UNITED STATES
SECURITIES AND EXCHANGE COMMISSION
Washington, D.C. 20549
FORM 10-Q
(Mark One)
|
| | | | |
x☒ | Quarterly report pursuant to Section 13 or 15(d) of the Securities Exchange Act of 1934 |
For the quarterly period ended October 31, 2017April 30, 2020
OR
|
| | | | |
¨☐ | Transition report pursuant to Section 13 or 15(d) of the Securities Exchange Act of 1934 |
Commission File Number: 001-32224
salesforce.com, inc.
(Exact name of registrant as specified in its charter)
|
| | | | |
| Delaware | 94-3320693 |
(State or other jurisdiction of
incorporation or organization)
| (IRS Employer
Identification No.)
|
The Landmark @ One Market, Suite 300Salesforce Tower
415 Mission Street, 3rd Fl
San Francisco, California 94105
(Address of principal executive offices)
Telephone Number (415) 901-7000
(Registrant’s telephone number, including area code)
| | | | | | | | |
| Securities registered pursuant to Section 12(b) of the Act |
| Title of each class | Trading Symbol(s) | Name of each exchange on which registered |
| Common Stock, par value $0.001 per share | CRM | New York Stock Exchange |
Indicate by check mark whether the Registrant (1) has filed all reports required to be filed by Section 13 or 15(d) of the Securities Exchange Act of 1934 (the “Exchange Act”) during the preceding 12 months (or for such shorter period that the Registrant was required to file such reports), and (2) has been subject to such filing requirements for the past 90 days: Yes x No ¨
Indicate by check mark whether the Registrant has submitted electronically and posted on its corporate Web site, if any, every Interactive Data File required to be submitted and posted pursuant to Rule 405 of Regulation S-T (§232.405 of this chapter) during the preceding 12 months (or for such shorter period that the Registrant was required to submit and post such files). Yes x No ¨
Indicate by check mark whether the Registrant is a large accelerated filer, an accelerated filer, a non-accelerated filer, smaller reporting company or an emerging growth company. See the definitions of “large accelerated filer,” “accelerated filer,” “smaller reporting company” and “emerging growth company” in Rule 12b-2 of the Exchange Act.
| | | | | | | | | | | |
| Large accelerated filer | ☒ | Accelerated filer | ☐ |
| | | |
| Non-accelerated filer | ☐ | Smaller reporting company | ☐ |
| | | |
| | |
Large accelerated filer x
| Accelerated filer | ¨ |
| | |
Non-accelerated filer ¨ (Do not check if a smaller reporting company)
| Smaller reporting company | ¨ |
| | |
| Emerging growth company | ¨☐ |
If an emerging growth company, indicate by check mark if the registrant has elected not to use the extended transition period for complying with any new or revised financial accounting standards provided pursuant to Section 13(a) of the Exchange Act. ¨
Indicate by check mark whether the Registrant is a shell company (as defined in Rule 12b-2 of the Exchange Act). Yes ¨☐ No x
As of October 31, 2017,May 29, 2020, there were approximately 722.3901 million shares of the Registrant’s Common Stock outstanding.
INDEX
| | | | | | | | |
| | Page No. |
| | |
| | |
| Item 1. | | |
| | |
| | Page No. |
| | |
| | |
Item 1. | | |
| | |
| | |
| | |
| | |
| | |
| | |
| | |
| | |
| | |
| | |
| | |
| | |
| | |
| Item 2. | | |
| | |
| Item 3. | | |
| | |
| Item 4. | | |
| | |
| | |
| | |
| Item 1. | | |
| | |
| Item 1A. | | |
| | |
| Item 2. | | |
| | |
| Item 3. | | |
| | |
| Item 4. | | |
| | |
| Item 5. | | |
| | |
| Item 6. | | |
PART I. FINANCIAL INFORMATION
ITEM 1. FINANCIAL STATEMENTS
salesforce.com, inc.
Condensed Consolidated Balance Sheets
(in thousands)millions)
| | | | | | | | | | | |
| April 30, 2020 | | January 31, 2020 |
| (unaudited) | | |
| Assets | | | |
| Current assets: | | | |
| Cash and cash equivalents | $ | 5,772 | | | $ | 4,145 | |
| Marketable securities | 4,030 | | | 3,802 | |
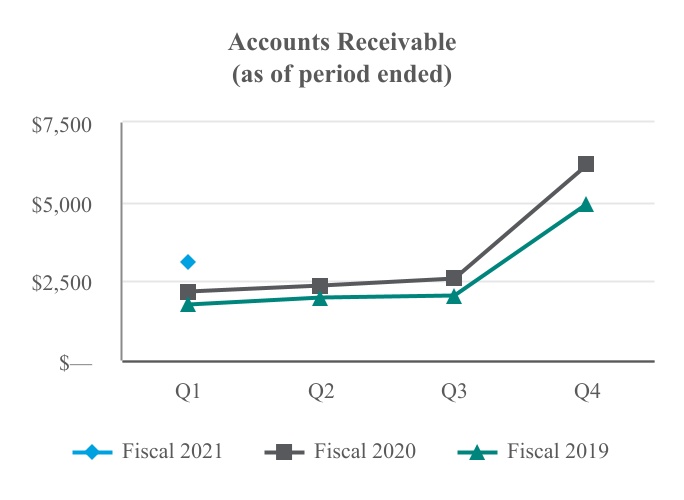
| Accounts receivable, net | 3,076 | | | 6,174 | |
| Costs capitalized to obtain revenue contracts, net | 881 | | | 926 | |
| Prepaid expenses and other current assets | 954 | | | 916 | |
| Total current assets | 14,713 | | | 15,963 | |
| Property and equipment, net | 2,518 | | | 2,375 | |
| Operating lease right-of-use assets, net | 2,983 | | | 3,040 | |
| Noncurrent costs capitalized to obtain revenue contracts, net | 1,171 | | | 1,348 | |
| | | |
| Strategic investments | 1,902 | | | 1,963 | |
| Goodwill | 25,266 | | | 25,134 | |
| Intangible assets acquired through business combinations, net | 4,488 | | | 4,724 | |
| Capitalized software and other assets, net | 582 | | | 579 | |
| Total assets | $ | 53,623 | | | $ | 55,126 | |
| Liabilities and stockholders’ equity | | | |
| Current liabilities: | | | |
| Accounts payable, accrued expenses and other liabilities | $ | 2,989 | | | $ | 3,433 | |
| Operating lease liabilities, current | 742 | | | 750 | |
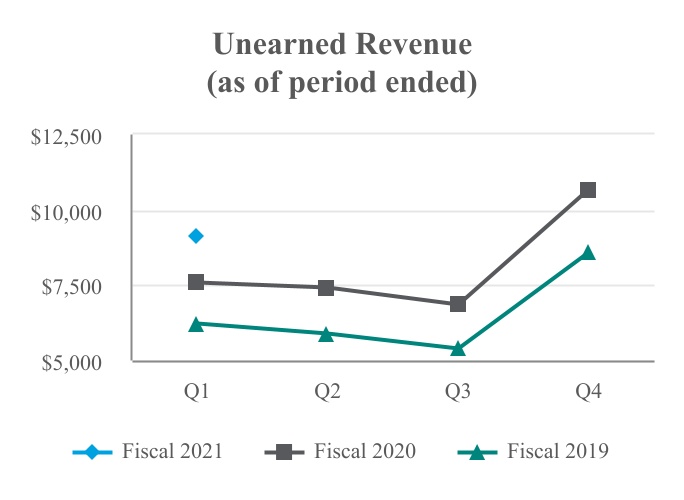
| Unearned revenue | 9,112 | | | 10,662 | |
| | | |
| Total current liabilities | 12,843 | | | 14,845 | |
| Noncurrent debt | 2,673 | | | 2,673 | |
| Noncurrent operating lease liabilities | 2,422 | | | 2,445 | |
| Other noncurrent liabilities | 1,120 | | | 1,278 | |
| Total liabilities | 19,058 | | | 21,241 | |
| | | |
| Stockholders’ equity: | | | |
| | | |
| Common stock | 1 | | | 1 | |
| | | |
| Additional paid-in capital | 32,739 | | | 32,116 | |
| Accumulated other comprehensive loss | (135) | | | (93) | |
| Retained earnings | 1,960 | | | 1,861 | |
| Total stockholders’ equity | 34,565 | | | 33,885 | |
| Total liabilities and stockholders’ equity | $ | 53,623 | | | $ | 55,126 | |
|
| | | | | | | |
| | October 31,
2017 | | January 31,
2017 |
| | (unaudited) | | |
| Assets | | | |
| Current assets: | | | |
| Cash and cash equivalents | $ | 2,071,837 |
| | $ | 1,606,549 |
|
| Marketable securities | 1,556,828 |
| | 602,338 |
|
| Accounts receivable, net | 1,519,916 |
| | 3,196,643 |
|
| Deferred commissions | 327,643 |
| | 311,770 |
|
| Prepaid expenses and other current assets | 469,946 |
| | 279,527 |
|
| Total current assets | 5,946,170 |
| | 5,996,827 |
|
| Property and equipment, net | 1,864,891 |
| | 1,787,534 |
|
| Deferred commissions, noncurrent | 253,004 |
| | 227,849 |
|
| Capitalized software, net | 140,768 |
| | 141,671 |
|
| Strategic investments | 670,406 |
| | 566,953 |
|
| Goodwill | 7,294,141 |
| | 7,263,846 |
|
| Intangible assets acquired through business combinations, net | 895,768 |
| | 1,113,374 |
|
| Other assets, net | 424,888 |
| | 486,869 |
|
| Total assets | $ | 17,490,036 |
| | $ | 17,584,923 |
|
| Liabilities, temporary equity and stockholders’ equity | | | |
| Current liabilities: | | | |
| Accounts payable, accrued expenses and other liabilities | $ | 1,686,408 |
| | $ | 1,752,664 |
|
| Deferred revenue | 4,392,082 |
| | 5,542,802 |
|
| Convertible 0.25% senior notes, net | 1,137,954 |
| | 0 |
|
| Total current liabilities | 7,216,444 |
| | 7,295,466 |
|
| Convertible 0.25% senior notes, net | 0 |
| | 1,116,360 |
|
| Term loan | 498,084 |
| | 497,221 |
|
| Loan assumed on 50 Fremont | 198,471 |
| | 198,268 |
|
| Revolving credit facility | 0 |
| | 196,542 |
|
| Other noncurrent liabilities | 736,870 |
| | 780,939 |
|
| Total liabilities | 8,649,869 |
| | 10,084,796 |
|
| Temporary equity: | | |
|
| Convertible 0.25% senior notes (See Note 8) | 10,797 |
| | 0 |
|
| Stockholders’ equity: | | | |
| Common stock | 722 |
| | 708 |
|
| Additional paid-in capital | 9,230,081 |
| | 8,040,170 |
|
| Accumulated other comprehensive income (loss) | 3,554 |
| | (75,841 | ) |
| Accumulated deficit | (404,987 | ) | | (464,910 | ) |
| Total stockholders’ equity | 8,829,370 |
| | 7,500,127 |
|
| Total liabilities, temporary equity and stockholders’ equity | $ | 17,490,036 |
| | $ | 17,584,923 |
|
See accompanying Notes.
salesforce.com, inc.
Condensed Consolidated Statements of Operations
(in thousands,millions, except per share data)
(unaudited)
| | | | Three Months Ended October 31, | | Nine Months Ended October 31, | |
| 1 | | 1 | | Three Months Ended April 30, | |
| | 2017 | | 2016 | | 2017 | | 2016 | | | 2020 | | 2019 | |
| Revenues: | | | | | | | | Revenues: | | | | | |
| Subscription and support | $ | 2,486,131 |
| | $ | 1,983,981 |
| | $ | 7,055,538 |
| | $ | 5,645,554 |
| Subscription and support | | $ | 4,575 | | | $ | 3,496 | | |
| Professional services and other | 193,710 |
| | 160,794 |
| | 573,471 |
| | 452,442 |
| Professional services and other | | 290 | | | 241 | | |
| Total revenues | 2,679,841 |
| | 2,144,775 |
| | 7,629,009 |
| | 6,097,996 |
| Total revenues | | 4,865 | | | 3,737 | | |
| Cost of revenues (1)(2): | | | | | | | | Cost of revenues (1)(2): | | | |
| Subscription and support | 528,182 |
| | 426,487 |
| | 1,484,982 |
| | 1,154,044 |
| Subscription and support | | 966 | | | 678 | | |
| Professional services and other | 186,326 |
| | 159,035 |
| | 550,748 |
| | 454,038 |
| Professional services and other | | 288 | | | 236 | | |
| Total cost of revenues | 714,508 |
| | 585,522 |
| | 2,035,730 |
| | 1,608,082 |
| Total cost of revenues | | 1,254 | | | 914 | | |
| Gross profit | 1,965,333 |
| | 1,559,253 |
| | 5,593,279 |
| | 4,489,914 |
| Gross profit | | 3,611 | | | 2,823 | | |
| Operating expenses (1)(2): | | | | | | | | Operating expenses (1)(2): | | | |
| Research and development | 393,998 |
| | 311,459 |
| | 1,156,526 |
| | 863,935 |
| Research and development | | 859 | | | 554 | | |
| Marketing and sales | 1,184,733 |
| | 997,993 |
| | 3,464,986 |
| | 2,828,784 |
| Marketing and sales | | 2,390 | | | 1,697 | | |
| General and administrative | 270,614 |
| | 246,765 |
| | 813,868 |
| | 709,622 |
| General and administrative | | 502 | | | 362 | | |
| | Total operating expenses | 1,849,345 |
| | 1,556,217 |
| | 5,435,380 |
| | 4,402,341 |
| Total operating expenses | | 3,751 | | | 2,613 | | |
| Income from operations | 115,988 |
| | 3,036 |
| | 157,899 |
| | 87,573 |
| |
| Investment income | 10,049 |
| | 3,709 |
| | 24,069 |
| | 23,747 |
| |
| Interest expense | (21,557 | ) | | (21,946 | ) | | (65,382 | ) | | (64,665 | ) | |
| Other income (expense) (1) | 1,921 |
| | 1,782 |
| | (2,695 | ) | | (11,500 | ) | |
| Gains from acquisitions of strategic investments | 0 |
| | 833 |
| | 0 |
| | 13,697 |
| |
| Income (loss) before benefit from (provision for) income taxes | 106,401 |
| | (12,586 | ) | | 113,891 |
| | 48,852 |
| |
| Income (loss) from operations | | Income (loss) from operations | | (140) | | | 210 | | |
| | Gains on strategic investments, net | | Gains on strategic investments, net | | 192 | | | 281 | | |
| Other expense | | Other expense | | (5) | | | (9) | | |
| Income before benefit from (provision for) income taxes | | Income before benefit from (provision for) income taxes | | 47 | | | 482 | | |
| Benefit from (provision for) income taxes | (55,007 | ) | | (24,723 | ) | | (53,968 | ) | | 182,220 |
| Benefit from (provision for) income taxes | | 52 | | | (90) | | |
| Net income (loss) | $ | 51,394 |
| | $ | (37,309 | ) | | $ | 59,923 |
| | $ | 231,072 |
| |
| Basic net income (loss) per share | $ | 0.07 |
| | $ | (0.05 | ) | | $ | 0.08 |
| | $ | 0.34 |
| |
| Diluted net income (loss) per share | $ | 0.07 |
| | $ | (0.05 | ) | | $ | 0.08 |
| | $ | 0.33 |
| |
| Shares used in computing basic net income (loss) per share | 717,445 |
| | 690,468 |
| | 711,884 |
| | 683,075 |
| |
| Shares used in computing diluted net income (loss) per share | 738,106 |
| | 690,468 |
| | 730,212 |
| | 696,257 |
| |
| Net income | | Net income | | $ | 99 | | | $ | 392 | | |
| | Basic net income per share | | Basic net income per share | | $ | 0.11 | | | $ | 0.51 | | |
| Diluted net income per share | | Diluted net income per share | | $ | 0.11 | | | $ | 0.49 | | |
| Shares used in computing basic net income per share | | Shares used in computing basic net income per share | | 896 | | | 771 | | |
| Shares used in computing diluted net income per share | | Shares used in computing diluted net income per share | | 913 | | | 793 | | |
_______________
(1) Amounts include amortization of purchased intangibles fromintangible assets acquired through business combinations, as follows:
| | | | | | | | | | | | | | | | | |
| | | | Three Months Ended April 30, |
| | | | | | 2020 | | 2019 | | |
| Cost of revenues | | | | | $ | 159 | | | $ | 61 | | | |
| Marketing and sales | | | | | 112 | | | 68 | | | |
| | | | | | | | | |
|
| | | | | | | | | | | | | | | |
| | Three Months Ended October 31, | | Nine Months Ended October 31, |
| | 2017 | | 2016 | | 2017 | | 2016 |
| Cost of revenues | $ | 39,610 |
| | $ | 36,703 |
| | $ | 126,679 |
| | $ | 84,462 |
|
| Marketing and sales | 30,067 |
| | 28,064 |
| | 91,274 |
| | 66,601 |
|
| Other income (expense) | 367 |
| | 579 |
| | 1,118 |
| | 1,927 |
|
(2) Amounts include stock-based expense, as follows: | | | | Three Months Ended October 31, | | Nine Months Ended October 31, | | | Three Months Ended April 30, |
| | 2017 | | 2016 | | 2017 | | 2016 | | | 2020 | | 2019 | |
| Cost of revenues | $ | 33,494 |
| | $ | 26,783 |
| | $ | 97,206 |
| | $ | 76,912 |
| Cost of revenues | | $ | 52 | | | $ | 43 | | |
| Research and development | 66,626 |
| | 50,372 |
| | 197,185 |
| | 124,164 |
| Research and development | | 166 | | | 81 | | |
| Marketing and sales | 116,992 |
| | 93,718 |
| | 356,538 |
| | 275,515 |
| Marketing and sales | | 223 | | | 177 | | |
| General and administrative | 34,165 |
| | 33,878 |
| | 108,402 |
| | 99,389 |
| General and administrative | | 63 | | | 42 | | |
See accompanying Notes.
salesforce.com, inc.
Condensed Consolidated Statements of Comprehensive Income (Loss)
(in thousands)millions)
(unaudited)
| | | | | | | | | | | | | | | | | |
| 1 | | | Three Months Ended April 30, |
| | | | | 2020 | | 2019 | | |
| Net income | | | | | $ | 99 | | | $ | 392 | | | |
| Other comprehensive loss, net of reclassification adjustments: | | | | | | | | | |
| Foreign currency translation and other losses | | | | | (23) | | | (13) | | | |
| Unrealized gains (losses) on marketable securities and privately held debt securities | | | | | (25) | | | 8 | | | |
| Other comprehensive loss, before tax | | | | | (48) | | | (5) | | | |
| Tax effect | | | | | 6 | | | (2) | | | |
| Other comprehensive loss, net | | | | | (42) | | | (7) | | | |
| Comprehensive income | | | | | $ | 57 | | | $ | 385 | | | |
|
| | | | | | | | | | | | | | | |
| | Three Months Ended October 31, | | Nine Months Ended October 31, |
| | 2017 | | 2016 | | 2017 | | 2016 |
| Net income (loss) | $ | 51,394 |
| | $ | (37,309 | ) | | $ | 59,923 |
| | $ | 231,072 |
|
| Other comprehensive income (loss), before tax and net of reclassification adjustments: | | | | | | | |
| Foreign currency translation and other gains (losses) | (2,218 | ) | | (28,372 | ) | | 28,190 |
| | (28,523 | ) |
| Unrealized gains (losses) on marketable securities and strategic investments (See Note 2) | (11,763 | ) | | (16,019 | ) | | 51,205 |
| | 20,961 |
|
| Other comprehensive income (loss), before tax | (13,981 | ) | | (44,391 | ) | | 79,395 |
| | (7,562 | ) |
| Tax effect | 0 |
| | (7,337 | ) | | 0 |
| | (5,464 | ) |
| Other comprehensive income (loss), net of tax | (13,981 | ) | | (51,728 | ) | | 79,395 |
| | (13,026 | ) |
| Comprehensive income (loss) | $ | 37,413 |
| | $ | (89,037 | ) | | $ | 139,318 |
| | $ | 218,046 |
|
See accompanying Notes.
salesforce.com, inc.
Condensed Consolidated Statements of Stockholders’ Equity
(in millions)
(unaudited)
| | | | | | | | | | | | | | | | | | | | | | | | | | | | | | | | | | | |
| Three Months Ended April 30, 2019 |
| | Common Stock | | Additional
Paid-in
Capital | | Accumulated Other Comprehensive Loss | | Retained Earnings | | Total
Stockholders’
Equity |
| | Shares | | Amount | |
| Balance at January 31, 2019 | 770 | | | $ | 1 | | | $ | 13,927 | | | $ | (58) | | | $ | 1,735 | | | $ | 15,605 | |
| Common stock issued | 5 | | | 0 | | | 113 | | | 0 | | | 0 | | | 113 | |
| Stock-based expenses | 0 | | | 0 | | | 343 | | | 0 | | | 0 | | | 343 | |
| Other comprehensive loss, net of tax | 0 | | | 0 | | | 0 | | | (7) | | | 0 | | | (7) | |
| Net income | 0 | | | 0 | | | 0 | | | 0 | | | 392 | | | 392 | |
| Balance at April 30, 2019 | 775 | | | $ | 1 | | | $ | 14,383 | | | $ | (65) | | | $ | 2,127 | | | $ | 16,446 | |
| | | | | | | | | | | |
| Three Months Ended April 30, 2020 |
| | Common Stock | | Additional
Paid-in
Capital | | Accumulated Other Comprehensive Loss | | Retained Earnings | | Total
Stockholders’
Equity |
| | Shares | | Amount | |
| Balance at January 31, 2020 | 893 | | | $ | 1 | | | $ | 32,116 | | | $ | (93) | | | $ | 1,861 | | | $ | 33,885 | |
| Common stock issued | 6 | | | 0 | | | 119 | | | 0 | | | 0 | | | 119 | |
| Stock-based expenses | 0 | | | 0 | | | 504 | | | 0 | | | 0 | | | 504 | |
| Other comprehensive loss, net of tax | 0 | | | 0 | | | 0 | | | (42) | | | 0 | | | (42) | |
| Net income | 0 | | | 0 | | | 0 | | | 0 | | | 99 | | | 99 | |
| Balance at April 30, 2020 | 899 | | | $ | 1 | | | $ | 32,739 | | | $ | (135) | | | $ | 1,960 | | | $ | 34,565 | |
See accompanying Notes.
salesforce.com, inc.
Condensed Consolidated Statements of Cash Flows
(in thousands)millions)
| | | | Three Months Ended October 31, | | Nine Months Ended October 31, | |
| 1 | | 1 | | Three Months Ended April 30, |
| | 2017 | | 2016 | | 2017 | | 2016 | | | 2020 | | 2019 | |
| Operating activities: | | | | | | | | Operating activities: | | | | | |
| Net income (loss) | $ | 51,394 |
| | $ | (37,309 | ) | | $ | 59,923 |
| | $ | 231,072 |
| |
| Adjustments to reconcile net income (loss) to net cash provided by operating activities: | | | | | | | | |
| Net income | | Net income | | $ | 99 | | | $ | 392 | | |
| Adjustments to reconcile net income to net cash provided by operating activities: | | Adjustments to reconcile net income to net cash provided by operating activities: | | | |
| Depreciation and amortization | 187,546 |
| | 169,346 |
| | 564,911 |
| | 451,479 |
| Depreciation and amortization | | 658 | | | 437 | | |
| Amortization of debt discount and issuance costs | 7,795 |
| | 7,281 |
| | 23,265 |
| | 21,334 |
| |
| Gains from acquisitions of strategic investments | 0 |
| | (833 | ) | | 0 |
| | (13,697 | ) | |
| Amortization of deferred commissions | 117,677 |
| | 93,230 |
| | 331,687 |
| | 270,527 |
| |
| Amortization of costs capitalized to obtain revenue contracts, net | | Amortization of costs capitalized to obtain revenue contracts, net | | 247 | | | 209 | | |
| Expenses related to employee stock plans | 251,277 |
| | 204,751 |
| | 759,331 |
| | 575,980 |
| Expenses related to employee stock plans | | 504 | | | 343 | | |
| | Gains on strategic investments, net | | Gains on strategic investments, net | | (192) | | | (281) | | |
| Changes in assets and liabilities, net of business combinations: | | | | | | | | Changes in assets and liabilities, net of business combinations: | | | |
| Accounts receivable, net | 49,406 |
| | 42,653 |
| | 1,677,466 |
| | 1,276,798 |
| Accounts receivable, net | | 3,094 | | | 2,774 | | |
| Deferred commissions | (171,562 | ) | | (92,803 | ) | | (372,714 | ) | | (226,965 | ) | |
| Costs capitalized to obtain revenue contracts, net | | Costs capitalized to obtain revenue contracts, net | | (25) | | | (124) | | |
| Prepaid expenses and other current assets and other assets | (15,669 | ) | | 40,676 |
| | (166,784 | ) | | (25,723 | ) | Prepaid expenses and other current assets and other assets | | (11) | | | (97) | | |
| Accounts payable, accrued expenses and other liabilities | 74,480 |
| | 57,836 |
| | (39,720 | ) | | (275,058 | ) | |
| Deferred revenue | (426,552 | ) | | (330,516 | ) | | (1,150,720 | ) | | (829,695 | ) | |
| Accounts payable | | Accounts payable | | 147 | | | 15 | | |
| Accrued expenses and other liabilities | | Accrued expenses and other liabilities | | (904) | | | (560) | | |
| Operating lease liabilities | | Operating lease liabilities | | (203) | | | (164) | | |
| Unearned revenue | | Unearned revenue | | (1,555) | | | (979) | | |
| Net cash provided by operating activities | 125,792 |
| | 154,312 |
| | 1,686,645 |
| | 1,456,052 |
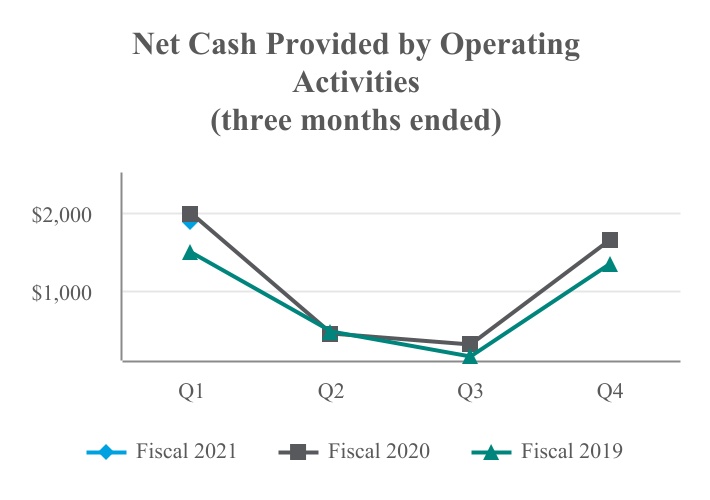
| Net cash provided by operating activities | | 1,859 | | | 1,965 | | |
| Investing activities: | | | | | | | | Investing activities: | | | | | |
| Business combinations, net of cash acquired | 0 |
| | (32,117 | ) | | (19,781 | ) | | (2,832,110 | ) | Business combinations, net of cash acquired | | (103) | | | (10) | | |
| Purchases of strategic investments | (54,585 | ) | | (28,660 | ) | | (113,088 | ) | | (65,834 | ) | Purchases of strategic investments | | (342) | | | (159) | | |
| Sales of strategic investments | 40,811 |
| | 11,783 |
| | 55,898 |
| | 26,506 |
| Sales of strategic investments | | 601 | | | 194 | | |
| Purchases of marketable securities | (233,824 | ) | | (111,731 | ) | | (1,433,718 | ) | | (986,862 | ) | Purchases of marketable securities | | (834) | | | (734) | | |
| Sales of marketable securities | 193,783 |
| | 93,391 |
| | 437,248 |
| | 1,927,049 |
| Sales of marketable securities | | 337 | | | 86 | | |
| Maturities of marketable securities | 29,819 |
| | 14,203 |
| | 43,089 |
| | 64,741 |
| Maturities of marketable securities | | 227 | | | 56 | | |
| Capital expenditures | (111,278 | ) | | (140,653 | ) | | (396,268 | ) | | (319,984 | ) | Capital expenditures | | (323) | | | (159) | | |
| Net cash used in investing activities | (135,274 | ) | | (193,784 | ) | | (1,426,620 | ) | | (2,186,494 | ) | Net cash used in investing activities | | (437) | | | (726) | | |
| Financing activities: | | | | | | | | Financing activities: | | | | | |
| Proceeds from term loan, net | 0 |
| | 0 |
| | 0 |
| | 495,550 |
| |
| | Proceeds from employee stock plans | 141,970 |
| | 92,846 |
| | 484,786 |
| | 315,865 |
| Proceeds from employee stock plans | | 258 | | | 219 | | |
| Principal payments on capital lease obligations | (7,716 | ) | | (10,997 | ) | | (82,890 | ) | | (73,760 | ) | |
| Payments on revolving credit facility | 0 |
| | 0 |
| | (200,000 | ) | | 0 |
| |
| Principal payments on financing obligations | | Principal payments on financing obligations | | (48) | | | (11) | | |
| Repayments of debt | | Repayments of debt | | (1) | | | (1) | | |
| Net cash provided by financing activities | 134,254 |
| | 81,849 |
| | 201,896 |
| | 737,655 |
| Net cash provided by financing activities | | 209 | | | 207 | | |
| Effect of exchange rate changes | (2,045 | ) | | (11,867 | ) | | 3,367 |
| | (19,840 | ) | Effect of exchange rate changes | | (4) | | | (5) | | |
| Net increase (decrease) in cash and cash equivalents | 122,727 |
| | 30,510 |
| | 465,288 |
| | (12,627 | ) | |
| Net increase in cash and cash equivalents | | Net increase in cash and cash equivalents | | 1,627 | | | 1,441 | | |
| Cash and cash equivalents, beginning of period | 1,949,110 |
| | 1,115,226 |
| | 1,606,549 |
| | 1,158,363 |
| Cash and cash equivalents, beginning of period | | 4,145 | | | 2,669 | | |
| Cash and cash equivalents, end of period | $ | 2,071,837 |
| | $ | 1,145,736 |
| | $ | 2,071,837 |
| | $ | 1,145,736 |
| Cash and cash equivalents, end of period | | $ | 5,772 | | | $ | 4,110 | | |
See accompanying Notes.
salesforce.com, inc.
Condensed Consolidated Statements of Cash Flows
Supplemental Cash Flow Disclosure
(in thousands)millions)
(unaudited)
| | | | | | | | | | | | | | | | | |
| | | | Three Months Ended April 30, |
| | | | | | 2020 | | 2019 | | |
| Supplemental cash flow disclosure: | | | | | | | | | |
| Cash paid during the period for: | | | | | | | | | |
| Interest | | | | | $ | 46 | | | $ | 50 | | | |
| Income taxes, net of tax refunds | | | | | $ | 58 | | | $ | 18 | | | |
| | | | | | | | | |
| | | | | | | | | |
| | | | | | | | | |
| | | | | | | | | |
| | | | | | | | | |
|
| | | | | | | | | | | | | | | |
| | Three Months Ended October 31, | | Nine Months Ended October 31, |
| | 2017 | | 2016 | | 2017 | | 2016 |
| Supplemental cash flow disclosure: | | | | | | | |
| Cash paid during the period for: | | | | | | | |
| Interest | $ | 6,774 |
| | $ | 11,365 |
| | $ | 34,039 |
| | $ | 41,400 |
|
| Income taxes, net of tax refunds | $ | 14,837 |
| | $ | 11,220 |
| | $ | 41,519 |
| | $ | 25,451 |
|
| Non-cash investing and financing activities: | | | | | | | |
| Fixed assets acquired under capital leases | $ | 0 |
| | $ | 180 |
| | $ | 2,471 |
| | $ | 765 |
|
| Fair value of equity awards assumed | $ | 0 |
| | $ | 26,406 |
| | $ | 0 |
| | $ | 47,199 |
|
| Fair value of common stock issued as consideration for business combinations | $ | 0 |
| | $ | 492,842 |
| | $ | 6,193 |
| | $ | 771,214 |
|
| Non-cash equity liability (See Note 9) | $ | 5,959 |
| | $ | (1,473 | ) | | $ | 18,920 |
| | $ | 74,570 |
|
See accompanying Notes.
salesforce.com, inc.
Notes to Condensed Consolidated Financial Statements
1. Summary of Business and Significant Accounting Policies
Description of Business
Salesforce.com, inc. (the "Company"“Company”) is a leading provider of enterprise software, delivered through the cloud, with a focus on customer relationship management, or CRM. The Company introduced its first CRM solution in 2000, and has since expanded its service offerings into new areas and industries with new editions, features and platform capabilities.
The Company's core mission is to empower its customers to connect with their customers in entirely new ways through cloud, mobile, social, Internet of Things (“IoT”)blockchain, voice, advanced analytics and artificial intelligence (“AI”) technologies.
The Company's Salesforce’s Customer Success Platform360 is an integrated platform that unites sales, service, marketing, commerce, integration, analytics and more to give companies a comprehensive portfoliosingle, shared view of service offerings providing sales force automation, customer service and support, marketing automation, digital commerce, community management, analytics, application development, IoT integration, collaborative productivity tools and its professional cloud services.their customers.
Fiscal Year
The Company’s fiscal year ends on January 31. References to fiscal 2018,2021, for example, refer to the fiscal year ending January 31, 2018.2021.
Basis of Presentation
The accompanying condensed consolidated balance sheet as of October 31, 2017April 30, 2020 and the condensed consolidated statements of operations, condensed consolidated statements of comprehensive income, (loss)condensed consolidated statements of stockholders' equity and condensed consolidated statements of cash flows for the three and nine months ended October 31, 2017April 30, 2020 and 2016, respectively,2019 are unaudited.
These financial statements have been prepared in accordance with U.S. generally accepted accounting principles (“U.S. GAAP”) for interim financial information. Accordingly, they do not include all of the financial information and footnotes required by U.S. GAAP for complete financial statements. In the opinion of the Company’s management, the unaudited condensed consolidated financial statements include all adjustments necessary for the fair presentation of the Company’s balance sheet as of October 31, 2017,April 30, 2020, and its results of operations, including its comprehensive income, (loss),stockholders' equity and its cash flows for the three and nine months ended October 31, 2017April 30, 2020 and 2016.2019. All adjustments are of a normal recurring nature. The results for the three and nine months ended October 31, 2017April 30, 2020 are not necessarily indicative of the results to be expected for any subsequent quarter or for the fiscal year ending January 31, 2018.2021.
These unaudited interim condensed consolidated financial statements should be read in conjunction with the consolidated financial statements and related notes included in the Company's Annual Report on Form 10-K for the fiscal year ended January 31, 2017,2020, filed with the Securities and Exchange Commission (the “SEC”) on March 6, 2017.5, 2020.
Use of Estimates
The preparation of financial statements in conformity with U.S. GAAP requires management to make estimates and assumptions in the Company’s condensed consolidated financial statements and notes thereto.
Significant estimates and assumptions made by management include the determination of:
the best estimate of selling price of the deliverables included in multiple deliverable revenue arrangements;
•the fair value of assets acquired and liabilities assumed for business combinations;
•the standalone selling price (“SSP”) of performance obligations for revenue contracts with multiple performance obligations;
•the valuation of privately-held strategic investments, including impairments;
•the recognition, measurement and valuation of current and deferred income taxes;taxes and uncertain tax positions;
•the average period of benefit associated with costs capitalized to obtain revenue contracts;
•the useful lives of intangible assets; and
•the fair value of certain stock awards issued;
the useful lives of intangible assets, property and equipment and building and structural components; and
the valuation of strategic investments and the determination of other-than-temporary impairments.issued.
Actual results could differ materially from those estimates. The Company bases its estimates on historical experience and on various other assumptions that are believed to be reasonable, the result of which forms the basis for making judgments about the carrying values of assets and liabilities.
In December 2019, the novel coronavirus and resulting disease (“COVID-19”) was reported and in March 2020 the World Health Organization declared it a pandemic. The extent of the impact of COVID-19 on the Company’s operational and financial performance will depend on certain developments, including the duration of the outbreak, impact on the Company’s
customers and its sales cycles, and impact on the Company’s employees, as discussed in more detail in Part I, Item 2 “Management’s Discussion and Analysis of Financial Condition and Results of Operations”. During the three months ended April 30, 2020, this uncertainty resulted in a higher level of judgment related to the Company’s estimates and assumptions concerning variable consideration related to revenue recognition, allowances for credit losses, impairment of strategic investments, contract termination costs related to customer and employee events and operating lease right of use assets impairment. As of the date of issuance of the financial statements, the Company is not aware of any specific event or circumstance that would require it to update its estimates, judgments, or revise the carrying value of its assets or liabilities. These estimates may change, as new events occur and additional information is obtained, and such changes will be recognized in the condensed consolidated financial statements as soon as they become known. Actual results could differ from these estimates and any such differences may be material to the Company’s financial statements.
Principles of Consolidation
The condensed consolidated financial statements include the accounts of the Company and its wholly-owned subsidiaries. All significant intercompany balances and transactions have been eliminated in consolidation.
Segments
The Company operates as one1 operating segment. Operating segments are defined as components of an enterprise for which separate financial information is evaluated regularly by the chief operating decision maker who is the chief executive officer,(“CODM”), in deciding how to allocate resources and assessingassess performance. Over the past few years, the Company has completed a number of acquisitions. These acquisitions have allowed the Company to expand its offerings, presence and reach in various market segments of the enterprise cloud computing market.
While the Company has offerings in multiple enterprise cloud computing market segments, including as a result of the Company's acquisitions, and operates in multiple countries, the Company’s business operates in one1 operating segment because the majoritymost of the Company's offerings operate on aits single platformCustomer 360 Platform and most of the Company's products are deployed in ana nearly identical way, andthe Company’s chief operating decision makerCODM evaluates the Company’s financial information and resources and assesses the performance of these resources on a consolidated basis. Since
In February 2020, former co-CEO and director Keith Block resigned his positions from the Company. Prior to his resignation, Mr. Block was identified as a co-CODM along with Marc Benioff, CEO and Chair of the Board. Upon Mr. Block’s resignation, Mr. Benioff assumed all Mr. Block’s responsibilities and, as of the first quarter of fiscal 2021, is the sole individual that evaluates the operating results of the Company operates in one operatingto assess performance and allocate resources. Accordingly, the Company determined that the chief executive officer also serves as the CODM for the purposes of segment all required financial segment information can be foundreporting. Despite the change in the consolidatedchief operating decision maker, the Company determined no change to segment reporting was necessary as there was no change in the components of the Company for which separate financial statements.information is regularly evaluated.
Concentrations of Credit Risk, and Significant Customers and Investments
The Company’s financial instruments that are exposed to concentrations of credit risk consist primarily of cash and cash equivalents, marketable securities and accounts receivable. In addition, in connection with the Company's 0.25% Senior Notes (as defined in Note 8 "Debt"), which were issued in March 2013, the Company entered into convertible note hedge transactions with respect to its common stock, which are exposed to concentrations of credit risk. Collateral is not required for accounts receivable or the note hedge transactions.receivable. The Company maintains an allowance for its doubtful accounts receivable.receivable due to estimated credit losses. This allowance is based upon historical loss patterns, the number of days that billings are past due, and an evaluation of the potential risk of loss associated with delinquent accounts.accounts and current market conditions and reasonable and supportable forecasts of future economic conditions to inform adjustments to historical loss patterns. Receivables are written-off and charged against itsthe recorded allowance when the Company has exhausted collection efforts without success.
No single customer accounted for more than five percent of accounts receivable at October 31, 2017April 30, 2020 and January 31, 2017.2020. No single customer accounted for five percent or more of total revenue during the three and nine months ended October 31, 2017April 30, 2020 and 2016.
Geographic Locations
2019. As of October 31, 2017April 30, 2020 and January 31, 2017,2020, assets located outside the Americas were 1311 percent and 12 percent of total assets, respectively. As of October 31, 2017April 30, 2020 and January 31, 2017,2020, assets located in the United States were 8687 percent and 8687 percent of total assets, respectively.
Revenues by geographical region are as follows (in thousands):
|
| | | | | | | | | | | | | | | |
| | Three Months Ended October 31, | | Nine Months Ended October 31, |
| | 2017 | | 2016 | | 2017 | | 2016 |
| Americas | $ | 1,927,405 |
| | $ | 1,598,344 |
| | $ | 5,536,932 |
| | $ | 4,506,774 |
|
| Europe | 493,732 |
| | 337,497 |
| | 1,367,718 |
| | 1,012,671 |
|
| Asia Pacific | 258,704 |
| | 208,934 |
| | 724,359 |
| | 578,551 |
|
| | $ | 2,679,841 |
|
| $ | 2,144,775 |
|
| $ | 7,629,009 |
| | $ | 6,097,996 |
|
Revenues by geography are determined based onThe Company is also exposed to concentrations of risk in its strategic investment portfolio. As of April 30, 2020, the region of the Salesforce contracting entity, which may be differentCompany held five investments with carrying values that were individually greater than the region of the customer. Americas revenue attributed to the United States was approximately 96 percent during the three and nine months ended October 31, 2017 and 2016. No other country represented more than ten5 percent of its total revenue duringstrategic investments, all of which were privately held. As of January 31, 2020, the threeCompany held 5 investments that were individually greater than 5 percent of its total strategic investments, of which 1 was publicly traded and nine months ended October 31, 2017 and 2016.4 were privately held.
Revenue Recognition
The Company derives its revenues from two sources: (1) subscription revenues, which are comprised of subscription fees from customers accessing the Company’s enterprise cloud computing services (collectively, “Cloud Services”), software licenses, and from customers paying for additional support beyond the standard support that is included in the basic
subscription fees; and (2) related professional services such as process mapping, project management and implementation services and other revenue.services. Other revenue consists primarily of training fees.
Revenue is recognized upon transfer of control of promised products and services to customers in an amount that reflects the consideration the Company expects to receive in exchange for those products or services. If the consideration promised in a contract includes a variable amount, for example, overage fees, contingent fees or service level penalties, the Company includes an estimate of the amount it expects to receive for the total transaction price if it is probable that a significant reversal of cumulative revenue recognized will not occur.
The Company commencesdetermines the amount of revenue recognition when allto be recognized through the application of the following conditions are satisfied:steps:
there is persuasive evidence•Identification of an arrangement;the contract, or contracts with a customer;
•Identification of the service has been or is being providedperformance obligations in the contract;
•Determination of the transaction price;
•Allocation of the transaction price to the customer;performance obligations in the contract; and
•Recognition of revenue when or as the collection ofCompany satisfies the fees is reasonably assured; and
the amount of fees to be paid by the customer is fixed or determinable.performance obligations.
The Company’s subscription service arrangements are non-cancelable and do not contain refund-type provisions.
Subscription and Support Revenues
Subscription and support revenues are comprised of fees that provide customers with access to Cloud Services, software licenses and related support and updates during the term of the arrangement.
Cloud Services allow customers to use the Company's multi-tenant software without taking possession of the software. Revenue is generally recognized ratably over the contract terms beginning onterm.
With the commencement dateMay 2018 acquisition of each contract, which isMuleSoft, Inc. (“MuleSoft”) and the dateAugust 2019 acquisition of Tableau Software, Inc. (“Tableau”), subscription and support revenues also includes revenues associated with software licenses. These licenses for on-premises software provide the Company’s servicecustomer with a right to use the software as it exists when made available. Customers purchase these term licenses through a subscription. Revenues from distinct licenses are generally recognized upfront when the software is made available to customers.the customer. In cases where the Company allocates revenue to software updates and support revenue, the allocated revenue is recognized as the updates are provided, which is generally ratably over the contract term.
The Company typically invoices its customers annually. Typical payment terms provide that customers pay within 30 days of invoice. Amounts that have been invoiced are recorded in accounts receivable and in deferredunearned revenue or revenue, depending on whether the revenue recognition criteria have been met.transfer of control to customers has occurred.
Professional Services and Other Revenues
The Company’s professional services contracts are either on a time and materials, fixed fee or subscription basis. These revenues are recognized as the services are rendered for time and materials contracts, when the milestones are achieved and accepted by the customer or on a proportional performance basis for fixed price contracts andor ratably over the contract term for subscription professional services contracts. The milestone method for revenue recognition is used when there is substantive uncertainty at the date the contract is entered into whether the milestone will be achieved. Training revenues are recognized as the services are performed.
Significant Judgments - Contracts with Multiple Deliverable ArrangementsPerformance Obligations
The Company enters into arrangementscontracts with its customers that may include promises to transfer multiple deliverables that generally include multiple subscriptions,Cloud Services, software licenses, premium support and professional services. If the deliverables have standalone value atA performance obligation is a promise in a contract inception, the Company accountswith a customer to transfer products or services that are distinct. Determining whether products and services are distinct performance obligations that should be accounted for each deliverable separately. Subscription services have standalone valueseparately or combined as one unit of accounting may require significant judgment.
Cloud Services and software licenses are distinct because such servicesofferings are often sold separately. In determining whether professional services have standalone value,are distinct, the Company considers the following factors for each professional services agreement: availability of the services from other vendors, the nature of the professional services, the timing of when the professional services contract was signed in comparison to the subscription service start date and the contractual dependence of the subscription service on the customer’s satisfaction with the professional services work. To date, the Company has concluded that all of the professional services included in contracts with multiple deliverable arrangements executed have standalone value.performance obligations generally are distinct.
Multiple deliverables included in an arrangement are separated into different units of accounting andThe Company allocates the arrangement consideration is allocatedtransaction price to the identified separate units basedeach performance obligation on a relative sellingSSP basis. The SSP is the price hierarchy. The Company determines the relative selling price for a deliverable based on its vendor-specific objective evidence of selling price (“VSOE”), if available, or its best estimate of selling price (“BESP”), if VSOE is not available. The Company has determined that third-party evidence of selling price (“TPE”) is not a practical alternative due to differences in its service offerings compared to other parties and the availability of relevant third-party pricing information. The amount of revenue allocated to delivered items is limited by contingent revenue, if any.
For certain professional services,at which the Company has established VSOE aswould sell a consistent number of standalone sales of these deliverables have been priced withinpromised product or service separately to a reasonably narrow range. The Company has not established VSOE for its subscription services due to lack of pricing consistency, the introduction of new services and other factors. Accordingly, the Company uses its BESPcustomer. Judgment is required to determine the relative selling priceSSP for its subscription services.each distinct performance obligation.
The Company determines BESPSSP by considering its overall pricing objectives and market conditions. Significant pricing practices taken into consideration include the Company’s discounting practices, the size and volume of the Company’s transactions, the customer demographic, the geographic area where services are sold, price lists, itsthe Company's go-to-market strategy, historical standalone sales and contract prices. The determinationIn instances where the Company does not sell or price a product or service
separately, the Company’s management, taking into consideration the go-to-market strategy.Company determines relative fair value using information that may include market conditions or other observable inputs. As the Company’s go-to-market strategies evolve, the Company may modify its pricing practices in the future, which could result in changes to SSP.
In certain cases, the Company is able to establish SSP based on observable prices of products or services sold or priced separately in relative selling prices, including both VSOEcomparable circumstances to similar customers. The Company uses a single amount to estimate SSP when it has observable prices.
If SSP is not directly observable, for example when pricing is highly variable, the Company uses a range of SSP. The Company determines the SSP range using information that may include pricing practices or other observable inputs. The Company typically has more than one SSP for individual products and BESP.services due to the stratification of those products and services by customer size and geography.
DeferredCosts Capitalized to Obtain Revenue Contracts
The deferred revenue balance does not represent the total contract valueCompany capitalizes incremental costs of annual or multi-year,obtaining a non-cancelable subscription agreements. Deferredand support revenue primarily consists of billings or payments received in advance of revenue recognition from subscription services described above and is recognized as the revenue recognition criteria are met. The
Company generally invoices customers in annual installments.contract. The deferred revenue balance is influenced by several factors, including seasonality, the compounding effects of renewals, invoice duration, invoice timing, dollar size and new business linearity within the quarter.
Deferred Commissions
Deferred commissions are the incremental costs that are directly associated with non-cancelable subscription contracts with customers andcapitalized amounts consist primarily of sales commissions paid to the Company’s direct sales force. Capitalized amounts also include (1) amounts paid to employees other than the direct sales force who earn incentive payouts under annual compensation plans that are tied to the value of contracts acquired, (2) commissions paid to employees upon renewals of subscription and support contracts, (3) the associated payroll taxes and fringe benefit costs associated with the payments to the Company’s employees, and to a lesser extent (4) success fees paid to partners in emerging markets where the Company has a limited presence.
Costs capitalized related to new revenue contracts are amortized on a straight-line basis over four years, which, although longer than the typical initial contract period, reflects the average period of benefit, including expected contract renewals. In arriving at this average period of benefit, the Company evaluated both qualitative and quantitative factors which included the estimated life cycles of its offerings and its customer attrition. Additionally, the Company amortizes capitalized costs for renewals and success fees paid to partners over two years.
The commissions are deferred and amortized over the non-cancelable terms of the related customer contracts, which are typically 12 to 36 months. The commission payments are paid in full the month after the customer’s service commences and are a direct and incremental cost of the revenue arrangements. The deferred commissioncapitalized amounts are recoverable through the future revenue streams under theall non-cancelable customer contracts. The Company believes this isperiodically evaluates whether there have been any changes in its business, the preferable method of accounting as the commission charges are so closely related to the revenue from the non-cancelable customer contractsmarket conditions in which it operates or other events which would indicate that theyits amortization period should be recorded as an asset and charged to expense over the same period that the subscription revenue is recognized. changed or if there are potential indicators of impairment.
Amortization of deferred commissionscapitalized costs to obtain revenue contracts is included in marketing and sales expense in the accompanying condensed consolidated statements of operations.
During the ninethree months ended October 31, 2017,April 30, 2020, the Company deferred $372.7capitalized $25 million of commission expenditurescosts to obtain revenue contracts and amortized $331.7$247 million to marketing and sales expense. During the three months ended April 30, 2020, the Company offered its direct sales force a partial minimum commission guarantee that would pay the greater of actual commissions earned or a fixed amount of their variable compensation that would have been otherwise paid if incremental new business was not impacted by the COVID-19 pandemic. As these payments were guaranteed and not a cost to obtain a revenue contract, the amounts were immediately expensed and reflected in the Company’s condensed consolidated statement of operations. During the same period a year ago, the Company deferred $227.0capitalized $124 million of commission expenditurescosts to obtain revenue contracts and amortized $270.5$209 million to marketing and sales expense. Deferred commissionsCosts capitalized to obtain a revenue contract, net on the Company's condensed consolidated balance sheets totaled $580.6 million$2.1 billion at October 31, 2017April 30, 2020 and $539.6 million$2.3 billion at January 31, 2017.2020. There were no impairments of costs to obtain revenue contracts for the three months ended April 30, 2020 and 2019, respectively.
Cash and Cash Equivalents
The Company considers all highly liquid investments purchased with an original maturity of three months or less to be cash equivalents. Cash and cash equivalents are stated at fair value.
Marketable Securities
The Company considers all of its marketable debt securities as available for use in current operations, including those with maturity dates beyond one year, and therefore classifies these securities within current assets on the condensed consolidated balance sheets. Securities are classified as available for sale and are carried at fair value, with the change in unrealized gains and losses, net of tax, reported as a separate component on the condensed consolidated statements of comprehensive income until realized. Fair value is determined based on quoted market rates when observable or utilizing data points that are observable, such as quoted prices, interest rates and yield curves. DeclinesSecurities with an amortized cost basis in excess of estimated fair value judgedare assessed to be other-than-temporarydetermine what amount of the excess, if any, is caused by expected credit losses, as required by new accounting pronouncement ASU 2016-13 discussed in further detail below. Expected credit losses on securities available for saleare recognized in other income (expense), net on the condensed consolidated statements of operations, and any remaining unrealized losses, net of taxes, are included as a reduction to investment income. In order to determine whether a decline in value is other-than-temporary, the Company evaluates, amongaccumulated other factors: the duration and extent to which the fair value has been less than the carrying value and its intent and ability to retain the investment for a period of time sufficient to allow for any anticipated recoverycomprehensive loss in fair value.stockholders' equity. For the
purposes of computing realized and unrealized gains and losses, the cost of securities sold is based on the specific-identification method. Interest on securities classified as available for sale is also included as a component of investment income.
Strategic Investments
The Company holds certain marketable equity and non-marketablestrategic investments in privately held debt and equity securities within its strategic investments portfolio. Marketableand publicly held equity securities in which the Company does not have a controlling interest.
Privately held equity securities which the Company does not have a controlling financial interest in but does exercise significant influence over the investee are measured using quoted prices in their respective active markets, non-marketable debtaccounted for under the equity method. Privately held equity securities not accounted for under the equity method are recorded at their estimated fair valuecost and adjusted for observable transactions for same or similar investments of the non-marketablesame issuer (referred to as the measurement alternative) or impairment. All gains and losses on privately held equity securities, realized and unrealized, are recorded at cost.
Marketable equity securities and non-marketablethrough gains on strategic investments, net on the condensed consolidated statement of operations. Privately held debt securities which consist of noncontrolling debt investments in privately held companies, are recorded at fair value with changes in fair value recorded through accumulated other comprehensive income. Equity investments without readily determinable fair values for whichincome on the Company does not have the ability to exercise significant influence are accounted for using the cost methodcondensed consolidated balance sheet.
Valuations of accounting. Under the cost method of accounting, the non-marketableprivately held securities are carried at cost and are adjusted only for other-than-temporary impairments, certain distributions and additional investments. These investments are valued using significant unobservable inputs or data in an inactive market and the valuation requires the Company's judgmentinherently complex due to the absence of market prices and inherent lack of liquidity.readily available market data and require the Company's use of judgment. The estimated fair value is based on quantitative and qualitative factors including, but not limited to, subsequent financing activities by the investee and projected discounted cash flows. Faircarrying value is not estimatedadjusted for non-marketablethe Company's privately held equity securities if there are no observable price changes in a same or similar security from the same issuer or if there are no identified events or changes in circumstances that may have an effect onindicate impairment, as discussed below. In determining the estimated fair value of its strategic investments in privately held companies, the Company utilizes the most recent data available to the Company. The Company assesses its privately held debt and equity securities in its strategic investment portfolio at least quarterly for impairment. The Company’s impairment analysis encompasses an assessment of both qualitative and quantitative factors including the investee's financial metrics, market acceptance of the investee's product or technology and the rate at which the investee is using its cash. If the investment is considered impaired, the Company recognizes an impairment through the condensed consolidated statement of operations and establishes a new carrying value for the investment.
The carryingPublicly held equity securities are measured at fair value of the Company’swith changes recorded through gains on strategic investments, is impacted by various events such as entering into new investments, dispositions due to acquisitions, fair market value adjustments or initial public offerings. The cash inflows from
exits and cash outflows for new investments are disclosed as strategic investments withinnet on the investing activities section of thecondensed consolidated statement of cash flows and any gains or losses are recorded within the operating activities of the statements of cash flows for each of the respective fiscal quarter periods. operations.
Derivative Financial Instruments
The Company enters into foreign currency derivative contracts with financial institutions to reduce foreign exchange risk. The Company uses forward currency derivative contracts to minimize the Company’s exposure to balances primarily denominated in the Euro, British Pound Sterling, Japanese Yen, Canadian Dollar and Australian Dollar. The Company’s foreign currency derivative contracts, which are not designated as hedging instruments, are used to reduce the exchange rate risk associated primarily with intercompany receivables and payables. The Company’s derivative financial instruments program is not designated for trading or speculative purposes. The Company generally enters into master netting arrangements with the financial institutions with which it contracts for such derivative contracts, which permit net settlement of transactions with the same counterparty, thereby reducing credit-related losses in the event of the financial institutions' nonperformance. As of October 31, 2017April 30, 2020 and January 31, 2017,2020, the outstanding foreign currency derivative contracts that were not settled were recorded at fair value on the condensed consolidated balance sheets.
Foreign currency derivative contracts are marked-to-market at the end of each reporting period with gains and losses recognized as other expense to offset the gains or losses resulting from the settlement or remeasurement of the underlying foreign currency denominated receivables and payables. While the contract or notional amount is often used to express the volume of foreign currency derivative contracts, the amounts potentially subject to credit risk are generally limited to the amounts, if any, by which the counterparties’ obligations under the agreements exceed the obligations of the Company to the counterparties.
Fair Value Measurement
The Company measures its cash and cash equivalents, marketable securities and foreign currency derivative contracts at fair value. In addition, the Company measures its strategic investments, including its publicly held equity securities, privately held debt securities and privately held equity securities for which there has been an observable price change in a same or similar security, at fair value. The additional disclosures regarding the Company’s fair value measurements are included in Note 45 “Fair Value Measurement.”
Property and Equipment
Property and equipment are stated at cost. Depreciation is calculated on a straight-line basis over the estimated useful lives of those assets as follows:
|
| | | | |
| Computers, equipment and software | 3 to 9 years |
| Furniture and fixtures | 5 years |
| Leasehold improvements | Shorter of the estimated lease term or 10 years |
| |
Building and structural components | Average weighted useful life of 32 years |
Building - leased facility | 27 years |
Buildingbuilding improvements | 10 to 40 years |
When assets are retired or otherwise disposed of, the cost and accumulated depreciation and amortization are removed from their respective accounts and any loss on such retirement is reflected in operating expenses.
Capitalized Software Costs
The Company capitalizes costs related to its enterprise cloud computing services and certain projects for internal use incurred during the application development stage. Costs related to preliminary project activities and post implementation activities are expensed as incurred. Internal-use software is amortized on a straight-line basis over its estimated useful life, which is generally three to five years. Management evaluates the useful lives of these assets on an annual basis and tests for impairment whenever events or changes in circumstances occur that could impact the recoverability of these assets.
Intangible Assets acquiredAcquired through Business Combinations
Intangible assets are amortized over their estimated useful lives. Each period, the Company evaluates the estimated remaining useful life of its intangible assets and whether events or changes in circumstances warrant a revision to the remaining period of amortization. Management tests for impairment whenever events or changes in circumstances occur that could impact the recoverability of these assets.
Impairment Assessment
The Company evaluates intangible assets and long-lived assets for possible impairment whenever events or changes in circumstances indicate that the carrying amount of such assets may not be recoverable. This includes but is not limited to significant adverse changes in business climate, market conditions, or other events that indicate an asset's carrying amount may not be recoverable. Recoverability of these assets is measured by comparing the carrying amount of each asset to the future
undiscounted cash flows the asset is expected to generate. If the undiscounted cash flows used in the test for recoverability are less than the carrying amount of these assets, the carrying amount of such assets is reduced to fair value.
The Company evaluates and tests the recoverability of its goodwill for impairment at least annually during its fourth quarter of each fiscal year or more often if and when circumstances indicate that goodwill may not be recoverable.
There waswere no impairmentmaterial impairments of capitalized software, intangible assets, long-lived assets or goodwill during the three and nine months ended October 31, 2017April 30, 2020 and 2016.2019, respectively.
Business Combinations
The Company uses its best estimates and assumptions to accurately assign fair value to the tangible and intangible assets acquired and liabilities assumed at the acquisition date. The Company’s estimates are inherently uncertain and subject to refinement. During the measurement period, which may be up to one year from the acquisition date, the Company may record adjustments to the fair value of these tangible and intangible assets acquired and liabilities assumed, with the corresponding offset to goodwill. In addition, uncertain tax positions and tax-related valuation allowances are initially establishedrecorded in connection with a business combination as of the acquisition date. The Company continues to collect information and reevaluates these estimates and assumptions quarterly and records any adjustments to the Company’s preliminary estimates to goodwill provided that the Company is within the measurement period. Upon the conclusion of the measurement period or final determination of the fair value of assets acquired or liabilities assumed, whichever comes first, any subsequent adjustments are recorded to the Company’s condensed consolidated statementsstatement of operations.
In the event the Company acquires an entity with which the Company has a preexisting relationship, the Company will generally recognize a gain or loss to settle that relationship as of the acquisition date which is recorded in otherwithin operating income (expense) withinon the condensed consolidated statements of operations. In the event that the Company acquires an entity in which the Company previously held a strategic investment, the difference between the fair value of the shares as of the date of the acquisition and the carrying value of the strategic investment is recorded as a gain or loss and disclosed separatelyrecorded within net gains (or losses) on strategic investments in the statementscondensed consolidated statement of operations.
Leases and Asset Retirement Obligations
The Company categorizesdetermines if an arrangement is a lease at inception. Operating leases are included in operating lease right-of-use (“ROU”) assets and current and noncurrent operating lease liabilities on the Company’s condensed consolidated balance sheets. Finance leases are included in property and equipment, accrued expenses and other liabilities, and other noncurrent liabilities on the Company’s condensed consolidated balance sheets.
ROU assets represent the Company's right to use an underlying asset for the lease term and the corresponding lease liabilities represent its obligation to make lease payments arising from the lease. Lease ROU assets and lease liabilities are recognized based on the present value of the future minimum lease payments over the lease term at their inception as either operatingcommencement date. The lease ROU asset is reduced for tenant incentives and excludes any initial direct costs incurred. As the Company’s leases do not provide an implicit rate, the net present value of future minimum lease payments is determined using the Company’s incremental borrowing rate. The Company's incremental borrowing rate is estimated to approximate the interest rate on a collateralized basis with similar terms and payments, in an economic environment where the leased asset is located. The Company’s lease terms may include options to extend or capital leases. Interminate the lease. These options are reflected in the ROU asset and lease liability when it is reasonably certain lease agreements,that the Company may receive rent holidays and other incentives.will exercise the option. The Company recognizesreassesses the lease coststerm if and when a significant event or change in circumstances occurs within the control of the Company, such as construction of significant leasehold improvements that are expected to have economic value when the option becomes exercisable.
Lease expenses for minimum lease payments for operating leases are recognized on a straight-line basis once controlover the lease term. Amortization expense of the spaceROU asset for finance leases is achieved, without regardrecognized on a straight-line basis over the lease term and interest expense for finance leases is recognized based on the incremental borrowing rate.
The Company has lease agreements with lease and non-lease components, which it has elected to deferred payment terms such as rent holidays that defercombine for all asset classes. In addition, the Company does not recognize ROU assets or lease liabilities for leases with a term of 12 months or less for all of its asset classes.
On the lease commencement date of required payments. Additionally, incentives received are treated as a reduction of costs over the term of the agreement.
The Company establishes assets and liabilities for the present value of estimated future costs to retire long-lived assets at the termination or expiration of a lease. Such assets are depreciatedamortized over the lease periodterm to operating expense.
In the event the Company is the deemed owner for accounting purposes during construction, the Company records assets and liabilities for the estimated construction costs incurred under build-to-suit lease arrangements to the extent it is involved in the construction of structural improvements or takes construction risk prior to commencement of a lease.
The Company additionally has entered into subleases for unoccupied leased office space. ToAny impairments to the extent there are losses associated with theROU asset, leasehold improvements or other assets as a result of a sublease they are recognized in the period the sublease is executed. Gains are recognized over the sublease life.executed and recorded as an operating expense. Any sublease payments received in excess of the straight-line rent payments for the sublease are recorded in other income (expense).as an offset to operating expenses and recognized over the sublease life.
Accounting for Stock-Based Expense
Stock-based expenses related to stock options are measured based on grant date at fair value using the Black-Scholes option pricing model and restricted stock awards based on grant date at fair value using the closing stock price. The Company recognizes stock-based expenses related to stock options and restricted stock awards on a straight-line basis, net of estimated forfeitures, over the requisite service period of the awards, which is generally the vesting term of four years. The Company recognizes stock-based
Stock-based expenses related to shares issued pursuant to itsthe Company’s Amended and Restated 2004 Employee Stock Purchase Plan (“ESPP” or “2004 Employee Stock Purchase Plan”) are measured based on grant date at fair value using the Black-Scholes option pricing model. The Company recognizes stock-based expenses related to shares issued pursuant to the 2004 Employee Stock Purchase Plan on a straight-line basis over the offering period, which is 12 months. The ESPP allows employees to purchase shares of the Company's common stock at a 15 percent discount from the lower of the Company’s stock price on (i) the first day of the offering period or on (ii) the last day of the purchase period and also allows employees to reduce their percentage election once during a six month purchase period (December 15 and June 15 of each fiscal year), but not increase that election until the next one-year offering period. The ESPP also includes a re-set provision for the purchase price if the stock price on the purchase date is less than the stock price on the offering date.
Stock-based expenses related to performance share grants, which are awarded to executive officers and other members of senior management, are measured based on grant date at fair value using a Monte Carlo simulation model and expensed on a straight-line basis, net of estimated forfeitures, over the service period of the awards, which is generally the vesting term of three years.
The Company, at times, grants unvested restricted shares to employee stockholders of certain acquired companies in lieu of cash consideration. These awards are generally subject to continued post-acquisition employment. Therefore, the Company accounts for them as post-acquisition stock-based expense. The Company recognizes stock-based expense equal to the grant date fair value of the restricted stock awards on a straight-line basis over the requisite service period of the awards, which is generally four years.
Income Taxes
The Company uses the asset and liability method of accounting for income taxes. Under this method, deferred tax assets and liabilities are determined based on temporary differences between the financial statement and tax basis of assets and liabilities using enacted tax rates in effect for the year in which the differences are expected to reverse. The effect on deferred tax assets and liabilities of a change in tax laws is recognized in the condensed consolidated statements of operations in the period that includes the enactment date.
The Company’s tax positions are subject to income tax audits by multiple tax jurisdictions throughout the world. The Company recognizes the tax benefit of an uncertain tax position only if it is more likely than not that the position is sustainable upon examination by the taxing authority, solely based on its technical merits. The tax benefit recognized is measured as the largest amount of benefit which is greater than 50 percent likely to be realized upon settlement with the taxing authority. The Company recognizes interest accrued and penalties related to unrecognized tax benefits in the income tax provision.
Valuation allowances are established when necessary to reduce deferred tax assets to the amounts that are more likely than not expected to be realized based on the weighting of positive and negative evidence. Future realization of deferred tax assets ultimately depends on the existence of sufficient taxable income of the appropriate character (for example, ordinary income or capital gain) within the carryback or carryforward periods available under the applicable tax law. The Company regularly reviews the deferred tax assets for recoverability based on historical taxable income, projected future taxable income, the expected timing of the reversals of existing temporary differences and tax planning strategies. The Company’s judgments regarding future profitability may change due to many factors, including future market conditions and the ability to successfully execute its business plans and/or tax planning strategies.plans. Should there be a change in the ability to recover deferred tax assets, the tax provision would increase or decrease in the period in which the assessment is changed.
Foreign Currency Translation
The functional currency of the Company’s major foreign subsidiaries is generally the local currency. Adjustments resulting from translating foreign functional currency financial statements into U.S. dollars are recorded as a separate component on the condensed consolidated statementsstatement of comprehensive income. Foreign currency transaction gains and losses are included in Otherother income (expense) in the condensed consolidated statementsstatement of operations for the period. All assets and liabilities denominated in a foreign currency are translated into U.S. dollars at the exchange rate on the balance sheet date. Revenues and expenses are translated at the average exchange rate during the period. Equity transactions are translated using historical exchange rates.
Warranties and Indemnification
The Company’s enterprise cloud computing services are typically warranted to perform in a manner consistent with general industry standards that are reasonably applicable and materially in accordance with the Company’s online help documentation under normal use and circumstances.
The Company’s arrangements generally include certain provisions for indemnifying customers against liabilities if its products or services infringe a third party’s intellectual property rights. To date, the Company has not incurred any material costs as a result of such obligations and has not accrued any material liabilities related to such obligations in the accompanying condensed consolidated financial statements.
The Company has also agreed to indemnify its directors and executive officers for costs associated with any fees, expenses, judgments, fines and settlement amounts incurred by any of these persons in any action or proceeding to which any of those persons is, or is threatened to be, made a party by reason of the person’s service as a director or officer, including any action by the Company, arising out of that person’s services as the Company’s director or officer or that person’s services provided to any other company or enterprise at the Company’s request. The Company maintains director and officer insurance coverage that would generally enable the Company to recover a portion of any future amounts paid. The Company may also be subject to indemnification obligations by law with respect to the actions of its employees under certain circumstances and in certain jurisdictions.
New Accounting Pronouncements Adopted in Fiscal 20182021
ASU 2016-13
In January 2017, the Financial Accounting Standards Board ("FASB") issued Accounting Standards Update No. 2017-01, "Business Combinations (Topic 805) Clarifying the Definition of a Business" ("ASU 2017-01") which amended the existing FASB Accounting Standards Codification. The standard provides additional guidance to assist entities with evaluating whether transactions should be accounted for as acquisitions (or disposals) of assets or businesses. The definition of a business affects many areas of accounting, including acquisitions, disposals, goodwill, and consolidation. ASU 2017-01 is effective for fiscal 2019 with early adoption permitted. The Company early adopted the standard in the first quarter of fiscal 2018 on a prospective basis. Since the Company has not acquired any material businesses since the start of the year, this standard has had no impact on the Company's financial statements.
In May 2017, the FASB issued Accounting Standards Update No. 2017-09, "Compensation—Stock Compensation (Topic 718): Scope of Modification Accounting" ("ASU 2017-09") which amended the existing FASB Accounting Standards Codification. The standard provides clarity and reduces the cost and complexity when applying the guidance in Topic 718, Compensation—Stock Compensation, to a change to the terms or conditions of a share-based payment award. ASU 2017-09 is effective for fiscal 2019 with early adoption permitted. The Company early adopted the standard in the second quarter of fiscal 2018 on a prospective basis and does not expect it to have any impact on the Company's financial statements.
Accounting Pronouncements Pending Adoption
In May 2014, the FASB issued Accounting Standards Update No. 2014-09, "Revenue from Contracts with Customers (Topic 606)" ("ASU 2014-09"), which amended the existing FASB Accounting Standards Codification, replaces existing revenue recognition guidance with a comprehensive revenue measurement and recognition standard and expanded disclosure requirements. The standard also provides guidance on the recognition of costs related to obtaining customer contracts. ASU 2014-09, as amended, will be effective as of the beginning of fiscal 2019, including interim periods within that reporting period.
The Company plans to adopt the standard using the full retrospective method to restate each prior reporting period presented.
The Company is continuing to assess the impact of adopting ASU 2014-09 on its financial position, results of operations and related disclosures and has concluded that the impact to the opening balance sheet as of February 1, 2016, due to the adjustment of revenues, is not material. The Company has not yet determined whether the impact on revenues will be material for the adjusted statements of operations or for future periods. Additionally, as the Company continues to assess the new standard along with industry trends and additional interpretive guidance, the Company may adjust its implementation plan accordingly.
The Company believes that the new standard will impact the following policies and disclosures:
removal of the current limitation on contingent revenue will result in revenue being recognized earlier for certain contracts;
allocation of subscription and support revenue across different clouds and to professional services revenue;
estimation of variable consideration for arrangements with overage fees;
required disclosures including information about the remaining transaction price and when the Company expects to recognize revenue; and
accounting for deferred commissions including costs that qualify for deferral and the amortization period.
The commission accounting under the new standard is significantly different than the Company's current commission capitalization policy, as it will require the Company to capitalize more costs and amortize them over a longer period of time. Under the Company's current policy, the Company only capitalizes commissions that have a direct relationship to a specific revenue contract and the cost is deemed to be incremental. Under the new standard, the concept of what must be capitalized is significantly broader since a direct relationship with a revenue contract is not required. Accordingly, the new standard will result in additional types of costs being capitalized, including fringe benefits and taxes. Additionally, all amounts capitalized will be amortized over a period longer than the Company's current policy of amortizing the deferred amounts over the specific revenue contract terms, which are typically 12 to 36 months. Specifically, initial incremental contract costs will be deferred and amortized over an estimated customer life of four years, which is calculated based on both qualitative and quantitative factors, such as product life cycles and customer attrition. While the Company has not yet finalized its assessment of the impact the new commission accounting policy will have on its financial position and results of operations, the Company believes it will be material to both its balance sheet and statement of operations due to the capitalization of additional costs and the longer period of amortization.
The Company does not expect the adoption of ASU 2014-09 to have any impact on its operating cash flows.
In JanuaryJune 2016, the FASB issued Accounting Standards Update No. 2016-01,2016-13 (ASU 2016-13) "Financial Instrument-Overall (Subtopic 825-10)Instruments-Credit Losses (Topic 326): Measurement of Credit Losses on Financial Instruments," ("ASU 2016-01"), which requires entities to measure equitythe measurement and recognition of expected credit losses for financial assets held at amortized cost, which includes the Company's accounts receivables, certain financial instruments at fair value and recognize any changescontract assets. ASU 2016-13 replaces the prior incurred loss impairment model with an expected loss methodology, which results in fair value in other income (expense) within the statementmore timely recognition of operations. Under the new standard,credit losses. Effective on February 1, 2020, the Company will record its publicly traded equity investments at fair value on a quarterly basisadopted the provisions and record the changeexpanded disclosure requirements described in other income (expense) within the statement of operations. Previously, such adjustments were recorded in other comprehensive income.ASU 2016-13. The guidance provides for electing the measurement alternative or defaulting to the fair value option for equity investments that do not have readily determinable fair values.The Company plans to elect the measurement alternative for its equity investments in privately held companies. These investments will be measured at cost, less any impairment, plus or minus adjustments resulting from observable price changes in orderly transactions for the identical or a similar investment of the same issuer, which are recorded in other income (expense) within the statement of operations. The new standard is effective as of the beginning of fiscal 2019, including interim periods within that reporting period, on a prospective basis for nonmarketable equity securities and a modified retrospective basis for publicly held equity investments. The Company expects the adoption of ASU 2016-01 will2016-13 was not material.
impact its strategic investments portfolio, which consists of approximately $100.3 million in publicly traded equity investments and $516.6 million in privately held equity investments, as of October 31, 2017, both of which are recorded in strategic investments within the balance sheet. Refer to Note 2, "Investments," for additional details. The new standard could have a material impact to the Company's consolidated financial statements, including additional volatility to other income (expense) within the Company's statements of operations in future periods, due to changes in market prices of the Company's investments in publicly held equity investments and the valuation and timing of same or similar transactions of the Company's investments in privately held equity investments.Accounting Pronouncements Pending Adoption
In October 2016,December 2019, the FASB issued Accounting Standards Update No. 2016-16, "Income2019-12, “Income Taxes (Topic 740): Intra-Entity TransfersSimplifying the Accounting for Income Taxes (“ASU 2019-12”),” which modifies and eliminates certain exceptions to the general principles of Assets Other Than Inventory" ("ASU 2016-16"), which requires entities to recognize the income tax consequences of an intra-entity transfer of an asset, other than inventory, when the transfer occurs. The new standard is effective for annual periods beginning after December 15, 2017, with early adoption permitted as of the beginning of a fiscal year. The Company plans to adopt the new standard in its first quarter of fiscal 2019 and does not expect it to have a material impact on its consolidated financial statements.
In February 2016, the FASB issued Accounting Standards Update No. 2016-02, "Leases (Topic 842)" ("ASU 2016-02"), which requires lessees to record most leases on their balance sheets but recognize the expenses on their statements of operations in a manner similar to current accounting rules. ASU 2016-02 states that a lessee would recognize a lease liability for the obligation to make lease payments and a right-to-use asset for the right to use the underlying asset for the lease term.ASC 740, Income taxes. The new standard is effective for interim and annual periods beginning after December 15, 2018 on a modified retrospective basis. The Company2020, and early adoption is in the process of implementing changes to its systems, processes and controls, in conjunction with its review of existing lease agreements, in order to adopt the new standard in its first quarter of fiscal 2020. The Company expects its leases designated as operating leases in Note 13, “Commitments,” will be reported on the consolidated balance sheets upon adoption.permitted. The Company is currently evaluating the impact of the adoption to its consolidated financial statements as it relates to other aspectsstatements.
2. Revenues
Disaggregation of Revenue
Subscription and Support Revenue by the Company's service offerings
Subscription and support revenues consisted of the business.following (in millions):
Reclassifications | | | | | | | | | | | | | | | | | | | |
| | | | Three Months Ended April 30, |
| | | | | | 2020 | | 2019 | | |
| Sales Cloud | | | | | $ | 1,245 | | | $ | 1,073 | | | |
| Service Cloud | | | | | 1,252 | | | 1,020 | | | |
| Salesforce Platform and Other | | | | | 1,364 | | | 842 | | | |
| Marketing and Commerce Cloud | | | | | 714 | | | 561 | | | |
| | | | | $ | 4,575 | | | $ | 3,496 | | | |
Certain reclassifications to fiscal 2017 balances were made to conform
Total Revenue by Geographic Locations
Revenues by geographical region consisted of the following (in millions):
| | | | | | | | | | | | | | | | | |
| | | | Three Months Ended April 30, |
| | | | | | 2020 | | 2019 | | |
| Americas | | | | | $ | 3,370 | | | $ | 2,617 | | | |
| Europe | | | | | 1,034 | | | 755 | | | |
| Asia Pacific | | | | | 461 | | | 365 | | | |
| | | | | $ | 4,865 | | | $ | 3,737 | | | |
Revenues by geography are determined based on the region of the Company's contracting entity, which may be different than the region of the customer. Americas revenue attributed to the United States was approximately 96 percent during the three months ended April 30, 2020 and 2019, respectively. No other country represented more than ten percent of total revenue during the three months ended April 30, 2020 and 2019, respectively.
Contract Balances
Contract Assets
As described in Note 1, subscription and support revenue is generally recognized ratably over the contract term beginning on the commencement date of each contract. License revenue is recognized as the licenses are delivered. The Company records a contract asset when revenue recognized on a contract exceeds the billings. The Company's standard billing terms are annual in advance. Contract assets were $454 million as of April 30, 2020 as compared to $449 million as of January 31, 2020, and are included in prepaid expenses and other current assets on the condensed consolidated balance sheet. Impairments of contract assets were immaterial during the three months ended April 30, 2020 and 2019, respectively.
Unearned Revenue
Unearned revenue represents amounts that have been invoiced in advance of revenue recognition and is recognized as revenue when transfer of control to customers has occurred or services have been provided. The unearned revenue balance does not represent the total contract value of annual or multi-year, non-cancelable subscription agreements. The Company generally invoices customers in annual installments. The unearned revenue balance is influenced by several factors, including seasonality, the compounding effects of renewals, invoice duration, invoice timing, dollar size and new business linearity within the quarter.
The change in unearned revenue was as follows (in millions):
| | | | | | | | | | | | | | | |
| | | Three Months Ended April 30, |
| | | | | 2020 | | 2019 |
| Unearned revenue, beginning of period | | | | | $ | 10,662 | | | $ | 8,564 | |
| Billings and other (1) | | | | | 3,305 | | | 2,714 | |
| Contribution from contract asset | | | | | 5 | | | 44 | |
| Revenue recognized ratably over time | | | | | (4,453) | | | (3,488) | |
| Revenue recognized over time as delivered | | | | | (191) | | | (172) | |
| Revenue recognized at a point in time | | | | | (221) | | | (77) | |
| Unearned revenue from business combinations | | | | | 5 | | | 0 | |
| Unearned revenue, end of period | | | | | $ | 9,112 | | | $ | 7,585 | |
(1) Other includes, for example, the impact of foreign currency translation.
Revenue recognized ratably over time is generally billed in advance and includes Cloud Services, the related support and advisory services.
Revenue recognized over time as delivered includes professional services billed on a time and materials basis, fixed fee professional services and training classes that are primarily billed, delivered and recognized within the same reporting period.
Revenue recognized at a point in time substantially consists of on-premise software licenses.
Remaining Performance Obligation
Remaining performance obligation represents contracted revenue that has not yet been recognized and includes unearned revenue and unbilled amounts that will be recognized as revenue in future periods. Transaction price allocated to the remaining performance obligation is influenced by several factors, including seasonality, the timing of renewals, the timing of software license deliveries, average contract terms and foreign currency exchange rates. Unbilled portions of the remaining performance obligation denominated in foreign currencies are revalued each period presentationbased on the period end exchange rates. Unbilled portions of the remaining performance obligation are subject to future economic risks including bankruptcies, regulatory changes and other market factors.
The Company excludes amounts related to performance obligations that are billed and recognized as they are delivered. This primarily consists of professional services contracts that are on a time-and-materials basis.
The majority of the Company's noncurrent remaining performance obligation is expected to be recognized in the consolidated balance sheets, consolidated statementnext 13 to 36 months.
Remaining performance obligation consisted of operations and consolidated statementsthe following (in billions):
| | | | | | | | | | | | | | | | | |
| | Current | | Noncurrent | | Total |
| As of April 30, 2020 | $ | 14.5 | | | $ | 14.8 | | | $ | 29.3 | |
| | | | | |
| As of January 31, 2020 | $ | 15.0 | | | $ | 15.8 | | | $ | 30.8 | |
| | | | | |
| | | | | |
| | | | | |
2.3. Investments
Marketable Securities
At October 31, 2017,April 30, 2020, marketable securities consisted of the following (in thousands)millions):
| | | Investments classified as Marketable Securities | Amortized Cost | | Unrealized Gains | | Unrealized Losses | | Fair Value | Investments classified as Marketable Securities | Amortized
Cost | | Unrealized
Gains | | Unrealized
Losses | | Fair Value |
| Corporate notes and obligations | $ | 939,959 |
| | $ | 2,246 |
| | $ | (2,435 | ) | | $ | 939,770 |
| Corporate notes and obligations | $ | 2,312 | | | $ | 9 | | | $ | (28) | | | $ | 2,293 | |
| U.S. treasury securities | 137,172 |
| | 29 |
| | (491 | ) | | 136,710 |
| U.S. treasury securities | 172 | | | 2 | | | 0 | | | 174 | |
| Mortgage backed obligations | 98,226 |
| | 22 |
| | (532 | ) | | 97,716 |
| Mortgage backed obligations | 269 | | | 5 | | | 0 | | | 274 | |
| Asset backed securities | 202,180 |
| | 96 |
| | (219 | ) | | 202,057 |
| Asset backed securities | 890 | | | 3 | | | (4) | | | 889 | |
| Municipal securities | 56,387 |
| | 81 |
| | (201 | ) | | 56,267 |
| Municipal securities | 165 | | | 1 | | | 0 | | | 166 | |
| Foreign government obligations | 68,845 |
| | 2 |
| | (524 | ) | | 68,323 |
| Foreign government obligations | 92 | | | 1 | | | 0 | | | 93 | |
| U.S. agency obligations | 10,506 |
| | 1 |
| | (9 | ) | | 10,498 |
| U.S. agency obligations | 12 | | | 0 | | | 0 | | | 12 | |
| | Time deposits | | Time deposits | 1 | | | 0 | | | 0 | | | 1 | |
| Covered bonds | 45,485 |
| | 63 |
| | (61 | ) | | 45,487 |
| Covered bonds | 128 | | | 0 | | | 0 | | | 128 | |
| Total marketable securities | $ | 1,558,760 |
|
| $ | 2,540 |
|
| $ | (4,472 | ) |
| $ | 1,556,828 |
| Total marketable securities | $ | 4,041 | | | $ | 21 | | | $ | (32) | | | $ | 4,030 | |
At January 31, 2017,2020, marketable securities consisted of the following (in thousands)millions):
| | | Investments classified as Marketable Securities | Amortized Cost | | Unrealized Gains | | Unrealized Losses | | Fair Value | Investments classified as Marketable Securities | Amortized
Cost | | Unrealized
Gains | | Unrealized
Losses | | Fair Value |
| Corporate notes and obligations | $ | 321,284 |
| | $ | 887 |
| | $ | (1,531 | ) | | $ | 320,640 |
| Corporate notes and obligations | $ | 2,199 | | | $ | 9 | | | $ | (1) | | | $ | 2,207 | |
| U.S. treasury securities | 62,429 |
| | 68 |
| | (674 | ) | | 61,823 |
| U.S. treasury securities | 182 | | | 1 | | | 0 | | | 183 | |
| Mortgage backed obligations | 74,882 |
| | 39 |
| | (669 | ) | | 74,252 |
| Mortgage backed obligations | 225 | | | 1 | | | 0 | | | 226 | |
| Asset backed securities | 101,913 |
| | 74 |
| | (197 | ) | | 101,790 |
| Asset backed securities | 779 | | | 2 | | | 0 | | | 781 | |
| Municipal securities | 33,523 |
| | 35 |
| | (183 | ) | | 33,375 |
| Municipal securities | 157 | | | 1 | | | 0 | | | 158 | |
| Foreign government obligations | 10,491 |
| | 3 |
| | (36 | ) | | 10,458 |
| Foreign government obligations | 69 | | | 0 | | | 0 | | | 69 | |
| U.S. agency obligations | | U.S. agency obligations | 12 | | | 0 | | | 0 | | | 12 | |
| Time deposits | | Time deposits | 1 | | | 0 | | | 0 | | | 1 | |
| Covered bonds | | Covered bonds | 165 | | | 0 | | | 0 | | | 165 | |
| Total marketable securities | $ | 604,522 |
|
| $ | 1,106 |
|
| $ | (3,290 | ) |
| $ | 602,338 |
| Total marketable securities | $ | 3,789 | | | $ | 14 | | | $ | (1) | | | $ | 3,802 | |
The contractual maturities of the investments classified as marketable securities are as follows (in thousands)millions):
| | | | As of | | As of |
| | October 31,
2017 | | January 31,
2017 | | April 30, 2020 | | January 31, 2020 |
| Due within 1 year | $ | 226,929 |
| | $ | 104,631 |
| Due within 1 year | $ | 1,293 | | | $ | 1,332 | |
| Due in 1 year through 5 years | 1,314,352 |
| | 494,127 |
| Due in 1 year through 5 years | 2,721 | | | 2,466 | |
| Due in 5 years through 10 years | 15,547 |
| | 3,580 |
| Due in 5 years through 10 years | 16 | | | 4 | |
| | $ | 1,556,828 |
| | $ | 602,338 |
| | $ | 4,030 | | | $ | 3,802 | |
As of October 31, 2017,April 30, 2020, the following marketable securities were in ana continuous unrealized loss position (in thousands)millions):
|
| | | | | | | | | | | | | | | | | | | | | | | |
| | Less than 12 Months | | 12 Months or Greater | | Total |
| | Fair Value | | Unrealized Losses | | Fair Value | | Unrealized Losses | | Fair Value | | Unrealized Losses |
| Corporate notes and obligations | $ | 424,101 |
| | $ | (2,052 | ) | | $ | 28,653 |
| | $ | (383 | ) | | $ | 452,754 |
| | $ | (2,435 | ) |
| U.S. treasury securities | 114,724 |
| | (491 | ) | | 0 |
| | 0 |
| | 114,724 |
| | (491 | ) |
| Mortgage backed obligations | 68,841 |
| | (315 | ) | | 16,564 |
| | (217 | ) | | 85,405 |
| | (532 | ) |
| Asset backed securities | 126,186 |
| | (210 | ) | | 3,461 |
| | (9 | ) | | 129,647 |
| | (219 | ) |
| Municipal securities | 30,671 |
| | (148 | ) | | 2,788 |
| | (53 | ) | | 33,459 |
| | (201 | ) |
| Foreign government obligations | 62,697 |
| | (520 | ) | | 1,027 |
| | (4 | ) | | 63,724 |
| | (524 | ) |
| U.S. agency obligations | 6,746 |
| | (9 | ) | | 0 |
| | 0 |
| | 6,746 |
| | (9 | ) |
| Covered bonds | 5,861 |
| | (61 | ) | | 0 |
| | 0 |
| | 5,861 |
| | (61 | ) |
| | $ | 839,827 |
| | $ | (3,806 | ) | | $ | 52,493 |
| | $ | (666 | ) | | $ | 892,320 |
| | $ | (4,472 | ) |
| | | | | | | | | | | | | | | | | | | | | | | | | | | | | | | | | | | |
| | Less than 12 Months | | 12 Months or Greater | | Total |
| | Fair Value | | Unrealized
Losses | | Fair Value | | Unrealized
Losses | | Fair Value | | Unrealized
Losses |
| Corporate notes and obligations | $ | 1,463 | | | $ | (28) | | | $ | 0 | | | $ | 0 | | | $ | 1,463 | | | $ | (28) | |
| | | | | | | | | | | |
| | | | | | | | | | | |
| Asset backed securities | 359 | | | (4) | | | 0 | | | 0 | | | 359 | | | (4) | |
| | | | | | | | | | | |
| | | | | | | | | | | |
| | | | | | | | | | | |
| | | | | | | | | | | |
| | | | | | | | | | | |
| $ | 1,822 | | | $ | (32) | | | $ | 0 | | | $ | 0 | | | $ | 1,822 | | | $ | (32) | |
The unrealized losses for each of the fixed rate marketable securities wereranged from less than $0.2$1 million to approximately $2 million. The Company does not believe any of the unrealized losses represent an other-than-temporary impairmentindication of credit loss based on its evaluation of available evidence as of October 31, 2017, such as the Company's intentApril 30, 2020. The Company does not intend to holdsell its investments in a loss position and whether it is not more likely than not that the Company will be required to sell the investmentinvestments before recovery of the investment'sinvestment’s amortized basis. The Company notes no credit allowances were recorded as of April 30, 2020. The Company expects to receive the full principal and interest on all of these marketable securities.
Investment Income
Investment income consists of interest income, realized gains and realized losses on the Company’s cash, cash equivalents and marketable securities. The components of investment income are presented below (in thousands)millions):
|
| | | | | | | | | | | | | | | |
| | Three Months Ended October 31, | | Nine Months Ended October 31, |
| | 2017 | | 2016 | | 2017 | | 2016 |
| Interest income | $ | 10,038 |
| | $ | 3,642 |
| | $ | 24,433 |
| | $ | 17,961 |
|
| Realized gains | 258 |
| | 210 |
| | 770 |
| | 7,771 |
|
| Realized losses | (247 | ) | | (143 | ) | | (1,134 | ) | | (1,985 | ) |
| Total investment income | $ | 10,049 |
| | $ | 3,709 |
| | $ | 24,069 |
| | $ | 23,747 |
|
Reclassification adjustments out of accumulated other comprehensive income into investment income were immaterial for the three and nine months ended October 31, 2017 and 2016.
| | | | | | | | | | | | | | | | | |
| | | | Three Months Ended April 30, |
| | | | | | 2020 | | 2019 | | |
| Interest income | | | | | $ | 28 | | | $ | 26 | | | |
| Realized gains | | | | | 1 | | | 0 | | | |
| Realized losses | | | | | (1) | | | 0 | | | |
| Investment income | | | | | $ | 28 | | | $ | 26 | | | |
Strategic Investments
AsStrategic investments by form and measurement category as of October 31, 2017, the Company had threeApril 30, 2020 were as follows (in millions):
| | | | | | | | | | | | | | | | | | | | | | | |
| | Measurement Category |
| | Fair Value | | Measurement Alternative | | Other | | Total |
| Equity securities | $ | 32 | | | $ | 1,731 | | | $ | 93 | | | $ | 1,856 | |
| Debt securities | 0 | | | 0 | | | 46 | | | 46 | |
| Balance as of April 30, 2020 | $ | 32 | | | $ | 1,731 | | | $ | 139 | | | $ | 1,902 | |
Strategic investments in marketable equity securities with a fair value of $100.3 million, which included an unrealized gain of $62.0 million. Asby form and measurement category as of January 31, 2017,2020 were as follows (in millions):
| | | | | | | | | | | | | | | | | | | | | | | |
| | Measurement Category |
| | Fair Value | | Measurement Alternative | | Other | | Total |
| Equity securities | $ | 370 | | | $ | 1,502 | | | $ | 40 | | | $ | 1,912 | |
| Debt securities | 0 | | | 0 | | | 51 | | | 51 | |
| Balance as of January 31, 2020 | $ | 370 | | | $ | 1,502 | | | $ | 91 | | | $ | 1,963 | |
Measurement Alternative Adjustments
The components of privately held equity securities accounted for under the measurement alternative included in the table above are presented below (in millions):
| | | | | | | | | | | | | | | | | |
| | | Three Months Ended April 30, | | |
| | | | | 2020 | | 2019 | | |
| Carrying amount, beginning of period | | | | | $ | 1,502 | | | $ | 785 | | | |
| Adjustments related to privately held equity securities: | | | | | | | | | |
| Net additions (1) | | | | | 265 | | | 20 | | | |
| Upward adjustments | | | | | 30 | | | 140 | | | |
| Impairments and downward adjustments | | | | | (66) | | | (18) | | | |
| Carrying amount, end of period | | | | | $ | 1,731 | | | $ | 927 | | | |
(1) Net additions include additions from purchases and reductions due to exits of securities and reclassifications due to changes to capital structure.
In February 2020, the Company had sixmade a strategic investment of $150 million in cash for preferred shares of a technology company in a preferred stock financing. The investment was accounted for using the measurement alternative.
Since the adoption of Accounting Standards Update No. 2016-01, “Financial Instrument-Overall (Subtopic 825-10)” (“ASU 2016-01”) on February 1, 2018, cumulative impairments and downward adjustments were $168 million and cumulative upward adjustments were $484 million through April 30, 2020.
Gains (losses) on strategic investments, in marketablenet
The components of gains and losses on strategic investments are presented below (in millions):
| | | | | | | | | | | | | | | | | |
| 1 | | | Three Months Ended April 30, |
| | | | | 2020 | | 2019 | | |
| Unrealized gains recognized on publicly traded equity securities, net | | | | | $ | 0 | | | $ | 150 | | | |
| Unrealized gains (losses) recognized on privately held equity securities, net | | | | | (38) | | | 122 | | | |
| Realized gains on sales of equity securities, net | | | | | 239 | | | 19 | | | |
| Losses on debt securities, net | | | | | (9) | | | (10) | | | |
| Gains on strategic investments, net | | | | | $ | 192 | | | $ | 281 | | | |
Realized gains on sales of equity securities, with a fair value of $41.0 million, which included an unrealized gain of $24.5 million. The change innet reflects the fair value ofdifference between the investments in publicly held companies is recorded in the consolidated balance sheets within strategic investmentssale proceeds and accumulated other comprehensive income.
As of October 31, 2017 and January 31, 2017, the carrying value of the Company’s non-marketable debt andequity security at the beginning of the period or the purchase date, if later. The cumulative net gain, measured as the sale price less the initial purchase price, for equity securities exited during the three months ended April 30, 2020 was $570.1$359 million and $526.0 million, respectively. The estimated fair valuewas primarily driven by the Company's sale of the non-marketable debt and equity securities was approximately $803.92 of its publicly traded investments resulting in a realized gain of $222 million, and $758.3 million asa cumulative net gain of October 31, 2017 and January 31, 2017, respectively.$314 million.
The Company sold a portion of its publicly-held investmentsNet unrealized losses recognized in the three months ended October 31, 2017, which resulted in a reclassificationApril 30, 2020 for strategic investments still held as of previously unrealized gains fromApril 30, 2020 were $47 million, and includes approximately $77 million of impairments on its privately held equity and debt securities during the statement of comprehensive income (loss) to the statement of operations in the amount of $15.5 million. This amount was not material in prior periods.three months ended April 30, 2020.
3.4. Derivatives
Details on outstanding foreign currency derivative contracts are presented below (in thousands)millions):
|
| | | | | | | |
| | As of |
| | October 31, 2017 | | January 31, 2017 |
| Notional amount of foreign currency derivative contracts | $ | 1,275,276 |
| | $ | 1,280,953 |
|
| Fair value of foreign currency derivative contracts | $ | 853 |
| | $ | 10,205 |
|
| | | | | | | | | | | |
| | As of |
| | April 30, 2020 | | January 31, 2020 |
| Notional amount of foreign currency derivative contracts | $ | 4,697 | | | $ | 5,543 | |
| | | |
The fair value of the Company’s outstanding derivative instruments not designated as hedging instruments are summarized below (in thousands)millions):
| | | | | | | | | | | | | | |
| | | As of |
| Balance Sheet Location | April 30, 2020 | | January 31, 2020 |
| Derivative Assets | | | | |
| Foreign currency derivative contracts | Prepaid expenses and other current assets | $ | 43 | | | $ | 28 | |
| Derivative Liabilities | | | | |
| Foreign currency derivative contracts | Accounts payable, accrued expenses and other liabilities | $ | 73 | | | $ | 24 | |
|
| | | | | | | | |
| | | As of |
| Balance Sheet Location | October 31, 2017 | | January 31, 2017 |
| Derivative Assets | | | | |
| Foreign currency derivative contracts | Prepaid expenses and other current assets | $ | 4,225 |
| | $ | 13,238 |
|
| Derivative Liabilities | | | | |
| Foreign currency derivative contracts | Accounts payable, accrued expenses and other liabilities | $ | 3,372 |
| | $ | 3,033 |
|
Gains/lossesGains (losses) on derivative instruments not designated as hedging instruments recorded in Otherother income (expense) in the condensed consolidated statements of operations during the three and nine months ended October 31, 2017 and 2016, respectively, are summarized below (in thousands)millions):
| | | | | | | | | | | | | | | | | |
| | | Three Months Ended April 30, |
| | | | | | 2020 | | 2019 | | |
| Foreign currency derivative contracts | | | | | $ | (28) | | | $ | 22 | | | |
|
| | | | | | | | | | | | | | | |
| | Three Months Ended
October 31, | | Nine Months Ended
October 31, |
| | 2017 | | 2016 | | 2017 | | 2016 |
| Foreign currency derivative contracts | $ | (1,606 | ) | | $ | (39,624 | ) | | $ | 11,500 |
| | $ | (86,528 | ) |
4.5. Fair Value Measurement
The Company uses a three-tier fair value hierarchy, which prioritizes the inputs used in the valuation methodologies in measuring fair value:
Level 1. Quoted prices (unadjusted) in active markets for identical assets or liabilities.
Level 2. Significant other inputs that are directly or indirectly observable in the marketplace.
Level 3. Significant unobservable inputs which are supported by little or no market activity.
All of the Company’s cash equivalents, marketable securities and foreign currency derivative contracts are classified within Level 1 or Level 2 because the Company’s cash equivalents, marketable securities and foreign currency derivative contracts are valued using quoted market prices or alternative pricing sources and models utilizing observable market inputs.
The following table presents information about the Company’s assets and liabilities that are measured at fair value as of October 31, 2017April 30, 2020 and indicates the fair value hierarchy of the valuation (in thousands)millions):
| | | | | | | | | | | | | | | | | | | | | | | |
| Description | Quoted Prices in
Active Markets
for Identical Assets
(Level 1) | | Significant Other
Observable
Inputs
(Level 2) | | Significant
Unobservable
Inputs
(Level 3) | | Balance as of
April 30, 2020 |
| Cash equivalents (1): | | | | | | | |
| Time deposits | $ | 0 | | | $ | 927 | | | $ | 0 | | | $ | 927 | |
| Money market mutual funds | 2,485 | | | 0 | | | 0 | | | 2,485 | |
| | | | | | | |
| Marketable securities: | | | | | | | |
| Corporate notes and obligations | 0 | | | 2,293 | | | 0 | | | 2,293 | |
| U.S. treasury securities | 0 | | | 174 | | | 0 | | | 174 | |
| Mortgage backed obligations | 0 | | | 274 | | | 0 | | | 274 | |
| Asset backed securities | 0 | | | 889 | | | 0 | | | 889 | |
| Municipal securities | 0 | | | 166 | | | 0 | | | 166 | |
| Foreign government obligations | 0 | | | 93 | | | 0 | | | 93 | |
| U.S. agency obligations | 0 | | | 12 | | | 0 | | | 12 | |
| | | | | | | |
| Time deposits | 0 | | | 1 | | | 0 | | | 1 | |
| Covered bonds | 0 | | | 128 | | | 0 | | | 128 | |
| Strategic investments: | | | | | | | |
| Publicly held equity securities | 32 | | | 0 | | | 0 | | | 32 | |
| | | | | | | |
| Foreign currency derivative contracts (2) | 0 | | | 43 | | | 0 | | | 43 | |
| Total assets | $ | 2,517 | | | $ | 5,000 | | | $ | 0 | | | $ | 7,517 | |
| Liabilities: | | | | | | | |
| Foreign currency derivative contracts (3) | 0 | | | 73 | | | 0 | | | 73 | |
| Total liabilities | $ | 0 | | | $ | 73 | | | $ | 0 | | | $ | 73 | |
|
| | | | | | | | | | | | | | | |
| Description | Quoted Prices in
Active Markets
for Identical Assets
(Level 1) | | Significant Other
Observable
Inputs
(Level 2) | | Significant
Unobservable
Inputs
(Level 3) | | Balances as of October 31, 2017 |
| Cash equivalents (1): | | | | | | | |
| Time deposits | $ | 0 |
| | $ | 394,123 |
| | $ | 0 |
| | $ | 394,123 |
|
| Money market mutual funds | 805,554 |
| | 0 |
| | 0 |
| | 805,554 |
|
| Marketable securities: | | | | | | | |
| Corporate notes and obligations | 0 |
| | 939,770 |
| | 0 |
| | 939,770 |
|
| U.S. treasury securities | 0 |
| | 136,710 |
| | 0 |
| | 136,710 |
|
| Mortgage backed obligations | 0 |
| | 97,716 |
| | 0 |
| | 97,716 |
|
| Asset backed securities | 0 |
| | 202,057 |
| | 0 |
| | 202,057 |
|
| Municipal securities | 0 |
| | 56,267 |
| | 0 |
| | 56,267 |
|
| Foreign government obligations | 0 |
| | 68,323 |
| | 0 |
| | 68,323 |
|
| U.S. agency obligations | 0 |
| | 10,498 |
| | 0 |
| | 10,498 |
|
| Covered bonds | 0 |
| | 45,487 |
| | 0 |
| | 45,487 |
|
| Foreign currency derivative contracts (2) | 0 |
| | 4,225 |
| | 0 |
| | 4,225 |
|
| Total assets | $ | 805,554 |
| | $ | 1,955,176 |
| | $ | 0 |
| | $ | 2,760,730 |
|
| Liabilities: | | | | | | | |
| Foreign currency derivative contracts (3) | 0 |
| | 3,372 |
| | 0 |
| | 3,372 |
|
| Total liabilities | $ | 0 |
| | $ | 3,372 |
| | $ | 0 |
| | $ | 3,372 |
|
(1)Included in “cash and cash equivalents” in the accompanying condensed consolidated balance sheet as of October 31, 2017,April 30, 2020, in addition to $872.2 million$2.4 billion of cash.
(2)Included in “prepaid expenses and other current assets” in the accompanying condensed consolidated balance sheet as of October 31, 2017.April 30, 2020.
(3)Included in “accounts payable, accrued expenses and other liabilities” in the accompanying condensed consolidated balance sheet as of October 31, 2017.April 30, 2020.
The following table presents information about the Company’s assets and liabilities that are measured at fair value as of January 31, 20172020 and indicates the fair value hierarchy of the valuation (in thousands)millions):
| | | Description | Quoted Prices in Active Markets for Identical Assets (Level 1) | | Significant Other Observable Inputs (Level 2) | | Significant Unobservable Inputs (Level 3) | | Balances as of January 31, 2017 | Description | Quoted Prices in
Active Markets
for Identical Assets
(Level 1) | | Significant Other
Observable Inputs (Level 2) | | Significant
Unobservable
Inputs
(Level 3) | | Balance as of January 31, 2020 |
| Cash equivalents (1): | | | | | | | | Cash equivalents (1): | | | | | | | |
| Time deposits | $ | 0 |
| | $ | 25,100 |
| | $ | 0 |
| | $ | 25,100 |
| Time deposits | $ | 0 | | | $ | 746 | | | $ | 0 | | | $ | 746 | |
| Money market mutual funds | 956,479 |
| | 0 |
| | 0 |
| | 956,479 |
| Money market mutual funds | 1,293 | | | 0 | | | 0 | | | 1,293 | |
| | Marketable securities: | | | | | | | | Marketable securities: | |
| Corporate notes and obligations | 0 |
| | 320,640 |
| | 0 |
| | 320,640 |
| Corporate notes and obligations | 0 | | | 2,207 | | | 0 | | | 2,207 | |
| U.S. treasury securities | 0 |
| | 61,823 |
| | 0 |
| | 61,823 |
| U.S. treasury securities | 0 | | | 183 | | | 0 | | | 183 | |
| Mortgage backed obligations | 0 |
| | 74,252 |
| | 0 |
| | 74,252 |
| Mortgage backed obligations | 0 | | | 226 | | | 0 | | | 226 | |
| Asset backed securities | 0 |
| | 101,790 |
| | 0 |
| | 101,790 |
| Asset backed securities | 0 | | | 781 | | | 0 | | | 781 | |
| Municipal securities | 0 |
| | 33,375 |
| | 0 |
| | 33,375 |
| Municipal securities | 0 | | | 158 | | | 0 | | | 158 | |
| Foreign government obligations | 0 |
| | 10,458 |
| | 0 |
| | 10,458 |
| Foreign government obligations | 0 | | | 69 | | | 0 | | | 69 | |
| U.S. agency obligations | | U.S. agency obligations | 0 | | | 12 | | | 0 | | | 12 | |
| Time deposits | | Time deposits | 0 | | | 1 | | | 0 | | | 1 | |
| Covered bonds | | Covered bonds | 0 | | | 165 | | | 0 | | | 165 | |
| Strategic investments: | | Strategic investments: | |
| Publicly held equity securities | | Publicly held equity securities | 370 | | | 0 | | | 0 | | | 370 | |
| | Foreign currency derivative contracts (2) | 0 |
| | 13,238 |
| | 0 |
| | 13,238 |
| Foreign currency derivative contracts (2) | 0 | | | 28 | | | 0 | | | 28 | |
| Total assets | $ | 956,479 |
| | $ | 640,676 |
| | $ | 0 |
| | $ | 1,597,155 |
| Total assets | $ | 1,663 | | | $ | 4,576 | | | $ | 0 | | | $ | 6,239 | |
| Liabilities: | | | | | | | | Liabilities: | | | | | | | |
| Foreign currency derivative contracts (3) | 0 |
| | 3,033 |
| | 0 |
| | 3,033 |
| Foreign currency derivative contracts (3) | 0 | | | 24 | | | 0 | | | 24 | |
| Total liabilities | $ | 0 |
| | $ | 3,033 |
| | $ | 0 |
| | $ | 3,033 |
| Total liabilities | $ | 0 | | | $ | 24 | | | $ | 0 | | | $ | 24 | |
______________
(1)Included in “cash and cash equivalents” in the accompanying condensed consolidated balance sheet as of January 31, 2017, in addition to $625.0 million$2.1 billion of cash.
(2)Included in “prepaid expenses and other current assets” in the accompanying condensed consolidated balance sheet as of January 31, 2017.sheet.
(3)Included in “accounts payable, accrued expenses and other liabilities” in the accompanying condensed consolidated balance sheetsheet.
Strategic investments measured and recorded at fair value on a non-recurring basis
The Company's privately held debt and equity securities and equity method investments are recorded at fair value on a non-recurring basis. The estimation of fair value for these investments requires the use of significant unobservable inputs, and as a result, the Company classifies these assets as Level 3 within the fair value hierarchy. For example, the Company's privately held equity securities that have been remeasured are classified within Level 3 in the fair value hierarchy because the value is based on valuation methods using the observable transaction price and other unobservable inputs including the volatility, rights, and obligations of the securities the Company holds. The Company's privately held debt and equity securities and equity method investments amounted to $1.9 billion as of April 30, 2020 and $1.6 billion as of January 31, 2017.2020.
5. Property and Equipment
Property and Equipment
Property and equipment, net consisted of the following (in thousands):
|
| | | | | | | |
| | As of |
| | October 31, 2017 | | January 31, 2017 |
| Land | $ | 183,888 |
| | $ | 183,888 |
|
| Buildings and building improvements | 626,168 |
| | 621,377 |
|
| Computers, equipment and software | 1,600,783 |
| | 1,440,986 |
|
| Furniture and fixtures | 132,374 |
| | 112,564 |
|
| Leasehold improvements | 776,396 |
| | 627,069 |
|
| | 3,319,609 |
| | 2,985,884 |
|
| Less accumulated depreciation and amortization | (1,454,718 | ) | | (1,198,350 | ) |
| | $ | 1,864,891 |
| | $ | 1,787,534 |
|
Depreciation and amortization expense totaled $94.2 million and $83.5 million during the three months ended October 31, 2017 and 2016, respectively, and $277.2 million and $239.2 million during the nine months ended October 31, 2017 and 2016, respectively.
Computers, equipment and software at October 31, 2017 and January 31, 2017 included a total of $729.5 million and $729.0 million acquired under capital lease agreements, respectively. Accumulated amortization relating to computers, equipment and software acquired under capital leases totaled $450.5 million and $386.9 million, respectively, at October 31, 2017 and January 31, 2017. Amortization of assets acquired under capital leases is included in depreciation and amortization expense.
Building - 350 Mission
In December 2013, the Company entered into a lease agreement for approximately 445,000 rentable square feet of office space at 350 Mission Street (“350 Mission”) in San Francisco, California, which is the total office space available in the building. As a result of the Company’s involvement during the construction period, the Company is considered for accounting purposes to be the owner of 350 Mission. As a result, the Company has capitalized the construction costs as Building with a corresponding current and noncurrent financing obligation liability and has accounted for the underlying land implicitly as an operating lease. As of October 31, 2017, the Company had capitalized $178.8 million of construction costs, based on the construction costs incurred to date by the landlord, and recorded a corresponding current and noncurrent financing obligation liability of $19.9 million and $198.9 million, respectively. As of January 31, 2017, the Company had capitalized $178.8 million of construction costs, based on the construction costs incurred to date by the landlord, and recorded a corresponding current and noncurrent financing obligation liability of $19.6 million and $200.7 million, respectively. The total expected financing obligation in the form of minimum lease payments inclusive of the amounts currently recorded is $306.3 million, including interest (see Note 13 “Commitments” for future commitment details). The obligation will be settled through monthly lease payments to the landlord, which commenced in October 2015. To the extent that operating expenses for 350 Mission are material, the Company, as the deemed accounting owner, will record the operating expenses.
6. Business Combinations
Evergage
In February 2017,2020, the Company acquired Sequence,all outstanding stock of Evergage Inc. ("Evergage"), for an aggregateconsideration consisting of $26.0 million in cash and equity netawards assumed. Evergage is a cloud-based real-time personalization and customer data platform. The acquisition date fair value of the consideration transferred for Evergage was approximately $100 million, which consisted of cash acquired, and has included the financial resultsfair value of the company in its consolidated financial statements from the date of acquisition. The costs associated with this acquisition were not material.stock options and restricted stock awards assumed. The Company accountedrecorded approximately $25 million for this acquisition as a business combination. In allocating the purchase consideration based ondeveloped technology and customer relationships with estimated fair values, theuseful lives of three to five years. The Company recorded $2.7approximately $74 million of intangible assetsgoodwill which is primarily attributed to the assembled workforce and $23.0 million of goodwill.expanded market opportunities from integrating Evergage's technology with the Company's other offerings. The goodwill balance associated with this business combination is not deductible for U.S. income tax purposes. The fair values assigned to tangible assets acquired and liabilities
assumed are based on management’s estimates and assumptions and may be subject to change as additional information is received and certain tax returns are finalized. The Company expects to finalize the valuation as soon as practicable, but not later than one year from the acquisition date.
The Company has included the financial results of Evergage in the condensed consolidated financial statements from the date of acquisition, which were not material. The transaction costs associated with the acquisition were not material. 7. Intangible Assets Acquired Through Business Combinations and Goodwill
Intangible assets acquired through business combinationscombination
Intangible assets acquired through business combinations are as follows (in thousands)millions):
| | | | | | | | | | | | | | | | | | | | | | | | | | | | | | | | | | | | | | | | | | | | | | | | | | | | | |
| Intangible Assets, Gross | | Accumulated Amortization | | Intangible Assets, Net | | Weighted
Average
Remaining Useful Life (Years) |
| January 31, 2020 | | Additions and retirements, net | | April 30, 2020 | | January 31, 2020 | | Expense and retirements, net | | April 30, 2020 | | January 31, 2020 | | April 30, 2020 | |
| Acquired developed technology | $ | 3,598 | | | $ | 11 | | | $ | 3,609 | | | $ | (1,249) | | | $ | (159) | | | $ | (1,408) | | | $ | 2,349 | | | $ | 2,201 | | | 3.9 |
| Customer relationships | 3,252 | | | 17 | | | 3,269 | | | (888) | | | (106) | | | (994) | | | 2,364 | | | 2,275 | | | 6.3 |
| Other (1) | 72 | | | 7 | | | 79 | | | (61) | | | (6) | | | (67) | | | 11 | | | 12 | | | 2.2 |
| Total | $ | 6,922 | | | $ | 35 | | | $ | 6,957 | | | $ | (2,198) | | | $ | (271) | | | $ | (2,469) | | | $ | 4,724 | | | $ | 4,488 | | | 5.1 |
|
| | | | | | | | | | | | | | | | | | | | | | | | | | | | | | | | | |
| | Intangible Assets, Gross | | Accumulated Amortization | | Intangible Assets, Net | | Weighted
Average
Remaining Useful Life |
| | Jan 31, 2017 | | Additions | | Oct. 31, 2017 | | Jan 31, 2017 | | Expense | | Oct. 31, 2017 | | Jan 31, 2017 | | Oct. 31, 2017 | |
| Acquired developed technology | $ | 1,092,161 |
| | $ | 0 |
| | $ | 1,092,161 |
| | $ | (577,929 | ) | | $ | (125,886 | ) | | $ | (703,815 | ) | | $ | 514,232 |
| | $ | 388,346 |
| | 3.0 |
| Customer relationships | 843,614 |
| | 1,690 |
| | 845,304 |
| | (254,035 | ) | | (89,769 | ) | | (343,804 | ) | | 589,579 |
| | 501,500 |
| | 4.7 |
| Trade names and trademarks | 45,950 |
| | 0 |
| | 45,950 |
| | (41,349 | ) | | (1,530 | ) | | (42,879 | ) | | 4,601 |
| | 3,071 |
| | 1.6 |
| Territory rights and other | 15,786 |
| | 0 |
| | 15,786 |
| | (12,256 | ) | | (996 | ) | | (13,252 | ) | | 3,530 |
| | 2,534 |
| | 8.3 |
| 50 Fremont lease intangibles | 7,713 |
| | 0 |
| | 7,713 |
| | (6,281 | ) | | (1,115 | ) | | (7,396 | ) | | 1,432 |
| | 317 |
| | 0.3 |
| Total | $ | 2,005,224 |
| | $ | 1,690 |
| | $ | 2,006,914 |
| | $ | (891,850 | ) | | $ | (219,296 | ) | | $ | (1,111,146 | ) | | $ | 1,113,374 |
| | $ | 895,768 |
| | 3.9 |
Amortization of intangible assets and unfavorable lease liabilities, which are not reflected in the table above, resulting from business combinations for the three months ended October 31, 2017April 30, 2020 and 20162019 was $70.0$271 million and $65.3 million, respectively, and for the nine months ended October 31, 2017 and 2016 was $219.1 million and $153.0$129 million, respectively.
The expected future amortization expense for intangible assets as of October 31, 2017April 30, 2020 is as follows (in thousands)millions):
| | | | | |
| Fiscal Period: | |
| Remaining nine months of Fiscal 2021 | $ | 798 | |
| Fiscal 2022 | 995 | |
| Fiscal 2023 | 840 | |
| Fiscal 2024 | 752 | |
| Fiscal 2025 | 516 | |
| Thereafter | 587 | |
| Total amortization expense | $ | 4,488 | |
|
| | | | |
| Fiscal Period: | | |
| Remaining three months of Fiscal 2018 | | $ | 69,053 |
|
| Fiscal 2019 | | 266,233 |
|
| Fiscal 2020 | | 225,039 |
|
| Fiscal 2021 | | 169,481 |
|
| Fiscal 2022 | | 111,353 |
|
| Thereafter | | 54,609 |
|
| Total amortization expense | | $ | 895,768 |
|
Customer contract assets resulting from business combinations reflects the fair value of future billings of amounts that are contractually committed by acquired companies' existing customers as of the acquisition date. Customer contract assets are amortized over the corresponding contract terms. Customer contract assets resulting from business combinations were $73 million and $93 million as of April 30, 2020 and January 31, 2020, respectively, and are included in other assets on the condensed consolidated balance sheets.
Goodwill
Goodwill represents the excess of the purchase price in a business combination over the fair value of net assetsacquired. Goodwill amounts are not amortized, but are rather tested for impairment at least annually during the fourth quarter.
The changes in the carrying amounts of goodwill, which is generally not deductible for tax purposes, were as follows (in thousands)millions):
| | | | | |
| |
| |
| |
| Balance as of January 31, 2020 | $ | 25,134 | |
| Evergage | 74 | |
| |
| |
| |
| Other acquisitions and adjustments (1) | 58 | |
| Balance as of April 30, 2020 | $ | 25,266 | |
(1) Adjustments include measurement period adjustments for business combinations from the prior year and the effect of foreign currency translation.
|
| | | | |
| Balance as of January 31, 2017 | | $ | 7,263,846 |
|
| Sequence, Inc. acquisition | | 22,982 |
|
| Adjustments of acquisition date fair values, including the effect of foreign currency translation | | 7,313 |
|
| Balance as of October 31, 2017 | | $ | 7,294,141 |
|
8. Debt
Convertible Senior Notes
|
| | | | | | | | | | | | | | | |
| Par Value Outstanding | | Equity Component Recorded at Issuance | | Liability Component of Par Value as of |
| (in thousands) | October 31,
2017 | | January 31,
2017 |
| 0.25% Convertible Senior Notes due April 1, 2018 | $ | 1,149,979 |
| | $ | 122,421 |
| (1) | $ | 1,137,954 |
| | $ | 1,116,360 |
|
___________
(1)This amount represents the equity component recorded at the initial issuanceThe carrying values of the 0.25% convertible senior notes. AsCompany's borrowings were as follows (in millions):
| | | | | | | | | | | | | | | | | | | | | | | | | | | | | | | | |
| Instrument | | Date of issuance | | Maturity date | | Effective interest rate for the three months ended April 30, 2020 | | April 30, 2020 | | January 31, 2020 |
| | | | | | | | | | |
| 2023 Senior Notes | | April 2018 | | April 2023 | | 3.26% | | $ | 995 | | | $ | 995 | |
| 2028 Senior Notes | | April 2018 | | April 2028 | | 3.70% | | 1,490 | | | 1,489 | |
| Loan assumed on 50 Fremont | | February 2015 | | June 2023 | | 3.75% | | 192 | | | 193 | |
| | | | | | | | | | |
| Total carrying value of debt | | | | | | | | 2,677 | | | 2,677 | |
| Less current portion of debt | | | | | | | | (4) | | | (4) | |
| Total noncurrent debt | | | | | | | | $ | 2,673 | | | $ | 2,673 | |
Each of October 31, 2017, $10.8 million was reclassifiedthe Company's debt agreements requires it to temporary equity on the accompanying consolidated balance sheet as these notes are convertible for the three months ending October 31, 2017 based on the conversion criteria below.
In March 2013,maintain compliance with certain debt covenants, all of which the Company issued at par value $1.15 billion of 0.25% convertible senior notes (the “0.25% Senior Notes”, or “Notes”) due April 1, 2018, unless earlier purchased by the Company or converted and are therefore classified as current on the consolidated balance sheetwas in compliance with as of October 31, 2017 as they are due within one year. Interest is payable semi-annually, in arrears on April 1 and October 1 of each year.
The 0.25% Senior Notes are governed by an indenture between the Company, as issuer, and U.S. Bank National Association, as trustee. The 0.25% Senior Notes are unsecured and do not contain any financial covenants or any restrictions on the payment of dividends, the incurrence of senior debt or other indebtedness, or the issuance or repurchase of securities by the Company.
If converted, holders of the 0.25% Senior Notes will receive cash equal to the principal amount, and at the Company’s election, cash, shares of the Company’s common stock, or a combination of cash and shares, for any amounts in excess of the principal amounts.
Certain terms of the conversion features of the 0.25% Senior Notes are as follows:
|
| | | | | | | | |
| | Conversion Rate per $1,000 Par Value | | Initial Conversion Price per Share | | Convertible Date |
| 0.25% Senior Notes | 15.0512 |
| | $ | 66.44 |
| | January 1, 2018 |
Throughout the term of the 0.25% Senior Notes, the conversion rate may be adjusted upon the occurrence of certain events, including any cash dividends. Holders of the 0.25% Senior Notes will not receive any cash payment representing accrued and unpaid interest upon conversion of a Note. Accrued but unpaid interest will be deemed to be paid in full upon conversion rather than canceled, extinguished or forfeited.
Holders may convert the 0.25% Senior Notes under the following circumstances:
during any fiscal quarter, if, for at least 20 trading days during the 30, consecutive trading day period ending on the last trading day of the immediately preceding fiscal quarter, the last reported sales price of the Company’s common stock for such trading day is greater than or equal to 130% of the applicable conversion price on such trading day;
in certain situations, when the trading price of the 0.25% Senior Notes is less than 98% of the product of the sale price of the Company’s common stock and the conversion rate;
upon the occurrence of specified corporate transactions described under the 0.25% Senior Notes indenture, such as a consolidation, merger or binding share exchange; or
at any time on or after the convertible date noted above (as described in the indenture).
Holders of the 0.25% Senior Notes have the right to require the Company to purchase with cash all or a portion of the Notes upon the occurrence of a fundamental change, such as a change of control, at a purchase price equal to 100% of the principal amount of the 0.25% Senior Notes plus accrued and unpaid interest. Following certain corporate transactions that constitute a change of control, the Company will increase the conversion rate for a holder who elects to convert the 0.25% Senior Notes in connection with such change of control.
In accounting for the issuances of the 0.25% Senior Notes, the Company separated the 0.25% Senior Notes into liability and equity components. The carrying amount of the liability component was calculated by measuring the fair value of a similar liability that does not have an associated convertible feature. The carrying amount of the equity component representing the conversion option was determined by deducting the fair value of the liability component from the par value of the 0.25% Senior Notes as a whole. The excess of the principal amount of the liability component over its carrying amount (“debt discount”) is amortized to interest expense over the term of the 0.25% Senior Notes. The equity component is not remeasured as long as it continues to meet the conditions for equity classification.
In any period when holders of the 0.25% Senior Notes are eligible to exercise their conversion option, the equity component related to convertible debt instruments is required to be reclassified from permanent equity to temporary equity. Therefore, if in any future period the holders of the 0.25% Senior Notes are able to exercise their conversion rights, then the difference between (1) the amount of cash deliverable upon conversion (i.e., par value of debt) and (2) the carrying value of the debt component will be reclassified from permanent equity to temporary equity, and will continue to be reported as temporary equity for any period in which the debt remains currently convertible.
In accounting for the transaction costs related to the 0.25% Senior Notes issuance, the Company allocated the total amount incurred to the liability and equity components based on their relative values. Transaction costs attributable to the liability component are being amortized to expense over the terms of the 0.25% Senior Notes, and transaction costs attributable to the equity component were netted with the equity component in stockholders’ equity.
The 0.25% Senior Notes consisted of the following (in thousands):
|
| | | | | | | |
| | As of |
| | October 31,
2017 | | January 31,
2017 |
| Liability component: | | | |
| Principal (1) | $ | 1,149,979 |
| | $ | 1,150,000 |
|
| Less: debt discount, net (2) | (10,797 | ) | | (29,954 | ) |
| Less: debt issuance cost | (1,228 | ) | | (3,686 | ) |
| Net carrying amount | $ | 1,137,954 |
| | $ | 1,116,360 |
|
(1)The effective interest rate of the 0.25% Senior Notes is 2.53%. The interest rate is based on the interest rates of similar liabilities at the time of issuance that did not have an associated convertible feature.
(2)Included in the consolidated balance sheets within Convertible 0.25% Senior Notes (which is classified as a current liability as of October 31, 2017 and a noncurrent liability as of January 31, 2017) and is amortized over the life of the 0.25% Senior Notes using the effective interest rate method.2020.
The total estimated fair value of the Company's 0.25%2023 and 2028 Senior Notes at Octoberas of April 30, 2020 and January 31, 20172020 was $1.8 billion.$2.8 billion and $2.7 billion, respectively. The fair value was determined based on the closing trading price per $100 of the 0.25%2023 and 2028 Senior Notes as of the last day of trading for the thirdfirst quarter of fiscal 2018.
Based on2021 and last day of trading for the closing pricefourth quarter of the Company’s common stock of $102.34 on October 31, 2017, the if-converted value of the 0.25% Senior Notes exceeded their principal amount by approximately $621.4 million.
During the three months ended October 31, 2017, an immaterial portion of the 0.25% Senior Notes outstanding was converted by noteholders. The Company recorded an immaterial loss during the three months ended October 31, 2017 related to the extinguishment of the 0.25% Senior Notes converted by noteholders, which represents the difference betweenfiscal 2020, respectively, and is deemed a Level 2 liability within the fair market value allocated to the liability component on settlement date and the net carrying amount of the liability component and unamortized debt issuance costs on settlement date. As of October 31, 2017 the remaining principal balance of the 0.25% Senior Notes outstanding is approximately $1.15 billion. The remaining principal balance of the 0.25% Senior Notes matures on April 1, 2018 unless earlier converted by noteholders.
As of the filing date of this Form 10-Q, the Company has received additional conversion notices for $26.7 million of the principal balance of the 0.25% Senior Notes.
Note Hedges
To minimize the impact of potential economic dilution upon conversion of the Notes, the Company entered into convertible note hedge transactions with respect to its common stock (“0.25% Note Hedges”).
|
| | | | | | | | |
| (in thousands, except for shares) | Date | | Purchase | | Shares |
| 0.25% Note Hedges | March 2013 | | $ | 153,800 |
| | 17,308,880 |
|
The 0.25% Note Hedges cover sharesexpected future principal payments for all borrowings as of the Company’s common stock at a strike price that corresponds to the initial conversion price of the 0.25% Senior Notes, also subject to adjustment, and are exercisable upon conversion of the Notes. The 0.25% Note Hedges will expire upon the maturity of the 0.25% Senior Notes. The 0.25% Note Hedges are intended to reduce the potential economic dilution upon conversion of the 0.25% Senior Notes in the event that the market value per share of the Company’s common stock,April 30, 2020 is as measured under the 0.25% Senior Notes, at the time of exercise is greater than the conversion price of the 0.25% Senior Notes. The 0.25% Note Hedges are separate transactions and are not part of the terms of the 0.25% Senior Notes. Holders of the 0.25% Senior Notes will not have any rights with respect to the 0.25% Note Hedges. The 0.25% Note Hedges do not impact earnings per share.follows (in millions):
Warrants | | | | | |
| Fiscal period: | |
| Remaining nine months of Fiscal 2021 | $ | 3 | |
| Fiscal 2022 | 4 | |
| Fiscal 2023 | 4 | |
| Fiscal 2024 | 1,182 | |
| Fiscal 2025 | 0 | |
| Thereafter | 1,500 | |
| Total principal outstanding | $ | 2,693 | |
|
| | | | | | | | | | | | |
| | Date | | Proceeds (in thousands) | | Shares | | Strike Price |
| 0.25% Warrants | March 2013 | | $ | 84,800 |
| | 17,308,880 |
| | $ | 90.40 |
|
In March 2013, the Company also entered into a warrants transaction (“0.25% Warrants”), whereby the Company sold warrants to acquire, subject to anti-dilution adjustments, shares of the Company’s common stock. If the 0.25% Warrants are not exercised on their exercise dates, which are in fiscal 2019, they will expire. If the market value per share of the Company's common stock exceeds the applicable exercise price of the 0.25% Warrants, the 0.25% Warrants will have a dilutive effect on the Company's earnings per share if the Company has achieved profitability at that time. The 0.25% Warrants are separate transactions entered into by the Company and are not part of the terms of the 0.25% Senior Notes or the 0.25% Note Hedges. Holders of the 0.25% Senior Notes and 0.25% Note Hedges will not have any rights with respect to the 0.25% Warrants.
Term Loan
In July 2016,April 2018, the Company entered into a credit agreement (“Term Loan Credit Agreement”) with Bank of America, N.A. and certain other institutional lenders for a $500.0 million term loan facility (“Term Loan”) that matures on July 11, 2019. The Term Loan will bear interest, at the Company’s option, at either a base rate plus a spread of 0.00% to 0.75% or an adjusted LIBOR rate plus a spread of 1.00% to 1.75%, in each case with such spread being determined based on the Company’s consolidated leverage ratio for the preceding four fiscal quarter period.
In July 2016, the Company borrowed the full $500.0 million under the Term Loan. All of the net proceeds of the Term Loan were for the purpose of partially funding the acquisition of Demandware.
Interest on the Term Loan is due and payable in arrears quarterly for loans bearing interest at a rate based on the base rate and at the end of an interest period in the case of loans bearing interest at the adjusted LIBOR rate.
All outstanding amounts under the Term Loan Credit Agreement will be due and payable on July 11, 2019. The Company may prepay the Term Loan, in whole or in part, at any time without premium or penalty, subject to certain conditions, and amounts repaid or prepaid may not be reborrowed. The Company’s obligations under the Term Loan Credit Agreement are required to be guaranteed by certain of its subsidiaries meeting certain thresholds set forth in the Term Loan Credit Agreement.
The Term Loan Credit Agreement contains customary affirmative and negative covenants, including covenants that limit or restrict the Company and its subsidiaries’ ability to, among other things, incur indebtedness, grant liens, merge or consolidate, dispose of assets, make investments, make acquisitions, enter into transactions with affiliates, pay dividends or make distributions and repurchase stock. The Company is also required to maintain compliance with a consolidated leverage ratio and a consolidated interest coverage ratio. The Term Loan Credit Agreement includes customary events of default. Under certain circumstances, a default interest rate will apply on all obligations during the existence of an event of default under the Term Loan Credit Agreement at a per annum rate equal to 2.00% above the applicable interest rate for any overdue principal and 2.00% above the rate applicable for base rate loans for any other overdue amounts. The occurrence of an event of default could result in the acceleration of obligations under the Term Loan Credit Agreement. The Company was in compliance with the Term Loan Credit Agreement’s covenants as of October 31, 2017.
The weighted average interest rate on the Term Loan was 2.2% for the three months ended October 31, 2017. Accrued interest on the Term Loan was $0.3 million as of October 31, 2017. As of October 31, 2017, the noncurrent outstanding principal portion was $500.0 million.
Revolving Credit Facility
In July 2016, the Company entered into anSecond Amended and Restated Credit Agreement (“("Revolving Loan Credit Agreement”Agreement") with Wells Fargo Bank, National Association, and certain other institutional lenders that provides for $1.0 billion unsecured revolving credit facility (“Credit Facility”) that matures in July 2021.April 2023. The Revolving Loan Credit Agreement amended and restated the Company’s existing revolving credit facility dated October 2014.July 2016. The Company may use the proceeds of future borrowings under the Credit Facility for refinancing other indebtedness, working capital, capital expenditures and other general corporate purposes, including permitted acquisitions.
The borrowings under the Credit Facility bear interest, at the Company’s option, at a base rate plus a spread of 0.00% to 0.75% or an adjusted LIBOR rate plus a spread of 1.00% to 1.75%, in each case with such spread being determined based on the Company’s consolidated leverage ratio for the preceding four fiscal quarter period. Interest is due and payable in arrears quarterly for loans bearing interest at a rate based on the base rate and at the end of an interest period in the case of loans bearing interest at the adjusted LIBOR rate. Regardless of what amounts, if any, are outstanding under the Credit Facility, the Company is also obligated to pay an ongoing commitment fee on undrawn amounts at a rate of 0.125% to 0.25%, with such rate being based on the Company’s consolidated leverage ratio for the preceding four fiscal quarter period, payable in arrears quarterly.
The Revolving Loan Credit Agreement contains customary affirmative and negative covenants, including covenants that limit or restrict the Company and its subsidiaries’ ability to, among other things, incur indebtedness, grant liens, merge or consolidate, dispose of assets, make investments, make acquisitions, enter into transactions with affiliates, pay dividends or make distributions and repurchase stock. The Company is also required to maintain compliance with a consolidated leverage ratio and a consolidated interest coverage ratio. The Revolving Loan Credit Agreement includes customary events of default. Under certain circumstances, a default interest rate will apply on all obligations during the existence of an event of default under the Revolving Loan Credit Agreement at a per annum rate equal to 2.00% above the applicable interest rate for any overdue principal and 2.00% above the rate applicable for base rate loans for any other overdue amounts. The occurrence of an event of default could result in the acceleration of obligations under the Revolving Loan Credit Agreement. The Company was in compliance with the Revolving Loan Credit Agreement’s covenants as of October 31, 2017.
In February 2017, the Company paid down the remaining $200.0 million of outstanding borrowings under the Credit Facility. There were no outstanding borrowings under the Credit Facility as of October 31, 2017.April 30, 2020. The Company continues to pay a commitment fee on the available amount of the Credit Facility.
Loan Assumed on 50 Fremont
The Company assumed a $200.0 million loan withFacility, which is included within other expense in the acquisitionCompany's condensed consolidated statement of 50 Fremont (“Loan”). The Loan bears an interest rate of 3.75% per annum and is due in June 2023. For the remainder of fiscal 2018, the Loan requires interest only payments. Beginning in fiscal 2019, principal and interest payments are required, with the remaining principal due at maturity. For the three months ended October 31, 2017 and 2016, total interest expense recognized was $1.8 million and $1.8 million, respectively. For the nine months ended October 31, 2017 and 2016, total interest expense recognized was $5.6 million and $5.6 million, respectively. The Loan can be prepaid at any time subject to a yield maintenance fee. The agreement governing the Loan contains certain customary affirmative and negative covenants that the Company was in compliance with as of October 31, 2017.operations.
Interest Expense on Convertible Senior Notes, Term Loan, Credit Facility and Loan Assumed on 50 FremontDebt
The following table sets forth total interest expense recognized related to the 0.25% Senior Notes, the Term Loan, the Credit Facility and the Loandebt (in thousands)millions):
| | | | | | | | | | | | | | | | | |
| | | | Three Months Ended April 30, |
| | | | | | 2020 | | 2019 | | |
| Contractual interest expense | | | | | $ | 24 | | | $ | 28 | | | |
| Amortization of debt issuance costs | | | | | 1 | | | 1 | | | |
| | | | | $ | 25 | | | $ | 29 | | | |
|
| | | | | | | | | | | | | | | |
| | Three Months Ended October 31, | | Nine Months Ended October 31, |
| | 2017 | | 2016 | | 2017 | | 2016 |
| Contractual interest expense | $ | 5,766 |
| | $ | 5,207 |
| | $ | 17,044 |
| | $ | 11,398 |
|
| Amortization of debt issuance costs | 1,332 |
| | 1,342 |
| | 3,996 |
| | 4,071 |
|
| Amortization of debt discount | 6,463 |
| | 6,304 |
| | 19,269 |
| | 18,794 |
|
| | $ | 13,561 |
| | $ | 12,853 |
| | $ | 40,309 |
| | $ | 34,263 |
|
9. Other Balance Sheet Accounts
Prepaid Expenses and Other Current Assets
Prepaid expenses and other current assets consisted ofIn March 2020, the following (in thousands): |
| | | | | | | |
| | As of |
| | October 31,
2017 | | January 31,
2017 |
| Prepaid income taxes | $ | 43,301 |
| | $ | 26,932 |
|
| Other taxes receivable | 33,099 |
| | 34,177 |
|
| Prepaid expenses and other current assets | 393,546 |
| | 218,418 |
|
| | $ | 469,946 |
| | $ | 279,527 |
|
Capitalized Software, net
Capitalized software, netCompany purchased the property located at October 31, 2017 and January 31, 2017 was $140.8 million and $141.7 million, respectively. Accumulated amortization relating to capitalized software, net totaled $306.6 million and $250.9 million, respectively, at October 31, 2017 and January 31, 2017.
Capitalized internal-use software amortization expense totaled $18.7 million and $16.6 million450 Mission St. (“450 Mission”) in San Francisco, California for the three months ended October 31, 2017 and 2016, respectively and $55.7 million and $47.5 million for the nine months ended October 31, 2017 and 2016, respectively.
The Company capitalized $2.0 million and $1.7approximately $150 million, of stock-based expenses relatedwhich $110 million was allocated to capitalized internal-use software development duringland, $34 million to building, which is included in property and equipment, net and $6 million to in-place leases, which is included in intangible assets in the three months ended October 31, 2017 and 2016, respectively, and $5.9 million and $5.1 million for the nine months ended October 31, 2017 and 2016, respectively.
Other Assets, net
Other assets consisted of the following (in thousands): |
| | | | | | | |
| | As of |
| | October 31,
2017 | | January 31,
2017 |
| Deferred income taxes, noncurrent, net | $ | 31,596 |
| | $ | 28,939 |
|
| Long-term deposits | 23,979 |
| | 23,597 |
|
| Domain names and patents, net | 26,811 |
| | 39,213 |
|
| Customer contract assets (1) | 201,357 |
| | 281,733 |
|
| Other | 141,145 |
| | 113,387 |
|
| | $ | 424,888 |
| | $ | 486,869 |
|
(1) Customer contract asset reflects the fair value of future billings of amounts that are contractually committed by acquired companies' existing customers as of the acquisition date.
Domain names and patents amortization expense was $4.3 million and $4.1 million for the three months ended October 31, 2017 and 2016, respectively, and $13.0 million and $11.9 million for the nine months ended October 31, 2017 and 2016, respectively.
Accounts Payable, Accrued Expenses and Other Liabilitiesaccompanying condensed consolidated balance sheet.
Accounts payable, accrued expenses and other liabilities consistedas of the following (in thousands):April 30, 2020 included approximately $0.9 billion of accrued compensation as compared to $1.5 billion as of January 31, 2020.
|
| | | | | | | |
| | As of |
| | October 31,
2017 | | January 31,
2017 |
| Accounts payable | $ | 120,019 |
| | $ | 115,257 |
|
| Accrued compensation | 622,419 |
| | 730,390 |
|
| Non-cash equity liability (1) | 49,435 |
| | 68,355 |
|
| Accrued other liabilities | 488,071 |
| | 419,299 |
|
| Accrued income and other taxes payable | 193,693 |
| | 239,699 |
|
| Accrued professional costs | 44,757 |
| | 38,254 |
|
| Accrued rent | 33,968 |
| | 19,710 |
|
| Capital lease obligation, current | 114,147 |
| | 102,106 |
|
| Financing obligation - leased facility, current | 19,899 |
| | 19,594 |
|
| | $ | 1,686,408 |
| | $ | 1,752,664 |
|
(1) Non-cash equity liability represents the purchase price of shares issued to non-executive employees, for those shares exceeding previously registered ESPP shares at the time of sale to the extent the shares had not been subsequently sold by the employee purchaser. The Company expects this liability will be relieved in the fourth quarter of fiscal 2018.
Other Noncurrent Liabilities
Other noncurrent liabilities consisted of the following (in thousands): |
| | | | | | | |
| | As of |
| | October 31,
2017 | | January 31,
2017 |
| Deferred income taxes and income taxes payable | $ | 117,193 |
| | $ | 99,378 |
|
| Financing obligation - leased facility | 198,903 |
| | 200,711 |
|
| Long-term lease liabilities and other | 420,774 |
| | 480,850 |
|
| | $ | 736,870 |
| | $ | 780,939 |
|
10. Stockholders’ Equity
The Company maintains the following stock plans: the ESPP, the 2013 Equity Incentive Plan and the 2014 Inducement Equity Incentive Plan (“2014 Inducement Plan”). The expirationfair value of the 1999 Stock Option Plan (“1999 Plan”) in fiscal 2010 did not affect awards outstanding, which continue to be governed by the terms and conditions of the 1999 Plan.
As of October 31, 2017, $119.2 million has been withheld on behalf of employees for future purchases under the ESPP and is recorded in accounts payable, accrued expenses and other liabilities.
Prior to February 2006, options issued under the Company’s stock option plans generally had a term of 10 years. From February 1, 2006 through July 2013, options issued had a term of five years. After July 2013, options issued have a term of seven years.
The fair value of each stock option grantand ESPP shares was estimated on the date of grant and the first day of the ESPP purchase period, respectively, using the Black-Scholes option pricing model with the following assumptions andmodel. The weighted-average fair value per share:
|
| | | | | | | | | | | | | | | | | | | |
| | Three Months Ended
October 31, | | Nine Months Ended
October 31, |
| Stock Options | 2017 | | 2016 | | 2017 | | 2016 |
| Volatility | 30.8 |
| % | | 32.3 |
| % | | 30.8 - 31.4 |
| % | | 32.1 - 32.3 |
| % |
| Estimated life | 3.5 years |
| | | 3.5 years |
| | | 3.5 years |
| | | 3.5 years |
| |
| Risk-free interest rate | 1.6 - 1.8 |
| % | | 0.9 - 1.1 |
| % | | 1.4 - 1.8 |
| % | | 0.9 - 1.1 |
| % |
| Weighted-average fair value per share of grants | $ | 24.12 |
| | | $ | 18.75 |
| | | $ | 22.26 |
| | | $ | 18.75 |
| |
The Company estimated its future stock price volatility considering both its observed option-implied volatilities and its historical volatility calculations. Management believes this is the best estimate of the expected volatility over the expected life of itsshare for stock options grants, excluding assumed awards, was $39.67 and stock purchase rights.
The estimated life for$40.82 in the stock options was based on an analysis of historical exercise activity. The risk-free interest rate is based on the rate for a U.S. government security with the same estimated life at the time of the option grantthree months ended April 30, 2020 and the stock purchase rights.2019, respectively.
ESPP assumptions and the related fair value per share table will only beare disclosed in the three month period in which there is ESPP activity, such as an ESPP purchase. The Company's ESPP allows for two purchases during the fiscal year, one during the second quarter and one during the fourth quarter. The estimated life of the ESPP will be based on the two purchase periods within each offering period. The weighted-average fair value per share of grantsfor ESPP shares was $21.13 and $21.93$41.76 in the three months ended April 30, 2020.
Stock option activity, excluding the ESPP for the three months ended July 31, 2017 and 2016, respectively.
The estimated forfeiture rate applied is based on historical forfeiture rates. The Company does not anticipate paying any cash dividends in the foreseeable future and therefore uses an expected dividend yield of zero in the option pricing model.
During fiscal 2016, the Company granted a performance-based restricted stock unit award to the Chairman of the Board and Chief Executive Officer and during fiscal 2017, the Company granted performance-based restricted stock unit awards to certain executive officers, including the Chairman of the Board and Chief Executive Officer. The performance-based restricted stock unit awards are subject to vesting based on a performance-based condition and a service-based condition. At the end of the three-year service period, based on the Company's share price performance, these performance-based restricted stock units will vest in a percentage of the target number of shares between 0 and 200%, depending on the extent the performance condition is achieved.
Stock activity excluding the ESPPApril 30, 2020 is as follows:
|
| | | | | | | | | | | | | |
| | | | Options Outstanding |
| | Shares Available for Grant | | Outstanding Stock Options | | Weighted- Average Exercise Price | | Aggregate Intrinsic Value (in thousands) |
| Balance as of January 31, 2017 | 16,531,822 |
| | 30,353,076 |
| | $ | 59.88 |
| | |
| Increase in shares authorized: | | | | | | | |
| 2013 Equity Incentive Plan | 37,009,109 |
| | 0 |
| | 0.00 |
| | |
| 2014 Inducement Plan | 16,198 |
| | 0 |
| | 0.00 |
| | |
| Options granted under all plans | (1,020,046 | ) | | 1,020,046 |
| | 89.01 |
| | |
| Restricted stock activity | (2,696,029 | ) | | 0 |
| | 0.00 |
| | |
| Stock grants to board and advisory board members | (163,596 | ) | | 0 |
| | 0.00 |
| | |
| Exercised | 0 |
| | (6,705,729 | ) | | 43.57 |
| | |
| Plan shares expired | (44,309 | ) | | 0 |
| | 0.00 |
| | |
| Canceled | 1,314,229 |
| | (1,314,229 | ) | | 71.92 |
| | |
| Balance as of October 31, 2017 | 50,947,378 |
| | 23,353,164 |
| | $ | 65.16 |
| | $ | 868,266 |
|
| Vested or expected to vest | | | 21,891,255 |
| | $ | 64.58 |
| | $ | 826,607 |
|
| Exercisable as of October 31, 2017 | | | 10,090,058 |
| | $ | 57.62 |
| | $ | 451,210 |
|
| | | | | | | | | | | | | | | | | | | |
| | | | Options Outstanding |
| | | | Outstanding
Stock
Options
(in millions) | | Weighted-
Average
Exercise Price | | Aggregate
Intrinsic Value (in millions) |
| Balance as of January 31, 2020 | | | 27 | | | $ | 98.56 | | | |
| | | | | | | |
| | | | | | | |
| | | | | | | |
| | | | | | | |
| Options granted under all plans | | | 6 | | | 154.23 | | | |
| | | | | | | |
| | | | | | | |
| | | | | | | |
| Exercised | | | (2) | | | 62.67 | | | |
| | | | | | | |
| | | | | | | |
| Balance as of April 30, 2020 | | | 31 | | | $ | 111.82 | | | $ | 1,542 | |
| Vested or expected to vest | | | 28 | | | $ | 108.78 | | | $ | 1,509 | |
| Exercisable as of April 30, 2020 | | | 14 | | | $ | 77.73 | | | $ | 1,201 | |
The total intrinsic valuefollowing table summarizes information about stock options outstanding as of April 30, 2020:
| | | | | | | | | | | | | | | | | | | | | | | | | | | | | | | | |
| | | Options Outstanding | | Options Exercisable |
Range of Exercise
Prices | | Number
Outstanding
(in millions) | | Weighted-
Average
Remaining
Contractual Life
(Years) | | Weighted-
Average
Exercise
Price | | Number of
Shares
(in millions) | | Weighted-
Average
Exercise
Price |
| $0.36 to $59.34 | | 7 | | | 2.9 | | $ | 40.47 | | | 6 | | | $ | 41.91 | |
| $59.37 to $80.99 | | 5 | | | 3.4 | | 77.03 | | | 4 | | | 77.85 | |
| $81.02 to $118.04 | | 5 | | | 4.8 | | 114.30 | | | 2 | | | 113.29 | |
| $122.03 to $148.95 | | 2 | | | 6.0 | | 142.32 | | | 0 | | | 0.00 | |
| $154.14 | | 6 | | | 7.0 | | 154.14 | | | 0 | | | 0.00 | |
| $155.20 to $189.50 | | 6 | | | 5.8 | | 161.90 | | | 2 | | | 161.50 | |
| | | | | | | | | | |
| | 31 | | | 4.9 | | $ | 111.82 | | | 14 | | | $ | 77.73 | |
Restricted stock activity for the options exercised during the ninethree months ended October 31, 2017 and 2016 was $298.7 million and $176.2 million, respectively. The intrinsic valueApril 30, 2020 is the difference between the current market value of the stock and the exercise price of the stock option.as follows:
The weighted-average remaining contractual life of vested and expected to vest options is approximately 5 years. | | | | | | | | | | | | | | | | | |
| | Restricted Stock Outstanding |
| | Outstanding
(in millions) | | Weighted-Average Grant Date Fair Value | | Aggregate
Intrinsic
Value (in millions) |
| Balance as of January 31, 2020 | 28 | | | $ | 140.14 | | | |
| Granted - restricted stock units and awards | 9 | | | 155.92 | | | |
| Granted - performance-based stock units | 1 | | | 154.14 | | | |
| Canceled | (1) | | | 138.87 | | | |
| Vested and converted to shares | (4) | | | 135.70 | | | |
| Balance as of April 30, 2020 | 33 | | | $ | 142.71 | | | $ | 5,428 | |
| Expected to vest | 29 | | | | | $ | 4,654 | |
As of October 31, 2017, options to purchase 10,090,058 shares were vested at a weighted average exercise price of $57.62 per share and had a remaining weighted-average contractual life of approximately 4 years. The total intrinsic value of these vested options as of October 31, 2017 was $451.2 million.
During the ninethree months ended October 31, 2017,April 30, 2020, the Company recognized stock-based expense related to its equity plans for employees and non-employee directors of $759.3$504 million. As of October 31, 2017, theThe aggregate stock compensation remaining to be amortized to costs and expenses was approximately $2.0 billion. The Company will amortize this stock compensation balance as follows: $234.5 million during the remaining three months of fiscal 2018; $777.8 million during fiscal 2019; $574.4 million during fiscal 2020; $303.6 million during fiscal 2021; $42.9 million during fiscal 2022 and $25.2 million
thereafter. The expected amortization reflects only outstanding stock awardsrecognized as of October 31, 2017 and assumes no forfeiture activity.April 30, 2020 is as follows (in millions):
| | | | | |
| Fiscal Period: | |
| Remaining nine months of fiscal 2021 | $ | 1,638 | |
| Fiscal 2022 | 1,684 | |
| Fiscal 2023 | 1,219 | |
| Fiscal 2024 | 630 | |
| Fiscal 2025 | 94 | |
| Thereafter | 3 | |
| Total stock compensation | $ | 5,268 | |
The aggregate stock compensation remaining to be amortizedrecognized to costs and expenses will be recognized over a weighted averageweighted-average period of 1.9approximately 2 years.
The following table summarizes information about stock options outstanding as of October 31, 2017:
|
| | | | | | | | | | | | | | | | |
| | | Options Outstanding | | Options Exercisable |
Range of Exercise Prices | | Number Outstanding | | Weighted- Average Remaining Contractual Life (Years) | | Weighted- Average Exercise Price | | Number of Shares | | Weighted- Average Exercise Price |
| $0.86 to $52.30 | | 4,540,787 |
| | 4.4 | | $ | 35.63 |
| | 3,693,473 |
| | $ | 41.41 |
|
| $53.60 to $58.86 | | 724,916 |
| | 3.8 | | 55.57 |
| | 478,771 |
| | 55.61 |
|
| $59.34 | | 4,826,489 |
| | 4.1 | | 59.34 |
| | 3,309,418 |
| | 59.34 |
|
| $59.37 to $75.01 | | 1,553,021 |
| | 5.2 | | 69.76 |
| | 500,029 |
| | 70.21 |
|
| $75.57 | | 5,576,546 |
| | 6.0 | | 75.57 |
| | 0 |
| | 0.00 |
|
| $76.48 to $80.62 | | 577,049 |
| | 5.6 | | 78.54 |
| | 175,146 |
| | 78.59 |
|
| $80.99 to $98.90 | | 5,554,356 |
| | 5.3 | | 82.48 |
| | 1,933,221 |
| | 80.99 |
|
| | | 23,353,164 |
| | 5.0 | | $ | 65.16 |
| | 10,090,058 |
| | $ | 57.62 |
|
Restricted stock activity is as follows:
|
| | | | | | | | | | |
| | Restricted Stock Outstanding |
| | Outstanding | | Weighted- Average Exercise Price | | Aggregate Intrinsic Value (in thousands) |
| Balance as of January 31, 2017 | 27,453,498 |
| | $ | 0.001 |
| | |
| Granted - restricted stock units and awards | 2,844,391 |
| | 0.001 |
| | |
| Canceled | (1,606,148 | ) | | 0.001 |
| | |
| Vested and converted to shares | (6,105,427 | ) | | 0.001 |
| | |
| Balance as of October 31, 2017 | 22,586,314 |
| | $ | 0.001 |
| | $ | 2,311,483 |
|
| Expected to vest | 19,722,393 |
| | | | $ | 2,018,390 |
|
The restricted stock, which upon vesting entitles the holder to one share of common stock for each share of restricted stock, has an exercise price of $0.001 per share, which is equal to the par value of the Company’s common stock, and generally vests over four years.
The weighted-average grant date fair value of the restricted stock issued for the nine months ended October 31, 2017 and 2016 was $89.04 and $76.90, respectively.
Common Stock
The following number of shares of common stock wereShares reserved and available for future issuance at Octoberas of April 30, 2020 and January 31, 2017:2020 were 115 million shares and 133 million shares, respectively.
|
| | |
Options outstanding | 23,353,164 |
|
Restricted stock awards and units and performance stock units outstanding | 22,586,314 |
|
Stock available for future grant: | |
2013 Equity Incentive Plan | 50,316,168 |
|
2014 Inducement Plan | 520,478 |
|
Amended and Restated 2004 Employee Stock Purchase Plan | 9,629,807 |
|
Acquired equity plans | 110,732 |
|
Convertible Senior Notes | 17,308,564 |
|
Warrants | 17,308,880 |
|
| 141,134,107 |
|
11. Income Taxes
Effective Tax Rate
The Company computes its year-to-date provision for income taxes by applying the estimated annual effective tax rate to year to dateyear-to-date pretax income or loss and adjusts the provision for discrete tax items recorded in the period. For the ninethree months ended October 31, 2017, the Company reported a tax provision of $54.0 million on a pretax income of $113.9 million, which resulted in an effective tax rate of 47 percent. The Company recorded year-to-date tax provision primarily from profitable jurisdictions outside of the United States.
The Company regularly assesses the realizability of the deferred tax assets and establishes a valuation allowance if it is more-likely-than-not that some or all of the Company's deferred tax assets will not be realized. The Company evaluates and weighs all available positive and negative evidence such as historic results, future reversals of existing deferred tax liabilities, projected future taxable income, as well as prudent and feasible tax-planning strategies. Generally, more weight is given to objectively verifiable evidence. The Company will continue to assess the realizability of the deferred tax assets in each of the applicable jurisdictions going forward. The Company will adjust its valuation allowance in the event sufficient positive evidence overcomes the negative evidence of losses in recent years, for example, if the trend in increasing annual taxable income continues.
For the nine months ended October 31, 2016,April 30, 2020, the Company reported a tax benefit of $182.2$52 million on a pretax income of $48.9$47 million, which resulted in a negative effective tax rate of 373111 percent. The most significant componentCompany’s effective tax rate differs from the U.S. statutory rate of this tax amount was the21 percent primarily due to favorable discrete tax benefititems including excess tax benefits from stock-based compensation.
For the three months ended April 30, 2019, the Company reported a tax provision of $205.6$90 million fromon a partial releasepretax income of the valuation allowance$482 million, which resulted in connection with the acquisitionan effective tax rate of Demandware.19 percent. The net deferredCompany's effective tax liabilityrate differs from the acquisitionU.S. statutory rate of Demandware provided a source of additional income21 percent primarily due to support the realizability of the Company's pre-existing deferredexcess tax assets and as a result, the Company released a portion of its valuation allowance. The tax benefit associated with the release of the valuation allowance was partiallybenefits from stock-based compensation, offset by income taxes in profitable jurisdictions outside of the United States.
Tax Benefits RelatedStates subject to Stock-Based Compensation
The income tax benefit related to stock-based compensation was $206.8 million and $161.4 million for the nine months ended October 31, 2017 and 2016, respectively, the majority of which was not recognized as a result of the valuation allowance.rates greater than 21 percent.
Unrecognized Tax Benefits and Other Considerations
The Company records liabilities related to its uncertain tax positions. Tax positions for the Company and its subsidiaries are subject to income tax audits by multiple tax jurisdictions throughout the world. Certain prior year tax returns are currently being examined by various taxing authorities in countries including the United States France, United Kingdom and Germany. In March 2017, the Company received the final notice of proposed adjustments primarily related to transfer pricing issues from the Internal Revenue Service ("IRS") for fiscal 2011 and fiscal 2012. Accordingly, the Company re-assessed and adjusted its reserves, which resulted in a net immaterial impact to the tax provision due to its valuation allowance. The Company is currently appealing the IRS proposed adjustments.France. The Company believes that it has provided adequate reserves for its income tax uncertainties in all open tax years. As the outcome of the tax audits cannot be predicted with certainty, if any issues addressedarising in the Company's tax audits are resolvedprogress in a manner inconsistent with management's expectations, the Company could adjust its provision for income taxes in the future. Generally, any adjustments resulting from the U.S. audits should not have a significant impact to the Company's tax provision due to its valuation allowance. In addition, the Company anticipates it is reasonably possible that a decrease of its unrecognized tax benefits up to approximately $6.8$17 million may occur in the next 12 months, as the applicable statutes of limitations lapse.lapse, ongoing examinations are completed, or tax positions meet the conditions of being effectively settled.
12. EarningsNet Income Per Share
Basic earnings per share is computed by dividing net income by the weighted-average number of common shares outstanding for the fiscal period. Diluted earnings per share is computed by giving effect to all potential weighted average dilutive common stock, including options and restricted stock units, warrants and the convertible senior notes.units. The dilutive effect of outstanding awards and convertible securities is reflected in diluted earnings per share by application of the treasury stock method.
A reconciliation of the denominator used in the calculation of basic and diluted earnings per share is as follows (in thousands)millions):
| | | | | | | | | | | | | | | | | |
| 1 | | | Three Months Ended April 30, |
| | | | | | 2020 | | 2019 | | |
| Numerator: | | | | | | | | | |
| Net income | | | | | $ | 99 | | | $ | 392 | | | |
| Denominator: | | | | | | | | | |
| Weighted-average shares outstanding for basic earnings per share | | | | | 896 | | | 771 | | | |
| | | | | | | | | |
| | | | | | | | | |
| Dilutive effect of employee stock awards | | | | | 17 | | | 22 | | | |
| | | | | | | | | |
| Adjusted weighted-average shares outstanding and assumed conversions for diluted earnings per share | | | | | 913 | | | 793 | | | |
|
| | | | | | | | | | | | | | | |
| | Three Months Ended October 31, | | Nine Months Ended October 31, |
| | 2017 | | 2016 | | 2017 | | 2016 |
| Numerator: | | | | | | | |
| Net income (loss) | $ | 51,394 |
| | $ | (37,309 | ) | | $ | 59,923 |
| | $ | 231,072 |
|
| Denominator: | | | | | | | |
| Weighted-average shares outstanding for basic earnings (loss) per share | 717,445 |
| | 690,468 |
| | 711,884 |
| | 683,075 |
|
| Effect of dilutive securities: | | | | | | | |
| Convertible senior notes | 5,162 |
| | 0 |
| | 4,571 |
| | 1,994 |
|
| Employee stock awards | 14,717 |
| | 0 |
| | 13,235 |
| | 11,188 |
|
| Warrants | 782 |
| | 0 |
| | 522 |
| | 0 |
|
| Adjusted weighted-average shares outstanding and assumed conversions for diluted earnings (loss) per share | 738,106 |
| | 690,468 |
| | 730,212 |
| | 696,257 |
|
The weighted-average number of shares outstanding used in the computation of diluted earnings per share does not include the effect of the following potential outstanding common stock. The effects of these potentially outstanding shares were not included in the calculation of diluted earnings per share because the effect would have been anti-dilutive (in thousands)millions):
| | | | | | | | | | | | | | | | | |
| | | | Three Months Ended April 30, |
| | | | | | 2020 | | 2019 | | |
| Employee stock awards | | | | | 10 | | | 3 | | | |
| | | | | | | | | |
| | | | | | | | | |
|
| | | | | | | | | | | |
| | Three Months Ended October 31, | | Nine Months Ended October 31, |
| | 2017 | | 2016 | | 2017 | | 2016 |
| Employee stock awards | 1,355 |
| | 17,946 |
| | 9,239 |
| | 8,640 |
|
| Convertible senior notes | 0 |
| | 17,309 |
| | 0 |
| | 0 |
|
| Warrants | 0 |
| | 17,309 |
| | 0 |
| | 17,309 |
|
13. Leases and Other Commitments
Leases
The Company has operating leases for corporate offices, data centers, and equipment under non-cancelable operating leases with various expiration dates. The leases have remaining terms of one year to 22 years, some of which include options to extend for up to five years, and some of which include options to terminate within one year.
Total operating lease costs were $279 million and $206 million for the three months ended April 30, 2020 and 2019, respectively.
For the three months ended April 30, 2020, cash payments for operating leases were $226 million. New ROU assets obtained in exchange for operating lease liabilities were $189 million during the three months ended April 30, 2020.
As of April 30, 2020, for operating leases, the weighted-average remaining lease term is seven years, and the weighted-average discount rate is 2.7 percent. As of April 30, 2020, for finance leases, the weighted-average remaining lease term is 18 years, and the weighted-average discount rate is 4.5 percent.
As of April 30, 2020, the maturities of lease liabilities under non-cancelable operating and finance leases were as follows (in millions):
| | | | | | | | | | | |
| Operating Leases | | Finance Leases |
| Fiscal Period: | | | |
| Remaining nine months of Fiscal 2021 | $ | 618 | | | $ | 49 | |
| Fiscal 2022 | 665 | | | 23 | |
| Fiscal 2023 | 490 | | | 23 | |
| Fiscal 2024 | 371 | | | 24 | |
| Fiscal 2025 | 301 | | | 24 | |
| Thereafter | 1,054 | | | 410 | |
| Total minimum lease payments | 3,499 | | | 553 | |
| Less: Imputed interest | (335) | | | (182) | |
| Total | $ | 3,164 | | | $ | 371 | |
Operating lease amounts above do not include sublease income. The Company has entered into various sublease agreements with third parties. Under these agreements, the Company expects to receive sublease income of approximately $187 million in the next five years and $49 million thereafter.
The Company’s lease terms may include options to extend or terminate the lease. These options are reflected in the Company's future contractual obligations when it is reasonably certain that the Company will exercise that option. The Company did not use hindsight when determining lease term therefore, as of April 30, 2020, renewal options are only included for the Company's finance lease for 350 Mission.
As of April 30, 2020, the Company has additional operating leases that have not yet commenced totaling $2.4 billion and therefore not reflected on the condensed consolidated balance sheet and tables above. These operating leases include agreements for office facilities to be constructed. These operating leases will commence between fiscal year 2021 and fiscal year 2025 with lease terms of one to 18 years.
Of the total operating lease commitment balance, including leases not yet commenced, of $5.9 billion, approximately $5.4 billion is related to facilities space. The remaining commitment amount is primarily related to equipment.
Letters of Credit
As of October 31, 2017,April 30, 2020, the Company had a total of $96.6$94 million in letters of credit outstanding substantially in favor of certain landlords for office space. These letters of credit renew annually and expire at various dates through December 2030.2033.
Leases
The Company leases facilities space and certain fixed assets under non-cancelable operating and capital leases with various expiration dates.
As of October 31, 2017, the future minimum lease payments under non-cancelable operating and capital leases are as follows (in thousands):
|
| | | | | | | | | | | |
| | Capital
Leases | | Operating
Leases | | Financing Obligation -Leased Facility (1) |
| Fiscal Period: | | | | | |
| Remaining three months of Fiscal 2018 | $ | 22,974 |
| | $ | 152,711 |
| | $ | 5,433 |
|
| Fiscal 2019 | 115,830 |
| | 575,237 |
| | 21,881 |
|
| Fiscal 2020 | 201,616 |
| | 503,390 |
| | 22,325 |
|
| Fiscal 2021 | 73 |
| | 368,148 |
| | 22,770 |
|
| Fiscal 2022 | 37 |
| | 282,804 |
| | 23,214 |
|
| Thereafter | 3 |
| | 1,408,213 |
| | 210,713 |
|
| Total minimum lease payments | 340,533 |
| | $ | 3,290,503 |
| | $ | 306,336 |
|
| Less: amount representing interest | (23,384 | ) | |
| |
|
| Present value of capital lease obligations | $ | 317,149 |
| |
| |
|
______________
(1) Total Financing Obligation - Leased Facility noted above represents the total obligation on the lease agreement including amounts allocated to interest and the implied lease for the land as noted in Note 5 “Property and Equipment.” As of October 31, 2017, $218.8 million of the total $306.3 million above was recorded to Financing obligation leased facility, of which the current portion is included in "Accounts payable, accrued expenses and other liabilities" and the noncurrent portion is included in “Other noncurrent liabilities” on the consolidated balance sheets.
The Company’s agreements for the facilities and certain services provide the Company with the option to renew. The Company’s future contractual obligations would change if the Company exercised these options.
The terms of the lease agreements provide for rental payments on a graduated basis. The Company recognizes rent expense on a straight-line basis over the lease period and has accrued for rent expense incurred but not paid. Of the total operating lease commitment balance of $3.3 billion, approximately $2.7 billion is related to facilities space. The remaining commitment amount is related to computer equipment and furniture and fixtures.
Other Purchase Commitments
In April 2016, the Company entered into an agreement with a third-party provider for certain infrastructure services for a period of four years. The Company paid $96.0 million in connection with this agreement during the nine months ended October 31, 2017. The agreement further provides that the Company will pay an additional $108.0 million in fiscal 2019 and $126.0 million in fiscal 2020.
14. Legal Proceedings and Claims
In the ordinary course of business, the Company is or may be involved in various legal or regulatory proceedings, and claims or purported class actions related to alleged infringement of third-party patents and other intellectual property rights, commercial, corporate and securities, labor and employment, class actions, wage and hour and other claims. The Company has been, and may in the future be put on notice and/or sued by third-partiesthird parties for alleged infringement of their proprietary rights, including patent infringement.
In general, the resolution of a legal matter could prevent the Company from offering its service to others, could be material to the Company’s financial condition or cash flows, or both, or could otherwise adversely affect the Company’s operating results.
The Company makes a provision for a liability relating to legal matters when it is both probable that a liability has been incurred and the amount of the loss can be reasonably estimated. These provisions are reviewed at least quarterly and adjusted to reflect the impacts of negotiations, estimated settlements, legal rulings, advice of legal counsel and other information and events pertaining to a particular matter. The outcomes of legal proceedings and other contingencies are, however, inherently unpredictable and subject to significant uncertainties. As a result,At this time, the Company is not able to reasonably estimate the amount or range of possible losses in excess of any amounts accrued, including losses that could arise as a result of application of non-monetary remedies, with respect to the contingencies it faces, and the Company’s estimates may not prove to be accurate.
In management’s opinion, resolution of all current matters is not expected to have a material adverse impact on the Company’s condensed consolidated results of operations, cash flows or financial position. However, depending on the nature and timing of any such dispute or other contingency, an unfavorable resolution of a matter could materially affect the Company’s current or future results of operations or cash flows, or both, in a particular quarter.
Tableau Litigation
In September 2013, oneJuly and August 2017, 2 substantially similar securities class action complaints were filed against Tableau and 2 of its now former executive officers. The first complaint was filed in the U.S. District for the Southern District of New York (the “Scheufele Action”). The second complaint was filed in the U.S. District Court for the Western District of Washington and was voluntarily dismissed on October 17, 2017. In December 2017, the lead plaintiff in the Scheufele Action filed an amended complaint, which alleged that between February 5, 2015 and February 4, 2016, Tableau and certain of its executive officers violated Sections 10(b) and 20(a) of the Company’s subsidiaries, ExactTarget, Inc. (“ExactTarget”Securities Exchange Act of 1934 (the "Exchange Act") and Rule 10b-5 promulgated thereunder, in connection with statements regarding Tableau’s business and operations by allegedly failing to disclose, among other things, that product launches and software upgrades by competitors were negatively impacting Tableau’s competitive position and profitability. The amended complaint sought unspecified damages, interest, attorneys’ fees and other costs. In February 2018, the lead plaintiff filed a second amended complaint (the "SAC"), waswhich contains substantially similar allegations as the amended complaint, and added as defendants 2 more of Tableau’s now former executive officers and directors. Defendants filed a motion to dismiss the SAC in March 2018, which was denied in February 2019. Defendants filed an answer to the SAC in March 2019, and subsequently amended their answer in April 2019. On January 15, 2020, the court granted lead plaintiff’s motion for class certification. The parties have completed fact discovery and are engaged in expert discovery. The court has not yet set a trial date.
In August 2018, Tableau was named as a nominal defendant in a purported class-action lawsuit that alleged that ExactTarget and one of its customers, Simply Fashion Stores, Ltd. (“Simply Fashion”), violated the Telephone Consumer Protection Act (“TCPA”) as a result of Simply Fashion’s text messaging campaigns and alleged failure to opt-out certain Simply Fashion customers from receiving messages. The complaint was subsequently amended to remove Simply Fashion as a defendant and the lawsuit is currently beforeshareholder derivative action in the United States District Court for the Southern District of Indiana.Delaware, allegedly on behalf of and for the benefit of Tableau, against certain of its now former directors and officers. The derivative action arises out of many of the factual allegations at issue in the Scheufele Action, and generally alleges that the individual defendants breached fiduciary duties owed to Tableau. The complaint seeks statutoryunspecified damages and injunctive relief. While disputingequitable relief, attorneys' fees, costs and expenses. The case is currently stayed. In April 2020, the allegationssame purported stockholder who filed the 2018 derivative action, who had previously been a shareholder of Tableau and acquired shares of Salesforce as a result of the acquisition of Tableau by Salesforce in August 2019, filed a “double derivative” action in the United States District Court for the District of Delaware, allegedly on behalf of and for the benefit of Salesforce and Tableau, against certain of Tableau’s now former directors and officers. The double derivative complaint adds Salesforce as an additional nominal defendant, but otherwise names the same individual defendants, generally alleges the same purported wrongdoing, and seeks the same relief as the 2018 derivative action. The Company has reached a settlement of the lawsuit for approximately $6.3 million. The parties have submitted the settlement agreementnot yet responded to the Court for approval.complaint.
15. Related-Party Transactions
In January 1999, the Salesforce.comSalesforce Foundation also referred to as the Foundation,(the “Foundation”) was chartered on an idea of leveraging the Company’s people, technology and resources to help improve communities around the world. The Company calls this integrated philanthropic approach the 1-1-1 model. Beginning in 2008, Salesforce.org, which is a non-profit public benefit corporation, was established to resell the Company's services to nonprofit organizations and certain higher education organizations.
The Company’s ChairmanChair is the chairmanchair of both the Foundation and Salesforce.org. The Company’s Chairman holds one1 of the three3 Foundation board seats. The Company’s Chairman, one of the Company’s employees and one of the Company’s board members hold three of Salesforce.org’s nine board seats. The Company does not control the Foundation’s or Salesforce.org's activities, and accordingly, the Company does not consolidate either of the related entities'Foundation’s statement of activities with its financial results.
Since the Foundation’s and Salesforce.org’s inception, the Company has provided at no charge certain resources to those entities' employees such as office space, furniture, equipment, facilities, services, and other resources.the Foundation including general administrative support. The value of these itemsresources to the Foundation has not been material.
As a result of the business combination with Salesforce.org in fiscal 2020, which was a related party, the Company agreed to use its best efforts to make charitable cash commitments of up to $5 million quarterly to the Foundation for ten years beginning in the third quarter of fiscal 2020.
16. Subsequent Events
In June 2020, the Company acquired all outstanding stock of Vlocity, Inc. (“Vlocity”), a leading provider of industry-specific cloud and mobile software. The total estimated consideration for Vlocity was approximately $7.4 million for$1.2 billion, net of the nine months ended October 31, 2017.
Additionally,value of shares held by the Company, allows Salesforce.org to donate subscriptionsand consisted of cash and the Company’s services to other qualified non-profit organizations. The Company also allows Salesforce.org to resell the Company’s service to non-profit organizations and certain education entities. The Company does not charge Salesforce.org for these subscriptions, therefore income from subscriptions sold to non-profit organizations is donated back to the community through charitable grants madeassumption of outstanding equity awards held by the Foundation and Salesforce.org. The value of the subscriptions sold by Salesforce.org pursuant to the reseller agreement, as amended, was approximately $129.7 million for the nine months ended October 31, 2017.Vlocity employees.
ITEM 2. MANAGEMENT’S DISCUSSION AND ANALYSIS OF FINANCIAL CONDITION AND RESULTS OF OPERATIONS
This Quarterly Report on Form 10-Q contains forward-looking statements within the meaning of Section 27A of the Securities Act of 1933, as amended (“Securities Act”), and Section 21E of the Securities Exchange Act of 1934, as amended (“Exchange Act”). Words such as “expects,” “anticipates,” “aims,” “projects,” “intends,” “plans,” “believes,” “estimates,” “seeks,” “assumes,” “may,” “should,” “could,” “would,” “foresees,” “forecasts,” “predicts,” “targets,” variations of such words and similar expressions are intended to identify such forward-looking statements, which may consist of, among other things, trend analyses and statements regarding future events, future financial performance, anticipated growth, industry prospects and industry prospects. the anticipated impact on our business of the ongoing COVID-19 pandemic and related public health measures.
These forward-looking statements are based on current expectations, estimates and forecasts, as well as the beliefs and assumptions of our management, and are subject to risks and uncertainties that are difficult to predict, including the effect of general economic and market conditions;including: the impact of foreign currency exchange ratethe COVID-19 pandemic, related public health measures and interest rate fluctuations onresulting economic downturn and market volatility; our results; our business strategy and our planability to build our business, including our strategy to be the leading provider of enterprise cloud computing applications and platforms; the pace of change and innovation in enterprise cloud computing services; the competitive nature of the market in which we participate; our international expansion strategy; ourmaintain service performance and security;security levels meeting the expectations of our customers, and the resources and costs required to avoid unanticipated downtime and prevent, detect and remediate performance degradation and security breaches; the expenses associated with newour data centers and third-party infrastructure providers; our ability to secure and costs related to additional data center capacity; real estate and office facilities space; our operating results and cash flows; new services and product features; our strategy of acquiring or making investments in complementary businesses, joint ventures, services, technologies and intellectual property rights; our ability to successfully integrate acquired businesses and technologies; our ability to continue to grow and maintain deferred revenue and unbilled deferred revenue; our ability to protect our intellectual property rights; our ability to develop our brands; our ability to realize the benefits from strategic partnerships and investments; our reliance on third-party hardware, software and platform providers; our dependency on the development and maintenance of the infrastructure of the Internet; the effect of evolving domestic and foreign government regulations, including those related to the provision of services on the Internet, those related to accessing the Internet, and those addressing data privacy, cross-border data transfers and import and export controls; current and potential litigation involving us or our industry, including litigation involving acquired entities such as Tableau, and the resolution or settlement thereof; regulatory developments and regulatory investigations involving us or affecting our industry; our ability to successfully introduce new services and product features, including any efforts to expand our services beyond the CRM market; the success of our strategy of acquiring or making investments in complementary businesses, joint ventures, services, technologies and intellectual property rights; our ability to realize the benefits from strategic partnerships, joint ventures and investments; our ability to successfully integrate acquired businesses and technologies; our ability to compete in the market in which we participate; the success of our business strategy and our plan to build our business, including our strategy to be the leading provider of enterprise cloud computing applications and platforms; our ability to execute our business plans; our ability to continue to grow unearned revenue and remaining performance obligation; the pace of change and innovation in enterprise cloud computing services; the seasonal nature of our sales cycles; our ability to limit customer attrition and costs related to those efforts; the success of our international expansion strategy; the demands on our personnel and infrastructure resulting from significant growth in our customer base and operations, including as a result of acquisitions; our dependency on the development and maintenance of the infrastructure of the Internet; our real estate and office facilities strategy and related costs and uncertainties; fluctuations in, and our ability to predict, our operating results and cash flows; the variability in our results arising from the accounting for term license revenue products; the performance and fair value of our investments in complementary businesses through our strategic investment portfolio; the impact of future gains or losses from our strategic investment portfolio including gains or losses from overall market conditions that may affect the publicly traded companies within our strategic investment portfolio; our ability to protect our intellectual property rights; our ability to develop our brands; the impact of foreign currency exchange rate and interest rate fluctuations on our results; the valuation of our deferred tax assets;assets and the release of related valuation allowances; the potential availability of additional tax assets in the future; the impact of new accounting pronouncements and tax lawslaws; uncertainties affecting our ability to estimate our tax rate; uncertainties regarding our tax obligations in connection with potential jurisdictional transfers of intellectual property, including the tax rate, the timing of the transfer and interpretations thereof;the value of such transferred intellectual property; uncertainties regarding the effect of general economic and market conditions; the impact of geopolitical events; uncertainties regarding the impact of expensing stock options and other equity awards; the sufficiency of our capital resources; factorsrisks related to our outstanding convertible2023 and 2028 senior notes, revolving credit facility term loan and loan associated with 50 Fremont; complianceour ability to comply with our debt covenants and capital lease obligations; and currentthe impact of climate change, natural disasters and potential litigation involving us.actual or threatened public health emergencies, including the ongoing COVID-19 pandemic. These and other risks and uncertainties may cause our actual results to differ materially and adversely from those expressed in any forward-looking statements. Readers are directed to risks and uncertainties identified below under “Risk Factors” and elsewhere in this report for additional detail regarding factors that may cause actual results to be different than those expressed in our forward-looking statements. Except as required by law, we undertake no obligation to revise or update publicly any forward-looking statements for any reason.
Overview
We are a leading provider of enterprise cloud computing solutions, with a focus onglobal leader in customer relationship management or CRM. We introduced our first CRM solution("CRM") technology that brings companies and customers together. Founded in 2000,1999, we enable companies of every size and we have since expanded our service offerings with new editions, features and platform capabilities. Our core mission is to empower our customersindustry to connect with their customers in entirely new ways through existing and emerging technologies, including cloud, mobile, social, Internet of Things (“IoT”)blockchain, voice and artificial intelligence technologies.(“AI”),
Our Customer Success Platform -to transform their businesses.
Website references throughout this document are provided for convenience only, and the content on the referenced websites is not incorporated by reference into this report.
COVID-19 Impact
In December 2019, the novel coronavirus and resulting disease (“COVID-19”) was first reported. After ongoing assessment of the rapid spread, number of cases and countries affected, on March 11, 2020, the World Health Organization characterized COVID-19 as a pandemic. The COVID-19 pandemic has created significant global economic uncertainty, adversely impacted the business of our customers and partners, impacted our business and results of operations and could further impact our results of operations and our cash flows in the future.
In response to the COVID-19 pandemic, we have been guided by our core values of trust, customer success, innovation and equality. In the first fiscal quarter of 2021, we took actions in response to the pandemic that focused on maintaining
business continuity, helping our employees, helping our customers and communities, and preparing for the future and the long-term success of our business.
Below is a summary of our response to and known impacts from the COVID-19 pandemic on our operational and financial performance as of and for the three months ended April 30, 2020:
•The sudden operational and economic impacts resulting from the COVID-19 pandemic affected some of our customers’ financial willingness or ability to pay. We supported certain customers who were experiencing distress as a result of COVID-19 by providing them with some temporary financial flexibility, such as payment delays. This resulted in a negative impact to our operating cash flows during the quarter. While significant uncertainty remains as to the ongoing economic and possible follow-on effects of the pandemic, including the impact on our customers’ ability or willingness to pay, we expect to collect the majority of amounts deferred as of April 30, 2020 during the remainder of this fiscal year.
•For approximately the first half of the quarter ended April 30, 2020, our incremental new business, which we define as orders for incremental applications or subscriptions from new or existing customers, continued with the momentum from the end of fiscal 2020 and was consistent with historical trends and seasonality for the same period a year ago. However, since the second half of March, as COVID-19 emerged as a global biological and economic crisis, we experienced a decline in new business as compared to the same period a year ago. We believe this was because customers were delaying or reducing their purchasing decisions due to the financial impact and future uncertainty of the global economic situation. In addition, the average contract duration for incremental new business, as well as renewals signed, in the first fiscal quarter of 2021 was approximately three months shorter compared to historical averages.
•The impact to revenue recognized ratably over time during the three months ended April 30, 2020 was not material. Software licenses revenues recognized at a point in time, which represent approximately five percent of total subscription and support revenues (primarily from our MuleSoft and Tableau products), were negatively impacted, in part due to lower new business and shorter contract duration, as discussed above, which we believe is due to our customers’ uncertainty due to COVID-19.
•We offered our direct sales force automation,a one-time partial minimum commission guarantee that would pay the greater of actual commissions earned or a fixed amount of their variable compensation that would have been otherwise paid if incremental new business were not impacted. As these payments were not a cost to obtain a revenue contract, the amounts were immediately expensed and reflected in our results of operations. The total value of the commitment was approximately $140 million.
•Due to social distancing and the cessation of travel, we cancelled our in person customer service and industry events, including Dreamforce, World Tours, Connections, Basecamps and Salesforce.org’s Higher Ed Summit, as well as employee events, and plan to provide virtual-only experiences for the remainder of 2020. As a result we were required to terminate or modify related contracts resulting in the acceleration of expenses of approximately $65 million. If our events were not modified or cancelled, these expenses would have been recognized in the quarters for which the events were originally scheduled. In addition, we have incurred incremental marketing expenses to support our virtual marketing automation, digital commerce, community management, analytics, application development, IoT integration, collaborative productivity toolsefforts in the absence of physical events.
•We directed our global workforce to work from home and cancelled all business travel by our professional cloud services - provides the tools customers need to succeedemployees, resulting in a digital world. Key elementsnet benefit to operating expenses of approximately $75 million. In addition, we continue to evaluate our strategy include:office space needs and as a result, we have decided to permanently exit certain spaces. As a result, we have recorded approximately $25 million in estimated operating lease right of use assets impairment.
extend existing service offerings;•We recorded over $20 million in operating expenses for donations and relief to members of the Salesforce ecosystem due to the ongoing COVID-19 pandemic.
cross sell•We recorded approximately $77 million in impairment charges related to our strategic investment portfolio, which were primarily due to the impact of COVID-19 on the portfolio investment companies.
In addition, authorities throughout the world have implemented numerous preventative measures to contain or mitigate the outbreak of the virus, such as travel bans and upsell;
expand into new horizontal markets;
target vertical markets;
extend go-to-market capabilities;
reduce customer attrition;restrictions, limitations on business activity, quarantines, work-from-home directives and
encourage shelter-in-place orders. These measures have caused, are continuing to cause, and may in the developmentfuture cause business slowdowns or shutdowns in affected areas, both regionally and worldwide. These business slowdowns and shutdowns have impacted and may in the future impact our business and results of third-party applications on our cloud computing platforms.
Salesforce is also committed to a sustainable, low-carbon future, advancing equalityoperations. For example, the extent and diversity, and fostering employee success. We try to integrate social good into everything we do. Allduration of these goals align with our long-term growth strategy and financial and operational priorities.
We believe the factors that will influencemeasures could impact our ability to achieve our objectives include: our prospective customers’ willingness to migrate to enterprise cloud computing services;address cybersecurity incidents; have resulted in increased internet demand, which could cause access issues; could affect our ability to maintain a balanced portfolio ofdevelop and support products and services; and could cause issues with access to data centers.
As a result of the first quarter financial impacts of COVID-19 and our current assumptions related to the extent to which the pandemic will affect our business going forward, we expect our business in fiscal 2021 to continue to grow at rates lower than planned prior to the COVID-19 pandemic. Specifically, as a result of COVID-19, we expect slower growth in our new incremental business, total revenues, remaining performance obligation (“RPO”) and operating cash flows. We do not yet know the impact this will have on our long-term revenue growth.
The ultimate extent of the impact of the COVID-19 pandemic on our operational and financial performance will depend on certain developments, including the duration of the outbreak, the severity of the disease, responsive actions taken by public health officials, the impacts on our customers the availability, performance and security of our service;sales cycles, our ability to generate new business leads, the impacts on our customer, employee and industry events, and the effects on our vendors, all of which are uncertain and currently cannot be predicted. As a result, the extent to which the COVID-19 pandemic will continue to release, and gain customer acceptanceimpact our financial condition or results of new and improved features;operations is uncertain. Due to our ability to successfully integrate acquired businesses and technologies; successful customer adoption and utilizationsubscription based business model, the effect of our service; acceptance of our service in markets where we have few customers; the emergence of additional competitorsCOVID-19 pandemic may not be fully reflected in our marketresults of operations until future periods. If the COVID-19 pandemic has a substantial impact on our employees’, partners’ or customers’ productivity, our results of operations and improved product offerings by existingoverall financial performance may be harmed. In addition, the global macroeconomic effects of the COVID-19 pandemic and new competitors;related impacts on our customers’ business operations and their demand for our products and services may persist for an indefinite period, even after the locationCOVID-19 pandemic has subsided.
See the section entitled “Risk Factors” for further discussion of new data centers that we operatethe impact and possible future impacts of the COVID-19 pandemic on our business.
Highlights from the First Quarter of Fiscal Year 2021.
•Revenue: Total first quarter revenue was $4.9 billion, an increase of 30 percent year-over-year.
•Earnings per Share: First quarter diluted earnings per share was $0.11, which benefited in part from gains on our strategic investment portfolio, as well ascompared to diluted earnings per share of $0.49 from a year ago.
•Cash: Total cash, cash equivalents and marketable securities ended the new locationsfirst quarter at $9.8 billion, an increase of services54 percent year-over-year. Cash provided by third-party cloud computing platform providers; third-party developers’ willingnessoperations for the first quarter was $1.9 billion, a decrease of five percent year-over-year.
•Remaining Performance Obligation: Remaining performance obligation ended the first quarter at approximately $29.3 billion, an increase of 18 percent year-over-year. Our remaining performance obligation includes approximately $450 million and $700 million related to develop applications on our platforms; our ability to attract new personnelthe Salesforce.org business combination in June 2019 and retain and motivate current personnel; and general economic conditions which could affect our customers’ ability and willingness to purchase our services, delay the customers’ purchasing decision or affect attrition rates.Tableau acquisition in August 2019, respectively. Current remaining performance obligation ended the first quarter at approximately $14.5 billion, an increase of 23 percent year-over-year.
To address these factors, we will need to, among other things,We continue to add substantial numbers of paying subscriptions, upgrade our customers to fully featured versions or arrangements such as an Enterprise License Agreement, provide high quality technical support to our customers, encourage the development of third-party applications on our platforms, realize the benefits from our strategic partnerships and continue to focus on retaining customers at the time of renewal. Our plans to invest for future growth includethrough focusing on multi-cloud adoption by our existing customers, growing our relationships with our enterprise customers, expanding internationally and expanding and strengthening our ecosystem of partners and independent software vendors (“ISVs”). In addition, even as we help respond to the continuationurgent needs of the expansion ofCOVID-19 crisis, we are innovating and delivering new solutions to help our data center capacity, the hiring of additional personnel, particularly in direct sales, other customer-related areas and research and development, the expansion of domestic and international selling and marketing activities, specifically in our top markets, continuing to develop our brands, the addition of distribution channels, the upgrade of our service offerings, the continued development of services including Analytics Cloud, Community Cloud, and IoT Cloud, the integration of new and acquired technologiescustomers succeed such as Commerce Cloud, artificial intelligence technologiesSalesforce Care and Salesforce Quip, the expansionwork.com, a suite of applications built on our Marketing Cloud and Salesforce Platform core service offerings, and the additionsplatform designed to help our global infrastructure to support our growth.customers re-open safely.
We also regularly evaluate acquisitions orand investment opportunities in complementary businesses, joint ventures, services and technologies and intellectual property rights in an effort to expand our service offerings through a disciplined and thoughtful acquisition process and to nurture the overall ecosystem for our offerings. We expect to continue to make such investments and acquisitions in the future and we plan to reinvest a significant portion of our incremental revenue in future periods to grow our business and continue our leadership role in the cloud computing industry. As part of our business and growth strategy, we are delivering innovative solutions in new categories, including analytics e-commerce, artificial intelligence, IoT and collaborative productivity tools.integration. We drive innovation organically and to a lesser extent through acquisitions, such as our July 2016 acquisition of Demandware, Inc. (“Demandware”), a digital commerce leader. We have a disciplined and thoughtful acquisition process where we routinely survey the industry landscape across a wide range of companies. acquisitions.
As a result of our aggressive growth plans and integration of our previously acquired businesses, we have incurred significant expenses fromfor equity awards and amortization of purchased intangibles, which have reduced our operating income. We remain focused on improving operating margins in fiscal 2018 and beyond.
Our typical subscription contract term is 12 to 36 months, although terms range from one to 60 months, so during any fiscal reporting period only a subset of active subscription contracts is eligible for renewal. We calculate our attrition rate as of the end of each month. Our current attrition rate, which does not include the Marketing and Commerce Cloud service offerings, was between eight and nine percent as of October 31, 2017. Our attrition rate, including the Marketing Cloud service offering, was approximately ten percent as of October 31, 2017. While it is difficult to predict, we expect our attrition rate to remain consistent as we continue to expand our enterprise business and invest in customer success and related programs.
We expect marketingperiodically make changes to our sales organization to position us for long-term growth, which has in the past and sales costs, which were 45 percent and 46 percent for the nine months ended October 31, 2017 and 2016, respectively, to continue to represent a substantial portion of total revenuescould again in the future result in temporary disruptions to our sales productivity. In addition, we have experienced, and may at times in the future experience, more variation from our forecasted expectations of new business activity due to longer and less predictable sales cycles and increasing complexity of our business, which includes an expanded mix of products and various revenue models resulting from acquisitions and increased enterprise solution selling activities. While we do not expect any of these changes to have a material adverse effect on our business, we experienced slower growth in new business in the quarter than we originally planned, primarily due to the impacts of COVID-19. Slower growth in new business in a given period could negatively affect our revenues in future periods, as we seekwell as remaining performance obligation in current or future periods, particularly if experienced on a sustained basis.
The expanding global scope of our business and the heightened volatility of global markets, including as a result of COVID-19, expose us to growthe risk of fluctuations in foreign currency markets. Fluctuations in foreign currency exchange rates had a modest adverse impact on our customer base, sell more productsrevenue results for the three months ended April 30, 2020 and had a minimal impact on our remaining performance obligation as of April 30, 2020. We expect these fluctuations to existing customers, and continue to build greater brand awareness.in the future.
Fiscal Year
Our fiscal year ends on January 31. References to fiscal 2018,2021, for example, refer to the fiscal year ending January 31, 2018.
2021.
Operating Segments
We operate as one operating segment. Operating segments are defined as componentsSee Note 1 “Summary of an enterprise for which separate financial information is evaluated regularly byBusiness and Significant Accounting Policies” to the chief operating decision maker, who in our case is the chief executive officer, in deciding how to allocate resources and assess performance. Over the past few years, including fiscal 2017, we have completed a number of acquisitions. These acquisitions have allowed us to expand our offerings, presence and reach in various market segments of the enterprise cloud computing market. While we have offerings in multiple enterprise cloud computing market segments, including as a result of our acquisitions, our business operates in one operating segment because the majority of our offerings operate on a single platform and are deployed in an identical way, andour chief operating decision maker evaluates our financial information and resources and assesses the performance of these resources on a consolidated basis. Since we operate as one operating segment, all required financial segment information can be found in thecondensed consolidated financial statements.statements for our discussion about segments.
Sources of Revenues
We derive our revenues from two sources: (1) subscription and support revenues whichand related professional services. Subscription and support revenues accounted for approximately 94 percent of our total revenues for the three months ended April 30, 2020.
Subscription and support revenues are primarily comprised of subscription fees from customers accessing our enterprise cloud computing services (collectively, "Cloud Services"). With the May 2018 acquisition of MuleSoft and from customers paying for additional support beyond the standard support that is included in the basicAugust 2019 acquisition of Tableau, subscription fees; and (2) related professional services such as process mapping, project management, implementation services and other revenue. “Other revenue” consists primarily of training fees. Subscription and support revenues accounted for approximately 92 percentalso include revenues associated with software licenses. Software license revenues include fees from the sales of our totalterm and perpetual licenses. Revenues from software licenses are generally recognized upfront when the software is made available to the customer and revenues forfrom the nine months ended October 31, 2017. Subscription revenuesrelated support are driven primarily by the number of paying subscribers, varying service types, the price of our service and renewals. We define a “customer” as a separate and distinct buying entity (e.g., a company, a distinct business unit of a large corporation, a partnership, etc.) that has entered into a contract to access our enterprise cloud computing services. We define a “subscription” as a unique user account purchased by a customer for use by its employees or other customer-authorized users, and we refer to each such user as a “subscriber.” The number of paying subscriptions at each of our customers ranges from one to hundreds of thousands. None of our customers accounted for more than five percent of our revenues during the nine months ended October 31, 2017 and 2016.
Subscription and support revenues aregenerally recognized ratably over the contract terms beginning on the commencement dates of each contract. The typical subscriptionterm. Changes in average contract duration can impact revenues recognized upfront. For example, software licenses revenues recognized upfront (primarily from our MuleSoft and support term is 12 to 36 months, although terms range from one to 60 months. Our subscription and support contracts are non-cancelable, though customers typically have the right to terminate their contracts for cause if we materially fail to perform. We generally invoice our customers in advance, in annual installments, and typical payment terms provide that our customers pay us within 30 days of invoice. Amounts that have been invoiced are recorded in accounts receivable and in deferred revenue, or in revenue depending on whether the revenue recognition criteria have been met. In general, we collect our billings in advance of the subscription service period.
Professional services and other revenues consist of fees associated with consulting and implementation services and training. Our consulting and implementation engagements are billed on a time and materials, fixed fee or subscription basis. We also offer a number of training classes on implementing, using and administering our service that are billed on a per person, per class basis. Our typical professional services payment terms provide that our customers pay us within 30 days of invoice.
In determining whether professional services can be accounted for separately from subscription and support revenues, we consider a number of factors, which are described in Note 1 “Summary of Business and Significant Accounting Policies.”
Revenue by Cloud Service Offering
The information below is provided on a supplemental basis to give additional insight into the revenue performance of our individual core service offerings. All of the cloud offerings that we offer to customers are grouped into four major cloud service offerings. Subscription and support revenues consisted of the following (in millions):
|
| | | | | | | | | | | | | | | | | | | |
| | Three Months Ended October 31, | | | | Nine Months Ended October 31, | | |
| | 2017 | | 2016 | | Variance- Percent | | 2017 | | 2016 | | Variance- Percent |
| Sales Cloud | $ | 906.5 |
| | $ | 776.2 |
| | 17% | | $ | 2,622.5 |
| | $ | 2,255.7 |
| | 16% |
| Service Cloud | 738.1 |
| | 589.9 |
| | 25% | | 2,087.8 |
| | 1,705.4 |
| | 22% |
| Salesforce Platform and Other | 495.3 |
| | 370.7 |
| | 34% | | 1,392.9 |
| | 1,050.0 |
| | 33% |
| Marketing and Commerce Cloud | 346.2 |
| | 247.2 |
| | 40% | | 952.3 |
| | 634.5 |
| | 50% |
| Total | $ | 2,486.1 |
| | $ | 1,984.0 |
| |
| | $ | 7,055.5 |
| | $ | 5,645.6 |
| |
|
Subscription and support revenues from the Analytics Cloud, Community Cloud, IoT Cloud, and Salesforce QuipTableau products) were not significantnegatively impacted for the three and nine months ended October 31, 2017. Analytics Cloud, IoT Cloud and Salesforce Quip revenue
is included with Salesforce Platform and OtherApril 30, 2020, in the table above. Community Cloud revenue is included in either Sales Cloud, Service Cloud or Salesforce Platform and Other depending on the primary service offering purchased.
As required under U.S. GAAP, we recorded deferred revenue relatedpart due to acquired contracts from Demandware at fair value on the date of acquisition. Asshorter contract duration than historical averages as a result we did not recognize certain revenues related to these acquired contracts that Demandware would have otherwise recorded as an independent entity. Of the $952.3 millionof COVID-19. Revenues from software licenses represent less than ten percent of total subscription and support revenue for Marketing and Commerce Cloud for the ninethree months ended October 31, 2017, approximately $160.9 million was attributed to Commerce Cloud.April 30, 2020.
In situations where a customer purchases multiple cloud offerings, such as through an Enterprise License Agreement, we allocate the contract value toThe revenue growth rates of each of our core service offerings, as described below in “Results of Operations,” fluctuate from quarter to quarter and over time. Additionally, we manage the total balanced product portfolio to deliver solutions to our customers, and as a result, the revenue result for each offering based on the customer’s estimated product demand plan and the service that was provided at the inceptionis not necessarily indicative of the contract. We do not update these allocations based on actual product usage during the term of the contract. We have allocated approximately 14 percent of our total subscription and support revenuesresults to be expected for the three and nine months ended October 31, 2017 and 12 percent of our total subscription and support revenues for the three and nine months ended October 31, 2016, based on customers’ estimated product demand plans and these allocated amounts are included in the table above.
Additionally,any subsequent quarter. In addition, some of our serviceCloud Service offerings have similar features and functions. For example, customers may use the Sales Cloud, the Service Cloud or ourthe Salesforce Platform to record account and contact information, which are similar features across these core service offerings. Depending on a customer’s actual and projected business requirements, more than one core service offering may satisfy the customer’s current and future needs. We record revenue based on the individual products ordered by a customer, not according to the customer’s business requirements and usage. In addition, as we introduce new features and functions within each offering and refine our allocation methodology for changes in our business, we do not expect it to be practical to adjust historical revenue results by service offering for comparability. Accordingly, comparisons of revenue performance by core service offering over time may not be meaningful.
Our Sales Cloud service offering is our most widely distributed service offering and has historically been the largest contributor of subscription and support revenues. As a result, Sales Cloud has the most international exposure and foreign exchange rate exposure relative to the other cloud service offerings. Conversely, revenue for Marketing and Commerce Cloud is primarily derived from the Americas with little impact from foreign exchange rate movement.
The revenue growth rates of each of our core service offerings fluctuate from quarter to quarter and over time. While we are a market leader in each core offering, we manage the total balanced product portfolio to deliver solutions to our customers. Accordingly, the revenue result for each cloud service offering is not necessarily indicative of the results to be expected for any subsequent quarter.
Seasonal Nature of DeferredUnearned Revenue, Accounts Receivable and Operating Cash Flow
DeferredUnearned revenue primarily consists of billings to customers for our subscription service. Over 90 percent of the value of our billings to customers is for our subscription and support service. We generally invoice our customers in advance, in annual cycles. Approximately 80 percentinstallments, and typical payment terms provide that our customers pay us within 30 days of invoice. Amounts that have been invoiced are recorded in accounts receivable and in unearned revenue or in revenue depending on whether transfer of control to customers has occurred. In general, we collect our billings in advance of the value of all subscription and support related invoices, excluding Demandware related invoices, were issued with annual terms during the three months ended October 31, 2017 and 2016.service period. We typically issue renewal invoices in advance of the renewal service period, and depending on timing, the initial invoice for the subscription and services contract and the subsequent renewal invoice may occur in different quarters. This may result in an increase in deferred revenue and accounts receivable. There is a disproportionate weighting toward annual billings in the fourth quarter, primarily as a result of large enterprise account buying patterns. Our fourth quarter has historically been our strongest quarter for new business and renewals. The year on yearyear-on-year compounding effect of this seasonality in both billing patterns and overall new and renewal business causes the value of invoices that we generate in the fourth quarter for both new business and renewals to increase as a proportion of our total annual billings. Accordingly, because of this billing activity, our first quarter is typically our largest collections and operating cash flow quarter.
Unbilled Deferred Revenue, an Operational Measure
Conversely, our third quarter has historically been our smallest operating cash flow quarter. The deferred revenue balanceimpact of COVID-19, including the impact on our consolidated balance sheets does not representcustomers’ ability or willingness to pay, our ability to collect, and the total contract value of annual or multi-year, non-cancelable subscription agreements. Unbilled deferred revenue is an operational measure that represents future billings under our subscription agreements that have not been invoiced and, accordingly, are not recorded in deferred revenue. Unbilled deferred revenue amounts by quarter are reflected in the table below. Our typical contract length is between 12 and 36 months. We expect that the amount of unbilled deferred revenue will change from quartertemporary financial flexibility offered to quarter for several reasons, including the specific timing, duration and size of large customer subscription agreements, varying billing cycles of subscription agreements, the specific timing of customer renewals, foreign currency fluctuations, the timing of when unbilled deferred revenue is to be recognized as revenue, and changes in customer financial circumstances. For multi-year subscription agreements billed annually, the associated unbilled deferred revenue is typically high at the beginning of the contract period, zero just prior to renewal, and increases if the agreement is renewed. Low unbilled deferred revenue attributable to a particular
subscription agreement is often associated with an impending renewalsome customers, has affected and may not be an indicatorcontinue to affect trends related to the seasonal nature of the likelihood of renewal or futureunearned revenue, from such customer. Accordingly, we expect that the amount of aggregate unbilled deferred revenue will change from year-to-year depending in part upon the numberaccounts receivable and dollar amount of subscription agreements at particular stages in their renewal cycle. Such fluctuations are not a reliable indicator of future revenues. Unbilled deferred revenue does not include minimum revenue commitments from indirect sales channels, as we recognize revenue, deferred revenue, and any unbilled deferred revenue upon sell-through to an end user customer. Unbilled deferred revenue also does not include any estimates for overage billings above a customer's minimum commitment.operating cash flow.
The sequential quarterly changes in accounts receivable and the related deferredunearned revenue and operating cash flow during the first quarter of our fiscal year are not necessarily indicative of the billing activity that occurs for the following quarters as displayed below (in thousands, exceptmillions).
The first quarter fiscal 2021 results reflected in the tables above include the impact of the Salesforce.org business combination in June 2019 and the Tableau acquisition in August 2019, respectively.
Remaining Performance Obligation
Our remaining performance obligation represents all future revenue under contract that has not yet been recognized as revenue and includes unearned revenue and unbilled deferred revenue)amounts. Our current remaining performance obligation represents future revenue under contract that is expected to be recognized as revenue in the next 12 months.
Remaining performance obligation is not necessarily indicative of future revenue growth and is influenced by several factors, including seasonality, the timing of renewals, average contract terms, foreign currency exchange rates and fluctuations
in new business growth. Unbilled portions of the remaining performance obligation denominated in foreign currencies are revalued each period based on the period end exchange rates. For multi-year subscription agreements billed annually, the associated unbilled balance and corresponding remaining performance obligation are typically high at the beginning of the contract period, zero just prior to renewal, and increase if the agreement is renewed. Low remaining performance obligation attributable to a particular subscription agreement is often associated with an impending renewal but may not be an indicator of the likelihood of renewal or future revenue from such customer. Changes in average contract duration can impact remaining performance obligation. For example, if customers were to reduce the length of their subscription agreement due to the uncertainty around COVID-19, this would negatively impact remaining performance obligation.
Remaining performance obligation consisted of the following (in billions):
|
| | | | | | | | | | | |
| | October 31,
2017 | | July 31,
2017 | | April 30,
2017 |
| Fiscal 2018 | | | | | |
| Accounts receivable, net | $ | 1,519,916 |
| | $ | 1,569,322 |
| | $ | 1,439,875 |
|
| Deferred revenue | 4,392,082 |
| | 4,818,634 |
| | 5,042,652 |
|
| Operating cash flow (1) | 125,792 |
| | 331,269 |
| | 1,229,584 |
|
| Unbilled deferred revenue | 11.5 bn |
| | 10.4 bn |
| | 9.6 bn |
|
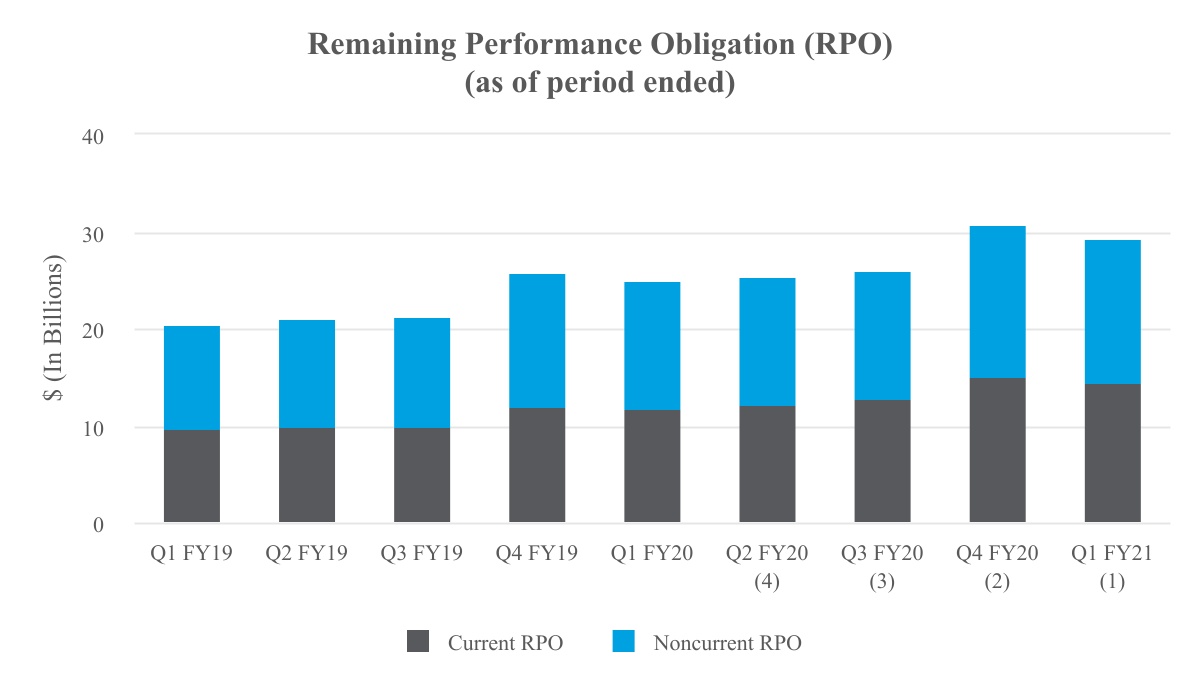
(1) Includes approximately $450 million and $700 million of remaining performance obligation related to Salesforce.org business combination in June 2019 and the Tableau acquisition in August 2019, respectively. |
| | | | | | | | | | | | | | | |
| | January 31,
2017 | | October 31,
2016 | | July 31,
2016 | | April 30,
2016 |
| Fiscal 2017 | | | | | | | |
| Accounts receivable, net | $ | 3,196,643 |
| | $ | 1,281,425 |
| | $ | 1,323,114 |
| | $ | 1,192,965 |
|
| Deferred revenue (2) | 5,542,802 |
| | 3,495,133 |
| | 3,823,561 |
| | 4,006,914 |
|
| Operating cash flow (1) | 706,146 |
| | 154,312 |
| | 250,678 |
| | 1,051,062 |
|
| Unbilled deferred revenue | 9.0 bn |
| | 8.6 bn |
| | 8.0 bn |
| | 7.6 bn |
|
(3) Includes approximately $400 million and $550 million of remaining performance obligation related to the Salesforce.org business combination in June 2019 and the Tableau acquisition in August 2019, respectively. |
| | | | | | | | | | | | | | | |
| | January 31,
2016 | | October 31,
2015 | | July 31,
2015 | | April 30,
2015 |
| Fiscal 2016 | | | | | | | |
| Accounts receivable, net | $ | 2,496,165 |
| | $ | 1,060,726 |
| | $ | 1,067,799 |
| | $ | 926,381 |
|
| Deferred revenue (2) | 4,291,553 |
| | 2,846,510 |
| | 3,034,991 |
| | 3,056,820 |
|
| Operating cash flow (1) | 470,208 |
| | 162,514 |
| | 304,278 |
| | 735,081 |
|
| Unbilled deferred revenue | 7.1 bn |
| | 6.7 bn |
| | 6.2 bn |
| | 6.0 bn |
|
| |
(1) | Operating cash flow represents net cash provided by operating activities for the three months ended in the periods stated above. |
| |
(2) | Amounts include deferred revenue current and noncurrent |
Cost of Revenues and Operating Expenses
Impact of Acquisitions
The comparability of our operating results is impacted by our recent acquisitions, including the acquisition of Tableau in August 2019. Expense contributions by expense type from our recent acquisitions generally may not be separately identifiable due to the integration of these businesses into our existing operations, or may be insignificant to our results of operations during the periods presented.
Cost of Revenues
Cost of subscription and support revenues primarily consists of expenses related to delivering our service and providing support, including the costs of data center capacity, depreciation or operating lease expense associated with computer equipment and software, allocated overhead, amortization expense associated with capitalized software related to our services and acquired developed technologies and certain fees paid to various third parties for the use of their technology, services and data. We allocate overheaddata and employee-related costs such as information technology infrastructure, rentsalaries and occupancy charges based on headcount. Employee benefit costs and taxes are allocated based upon a percentage of total compensation expense. As such, general overhead expenses are reflected in each cost of revenue and operating expense category. benefits.
Cost of professional services and other revenues consists primarily of employee-related costs associated with these services, including stock-based expenses, the cost of subcontractors and certain third-party fees and allocated overhead. The cost of providing professional services is higher as a percentage of the related revenue than for our enterprise cloud computing subscription service due to the direct labor costs and costs of subcontractors.fees.
We intend to continue to invest additional resources in our enterprise cloud computing services. For example, we have invested in additional database software and hardware and we plan to increase the capacity that we are able to offer globally
through data centers and third-party infrastructure providers. As we acquire new businesses and technologies, the amortization expense associated with this activity will be included in cost of revenues. Additionally, as we enter into new contracts with third parties for the use of their technology, services or data, or as our sales volume grows, the fees paid to use such technology or services may increase. Finally, we expect the cost of professional services to be approximately in line with revenues from professional services as we believe this investment in professional services facilitates the adoption of our service offerings. The timing of these additional expenses will affect our cost of revenues, both in terms of absolute dollars and as a percentage of revenues, in the affected periods.
Research and Development
Research and development expenses consist primarily of salaries and related expenses, including stock-based expenses the costs of our development and test data center and allocated overhead. We continue to focus our research and development efforts on adding new features and services, integrating acquired technologies, increasing the functionality and security and enhancing the ease
We expect that in the future, research and development expenses will increase in absolute dollars and may increase as a percentage of total revenues as we invest in building the necessary employee and system infrastructure required to support the development of new, and improve existing, technologies and the integration of acquired businesses and technologies.
Marketing and Sales
Marketing and sales expenses aremake up the majority of our largest costoperating expenses and consist primarily of salaries and related expenses, including stock-based expenses and commissions, for our sales and marketing staff, including commissions, as well as payments to partners, marketing programs and allocated overhead. Marketing programs consist of advertising, events, corporate communications, brand building and product marketing activities.
We plan to continue to invest in marketing and sales by expanding our domestic and international selling and marketing activities, building brand awareness, attracting new customers and sponsoring additional marketing events. The timing of these marketing events, such as our annual and largest event, Dreamforce, will affect our marketing costs in a particular quarter. We expect that in the future, marketing and sales expenses will increase in absolute dollars and continue to be our largest cost. We also expect marketing and sales costs as a percentage of total revenues to either remain flat or decrease for the next several quarters.
General and Administrative
General and administrative expenses consist primarily of salaries and related expenses, including stock-based expenses, for finance and accounting, legal, internal audit, human resources and management information systems personnel legal costs,and professional fees, other corporate expenses and allocated overhead. We expect that in the future, general and administrative expenses will increase in absolute dollars as we invest in our infrastructure and we incur additional employee related costs, professional fees and insurance costs related to the growth of our business and international expansion. We expect general and administrative costs as a percentage of total revenues to either remain flat or decrease for the next several quarters. However, the timing of additional expenses in a particular quarter, both in terms of absolute dollars and as a percentage of revenues, will affect our general and administrative expenses.services fees.
Stock-Based Expenses
Our cost of revenues and operating expenses include stock-based expenses related to equity plans for employees and non-employee directors. We recognize our stock-based compensation as an expense in the statements of operations based on their fair values and vesting periods. These charges have been significant in the past and we expect that they will increase as our stock price increases, as we acquire more companies, as we hire more employees and seek to retain existing employees.
During the nine months ended October 31, 2017, we recognized stock-based expense related to our equity plans for employees and non-employee directors of $759.3 million. As of October 31, 2017, the aggregate stock compensation remaining to be amortized to costs and expenses was approximately $2.0 billion. We expect this stock compensation balance to be amortized as follows: $234.5 million during the remaining three months of fiscal 2018; $777.8 million during fiscal 2019; $574.4 million during fiscal 2020; $303.6 million during fiscal 2021; $42.9 million during fiscal 2022 and $25.2 million thereafter. The expected amortization reflects only outstanding stock awards as of October 31, 2017 and assumes no forfeiture activity. We expect to continue to issue stock-based awards to our employees in future periods.
Amortization of Purchased Intangibles from Business Combinations and the Purchase of 50 Fremont
Our cost of revenues, operating expenses and other expense include amortization of acquisition-related intangible assets, such as the amortization of the cost associated with an acquired company’s developed technology, trade names and trademarks, customer lists, acquired leases and customer relationships. We expect this expense to fluctuate as we acquire more businesses and intangible assets become fully amortized.
Critical Accounting Policies and Estimates
There have been noOur condensed consolidated financial statements are prepared in accordance with accounting principles generally accepted in the United States. The preparation of these condensed consolidated financial statements requires us to make estimates and assumptions that affect the reported amounts of assets, liabilities, revenues, costs and expenses, and related disclosures. On an ongoing basis, we evaluate our estimates and assumptions. Our actual results may differ from these estimates under different assumptions or conditions.
We believe that of our significant changesaccounting policies, which are described in Note 1 “Summary of Business and Significant Accounting Policies” to our criticalcondensed consolidated financial statements, the following accounting policies and specific estimates duringinvolve a greater degree of judgment and complexity. Accordingly, these are the nine months ended October 31, 2017 as compared to the critical accounting policies and estimates disclosedwe believe are the most critical to aid in Item 7. Management’s Discussionfully understanding and Analysisevaluating our consolidated financial condition and results of Financial Conditionoperations:
•the fair value of assets acquired and Resultsliabilities assumed for business combinations;
•the standalone selling price ("SSP") of Operations includedperformance obligations for revenue contracts with multiple performance obligations;
•the average period of benefit associated with costs capitalized to obtain revenue contracts;
•the recognition, measurement and valuation of current and deferred income taxes and uncertain tax positions; and
•the valuation of privately held strategic investments, including impairment considerations.
During the quarter, uncertainty around the impact of COVID-19 resulted in a higher level of judgment related to our Annual Report on Form 10-Kestimates and assumptions concerning variable consideration related to revenue recognition, allowances for credit losses, impairment of strategic investments, contract termination costs related to customer and employee events and impairment of operating lease right of use assets. As of the year ended January 31, 2017.date of issuance of the financial statements, we are not aware of any specific event or circumstance that would require us to update our estimates, judgments, or revise the carrying value of our assets or liabilities. These estimates may change, as new events occur and additional information is obtained, and such changes will be recognized in the condensed consolidated financial statements as soon as they become known. Actual results could differ from these estimates, including as a result of the COVID-19 pandemic, and any such differences may be material to our financial statements.
Recent Accounting Pronouncements
See Note 1 “Summary of Business and Significant Accounting Policies” to the condensed consolidated financial statements for our discussion about new accounting pronouncements adopted and those pending.
Results of Operations
Three and Nine Months Ended October 31, 2017 and 2016
The following tables set forth selected data for each of the periods indicated (in thousands)millions): | | | | Three Months Ended October 31, | |
| 1 | | 1 | | Three Months Ended April 30, |
| | 2017 | | As a % of Total Revenues | | 2016 | | As a % of Total Revenues | | | 2020 | | % of Total Revenues | | 2019 | | % of Total Revenues | |
| Revenues: | | | | | | | | Revenues: | | | | | | | | | |
| Subscription and support | $ | 2,486,131 |
| | 93 | % | | $ | 1,983,981 |
| | 93 | % | Subscription and support | | $ | 4,575 | | | 94 | % | | $ | 3,496 | | | 94 | % | |
| Professional services and other | 193,710 |
| | 7 |
| | 160,794 |
| | 7 |
| Professional services and other | | 290 | | | 6 | | | 241 | | | 6 | | |
| Total revenues | 2,679,841 |
| | 100 |
| | 2,144,775 |
| | 100 |
| Total revenues | | 4,865 | | | 100 | | | 3,737 | | | 100 | | |
| Cost of revenues (1)(2): | | | | | | | | Cost of revenues (1)(2): | | | |
| Subscription and support | 528,182 |
| | 20 |
| | 426,487 |
| | 20 |
| Subscription and support | | 966 | | | 20 | | | 678 | | | 18 | | |
| Professional services and other | 186,326 |
| | 7 |
| | 159,035 |
| | 7 |
| Professional services and other | | 288 | | | 6 | | | 236 | | | 6 | | |
| Total cost of revenues | 714,508 |
| | 27 |
| | 585,522 |
| | 27 |
| Total cost of revenues | | 1,254 | | | 26 | | | 914 | | | 24 | | |
| Gross profit | 1,965,333 |
| | 73 |
| | 1,559,253 |
| | 73 |
| Gross profit | | 3,611 | | | 74 | | | 2,823 | | | 76 | | |
| Operating expenses (1)(2): | | | | | | | | Operating expenses (1)(2): | | | |
| Research and development | 393,998 |
| | 15 |
| | 311,459 |
| | 15 |
| Research and development | | 859 | | | 18 | | | 554 | | | 15 | | |
| Marketing and sales | 1,184,733 |
| | 44 |
| | 997,993 |
| | 47 |
| Marketing and sales | | 2,390 | | | 49 | | | 1,697 | | | 45 | | |
| General and administrative | 270,614 |
| | 10 |
| | 246,765 |
| | 11 |
| General and administrative | | 502 | | | 10 | | | 362 | | | 10 | | |
| | Total operating expenses | 1,849,345 |
| | 69 |
| | 1,556,217 |
| | 73 |
| Total operating expenses | | 3,751 | | | 77 | | | 2,613 | | | 70 | | |
| Income from operations | 115,988 |
| | 4 |
| | 3,036 |
| | 0 |
| |
| Investment income | 10,049 |
| | 1 |
| | 3,709 |
| | 0 |
| |
| Interest expense | (21,557 | ) | | (1 | ) | | (21,946 | ) | | (1 | ) | |
| Other income (1) | 1,921 |
| | 0 |
| | 1,782 |
| | 0 |
| |
| Gains from acquisitions of strategic investments | 0 |
| | 0 |
| | 833 |
| | 0 |
| |
| Income (loss) before provision for income taxes | 106,401 |
| | 4 |
| | (12,586 | ) | | (1 | ) | |
| Provision for income taxes | (55,007 | ) | | (2 | ) | | (24,723 | ) | | (1 | ) | |
| Net income (loss) | $ | 51,394 |
| | 2 | % | | $ | (37,309 | ) | | (2 | )% | |
| Income (loss) from operations | | Income (loss) from operations | | (140) | | | (3) | | | 210 | | | 6 | | |
| | Gains on strategic investments, net | | Gains on strategic investments, net | | 192 | | | 4 | | | 281 | | | 7 | | |
| Other expense | | Other expense | | (5) | | | 0 | | | (9) | | | 0 | | |
| Income before benefit from (provision for) income taxes | | Income before benefit from (provision for) income taxes | | 47 | | | 1 | | | 482 | | | 13 | | |
| Benefit from (provision for) income taxes | | Benefit from (provision for) income taxes | | 52 | | | 1 | | | (90) | | | (3) | | |
| Net income | | Net income | | $ | 99 | | | 2 | % | | $ | 392 | | | 10 | % | |
(1) Amounts related to amortization of purchased intangibles fromintangible assets acquired through business combinations, as follows (in thousands)millions): | | | | Three Months Ended October 31, | | | Three Months Ended April 30, |
| | 2017 | | As a % of Total Revenues | | 2016 | | As a % of Total Revenues | | | 2020 | | % of Total Revenues | | 2019 | | % of Total Revenues | |
| Cost of revenues | $ | 39,610 |
| | 1 | % | | $ | 36,703 |
| | 2 | % | Cost of revenues | | $ | 159 | | | 3 | % | | $ | 61 | | | 2 | % | |
| Marketing and sales | 30,067 |
| | 1 |
| | 28,064 |
| | 1 |
| Marketing and sales | | 112 | | | 2 | % | | 68 | | | 2 | | |
| Other income (expense) | 367 |
| | 0 |
| | 579 |
| | 0 |
| |
|
(2) Amounts related to stock-based expenses, as follows (in thousands)millions):
| | | | | | | | | | | | | | | | | | | | | | | | | | | | | | | | | | | |
| | | | Three Months Ended April 30, |
| | | | | | | | | | 2020 | | % of Total Revenues | | 2019 | | % of Total Revenues | | | | |
| Cost of revenues | | | | | | | | | $ | 52 | | | 1 | % | | $ | 43 | | | 1 | % | | | | |
| Research and development | | | | | | | | | 166 | | | 3 | | | 81 | | | 2 | | | | | |
| Marketing and sales | | | | | | | | | 223 | | | 5 | | | 177 | | | 5 | | | | | |
| General and administrative | | | | | | | | | 63 | | | 1 | | | 42 | | | 1 | | | | | |
|
| | | | | | | | | | | | | |
| | Three Months Ended October 31, |
| | 2017 | | As a % of Total Revenues | | 2016 | | As a % of Total Revenues |
| Cost of revenues | $ | 33,494 |
| | 1 | % | | $ | 26,783 |
| | 1 | % |
| Research and development | 66,626 |
| | 2 |
| | 50,372 |
| | 2 |
|
| Marketing and sales | 116,992 |
| | 4 |
| | 93,718 |
| | 4 |
|
| General and administrative | 34,165 |
| | 1 |
| | 33,878 |
| | 2 |
|
The following table sets forth selected balance sheet data and other metrics for each of the periods indicated (in millions, except remaining performance obligation, which is presented in billions):
| | | | | | | | | | | |
| As of April 30, | | As of January 31, |
| 2020 | | 2020 |
| | | |
| Cash, cash equivalents and marketable securities | $ | 9,802 | | | $ | 7,947 | |
| Unearned revenue | 9,112 | | | 10,662 | |
| Remaining performance obligation | 29.3 | | | 30.8 | |
| Principal due on our outstanding debt obligations (1) | 2,693 | | | 2,694 | |
|
| | | | | | | | | | | | | |
| | Nine Months Ended October 31, |
| | 2017 | | As a % of Total Revenues | | 2016 | | As a % of Total Revenues |
| Revenues: | | | | | | | |
| Subscription and support | $ | 7,055,538 |
| | 92 | % | | $ | 5,645,554 |
| | 93 | % |
| Professional services and other | 573,471 |
| | 8 |
| | 452,442 |
| | 7 |
|
| Total revenues | 7,629,009 |
| | 100 |
| | 6,097,996 |
| | 100 |
|
| Cost of revenues (1)(2): | | | | | | | |
| Subscription and support | 1,484,982 |
| | 20 |
| | 1,154,044 |
| | 19 |
|
| Professional services and other | 550,748 |
| | 7 |
| | 454,038 |
| | 7 |
|
| Total cost of revenues | 2,035,730 |
| | 27 |
| | 1,608,082 |
| | 26 |
|
| Gross profit | 5,593,279 |
| | 73 |
| | 4,489,914 |
| | 74 |
|
| Operating expenses (1)(2): | | | | | | | |
| Research and development | 1,156,526 |
| | 15 |
| | 863,935 |
| | 14 |
|
| Marketing and sales | 3,464,986 |
| | 45 |
| | 2,828,784 |
| | 46 |
|
| General and administrative | 813,868 |
| | 11 |
| | 709,622 |
| | 12 |
|
| Total operating expenses | 5,435,380 |
| | 71 |
| | 4,402,341 |
| | 72 |
|
| Income from operations | 157,899 |
| | 2 |
| | 87,573 |
| | 2 |
|
| Investment income | 24,069 |
| | 0 |
| | 23,747 |
| | 0 |
|
| Interest expense | (65,382 | ) | | (1 | ) | | (64,665 | ) | | (1 | ) |
| Other expense (1) | (2,695 | ) | | 0 |
| | (11,500 | ) | | 0 |
|
| Gains from acquisitions of strategic investments | 0 |
| | 0 |
| | 13,697 |
| | 0 |
|
| Income before benefit from (provision for) income taxes | 113,891 |
| | 1 |
| | 48,852 |
| | 1 |
|
| Benefit from (provision for) income taxes | (53,968 | ) | | 0 |
| | 182,220 |
| | 3 |
|
| Net income | $ | 59,923 |
| | 1 | % | | $ | 231,072 |
| | 4 | % |
(1) Amounts related to amortizationdo not include operating or financing lease obligations.
Remaining performance obligation represents contracted revenue that has not yet been recognized, which includes unearned revenue and unbilled amounts that will be recognized as revenue in future periods.
Impact of
purchased intangibles from business combinations, as follows (in thousands):Acquisitions |
| | | | | | | | | | | | | |
| | Nine Months Ended October 31, |
| | 2017 | | As a % of Total Revenues | | 2016 | | As a % of Total Revenues |
| Cost of revenues | $ | 126,679 |
| | 2 | % | | $ | 84,462 |
| | 1 | % |
| Marketing and sales | 91,274 |
| | 1 |
| | 66,601 |
| | 1 |
|
| Other income (expense) | 1,118 |
| | 0 |
| | 1,927 |
| | 0 |
|
(2) Amounts related to stock-based expenses, as follows (in thousands): |
| | | | | | | | | | | | | |
| | Nine Months Ended October 31, |
| | 2017 | | As a % of Total Revenues | | 2016 | | As a % of Total Revenues |
| Cost of revenues | $ | 97,206 |
| | 1 | % | | $ | 76,912 |
| | 1 | % |
| Research and development | 197,185 |
| | 3 |
| | 124,164 |
| | 2 |
|
| Marketing and sales | 356,538 |
| | 5 |
| | 275,515 |
| | 5 |
|
| General and administrative | 108,402 |
| | 1 |
| | 99,389 |
| | 2 |
|
|
| | | | | | | | | | | | | |
| | Three Months Ended October 31, | | Variance |
| (in thousands) | 2017 | | 2016 | | Dollars | | Percent |
| Subscription and support | $ | 2,486,131 |
| | $ | 1,983,981 |
| | $ | 502,150 |
| | 25% |
| Professional services and other | 193,710 |
| | 160,794 |
| | 32,916 |
| | 20% |
| Total revenues | $ | 2,679,841 |
| | $ | 2,144,775 |
| | $ | 535,066 |
| | 25% |
|
| | | | | | | | | | | | | |
| | Nine Months Ended October 31, | | Variance |
| (in thousands) | 2017 | | 2016 | | Dollars | | Percent |
| Subscription and support | $ | 7,055,538 |
| | $ | 5,645,554 |
| | $ | 1,409,984 |
| | 25% |
| Professional services and other | 573,471 |
| | 452,442 |
| | 121,029 |
| | 27% |
| Total revenues | $ | 7,629,009 |
| | $ | 6,097,996 |
| | $ | 1,531,013 |
| | 25% |
Total revenues were $2.7 billionThe comparability of our operating results for the three months ended October 31, 2017,April 30, 2020 compared to $2.1 billion during the same period aof fiscal 2020 was impacted by our business combination and acquisitions in the current and prior year, ago, an increaseincluding the acquisition of $535.1 million, or 25 percent. Total revenues were $7.6 billion forTableau in the nine months ended October 31, 2017, comparedprior year, which was our largest acquisition to $6.1 billion during the same period a year ago, an increasedate. In our discussion of $1.5 billion, or 25 percent. Subscription and support revenues were $2.5 billion, or 93 percentchanges in our results of total revenues,operations for the three months ended October 31, 2017,April 30, 2020 compared to $2.0 billion, or 93 percent of total revenues, during the same period a year ago, an increase of $502.2 million, or 25 percent. Subscriptionfiscal 2020, we may quantitatively disclose the impact of our acquired products and support revenues were $7.1 billion, or 92 percent of total revenues,services for the nine months ended October 31, 2017, comparedone-year period subsequent to $5.6 billion,the acquisition date on the growth in certain of our revenues where such discussions would be meaningful. Expense contributions from our recent acquisitions for each of the respective period comparisons generally were not separately identifiable due to the integration of these businesses into our existing operations or 93 percentwere insignificant to our results of total revenues,operations during the same period a year ago, an increase of $1.4 billion, or 25 percent. periods presented.
Revenues
| | | | | | | | | | | | | | | | | | | | | | | |
| | Three Months Ended April 30, | | Variance |
| (in millions) | 2020 | | 2019 | | Dollars | | Percent |
| Subscription and support | $ | 4,575 | | | $ | 3,496 | | | $ | 1,079 | | | 31 | % |
| Professional services and other | 290 | | | 241 | | | 49 | | | 20 | |
| Total revenues | $ | 4,865 | | | $ | 3,737 | | | $ | 1,128 | | | 30 | |
The increase in subscription and support revenues was primarily caused by volume-driven increases from new business, which includes new customers, upgrades, and additional subscriptions from existing customers. Ourcustomers and acquisition activity. Pricing was not a significant driver of Demandwarethe increase in July 2016 contributed $160.9 million torevenues for the nineperiod. Revenues from term and perpetual software licenses, which are recognized at a point in time, represent approximately five percent of total subscription and support revenues for the three months ended October 31, 2017 as compared to $57.9 million fromApril 30, 2020. Subscription and support revenues accounted for approximately 94 percent of our total revenues for both the date of acquisition to October 31, 2016. This was offsetthree months ended April 30, 2020 and 2019. Additionally, subscription and support revenues increased by a reduction in subscription revenues of approximately $20.0$46 million as a result of one lessmore day (February 29, 2020) in the ninethree months ended October 31, 2017April 30, 2020 compared to the ninesame period a year ago.
The business combination with Salesforce.org in June 2019 and acquisition of Tableau in August 2019 contributed approximately $104 million and $273 million to total subscription and support revenues in the three months ended October 31, 2016. April 30, 2020, respectively. As a result of our business combination activity, we recorded unearned revenue related to acquired contracts from acquired entities at fair value on the date of acquisition. As a result, we did not recognize certain revenues related to these acquired contracts that the acquired entities would have otherwise recorded as an independent entity.
Our growth in revenues is also impacted by attrition. Attrition represents the reduction or loss of the annualized value of our contracts with customers. We calculate our attrition rate at a point in time on a trailing twelve-month basis as of the end of each month. As of April 30, 2020, our attrition rate, excluding Integration Cloud, Salesforce.org and Tableau, was less than nine percent. Our attrition rate for the three months ended April 30, 2020 benefited, in part, from the ongoing shift in our business mix to enterprise and international markets which have longer customer contract term durations. In general, we exclude service offerings from acquisitions from our attrition calculation until they are fully integrated into our customer success organization. While it is difficult to predict, we expect our attrition rate to remain consistent in the near term due to the timing of renewals, as the fourth quarter is the largest quarter for renewals, and the diversity of size, industry and geography within the customer base, but it may increase over time as a result of COVID-19.
We continue to invest in a variety of customer programs and initiatives which, along with increasing enterprise adoption, have helped keep our attrition rate consistent as compared to the prior year. Consistent attrition rates play a role in our ability to
maintain growth in our subscription and support revenues. Changes in the net price per user per month have not been a significant driver of revenue growth for the periods presented. Professional services and other revenues were $193.7 million, or seven percent of total revenues, for the three months ended October 31, 2017, compared to $160.8 million, or seven percent of total revenues, for the same period a year ago, an increase of $32.9 million, or 20 percent. Professional services and other revenues were $573.5 million, or eight percent of total revenues, for the nine months ended October 31, 2017, compared to $452.4 million, or seven percent of total revenues, for the same period a year ago, an increase of $121.0 million, or 27 percent. The increase in professional services and other revenues was due primarily to the higher demand for services from an increased number of customers.
Subscription and Support Revenue by Service Offering
Subscription and support revenues consisted of the following (in millions):
| | | | | | | | | | | | | | | | | |
| | Three Months Ended April 30, | | |
| | 2020 | | 2019 | | Variance Percent |
| Sales Cloud | $ | 1,245 | | | $ | 1,073 | | | 16% |
| Service Cloud | 1,252 | | | 1,020 | | | 23% |
| Salesforce Platform and Other | 1,364 | | | 842 | | | 62% |
| Marketing and Commerce Cloud | 714 | | | 561 | | | 27% |
| Total | $ | 4,575 | | | $ | 3,496 | | | |
Our Industry Offerings revenue is included in either Sales Cloud, Service Cloud or Salesforce Platform and Other depending on the primary service offering purchased. Integration and Analytics revenues are included in Salesforce Platform and Other. The acquisition of Tableau in August 2019 contributed approximately $273 million to Salesforce Platform and Other during the three months ended April 30, 2020. The revenue growth rates of each of our core service offerings have been and may be impacted by COVID-19 in the future, depending on our customer’s actual and projected business needs. For example, we experienced increased demand for our Commerce Cloud offering for the three months ended April 30, 2020 when compared to prior periods.
Revenuesby geography were as follows (in thousands):
| | | | | | | | | | | | Three Months Ended April 30, |
| | Three Months Ended October 31, | |
| | 2017 | | As a % of Total Revenues | | 2016 | | As a % of Total Revenues | |
| (in millions) | | (in millions) | 2020 | | As a % of Total Revenues | | 2019 | | As a % of Total Revenues | | Growth Rate |
| Americas | $ | 1,927,405 |
| | 72 | % | | $ | 1,598,344 |
| | 74 | % | Americas | $ | 3,370 | | | 69 | % | | $ | 2,617 | | | 70 | % | | 29 | % |
| Europe | 493,732 |
| | 18 |
| | 337,497 |
| | 16 |
| Europe | 1,034 | | | 21 | | | 755 | | | 20 | | | 37 | |
| Asia Pacific | 258,704 |
| | 10 |
| | 208,934 |
| | 10 |
| Asia Pacific | 461 | | | 10 | | | 365 | | | 10 | | | 26 | |
| | $ | 2,679,841 |
| | 100 | % | | $ | 2,144,775 |
| | 100 | % | |
| Total | | Total | $ | 4,865 | | | 100 | % | | $ | 3,737 | | | 100 | % | |
|
| | | | | | | | | | | | | |
| | Nine Months Ended October 31, |
| | 2017 | | As a % of Total Revenues | | 2016 | | As a % of Total Revenues |
| Americas | $ | 5,536,932 |
| | 73 | % | | $ | 4,506,774 |
| | 74 | % |
| Europe | 1,367,718 |
| | 18 |
| | 1,012,671 |
| | 17 |
|
| Asia Pacific | 724,359 |
| | 9 |
| | 578,551 |
| | 9 |
|
| | $ | 7,629,009 |
| | 100 | % | | $ | 6,097,996 |
| | 100 | % |
Revenues by geography are determined based on the region of the Salesforce contracting entity, which may be different than the region of the customer. The increase in Americas revenue attributed torevenues was the United States was approximately 96 percentresult of the increasing acceptance of our services and 96 percent during the three months ended October 31, 2017 and 2016, respectively, and 96 percent and 96 percent during the nine months ended October 31, 2017 and 2016, respectively.
Revenues in Europe and Asia Pacific accounted for $752.4 million, or 28 percentinvestment of total revenues, for the three months ended October 31, 2017, compared to $546.4 million, or 26 percent of total revenues, during the same period a year ago, an increase of $206.0 million, or 38 percent. Revenues in Europe and Asia Pacific accounted for $2.1 billion, or 27 percent of total revenues, for the nine months ended October 31, 2017, compared to $1.6 billion, or 26 percent of total revenues, during the same period a year ago, an increase of $500.9 million, or 31 percent.additional sales resources. The increase in revenues outside of the Americas was the result of the increasing acceptance of our services, our focus on marketing our services internationally and investment in additional international resources. Revenues in the Americas and Europe also benefited from our acquisition of Tableau in August 2019. Foreign currency fluctuations, primarily the strengtheningBritish Pound Sterling, had a negative impact on revenues outside of the Americas increased on a total dollar basis by $38.6 million and $33.5of approximately $34 million in the three and nine months ended October 31, 2017, respectively,April 30, 2020 compared to a negative impact of approximately $60 million during the same periods a year ago as a result of the weakening U.S. dollar.three months ended April 30, 2019.
Cost of Revenues.
|
| | | | | | | | | | | |
| | Three Months Ended October 31, | | Variance |
| (in thousands) | 2017 | | 2016 | | Dollars |
| Subscription and support | $ | 528,182 |
| | $ | 426,487 |
| | $ | 101,695 |
|
| Professional services and other | 186,326 |
| | 159,035 |
| | 27,291 |
|
| Total cost of revenues | $ | 714,508 |
| | $ | 585,522 |
| | $ | 128,986 |
|
| Percent of total revenues | 27 | % | | 27 | % | | |
| | | | | | | | | | | | | | | | | |
| | Three Months Ended April 30, | | Variance
Dollars |
| (in millions) | 2020 | | 2019 | |
| Subscription and support | $ | 966 | | | $ | 678 | | | $ | 288 | |
| Professional services and other | 288 | | | 236 | | | 52 | |
| Total cost of revenues | $ | 1,254 | | | $ | 914 | | | $ | 340 | |
| Percent of total revenues | 26 | % | | 24 | % | | |
|
| | | | | | | | | | | |
| | Nine Months Ended October 31, | | Variance |
| (in thousands) | 2017 | | 2016 | | Dollars |
| Subscription and support | $ | 1,484,982 |
| | $ | 1,154,044 |
| | $ | 330,938 |
|
| Professional services and other | 550,748 |
| | 454,038 |
| | 96,710 |
|
| Total cost of revenues | $ | 2,035,730 |
| | $ | 1,608,082 |
| | $ | 427,648 |
|
| Percent of total revenues | 27 | % | | 26 | % | | |
Cost of revenues was $714.5 million, or 27 percent of total revenues, for the three months ended October 31, 2017, compared to $585.5 million, or 27 percent of total revenues, during the same period a year ago, an increase of $129.0 million. Cost of revenues was $2.0 billion, or 27 percent of total revenues, for the nine months ended October 31, 2017, compared to $1.6 billion, or 26 percent of total revenues, during the same period a year ago, an increase of $427.6 million. For the three months ended October 31, 2017,April 30, 2020, the increase in absolute dollarscost of revenues was primarily due to an increase of $41.6$90 million in employee-related costs, an increase of $6.7$9 million in stock-based expenses, an increase of $53.7$80 million in service delivery costs, primarily due to our efforts to increase data center capacity and an increase of amortization of purchased intangible assets of $2.9 million$98 million. Service delivery costs associated with our perpetual and an increase of $4.6 million in allocated overhead. For the nine months ended October 31, 2017, the increase in absolute dollars was primarily due to an increase of $149.1 million in employee-related costs, an increase of $20.3 million in stock-based expenses, an increase of $143.8 million interm software licenses are lower than service delivery costs primarilyassociated with our cloud service offerings and as a result, our subscription and support gross margin in the three months ended April 30, 2020 benefited, in part, due to this shift in our efforts to increase data center capacity, an increasebusiness mix.
We have increased our headcount by 1436 percent since October 31, 2016April 30, 2019 to meet the higher demand for services from our customers, and as a result of our fiscal 2017 acquisitions.recent acquisitions also contributed to this increase. We intend to continue to invest additional resources in our enterprise cloud computing services and data center capacity.capacity to allow us to scale with our customers and continuously evolve our security measures. We also plan to add additional employees in our professional services group to facilitate the adoption of our services. The timing of these expenses will affect our cost of revenues, both in terms of absolute dollars and as a percentage of revenues, in future periods.
The cost ofOur professional services and other revenuesgross margin was $186.3positive $2 million during the three months ended October 31, 2017 resulting inApril 30, 2020 and positive gross margins of $7.4 million. The cost of professional services and other revenues was $550.7$5 million during the nine months ended October 31, 2017 resulting in positive gross margin of $22.7 million. The cost of professional services and other revenues was $159.0 million during the three months ended October 31, 2016 resulting in positive gross margins of $1.8 million and $454.0 million during the nine months ended October 31, 2016 resulting in negative gross margins of $1.6 million.fiscal 2019. We expect the cost of professional services to be approximately in line with revenues from professional services in future fiscal quarters. We believe that this investment in professional services facilitates the adoption of our service offerings.
Operating Expenses.
|
| | | | | | | | | | | |
| | Three Months Ended October 31, | | Variance |
| (in thousands) | 2017 | | 2016 | | Dollars |
| Research and development | $ | 393,998 |
| | $ | 311,459 |
| | $ | 82,539 |
|
| Marketing and sales | 1,184,733 |
| | 997,993 |
| | 186,740 |
|
| General and administrative | 270,614 |
| | 246,765 |
| | 23,849 |
|
| Total operating expenses | $ | 1,849,345 |
| | $ | 1,556,217 |
| | $ | 293,128 |
|
| Percent of total revenues | 69 | % | | 73 | % | | |
| | | | | | | | | | | | | | | | | |
| | Three Months Ended April 30, | | Variance
Dollars |
| (in millions) | 2020 | | 2019 | |
| Research and development | $ | 859 | | | $ | 554 | | | $ | 305 | |
| Marketing and sales | 2,390 | | | 1,697 | | | 693 | |
| General and administrative | 502 | | | 362 | | | 140 | |
| | | | | |
| Total operating expenses | $ | 3,751 | | | $ | 2,613 | | | $ | 1,138 | |
| Percent of total revenues | 77 | % | | 70 | % | | |
|
| | | | | | | | | | | |
| | Nine Months Ended October 31, | | Variance |
| (in thousands) | 2017 | | 2016 | | Dollars |
| Research and development | $ | 1,156,526 |
| | $ | 863,935 |
| | $ | 292,591 |
|
| Marketing and sales | 3,464,986 |
| | 2,828,784 |
| | 636,202 |
|
| General and administrative | 813,868 |
| | 709,622 |
| | 104,246 |
|
| Total operating expenses | $ | 5,435,380 |
| | $ | 4,402,341 |
| | $ | 1,033,039 |
|
| Percent of total revenues | 71 | % | | 72 | % | | |
Research and development expenses were $394.0 million, or 15 percent of total revenues, for the three months ended October 31, 2017, compared to $311.5 million, or 15 percent of total revenues, during the same period a year ago, an increase of $82.5 million. Research and development expenses were $1.2 billion, or 15 percent of total revenues, for the nine months ended October 31, 2017, compared to $863.9 million, or 14 percent of total revenues, during the same period a year ago, an increase of $292.6 million. For the three months ended October 31, 2017,April 30, 2020, the increase in absolute dollarsresearch and development expenses was primarily due to an increase of approximately $47.2$182 million in employee-related costs, an increase of $16.3$85 million in stock-based expenses, an increase in our development and test data center costs and allocated overhead. For the nine months ended October 31, 2017, the increase in absolute dollars was primarily due to an increase of approximately $164.0 million in employee-related costs, an increase of $73.0 million in stock-based expenses, an increase in our development and test data center costs and allocated overhead. We increased ourOur research and development headcount increased by 1447 percent since October 31, 2016April 30, 2019 in order to improve and extend our service offerings, develop new technologies, and integrate previously acquired companies, including our fiscal 2017 acquisitions.companies. Our recent acquisitions also contributed to this increase in headcount. We expect that research and development expenses will increase in absolute dollars and may increase as a percentage of revenues in future periods as we continue to invest in additional employees and technology to support the development of new, and improve existing, technologies and the integration of acquired technologies.
Marketing and sales expenses were $1.2 billion, or 44 percent of total revenues, for the three months ended October 31, 2017, compared to $998.0 million, or 47 percent of total revenues, during the same period a year ago, an increase of $186.7 million. Marketing and sales expenses were $3.5 billion, or 45 percent of total revenues, for the nine months ended October 31, 2017, compared to $2.8 billion, or 46 percent of total revenues, during the same period a year ago, an increase of $636.2 million. For the three months ended October 31, 2017,April 30, 2020, the increase in marketing and sales expenses was primarily due to an increase of $164.1$494 million in employee-related costs and amortization of deferred commissions, an increase of $23.3$46 million in stock-based expenses, an increase in amortization of purchased intangible assets of $2.0$44 million, and allocated overhead, offset by a decrease of $24.3 million in advertising expenses. Foroverhead. Marketing and sales expenses for the ninethree months ended October 31, 2017.April 30, 2020 were also negatively impacted by the change was primarily dueone-time partial minimum commission guarantee offered to an increaseour direct sales force and the cancellation of $474.4 million in employee-related costs and amortization of deferred commissions, an increase of $81.0 million in stock-based expenses, an increase in amortization of purchased intangible assets of $24.7 million, and allocated overhead.our in-person events. Our marketing and sales headcount increased by 2434 percent since October 31, 2016. The increase in headcount wasApril 30, 2019, primarily attributable to hiring additional sales personnel to focus on adding new customers and increasing penetration within our existing customer base. Our recent acquisitions also contributed to this increase in headcount. We expect that marketing and sales expenses will increase in absolute dollars and may increase as a percentage of revenues in future periods as we continue to hire additional sales personnel.
General and administrative expenses were $270.6 million, or 10 percent of total revenues, forFor the three months ended October 31, 2017, compared to $246.8 million, or 11 percent of total revenues, duringApril 30, 2020, the same period a year ago, an increase of $23.8 million. Generalin general and administrative expenses were $813.9 million, or 11 percent of total revenues, for the nine months ended October 31, 2017, compared to $709.6 million, or 12 percent of total revenues, during the same period a year ago, an increase of $104.2 million. The increases werewas primarily due to an increase in employee-related costs. General and administrative expenses for the three months ended April 30, 2020 were also negatively impacted by our donations to members of our ecosystem and community, including the donation of personal protective equipment. Our general and administrative headcount increased by 1943 percent since October 31, 2016April 30, 2019 as we added personnel to support our growth.growth, and our recent acquisitions also contributed to this increase. While not material to date, we may experience increasing credit loss risks from accounts receivable in future periods depending on the duration or degree of economic slowdown caused by the COVID-19 pandemic, and our actual experience in the future may differ from our past experiences or current assessments.
Other income and expense.
| | | | | | | | | | | | | | | | | |
| | Three Months Ended April 30, | | Variance
Dollars |
| (in millions) | 2020 | | 2019 | |
| | | | | |
| | | | | |
| Gains on strategic investments, net | $ | 192 | | | $ | 281 | | | $ | (89) | |
| Other expense | (5) | | | (9) | | | 4 | |
Gains on strategic investments, net consists primarily of mark-to-market adjustments related to our publicly held equity securities, observable price adjustments related to our privately held equity securities and other adjustments. Net gains recognized during the three months ended April 30, 2020, were primarily driven by realized gains recognized on publicly held equity securities of $231 million and unrealized gains recognized on privately held securities of $30 million, offset by
|
| | | | | | | | | | | |
| | Three Months Ended October 31, | | Variance |
| (in thousands) | 2017 | | 2016 | | Dollars |
| Investment income | $ | 10,049 |
| | $ | 3,709 |
| | $ | 6,340 |
|
| Interest expense | (21,557 | ) | | (21,946 | ) | | 389 |
|
| Other income (expense) | 1,921 |
| | 1,782 |
| | 139 |
|
| Gains from acquisitions of strategic investments | 0 |
| | 833 |
| | (833 | ) |
|
| | | | | | | | | | | |
| | Nine Months Ended October 31, | | Variance |
| (in thousands) | 2017 | | 2016 | | Dollars |
| Investment income | $ | 24,069 |
| | $ | 23,747 |
| | $ | 322 |
|
| Interest expense | (65,382 | ) | | (64,665 | ) | | (717 | ) |
| Other income (expense) | (2,695 | ) | | (11,500 | ) | | 8,805 |
|
| Gains from acquisitions of strategic investments | 0 |
| | 13,697 |
| | (13,697 | ) |
Investment incomeOther expense primarily consists of incomeinterest expense on our cashdebt as well as our operating and marketable securities balances. Investment incomefinance leases offset by investment income. Interest expense was $10.0$29 million and $35 million for the three months ended October 31, 2017April 30, 2020 and 2019, respectively. Investment income increased $2 million in the three months ended April 30, 2020 compared to $3.7 million during the same period a year ago. Investment income was $24.1 million for the nine months ended October 31, 2017 and was $23.7 million during the same period a year ago. The increase wasago due to greater realized gains resulting fromhigher interest income across our portfolio, which is primarily a result of the sales oflarger cash equivalents and marketable securities in the three and nine months ended October 31, 2017.balances.
Interest expense consists of interest on our convertible senior notes, capital leases, financing obligation related to 350 Mission, the loan assumed on 50 Fremont, revolving credit facility and the $500.0 million term loan that was entered into in connection with our acquisition of Demandware. Interest expense was $21.6 million for the three months ended October 31, 2017 compared to $21.9 million during the same period a year ago. Interest expense was $65.4 million for the nine months ended October 31, 2017 and was $64.7 million during the same period a year ago.
Other income (expense) primarily consists of non-operating transactions such as strategic investments fair market value adjustments, gains and losses from foreign exchange rate fluctuations and real estate transactions.
Gains from acquisitions of strategic investments represents gains on sales of strategic investments when we acquire an entity in which we previously held a strategic investment. The difference between the fair value of the shares as of the date of the acquisition and the carrying value of the strategic investment is recorded as a gain or loss and disclosed separately within the statements of operations.
Benefit from (provision for) income taxes.
|
| | | | | | | | | | | |
| | Three Months Ended October 31, | | Variance |
| (in thousands) | 2017 | | 2016 | | Dollars |
| Provision for income taxes | $ | (55,007 | ) | | $ | (24,723 | ) | | $ | (30,284 | ) |
| Effective tax rate | 52 | % | | 196 | % | | |
| | | | | | | | | | | | | | | | | |
| | Three Months Ended April 30, | | Variance
Dollars |
| (in millions) | 2020 | | 2019 | |
| Benefit from (provision for) income taxes | $ | 52 | | | $ | (90) | | | $ | 142 | |
| Effective tax rate | (111) | % | | 19 | % | | |
|
| | | | | | | | | | | |
| | Nine Months Ended October 31, | | Variance |
| (in thousands) | 2017 | | 2016 | | Dollars |
| Benefit from (provision for) income taxes | $ | (53,968 | ) | | $ | 182,220 |
| | $ | (236,188 | ) |
| Effective tax rate | 47 | % | | (373 | )% | | |
WeDuring the three months ended April 30, 2020, we recognized a tax provisionbenefit of $55.0$52 million on a pretax income of $106.4 million for the three months ended October 31, 2017 and a$47 million. Our tax provision decreased from the same period a year ago primarily due to smaller quarter-to-date pre-tax income. Our effective tax rate may fluctuate due to changes in our domestic and foreign earnings or material discrete tax items or a combination of $54.0 million on a pretax income of $113.9 millionthese factors resulting from transactions or events, for the nine months ended October 31, 2017. The tax provision recorded was primarily related to income taxes in profitable jurisdictions outside of the United States.
In fiscal 2017, we recorded a tax provision of $24.7 million with a pretax loss of $12.6 million for the three months ended October 31, 2016. We finalized the fair value assessment of the assets acquired and liabilities assumed from Demandware, including the customer relationship asset and the customer contract asset during the third quarter of fiscal 2017. As a result of the updated valuation, we adjusted the net deferred tax liability recognized which correspondingly impacted our valuation allowance because the net deferred tax liability provided a source of additional income to support the realizability of our preexisting deferred tax assets. Theseexample, acquisitions, changes to the valuation of the acquired assets resulted in a quarterly discrete tax expense of $60.0 million. Excluding this discrete item, we had a tax benefit of $35.3 million for the quarter. The tax benefit was relatedour operating structure, or COVID-19.
to our acquisitions which changed our quarterly earnings and the recognition of our interim tax provision, resulting in a favorable adjustment to our quarterly income tax provision.
Also in fiscal 2017, we recorded a tax benefit of $182.2 million with a pretax income of $48.9 million for the nine months ended October 31, 2016. The most significant component of this tax amount was the discrete tax benefit of $205.6 million from a partial release of the valuation allowance in connection with the acquisition of Demandware. The net deferred tax liability from the acquisition of Demandware provided a source of additional income to support the realizability of our preexisting deferred tax assets and, as a result, we released a portion of our valuation allowance. The tax benefit associated with the release of the valuation allowance was partially offset by income taxes in profitable jurisdictions outside of the United States.
Liquidity and Capital Resources
At October 31, 2017,April 30, 2020, our principal sources of liquidity were cash, cash equivalents and marketable securities totaling $3.6$9.8 billion and accounts receivable of $1.5$3.1 billion. Our cash, cash equivalents and marketable securities are comprised primarily of corporate notes and obligations, U.S. treasury securities, U.S. agency obligations, asset backed securities, foreign government obligations, mortgage backed obligations, covered bonds, time deposits, money market mutual funds and municipal securities. Our revolving loan credit agreement, which provides $1.0 billion unsecured financing (“Credit Facility”) as of April 30, 2020, also serves as a source of liquidity.
NetAs of April 30, 2020, our remaining performance obligation was $29.3 billion. Our remaining performance obligation represents contracted revenue that has not yet been recognized and includes unearned revenue, which has been invoiced and is recorded on the balance sheet, and unbilled amounts that are not recorded on the balance sheet, that will be recognized as revenue in future periods.
Cash from operations could be affected by various risks and uncertainties, including, but not limited to, the effects of the COVID-19 pandemic and other risks detailed in Part II, Item 1A titled “Risk Factors.” We believe our existing cash, cash equivalents, marketable securities, cash provided by operating activities was $1.7 billion during the nine months ended October 31, 2017 and, $1.5 billion during the same period a year ago. Cash provided by operating activities has historically been affected by the amount of net income adjusted for non-cash expense items such as depreciationif necessary, our borrowing capacity under our Credit Facility and amortization; amortization of purchased intangibles from business combinations; amortization of debt discount; the expense associated with stock-based awards; gains from acquisitions of strategic investments; the timing of employeeunbilled amounts related costs including commissions and bonus payments; the timing of payments against accounts payable, accrued expenses and other current liabilities; the timing of collections from our customers,to contracted non-cancelable subscription agreements, which is our largest source of operating cash flows; the timing of business combination activity and the related integration and transaction costs; and changes in working capital accounts.
Our working capital accounts consist of accounts receivable, deferred commissions, prepaid assets and other current assets. Claims against working capital include accounts payable, accrued expenses, deferred revenue, and other current liabilities and payments related to our debt obligations. Our working capital may be impacted by factors in future periods such as billings to customers for subscriptions and support services and the subsequent collection of those billings, certain amounts and timing of which are seasonal. Our working capital in some quarters may be impacted by adverse foreign currency exchange rate movements and this impact may increase as our working capital balances increase in our foreign subsidiaries. Our billings are also influenced by new business linearity within the quarters and across quarters.
As described above in “Seasonal Nature of Deferred Revenue, Accounts Receivable and Operating Cash Flow,” our fourth quarter has historically been our strongest quarter for new business and renewals and, correspondingly, the first quarter has historically been the strongest for cash collections. The year on year compounding effect of this seasonality in both billing patterns and overall business causes both the value of invoices that we generate in the fourth quarter and cash collections in the first quarter to increase as a proportion of our total annual billings.
We generally invoice our customers for our subscription and services contracts in advance in annual installments. We typically issue renewal invoices in advance of the renewal service period, and depending on timing, the initial invoice for the subscription and services contract and the subsequent renewal invoice may occur in different quarters. Such invoice amounts are initially reflected in accounts receivable and deferred revenue, which isnot reflected on the balance sheets. The operating cash flow benefit of increased billing activity generally occurs in the subsequent quarter when we collect from our customers. As such, our first quarter is our largest collections and operating cash flow quarter.
Net cash used in investing activities was $1.4 billion during the nine months ended October 31, 2017 and $2.2 billion during the same period a year ago. The net cash used in investing activities during the nine months ended October 31, 2017 primarily related to purchases of marketable securities of approximately $1.4 billion, new office build outs and strategic and capital investments which were offset by the cash inflows for the period from the sales of marketable securities of $437.2 million.
Net cash provided by financing activities was $201.9 million during the nine months ended October 31, 2017 as compared to $737.7 million during the same period a year ago. Net cash provided by financing activities during the nine months ended October 31, 2017 consisted primarily of $484.8 million from proceeds from equity plans offset by $200.0 million repayment of the revolving credit facility and $82.9 million of principal payments on capital lease obligations.
In March 2013, we issued at par value $1.15 billion of 0.25% convertible senior notes (“0.25% Senior Notes”), due April 1, 2018, unless earlier purchased by us or converted. The Notessheet, will be convertible if during any 20 trading days during the 30 consecutive trading days of any fiscal quarter,sufficient to meet our common stock trades at a price exceeding 130% of the conversion price of $66.44 per share applicable to the Notes. The Notes are classified as a current liability on our consolidated balance sheet as of October 31, 2017 as they are due within one year. For the 20 trading days during the 30 consecutive trading days ended
October 31, 2017, our common stock traded at a price exceeding 130% of the conversion price of $66.44 per share applicable to the 0.25% Senior Notes. Accordingly, the 0.25% Senior Notes will be convertible at the holders’ option for the quarter ending January 31, 2018. As of October 31, 2017 the remaining principal balance of the 0.25% Senior Notes outstanding is $1.15 billion.
In July 2016, we entered into a credit agreement (“Revolving Loan Credit Agreement”), which provides for a $1.0 billion unsecured revolving credit facility (“Credit Facility”) that matures in July 2021. We may use any future borrowings under the Credit Facility for refinancing other indebtedness, working capital, capital expendituresexpenditure and other general corporate purposes, including permitted acquisitions. We may borrow amounts under the Credit Facility at any time during the term of the Revolving Loan Credit Agreement. As of October 31, 2017, we had no outstanding borrowings under the Credit Facility.
The Revolving Loan Credit Agreement contains certain customary affirmative and negative covenants, including a consolidated leverage ratio covenant, a consolidated interest coverage ratio covenant, a limit on our ability to incur additional indebtedness, dispose of assets, make certain acquisition transactions, pay dividends or distributions, and certain other restrictions on our activities each defined specifically in the Revolving Loan Credit Agreement. We were in compliance with the Revolving Loan Credit Agreement’s covenants as of October 31, 2017.
In July 2016, in order to partially finance the acquisition of Demandware, we entered into a $500.0 million term loan (“Term Loan”) which matures in July 2019. As of October 31, 2017, the noncurrent outstanding principal portion of the Term Loan was $500.0 million.
As of October 31, 2017, we have a total of $96.6 million in letters of credit outstanding in favor of certain landlords for office space. To date, no amounts have been drawn against the letters of credit, which renew annually and expire at various dates through December 2030.
We do not have any special purpose entities, and other than operating leases for office space and computer equipment, we do not engage in off-balance sheet financing arrangements.
Our principal commitments consist of obligations under leases for office space, co-location data center facilities and our development and test data center, as well as leases for computer equipment, software, furniture and fixtures. At October 31, 2017, the future non-cancelable minimum payments under these commitments were as follows (in thousands):
|
| | | | | | | | | | | |
| | Capital
Leases | | Operating
Leases | | Financing Obligation - Leased Facility |
| Fiscal Period: | | | | | |
| Remaining three months of Fiscal 2018 | $ | 22,974 |
| | $ | 152,711 |
| | $ | 5,433 |
|
| Fiscal 2019 | 115,830 |
| | 575,237 |
| | 21,881 |
|
| Fiscal 2020 | 201,616 |
| | 503,390 |
| | 22,325 |
|
| Fiscal 2021 | 73 |
| | 368,148 |
| | 22,770 |
|
| Fiscal 2022 | 37 |
| | 282,804 |
| | 23,214 |
|
| Thereafter | 3 |
| | 1,408,213 |
| | 210,713 |
|
| Total minimum lease payments | 340,533 |
| | $ | 3,290,503 |
| | $ | 306,336 |
|
| Less: amount representing interest | (23,384 | ) | | | | |
| Present value of capital lease obligations | $ | 317,149 |
| | | | |
The majority of our operating lease agreements provide us with the option to renew. Our future operating lease obligations would change if we exercised these options and if we entered into additional operating lease agreements as we expand our operations.
The financing obligation above represents the total obligation for our lease of approximately 445,000 rentable square feet of office space at 350 Mission St. ("350 Mission") in San Francisco, California. As of October 31, 2017, $218.8 million of the total obligation noted above was recorded to Financing obligation - leased facility, of which the current portion is included in “Accounts payable, accrued expenses and other liabilities” and the noncurrent portion is included in “Other noncurrent liabilities” on the consolidated balance sheets.
In April 2016, we entered into an agreement with a third-party provider for certain infrastructure services for a period of four years. We paid $96.0 million in connection with this agreement during the nine months ended October 31, 2017. The agreement further provides that we will pay an additional $108.0 million in fiscal 2019 and $126.0 million in fiscal 2020.
In July 2017, we entered into an agreement with a third-party to obtain the exclusive naming rights for the project formerly known as the Transbay Transit Terminal in San Francisco for a period of 25 years. We paid a non-refundable fee of
$1.0 million upon execution of the agreement and we are obligated to pay approximately $4.4 million each yeardebt repayment needs over the life of the agreement. The agreement may be terminated by us without cause upon satisfaction of certain conditions.
During the remaining three months of fiscal 2018 and in future fiscal years, we expect to continue to make additional investments in our infrastructure to scale our operations and increase productivity. We plan to upgrade or replace various internal systems to scale with the overall growth of the Company. Additionally, we expect capital expenditures to be higher in absolute dollars and remain consistent as a percentage of total revenues in future periods as a result of continued office build-outs, other leasehold improvements and data center investments.next 12 months.
In the future, we may enter into arrangements to acquire or invest in complementary businesses, or joint ventures, services and technologies, and intellectual property rights. To facilitate these acquisitions or investments, we may seek additional equity or debt financing, which may not be available on terms favorable to us or at all, which may affectimpacting our ability to complete subsequent acquisitions or investments,investments.
Cash Flows
For the three months ended April 30, 2020 and which may affect the risks2019 our cash flows were as follows (in millions):
| | | | | | | | | | | | | | | | | |
| 1 | | | Three Months Ended April 30, |
| | | | | | 2020 | | 2019 | | |
| Net cash provided by operating activities | | | | | $ | 1,859 | | | $ | 1,965 | | | |
| Net cash used in investing activities | | | | | (437) | | | (726) | | | |
| Net cash provided by financing activities | | | | | 209 | | | 207 | | | |
We believe our existing cash, cash equivalents, marketable securities,Operating Activities
The net cash provided by operating activities during the three months ended April 30, 2020 was primarily related to net income of $99 million, adjusted for non-cash items of $658 million of depreciation and if necessary,amortization, $504 million of expenses related to employee stock plans and $247 million of amortization of costs capitalized to obtain revenue contracts, and change in accounts receivable, net of $3.1 billion, offset by change in unearned revenue of $1.6 billion. Cash provided by operating activities during the three months ended April 30, 2020 was negatively impacted by providing temporary financial flexibility to customers most affected by COVID-19. In addition, our borrowing capacity underoperating cash flows were negatively impacted by the partial minimum commission guarantee as these cash outflows were not offset by corresponding cash inflows from customer receipts.
The net cash provided by operating activities during the three months ended April 30, 2019 was primarily related to net income of $392 million, adjusted for non-cash items such as $437 million related to depreciation and amortization and $343 million of expenses related to employee stock plans, and change in accounts receivable, net of $2.8 billion, offset by change in unearned revenue of $1.0 billion.
Investing Activities
The net cash used in investing activities during the three months ended April 30, 2020 was primarily related to the purchases of marketable securities of $834 million and was offset by sales and maturities of marketable securities of $564 million. In addition, we paid approximately $150 million of cash consideration related to the purchase of 450 Mission, which is reflected in capital expenditures, and approximately $103 million of cash consideration for business combinations, net of cash acquired during the three months ended April 30, 2020.
The net cash used in investing activities during the three months ended April 30, 2019 was primarily related to the purchases of marketable securities of $734 million.
Financing Activities
Net cash provided by financing activities during the three months ended April 30, 2020 consisted primarily of $258 million from proceeds from equity plans offset by principal payments on financing obligations of $48 million.
Net cash provided by financing activities during the three months ended April 30, 2019 consisted primarily of $219 million from proceeds from equity plans.
Debt
As of April 30, 2020, we had senior unsecured debt outstanding due in 2023 and 2028 with a total carrying value of $2.5 billion. In addition, we had senior secured notes outstanding related to our loan on 50 Fremont due in 2023 with a total carrying value of $192 million. We were in compliance with all debt covenants as of April 30, 2020.
We maintain a $1.0 billion Credit Facility will be sufficient to meet ourthat matures in April 2023. There were no outstanding borrowings under the Credit Facility as of April 30, 2020. We may use the proceeds of future borrowings under the Credit Facility for refinancing other indebtedness, working capital, capital expenditureexpenditures and debt repayment needsother general corporate purposes, including permitted acquisitions.
We do not have any special purpose entities and we do not engage in off-balance sheet financing arrangements.
Contractual Obligations
Our principal commitments consist of obligations under leases for office space, co-location data center facilities and our development and test data center, as well as leases for computer equipment, software, furniture and fixtures, excluding all secured and unsecured debt. At April 30, 2020, the future non-cancelable minimum payments under these commitments were approximately $4.1 billion. As of April 30, 2020, we have additional operating leases that have not yet commenced totaling $2.4 billion. These operating leases include agreements for office facilities to be constructed and will commence between fiscal year 2021 and fiscal year 2025 with lease terms of 1 to 18 years.
During fiscal 2021 and in future fiscal years, we have made and expect to continue to make additional investments in our infrastructure to scale our operations, increase productivity and enhance our security measures. We plan to upgrade or replace various internal systems to scale with our overall growth. While we continue to make investments in our infrastructure including offices, information technology and data centers to provide capacity for the growth of our business, however our strategy may change related to these investments and we may slow the pace of our investments due to COVID-19.
Other Future Obligations
In June 2020, we acquired all outstanding stock of Vlocity, Inc. (“Vlocity”), a leading provider of industry-specific cloud and mobile software for approximately $1.2 billion, which consisted of cash and the assumption of outstanding equity awards held by Vlocity employees.
In October 2019, we acquired ClickSoftware for approximately $1.4 billion. In the event that we fully integrate the operations and assets of ClickSoftware, as well as other acquired Israeli based entities into our operations, we may be subject to a potential one-time income tax charge based on an assumed Israeli statutory tax rate of 23 percent applied to the value of any transferred intangibles. Our tax provision for fiscal 2020 reflected the estimated incremental tax costs associated with the integration of ClickSoftware’s operations and assets. The timing and amount of the cash payment, if any, is uncertain and would be based upon a number of factors, including our integration plans, valuations related to intercompany transactions, the tax rate in effect at the time, potential negotiations with the taxing authorities and potential litigation.
Environmental, Social, Governance
We believe the business of business is to make the world a better place for all of our stakeholders, including our stockholders, customers, employees, partners, the planet and the communities in which we work and live. To this end, we are proud to have signed and to support the Business Roundtable’s Statement on the Purpose of a Corporation, which affirms the essential role corporations can play in improving our society, a belief that Salesforce has long held and long incorporated into our business practices, to make sure we are doing well and doing good. In addition, delivering innovative solutions to our customers is core to our mission and, as a technology company, we have developed solutions on the Salesforce Platform that enable our customers and stakeholders to manage and affect environmental, social and governance (“ESG”) matters that are meaningful to them. All of these goals align with our long-term growth strategy and financial and operational priorities.
We also believe that transparently disclosing the goals and relevant metrics related to our ESG programs will allow our stakeholders to be informed on our progress. To this end, we are working to align with the recommendations of the Financial Stability Board’s (“FSB”) Task Force on Climate-Related Financial Disclosures (“TCFD”) and of the Sustainability Accounting Standards Board (“SASB”) by the end of fiscal 2021.
A summary of the key ESG topics that are most important to our stakeholders and the success of our business, along with key goals for each topic, can be found in our Annual Report on Form 10-K for the fiscal year ended January 31, 2020, filed with the Securities and Exchange Commission (the “SEC”) on March 5, 2020. We also published our annual Stakeholder Impact Report in May 2020, which includes a table of detailed metrics and indicators that highlights the key goals of our ESG programs, provides year over year trends and references SASB, The Global Reporting Initiative (“GRI”), and the Ten Principles of the United Nations Global Compact (“UNGC”).
In the current fiscal year our ESG highlights as of April 30, 2020 include the following:
•COVID-19 Response. We mobilized to support our employees, our customers, and our communities in response to the COVID-19 pandemic in a number of ways. In addition, to ensure business continuity and to mitigate the impact on our business operations, from the beginning we performed impact assessments, contingency planning and frequent leadership updates, including with our Board of Directors. Examples of some of the actions we took include investing in our employees, customers and communities and preparing for the future, which we believe will benefit our company and our stakeholders over the long-term:
◦Protecting our workforce. In an effort to protect the safety and well-being of our employees we closed our offices around the world and provided an allowance for employees to use for equipment to advance their ability to work from home. We have provided regular communication and updates to employees, including through company-wide video calls led by senior management, with participation of Board members and guest experts in psychology and other medical fields. We launched a daily “B-Well Together” company-wide video program, that was subsequently opened to the public, also featuring physical and mental health experts and other informative and inspiring speakers. In addition, we have continued to pay all of our hourly and salaried workers and support staff and announced a 90 day no significant layoff pledge in March 2020.
◦Innovation and customer support. To support our customers we launched Salesforce Care, a suite of free rapid response solutions to help companies navigate COVID-19, including solutions designed to support response to the pandemic in the healthcare industry, solutions designed to support companies with employee and customer support during the pandemic, and other solutions designed to support social community engagement, philanthropy, and small businesses. We also launched the Tableau COVID-19 Data Hub, to help organizations around the world see and understand data about the pandemic. To further support small businesses, we created the Salesforce Care Small Business Grants program which supports small businesses as they work to replenish materials, pay salaries, or adapt their business models. We are also providing our technology to companies to support their own philanthropic efforts. For example, together with our partner
United Way, we are offering free access to Philanthropy Cloud for a limited time to companies to enable their employees to give back to their communities.
◦Supporting our communities. We have taken action to help address the Personal Protective Equipment (“PPE”) shortage facing medical personnel. During the three months ended April 30, 2020, we sourced millions of units of Personal Protective Equipment for doctors, nurses and first responders in the United States and other countries.
•Integrated philanthropy. Together with the Salesforce Foundation, a 501(c)(3) nonprofit organization, since inception we have given approximately $353 million to charitable organizations, logged more than five million employee volunteer hours around the world and provided more than 51,000 nonprofit and higher education organizations with the use of our service offerings for free or at a discount.
•Managing and recruiting a diverse and skilled workforce - We continued our investment in programs designed to enhance employee success and create a safe, healthy and engaging working environment.
◦V2MOM. We completed our annual organizational alignment exercise and released our corporate V2MOM, an internal management tool used by all employees which incorporates our vision, values, methods, obstacles, and measures for fiscal 2021. All employees are expected to complete their own annual V2MOM which aligns with the corporate V2MOM. We also have created a COVID-19 V2MOM and have taken steps to review and adjust our employee V2MOMs as a result of COVID-19.
◦Equal pay for equal work. As a result of our commitment to ensure everyone is paid equally for equal work we made $2.1 million in adjustments to employee compensation in March 2020 to address unexplained differences in pay. Through April 30, 2020, we have spent more than $12 million supporting these efforts.
•Protecting our Planet - We continued to make progress on our environmental goals, which we believe contributes to the long-term benefit of our company and our stockholders.
◦Science-Based Targets. We published progress towards achieving our science-based targets and 100 percent renewable energy commitments. In fiscal 2020, we procured electricity from renewable energy resources equivalent to 63 percent of what we used globally. We also achieved a 13 percent absolute reduction in Scope 1 and 2 emissions relative to fiscal 2019 marking progress toward our goal of achieving a 50 percent reduction by fiscal 2031. In addition, 15 percent of our targeted upstream suppliers now set their own science-based targets.
◦1t.org. In January 2020, the World Economic Forum (“WEF”) and certain partners, including Salesforce, launched 1t.org with a goal to conserve, restore and grow one trillion trees within this decade. To achieve this goal, Salesforce intends to contribute our technology to WEFs Uplink, a new digital platform to bring stakeholders together to advance the United Nations’ Sustainable Development Goals. We have also made a commitment to support and mobilize the conservation and restoration of 100 million trees over the next 12 months.decade.
New Accounting Pronouncements
See Note 1 “Summary of Business and Significant Accounting Policies” to the consolidated financial statements for our discussion about new accounting pronouncements adopted and those pending.
| |
ITEM 3. | QUANTITATIVE AND QUALITATIVE DISCLOSURES ABOUT MARKET RISK |
ITEM 3. QUANTITATIVE AND QUALITATIVE DISCLOSURES ABOUT MARKET RISK
We are exposed to financial market risks, including changes in foreign currency exchange rates, interest rates and equity investment risks. This exposure has increased due to recent financial market movements and changes to our expectations of near-term possible movements caused by the impact of COVID-19 as discussed in more detail below.
Foreign Currency Exchange Risk
We primarily conduct our business in the following locations: the United States, Europe, Canada, Asia Pacific and Japan. The expanding global scope of our business exposes us to risk of fluctuations in foreign currency markets, including emerging markets. This exposure is the result of selling in multiple currencies, growth in our international investments, including data center expansion, costs associated with third-party infrastructure providers, additional headcount in foreign countries and operating in countries where the functional currency is the local currency. Specifically, our results of operations and cash flows are subject to fluctuations in the following currencies: the Euro, British Pound Sterling, Canadian Dollar, Australian Dollar and Japanese Yen against the United States Dollar (“USD”). These exposures may change over time as business practices evolve and economic conditions change.change, including market impacts associated with COVID-19. Changes in foreign currency exchange rates could have an adverse impact on our financial results and cash flows.
OurIn fiscal 2020, we began transitioning away from our UK-centralized European revenue,structure to enable some of our local subsidiaries within Europe, including Germany and France, to invoice customers directly. This transition, which may take multiple years, would thereby enable the local subsidiaries to recognize revenues, operating expenses and significantcorresponding balance sheet accounts denominated in currencies other thanlocal currencies. With the USD primarily flow throughchange to local invoicing in some markets, we expect better alignment between our United Kingdom subsidiary,revenue and expenses in the local currency.
In January 2020, the UK exited the European Union (“EU”) (“Brexit”) and entered a transition period expected to last until the end of calendar 2020 during which has a functional currencythe UK will continue to be subject to EU rules and regulations while it negotiates the future terms of its relationship with the EU. Brexit, and the outcome of these ongoing negotiations, could adversely affect the UK, regional (including European) and worldwide economic and market conditions and could contribute to instability in
global financial and foreign exchange markets, including volatility in the value of the British Pound. This resultsPound Sterling and Euro. We have evaluated and started to implement initiatives, such as the commitment to invest resources in a two-step currency exchange process whereinDublin, Ireland that could partially mitigate the currenciesimpact Brexit could have on our operations. In the three months ended April 30, 2020 and 2019, revenues generated in Europe other thanwere approximately 21 percent and 20 percent of total revenues, respectively, of which most are recorded in our UK, Germany, France, Italy, Spain and Ireland subsidiaries. Revenues in Europe were negatively impacted by approximately $33 million in the three months ended April 30, 2020 compared to the three months ended April 30, 2019 as a result of the strengthening British Pound Sterling. We recognize that there are first converted intostill significant uncertainties surrounding the British Poundultimate resolution of Brexit negotiations, and then British Pounds are translated into USD forwe will continue to monitor any changes that may arise and assess their potential impact on our Consolidated Financial Statements. As an example, costs incurred in France are translated from the Euro to the British Pound and then into the USD. Our statements of operations and balance sheet accounts are also impacted by the re-measurement of non-functional currency transactions such as USD denominated intercompany loans, cash accounts held by our overseas subsidiaries, accounts receivable denominated in foreign currencies and deferred revenue and accounts payable denominated in foreign currencies.business.
Foreign Currency Transaction Risk
Our foreign currency exposures typically arise from selling annual and multi-year subscriptions in multiple currencies, customer account receivables,accounts receivable, intercompany transfer pricing arrangements and other intercompany transactions. Our foreign currency management objective is to minimize the effect of fluctuations in foreign exchange rates on selected assets or liabilities without exposing us to additional risk associated with transactions that could be regarded as speculative.
We pursue our objective by utilizing foreign currency forward contracts to offset foreign exchange risk. Our foreign currency forward contracts are generally short-term in duration. We neither use these foreign currency forward contracts for trading purposes nor do we currently designate these forward contracts as hedging instruments pursuant to Accounting Standards Codification 815 (“ASC 815”), Derivatives and Hedging. Accordingly, we record the fair values of these contracts as of the end of our reporting period to our condensed consolidated balance sheets with changes in fair values recorded to our condensed consolidated statements of operations. Given the short duration of the forward contracts, the amount recorded is not significant. Our ultimate realized gain or loss with respect to foreign currency exposures will generally depend on the size and type of cross-currency transactions that we enter into, the currency exchange rates associated with these exposures and changes in those rates, the net realized gain or loss on our foreign currency forward contracts and other factors.
Foreign Currency Translation Risk
Fluctuations in foreign currencies impact the amount of total assets, liabilities, revenues, operating expenses and cash flows that we report for our foreign subsidiaries upon the translation of these amounts into USD. AsAlthough the USD fluctuated against certain international currencies over the past several months, the amounts of revenue and deferred revenueremaining performance obligation that we reported in USD for foreign subsidiaries that transact in international currencies were slightly higher relativesimilar to what we would have reported during the three months ended April 30, 2019 using a constant currency rate.
Interest Rate Sensitivity
We had cash, cash equivalents and marketable securities totaling $3.6$9.8 billion at October 31, 2017.as of April 30, 2020. This amount was invested primarily in money market funds, time deposits, corporate notes and bonds, government securities and other debt securities with credit ratings of at least BBB or better. The cash, cash equivalents and marketable securities are held for general corporate purposes, including possible acquisitions of, or investments in, complementary businesses, services or technologies, working capital and capital expenditures. Our investments are made for capital preservation purposes. We do not enter into investments for trading or speculative purposes.
Our cash equivalents and our portfolio of marketable securities are subject to market risk due to changes in interest rates. Fixed rate securities may have their market value adversely impacted due to a rise in interest rates, while floating rate securities may produce less income than expected if interest rates fall. Due in part to these factors, our future investment income may fall short of expectation due to changes in interest rates or we may suffer losses in principal if we are forced to sell securities that decline in market value due to changes in interest rates. However, because we classify our debt securities as “available for sale,” no gains or losses are recognized due to changes in interest rates unless such securities are sold prior to maturity or declines in fair value are determineddue to be other-than-temporary. expected credit losses.
Our fixed-income portfolio is also subject to interest rate risk.
An immediate increase or decrease in interest rates of 100-basis100 basis points at October 31, 2017April 30, 2020 could result in a $31.5$37 million market value reduction or increase of the same amount. This estimate is based on a sensitivity model that measures market
value changes when changes in interest rates occur. Fluctuations in the value of our investment securities caused by a change in interest rates (gains or losses on the carrying value) are recorded in other comprehensive income, and are realized only if we sell the underlying securities.
At January 31, 2017,2020, we had cash, cash equivalents and marketable securities totaling $2.2$7.9 billion. The fixed-income portfolio was also subject to interest rate risk. Changes in interest rates of 100-basis100 basis points would have resulted in market value changes of $13.0$38 million.
Market Risk and Market Interest Risk
We deposit our cash with multiple financial institutions.
In March 2013,addition, we issued at par value $1.15 billion of 0.25% convertible senior notes (“Notes”) due April 1, 2018. Holders of the Notes may convert the Notes priormaintain debt obligations that are subject to maturity upon the occurrence of certain circumstances. Upon conversion, we would pay the holder an amount of cash equal to the principal amounts of the Notes. The amounts in excess of the principal amounts, if any, may be paid in cash or stock at our option. Concurrent with the issuance of the Notes, we entered into separate note hedging transactions and the sale of warrants. These separate transactions were completed to reduce the potential economic dilution from the conversion of the Notes.market interest risk, as follows (in millions):
| | | | | | | | | | | | | | | | | | | | | | | | | | |
| Instrument | | Maturity date | | Principal Outstanding as of April 30, 2020 | | Interest Terms | | Effective interest rate for the three months ended April 30, 2020 |
| | | | | | | | |
| 2023 Senior Notes | | April 2023 | | $ | 1,000 | | | Fixed | | 3.26% |
| 2028 Senior Notes | | April 2028 | | 1,500 | | Fixed | | 3.70% |
| | | | | | | | |
| Loan assumed on 50 Fremont | | June 2023 | | 193 | | Fixed | | 3.75% |
| Revolving credit facility | | April 2023 | | 0 | | Floating | | N/A |
The Notes have a fixed annual interest rate of 0.25% and therefore, we do not have economic interest rate exposure on the Notes. However, the value of the Notes is exposed to interest rate risk. Generally, the fair value ofborrowings under our fixed interest rate Notes will increase as interest rates fall and decrease as interest rates rise. In addition, the fair value of our Notes is affected by our stock price. The principal balance of our Notes was $1.15 billion as of October 31, 2017. The total estimated fair value of our Notes at October 31, 2017 was $1.8 billion. The fair value was determined based on the closing trading price per $100 of the Notes as of the last day of trading for the third quarter of fiscal 2018, which was $102.34.
In July 2016, we amended our credit agreement (“Revolving Loan Credit Agreement”) to provide for a $1.0 billion unsecured revolving credit facility (“Credit Facility”) that matures in July 2021.
The Borrowings under the Credit Facility bear interest, at our option, at a base rate plus a spread of 0.00% to 0.75%0.375% or an adjusted LIBOR rate plus a spread of 1.00%0.75% to 1.75%1.375%, in each case with such spread being determined based on our consolidated leverage ratiocredit rating. Our Credit Facility allows for the preceding four fiscal quarter period.LIBOR rate to be phased-out and replaced with the Secured Overnight Financing Rate and therefore we do not anticipate a material impact by the expected upcoming LIBOR transition. Regardless of what amounts, if any, are outstanding under the revolving credit facility,Credit Facility, we are also obligated to pay an ongoing commitment fee on undrawn amounts at a rate of 0.125%0.05% to 0.25%0.175%, with such rate being based on our consolidated leverage ratio for the preceding four fiscal quarter period,credit rating, payable in arrears quarterly. As of October 31, 2017April 30, 2020, there was no outstanding borrowing amount under the Credit Facility.
In February 2015, we assumed a $200.0 million loan with the acquisition of 50 Fremont (“Loan”). The Loan bears an interest rate of 3.75% per annum and is due in June 2023. For the remainder of fiscal 2018, the Loan requires interest only payments. Beginning in fiscal 2019, principal and interest payments are required, with the remaining principal due at maturity. The Loan can be prepaid at any time subject to a yield maintenance fee. The agreement governing the Loan contains certain customary affirmative and negative covenants that we were in compliance with as of October 31, 2017.
In July 2016, we entered into a $500.0 million term loan (“Term Loan”) which matures in July 2019 and bears interest at our option, at either a base rate plus a spread of 0.00% to 0.75% or an adjusted LIBOR rate plus a spread of 1.00% to 1.75%, in each case with such spread being determined based on the Company’s consolidated leverage ratio for the preceding four fiscal quarter period. We entered into the Term Loan for purposes of partially funding the acquisition of Demandware. Interest is due and payable in arrears quarterly for loans bearing interest at a rate based on the base rate and at the end of an interest period in the case of loans bearing interest at the adjusted LIBOR rate.
By entering into the Term Loan, we have assumed risks associated with variable interest rates based upon a variable base rate or LIBOR. The weighted average interest rate on the Term Loan was 2.2% as of October 31, 2017. Changes in the overall level of interest rates affect the interest expense that we recognize in our statements of operations.
The bank counterparties to our derivative contracts potentially expose us to credit-related losses in the event of their nonperformance. To mitigate that risk, we only contract with counterparties who meet the minimum requirements under our counterparty risk assessment process. We monitor ratings, credit spreads and potential downgrades on at least a quarterly basis. Based on our on-goingongoing assessment of counterparty risk, we adjust our exposure to various counterparties. We generally enter into master netting arrangements, which reduce credit risk by permitting net settlement of transactions with the same counterparty. However, we do not have any master netting arrangements in place with collateral features.
We have an investment portfolio that includes strategic investments in publicprivately held and privately heldpublicly traded companies, which range from early-stage companies to more mature companies with established revenue streamsboth domestically and business models. Our portfolio consists of investments in over 200 privately held companies and three public companies,internationally. We primarily comprised of independent software vendors and system integrators. Our investments in these companies range from $0.2 million to over $90.0 million, with 16 investments individually equal to or in excess of approximately $10.0 million.
We invest in early-to-late stage enterprise cloud companies, for strategic reasonstechnology startups and system integrators to support key business initiativesadvance and expand our ecosystem. As the enterprise cloud computing ecosystem continues to growmature and technologies change, our ecosystem of partnersinvestment strategy and accelerate the adoption of cloud technologies. We invest in both domestic and international companies and currently holdcorresponding investment opportunities have expanded to include investments in all of our regions: the Americas, Europe, and Asia Pacific.companies concurrently with their initial public offerings, as well as larger capital investments in late stage companies. We plan to continue to invest in these types of strategic investments, including in companies representing targeted geographies and targeted business and technological initiatives, as opportunities arise that we find attractiveattractive.
As of April 30, 2020, our portfolio consisted of investments in over 270 companies, with capital investments ranging from less than $0.3 million to approximately $325 million, and 33 investments with carrying values individually equal to or in excess of approximately $10 million.
The primary purposefollowing table sets forth additional information regarding active investments within our strategic investment portfolio as of April 30, 2020 and excludes exited investments (in millions):
| | | | | | | | | | | | | | | | | | | | | | | | | | |
| Investment Type | | Capital Invested | | Unrealized Gains (Cumulative) | | Unrealized Losses (Cumulative) | | Carrying Value as of April 30, 2020 |
| Publicly held equity securities | | $ | 19 | | | $ | 13 | | | $ | 0 | | | $ | 32 | |
| Privately held equity securities | | 1,602 | | | 465 | | | (243) | | | 1,824 | |
| Total equity securities | | $ | 1,621 | | | $ | 478 | | | $ | (243) | | | $ | 1,856 | |
We anticipate additional volatility to our condensed consolidated statements of operations due to changes in market prices, observable price changes and impairments to our investments. These changes could be material based on market conditions and events. While historically our investment portfolio has had a positive impact on our financial results, that may not be true for future periods, particularly in periods of significant market fluctuations that affect our equity securities within our strategic investments portfolio. Volatility in the global market conditions, including recent and ongoing volatility related to the impacts of COVID-19 and related public health measures, may impact our investment portfolio and our financial results may fluctuate from historical results and expectations.
Our investments in privately held securities are in various classes of equity which may have different rights and preferences. The particular securities we hold, and their rights and preferences relative to those of other securities within the capital structure, may impact the magnitude by which our investment value moves in relation to movement of the total enterprise value of the company. As a result, our investment value in a specific company may move by more or less than any change in value of that overall company. An immediate decrease of ten percent in enterprise value of our significant publicly traded and privately held equity securities held as of April 30, 2020, which represents 56% of the strategic investment portfolio, could result in a $90 million reduction in the value of our investment portfolio. Fluctuations in the value of our privately held equity investments are only recorded when there is to create an ecosystemobservable transaction for a same or similar investment of enterprise cloud companies and accelerate the growthsame
issuer or in the event of impairment.
We continually evaluate our investments in privately held and publicly traded companies, post public offering, for exit strategies. Ourcompanies. In certain cases, our ability to sell these investments may be impacted by contractual obligations to hold the securities for a set period of time after a public offering. Currently, onenone of our publicly held investments isare subject to such a contractual obligation, which expires inobligation.
In addition, the first quarter of fiscal 2019.
Our strategic investments in privately held companies are primarily in preferred stock of the respective investees and therefore provide us with liquidation preferences in the event there are certain liquidation events. When our ownership interests are less than 20 percent and we do not have the ability to exert significant influence, we account for investments in non-marketable debt at their estimated fair value and equity securities of the privately held companies using the cost method of accounting. Otherwise, we account for the investments using the equity method of accounting.
As of October 31, 2017 and January 31, 2017 the carrying value of our investments in privately held companies was $570.1 million and $526.0 million, respectively. The estimated fair value of our investments in privately held companies was $803.9 million and $758.3 million as of October 31, 2017 and January 31, 2017, respectively. The financial success of our investment in any company is typically dependent on a liquidity event, such as a public offering, acquisition or other favorable market event reflecting appreciation to the cost of our initial investment. If we determine that any of our investments in such companies have experienced a decline in fair value, we may be required to record an impairment that is other-than-temporary, which could be material. We have in the past recorded other than temporary impairments or written off the full value of specific investments. Similar situations could occur in the future and negatively impact our financial results. All of our investments, particularly those in privately held companies, are therefore subject to a risk of partial or total loss of investmentinvested capital. The rapid spread of COVID-19 and its reverberating effects on the global economy have caused disruptions to the industry and to financial markets that are inhibiting and may continue to inhibit the ability of investee companies to complete a liquidity event. In severe cases, our investee companies may no longer be able to operate or could experience reduced profitability, delayed public offerings, reduced ability to raise favorable rounds of financing, or acquisitions at less favorable terms. These outcomes could materially adversely affect the Company’s financial position, results of operations, and cash flows.
| |
ITEM 4. | CONTROLS AND PROCEDURES |
ITEM 4. CONTROLS AND PROCEDURES
(a) Evaluation of Disclosure Controls and Procedures
Under the supervision and with the participation of our management, including our principal executive officer and principal financial officer, we conducted an evaluation of the effectiveness of the design and operation of our disclosure controls and procedures, as defined in Rules 13a-15(e) and 15d-15(e) under the Securities Exchange Act of 1934, as amended (the “Exchange Act”), as of the end of the period covered by this report.
In designing and evaluating our disclosure controls and procedures, management recognizes that any disclosure controls and procedures, no matter how well designed and operated, can provide only reasonable assurance of achieving the desired control objectives. In addition, the design of disclosure controls and procedures must reflect the fact that there are resource constraints and that management is required to apply its judgment in evaluating the benefits of possible controls and procedures relative to their costs.
Based on management’s evaluation, our principal executive officer and principal financial officer concluded that our disclosure controls and procedures are designed to, and are effective to, provide assurance at a reasonable level that the information we are required to disclose in reports that we file or submit under the Exchange Act is recorded, processed, summarized and reported within the time periods specified in Securities and Exchange Commission rules and forms, and that such information is accumulated and communicated to our management, including our chief executive officer and chief financial officer, as appropriate, to allow timely decisions regarding required disclosures.
As a result of COVID-19, our employees globally shifted to working primarily from home beginning in March 2020. While pre-existing controls were not specifically designed to operate in our current work-from-home operating environment, we believe that our disclosure controls and procedures can be executed effectively and continue to be effective.
(b) Management’s Report on Internal Control Over Financial Reporting
Under the supervision and with the participation of our management, including our principal executive officerofficers and principal financial officer, we conducted an evaluation of any changes in our internal control over financial reporting (as such term is defined in Rules 13a-15(f) and 15d-15(f) under the Exchange Act) that occurred during our most recently completed fiscal quarter. Based on that evaluation, our principal executive officerofficers and principal financial officer concluded that there has not been any material change in our internal control over financial reporting during the quarter covered by this report that materially affected, or is reasonably likely to materially affect, our internal control over financial reporting. There were no significant changes to our internal control over financial reporting.
As a result of COVID-19, and as described above, we took precautionary actions to re-evaluate and refine our financial reporting process to provide reasonable assurance that we could report our financial results accurately and timely. We believe that our internal control over financial reporting can be executed effectively and continue to be effective.
PART II. OTHER INFORMATION
| |
ITEM 1. | ITEM 1. LEGAL PROCEEDINGS |
In the ordinary course of business, we are or may be involved in various legal or regulatory proceedings, claims, or purported class actions related to alleged infringement of third-party patents and other intellectual property rights, or alleged violation of commercial, corporate and securities, labor and employment, wage and hour, or other laws or regulations. We have been, and may in the future be put on notice and/or sued by third parties for alleged infringement of their proprietary rights, including patent infringement.
We evaluate all claims and lawsuits with respect to their potential merits, our potential defenses and counterclaims, settlement or litigation potential and the expected effect on us. Our technologies may be subject to injunction if they are found to infringe the rights of a third-party.third party. In addition, many of our subscription agreements require us to indemnify our customers for third-party intellectual property infringement claims, which could increase the cost to us of an adverse ruling on such a claim.
The outcome of any claims or litigation, regardless of the merits, is inherently uncertain. Any claims and other lawsuits, and the disposition of such claims and lawsuits, whether through settlement or litigation, could be time-consuming and expensive to resolve, divert our attention from executing our business plan, result in efforts to enjoin our activities, lead to attempts by third parties to seek similar claims and, in the case of intellectual property claims, require us to change our technology, change our business practices, pay monetary damages or enter into short- or long-term royalty or licensing agreements.
In general, the resolution of a legal matter could prevent us from offering our service to others, could be material to our financial condition or cash flows, or both, or could otherwise adversely affect our operating results.
We make a provision for a liability relating to legal matters when it is both probable that a liability has been incurred and the amount of the loss can be reasonably estimated. These provisions are reviewed at least quarterly and adjusted to reflect the impacts of negotiations, estimated settlements, legal rulings, advice of legal counsel and otherFor more information and events pertaining to a particular matter. The outcomes of ourregarding legal proceedings, and other contingencies are, however, inherently unpredictable and subject to significant uncertainties. As a result, we may not be able to reasonably estimate the amount or range of possible losses in excess of any amounts accrued, including losses that could arise as a result of application of non-monetary remedies, with respect to any contingencies, and our estimates may not prove to be accurate.
In our opinion, resolution of all current matters is not expected to have a material adverse impact on our consolidated results of operations, cash flows or financial position. However, depending on the nature and timing of a given dispute or other contingency, an unfavorable resolution could materially affect our current or future results of operations or cash flows, or both, in a particular quarter.
See alsosee Note 14 “Legal Proceedings and Claims” ofProceedings” to the Notes to Consolidated Financial Statements includedcondensed consolidated financial statements in Part I, Item 1 of this Quarterly Report on Form 10-Q, which is incorporated herein by reference.Part I.
ITEM 1A. RISK FACTORS
The risks and uncertainties described below are not the only ones facing us. Other events that we do not currently anticipate or that we currently deem immaterial also may affect our business, financial condition, results of operations, cash flows and financial condition.the trading price of our common stock.
Risks Related to Our Business and Industry
The effects of the COVID-19 pandemic and related public health measures have materially affected how we and our customers are operating our businesses, and have materially affected our operating results; the duration and extent to which this will impact our future results of operations remains uncertain.
The COVID-19 pandemic and related public health measures have materially affected how we and our customers are operating our businesses, and have materially affected our operating results; the duration and extent to which this will impact our future results of operations remain uncertain. In response to the COVID-19 pandemic, we have cancelled or delayed some customer events, and shifted many of them, including Dreamforce, World Tours, Connections, Basecamps and Salesforce.org’s Higher Ed Summit, to virtual-only experiences. We may deem it advisable to similarly alter, postpone or cancel entirely additional customer, employee and industry events in the future. Our shift to creating virtual customer, employee and industry events may not be successful, and we may not be able to showcase our products as well as or generate the same customer interest, opportunities and leads through virtual events as we have historically done through in-person events. If we attempt to re-introduce large in-person events, we may not be able to do so successfully and our customers may not be able or willing to attend them.
We also temporarily closed all Salesforce offices globally. This global work-from-home operating environment has caused strain for, and has adversely impacted productivity of, certain employees, and these conditions may persist and harm our business, including our future sales and operating results. Additionally, our efforts to re-open our offices safely may not be successful, could expose our personnel to health risks, and will involve additional financial burdens. The COVID-19 epidemic may have long-term effects on the nature of the office environment and remote working, and this may present operational challenges that may adversely affect our business.
Moreover, the conditions caused by the COVID-19 have affected customer IT spending and have and may continue to adversely affect our customers’ ability or willingness to purchase our enterprise cloud computing services. These conditions have delayed and may continue to delay prospective customers’ purchasing decisions, and have reduced and may continue to reduce the value or duration of our customers’ subscription contracts, and affect attrition rates, all of which could adversely affect our future sales and operating results.
Our operations have also begun to be negatively affected by a range of external factors related to the COVID-19 pandemic that are not within our control. Authorities throughout the world have implemented numerous preventative measures to contain or mitigate the outbreak of the virus, such as travel bans and restrictions, limitations on business activity, quarantines, work-from-home directives and shelter-in-place orders. These measures have caused, and are continuing to cause, business slowdowns or shutdowns in affected areas, both regionally and worldwide, which have impacted our business and results of operations. For example, these measures and related economic effects contributed to certain customers’ reluctance or inability to submit payments to us, and adversely impacted the effectiveness of outsourced service providers we use to collect payments, and these conditions may persist or worsen. The extent and duration of these measures could also impact our ability to address cybersecurity incidents, have resulted in increased internet demand which could cause access issues, could affect our ability to develop and support products and services, and could cause issues with access to data centers. As we continue to monitor the situation and public health guidance, we may adjust our current policies and practices, and existing and new precautionary measures could negatively affect our operations.
The extent of the impact of COVID-19 on our operational and financial performance will depend on certain developments, including the duration and spread of the outbreak, impact on our customers and our sales cycles, our ability to generate new business leads, impact on our customer, employee and industry events, and effect on our vendors, all of which are uncertain and cannot be predicted. At this point, the extent to which the pandemic may impact our financial condition or results of operations, including our long-range plan, is uncertain. Due to our subscription-based business model, the effect of the COVID-19 pandemic may not be fully reflected in our results of operations until future periods. If the COVID-19 pandemic has a substantial impact on our employees’, partners’ or customers’ business and productivity, our results of operations and overall financial performance may be harmed. The global macroeconomic effects of the COVID-19 pandemic and related impacts on our customers’ business operations and their demand for our products and services may persist for an indefinite period, even after the COVID-19 pandemic has subsided. In addition, the effects of the COVID-19 pandemic may heighten many of the other risks described in this ‘‘Risk Factors’’ section.
If our security measures or those of our third-party data center hosting facilities, cloud computing platform providers or third-party service partners, or the underlying infrastructure of the Internet are breached, and unauthorized access is obtained to a customer’s data, our data or our Information Technology ("IT")IT systems, or authorized access is blocked or disabled, our services may be perceived as not being secure, customers may curtail or stop using our services, and we may incur significant reputational harm, legal and financial exposure and liabilities.liabilities, or a negative financial impact.
Our services involve the storage and transmission of our customers’ and our customers' customers'customers’ customers’ proprietary and other sensitive data, including financial, informationhealth and other personally identifiablepersonal information. Security breaches could expose us to a risk of loss or inappropriate use of this information, or the denial of access to this information, any of which could result in litigation and possible liability. While we have security measures in place theyto protect our customers and our customers’ customers' data, our services and underlying infrastructure may in the future be materially breached or compromised as a result of the following:
•third-party action, including intentional misconduct by computer hackers, employee error, malfeasance or otherwise and result in someone obtaining unauthorized access to, or denying authorized access to our IT systems, our customers’ data or our data, including our intellectual property and other confidential business information. Additionally, third parties may attemptattempts to fraudulently induce employees or customers into disclosing sensitive information such as user names, passwords or other information in order to gain access to our customers’ data or IT systems, or our data or our IT systems;
•efforts by individuals or groups of hackers and sophisticated organizations, including state-sponsored organizations or nation-states;
•cyber-attacks on our internally built infrastructure on which many of our service offerings operate;
•vulnerabilities resulting from enhancements and updates to our existing service offerings;
•vulnerabilities in the products or components across the broad ecosystem that our services operate in conjunction with and are dependent on;
•vulnerabilities existing within new technologies and infrastructures, including those from acquired companies;
•attacks on, or vulnerabilities in, the many different underlying networks and services that power the Internet that our products depend on, most of which are not under our control or the control of our vendors, partners, or customers; and
•employee or contractor errors or intentional acts that compromise our security systems. Because
In addition, the changes in our work environment as a result of the COVID-19 pandemic could adversely affect our security measures, as well as our ability to address and respond to incidents quickly. These risks are mitigated, to the extent possible, by our ability to maintain and improve business and data governance policies, enhanced processes and internal security controls, including our ability to escalate and respond to known and potential risks. Our Board of Directors, Audit Committee and executive management are regularly briefed on our cyber-security policies and practices and ongoing efforts to improve security, as well as periodic updates on cyber-security events. Although we have developed systems and processes designed to protect our customers’ and our customers’ customers’ proprietary and other sensitive data, we can provide no assurances that such measures will provide absolute security or that a material breach will not occur. For example, our ability to mitigate these risks may be impacted by the following:
•frequent changes to, and growth in complexity of, the techniques used to breach, obtain unauthorized access to, or to sabotage IT systems change frequently and infrastructure, which are generally are not recognized until launched against a target, we may beand could result in our being unable to anticipate these techniques or to implement adequate preventative measures. In addition,measures to prevent such techniques;
•the continued evolution of our internal IT systems as we early adopt new technologies and new ways of sharing data and communicating internally and with partners and customers, which increases the complexity of our IT systems;
•authorization by our customers may authorizeto third-party technology providers to access their customer data, and some ofwhich may lead to our customers may not have adequate security measures in placecustomers' inability to protect their data that is stored on our servers. Because we do notservers; and
•our limited control over our customers or third-party technology providers, or the processing of such data by third-party technology providers, we cannot ensurewhich may not allow us to maintain the integrity or security of such transmissions or processing. Malicious third
In the normal course of business, we are and have been the target of malicious cyber-attack attempts and have experienced other security incidents. To date, such identified security events have not been material or significant to us, including to our reputation or business operations, or had a material financial impact, but there can be no assurance that future cyberattacks will not be material or significant.
A security breach or incident could result in unauthorized parties may also conduct attacks designedobtaining access to, temporarily deny customersor the denial of authorized access to, our services. AnyIT systems or data, or our customers' systems or data, including intellectual property and proprietary, sensitive, or other confidential information. A security breach could also result in a loss of confidence in the security of our services, damage our reputation, negatively impact our future sales, disrupt our business and lead to increases in insurance premiums and legal and financial exposure and liability. Finally, the detection, prevention and remediation of known or potential security vulnerabilities, including those arising from third-party hardware or software, may result in additional financial burdens due to additional direct and indirect costs, such as additional infrastructure capacity spending to mitigate any system degradation and the reallocation of resources from development activities.
Defects or disruptions in our services could diminish demand for our services and subject us to substantial liability.
Because our services are complex and incorporate a variety of hardware, proprietary software and third-party software, our services may have errors or defects that could result in unanticipated downtime for our subscribers and harm to our reputation and our business. Cloud services frequently contain undetected errors when first introduced or when new versions or enhancements are released. We have from time to time found defects in, and experienced disruptions to, our services and new defects or disruptions may
occur in the future. Such defects could also create vulnerabilities that could inadvertently permit access to protected customer data. For example, in fiscal 2020, we experienced a significant service disruption due to an internally deployed software update that had an unintended impact on our services for certain customers. As a precaution, we immediately disabled access to our services for potentially impacted customers while we worked to remediate the issue. Upon completion of the evaluation of the cause and impact of the disruption, we determined it did not materially affect our business, reputation or financial results.
In addition, our customers may use our services in unanticipated ways that may cause a disruption in services for other customers attempting to access their data. As we acquire companies, we may encounter difficulty in incorporating the acquired technologies into our services and in augmenting the technologies to meet the quality standards that are consistent with our brand and reputation. As a result, our services may have errors or defects resulting from the complexities of integrating acquisitions.
Since our customers use our services for important aspects of their business, any errors, defects, disruptions in service or other performance problems could hurt our reputation and may damage our customers’ businesses. As a result, customers could elect to not renew our services or delay or withhold payment to us. We could also lose future sales or customers may make warranty or other claims against us, which could result in an increase in our allowance for doubtful accounts, an increase in collection cycles for accounts receivable or the expense and risk of litigation.
InterruptionsAny interruptions or delays in services from third-parties,third parties, including data center hosting facilities, cloud computing platform providers orand other hardware and software vendors, or from our inability to adequately plan for and manage service interruptions or infrastructure capacity requirements, could impair the delivery of our services and harm our business.
We currently serve our customers from third-party data center hosting facilities and cloud computing platform providers located in the United States and other countries. We also rely on computer hardware purchased or leased from, software licensed from, and cloud computing platforms provided by, third parties in order to offer our services, including database software, hardware and data from a variety of vendors. Any disruption or damage to, or failure of our systems generally, including the systems of our third-party platform providers, could result in interruptions in our services. We have from time to time experienced interruptions in our services and such interruptions may occur in the future. In addition, the ongoing COVID-19 pandemic has and may continue to disrupt the supply chain of hardware needed to maintain these third-party systems or to run our business. As we increase our reliance on these third-party systems, our exposure to damage from service interruptions may increase. Interruptions in our services may reduce our revenue, cause us to issue credits or pay penalties, cause customers to make warranty or other claims against us or to terminate their subscriptions and adversely affect our attrition rates and our ability to attract new customers, all of which would reduce our revenue. Our business would also be harmed if our customers and potential customers believe our services are unreliable.
We use a range of disaster recovery and business continuity arrangements. For many of our offerings, our production environment and customers’ data are replicated in near real-time in a separate facility located elsewhere. Certain offerings, including some offerings of companies added through acquisitions, may be served through alternate facilities or arrangements. We do not control the operation of any of these facilities, and they may be vulnerable to damage or interruption from
earthquakes, floods, fires, power loss, telecommunications failures and similar events. They may also be subject to break-ins, sabotage, intentional acts of vandalism and similar misconduct, as well as local administrative actions, changes to legal or permitting requirements and litigation to stop, limit or delay operation. Despite precautions taken at these facilities, such as disaster recovery and business continuity arrangements, the occurrence of a natural disaster or pandemic (including the COVID-19 pandemic) or an act of terrorism, a decision to close the facilities without adequate notice or other unanticipated problems at these facilities could result in lengthy interruptions in our services.
These hardware, software, data and cloud computing platforms may not continue to be available at reasonable prices, on commercially reasonable terms or at all. Any loss of the right to use any of these hardware, software or cloud computing platforms could significantly increase our expenses and otherwise result in delays in the provisioning of our services until equivalent technology is either developed by us, or, if available, is identified, obtained through purchase or license and integrated into our services.
If we do not accurately plan for our infrastructure capacity requirements and we experience significant strains on our data center capacity, our customers could experience performance degradation or service outages that may subject us to financial liabilities, result in customer losses and harm our reputation and business. WhenAs we add data centers and add capacity and continue to move to cloud computing platform providers, we may move or transfer our data and our customers’ data. Despite precautions taken during this process, any unsuccessful data transfers may impair the delivery of our services, which may damage our business.
Privacy concerns and laws such as the California Consumer Privacy Act and the European Union’s General Data Protection Regulation, evolving regulation of cloud computing, cross-border data transfer restrictions and other domestic or foreign regulations may limit the use and adoption of our services and adversely affect our business.
Regulation related to the provision of services over the Internet is evolving, as federal, state and foreign governments continue to adopt new, or modify existing, laws and regulations addressing data privacy, cybersecurity, data protection, data sovereignty and the collection, processing, storage, transfer and use of data.data, generally. In some cases, new data privacy laws and regulations, such as the European Union’s ("EU") General Data Protection Regulation ("GDPR") that takestook effect in May 2018, and an amended Act on the Protection of Personal Information in Japan, impose new obligations directly on Salesforce as both a data controller and a data processor, as well as on many of our customers. TheseIn addition, new laws may require us to make changes to our services to enable Salesforce and/or our customers to meet the new legal requirements, and may also increase our potential liability exposure through higher potential penalties for non-compliance. Further,domestic data privacy laws, such as the European Union’sCalifornia Consumer Privacy Act (“CCPA”), which took effect in January 2020, similarly impose new obligations on
us and many of our customers, potentially as both businesses and service providers. As the CCPA continues to evolve and various states introduce similar proposals, we and our customers could be exposed to additional regulatory burdens. Further, laws and legislative proposals such as the EU’s proposed e-Privacy Regulation are increasingly aimed at the use of personal information for marketing purposes, and the tracking of individuals’ online activities.
Although we monitor the regulatory environment and have invested in addressing these developments, such as GDPR and CCPA readiness, these laws may require us to make additional changes to our practices and services to enable us or our customers to meet the new legal requirements, and may also increase our potential liability exposure through new or higher potential penalties for non-compliance, including as a result of penalties, fines and lawsuits related to data breaches. These new or proposed laws and regulations are subject to differing interpretations and may be inconsistent among jurisdictions. These and other requirements could reduce demand for our services, require us to take on more onerous obligations in our contracts, restrict our ability to store, transfer and process data or, in some cases, impact our ability or our customers' ability to offer our services in certain locations, or our customers' ability to deploy our solutions, to reach current and prospective customers, or to derive insights from customer data globally. For example, ongoing legal challenges in Europe to the mechanisms allowing companies to transfer personal data from the European Economic Area to the United States could result in further limitations on the ability to transfer data across borders, particularly if governments are unable or unwilling to reach new or maintain existing agreements that support cross-border data transfers, such as the EU-U.S. and Swiss-U.S. Privacy Shield framework. Additionally, certain countries have passed or are considering passing laws requiring local data residency. By way of further example, statutory damages available through a private right of action for certain data breaches under CCPA, and potentially other states' laws, may increase our and our customers' potential liability and the demands our customers place on us. The costs of compliance with, and other burdens imposed by, privacy laws, regulations and standards may limit the use and adoption of our services, reduce overall demand for our services, make it more difficult to meet expectations from or commitments to customers and our customers' customers, lead to significant fines, penalties or liabilities for noncompliance, impact our reputation, or slow the pace at which we close sales transactions, any of which could harm our business.
In addition to government activity, privacy advocacy and other industry groups have established or may establish new self-regulatory standards that may place additional burdens on our ability to provide our services globally. Our customers expect us to meet voluntary certification and other standards established by third parties, such as TRUSTe. If we are unable to maintain these certifications or meet these standards, it could adversely affect our ability to provide our solutions to certain customers and could harm our business.
Furthermore, the uncertain and shifting regulatory environment and trust climate, particularly in regard to COVID-19-related data processing, may raise concerns regarding data privacy and cybersecurity, which may cause our customers or our customers’ customers to resist providing the data necessary to allow our customers to use our services effectively. In addition, new products we develop in connection with changing events, such as in response to the COVID-19 pandemic, may expose us to liability or regulatory risk. Even the perception that the privacy and security of personal information isare not satisfactorily protected or doesdo not meet regulatory requirements could inhibit sales of our products or services and could limit adoption of our cloud-based solutions.
Volatile and significantly weakened global economic conditions have in the past and may in the future adversely affect our industry, business and results of operations.
Our abilityoverall performance depends in part on worldwide economic and geopolitical conditions. The United States and other key international economies have experienced significant economic and market downturns in connection with the COVID-19 pandemic, and are likely to deliver our servicesexperience additional cyclical downturns from time to time in which economic activity is dependent on the development and maintenance of the infrastructure of the Internetimpacted by third parties.
The Internet’s infrastructure is comprised of many different networks and services that are highly fragmented and distributed by design. This infrastructure is run by a series of independent third-party organizations that work together to provide the infrastructure and supporting services of the Internet under the governance of the Internet Corporationfalling demand for Assigned Numbers and Names (ICANN) and the Internet Assigned Numbers Authority (IANA), now under the stewardship of ICANN.
The Internet has experienced a variety of outagesgoods and services, restricted credit, poor liquidity, reduced corporate profitability, volatility in credit, equity and foreign exchange markets, bankruptcies and overall uncertainty with respect to the economy. These economic conditions can arise suddenly, as did the conditions associated with the COVID-19 pandemic, and the full impact of such conditions can be difficult to predict. In addition, geopolitical developments, such as existing and potential trade wars and other delaysevents beyond our control, can increase levels of political and economic unpredictability globally and increase the volatility of global financial markets, as has been the case with the COVID-19 pandemic. Moreover, these conditions have affected and may continue to affect the rate of IT spending; could adversely affect our customers’ ability or willingness to attend our events or to purchase our enterprise cloud computing services; have delayed and may delay customer purchasing decisions; have reduced and may in the future reduce the value and duration of customer subscription contracts; and we expect these conditions will adversely affect our customer attrition rates. All of these risks and conditions could materially adversely affect our future sales and operating results.
Our efforts to expand our services beyond the CRM market and to develop and integrate our existing services in order to keep pace with technological developments may not succeed and may reduce our revenue growth rate and harm our business.
We derive a significant portion of our revenue from subscriptions to our CRM enterprise cloud computing application services, and we expect this will continue for the foreseeable future. Our efforts to expand our services beyond the CRM market, such as with Analytics and Integration, may not succeed and may reduce our revenue growth rate. In addition, the markets for certain of our offerings, including Einstein Analytics and Voice, blockchain, and other offerings, remain relatively new and it is uncertain whether our efforts, and related investments, will ever result in significant revenue for us. In addition, we may be required to continuously enhance our artificial intelligence offerings so that quality recommendations can be provided to our customers. Further, the
introduction of significant platform changes and upgrades may not succeed and early stage interest and adoption of such new services may not result in long term success or significant revenue for us.
Additionally, if we fail to anticipate or identify significant Internet-related and other technology trends and developments early enough, or if we do not devote appropriate resources to adapting to such trends and developments, our business could be harmed.
If we are unable to develop enhancements to and new features for our existing or new services that keep pace with rapid technological developments, our business could be harmed. The success of enhancements, new features and services depends on several factors, including the timely completion, introduction and market acceptance of the feature, service or enhancement by customers, administrators and developers, as well as our ability to seamlessly integrate all of our service offerings and develop adequate selling capabilities in new markets. Failure in this regard may significantly impair our revenue growth as well as negatively impact our operating results if the additional costs are not offset by additional revenues. In addition, because our services are designed to operate over various network technologies and on a variety of mobile devices, operating systems and computer hardware and software platforms using a standard browser, we will need to continuously modify and enhance our services to keep pace with changes in Internet-related hardware, software, communication, browser, app development platform and database technologies, as well as continue to maintain and support our services on legacy systems. We may not be successful in either developing these modifications and enhancements or in bringing them to market timely. Additionally, changes to our work environment and workforce as a result of damagesthe COVID-19 pandemic could adversely affect our ability to portionstimely develop enhancements to and new features for existing or new services. Our efforts to quickly introduce new offerings designed to help our customers respond to the COVID-19 pandemic, including our Work.com offering, may not be successful.
Furthermore, uncertainties about the timing and nature of its infrastructure, denial-of-service attacksnew network platforms or related cyber incidents,technologies, or modifications to existing platforms or technologies, could increase our research and it could face outagesdevelopment or service delivery expenses. Any failure of our services to operate effectively with future network platforms and delays in the future. These outages and delaystechnologies could reduce the level of Internet usage ordemand for our services, result in fragmentation of the Internet, resulting in multiple separate Internets. These scenarios are not under our control and could reduce the availability of the Internet to us or our customers for delivery of our Internet-based services. Any resulting interruptions in our services or the ability of our customers to access our services could result in a loss of potential or existing customerscustomer dissatisfaction and harm our business.
In addition, certainAs we acquire and invest in companies or technologies, we may not realize the expected business or financial benefits and the acquisitions could prove difficult to integrate, disrupt our business, dilute stockholder value and adversely affect our operating results and the market value of our common stock.
As part of our business strategy, we periodically make investments in, or acquisitions of, complementary businesses, joint ventures, services and technologies and intellectual property rights, and we expect that we will continue to make such investments and acquisitions in the future.
Acquisitions and other transactions, arrangements, and investments involve numerous risks and could create unforeseen operating difficulties and expenditures, including:
•potential failure to achieve the expected benefits on a timely basis or at all;
•potential identified or unknown security vulnerabilities in acquired products that expose us to additional security risks or delay our ability to integrate the product into our service offerings or recognize the benefits of our investment;
•difficulties in increasing or maintaining the security standards for acquired technology consistent with our other services, and related costs;
•difficulty of transitioning the acquired technology onto our existing platforms and customer acceptance of multiple platforms on a temporary or permanent basis;
•augmenting the acquired technologies and platforms to the levels that are consistent with our brand and reputation;
•challenges converting the acquired company's revenue recognition policies and forecasting the related revenues, including subscription-based revenues and software license revenue, as well as appropriate allocation of the customer consideration to the individual deliverables;
•diversion of financial and managerial resources from existing operations;
•the potential entry into new markets in which we have little or no experience or where competitors may have stronger market positions;
•currency and regulatory risks associated with foreign countries have implemented legislative and technological actionspotential additional cybersecurity and compliance risks resulting from entry into new markets;
•difficulties in, and the cost of, integrating acquired operations, technologies, services, platforms and personnel;
•the inability to obtain the regulatory approvals necessary to complete transactions or to integrate operations, or potential remedies imposed by regulatory authorities either as a condition to or following the completion of a transaction (such as the global hold separate order, issued in connection with our acquisition of Tableau by the United Kingdom Competition & Markets Authority in fiscal 2020, which order was lifted in fiscal 2020), which may include divestitures, ownership or operational restrictions or other structural or behavioral remedies;
•failure to assimilate acquired employees, which may lead to retention risk with respect to both key acquired employees and our existing key employees or disruption to existing teams;
•difficulties in re-training key employees of acquired companies and integrating them into our organizational structure and corporate culture;
•differences between our values and those of our acquired companies;
•inability to generate sufficient revenue to offset acquisition or investment costs;
•inability to maintain relationships with customers and partners of the acquired business;
•challenges with the acquired company's third-party service providers, including those that either do or can effectively regulateare required for ongoing access to third-party data;
•changes to customer relationships or customer perception of the Internet. These actions could potentially limitacquired business as a result of the acquisition;
•potential for acquired products to impact the profitability of existing products;
•unanticipated expenses related to acquired technology and its integration into our existing technology;
•known and potential unknown liabilities associated with the acquired businesses, including due to litigation;
•potential write-offs of acquired assets or interrupt accessinvestments, and potential financial and credit risks associated with acquired customers;
•negative impact to our services from certain countries or Internet Service Providersresults of operations because of the depreciation and result in amortization of amounts related to acquired intangible assets, fixed assets and deferred compensation;
•the loss of potentialacquired unearned revenue and unbilled unearned revenue;
•challenges relating to the structure of an investment, such as governance, accountability and decision-making conflicts that may arise in the context of a joint venture or existing customersother majority ownership investments;
•difficulties in and financial costs of addressing acquired compensation structures inconsistent with our compensation structure;
•additional stock-based compensation, including the impact on stockholder dilution and our results of operations;
•delays in customer purchases due to uncertainty related to any acquisition;
•ineffective or inadequate controls, procedures and policies at the acquired company;
•in the case of foreign acquisitions, challenges caused by integrating operations over distance, and across different languages, cultures and political environments; and
•the tax effects and costs of any such acquisitions including the related integration into our tax structure and assessment of the impact on the realizability of our future tax assets or liabilities.
Any of these risks could harm our business.business or negatively impact our results of operations. In addition, to facilitate acquisitions or investments, we may seek additional equity or debt financing, which may not be available on terms favorable to us or at all, which may affect our ability to complete subsequent acquisitions or investments, and which may affect the risks of owning our common stock. For example, if we finance acquisitions by issuing equity or convertible or other debt securities or loans, our existing stockholders may be diluted, or we could face constraints related to the terms of, and repayment obligation related to, the incurrence of indebtedness that could affect the market price of our common stock.
Our ability to acquire other businesses or technologies, make strategic investments or integrate acquired businesses effectively, may be impaired by the effects of the COVID-19 pandemic and government actions in light of the pandemic. For example, a number of countries, including the U.S. and countries in Europe and the Asia-Pacific region, are considering or have recently adopted restrictions of varying kinds on transactions involving foreign investments. Governments may adopt more restrictions of this nature, some of which may apply to acquisitions, investments or integrations of businesses by us.
Industry-specific regulation and other requirements and standards are evolving and unfavorable industry-specific laws, regulations, interpretive positions or standards could harm our business.
Our customers and potential customers conduct business in a variety of industries, including financial services, the public sector, healthcare and telecommunications. Regulators in certain industries have adopted and may in the future adopt regulations or interpretive positions regarding the use of cloud computing and other outsourced services. The costs of compliance with, and other burdens imposed by, industry-specific laws, regulations and interpretive positions may limit our customers’ use and adoption of our services and reduce overall demand for our services. Compliance with these regulations may also require us to devote greater resources to support certain customers, which may increase costs and lengthen sales cycles. For example, some financial services regulators have imposed guidelines for use of cloud computing services that mandate specific controls or require financial services enterprises to obtain regulatory approval prior to outsourcing certain functions. If we are unable to comply with these guidelines or controls, or if our customers are unable to obtain regulatory approval to use our services where required, our business may be harmed. In addition, an inability to satisfy the standards of certain voluntary third-party certification bodies that our customers may expect,
such as an attestation of compliance with the Payment Card Industry (PCI) Data Security Standards, may have an adverse impact on our business and results. If in the future we are unable to achieve or maintain industry-specific certifications or other requirements or standards relevant to our customers, it may harm our business and adversely affect our results.
Further, in some cases, industry-specific laws, regionally-specific, or product-specific laws, regulations, or interpretive positions may also apply directlyimpact our ability, as well as the ability of our customers, partners and data providers, to us as a service provider.collect, augment, analyze, use, transfer and share personal and other information that is integral to certain services we provide. The interpretation of many of these statutes, regulations, and rulings is evolving in the courts and administrative agencies and an inability to comply may have an adverse impact on our business and results. This impact may be particularly acute in countries that have passed or are considering passing legislation that requires data to remain localized "in country," as this may impose financial costs on companies required to store data in jurisdictions not of their choosing and nonstandard operational processes that add complexity and are difficult and costly to integrate with global processes. Any failure or perceived failure by us to comply with such requirements could have an adverse impact on our business. For example, there are various statutes, regulations, and rulings relevant to the direct email marketing and text-messaging industries, including the Telephone Consumer Protection Act (TCPA)(“TCPA”) and related Federal Communication Commission (FCC)(“FCC”) orders, which impose significant restrictions on the ability to utilize telephone calls and text messages to mobile telephone numbers as a means of communication, when the prior consent of the person being contacted has not been obtained. We are,have been, and may in the future be, subject to one or more class-action lawsuits, as well as individual lawsuits, containing allegations that one of our businesses or customers violated the TCPA. A determination that we or our customers violated the TCPA or other communications-based statutes could expose us to significant damage awards that could, individually or in the aggregate, materially harm our business.
Supporting our existing and growing customer base could strain our personnel resources and infrastructure, and if we are unable to scale our operations and increase productivity, we may not be able to successfully implement our business plan.
We continue to experience significant growth in our customer base and personnel, particularly through acquisitions, which has placed a strain on our management, administrative, operational and financial infrastructure. We anticipate that significant additional investments will be required to scale our operations and increase productivity, to address the needs of our customers, to further develop and enhance our services, to expand into new geographic areas, and to scale with our overall growth. The additional investments we are making will increase our cost base, which will make it more difficult for us to offset any future revenue shortfalls by reducing expenses in the short term. Due to the effects of and financial burdens associated with the COVID-19 pandemic, we may not be able to make these investments as quickly or effectively as necessary to successfully scale our operations.
We regularly upgrade or replace our various software systems. If the implementations of these new applications are delayed, or if we encounter unforeseen problems with our new systems or in migrating away from our existing applications and systems, our operations and our ability to manage our business could be negatively impacted.
Our success will depend in part upon the ability of our senior management to manage our projected growth effectively. To do so, we must continue to increase the productivity of our existing employees and to hire, train and manage new employees as needed. Additionally, changes in our work environment and workforce as a result of the COVID-19 pandemic could adversely affect our operations. To manage the expected domestic and international growth of our operations and personnel, we will need to continue to improve our operational, financial and management controls, our reporting systems and procedures, and our utilization of real estate. If we fail to successfully scale our operations and increase productivity, we may be unable to execute our business plan and the value of our common stock could decline.
The market in which we participate is intensely competitive, and if we do not compete effectively, our operating results could be harmed.
The market for enterprise applications and platform services is highly competitive, rapidly evolving and fragmented, and subject to changing technology, low barriers to entry, shifting customer needs and frequent introductions of new products and services. We compete primarily with generalized platformsMany prospective customers have invested substantial personnel and financial resources to implement and integrate their current enterprise software into their businesses and therefore may be reluctant or unwilling to migrate away from their current solution to an enterprise cloud computing application service. Additionally, third-party developers may be reluctant to build application services on our platform since they have invested in other competing technology platforms.
Our current competitors include:
•vendors of packaged business software, as well as companies offering enterprise apps including CRM, collaboration, e-commerce and business intelligence software. We also compete with internally developed apps and face competition from enterprise software vendors and online service providers who may develop toolsets and products that allow customers to build new applications that run on the customers’ current infrastructure or as hosted services. Our current competitors include:
delivered through on-premises offerings from enterprise software application vendors;
vendors and cloud computing application service providers, either individually or with others;
marketing vendors, which may be specialized in advertising, targeting, messaging, or campaign automation;•internally developed enterprise applications (by our potential customers’ IT departments);
•software companies that provide their product or service free of charge, and only charge a premium for advanced features and functionality;
•suppliers of traditional business intelligence and data preparation products, as well as business analytics software companies;
•integration software vendors and other companies offering integration or API solutions;
•marketing vendors, which may be specialized in advertising, targeting, messaging, or campaign automation;
•e-commerce solutions from established and emerging cloud-only vendors and established on-premises vendors;
•traditional platform development environment companies;
companies and cloud computing development platform companies;companies who may develop toolsets and products that allow customers to build new apps that run on the customers’ current infrastructure or as hosted services;
internally developed applications (by our potential customers’ IT departments);
•IoT platforms from large companies that have existing relationships with hardware and software companies; and
e-commerce solutions from emerging cloud-only vendors and established on-premises vendors; and
artificial intelligence•AI solutions from new startups and established companies.
ManyIn addition, we may face more competition as we expand our product offerings. Some of our current and potential competitors may have competitive advantages, such as greater name recognition, longer operating histories, significant installed bases, broader geographic scope, and larger marketing budgets, as well as substantially greater financial, technical, personnel, and other resources. In addition, many of our current and potential competitors have established marketing relationships and access to larger customer bases, and have major distribution agreements with consultants, system integrators and resellers. As a result, ourWe also experience competition from smaller, younger competitors that may be more agile in responding to customers' demands. These competitors may be able to respond more quickly and effectively than we can to new or changing opportunities, technologies, standards or customer requirements. Furthermore, because of these advantages,requirements or provide competitive pricing. As a result, even if our services are more effective than the products and services that our competitors offer, potential customers might select competitive products and services in lieu of purchasing our services. For all of these reasons, we may not be able to compete successfully against our current and future competitors.competitors, which could negatively impact our future sales and harm our business.
AsOur continued success depends on our ability to maintain and enhance our brands.
We believe that the brand identities we acquirehave developed including associations with trust, customer success, innovation and investequality have significantly contributed to the success of our business. Maintaining and enhancing the Salesforce brand and our other brands are critical to expanding our base of customers, partners and employees. Our brand strength will depend largely on our ability to remain a technology leader and continue to provide high-quality innovative products, services, and features securely, reliably and in companies or technologies,a manner that enhances our customers' success. In order to maintain and enhance the strength of our brands, we may not realizemake substantial investments to expand or improve our product offerings and services that may be accompanied by initial complications or ultimately prove to be unsuccessful.
In addition, we have secured the expected businessnaming rights to facilities controlled by third parties, such as office towers and a transit center, and any negative events or financial benefitspublicity arising in connection with these facilities could adversely impact our brand.
If we fail to maintain and the acquisitions could prove difficultenhance our brands, or if we incur excessive expenses in our efforts to integrate, disruptdo so, our business, dilute stockholder value and adversely affect our operating results and financial condition may be materially and adversely affected.
Our ability to deliver our services is dependent on the market valuedevelopment and maintenance of our common stock.the infrastructure of the Internet by third parties.
As partThe Internet’s infrastructure is comprised of our business strategy, we periodically make investments in,many different networks and services that are highly fragmented and distributed by design. This infrastructure is run by a series of independent third-party organizations that work together to provide the infrastructure and supporting services of the Internet under the governance of the Internet Corporation for Assigned Numbers and Names (“ICANN”) and the Internet Assigned Numbers Authority (“IANA”), now under the stewardship of ICANN.
The Internet has experienced a variety of outages and other delays as a result of damages to portions of its infrastructure, denial-of-service attacks or acquisitions of, complementary businesses, joint ventures, servicesrelated cyber incidents, and technologiesit could face outages and intellectual property rights, and we expect that we will continue to make such investments and acquisitionsdelays in the future. AcquisitionsThese outages and investments involve numerous risks, including:
•potential failure to achievedelays could reduce the expected benefitslevel of Internet usage or result in fragmentation of the combinationInternet, resulting in multiple separate Internets. These scenarios are not under our control and could reduce the availability of the Internet to us or acquisition;
•difficultiesour customers for delivery of our Internet-based services. Any resulting interruptions in andour services or the costability of integrating operations, technologies,our customers to access our services platforms and personnel;
•diversion of financial and managerial resources from existing operations;
the potential entry into new marketscould result in which we have little or no experience or where competitors may have stronger market positions;
potential write-offs of acquired assets or investments, and potential financial and credit risks associated with acquired customers;
potentiala loss of key employees of the acquired company;
inability to generate sufficient revenue to offset acquisitionpotential or investment costs;
inability to maintain relationships withexisting customers and partners of the acquired business;harm our business.
difficulty of transitioning the acquired technology onto our existing platformsIn addition, certain countries have implemented (or may implement) legislative and customer acceptance of multiple platforms on a temporarytechnological actions that either do or permanent basis;
augmenting the acquired technologies and platformscan effectively regulate access to the levels that are consistent with our brandInternet, including the ability of Internet service providers to limit access to specific websites or content. Additionally, COVID-19 has also resulted in quarantines, shelter in place orders, and reputation;
increasingwork from home directives, all of which have increased demands for internet access and may create access challenges. These actions could potentially limit or maintaining the security standards for acquired technology consistent with our other services;
potential unknown liabilities associated with the acquired businesses;
unanticipated expenses related to acquired technology and its integration into our existing technology;
negative impactinterrupt access to our results of operations because of the depreciationservices from certain countries or Internet service providers, impede our growth, productivity and amortization of amounts related to acquired intangible assets, fixed assets and deferred compensation;
additional stock based compensation;operational effectiveness, result in the loss of acquired deferred revenuepotential or existing customers and unbilled deferred revenue;
delays in customer purchases due to uncertainty related to any acquisition;
ineffective or inadequate controls, procedures and policies at the acquired company may negatively impact our results of operations;
challenges caused by integrating operations over distance, and across different languages and cultures;
currency and regulatory risks associated with foreign countries and potential additional cybersecurity and compliance risks resulting from entry into new markets; and
the tax effects of any such acquisitions.
Any of these risks could harm our business. In addition, to facilitate these acquisitions or investments, we may seek additional equity or debt financing, which may not be available on terms favorable to us or at all, which may affect our ability to complete subsequent acquisitions or investments, and which may affect the risks
We are subject to risks associated with our strategic investments. Other-than-temporary impairmentsinvestments, including partial or complete loss of invested capital. Significant changes in the fair value of this portfolio, including changes in the valuation of our investments in publicly traded and privately held companies, could negatively impact our financial results.
We investhave strategic investments in early-to-late stagepublicly traded and privately held companies, for strategic reasonswhich range from early-stage companies to more mature companies with established revenue streams and to support key business initiatives, and may not realize a return on our strategic investments.models. Many such companies generate net losses and the market for their products, services or technologies may be slow to develop, and, therefore, are dependent on the availability of later rounds of financing from banks or investors on favorable terms to continue their operations. The financial success of our investment in any privately held company is typically dependent on a liquidity event, such as a public offering, acquisition or other favorable market event reflecting appreciation to the cost of our initial investment. Likewise, the financial success of our investment in any publicly held company is typically dependent upon an exit in favorable market conditions, and to a lesser extent on liquidity events. The capital markets for public offerings and acquisitions are dynamic and the likelihood of successful liquidity events for the companies we have invested in could significantly worsen. Further, valuations of privately-heldprivately held companies are inherently complex due to the lack of readily available market data. If
The rapid spread of COVID-19 and its reverberating effects on the global economy have caused disruptions to our industry and to financial markets that are inhibiting and may continue to inhibit the ability of investee companies to complete a currently planned or future liquidity event. In some cases, our investee companies may no longer be able to operate or could experience reduced revenues or profitability, an increase in customer attrition, delayed public offerings, reduced ability to raise favorable rounds of financing, acquisitions at less favorable terms or insolvency or bankruptcy. These outcomes could materially adversely affect the Company’s financial position, results of operations, and cash flows.
As the enterprise cloud computing ecosystem has matured, the opportunities in which we determine that anycan invest have expanded to include investments in companies concurrently with an initial public offering in addition to our investments in early to late stage private companies. Therefore, our investment strategy and portfolio has also expanded to include more mature companies. In certain cases, our ability to sell these investments may be constrained by contractual obligations to hold the securities for a period of time after a public offering, including market standoff agreements and lock-up agreements.
We record all fair value adjustments of our publicly traded and privately held equity investments through the condensed consolidated statement of operations. As a result, we may experience additional volatility to our statements of operations due to changes in market prices of our investments in such companies have experienced a declinepublicly held equity investments and the valuation and timing of observable price changes or impairments of our investments in value, weprivately held securities. Our ability to mitigate this volatility in any given period may be requiredimpacted by our contractual obligations to record an other-than-temporary impairment, which could be material. We havehold securities for a set period of time. Volatility in the past written offfinancial markets, including the full valueimpact of specific investments. Similar situationsthe COVID-19 pandemic, has been and could occurcontinue to be material to our results in the futureany given quarter and negativelymay cause our stock price to decline. While historically our investment portfolio has had a positive impact on our financial results. results, that may not be true for future periods, particularly in periods of significant market fluctuations which affect our strategic investments portfolio.
All of our investments, especially our investments in privately held companies, are subject to a risk of a partial or total loss of investment capital. In addition, in the future we may deploy material investments in individual investee companies, resulting in the increasing concentration of risk in a small number of companies. Changes in the fair value or partial or total loss of investment capital of these individual companies could be material to our financial statements.
Our quarterly results are likely to fluctuate, and our stock price andwhich may cause the value of our common stock couldto decline substantially.
Our quarterly results are likely to fluctuate. For example,Fluctuations have occurred due to known and unknown risks, including the sudden and unanticipated effects of the COVID-19 pandemic. In addition, our fiscal fourth quarter has historically been our strongest quarter for new business and renewals. Therenewals, and the year-over-year compounding effect of this seasonality in billing patterns and overall new business and renewal activity causes the value of invoices that we generate in the fourth quarter to continually increase in proportion to our billings in the other three quarters of our fiscal year. As a result, our fiscal first quarter ishas typically in the past been our largest collections and operating cash flow quarter.quarter; this trend has been adversely impacted by the effects of the COVID-19 pandemic and related economic downturn and uncertainties.
Additionally, some of the important factors that may cause our revenues, operating results and cash flows to fluctuate from quarter to quarter include:
our ability to retain and increase sales to existing customers, attract new customers and satisfy our customers’ requirements;
the attrition rates for our services;
the rate of expansion and productivity of our sales force;
the length•general economic or geopolitical conditions, which have been significantly adversely impacted as a result of the sales cycle for our services;
new productCOVID-19 pandemic, and service introductions by our competitors;
our success in selling our serviceswhich are adversely affecting and may continue to large enterprises;
our ability to realize benefits from strategic partnerships, acquisitions or investments;
general economic conditions, which may adversely affect either our customers’ ability or willingness to purchase additional subscriptions or upgrade their services, or delay a prospective customer'scustomers’ purchasing decision,decisions, reduce the value of new subscription contracts, or affect attrition rates;
•our ability to retain and increase sales to existing customers, attract new customers and satisfy our customers’ requirements;
•the attrition rates for our services;
•the rate of expansion and productivity of our sales force;
•the length of the sales cycle for our services;
•new product and service introductions by our competitors;
•our success in selling our services to large enterprises;
•changes in unearned revenue and remaining performance obligation, due to seasonality, the timing of and compounding effects of renewals, invoice duration, size and timing, new business linearity between quarters and within a quarter, average contract term, the collectibility of invoices related to multiyear agreements, the timing of license software revenue recognition, or fluctuations due to foreign currency movements, all of which may impact implied growth rates;
•our ability to realize benefits from strategic partnerships, acquisitions or investments;
•variations in the revenue mix of our services and growth rates of our cloud subscription and support offerings;offerings, including the timing of software license sales and sales offerings that include an on-premise software element for which the revenue allocated to that deliverable is recognized upfront;
•the seasonality of our sales cycle, including software license sales, and timing of contract execution and the corresponding impact on revenue recognized at a point in time;
•changes in our pricing policies and terms of contracts, whether initiated by us or as a result of competition;competition, customer preference or other factors;
•changes in payment terms and the timing of customer payments and payment defaults by customers;
changes in deferred revenuecustomers as have been and unbilled deferred revenue balances, which are not reflected inmay continue to be impacted by the balance sheet, due to seasonality, the compounding effects of renewals, invoice duration, size and timing, new business linearity between quarters and within a quarter and fluctuations due to foreign currency movements;the COVID-19 pandemic;
•the seasonality of our customers’ businesses, especially Commerce Cloud customers, including retailers and branded manufacturers;
changes•fluctuations in foreign currency exchange rates such as with respect to the British Pound;Pound Sterling;
•the amount and timing of operating costs and capital expenditures related to the operations and expansion of our business;
•the number of new employees;
•the timing of commission, bonus, and other compensation payments to employees;employees, including decisions to guarantee some portion of commissions payments in connection with extraordinary events such as the partial commission guarantee in the fiscal quarter ended April 30, 2020;
•the cost, timing and management effort required for the introduction of new features to our services;
•the costs associated with acquiring new businesses and technologies and the follow-on costs of integration and consolidating the results of acquired businesses;
•expenses related to our real estate, our office leases and our data center capacity and expansion;
•timing of additional investments in our enterprise cloud computing application and platform services and in our consulting services;
•expenses related to significant, unusual or discrete events, which are recorded in the period in which the events occur;occur, including for example expenses related to the COVID-19 pandemic;
•extraordinary expenses such as litigation or other dispute-related settlement payments;
•income tax effects;effects resulting from, but not limited to, tax law changes, court decisions on tax matters, global tax developments applicable to multinational corporations, changes in operations or business structures, and acquisition activity;
•the timing of payroll and other withholding tax expenses, which are triggered by the payment of bonuses and when employees exercise their vested stock awards;options;
•technical difficulties or interruptions in our services;
•changes in interest rates and our mix of investments, which would impact the return on our investments in cash and marketable securities;
•conditions, and particularly sudden changes, in the financial markets, such as the recent volatility caused by the COVID-19 pandemic, which have impacted and may continue to impact the value of and liquidity of our investment portfolio;
other than temporary impairments•changes in the fair value of our strategic investments in early-to-late stage privately held and public companies, which could be materialnegatively and materially impact our financial results, particularly in a particular quarter;periods of significant market fluctuations;
•equity issuances, including as consideration in acquisitions or due to the conversionacquisitions;
•the timing of stock awards to employees and the related adverse financial statement impact of having to expense those stock awards on a straight-line basis over their vesting schedules;
•evolving regulations of cloud computing and cross-border data transfer restrictions and similar regulations;
•regulatory compliance costs; and
•the impact of new accounting pronouncements and associated system implementations, for example, the adoption of Accounting Standards Update No. 2014-09, “Revenue from Contracts with Customers (Topic 606)” (“ASU 2014-09”), which includes the accounting for revenue recognized and capitalized costs.implementations.
Many of these factors are outside of our control, and the occurrence of one or more of them might cause our operating results to vary widely. As such, we believe that historical quarter-to-quarter comparisons of our revenues, operating results, changes in our deferred revenue and unbilled deferred revenue balances and cash flows may not be meaningful and should not be relied upon as an indication of future performance.
Additionally, ifIf we fail to meet or exceed theoperating results expectations ofor if securities analysts and investors have estimates and forecasts of our future performance that are unrealistic or that we do not meet, the market price of our common stock could decline. In addition, if one or more of the securities analysts who cover us adversely change their recommendation regarding our stock, the market price of our common stock could decline. Moreover, our stock price may be based on expectations, estimates and forecasts of our future performance that may be unrealistic or that may not be met. Further, our stock price may fluctuate based on reporting by the financial media, including television, radio and press reports and blogs.
If we experience significant fluctuations in our rate of anticipated growth and fail to balance our expenses with our revenue forecasts, our resultsbusiness could be harmed.harmed and the market price of our common stock could decline.
Due to the unpredictability of future general economic and financial market conditions (including due to the impact of the COVID-19 pandemic), the pace of change and innovation in enterprise cloud computing services, the unpredictability of future general economic and financial market conditions, the impact of foreign currency exchange rate fluctuations, the growing complexity of our business, including the use of multiple pricing and packaging models and the increasing amount of revenue from software license sales, and our increasing focus on enterprise cloud computing services, we may not be able to realize our projected revenue growth plans. We plan our expense levels and investment on estimates of future revenue and future anticipated rate of growth. We may not be able to adjust our spending appropriately if the addition of new subscriptions or the renewals of existing subscriptions fall short of our expectations.expectations, and unanticipated events, such as the COVID-19 pandemic, may cause us to incur expenses beyond what we anticipated. A portion of our expenses may also be fixed in nature for some minimum amount of time, such as with acosts capitalized to obtain revenue contracts, data center contractand infrastructure service contracts or office lease,leases, so it may not be possible to reduce costs in a timely manner, or at all, without the payment of fees to exit certain obligations early. As a result, we expect that our revenues, operating results and cash flows may fluctuate significantly on a quarterly basis. Our recentbasis and revenue growth rates may not be sustainable and may decline in the future. We believe that historical period-to-period comparisons of our revenues, operating resultsfuture, and cash flowsin some periods, we have not been able to, and may not be meaningful and should not be relied upon as an indication ofable in the future performance.
Our efforts to expand our services beyond the CRM market and to develop our existing services in order to keep pace with technological developments may not succeed and may reduce our revenue growth rate andprovide continued operating margin expansion, which could harm our business.
We derive substantially allbusiness and cause the market price of our revenue from subscriptionscommon stock to our CRM enterprise cloud computing application services, and we expect this will continue for the foreseeable future. Our efforts to expand our services beyond the CRM market may not succeed and may reduce our revenue growth rate. The markets for our Analytics, IoT, Commerce and Salesforce Quip Clouds remain relatively new and it is uncertain whether our efforts will ever result in significant revenue for us. Further, the
introduction of significant platform changes and upgrades, including our conversion to our new Lightning platform, and introduction of new services beyond the CRM market, may not be successful, and early stage interest and adoption of such new services may not result in long term success or significant revenue for us.
Additionally, if we are unable to develop enhancements to and new features for our existing or new services that keep pace with rapid technological developments, our business will be harmed. The success of enhancements, new features and services depends on several factors, including the timely completion, introduction and market acceptance of the feature, service or enhancement. Failure in this regard may significantly impair our revenue growth. In addition, because our services are designed to operate over various network technologies and on a variety of mobile devices, operating systems and computer hardware and software platforms using a standard browser, we will need to continuously modify and enhance our services to keep pace with changes in Internet-related hardware, software, communication, browser, app development platform and database technologies. We may not be successful in either developing these modifications and enhancements or in bringing them to market timely. Furthermore, uncertainties about the timing and nature of new network platforms or technologies, or modifications to existing platforms or technologies, could increase our research and development or service delivery expenses. Any failure of our services to operate effectively with future network platforms and technologies could reduce the demand for our services, result in customer dissatisfaction and harm our business.
Additionally, if we fail to anticipate or identify significant Internet-related and other technology trends and developments early enough, or if we do not devote appropriate resources to adapting to such trends and developments, our business could be harmed.decline.
Sales to customers outside the United States expose us to risks inherent in international operations.
We sell our services throughout the world and are subject to risks and challenges associated with international business. We intend to continue to expand our international sales efforts. The risks and challenges associated with sales to customers outside the United States or those that can affect international operations generally, include:
•natural disasters, acts of war, terrorism, and pandemics, including the ongoing COVID-19 pandemic and related public health measures and resulting changes to laws and regulations, including changes oriented to protecting local businesses or restricting the movement of our or our customers’ employees;
•localization of our services, including translation into foreign languages and associated expenses;
•regulatory frameworks or business practices favoring local competitors;
•pressure on the creditworthiness of sovereign nations, particularly in Europe, where we have customers and a balance of our cash, cash equivalents and marketable securities;
•foreign currency fluctuations and controls, which may make our services more expensive for international customers and could add volatility to our operating results;
•compliance with multiple, conflicting, ambiguous or evolving domesticgovernmental laws and internationalregulations, including employment, tax, environments;privacy, anti-corruption, import/export, customs, anti-boycott, sanctions and embargoes, antitrust, data transfer, storage and protection, and industry-specific laws and regulations, including rules related to compliance by our third-party resellers and our ability to identify and respond timely to compliance issues when they occur;
•liquidity issues or political actions by sovereign nations, including nations with a controlled currency environment, which could result in decreased values of these balances or potential difficulties protecting our foreign assets or satisfying local obligations;
foreign currency fluctuations•vetting and controls;
compliance with multiple, conflicting, ambiguous or evolving governmental laws and regulations, including employment, tax, privacy, anti-corruption, import/export, antitrust, data transfer, storage and protection, and industry-specific laws and regulations, including rules related to compliance bymonitoring our third-party resellers;resellers in new and evolving markets to confirm they maintain standards consistent with our brand and reputation;
regional data privacy laws and other regulatory requirements that apply to outsourced service providers and to the transmission of our customers’ data across international borders;
•treatment of revenue from international sources, evolving domestic and international tax environments, and changes to tax codes, including being subject to foreign tax laws and being liable for paying withholding income or other taxes in foreign jurisdictions;
•uncertainty regarding regulation, currency, tax, and operations resulting from the United Kingdom's exit from the EU ("Brexit") on January 31, 2020 and possible disruptions in trade, the sale of our services and commerce, and movement of our people between the United Kingdom, EU, and other locations;
•uncertainty regarding the imposition of and changes in the United States' and other governments' trade regulations, trade wars, tariffs, other restrictions or other geopolitical events;
•changes in the public perception of governments in the regions where we operate or plan to operate;
•regional data privacy laws and other regulatory requirements that apply to outsourced service providers and to the transmission of our customers’ data across international borders, which grow more complex as we scale and expand into new markets;
•different pricing environments;
•difficulties in staffing and managing foreign operations;
•different or lesser protection of our intellectual property, including increased risk of theft of our proprietary technology and other intellectual property;
•longer accounts receivable payment cycles and other collection difficulties; and
natural disasters, acts of war, terrorism, pandemics or security breaches; and
•regional economic and political conditions.
Any of these factors could negatively impact our business and results of operations. The above factors may also negatively impact our ability to successfully expand into emerging market countries, where we have little or no operating experience, where it can be costly and challenging to establish and maintain operations, including hiring and managing required personnel, and difficult to promote our brand, and where we may not benefit from any first-to-market advantage or otherwise succeed.
Additionally, our international subscription fees are paid either in U.S. Dollars or local currency. As a result, fluctuations in the value of the U.S. Dollar and foreign currencies may make our services more expensive for international customers, which could harm our business.
Because we generally recognize revenue from subscriptions for our services over the term of the subscription, downturns or upturns in new business may not be immediately reflected in our operating results.
We generally recognize revenue from customers ratably over the terms of their subscription and support agreements, which are typically 12 to 36 months. As a result, most of the revenue we report in each quarter is the result of subscription and support agreements entered into during previous quarters. Consequently, a decline in new or renewed subscriptions in any one quarter may not be reflected in our revenue results for that quarter. Any such decline, however, will negatively affectimpact our revenue in future quarters. Accordingly, the effect of significant downturns in sales and market acceptance of our services, and potential changes in our attrition rate, may not be fully reflected in our results of operations until future periods.periods, including changes resulting from the effects of the COVID-19 pandemic. Our subscription model also makes it difficult for us to rapidly increase our revenue through additional sales in any period, as revenue from new customers must be recognized over the applicable subscription and support term.
If our customers do not renew their subscriptions for our services or reduce the number of paying subscriptions at the time of renewal, our revenue willand current remaining performance obligation could decline and our business willmay suffer. If we cannot accurately predict subscription renewals or upgrade rates, we may not meet our revenue targets, which may adversely affect the market price of our common stock.
Our customers have no obligation to renew their subscriptions for our services after the expiration of their contractual subscription period, which is typically 12 to 36 months, and in the normal course of business, some customers have elected not to renew. In addition, our customers may renew for fewer subscriptions, renew for shorter contract lengths, or switch to lower cost offerings of our services. It is difficult to predict attrition rates given our varied customer base of enterprise and small and medium size business customers and the number of multi-year subscription contracts. Historically, our subscription and support revenues primarily consisted of subscription fees; however, with the May 2018 acquisition of MuleSoft and the August 2019 acquisition of Tableau, subscription and support revenues also now include term software license sales. We have less experience forecasting the renewal rates of such term software license sales. Our attrition rates may increase or fluctuate as a result of a number of factors, including customer dissatisfaction with our services, customers’ spending levels, mix of customer base, decreases in the number of users at our customers, competition, pricing increases or changes and deteriorating general economic conditions.conditions, including as a result of the COVID-19 pandemic.
Our future success also depends in part on our ability to sell additional features and services, more subscriptions or enhanced editions of our services to our current customers. This may also require increasingly sophisticated and costly sales efforts that are targeted at senior management. Similarly, the rate at which our customers purchase new or enhanced services depends on a number of factors, including general economic conditions and that our customers do not react negatively to any price changes related to these additional features and services.
If our efforts to upsell to our customers aredo not successfulrenew their subscriptions, do not purchase additional features or enhanced subscriptions or if attrition rates increase, our business may suffer.could be harmed.
If third-party developers and providers do not continue to embrace our technology delivery model and enterprise cloud computing services, or if our customers seek warranties from us for third-party applications, integrations, data and integrations,content, our business could be harmed.
Our success depends on the willingness of a growing community of third-party developers and technology providers to build applications and provide integrations, data and content that are complementary to our services. Without the continued development of these applications and provision of such integrations, data and content, both current and potential customers may not find our services sufficiently attractive.attractive, which could impact future sales. In addition, for those customers who authorize a third-party technology partner access to their data, we do not provide any warranty related to the functionality, security andor integrity of the data transmission or processing. Despite contract provisions to protect us, customers may look to us to support and provide warranties for the third-party applications, integrations, data and integrations,content, even though not developed or sold by us, which may expose us to potential claims, liabilities and obligations, for applications we did not develop or sell, all of which could harm our business.
We are exposed to fluctuations in currency exchange rates that have in the past and could in the future negatively impact our financial results and cash flows from changes in the value of the U.S. Dollar versus local currencies.currencies and the Euro versus the British Pound Sterling.
We primarily conduct our business in the following regions: the Americas, Europe and Asia Pacific. The expanding global scope of our business exposes us to risk of fluctuations in foreign currency markets, including in emerging markets. This exposure is the result of selling in multiple currencies, growth in our international investments, including data center expansion, additional headcount in foreign locations, and operating in countries where the functional currency is the local currency. Specifically, our results of operations and cash flows are subject to currency fluctuations primarily in British Pound Sterling, Euro, Japanese Yen, Canadian Dollar and Australian Dollar against the U.S. Dollar.Dollar as well as the Euro against the British Pound Sterling. These exposures may change over time as business practices evolve, economic and economicpolitical conditions change.change and evolving tax regulations come into effect. The fluctuations of currencies in which we conduct business can both increase and decrease our overall revenue and expenses for any given fiscal period. Such volatility, even when it increases our revenues or decreases our expenses, impactsFurthermore, fluctuations in foreign currency exchange rates can affect our ability to accurately predict our future results and earnings. Additionally, global events, including the sudden and unexpected effects of the COVID-19 pandemic, as well as geopolitical developments, fluctuating commodity prices and trade tariff developments, have caused and may in the future cause global economic uncertainty and uncertainty about the interest rate environment, which could amplify the volatility of currency fluctuations. Although we attempt to mitigate some of this volatility and related risks through foreign currency hedging, our hedging activities are limited in scope and may not effectively offset the adverse financial impacts that may result from unfavorable movements in foreign currency exchange rates, which could adversely affectimpact our financial condition or results of operations. Additionally, recent events, including the United Kingdom’s 2016 vote in favor of exiting the European Union, or “Brexit,” and similar geopolitical developments and uncertainty in the European Union and elsewhere could amplify the volatility of currency fluctuations and related risks for our business.
Supporting our existing and growing customer base could strain our personnel resources and infrastructure, and if we are unable to scale our operations and increase productivity, we may not be able to successfully implement our business plan.
We continue to experience significant growth in our customer base and personnel, which has placed a strain on our management, administrative, operational and financial infrastructure. We anticipate that additional investments in our internal infrastructure, data center capacity, research, customer support and development, and real estate spending will be required to scale our operations and increase productivity, to address the needs of our customers, to further develop and enhance our services, to expand into new geographic areas, and to scale with our overall growth. The additional investments we are making will increase our cost base, which will make it more difficult for us to offset any future revenue shortfalls by reducing expenses in the short term.
We regularly upgrade or replace our various software systems. If the implementations of these new applications are delayed, or if we encounter unforeseen problems with our new systems or in migrating away from our existing applications and systems, our operations and our ability to manage our business could be negatively impacted.
Our success will depend in part upon the ability of our senior management to manage our projected growth effectively. To do so, we must continue to increase the productivity of our existing employees and to hire, train and manage new employees as needed. To manage the expected domestic and international growth of our operations and personnel, we will need to continue to improve our operational, financial and management controls, our reporting systems and procedures, and our utilization of real estate. If we fail to successfully scale our operations and increase productivity, we may be unable to execute our business plan.
As more of our sales efforts are targeted at larger enterprise customers, our sales cycle may become more time-consuming and expensive, we may encounter pricing pressure and implementation and configuration challenges, and we may have to delay revenue recognition for some complex transactions, all of which could harm our business and operating results.
As we target more of our sales efforts at larger enterprise customers, including governmental entities, we may face greater costs, longer sales cycles, greater competition and less predictability in completing some of our sales. In this market segment, the customer’s decision to use our services may be an enterprise-wide decision and, if so, these types of sales would require us to provide greater levels of education regarding the use and benefits of our services, as well as education regarding privacy and data protection laws and regulations to prospective customers with international operations. Moreover, restrictions in place in response to the COVID-19 pandemic have disrupted our operations, and our customers’ operations and businesses, and this has adversely affected, and may continue to adversely affect, our sales efforts.
In addition, larger customers and governmental entities may demand more configuration, integration services and features. As a result of these factors, these sales opportunities may require us to devote greater sales support and professional services resources to individual customers, driving up costs and time required to complete sales and diverting our own sales and professional services resources to a smaller number of larger transactions, while potentially requiring us to delay revenue recognition on some of these transactions until the technical or implementation requirements have been met.
Pricing and packaging strategies for enterprise and other customers for subscriptions to our existing and future service offerings may not be widely accepted by other new or existing customers. Our adoption of such new pricing and packaging strategies may harm our business.
For large enterprise customers, professional services may also be performed by us, a third party, or a combination of our own staff and a third-party.third party. Our strategy is to work with third parties to increase the breadth of capability and depth of capacity for delivery of these services to our customers. If a customer is not satisfied with the quality of work performed by us or a third-partythird party or with the type of services or solutions delivered, then we could incur additional costs to address the situation, the profitability of that work might be impaired, and the customer’s dissatisfaction with our services could damage our ability to obtain additional work from that customer. In addition, negative publicity related to our customer relationships, regardless of its accuracy, may further damage our business by affecting our ability to compete for new business with current or prospective customers.
Social and ethical issues, including the use of AI in our offerings, may result in reputational harm and liability.
Social and ethical issues, including the use of new and evolving technologies such as AI in our offerings, may result in reputational harm and liability. We are increasingly building AI into many of our offerings. As with many innovations, AI and our Customer 360 platform present additional risks and challenges that could affect their adoption and therefore our business. For example, the development of AI and Customer 360, the latter of which provides information regarding our customers’ customers, presents emerging ethical issues and if we enable or offer solutions that draw controversy due to their perceived or actual impact on human rights, privacy, employment, or in other social contexts, we may experience brand or reputational harm, competitive harm or legal liability. Data practices by us or others that result in controversy could impair the acceptance of artificial intelligence solutions. This in turn could undermine the decisions, predictions, or analysis AI applications produce, subjecting us to competitive harm, legal liability, and brand or reputational harm.
In addition, positions we take on social and ethical issues may be unpopular with some customers or potential customers, which has in the past and may in the future impact our ability to attract or retain such customers or other prospective customers. We also may choose not to conduct business with potential customers or discontinue or not expand business with existing customers due to these positions. Further, actions taken by our customers, including through the use or misuse of our products, may result in reputational harm or possible liability. For example, we have been subject to allegations in legal proceedings that we should be liable for the use of certain of our products by third parties. Although we believe that such claims lack merit, such claims could cause reputational harm to our brand or result in liability. Our brand is also associated with our public commitments to sustainability, equality and ethical use, and any perceived changes in our dedication to these commitments could harm our reputation or brand and could adversely impact our relationships with our customers.
We have been and may in the future be sued by third parties for various claims, including alleged infringement of proprietary rights.
We are involved in various legal matters arising from the normal course of business activities. These may include claims, suits, government investigations and other proceedings involving alleged infringement of third-party patents and other intellectual property rights, as well as commercial, corporate and securities, labor and employment, class actions, wage and hour, antitrust and other matters.
The software and Internet industries are characterized by the existence of a large number of patents, trademarks and copyrights and by frequent litigation based on allegations of infringement or other violations of intellectual property rights. We have received in the past and may receive in the future communications from third parties, including practicing entities and non-practicing entities, claiming that we have infringed their intellectual property rights.
In addition, we We have also been, and may in the future be, sued by third parties for alleged infringement of their claimed proprietary rights. Our technologies may be subject to injunction if they are found to infringe the rights of a third-party or we may be required to pay damages, or both. Further, many of our subscription agreements require us to indemnify our customers for third-party intellectual property infringement claims, which would increase the cost to us of an adverse ruling on such a claim.
In addition, we have in the past been, and may in the future be, sued by third parties who seek to target us for actions taken by our customers, including through the use or misuse of our products. For example, we have been subject to allegations in legal proceedings that we should be liable for the use of certain of our products by third parties. Although we believe that such claims lack merit, such claims could cause reputational harm to our brand or result in liability.
Our exposure to risks associated with various claims, including claims related to the use of intellectual property as well as securities and related stockholder derivative claims, may be increased as a result of acquisitions of other companies. For example, we are subject to ongoing securities class action litigation and related stockholder derivative claims brought against Tableau that remain outstanding, and as to which we may ultimately be subject to liability or settlement costs. Additionally, we may have a lower level of visibility into the development process with respect to intellectual property or the care taken to safeguard against infringement risks with respect to acquired companies or technologies. In addition, third parties have made claims in connection with our acquisitions and may do so in the future, and they may also make infringement and similar or related claims after we have acquired technology that had not been asserted prior to our acquisition.
The outcome of any claims or litigation, regardless of the merits, is inherently uncertain. Any claims andor lawsuits, and the disposition of such claims and lawsuits, whether through settlement or licensing discussions, or litigation, could be time-consuming and expensive to resolve, divert management attention from executing our business plan, result in efforts to enjoin our activities, lead to attempts on the part of other parties to pursue similar claims and, in the case of intellectual property claims, require us to change our technology, change our business practices, pay monetary damages or enter into short- or long-term royalty or licensing agreements.
Any adverse determination or settlement related to intellectual property claims or other litigation could prevent us from offering our services to others, could be material to our financial condition or cash flows, or both, or could otherwise adversely affect our operating results.results, including our operating cash flow in a particular period. In addition, depending on the nature and timing of any such dispute, an unfavorable resolution of a legal matter could materially affect our current or future results of operations or cash flows in a particular quarter.period.
In addition, our exposure to risks associated with various claims, including the use
Any failure to protect our intellectual property rights could impair our ability to protect our proprietary technology and our brand.brand, cause us to incur significant expenses and harm our business.
If we fail to protect our intellectual property rights adequately, our competitors may gain access to our technology, affecting our brand, causing us to incur significant expenses and harming our business may be harmed. In addition, defending our intellectual property rights may entail significant expense.business. Any of our patents, trademarks or other intellectual property rights may be challenged by others or invalidated through administrative process or litigation. While we have many U.S. patents and pending U.S. and international patent applications, we may be unable to obtain patent protection for the technology covered in our patent applications or the patent protection may not be obtained quickly enough to meet our business needs. In addition, our existing patents and any patents issued in the future may not provide us with competitive advantages, or may be successfully challenged by third parties. Furthermore, legal standards relating to the validity, enforceability and scope of protection of intellectual property rights are uncertain, and we also may face proposals to change the scope of protection for some intellectual property rights in the U.S. Effective patent, trademark, copyright and trade secret protection may not be available to us in every country in which our services are available. The laws of some foreign countries may not be as protective of intellectual property rights as those in the U.S., and mechanisms for enforcement of intellectual property rights may be inadequate. Also, our involvement in standard settingstandard-setting activity or the need to obtain licenses from others may require us to license our intellectual property. Accordingly, despite our efforts, we may be unable to prevent third parties from using our intellectual property.
We may be required to spend significant resources and expense to monitor and protect our intellectual property rights and we may conclude that in at least some instances the benefits of protecting our intellectual property rights may be outweighed by the expense.rights. We may initiate claims or litigation against third parties for infringement of our proprietary rights or to establish the validity of our proprietary rights. AnyIf we fail to protect our intellectual property rights, it could impact our ability to protect our technology and brand. Furthermore, any litigation, whether or not it is resolved in our favor, could result in significant expense to us, cause us to divert time and divert the efforts ofresources from our technicalcore business, and management personnel.
Our continued success depends on our ability to maintain and enhance our brands.
We believe that the brand identities we have developed have significantly contributed to the success ofharm our business. Maintaining and enhancing the Salesforce brand and our other brands are critical to expanding our base of customers, partners and employees. Our brand strength will depend largely on our ability to remain a technology leader and continue to provide high-quality innovative products, services, and features securely, reliably and in a manner that enhances our customers' success. In order to maintain and enhance our brands, we may be required to make substantial investments that may later prove to be unsuccessful. In addition, positions we take on social issues may be unpopular with some customers or potential customers, which may impact our ability to attract or retain such customers. If we fail to maintain and enhance our brands, or if we incur excessive expenses in our efforts to do so, our business, operating results and financial condition may be materially and adversely affected.
We may lose key members of our management team or development and operations personnel, and may be unable to attract and retain employees we need to support our operations and growth.
Our success depends substantially upon the continued services of our executive officers and other key members of management, particularly our Chief Executive Officer.chief executive officer. From time to time, there may be changes in our executive management team resulting from the hiring or departure of executives. For example, in February 2020, Keith Block resigned as co-CEO and as a director of the Company. Such changes in our executive management team may be disruptive to our business. We are also substantially dependent on the continued service of our existing development and operations personnel because of the complexity of our services and technologies. We do not have employment agreements with any of ourOur executive officers, key management, development or operations personnel and they could terminate their employment with us at any time. The loss of one or more of our key employees or groups of employees could seriously harm our business.
In theThe technology industry there is subject to substantial and continuous competition for engineers with high levels of experience in designing, developing and managing software and Internet-related services, as well as competition for sales executives, data scientists and operations personnel. We have experienced significant competition in attracting and retaining, and may not in the future be successful in attracting and retaining qualified personnel. We have from time to time experienced, and we expect to continue to experience, difficulty in hiring, developing, integrating and retaining highly skilled employees with appropriate qualifications. These difficulties may be amplified by evolving restrictions on immigration, travel, or availability of visas for skilled technology workers. workers, including restrictions imposed in response to the COVID-19 pandemic. These difficulties may potentially be further amplified by the high cost of living in the San Francisco Bay Area, where our headquarters are located.If we fail to attract new personnel or fail to retain and motivate our current personnel, our business and future growth prospects could be severely harmed.
In addition, we believe in the importance of our corporate culture, of Ohana, which fosters dialogue, collaboration, recognition and a sense of family. As our organization grows and expands globally, and as employees’ workplace expectations develop, we may find it increasingly difficult to maintain the beneficial aspects of our corporate culture. This could negatively impact our ability to attract and retain employees or our reputation with customers and could negatively impact our future success.growth.
Any failure in our delivery of high-quality technical support services may adversely affect our relationships with our customers and our financial results.
Our customers depend on our support organization to resolve technical issues relating to our applications. We may be unable to respond quickly enough to accommodate short-term increases in customer demand for support services.services across our varying and diverse offerings. Outsourced provision of technical support may be suddenly and adversely impacted by unforeseen events, for example, as recently occurred when certain business process outsourced service providers were delayed in effectively servicing our customers due to conditions related to the COVID-19 pandemic. Increased customer demand for these services, without corresponding revenues, could increase costs and adversely affect our operating results. In addition, our sales process is highly dependent on our applications and business reputation and on positive recommendations from our existing customers. Any failure to maintain high-quality technical support, or a market perception that we do not maintain high-quality support, could adversely affect our reputation, our ability to sell our enterprise cloud computing solutionsservice offerings to existing and prospective customers, and our business, operating results and financial position.
Periodic changes to our sales organization can be disruptive and may reduce our rate of growth.
We periodically change and make adjustments to our sales organization in response to market opportunities, competitive threats, management changes, product introductions or enhancements, acquisitions, sales performance, increases in sales headcount, cost
levels and other internal and external considerations. Any such futureSuch sales organization changes have in some periods resulted in, and may in the future result in, a temporary reduction of productivity, which could negatively affectimpact our rate of growth.growth and operating results. In addition, any significant change to the way we structure our compensation of our sales organization may be disruptive and may affect our revenue growth.
Unanticipated changes in our effective tax rate and additional tax liabilities and recent global tax developments may impact our financial results.
We are subject to income taxes in the United States and various jurisdictions outside of the United States. Significant judgment is often required in the determination of our worldwide provision for income taxes. Our effective tax rate could fluctuate due tobe impacted by changes in the mix ofour earnings and losses in countries with differing statutory tax rates. Our tax expense could also be impacted byrates, changes in operations, changes in non-deductible expenses, changes in excess tax benefits of stock-based compensation, changes in the valuation of deferred tax assets and liabilities and our ability to utilize them, the applicability of withholding taxes, and effects from acquisitions.
We are subject to tax examinations in multiple jurisdictions. While we regularly evaluate new information that may change our judgment resulting in recognition, derecognition or change in measurement of a tax position taken, there can be no assurance that the final determination of any examinations will not have an adverse effect on our operating resultsacquisitions, and financial position.
Our tax provision could also be impacted by changes in accounting principles and tax laws. Any changes, in U.S. federal and stateambiguity, or international tax laws applicable to corporate multinationals. Countries such as the United Kingdom and Australia have enacted new legislation in recent years, while other countries are currently considering fundamental law changes. In particular, U.S. lawmakers recently proposed many significant changes that could have a material impact on our financial statements. Additionally, changesuncertainty in taxing jurisdictions' administrative interpretations, decisions, policies and positions could also materially impact our income tax liabilities.
We may also be subject to additional tax liabilities and penalties due to changes in non-income based taxes resulting from changes in federal, state or international tax laws, changes in taxing jurisdictions’ administrative interpretations, decisions, policies, and positions, results of tax examinations, settlements or judicial decisions, changes in accounting principles, or changes
to theour business operations including acquisitions, as well as the evaluationa result of acquisitions. Any resulting increase in our tax obligation or cash taxes paid could adversely affect our cash flows and financial results.
We are also subject to tax examinations in multiple jurisdictions. While we regularly evaluate new information that resultsmay change our judgment resulting in a change torecognition, derecognition or changes in measurement of a tax position taken, there can be no assurance that the final determination of any examinations will not have an adverse effect on our operating results or financial position.
As our business continues to grow, increasing our brand recognition and profitability, we may be subject to increased scrutiny and corresponding tax disputes, which may impact our cash flows and financial results. Furthermore, our growing prominence may bring public attention to our tax profile, and if perceived negatively, may cause brand or reputational harm.
As we utilize our tax credits and net operating loss carry-forwards, we may be unable to mitigate our tax obligations to the same extent as in prior years, which could have a prior period.material impact to our future cash flows. In addition, changes to our operating structure including changes related to acquisitions may result in cash tax obligations.
In addition, recent global tax developments applicable to multinational businesses may have a material impact to our business, cash flow from operating activities, or financial results. Such developments, for example, include the Organization for Economic Co-operation and Development’s, the European Commission’s, and certain major jurisdictions' heightened interest in and taxation of companies participating in the digital economy. Governments’ responses to the economic impact of COVID-19 may lead to tax rule changes that could materially and adversely affect our cash flows and financial results.
Our debt service obligations, and operating lease commitments and other contractual obligations may adversely affect our financial condition and cash flows from operations.
We haveAs of April 30, 2020, we had a substantial level of debt, including the 0.25% convertible senior notes we issued in March 2013 (“0.25% our 2023 and 2028 Senior Notes ("Senior Notes”) due April 1, 2018,, the loan we assumed when we purchased an office building located at 50 Fremont Street in San Francisco, California (“50 Fremont”), the $500.0 million term loan to finance our acquisition of Demandware, due July 11, 2019 (the “term loan”)June 2023 and capital lease arrangements. We also have a Credit Facility under which we can draw $1.0 billion. Additionally, we have significant contractual commitments, in operating lease arrangements,such as commitments with infrastructure service providers, which are not reflected on our condensed consolidated balance sheets. In addition, we have a financing obligation for a leased facility of which we are deemed the owner for accounting purposes. In July 2016, we amended and restated our revolving credit facility under which we can draw down up to $1.0 billion. Maintenance of our indebtedness and contractual commitments and any additional issuances of indebtedness could:
•impair our ability to obtain additional financing in the future for working capital, capital expenditures, acquisitions, general corporate or other purposes;
•cause us to dedicate a substantial portion of our cash flows from operations towards debt service obligations and principal repayments; and
•make us more vulnerable to downturns in our business, our industry or the economy in general; and
due to limitations withingeneral, such as recent downturns in connection with the revolving credit facility and term loan covenants, restrict our ability to incur additional indebtedness, grant liens, merge or consolidate, disposeeffects of assets, make investments, make acquisitions, enter into transactions with affiliates, pay dividends or make distributions, repurchase stock and enter into restrictive agreements, as defined in the credit agreement.COVID-19 pandemic.
Our ability to meet our expenses and debt obligations will depend on our future performance, which will be affected by financial, business, economic, regulatory and other factors. We will not be able to control many of these factors, such as economic conditions and governmental regulations. Further, our operations may not generate sufficient cash to enable us to service our debt or contractual obligations resulting from our leases. If we fail to make a payment on our debt, we could be in default on such debt. If we are at any time unable to generate sufficient cash flows from operations to service our indebtedness when payment is due, we may be required to attempt to renegotiate the terms of the instruments relating to the indebtedness, seek to refinance all or a portion of the indebtedness or obtain additional financing. There can be no assurance that we would be able to successfully renegotiate such terms, that any such refinancing would be possible or that any additional financing could be obtained on terms that are favorable or acceptable to us. Any
new or refinanced debt may be subject to substantially higher interest rates, which could adversely affect our financial condition and impact our business.
In addition, adverse changes by any rating agency to our credit rating may negatively impact the value and liquidity of both our debt and equity securities, as well as the potential costs associated with a refinancing of our debt. Downgrades in our credit ratings could also affect the terms of any such refinancing or future financing or restrict our ability to obtain additional financing in the future.
Our senior unsecured notes and senior unsecured credit agreement impose restrictions on us and require us to maintain compliance with specified covenants. Our ability to comply with these covenants may be affected by events beyond our control. A failure to comply with the covenants and other provisions of our outstanding debt could result in events of default under such instruments, which could permit acceleration of all of our notesdebt and borrowings. Any required repayment of our notesdebt or revolving credit facilityour Credit Facility as a result of a fundamental change or other acceleration would lower our current cash on hand such that we would not have those funds available for use in our business.
New leaseLease accounting guidance will requirerequires that we record a liability for operating lease activity on our condensed consolidated balance sheet, no later than fiscal 2020, which will result in an increase inincreases both our assets and financing obligations. The implementation of this guidanceliabilities and therefore may impact our ability to obtain the necessary financing from financial institutions at commercially viable rates or at all as this new guidanceall. Our lease terms may include options to extend or terminate the lease. These options are reflected in the operating lease right-of-use ("ROU") asset, which represents our right to use an underlying asset for the lease term, and lease liability only when it is reasonably certain that we will resultexercise that option. We reassess the lease term if and when a significant event or change in a higher financing obligation oncircumstances occurs within our consolidated balance sheet.
Weakened global economic conditions may adversely affect our industry, business and results of operations.
Our overall performance depends in part on worldwide economic and geopolitical conditions.control. The United States and other key international economies have experienced cyclical downturns from time to time in which economic activity was impacted by falling demand for a variety of goods and services, restricted credit, poor liquidity, reduced corporate profitability, volatility in credit, equity and foreign exchange markets, bankruptcies and overall uncertainty with respect to the economy. These economic conditions can arise suddenly and the fullpotential impact of such conditions can remain uncertain. In addition, recent geopolitical developments, including Brexit, have increased levels of politicalthese options to extend could be material to our financial position and economic unpredictability globally, and may increase the volatility of global financial markets; the impact of such developments on the global economy remains uncertain. Moreover, these conditions can affect the rate of information technology spending and could adversely affect our customers’ ability or willingness to purchase our enterprise cloud computing services, delay prospective customers’ purchasing decisions, reduce the value or duration of their subscription contracts, or affect attrition rates, all of which could adversely affect our operating results.
Natural disasters and other events beyond our control couldhave in the past and may in the future materially adversely affect us.
Natural disasters or other catastrophic events have in the past and may in the future cause damage or disruption to our operations, international commerce and the global economy, and thus could have a strong negative effect on us. Our business operations are subject to interruption
by natural disasters, fire, power shortages, pandemics (including the ongoing COVID-19 pandemic) and other events beyond our control. For example, in response to the COVID-19 pandemic we temporarily closed our offices globally, including our corporate headquarters and are experiencing and expect to continue to experience ongoing effects related to the local and global economic and other effects of this pandemic. Although we maintain crisis management and disaster response plans, such events could make it difficult or impossible for us to deliver our services to our customers, and could decrease demand for our services. Our corporate headquarters, and a significant portion of our research and development activities, information technologyIT systems, and other critical business operations, are located near major seismic faults in the San Francisco Bay Area. Because we do not carry earthquake insurance for direct quake-related losses, with the exception of the building that we own in San Francisco, and significant recovery time could be required to resume operations, our financial condition and operating results could be materially adversely affected in the event of a major earthquake or catastrophic event.event, and the adverse effects of any such catastrophic event would be exacerbated if experienced at the same time as another unexpected and adverse event, such as the COVID-19 pandemic.
Climate change may have a long-term impact on our business.
While we seek to mitigate our business risks associated with climate change by establishing robust environmental programs and partnering with organizations who are also focused on mitigating their own climate related risks, we recognize that there are inherent climate related risks wherever business is conducted. Access to clean water and reliable energy in the communities where we conduct our business, whether for our offices, data centers, vendors, customers or other stakeholders, is a priority and is not guaranteed. Any of our primary locations may be vulnerable to the adverse effects of climate change. For example, our California headquarters are projected to be vulnerable to future water scarcity due to climate change. Climate-related events, including the increasing frequency of extreme weather events and their impact on critical infrastructure in the U.S. and elsewhere, have the potential to disrupt our business, our third-party suppliers, and the business of our customers, and may cause us to experience higher attrition, losses and additional costs to maintain or resume operations.
Current and future accounting pronouncements and other financial and non-financial reporting standards especially but not only concerning revenue recognition, cost capitalization and lease accounting, may negatively impact our financial results.
We regularly monitor our compliance with applicable financial reporting standards and review new pronouncements and drafts thereofinterpretations that are relevant to us. As a result of new standards, changes to existing standards and changes in their interpretation, we mightmay be required to change our accounting policies, particularly concerning revenue recognition, the capitalized incremental costs to obtain a customer contract and lease accounting, to alter our operational policies, and to implement new or enhance existing systems so that they reflect new or amended financial reporting standards, orand to restateadjust our published financial statements. Such changes may have an adverse effect on our reputation, business, financial position, and profit,operating results, or cause an adverse deviation from our revenue and operating profit target,targets, which may negatively impact our financial results.
In addition, as we work to align with the recommendations of the Financial Stability Board's Task Force on Climate-related Financial Disclosures ("TCFD"), the Sustainability Accounting Standards Board ("SASB"), and our own Environmental, Social, Governance (“ESG”) materiality assessment, we have and, in the future, may continue to expand our disclosures in these areas. This transparency is consistent with our commitment to executing on a strategy that reflects the economic, social, and environmental impact
we have on the world while advancing and complementing our business strategy. Our disclosures on these matters, and standards we set for ourselves or a failure to meet these standards, may influence our reputation and the value of our brand. Our failure to achieve progress on our metrics on a timely basis, or at all, could adversely affect our reputation, business, financial performance, and growth.
By electing to set and share publicly these corporate ESG standards, our business may also face increased scrutiny related to ESG activities. As a result, we could damage our reputation and the value of our brand if we fail to act responsibly in the areas in which we report. Any harm to our reputation resulting from setting these standards or our failure or perceived failure to meet such standards could adversely affect our business, financial performance, and growth.
We may be subject to risks related to government contracts and related procurement regulations.
Our contracts with federal, state, local, and foreign government entities are subject to various procurement regulations and other requirements relating to their formation, administration and performance. We may be subject to audits and investigations relating to our government contracts, and any violations could result in various civil and criminal penalties and administrative sanctions, including termination of contract,contracts, refunding or suspending of payments, forfeiture of profits, payment of fines, and suspension or debarment from future government business. In addition, such contracts may provide for termination by the government at any time, without cause.cause, and termination of any such contract may adversely impact our other existing or prospective government contracts. Any of these risks related to contracting with governmental entities could adversely impact our future sales and operating results.
We are subject to governmental export and import controls that could impair our ability to compete in international markets and subject us to liability if we are not in full compliance with applicable laws.
Our solutions are subject to export and import controls, including the Commerce Department’s Export Administration Regulations, U.S. Customs regulations and various economic and trade sanctions regulations established by the Treasury Department’s Office of Foreign Assets Control. If we fail to comply with these U.S. export control laws and import laws we and certain of our employees could be subject to substantial civil or criminal penalties, including the possible loss of export or import privileges; fines, which may be imposed on us and responsible employees or managers; and, in extreme cases, the incarceration of responsible employees or managers. Obtaining the necessary authorizations, including any required license, may be time-consuming, and require expenditure of significant corporate resources, is not guaranteed and may result in the delay or loss of sales opportunities.opportunities or the ability to realize value from certain acquisitions. Furthermore, the U.S. export control laws and economic sanctions laws prohibit the shipment of certain products and services to U.S. embargoed or sanctioned countries, governments and persons. Even though we take precautions to prevent our solutions from being provisioned or provided to U.S. sanctions targets in violation of applicable regulations, our solutions could be provisioned to those targets or provided by our resellers despite such precautions. Any such sales could have negative consequences, including government investigations, penalties and reputational harm. Changes in our solutions or changes in export and import regulations may create delays in the introduction, sale and deployment of our solutions in international markets or prevent the export or import of our solutions to certain countries, governments or persons altogether. Any decreased use of our solutions or limitation on our ability to export or sell our solutions would likely adversely affect our business, financial condition and results of operations. Import and export control regulations in the U.S. and other countries are subject to change and uncertainty, including as a result of geopolitical developments, which may be amplified by considerations related to United States election cycles and the effects of the COVID-19 pandemic.
Risks RelatingRelated to Our Convertible Senior Notes and Our Common Stock
The market price of our common stock is likely to be volatile and could subject us to litigation.
The trading prices of the securities of technology companies have historically been highly volatile. Accordingly, the market price of our notes and common stock has been and is likely to continue to be subject to wide fluctuations. Factors affecting the market price of our notes and common stock include:
•variations in our operating results, earnings per share, cash flows from operating activities, deferredunearned revenue, remaining performance obligation, year-over-year growth rates for individual core service offerings and other financial metrics and non-financial metrics, such as transaction usage volumes and other usage metrics, and how those results compare to analyst expectations;
•variations in, and limitations of, the various financial and other metrics and modeling used by analysts in their research and reports about our business;
•forward-looking guidance to industry and financial analysts related to, for example, future revenue, unearned revenue, remaining performance obligation, cash flows from operating activities and earnings per share;share, the accuracy of which may be impacted by various factors, many of which are beyond our control, including general economic and market conditions and unanticipated delays in the integration of acquired companies as a result of regulatory review;
•our ability to meet or exceed forward-looking guidance we have given or to meet or exceed the expectations of investors, analysts or others; our ability to give forward-looking guidance consistent with past practices; and changes to or withdrawal of previous guidance or long-range targets, including due to uncertainty in connection with effects of the COVID-19 pandemic;
•changes in the estimates of our operating results or changes in recommendations by securities analysts that elect to follow our common stock;
•announcements of technological innovations, new services or service enhancements, strategic alliances or significant agreements by us or by our competitors;
•announcements by us or by our competitors of mergers or other strategic acquisitions, or rumors of such transactions involving us or our competitors;
•announcements of customer additions and customer cancellations or delays in customer purchases;
•the coverage of our common stock by the financial media, including television, radio and press reports and blogs;
•recruitment or departure of key personnel;
•disruptions in our service due to computer hardware, software, network or data center problems;
•the economy as a whole, geopolitical conditions, including global trade and health concerns, market conditions in our industry and the industries of our customers;
•trading activity by a limited number of stockholders who together beneficially own a significant portion of our outstanding common stock;
•the issuance of shares of common stock by us, whether in connection with an acquisition or a capital raising transaction or upon conversion of some or all of our outstanding convertible senior notes; andtransaction;
•issuance of debt or other convertible securities.securities;
•changes to our credit ratings; and
•environmental, social, governance and other issues impacting the Company's reputation.
In addition, if the market for technology stocks or the stockgreater securities market, including debt offerings, in general experiences uneven investor confidence, the market price of our notes and common stock could decline for reasons unrelated to our business, operating results or financial condition. The market price of our notes and common stock might also decline in reaction to events that affect other companies within, or outside, our industry even if these events do not directly affect us. Some companies that have experienced volatility in the trading price of their stock have been the subject of securities class action litigation. Iflitigation such as securities litigation against Tableau that was brought before we are the subject of suchacquired that company. Such litigation, itwhether against Salesforce or an acquired subsidiary, could result in substantial costs and a diversion of management’s attention and resources.
We may issue additional shares of our common stock or instruments convertible into shares of our common stock, including in connection with the conversion of the notes,resources and thereby materially and adversely affect the market price of our common stock and the trading price of the notes.
We are not restrictedliability resulting from issuing additional shares of our common stock or other instruments convertible into, or exchangeable or exercisable for, shares of our common stock during the life of the notes. If we issue additional shares of our common stock or instruments convertible into shares of our common stock, it may materially and adversely affect the market price of our common stock and, in turn, the trading price of the notes. In addition, the conversion of some or all of the notes may dilute the ownership interests of existing holders of our common stock, and any sales in the public market of any shares of our common stock issuable upon such conversion of the notes could adversely affect the prevailing market price of our common stock. In addition, the potential conversion of the notes could depress the market price of our common stock.
We may not have the ability to pay the amount of cash due upon conversion of the notes or the fundamental change purchase price due when a holder submits its notes for purchase upon the occurrencesettlement of a fundamental change.
Upon the occurrence of a fundamental change, holders of the notes may require us to purchase, for cash, all or a portion of their notes. In addition, if a holder converts its notes, we will generally pay such holder an amount of cash before delivering to such holder any shares of our common stock.
There can be no assurance that we will have sufficient financial resources, or will be able to arrange financing, to pay the fundamental change purchase price if holders submit their notes for purchase by us upon the occurrence of a fundamental change or to pay the amount of cash due if holders surrender their notes for conversion. In addition, agreements governing any future debt may restrict our ability to make each of the required cash payments even if we have sufficient funds to make them. Furthermore, our ability to purchase the notes or to pay cash upon the conversion of the notes may be limited by law or regulatory authority. If we fail to purchase the notes, to pay interest due on the notes, or to pay the amount of cash due upon conversion, we will be in default under the indenture, which in turn may result in the acceleration of other indebtedness we may then have. If the repayment of the other indebtedness were to be accelerated, we may not have sufficient funds to repay that indebtedness and to purchase the notes or to pay the amount of cash due upon conversion. Our inability to pay for the notes that are tendered for purchase or upon conversionlitigation could result in note holders receiving substantially less than the principal amount of the notes, which could harm our reputation, financing opportunities and our business.
The fundamental change provisions of the notes may delay or prevent an otherwise beneficial takeover attempt of us.
The fundamental change purchase rights will allow holders of the notes to require us to purchase all or a portion of their notes upon the occurrence of a fundamental change. The provisions requiring an increase to the conversion rate for conversions in connection with a make-whole fundamental change may, in certain circumstances, delay or prevent a takeover of us and the removal of incumbent management that might otherwise be beneficial to investors.
The convertible note hedges and warrant transactions may affect the trading price of the notes and the market price of our common stock.
We entered into privately negotiated convertible note hedge transactions with certain hedge counterparties concurrently with the pricing of the notes. We also entered into privately negotiated warrant transactions with the hedge counterparties. Taken together, the convertible note hedge transactions and the warrant transactions are expected, but not guaranteed, to reduce the potential dilution with respectmaterial adverse impacts to our common stock upon conversionoperating cash flows or results of the notes. If, however, the price of our common stock, as measured under the terms of the warrant transactions, exceeds the exercise price of the warrant transactions, the warrant transactions will haveoperations for a dilutive effect on our earnings per share to the extent that the price of our common stock as measured under the warrant transactions exceeds the strike price of the warrant transactions.
The hedge counterparties and their respective affiliates periodically modify their hedge positions from time to time following the pricing of the notes (and are particularly likely to do so during any observation period relating to a conversion of the notes) by entering into or unwinding various over-the-counter derivative transactions with respect to our common stock, or by purchasing or selling shares of our common stock or the notes in privately negotiated transactions or open market transactions. The effect, if any, of these transactions and activities on the market price of our common stock or the trading price of the notes will depend in part on market conditions and cannot be ascertained at this time. Any of these activities could adversely affect the market price of our common stock and the trading price of the notes.
We do not make any representation or prediction as to the direction or magnitude of any potential effect that the transactions described above may have on the price of the notes or our common stock. In addition, we do not make any representation that the counterparties to those transactions will engage in these transactions or activities or that these transactions and activities, once commenced, will not be discontinued without notice; the counterparties or their affiliates may choose to engage in, or discontinue engaging in, any of these transactions or activities with or without notice at any time, and their decisions will be in their sole discretion and not within our control.
We are subject to counterparty risk with respect to the convertible note hedge transactions.
The hedge counterparties are financial institutions or affiliates of financial institutions, and we will be subject to the risk that these hedge counterparties may default under the convertible note hedge transactions. Our exposure to the credit risk of the hedge counterparties will not be secured by any collateral. If one or more of the hedge counterparties to one or more of our convertible note hedge transactions becomes subject to insolvency proceedings, we will become an unsecured creditor in those proceedings with a claim equal to our exposure at the time under those transactions. Our exposure will depend on many factors but, generally, the increase in our exposure will be correlated to the increase in our stock price and the volatility of our stock. In addition, upon a default by one of the hedge counterparties, we may suffer adverse tax consequences and dilution with respect to our common stock. We can provide no assurances as to the financial stability or viability of any of the hedge counterparties.given period.
Provisions in our amended and restated certificate of incorporation and bylaws and Delaware law might discourage, delay or prevent a change of control of our company or changes in our management and, therefore, depress the market price of our common stock.
Our amended and restated certificate of incorporation and bylaws contain provisions that could depress the market price of our common stock by acting to discourage, delay or prevent a change in control of our company or changes in our management that the stockholders of our company may deem advantageous. These provisions among other things:
•permit the board of directors to establish the number of directors;
provide that directors may only be removed with the approval of holders of 66 2/3 percent of our outstanding capital stock;
require super-majority voting to amend some provisions in our amended and restated certificate of incorporation and bylaws;
•authorize the issuance of “blank check” preferred stock that our board could use to implement a stockholder rights plan (also known as a “poison pill”);
prohibit the ability of our stockholders to call special meetings of stockholders;
•prohibit stockholder action by written consent, which requires all stockholder actions to be taken at a meeting of our stockholders;
•provide that the board of directors is expressly authorized to make, alter or repeal our bylaws; and
•establish advance notice requirements for nominations for election to our board or for proposing matters that can be acted upon by stockholders at annual stockholder meetings.
In addition, Section 203 of the Delaware General Corporation Law may discourage, delay or prevent a change in control of our company. Section 203 imposes certain restrictions on merger, business combinations and other transactions between us and holders of 15 percent or more of our common stock.
In addition, the fundamental change purchase rights applicable to the notes, which will allow note holders to require us to purchase all or a portion
ITEM 2. UNREGISTERED SALES OF EQUITY SECURITIES AND USE OF PROCEEDS
In connection with the acquisition of MetaMind, Inc. in April 2016, the Company issued 1,58012,012 shares of Company common stock on OctoberApril 1, 2020. In connection with the acquisition of Evergage, the Company issued 18,710 shares of Company common stock on February 3, 2020. In connection with the acquisition of CMO Club, the Company issued 13,933 shares of Company common stock on March 2, 2017. This issuance was2020. These issuances were made in reliance on one or more of the following exemptions or exclusions from the registration requirements of the Securities Act of 1933, as amended (the “Securities Act”): Section 4(a)(2) of the Securities Act, Regulation D promulgated under the Securities Act, and Regulation S promulgated under the Securities Act.
ITEM 3. DEFAULTS UPON SENIOR SECURITIES
Not applicable.
| |
ITEM 4. | MINE SAFETY DISCLOSURES |
ITEM 4. MINE SAFETY DISCLOSURES
Not applicable.
ITEM 5. OTHER INFORMATION
Not applicable.
ITEM 6. EXHIBITS
The documents listed in the Index to Exhibits of this quarterly report on Form 10-Q are incorporated by reference or are filed with this quarterly report on Form 10-Q, in each case as indicated therein (numbered in accordance with Item 601 of Regulation S-K).
Index to Exhibits
| | | | | | | | | | | | | | | | | | | | | | | | | | | | | | | | | | | | | | |
Exhibit
No. | | | | Provided
Herewith | | Incorporated by Reference |
| Exhibit Description | | Form | | SEC File No. | | Exhibit | | Filing Date |
| | | | | | | | | | | | |
| | | | | | | | | | | | |
| | | | | | | | | | | | |
| 3.1 | | | | | | 8-K | | 001-32224 | | 3.1 | | 6/7/2019 |
| 3.2 | | | | | | 8-K | | 001-32224 | | 3.2 | | 6/7/2019 |
| | | | | | | | | | | | |
| | | | | | | | | | | | |
| | | | | | | | | | | | |
| | | | | | | | | | | | |
| | | | | | | | | | | | |
| | | | | | | | | | | | |
| | | | | | | | | | | | |
| | | | | | | | | | | | |
| | | | | | | | | | | | |
| 10.1 | | | | | | S-8 | | 333-236918 | | 4.3 | | 3/5/2020 |
| 10.2* | | | | X | | | | | | | | |
| | | | | | | | | | | | |
| | | | | | | | | | | | |
| | | | | | | | | | | | |
| | | | | | | | | | | | |
| | | | | | | | | | | | |
| | | | | | | | | | | | |
| | | | | | | | | | | | |
| | | | | | | | | | | | |
| | | | | | | | | | | | |
| | | | | | | | | | | | |
| | | | | | | | | | | | |
| | | | | | | | | | | | |
| | | | | | | | | | | | |
| | | | | | | | | | | | |
| | | | | | | | | | | | |
| | | | | | | | | | | | |
| | | | | | | | | | | | |
| | | | | | | | | | | | |
| | | | | | | | | | | | |
| | | | | | | | | | | | |
| | | | | | | | | | | | |
| | | | | | | | | | | | |
| | | | | | | | | | | | |
| | | | | | | | | | | | |
| | | | | | | | | | | | |
| | | | | | | | | | | | |
| | | | | | | | | | | | |
| | | | | | | | | | | | |
| | | | | | | | | | | | |
| | | | | | | | | | | | |
| | | | | | | | | | | | |
| | | | | | | | | | | | |
| | | | | | | | | | | | |
| | | | | | | | | | | | |
| | | | | | | | | | | | |
| | | | | | | | | | | | |
| | | | | | | | | | | | |
| | | | | | | | | | | | |
| | | | | | | | | | | | |
| | | | | | | | | | | | |
| | | | | | | | | | | | |
| | | | | | | | | | | | |
| | | | | | | | | | | | |
| | | | | | | | | | | | |
| | | | | | | | | | | | |
| | | | | | | | | | | | |
| 10.3* | | | | X | | | | | | | | |
| 31.1 | | | | X | | | | | | | | |
| 31.2 | | | | X | | | | | | | | |
| 32.1 | | | | X | | | | | | | | |
| 101.INS | | Inline XBRL Instance Document | | | | | | | | | | |
| 101.SCH | | Inline XBRL Taxonomy Extension Schema Document | | | | | | | | | | |
| 101.CAL | | Inline XBRL Taxonomy Extension Calculation Linkbase Document | | | | | | | | | | |
| 101.DEF | | Inline XBRL Extension Definition | | | | | | | | | | |
| 101.LAB | | Inline XBRL Taxonomy Extension Label Linkbase Document | | | | | | | | | | |
| 101.PRE | | Inline XBRL Taxonomy Extension Presentation Linkbase Document | | | | | | | | | | |
| 104 | | The cover page from the Company's Quarterly Report on Form 10-Q for the period ended April 30, 2020, formatted in Inline XBRL (included in Exhibit 101). | | | | | | | | | | |
* Indicates a management contract or compensatory plan or arrangement.
|
| | | | | | | | | | | | | |
Exhibit No. | | Exhibit Description | | Provided Herewith | | Incorporated by Reference |
| Form | | SEC File No. | | Exhibit | | Filing Date |
| | | | | | | | | | | | | |
| 3.1 | | | | | | 8-K | | 001-32224 | | 3.1 |
| | 06/03/2016 |
| | | | | | | | | | | | | |
| 3.2 | | | | | | 8-K | | 001-32224 | | 3.2 |
| | 03/21/2016 |
| | | | | | | | | | | | | |
| 10.1 | | | | X | | | | | | | | |
| | | | | | | | | | | | | |
| 31.1 | | | | X | | | | | | | | |
| | | | | | | | | | | | | |
| 31.2 | | | | X | | | | | | | | |
| | | | | | | | | | | | | |
| 32.1 | | | | X | | | | | | | | |
| | | | | | | | | | | | | |
| 101.INS | | XBRL Instance Document | | | | | | | | | | |
| | | | | | | | | | | | | |
| 101.SCH | | XBRL Taxonomy Extension Schema Document | | | | | | | | | | |
| | | | | | | | | | | | | |
| 101.CAL | | XBRL Taxonomy Extension Calculation Linkbase Document | | | | | | | | | | |
| | | | | | | | | | | | | |
| 101.DEF | | XBRL Extension Definition Linkbase Document | | | | | | | | | | |
| | | | | | | | | | | | | |
| 101.LAB | | XBRL Taxonomy Extension Label Linkbase Document | | | | | | | | | | |
| | | | | | | | | | | | | |
| 101.PRE | | XBRL Taxonomy Extension Presentation Linkbase Document | | | | | | | | | | |
SIGNATURES
Pursuant to the requirements of Section 13 or 15(d) of the Securities Exchange Act of 1934, the registrant has duly caused this report to be signed on its behalf by the undersigned thereunto duly authorized.
| | | | | | | | | | | | | | | | | | | | |
| | | | | | |
| Dated: June 1, 2020 | | | | | | |
Dated: November 22, 2017 | | | | | | salesforce.com, inc. |
| | | | salesforce.com, inc. | | |
| | | | By: | | |
| | | | By: | | /S/ MARK J. HAWKINS |
| | | | | | s/ Mark J. Hawkins |
| | | | | | Mark J. Hawkins |
| | | | | | President and
Chief Financial Officer
(Principal Financial Officer)
|
| | | | | | |
Dated: November 22, 2017June 1, 2020 | | | | | | |
| | | | salesforce.com, inc. |
| | | | | | |
| | | | By: | | /S/ JOE ALLANSON |
| | | | | | s/ Joe Allanson |
| | | | | | Joe Allanson |
| | | | | | Executive Vice President,
Chief Accounting Officer
and Corporate Controller
(Principal Accounting Officer)
|