UNITED STATES
SECURITIES AND EXCHANGE COMMISSION
Washington D.C. 20549
________________
FORM 10-Q
(Mark One)
☑ QUARTERLY REPORT PURSUANT TO SECTION 13 OR 15(d)
OF THE SECURITIES EXCHANGE ACT OF 1934
For the quarterly period ended September 30, 20192020
OR
☐ TRANSITION REPORT PURSUANT TO SECTION 13 OR 15(d)
OF THE SECURITIES EXCHANGE ACT OF 1934
For the transition period from ____________ to ____________
Commission file number 001-15827
VISTEON CORPORATIONCORPORATION
(Exact name of registrant as specified in its charter) |
| | | | | | | | | | |
| State of | Delaware | | 38-3519512 |
| (State or other jurisdiction of incorporation or organization) | (I.R.S. Employer Identification No.) |
| One Village Center Drive, | Van Buren Township, | Michigan | 48111 |
| (Address of principal executive offices) | (Zip code) |
Registrant’s telephone number, including area code: (800)-VISTEON(800)-VISTEON
Securities registered pursuant to Section 12(b) of the Act: |
| | | | | | | |
| Title of each class | Trading Symbol(s) | Name of each exchange on which registered |
| Common Stock, Par Value $.01 Per Share | VC | The NASDAQ Stock Market LLC |
Indicate by check mark whether the registrant: (1) has filed all reports required to be filed by Section 13 or 15(d) of the Securities Exchange Act of 1934 during the preceding 12 months (or for such shorter period that the Registrant was required to file such reports), and (2) has been subject to such filing requirements for the past 90 days. Yes ü No__
Indicate by check mark whether the registrant: has submitted electronically and posted on its corporate Web site, if any, every Interactive Data File required to be submitted and posted pursuant to Rule 405 of Regulation S-T (§232.405 of this chapter) during the preceding 12 months (or for such shorter period that the registrant was required to submit and post such files). Yes ü No __
Indicate by check mark whether the registrant is a large accelerated filer, an accelerated filer, a non-accelerated filer, a smaller reporting company, or an emerging growth company. See the definitions of “large accelerated filer," "accelerated filer,” "smaller reporting company" and “emerging growth company" in Rule 12b-2 of the Exchange Act.
Large accelerated filer ü Accelerated filer __ Non-accelerated filer __ Smaller reporting company ☐
Emerging growth company ☐
If an emerging growth company, indicate by check mark if the registrant has elected not to use the extended transition period for complying with any new or revised financial accounting standards provided pursuant to Section 13(a) of the Exchange Act. __
Indicate by check mark whether the registrant is a shell company (as defined in Rule 12b-2 of the Exchange Act). Yes ☐ No ü
Indicate by check mark whether the registrant has filed all documents and reports required to be filed by Sections 12, 13 or 15(d) of the Securities Exchange Act of 1934 subsequent to the distribution of securities under a plan confirmed by a court. Yes ü No__
As of October 17, 2019,23, 2020, the registrant had outstanding 27,965,33627,832,807 shares of common stock.
Exhibit index located on page number 44.40.
Visteon Corporation and Subsidiaries
Index
|
| | | | | | | |
| Page |
| | |
| | |
| | |
| | |
| Condensed Consolidated Statements of Changes in Equity (Unaudited) | |
| | |
| | |
| | |
| | |
| |
| | |
| | |
| | |
| | |
| |
| |
Part I
Financial Information
| |
Item 1. | Consolidated Financial Statements |
Item 1.Condensed Consolidated Financial Statements
VISTEON CORPORATION AND SUBSIDIARIES
CONDENSED CONSOLIDATED STATEMENTS OF COMPREHENSIVE INCOME (LOSS)
(Dollars in Millions Except Per Share Amounts)In millions except per share amounts)
(Unaudited)
| | | | | | | | | | | | | | | | | | | | | | | |
| Three Months Ended September 30, | | Nine Months Ended
September 30, |
| 2020 | | 2019 | | 2020 | | 2019 |
| Net sales | $ | 747 | | | $ | 731 | | | $ | 1,761 | | | $ | 2,201 | |
| Cost of sales | (648) | | | (647) | | | (1,605) | | | (1,981) | |
| Gross margin | 99 | | | 84 | | | 156 | | | 220 | |
| Selling, general and administrative expenses | (45) | | | (52) | | | (140) | | | (167) | |
| Restructuring expense, net | (32) | | | (1) | | | (69) | | | (2) | |
| Interest expense | (6) | | | (4) | | | (14) | | | (10) | |
| Interest income | 1 | | | 1 | | | 4 | | | 3 | |
| Equity in net income of non-consolidated affiliates | 2 | | | 1 | | | 4 | | | 7 | |
| Other income, net | 3 | | | 2 | | | 10 | | | 7 | |
| Income (loss) before income taxes | 22 | | | 31 | | | (49) | | | 58 | |
| Provision for income taxes | (12) | | | (13) | | | (19) | | | (16) | |
| | | | | | | |
| | | | | | | |
| Net income (loss) | 10 | | | 18 | | | (68) | | | 42 | |
| Net income attributable to non-controlling interests | (4) | | | (4) | | | (6) | | | (7) | |
| Net income (loss) attributable to Visteon Corporation | $ | 6 | | | $ | 14 | | | $ | (74) | | | $ | 35 | |
| | | | | | | |
| Comprehensive income (loss) | $ | 30 | | | $ | (4) | | | $ | (80) | | | $ | 21 | |
| Less: Comprehensive income attributable to non-controlling interests | 7 | | | 1 | | | 9 | | | 4 | |
| Comprehensive income (loss) attributable to Visteon Corporation | $ | 23 | | | $ | (5) | | | $ | (89) | | | $ | 17 | |
| | | | | | | |
| | | | | | | |
| | | | | | | |
| | | | | | | |
| Basic earnings (loss) per share attributable to Visteon Corporation | $ | 0.22 | | | $ | 0.50 | | | $ | (2.65) | | | $ | 1.25 | |
| | | | | | | |
| | | | | | | |
| | | | | | | |
| | | | | | | |
| Diluted earnings (loss) per share attributable to Visteon Corporation | $ | 0.21 | | | $ | 0.50 | | | $ | (2.65) | | | $ | 1.24 | |
|
| | | | | | | | | | | | | | | |
| | Three Months Ended September 30 | | Nine Months Ended
September 30 |
| | 2019 | | 2018 | | 2019 | | 2018 |
| Sales | $ | 731 |
| | $ | 681 |
| | $ | 2,201 |
| | $ | 2,253 |
|
| Cost of sales | (647 | ) | | (599 | ) | | (1,981 | ) | | (1,938 | ) |
| Gross margin | 84 |
| | 82 |
| | 220 |
| | 315 |
|
| Selling, general and administrative expenses | (52 | ) | | (40 | ) | | (167 | ) | | (139 | ) |
| Restructuring expense, net | (1 | ) | | (18 | ) | | (2 | ) | | (28 | ) |
| Interest expense | (4 | ) | | (4 | ) | | (10 | ) | | (11 | ) |
| Interest income | 1 |
| | 2 |
| | 3 |
| | 5 |
|
| Equity in net income of non-consolidated affiliates | 1 |
| | 3 |
| | 7 |
| | 10 |
|
| Other income, net | 2 |
| | 7 |
| | 7 |
| | 17 |
|
| Income before income taxes | 31 |
| | 32 |
| | 58 |
| | 169 |
|
| Provision for income taxes | (13 | ) | | (9 | ) | | (16 | ) | | (42 | ) |
| Net income from continuing operations | 18 |
| | 23 |
| | 42 |
| | 127 |
|
| Income from discontinued operations, net of tax | — |
| | 1 |
| | — |
| | 2 |
|
| Net income | 18 |
| | 24 |
| | 42 |
| | 129 |
|
| Net income attributable to non-controlling interests | (4 | ) | | (3 | ) | | (7 | ) | | (8 | ) |
| Net income attributable to Visteon Corporation | $ | 14 |
| | $ | 21 |
| | $ | 35 |
| | $ | 121 |
|
| | | | | | | | |
| Comprehensive income (loss) | $ | (4 | ) | | $ | 8 |
| | $ | 21 |
| | $ | 91 |
|
| Comprehensive income (loss) attributable to Visteon Corporation | $ | (5 | ) | | $ | 8 |
| | $ | 17 |
| | $ | 87 |
|
| | | | | | | | |
| Basic earnings per share: | | | | | | | |
| Continuing operations | $ | 0.50 |
| | $ | 0.68 |
| | $ | 1.25 |
| | $ | 3.99 |
|
| Discontinued operations | — |
| | 0.03 |
| | — |
| | 0.07 |
|
| Basic earnings per share attributable to Visteon Corporation | $ | 0.50 |
| | $ | 0.71 |
| | $ | 1.25 |
| | $ | 4.06 |
|
| Diluted earnings per share: | | | | | | | |
| Continuing operations | $ | 0.50 |
| | $ | 0.68 |
| | $ | 1.24 |
| | $ | 3.95 |
|
| Discontinued operations | — |
| | 0.03 |
| | — |
| | 0.07 |
|
| Diluted earnings per share attributable to Visteon Corporation | $ | 0.50 |
| | $ | 0.71 |
| | $ | 1.24 |
| | $ | 4.02 |
|
See accompanying notes to the condensed consolidated financial statements.
VISTEON CORPORATION AND SUBSIDIARIES
CONDENSED CONSOLIDATED BALANCE SHEETS
(Dollars in Millions)In millions)
| | | | | | | | | | | |
| (Unaudited) | | |
| September 30, | | December 31, |
| 2020 | | 2019 |
| ASSETS |
| Cash and equivalents | $ | 431 | | | $ | 466 | |
| Restricted cash | 4 | | | 3 | |
| Accounts receivable, net | 476 | | | 514 | |
| Inventories, net | 164 | | | 169 | |
| Other current assets | 193 | | | 193 | |
| Total current assets | 1,268 | | | 1,345 | |
| Property and equipment, net | 418 | | | 436 | |
| Intangible assets, net | 126 | | | 127 | |
| Right-of-use assets | 168 | | | 165 | |
| Investments in non-consolidated affiliates | 51 | | | 48 | |
| Other non-current assets | 133 | | | 150 | |
| Total assets | $ | 2,164 | | | $ | 2,271 | |
| LIABILITIES AND EQUITY |
| Short-term debt | $ | 0 | | | $ | 37 | |
| Accounts payable | 494 | | | 511 | |
| Accrued employee liabilities | 74 | | | 73 | |
| Current lease liability | 31 | | | 30 | |
| Other current liabilities | 189 | | | 147 | |
| Total current liabilities | 788 | | | 798 | |
| Long-term debt, net | 348 | | | 348 | |
| Employee benefits | 280 | | | 292 | |
| Non-current lease liability | 145 | | | 139 | |
| Deferred tax liabilities | 29 | | | 27 | |
| Other non-current liabilities | 72 | | | 72 | |
| Stockholders’ equity: | | | |
| Preferred stock (par value $0.01, 50 million shares authorized, none outstanding as of September 30, 2020 and December 31, 2019) | 0 | | | 0 | |
| Common stock (par value $0.01, 250 million shares authorized, 55 million shares issued, 28 million shares outstanding as of September 30, 2020 and December 31, 2019) | 1 | | | 1 | |
| Additional paid-in capital | 1,344 | | | 1,342 | |
| Retained earnings | 1,605 | | | 1,679 | |
| Accumulated other comprehensive loss | (282) | | | (267) | |
| Treasury stock | (2,283) | | | (2,275) | |
| Total Visteon Corporation stockholders’ equity | 385 | | | 480 | |
| Non-controlling interests | 117 | | | 115 | |
| Total equity | 502 | | | 595 | |
| Total liabilities and equity | $ | 2,164 | | | $ | 2,271 | |
|
| | | | | | | |
| | (Unaudited) | | |
| | September 30 | | December 31 |
| | 2019 | | 2018 |
| ASSETS |
| Cash and equivalents | $ | 443 |
| | $ | 463 |
|
| Restricted cash | 3 |
| | 4 |
|
| Accounts receivable, net | 457 |
| | 486 |
|
| Inventories, net | 192 |
| | 184 |
|
| Other current assets | 192 |
| | 159 |
|
| Total current assets | 1,287 |
| | 1,296 |
|
| Property and equipment, net | 410 |
| | 397 |
|
| Intangible assets, net | 124 |
| | 129 |
|
| Right to use assets, net | 156 |
| | — |
|
| Investments in non-consolidated affiliates | 48 |
| | 42 |
|
| Other non-current assets | 139 |
| | 143 |
|
| Total assets | $ | 2,164 |
| | $ | 2,007 |
|
| LIABILITIES AND EQUITY |
| Short-term debt | $ | 47 |
| | $ | 57 |
|
| Accounts payable | 464 |
| | 436 |
|
| Accrued employee liabilities | 73 |
| | 67 |
|
| Current lease liabilities | 28 |
| | — |
|
| Other current liabilities | 150 |
| | 161 |
|
| Total current liabilities | 762 |
| | 721 |
|
| Long-term debt | 348 |
| | 348 |
|
| Employee benefits | 247 |
| | 257 |
|
| Non-current lease liabilities | 132 |
| | — |
|
| Deferred tax liabilities | 27 |
| | 23 |
|
| Other non-current liabilities | 64 |
| | 76 |
|
| Stockholders’ equity: | | | |
| Preferred stock (par value $0.01, 50 million shares authorized, none outstanding as of September 30, 2019 and December 31, 2018) | — |
| | — |
|
| Common stock (par value $0.01, 250 million shares authorized, 55 million shares issued, 28 million shares outstanding as of September 30, 2019 and December 31, 2018) | 1 |
| | 1 |
|
| Additional paid-in capital | 1,340 |
| | 1,335 |
|
| Retained earnings | 1,644 |
| | 1,609 |
|
| Accumulated other comprehensive loss | (234 | ) | | (216 | ) |
| Treasury stock | (2,277 | ) | | (2,264 | ) |
| Total Visteon Corporation stockholders’ equity | 474 |
| | 465 |
|
| Non-controlling interests | 110 |
| | 117 |
|
| Total equity | 584 |
| | 582 |
|
| Total liabilities and equity | $ | 2,164 |
| | $ | 2,007 |
|
See accompanying notes to the condensed consolidated financial statements.
VISTEON CORPORATION AND SUBSIDIARIES
CONDENSED CONSOLIDATED STATEMENTS OF CASH FLOWS1
(Dollars in Millions)In millions)
(Unaudited)
| | | | Nine Months Ended
September 30 | | Nine Months Ended September 30, |
| | 2019 | | 2018 | | 2020 | | 2019 |
| Operating Activities | | | | Operating Activities | | | |
| Net income | $ | 42 |
| | $ | 129 |
| |
| Adjustments to reconcile net income to net cash provided from operating activities: | | | | |
| Net income (loss) | | Net income (loss) | $ | (68) | | | $ | 42 | |
| Adjustments to reconcile net income (loss) to net cash provided from (used by) operating activities: | | Adjustments to reconcile net income (loss) to net cash provided from (used by) operating activities: | |
| Depreciation and amortization | 74 |
| | 67 |
| Depreciation and amortization | 75 | | | 74 | |
| Non-cash stock-based compensation | 14 |
| | 4 |
| Non-cash stock-based compensation | 13 | | | 14 | |
| Equity in net income of non-consolidated affiliates, net of dividends remitted | (7 | ) | | (10 | ) | Equity in net income of non-consolidated affiliates, net of dividends remitted | (4) | | | (7) | |
| Gains on transactions | — |
| | (8 | ) | |
| Other non-cash items | 5 |
| | 2 |
| Other non-cash items | 1 | | | 5 | |
| Changes in assets and liabilities: | | | | Changes in assets and liabilities: | |
| Accounts receivable | 17 |
| | 82 |
| Accounts receivable | 38 | | | 17 | |
| Inventories | (13 | ) | | (38 | ) | Inventories | 5 | | | (13) | |
| Accounts payable | 49 |
| | (17 | ) | Accounts payable | 11 | | | 49 | |
| Other assets and other liabilities | (63 | ) | | (104 | ) | Other assets and other liabilities | 26 | | | (63) | |
| Net cash provided from operating activities | 118 |
| | 107 |
| Net cash provided from operating activities | 97 | | | 118 | |
| Investing Activities | | | | Investing Activities | |
| Capital expenditures, including intangibles | (109 | ) | | (96 | ) | Capital expenditures, including intangibles | (83) | | | (109) | |
| Loan repayments from non-consolidated affiliates | 11 |
| | — |
| Loan repayments from non-consolidated affiliates | 2 | | | 11 | |
| Acquisition of business, net of cash acquired | — |
| | 16 |
| |
| Net investment hedge | | Net investment hedge | 7 | | | 4 | |
| Other | 2 |
| | 13 |
| Other | (3) | | | (2) | |
| Net cash used by investing activities | (96 | ) | | (67 | ) | Net cash used by investing activities | (77) | | | (96) | |
| Financing Activities | | | | Financing Activities | |
| Borrowings on revolving credit facility | | Borrowings on revolving credit facility | 400 | | | 0 | |
| Payments on revolving credit facility | | Payments on revolving credit facility | (400) | | | 0 | |
| Repurchase of common stock | (20 | ) | | (250 | ) | Repurchase of common stock | (16) | | | (20) | |
| Short-term debt, net | (8 | ) | | (13 | ) | |
| Dividends paid to non-controlling interests | (7 | ) | | (12 | ) | Dividends paid to non-controlling interests | (7) | | | (7) | |
| Distribution payments | — |
| | (14 | ) | |
| Stock compensation tax withholding payments | — |
| | (7 | ) | |
| Other | — |
| | 2 |
| |
| Short-term debt repayments, net | | Short-term debt repayments, net | (37) | | | (8) | |
| Net cash used by financing activities | (35 | ) | | (294 | ) | Net cash used by financing activities | (60) | | | (35) | |
| Effect of exchange rate changes on cash | (8 | ) | | (13 | ) | Effect of exchange rate changes on cash | 6 | | | (8) | |
| Net decrease in cash | (21 | ) | | (267 | ) | Net decrease in cash | (34) | | | (21) | |
| Cash and restricted cash at beginning of the period | 467 |
| | 709 |
| Cash and restricted cash at beginning of the period | 469 | | | 467 | |
| Cash and restricted cash at end of the period | $ | 446 |
| | $ | 442 |
| Cash and restricted cash at end of the period | $ | 435 | | | $ | 446 | |
1
The Company has combined cash flows from discontinued and continuing operations within the operating and financing categories.
See accompanying notes to the condensed consolidated financial statements.
VISTEON CORPORATION AND SUBSIDIARIES
CONDENSED CONSOLIDATED STATEMENTS OF CHANGES IN EQUITY
(Dollars in Millions)In millions)
(Unaudited)
| | | | | | | | | | | | | | | | | | | | | | | | | | | | | | | | | | | | | | | | | | | | | | | |
| Total Visteon Corporation Stockholders' Equity | | | | |
| Common
Stock | | Additional
Paid-In
Capital | | Retained
Earnings | | Accumulated
Other
Comprehensive
Income (Loss) | | Treasury
Stock | | Total Visteon Corporation Stockholders' Equity | | Non-Controlling Interests | | Total Equity |
| December 31, 2019 | $ | 1 | | | $ | 1,342 | | | $ | 1,679 | | | $ | (267) | | | $ | (2,275) | | | $ | 480 | | | $ | 115 | | | $ | 595 | |
| Net income (loss) | 0 | | | 0 | | | (35) | | | 0 | | | 0 | | | (35) | | | (1) | | | (36) | |
| Other comprehensive income (loss) | 0 | | | 0 | | | 0 | | | (37) | | | 0 | | | (37) | | | 0 | | | (37) | |
| Stock-based compensation, net | 0 | | | (5) | | | 0 | | | 0 | | | 7 | | | 2 | | | 0 | | | 2 | |
| Repurchase of shares of common stock | 0 | | | 0 | | | 0 | | | 0 | | | (16) | | | (16) | | | 0 | | | (16) | |
| Dividends declared to non-controlling interests | 0 | | | 0 | | | 0 | | | 0 | | | 0 | | | 0 | | | (7) | | | (7) | |
| March 31, 2020 | $ | 1 | | | $ | 1,337 | | | $ | 1,644 | | | $ | (304) | | | $ | (2,284) | | | $ | 394 | | | $ | 107 | | | $ | 501 | |
| Net income (loss) | 0 | | | 0 | | | (45) | | | 0 | | | 0 | | | (45) | | | 3 | | | (42) | |
| Other comprehensive income (loss) | 0 | | | 0 | | | 0 | | | 5 | | | 0 | | | 5 | | | 0 | | | 5 | |
| Stock-based compensation, net | 0 | | | 4 | | | 0 | | | 0 | | | 0 | | | 4 | | | — | | | 4 | |
| | | | | | | | | | | | | | | |
| | | | | | | | | | | | | | | |
| June 30, 2020 | $ | 1 | | | $ | 1,341 | | | $ | 1,599 | | | $ | (299) | | | $ | (2,284) | | | $ | 358 | | | $ | 110 | | | $ | 468 | |
| Net income (loss) | 0 | | | 0 | | | 6 | | | 0 | | | 0 | | | 6 | | | 4 | | | 10 | |
| Other comprehensive income (loss) | 0 | | | 0 | | | 0 | | | 17 | | | 0 | | | 17 | | | 3 | | | 20 | |
| Stock-based compensation, net | 0 | | | 3 | | | 0 | | | 0 | | | 1 | | | 4 | | | 0 | | | 4 | |
| | | | | | | | | | | | | | | |
| | | | | | | | | | | | | | | |
| September 30, 2020 | $ | 1 | | | $ | 1,344 | | | $ | 1,605 | | | $ | (282) | | | $ | (2,283) | | | $ | 385 | | | $ | 117 | | | $ | 502 | |
|
| | | | | | | | | | | | | | | | | | | | | | | | | | | | | | | |
| | Total Visteon Corporation Stockholders' Equity | | | | |
| | Common Stock | | Additional Paid-In Capital | | Retained Earnings | | Accumulated Other Comprehensive Income (Loss) | | Treasury Stock | | Total Visteon Corporation Stockholders' Equity | | Non-Controlling Interests | | Total Equity |
| December 31, 2018 | $ | 1 |
| | $ | 1,335 |
| | $ | 1,609 |
| | $ | (216 | ) | | $ | (2,264 | ) | | $ | 465 |
| | $ | 117 |
| | $ | 582 |
|
| Net income | — |
| | — |
| | 14 |
| | — |
| | — |
| | 14 |
| | 2 |
| | 16 |
|
| Other comprehensive income | — |
| | — |
| | — |
| | 4 |
| | — |
| | 4 |
| | 1 |
| | 5 |
|
| Stock-based compensation, net | — |
| | (5 | ) | | — |
| | — |
| | 7 |
| | 2 |
| | — |
| | 2 |
|
| Acquisition of non-controlling interest | — |
| | 2 |
| | — |
| | — |
| | — |
| | 2 |
| | (2 | ) | | — |
|
| March 31, 2019 | $ | 1 |
| | $ | 1,332 |
| | $ | 1,623 |
| | $ | (212 | ) | | $ | (2,257 | ) | | $ | 487 |
| | $ | 118 |
| | $ | 605 |
|
| Net income | — |
| | — |
| | 7 |
| | — |
| | — |
| | 7 |
| | 1 |
| | 8 |
|
| Other comprehensive loss | — |
| | — |
| | — |
| | (3 | ) | | — |
| | (3 | ) | | (1 | ) | | (4 | ) |
| Stock-based compensation, net | — |
| | 6 |
| | — |
| | — |
| | — |
| | 6 |
| | — |
| | 6 |
|
| Repurchase of shares of common stock | — |
| | — |
| | — |
| | — |
| | (20 | ) | | (20 | ) | | — |
| | (20 | ) |
| Dividends payable | — |
| | — |
| | — |
| | — |
| | — |
| | — |
| | (2 | ) | | (2 | ) |
| June 30, 2019 | $ | 1 |
| | $ | 1,338 |
| | $ | 1,630 |
| | $ | (215 | ) | | $ | (2,277 | ) | | $ | 477 |
| | $ | 116 |
| | $ | 593 |
|
| Net income | — |
| | — |
| | 14 |
| | — |
| | — |
| | 14 |
| | 4 |
| | 18 |
|
| Other comprehensive loss | — |
| | — |
| | — |
| | (19 | ) | | — |
| | (19 | ) | | (3 | ) | | (22 | ) |
| Stock-based compensation, net | — |
| | 2 |
| | — |
| | — |
| | — |
| | 2 |
| | — |
| | 2 |
|
| Cash dividends | — |
| | — |
| | — |
| | — |
| | — |
| | — |
| | (7 | ) | | (7 | ) |
| September 30, 2019 | $ | 1 |
| | $ | 1,340 |
| | $ | 1,644 |
| | $ | (234 | ) | | $ | (2,277 | ) | | $ | 474 |
| | $ | 110 |
| | $ | 584 |
|
| | | | | | | | | | | | | | | | | | | | | | | | | | | | | | | | | | | | | | | | | | | | | | | |
| Total Visteon Corporation Stockholders' Equity | | | | |
| Common
Stock | | Additional
Paid-In
Capital | | Retained
Earnings | | Accumulated
Other
Comprehensive
Income (Loss) | | Treasury
Stock | | Total Visteon Corporation Stockholders' Equity | | Non-Controlling Interests | | Total Equity |
| December 31, 2018 | $ | 1 | | | $ | 1,335 | | | $ | 1,609 | | | $ | (216) | | | $ | (2,264) | | | $ | 465 | | | $ | 117 | | | $ | 582 | |
| Net income (loss) | 0 | | | 0 | | | 14 | | | 0 | | | 0 | | | 14 | | | 2 | | | 16 | |
| Other comprehensive income (loss) | 0 | | | 0 | | | 0 | | | 4 | | | 0 | | | 4 | | | 1 | | | 5 | |
| Stock-based compensation, net | 0 | | | (5) | | | 0 | | | 0 | | | 7 | | | 2 | | | 0 | | | 2 | |
| Acquisition of non-controlling interest | 0 | | | 2 | | | 0 | | | 0 | | | 0 | | | 2 | | | (2) | | | 0 | |
| | | | | | | | | | | | | | | |
| March 31, 2019 | $ | 1 | | | $ | 1,332 | | | $ | 1,623 | | | $ | (212) | | | $ | (2,257) | | | $ | 487 | | | $ | 118 | | | $ | 605 | |
| Net income (loss) | 0 | | | 0 | | | 7 | | | 0 | | | 0 | | | 7 | | | 1 | | | 8 | |
| Other comprehensive income (loss) | 0 | | | 0 | | | 0 | | | (3) | | | 0 | | | (3) | | | (1) | | | (4) | |
| Stock-based compensation, net | 0 | | | 6 | | | 0 | | | 0 | | | 0 | | | 6 | | | 0 | | | 6 | |
| Dividends declared to non-controlling interests | 0 | | | 0 | | | 0 | | | 0 | | | 0 | | | 0 | | | (2) | | | (2) | |
| Repurchase of shares of common stock | 0 | | | 0 | | | 0 | | | 0 | | | (20) | | | (20) | | | 0 | | | (20) | |
| June 30, 2019 | $ | 1 | | | $ | 1,338 | | | $ | 1,630 | | | $ | (215) | | | $ | (2,277) | | | $ | 477 | | | $ | 116 | | | $ | 593 | |
| Net income (loss) | 0 | | | 0 | | | 14 | | | 0 | | | 0 | | | 14 | | | 4 | | | 18 | |
| Other comprehensive income (loss) | 0 | | | 0 | | | 0 | | | (19) | | | 0 | | | (19) | | | (3) | | | (22) | |
| Stock-based compensation, net | 0 | | | 2 | | | 0 | | | 0 | | | 0 | | | 2 | | | 0 | | | 2 | |
| Dividends declared to non-controlling interests | 0 | | | 0 | | | 0 | | | 0 | | | 0 | | | 0 | | | (7) | | | (7) | |
| | | | | | | | | | | | | | | |
| September 30, 2019 | $ | 1 | | | $ | 1,340 | | | $ | 1,644 | | | $ | (234) | | | $ | (2,277) | | | $ | 474 | | | $ | 110 | | | $ | 584 | |
|
| | | | | | | | | | | | | | | | | | | | | | | | | | | | | | | |
| | Total Visteon Corporation Stockholders' Equity | | | | |
| | Common Stock | | Additional Paid-In Capital | | Retained Earnings | | Accumulated Other Comprehensive Income (Loss) | | Treasury Stock | | Total Visteon Corporation Stockholders' Equity | | Non-Controlling Interests | | Total Equity |
| December 31, 2017 | $ | 1 |
| | $ | 1,339 |
| | $ | 1,445 |
| | $ | (174 | ) | | $ | (1,974 | ) | | $ | 637 |
| | $ | 124 |
| | $ | 761 |
|
| Net income | — |
| | — |
| | 65 |
| | — |
| | — |
| | 65 |
| | 4 |
| | 69 |
|
| Other comprehensive income | — |
| | — |
| | — |
| | 17 |
| | — |
| | 17 |
| | 6 |
| | 23 |
|
| Stock-based compensation, net | — |
| | (18 | ) | | — |
| | — |
| | 5 |
| | (13 | ) | | — |
| | (13 | ) |
| Repurchase of shares of common stock | — |
| | (30 | ) | | — |
| | — |
| | (170 | ) | | (200 | ) | | — |
| | (200 | ) |
| Dividends payable | — |
| | — |
| | — |
| | — |
| | — |
| | — |
| | (25 | ) | | (25 | ) |
| March 31, 2018 | $ | 1 |
| | $ | 1,291 |
| | $ | 1,510 |
| | $ | (157 | ) | | $ | (2,139 | ) |
| $ | 506 |
| | $ | 109 |
| | $ | 615 |
|
| Net income | — |
| | — |
| | 35 |
| | — |
| | — |
| | 35 |
| | 1 |
| | 36 |
|
| Other comprehensive loss | — |
| | — |
| | — |
| | (38 | ) | | — |
| | (38 | ) | | (7 | ) | | (45 | ) |
| Stock-based compensation, net | — |
| | 11 |
| | — |
| | — |
| | 2 |
| | 13 |
| |
|
| | 13 |
|
| Dividends payable | — |
| | — |
| | — |
| | — |
| | — |
| | — |
| | (3 | ) | | (3 | ) |
| June 30, 2018 | $ | 1 |
| | $ | 1,302 |
| | $ | 1,545 |
| | $ | (195 | ) | | $ | (2,137 | ) | | $ | 516 |
| | $ | 100 |
| | $ | 616 |
|
| Net income | — |
| | — |
| | 21 |
| | — |
| | — |
| | 21 |
| | 3 |
| | 24 |
|
| Other comprehensive loss | — |
| | — |
| | — |
| | (13 | ) | | — |
| | (13 | ) | | (3 | ) | | (16 | ) |
| Stock-based compensation, net | — |
| | (1 | ) | | — |
| | — |
| | 3 |
| | 2 |
| | — |
| | 2 |
|
| Repurchase of shares of common stock | — |
| | 30 |
| | — |
| | — |
| | (80 | ) | | (50 | ) | | — |
| | (50 | ) |
| Business acquisition | — |
| | — |
| | — |
| | — |
| | — |
| | — |
| | 15 |
| | 15 |
|
| September 30, 2018 | $ | 1 |
| | $ | 1,331 |
| | $ | 1,566 |
| | $ | (208 | ) | | $ | (2,214 | ) | | $ | 476 |
| | $ | 115 |
| | $ | 591 |
|
See accompanying notes to the condensed consolidated financial statements.
VISTEON CORPORATION AND SUBSIDIARIES
NOTES TO CONDENSED CONSOLIDATED FINANCIAL STATEMENTS
NOTE 1. Summary of Significant Accounting Policies
Basis of Presentation - Interim Financial Statements
The unauditedcondensed consolidated financial statements of Visteon Corporation (the "Company" or "Visteon") have been prepared in accordance with accounting principles generally accepted in the rules and regulations of the United States ("U.S. Securities and Exchange Commission ("SEC"GAAP"). Certain information and footnote disclosures normally included in financial statements prepared in accordance with accounting principles generally accepted in the United Statesrules and regulations of the U.S. Securities and Exchange Commission ("U.S. GAAP"SEC") have been condensed or omitted pursuant to such rules and regulations. These interim condensed consolidated financial statements include all adjustments (consisting of normal recurring adjustments, except as otherwise disclosed) that management believes are necessary for a fair presentation of the results of operations, financial position, stockholders' equity and cash flows of the Company for the interim periods presented. Interim results are not necessarily indicative of full-year results.
Other Income, Net:
|
| | | | | | | | | | | | | | | |
| Three Months Ended September 30 | | Nine Months Ended
September 30 |
| 2019 |
| 2018 | | 2019 | | 2018 |
| (Dollars in Millions) |
| Pension financing benefits, net | $ | 2 |
| | $ | 3 |
| | $ | 7 |
| | $ | 9 |
|
| Transformation initiatives | — |
|
| — |
|
| — |
|
| 4 |
|
| Gain on non-consolidated affiliate transactions, net | — |
| | 4 |
| | — |
| | 4 |
|
| $ | 2 |
|
| $ | 7 |
| | $ | 7 |
| | $ | 17 |
|
Pension financing benefits, net include return on assets netUse of interest costsEstimates: The preparation of financial statements in conformity with U.S. GAAP requires management to make estimates and assumptions that affect amounts reported herein. Such estimates and assumptions affect, among other amortization.
Transformation initiatives forthings, the nine months endedCompany’s goodwill and long-lived asset valuation; inventory valuation; assessment of the annual effective tax rate; valuation of deferred income taxes and income tax contingencies; and credit losses related to our financial assets. Considerable judgment is involved in making these determinations and the use of different estimates or assumptions could result in significantly different results. Management believes its assumptions and estimates are reasonable and appropriate. However, actual results could differ from those reported herein. Events and changes in circumstances arising after September 30, 2018 include2020, including those resulting from the impacts of COVID-19, will be reflected in management’s estimates for future periods.
Allowance for Doubtful Accounts
The following table provides a $4 million benefit on settlementrollforward of litigation matters withchanges in the Company’s former President and Chief Executive Officer (“former CEO”) as further described in Note 19, "Commitments and Contingencies."allowance for doubtful accounts:
On September 1, 2018, Visteon acquired an additional 1% ownership interest in Changchun Visteon FAWAY Auto Electronics Co., Ltd, ("VFAE" or the "VFAE acquisition"), a former non-consolidated affiliate, resulting in a total 51% controlling interest and a non-cash gain of $4 million as further described in Note 17, "Acquisitions." | | | | | |
| Nine Months Ended September 30, |
| (In millions) | 2020 |
| Beginning balance | $ | 10 | |
| Provision | 2 | |
| Recoveries | (3) | |
| Write-offs charged against the allowance | (4) | |
| Ending balance | $ | 5 | |
Recently Adopted Accounting Pronouncements:Pronouncements
In February 2016, the
The Financial Accounting Standards Board ("FASB") issued Accounting Standards Update ("ASU") 2016-02, “Leases (Subtopic 842).” The standard increases the transparency and comparability of organizations by recognizing right-of-use (“ROU”) assets and lease liabilities on the consolidated balance sheets and disclosing key quantitative and qualitative information about leasing arrangements. In transition, the standard provides for certain practical expedients. Management elected certain practical expedients including the election not to reassess existing or expired contracts to determine if such contracts contain a lease or if the lease classification would differ, as well as the election not to separate lease and non-lease components for arrangements where the Company is a lessee.
The Company adopted the standard January 1, 2019, by applying the modified retrospective method without restatement of comparative periods' financial information, as permitted by the transition guidance. The standard had a material impact on the Company's consolidated balance sheets, but did not have an impact on its consolidated results of operations and cash flows. The most significant impact was the recognition of ROU assets and lease liabilities for operating leases, while the Company's accounting for finance leases remained substantially unchanged. Adoption of the new standard resulted in the recording of additional net lease assets and lease liabilities of approximately $172 million and $176 million, respectively, as of January 1, 2019. For additional information, refer to Note 10, "Leases."
In February 2018, the FASB issued ASU 2018-02, "Income Statement - Reporting Comprehensive Income (Topic 220)." This standard provides an option to reclassify stranded tax effects within accumulated other comprehensive income (loss) to retained earnings due to the U.S. federal corporate income tax rate change in the Tax Cuts and Jobs Act of 2017 (the "Act"). The Company adopted the standard January 1, 2019 and elected to reclassify stranded amounts related to the Act from accumulated other comprehensive income (loss) to retained earnings. However, due to the U.S. valuation allowance, there were no stranded tax
effects within accumulated other comprehensive income (loss) as of the enactment date, and thus, no amount to reclassify to retained earnings.
Accounting Pronouncements Not Yet Adopted:
In June 2016, the FASB issued ASU 2016-13, "Credit Losses (Topic 326) - Measurement of Credit Losses on Financial Instruments." The guidance requires that for most financial assets, losses be based on an expected loss approach which includes estimates of losses over the life of exposure that considers historical, current and forecasted information. Expanded disclosures related to the methods used to estimate the losses as well as a specific disaggregation of balances for financial assets are also required. The change isInstruments", effective for fiscal years beginning after December 15, 2019,2019. The guidance requires financial asset (or a group of financial assets) measured on the basis of amortized cost to be presented at the net amount expected to be collected. The guidance also requires that the income statement reflect the measurement of credit losses for newly recognized financial assets as well as the expected increases or decreases of expected credit losses that have taken place during the period. Additionally, the guidance limits the credit loss to the amount by which fair value is below amortized cost.
The Company adopted the guidance effective January 1, 2020. The guidance allows for various methods for measuring expected credit losses. The Company elected to apply a historical loss rate based on historic write offs by region to aging categories. The historical loss rate will be adjusted for current conditions and reasonable and supportable forecasts of future losses as necessary. The adoption of the guidance did not have a material impact on the Company's condensed consolidated financial statements.
The FASB issued ASU 2019-12, "Income Taxes (Topic 740) - Simplifying the Accounting for Income Taxes." The new guidance simplifies the accounting for income taxes by eliminating certain exceptions related to the approach for intraperiod tax allocation, the methodology for calculating income taxes in an interim periods within those fiscal years, with early adoption permittedperiod, hybrid taxes and the recognition of deferred tax liabilities for outside basis differences. It also clarifies and simplifies other aspects of the accounting for income taxes. The amendments in this ASU are effective for fiscal years beginning after December 15, 2020 and interim periods within those fiscal years. Early adoption is permitted in interim or annual periods with any adjustments reflected as of the beginning of the annual period that includes that interim period. Additionally, entities that elect early adoption must adopt all the amendments in the same period. Amendments are to be applied prospectively, except for certain amendments that are to be applied either retrospectively or with a modified retrospective approach through a cumulative effect adjustment recorded to retained earnings. The Company adopted the guidance effective January 1, 2020. The adoption of the guidance did not have a material impact on the Company's condensed consolidated financial statements.
Accounting Pronouncements Not Yet Adopted
In March 2020, the FASB issued ASU 2020-04, "Reference Rate Reform (Topic 848) - Facilitation of the Effects of Reference Rate Reform on Financial Reporting." The guidance provides optional expedients and exceptions related to certain contract modifications and hedging relationships that reference LIBOR or another rate that is expected to be discontinued. The amendments in the guidance are effective for all entities as of March 12, 2020 through December 31, 2022. The Company is currently evaluating the impacts of the provisions of ASU 2020-04.
In August 2018, the FASB issued ASU 2018-14, "Compensation - Retirement Benefits - Defined Benefit Plans - General (Topic 715-20): Disclosure Framework - Changes to the Disclosure Requirements for Defined Benefit Plans." The guidance (i) removes disclosures that are no longer considered cost beneficial, (ii) clarifies the specific requirements of disclosures and (iii) adds disclosure requirements including reasons for significant gains and losses related to changes in the benefit obligation. The amendments in this ASU are effective for fiscal years beginning after December 15, 2020 and interim periods within those fiscal years. The Company does not expect application of this accounting standards update to have a material impact on its condensed consolidated financial statements.
NOTE 2. Revenue RecognitionNon-Consolidated Affiliates
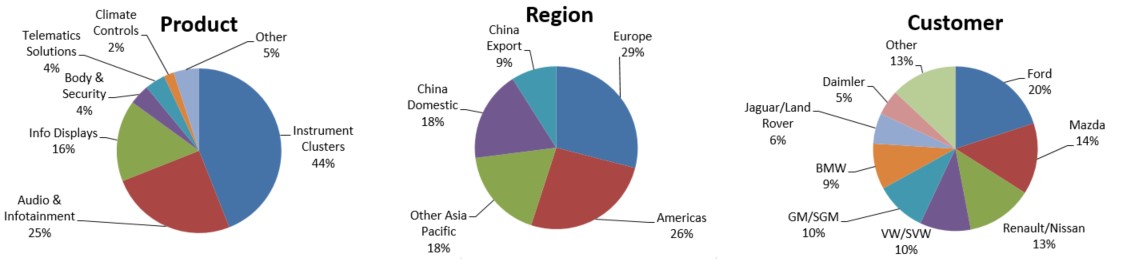
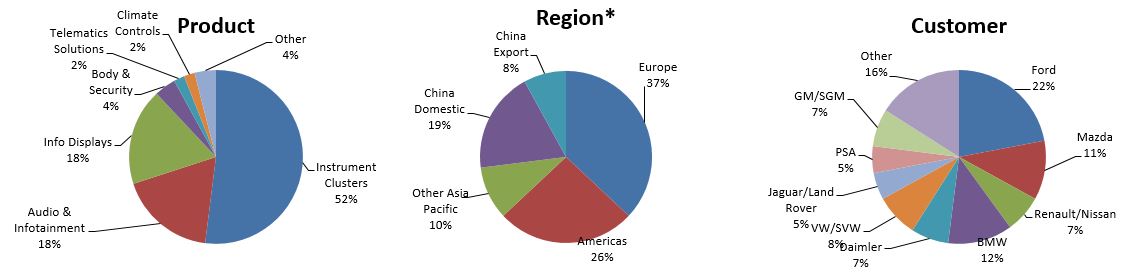
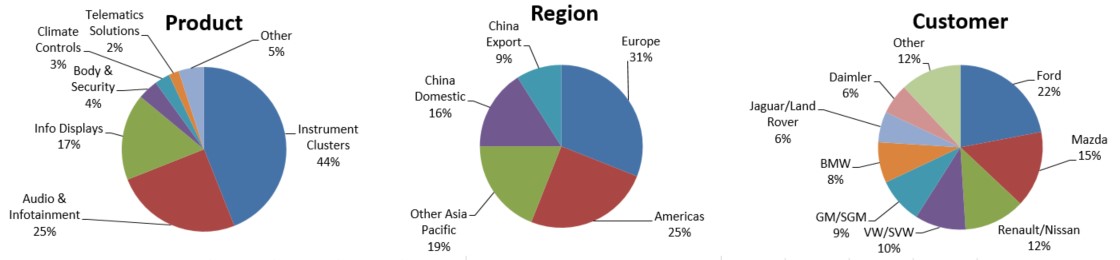
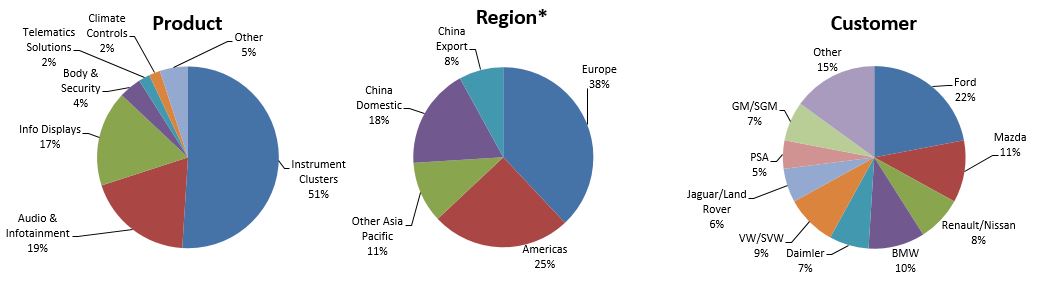
Disaggregated revenue by geographical market and product lines is as follows:
|
| | | | | | | | | | | | | | | |
| Three Months Ended September 30 | | Nine Months Ended
September 30 |
| | 2019 | | 2018 | | 2019 |
| 2018 |
| (Dollars in Millions) |
| Geographical Markets |
| | | | | | |
| Europe | $ | 221 |
| | $ | 223 |
| | $ | 726 |
| | $ | 759 |
|
| Americas | 201 |
| | 180 |
| | 597 |
| | 611 |
|
| China Domestic | 143 |
| | 90 |
| | 372 |
| | 281 |
|
| China Export | 70 |
| | 77 |
| | 204 |
| | 239 |
|
| Other Asia-Pacific | 141 |
| | 155 |
| | 440 |
| | 508 |
|
| Eliminations | (45 | ) | | (44 | ) | | (138 | ) | | (145 | ) |
| $ | 731 |
| | $ | 681 |
| | $ | 2,201 |
| | $ | 2,253 |
|
Investments in Affiliates
|
| | | | | | | | | | | | | | | |
| | Three Months Ended September 30 | | Nine Months Ended
September 30 |
| | 2019 | | 2018 | | 2019 | | 2018 |
| | (Dollars in Millions) |
| Product Lines | | | | | | | |
| Instrument clusters | $ | 322 |
| | $ | 275 |
| | $ | 959 |
| | $ | 908 |
|
| Audio and infotainment | 182 |
| | 176 |
| | 562 |
| | 578 |
|
| Information displays | 120 |
| | 116 |
| | 365 |
| | 382 |
|
| Body and security | 27 |
| | 25 |
| | 91 |
| | 86 |
|
| Climate controls | 18 |
| | 27 |
| | 59 |
| | 98 |
|
| Telematics | 29 |
| | 17 |
| | 51 |
| | 51 |
|
| Other | 33 |
| | 45 |
| | 114 |
| | 150 |
|
| | $ | 731 |
| | $ | 681 |
| | $ | 2,201 |
| | $ | 2,253 |
|
During the three and nine months ended September 30, 2019 and 2018, the Company recognized approximately $8 million and $19 million and $10 million and $22 million net increases in transaction price related to performance obligations satisfied in previous periods, respectively. The Company has no material contract assets, contract liabilities or capitalized contract acquisition costs as of September 30, 2019.
NOTE 3. Segment Information
Financial results for the Company's reportable segment have been prepared using a management approach, which is consistent with the basis and manner in which financial information is evaluated by the Company's chief operating decision maker in allocating resources and in assessing performance. The Company’s chief operating decision maker, the Chief Executive Officer, evaluates the performance of the Company’s segment primarily based on net sales, before elimination of inter-company shipments, Adjusted EBITDA (a non-GAAP financial measure, as defined below) and operating assets. As the Company has one reportable segment, net sales, total assets, depreciation, amortization and capital expenditures are equal to consolidated results.
The Company’s current reportable segment is Electronics, which provides vehicle cockpit electronics products to customers, including instrument clusters, information displays, infotainment systems, audio systems, telematics solutions and head-up displays.
Adjusted EBITDA
The Company defines Adjusted EBITDA as net income attributable to the Company adjusted to eliminate the impact of depreciation and amortization, restructuring expense, net interest expense,recorded equity in the net income of non-consolidated affiliates gainof $4 million and loss on divestiture, provision$7 million for income taxes, discontinued operations, net income attributable to non-controlling interests, non-cash stock-based compensation expense,the nine months ended September 30, 2020 and other gains2019, respectively.
Visteon and losses not reflectiveYangfeng Automotive Trim Systems Co. Ltd. ("YF") each own 50% of a joint venture under the name of Yanfeng Visteon Investment Co., Ltd. ("YFVIC"). In October 2014, YFVIC completed the purchase of YF’s 49% direct ownership in Yanfeng Visteon Automotive Electronics Co., Ltd. ("YFVE"), a consolidated joint venture of the Company ("The YFVIC Transaction"). The purchase by YFVIC was financed through a shareholder loan from YF and external borrowings, guaranteed by Visteon, which was paid in 2019.
A summary of the Company's ongoing operations.investments in non-consolidated equity method affiliates is provided below:
Adjusted EBITDA | | | | | | | | | | | |
| September 30, | | December 31, |
| (In millions) | 2020 | | 2019 |
| YFVIC (50%) | $ | 46 | | | $ | 43 | |
| PT Astra Visteon Indonesia (50%) | 5 | | | 5 | |
| Total investments in non-consolidated affiliates | $ | 51 | | | $ | 48 | |
Variable Interest Entities
The Company evaluates whether joint ventures in which it has invested are Variable Interest Entities (“VIE”) at the start of each new venture and when a reconsideration event has occurred. The Company consolidates a VIE if it is presented asdetermined to be the primary beneficiary of the VIE having both the power to direct the activities of the VIE that most significantly impact the entity’s economic performance and the obligation to absorb losses or the right to receive benefits from the VIE that could potentially be significant to the VIE.
The Company determined that YFVIC is a supplemental measureVIE. The Company holds a variable interest in YFVIC primarily related to its ownership interests and subordinated financial support. The Company and YF each own 50% of YFVIC and neither entity has the power to control the operations of YFVIC; therefore, the Company is not the primary beneficiary of YFVIC and does not consolidate the joint venture.
A summary of the Company's financial performance that management believesinvestments in YFVIC is useful to investors because the excluded items may vary significantly in timing or amounts and/or may obscure trends useful in evaluating and comparing the Company's operating activities across reporting periods. Not all companies use identical calculations and, accordingly, the Company's presentation of Adjusted EBITDA may not be comparable to other similarly titled measures of other companies. Adjusted EBITDA is not a recognized term under GAAP and does not purport to be a substitute for net income as an indicator of operating performance or cash flows from operating activities as a measure of liquidity. Adjusted EBITDA has limitations as an analytical tool and is not intended to be a measure of cash flow available for management's discretionary use, as it does not consider certain cash requirements such as interest payments, tax payments and debt service requirements. provided below:
| | | | | | | | | | | |
| September 30, | | December 31, |
| (In millions) | 2020 | | 2019 |
| Payables due to YFVIC | $ | 11 | | | $ | 9 | |
| Exposure to loss in YFVIC: | | | |
| Investment in YFVIC | $ | 46 | | | $ | 43 | |
| Receivables due from YFVIC | 52 | | | 41 | |
| Subordinated loan receivable from YFVIC | 6 | | | 8 | |
| | | |
| Maximum exposure to loss in YFVIC | $ | 104 | | | $ | 92 | |
Investments
In addition,2018, the Company uses Adjusted EBITDA (i) ascommitted to make a factor$15 million investment in incentive compensation decisions, (ii)two entities principally focused on the automotive sector pursuant to evaluatelimited partnership agreements. As a limited partner in each entity, the effectivenessCompany will periodically make capital contributions toward this total commitment amount. As of September 30, 2020, the Company's business strategies and (iii)Company has contributed a total of $3 million toward the Company's credit agreements use measures similar to Adjusted EBITDA to measure compliance with certain covenants.aggregate investment commitments.
The reconciliation of net income attributable to Visteon to Adjusted EBITDA is as follows: |
| | | | | | | | | | | | | | | |
| | Three Months Ended September 30 | | Nine Months Ended
September 30 |
| | 2019 | | 2018 | | 2019 | | 2018 |
| | (Dollars in Millions) |
| Net income attributable to Visteon Corporation | $ | 14 |
| | $ | 21 |
| | $ | 35 |
| | $ | 121 |
|
| Depreciation and amortization | 25 |
| | 22 |
| | 74 |
| | 67 |
|
| Non-cash, stock-based compensation expense | 3 |
| | 4 |
| | 14 |
| | 4 |
|
| Provision for income taxes | 13 |
| | 9 |
| | 16 |
| | 42 |
|
| Interest expense, net | 3 |
| | 2 |
| | 7 |
| | 6 |
|
| Net income attributable to non-controlling interests | 4 |
| | 3 |
| | 7 |
| | 8 |
|
| Restructuring expense, net | 1 |
| | 18 |
| | 2 |
| | 28 |
|
| Income from discontinued operations, net of tax | — |
| | (1 | ) | | — |
| | (2 | ) |
| Equity in net income of non-consolidated affiliates | (1 | ) | | (3 | ) | | (7 | ) | | (10 | ) |
| Other | — |
| | (4 | ) | | 1 |
| | (8 | ) |
| Adjusted EBITDA | $ | 62 |
| | $ | 71 |
| | $ | 149 |
| | $ | 256 |
|
NOTE 4. Earnings Per Share
Basic earnings per share is calculated by dividing net income attributable to Visteon by the weighted average number of shares of common stock outstanding. Diluted earnings per share is computed by dividing net income by the weighted average number of common and potentially dilutive common shares outstanding. Performance based share units are considered contingently issuable shares, and are included in the computation of diluted earnings per share based on the number of shares that would be issuable if the reporting date were the end of the contingency period and if the result would be dilutive.
The table below provides details underlying the calculations of basic and diluted earnings per share:
|
| | | | | | | | | | | | | | | |
| | Three Months Ended September 30 | | Nine Months Ended
September 30 |
| | 2019 | | 2018 | | 2019 | | 2018 |
| | (In Millions, Except Per Share Amounts) |
| Numerator: | | | | | | | |
| Net income from continuing operations attributable to Visteon | $ | 14 |
| | $ | 20 |
| | $ | 35 |
| | $ | 119 |
|
| Net income from discontinued operations attributable to Visteon | — |
| | 1 |
| | — |
| | 2 |
|
| Net income attributable to Visteon | $ | 14 |
| | $ | 21 |
| | $ | 35 |
| | $ | 121 |
|
| Denominator: | | | | | | | |
| Average common stock outstanding - basic | 28.0 |
| | 29.3 |
| | 28.1 |
| | 29.8 |
|
| Dilutive effect of performance based share units and other | 0.1 |
| | 0.2 |
| | 0.1 |
| | 0.3 |
|
| Diluted shares | 28.1 |
| | 29.5 |
| | 28.2 |
| | 30.1 |
|
| Basic and Diluted Per Share Data: | | | | | | | |
| Basic earnings per share attributable to Visteon: | | | | | | | |
| Continuing operations | $ | 0.50 |
| | $ | 0.68 |
| | $ | 1.25 |
| | $ | 3.99 |
|
| Discontinued operations | — |
| | 0.03 |
| | — |
| | 0.07 |
|
| | $ | 0.50 |
| | $ | 0.71 |
| | $ | 1.25 |
| | $ | 4.06 |
|
| Diluted earnings per share attributable to Visteon: | | | | | | | |
| Continuing operations | $ | 0.50 |
| | $ | 0.68 |
| | $ | 1.24 |
| | $ | 3.95 |
|
| Discontinued operations | — |
| | 0.03 |
| | — |
| | 0.07 |
|
| | $ | 0.50 |
| | $ | 0.71 |
| | $ | 1.24 |
| | $ | 4.02 |
|
NOTE 5.3. Restructuring Activities
Given the economically-sensitive and highly competitive nature of the automotive electronics industry, the Company continues to closely monitor current market factors and industry trends, including potential impacts related to COVID-19, taking action as necessary which may include restructuring actions. However, there can be no assurance that any such actions will be sufficient to fully offset the impact of adverse factors on the Company or its results of operations, financial position and cash flows.
10Restructuring actions initiated during 2020 include the following:
Electronics
•In March, the Company approved a global restructuring plan impacting engineering, administrative and manufacturing functions to improve the Company’s efficiency and rationalize its footprint. The Company incurred $16 million of net restructuring expense for cash severance, retention, and termination costs related to this plan. As of September 30, 2020, $4 million remains accrued related to this action.
•In January, the Company approved a plan primarily related to European engineering and administrative functions to improve the Company’s efficiency and rationalize its footprint. The Company incurred $22 million of net restructuring expense for cash severance, retention, and termination costs related to this plan and expects to incur up to $24 million. As of September 30, 2020, $13 million remains accrued related to this action.
•During the nine months ended September 30, 2020, the Company incurred $1 million of restructuring expense for cash severance payments at two North American manufacturing facilities.
During the first quarter of 2019, the Company approved a restructuring program impacting two European manufacturing facilities due to the end of life of certain product lines. During the nine months ended September 30, 2019, the Company recorded approximatelynet restructuring expense of $2 million of restructuring expenses related to this program approximately $1 million remains accrued as of September 30, 2019.program.
During the thirdsecond quarter of 2018, the Company approved a restructuring program impacting engineering and administrative functions to optimize operations. During the nine months ended September 30, 2019 and 2018, the Company has recorded approximately $1 million and $18 million of net restructuring expenses, respectively. As of September 30, 2019, approximately $5 million remains accrued.
During the second quarter of 2018, the Company approved restructuring programs impacting employee severance and termination benefit expenses of legacy employees at a South America facility and employees at North America manufacturing facilities due to the wind-down of certain products. During the nine months endedproducts, as of September 30, 2018, the Company recorded approximately $5 million of restructuring expense under these programs and approximately2020, $3 million remains accrued as of September 30, 2019.
During the fourth quarter of 2016, the Company approved a restructuring program impacting engineering and administrative functionsrelated to further align the Company's footprint with its core product technologies and customers. During the nine months ended September 30, 2018, the Company recorded approximately $5 million of restructuring expenses under this program. As of September 30, 2019, the restructuring program is considered substantially complete.
Other and Discontinued Operations
During the nine months ended September 30, 2018, the Company recorded approximately $1 million of restructuring expense associated with a former European Interiors facility related to settlement of employee severance litigation.
As of September 30, 2019,2020, the Company has retained approximately $2 million of restructuring reserves as part of the Company's divestiture of the majority of its global Interiors Divestiturebusiness (the "Interiors Divestiture") of $2 million associated with previously announcedcompleted programs for the fundamental reorganization of operations at facilities in Brazil and France.
Restructuring Reserves
Restructuring reserve balances of $11$52 million and $23$10 million as of September 30, 20192020 and December 31, 2018,2019, respectively, are classified as "Other current liabilities" on the condensed consolidated balance sheets. The Company anticipates that the activities associated with the current restructuring reserve balance will be substantially complete within one year.by the end of 2021. The Company’s condensed consolidated restructuring reserves and related activity are summarized below, including amounts associated with discontinued operations.
|
| | | | | | | | | | | |
| | Electronics | | Other and Discontinued Operations | | Total |
| | (Dollars in Millions) |
| December 31, 2018 | $ | 20 |
| | $ | 3 |
| | $ | 23 |
|
| Expense | 2 |
| | — |
| | 2 |
|
| Utilization | (3 | ) | | — |
| | (3 | ) |
| Change in estimate | (1 | ) | | (1 | ) | | (2 | ) |
| Foreign currency | (1 | ) | | — |
| | (1 | ) |
| March 31, 2019 | $ | 17 |
| | $ | 2 |
| | $ | 19 |
|
| Expense | 2 |
| | — |
| | 2 |
|
| Utilization | (5 | ) | | — |
| | (5 | ) |
| Change in estimate | (2 | ) | | — |
| | (2 | ) |
| June 30, 2019 | $ | 12 |
| | $ | 2 |
| | $ | 14 |
|
| Expense | 1 |
| | — |
| | 1 |
|
| Utilization | (4 | ) | | — |
| | (4 | ) |
| September 30, 2019 | $ | 9 |
| | $ | 2 |
| | $ | 11 |
|
| | | | | | | | | |
| (In millions) | | | | | |
| December 31, 2019 | $ | 10 | | | | | |
| Expense | 33 | | | | | |
| Utilization | (6) | | | | | |
| Foreign currency | (1) | | | | | |
| March 31, 2020 | $ | 36 | | | | | |
| Expense | 1 | | | | | |
| Change in estimate | 3 | | | | | |
| Utilization | (9) | | | | | |
| Foreign currency | 1 | | | | | |
| June 30, 2020 | $ | 32 | | | | | |
| Expense | 31 | | | | | |
| Change in estimate | 1 | | | | | |
| Utilization | (12) | | | | | |
| September 30, 2020 | $ | 52 | | | | | |
| | | | | |
| | | | | |
| | | | | |
| | | | | |
| | | | | |
NOTE 4. Inventories
Inventories, net consist of the following components:
| | | | | | | | | | | |
| September 30, | | December 31, |
| (In millions) | 2020 | | 2019 |
| Raw materials | $ | 102 | | | $ | 100 | |
| Work-in-process | 25 | | | 28 | |
| Finished products | 37 | | | 41 | |
| $ | 164 | | | $ | 169 | |
NOTE 5. Goodwill and Other Intangible Assets
Intangible assets, net are comprised of the following:
| | | | | | | | | | | | | | | | | | | | | | | |
| | | September 30, 2020 |
| (In millions) | Estimated Weighted Average Useful Life (years) | | Gross Intangibles | | Accumulated Amortization | | Net Intangibles |
| Definite-Lived: | | |
| Developed technology | 5 | | $ | 40 | | | $ | (37) | | | $ | 3 | |
| Customer related | 10 | | 91 | | | (59) | | | 32 | |
| Capitalized software development | 3 | | 41 | | | (6) | | | 35 | |
| Other | 20 | | 16 | | | (7) | | | 9 | |
| Subtotal | | | 188 | | | (109) | | | 79 | |
| Indefinite-Lived: | | |
| Goodwill | | | 47 | | | 0 | | | 47 | |
| Total | | | $ | 235 | | | $ | (109) | | | $ | 126 | |
A rollforward of the carrying amounts of intangible assets is presented below:
| | | | | | | | | | | | | | | | | | | | | | | | | | | | | | | | | | | | | | | | | |
| December 31, 2019 | | September 30, 2020 |
| (In millions) | Gross Intangibles | | Accumulated Amortization | | Net Intangibles | | Additions | | Foreign Currency | | Amortization Expense | | Net Intangibles |
| Definite-Lived: | | | | | | |
| Developed technology | $ | 40 | | | $ | (35) | | | $ | 5 | | | $ | 0 | | | $ | 0 | | | $ | (2) | | | $ | 3 | |
| Customer related | 89 | | | (51) | | | 38 | | | 0 | | | 0 | | | (6) | | | 32 | |
| Capitalized software development | 32 | | | (5) | | | 27 | | | 9 | | | 0 | | | (1) | | | 35 | |
| Other | 15 | | | (4) | | | 11 | | | 0 | | | 0 | | | (2) | | | 9 | |
| Subtotal | 176 | | | (95) | | | 81 | | | 9 | | | 0 | | | (11) | | | 79 | |
| Indefinite-Lived: | | | | | | |
| Goodwill | 46 | | | 0 | | | 46 | | | 0 | | | 1 | | | 0 | | | 47 | |
| Total | $ | 222 | | | $ | (95) | | | $ | 127 | | | $ | 9 | | | $ | 1 | | | $ | (11) | | | $ | 126 | |
NOTE 6. Other Assets
Other current assets are comprised of the following components:
| | | | | | | | | | | |
| September 30, | | December 31, |
| (In millions) | 2020 | | 2019 |
| Recoverable taxes | $ | 68 | | | $ | 64 | |
| Joint venture receivables | 52 | | | 41 | |
| Contractually reimbursable engineering costs | 32 | | | 29 | |
| Prepaid assets and deposits | 19 | | | 22 | |
| China bank notes | 11 | | | 16 | |
| Royalty agreements | 11 | | | 17 | |
| Other | 0 | | | 4 | |
| $ | 193 | | | $ | 193 | |
The Company receives bank notes from certain customers in China to settle trade accounts receivable. The collection of such bank notes are included in operating cash flows based on the substance of the underlying transactions, which are operating in
nature. The Company redeemed $104 million and $59 million of China bank notes during the nine months ended September 30, 2020 and 2019, respectively. Remaining amounts outstanding at third party institutions related to sold bank notes will mature by March 31, 2021.
Other non-current assets are comprised of the following components:
| | | | | | | | | | | |
| September 30, | | December 31, |
| (In millions) | 2020 | | 2019 |
| Deferred tax assets | $ | 55 | | | $ | 59 | |
| Contractually reimbursable engineering costs | 30 | | | 24 | |
| Recoverable taxes | 19 | | | 28 | |
| Royalty agreements | 8 | | | 11 | |
| Joint venture notes receivable | 6 | | | 8 | |
| Other | 15 | | | 20 | |
| $ | 133 | | | $ | 150 | |
Current and non-current contractually reimbursable engineering costs are related to pre-production design and development costs incurred pursuant to long-term supply arrangements that are contractually guaranteed for reimbursement by customers. The Company expects to receive cash reimbursement payments of $12 million during the remainder of 2020, $24 million in 2021, $8 million in 2022, $7 million in 2023 and $11 million in 2024 and beyond.
NOTE 7. Other Liabilities
Other current liabilities are summarized as follows:
| | | | | | | | | | | |
| September 30, | | December 31, |
| (In millions) | 2020 | | 2019 |
| Restructuring reserves | $ | 52 | | | $ | 10 | |
| Product warranty and recall accruals | 37 | | | 34 | |
| Deferred income | 21 | | | 22 | |
| Non-income taxes payable | 19 | | | 17 | |
| Royalty reserves | 14 | | | 19 | |
| Joint venture payables | 11 | | | 9 | |
| | | |
| Income taxes payable | 4 | | | 7 | |
| Dividends payable to non-controlling interests | 2 | | | 3 | |
| Other | 29 | | | 26 | |
| $ | 189 | | | $ | 147 | |
Other non-current liabilities are summarized as follows:
| | | | | | | | | | | |
| September 30, | | December 31, |
| (In millions) | 2020 | | 2019 |
| Derivative financial instruments | $ | 27 | | | $ | 14 | |
| Product warranty and recall accruals | 13 | | | 15 | |
| | | |
| Deferred income | 7 | | | 9 | |
| Royalty reserves | 6 | | | 13 | |
| Income tax reserves | 5 | | | 5 | |
| Non-income tax reserves | 1 | | | 1 | |
| Other | 13 | | | 15 | |
| $ | 72 | | | $ | 72 | |
NOTE 8. Debt
The Company’s short and long-term debt consists of the following:
| | | | | | | | | | | |
| September 30, | | December 31, |
| (In millions) | 2020 | | 2019 |
| Short-Term Debt: | | | |
| Short-term borrowings | $ | — | | | $ | 37 | |
| | | |
| Long-Term Debt: | | | |
| | | |
| | | |
| Term debt facility, net | $ | 348 | | | $ | 348 | |
Short-Term Debt
Short-term borrowings, primarily related to the Company's non-U.S. joint ventures, were fully repaid during the third quarter of 2020. As of September 30, 2020, the available borrowings under these affiliate credit facilities are $153 million.
Long-Term Debt
As of September 30, 2020, the Company has an amended credit agreement ("Credit Agreement") which includes a $350 million Term Facility maturing March 24, 2024 and a $400 million Revolving Credit Facility which matures the earlier of December 24, 2024, 90 days prior to the scheduled maturity of the Term Facility, or the date of the termination of the Company's credit agreement.
On March 19, 2020, the Company borrowed the entire amount of revolving loans available under the Revolving Credit Facility to increase its cash position and maximize its flexibility in response to unprecedented uncertainty related to the impact of COVID-19. On September 24, 2020, the Company fully repaid the amount borrowed under the Revolving Credit Facility following stronger than expected industry recovery and improved Company performance in the third quarter of 2020.
Interest on the Term Facility loans accrue at a rate equal to a LIBOR-based rate plus an applicable margin of 1.75% per annum. Loans under the Company' Revolving Credit Facility accrue interest at a rate equal to a LIBOR-based rate plus an applicable margin of between 1.00% - 2.00%, as determined by the Company's total gross leverage ratio.
The Credit Agreement requires compliance with customary affirmative and negative covenants and contains customary events of default. The Revolving Credit Facility also requires that the Company maintain a total net leverage ratio no greater than 3.50:1.00. During any period when the Company’s corporate and family ratings meet investment grade ratings, certain of the negative covenants are suspended. As of September 30, 2020, the Company was in compliance with all its debt covenants.
The Revolving Credit Facility also provides $75 million availability for the issuance of letters of credit and a maximum of $20 million for swing line borrowings. Any amount of the facility utilized for letters of credit or swing line loans outstanding will reduce the amount available under the existing Revolving Credit Facility. The Company may request increases in the limits under the Credit Agreement and may request the addition of one or more term loan facilities. Outstanding borrowings may be prepaid without penalty (other than borrowings made for the purpose of reducing the effective interest rate margin or weighted average yield of the loans). There are mandatory prepayments of principal in connection with: (i) excess cash flow sweeps above certain leverage thresholds, (ii) certain asset sales or other dispositions, (iii) certain refinancing of indebtedness and (iv) over-advances under the Revolving Credit Facility. There are no excess cash flow sweeps required at the Company’s current leverage level.
All obligations under the Credit Agreement and obligations with respect to certain cash management services and swap transaction agreements between the Company and its lenders are unconditionally guaranteed by certain of the Company’s subsidiaries. Under the terms of the Credit Agreement, any amounts outstanding are secured by a first-priority perfected lien on substantially all property of the Company and the subsidiaries party to the security agreement, subject to certain limitations.
Other
The Company has a $5 million letter of credit facility, whereby the Company is required to maintain a cash collateral account equal to 103% (110% for non-U.S. dollar denominated letters)of the aggregate stated amount of issued letters of credit and must reimburse any amounts drawn under issued letters of credit. The Company had $3 million of outstanding letters of credit issued under this facility secured by restricted cash, as of September 30, 2020. Additionally, the Company had $7 million of locally issued letters of credit with less than $1 million of collateral as of September 30, 2020, to support various tax appeals, customs arrangements and other obligations at its local affiliates.
NOTE 6. Non-Consolidated Affiliates9. Employee Benefit Plans
Variable Interest EntitiesDefined Benefit Plans
The Company's net periodic benefit costs for all defined benefit plans for the three month periods ended September 30, 2020 and 2019 were as follows:
| | | | | | | | | | | | | | | | | | | | | | | |
| U.S. Plans | | Non-U.S. Plans |
| (In millions) | 2020 | | 2019 | | 2020 | | 2019 |
| Costs Recognized in Income: | | | | | | | |
| | | | | | | |
| | | | | | | |
| Pension financing benefits (cost): | | | | | | | |
| Interest cost | $ | (6) | | | $ | (8) | | | $ | (2) | | | $ | (2) | |
| Expected return on plan assets | 10 | | | 10 | | | 2 | | | 2 | |
| Amortization of losses and other | — | | | — | | | (1) | | | — | |
| Total Pension financing benefits (cost): | 4 | | | 2 | | | (1) | | | — | |
| Restructuring related pension cost: | | | | | | | |
| Special termination benefits | (1) | | | — | | | — | | | (1) | |
| Net pension benefit (cost) | $ | 3 | | | $ | 2 | | | $ | (1) | | | $ | (1) | |
Pension financing benefits, net of $3 million and $2 million for the three months ended September 30, 2020 and 2019 are classified as Other income, net on the Company's condensed consolidated statements of comprehensive income.
The Company's net periodic benefit costs for all defined benefit plans for the nine month periods ended September 30, 2020 and 2019 were as follows:
| | | | | | | | | | | | | | | | | | | | | | | |
| U.S. Plans | | Non-U.S. Plans |
| (In millions) | 2020 | | 2019 | | 2020 | | 2019 |
| Costs Recognized in Income: | | | | | | | |
| Pension service cost: | | | | | | | |
| Service cost | $ | — | | | $ | — | | | $ | (1) | | | $ | (1) | |
| Pension financing benefits (cost): | | | | | | | |
| Interest cost | (18) | | | (23) | | | (5) | | | (6) | |
| Expected return on plan assets | 29 | | | 30 | | | 6 | | | 7 | |
| Amortization of losses and other | — | | | — | | | (2) | | | (1) | |
| Total Pension financing benefits (cost): | 11 | | | 7 | | | (1) | | | — | |
| Restructuring related pension cost: | | | | | | | |
| Special termination benefits | (3) | | | — | | | (1) | | | (1) | |
| Net pension benefit (cost) | $ | 8 | | | $ | 7 | | | $ | (3) | | | $ | (2) | |
Pension financing benefits, net of $10 million and $7 million for the nine months ended September 30, 2020 and 2019, respectively are classified as Other income, net on the Company's condensed consolidated statements of comprehensive income.
The Company determines whether joint ventureshas deferred approximately $17 million of contributions related to its defined benefit U.S. pension plans, pursuant to COVID-19 relief measures. The Company intends to make contributions related to such U.S. plans by year end 2020. The Company estimates that contributions related to its non-U.S. defined benefit plans will approximate $1 million for
the remainder of 2020. Contributions of $3 million have been made and approximately $2 million deferred until 2024, due to COVID-19 relief measures, for these non-U.S. plans.
NOTE 10. Income Taxes
During the three and nine month period ended September 30, 2020, the Company recorded a provision for income tax of $12 million and $19 million, respectively, which reflects income tax expense in countries where the Company is profitable; accrued withholding taxes; ongoing assessments related to the recognition and measurement of uncertain tax benefits; the inability to record a tax benefit for pretax losses and/or recognize expense for pretax income in certain jurisdictions (including the U.S.) due to valuation allowances; and other non-recurring tax items, including changes in judgment about valuation allowances. Pretax losses from continuing operations in jurisdictions where valuation allowances are maintained and no income tax benefits are recognized totaled $106 million and $46 million for the nine month periods ended September 30, 2020 and 2019, respectively, resulting in an increase in the Company's effective tax rate in those years.
The Company's provision for income taxes in interim periods is computed by applying an estimated annual effective tax rate against income before income taxes, excluding equity in net income of non-consolidated affiliates for the period. Effective tax rates vary from period to period as separate calculations are performed for those countries where the Company's operations are profitable and whose results continue to be tax-effected and for those countries where full deferred tax valuation allowances exist and are maintained. In determining the estimated annual effective tax rate, the Company analyzes various factors, including but not limited to, forecasts of projected annual earnings, taxing jurisdictions in which the pretax income and/or pretax losses will be generated, available tax planning strategies and estimated impacts attributable to the Tax Cuts and Jobs Act of 2017 (the "Act"). The changing and volatile macro-economic conditions connected with the COVID-19 pandemic may cause fluctuations in forecasted earnings before income taxes. As such, the Company's effective tax rate could be subject to volatility as forecasted earnings before income taxes are impacted by events which cannot be predicted. The Company’s estimated annual effective tax rate is updated each quarter and may be significantly impacted by changes to the mix of forecasted earnings by tax jurisdiction. The tax impact of adjustments to the estimated annual effective tax rate are recorded in the period such estimates are revised. The Company is also required to record the tax impact of certain other non-recurring tax items, including changes in judgment about valuation allowances and uncertain tax positions, and changes in tax laws or rates, in the interim period in which they occur, rather than include them in the estimated annual effective tax rate.
The need to maintain valuation allowances against deferred tax assets in the U.S. and other affected countries will cause variability in the Company’s quarterly and annual effective tax rates. Full valuation allowances against deferred tax assets in the U.S. and applicable foreign countries will be maintained until sufficient positive evidence exists to reduce or eliminate them. The factors considered by management in its determination of the probability of the realization of the deferred tax assets include, but are not limited to, recent historical financial results, historical taxable income, projected future taxable income, the expected timing of the reversals of existing temporary differences, tax planning strategies and projected future impacts attributable to the Act. If, based upon the weight of available evidence, it is more likely than not the deferred tax assets will not be realized, a valuation allowance is recorded. The weight given to the positive and negative evidence is commensurate with the extent to which the evidence may be objectively verified. As such, it is generally difficult for positive evidence regarding projected future taxable income exclusive of reversing taxable temporary differences to outweigh objective negative evidence of recent financial reporting losses, in particular, when there is a cumulative loss incurred over a three-year period. However, the three-year loss position is not solely determinate and, accordingly, management considers all other available positive and negative evidence in its analysis. In regards to the full valuation allowance recorded against the U.S. net deferred tax assets, despite recent improvement in the U.S. financial results, management concluded that the weight of negative evidence continues to outweigh the positive evidence, as the impact of COVID-19 reinforces the prevailing uncertainty surrounding global production volumes in 2020 that had already showed signs of softening which contributed to the reduction in the U.S. profitability during 2019. These factors further contribute to the relative uncertainty surrounding the ability that the U.S. operations will demonstrate sustained profitability in the future. Additionally, the Company has made a policy election to apply the incremental cash tax savings approach when analyzing the impact the Act's provisions for global intangible low-taxed income ("GILTI") could have on its U.S. valuation allowance assessment. As a result of future expected GILTI inclusions, and because of the Act’s ordering rules, U.S. companies may now expect to utilize tax attribute carryforwards (e.g. net operating losses and foreign tax credits) for which a valuation allowance has historically been recorded (this is referred to as the “tax law ordering approach”). However, due to the mechanics of the GILTI rules, companies that have a GILTI inclusion may realize a reduced (or no) cash tax savings from utilizing such tax attribute carryforwards (this view is referred to as the “incremental cash tax savings approach”). These positions, along with management’s analysis of all other available evidence, resulted in the conclusion that the Company maintain the valuation allowance against deferred tax assets in the U.S. Based on the Company’s current assessment, it is possible that within the next 12 to 24 months, the existing valuation allowance against the U.S. net deferred tax assets could be partially released. Any such release is dependent upon an improvement in U.S. operating results,
and, if such a release of the valuation allowance were to occur, it could have a significant impact on net income in the quarter in which it has invested are Variable Interest Entities (“VIE”) atis deemed appropriate to partially release the startreserve.
In March 2019, the closure of each new venture and whentax audits in Germany allowed the Company to initiate a reconsideration event has occurred. An enterprise must consolidate a VIE if it istax planning strategy previously determined not to be prudent. This strategy provided the primary beneficiarynecessary positive evidence to support the future utilization of a portion of the VIE.Company's deferred tax assets in Germany resulting in a $12 million valuation allowance release during the first quarter of 2019. In September 2020, the Company approved a restructuring program impacting engineering and administrative functions globally, including German operations. The primary beneficiary has both the power to direct the activitiesSeptember action, combined with earlier 2020 actions, necessitated a reassessment of the VIE that most significantly impactfuture utilization of deferred tax assets in Germany resulting in recording a $4 million discrete income tax expense adjustment during the entity’s economic performance and the obligation to absorb losses or the right to receivethird quarter of 2020.
Unrecognized Tax Benefits
Gross unrecognized tax benefits from the VIE that could potentially be significant to the VIE.
Visteon and Yangfeng Automotive Trim Systems Co. Ltd. ("YF") each own 50% of a joint venture under the name of Yanfeng Visteon Investment Co., Ltd. ("YFVIC"). In October 2014, YFVIC completed the purchase of YF’s 49% direct ownership in Yanfeng Visteon Automotive Electronics Co., Ltd ("YFVE") a consolidated joint venture of the Company ("The YFVIC Transaction"). The purchase by YFVIC was financed through a shareholder loan from YF and external borrowings, guaranteed by Visteon, have been paid as of September 30, 2019.
2020 and December 31, 2019 were $13 million in both years. Of these amounts, approximately $6 million in both years represent the amount of unrecognized benefits that, if recognized, would impact the effective tax rate. The gross unrecognized tax benefit differs from that which would impact the effective tax rate due to uncertain tax positions embedded in other deferred tax attributes carrying a full valuation allowance. If the uncertainty is resolved while a full valuation allowance is maintained, these uncertain tax positions should not impact the effective tax rate in current or future periods. The Company determined that YFVIC is a VIE. The Company holds a variablerecords interest in YFVIC primarilyand penalties related to its ownership interestsuncertain tax positions as a component of income tax expense and subordinated financial support. The Companyrelated amounts accrued at September 30, 2020 and YF each own 50% of YFVIC and neither entity has the power to control the operations of YFVIC; therefore,December 31, 2019 was $2 million in both years.
With few exceptions, the Company is no longer subject to U.S. federal tax examinations for years before 2014, or state, local or non-U.S. income tax examinations for years before 2003, although U.S. net operating losses carried forward into open tax years technically remain open to adjustment. Although it is not possible to predict the primary beneficiarytiming of YFVICthe resolution of all ongoing tax audits with accuracy, it is reasonably possible that certain tax proceedings in the U.S., Europe, Asia and Mexico could conclude within the next twelve months and result in a significant increase or decrease in the balance of gross unrecognized tax benefits. Given the number of years, jurisdictions and positions subject to examination, the Company is unable to estimate the full range of possible adjustments to the balance of unrecognized tax benefits. The long-term portion of uncertain income tax positions (including interest) in the amount of $5 million is included in "Other non-current liabilities" on the condensed consolidated balance sheet, while $3 million is reflected as a reduction of a deferred tax asset related to a net operating loss included in Other-non current assets on the condensed consolidated balance sheet.
During 2012, Brazil tax authorities issued tax assessment notices to Visteon Sistemas Automotivos (“Sistemas”) related to the sale of its chassis business to a third party, which required a deposit in the amount of $15 million during 2013 necessary to open a judicial proceeding against the government in order to suspend the debt and allow Sistemas to operate regularly before the tax authorities after attempts to reopen an appeal of the administrative decision failed. adjusted for currency impacts and accrued interest, the deposit amount is $10 million as of September 30, 2020. The Company believes that the risk of a negative outcome is remote once the matter is fully litigated at the highest judicial level. These appeal payments, as well as income tax refund claims associated with other jurisdictions, total $13 million as of September 30, 2020, and are included in "Other non-current assets" on the condensed consolidated balance sheets.
NOTE 11. Stockholders’ Equity and Non-controlling Interests
Share Repurchase Program
During the first quarter of 2020, the Company purchased a total of 233,769 shares of Visteon common stock at an average price of $67.87 for an aggregate purchase amount of $16 million pursuant to an agreement with a third-party financial institution.
During 2019, the Company purchased a total of 322,120 shares of Visteon common stock at an average price of $62.06 for an aggregate purchase amount of $20 million pursuant to various programs with third-party financial institutions.
As of September 30, 2020, $364 million is available for additional share repurchases under the Board of Directors authorization which expires on December 31, 2020. The Company currently does not consolidate the joint venture.intend to repurchase additional shares under this authorization.
16
A summary of the Company's investments in YFVIC is provided below:
|
| | | | | | | |
| | September 30 | | December 31 |
| | 2019 | | 2018 |
| | (Dollars in Millions) |
| Payables due to YFVIC | $ | 13 |
| | $ | 17 |
|
| Exposure to loss in YFVIC: | | | |
| Investment in YFVIC | $ | 43 |
| | $ | 38 |
|
| Receivables due from YFVIC | 45 |
| | 36 |
|
| Subordinated loan receivable from YFVIC | 8 |
| | 20 |
|
| Loan guarantee of YFVIC debt | — |
| | 11 |
|
| Maximum exposure to loss in YFVIC | $ | 96 |
| | $ | 105 |
|
Non-Controlling Interests
| | | | | | | | | | | |
| September 30, | | December 31, |
| (In millions) | 2020 | | 2019 |
| Yanfeng Visteon Automotive Electronics Co., Ltd. | $ | 53 | | | $ | 56 | |
| Shanghai Visteon Automotive Electronics, Co., Ltd. | 43 | | | 41 | |
| Changchun Visteon FAWAY Electronics, Co., Ltd. | 19 | | | 17 | |
| Other | 2 | | | 1 | |
| $ | 117 | | | $ | 115 | |
NOTE 7. Inventories
Inventories, net consist of the following components:
|
| | | | | | | |
| | September 30 | | December 31 |
| | 2019 | | 2018 |
| | (Dollars in Millions) |
| Raw materials | $ | 122 |
| | $ | 124 |
|
| Work-in-process | 25 |
| | 26 |
|
| Finished products | 45 |
| | 34 |
|
| | $ | 192 |
| | $ | 184 |
|
Changes in Accumulated other comprehensive income (loss) (“AOCI”) and reclassifications out of AOCI by component include:
| | | | | | | | | | | | | | | | | | | | | | | |
| Three Months Ended September 30, | | Nine Months Ended
September 30, |
| (In millions) | 2020 | | 2019 | | 2020 | | 2019 |
| Changes in AOCI: | | | | | | | |
| Beginning balance | $ | (299) | | | $ | (215) | | | $ | (267) | | | $ | (216) | |
| Other comprehensive income (loss) before reclassification, net of tax | 18 | | | (17) | | | (13) | | | (14) | |
| Amounts reclassified from AOCI | (1) | | | (2) | | | (2) | | | (4) | |
| Ending balance | $ | (282) | | | $ | (234) | | | $ | (282) | | | $ | (234) | |
| Changes in AOCI by Component: | | | | | | | |
| Foreign currency translation adjustments | | | | | | | |
| Beginning balance | $ | (185) | | | $ | (140) | | | $ | (153) | | | $ | (142) | |
| Other comprehensive income (loss) before reclassification, net of tax (a) | 28 | | | (28) | | | (4) | | | (26) | |
| Ending balance | (157) | | | (168) | | | (157) | | | (168) | |
| Net investment hedge | | | | | | | |
| Beginning balance | 9 | | | (1) | | | 4 | | | (5) |
| Other comprehensive income (loss) before reclassification, net of tax (a) | (9) | | | 13 | | | (1) | | | 20 | |
| Amounts reclassified from AOCI | (2) | | | (2) | | | (5) | | | (5) | |
| Ending balance | (2) | | | 10 | | (2) | | | 10 |
| Benefit plans | | | | | | | |
| Beginning balance | (111) | | | (70) | | | (114) | | | (71) | |
| Other comprehensive income (loss) before reclassification, net of tax (b) | (2) | | | 0 | | | 0 | | | 0 | |
| Amounts reclassified from AOCI | 1 | | | 0 | | | 2 | | | 1 | |
| Ending balance | (112) | | | (70) | | | (112) | | | (70) | |
| Unrealized hedging gain (loss) | | | | | | | |
| Beginning balance | (12) | | | (4) | | | (4) | | | 2 | |
| Other comprehensive income (loss) before reclassification, net of tax (c) | 1 | | | (2) | | | (8) | | | (8) | |
| Amounts reclassified from AOCI | 0 | | | 0 | | | 1 | | | 0 | |
| Ending balance | (11) | | | (6) | | | (11) | | | (6) | |
| Total AOCI | $ | (282) | | | $ | (234) | | | $ | (282) | | | $ | (234) | |
NOTE 8. Intangible Assets, net
Intangible assets, net are comprised of the following:
|
| | | | | | | | | | | | | |
| | | | September 30, 2019 |
| | Estimated Weighted Average Useful Life (years) | | Gross Intangibles | | Accumulated Amortization | | Net Intangibles |
| | | | (Dollars in Millions) |
| Definite-Lived: | | |
| Developed technology | 8 | | $ | 40 |
| | $ | (34 | ) | | $ | 6 |
|
| Customer related | 10 | | 87 |
| | (48 | ) | | 39 |
|
| Capitalized software development | 4 | | 27 |
| | (4 | ) | | 23 |
|
| Other | 21 | | 14 |
| | (4 | ) | | 10 |
|
| Subtotal | | | 168 |
| | (90 | ) | | 78 |
|
| Indefinite-Lived: | | |
| Goodwill | | | 46 |
| | — |
| | 46 |
|
| Total | | | $ | 214 |
| | $ | (90 | ) | | $ | 124 |
|
A roll-forward of the carrying amounts of intangible assets is presented below:
|
| | | | | | | | | | | | | | | | | | | | | | | | | | | |
| | December 31, 2018 | | September 30, 2019 |
| | Gross Intangibles | | Accumulated Amortization | | Net Intangibles | | Additions | | Foreign Currency | | Amortization Expense | | Net Intangibles |
| | (Dollars in Millions) |
| Definite-Lived: | | | | | | |
| Developed technology | $ | 40 |
| | $ | (31 | ) | | $ | 9 |
| | $ | — |
| | $ | — |
| | $ | (3 | ) | | $ | 6 |
|
| Customer related | 90 |
| | (42 | ) | | 48 |
| | — |
| | (2 | ) | | (7 | ) | | 39 |
|
| Capitalized software development | 16 |
| | (3 | ) | | 13 |
| | 11 |
| | — |
| | (1 | ) | | 23 |
|
| Other | 14 |
| | (2 | ) | | 12 |
| | — |
| | (1 | ) | | (1 | ) | | 10 |
|
| Subtotal | 160 |
| | (78 | ) | | 82 |
| | 11 |
| | (3 | ) | | (12 | ) | | 78 |
|
| Indefinite-Lived: | | | | | | |
| Goodwill | 47 |
| | — |
| | 47 |
| | — |
| | (1 | ) | | — |
| | 46 |
|
| Total | $ | 207 |
| | $ | (78 | ) | | $ | 129 |
| | $ | 11 |
| | $ | (4 | ) | | $ | (12 | ) | | $ | 124 |
|
During(b) Net tax expense was less than $1 million related to benefit plans for the three and nine months ended September 30, 20192020 and 2018 the Company recorded approximately $4 million and $12 million, and $4 million and $11 million of amortization expense related to definite-lived intangible assets, respectively. The Company currently estimates annual amortization expense to be $18 million for 2019, $15 million for 2020, $11 million for 2021, $11 million for 2022, $8 million for 2023, and $27 million cumulatively thereafter. Indefinite-lived intangible assets are not amortized but are tested for impairment at least annually, or earlier when events and circumstances indicate that it is more likely than not that such assets have been impaired.2019.
(c) There were no indicators of impairment duringincome tax effects related to unrealized hedging gain (loss) for either period due to the nine months ended September 30, 2019.
NOTE 9. Other Assets
Other current assets are comprised of the following components:
|
| | | | | | | |
| | September 30 | | December 31 |
| | 2019 | | 2018 |
| | (Dollars in Millions) |
| Recoverable taxes | $ | 51 |
| | $ | 46 |
|
| Joint venture receivables | 45 |
| | 37 |
|
| Contractually reimbursable engineering costs | 42 |
| | 40 |
|
| China bank notes | 23 |
| | 12 |
|
| Prepaid assets and deposits | 21 |
| | 20 |
|
| Other | 10 |
| | 4 |
|
| | $ | 192 |
| | $ | 159 |
|
The Company sold $59 million and $27 million of China bank notes during the nine months ended September 30, 2019 and 2018 respectively. The collection of such bank notes are included in operating cash flows based on the substance of the underlying transactions, which are operating in nature. As of September 30, 2019, $13 million remains outstanding and will mature by the end of the first quarter of 2020.
Other non-current assets are comprised of the following components:
|
| | | | | | | |
| | September 30 | | December 31 |
| | 2019 | | 2018 |
| | (Dollars in Millions) |
| Deferred tax assets | $ | 58 |
| | $ | 45 |
|
| Recoverable taxes | 28 |
| | 33 |
|
| Contractually reimbursable engineering costs | 21 |
| | 29 |
|
| Joint venture notes receivables | 8 |
| | 20 |
|
| Derivative financial instruments | 4 |
| | — |
|
| Other | 20 |
| | 16 |
|
| | $ | 139 |
| | $ | 143 |
|
Current and non-current contractually reimbursable engineering costs are related to pre-production design and development costs incurred pursuant to long-term supply arrangements that are contractually guaranteed for reimbursement by customers. The Company expects to receive cash reimbursement payments of approximately $14 million during the remainder of 2019, $35 million in 2020, $6 million in 2021, $3 million in 2022 and $5 million in 2023 and beyond.
NOTE 10. Leases
The Company has operating leases primarily for corporate offices, technical and engineering centers, customer centers, vehicles and certain equipment. As of September 30, 2019 assets and related accumulated depreciation recorded under finance leasing arrangements were not material.
The Company elected the package of practical expedients permitted under the transition guidance within the new lease standard, which among other things, allows the Company to carryforward the historical lease classification. The Company elected to combine lease components (e.g., fixed payments including rent, real estate taxes and insurance costs) with non-lease components (e.g., fixed common-area maintenance costs). The Company also elected to apply the practical expedient related to land easements, allowing the Company to carry forward its current accounting treatment for land easements on existing agreements.
Certain leases include one or more options to renew, with renewal terms that can extend the lease term from one to 30 years or more, leases may also include options to purchase the leased property or to terminate the leases. The depreciable life of assets and leasehold improvements are limited by the expected lease term, unless there is a transfer of title or purchase option reasonably certain of exercise.
Certain of the Company's lease agreements include rental payments adjusted periodically primarily for inflation. The Company’s lease agreements do not contain any material residual value guarantees or material restrictive covenants. The Company subleases certain real estate to third parties, which primarily consists of operating leases related to the Company’s principal executive offices in Van Buren Township, Michigan.
Leases with an initial term of 12 months or less are not recorded on the balance sheet; the Company recognizes lease expense for these leases on a straight-line basis over the lease term. As most of the Company's leases do not provide an implicit rate, the Company is applying its incremental borrowing rate based on corporate rates. The incremental borrowing rate is applied to the tranches of leases based on lease term, regardless of the asset class. For the three and nine months ended September 30, 2019, the weighted average remaining lease term and discount rate were 7 years and 4.5%, respectively.
The components of lease expense is as follows:
|
| | | | | | | |
| | Three Months Ended September 30 | | Nine Months Ended September 30 |
| | 2019 | | 2019 |
| | (Dollars in Millions) |
| Operating lease cost (includes immaterial variable lease costs) | $ | (10 | ) | | $ | (31 | ) |
| Short-term lease cost | — |
| | (1 | ) |
| Sublease income | 2 |
| | 4 |
|
| Total lease cost | $ | (8 | ) | | $ | (28 | ) |
Other information related to leases is as follows:
|
| | | |
| | Nine Months Ended September 30 |
| | 2019 |
| (Dollars in Millions) |
| Cash out flows from operating leases | $ | 28 |
|
| Right-of-use assets obtained in exchange for lease obligations | $ | 20 |
|
Future minimum lease payments under non-cancellable leases is as follows:
|
| | | |
| (Dollars in Millions) | |
| 2019 (excluding the nine months ended September 30, 2019) | $ | 9 |
|
| 2020 | 34 |
|
| 2021 | 27 |
|
| 2022 | 24 |
|
| 2023 | 23 |
|
| 2024 and thereafter | 71 |
|
| Total future minimum lease payments | 188 |
|
| Less imputed interest | 28 |
|
| Total lease liabilities | $ | 160 |
|
| | |
NOTE 11. Debt
The Company’s short and long-term debt consists of the following:
|
| | | | | | | |
| | September 30 | | December 31 |
| | 2019 | | 2018 |
| | (Dollars in Millions) |
| Short-Term Debt: | | | |
| Short-term borrowings | $ | 47 |
| | $ | 57 |
|
| | | | |
| Long-Term Debt: | | | |
| Term debt facility | $ | 348 |
| | $ | 348 |
|
Short-Term Debt
Short-term borrowings are primarily related to the Company's non-U.S. joint ventures and are payable in Chinese Renminbi and India Rupee. Available borrowings on outstanding affiliate credit facilities as of September 30, 2019, are approximately $68 million and certain of these facilities have pledged assets as security.
Long-Term Debt
As of September 30, 2019, the Company had an amended credit agreement (the "Credit Agreement") which included a $350 million Term Facility maturing March 24, 2024 and a Revolving Credit Facility with capacity of $300 million maturing March 24, 2022.
The Credit Agreement interest shall accrue at a rate equal to the applicable annualized domestic rate plus an applicable margin of 0.75% or the LIBOR-based rate plus an applicable margin of 1.75% per annum. The Company is required to pay accrued interest on any outstanding principal balance under the credit facility with a frequency of the lesser of the elected LIBOR tenor or every three months. Any outstanding principal under this facility will be due upon the maturity date. The Company may also terminate or reduce the borrowing commitments under this facility, in whole or in part, upon three business days’ notice.
Loans drawn under the Revolving Credit Facility accrue interest at an annualized rate equal to LIBOR plus a margin ranging from 1.25% to 2.25% as specified by a ratings grid contained in the Credit Agreement. Based on the Company’s current credit ratings, borrowings would accrue interest at LIBOR plus 1.75% per annum. The Revolving Credit Facility also provides $75 million availability for the issuance of letters of credit and a maximum of $20 million for swing line borrowing. Any amount of the facility utilized for letters of credit or swing line loans outstanding will reduce the amount available under the Revolving Credit Facility.
The Company may request increases in the limits under the Term Facility and the Revolving Credit Facility and may request the addition of one or more term loan facilities under the Credit Agreement. Outstanding borrowings may be prepaid without penalty (other than borrowings made for the purpose of reducing the effective interest rate margin or weighted average yield of the loans). There are mandatory prepayments of principal in connection with: (i) excess cash flow sweeps above certain leverage thresholds, (ii) certain asset sales or other dispositions, (iii) certain refinancing of indebtedness and (iv) over-advances under the Revolving Credit Facility. There are no excess cash flow sweeps required at the Company’s current leverage level.
The Credit Agreement requires the Company and its subsidiaries to comply with customary affirmative and negative covenants, and contains customary events of default. The Revolving Credit Facility also requires that the Company maintain a total net leverage ratio no greater than 3.00:1.00. During any period when the Company’s corporate and family ratings meet investment grade ratings, certain of the negative covenants will be suspended. As of September 30, 2019, the Company was in compliance with all its debt covenants.
In connection with the second amendment both the Term Facility and Revolving Credit Facility during 2017, the Company recorded $1 million of interest expense and deferred $2 million of costs as a non-current asset. The deferred costs are being amortized over the term of the debt facilities. As of September 30, 2019, the Term Facility remains at $350 million of aggregate principal outstanding and there were no borrowings under the Revolving Credit Facility.
Other
The Company has a $5 million letter of credit facility, whereby the Company is required to maintain a collateral account equal to 103% (110% for non-U.S. dollar denominated letters)of the aggregate stated amount of issued letters of credit and must reimburse any amounts drawn under issued letters of credit. The Company had $2 million of outstanding letters of credit issued under this facility secured by restricted cash, as of September 30, 2019. Additionally, the Company had $14 million of locally issued letters of credit with less than $1 million of collateral as of September 30, 2019, to support various tax appeals, customs arrangements and other obligations at its local affiliates.
NOTE 12. Other Liabilities
Other current liabilities are summarized as follows:
|
| | | | | | | |
| | September 30 | | December 31 |
| | 2019 | | 2018 |
| | (Dollars in Millions) |
| Product warranty and recall accruals | $ | 36 |
| | $ | 34 |
|
| Rent and royalties | 22 |
| | 14 |
|
| Deferred income | 18 |
| | 16 |
|
| Non-income taxes payable | 15 |
| | 13 |
|
| Joint venture payables | 13 |
| | 17 |
|
| Restructuring reserves | 11 |
| | 23 |
|
| Income taxes payable | 8 |
| | 15 |
|
| Dividends payable to non-controlling interests | 5 |
| | 3 |
|
| Other | 22 |
| | 26 |
|
| | $ | 150 |
| | $ | 161 |
|
Other non-current liabilities are summarized as follows:
|
| | | | | | | |
| | September 30 | | December 31 |
| | 2019 | | 2018 |
| | (Dollars in Millions) |
| Product warranty and recall accruals | $ | 15 |
| | $ | 14 |
|
| Derivative financial instruments | 14 |
| | 18 |
|
| Deferred income | 9 |
| | 14 |
|
| Income tax reserves | 6 |
| | 6 |
|
| Non-income tax reserves | 4 |
| | 5 |
|
| Other | 16 |
| | 19 |
|
| | $ | 64 |
| | $ | 76 |
|
NOTE 13. Employee Benefit Plans12. Earnings Per Share
Defined Benefit Plans
The Company's net periodic benefit costs for all defined benefit plans for the three month periods ended September 30, 2019 and 2018 were as follows:
|
| | | | | | | | | | | | | | | |
| | U.S. Plans | | Non-U.S. Plans |
| | 2019 | | 2018 | | 2019 | | 2018 |
| | (Dollars in Millions) |
| Costs Recognized in Income: | | | | | | | |
| Pension financing benefit (cost): | | | | | | | |
| Interest cost | $ | (8 | ) | | $ | (6 | ) | | $ | (2 | ) | | $ | (3 | ) |
| Expected return on plan assets | 10 |
| | 10 |
| | 2 |
| | 2 |
|
| Restructuring related pension cost: | | | | | | | |
| Special termination benefits | — |
| | — |
| | (1 | ) | | — |
|
| Net pension benefit (cost) | $ | 2 |
| | $ | 4 |
| | $ | (1 | ) | | $ | (1 | ) |
The Company's net periodic benefit costs for all defined benefit plans for the nine month periods ended September 30, 2019 and 2018 were as follows:
|
| | | | | | | | | | | | | | | |
| | U.S. Plans | | Non-U.S. Plans |
| | 2019 | | 2018 | | 2019 | | 2018 |
| | (Dollars in Millions) |
| Costs Recognized in Income: | | | | | | | |
| Pension service cost: | | | | | | | |
| Service cost | $ | — |
| | $ | — |
| | $ | (1 | ) | | $ | (1 | ) |
| Pension financing benefit (cost): | | | | | | | |
| Interest cost | (23 | ) | | (20 | ) | | (6 | ) | | (7 | ) |
| Expected return on plan assets | 30 |
| | 30 |
| | 7 |
| | 7 |
|
| Amortization of losses and other | — |
| | — |
| | (1 | ) | | (1 | ) |
| Restructuring related pension cost: | | | | | | | |
| Special termination benefits | — |
| | (1 | ) | | (1 | ) | | — |
|
| Net pension benefit (cost) | $ | 7 |
| | $ | 9 |
| | $ | (2 | ) | | $ | (2 | ) |
DuringBasic earnings per share is calculated by dividing net income attributable to Visteon by the weighted average number of shares of common stock outstanding. Diluted earnings per share is computed by dividing net income by the weighted average number of common and potentially dilutive common shares outstanding. Performance based share units are considered contingently issuable shares, and are included in the computation of diluted earnings per share based on the number of shares that would be issuable if the reporting date were the end of the contingency period and if the result would be dilutive.
The table below provides details underlying the calculations of basic and diluted earnings per share:
| | | | | | | | | | | | | | | | | | | | | | | |
| Three Months Ended September 30, | | Nine Months Ended
September 30, |
| (In millions, except per share amounts) | 2020 | | 2019 | | 2020 | | 2019 |
| Numerator: | | | | | | | |
| | | | | | | |
| | | | | | | |
| Net income (loss) attributable to Visteon | $ | 6 | | | $ | 14 | | | $ | (74) | | | $ | 35 | |
| Denominator: | | | | | | | |
| Average common stock outstanding - basic | 27.8 | | | 28.0 | | | 27.9 | | | 28.1 | |
| Dilutive effect of performance based share units and other | 0.2 | | | 0.1 | | | — | | | 0.1 | |
| Diluted shares | 28.0 | | | 28.1 | | | 27.9 | | | 28.2 | |
| Basic and Diluted Per Share Data: | | | | | | | |
| | | | | | | |
| | | | | | | |
| | | | | | | |
| Basic earnings (loss) per share attributable to Visteon | $ | 0.22 | | | $ | 0.50 | | | $ | (2.65) | | | $ | 1.25 | |
| | | | | | | |
| | | | | | | |
| | | | | | | |
| | | | | | | |
| Diluted earnings (loss) per share attributable to Visteon: | $ | 0.21 | | | $ | 0.50 | | | $ | (2.65) | | | $ | 1.24 | |
Performance based share units of approximately 181,000 were excluded from the calculation of diluted loss per share because the effect of including them would have been anti-dilutive for the nine months ended September 30, 2019, cash contributions to the Company's defined benefit plans were approximately $1 million for the U.S. plans and $4 million for the non-U.S. plans. The Company estimates that cash contributions to its defined benefit pension plans will be $7 million in 2019.2020.
NOTE 14. Income Taxes13. Fair Value Measurements and Financial Instruments
During the three and nine month periods ended September 30, 2019, the Company recorded a provision for income tax on continuing operations of $13 million and $16 million, respectively, which reflects income tax expense in countries where the Company is profitable; accrued withholding taxes; ongoing assessments related to the recognition and measurement of uncertain tax benefits; the inability to record a tax benefit for pretax losses and/or recognize expense for pretax income in certain jurisdictions (including the U.S.) due to valuation allowances; and other non-recurring tax items, including changes in judgment about valuation allowances. Pretax losses from continuing operations in jurisdictions where valuation allowances are maintained and no income tax benefits are recognized totaled $46 million and $10 million for the nine month periods ended September 30, 2019 and 2018, respectively, resulting in an increase in the Company's effective tax rate in those years.Fair Value Measurements
The Company provides for U.S.uses a three-level fair value hierarchy that categorizes assets and non-U.S. income taxes and non-U.S. withholding taxesliabilities measured at fair value based on the projected future repatriationsobservability of the earnings from its non-U.S. operationsinputs utilized in the valuation. The fair value hierarchy gives the highest priority to the quoted prices in active markets for identical assets and liabilities and lowest priority to unobservable inputs.
•Level 1 – Financial assets and liabilities whose values are based on unadjusted quoted market prices for identical assets and liabilities in an active market that the Company has the ability to access.
•Level 2 – Financial assets and liabilities whose values are based on quoted prices in markets that are not considered permanently reinvested at each tieractive or model inputs that are observable for substantially the full term of the legal entity structure. Duringasset or liability.
•Level 3 – Financial assets and liabilities whose values are based on prices or valuation techniques that require inputs that are both unobservable and significant to the nine month periods ended September 30, 2019 and 2018, the Company recognized expense primarily related to non-U.S. withholding taxes, including exchange impacts, of $5 million and $6 million, respectively, reflecting the Company's forecasts which contemplate numerous financial and operational considerations that impact future repatriations.overall fair value measurement.
The Company's provision for income taxes in interim periodsCompany is computed by applying an estimated annual effective tax rate against income before income taxes, excluding equity in net income of non-consolidated affiliates for the period. Effective tax rates vary from periodexposed to period as separate calculations are performed for those countries where the Company's operations are profitable and whose results continue to be tax-effected and for those countries where full deferred tax valuation allowances exist and are maintained. In determining the estimated annual effective tax rate, the Company analyzes various factors,market risks including, but not limited to, forecastschanges in currency exchange rates arising from the sale of projected annual earnings, taxing jurisdictionsproducts in countries other than the manufacturing source, foreign currency denominated supplier payments, debt, dividends and investments in subsidiaries. The Company manages these risks, in part, through the use of derivative financial instruments. The maximum length of time over which the pretax income and/or pretax losses will be generated, available tax planning strategies and estimated impacts attributable toCompany hedges the Act. The Company’s estimated annual effective tax rate is updated each quarter and may be significantly impacted by changes to the mix of forecasted earnings by tax jurisdiction. The tax impact of adjustments to the estimated annual effective tax rate are recorded in the period such estimates are revised. The Company is also required to record the tax impact of certain other non-recurring tax items, including changes in judgment about valuation allowances and uncertain tax positions, and changes in tax laws or rates, in the interim period in which they occur, rather than include them in the estimated annual effective tax rate.
The need to maintain valuation allowances against deferred tax assets in the U.S. and other affected countries will cause variability in the Company’s quarterlyfuture cash flows related to transactions, excluding those transactions as related to the payment of variable interest on existing debt, is eighteen months. The maximum length of time over which the Company hedges forecasted transactions related to variable interest payments is the term of the underlying debt.
Hedge instruments are measured at fair value on a recurring basis under an income approach using industry-standard models
that consider various assumptions, including time value, volatility factors, current market and annual effective tax rates. Full valuation allowances against deferred tax assetscontractual prices for the underlying and non-performance risk. Substantially all of these assumptions are observable in the U.S. and applicable foreign countries will be maintained until sufficient positive evidence exists to reduce or eliminate them. The factors considered by management in its determinationmarketplace throughout the full term of the probabilityinstrument or may derived from observable data. Accordingly, the Company's currency instruments are classified as Level 2, "Other Observable Inputs" in the fair value hierarchy.
The Company presents its derivative positions and any related material collateral under master netting arrangements that provide for the net settlement of contracts, by counterparty, in the event of default or termination. Derivative financial instruments are included in the Company’s condensed consolidated balance sheets. There is no cash collateral on any of these derivatives.
Currency Exchange Rate Instruments: The Company primarily uses forward contracts denominated in euro, Japanese yen, Thai baht and Mexican peso intended to mitigate the variability of cash flows denominated in currency other than the hedging entity's functional currency.
As of September 30, 2020 and December 31, 2019, the Company had foreign currency derivative instruments with gross notional values of $78 million and $40 million, respectively. At September 30, 2020, approximately $8 million of these instruments have been designated as cash flow hedges. Accordingly, the total change in fair value of these transactions are recognized in other comprehensive income, a component of shareholders' equity. Upon settlement of the realization oftransactions, the deferred tax assets include, butaccumulated gains and losses are not limitedreclassified to recent historical financial results, historical taxable income, projected future taxable income, the expected timing of the reversals of existing temporary differences, tax planning strategies and projected future impacts attributable to the Act. If, based upon the weight of available evidence, it is more likely than not the deferred tax assets will not be realized, a valuation allowance is recorded. The weight given to the positive and negative evidence is commensurate with the extent to which the evidence may be objectively verified. As such, it is generally difficult for positive evidence regarding projected future taxable income exclusive of reversing taxable temporary differences to outweigh objective negative evidence of recent financial reporting losses, in particular, when there is a cumulative loss incurred over a three-year period. However, the three-year loss position is not solely determinative and, accordingly, management considers all other available positive and negative evidence in its analysis. In regards to the full valuation allowance recorded against the U.S. net deferred tax assets, despite recent improvement in the U.S. financial results, management concluded that the weight of negative evidence continues to outweigh the positive evidence, in part attributable to unfavorable volumes for the most recent period and overall relative uncertainty surrounding global production volumes in later years. Additionally, the Company has made a policy election to apply the incremental cash tax savings approach when analyzing the impact the Act's provisions for global intangible low-taxed income ("GILTI") could have on its U.S. valuation allowance assessment. As a result of future expected GILTI inclusions, and because of the Act’s ordering rules, U.S. companies may now expect to utilize tax attribute carryforwards (e.g. net operating losses and foreign tax credits) for which a valuation allowance has historically been recorded (this is referred to as the “tax law ordering approach”). However, due to the mechanics of the GILTI rules, companies that have a GILTI inclusion may realize a reduced (or no) cash tax savings from utilizing such tax attribute carryforwards (this view is referred to as the “incremental cash tax savings approach”). These positions, along with management’s analysis of all other available evidence, resulted in the conclusion that the Company maintain the valuation allowance against deferred tax assets in the U.S. Based on the Company’s current assessment, it is possible that within the next 3 to 18 months, the existing valuation allowance against the U.S. net deferred tax assets could be partially released. Any such release is dependent upon the sustained improvement in U.S. operating results, and, if such a release of the valuation allowance were to occur, it could have a significant impact on net income in the quarter insame periods during which itthe hedged cash flows impact earnings. The fair value of these derivative instruments is deemed appropriate to partially release the reserve.
In March 2019, the closurea liability of tax audits in Germany allowed the Company to initiate a tax planning strategy previously determined not to be prudent. This strategy provided the necessary positive evidence to support the future utilization of a portion of the Company's deferred tax assets in Germany resulting in a $12 million valuation allowance release during the three months ended March 31, 2019.
Unrecognized Tax Benefits
Gross unrecognized tax benefits as of September 30, 2019 and December 31, 2018, including amounts attributable to discontinued operations, were $10 million in both years. Of these amounts approximately $3 million and $4less than $1 million, as of September 30, 20192020 and December 31, 2018, respectively, represent2019. The difference between the amountgross and net value of unrecognized benefits that, if recognized, would impactthese derivatives after offset by counter party is not material. As of September 30, 2020, a loss of less than $1 million is expected to be reclassified out of accumulated other comprehensive income into earnings within the effective tax rate. The gross unrecognized tax benefit differs from that which would impact the effective tax rate duenext 12 months related to uncertain tax positions embedded in other deferred tax attributes carrying a full valuation allowance. If the uncertainty is resolved while a full valuation allowance is maintained, these uncertain tax positions should not impact the effective tax rate in current or future periods. designated hedges.
Cross Currency Swaps: The Company records interesthas executed cross-currency swap transactions intended to mitigate the variability of the U.S. dollar value of its investment in certain of its non-U.S. entities. These transactions are designated as net investment hedges and penalties relatedthe Company has elected to uncertain tax positions as a componentassess hedge effectiveness under the spot method. Accordingly, periodic changes in the fair value of income tax expensethe derivative instruments attributable to factors other than spot exchange rate variability are excluded from the measurement of hedge ineffectiveness and related amounts accrued atreported directly in earnings each reporting period.
As of September 30, 20192020 and December 31, 2018 was $2 million in both years.
With few exceptions,2019, the Company had cross currency swaps with an aggregate notional value of $250 million. The aggregate fair value of these derivatives is no longer subject to U.S. federal tax examinations for years before 2014, or state, local or non-U.S. income tax examinations for years before 2003, although U.S. net operating losses carried forward into open tax years technically remain open to adjustment. Although it is not possible to predict the timing of the resolution of all ongoing tax audits with accuracy, it is reasonably possible that certain tax proceedings in the U.S., Europe, Asia and Mexico could conclude within the next twelve months and result in a significant increase or decrease in the balance of gross unrecognized tax benefits. Given the number of years, jurisdictions and positions subject to examination, the Company is unable to estimate the full range of possible adjustments to the balance of unrecognized tax benefits. The long-term portion of uncertain income tax positions (including interest) in the amount of $6 million is included in "Other non-current liabilities" on the consolidated balance sheets.
During 2012, Brazil tax authorities issued tax assessment notices to Visteon Sistemas Automotivos (“Sistemas”) related to the sale of its chassis business to a third party, which required a deposit in the amountliability of $15 million during 2013 necessary to open a judicial proceeding against the government in order to suspend the debt and allow Sistemas to operate regularly before the tax authorities after attempts to reopen an appeal of the administrative decision failed. Adjusted for currency impacts and accrued interest, the deposit amount is approximately $13$6 million as of September 30, 2019. 2020 and December 31, 2019, respectively. As of September 30, 2020, a gain of $6 million is expected to be reclassified out of accumulated other comprehensive income into earnings within the next 12 months.
Interest Rate Swaps: The Company believes thatutilizes interest rate swap instruments to manage its exposure and to mitigate the riskimpact of interest rate variability. The instruments are designated as cash flow hedges, accordingly, the effective portion of the periodic changes in fair value is recognized in accumulated other comprehensive income, a negative outcomecomponent of shareholders' equity. Subsequently, the accumulated gains and losses recorded in equity are reclassified to income in the period during which the hedged cash flow impacts earnings.
As of September 30, 2020 and December 31, 2019, the Company had interest rate swaps with an aggregate notional value of $300 million and $250 million, respectively. The aggregate fair value of these derivative transactions is remote once the matter is fully litigated at the highest judicial level. These appeal payments, as well as income tax refund claims associated with other jurisdictions, total $16a non-current liability of $12 million and $7 million as of September 30, 2020 and December 31, 2019, and are included in "Other non-current assets" on the consolidated balance sheets.
NOTE 15. Stockholders’ Equity and Non-controlling Interests
Share Repurchase Program
On January 9, 2017, the Company's Board of Directors authorized $400 million of share repurchases of common stock through March 2018. On January 15, 2018, the Company's Board of Directors authorized an additional $300 million of share repurchases, for a total authorization of $700 million, of its shares of common stock through December 2020.
During 2018, the Company entered into various programs with third-party financial institutions to purchase a total of approximately 2.8 million shares of Visteon common stock at an average price of $106.92 for an aggregate purchase amount of $300 million.
During the nine months ended September 30, 2019, the Company has purchased a total of 322,120 shares of Visteon common stock at an average price of $62.06 for an aggregate purchase amount of $20 million pursuant to various programs with third-party financial institutions.
respectively. As of September 30, 2019, the Company may execute up2020, a loss of $6 million is expected to $380 million additional share repurchases under the Boardbe reclassified out of Directors authorization which expires on December 31, 2020.
Stock-based Compensation
During the nine months ended September 30, 2018, equity increased $13 million due to the forfeiture of unvested shares for a litigation matter with the Company's former CEO as further described in Note 19, "Commitments and Contingencies," classified as a benefit of $10 million to selling, general and administrative expenses and a $3 million benefit classified as discontinued operations.
Non-Controlling Interests
The Company's non-controlling interests are as follows:
|
| | | | | | | |
| | September 30 | | December 31 |
| | 2019 | | 2018 |
| | (Dollars in Millions) |
| Yanfeng Visteon Automotive Electronics Co., Ltd. | $ | 52 |
| | $ | 56 |
|
| Shanghai Visteon Automotive Electronics, Co., Ltd. | 41 |
| | 43 |
|
| Changchun Visteon FAWAY Electronics, Co., Ltd. | 16 |
| | 15 |
|
| Other | 1 |
| | 3 |
|
| | $ | 110 |
| | $ | 117 |
|
During the nine months ended September 30, 2019, the Company paid less than a $1 million to purchase the remaining shares of a previous non-controlling interest.
Accumulated Other Comprehensive Loss
Changes in Accumulatedaccumulated other comprehensive income (loss) (“AOCI”)into earnings within the next 12 months.
Financial Statement Presentation
Gains and
reclassifications out of AOCI by component include: |
| | | | | | | | | | | | | | | |
| | Three Months Ended September 30 |
| Nine Months Ended
September 30 |
| | 2019 | | 2018 | | 2019 | | 2018 |
| | (Dollars in Millions) |
| Changes in AOCI: | | | | | | | |
| Beginning balance | $ | (215 | ) | | $ | (195 | ) | | $ | (216 | ) | | $ | (174 | ) |
| Other comprehensive loss before reclassification, net of tax | (17 | ) | | (11 | ) | | (14 | ) | | (33 | ) |
| Amounts reclassified from AOCI | (2 | ) | | (2 | ) | | (4 | ) | | (1 | ) |
| Ending balance | $ | (234 | ) | | $ | (208 | ) | | $ | (234 | ) | | $ | (208 | ) |
| Changes in AOCI by Component: | | |
| Foreign currency translation adjustments | | | | | | | |
| Beginning balance | $ | (140 | ) | | $ | (129 | ) | | $ | (142 | ) | | $ | (100 | ) |
| Other comprehensive loss before reclassification, net of tax (a) | (28 | ) | | (14 | ) | | (26 | ) | | (43 | ) |
| Ending balance | (168 | ) | | (143 | ) | | (168 | ) | | (143 | ) |
| Net investment hedge | | | | | | | |
| Beginning balance | (1 | ) | | (10 | ) | | (5 | ) | | (12) |
|
| Other comprehensive income before reclassification, net of tax (a) | 13 |
| | 1 |
| | 20 |
| | 3 |
|
| Amounts reclassified from AOCI | (2 | ) | | (1 | ) | | (5 | ) | | (1 | ) |
| Ending balance | 10 |
| | (10) |
| | 10 |
| | (10) |
|
| Benefit plans | | | | | | | |
| Beginning balance | (70 | ) | | (61 | ) | | (71 | ) | | (63 | ) |
| Other comprehensive income before reclassification, net of tax (b) | — |
| | — |
| | — |
| | 1 |
|
| Amounts reclassified from AOCI (c) | — |
| | — |
| | 1 |
| | 1 |
|
| Ending balance | (70 | ) | | (61 | ) | | (70 | ) | | (61 | ) |
| Unrealized hedging gain (loss) | | | | | | | |
| Beginning balance | (4 | ) | | 5 |
| | 2 |
| | 1 |
|
| Other comprehensive income (loss) before reclassification, net of tax (c) | (2 | ) | | 2 |
| | (8 | ) | | 6 |
|
| Amounts reclassified from AOCI | — |
| | (1 | ) | | — |
| | (1 | ) |
| Ending balance | (6 | ) | | 6 |
| | (6 | ) | | 6 |
|
| Total AOCI | $ | (234 | ) | | $ | (208 | ) | | $ | (234 | ) | | $ | (208 | ) |
(a) There were no income tax effects for either period due to the valuation allowance.
(b) Net tax expense was less than $1 million related to benefit planslosses on derivative financial instruments for the three and nine months ended September 30, 2020 and 2019 are as follows:
| | | | | | | | | | | | | | | | | | | | | | | | | | | |
| Recorded Income (Loss) into AOCI, net of tax | | Reclassified from AOCI into Income (Loss) | | |
| (In millions) | 2020 | | 2019 | | 2020 | | 2019 | | | | |
| Three months ended September 30, | | | | | | | | | | | |
| | | | | | | | | | | |
| | | | | | | | | | | |
| | | | | | | | | | | |
| Foreign currency risk - Cost of sales: | | | | | | | | | | | |
| Cash flow hedges | $ | 1 | | | $ | — | | | $ | — | | | $ | — | | | | | |
| | | | | | | | | | | |
| Interest rate risk - Interest expense, net: | | | | | | | | | | | |
| Interest rate swap | 0 | | | (2) | | | 0 | | | 0 | | | | | |
| Net investment hedges | (9) | | | 13 | | | 2 | | | 2 | | | | | |
| $ | (8) | | | $ | 11 | | | $ | 2 | | | $ | 2 | | | | | |
| Nine months ended September 30, | | | | | | | | | | | |
| | | | | | | | | | | |
| | | | | | | | | | | |
| | | | | | | | | | | |
| Foreign currency risk - Cost of sales: | | | | | | | | | | | |
| Cash flow hedges | $ | — | | | $ | — | | | $ | — | | | $ | — | | | | | |
| | | | | | | | | | | |
| Interest rate risk - Interest expense, net: | | | | | | | | | | | |
| Interest rate swap | (8) | | | (8) | | | (1) | | | 0 | | | | | |
| Net investment hedges | (1) | | | 20 | | | 5 | | | 5 | | | | | |
| $ | (9) | | | $ | 12 | | | $ | 4 | | | $ | 5 | | | | | |
Items Not Carried at Fair Value
The Company's fair value of debt was $342 million and 2018.
(c) For the three and nine months ended$390 million as of September 30, 2020 and December 31, 2019, thererespectively. Fair value estimates were no income tax effects related to unrealized hedging gain (loss) duebased on the current rates offered to the valuation allowance. Net tax benefit was less than $1 million relatedCompany for debt of the same remaining maturities. Accordingly, the Company's debt fair value disclosures are classified as Level 2, "Other Observable Inputs" in the fair value hierarchy.
Concentrations of Credit Risk
Financial instruments including cash equivalents, derivative contracts, and accounts receivable, expose the Company to unrealized hedging gain (loss)counter-party credit risk for non-performance. The Company’s counterparties for cash equivalents and derivative contracts are banks and financial institutions that meet the three months endedCompany’s credit rating requirements. The Company’s counterparties for derivative contracts are substantial investment and commercial banks with significant experience using such derivatives. The Company manages its credit risk pursuant to written policies that specify minimum counterparty credit profile and by limiting the concentration of credit exposure amongst its multiple counterparties.
The Company's credit risk with any single customer does not exceed ten percent of total accounts receivable except for Ford and its affiliates which represent 14% and 12%, and Renault/Nissan which represents 12% and 13%, of the Company's balance as of September 30, 2018. Net tax expense was less than $1 million related to unrealized hedging gain (loss) for the nine months ended September 30, 2018.2020 and December 31, 2019, respectively.
NOTE 16. Fair Value Measurements and Financial Instruments
Fair Value Measurements
The Company uses a three-level fair value hierarchy that categorizes assets and liabilities measured at fair value based on the observability of the inputs utilized in the valuation. The fair value hierarchy gives the highest priority to the quoted prices in active markets for identical assets and liabilities and lowest priority to unobservable inputs.
Level 1 – Financial assets and liabilities whose values are based on unadjusted quoted market prices for identical assets and liabilities in an active market that the Company has the ability to access.
Level 2 – Financial assets and liabilities whose values are based on quoted prices in markets that are not active or model inputs that are observable for substantially the full term of the asset or liability.
Level 3 – Financial assets and liabilities whose values are based on prices or valuation techniques that require inputs that are both unobservable and significant to the overall fair value measurement.
Items Measured at Fair Value on a Recurring Basis
The Company is exposed to various market risks including, but not limited to, changes in currency exchange rates arising from the sale of products in countries other than the manufacturing source, foreign currency denominated supplier payments, debt, dividends and investments in subsidiaries. The Company manages these risks, in part, through the use of derivative financial instruments. The maximum length of time over which the Company hedges the variability in the future cash flows related to transactions, excluding those transactions as related to the payment of variable interest on existing debt, is eighteen months. The maximum length of time over which the Company hedges forecasted transactions related to variable interest payments is the term of the underlying debt.
Hedge instruments are measured at fair value on a recurring basis under an income approach using industry-standard models that consider various assumptions, including time value, volatility factors, current market and contractual prices for the underlying and non-performance risk. Substantially all of these assumptions are observable in the marketplace throughout the full term of the instrument or may derived from observable data. Accordingly, the Company's currency instruments are classified as Level 2, "Other Observable Inputs" in the fair value hierarchy.
The Company presents its derivative positions and any related material collateral under master netting arrangements that provide for the net settlement of contracts, by counterparty, in the event of default or termination. Derivative financial instruments are included in the Company’s consolidated balance sheets. There is no cash collateral on any of these derivatives.
Currency Exchange Rate Instruments: The Company primarily uses forward contracts denominated in Euro, Japanese Yen, Thai Baht and Mexican Peso intended to mitigate the variability of cash flows denominated in currency other than the hedging entity's functional currency.
As of September 30, 2019 and December 31, 2018, the Company had foreign currency derivative instruments with aggregate notional value of approximately $9 million and $23 million, respectively. The fair value of these derivatives is a liability of less than $1 million and an asset of $1 million, as of September 30, 2019 and December 31, 2018, respectively. The difference between the gross and net value of these derivatives after offset by counter party is not material.
Cross Currency Swaps: The Company has executed cross-currency swap transactions intended to mitigate the the variability of the U.S. dollar value of its investment in certain of its non-U.S. entities. These transactions are designated as net investment hedges and the Company has elected to assess hedge effectiveness under the spot method. Accordingly, periodic changes in the fair value of the derivative instruments attributable to factor other than spot exchange rate variability are excluded from the measure of hedge ineffectiveness and reported directly in earnings each reporting period.
As of September 30, 2019 and December 31, 2018, the Company had cross currency swaps with an aggregate notional value of $250 million. The aggregate fair value of these derivatives is a non-current liability of $1 million and $16 million at September 30, 2019 and December 31, 2018, respectively. The amount of accumulated other income expected to be reclassified into earnings within the next 12 months is a gain of approximately $7 million.
Interest Rate Swaps: The Company utilizes interest rate swap instruments to manage its exposure and to mitigate the impact of interest rate variability. The instruments are designated as cash flow hedges, accordingly, the effective portion of the periodic changes in fair value is recognized in accumulated other comprehensive income, a component of shareholders' equity. Subsequently, the accumulated gains and losses recorded in equity are reclassified to income in the period during which the hedged cash flow impacts earnings.
As of September 30, 2019 and December 31, 2018, the Company had an aggregate notional value of interest rate swap transactions of $250 million. The aggregate fair value of these derivative transactions as of September 30, 2019 and December 31, 2018 was a non-current liability of approximately $9 million and a non-current asset of $2 million, respectively. As of September 30, 2019, a gain of approximately $2 million is expected to be reclassified out of accumulated other comprehensive income into earnings within the next 12 months.
Financial Statement Presentation
Gains and losses on derivative financial instruments for the three and nine months ended September 30, 2019 and 2018 are as follows:
|
| | | | | | | | | | | | | | | | | | | | | | | |
| | Recorded Income (Loss) into AOCI, net of tax | | Reclassified from AOCI into Income (Loss) | | Recorded in Income (Loss) |
| | 2019 | | 2018 | | 2019 | | 2018 | | 2019 | | 2018 |
| | (Dollars in Millions) |
| Three months ended September 30, 2019 | | | | | | | | | | | |
| Foreign currency risk - Cost of sales: | | | | | | | | | | | |
| Cash flow hedges | $ | — |
| | $ | — |
| | $ | — |
| | $ | 1 |
| | $ | — |
| | $ | — |
|
| Interest rate risk - Interest expense, net: | | | | | | | | | | | |
| Interest rate swap | (2 | ) | | 2 |
| | — |
| | — |
| | — |
| | — |
|
| Net investment hedges | 13 |
| | 1 |
| | 2 |
| | 1 |
| | — |
| | — |
|
| | $ | 11 |
| | $ | 3 |
| | $ | 2 |
| | $ | 2 |
| | $ | — |
| | $ | — |
|
| Nine months ended September 30, 2019 | | | | | | | | | | | |
| Foreign currency risk - Cost of sales: | | | | | | | | | | | |
| Cash flow hedges | $ | — |
| | $ | 2 |
| | $ | — |
| | $ | 1 |
| | $ | — |
| | $ | — |
|
| Non-designated cash flow hedges | — |
| | — |
| | — |
| | — |
| | — |
| | 1 |
|
| Interest rate risk - Interest expense, net: | | | | | | | | | | | |
| Interest rate swap | (8 | ) | | 4 |
| | — |
| | — |
| | — |
| | — |
|
| Net investment hedges | 20 |
| | 3 |
| | 5 |
| | 1 |
| | — |
| | — |
|
| | $ | 12 |
| | $ | 9 |
| | $ | 5 |
| | $ | 2 |
| | $ | — |
| | $ | 1 |
|
Items Not Carried at Fair Value
The Company's fair value of debt was approximately $393 million and $388 million as of September 30, 2019 and December 31, 2018, respectively. Fair value estimates were based on the current rates offered to the Company for debt of the same remaining maturities. Accordingly, the Company's debt fair value disclosures are classified as Level 2, "Other Observable Inputs" in the fair value hierarchy.
Investments
In 2018, the Company committed to make a $15 million investment in two entities principally focused on the automotive sector pursuant to limited partnership agreements. As a limited partner in each entity, the Company will periodically make capital contributions toward this total commitment amount. As of September 30, 2019 and December 31, 2018, the Company contributed approximately $2 million and $1 million, respectively. The Company does not have significant influence in either partnership. These investments are carried at cost and evaluated for impairment on an annual basis.
The carrying amount of these investments reflected on the consolidated balance sheets approximates their fair values.
Concentrations of Credit Risk
Financial instruments including cash equivalents, derivative contracts, and accounts receivable, expose the Company to counter-party credit risk for non-performance. The Company’s counterparties for cash equivalents and derivative contracts are banks and financial institutions that meet the Company’s credit rating requirements. The Company’s counterparties for derivative contracts are substantial investment and commercial banks with significant experience using such derivatives. The Company manages its credit risk pursuant to written policies that specify minimum counterparty credit profile and by limiting the concentration of credit exposure amongst its multiple counterparties.
The Company's credit risk with any single customer does not exceed ten percent of total accounts receivable except for Ford and its affiliates which represent 15% and 14%, and Renault/Nissan which represents 13% and 11%, of the balance as of September 30, 2019 and December 31, 2018, respectively.
NOTE 17. Acquisitions
On September 1, 2018, the Company invested approximately $300,000 and acquired an additional 1% ownership in VFAE, a Chinese automotive electronic applications manufacturer in which the Company had previously been an equity investor. The Company's ownership interest increased to 51% and, because of the change in control, the assets and liabilities of VFAE were consolidated from the date of the transaction. The Company made this additional investment as part of its long-term strategic plan for VFAE. The investment will contribute to the business growth and enhanced economic performance of VFAE by leveraging Visteon’s manufacturing technology and engineering capabilities.
The VFAE acquisition has been accounted for as a purchase transaction. The total consideration, including the $300,000 paid and the fair value of the original 50% interest, has been allocated to the assets acquired, liabilities assumed and non-controlling shareholder interest based on their representative value at September 1, 2018. The excess consideration over the estimated fair value of the net assets acquired has been allocated to goodwill. The operating results of VFAE have been included in the consolidated financial statements of the Company since the date of the transaction.
A summary of the fair value of the assets acquired and liabilities assumed, translated in U.S. dollars, in conjunction with the transaction is shown below (in millions):
|
| | | | | | | | |
| Assets Acquired | | | Liabilities Assumed | |
| Cash and equivalents | $ | 16 |
| | Payable to Visteon Corporation | $ | 9 |
|
| Accounts receivable, net | 12 |
| | Accounts payable | 6 |
|
| Inventories, net | 4 |
| | Other current liabilities | 5 |
|
| Other current assets | 6 |
| | Income taxes payable | 1 |
|
| Property and equipment, net | 5 |
| | Other non-current liabilities | 2 |
|
| Intangible assets including goodwill | 9 |
| | Total liabilities assumed | 23 |
|
| Other non-current assets | 1 |
| | Non-controlling interest | 15 |
|
| Total assets acquired | $ | 53 |
| | Visteon Corporation Consideration | $ | 15 |
|
The Company utilized a third party to assist in the fair value determination of certain components of the purchase price allocation, primarily intangible assets and non-controlling interest, as well as the fair value of the Company’s original 50% equity investment.
Fair values of equity investment and non-controlling interest, as of the acquisition date were estimated using the discounted cash flow technique of the income approach. Fair values of intangible assets were based on the excess earning method of the income approach. The income approach requires the Company to project related future cash inflows and outflows and apply an appropriate discount rate. The estimates used in determining fair values are based on assumptions believed to be reasonable but which are inherently uncertain.
The Company previously recorded its investment in VFAE of $10 million as an Investment in non-consolidated affiliates on its consolidated balance sheets. In connection with its increased investment in VFAE, the Company recorded a gain of approximately $4 million on its original investment, classified as "Other income, net" in the consolidated income statement.
The acquisition does not meet the thresholds for a significant acquisition and therefore no pro forma financial information is presented.
NOTE 18. Discontinued Operations
The Company completed the sale of the majority of its global Climate business (the "Climate Transaction") during 2015 and completed the divestiture of its global Interiors business in 2016 (the "Interiors Divestiture"). These transactions met the conditions required to qualify for discontinued operations reporting and accordingly the settlement of retained contingencies have been classified in income from discontinued operations, net of tax, in the consolidated statements of comprehensive income for the three and nine months ended September 30, 2019 and 2018.
Discontinued operations are summarized as follows:
|
| | | | | | | | | | | | | | | |
| | Three Months Ended September 30 | | Nine Months Ended
September 30 |
| | 2019 | | 2018 | | 2019 | | 2018 |
| | (Dollars in Millions) |
| Cost of sales | $ | — |
| | $ | — |
| | $ | (1 | ) | | $ | — |
|
| Selling, general and administrative expenses | — |
| | — |
| | — |
| | (1 | ) |
| Restructuring, net | — |
| | — |
| | 1 |
| | (1 | ) |
| Gain on divestitures | — |
| | 1 |
| | — |
| | 4 |
|
| Income from discontinued operations, net of tax | $ | — |
| | $ | 1 |
| | $ | — |
| | $ | 2 |
|
During the first nine months of 2018, the Company recognized a $3 million benefit on settlement of litigation matters with its former CEO as further described in Note 19, "Commitments and Contingencies."
NOTE 19.14. Commitments and Contingencies
Litigation and Claims
The dispute betweenIn 2003, the Local Development Finance Authority of the Charter Township of Van Buren, Michigan issued approximately $28 million in bonds finally maturing in 2032, the proceeds of which were used at least in part to assist in the development of the Company’s U.S. headquarters located in the Township. During January 2010, the Company and its former CEO was resolvedthe Township entered into a settlement agreement (the “Settlement Agreement”) that, among other things, reduced the taxable value of the headquarters property to current market value. The Settlement Agreement also provided that the Company would negotiate in good faith with the Township, pursuant to the terms of the Settlement Agreement, in the first quarter of 2018. Pursuantevent that property tax payments were inadequate to permit the Township to meet its payment obligations with respect to the resolution,bonds. In October 2019, the Township notified the Company recognized $17 millionthat the Township had incurred a shortfall under the bonds of pre-tax income, representing the forfeiture of stock based awards and release of other liabilities accrued during prior periods. The benefit is classified as a reduction to selling, general and administrative expenses of $10 million, a benefit to "Other income, net" of $4less than $1 million and a benefitrequested that the Company
meet to discontinued operationsdiscuss payment. The parties met in November 2019 but no agreement was reached. On December 9, 2019, the Township commenced litigation against the Company in Michigan’s Wayne County Circuit Court claiming damages of $3$28 million duringrelated to what the nine months ended September 30, 2018.
In November 2013, the Company and Halla Visteon Climate Control Corporation (“HVCC”), jointly filed an Initial Notice of Voluntary Self-Disclosure statement with the U.S. Treasury Department’s Office of Foreign Assets Control (“OFAC”) regarding certain sales of automotive HVAC components by a minority-owned, Chinese joint venture of HVCC into Iran. The Company updated that notice in December 2013, and subsequently filed a voluntary self-disclosure regarding these sales with OFAC in March 2014. In May 2014, the Company voluntarily filed a supplementary self-disclosure identifying additional sales of automotive HVAC components by the Chinese joint venture, as well as similar sales involving an HVCC subsidiary in China, totaling approximately $12 million, and filed a final voluntary-self disclosure with OFAC on October 17, 2014. OFAC is currently reviewing the results of the Company’s investigation. Following that review, OFAC may conclude that the disclosed sales resulted in violations of U.S. economic sanctions laws and warrant the imposition of civil penalties, such as fines, limitations on the Company's ability to export products from the United States, and/or referral for further investigation by the U.S. Department of Justice. Any such fines or restrictions may be material to the Company’s financial results in the period in which they are imposed, but the Company is not able to estimate the possible loss or range of loss in connection with this matter. Additionally, disclosure of this conduct and any fines or other action relating to this conduct could harm the Company’s reputation and have a material adverse effect on its business, operating results and financial condition. The Company cannot predict when OFAC will conclude its own review of voluntary self-disclosures or whether it may impose any of the potential penalties described above.
The Company's operations in Brazil are subject to highly complex labor, tax, customs and other laws. While the Company believes that it is in compliance with such laws, it is periodically engaged in litigation regarding the application of these laws. The Company maintained accruals of approximately $11$8 million for claims aggregating approximately $73$52 million in Brazil as of September 30, 2019.2020. The amounts accrued represent claims that are deemed probable of loss and are reasonably estimable based on the Company's assessment of the claims and prior experience with similar matters.
While the Company believes its accruals for litigation and claims are adequate, the final amounts required to resolve such matters could differ materially from recorded estimates and the Company's results of operations and cash flows could be materially affected.
Guarantees and Commitments
During 2014, as part of the YFVIC Transaction, the Company guaranteed certain standard non-payment provisions to cover the lenders in event of non-payment of principal, accrued interest, and other fees due. The loan was fully payed by the borrower and the guarantee concurrently relieved during the quarter ended September 30, 2019.
As part of the agreements involving the divestiture of the Climate Transactionbusiness (the "Climate Transaction") and Interiors Divestiture, the Company continues to provide lease guarantees to divested Climate and Interiors entities. As of September 30, 2019,2020, the Company has approximately $5 million and $1 million
of outstanding guarantees, related to the divested Climate and Interiors entities, respectively. TheseThe guarantees represent the maximum potential amount that the Company could be required to pay under the guarantees in the event of default by the guaranteed parties. The guarantees will generally cease upon expiration of current lease agreement which expire in 2026 and 2021 for the Climate and Interiors entities, respectively.
Product Warranty and Recall
Amounts accrued for product warranty and recall claims are based on management’s best estimates of the amounts that will ultimately be required to settle such items. The Company’s estimates for product warranty and recall obligations are developed with support from its sales, engineering, quality and legal functions and include due consideration of contractual arrangements, past experience, current claims and related information, production changes, industry and regulatory developments and various other considerations. The Company can provide no assurances that it will not experience material claims in the future or that it will not incur significant costs to defend or settle such claims beyond the amounts accrued or beyond what the Company may recover from its suppliers. Specific cause actions represent customer actions related to defective supplier parts and related software.
The following table provides a reconciliationrollforward of changes in the product warranty and recall claims liability:
| | | | | | | | | | | |
| Nine Months Ended September 30, |
| (In millions) | 2020 | | 2019 |
| Beginning balance | $ | 49 | | | $ | 48 | |
| Accruals for products shipped | 11 | | | 15 | |
| Changes in estimates | (2) | | | 2 | |
| Specific cause actions | 5 | | | 3 | |
| | | |
| | | |
| | | |
| Settlements | (14) | | | (16) | |
| Foreign currency translation | 1 | | | (1) | |
| Ending balance | $ | 50 | | | $ | 51 | |
|
| | | | | | | |
| | Nine Months Ended September 30 |
| | 2019 | | 2018 |
| | (Dollars in Millions) |
| Beginning balance | $ | 48 |
| | $ | 49 |
|
| Accruals for products shipped | 15 |
| | 14 |
|
| Changes in estimates | 2 |
| | (1 | ) |
| Specific cause actions | 3 |
| | 5 |
|
| Recoverable warranty/recalls | — |
| | 2 |
|
| Foreign currency | (1 | ) | | (1 | ) |
| VFAE Consolidation | — |
| | 1 |
|
| Settlements | (16 | ) | | (18 | ) |
| Ending balance | $ | 51 |
| | $ | 51 |
|
Other Contingent Matters
Various legal actions, governmental investigations and proceedings and claims are pending or may be instituted or asserted in the future against the Company, including those arising out of alleged defects in the Company’s products; governmental regulations relating to safety; employment-related matters; customer, supplier and other contractual relationships; intellectual property rights; product warranties; product recalls; and environmental matters. Some of the foregoing matters may involve compensatory, punitive or antitrust or other treble damage claims in very large amounts, or demands for recall campaigns, environmental remediation programs, sanctions, or other relief which, if granted, would require very large expenditures. The Company enters into agreements that contain indemnification provisions in the normal course of business for which the risks are considered nominal and impracticable to estimate.
Contingencies are subject to many uncertainties, and the outcome of individual litigated matters is not predictable with assurance. Reserves have been established by the Company for matters discussed in the immediately foregoing paragraphparagraphs where losses are deemed probable and reasonably estimable. It is possible, however, that some of the matters discussed in the foregoing paragraphparagraphs could be decided unfavorably to the Company and could require the Company to pay damages or make other expenditures in amounts, or a range of amounts, that cannot be estimated as of September 30, 20192020 and that are in excess of established reserves. The Company does not reasonably expect, except as otherwise described herein, based on its analysis, that any adverse outcome from such matters would have a material effect on the Company’s financial condition, results of operations or cash flows, although such an outcome is possible.
NOTE 15. Segment Information
Financial results for the Company's reportable segment have been prepared using a management approach, which is consistent with the basis and manner in which financial information is evaluated by the Company's chief operating decision maker in allocating resources and in assessing performance. The Company’s chief operating decision maker, the Chief Executive Officer, evaluates the performance of the Company’s segment primarily based on net sales, before elimination of inter-company shipments, Adjusted EBITDA (a non-GAAP financial measure, as defined below) and operating assets.
The Company’s single reportable segment is Electronics, which provides vehicle cockpit electronics products to customers, including instrument clusters, information displays, infotainment systems, audio systems, telematics solutions and head-up displays. As the Company has one reportable segment, net sales, total assets, depreciation, amortization and capital expenditures are equal to consolidated results.
Adjusted EBITDA
The Company defines Adjusted EBITDA as net income attributable to the Company adjusted to eliminate the impact of depreciation and amortization, restructuring expense, net interest expense, equity in net income of non-consolidated affiliates, gain and loss on divestiture, provision for income taxes, discontinued operations, net income attributable to non-controlling interests, non-cash stock-based compensation expense, and other gains and losses not reflective of the Company's ongoing operations.
Adjusted EBITDA is presented as a supplemental measure of the Company's financial performance that management believes is useful to investors because the excluded items may vary significantly in timing or amounts and/or may obscure trends useful in evaluating and comparing the Company's operating activities across reporting periods. Not all companies use identical calculations and, accordingly, the Company's presentation of Adjusted EBITDA may not be comparable to other similarly titled measures of other companies. Adjusted EBITDA is not a recognized term under U.S. GAAP and does not purport to be a substitute for net income as an indicator of operating performance or cash flows from operating activities as a measure of liquidity. Adjusted EBITDA has limitations as an analytical tool and is not intended to be a measure of cash flow available for management's discretionary use, as it does not consider certain cash requirements such as interest payments, tax payments and debt service requirements. The Company uses Adjusted EBITDA as a factor in incentive compensation decisions and to evaluate the effectiveness of the Company's business strategies. In addition, the Company's credit agreements use measures similar to Adjusted EBITDA to measure compliance with certain covenants.
Segment Adjusted EBITDA and reconciliation to net income (loss) attributable to Visteon is as follows:
| | | | | | | | | | | | | | | | | | | | | | | |
| Three Months Ended September 30, | | Nine Months Ended
September 30, |
| (In millions) | 2020 | | 2019 | | 2020 | | 2019 |
| Net income (loss) attributable to Visteon Corporation | $ | 6 | | | $ | 14 | | | $ | (74) | | | $ | 35 | |
| Depreciation and amortization | 25 | | | 25 | | | 75 | | | 74 | |
| Non-cash, stock-based compensation expense | 4 | | | 3 | | | 13 | | | 14 | |
| Provision for income taxes | 12 | | | 13 | | | 19 | | | 16 | |
| Interest expense, net | 5 | | | 3 | | | 10 | | | 7 | |
| Net income attributable to non-controlling interests | 4 | | | 4 | | | 6 | | | 7 | |
| Restructuring expense, net | 32 | | | 1 | | | 69 | | | 2 | |
| | | | | | | |
| Equity in net income of non-consolidated affiliates | (2) | | | (1) | | | (4) | | | (7) | |
| Other | 1 | | | 0 | | | 3 | | | 1 | |
| Adjusted EBITDA | $ | 87 | | | $ | 62 | | | $ | 117 | | | $ | 149 | |
Revenue Recognition
Disaggregated revenue by geographical market and product lines is as follows:
| | | | | | | | | | | | | | | | | | | | | | | |
| Three Months Ended September 30, | | Nine Months Ended
September 30, |
| (In millions) | 2020 | | 2019 | | 2020 | | 2019 |
| Geographical Markets | | | | | | | |
| Europe | $ | 281 | | | $ | 221 | | | $ | 667 | | | $ | 726 | |
| Americas | 192 | | | 201 | | | 446 | | | 597 | |
| China Domestic | 140 | | | 143 | | | 323 | | | 372 | |
| China Export | 58 | | | 70 | | | 145 | | | 204 | |
| Other Asia-Pacific | 107 | | | 141 | | | 261 | | | 440 | |
| Eliminations | (31) | | | (45) | | | (81) | | | (138) | |
| $ | 747 | | | $ | 731 | | | $ | 1,761 | | | $ | 2,201 | |
| | | | | | | | | | | | | | | | | | | | | | | |
| Three Months Ended September 30, | | Nine Months Ended
September 30, |
| (In millions) | 2020 | | 2019 | | 2020 | | 2019 |
| Product Lines | | | | | | | |
| Instrument clusters | $ | 388 | | | $ | 322 | | | $ | 901 | | | $ | 959 | |
| Audio and infotainment | 134 | | | 182 | | | 333 | | | 562 | |
| Information displays | 135 | | | 120 | | | 298 | | | 365 | |
| Body and security | 28 | | | 27 | | | 66 | | | 91 | |
| Climate controls | 14 | | | 18 | | | 31 | | | 59 | |
| Telematics | 14 | | | 29 | | | 43 | | | 51 | |
| Other | 34 | | | 33 | | | 89 | | | 114 | |
| $ | 747 | | | $ | 731 | | | $ | 1,761 | | | $ | 2,201 | |
During the three and nine months ended September 30, 2020, revenue recognized related performance obligations satisfied in previous periods represented less than 1% of consolidated net sales. The Company has no material contract assets, contract liabilities or capitalized contract acquisition costs as of September 30, 2020.
| |
Item 2. | Management's Discussion and Analysis of Financial Condition and Results of Operations |
Item 2.Management's Discussion and Analysis of Financial Condition and Results of Operations
Management’s Discussion and Analysis (“MD&A”) is intended to help the reader understand the results of operations, financial condition and cash flows of Visteon Corporation (“Visteon” or the “Company”). MD&A is provided as a supplement to, and should be read in conjunction with, the Company’s Annual Report on Form 10-K for the fiscal year ended December 31, 20182019 filed with the Securities and Exchange Commission on February 21, 2019,20, 2020, and the financial statements and accompanying notes to the financial statements included elsewhere herein.
Description of Business
Visteon Corporation (the "Company" or "Visteon") is a global technology companyautomotive supplier that designs, engineers and manufactures innovative cockpit electronics and connected car solutions for the world’s major vehicle manufacturers including Ford, Mazda, Renault/Nissan, Volkswagen, General Motors, BMW, Jaguar/Land Rover, Daimler and Honda. Visteon is headquartered in Van Buren Township, Michigan, and has an international network of manufacturing operations, technical centers and joint venture operations, supported by approximately 10,000 employees, dedicated to the design, development, manufacture and support of its product offerings and its global customers. The Company's manufacturing and engineering footprint is principally located outside of the U.S., primarily in Mexico, Bulgaria, Portugal, Germany, India and China.
Visteon is driving the smart, learning, digital cockpit of the future, to improve safety and the user experience. Visteon is a global leader in cockpit electronic products including digital instrument clusters, information displays, infotainment, head-up displays, telematics, SmartCore™ cockpit domain controllers, and the DriveCore™ autonomous driving platform. Visteon also delivers artificial intelligence based technologies, connected car, cybersecurity, interior sensing, embedded multimedia and smartphone connectivity software solutions.
Strategic Priorities
Visteon is a technology-focused, pure-play supplier of automotive cockpit electronics.manufacturers. The cockpit electronics businessmarket is growingexpected to grow faster than underlying vehicle production expected to grow by more than 1.5 times overvolumes as the next five years. The industry is shiftingcockpit shifts from analog to digital and towards device and cloud connectivity, electric vehicles, and more advanced safety and autonomous.features.
The Company has laid out the following strategic priorities:
| |
• | Transformation of the Automotive Cockpit as a Smart Mobile Digital Assistant •Technology Innovation - The Company is an established global leader in cockpit electronics and is positioned to provide solutions as the industry transitions to the next generation automotive cockpit experience. The cockpit is becoming fully digital, connected, automated, learning, and voice enabled. Visteon's broad portfolio of cockpit electronics technology and the development of the DriveCore™ advanced safety platform positions Visteon to support these macro trends in the automotive industry.- The Company is an established global leader in cockpit electronics and is positioned to provide solutions as the industry transitions to the next generation automotive cockpit experience. The cockpit is becoming fully digital, connected, automated, learning, and voice enabled. Visteon's broad portfolio of cockpit electronics technology and the development of the DriveCore advanced safety platform positions Visteon to support these macro trends in automotive. |
| |
• | Long-Term Growth and Margin Expansion - Visteon has continued to win an increasing level of business by demonstrating product quality, technical and development capability, new product innovation, reliability and timeliness, product design and manufacturing capability and flexibility, as well as overall customer service.
|
| |
• | Enhance Shareholder Returns - The Company has returned approximately $3.3 billion to shareholders since 2015 through a combination of share repurchases and a one-time special distribution of $1.75 billion in 2016. As of September 30, 2019 the Company’s Board of Directors has authorized the repurchase of an additional $380 million of the Company’s shares through December 31, 2020.
|
•Enhance Shareholder Returns - The Company has returned approximately $3.3 billion to shareholders since 2015 through a combination of ongoing share repurchases and a onetime $1.75 billion special distribution in 2016.
Executive Summary
The pie charts below highlight the net sales breakdown for Visteon's Electronics segment for the three and nine months ended September 30, 2019.2020.
Three Months Ended September 30, 20192020
Nine Months Ended September 30, 20192020
*Regional net sales are based on the geographic region where sale originates and not where customer is located (excludes inter-regional eliminations ).
Global Automotive Market Conditions and Production Levels
Third quarter 20192020 global light vehicle production decreased 3.2%3% over the same period last year. Most regions have declined year over year with China showing an above average decrease of 5.3% and Europe increasing 0.7% from the same quarter of 2018.
Light vehicle production levels by geographic region for the nine months ended September 30, 2020 and 2019 and 2018by geographic region are provided below:
| | | | | | | | | | | | | | | | | | | | | | | | | | | | | | | | | | | |
| (Units in millions) | Three Months Ended September 30, | | Nine Months Ended September 30, |
| 2020 | | 2019 | | Change | | 2020 | | 2019 | | Change |
| China | 6.4 | | | 5.8 | | | 10.6 | % | | 15.8 | | | 17.3 | | | (8.8) | % |
| Other Asia Pacific | 4.5 | | | 5.2 | | | (14.7) | % | | 11.9 | | | 16.3 | | | (27.3) | % |
| Europe | 4.3 | | | 4.7 | | | (7.7) | % | | 11.2 | | | 16.0 | | | (29.5) | % |
| Americas | 4.7 | | | 4.9 | | | (3.4) | % | | 10.7 | | | 15.0 | | | (28.9) | % |
| Other | 0.4 | | | 0.4 | | | — | % | | 1.2 | | | 1.5 | | | (19.4) | % |
| Global | 20.3 | | | 21.0 | | | (3.4) | % | | 50.8 | | | 66.1 | | | (23.2) | % |
| Source: IHS Automotive, October 2020 |
|
| | | | | | | | | | | | | | | | | |
| | Three Months Ended September 30 | | Nine Months Ended September 30 |
| | 2019 |
| 2018 |
| Change | | 2019 | | 2018 | | Change |
| | (Units in Millions) |
| Global | 21.2 |
| | 21.9 |
| | (3.2 | )% | | 66.2 |
| | 70.3 |
| | (5.9 | )% |
| China | 5.9 |
| | 6.2 |
| | (5.3 | )% | | 17.5 |
| | 19.7 |
| | (11.5 | )% |
| Other Asia Pacific | 5.3 |
| | 5.5 |
| | (3.7 | )% | | 16.4 |
| | 16.6 |
| | (1.6 | )% |
| Europe | 4.7 |
| | 4.6 |
| | 0.7 | % | | 15.9 |
| | 16.6 |
| | (3.8 | )% |
| Americas | 4.9 |
| | 5.0 |
| | (1.2 | )% | | 15.0 |
| | 15.4 |
| | (2.4 | )% |
| Other | 0.4 |
| | 0.6 |
| | (23.4 | )% | | 1.4 |
| | 2.0 |
| | (28.5 | )% |
| Source: IHS Automotive |
In North America, production volumes decreased for key customers as a result of lower consumer demand for sedans and higher average selling prices of vehicles. In China and Other Asia Pacific production volumes have decreased as a result of increased macroeconomic uncertainties and increased regulations. These market dynamics are expected to persist into the fourth quarter of 2019.
Significant aspects of the Company's financial results during the three and nine months periods ended September 30, 2019 include the following:
The Company recorded sales of $731 million and $2,201 million for the three and nine month periods ended September 30, 2019, representing an increase of $50 million and a decrease of $52 million when compared with the same periods of 2018.
Gross margin was $84 million or 11.5% of sales and $220 million or 10.0% of sales for the three and nine month periods ended September 30, 2019, representing an increase of $2 million and a decrease of $95 million compared to the same periods of 2018. As a percent of sales, gross margin decreased 0.5% and 4.0% when compared with the same periods of 2018.
Net income attributable to Visteon was $14 million and $35 million for the three and nine month periods ended September 30, 2019, compared to net income of $21 million and $121 million for the same periods of 2018.
As of September 30, 2019, total cash was $446 million, including $3 million of restricted cash, representing a $21 million decrease as compared to $467 million as of December 31, 2018.
The Company generated $118 million of cash from operating activities during the nine months ended September 30, 2019, compared to cash generated by operations of $107 million during the same period of 2018, representing an $11 million improvement.
Results of Operations - Three Months Ended September 30, 20192020 and 20182019
The Company's consolidated results of operations for the three months ended September 30, 20192020 and 20182019 were as follows: | | | | | | | | | | Three Months Ended September 30, |
| | Three Months Ended September 30 | |
| | 2019 | | 2018 | | Change | |
| | (Dollars in Millions) | |
| Sales | $ | 731 |
| | $ | 681 |
| | $ | 50 |
| |
| (In millions) | | (In millions) | 2020 | | 2019 | | Change |
| Net sales | | Net sales | $ | 747 | | | $ | 731 | | | $ | 16 | |
| Cost of sales | (647 | ) | | (599 | ) | | (48 | ) | Cost of sales | (648) | | | (647) | | | (1) | |
| Gross margin | 84 |
| | 82 |
| | 2 |
| Gross margin | 99 | | | 84 | | | 15 | |
| Selling, general and administrative expenses | (52 | ) | | (40 | ) | | (12 | ) | Selling, general and administrative expenses | (45) | | | (52) | | | 7 | |
| Restructuring expense, net | (1 | ) | | (18 | ) | | 17 |
| Restructuring expense, net | (32) | | | (1) | | | (31) | |
| Interest expense, net | (3 | ) | | (2 | ) | | (1 | ) | Interest expense, net | (5) | | | (3) | | | (2) | |
| Equity in net income of non-consolidated affiliates | 1 |
| | 3 |
| | (2 | ) | Equity in net income of non-consolidated affiliates | 2 | | | 1 | | | 1 | |
| Other income, net | 2 |
| | 7 |
| | (5 | ) | Other income, net | 3 | | | 2 | | | 1 | |
| Provision for income taxes | (13 | ) | | (9 | ) | | (4 | ) | Provision for income taxes | (12) | | | (13) | | | 1 | |
| Net income from continuing operations | 18 |
| | 23 |
| | (5 | ) | |
| Income from discontinued operations | — |
| | 1 |
| | (1 | ) | |
| Net income | 18 |
| | 24 |
| | (6 | ) | |
| | Net income (loss) | | Net income (loss) | 10 | | | 18 | | | (8) | |
| Net income attributable to non-controlling interests | (4 | ) | | (3 | ) | | (1 | ) | Net income attributable to non-controlling interests | (4) | | | (4) | | | — | |
| Net income attributable to Visteon Corporation | $ | 14 |
| | $ | 21 |
| | $ | (7 | ) | |
| Net income (loss) attributable to Visteon Corporation | | Net income (loss) attributable to Visteon Corporation | $ | 6 | | | $ | 14 | | | $ | (8) | |
| Adjusted EBITDA* | $ | 62 |
| | $ | 71 |
| | $ | (9 | ) | Adjusted EBITDA* | $ | 87 | | | $ | 62 | | | $ | 25 | |
* Adjusted EBITDA is a Non-GAAP financial measure, as further discussed below. | * Adjusted EBITDA is a Non-GAAP financial measure, as further discussed below. | * Adjusted EBITDA is a Non-GAAP financial measure, as further discussed below. |
Net Sales, Cost of Sales and Gross Margin
| | | | | | | | | | | | | | | | | | |
| (In millions) | Net Sales | | Cost of Sales | | Gross Margin | |
| Three months ended September 30, 2019 | $ | 731 | | | $ | (647) | | | $ | 84 | | |
| Volume, mix, and net new business | 38 | | | (50) | | | (12) | | |
| Currency | (3) | | | 1 | | | (2) | | |
| Customer pricing | (17) | | | — | | | (17) | | |
| Engineering costs, net * | — | | | 24 | | | 24 | | |
| Cost performance, design changes and other | (2) | | | 24 | | | 22 | | |
| Three months ended September 30, 2020 | $ | 747 | | | $ | (648) | | | $ | 99 | | |
| *Excludes the impact of currency. | | | | | | |
|
| | | | | | | |
| | Sales | | Cost of Sales |
| | (Dollars in Millions) |
| Three months ended September 30, 2018 | $ | 681 |
| | $ | (599 | ) |
| Volume, mix, and net new business | 57 |
| | (58 | ) |
| Currency | (7 | ) | | 7 |
|
| VFAE consolidation | 12 |
| | (10 | ) |
| Customer pricing and other | (12 | ) | | — |
|
| Engineering costs, net * | — |
| | 4 |
|
| Cost performance | — |
| | 9 |
|
| Three months ended September 30, 2019 | $ | 731 |
| | $ | (647 | ) |
| *Excludes the impact of currency and the consolidation of VFAE. | | | |
SalesNet sales for the three months ended September 30, 20192020 totaled $731$747 million, which representsrepresenting an increase of $50$16 million compared with the same period of 2018. Net new business, partially offset by lower volumes,2019. Volumes increased net sales by $57$38 million. Unfavorable currency decreased net sales by $7$3 million, primarily attributable to the Euroeuro, Brazilian real and Chinese Renminbi. Other reductions, primarily associated with customerrenminbi. Customer pricing, decreased net sales by $12$17 million. The consolidation of a previously non-consolidated affiliate, Changchun Visteon FAWAY Auto Electronics Co., Ltd, ("VFAE"), during the third quarter of 2018, increasedCost performance, design changes and other revenue claims decreased net sales $12by $2 million.
Cost of sales increased by $48$1 million for the three months ended September 30, 20192020 compared with the same period in 2018. Volumes,2019. Increased volumes and unfavorable product mix, and net new business, increased cost of sales by $58$50 million. Foreign currency decreased cost of sales by $7$1 million, primarily attributable to the Euro,euro, Mexican peso and Chinese Renminbi, Mexican Peso, Brazilian Real, Indian Rupee and Bulgarian Lev. Engineeringrenminbi. Net engineering costs, net, excluding currency, and the consolidation of VFAE, decreased cost of sales $4by $24 million. CostFavorable cost performance, includingprimarily due to material, design and usage economics partially offset by higher manufacturing costs and the non-recurrence of an incentive compensation accrual release in the third quarter of 2018 decreased cost of sales by $9$24 million. The consolidation of VFAE during the third quarter of 2018 increased cost of sales $10 million.
A summary of net engineering costs is shown below:
| | | | | | | | | | | |
| Three Months Ended September 30, |
| (In millions) | 2020 | | 2019 |
| Gross engineering costs | $ | (79) | | | $ | (105) | |
| Engineering recoveries | 31 | | | 32 | |
| Engineering costs, net | $ | (48) | | | $ | (73) | |
|
| | | | | | | |
| | Three Months Ended September 30 |
| | 2019 | | 2018 |
| | (Dollars in Millions) |
| Gross engineering costs | $ | (105 | ) | | $ | (111 | ) |
| Engineering recoveries | 32 |
| | 34 |
|
| Engineering costs, net | $ | (73 | ) | | $ | (77 | ) |
Gross engineering costs relate to forward model program development and advanced engineering activities and exclude contractually reimbursable engineering costs. Net engineering costs of $73$48 million for the three months ended September 30, 2019,2020, including the impacts of currency, and the consolidation of VFAE, were $4$25 million lower than the same period of 2018,2019, primarily related to short-term and long-term cost reduction initiatives including the benefits of previously announced restructuring actions and the timing of program expenses.implemented to optimize structure while supporting future growth.
|
| | | | | | | | | | | | | |
| | Three Months Ended September 30 |
| | 2019 | | 2018 |
| | (Dollars in Millions) |
| | | | % of Sales | | | | % of Sales |
| Sales | $ | 731 |
| | | | $ | 681 |
| | |
| Cost of sales, excluding engineering costs | (574 | ) | | 78.5 | % | | (522 | ) | | 76.7 | % |
| Engineering costs, net | (73 | ) | | 10.0 | % | | (77 | ) | | 11.3 | % |
| Gross margin | $ | 84 |
| | 11.5 | % | | $ | 82 |
| | 12.0 | % |
GrossThe Company's gross margin was $84$99 million or 11.5%13.3% of net sales for the three months ended September 30, 20192020 compared to $82$84 million or 12.0%11.5 % of net sales for the same period of 2018. Gross2019. Increased volumes offset by unfavorable product mix decreased gross margin was impacted by $1 million from unfavorable volumes and product mix.$12 million. Lower net engineering costs excluding currency, and the consolidation of VFAE, increased gross margin by $4$24 million. Gross margin was impacted by annual customer pricing and other of $12 million, partially offset by favorableFavorable cost performance of $9$20 million, which includesincluding material, design and usage economics, partially offset by higherlower manufacturing costs, and the non-recurrence of an incentive compensation accrual release in the third quarterprior year operational challenges more than offset annual customer pricing of 2018. The consolidation of VFAE, during the third quarter of 2018 increased gross margin by $2$17 million.
Selling, General and Administrative Expenses
Selling, general, and administrative expenses were $45 million or 6.0% and $52 million or 7.1% and $40 million or 5.9% of net sales, during the three months ended September 30, 20192020 and 2018,2019, respectively. The increasedecrease is primarily related to the non-recurrence of an incentive compensation accrual releasetemporary salary reductions, other cost reduction initiatives, and the consolidation of VFAE in the third quarter of 2018.previously announced restructuring actions.
Restructuring Expense, Net
Restructuring actions initiated during 2020 include the following :
•In September, in response to COVID-19 and to improve efficiency and rationalize the Company’s footprint, the Company approved a plan related to cash severance, retention, and termination costs. The Company has incurred $31 million in restructuring costs related to this plan.
•In March, the Company approved a global restructuring plan impacting engineering, administrative and manufacturing functions to improve the Company’s efficiency and rationalize its footprint. During the three months ended September 30, 2020, the Company recorded net restructuring expense of $1 million in relation to the program.
•In January, the Company approved a plan primarily related to European engineering and administrative functions to improve the Company’s efficiency and rationalize its footprint. During the three months ended September 30, 2020, the Company recorded net restructuring expense of $1 million in relation to the program.
During the third quarter of 2018, the Company approved a restructuring program impacting engineering and administrative functions to optimize operations. During the three months ended September 30, 2019, and 2018, the Company has recorded net restructuring expense of approximately $1 million and $18 million of net restructuring expenses, respectively.million.
Interest Expense, Net
Interest expense, net, was $3of $5 million and $2 million for the three months ended September 30, 20192020 and 20182019, respectively. The increase in net interest expense is primarily due to lower interest income on short term investments.
Equity in Net Income of Non-Consolidated Affiliates
Equity in net income of non-consolidated affiliates was $1$2 million and $3$1 million for the three month periods ending September 30, 2020 and 2019, and 2018, respectively, whichrespectively. The increase in income is primarily attributable due to increased engineering services revenue at the Company's equity interestinvestment in Yanfeng Visteon Investment Company.
Other Income, Net
Other income, net consists of $3 million and $2 million for the following:three month periods ending September 30, 2020 and 2019, respectively, is primarily due to net pension financing benefits.
|
| | | | | | | |
| Three Months Ended September 30 |
| 2019 |
| 2018 |
| (Dollars in Millions) |
| Pension financing benefits, net | $ | 2 |
|
| $ | 3 |
|
| Gain on non-consolidated affiliate transactions, net | — |
|
| 4 |
|
| $ | 2 |
|
| $ | 7 |
|
Pension financing benefits, net include return on assets net of interest costs and other amortization.
On September 1, 2018, Visteon acquired an additional 1% ownership interest in VFAE, a former non-consolidated affiliate, resulting in a total 51% controlling interest and a non-cash gain of $4 million as further described in Note 17, "Acquisitions."
Income Taxes
The Company's provision for income taxes of $13$12 million for the three months ended September 30, 2019,2020, represents an increasea decrease of $4$1 million, when compared to a provision for income taxes of $9with $13 million in the same period of 2018.2019. The increasedecrease in tax expense is primarily attributable to changes in the mix of earnings and differing tax rates between jurisdictions which reflects the overall increasedecrease in year-over-year earnings in jurisdictions where the Company is profitable and withholding taxes.
Net Income
Net These decreases were partially offset by a reassessment of the valuation allowances in connection with the realization of deferred tax assets in Germany resulting in recording a $4 million discrete income attributable to Visteon was $14 million fortax expense adjustment during the three months ended September 30, 2019, compared to net income of $21 million for the same period of 2018. The decrease of $7 million is primarily attributable to higher selling, general and administrative expenses of $12 million, the non-recurrence of a gain on non-consolidated affiliate transactions of $4 million, and an increase in provision for income taxes of $4 million, partially offset by lower restructuring expense of $17 million.2020.
Adjusted EBITDA
Adjusted EBITDA (a non-GAAP financial measure, as defined in Note 3,15, "Segment Information") was $62$87 million for the three months ended September 30, 2019,2020, representing a decreasean increase of $9$25 million when compared to adjustedAdjusted EBITDA of $71$62 million for the same period of 2018. Unfavorable2019. Increased volumes andoffset by unfavorable product mix reduced adjusteddecreased Adjusted EBITDA by $1$12 million. Lower net engineering costs, excluding currency, and the consolidation of VFAE, increased adjustedAdjusted EBITDA by $4$24 million. Adjusted EBITDA was impacted by annual customer pricing and other of $12 million, and unfavorableFavorable cost performance of $1$30 million, which includes higherincluding material, design and usage economics, lower manufacturing costs, lower selling, general, and administrative expenses, and the non-recurrence of an incentive compensation accrual release in the third quarterprior year operational challenges, more than offset annual customer pricing of 2018, partially offset by material, design and usage economics. The consolidation of VFAE, during the third quarter of 2018 increased adjusted EBITDA by $1$17 million.
The reconciliation of net income (loss) attributable to Visteon to adjustedAdjusted EBITDA for the three months ended September 30, 20192020 and 2018,2019, is as follows:
| | | | | | | | | | | | | | | | | |
| Three Months Ended September 30, |
| (In millions) | 2020 | | 2019 | | Change |
| Net income (loss) attributable to Visteon Corporation | $ | 6 | | | $ | 14 | | | $ | (8) | |
| Depreciation and amortization | 25 | | | 25 | | | — | |
| Provision for income taxes | 12 | | | 13 | | | (1) | |
| Non-cash, stock-based compensation expense | 4 | | | 3 | | | 1 | |
| Interest expense, net | 5 | | | 3 | | | 2 | |
| Net income attributable to non-controlling interests | 4 | | | 4 | | | — | |
| Restructuring expense, net | 32 | | | 1 | | | 31 | |
| | | | | |
| Equity in net income of non-consolidated affiliates | (2) | | | (1) | | | (1) | |
| Other | 1 | | | — | | | 1 | |
| Adjusted EBITDA | $ | 87 | | | $ | 62 | | | $ | 25 | |
|
| | | | | | | | | | | |
| | Three Months Ended September 30 |
| | 2019 | | 2018 | | Change |
| | (Dollars in Millions) |
| Net income attributable to Visteon Corporation | $ | 14 |
| | $ | 21 |
| | $ | (7 | ) |
| Depreciation and amortization | 25 |
| | 22 |
| | 3 |
|
| Provision for income taxes | 13 |
| | 9 |
| | 4 |
|
| Non-cash, stock-based compensation expense | 3 |
| | 4 |
| | (1 | ) |
| Interest expense, net | 3 |
| | 2 |
| | 1 |
|
| Net income attributable to non-controlling interests | 4 |
| | 3 |
| | 1 |
|
| Restructuring expense, net | 1 |
| | 18 |
| | (17 | ) |
| Income from discontinued operations, net of tax | — |
| | (1 | ) | | 1 |
|
| Equity in net income of non-consolidated affiliates | (1 | ) | | (3 | ) | | 2 |
|
| Other | — |
| | (4 | ) | | 4 |
|
| Adjusted EBITDA | $ | 62 |
| | $ | 71 |
| | $ | (9 | ) |
Results of Operations - Nine Months Ended September 30, 20192020 and 20182019
The Company's consolidated results of operations for the nine months ended September 30, 20192020 and 20182019 were as follows:
| | | | | | | | | | | | | | | | | |
| Nine Months Ended September 30, |
| (In millions) | 2020 | | 2019 | | Change |
| Net sales | $ | 1,761 | | | $ | 2,201 | | | $ | (440) | |
| Cost of sales | (1,605) | | | (1,981) | | | 376 | |
| Gross margin | 156 | | | 220 | | | (64) | |
| Selling, general and administrative expenses | (140) | | | (167) | | | 27 | |
| Restructuring expense, net | (69) | | | (2) | | | (67) | |
| Interest expense, net | (10) | | | (7) | | | (3) | |
| Equity in net income of non-consolidated affiliates | 4 | | | 7 | | | (3) | |
| Other income, net | 10 | | | 7 | | | 3 | |
| Provision for income taxes | (19) | | | (16) | | | (3) | |
| | | | | |
| | | | | |
| Net income (loss) | (68) | | | 42 | | | (110) | |
| Net income attributable to non-controlling interests | (6) | | | (7) | | | 1 | |
| Net income (loss) attributable to Visteon Corporation | $ | (74) | | | $ | 35 | | | $ | (109) | |
| Adjusted EBITDA* | $ | 117 | | | $ | 149 | | | $ | (32) | |
| | | | | |
* Adjusted EBITDA is a Non-GAAP financial measure, as further discussed below. |
|
| | | | | | | | | | | |
| | Nine Months Ended September 30 |
| | 2019 | | 2018 | | Change |
| | (Dollars in Millions) |
| Sales | $ | 2,201 |
| | $ | 2,253 |
| | $ | (52 | ) |
| Cost of sales | (1,981 | ) | | (1,938 | ) | | (43 | ) |
| Gross margin | 220 |
| | 315 |
| | (95 | ) |
| Selling, general and administrative expenses | (167 | ) | | (139 | ) | | (28 | ) |
| Restructuring expense, net | (2 | ) | | (28 | ) | | 26 |
|
| Interest expense, net | (7 | ) | | (6 | ) | | (1 | ) |
| Equity in net income of non-consolidated affiliates | 7 |
| | 10 |
| | (3 | ) |
| Other income, net | 7 |
| | 17 |
| | (10 | ) |
| Provision for income taxes | (16 | ) | | (42 | ) | | 26 |
|
| Net income from continuing operations | 42 |
| | 127 |
| | (85 | ) |
| Income from discontinued operations | — |
| | 2 |
| | (2 | ) |
| Net income | 42 |
| | 129 |
| | (87 | ) |
| Net income attributable to non-controlling interests | (7 | ) | | (8 | ) | | 1 |
|
| Net income attributable to Visteon Corporation | $ | 35 |
| | $ | 121 |
| | $ | (86 | ) |
| Adjusted EBITDA* | $ | 149 |
| | $ | 256 |
| | $ | (107 | ) |
| | | | | | |
* Adjusted EBITDA is a Non-GAAP financial measure, as further discussed below. |
Net Sales, Cost of Sales and Gross Margin | | | | Sales | | Cost of Sales | |
| | (Dollars in Millions) | |
| Nine months ended September 30, 2018 | $ | 2,253 |
| | $ | (1,938 | ) | |
| (In millions) | | (In millions) | Net Sales | | Cost of Sales | | Gross Margin |
| Nine months ended September 30, 2019 | | Nine months ended September 30, 2019 | $ | 2,201 | | | $ | (1,981) | | | $ | 220 | |
| Volume, mix, and net new business | 4 |
| | (52 | ) | Volume, mix, and net new business | (383) | | | 209 | | | (174) | |
| Currency | (52 | ) | | 44 |
| Currency | (21) | | | 15 | | | (6) | |
| VFAE consolidation | 38 |
| | (32 | ) | |
| Customer pricing and other | (42 | ) | | — |
| |
| | Customer pricing | | Customer pricing | (40) | | | — | | | (40) | |
| Engineering costs, net* | — |
| | (27 | ) | Engineering costs, net* | — | | | 74 | | | 74 | |
| Cost performance | — |
| | 24 |
| Cost performance | 4 | | | 78 | | | 82 | |
| Nine months ended September 30, 2019 | $ | 2,201 |
| | $ | (1,981 | ) | |
| *Excludes the impact of currency and the consolidation of VFAE. | | | | |
| Nine months ended September 30, 2020 | | Nine months ended September 30, 2020 | $ | 1,761 | | | $ | (1,605) | | | $ | 156 | |
| *Excludes the impact of currency. | | *Excludes the impact of currency. | | | | | |
SalesNet sales for the nine months ended September 30, 20192020 totaled $2,201$1,761 million, which represents a decrease of $52$440 million compared with the same period of 2018.2019. Unfavorable volumes, primarily driven by COVID-19, decreased net sales by $383 million. Unfavorable currency decreased net sales by $52$21 million, primarily attributable to the Euro,euro, Chinese Renminbi,renminbi, and Brazilian Real, Indian Rupee and Japanese Yen. Net new business, mostly offset by unfavorable volumes, increasedreal. Customer pricing decreased net sales by $4$40 million. Other reductions, primarily associated with customer pricing, decreasedCost performance, design changes and other revenue claims increased net sales by $42 million. The consolidation of VFAE during the third quarter of 2018 increased sales $38$4 million.
Cost of sales increaseddecreased by $43$376 million for the nine months ended September 30, 20192020 when compared with the same period in 2018. Volumes,2019. Unfavorable volumes and product mix and net new business increaseddecreased cost of sales $52by $209 million. Foreign currency decreased cost of sales by $44$15 million primarily attributable to the Euro,euro, Chinese Renminbi, Indian Rupee, Brazilian Real,renminbi, and Mexican Peso and Bulgarian Lev.peso. Engineering costs, net, excluding currency, and the consolidation of VFAE, increaseddecreased cost of sales $27by $74 million. CostFavorable cost performance, including material, design and usage economics, partially offset by higherlower manufacturing costs, and the non-recurrence of an incentive compensation accrual release in the third quarter of 2018, inefficiencies associated with a plant transfer in Mexico, and launchprior year operational challenges, associated with a curved center information display decreased cost of sales by $24$78 million. The consolidation of VFAE during the third quarter of 2018 increased cost of sales $32 million.
A summary of net engineering costs is shown below: | | | | | | | | Nine Months Ended September 30, | |
| | Nine Months Ended September 30 | |
| | 2019 | | 2018 | |
| | (Dollars in Millions) | |
| (In millions) | | (In millions) | 2020 | | 2019 | |
| Gross engineering costs | $ | (326 | ) | | $ | (310 | ) | Gross engineering costs | $ | (257) | | | $ | (326) | | |
| Engineering recoveries | 81 |
| | 86 |
| Engineering recoveries | 91 | | | 81 | | |
| Engineering costs, net | $ | (245 | ) | | $ | (224 | ) | Engineering costs, net | $ | (166) | | | $ | (245) | | |
Gross engineering costs relate to forward model program development and advanced engineering activities, and exclude contractually reimbursable engineering costs. Net engineering costs, of $245$166 million for the nine months ended September 30, 2019,2020, including the impacts of currency, and the consolidation of VFAE, were $21$79 million higherlower than the same period of 2018,2019, primarily related to costsshort-term and long-term cost reduction initiatives including the benefits of previously announced restructuring actions implemented to support the Company's new business wins.optimize structure while supporting future growth.
|
| | | | | | | | | | | | | |
| | Nine Months Ended September 30 |
| | 2019 | | 2018 |
| | (Dollars in Millions) |
| | | | % of Sales | | | | % of Sales |
| Sales | $ | 2,201 |
| | | | $ | 2,253 |
| | |
| Cost of sales, excluding engineering costs | (1,736 | ) | | 78.9 | % | | (1,714 | ) | | 76.1 | % |
| Engineering costs, net | (245 | ) | | 11.1 | % | | (224 | ) | | 9.9 | % |
| Gross margin | $ | 220 |
| | 10.0 | % | | $ | 315 |
| | 14.0 | % |
Gross margin was $220$156 million or 10.0%8.9% of net sales for the nine months ended September 30, 20192020 compared to $315$220 million or 14.0%10.0 % of net sales for the same period of 2018.2019. Gross margin was impacted by $48$174 million fromby unfavorable volumes and product mix. Unfavorable currency of $8$6 million reflected the Euro, Chinese Renminbi, Brazilian Real,real and Japanese Yen,Indian rupee, partially offset
by the Japanese yen, Chinese renminbi, and Mexican Peso and Bulgarian Lev. Higherpeso. Lower engineering costs, excluding currency, and the consolidation of VFAE, decreasedincreased gross margin by $27$74 million. Gross margin was impacted by annual customer pricing and other of $42 million, partially offset by favorableFavorable cost performance of $24$82 million, which includes material, design and usage economics, partially offset by higherlower manufacturing costs, inefficiencies associated with a plant transfer in Mexico, launch challenges associated with a curved center information display, and the non-recurrence of an incentive compensation accrual release in the third quarterprior year operational challenges more than offset annual customer pricing of 2018. The consolidation of VFAE, during the third quarter of 2018 increased gross margin by $6$40 million.
Selling, General and Administrative Expenses
Selling, general, and administrative expenses were $140 million or 8.0% of net sales and $167 million or 7.6% of sales and $139 million or 6.2% ofnet sales during the nine months ended September 30, 20192020 and 2018,2019, respectively. The increasedecrease is primarily related to higher stock compensation expense due to the non-recurrence of the resolution of a legal matter in 2018 as further described in Note 19, "Commitmentstemporary salary reductions, previously announced restructuring actions and Contingencies," the non-recurrence of an incentive compensation accrual release in the third quarter of 2018, bad debt expense and the consolidation of VFAE, partially offset by favorable currency.other cost reduction initiatives.
Restructuring Expense, Net
Restructuring actions initiated during 2020 include the following :
•In September, in response to COVID-19 and to improve efficiency and rationalize the Company’s footprint, the Company approved a plan related to cash severance, retention, and termination costs. The Company has incurred $31 million in restructuring costs related to this plan.
•In March, the Company approved a global restructuring plan impacting engineering, administrative and manufacturing functions to improve the Company’s efficiency and rationalize its footprint. The Company incurred $16 million of net restructuring expense for cash severance, retention, and termination costs related to this plan.
•In January, the Company approved a plan primarily related to European engineering and administrative functions to improve the Company’s efficiency and rationalize its footprint. The Company incurred $22 million of net restructuring expense for cash severance, retention, and termination costs related to this plan.
•During the nine months ended September 30, 2020, the Company incurred $1 million of restructuring expense for cash severance payments at two North American manufacturing facilities.
During the first quarter of 2019, the Company approved a restructuring program impacting two European manufacturing facilities due to the end of life of certain product lines. The Company recorded approximately $2 million of restructuring expenses related to this program duringDuring the nine months ended September 30, 2019.2019, the Company recorded net restructuring expense of $2 million in relation to the program.
During the third quarter of 2018, the Company approved a restructuring program impacting engineering and administrative functions to optimize operations. The Company recorded approximately $1 million and $18 million of net restructuring expenses duringDuring the nine months ended September 30, 2019, and 2018 respectively.
During the second quarter of 2018, the Company approved restructuring programs impacting employee severance and termination
benefit expenses of legacy employees at a South America facility and employees at North America manufacturing facilities due to the wind-down of certain products. During the nine months ended September 30, 2018, the Company recorded net restructuring expense of approximately $5 million of restructuring expenses under this program.$1 million.
During the fourth quarter of 2016, the Company approved a restructuring program impacting engineering and administrative functions to further align the Company's footprint with its core product technologies and customers. During the nine months ended September 30, 2018, the Company recorded approximately $5 million of restructuring expenses under this program.
Interest Expense, Net
Interest expense, net was $7$10 million and $6$7 million for the nine months ended September 30, 20192020 and 20182019 respectively. The increase in net interest expense is primarily due to lower interest income on short term investments.the $400 million revolving credit facility.
Equity in Net Income of Non-Consolidated Affiliates
Equity in net income of non-consolidated affiliates was $7$4 million and $10$7 million for the nine month periods ending September 30, 2020 and 2019, and 2018, respectively, whichrespectively. The decrease in equity income is primarily attributable to due to increased engineering services revenue at the Company's equity interestinvestment in Yanfeng Visteon Investment Company.
Other Income, Net
Other income, net consists of the following:
|
| | | | | | | |
| | Nine Months Ended
September 30 |
| | 2019 | | 2018 |
| | (Dollars in Millions) |
| Pension financing benefits, net | $ | 7 |
| | $ | 9 |
|
| Transformation initiatives | — |
| | 4 |
|
| Gain on non-consolidated affiliate transactions, net | — |
| | 4 |
|
| | $ | 7 |
| | $ | 17 |
|
Pension financing benefits, net include return on assets net of interest costs$10 million and other amortization.
Transformation initiatives during$7 million for the nine months ended September 30, 2018 include a $4 million benefit related2020 and 2019, respectively, is primarily due to the resolution of a legal matter as further described in Note 19, "Commitments and Contingencies."net pension financing benefits.
On September 1, 2018, Visteon acquired an additional 1% ownership interest in VFAE, a former non-consolidated affiliate, resulting in a total 51% controlling interest and a non-cash gain of $4 million as further described in Note 17, "Acquisitions."
Income Taxes
The Company's provision for income taxes of $16$19 million for the nine months ended September 30, 20192020 represents a decreasean increase of $26$3 million when compared with $42$16 million in the same period of 2018.2019. The decreaseincrease in tax expense includes approximately $14 millionis primarily attributable to a reassessment of the overall2020 valuation allowances in connection with the realization of deferred tax assets in Germany as well as the non-recurrence of a 2019 discrete income tax valuation allowance release in Germany, resulting in a year-over-year income tax expense increase of $16 million. This increase was partially offset by approximately $13 million decrease in year-over-year earnings, includingincome tax expense primarily due to changes in the mix of earnings and differing tax rates between jurisdictions which reflects the overall decrease in year-over-year earnings in jurisdictions where the Company is profitable and withholding taxes. During the first quarter of 2019, the closure of tax audits in Germany allowed the Company to initiate a tax planning strategy previously determined not to be prudent. This strategy provided the necessary positive evidence to support the future utilization of a portion of the Company's deferred tax assets in Germany resulting in a $12 million discrete income tax benefit during the nine months ended September 30, 2019.
Net Income
Net income attributable to Visteon was $35 million for the nine months ended September 30, 2019, compared to net income of $121 million for the same period of 2018. The decrease of $86 million includes a decrease in gross margin of $95 million, higher selling, general and administrative expenses of $28 million and lower other income, net of $10 million. These decreases were partially offset by lower restructuring expense of $26 million and provision for income taxes of $26 million.
Adjusted EBITDA
Adjusted EBITDA (a non-GAAP financial measure, as defined in Note 3,15, "Segment Information") was $149$117 million for the nine months ended September 30, 2019,2020, representing a decrease of $107$32 million when compared to adjustedAdjusted EBITDA of $256$149 million for the same period of 2018. Unfavorable2019. Decreased volumes and unfavorable product mix reduced adjustedAdjusted EBITDA by $48$174 million. Foreign currency decreased adjustedAdjusted EBITDA by $4 million attributable to the Euro, Chinese Renminbi, Brazilian Realreal and Japanese Yen,Indian rupee, partially offset by the euro, Japense yen, Chinese renminbi, and Mexican Peso and Bulgarian Lev. Higherpeso. Lower net engineering costs, excluding currency, and the consolidation of VFAE, decreased adjustedincreased Adjusted EBITDA by $27$74 million. Adjusted EBITDA was impacted by annual customer pricing and other of $42 million, partially offset by favorableFavorable cost performance of $10$112 million, which includes material, design and usage economics, partially offset by higherlower manufacturing costs, inefficiencies associated with a plant transfer in Mexico, launch challenges associated with a curved center information display,lower selling, general, and administrative expenses, and the non-recurrence of an incentive compensation accrual release in the third quarterprior year operational challenges, more than offset annual customer pricing of 2018. The consolidation of VFAE, during the third quarter of 2018 increased adjusted EBITDA by $4$40 million.
The reconciliation of net income (loss) attributable to Visteon to adjustedAdjusted EBITDA for the nine months ended September 30, 20192020 and 2018,2019, is as follows:
| | | | | | | | | | | | | | | | | |
| Nine Months Ended September 30, |
| (In millions) | 2020 | | 2019 | | Change |
| Net income (loss) attributable to Visteon Corporation | $ | (74) | | | $ | 35 | | | $ | (109) | |
| Depreciation and amortization | 75 | | | 74 | | | 1 | |
| Non-cash, stock-based compensation expense | 13 | | | 14 | | | (1) | |
| Provision for income taxes | 19 | | | 16 | | | 3 | |
| Interest expense, net | 10 | | | 7 | | | 3 | |
| Net income attributable to non-controlling interests | 6 | | | 7 | | | (1) | |
| Restructuring expense, net | 69 | | | 2 | | | 67 | |
| | | | | |
| Equity in net income of non-consolidated affiliates | (4) | | | (7) | | | 3 | |
| Other | 3 | | | 1 | | | 2 | |
| Adjusted EBITDA | $ | 117 | | | $ | 149 | | | $ | (32) | |
|
| | | | | | | | | | | |
| | Nine Months Ended September 30 |
| | 2019 | | 2018 | | Change |
| | (Dollars in Millions) |
| Net income attributable to Visteon Corporation | $ | 35 |
| | $ | 121 |
| | $ | (86 | ) |
| Depreciation and amortization | 74 |
| | 67 |
| | 7 |
|
| Non-cash, stock-based compensation expense | 14 |
| | 4 |
| | 10 |
|
| Provision for income taxes | 16 |
| | 42 |
| | (26 | ) |
| Interest expense, net | 7 |
| | 6 |
| | 1 |
|
| Net income attributable to non-controlling interests | 7 |
| | 8 |
| | (1 | ) |
| Restructuring expense, net | 2 |
| | 28 |
| | (26 | ) |
| Income from discontinued operations, net of tax | — |
| | (2 | ) | | 2 |
|
| Equity in net income of non-consolidated affiliates | (7 | ) | | (10 | ) | | 3 |
|
| Other | 1 |
| | (8 | ) | | 9 |
|
| Adjusted EBITDA | $ | 149 |
| | $ | 256 |
| | $ | (107 | ) |
Liquidity
The Company's primary sources of liquidity are cash flows from operations, existing cash balances and borrowings under available credit facilities, if necessary. Thefacilities. As we continue to confront the many challenges caused by the impact of COVID-19, including governmental actions to mitigate the pandemic, the Company believes that funds generated from these sources will be adequatesufficient to fundsustain ongoing operations and support investment in differentiating technologies. The Company will continue to closely monitor and preserve its available liquidity for current businessand maintain access to additional liquidity to weather these challenging conditions. The Company's intra-year needs are normally impacted by seasonal effects in the industry, such as mid-year shutdowns, the ramp-up of new model production, and year-end shutdowns at key customers. The COVID-19 pandemic may significantly exacerbate the intra-year requirements.
A substantial portion of the Company's cash flows from operations are generated by operations located outside of the United States. Accordingly, the Company utilizes a combination of cash repatriation strategies, including dividends and distributions, royalties, and other intercompany arrangements to provide the funds necessary to meet obligations globally. The Company’s ability to access funds from its subsidiaries is subject to, among other things, customary regulatory and statutory requirements and contractual arrangements including joint venture agreements and local credit facilities. Moreover, repatriation efforts may be modified by the Company according to prevailing circumstances.
The Company's ability to generate operating cash flow is dependent on the level, variability and timing of its customers' worldwide vehicle production, which may be affected by many factors including, but not limited to, general economic conditions, specific industry conditions, financial markets, competitive factors and legislative and regulatory changes. The Company monitors the macroeconomic environment and its impact on vehicle production volumes in relation to the Company's specific cash needs. The Company's intra-year needs are impacted by seasonal effects in the industry, such as mid-year shutdowns, the subsequent ramp-up of new model production and year-end shutdowns at key customers.
In the event that the Company's funding requirements exceed cash provided by its operating activities,On March 19, 2020, the Company will meet such requirements by reducing existing cash balances, by drawing on its $300borrowed, the entire $400 million amount available under the revolving credit facility. On September 24, 2020, the Company fully repaid the amount borrowed under the Revolving Credit Facility or other affiliate working capital lines, by seeking additional capital through debt or equity markets, or some combination thereof.following stronger than expected industry recovery and improved Company performance in the third quarter of 2020.
Access to additional capital through the debt or equity markets is influenced by the Company's credit ratings. As of September 30, 2019,2020, the Company’s corporate credit rating is Ba3 and BBBB- by Moody’s and Standard & Poor’s, respectively. See Note 11,8, "Debt" for a more comprehensive discussion of the Company's debt facilities. Incremental funding requirements of the Company's consolidated foreign entities are primarily accommodated by intercompany cash pooling structures. Affiliate working capital lines, which are utilized by the Company's consolidated joint ventures, had availability of $68$153 million and the Company had $400 million of available credit under the revolving credit facility, as of September 30, 2019.2020.
Cash Balances
As of September 30, 2019,2020, the Company had total cash of $446$435 million, including $3$4 million of restricted cash. Cash balances totaling $332$351 million were located in jurisdictions outside of the United States, of which approximately $145$135 million is considered permanently reinvested for funding ongoing operations outside of the U.S. If such permanently reinvested funds were repatriated to the U.S., no U.S. federal taxes would be imposed on the distribution of such foreign earnings due to U.S. tax reform enacted in December 2017, however,2017. However, the Company would be required to accrue additional tax expense, primarily related to foreign withholding taxes.
Other Items Affecting Liquidity
As of September 30, 2019,2020, the Company may execute up to $380has $364 million available for additional share repurchases under the Board of Directors authorization which expires on December 31, 2020. Additional discussion regardingThe Company currently does not intend to repurchase additional shares under this authorization.
The Company has deferred approximately $17 million of contributions related to its defined benefit U.S. pension plans, pursuant to COVID-19 relief measures. The Company intends to make contributions related to such U.S. plans by year end 2020. The Company estimates that contributions related to its non-U.S. defined benefit plans will approximate $1 million for the Company's share repurchase activity is provided in Note 15, "Stockholders' Equityremainder of 2020. Contributions of $3 million have been made and Non-Controlling Interests."approximately $2 million deferred until 2024, due to COVID-19 relief measures, for these non-U.S. plans.
During the nine months ended September 30, 2019, cash contributions to the Company's defined benefit plans were approximately $1 million for the U.S. plans and $4 million for the non-U.S. plans. The Company estimates that cash contributions to its defined benefit pension plans will be $7 million in 2019.
During the nine months ended September 30, 2019,2020, the Company paid $12$23 million related to restructuring activities. Management’s ongoing efforts to drive further operational improvements may causeAdditional discussion regarding the Company to incur additionalCompany's restructuring charges.activities is provided in Note 3, "Restructuring Activities."
In 2018, theThe Company committed to make a $15 million investment in two entities principally focused on the automotive sector pursuant to limited partnership agreements. As of September 30, 2020, the Company contributed $3 million toward the aggregate investment commitments. As a limited partner in each entity, the Company will periodically make capital contributions toward this total commitment amount.
Cash Flows
Operating Activities
The Company generated $118$97 million of cash from operating activities during the nine months ended September 30, 2019,2020, representing an $11a $21 million improvementdecrease as compared to cash generated by operations of $107$118 million during the same period of 2018. The increase in2019. Although the Company generated lower cash from operating activities, the Company's implemented significant actions to preserve cash flows is primarily due to a decrease of cash used by trade working capital and other assets and other liabilities of $10 millionliquidity during the nine months ended September 30, 20192020 that substantially mitigated the impact that COVID-19 might have otherwise had on the Company's results. Notwithstanding these successful efforts, operating cash flows declined by $32 million, due to lower Adjusted EBITDA (a non-GAAP financial measure, as compared to $77 million cashdiscussed in Note 15, "Segment Information").
Investing Activities
Cash used during the same period last year, representing an improvement of cash provided by operatinginvesting activities of $67 million. In addition, non-cash items, including depreciation and amortization, impacted cash provided by operating activities by $31 million more induring the nine months ended September 30, 2019 as compared2020 totaled $77 million. Net cash used by investing activities during the nine months ended September 30, 2020 included capital expenditures of $83 million, primarily to the same period of 2018. These items aresupport new business, partially offset by lowerproceeds from the settlement of net income of $87 million.
Investing Activitiesinvestment hedging transactions and loan repayments received from non-consolidated affiliate.
Cash used by investing activities during the nine months ended September 30, 2019 totaled $96 million, compared to net cash used by investing activities of $67 million for the same period in 2018. Net cash used by investing activities during the nine months ended September 30, 2019, includedincluding capital expenditures of $109 million which was partially offset by proceeds from non-consolidated affiliate loan repayments.
Cash used by investing activities during the nine months ended September 30, 2018 totaled $67 million, including capital expenditures of $96 million, partially offset by cash acquired from the consolidation of VFAE of $16 million and $10 million of proceeds primarily related to the settlement of certain agreements related to the Interiors Divestiture.
Financing Activities
Cash used by financing activities during the nine months ended September 30, 2019,2020 totaled $35$60 million, as compared to a use of cash of $294$35 million during the same period in 2018, for a decrease2019, representing an increase of cash used by financing activities of $259$25 million. The decreaseNet cash used by financing activities during the nine months ended September 30, 2020 is attributable to a decrease inthe repayment of $37 million of short-term debt primarily at the Company's Chinese joint venture operations, $16 million of share repurchases, and distribution payments.$7 million of dividends paid to non-controlling interests.
Net cash used by financing activities during the nine months ended September 30, 2019 is attributable to $20 million of share repurchases, the repayment of $8 million of short-term debt primarily at the Company's Chinese joint venture operations, and $7 million of dividends paid to non-controlling interests.
Debt and Capital Structure
See Note 11,8, “Debt” to the condensed consolidated financial statements included in Item 1.
Off-Balance Sheet Arrangements
The Company does not have any off-balance sheet arrangements.Significant Accounting Policies and Critical Accounting Estimates
See Note 1, “Summary of Significant Accounting Policies” to the accompanying condensed consolidated financial statements in Item 1.
Fair Value MeasurementMeasurements
See Note 16,13, “Fair Value Measurements and Financial Instruments” to the condensed consolidated financial statements included in Item 1.
Recent Accounting Pronouncements
See Note 1, “Summary of Significant Accounting Policies” to the accompanying condensed consolidated financial statements in Item 1.
Forward-Looking Statements
Certain statements contained or incorporated in this Quarterly Report on Form 10-Q which are not statements of historical fact constitute “Forward-Looking Statements” within the meaning of the Private Securities Litigation Reform Act of 1995 (the “Reform Act”). Forward-looking statements give current expectations or forecasts of future events. Words such as “anticipate”, “expect”, “intend”, “plan”, “believe”, “seek”, “estimate” and other words and terms of similar meaning in connection with discussions of future operating or financial performance signify forward-looking statements. These statements reflect the Company’s current views with respect to future events and are based on assumptions and estimates, which are subject to risks and uncertainties. Accordingly, undue reliance should not be placed on these forward-looking statements. Also, these forward-looking statements represent the Company’s estimates and assumptions only as of the date of this report. The Company does not intend to update any of these forward-looking statements to reflect circumstances or events that occur after the statement is made and qualifies all of its forward-looking statements by these cautionary statements.
You should understand that various factors, in addition to those discussed elsewhere in this document, could affect the Company’s future results and could cause results to differ materially from those expressed in such forward-looking statements, including:
•Continued and future impacts of the COVID-19 pandemic on our financial condition and business operations including global supply chain disruptions, market downturns, reduced consumer demand, and new government actions or restrictions.
•Visteon’s ability to satisfy its future capital and liquidity requirements; Visteon’s ability to access the credit and capital markets at the times and in the amounts needed and on terms acceptable to Visteon; Visteon’s ability to comply with covenants applicable to it; and the continuation of acceptable supplier payment terms.
•Visteon’s ability to satisfy its pension and other postretirement employee benefit obligations,obligations; and to retire outstanding debt and satisfy other contractual commitments all at the levels and times planned by management.
•Visteon’s ability to access funds generated by its foreign subsidiaries and joint ventures on a timely and cost-effective basis.
•Changes in the operations (including products, product planning and part sourcing), financial condition, results of operations or market share of Visteon’s customers.
•Changes in vehicle production volume of Visteon’s customers in the markets where it operates.
•Increases in commodity costs or disruptions in the supply of commodities, including resins, copper, fuel and natural gas.
•Visteon’s ability to generate cost savings to offset or exceed agreed-upon price reductions or price reductions to win additional business and, in general, improve its operating performance; to achieve the benefits of its restructuring actions; and to recover engineering and tooling costs and capital investments.
•Visteon’s ability to compete favorably with automotive parts suppliers with lower cost structures and greater ability to rationalize operations;operations and to exit non-performing businesses on satisfactory terms, particularly due to limited flexibility under existing labor agreements.
•Restrictions in labor contracts with unions that restrict Visteon’s ability to close plants, divest unprofitable, noncompetitive businesses, change local work rules and practices at a number of facilities and implement cost-saving measures.
•The costs and timing of facility closures or dispositions, business or product realignments, or similar restructuring actions, including potential asset impairment or other charges related to the implementation of these actions or other adverse industry conditions and contingent liabilities.
•Significant changes in the competitive environment in the major markets where Visteon procures materials, components or supplies or where its products are manufactured, distributed or sold.
•Legal and administrative proceedings, investigations and claims, including shareholder class actions, inquiries by regulatory agencies, product liability, warranty, employee-related, environmental and safety claims and any recalls of products manufactured or sold by Visteon.
•Changes in economic conditions, currency exchange rates, changes in foreign laws, regulations, or trade policies, or political stability in foreign countries where Visteon procures materials, components or supplies or where its products are manufactured, distributed or sold.
•Shortages of materials or interruptions in transportation systems, labor strikes, work stoppages or other interruptions to or difficulties in the employment of labor in the major markets where Visteon purchases materials, components or supplies to manufacture its products or where its products are manufactured, distributed or sold.
•Changes in laws, regulations, policies or other activities of governments, agencies and similar organizations, domestic and foreign, that may tax or otherwise increase the cost of, or otherwise affect, the manufacture, licensing, distribution, sale, ownership or use of Visteon’s products or assets.
•Possible terrorist attacks or acts of war, which could exacerbate other risks such as slowed vehicle production, interruptions in the transportation system or fuel prices and supply.
•The cyclical and seasonal nature of the automotive industry.
•Visteon’s ability to comply with environmental, safety and other regulations applicable to it and any increase in the requirements, responsibilities and associated expenses and expenditures of these regulations.
•Visteon’s ability to protect its intellectual property rights, and to respond to changes in technology and technological risks and to respond to claims by others that Visteon infringes their intellectual property rights.
•Visteon’s ability to quickly and adequately remediate control deficiencies in its internal control over financial reporting.
•Other factors, risks, and uncertainties detailed from time to time in Visteon’s Securities and Exchange Commission filings.
•Caution should be taken not to place undue reliance on our forward-looking statements, which represent our view only as of the date of this presentation, and which we assume no obligation to update. Backlog does not represent firm orders or firm commitments from customers, but are based on various assumptions, including the timing and duration of product launches, vehicle production levels, customer cancellations, installation rates, customer price reductions, and currency exchange rates.
| |
Item 3. | Quantitative and Qualitative Disclosures About Market Risk |
Item 3.Quantitative and Qualitative Disclosures About Market Risk
The primary market risks to which the Company is exposed include changes in currency exchange rates, interest rates and certain commodity prices. The Company manages these risks through operating actions including fixed price contracts with suppliers and cost sourcing arrangements with customers and through various derivative instruments. The Company's use of derivative instruments is strictly intended for hedging purposes to mitigate market risks pursuant to written risk management policies. Accordingly, derivative instruments are not used for speculative or trading purposes. The Company's use of derivative instruments creates exposure to credit loss in the event of non-performance by the counter-party to the derivative financial instruments. The Company limits this exposure by entering into agreements directly with a variety of major financial institutions with high credit standards and that are expected to fully satisfy their obligations under the contracts. Additionally, the Company's ability to utilize derivatives to manage market risk is dependent on credit conditions, and market conditions, given the currentand prevailing economic environment.
Foreign Currency Risk
The Company's cash flows are exposed to the risk of adverse changes in exchange rates as related to the sale of products in countries other than the manufacturing source, foreign currency denominated supplier payments, debt and other payables, dividends, investments in subsidiaries, and anticipated foreign currency denominated transaction proceeds. Where possible, the Company utilizes derivative financial instruments to manage foreign currency exchange rate risks. Forward and option contracts may be utilized to mitigate the impact exchange rate variability on the Company's cash flows. Foreign currency exposures are reviewed periodically and any natural offsets are considered prior to entering into a derivative financial instrument. The Company’s current primary hedged currency exposures include the Japanese Yen, Euro,yen, euro, Thai Baht,baht, and Mexican Peso.peso. The Company utilizes a strategy of partial coverage for transactions in these currencies. The Company's policy requires that hedge transactions relate to a specific portion of the exposure not to exceed the aggregate amount of the underlying transaction.
In addition to the transactional exposure described above, the Company's operating results are impacted by the translation of its foreign operating income into U.S. dollars. The Company does not enter into currency exchange rate contracts to mitigate this exposure.
The hypothetical pre-tax gain or loss in fair value from a 10% favorable or adverse change in quoted currency exchange rates would be approximately$36 million and $32 million for currency derivative financial instruments as of September 30, 20192020 and December 31, 2018.2019, respectively. These estimated changes assume a parallel shift in all currency exchange rates and include the gain or loss on financial instruments used to hedge investments in subsidiaries. Because exchange rates typically do not all move in the same direction, the estimate may overstate the impact of changing exchange rates on the net fair value of the Company's financial derivatives. It is also important to note that gains and losses indicated in the sensitivity analysis would generally be offset by gains and losses on the underlying exposures being hedged.
Interest Rate Risk
See Note 16,13, "Fair Value Measurements and Financial Instruments" to the condensed consolidated financial statements included in Item 1 for additional information.
Commodity Risk
The Company's exposures to market risk from changes in the price of production material are managed primarily through negotiations with suppliers and customers, although there can be no assurance that the Company will recover all such costs. The Company continues to evaluate derivatives available in the marketplace and may decide to utilize derivatives in the future to manage select commodity risks if an acceptable hedging instrument is identified for the Company's exposure level at that time, as well as the effectiveness of the financial hedge among other factors.
| |
Item 4. | Controls and Procedures |
Item 4.Controls and Procedures
Disclosure Controls and Procedures
The Company maintains disclosure controls and procedures that are designed to ensure that information required to be disclosed in periodic reports filed with the SEC under the Securities Exchange Act of 1934 is recorded, processed, summarized, and reported within the time periods specified in the SEC’s rules and forms, and that such information is accumulated and communicated to the Company’s management, including its Chief Executive Officer and ExecutiveSenior Vice President and Chief Financial Officer, as appropriate, to allow timely decisions regarding required disclosure.
As of September 30, 2019,2020, an evaluation was performed under the supervision and with the participation of the Company’s management, including its Chief Executive and Chief Financial Officer, of the effectiveness of the design and operation of disclosure controls and procedures. Based on that evaluation, the Chief Executive Officer and ExecutiveSenior Vice President and Chief Financial Officer concluded that the Company’s disclosure controls and procedures were effective as of September 30, 2019.2020.
Internal Control over Financial Reporting
There were no changes in the Company's internal control over financial reporting during the three months ended September 30, 20192020 that have materially affected, or are reasonably likely to materially affect, the Company's internal control over financial reporting.
Part II
Other Information
Item 1. Legal Proceedings
See the information above under Note 19,14, "Commitments and Contingencies," to the condensed consolidated financial statements which is incorporated herein by reference.
Certain risks described below updateItem 1A.Risk Factors
The Company is supplementing the risk factors in Part I, "Itemdescribed under “Item 1A. Risk Factors"Factors” in its Annual Report on Form 10-K for the year ended December 31, 2019, with the additional risk factors set forth below, which supplement, and to the extent inconsistent, supersedes such risk factors.
The Company’s business, results of operations and financial condition have been, and may continue to be, adversely affected by the recent COVID-19 pandemic.
The COVID-19 pandemic poses the risk that the Company or its affiliates and joint ventures, employees, suppliers, customers and others may be restricted or prevented from conducting business activities for indefinite or intermittent periods of time, including as a result of employee health and safety concerns, shutdowns, shelter in place orders, travel restrictions and other actions and restrictions that may be requested or mandated by governmental authorities. In addition, the Company has experienced, and may continue to experience, disruptions or delays in our supply chain as a result of such actions, which is likely to result in higher supply chain costs to us in order to maintain the supply of materials and components for our products. While the Company has implemented measures to mitigate the impact on its results of operations, there can be no assurance that these measures will be successful. The Company cannot predict the degree to, or the period over, which its net sales and operations will be affected by this outbreak and preventative measures, and the effects could be material.
The Company may also experience impacts from market downturns and changes in consumer behavior related to pandemic fears and impacts on its workforce as a result of COVID-19. The Company has experienced a significant decline in demand from its customers as a result of the impact of efforts to contain the spread of COVID-19. In addition, some customers may choose to delay or abandon projects on which the Company provides products and/or services in response to the adverse impact of the COVID-19 pandemic.
The extent to which the COVID-19 outbreak continues to impact the Company’s financial condition will depend on future developments that are highly uncertain and cannot be predicted, including new government actions or restrictions, new information that may emerge concerning the severity of COVID-19, the longevity of COVID-19, and the impact of COVID-19 on economic activity. Even after the COVID-19 pandemic has subsided, the Company may continue to experience adverse impacts on its business and financial performance as a result of its global economic impact, including a recession that has occurred or may occur in the Company'sfuture. To the extent the COVID-19 pandemic materially adversely affects the Company’s business and financial results, it may also have the effect of significantly heightening many of the other risks associated with the Company’s business, liquidity and indebtedness, including those described in its most recent Annual Report on Form 10-K for the year ended December 31, 2018.2019.
Changes in the United Kingdom's economic and other relationships with the European Union could adversely affect the Company.
In June 2016, a majority of voters in the United Kingdom elected to withdraw from the European Union ("Brexit"). In March 2017, the United Kingdom formally notified the European Union of its intention to withdraw thereby triggering a two-year negotiation period which has now been extended to October 31, 2019, unless further extension is agreed to by the parties. There remains significant uncertainty about the future relationship between the United Kingdom and the European Union, including the possibility of the United Kingdom leaving the European Union without a negotiated and bilaterally approved withdrawal plan. The Company does not have manufacturing operations in the United Kingdom but does have significant sales in the United Kingdom from manufacturing facilities in the European Union. In 2018, those sales were approximately $90 million. In addition, our supply chain and that of our customers are highly integrated across the United Kingdom and the European Union, and we are highly dependent on the free flow of goods in those regions. The ongoing uncertainty and potential re-imposition of border controls and customs duties on trade between the United Kingdom and European Union nations could negatively impact our competitive position, supplier and customer relationships and financial performance. The ultimate effects of Brexit on us will depend on the specific terms of any agreement the United Kingdom and the European Union reach to provide access to each other’s respective markets.
| |
Item 2. | Unregistered Sales of Equity Securities and Use of Proceeds |
Item 2.Unregistered Sales of Equity Securities and Use of Proceeds
There were no purchases made by or on behalf of the Company, or an affiliated purchaser, of shares of the Company’s common stock during the third quarter of 2019.2020.
Item 6.Exhibits
The exhibits listed on the "Exhibit Index" on Page 4440 hereof are filed with this report or incorporated by reference as set forth therein.
Exhibit Index
|
| | | | | | | |
| Exhibit No. | | Description |
| | |
| | |
| | |
| | |
| 101.INS | | XBRL Instance Document.** |
| 101.SCH | | XBRL Taxonomy Extension Schema Document.** |
| 101.CAL | | XBRL Taxonomy Extension Calculation Linkbase Document.** |
| 101.LAB | | XBRL Taxonomy Extension Label Linkbase Document.** |
| 101.PRE | | XBRL Taxonomy Extension Presentation Linkbase Document.** |
| 101.DEF | | XBRL Taxonomy Extension Definition Linkbase Document.** |
| |
* | Indicates that exhibit is a management contract or compensatory plan or arrangement. |
| |
** | Pursuant to Rule 406T of Regulation S-T, the Interactive Data Files as Exhibit 101 hereto are deemed not filed or part of a registration |
* Indicates that exhibit is a management contract or compensatory plan or arrangement.
** Pursuant to Rule 406T of Regulation S-T, the Interactive Data Files as Exhibit 101 hereto are deemed not filed or part of a registration statement or prospectus for purposes of Sections 11 or 12 of the Securities Act of 1933, as amended, are deemed not filed for purposes
of Section 18 of the Securities and Exchange Act of 1934, as amended, and otherwise are not subject to liability under those sections.
In lieu of filing certain instruments with respect to long-term debt of the kind described in Item 601(b)(4) of Regulation S-K, Visteon agrees to furnish a copy of such instruments to the Securities and Exchange Commission upon request.
Signatures
Pursuant to the requirements of Section 13 of the Securities Exchange Act of 1934, Visteon Corporation has duly caused this Report to be signed on its behalf by the undersigned, thereunto duly authorized.
| | | | | | | | |
| VISTEON CORPORATION |
| | |
| VISTEON CORPORATIONBy: | /s/ Abigail S. Fleming |
| | Abigail S. Fleming |
| By: | /s/ Christian A. Garcia |
| | Christian A. Garcia |
| | Executive Vice President and Chief FinancialAccounting Officer |
Date: October 24, 201929, 2020