UNITED STATES
SECURITIES AND EXCHANGE COMMISSION
Washington, D.C. 20549
FORM 10-Q
(Mark One)
|
| |
[X]☒ | QUARTERLY REPORT PURSUANT TO SECTION 13 OR 15(d) OF THE SECURITIES EXCHANGE ACT OF 1934 |
For the quarterly period ended September 30, 20172019
OR
|
| |
[ ]☐ | TRANSITION REPORT PURSUANT TO SECTION 13 OR 15(d) OF THE SECURITIES EXCHANGE ACT OF 1934 |
For the transition period from _____ to _____
Commission file number: 001-16337
OIL STATES INTERNATIONAL, INC.INC.
______________
(Exact name of registrant as specified in its charter)
|
| | |
| Delaware | 76-0476605 |
| (State or other jurisdiction of | (I.R.S. Employer |
| incorporation or organization) | Identification No.) |
| | |
| Three Allen Center, 333 Clay Street | |
| Suite 4620 | 77002 |
| Houston, | Texas | (Zip Code) |
| (Address of principal executive offices) | |
(713) 652-0582
(Registrant’sRegistrant's telephone number, including area code)
Securities registered pursuant to Section 12(b) of the Act:
|
| | | | |
| Title of each class | | Trading Symbol(s) | | Name of each exchange on which registered |
| Common stock, par value $0.01 per share | | OIS | | New York Stock Exchange |
Indicate by check mark whether the registrant (1) has filed all reports required to be filed by Section 13 or 15(d) of the Securities Exchange Act of 1934 during the preceding 12 months (or for such shorter period that the registrant was required to file such reports), and (2) has been subject to such filing requirements for the past 90 days.
Indicate by check mark whether the registrant has submitted electronically and posted on its corporate Web site, if any, every Interactive Data File required to be submitted and posted pursuant to Rule 405 of Regulation S-T (§232.405 of this chapter) during the preceding 12 months (or for such shorter period that the registrant was required to submit and post such files).
Indicate by check mark whether the registrant is a large accelerated filer, an accelerated filer, a non-accelerated filer, a smaller reporting company or an emerging growth company. See the definitions of “large"large accelerated filer,” “accelerated" "accelerated filer,” “smaller" "smaller reporting company,”" and “emerging"emerging growth company”company" in Rule 12b-2 of the Exchange Act. (Check one):
|
| | | | |
| Large accelerated filer | [X]☒ | | Accelerated filer | [ ] |
| | | | ☐ |
| Non-accelerated filer | [ ]☐ | (Do not check if a smaller reporting company) | Smaller reporting company | [ ] |
| | | | ☐ |
| | | | Emerging growth company | [ ]☐ |
If an emerging growth company, indicate by check mark if the registrant has elected not to use the extended transition period for complying with any new or revised financial accounting standards provided pursuant to Section 13(a) of the Exchange Act. [ ]☐
Indicate by check mark whether the registrant is a shell company (as defined in Rule 12b-2 of the Exchange Act).
As of October 23, 2017,21, 2019, the number of shares of common stock outstanding was 51,089,350.60,502,803.
OIL STATES INTERNATIONAL, INC.AND SUBSIDIARIES
INDEX
| | | | Page No. | Page No. |
| Part I -- FINANCIAL INFORMATION | | | |
| Part I – FINANCIAL INFORMATION | | | |
| | | | | |
| Item 1. Financial Statements: | | | | |
| | | | | |
| Condensed Consolidated Financial Statements | | | | |
| Unaudited Consolidated Statements of Operations | | | Unaudited Consolidated Statements of Operations | |
| Unaudited Consolidated Statements of Comprehensive Loss | | | Unaudited Consolidated Statements of Comprehensive Loss | |
| Consolidated Balance Sheets | | | Consolidated Balance Sheets | |
| Unaudited Consolidated Statement of Stockholders’ Equity | | | |
| Unaudited Consolidated Statements of Stockholders' Equity | | Unaudited Consolidated Statements of Stockholders' Equity | |
| Unaudited Consolidated Statements of Cash Flows | | | Unaudited Consolidated Statements of Cash Flows | |
| Notes to Unaudited Condensed Consolidated Financial Statements | | – | | | – | |
| | | | | |
| Cautionary Statement Regarding Forward-Looking Statements | | – | | | – | |
| | | | | |
| Item 2. Management’s Discussion and Analysis of Financial Condition and Results of Operations | | – | | |
| Item 2. Management's Discussion and Analysis of Financial Condition and Results of Operations | | | – | |
| | | | | |
| Item 3. Quantitative and Qualitative Disclosures About Market Risk | | | Item 3. Quantitative and Qualitative Disclosures About Market Risk | |
| | | | | |
| Item 4. Controls and Procedures | | | Item 4. Controls and Procedures | |
| | | | | |
| Part II -- OTHER INFORMATION | | | |
| Part II – OTHER INFORMATION | | | |
| | | | | |
| Item 1. Legal Proceedings | | | Item 1. Legal Proceedings | |
| | | | | |
| Item 1A. Risk Factors | | | Item 1A. Risk Factors | |
| | | | | |
| Item 2. Unregistered Sales of Equity Securities and Use of Proceeds | | | Item 2. Unregistered Sales of Equity Securities and Use of Proceeds | |
| | | | | |
| Item 3. Defaults Upon Senior Securities | | | Item 3. Defaults Upon Senior Securities | |
| | | | | |
| Item 4. Mine Safety Disclosures | | | Item 4. Mine Safety Disclosures | |
| | | | | |
| Item 5. Other Information | | | Item 5. Other Information | |
| | | | | |
| Item 6. Exhibits | | | Item 6. Exhibits | |
| | | | | |
| Signature Page | | | Signature Page | |
PART I – FINANCIAL INFORMATION
ITEM 1.Financial Statements
OIL STATES INTERNATIONAL, INC. AND SUBSIDIARIES
UNAUDITED CONSOLIDATED STATEMENTS OF OPERATIONS
(In Thousands, Except Per Share Amounts)
|
| | | | | | | | | | | | | | | |
| | Three Months Ended September 30, | | Nine Months Ended September 30, |
| | 2017 | | 2016 | | 2017 | | 2016 |
| Revenues: | | | | | | | |
| Products | $ | 67,339 |
| | $ | 109,312 |
| | $ | 223,269 |
| | $ | 323,566 |
|
| Service | 96,709 |
| | 69,694 |
| | 263,648 |
| | 200,944 |
|
| | 164,048 |
| | 179,006 |
| | 486,917 |
| | 524,510 |
|
| | | | | | | | |
| Costs and expenses: | | | | | | | |
| Product costs | 50,593 |
| | 75,345 |
| | 160,252 |
| | 227,855 |
|
| Service costs | 78,596 |
| | 60,421 |
| | 219,697 |
| | 173,125 |
|
| Selling, general and administrative expense | 26,843 |
| | 30,388 |
| | 84,055 |
| | 90,854 |
|
| Depreciation and amortization expense | 26,788 |
| | 29,848 |
| | 82,552 |
| | 89,666 |
|
| Other operating (income) expense, net | (589 | ) | | (1,370 | ) | | 374 |
| | (4,098 | ) |
| | 182,231 |
| | 194,632 |
| | 546,930 |
| | 577,402 |
|
| Operating loss | (18,183 | ) | | (15,626 | ) | | (60,013 | ) | | (52,892 | ) |
| | | | | | | | |
| Interest expense | (1,147 | ) | | (1,364 | ) | | (3,370 | ) | | (4,124 | ) |
| Interest income | 73 |
| | 119 |
| | 243 |
| | 321 |
|
| Other income | 207 |
| | 32 |
| | 477 |
| | 462 |
|
| Loss from continuing operations before income taxes | (19,050 | ) | | (16,839 | ) | | (62,663 | ) | | (56,233 | ) |
| Income tax benefit | 4,019 |
| | 6,021 |
| | 15,708 |
| | 20,474 |
|
| Net loss from continuing operations | (15,031 | ) | | (10,818 | ) | | (46,955 | ) | | (35,759 | ) |
| Net loss from discontinued operations, net of tax | — |
| | — |
| | — |
| | (4 | ) |
| Net loss attributable to Oil States | $ | (15,031 | ) | | $ | (10,818 | ) | | $ | (46,955 | ) | | $ | (35,763 | ) |
| | | | | | | | |
| Basic net loss per share attributable to Oil States from: | | | | | | | |
| Continuing operations | $ | (0.30 | ) | | $ | (0.22 | ) | | $ | (0.94 | ) | | $ | (0.71 | ) |
| Discontinued operations | — |
| | — |
| | — |
| | — |
|
| Net loss | $ | (0.30 | ) | | $ | (0.22 | ) | | $ | (0.94 | ) | | $ | (0.71 | ) |
| | | | | | | | |
| Diluted net loss per share attributable to Oil States from: | | | | | | | |
| Continuing operations | $ | (0.30 | ) | | $ | (0.22 | ) | | $ | (0.94 | ) | | $ | (0.71 | ) |
| Discontinued operations | — |
| | — |
| | — |
| | — |
|
| Net loss | $ | (0.30 | ) | | $ | (0.22 | ) | | $ | (0.94 | ) | | $ | (0.71 | ) |
| | | | | | | | |
| Weighted average number of common shares outstanding: | | | | | | | |
| Basic | 49,978 |
| | 50,222 |
| | 50,190 |
| | 50,158 |
|
| Diluted | 49,978 |
| | 50,222 |
| | 50,190 |
| | 50,158 |
|
|
| | | | | | | | | | | | | | | |
| | Three Months Ended September 30, | | Nine Months Ended September 30, |
| | 2019 | | 2018 | | 2019 | | 2018 |
| Revenues: | | | | | | | |
| Products | $ | 122,067 |
| | $ | 120,271 |
| | $ | 363,360 |
| | $ | 385,279 |
|
| Services | 141,630 |
| | 154,323 |
| | 415,633 |
| | 428,736 |
|
| | 263,697 |
| | 274,594 |
| | 778,993 |
| | 814,015 |
|
| | | | | | | | |
| Costs and expenses: | | | | | | | |
| Product costs | 90,796 |
| | 87,822 |
| | 275,353 |
| | 276,122 |
|
| Service costs | 110,294 |
| | 127,836 |
| | 333,727 |
| | 342,829 |
|
| Cost of revenues (exclusive of depreciation and amortization expense presented below) | 201,090 |
| | 215,658 |
| | 609,080 |
| | 618,951 |
|
| Selling, general and administrative expense | 31,935 |
| | 32,285 |
| | 93,527 |
| | 102,399 |
|
| Depreciation and amortization expense | 31,366 |
| | 30,586 |
| | 94,800 |
| | 90,698 |
|
| Impairment of fixed assets | 33,697 |
| | — |
| | 33,697 |
| | — |
|
| Other operating (income) expense, net | 519 |
| | (213 | ) | | 34 |
| | (2,097 | ) |
| | 298,607 |
| | 278,316 |
| | 831,138 |
| | 809,951 |
|
| Operating income (loss) | (34,910 | ) | | (3,722 | ) | | (52,145 | ) | | 4,064 |
|
| | | | | | | | |
| Interest expense, net | (4,352 | ) | | (4,843 | ) | | (13,721 | ) | | (14,087 | ) |
| Other income, net | 1,190 |
| | 709 |
| | 2,866 |
| | 1,927 |
|
| Loss before income taxes | (38,072 | ) | | (7,856 | ) | | (63,000 | ) | | (8,096 | ) |
| Income tax benefit | 6,204 |
| | 3,837 |
| | 6,744 |
| | 3,327 |
|
| Net loss | $ | (31,868 | ) | | $ | (4,019 | ) | | $ | (56,256 | ) | | $ | (4,769 | ) |
| | | | | | | | |
| Net loss per share: | | | | | | | |
| Basic | $ | (0.54 | ) | | $ | (0.07 | ) | | $ | (0.95 | ) | | $ | (0.08 | ) |
| Diluted | (0.54 | ) | | (0.07 | ) | | (0.95 | ) | | (0.08 | ) |
| | | | | | | | |
| Weighted average number of common shares outstanding: | | | | | | | |
| Basic | 59,423 |
| | 59,026 |
| | 59,362 |
| | 58,606 |
|
| Diluted | 59,423 |
| | 59,026 |
| | 59,362 |
| | 58,606 |
|
The accompanying notes are an integral part of these financial statements.
OIL STATES INTERNATIONAL, INC. AND SUBSIDIARIES
UNAUDITED CONSOLIDATED STATEMENTS OF COMPREHENSIVE LOSS
(In Thousands)
|
| | | | | | | | | | | | | | | |
| | Three Months Ended September 30, | | Nine Months Ended September 30, |
| | 2017 | | 2016 | | 2017 | | 2016 |
| Net loss | $ | (15,031 | ) | | $ | (10,818 | ) | | $ | (46,955 | ) | | $ | (35,763 | ) |
| | | | | | | | |
| Other comprehensive income (loss): | | | | | | | |
| Currency translation adjustments | 4,857 |
| | (5,217 | ) | | 13,490 |
| | (12,534 | ) |
| Comprehensive loss attributable to Oil States | $ | (10,174 | ) | | $ | (16,035 | ) | | $ | (33,465 | ) | | $ | (48,297 | ) |
The accompanying notes are an integral part of these financial statements.
OIL STATES INTERNATIONAL, INC. AND SUBSIDIARIES
UNAUDITED CONSOLIDATED BALANCE SHEETSSTATEMENTS OF COMPREHENSIVE LOSS
(In Thousands, Except Share Amounts)
Thousands)
|
| | | | | | | |
| | September 30, 2017 | | December 31, 2016 |
| | (Unaudited) | | |
| ASSETS | | | |
| | | | |
| Current assets: | | | |
| Cash and cash equivalents | $ | 65,864 |
| | $ | 68,800 |
|
| Accounts receivable, net | 210,218 |
| | 234,513 |
|
| Inventories, net | 173,447 |
| | 175,490 |
|
| Prepaid expenses and other current assets | 26,464 |
| | 11,174 |
|
| Total current assets | 475,993 |
| | 489,977 |
|
| | | | |
| Property, plant, and equipment, net | 508,743 |
| | 553,402 |
|
| Goodwill, net | 268,917 |
| | 263,369 |
|
| Other intangible assets, net | 50,105 |
| | 52,746 |
|
| Other noncurrent assets | 25,597 |
| | 24,404 |
|
| Total assets | $ | 1,329,355 |
| | $ | 1,383,898 |
|
| | | | |
| LIABILITIES AND STOCKHOLDERS’ EQUITY | | | |
| | | | |
| Current liabilities: | | | |
| Current portion of long-term debt and capitalized leases | $ | 492 |
| | $ | 538 |
|
| Accounts payable | 44,768 |
| | 34,207 |
|
| Accrued liabilities | 47,632 |
| | 45,333 |
|
| Income taxes payable | 1,031 |
| | 5,839 |
|
| Deferred revenue | 22,588 |
| | 21,315 |
|
| Total current liabilities | 116,511 |
| | 107,232 |
|
| | | | |
| Long-term debt and capitalized leases | 19,061 |
| | 45,388 |
|
| Deferred income taxes | 4,592 |
| | 5,036 |
|
| Other noncurrent liabilities | 22,914 |
| | 21,935 |
|
| Total liabilities | 163,078 |
| | 179,591 |
|
| | | | |
| Stockholders’ equity: | | | |
| Common stock, $.01 par value, 200,000,000 shares authorized, 62,721,256 shares and 62,295,870 shares issued, respectively | 627 |
| | 623 |
|
| Additional paid-in capital | 748,581 |
| | 731,562 |
|
| Retained earnings | 1,086,518 |
| | 1,133,473 |
|
| Accumulated other comprehensive loss | (56,810 | ) | | (70,300 | ) |
| Treasury stock, at cost, 11,631,810 and 10,921,509 shares, respectively | (612,639 | ) | | (591,051 | ) |
| Total stockholders’ equity | 1,166,277 |
| | 1,204,307 |
|
| Total liabilities and stockholders’ equity | $ | 1,329,355 |
| | $ | 1,383,898 |
|
|
| | | | | | | | | | | | | | | |
| | Three Months Ended September 30, | | Nine Months Ended September 30, |
| | 2019 | | 2018 | | 2019 | | 2018 |
| Net loss | $ | (31,868 | ) | | $ | (4,019 | ) | | $ | (56,256 | ) | | $ | (4,769 | ) |
| | | | | | | | |
| Other comprehensive loss: | | | | | | | |
| Currency translation adjustments | (5,672 | ) | | (2,539 | ) | | (5,535 | ) | | (11,238 | ) |
| Comprehensive loss | $ | (37,540 | ) | | $ | (6,558 | ) | | $ | (61,791 | ) | | $ | (16,007 | ) |
The accompanying notes are an integral part of these financial statements.
OIL STATES INTERNATIONAL, INC. AND SUBSIDIARIES
UNAUDITED CONSOLIDATED STATEMENT OF STOCKHOLDERS' EQUITYBALANCE SHEETS
(In Thousands)
Thousands, Except Share Amounts)
|
| | | | | | | | | | | | | | | | | | | | | | | |
| | Common Stock | | Additional Paid-In Capital | | Retained Earnings | | Accumulated Other Comprehensive Loss | | Treasury Stock | | Total Stockholders' Equity |
| Balance, December 31, 2016 | $ | 623 |
| | $ | 731,562 |
| | $ | 1,133,473 |
| | $ | (70,300 | ) | | $ | (591,051 | ) | | $ | 1,204,307 |
|
| Net loss | — |
| | — |
| | (46,955 | ) | | — |
| | — |
| | (46,955 | ) |
| Currency translation adjustments (excluding intercompany advances) | — |
| | — |
| | — |
| | 12,346 |
| | — |
| | 12,346 |
|
| Currency translation adjustments on intercompany advances | — |
| | — |
| | — |
| | 1,144 |
| | — |
| | 1,144 |
|
| Stock-based compensation expense- | | | | | | | | | | | |
| Restricted stock | 4 |
| | 16,043 |
| | — |
| | — |
| | — |
| | 16,047 |
|
| Stock options | — |
| | 976 |
| | — |
| | — |
| | — |
| | 976 |
|
| Stock repurchases | — |
| | — |
| | — |
| | — |
| | (16,283 | ) | | (16,283 | ) |
| Surrender of stock to pay taxes on restricted stock awards | — |
| | — |
| | — |
| | — |
| | (5,305 | ) | | (5,305 | ) |
| Balance, September 30, 2017 | $ | 627 |
| | $ | 748,581 |
| | $ | 1,086,518 |
| | $ | (56,810 | ) | | $ | (612,639 | ) | | $ | 1,166,277 |
|
|
| | | | | | | |
| | September 30,
2019 | | December 31, 2018 |
| | (Unaudited) | | |
| ASSETS | | | |
| | | | |
| Current assets: | | | |
| Cash and cash equivalents | $ | 14,655 |
| | $ | 19,316 |
|
| Accounts receivable, net | 256,387 |
| | 283,607 |
|
| Inventories, net | 215,558 |
| | 209,393 |
|
| Prepaid expenses and other current assets | 18,802 |
| | 21,715 |
|
| Total current assets | 505,402 |
| | 534,031 |
|
| | | | |
| Property, plant, and equipment, net | 470,983 |
| | 540,427 |
|
| Operating lease assets, net | 45,497 |
| | — |
|
| Goodwill, net | 646,744 |
| | 647,018 |
|
| Other intangible assets, net | 236,159 |
| | 255,301 |
|
| Other noncurrent assets | 29,179 |
| | 27,044 |
|
| Total assets | $ | 1,933,964 |
| | $ | 2,003,821 |
|
| | | | |
| LIABILITIES AND STOCKHOLDERS' EQUITY | | | |
| | | | |
| Current liabilities: | | | |
| Current portion of long-term debt | $ | 25,591 |
| | $ | 25,561 |
|
| Accounts payable | 78,511 |
| | 77,511 |
|
| Accrued liabilities | 59,988 |
| | 60,730 |
|
| Current operating lease liabilities | 8,557 |
| | — |
|
| Income taxes payable | 5,385 |
| | 3,072 |
|
| Deferred revenue | 25,888 |
| | 14,160 |
|
| Total current liabilities | 203,920 |
| | 181,034 |
|
| | | | |
| Long-term debt | 239,596 |
| | 306,177 |
|
| Long-term operating lease liabilities | 37,230 |
| | — |
|
| Deferred income taxes | 41,604 |
| | 53,831 |
|
| Other noncurrent liabilities | 25,270 |
| | 23,011 |
|
| Total liabilities | 547,620 |
| | 564,053 |
|
| | | | |
| Stockholders' equity: | | | |
| Common stock, $.01 par value, 200,000,000 shares authorized, 72,548,151 shares and 71,753,937 shares issued, respectively | 726 |
| | 718 |
|
| Additional paid-in capital | 1,110,572 |
| | 1,097,758 |
|
| Retained earnings | 973,262 |
| | 1,029,518 |
|
| Accumulated other comprehensive loss | (76,932 | ) | | (71,397 | ) |
| Treasury stock, at cost, 12,045,065 and 11,784,242 shares, respectively | (621,284 | ) | | (616,829 | ) |
| Total stockholders' equity | 1,386,344 |
| | 1,439,768 |
|
| Total liabilities and stockholders' equity | $ | 1,933,964 |
| | $ | 2,003,821 |
|
The accompanying notes are an integral part of these financial statements.
OIL STATES INTERNATIONAL, INC. AND SUBSIDIARIES
UNAUDITED CONSOLIDATED STATEMENTS OF CASH FLOWSSTOCKHOLDERS' EQUITY
(In Thousands)
|
| | | | | | | | | | | | | | | | | | | | | | | |
| Three Months Ended September 30, 2019 | Common Stock | | Additional Paid-In Capital | | Retained Earnings | | Accumulated Other Comprehensive Loss | | Treasury Stock | | Total Stockholders' Equity |
| Balance, June 30, 2019 | $ | 726 |
| | $ | 1,106,340 |
| | $ | 1,005,130 |
| | $ | (71,260 | ) | | $ | (621,208 | ) | | $ | 1,419,728 |
|
| Net loss | — |
| | — |
| | (31,868 | ) | | — |
| | — |
| | (31,868 | ) |
| Currency translation adjustments (excluding intercompany advances) | — |
| | — |
| | — |
| | (4,448 | ) | | — |
| | (4,448 | ) |
| Currency translation adjustments on intercompany advances | — |
| | — |
| | — |
| | (1,224 | ) | | — |
| | (1,224 | ) |
| Stock-based compensation expense: | | | | | | | | | | | |
| Restricted stock | — |
| | 4,232 |
| | — |
| | — |
| | — |
| | 4,232 |
|
| Stock options | — |
| | — |
| | — |
| | — |
| | — |
| | — |
|
| Stock repurchases | — |
| | — |
| | — |
| | — |
| | — |
| | — |
|
| Surrender of stock to settle taxes on restricted stock awards | — |
| | — |
| | — |
| | — |
| | (76 | ) | | (76 | ) |
| Balance, September 30, 2019 | $ | 726 |
| | $ | 1,110,572 |
| | $ | 973,262 |
| | $ | (76,932 | ) | | $ | (621,284 | ) | | $ | 1,386,344 |
|
|
| | | | | | | |
| | Nine Months Ended September 30, |
| | 2017 | | 2016 |
| Cash flows from operating activities: | | | |
| Net loss | $ | (46,955 | ) | | $ | (35,763 | ) |
| Adjustments to reconcile net loss to net cash provided by operating activities: | | | |
| Loss from discontinued operations | — |
| | 4 |
|
| Depreciation and amortization | 82,552 |
| | 89,666 |
|
| Stock-based compensation expense | 17,023 |
| | 15,938 |
|
| Deferred income tax benefit | (2,224 | ) | | (28,264 | ) |
| Provision for bad debt | 257 |
| | 759 |
|
| Gain on disposals of assets | (526 | ) | | (445 | ) |
| Amortization of deferred financing costs | 608 |
| | 585 |
|
| Other, net | 62 |
| | 689 |
|
| Changes in operating assets and liabilities, net of effect from acquired businesses: | | | |
| Accounts receivable | 26,909 |
| | 68,193 |
|
| Inventories | 5,912 |
| | 15,600 |
|
| Accounts payable and accrued liabilities | 11,811 |
| | (18,588 | ) |
| Income taxes payable | (4,789 | ) | | (2,987 | ) |
| Other operating assets and liabilities, net | (14,323 | ) | | 2,392 |
|
| Net cash flows provided by continuing operating activities | 76,317 |
| | 107,779 |
|
| Net cash flows used in discontinued operating activities | — |
| | 3 |
|
| Net cash flows provided by operating activities | 76,317 |
| | 107,782 |
|
| | | | |
| Cash flows from investing activities: | | | |
| Capital expenditures | (20,331 | ) | | (23,893 | ) |
| Acquisitions of businesses | (12,859 | ) | | — |
|
| Proceeds from disposition of property, plant and equipment | 1,125 |
| | 1,026 |
|
| Other, net | (631 | ) | | (1,534 | ) |
| Net cash flows used in investing activities | (32,696 | ) | | (24,401 | ) |
| | | | |
| Cash flows from financing activities: | | | |
| Revolving credit facility borrowings (repayments), net | (26,578 | ) | | (59,731 | ) |
| Debt and capital lease repayments | (403 | ) | | (398 | ) |
| Purchase of treasury stock | (16,283 | ) | | — |
|
| Issuance of common stock from stock-based payment arrangements | — |
| | 367 |
|
| Shares added to treasury stock as a result of net share settlements due to vesting of restricted stock | (5,305 | ) | | (3,950 | ) |
| Net cash flows used in financing activities | (48,569 | ) | | (63,712 | ) |
| | | | |
| Effect of exchange rate changes on cash and cash equivalents | 2,012 |
| | (1,852 | ) |
| Net change in cash and cash equivalents | (2,936 | ) | | 17,817 |
|
| Cash and cash equivalents, beginning of period | 68,800 |
| | 35,973 |
|
| | | | |
| Cash and cash equivalents, end of period | $ | 65,864 |
| | $ | 53,790 |
|
|
| | | | | | | | | | | | | | | | | | | | | | | |
| Nine Months Ended September 30, 2019 | Common Stock | | Additional Paid-In Capital | | Retained Earnings | | Accumulated Other Comprehensive Loss | | Treasury Stock | | Total Stockholders' Equity |
| Balance, December 31, 2018 | $ | 718 |
| | $ | 1,097,758 |
| | $ | 1,029,518 |
| | $ | (71,397 | ) | | $ | (616,829 | ) | | $ | 1,439,768 |
|
| Net loss | — |
| | — |
| | (56,256 | ) | | — |
| | — |
| | (56,256 | ) |
| Currency translation adjustments (excluding intercompany advances) | — |
| | — |
| | — |
| | (4,841 | ) | | — |
| | (4,841 | ) |
| Currency translation adjustments on intercompany advances | — |
| | — |
| | — |
| | (694 | ) | | — |
| | (694 | ) |
| Stock-based compensation expense: | | | | | | | | | | | |
| Restricted stock | 8 |
| | 12,761 |
| | — |
| | — |
| | — |
| | 12,769 |
|
| Stock options | — |
| | 53 |
| | — |
| | — |
| | — |
| | 53 |
|
| Stock repurchases | — |
| | — |
| | — |
| | — |
| | (757 | ) | | (757 | ) |
| Surrender of stock to settle taxes on restricted stock awards | — |
| | — |
| | — |
| | — |
| | (3,698 | ) | | (3,698 | ) |
| Balance, September 30, 2019 | $ | 726 |
| | $ | 1,110,572 |
| | $ | 973,262 |
| | $ | (76,932 | ) | | $ | (621,284 | ) | | $ | 1,386,344 |
|
OIL STATES INTERNATIONAL, INC. AND SUBSIDIARIES
UNAUDITED CONSOLIDATED STATEMENTS OF STOCKHOLDERS' EQUITY
(In Thousands)
|
| | | | | | | | | | | | | | | | | | | | | | | |
| Three Months Ended September 30, 2018 | Common Stock | | Additional Paid-In Capital | | Retained Earnings | | Accumulated Other Comprehensive Loss | | Treasury Stock | | Total Stockholders' Equity |
| Balance, June 30, 2018 | $ | 718 |
| | $ | 1,085,927 |
| | $ | 1,047,873 |
| | $ | (67,192 | ) | | $ | (616,673 | ) | | $ | 1,450,653 |
|
| Net loss | — |
| | — |
| | (4,019 | ) | | — |
| | — |
| | (4,019 | ) |
| Currency translation adjustments (excluding intercompany advances) | — |
| | — |
| | — |
| | (2,915 | ) | | — |
| | (2,915 | ) |
| Currency translation adjustments on intercompany advances | — |
| | — |
| | — |
| | 376 |
| | — |
| | 376 |
|
| Stock-based compensation expense: | | | | | | | | | | | |
| Restricted stock | — |
| | 5,597 |
| | — |
| | — |
| | — |
| | 5,597 |
|
| Stock options | — |
| | 96 |
| | — |
| | — |
| | — |
| | 96 |
|
| Issuance of common stock in connection with GEODynamics acquisition | — |
| | — |
| | — |
| | — |
| | — |
| | — |
|
| Issuance of 1.50% convertible senior notes, net of income taxes of $7,744 | — |
| | 43 |
| | — |
| | — |
| | — |
| | 43 |
|
| Surrender of stock to settle taxes on restricted stock awards | — |
| | — |
| | — |
| | — |
| | (156 | ) | | (156 | ) |
| Balance, September 30, 2018 | $ | 718 |
| | $ | 1,091,663 |
| | $ | 1,043,854 |
| | $ | (69,731 | ) | | $ | (616,829 | ) | | $ | 1,449,675 |
|
|
| | | | | | | | | | | | | | | | | | | | | | | |
| Nine Months Ended September 30, 2018 | Common Stock | | Additional Paid-In Capital | | Retained Earnings | | Accumulated Other Comprehensive Loss | | Treasury Stock | | Total Stockholders' Equity |
| Balance, December 31, 2017 | $ | 627 |
| | $ | 754,607 |
| | $ | 1,048,623 |
| | $ | (58,493 | ) | | $ | (612,651 | ) | | $ | 1,132,713 |
|
| Net loss | — |
| | — |
| | (4,769 | ) | | — |
| | — |
| | (4,769 | ) |
| Currency translation adjustments (excluding intercompany advances) | — |
| | — |
| | — |
| | (9,053 | ) | | — |
| | (9,053 | ) |
| Currency translation adjustments on intercompany advances | — |
| | — |
| | — |
| | (2,185 | ) | | — |
| | (2,185 | ) |
| Stock-based compensation expense: | | | | | | | | | | | |
| Restricted stock | 4 |
| | 16,154 |
| | — |
| | — |
| | — |
| | 16,158 |
|
| Stock options | — |
| | 396 |
| | — |
| | — |
| | — |
| | 396 |
|
| Issuance of common stock in connection with GEODynamics acquisition | 87 |
| | 294,823 |
| | — |
| | — |
| | — |
| | 294,910 |
|
| Issuance of 1.50% convertible senior notes, net of income taxes of $7,744 | — |
| | 25,683 |
| | — |
| | — |
| | — |
| | 25,683 |
|
| Surrender of stock to settle taxes on restricted stock awards | — |
| | — |
| | — |
| | — |
| | (4,178 | ) | | (4,178 | ) |
| Balance, September 30, 2018 | $ | 718 |
| | $ | 1,091,663 |
| | $ | 1,043,854 |
| | $ | (69,731 | ) | | $ | (616,829 | ) | | $ | 1,449,675 |
|
The accompanying notes are an integral part of these financial statements.
OIL STATES INTERNATIONAL, INC. AND SUBSIDIARIES
UNAUDITED CONSOLIDATED STATEMENTS OF CASH FLOWS
(In Thousands)
|
| | | | | | | |
| | Nine Months Ended September 30, |
| | 2019 | | 2018 |
| Cash flows from operating activities: | | | |
| Net loss | $ | (56,256 | ) | | $ | (4,769 | ) |
| Adjustments to reconcile net loss to net cash provided by operating activities: | | | |
| Depreciation and amortization expense | 94,800 |
| | 90,698 |
|
| Impairment of fixed assets | 33,697 |
| | — |
|
| Stock-based compensation expense | 12,822 |
| | 16,554 |
|
| Amortization of debt discount and deferred financing costs | 5,903 |
| | 5,504 |
|
| Deferred income tax provision (benefit) | (11,935 | ) | | 1,061 |
|
| Gain on disposals of assets | (2,310 | ) | | (5,046 | ) |
| Other, net | 1,216 |
| | 991 |
|
| Changes in operating assets and liabilities, net of effect from acquired businesses: | | | |
| Accounts receivable | 24,993 |
| | (25,454 | ) |
| Inventories | (6,867 | ) | | (7,867 | ) |
| Accounts payable and accrued liabilities | 3,143 |
| | 18,311 |
|
| Income taxes payable | 1,948 |
| | 524 |
|
| Other operating assets and liabilities, net | 14,740 |
| | (10,406 | ) |
| Net cash flows provided by operating activities | 115,894 |
| | 80,101 |
|
| | | | |
| Cash flows from investing activities: | | | |
| Capital expenditures | (45,832 | ) | | (71,286 | ) |
| Acquisitions of businesses, net of cash acquired | — |
| | (379,676 | ) |
| Proceeds from disposition of property, plant and equipment | 3,619 |
| | 1,812 |
|
| Proceeds from flood insurance claims | — |
| | 3,589 |
|
| Other, net | (1,534 | ) | | (1,218 | ) |
| Net cash flows used in investing activities | (43,747 | ) | | (446,779 | ) |
| | | | |
| Cash flows from financing activities: | | | |
| Issuance of 1.50% convertible senior notes | — |
| | 200,000 |
|
| Purchase of 1.50% convertible senior notes | (858 | ) | | — |
|
| Revolving credit facility borrowings | 175,306 |
| | 769,147 |
|
| Revolving credit facility repayments | (246,450 | ) | | (608,565 | ) |
| Other debt and finance lease repayments, net | (434 | ) | | (405 | ) |
| Payment of financing costs | (18 | ) | | (7,368 | ) |
| Purchase of treasury stock | (757 | ) | | — |
|
Shares added to treasury stock as a result of net share settlements
due to vesting of restricted stock | (3,698 | ) | | (4,178 | ) |
| Net cash flows provided by (used in) financing activities | (76,909 | ) | | 348,631 |
|
| | | | |
| Effect of exchange rate changes on cash and cash equivalents | 101 |
| | 849 |
|
| Net change in cash and cash equivalents | (4,661 | ) | | (17,198 | ) |
| Cash and cash equivalents, beginning of period | 19,316 |
| | 53,459 |
|
| Cash and cash equivalents, end of period | $ | 14,655 |
| | $ | 36,261 |
|
| | | | |
| Cash paid for: | | | |
| Interest | $ | 8,378 |
| | $ | 7,730 |
|
| Income taxes, net of refunds | (2,522 | ) | | 2,369 |
|
The accompanying notes are an integral part of these financial statements.
OIL STATES INTERNATIONAL, INC. AND SUBSIDIARIES
NOTES TO UNAUDITED CONDENSED CONSOLIDATED
FINANCIAL STATEMENTS
| |
| 1. | Organization and Basis of Presentation |
The accompanying unaudited condensed consolidated financial statements of Oil States International, Inc. and its subsidiaries (referred to in this report as “we”"we" or the “Company”"Company") have been prepared pursuant to the rules and regulations of the Securities and Exchange Commission (the “Commission”"Commission") pertaining to interim financial information. Certain information in footnote disclosures normally included in financial statements prepared in accordance with U.S. generally accepted accounting principles (“GAAP”("GAAP") have been condensed or omitted pursuant to these rules and regulations. The unaudited financial statements included in this report reflect all the adjustments, consisting of normal recurring adjustments, which the Company considers necessary for a fair presentationstatement of the results of operations for the interim periods covered and for the financial condition of the Company at the date of the interim balance sheet. Results for the interim periods are not necessarily indicative of results for the full year.
Certain prior-year amounts in the Company's unaudited condensed consolidated financial statements have been reclassified to conform to the current year presentation.
The preparation of condensed consolidated financial statements in conformity with GAAP requires the use of estimates and assumptions by management in determining the reported amounts of assets and liabilities and disclosures of contingent assets and liabilities at the date of the condensed consolidated financial statements and the reported amounts of revenues and expenses during the reporting period. Examples of such estimates include goodwill and long-lived asset impairment analyses, revenue and income recognized over time, valuation allowances recorded on deferred tax assets, the fair value of assets and liabilities acquired and identification of associated goodwill and intangible assets, reserves on inventory, allowances for doubtful accounts, warranty obligations and potential future adjustments related to contractual indemnification and other agreements. If the underlying estimates and assumptions, upon which the financial statements are based, change in future periods, actual amounts may differ from those included in the accompanying condensed consolidated financial statements. Our industry is cyclical and this cyclicality impacts our estimates of the period over which future cash flows will be generated, as well as the predictability of these cash flows including our determination of whether a decline in value of our deferred tax assets, long-lived assets and/or goodwill has occurred.
During the first quarter of 2017, we modified the name of our “Offshore Products” segment to the “Offshore/Manufactured Products” segment given the higher proportional weighting of our shorter-cycle manufactured products (much of which is driven by land-based activity) to the total revenues generated by the segment. The Company has also provided supplemental disclosure in Note 12, “Segments and Related Information,” with respect to product and service revenues generated by the Offshore/Manufactured Products segment, including project-driven products, short-cycle products, and other products and services. There have been no operational, reporting or other material changes related to the Offshore/Manufactured Products segment.
The financial statements included in this report should be read in conjunction with the Company’sCompany's audited financial statements and accompanying notes included in its Annual Report on Form 10-K for the year ended December 31, 20162018 (the “2016"2018 Form 10‑K”K").
| |
| 2. | Recent Accounting Pronouncements |
From time to time, new accounting pronouncements are issued by the Financial Accounting Standards Board (the “FASB”"FASB"), which are adopted by the Company as of the specified effective date. Unless otherwise discussed, management believes that the impact of recently issued standards, which are not yet effective, will not have a material impact on the Company’sCompany's consolidated financial statements upon adoption.
In May 2014,February 2016, the FASB issued guidance on revenue from contracts with customersleases which, as amended, introduced the recognition of lease assets and lease liabilities by lessees for all leases that will supersede most current revenue recognition guidance, including industry-specific guidance. The underlying principle is that an entity will recognize revenue to depict the transfer of goods or services to customers at an amount that the entity expects to be entitled to receiveare not short-term in exchange for those goods or services. The guidance permits the use of either a full retrospective or modified retrospective transition method.nature. The Company will adoptadopted this guidance on January 1, 2018,2019, using the modified retrospectiveoptional transition method applied to those contracts which are not completed as of that date. Upon adoption, we will recognizerecognizing any cumulative effect of adopting this guidance as an adjustment to ourthe opening balance of retained earnings. The cumulative impact of the adoption of the new standard was not material to the Company's consolidated financial statements. Prior periods willwere not be retrospectively adjusted. We have reviewed existing contractsIn addition, the Company elected a package of practical expedients permitted under transition guidance for the new standard which, among other things, allowed for the carryforward of historical lease classification. The Company has lease agreements with customerslease and will continue to review new contracts with certain customers (primarily those related to project-driven products) within our Offshore/Manufactured Products segmentnon-lease components, which are generally accounted for as a single lease component. Most of the Company's leases do not provide an implicit interest rate. Therefore, the Company's incremental borrowing rate, based on available information at the lease commencement date, is used to determine the impact, if any,present value of lease payments.
In connection with the adoption of the new standard, on such contractsthe Company recorded $47.7 million of operating lease assets and onliabilities as of January 1, 2019. The standard did not materially impact our consolidated financial statements through the datestatement of adoption. In accordance with the guidance, we expect to expand our revenue recognition disclosures in 2018 to address the new qualitativeoperations and quantitative requirements.had no impact on cash flows. As of September 30, 2019, net operating lease assets and liabilities totaled $45.5 million and $45.8 million, respectively.
OIL STATES INTERNATIONAL, INC. AND SUBSIDIARIES
NOTES TO UNAUDITED CONDENSED CONSOLIDATED
FINANCIAL STATEMENTS
(Continued)
In February 2016, the FASB issued guidance on leases which introduces the recognition of lease assets and lease liabilities by lessees for all leases which are not short-term in nature. The new standard requires a modified retrospective transition for capital or operating leases existing at or entered into after the beginning of the earliest comparative period presented in the financial statements. The Company will adopt this guidance on January 1, 2019. Upon initial evaluation, we believe the key change upon adoption will be the balance sheet recognition of our operating leases when we are the lessee. The income statement recognition appears similar to our current methodology. The Company’s future obligations under operating leases as of December 31, 2016 are summarized in Note 14, “Commitments and Contingencies,” in our 2016 Form 10‑K.
In March 2016, the FASB issued guidance on employee share-based payment accounting which modifies existing guidance related to the accounting for forfeitures, employer tax withholding on stock-based compensation and the financial statement presentation of excess tax benefits or deficiencies. The Company adopted this guidance on January 1, 2017. Adoption of this standard had no retrospective impact on the Company’s financial statements and the impact on the Company’s income tax benefit during the first nine months of 2017 was not material.
In January 2017, the FASB issued guidance which simplifies the test of goodwill impairment. Under the revised standard, the Company will no longer be required to determine the implied fair value of goodwill by assigning the fair value of a reporting unit to its individual assets and liabilities as if that reporting unit had been acquired in a business combination. The revised guidance requires a prospective transition and permits early adoption for interim and annual goodwill impairment tests performed after January 1, 2017. The Company adopted this standard effective January 1, 2017.
In January 2017, the FASB issued guidance clarifying the definition of a business to assist entities with evaluating when a group of transferred assets and activities is a business in connection with a business combination. The revised standard provides that if substantially all of the fair value of the gross assets acquired is concentrated in a single identifiable asset or a set of similar identifiable assets, the group of transferred assets and activities is not a business. The Company adopted this standard effective January 1, 2017.
| |
| 3. | Details of Selected Balance Sheet AccountsBusiness Acquisitions |
GEODynamics Acquisition
AdditionalOn January 12, 2018, the Company acquired GEODynamics, Inc. ("GEODynamics"), which provides oil and gas perforation systems and downhole tools in support of completion, intervention, wireline and well abandonment operations (the "GEODynamics Acquisition"). Total recorded purchase price consideration was $615.3 million, consisting of (i) $295.4 million in cash (net of cash acquired), which was funded through borrowings under the Company's Revolving Credit Facility (as defined in Note 6, "Long-term Debt"), (ii) approximately 8.66 million shares of the Company's common stock (having a market value of approximately $295 million based on the share price of $34.05 as of the acquisition closing date) and (iii) an unsecured $25 million promissory note that bears interest at 2.5% per annum. Under the terms of the purchase agreement, the Company is entitled to indemnification in respect of certain matters occurring prior to the acquisition and payments due under the promissory note are subject to set-off, in part or in full, in respect of such indemnified matters. See Note 14, "Commitments and Contingencies."
GEODynamics' results of operations have been included in the Company's financial statements subsequent to the closing of the acquisition on January 12, 2018. The acquired GEODynamics operations are reported as the Downhole Technologies segment. See Note 13, "Segments and Related Information" for further information regarding selected balance sheet accounts atwith respect to the Downhole Technologies segment operations.
Falcon Acquisition
On February 28, 2018, the Company acquired Falcon Flowback Services, LLC ("Falcon"), a full service provider of flowback and well testing services for the separation and recovery of fluids, solid debris and proppant used during hydraulic fracturing operations. Falcon provides additional scale and diversity to our Completion Services well testing operations in key shale plays in the United States. The purchase price was $84.2 million (net of cash acquired). The Falcon acquisition was funded by borrowings under the Company's Revolving Credit Facility. Under the terms of the purchase agreement, the Company is entitled to indemnification in respect of certain matters occurring prior to the acquisition. Falcon's results of operations have been included in the Company's financial statements and have been reported within the Completion Services business subsequent to the closing of the acquisition on February 28, 2018.
Transaction-Related Costs
During the first quarter of 2018, the Company expensed transaction-related costs of $2.6 million, which are included in selling, general and administrative expense and in other operating income, net for the nine months ended September 30, 20172018.
Supplemental Unaudited Pro Forma Financial Information
The following supplemental unaudited pro forma results of operations data for the nine months ended September 30, 2018 gives pro forma effect to the consummation of the GEODynamics and December 31, 2016Falcon acquisitions as if they had occurred on January 1, 2018. The supplemental unaudited pro forma financial information was prepared based on historical financial information, adjusted to give pro forma effect to fair value adjustments on depreciation and amortization expense, interest expense, and related tax effects, among others. The pro forma results for the nine months ended September 30, 2018 also reflect adjustments to exclude the after-tax impact of transaction costs totaling $2.0 million. The supplemental unaudited pro forma financial information may not reflect what the results of the combined operations would have been had the acquisitions occurred on January 1, 2018. As such, it is presented belowfor informational purposes only (in thousands):thousands, except per share amount).
|
| | | |
| | Nine Months Ended
September 30, 2018 |
| Revenue | $ | 840,639 |
|
| Net loss | $ | (2,269 | ) |
| Diluted net loss per share | $ | (0.04 | ) |
| Diluted weighted average common shares outstanding | 59,132 |
|
|
| | | | | | | |
| | September 30,
2017 | | December 31,
2016 |
| Accounts receivable, net: | | | |
| Trade | $ | 148,981 |
| | $ | 173,087 |
|
| Unbilled revenue | 63,585 |
| | 64,564 |
|
| Other | 5,304 |
| | 5,372 |
|
| Total accounts receivable | 217,870 |
| | 243,023 |
|
| Allowance for doubtful accounts | (7,652 | ) | | (8,510 | ) |
| | $ | 210,218 |
| | $ | 234,513 |
|
|
| | | | | | | |
| | September 30,
2017 | | December 31,
2016 |
| Inventories, net: | | | |
| Finished goods and purchased products | $ | 86,553 |
| | $ | 87,241 |
|
| Work in process | 33,865 |
| | 30,584 |
|
| Raw materials | 68,713 |
| | 72,514 |
|
| Total inventories | 189,131 |
| | 190,339 |
|
| Allowance for excess or obsolete inventory | (15,684 | ) | | (14,849 | ) |
| | $ | 173,447 |
| | $ | 175,490 |
|
OIL STATES INTERNATIONAL, INC. AND SUBSIDIARIES
NOTES TO UNAUDITED CONDENSED CONSOLIDATED
FINANCIAL STATEMENTS
(Continued)
| |
| 4. | Details of Selected Balance Sheet Accounts |
Additional information regarding selected balance sheet accounts at September 30, 2019 and December 31, 2018 is presented below (in thousands):
|
| | | | | | | |
| | September 30,
2019 | | December 31,
2018 |
| Accounts receivable, net: | | | |
| Trade | $ | 206,574 |
| | $ | 227,052 |
|
| Unbilled revenue | 36,856 |
| | 35,674 |
|
| Contract assets | 16,364 |
| | 21,201 |
|
| Other | 3,564 |
| | 6,381 |
|
| Total accounts receivable | 263,358 |
| | 290,308 |
|
| Allowance for doubtful accounts | (6,971 | ) | | (6,701 | ) |
| | $ | 256,387 |
| | $ | 283,607 |
|
|
| | | | | | | |
| | September 30,
2017 | | December 31,
2016 |
| Prepaid expenses and other current assets: | | | |
| Income taxes receivable (see Note 11) | $ | 17,695 |
| | $ | 430 |
|
| Prepayments to vendors | 2,826 |
| | 877 |
|
| Prepaid non-income taxes | 1,857 |
| | 1,650 |
|
| Prepaid insurance | 267 |
| | 3,738 |
|
| Other | 3,819 |
| | 4,479 |
|
| | $ | 26,464 |
| | $ | 11,174 |
|
|
| | | | | | | |
| | September 30,
2019 | | December 31,
2018 |
| Deferred revenue (contract liabilities) | $ | 25,888 |
| | $ | 14,160 |
|
For the nine months ended September 30, 2019, the $4.8 million net decrease in contract assets was primarily attributable to $19.8 million transferred to accounts receivable, which was partially offset by $15.2 million in revenue recognized during the period. Deferred revenue (contract liabilities) increased by $11.7 million in 2019, primarily reflecting $19.0 million in new customer billings which were not recognized as revenue during the period, partially offset by the recognition of $7.2 million of revenue that was deferred at the beginning of the period.
|
| | | | | | | |
| | September 30,
2019 | | December 31,
2018 |
| Inventories, net: | | | |
| Finished goods and purchased products | $ | 107,388 |
| | $ | 96,195 |
|
| Work in process | 23,218 |
| | 20,552 |
|
| Raw materials | 103,922 |
| | 111,197 |
|
| Total inventories | 234,528 |
| | 227,944 |
|
| Allowance for excess or obsolete inventory | (18,970 | ) | | (18,551 | ) |
| | $ | 215,558 |
| | $ | 209,393 |
|
|
| | | | | | | | | | | | | |
| | Estimated Useful Life (years) | | September 30,
2019 | | December 31,
2018 |
| Property, plant and equipment, net: | | | | | | | | | |
| Land | | $ | 36,802 |
| | $ | 37,545 |
|
| Buildings and leasehold improvements | 2 | | – | | 40 | | 261,772 |
| | 259,834 |
|
| Machinery and equipment | 1 | | – | | 28 | | 241,322 |
| | 483,629 |
|
| Completion Services equipment | 2 | | – | | 10 | | 509,340 |
| | 492,183 |
|
| Office furniture and equipment | 3 | | – | | 10 | | 44,665 |
| | 43,654 |
|
| Vehicles | 2 | | – | | 10 | | 104,053 |
| | 122,982 |
|
| Construction in progress | | 22,615 |
| | 29,451 |
|
| Total property, plant and equipment | | 1,220,569 |
| | 1,469,278 |
|
| Accumulated depreciation | | (749,586 | ) | | (928,851 | ) |
| | | | | | | | $ | 470,983 |
| | $ | 540,427 |
|
The Company's industry is highly cyclical, and this cyclicality impacts the determination of whether a decline in value of the Company's long-lived assets, including fixed assets, definite-lived intangible assets, and/or goodwill has occurred. The Company is required to periodically review the long-lived assets and goodwill of its reporting units for potential impairment in value if circumstances, some of which are beyond the Company's control, indicate that the carrying amounts will not be recoverable.
|
| | | | | | | | | | | | | |
| | Estimated Useful Life (years) | | September 30,
2017 | | December 31,
2016 |
| Property, plant and equipment, net: | | | | | | | | | |
| Land | | | | | | | $ | 36,310 |
| | $ | 31,683 |
|
| Buildings and leasehold improvements | 3 | | – | | 40 | | 231,824 |
| | 227,642 |
|
| Machinery and equipment | 2 | | – | | 28 | | 466,609 |
| | 455,873 |
|
| Completion services equipment | 2 | | – | | 10 | | 426,726 |
| | 429,845 |
|
| Office furniture and equipment | 3 | | – | | 10 | | 44,401 |
| | 42,827 |
|
| Vehicles | 2 | | – | | 10 | | 119,336 |
| | 121,317 |
|
| Construction in progress | | | | | | | 34,011 |
| | 27,519 |
|
| Total property, plant and equipment | | | | | | | 1,359,217 |
| | 1,336,706 |
|
| Accumulated depreciation | | | | | | | (850,474 | ) | | (783,304 | ) |
| | | | | | | | $ | 508,743 |
| | $ | 553,402 |
|
|
| | | | | | | |
| | September 30,
2017 | | December 31,
2016 |
| Other noncurrent assets: | | | |
| Deferred compensation plan | $ | 19,875 |
| | $ | 18,772 |
|
| Deferred income taxes | 418 |
| | 120 |
|
| Other | 5,304 |
| | 5,512 |
|
| | $ | 25,597 |
| | $ | 24,404 |
|
|
| | | | | | | |
| | September 30,
2017 | | December 31,
2016 |
| Accrued liabilities: | | | |
| Accrued compensation | $ | 22,540 |
| | $ | 23,131 |
|
| Insurance liabilities | 7,734 |
| | 8,099 |
|
| Accrued taxes, other than income taxes | 7,099 |
| | 2,461 |
|
| Accrued leasehold restoration liability | 831 |
| | 766 |
|
| Accrued product warranty reserves | 743 |
| | 1,113 |
|
| Accrued commissions | 1,514 |
| | 1,305 |
|
| Accrued claims | 1,288 |
| | 1,578 |
|
| Other | 5,883 |
| | 6,880 |
|
| | $ | 47,632 |
| | $ | 45,333 |
|
OIL STATES INTERNATIONAL, INC. AND SUBSIDIARIES
NOTES TO UNAUDITED CONDENSED CONSOLIDATED
FINANCIAL STATEMENTS
(Continued)
In this regard, the Company made the strategic decision to reduce the scope of its Drilling Services business unit (with plans to adjust from 34 rigs to 9 rigs) during the third quarter of 2019 due to the ongoing weakness in customer demand for vertical drilling rigs in the U.S. land market, particularly the Permian Basin. As a result of this decision, the carrying value of 25 rigs which will be decommissioned or sold was reduced to their estimated salvage value, resulting in the recognition of a $25.5 million non-cash impairment charge. Additionally, indicators of impairment were identified for the remaining rigs which the Company plans to continue operating. The Company performed a fair value assessment on the remaining drilling rigs and recognized an additional non-cash impairment charge of $8.2 million (a Level 3 fair value measurement). This fixed asset impairment charge was based in part on the estimated future cash flows that these assets are projected to generate (income approach), which included unobservable inputs that required significant judgments including projected day rates and costs, rig utilization and remaining economic useful life. The income approach was also weighted with a market approach, which included estimates of the selling price for each drilling rig, resulting in a fair value measurement of $4.9 million. These non-cash charges totaling $33.7 million are reported in the Drilling Services business and are separately presented in the consolidated statement of operations. In connection with this fixed asset impairment and as reflected in the preceding table, the cost basis of drilling rigs (included in machinery and equipment) and other fixed assets, along with related accumulated depreciation, were both reduced by a total of $257.8 million as of September 30, 2019.
|
| | | | | | | |
| | September 30,
2019 | | December 31,
2018 |
| Other noncurrent assets: | | | |
| Deferred compensation plan | $ | 22,784 |
| | $ | 20,468 |
|
| Deferred income taxes | 700 |
| | 761 |
|
| Other | 5,695 |
| | 5,815 |
|
| | $ | 29,179 |
| | $ | 27,044 |
|
|
| | | | | | | |
| | September 30,
2019 | | December 31,
2018 |
| Accrued liabilities: | | | |
| Accrued compensation | $ | 28,846 |
| | $ | 29,867 |
|
| Insurance liabilities | 9,992 |
| | 9,177 |
|
| Accrued taxes, other than income taxes | 9,148 |
| | 4,530 |
|
| Accrued commissions | 1,448 |
| | 1,484 |
|
| Other | 10,554 |
| | 15,672 |
|
| | $ | 59,988 |
| | $ | 60,730 |
|
|
| | | | | | | | | | | | | | | | | | | | | | | |
| Goodwill: | Well Site Services | | Downhole Technologies | | Offshore/
Manufactured Products | | Total |
| Completion Services | | Drilling Services | | Subtotal |
| Balance as of December 31, 2018 | | | | | | | | | | | |
| Goodwill | $ | 221,582 |
| | $ | 22,767 |
| | $ | 244,349 |
| | $ | 357,502 |
| | $ | 162,462 |
| | $ | 764,313 |
|
| Accumulated impairment losses | (94,528 | ) | | (22,767 | ) | | (117,295 | ) | | — |
| | — |
| | (117,295 | ) |
| | 127,054 |
| | — |
| | 127,054 |
| | 357,502 |
| | 162,462 |
| | 647,018 |
|
| Foreign currency translation | — |
| | — |
| | — |
| | — |
| | (274 | ) | | (274 | ) |
| Balance as of September 30, 2019 | $ | 127,054 |
| | $ | — |
| | $ | 127,054 |
| | $ | 357,502 |
| | $ | 162,188 |
| | $ | 646,744 |
|
OIL STATES INTERNATIONAL, INC. AND SUBSIDIARIES
NOTES TO UNAUDITED CONDENSED CONSOLIDATED
FINANCIAL STATEMENTS
(Continued)
|
| | | | | | | | | | | | | | | | | | | | | | | |
| Other Intangible Assets: | September 30, 2019 | | December 31, 2018 |
| | Gross Carrying Amount | | Accumulated Amortization | | Net Carrying Amount | | Gross Carrying Amount | | Accumulated Amortization | | Net Carrying Amount |
| Customer relationships | $ | 168,257 |
| | $ | 41,512 |
| | $ | 126,745 |
| | $ | 167,811 |
| | $ | 33,247 |
| | $ | 134,564 |
|
| Patents/Technology/Know-how | 85,487 |
| | 29,146 |
| | 56,341 |
| | 84,903 |
| | 23,418 |
| | 61,485 |
|
| Noncompete agreements | 17,082 |
| | 9,724 |
| | 7,358 |
| | 18,705 |
| | 7,544 |
| | 11,161 |
|
| Tradenames and other | 53,708 |
| | 7,993 |
| | 45,715 |
| | 53,708 |
| | 5,617 |
| | 48,091 |
|
| | $ | 324,534 |
| | $ | 88,375 |
| | $ | 236,159 |
| | $ | 325,127 |
| | $ | 69,826 |
| | $ | 255,301 |
|
For the three months ended September 30, 2019 and 2018, amortization expense was $6.8 million and $6.4 million, respectively. Amortization expense was $20.3 million and $18.4 million for the nine months ended September 30, 2019 and 2018, respectively.
The Company performed a qualitative assessment of definite-lived intangible assets and goodwill at September 30, 2019 and concluded that no further impairment evaluation was required. As a result, no additional impairments were recorded in the third quarter of 2019. Should, among other events and circumstances, global economic and industry conditions deteriorate, the outlook for future operating results and cash flow for any of the Company's reporting units decline, income tax rates increase or regulations change, costs of equity or debt capital increase, valuations for comparable public companies or comparable acquisition valuations decrease, or the Company's market capitalization experience a material, sustained decline below its book value, the Company may need to recognize additional impairment losses in future periods.
The table below provides a reconciliation of the numerators and denominators of basic and diluted net loss per share for the three and nine months ended September 30, 2019 and 2018 (in thousands, except per share amounts):
|
| | | | | | | | | | | | | | | |
| | Three Months Ended
September 30, | | Nine Months Ended
September 30, |
| | 2019 | | 2018 | | 2019 | | 2018 |
| Numerators: | | | | | | | |
| Net loss | $ | (31,868 | ) | | $ | (4,019 | ) | | $ | (56,256 | ) | | $ | (4,769 | ) |
| Less: Income attributable to unvested restricted stock awards | — |
| | — |
| | — |
| | — |
|
| Numerator for basic net loss per share | (31,868 | ) | | (4,019 | ) | | (56,256 | ) | | (4,769 | ) |
| Effect of dilutive securities: | | | | | | | |
| Unvested restricted stock awards | — |
| | — |
| | — |
| | — |
|
| Numerator for diluted net loss per share | $ | (31,868 | ) | | $ | (4,019 | ) | | $ | (56,256 | ) | | $ | (4,769 | ) |
| | | | | | | | |
| Denominators: | | | | | | | |
| Weighted average number of common shares outstanding | 60,493 |
| | 59,977 |
| | 60,400 |
| | 59,585 |
|
| Less: Weighted average number of unvested restricted stock awards outstanding | (1,070 | ) | | (951 | ) | | (1,038 | ) | | (979 | ) |
| Denominator for basic and diluted net loss per share | 59,423 |
| | 59,026 |
| | 59,362 |
| | 58,606 |
|
| | | | | | | | |
| Net loss per share: | | | | | | | |
| Basic | $ | (0.54 | ) | | $ | (0.07 | ) | | $ | (0.95 | ) | | $ | (0.08 | ) |
| Diluted | (0.54 | ) | | (0.07 | ) | | (0.95 | ) | | (0.08 | ) |
The calculation of diluted net loss per share for the three and nine months ended September 30, 2019 excluded 643 thousand shares and 665 thousand shares, respectively, issuable pursuant to outstanding stock options, due to their antidilutive effect. The calculation of diluted net loss per share for the three and nine months ended September 30, 2018 excluded 694 thousand shares and 696 thousand shares, respectively, issuable pursuant to outstanding stock options, due to their antidilutive effect. Additionally, shares issuable upon conversion of the 1.50% convertible senior notes were not convertible and therefore excluded for the three and nine months ended September 30, 2019 and 2018, due to their antidilutive effect.
OIL STATES INTERNATIONAL, INC. AND SUBSIDIARIES
NOTES TO UNAUDITED CONDENSED CONSOLIDATED
FINANCIAL STATEMENTS
(Continued)
As of September 30, 2019 and December 31, 2018, long-term debt consisted of the following (in thousands):
|
| | | | | | | |
| | September 30,
2019 | | December 31,
2018 |
Revolving credit facility(1) | $ | 63,436 |
| | $ | 134,096 |
|
1.50% convertible senior notes(2) | 171,645 |
| | 167,102 |
|
| Promissory note | 25,000 |
| | 25,000 |
|
| Other debt and finance lease obligations | 5,106 |
| | 5,540 |
|
| Total debt | 265,187 |
| | 331,738 |
|
| Less: Current portion | (25,591 | ) | | (25,561 | ) |
| Total long-term debt | $ | 239,596 |
| | $ | 306,177 |
|
____________________
| |
| (1) | Presented net of $1.6 million and $2.0 million of unamortized debt issuance costs as of September 30, 2019 and December 31, 2018, respectively. |
| |
| (2) | The outstanding principal amount of the 1.50% convertible senior notes was $199.0 million and $200.0 million as of September 30, 2019 and December 31, 2018, respectively. |
RevolvingCredit Facility
The Company's senior secured revolving credit facility, as amended (the "Revolving Credit Facility") is governed by a credit agreement with Wells Fargo Bank, N.A., as administrative agent for the lenders party thereto and collateral agent for the secured parties thereunder, and the lenders and other financial institutions from time to time party thereto, dated as of January 30, 2018, as amended and restated (the "Credit Agreement"), and matures on January 30, 2022. The Revolving Credit Facility provides for $350 million in lender commitments with an option to increase the maximum borrowings to $500 million subject to additional lender commitments prior to its maturity on January 30, 2022. Under the Revolving Credit Facility, $50 million is available for the issuance of letters of credit.
As of September 30, 2019, the Company had $65.0 million of borrowings outstanding under the Credit Agreement and $22.6 million of outstanding letters of credit, leaving $139.1 million available to be drawn. The total amount available to be drawn under our Revolving Credit Facility was less than the lender commitments as of September 30, 2019, due to limits imposed by maintenance covenants in the Credit Agreement.
Amounts outstanding under the Revolving Credit Facility bear interest at LIBOR plus a margin of 1.75% to 3.00%, or at a base rate plus a margin of 0.75% to 2.00%, in each case based on a ratio of the Company's total net funded debt to consolidated EBITDA (as defined in the Credit Agreement). The Company must also pay a quarterly commitment fee of 0.25% to 0.50%, based on the Company's ratio of total net funded debt to consolidated EBITDA, on the unused commitments under the Credit Agreement.
The Credit Agreement contains customary financial covenants and restrictions. Specifically, the Company must maintain an interest coverage ratio, defined as the ratio of consolidated EBITDA to consolidated interest expense, of at least 3.00 to 1.0, a maximum senior secured leverage ratio, defined as the ratio of senior secured debt to consolidated EBITDA, of no greater than 2.25 to 1.0 and a total net leverage ratio, defined as the ratio of total net funded debt to consolidated EBITDA, of no greater than 3.75 to 1.0. The financial covenants give pro forma effect to acquired businesses and the annualization of EBITDA for acquired businesses.
Each of the factors considered in the calculation of these ratios are defined in the Credit Agreement. Consolidated EBITDA and consolidated interest, as defined, exclude goodwill and fixed asset impairments, losses on extinguishment of debt, debt discount amortization, stock-based compensation expense and other non-cash charges.
Borrowings under the Credit Agreement are secured by a pledge of substantially all of the Company's assets and the assets of its domestic subsidiaries. The Company's obligations under the Credit Agreement are guaranteed by its significant domestic subsidiaries. The Credit Agreement also contains negative covenants that limit the Company's ability to borrow additional funds, encumber assets, pay dividends, sell assets and enter into other significant transactions.
Under the Credit Agreement, the occurrence of specified change of control events involving the Company would constitute an event of default that would permit the banks to, among other things, accelerate the maturity of the facility and cause it to become immediately due and payable in full.
OIL STATES INTERNATIONAL, INC. AND SUBSIDIARIES
NOTES TO UNAUDITED CONDENSED CONSOLIDATED
FINANCIAL STATEMENTS
(Continued)
As of September 30, 2019, the Company was in compliance with its debt covenants.
1.50% Convertible Senior Notes
On January 30, 2018, the Company issued $200 million aggregate principal amount of its 1.50% convertible senior notes due 2023 (the "Notes") pursuant to an indenture, dated as of January 30, 2018 (the "Indenture"), between the Company and Wells Fargo Bank, National Association, as trustee. Net proceeds from the Notes, after deducting issuance costs, were approximately $194 million, which were used by the Company to repay a portion of the outstanding borrowings under the Revolving Credit Facility during the first quarter of 2018.
During the third quarter of 2019, the Company repurchased $1.0 million in principal amount of the outstanding Notes for $0.9 million, which approximated the net carrying amount of the related liability.
The initial carrying amount of the Notes recorded in the consolidated balance sheet was less than the $200 million in principal amount of the Notes, in accordance with applicable accounting principles, reflective of the estimated fair value of a similar debt instrument that does not have a conversion feature. The Company recorded the value of the conversion feature as a debt discount, which is amortized as interest expense over the term of the Notes, with a similar amount allocated to additional paid-in capital. As a result of this amortization, the interest expense the Company recognizes related to the Notes for accounting purposes is based on an effective interest rate of approximately 6.0%, which is greater than the cash interest payments the Company is obligated to pay on the Notes. Recorded interest expense associated with the Notes for the three and nine months ended September 30, 2019 was $2.6 million and $7.7 million, respectively, while the related contractual cash interest expense totaled $0.8 million and $2.3 million, respectively. Recorded interest expense associated with the Notes for the three and nine months ended September 30, 2018 was $2.5 million and $6.6 million, respectively, while the related contractual cash interest expense totaled $0.8 million and $2.0 million, respectively.
The following table presents the carrying amount of the Notes in the consolidated balance sheets (in thousands):
|
| | | | | | | |
| | September 30,
2019 | | December 31,
2018 |
| Principal amount of the liability component | $ | 199,000 |
| | $ | 200,000 |
|
| Less: Unamortized discount | 23,919 |
| | 28,825 |
|
| Less: Unamortized issuance costs | 3,436 |
| | 4,073 |
|
| Net carrying amount of the liability | $ | 171,645 |
| | $ | 167,102 |
|
The Notes bear interest at a rate of 1.50% per year until maturity. Interest is payable semi-annually in arrears on February 15 and August 15 of each year, beginning on August 15, 2018. In addition, additional interest and special interest may accrue on the Notes under certain circumstances as described in the Indenture. The Notes will mature on February 15, 2023, unless earlier repurchased, redeemed or converted. The initial conversion rate is 22.2748 shares of the Company's common stock per $1,000 principal amount of Notes (equivalent to an initial conversion price of approximately $44.89 per share of common stock). The conversion rate, and thus the conversion price, may be adjusted under certain circumstances as described in the Indenture. The Company's intent is to repay the principal amount of the Notes in cash and the conversion feature, if payable, in shares of the Company's common stock.
Noteholders may convert their Notes, at their option, only in the following circumstances: (1) if the last reported sale price per share of the Company's common stock exceeds 130% of the conversion price for each of at least 20 trading days during the 30 consecutive trading days ending on, and including, the last trading day of the immediately preceding calendar quarter; (2) during the 5 consecutive business days immediately after any five consecutive trading day period (such 5 consecutive trading day period, the "measurement period") in which the trading price per $1,000 principal amount of the Notes for each trading day of the measurement period was less than 98% of the product of the last reported sale price per share of the Company's common stock on such trading day and the conversion rate on such trading day; (3) upon the occurrence of certain corporate events or distributions on the Company's common stock, as described in the Indenture; or (4) if the Company calls the Notes for redemption, or at any time from, and including, November 15, 2022 until the close of business on the second scheduled trading day immediately before the maturity date. The Company will settle conversions by paying or delivering, as applicable, cash, shares of common stock or a combination of cash and shares of common stock, at the Company's election, based on the applicable conversion rate(s). If the Company elects to deliver cash or a combination of cash and shares of common stock, then the consideration due upon conversion will be based on a defined observation period.
OIL STATES INTERNATIONAL, INC. AND SUBSIDIARIES
NOTES TO UNAUDITED CONDENSED CONSOLIDATED
FINANCIAL STATEMENTS
(Continued)
The Notes will be redeemable, in whole or in part, at the Company's option at any time, and from time to time, on or after February 15, 2021, at a cash redemption price equal to the principal amount of the Notes to be redeemed, plus accrued and unpaid interest, if any, to, but excluding, the redemption date, but only if the last reported sale price per share of common stock exceeds 130% of the conversion price on each of at least 20 trading days during the 30 consecutive trading days ending on, and including, the trading day immediately before the date the Company sends the related redemption notice.
If specified change in control events involving the Company as defined in the Indenture occur, then noteholders may require the Company to repurchase their Notes at a cash repurchase price equal to the principal amount of the Notes to be repurchased, plus accrued and unpaid interest. Additionally, the Notes contain certain events of default as set forth in the Indenture. As of September 30, 2019, none of the conditions allowing holders of the Notes to convert, or requiring the Company to repurchase the Notes, had been met.
Promissory Note
In connection with the GEODynamics Acquisition, the Company issued a $25.0 million promissory note that bears interest at 2.50% per annum and was scheduled to mature on July 12, 2019. Payments due under the promissory note are subject to set off, in part or in full, against certain indemnification claims related to matters occurring prior to the Company's acquisition of GEODynamics. As more fully described in Note 14, "Commitments and Contingencies," the Company has provided notice to and asserted an indemnification claim against the seller of GEODynamics. As a result, the maturity date of the note is extended until the resolution of the indemnity claim. The Company expects that the amount ultimately paid in respect of such note may be reduced as a result of this indemnification claim.
| |
| 7. | Fair Value Measurements |
The Company's financial instruments consist of cash and cash equivalents, investments, receivables, payables and debt instruments. The Company believes that the carrying values of these instruments, other than the Notes, on the accompanying consolidated balance sheets approximate their fair values. The estimated fair value of the Notes as of September 30, 2019 and December 31, 2018 was approximately $170 million and $166 million, respectively, based on quoted market prices (a Level 1 fair value measurement), which compares to the $199 million in principal amount of the Notes.
The Company leases a portion of its facilities, office space, equipment and vehicles. Leases with an initial term of 12 months or less are not recorded in the consolidated balance sheet as of September 30, 2019. Substantially all of the Company's future lease obligations are related to operating leases. Consistent with the Company's historical practice, finance (capital) lease obligations, which totaled $0.6 million as of September 30, 2019, are classified within long-term debt while related assets are included within property, plant and equipment.
Most of the Company's operating leases include one or more options to renew, with renewal terms that can extend the lease term from one to 20 years. The exercise of lease renewal options is at the Company's sole discretion. The depreciable life of lease-related assets and leasehold improvements are limited by the expected lease term. Certain operating lease agreements include rental payments adjusted periodically for inflation. The Company's operating lease agreements do not contain any material residual value guarantees or material restrictive covenants. While the Company rents or subleases certain real estate to third parties, such amounts are not material. Cash outflows related to operating leases are presented within cash flows from operations.
OIL STATES INTERNATIONAL, INC. AND SUBSIDIARIES
NOTES TO UNAUDITED CONDENSED CONSOLIDATED
FINANCIAL STATEMENTS
(Continued)
The following tables summarize the financial statement information regarding of the Company's operating leases for the three and nine months ended September 30, 2019 (in thousands):
|
| | | | | | | |
| | Three Months Ended
September 30, 2019 | | Nine Months Ended
September 30, 2019 |
| Operating lease expense components: | | | |
| Leases with initial term of greater than 12 months | $ | 3,032 |
| | $ | 9,006 |
|
| Leases with initial term of 12 months or less | 1,576 |
| | 4,228 |
|
| | $ | 4,608 |
| | $ | 13,234 |
|
| | | | |
| Operating lease assets obtained in exchange for operating lease liabilities: | | | |
| Upon adoption of standard (January 1, 2019) | | | $ | 47,721 |
|
| Subsequent to adoption of standard | | | 5,865 |
|
| Non-cash operating lease additions | | | $ | 53,586 |
|
The following table provides the maturities of operating lease liabilities as of September 30, 2019 (in thousands):
|
| | | |
| | Operating Leases |
| 2019 (less nine months ended September 30) | $ | 2,819 |
|
| 2020 | 10,060 |
|
| 2021 | 8,295 |
|
| 2022 | 6,177 |
|
| 2023 | 5,182 |
|
| After 2023 | 22,621 |
|
| Total lease payments | 55,154 |
|
| Less: Imputed interest | (9,367 | ) |
| Present value of operating lease liabilities | 45,787 |
|
| Less: Current portion | (8,557 | ) |
| Total long-term operating lease liabilities | $ | 37,230 |
|
| Weighted-average remaining lease term (years) | 7.5 |
|
| Weighted-average discount rate | 5.0 | % |
The following table provides details with respect to the changes to the number of shares of common stock, $0.01 par value, outstanding during the first nine months of 2019:
|
| | |
| Shares of common stock outstanding – December 31, 2018 | 59,969,695 |
|
| Restricted stock awards, net of forfeitures | 794,214 |
|
| Shares withheld for taxes on vesting of restricted stock awards and transferred to treasury | (210,023 | ) |
| Purchase of treasury stock | (50,800 | ) |
| Shares of common stock outstanding – September 30, 2019 | 60,503,086 |
|
As of September 30, 2019 and December 31, 2018, the Company had 25,000,000 shares of preferred stock, $0.01 par value, authorized, with 0 shares issued or outstanding.
On July 29, 2015, the Company's Board of Directors approved a share repurchase program providing for the repurchase of up to $150.0 million of the Company's common stock, which, following extensions, was scheduled to expire on July 29, 2019. On July 24, 2019, the Company's Board of Directors extended the share repurchase program for one year to July 29, 2020. During the first nine months of 2019, the Company repurchased approximately 51 thousand shares of common stock under the program. The amount remaining under the Company's share repurchase authorization as of September 30, 2019 was $119.8 million. Subject to applicable securities laws, such purchases will be at such times and in such amounts as the Company deems appropriate.
OIL STATES INTERNATIONAL, INC. AND SUBSIDIARIES
NOTES TO UNAUDITED CONDENSED CONSOLIDATED
FINANCIAL STATEMENTS
(Continued)
| |
| 10. | Accumulated Other Comprehensive Loss |
Accumulated other comprehensive loss, reported as a component of stockholders’stockholders' equity, decreasedincreased from $70.3$71.4 million at December 31, 20162018 to $56.8$76.9 million at September 30, 2017,2019, due to changes in currency exchange rates. Accumulated other comprehensive loss is primarily related to fluctuations in the currency exchange rates compared to the U.S. dollar which are used to translate certain of the international operations of our reportable segments. For the nine months ended September 30, 20172019 and 2016,2018, currency translation adjustments recognized as a component of other comprehensive income (loss)loss were primarily attributable to the United Kingdom and Brazil. As of September 30, 2017,2019, the exchange ratesrate for the British pound and the Brazilian real compared to the U.S. dollar strengthenedweakened by 8%4% and 3%7%, respectively, compared to the exchange ratesrate at December 31, 2016,2018, contributing to other comprehensive incomeloss of $13.5$5.5 million reported for the nine months ended September 30, 2017.2019. During the first nine months of 2016,2018, the exchange rates for the British pound and the Brazilian real weakened by 12%4% and 17%, respectively, compared to the U.S. dollar, while the Brazilian real strengthened by 22% compared to the U.S. dollar during the same period, contributing to other comprehensive loss of $12.5$11.2 million.
The table below provides a reconciliation of the numerators and denominators of basic and diluted net loss per share for the three and nine months ended September 30, 2017 and 2016 (in thousands, except per share amounts):
|
| | | | | | | | | | | | | | | |
| | Three Months Ended September 30, | | Nine Months Ended September 30, |
| | 2017 | | 2016 | | 2017 | | 2016 |
| Numerators: | | | | | | | |
| Net loss from continuing operations | $ | (15,031 | ) | | $ | (10,818 | ) | | $ | (46,955 | ) | | $ | (35,759 | ) |
| Less: Income attributable to unvested restricted stock awards | — |
| | — |
| | — |
| | — |
|
Numerator for basic net loss per share from continuing operations | (15,031 | ) | | (10,818 | ) | | (46,955 | ) | | (35,759 | ) |
| Net loss from discontinued operations, net of tax | — |
| | — |
| | — |
| | (4 | ) |
Numerator for basic net loss per share attributable to Oil States | (15,031 | ) | | (10,818 | ) | | (46,955 | ) | | (35,763 | ) |
| Effect of dilutive securities: | | | | | | | |
| Unvested restricted stock awards | — |
| | — |
| | — |
| | — |
|
Numerator for diluted net loss per share attributable to Oil States | $ | (15,031 | ) | | $ | (10,818 | ) | | $ | (46,955 | ) | | $ | (35,763 | ) |
| | | | | | | | |
| Denominators: | | | | | | | |
| Weighted average number of common shares outstanding | 51,089 |
| | 51,354 |
| | 51,310 |
| | 51,287 |
|
| Less: Weighted average number of unvested restricted stock awards outstanding | (1,111 | ) | | (1,132 | ) | | (1,120 | ) | | (1,129 | ) |
Denominator for basic net loss per share attributable to Oil States | 49,978 |
| | 50,222 |
| | 50,190 |
| | 50,158 |
|
| Effect of dilutive securities: | | | | | | | |
| Unvested restricted stock awards | — |
| | — |
| | — |
| | — |
|
| Assumed exercise of stock options | — |
| | — |
| | — |
| | — |
|
| | — |
| | — |
| | — |
| | — |
|
Denominator for diluted net loss per share attributable to Oil States | 49,978 |
| | 50,222 |
| | 50,190 |
| | 50,158 |
|
| | | | | | | | |
Basic net loss per share attributable to Oil States from: | | | | | | | |
| Continuing operations | $ | (0.30 | ) | | $ | (0.22 | ) | | $ | (0.94 | ) | | $ | (0.71 | ) |
| Discontinued operations | — |
| | — |
| | — |
| | — |
|
| Net loss | $ | (0.30 | ) | | $ | (0.22 | ) | | $ | (0.94 | ) | | $ | (0.71 | ) |
| | | | | | | | |
Diluted net loss per share attributable to Oil States from: | | | | | | | |
| Continuing operations | $ | (0.30 | ) | | $ | (0.22 | ) | | $ | (0.94 | ) | | $ | (0.71 | ) |
| Discontinued operations | — |
| | — |
| | — |
| | — |
|
| Net loss | $ | (0.30 | ) | | $ | (0.22 | ) | | $ | (0.94 | ) | | $ | (0.71 | ) |
OIL STATES INTERNATIONAL, INC. AND SUBSIDIARIES
NOTES TO UNAUDITED CONDENSED CONSOLIDATED
FINANCIAL STATEMENTS
(Continued)
The calculation of diluted net loss per share for the three and nine months ended September 30, 2017 excluded 701 thousand shares and 712 thousand shares, respectively, issuable pursuant to outstanding stock options and restricted stock awards, due to their antidilutive effect. The calculation of diluted net loss per share for the three and nine months ended September 30, 2016 excluded 745 thousand shares and 755 thousand shares, respectively, issuable pursuant to outstanding stock options and restricted stock awards, due to their antidilutive effect.
| |
6. | Business Acquisitions and Goodwill |
In January 2017, our Offshore/Manufactured Products segment acquired the intellectual property and assets of complementary product lines to our global crane manufacturing and service operations. The acquisition included adding active heave compensation technology and knuckle-boom crane designs to our existing portfolio.
In April 2017, our Offshore/Manufactured Products segment acquired assets and intellectual property that are complementary to our riser testing, inspection and repair service offerings. This complimentary technology allows the segment to provide automated inspection techniques either on board an offshore vessel or on the quayside, without the requirements to transport to a facility to remove the buoyancy materials.
Using cash on hand, consideration paid in connection with these transactions totaled $12.9 million, which was allocated to the net assets acquired, including intangibles and goodwill. While no material adjustments are anticipated, the Company’s allocations of purchase price are preliminary and subject to change primarily based on the final determination of the fair values of intangible assets acquired.
Changes in the carrying amount of goodwill for the nine month period ended September 30, 2017 were as follows (in thousands):
|
| | | | | | | | | | | | | | | | | | | |
| | Well Site Services | | | | |
| | Completion
Services | | Drilling
Services | | Subtotal | | Offshore /
Manufactured
Products | | Total |
| Balance as of December 31, 2016 | | | | | | | | | |
| Goodwill | $ | 199,278 |
| | $ | 22,767 |
| | $ | 222,045 |
| | $ | 158,619 |
| | $ | 380,664 |
|
| Accumulated impairment losses | (94,528 | ) | | (22,767 | ) | | (117,295 | ) | | — |
| | (117,295 | ) |
| | 104,750 |
| | — |
| | 104,750 |
| | 158,619 |
| | 263,369 |
|
| Goodwill acquired | — |
| | — |
| | — |
| | 4,698 |
| | 4,698 |
|
| Foreign currency translation | 353 |
| | — |
| | 353 |
| | 497 |
| | 850 |
|
| Balance as of September 30, 2017 | $ | 105,103 |
| | $ | — |
| | $ | 105,103 |
| | $ | 163,814 |
| | $ | 268,917 |
|
| | | | | | | | | | |
| Balance as of September 30, 2017 | | | | | | | | | |
| Goodwill | $ | 199,631 |
| | $ | 22,767 |
| | $ | 222,398 |
| | $ | 163,814 |
| | $ | 386,212 |
|
| Accumulated impairment losses | (94,528 | ) | | (22,767 | ) | | (117,295 | ) | | — |
| | (117,295 | ) |
| | $ | 105,103 |
| | $ | — |
| | $ | 105,103 |
| | $ | 163,814 |
| | $ | 268,917 |
|
OIL STATES INTERNATIONAL, INC. AND SUBSIDIARIES
NOTES TO UNAUDITED CONDENSED CONSOLIDATED
FINANCIAL STATEMENTS
(Continued)
As of September 30, 2017 and December 31, 2016, long-term debt consisted of the following (in thousands):
|
| | | | | | | |
| | September 30,
2017 | | December 31,
2016 |
Revolving credit facility(1) | $ | 14,260 |
| | $ | 40,230 |
|
| Capital lease obligations and other debt | 5,293 |
| | 5,696 |
|
| Total debt | 19,553 |
| | 45,926 |
|
| Less: Current portion | (492 | ) | | (538 | ) |
| Total long-term debt and capitalized leases | $ | 19,061 |
| | $ | 45,388 |
|
| |
(1) | Amounts presented are net of $1.4 million and $2.0 million, respectively, of unamortized debt issuance costs. |
RevolvingCredit Facility
The Company has a $600 million senior secured revolving credit facility (the “Revolving Credit Facility”) with an option to increase the maximum borrowings to $750 million subject to additional lender commitments prior to its maturity on May 28, 2019. As of September 30, 2017, we had $15.6 million outstanding under the Credit Agreement (as defined below) and an additional $21.6 million of outstanding letters of credit, leaving $146.5 million available to be drawn under the Revolving Credit Facility. As of September 30, 2017, amounts available to be drawn under the Revolving Credit Facility plus cash and cash equivalents totaled $212.4 million. The total amount available to be drawn was less than the lender commitments as of September 30, 2017, due to the maximum leverage ratio covenant in the Credit Agreement which serves to limit borrowings. We expect our availability to continue to be limited by the maximum leverage ratio covenant during the remainder of 2017 and into 2018 based upon our forecast of our trailing twelve-month EBITDA (as defined in the Credit Agreement and further discussed below).
The Revolving Credit Facility is governed by a Credit Agreement dated as of May 28, 2014, as amended, (the “Credit Agreement”) by and among the Company, the Lenders party thereto, Wells Fargo Bank, N.A., as administrative agent, the Swing Line Lender and an Issuing Bank, and Royal Bank of Canada, as Syndication agent, and Compass Bank, as Documentation agent. Amounts outstanding under the Revolving Credit Facility bear interest at LIBOR plus a margin of 1.50% to 2.50%, or at a base rate plus a margin of 0.50% to 1.50%, in each case based on a ratio of the Company’s total leverage to EBITDA. During the first nine months of 2017, our applicable margin over LIBOR was 1.50%. We must also pay a quarterly commitment fee, based on our leverage ratio, on the unused commitments under the Credit Agreement. The unused commitment fee was 0.375% during the first nine months of 2017. The Credit Agreement contains customary financial covenants and restrictions. Specifically, we must maintain an interest coverage ratio, defined as the ratio of consolidated EBITDA to consolidated interest expense, of at least 3.0 to 1.0 and a maximum leverage ratio, defined as the ratio of total debt to consolidated EBITDA, of no greater than 3.25 to 1.0. Each of the factors considered in the calculations of these ratios are defined in the Credit Agreement. EBITDA and consolidated interest, as defined, exclude goodwill impairments, losses on extinguishment of debt, debt discount amortization, and other non-cash charges. As of September 30, 2017, we were in compliance with our debt covenants.
Borrowings under the Credit Agreement are secured by a pledge of substantially all of our assets and the assets of our domestic subsidiaries. Our obligations under the Credit Agreement are guaranteed by our significant domestic subsidiaries. The Revolving Credit Facility also contains negative covenants that limit the Company's ability to borrow additional funds, encumber assets, pay dividends, sell assets and enter into other significant transactions.
Under the Credit Agreement, the occurrence of specified change of control events involving our Company would constitute an event of default that would permit the banks to, among other things, accelerate the maturity of the facility and cause it to become immediately due and payable in full.
| |
8. | Fair Value Measurements |
The Company’s financial instruments consist of cash and cash equivalents, investments, receivables, payables, bank debt and foreign currency forward contracts. The Company believes that the carrying values of these instruments on the accompanying consolidated balance sheets approximate their fair values.
OIL STATES INTERNATIONAL, INC. AND SUBSIDIARIES
NOTES TO UNAUDITED CONDENSED CONSOLIDATED
FINANCIAL STATEMENTS
(Continued)
| |
9. | Changes in Common Stock Outstanding |
|
| | |
Shares of common stock outstanding – December 31, 2016 | 51,374,361 |
|
Restricted stock awards, net of forfeitures | 425,386 |
|
Shares withheld for taxes on vesting of restricted stock awards and transferred to treasury | (148,536 | ) |
Purchase of treasury stock | (561,765 | ) |
Shares of common stock outstanding – September 30, 2017 | 51,089,446 |
|
On July 29, 2015, the Company’s Board of Directors approved a new share repurchase program providing for the repurchase of up to $150.0 million of the Company’s common stock, which, following extension, was scheduled to expire on July 29, 2017. On July 26, 2017, our Board of Directors extended the share repurchase program for one year to July 29, 2018. During the first nine months of 2017, the Company repurchased 562 thousand shares of common stock under the program at a total cost of $16.3 million. The amount remaining under our share repurchase authorization as of September 30, 2017 was $120.5 million. Subject to applicable securities laws, such purchases will be at such times and in such amounts as the Company deems appropriate.
| |
10. | Stock-basedLong-Term Incentive Compensation |
The following table presents a summary of activity for stock options, service-based restricted stock awards and performance-based stock unit awards for the nine months ended September 30, 2017.
2019.
|
| | | | | | | | | | | |
| | Stock Options | | Service-based Restricted Stock | | Performance-based Stock Units |
| Outstanding – December 31, 2018 | 681,894 |
| | 929,554 |
| | 227,124 |
|
| Granted | — |
| | 701,671 |
| | 76,793 |
|
| Vested/Exercised | — |
| | (551,296 | ) | | (105,988 | ) |
| Forfeited | (46,381 | ) | | (13,445 | ) | | — |
|
| Outstanding – September 30, 2019 | 635,513 |
| | 1,066,484 |
| | 197,929 |
|
| Weighted average grant date fair value (2019 awards) | $ | — |
| | $ | 17.64 |
| | $ | 17.58 |
|
|
| | | | | | | | | | | |
| | Stock Options | | Service-based
Restricted Stock | | Performance-based
Stock Units |
| Outstanding at December 31, 2016 | 715,095 |
| | 1,140,489 |
| | 157,925 |
|
| Granted | — |
| | 475,432 |
| | 74,758 |
|
| Restricted stock awards vested | — |
| | (466,304 | ) | | — |
|
| Forfeited | (21,818 | ) | | (50,046 | ) | | — |
|
| Outstanding at September 30, 2017 | 693,277 |
| | 1,099,571 |
| | 232,683 |
|
| Weighted average grant date fair value (2017 awards) | $ | — |
| | $ | 39.50 |
| | $ | 62.66 |
|
The restricted stock program consists of a combination of service-based restricted stock and performance-based stock units. The service-basedService-based restricted stock awards generally vest on a straight-line basis over their term, which is generally three to four years. ThePerformance-based restricted stock awards generally vest at the end of a three-year period, with the number of performance-based restricted shares ultimately issued under the program is dependent upon our achievement of a predefined specific performance measures generally measured over a three-year period. measures.
In the event the predefined targets are exceeded for any performance-based award, additional shares up to a maximum of 200% of the target award may be granted. Conversely, if actual performance falls below the predefined target, the number of shares vested is reduced. If the actual performance falls below the threshold performance level, no restricted shares will vest. The performance measure for theawards issued in 2017 and 2016 awards is relative total stockholder return compared to oura peer group of companies. The performance measures for performance-based stock units granted during 2018 and 2019 are based on the Company's EBITDA growth rate over a three-year period.
During the first quarters of 2019 and 2018, the Company issued conditional long-term cash incentive awards ("Cash Awards") of approximately $1.3 million each year, with the ultimate dollar amount to be awarded ranging from 0 to a maximum of $2.7 million for each Cash Award. The performance measure for these Cash Awards is relative total stockholder return compared to a peer group of companies whilemeasured over a three-year period. The ultimate dollar amount to be awarded for the 2019 Cash Awards is limited to their targeted award value ($1.3 million) if the Company's total stockholder return is negative over the performance measure specified forperiod. The obligation related to the 2015 awards was average after-tax return on invested capital. Currently, itCash Awards is unlikely thatclassified as a liability and recognized over the 2015 performance measure threshold will be met which would result in a performance award forfeiture of approximately 80 thousand units in the fourth quarter of 2017.
vesting period.
Stock-based compensation pre-tax expense recognized in the three-month periodsthree and nine months ended September 30, 2017 and 20162019 totaled $6.1$4.2 million and $5.4$12.8 million, respectively. Stock-based compensation pre-tax expense recognized in the three and nine month periodsmonths ended September 30, 2017 and 20162018 totaled $17.1$5.7 million and $15.9$16.6 million, respectively. As of September 30, 2017,2019, there was $33.7$18.6 million of pre-tax compensation costs related to service-based and performance-based stock awards, and unvested stock options, which will be recognized in future periods as vesting conditions are satisfied.
OIL STATES INTERNATIONAL, INC. AND SUBSIDIARIES
NOTES TO UNAUDITED CONDENSED CONSOLIDATED
FINANCIAL STATEMENTS
(Continued)
The income tax provisionbenefit for interimthe three and nine month periods is based on estimatesended September 30, 2019 was calculated using a discrete approach. This methodology was used because minor changes in the Company's results of operations and non-deductible expenses can materially impact the estimated annual effective tax rate forrate. For the entire fiscal year. The Company’sthree months ended September 30, 2019, the Company's income tax provisionbenefit was $6.2 million, or 16.3% of pre-tax losses. For the nine months ended September 30, 2019, the Company's income tax benefit was $6.7 million, or 10.7% of pre-tax losses. This compares to an income tax benefit of $3.8 million, or 48.8% of pre-tax losses, and an income tax benefit of $3.3 million, or 41.1% of pre-tax losses, for the three and nine months ended September 30, 2017 was an income2018, respectively. The effective tax rate benefit of $4.0 million, or 21.1% of pre-tax losses, and $15.7 million, or 25.1% of pre-tax losses, respectively. This compares to an income tax benefit of $6.0 million, or 35.8% of pre-tax losses, and $20.5 million, or 36.4% of pre-tax losses, respectively, for the three and nine months ended September 30, 2016. The lower effective tax2019 was below the U.S. statutory rate benefit in the first nine months of 2017 was primarily attributabledue to a shift in the mix between domestic pre-tax losses and foreign pre-tax income compared to the prior-year period, additional valuation allowances provided against net operating losses in certain domestic and foreign jurisdictions, and incremental tax expense related to our decision to carryback certain U.S. net operating losses discussed below.
During the third quarter of 2017, the Company decided to carryback 2016 and 2017 U.S. net operating losses to prior years. The Company plans to file carryback claims against prior year U.S. federal income tax returns and has recorded related income taxes receivable totaling $16.6 million. Such amounts have been classified within prepaid expenses and other current assets as of September 30, 2017. The effect of the carryback will result in the loss of certain previously claimed tax deductions. As a result, the Company recorded a discrete tax charge of $1.0 million in the third quarter of 2017, thereby reducing the effective tax rate benefit.
The Company records a valuation allowance in each reporting period when management believes that it is more likely than not that any deferred tax asset will not be realized. This assessment requires analysis of available positive and negative evidence, including losses incurred in recent years, reversals of temporary differences, forecasts of future income, assessment of future business assumptions and tax planning strategies. During 2016 and the first nine months of 2017, we recorded valuation allowances with respect to net operating loss carryforwards of certain of our domestic and foreign operations. Future increases in our valuation allowances are possible if our estimates and assumptions (particularly as they relate to our forecasts) are revised such that they reduce estimates of future taxable income during the carryforward period.
non-deductible expenses.
| |
12.13. | Segments and Related Information |
The Company operates through two3 reportable segments: Well Site Services, Downhole Technologies and Offshore/Manufactured Products. The Company’sCompany's reportable segments represent strategic business units that generally offer different products and services. They are managed separately because each business often requires different technologies and marketing strategies. AcquisitionsRecent acquisitions, except for the acquisition of GEODynamics in 2018, have been direct extensions to our business segments. Separate business lines within the Well Site Services segment have been disclosed to provide additional information for that segment.
Our Well Site Services segment provides a broad range of equipment and services that are used to drill for, establish and maintain the flow of oil and natural gas from a well throughout its life cycle. In this segment, our operations primarily include completion-focused equipment and services as well as land drilling services. Our Completion Services operations provide solutions to our customers using our completion tools and highly-trained personnel throughout our service offerings which include: wireline support, frac stacks, isolations tools, extended reach tools, ball launchers, well testing operations, thru tubing activity and sand control. Drilling Services provides land drilling services for shallow to medium depth wells in West Texas and the Rocky Mountain region of the United States.
Our Offshore/Manufactured Products segment designs, manufactures and markets capital equipment utilized on floating production systems, subsea pipeline infrastructure, and offshore drilling rigs and vessels, along with short-cycle and other products. Driven principally by longer-term customer investments for offshore oil and natural gas projects, “project-driven product” revenues include: flexible bearings, advanced connector systems, high-pressure riser systems, deepwater mooring systems, cranes, subsea pipeline products and blow-out preventer stack integration. “Short-cycle products” manufactured by the segment include: valves, elastomers and other specialty products generally used in the land-based drilling and completion markets. “Other products,” manufactured and offered by the segment, include a variety of products for use in industrial, military and other applications outside the oil and gas industry. The segment also offers a broad line of complementary, value-added services including: specialty welding, fabrication, cladding and machining services, offshore installation services, and inspection and repair services.
Financial information by business segment for the three and nine months ended September 30, 20172019 and 20162018 is summarized as followsin the following tables (in thousands).
|
| | | | | | | | | | | | | | | | | | | |
| | Revenues | | Depreciation and
amortization | | Operating income (loss) | | Capital
expenditures | | Total assets |
| Three months ended September 30, 2019 | | | | | | | | | |
| Well Site Services – | | | | | | | | | |
| Completion Services | $ | 103,966 |
| | $ | 17,024 |
| | $ | 1,719 |
| | $ | 6,088 |
| | $ | 496,684 |
|
Drilling Services(1) | 12,034 |
| | 3,164 |
| | (36,495 | ) | | 538 |
| | 21,464 |
|
| Total Well Site Services | 116,000 |
| | 20,188 |
| | (34,776 | ) | | 6,626 |
| | 518,148 |
|
| Downhole Technologies | 42,882 |
| | 5,309 |
| | 659 |
| | 4,045 |
| | 700,789 |
|
| Offshore/Manufactured Products | 104,815 |
| | 5,680 |
| | 11,139 |
| | 3,147 |
| | 673,947 |
|
| Corporate | — |
| | 189 |
| | (11,932 | ) | | 437 |
| | 41,080 |
|
| Total | $ | 263,697 |
| | $ | 31,366 |
| | $ | (34,910 | ) | | $ | 14,255 |
| | $ | 1,933,964 |
|
|
| | | | | | | | | | | | | | | | | | | |
| | Revenues | | Depreciation and
amortization | | Operating income (loss) | | Capital
expenditures | | Total assets |
| Three months ended September 30, 2018 | | | | | | | | | |
| Well Site Services – | | | | | | | | | |
| Completion Services | $ | 111,669 |
| | $ | 16,884 |
| | $ | (3,271 | ) | | $ | 17,915 |
| | $ | 540,203 |
|
| Drilling Services | 16,920 |
| | 3,479 |
| | (2,206 | ) | | 2,711 |
| | 68,444 |
|
| Total Well Site Services | 128,589 |
| | 20,363 |
| | (5,477 | ) | | 20,626 |
| | 608,647 |
|
| Downhole Technologies | 56,571 |
| | 4,582 |
| | 6,485 |
| | 8,727 |
| | 691,974 |
|
| Offshore/Manufactured Products | 89,434 |
| | 5,426 |
| | 7,069 |
| | 3,475 |
| | 703,203 |
|
| Corporate | — |
| | 215 |
| | (11,799 | ) | | 197 |
| | 40,972 |
|
| Total | $ | 274,594 |
| | $ | 30,586 |
| | $ | (3,722 | ) | | $ | 33,025 |
| | $ | 2,044,796 |
|
OIL STATES INTERNATIONAL, INC. AND SUBSIDIARIES
NOTES TO UNAUDITED CONDENSED CONSOLIDATED
FINANCIAL STATEMENTS
(Continued)
| | | | Revenues | | Depreciation and
amortization | | Operating (loss) income | | Equity in
losses of
unconsolidated
affiliates | | Capital
expenditures | | Total assets | Revenues | | Depreciation and
amortization | | Operating income (loss) | | Capital
expenditures | | Total assets |
| Three months ended September 30, 2017 | | | | | | | | | | | | |
| Nine months ended September 30, 2019 | | | | | | | | | | |
| Well Site Services – | | | | | | | | | | | | | | | | | | | | |
| Completion Services | $ | 61,015 |
| | $ | 15,679 |
| | $ | (9,933 | ) | | $ | — |
| | $ | 2,447 |
| | $ | 427,207 |
| $ | 307,928 |
| | $ | 51,558 |
| | $ | (2,282 | ) | | $ | 24,971 |
| | $ | 496,684 |
|
Drilling Services | 16,162 |
| | 4,454 |
| | (3,235 | ) | | — |
| | 1,693 |
| | 74,991 |
| 32,430 |
| | 9,729 |
| | (43,655 | ) | | 2,452 |
| | 21,464 |
|
| Total Well Site Services | 77,177 |
| | 20,133 |
| | (13,168 | ) | | — |
| | 4,140 |
| | 502,198 |
| 340,358 |
| | 61,287 |
| | (45,937 | ) | | 27,423 |
| | 518,148 |
|
| Downhole Technologies | | 143,912 |
| | 15,631 |
| | 3,251 |
| | 11,121 |
| | 700,789 |
|
| Offshore/Manufactured Products | 86,871 |
| | 6,404 |
| | 7,334 |
| | (33 | ) | | 2,846 |
| | 782,651 |
| 294,723 |
| | 17,240 |
| | 26,207 |
| | 6,413 |
| | 673,947 |
|
| Corporate | — |
| | 251 |
| | (12,349 | ) | | — |
| | 54 |
| | 44,506 |
| — |
| | 642 |
| | (35,666 | ) | | 875 |
| | 41,080 |
|
| Total | $ | 164,048 |
| | $ | 26,788 |
| | $ | (18,183 | ) | | $ | (33 | ) | | $ | 7,040 |
| | $ | 1,329,355 |
| $ | 778,993 |
| | $ | 94,800 |
| | $ | (52,145 | ) | | $ | 45,832 |
| | $ | 1,933,964 |
|
|
| | | | | | | | | | | | | | | | | | | |
| | Revenues | | Depreciation and
amortization | | Operating income (loss) | | Capital
expenditures | | Total assets |
| Nine months ended September 30, 2018 | | | | | | | | | |
| Well Site Services – | | | | | | | | | |
| Completion Services | $ | 302,877 |
| | $ | 49,082 |
| | $ | (6,538 | ) | | $ | 40,430 |
| | $ | 540,203 |
|
| Drilling Services | 51,235 |
| | 10,898 |
| | (7,474 | ) | | 5,737 |
| | 68,444 |
|
| Total Well Site Services | 354,112 |
| | 59,980 |
| | (14,012 | ) | | 46,167 |
| | 608,647 |
|
| Downhole Technologies | 161,626 |
| | 12,998 |
| | 26,139 |
| | 13,793 |
| | 691,974 |
|
| Offshore/Manufactured Products | 298,277 |
| | 17,026 |
| | 32,185 |
| | 10,606 |
| | 703,203 |
|
| Corporate | — |
| | 694 |
| | (40,248 | ) | | 720 |
| | 40,972 |
|
| Total | $ | 814,015 |
| | $ | 90,698 |
| | $ | 4,064 |
| | $ | 71,286 |
| | $ | 2,044,796 |
|
________________
| |
| (1) | Operating loss for the Drilling Services business includes a non-cash fixed asset impairment charge of $33.7 million. See Note 4, “Details of Selected Balance Sheet Accounts,” for further discussion. |
No customer individually accounted for 10% of the Company's consolidated product and service revenue for the nine months ended September 30, 2019 or individually represented 10% of the Company's consolidated total accounts receivable as of September 30, 2019. One customer individually accounted for 10% of the Company's consolidated product and service revenue for the nine months ended September 30, 2018 and individually represented 11% of the Company's consolidated total accounts receivable as of December 31, 2018.
The following table provides supplemental disaggregated revenue from contracts with customers by business segment for the three and nine months ended September 30, 2019 and 2018 (in thousands):
|
| | | | | | | | | | | | | | | | | | | | | | | |
| | Revenues | | Depreciation and
amortization | | Operating (loss) income | | Equity in
losses of
unconsolidated
affiliates | | Capital
expenditures | | Total assets |
| Three months ended September 30, 2016 | | | | | | | | | | | |
| Well Site Services – | | | | | | | | | | | |
| Completion Services | $ | 38,975 |
| | $ | 17,230 |
| | $ | (20,450 | ) | | $ | — |
| | $ | 2,365 |
| | $ | 475,139 |
|
| Drilling Services | 7,375 |
| | 5,629 |
| | (5,641 | ) | | — |
| | 249 |
| | 82,683 |
|
| Total Well Site Services | 46,350 |
| | 22,859 |
| | (26,091 | ) | | — |
| | 2,614 |
| | 557,822 |
|
| Offshore/Manufactured Products | 132,656 |
| | 6,712 |
| | 22,867 |
| | (77 | ) | | 2,502 |
| | 851,819 |
|
| Corporate | — |
| | 277 |
| | (12,402 | ) | | — |
| | 379 |
| | 25,486 |
|
| Total | $ | 179,006 |
| | $ | 29,848 |
| | $ | (15,626 | ) | | $ | (77 | ) | | $ | 5,495 |
| | $ | 1,435,127 |
|
|
| | | | | | | | | | | | | | | | | | | | | | | | | | | | | | | |
| | Well Site Services | | Downhole Technologies | | Offshore/Manufactured Products | | Total |
| | 2019 | | 2018 | | 2019 | | 2018 | | 2019 | | 2018 | | 2019 | | 2018 |
| Three months ended September 30 | | | | | | | | | | | | | | | |
| Major revenue categories - | | | | | | | | | | | | | | | |
| Project-driven products | $ | — |
| | $ | — |
| | $ | — |
| | $ | — |
| | $ | 39,474 |
| | $ | 22,277 |
| | $ | 39,474 |
| | $ | 22,277 |
|
| Short-cycle: | | | | | | | | | | | | | | | |
| Completion products and services | 103,966 |
| | 111,669 |
| | 42,882 |
| | 56,571 |
| | 26,710 |
| | 27,463 |
| | 173,558 |
| | 195,703 |
|
| Drilling services | 12,034 |
| | 16,920 |
| | — |
| | — |
| | — |
| | — |
| | 12,034 |
| | 16,920 |
|
| Other products | — |
| | — |
| | — |
| | — |
| | 7,988 |
| | 6,707 |
| | 7,988 |
| | 6,707 |
|
| Total short-cycle | 116,000 |
| | 128,589 |
| | 42,882 |
| | 56,571 |
| | 34,698 |
| | 34,170 |
| | 193,580 |
| | 219,330 |
|
| Other products and services | — |
| | — |
| | — |
| | — |
| | 30,643 |
| | 32,987 |
| | 30,643 |
| | 32,987 |
|
| | $ | 116,000 |
| | $ | 128,589 |
| | $ | 42,882 |
| | $ | 56,571 |
| | $ | 104,815 |
| | $ | 89,434 |
| | $ | 263,697 |
| | $ | 274,594 |
|
|
| | | | | | | | | | | | | | | | | | | | | | | |
| | Revenues | | Depreciation and
amortization | | Operating (loss) income | | Equity in
losses of
unconsolidated
affiliates | | Capital
expenditures | | Total assets |
| Nine months ended September 30, 2017 | | | | | | | | | | | |
| Well Site Services – | | | | | | | | | | | |
| Completion Services | $ | 167,577 |
| | $ | 48,400 |
| | $ | (38,960 | ) | | $ | — |
| | $ | 8,560 |
| | $ | 427,207 |
|
| Drilling Services | 39,120 |
| | 14,283 |
| | (11,239 | ) | | — |
| | 2,800 |
| | 74,991 |
|
| Total Well Site Services | 206,697 |
| | 62,683 |
| | (50,199 | ) | | — |
| | 11,360 |
| | 502,198 |
|
| Offshore/Manufactured Products | 280,220 |
| | 19,091 |
| | 27,460 |
| | (62 | ) | | 8,775 |
| | 782,651 |
|
| Corporate | — |
| | 778 |
| | (37,274 | ) | | — |
| | 196 |
| | 44,506 |
|
| Total | $ | 486,917 |
| | $ | 82,552 |
| | $ | (60,013 | ) | | $ | (62 | ) | | $ | 20,331 |
| | $ | 1,329,355 |
|
|
| | | | | | | | | | | | | | | | | | | | | | | |
| Percentage of total revenue by type - | | | | | | | | | | | | | | | |
| Products | — | % | | — | % | | 98 | % | | 98 | % | | 77 | % | | 73 | % | | 46 | % | | 44 | % |
| Services | 100 | % | | 100 | % | | 2 | % | | 2 | % | | 23 | % | | 27 | % | | 54 | % | | 56 | % |
|
| | | | | | | | | | | | | | | | | | | | | | | |
| | Revenues | | Depreciation and
amortization | | Operating (loss) income | | Equity in
losses of
unconsolidated
affiliates | | Capital
expenditures | | Total assets |
| Nine months ended September 30, 2016 | | | | | | | | | | | |
| Well Site Services – | | | | | | | | | | | |
| Completion Services | $ | 116,748 |
| | $ | 52,789 |
| | $ | (66,251 | ) | | $ | — |
| | $ | 9,032 |
| | $ | 475,139 |
|
| Drilling Services | 14,016 |
| | 18,053 |
| | (19,697 | ) | | — |
| | 748 |
| | 82,683 |
|
| Total Well Site Services | 130,764 |
| | 70,842 |
| | (85,948 | ) | | — |
| | 9,780 |
| | 557,822 |
|
| Offshore/Manufactured Products | 393,746 |
| | 17,977 |
| | 67,854 |
| | (196 | ) | | 13,476 |
| | 851,819 |
|
| Corporate | — |
| | 847 |
| | (34,798 | ) | | — |
| | 637 |
| | 25,486 |
|
| Total | $ | 524,510 |
| | $ | 89,666 |
| | $ | (52,892 | ) | | $ | (196 | ) | | $ | 23,893 |
| | $ | 1,435,127 |
|
OIL STATES INTERNATIONAL, INC. AND SUBSIDIARIES
NOTES TO UNAUDITED CONDENSED CONSOLIDATED
FINANCIAL STATEMENTS
(Continued)
|
| | | | | | | | | | | | | | | | | | | | | | | | | | | | | | | |
| | Well Site Services | | Downhole Technologies | | Offshore/Manufactured Products | | Total |
| | 2019 | | 2018 | | 2019 | | 2018 | | 2019 | | 2018 | | 2019 | | 2018 |
| Nine months ended September 30 | | | | | | | | | | | | | | | |
| Major revenue categories - | | | | | | | | | | | | | | | |
| Project-driven products | $ | — |
| | $ | — |
| | $ | — |
| | $ | — |
| | $ | 105,236 |
| | $ | 98,301 |
| | $ | 105,236 |
| | $ | 98,301 |
|
| Short-cycle: | | | | | | | | | | | | | | | |
| Completion products and services | 307,928 |
| | 302,877 |
| | 143,912 |
| | 161,626 |
| | 80,250 |
| | 90,218 |
| | 532,090 |
| | 554,721 |
|
| Drilling services | 32,430 |
| | 51,235 |
| | — |
| | — |
| | — |
| | — |
| | 32,430 |
| | 51,235 |
|
| Other products | — |
| | — |
| | — |
| | — |
| | 21,472 |
| | 21,718 |
| | 21,472 |
| | 21,718 |
|
| Total short-cycle | 340,358 |
| | 354,112 |
| | 143,912 |
| | 161,626 |
| | 101,722 |
| | 111,936 |
| | 585,992 |
| | 627,674 |
|
| Other products and services | — |
| | — |
| | — |
| | — |
| | 87,765 |
| | 88,040 |
| | 87,765 |
| | 88,040 |
|
| | $ | 340,358 |
| | $ | 354,112 |
| | $ | 143,912 |
| | $ | 161,626 |
| | $ | 294,723 |
| | $ | 298,277 |
| | $ | 778,993 |
| | $ | 814,015 |
|
The Company has one customer whose revenue individually represented 16% |
| | | | | | | | | | | | | | | | | | | | | | | |
| Percentage of total revenue by type - | | | | | | | | | | | | | | | |
| Products | — | % | | — | % | | 97 | % | | 98 | % | | 76 | % | | 76 | % | | 47 | % | | 47 | % |
| Services | 100 | % | | 100 | % | | 3 | % | | 2 | % | | 24 | % | | 24 | % | | 53 | % | | 53 | % |
Revenues from products and 15%services transferred to customers over time accounted for approximately 67% and 69% of the Company’s consolidated product and service revenuerevenues for the three and nine months ended September 30, 2017, respectively,2019 and whose receivables individually represented 12%2018, respectively. The balance of revenues for the Company’s consolidated total accounts receivable asrespective periods relates to products and services transferred to customers at a point in time. As of September 30, 2017.
The following table provides supplemental2019, the Company had $174 million of remaining backlog related to contracts with an original expected duration of greater than one year. Approximately 13% of this remaining backlog is expected to be recognized as revenue information forover the Offshore/Manufactured Products segment forremaining three months of 2019, with an additional 55% in 2020 and the three and nine months ended September 30, 2017 and 2016 (in thousands):
|
| | | | | | | | | | | | | | | |
| | Three Months Ended September 30, | | Nine Months Ended September 30, |
| | 2017 | | 2016 | | 2017 | | 2016 |
| Project-driven products | $ | 22,698 |
| | $ | 76,541 |
| | $ | 89,615 |
| | $ | 234,440 |
|
| Short-cycle products | 37,781 |
| | 23,766 |
| | 110,872 |
| | 63,033 |
|
| Other products and services | 26,392 |
| | 32,349 |
| | 79,733 |
| | 96,273 |
|
| | $ | 86,871 |
| | $ | 132,656 |
| | $ | 280,220 |
| | $ | 393,746 |
|
balance thereafter.
| |
13.14. | Commitments and Contingencies |
Following the Company's acquisition of GEODynamics in January 2018, the Company determined that certain steel products historically imported by GEODynamics from China for use in its manufacturing process may potentially be subject to anti-dumping and countervailing duties based on clarifications/decisions rendered by the U.S. Department of Commerce and the U.S. Court of International Trade in March 2018. Following these findings, the Company commenced an internal review of this matter and ceased further purchases of these potentially affected Chinese products. As part of the Company's internal review, the Company engaged trade counsel and decided to voluntarily disclose this matter to U.S. Customs and Border Protection in September 2018. In connection with the GEODynamics Acquisition, the seller agreed to indemnify and hold the Company harmless against certain claims related to matters such as this, and the Company has provided notice to and asserted an indemnification claim against the seller. Additionally, the Company is able to set-off payments due under the $25.0 million promissory note (see Note 6, "Long-term Debt") issued to the seller of GEODynamics in respect of indemnification claims. Such note was scheduled to mature on July 12, 2019, but, because the Company has provided notice to and asserted an indemnification claim, the maturity date of the note is extended until the resolution of such claim. The Company expects that the amount ultimately paid in respect of such note may be reduced as a result of this indemnification claim.
InAdditionally, in the ordinary course of conducting ourits business, we become involved in litigation and other claims from private party actions, as well as judicial and administrative proceedings involving governmental authorities at the federal, state and local levels. Over recent years, a number of lawsuits were filed in Federal Court, against the Company and or one of its subsidiaries, by current and former employees alleging violations of the Fair Labor Standards Act (“FLSA”). The plaintiffs seek damages and penalties for the Company’s alleged failure to: properly classify its field service employees as “non-exempt” under the FLSA; and pay them on an hourly basis (including overtime). The plaintiffs are seeking recovery on their own behalf as well as on behalf of a class of similarly situated employees. Settlement of the class action against the Company was approved, and a judgment was entered November 19, 2015. The Company has settled the vast majority of these claims and is evaluating potential settlements for the remaining individual plaintiffs’ claims which are not expected to be significant.
We are amay become party to various pending or threatened claims, lawsuits and administrative proceedings seeking damages or other remedies concerning ourits commercial operations, products, employees and other matters, including occasional claims by individuals alleging exposure to hazardous materials as a result of ourthe Company's products or operations. Some of these claims relate to matters occurring prior to ourthe acquisition of businesses (including GEODynamics and Falcon), and some relate to businesses we havethe Company has sold. In certain cases, we arethe Company is entitled to indemnification from the sellers of businesses and, in other cases, we havethe Company has indemnified the buyers of businesses from us.businesses. Although wethe Company can give no assurance about the outcome of pending legal and administrative proceedings and the effect such outcomes may have on us, we believethe Company, management believes that any ultimate liability resulting from the outcome of such proceedings, to the extent not otherwise provided for or covered by indemnity or insurance, will not have a material adverse effect on ourthe Company's consolidated financial position, results of operations or liquidity.
| |
| 15. | Related Party Transactions |
GEODynamics historically leased certain land and facilities from an equity holder and employee of GEODynamics. In connection with the acquisition of GEODynamics, the Company assumed these leases. The Company exercised its option to purchase the most significant facilities and associated land for approximately $5.4 million in September 2018. Rent expense related to leases with this employee for the three and nine months ended September 30, 2019 totaled $44 thousand and $113 thousand, respectively. Rent expense related to leases with this employee for the three months ended September 30, 2018 and the period from January 12, 2018 through September 30, 2018 totaled $96 thousand and $316 thousand, respectively.
Additionally, in 2019 GEODynamics purchased products from and sold products to a company in which this employee is an investor. Purchases from this company were $0.4 million and $1.2 million for the three and nine months ended September 30, 2019, respectively. Sales to this company by GEODynamics were $0.4 million and $1.0 million for the three and nine months ended September 30, 2019, respectively.
Cautionary Statement Regarding Forward-Looking Statements
This Quarterly Report on Form 10-Q and other statements we make contain certain “forward-looking statements”"forward-looking statements" within the meaning of Section 27A of the Securities Act of 1933 (the “Securities Act”) and Section 21E of the Securities Exchange Act of 1934 (the “Exchange Act”"Exchange Act"). Actual results could differ materially from those projected in the forward-looking statements as a result of a number of important factors. For a discussion of known material factors that could affect our results, please refer to “Part"Part I, Item 1. Business,” “Part" "Part I, Item 1A. Risk Factors,” “Part" "Part II, Item 7. Management's Discussion and Analysis of Financial Condition and Results of Operations”Operations" and “Part"Part II, Item 7A. Quantitative and Qualitative Disclosures about Market Risk”Risk" included in our 20162018 Form 10-K filed with the Securities and Exchange Commission (the "Commission") on February 17, 201719, 2019 as well as “Part"Part II, Item 1A, Rick Factors”1A. Risk Factors" included in this Quarterly Report on Form 10-Q.
You can typically identify “forward-looking statements”"forward-looking statements" by the use of forward-looking words such as “may,” “will,” “could,” “project,” “believe,” “anticipate,” “expect,” “estimate,” “potential,” “plan,” “forecast,” “proposed,” “should,” “seek,”"may," "will," "could," "project," "believe," "anticipate," "expect," "estimate," "potential," "plan," "forecast," "proposed," "should," "seek," and other similar words. Such statements may relate to our future financial position, budgets, capital expenditures, projected costs, plans and objectives of management for future operations and possible future strategic transactions. Where any such forward-looking statement includes a statement of the assumptions or bases underlying such forward-looking statement, we caution that assumed facts or bases almost always vary from actual results. The differences between assumed facts or bases and actual results can be material, depending upon the circumstances.
In any forward-looking statement where we express an expectation or belief as to future results, such expectation or belief is expressed in good faith and believed to have a reasonable basis. However, there can be no assurance that the statement of expectation or belief will result or be achieved or accomplished. The following are important factors that could cause actual results to differ materially from those expressed in any forward-looking statement made by, or on behalf of, our Company:
the level of supply of and demand for oil and natural gas;
fluctuations in the current and future prices of oil and natural gas;
the cyclical nature of the oil and natural gas industry;
the level of exploration, drilling and completion activity;
the financial health of our customers;
the impact on certain major U.S. areas in which we operate of pipeline take away capacity constraints;
the availability of and access to attractive oil and natural gas field prospects by our customers, which may be affected by governmental actions or actions of other parties which may restrict drilling;drilling and completion activities;
the level of offshore oil and natural gas developmental activities;
general global economic conditions;
the ability of the Organization of Petroleum Exporting Countries ("OPEC") to set and maintain production levels and pricing;
global weather conditions and natural disasters;
changes in tax laws and regulations;
the impact of tariffs and duties on imported raw materials and exported finished goods;
impact of environmental matters, including future environmental regulations;or climate change regulations which may result in increased operating costs or reduced commodity demand globally;
our ability to find and retain skilled personnel;
negative outcome of litigation, threatened litigation or government proceeding;proceedings;
fluctuations in currency exchange rates;
physical, digital, cyber, internal and external security breaches;
the availability and cost of capital;
our ability to protect our intellectual property rights;
our ability to complete the integration of acquired businesses and achieve the expected accretion in earnings; and
the other factors identified in “Part"Part I, Item 1A. Risk Factors”Factors" in our 20162018 Form 10-K.
10-K and "Part II, Item 1A. Risk Factors" included in this Quarterly Report on Form 10-Q.
Should one or more of these risks or uncertainties materialize, or should the assumptions on which our forward-looking statements are based prove incorrect, actual results may differ materially from those expected, estimated or projected. In addition, the factors identified above may not necessarily be all of the important factors that could cause actual results to differ materially from those expressed in any forward-looking statement made by us, or on our behalf. Readers are cautioned not to place undue reliance on forward-looking statements, which speak only as of the date hereof. We undertake no responsibility to publicly release the result of any revision of our forward-looking statements after the date they are made.
In addition, in certain places in this Quarterly Report on Form 10-Q, we refer to reports published by third parties that purport to describe trends or developments in the energy industry. The Company does so for the convenience of our stockholders and in an effort to provide information available in the market that will assist the Company’sCompany's investors to have a better understanding of the market environment in which the Company operates. However, the Company specifically disclaims any responsibility for the accuracy and completeness of such information and undertakes no obligation to update such information.
ITEM 2.Management’sManagement's Discussion and Analysis of Financial Condition and Results of Operations
The following discussion and analysis should be read together with our condensed consolidated financial statements and the notes to those statements included elsewhere in this Quarterly Report on Form 10-Q10‑Q and our consolidated financial statements and notes to those statements included in our 20162018 Form 10-K.
During the first quarter of 2017, we modified the name of our “Offshore Products” segment10‑K in order to the “Offshore/Manufactured Products” segment given the higher proportional weighting of our shorter-cycle manufactured products (much ofunderstand factors, such as business acquisitions and financing transactions, which is driven by land-based activity) to the total revenues generated by the segment. The Company has also provided supplemental disclosure below, and in Note 12, “Segments and Related Information,” with respect to product and service revenues generated by the Offshore/Manufactured Products segment, including project-driven products, short-cycle products, and other products and services. There have been no operational, reporting or other material changes related to the Offshore/Manufactured Products segment.
Macroeconomic Environment
may impact comparability.
We provide a broad range of products and services to the oil and gas industry through our Offshore/Manufactured Products and Well Site Services, Downhole Technologies and Offshore/Manufactured Products business segments. Demand for our products and services is cyclical and substantially dependent upon activity levels in the oil and gas industry, particularly our customers’customers' willingness to invest capital in the exploration for and development of crude oil and natural gas reserves. Our customers’customers' capital spending programs are generally based on their cash flows and their outlook for near-term and long-term commodity prices, economic growth, commodity demand and estimates of resource production. As a result, demand for our products and services is largely sensitive to future expectations with respect to crude oil and natural gas prices.
Our consolidated results of operations include contributions from the GEODynamics and Falcon acquisitions completed in the first quarter of 2018 (discussed below). Our reported results of operations reflect the impact of current industry trends and customer spending activities which are focused on growth in thewith investments weighted toward U.S. shale play regions with weaker U.S. Gulfregions. However, in 2019, we are beginning to see a general improvement in the level of Mexico and international activity. In addition,planned investments in deepwater markets globallyglobally.
Recent Developments
In addition to capital spending, we have slowed sinceinvested in acquisitions of businesses complementary to our growth strategy. Our acquisition strategy has allowed us to leverage our existing and acquired products and services into new geographic locations and has expanded the startbreadth of our technology and product offerings while allowing us to leverage our cost structure. We have made strategic and complementary acquisitions in each of our business segments in recent years.
On December 12, 2017 we entered into an agreement to acquire GEODynamics, Inc. ("GEODynamics"), which provides oil and gas perforation systems and downhole tools in support of completion, intervention, wireline and well abandonment operations. On January 12, 2018, we closed the acquisition of GEODynamics for total consideration of $615 million (the "GEODynamics Acquisition"), consisting of (i) $295 million in cash (net of cash acquired), (ii) 8.66 million shares of our common stock and (iii) an unsecured $25 million promissory note.
In connection with the GEODynamics Acquisition, we completed several financing transactions to extend the maturity of our debt while providing us with the flexibility to repay outstanding borrowings under our revolving credit facility (the "Revolving Credit Facility") with anticipated future cash flows from operations.
On January 30, 2018, we sold $200.0 million aggregate principal amount of our 1.50% convertible senior notes due 2023 (the "Notes") through a private placement to qualified institutional buyers. We received net proceeds from the offering of the recent industry downturnNotes of approximately $194 million, after deducting issuance costs. We used the net proceeds from the sale of the Notes to repay a portion of the borrowings outstanding under our Revolving Credit Facility, substantially all of which were drawn to fund the cash portion of the purchase price paid for GEODynamics.
Concurrently with the Notes offering, we amended our Revolving Credit Facility, to extend the maturity date to January 2022, permit the issuance of the Notes and provide for up to $350.0 million in 2014.borrowing capacity.
A severe industry downturn startedOn February 28, 2018, we acquired Falcon Flowback Services, LLC ("Falcon"), a full service provider of flowback and well testing services for the separation and recovery of fluids, solid debris and proppant used during hydraulic fracturing operations. Falcon provides additional scale and diversity to our Completion Services well testing operations in key shale plays in the second halfUnited States. The acquisition price was $84.2 million, net of 2014 and continued into 2017, driven by global economic uncertainties and high levelscash acquired. The Falcon acquisition was funded with borrowings under our Revolving Credit Facility.
During the third quarter of global oil production. As shown2019, we made the strategic decision to reduce the scope of our Drilling Services business (with plans to adjust from 34 rigs to 9 rigs) due to the ongoing weakness in customer demand for vertical drilling rigs in the table that follows, significantU.S. land market. As a result of this decision, our Drilling Services business recorded a non-cash impairment charge of $33.7 million to decrease the carrying value of the business' fixed assets to their estimated fair value.
See Note 3, "Business Acquisitions," Note 4, "Details of Selected Balance Sheet Accounts," and Note 6, "Long-term Debt" to the unaudited condensed consolidated financial statements included in this Quarterly Report on Form 10‑Q for further discussion of these recent developments.
Macroeconomic Environment
The macroeconomic environment for the energy sector has been and continues to be extremely volatile. Significant downward crude oil price volatility began in late 2014 with Intercontinental Exchange Brent (“Brent”) crude oil declining from an average of $102 per barrelearly in the thirdfourth quarter of 2014 and continued into 2016. In response to an average of $34 per barrel in the first quarter of 2016 (a level last seen in 2004). The sustained material decrease inweakening crude oil prices, relative to 2014 is primarily attributable to high levels of global crude oil inventories resulting from significant production growth in the U.S. shale plays, the strengthening of the U.S. dollar relative to other currencies, and increased production by the Organization of Petroleum Exporting Countries (“OPEC”("OPEC"). OPEC demonstrated, throughout 2015 and through November of 2016 an unwillingness, along with Russia, agreed to modifyreduce crude oil production levels, as it had done in previous years,late 2016 in an effort to protect its market share. These production increases were partially offset by growth in global crude oil demand. The combination of these factors caused a globalre-balance supply and demand imbalance for crudedemand. Crude oil which, along with concerns regarding the potential effects on energy demand stemming from the diminished growth outlook in China and other emerging markets, and supply increases related to the lifting of sanctions against Iran, resulted in materially lower crude oil prices. Non-OPEC production, particularly in the United States, began to decline in 2015 due to substantially reduced investment in drilling and completion activity triggered by lower crude oil prices leading to some recovery in crude oil prices in late 2016 and early 2017 relative to the crude oil price lows experienced in early 2016. On November 30, 2016, OPEC agreed to production cuts which should, over time, if the cuts are adhered to, result in further reductions in global crude oil inventories and a more favorable commodity price environment. In May 2017, OPEC agreed to extend these production cuts to March 2018. Brent crude oil prices averaged $52 per barrel in the third quarter of 2017, which is 14% above the third quarter 2016 average of $46 per barrel and up 5% from the average in the second quarter of 2017. Similarly, the average price
of West Texas Intermediate (“WTI”) was $48 per barrel in the third quarter of 2017, up 7% from the third quarter 2016 average of $45 per barrel but unchanged on a sequential quarter basis. The year-over-year improvement in oil prices was driven by the belief that OPEC and Russia, its key ally in the effort to stabilize the global crude oil market, would be successful in cutting their production. However, improvements in crude oil prices rapidly translated into increased drilling activity in U.S. shale play developments in areas such as the Permian Basin, which is leading to higher domestic production. This increased shale driven activity has pressured crude oil prices again with the average WTI price per barrel over the second and third quarters of 2017 declining 7% from the first quarter 2017 average. Further, WTI crude oil is currently trading at an approximate $6 per barrel discount to Brent crude oil, as shown below. Spending in these regions, which began to improve in the second half of 2016 in response to higher2017, which carried into 2018. During 2018, crude oil prices has positively influencedrose to their highest levels since the overallbeginning of the downturn, improving our customers' cash flow and potentially driving them to invest additional capital to increase their production. Additionally, advancements in technologies and improved operating efficiencies have allowed the U.S. exploration and production industry to lower the breakeven price of oil and gas production. During 2017 and 2018, rising crude oil prices rapidly translated into increased U.S. land oriented drilling and completion activity in these regionsareas of concentration such as the Permian Basin, which led to record high domestic production. The U.S. Energy Information Administration estimates that U.S. crude oil production averaged 11.0 million barrels per day in 2018, up approximately 17% from the 2017 average, reaching its highest level, experiencing the largest volume growth on record and therefore,accounting for approximately 60% of global demand growth over the activityperiod. However, during the fourth quarter of our Well Site Services segment2018, crude oil prices declined approximately 40%, due in part to higher than expected supply growth from the United States, Russia and Saudi Arabia, as well as slowing of global demand growth. In response to the precipitous decline in crude oil prices, OPEC and Russia agreed to reduce production and the Canadian government mandated a production shut‑in in December of 2018. In July 2019, OPEC and Russia agreed to extend these production cuts through March 2020.
After declining materially in the fourth quarter of 2018, Brent and West Texas Intermediate ("WTI") crude oil prices closed at $51 and $45 per barrel, respectively, on December 31, 2018. Subsequent to year-end 2018, Brent and WTI crude oil prices increased to $61 and $54 per barrel, respectively, as of September 30, 2019. Additionally, during the first quarter of 2019, the pricing differential for short-cycle productsWTI crude oil between Cushing, Oklahoma and Midland, Texas was effectively eliminated due to improvements in pipeline takeaway capacity from the Permian Basin, providing operators in the region with increased cash flows. While the commodity price environment has improved in 2019 relative to December of 2018, the crude oil price outlook and associated volatility continues to have a moderating impact on our customers' operating results and capital spending plans, particularly those operating in the U.S. shale play regions. The U.S. rig count at September 30, 2019 of 860 rigs has fallen 21% since the most recent peak of 1,083 rigs in December 2018.
Current and expected future pricing for WTI crude will continue to influence our customers' spending in U.S. shale play developments as our customers strive for financial discipline and spending levels that are within our Offshore/Manufactured Products segment in 2017.their capital budgets and generated cash flow ranges. Expectations with respect tofor the longer-term price for Brent crude oil will continue to influence our customers’customers' spending related to global offshore drilling and development and, thus, a significant portion of the activity of our Offshore/Manufactured Products segment.
Given the historical volatility of crude oil prices, thereThere remains a degree of risk that crude oil prices could remain at their current levels or deteriorate furtherhighly volatile due to relatively highincreases in global inventory levels, of global inventories, increasing domestic or international crude oil production, trade tensions with China, sanctions on Iranian production and tensions with Iran, civil unrest in Libya and Venezuela, increasing price differentials between markets, slowing growth rates in variousChina and other global regions, use of alternatives,alternative fuels, improved vehicle fuel efficiency, a more sustained movement to electric vehicles and/or the potential for ongoing supply/demand imbalances. Conversely, if the global supply of crude oil were to decrease due to a prolonged reduction in capital investment by our customers or if government instability in a major oil-producing nation develops, and energy demand were to continue to increase, in the United States, India and China, a sustained recovery in WTI and Brent crude oil prices could occur. In any event, crude oil price improvements will depend upon a rebalancingthe balance of global supply and demand, with a corresponding continued reduction in global inventories, the timing of which is difficult to predict. If commodity prices do not improve, or decline further, demand for our products and services could continue to be weak or could decline further.inventories.
Natural gas prices improved slightly over the past year from an average of $2.88 per mmBtu in the third quarter of 2016 to an average of $2.95 per mmBtu during the third quarter of 2017. Customer spending in the natural gas shale plays has been limited due to associated natural gas beingproduction from prolific basins in the Northeastern United States and from associated gas produced from the drilling and completion of unconventional oil wells in North America. If natural gas production growth surpasses demand growth in the United States, and/or if the supply of natural gas were to increase, whether from conventional or unconventional production or associated natural gas production from oil wells, prices for natural gas could remain depressed for an extended period of time and could result in fewer rigs drilling for natural gas.
Recent WTI, Brent crude oil Brent crude and natural gas pricing trends are as follows:
|
| | | | | | | | | | | | | | | | |
| | | Average Price(1) for quarter ended |
| Year | | March 31 | | June 30 | | September 30 | | December 31 |
| WTI Crude (per bbl) | | | | | | |
| 2017 | | $ | 51.62 |
| | $ | 48.14 |
| | $ | 48.18 |
| | |
| 2016 | | $ | 33.35 |
| | $ | 45.46 |
| | $ | 44.85 |
| | $ | 49.14 |
|
| 2015 | | $ | 48.49 |
| | $ | 57.85 |
| | $ | 46.49 |
| | $ | 41.94 |
|
| 2014 | | $ | 98.68 |
| | $ | 103.35 |
| | $ | 97.87 |
| | $ | 73.21 |
|
| Brent Crude (per bbl) | | | | | | |
| 2017 | | $ | 53.59 |
| | $ | 49.59 |
| | $ | 52.10 |
| | |
| 2016 | | $ | 33.84 |
| | $ | 45.57 |
| | $ | 45.80 |
| | $ | 49.11 |
|
| 2015 | | $ | 53.98 |
| | $ | 61.65 |
| | $ | 50.44 |
| | $ | 43.56 |
|
| 2014 | | $ | 108.14 |
| | $ | 109.69 |
| | $ | 101.90 |
| | $ | 76.43 |
|
| Henry Hub Natural Gas (per mmBtu) | | | | |
| 2017 | | $ | 3.02 |
| | $ | 3.08 |
| | $ | 2.95 |
| | |
| 2016 | | $ | 1.99 |
| | $ | 2.15 |
| | $ | 2.88 |
| | $ | 3.04 |
|
| 2015 | | $ | 2.90 |
| | $ | 2.75 |
| | $ | 2.76 |
| | $ | 2.12 |
|
| 2014 | | $ | 5.18 |
| | $ | 4.61 |
| | $ | 3.96 |
| | $ | 3.78 |
|
|
| | | | | | | | | | | | | | | | | | | | |
| | | Average Price(1) for quarter ended | | Average Price(1) for year ended December 31 |
| Year | | March 31 | | June 30 | | September 30 | | December 31 | |
| WTI Crude (per bbl) | | | | | | | | |
| 2019 | | $ | 54.82 |
| | $ | 59.88 |
| | $ | 56.34 |
| | | | |
| 2018 | (2) | $ | 62.91 |
| | $ | 68.07 |
| | $ | 69.70 |
| | $ | 59.97 |
| | $ | 65.25 |
|
| 2017 | | $ | 51.62 |
| | $ | 48.13 |
| | $ | 48.18 |
| | $ | 55.27 |
| | $ | 50.80 |
|
| Brent Crude (per bbl) | | | | | | | | |
| 2019 | | $ | 63.10 |
| | $ | 69.01 |
| | $ | 61.95 |
| | | | |
| 2018 | (2) | $ | 66.86 |
| | $ | 74.53 |
| | $ | 75.08 |
| | $ | 68.76 |
| | $ | 71.32 |
|
| 2017 | | $ | 53.59 |
| | $ | 49.55 |
| | $ | 52.10 |
| | $ | 61.40 |
| | $ | 54.12 |
|
| Henry Hub Natural Gas (per mmBtu) | | | | | | |
| 2019 | | $ | 2.92 |
| | $ | 2.57 |
| | $ | 2.38 |
| | | | |
| 2018 | | $ | 3.08 |
| | $ | 2.85 |
| | $ | 2.93 |
| | $ | 3.77 |
| | $ | 3.15 |
|
| 2017 | | $ | 3.02 |
| | $ | 3.08 |
| | $ | 2.95 |
| | $ | 2.90 |
| | $ | 2.99 |
|
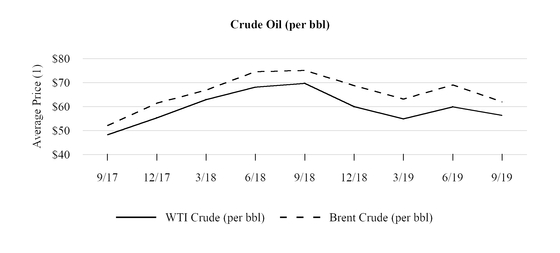
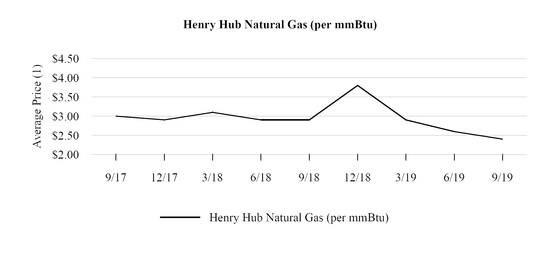
| |
| (1) | Source: U.S. Energy Information Administration (“EIA”).Administration. As of October 23, 2017,24, 2019, WTI crude oil, Brent crude oil and natural gas traded at approximately $51.91$56.11 per barrel, $57.69$61.71 per barrel and $2.95$2.33 per mmBtu, respectively. |
| |
| (2) | Reflecting the impact of pipeline takeaway capacity constraints from the Permian Basin, the average price per barrel for WTI (Midland, Texas) crude oil for the first, second, third and fourth quarters of 2018 was approximately 1%, 12%, 21% and 11%, respectively, below the average WTI crude oil quarterly benchmark prices referenced, which are based on the spot price of WTI at Cushing, Oklahoma. Brent crude oil average quarterly prices for the first, second, third and fourth quarters of 2018 were 7%, 24%, 36% and 28%, respectively above the corresponding WTI (Midland, Texas) crude oil quarterly average prices. During the first quarter of 2019, the differential between WTI crude oil pricing and WTI (Midland, Texas) crude oil pricing was effectively eliminated due to reductions in pipeline takeaway capacity constraints from the Permian Basin. |
Overview
Demand forOur Well Site Services segment provides completion services in the productsUnited States (including the Gulf of Mexico) and the rest of the world and, to a much lesser extent, land drilling services of our Offshore/Manufactured Products segment is driven byin the longer-term outlook for commodity prices and changes inUnited States. U.S. drilling and completion activity both offshore and, onshore. Demand for the equipment and services ofin turn, our Well Site Services results, are sensitive to near-term fluctuations in commodity prices, particularly WTI crude oil prices, given the short-term, call-out nature of its operations.
Within this segment, respondsour Completion Services business (which includes the Falcon operations we acquired in February 2018) supplies equipment and service personnel utilized in the completion and initial production of new and recompleted wells. Activity for the Completion Services business is dependent primarily upon the level and complexity of drilling, completion, and workover activity in the areas of operations mentioned above. Well intensity and complexity has increased with the continuing transition to shorter-term movementsmulti-well pads, the drilling of longer lateral wells and increased downhole pressures, along with the increased number of frac stages completed in horizontal wells. Similarly, demand for our Drilling Services operations has historically been driven by activity in our primary land drilling markets of the Permian Basin in West Texas and the U.S. Rocky Mountain area. During the third quarter of 2019, we made the strategic decision to reduce the scope of our Drilling Services business (with plans to adjust from 34 rigs to 9 rigs) due to the ongoing weakness in customer demand for vertical drilling rigs in the U.S. land market. Prospectively, the operations will primarily focus on serving operators in the Rocky Mountain region. See Note 4, "Details of Selected Balance Sheet Accounts."
Our Downhole Technologies segment is comprised of the GEODynamics business we acquired in January 2018. GEODynamics was founded in 2004 as a researcher, developer and manufacturer of consumable engineered products used in completion applications. This segment provides oil and gas perforation systems, downhole tools and services in support of completion, intervention, wireline and well abandonment operations. This segment designs, manufactures and markets its consumable engineered products to oilfield service as well as exploration and production companies. Product and service offerings for this segment include innovations in perforation technology through patented and proprietary systems combined with advanced modeling and analysis tools. This expertise has led to the optimization of perforation hole size, depth, and quality of tunnels, which are key factors for maximizing the effectiveness of hydraulic fracturing. Additional offerings include proprietary toe valve and frac plug products, which are focused on zonal isolation for hydraulic fracturing of horizontal wells, and a broad range of consumable products, such as setting tools and bridge plugs, that are used in completion, intervention and decommissioning applications. Demand drivers for the Downhole Technologies segment include continued trends toward longer lateral lengths, increased frac stages and more perforation clusters to target increased unconventional well productivity.
Demand for our Well Site Services and Downhole Technologies segments' businesses is correlated to changes in the total number of wells drilled in the United States, total footage drilled, the number of drilled wells that are completed and, to a lesser degree, changes in the drilling rig count. The following table sets forth a summary of the average U.S. drilling rig count, as measured by Baker Hughes, for the periods indicated.
|
| | | | | | | |
| | Three Months Ended September 30, | | Nine Months Ended September 30, |
| | 2019 | | 2018 | | 2019 | | 2018 |
| Average U.S. drilling rig count | | | | | | | |
| Land – Oil | 733 | | 848 | | 782 | | 814 |
| Land – Natural gas and other | 160 | | 181 | | 177 | | 184 |
| Offshore | 27 | | 22 | | 25 | | 21 |
| Total | 920 | | 1,051 | | 984 | | 1,019 |
Over recent years, our industry experienced increased customer spending in crude oil and natural gas pricesliquids-rich exploration and specifically, changesdevelopment in North AmericanU.S. shale plays utilizing horizontal drilling and completion activity giventechniques. As of September 30, 2019, oil-directed drilling accounted for 83% of the spot contract nature of our operations coupledtotal U.S. rig count – with shorter cycles between drilling a well and bringing it on production. Other factors that can affect our business and financial results include, but are not limitedthe balance largely natural gas related. The average U.S. rig count for the three months ended September 30, 2019 decreased by 131 rigs, or 12%, compared to the general global economic environment, competitive pricing pressures and regulatory changes inaverage for the United States and international markets.
three months ended September 30, 2018.
Our Offshore/Manufactured Products segment provides technology-driven, highly-engineered products and services for offshore oil and natural gas production systems and facilities, as well as certain products and services to the offshore and land-based drilling and completion markets. Approximately 60% of Offshore/Manufactured Products sales in 2016 were driven by our customers’customers' capital spending for offshore production systems and subsea pipeline infrastructure,pipelines, repairs and, to a lesser extent, upgrades of existing offshore drilling rigs and construction of new offshore drilling rigs and vessels (referred to herein as “project-driven product revenue”"project-driven products"). As a result, thisFor the first nine months of 2019, these activities only represent approximately 36% of the segment's revenue. This segment has historically beenis particularly influenced by global deepwater drilling and production spending, which are driven largely by our customers’customers' longer-term commodity demand forecasts and outlook for crude oil and natural gas prices. Deepwater oil and gas development projects typically involve significant
capital investments and multi-year development plans. As a result, suchSuch projects are generally undertaken by larger exploration, field development and production companies (primarily international oil companies (“IOCs”("IOCs") and state-run national oil companies (“NOCs”("NOCs")) using relatively conservative crude oil and natural gas pricing assumptions. WeGiven the longer lead times associated with field development, we believe some of these deepwater projects, once approved for development, are therefore less susceptible to short-term fluctuations in the price of crude oil and natural gas given longer lead times associated with field development.gas. However, the decline in crude oil prices that began in 2014 and continued into 2017,2016, coupled with the relatively uncertain outlook around shorter-term and possibly longer-term pricing improvements, have caused exploration and production companies to reevaluatereduce their future capital expenditures in regards to these deepwater projects since they are expensive to drill and complete, have long lead times to first production and may be considered uneconomical relative to the risk involved. However,Customers have focused on improving the economics of major deepwater projects at lower commodity breakeven prices by re-bidding projects, identifying advancements in technology, and reducing overall project costs through equipment standardization. As a few development projects have been sanctioned in the first nine months of 2017 due to re-engineering of the projects and lower development costs, which led to an improvement in final investment decisions (“FIDs”) on these projects from the previous two years. Ourresult, our bookings have declined over this period, leading to substantially reduced backlog in 20172018, and lower levels of project-driven revenue in 2018 relative to recentprior years. As a result, this segment’s project-driven revenue declined 62% from the first nine months of 2016During 2019, we have experienced higher bidding and accounted for only 32% of the segment’s total revenuequoting activity in the first nine months of 2017. Shorter-cycle manufactured products sold primarily to the land-based completions market are impacted by near-term fluctuations in commodity prices. For the nine months ended September 30, 2017, sales of these shorter-cycle products (such as valves and elastomer products) for this segment, increased 76% over the level reported in the same period last year dueleading to the significant increase in U.S. land-based drilling and completion activity.
an improved outlook.
Our Offshore/Manufactured Products segment revenues and operating income declined at a slower pace during 2015 and 2016 than our Well Site Services segment given the high levels of backlog that existed at the beginning of 2014.2015. Bidding and quoting activity, along with orders from customers, for our Offshore/Manufactured Products segment continued after 2014, albeit at a muchsubstantially slower pace. Reflecting the impact of customer (both IOCs and NOCs) delays and deferrals in approving major, capital intensive projects in light of the prolonged low commodity price environment, backlog in our Offshore/Manufactured Products segment decreased from $599 million at June 30, 2014 to $199$179 million at December 31, 2016. With a book-to-bill ratio of 1.0x for2018. However, deepwater project award potential appears to be improving despite commodity price volatility. During the first nine months of 2017, our2019, backlog totaled $198increased $114 million, totaling $293 million at September 30, 2017.2019 – the highest level recorded since the first quarter of 2016. The segment received four notable orders during the first nine months of 2019 for production facility content destined for South America and Southeast Asia, as well as connector products destined for the Middle East and military products for the United States. The following table sets forth reported backlog for our Offshore/Manufactured Products segment as of the dates indicated (in millions).
|
| | | | | | | | | | | | | | | | | | | | |
| | | Backlog as of |
| Year | | March 31 | | June 30 | | September 30 | | December 31 | | Year Average(1) |
| 2017 | | $ | 204 |
| | $ | 202 |
| | $ | 198 |
| | |
| | $ | 202 |
|
| 2016 | | $ | 306 |
| | $ | 268 |
| | $ | 203 |
| | $ | 199 |
| | $ | 269 |
|
| 2015 | | $ | 474 |
| | $ | 409 |
| | $ | 394 |
| | $ | 340 |
| | $ | 435 |
|
| 2014 | | $ | 578 |
| | $ | 599 |
| | $ | 543 |
| | $ | 490 |
| | $ | 564 |
|
| |
(1) | Average is computed based on month end backlog amounts for the respective nine-month and twelve-month periods. |
In our Well Site Services segment, we predominantly provide completion services and, to a lesser extent, land drilling services. Our Completion Services business provides equipment and service personnel utilized in the completion and initial production of new and recompleted wells. Activity for the Completion Services business is dependent primarily upon the level and complexity of drilling, completion, and workover activity in the United States, including the Gulf of Mexico, and, to a lesser extent, Canada and the rest of the world. Well complexity has increased with the continuing transition to multi-well pads and the drilling of longer lateral wells along with the increased number of frac stages completed in horizontal wells. Demand for our Drilling Services operations is driven by land drilling activity in our primary drilling markets of the Permian Basin in West Texas, where we primarily drill oil wells, and the U.S. Rocky Mountain area, where we drill both liquids-rich and natural gas wells.
Demand for our Completion Services and Drilling Services businesses is correlated to changes in the drilling rig count in North America, as well as changes in the total number of wells drilled, total footage, and the number of drilled wells that are completed. The following table sets forth a summary of the average North American drilling rig count, as measured by Baker Hughes (a GE company), for the periods indicated.
|
| | | | | | | |
| | Three Months Ended September 30, | | Nine Months Ended September 30, |
| | 2017 | | 2016 | | 2017 | | 2016 |
| U.S. Land – Oil | 742 | | 375 | | 671 | | 370 |
| U.S. Land – Natural gas and other | 182 | | 87 | | 167 | | 90 |
| U.S. Offshore | 22 | | 18 | | 23 | | 23 |
| Total United States | 946 | | 480 | | 861 | | 483 |
| Canada | 208 | | 121 | | 207 | | 112 |
| Total North America | 1,154 | | 601 | | 1,068 | | 595 |
The average North American rig count for the nine months ended September 30, 2017 increased 473 rigs, or 79%, compared to the nine months ended September 30, 2016, in response to the increase in crude oil prices discussed above.
Over recent years, our industry experienced a shift in customer spending from natural gas exploration and development to crude oil and liquids-rich exploration and development in the North American shale plays utilizing horizontal drilling and completion techniques. The U.S. natural gas-related working rig count declined from approximately 810 rigs at the beginning of 2012 to 81 rigs in August of 2016, a more than 29 year low. According to rig count data published by Baker Hughes (a GE company), the U.S. oil rig count peaked in October 2014 at 1,609 rigs but has declined materially since late 2014 due to much lower crude oil prices, totaling 750 rigs as of September 30, 2017 (with the U.S. oil rig count having troughed at 316 rigs in May 2016, which was the lowest oil rig count during this current cyclical downturn). As of September 30, 2017, oil-directed drilling accounted for 80% of the total U.S. rig count – with the balance natural gas related. The total U.S. rig count has increased 536 rigs, or 133%, since troughing in May of 2016, largely due to improved crude oil prices, decreased service costs and improved technologies applied in the shale play regions of the United States.
Exacerbating the steep declines in drilling activity experienced in 2015 and 2016, many of our exploration and production customers deferred well completions. These deferred completions are referred to in the industry as drilled but uncompleted wells (or “DUCs”). Given our Well Site Services segment’s exposure to the level of completion activity, an increase in the number of DUCs will have a short-term negative impact on our results of operations relative to the rig count trends but over the longer-term should have a positive impact on the segment’s results as the wells are completed.
|
| | | | | | | | | | | | | | | | |
| | | Backlog as of |
| Year | | March 31 | | June 30 | | September 30 | | December 31 |
| 2019 | | $ | 234 |
| | $ | 283 |
| | $ | 293 |
| | |
| 2018 | | $ | 157 |
| | $ | 165 |
| | $ | 175 |
| | $ | 179 |
|
| 2017 | | $ | 204 |
| | $ | 202 |
| | $ | 198 |
| | $ | 168 |
|
| 2016 | | $ | 306 |
| | $ | 268 |
| | $ | 203 |
| | $ | 199 |
|
Reduced demand for our products and services, coupled with a reduction in the prices we charge our customers for our services, has adversely affected our results of operations, cash flows and financial position since the second half of 2014. If the current pricing environment for crude oil and natural gas does not continue to improve, or declines further, our customers may be required to further reduce their capital expenditures, causing additional declines in the demand for, and prices of, our products and services, which would adversely affect our results of operations, cash flows and financial position. Our customers have experienced
We use a significant declinevariety of domestically produced and imported raw materials and component products, including steel, in their revenuesmanufacturing our products. The United States recently imposed tariffs on a variety of imported products, including steel and cash flows duealuminum. In response to the commodity price declines, with many experiencing a significant reduction in liquidity. Several explorationU.S. tariffs on steel and production companies declared bankruptcy during 2015aluminum, the European Union and 2016, several other countries, including Canada and China, have threatened and/or had to exchange equity for the forgiveness of debt, and others were forced to sell assets in an effort to preserve liquidity. However, over the past twelve months, access to capital and debt markets have improved for certainimposed retaliatory tariffs. The effect of these customers.new tariffs and the application and interpretation of existing trade agreements and customs, anti-dumping and countervailing duty regulations continue to evolve, and we continue to monitor these matters. If we encounter difficulty in procuring these raw materials and component products, or if the prices we have to pay for these products increase as a result of customs, anti-dumping and countervailing duty regulations or otherwise, and we are unable to pass corresponding cost increases on to our customers, our financial position and results of operations could be adversely affected. Furthermore, uncertainty with respect to potential costs in the drilling and completion of oil and gas wells, or regarding the expected impact of such tariffs on the demand for and the price of crude oil, could cause our customers to delay or cancel planned projects which, if this occurred, would adversely affect our financial position and results of operations. See Note 14, "Commitments and Contingencies."
Other factors that can affect our business and financial results include but are not limited to the general global economic environment, competitive pricing pressures, regulatory changes and changes in tax laws in the United States and international markets. We continue to monitor the global economy, the prices of and demand for crude oil and natural gas, and the resultant impact on the capital spending plans and operations of our customers in order to plan and manage our business.
Selected Financial Data
Unaudited Consolidated Results of Operations Data
The following summarizes our unaudited consolidated results of operations for the three and nine months ended September 30, 2019 and 2018 (in thousands, except per share amounts):
|
| | | | | | | | | | | | | | | | | | | | | | | |
| | Three Months Ended September 30, | | Nine Months Ended September 30, |
| | 2019 | | 2018 | | Variance | | 2019 | | 2018 | | Variance |
| Revenues | | | | | | | | | | | |
| Products | $ | 122,067 |
| | $ | 120,271 |
| | $ | 1,796 |
| | $ | 363,360 |
| | $ | 385,279 |
| | $ | (21,919 | ) |
| Services | 141,630 |
| | 154,323 |
| | (12,693 | ) | | 415,633 |
| | 428,736 |
| | (13,103 | ) |
| 263,697 |
| | 274,594 |
| | (10,897 | ) | | 778,993 |
| | 814,015 |
| | (35,022 | ) |
| Costs and expenses: | | | | | | | | | | | |
| Product costs | 90,796 |
| | 87,822 |
| | 2,974 |
| | 275,353 |
| | 276,122 |
| | (769 | ) |
| Service costs | 110,294 |
| | 127,836 |
| | (17,542 | ) | | 333,727 |
| | 342,829 |
| | (9,102 | ) |
| Cost of revenues (exclusive of depreciation and amortization expense presented below) | 201,090 |
| | 215,658 |
| | (14,568 | ) | | 609,080 |
| | 618,951 |
| | (9,871 | ) |
| Selling, general and administrative expenses | 31,935 |
| | 32,285 |
| | (350 | ) | | 93,527 |
| | 102,399 |
| | (8,872 | ) |
| Depreciation and amortization expense | 31,366 |
| | 30,586 |
| | 780 |
| | 94,800 |
| | 90,698 |
| | 4,102 |
|
Impairment of fixed assets(1) | 33,697 |
| | — |
| | 33,697 |
| | 33,697 |
| | — |
| | 33,697 |
|
| Other operating (income) expense, net | 519 |
| | (213 | ) | | 732 |
| | 34 |
| | (2,097 | ) | | 2,131 |
|
| | 298,607 |
| | 278,316 |
| | 20,291 |
| | 831,138 |
| | 809,951 |
| | 21,187 |
|
| Operating income (loss) | (34,910 | ) | | (3,722 | ) | | (31,188 | ) | | (52,145 | ) | | 4,064 |
| | (56,209 | ) |
| Interest expense, net | (4,352 | ) | | (4,843 | ) | | 491 |
| | (13,721 | ) | | (14,087 | ) | | 366 |
|
| Other income | 1,190 |
| | 709 |
| | 481 |
| | 2,866 |
| | 1,927 |
| | 939 |
|
| Loss before income taxes | (38,072 | ) | | (7,856 | ) | | (30,216 | ) | | (63,000 | ) | | (8,096 | ) | | (54,904 | ) |
| Income tax benefit | 6,204 |
| | 3,837 |
| | 2,367 |
| | 6,744 |
| | 3,327 |
| | 3,417 |
|
| Net loss | $ | (31,868 | ) | | $ | (4,019 | ) | | $ | (27,849 | ) | | $ | (56,256 | ) | | $ | (4,769 | ) | | $ | (51,487 | ) |
| | | | | | | | | | | | |
| Net loss per share: |
| Basic | $ | (0.54 | ) | | $ | (0.07 | ) | | | | $ | (0.95 | ) | | $ | (0.08 | ) | | |
| Diluted | (0.54 | ) | | (0.07 | ) | | | | (0.95 | ) | | (0.08 | ) | | |
| | | | | | | | | | | | |
| Weighted average number of common shares outstanding: |
| Basic | 59,423 |
| | 59,026 |
| | | | 59,362 |
| | 58,606 |
| | |
| Diluted | 59,423 |
| | 59,026 |
| | | | 59,362 |
| | 58,606 |
| | |
_____________
| |
| (1) | Operating loss for the Drilling Services business includes a non-cash fixed asset impairment charge of $33.7 million for the three and nine months ended September 30, 2019. See Note 4, "Details of Selected Balance Sheet Accounts," to the condensed consolidated financial statements for further discussion. |
Unaudited Operating Segment Financial Data
We manage and measure our business performance in twothree distinct operating segments: Well Site Services, Downhole Technologies and Offshore/Manufactured Products. SelectedSupplemental unaudited financial information by business segment for the three and nine months ended September 30, 20172019 and 20162018 is summarized below (dollars in thousands):
| | | | Three Months Ended September 30, | | Nine Months Ended September 30, | | | | | | | | | | | | | | | |
| | | | | | Variance | | | | | | Variance | Three Months Ended September 30, | | Nine Months Ended September 30, |
| | 2017 | | 2016 | | $ | | % | | 2017 | | 2016 | | $ | | % | 2019 | | 2018 | | Variance | | 2019 | | 2018 | | Variance |
| Revenues | | | | | | | | | | | | | | | | Revenues |
| Well Site Services - | | | | | | | | | | | | | | | | | | | | | | | | | | |
| Completion Services | $ | 61,015 |
| | $ | 38,975 |
| | $ | 22,040 |
| | 57 | % | | $ | 167,577 |
| | $ | 116,748 |
| | $ | 50,829 |
| | 44 | % | $ | 103,966 |
| | $ | 111,669 |
| | $ | (7,703 | ) | | $ | 307,928 |
| | $ | 302,877 |
| | $ | 5,051 |
|
| Drilling Services | 16,162 |
| | 7,375 |
| | 8,787 |
| | 119 | % | | 39,120 |
| | 14,016 |
| | 25,104 |
| | 179 | % | 12,034 |
| | 16,920 |
| | (4,886 | ) | | 32,430 |
| | 51,235 |
| | (18,805 | ) |
| Total Well Site Services | 77,177 |
| | 46,350 |
| | 30,827 |
| | 67 | % | | 206,697 |
| | 130,764 |
| | 75,933 |
| | 58 | % | 116,000 |
| | 128,589 |
| | (12,589 | ) | | 340,358 |
| | 354,112 |
| | (13,754 | ) |
| Offshore/Manufactured Products - | | | | | | | | | | | | | | | | |
| Project-driven products | 22,698 |
| | 76,541 |
| | (53,843 | ) | | (70 | )% | | 89,615 |
| | 234,440 |
| | (144,825 | ) | | (62 | )% | |
| Short-cycle products | 37,781 |
| | 23,766 |
| | 14,015 |
| | 59 | % | | 110,872 |
| | 63,033 |
| | 47,839 |
| | 76 | % | |
| Other products and services | 26,392 |
| | 32,349 |
| | (5,957 | ) | | (18 | )% | | 79,733 |
| | 96,273 |
| | (16,540 | ) | | (17 | )% | |
| Total Offshore/Manufactured Products | 86,871 |
| | 132,656 |
| | (45,785 | ) | | (35 | )% | | 280,220 |
| | 393,746 |
| | (113,526 | ) | | (29 | )% | |
| Total | $ | 164,048 |
| | $ | 179,006 |
| | $ | (14,958 | ) | | (8 | )% | | $ | 486,917 |
| | $ | 524,510 |
| | $ | (37,593 | ) | | (7 | )% | |
| | | | | | | | | | | | | | | | | |
| Product and service costs | | | | | | | | | | | | | | | | |
| Well Site Services - | | | | | | | | | | | | | | | | |
| Completion Services | $ | 51,584 |
| | $ | 36,871 |
| | $ | 14,713 |
| | 40 | % | | $ | 146,833 |
| | $ | 111,701 |
| | $ | 35,132 |
| | 31 | % | |
| Drilling Services | 14,521 |
| | 6,992 |
| | 7,529 |
| | 108 | % | | 34,755 |
| | 14,368 |
| | 20,387 |
| | 142 | % | |
| Total Well Site Services | 66,105 |
| | 43,863 |
| | 22,242 |
| | 51 | % | | 181,588 |
| | 126,069 |
| | 55,519 |
| | 44 | % | |
| Downhole Technologies | | 42,882 |
| | 56,571 |
| | (13,689 | ) | | 143,912 |
| | 161,626 |
| | (17,714 | ) |
| Offshore/Manufactured Products | 63,084 |
| | 91,903 |
| | (28,819 | ) | | (31 | )% | | 198,361 |
| | 274,912 |
| | (76,551 | ) | | (28 | )% | 104,815 |
| | 89,434 |
| | 15,381 |
| | 294,723 |
| | 298,277 |
| | (3,554 | ) |
| Total | $ | 129,189 |
| | $ | 135,766 |
| | $ | (6,577 | ) | | (5 | )% | | $ | 379,949 |
| | $ | 400,981 |
| | $ | (21,032 | ) | | (5 | )% | $ | 263,697 |
| | $ | 274,594 |
| | $ | (10,897 | ) | | $ | 778,993 |
| | $ | 814,015 |
| | $ | (35,022 | ) |
| | | | | | | | | | | | | | | | | | | | | | | | | | | |
Gross profit (loss)(1) | | | | | | | | | | | | | | | | |
| Operating income (loss) | | Operating income (loss) |
| Well Site Services - | | | | | | | | | | | | | | | | | | | | | | | | | | |
| Completion Services | $ | 9,432 |
| | $ | 2,104 |
| | $ | 7,328 |
| | 348 | % | | $ | 20,744 |
| | $ | 5,047 |
| | $ | 15,697 |
| | 311 | % | $ | 1,719 |
| | $ | (3,271 | ) | | $ | 4,990 |
| | $ | (2,282 | ) | | $ | (6,538 | ) | | $ | 4,256 |
|
| Drilling Services | 1,640 |
| | 383 |
| | 1,257 |
| | 328 | % | | 4,365 |
| | (352 | ) | | 4,717 |
| | n.m. |
| |
Drilling Services(1) | | (36,495 | ) | | (2,206 | ) | | (34,289 | ) | | (43,655 | ) | | (7,474 | ) | | (36,181 | ) |
| Total Well Site Services | 11,072 |
| | 2,487 |
| | 8,585 |
| | 345 | % | | 25,109 |
| | 4,695 |
| | 20,414 |
| | 435 | % | (34,776 | ) | | (5,477 | ) | | (29,299 | ) | | (45,937 | ) | | (14,012 | ) | | (31,925 | ) |
| Downhole Technologies | | 659 |
| | 6,485 |
| | (5,826 | ) | | 3,251 |
| | 26,139 |
| | (22,888 | ) |
| Offshore/Manufactured Products | 23,787 |
| | 40,754 |
| | (16,967 | ) | | (42 | )% | | 81,859 |
| | 118,835 |
| | (36,976 | ) | | (31 | )% | 11,139 |
| | 7,069 |
| | 4,070 |
| | 26,207 |
| | 32,185 |
| | (5,978 | ) |
| Corporate | | (11,932 | ) | | (11,799 | ) | | (133 | ) | | (35,666 | ) | | (40,248 | ) | | 4,582 |
|
| Total | $ | 34,859 |
| | $ | 43,241 |
| | $ | (8,382 | ) | | (19 | )% | | $ | 106,968 |
| | $ | 123,530 |
| | $ | (16,562 | ) | | (13 | )% | $ | (34,910 | ) | | $ | (3,722 | ) | | $ | (31,188 | ) | | $ | (52,145 | ) | | $ | 4,064 |
| | $ | (56,209 | ) |
| | Gross profit (loss) as a percentage of revenues(1) | | | | | | | | | | | | | |
Operating income (loss) as a percentage of revenues(2) | | Operating income (loss) as a percentage of revenues(2) |
| Well Site Services - | | | | | | | | | | | | | | | | | | | | | | | | | |
| Completion Services | 15 | % | | 5 | % | | | | | | 12 | % | | 4 | % | | | | | 2 | % | | (3 | )% | | | | (1 | )% | | (2 | )% | |
| Drilling Services | 10 | % | | 5 | % | | | | | | 11 | % | | (3 | )% | | | | | (303 | )% | | (13 | )% | | | | (135 | )% | | (15 | )% | |
| Total Well Site Services | 14 | % | | 5 | % | | | | | | 12 | % | | 4 | % | | | | | (30 | )% | | (4 | )% | | | | (13 | )% | | (4 | )% | |
| Downhole Technologies | | 2 | % | | 11 | % | | 2 | % | | 16 | % | |
| Offshore/Manufactured Products | 27 | % | | 31 | % | | 29 | % | | 30 | % | | 11 | % | | 8 | % | | 9 | % | | 11 | % | |
| Total | 21 | % | | 24 | % | | | | | | 22 | % | | 24 | % | | | | | (13 | )% | | (1 | )% | | | | (7 | )% | | — | % | |
_____________
| |
| (1) | Gross profitOperating loss for the Drilling Services business includes a non-cash fixed asset impairment charge of $33.7 million for the three and nine months ended September 30, 2019. See Note 4, "Details of Selected Balance Sheet Accounts," to the condensed consolidated financial statements for further discussion. |
| |
| (2) | Operating margin is defined as operating income (loss) is computeddivided by deducting product and service costs from revenues, and excludes depreciation expense. Gross profit (loss) as a percentage of revenues is also referred to herein as gross margin.revenues. |
Three Months Ended September 30, 20172019 Compared to Three Months Ended September 30, 20162018
Consolidated Operating Results
We reported a net loss for the three months ended September 30, 20172019 of $15.0$31.9 million, or $0.30$0.54 per diluted share, which included $0.4a non-cash fixed asset impairment charge of $33.7 million ($0.326.6 million after-tax, or $0.45 per diluted share) and $0.7 million ($0.5 million after-tax, or $0.01 per diluted share) of severance and other downsizing charges and $1.0 million ($0.02 per diluted share) of additional tax expense related to the decision to carryback net operating losses incurred in 2016 against taxable income reported in 2014. Excluding these third quarter 2017 charges, the net loss would have been $13.7 million, or $0.27 per diluted share.costs. These results compare to a net loss for the three months ended September 30, 20162018 of $10.8$4.0 million, or $0.22$0.07 per diluted share, which included $2.0$3.5 million ($1.32.8 million after-tax, or $0.05 per diluted share) of charges related to legal fees incurred for patent defense and a $2.6 million provision ($2.1 million after-tax, or $0.03 per diluted share) of severance and other downsizing charges. Excluding these thirdfor prior years' Fair Labor Standards Act ("FLSA") claim settlements. Additionally, in the prior-year quarter 2016 charges, the net loss from continuing operations would have been $9.5Company recognized a $5.8 million or $0.19($0.10 per diluted share.
The Company’s third quarter 2017 consolidated results of operations were adversely affected by Hurricane Harvey which caused widespread damage and logistical challenges in Houston and the surrounding region where we operate five manufacturing facilities and employ about 500 individuals. The Company was impacted by lower revenues and under-absorption of manufacturing facility costs primarilyshare) income tax benefit related to a change in its Offshore/Manufactured Products segment but also suffered some field-level downtime dueprovisional estimates with respect to employee dislocations resulting from the storm. One of the Company's Houston facilities experienced significant flooding and is not yet operational but was fully insured. Project work in that facility has been shifted to other manufacturing locations to meet customer delivery requirements.
U.S. tax reform legislation.
Our consolidated results of operations alsoinclude the GEODynamics (Downhole Technologies segment) and Falcon acquisitions completed in the first quarter of 2018. Our reported results of operations reflect the impact of current industry trends and customer spending activities which are focused on growth in thewith investments recently weighted toward U.S. shale play regions with weaker U.S. Gulfregions. However, in 2019, we are beginning to see a general improvement in the level of Mexico and international activity. In addition,planned investments in deepwater markets globally have slowed since the start of the recent industry downturn in 2014.globally.
Revenues. Consolidated total revenues in the third quarter of 20172019 decreased $15.0$10.9 million, or 4%, from the third quarter of 2018. Consolidated product revenues in the third quarter of 2019 increased $1.8 million, or 1%, from the third quarter of 2018, with the impact of higher project-driven product demand in our Offshore/Manufactured Products segment partially offset by lower U.S. land-based customer activity as well as the impact of competitive pricing pressures for conventional perforating products in our Downhole Technologies segment. Consolidated service revenues in the third quarter of 2019 decreased $12.7 million, or 8%, from the third quarter of 20162018 due primarily to declinesreduced customer spending in the U.S. shale play regions. As can be derived from the following table, 73% of our Offshore/Manufactured Products segment, which were partially offset by improvementsconsolidated revenues in our Well Site Services segment. In the third quarter of 2017, over 55%2019 were derived from sales of our short-cycle product and service offerings, which compares to 80% in the same period last year.
The following table provides supplemental disaggregated revenue from contracts with customers by operating segment for the three months ended September 30, 2019 and 2018 (in thousands):
|
| | | | | | | | | | | | | | | | | | | | | | | | | | | | | | | |
| | Well Site Services | | Downhole Technologies | | Offshore/ Manufactured Products | | Total |
| Three months ended September 30 | 2019 | | 2018 | | 2019 | | 2018 | | 2019 | | 2018 | | 2019 | | 2018 |
| Major revenue categories - | | | | | | | | | | | | | | | |
| Project-driven products | $ | — |
| | $ | — |
| | $ | — |
| | $ | — |
| | $ | 39,474 |
| | $ | 22,277 |
| | $ | 39,474 |
| | $ | 22,277 |
|
| Short-cycle: | | | | | | | | | | | | | | | |
| Completion products and services | 103,966 |
| | 111,669 |
| | 42,882 |
| | 56,571 |
| | 26,710 |
| | 27,463 |
| | 173,558 |
| | 195,703 |
|
| Drilling services | 12,034 |
| | 16,920 |
| | — |
| | — |
| | — |
| | — |
| | 12,034 |
| | 16,920 |
|
| Other products | — |
| | — |
| | — |
| | — |
| | 7,988 |
| | 6,707 |
| | 7,988 |
| | 6,707 |
|
| Total short-cycle | 116,000 |
| | 128,589 |
| | 42,882 |
| | 56,571 |
| | 34,698 |
| | 34,170 |
| | 193,580 |
| | 219,330 |
|
| Other products and services | — |
| | — |
| | — |
| | — |
| | 30,643 |
| | 32,987 |
| | 30,643 |
| | 32,987 |
|
| | $ | 116,000 |
| | $ | 128,589 |
| | $ | 42,882 |
| | $ | 56,571 |
| | $ | 104,815 |
| | $ | 89,434 |
| | $ | 263,697 |
| | $ | 274,594 |
|
|
| | | | | | | | | | | | | | | | | | | | | | | |
| Percentage of total revenue by type - | | | | | | | | | | | | | | | |
| Products | — | % | | — | % | | 98 | % | | 98 | % | | 77 | % | | 73 | % | | 46 | % | | 44 | % |
| Services | 100 | % | | 100 | % | | 2 | % | | 2 | % | | 23 | % | | 27 | % | | 54 | % | | 56 | % |
Cost of Revenues (exclusive of Depreciation and Amortization Expense). Our consolidated total cost of revenues were driven by U.S. shale play activity.
Our Well Site Services segment revenues increased $30.8(exclusive of depreciation and amortization expense) decreased $14.6 million, or 67%7%, in the third quarter of 20172019 compared to the third quarter of 2018. Consolidated product costs in the third quarter of 2019 increased $3.0 million, or 3%, from the third quarter of 2018 while consolidated product revenues increased 1% from the prior-year period. The year-over-year increase in product costs was driven by the increase in activity levels in the Offshore/Manufactured Products segment, partially offset by the activity-related decrease in product costs in the Downhole Technologies segment during the three months ended September 30, 2019. Consolidated service costs in the third quarter due to growth of both Completion Services and Drilling Services revenues. Our Completion Services revenues increased $22.02019 decreased $17.5 million, or 57%14%, from the third quarter of 2018, which included the impact of $2.6 million in expense related to the settlement of FLSA claims arising in prior years which was reported within the Well Site Services segment. The balance of the decline in consolidated service costs is due primarily to the impact of lower activity levels in U.S. shale play regions, partially offset by incremental costs in our Downhole Technologies segment associated with an expansion of field support operations.
Selling, General and Administrative Expense. Selling, general and administrative expense, in the third quarter of 2019 was consistent with expense in the third quarter of 2018. Higher annual incentive plan compensation and bad debt expense reported in the third quarter of 2019 was offset by the non-recurrence of $3.5 million of patent defense costs recorded during the third quarter of 2018.
Depreciation and Amortization Expense. Depreciation and amortization expense increased $0.8 million, or 3%, in the third quarter of 20172019 compared to the prior-year quarter driven primarily by investments in property and equipment over the past twelve months. Note 13, "Segments and Related Information," presents depreciation and amortization expense by segment.
Impairment of Fixed Assets. During the third quarter of 2016, with2019, we made the impactstrategic decision to reduce the scope of a higher commodity price environment and lower overall service costs driving increased U.S. land-based activity, partially offset byour Drilling Services business (with plans to adjust from 34 rigs to 9 rigs) due to the timing ofongoing weakness in customer activity in certain international markets. The number of Completion Services job ticketsdemand for vertical drilling rigs in the third quarter of 2017 increased 31% over the prior-year period and revenue per Completion Services job increased 20% year-over-year asU.S. land market. As a result of increased completions activity and a more favorable job mix. Ourthis decision, our Drilling Services revenues increased $8.8business recorded a non-cash impairment charge of $33.7 million or 119%, to $16.2decrease the carrying value of the unit’s fixed assets. See Note 4, “Details of Selected Balance Sheet Accounts,” to the unaudited condensed consolidated financial statements included in this Quarterly Report on Form 10‑Q, for further discussion.
Other Operating (Income) Expense, Net. Other operating (income) expense was relatively consistent between periods, with expense of $0.5 million in the third quarter of 2017 from the third quarter2019 and income of 2016 primarily as a result of increased utilization of our land drilling rigs from an average of 15% during the third quarter of 2016 to an average of 34% in the third quarter of 2017 coupled with increased dayrates.
Our Offshore/Manufactured Products segment revenues decreased $45.8 million, or 35%, in the third quarter of 2017 compared to the third quarter of 2016 primarily as a result of a decline in demand for deepwater project-driven products (including subsea pipeline infrastructure, offshore production and drilling products), lower levels of service activities and a backlog position that has trended lower since mid-2014. These deepwater project-driven revenue declines were partially offset by increases in sales of our short-cycle products, which increased 59% year-over-year. Shorter-cycle products, such as elastomers and valves, have benefited from increased land-based drilling and completion activity in the United States. Bidding and quoting activity, along with orders from customers, for our Offshore/Manufactured Products segment continued, albeit at a much slower pace. Reflecting the impact of customer delays and deferrals in approving major, capital intensive projects in light of the prolonged low commodity price environment, backlog in our Offshore/Manufactured Products segment decreased from $340 million at December 31, 2015 to $199 million at December 31, 2016. With a book to bill ratio of 1.0x in the first nine months of 2017, our backlog remained relatively flat at $198 million as of September 30, 2017.
Cost of Sales and Services. Our consolidated cost of sales and services decreased $6.6 million, or 5%, in the third quarter of 2017 compared to the third quarter of 2016 as a result of decreased cost of sales and services at our Offshore/Manufactured Products segment of $28.8 million, or 31%, which was partially offset by a $22.2 million, or 51%, increase in cost of services at our Well Site Services segment. Consolidated gross profit as a percentage of revenues decreased from 24% in the third quarter of 2016 to 21% in the third quarter of 2017, with gross margin expansion within our Well Site Services segment offset by the impact of a significant reduction in sales of project-driven products in our Offshore/Manufactured Products segment.
Our Well Site Services segment cost of services increased $22.2 million, or 51%, in the third quarter of 2017 compared to the third quarter of 2016 as a result of a $14.7 million, or 40%, increase in Completion Services cost of services and a $7.5 million, or 108%, increase in costs in our Drilling Services business. These increases in cost of services, which are strongly correlated to the revenue increases in these businesses, reflect the increase in land-based activity in the United States. Costs increases included higher personnel costs from increased employee overtime and costs associated with headcount additions made during the current year. Our Well Site Services segment gross profit as a percentage of revenues improved from 5% in the third quarter of 2016 to 14% in the third quarter of 2017. Our Completion Services gross profit as a percentage of revenues increased from 5% in the third quarter of 2016 to 15% in the third quarter of 2017 primarily due to the significant increase in revenue levels. Our Drilling Services gross profit as a percentage of revenues improved from 5% in the third quarter of 2016 to 10% in the third quarter of 2017, primarily due to increased rig utilization and cost absorption.
Our Offshore/Manufactured Products segment cost of sales decreased $28.8 million, or 31%, in the third quarter of 2017 compared to the third quarter of 2016 reflecting the decrease in project-driven activity. Gross profit as a percentage of revenues decreased from 31% in the third quarter of 2016 to 27% in the third quarter of 2017 driven primarily by the reported 70% decline in sales of project-driven products.
Selling, General and Administrative Expenses. Selling, general and administrative expenses decreased $3.5 million, or 12%, in the third quarter of 2017 from the prior-year quarter reflecting the impact of 2016 cost reduction measures, lower incentive compensation accruals and reduced employee severance-related charges in the third quarter of 2017.
Depreciation and Amortization. Depreciation and amortization expense decreased $3.1 million, or 10%, in the third quarter of 2017 compared to the third quarter of 2016 primarily due to certain assets becoming fully depreciated and overall lower levels of capital expenditures.
Other Operating (Income) Expense, Net. Other operating income declined from $1.4$0.2 million in the third quarter of 2016 to $0.62018.
Operating Income (Loss). Our consolidated operating loss was $34.9 million in the third quarter of 2017, primarily due to2019, which includes the impact of lower foreign currency exchange gains recognized in the current-year period.
Operating Loss. Our$33.7 million fixed asset impairment charge discussed above and $0.7 million of severance and downsizing charges. This compares to a consolidated operating loss increased from $15.6of $3.7 million in the third quarter of 2016 to $18.22018, which included $6.1 million in costs associated with patent defense and settlement of FLSA claims as discussed previously.
Interest Expense, Net. Net interest expense was $4.4 million in the third quarter of 2017 primarily2019, which compares to net interest expense of $4.8 million in the same period of 2018. Interest expense, which includes amortization of debt discount and deferred financing costs, as a resultpercentage of a decreasetotal debt outstanding was approximately 6% in operating income from our Offshore/Manufactured Products segment of $15.5 million due to a continued decline in offshore-related activity, offset by a decrease in operating loss of $12.9 million from our Well Site Services segment. Corporate expenses were $12.3 million inboth the third quarter of 2017, flat with the prior-year period.
Interest Expense2019 and Interest Income. Net2018. Our contractual cash interest expense decreased $0.2 million, or 14%, in the third quarter of 2017 compared to the third quarter of 2016 primarily due to a reduction in amounts outstanding under the Revolving Credit Facility (defined below) partially offset by higher unused commitment fees paid to our lenders. Interest expense as a percentage of total debt outstanding increased from 5.6%was substantially lower – averaging approximately 3% in both the third quarter of 2016 to 14.0% in the third quarter of 2017 due to an increased proportion of interest expense associated with unused commitment fees, lower average borrowings outstanding under the Revolving Credit Facilitythree months ended September 30, 2019 and non-cash amortization of debt issuance costs.2018.
Income TaxBenefit.Tax. The income tax provision for interim periods is based on estimates of the effective tax rate for the entire fiscal year. The Company’s income tax provisionbenefit for the three months ended September 30, 20172019 was ancalculated using a discrete approach. This methodology was used because minor changes in our results of operations and non-deductible expenses can materially impact the estimated annual effective tax rate. For the three months ended September 30, 2019, our income tax benefit of $4.0was $6.2 million, or 21%16.3% of pre-tax losses, comparedlosses. This compares to an income tax benefit of $6.0$3.8 million, or 36%48.8% of pre-tax losses, for the three months ended September 30, 2016.2018. The lower effective tax rate benefit infor the third quarterthree months ended September 30, 2019 was below the U.S. statutory rate primarily due to certain non-deductible expenses.
Other ComprehensiveLoss. Reported comprehensive loss is the sum of 2017 was primarily attributable to a shift in the mix between domestic pre-tax lossesreported net loss and foreign pre-tax income compared to the prior-year period, additional valuation allowances provided against net operating losses in certain domestic and foreign jurisdictions and incremental tax expense related to the decision to carryback 2016 net operating losses.
Other ComprehensiveIncome(Loss).other comprehensive loss. Other comprehensive incomeloss was $4.9$5.7 million in the third quarter of 20172019 compared to a loss of $5.2$2.5 million in the third quarter of 20162018 due to fluctuations in foreign currency exchange rates compared to the U.S. dollar for certain of the international operations of our reportable segments. For the three months ended September 30, 20172019 and 2016,2018, currency translation adjustments recognized as a component of other comprehensive income (loss)loss were primarily attributable to the United Kingdom and Brazil. During the third quarterquarters of 2017,both 2019 and 2018, the exchange rates for both the British pound and the Brazilian real strengthenedweakened compared to the U.S. dollar. This compares to the third quarter of 2016, when the exchange rates for the British pound weakened compared to the U.S. dollar, while the Brazilian real strengthened compared to the U.S. dollar. The British pound was impacted by the United Kingdom’s vote to exit the European Union in late June 2016.
Segment Operating Results
Nine Months Ended September 30, 2017 Compared to Nine Months Ended September 30, 2016
We reported a net loss for the nine months ended September 30, 2017 of $47.0 million, or $0.94 per diluted share, which included $2.0 million ($1.5 million after-tax, or $0.03 per diluted share) of severance and other downsizing charges and $1.0 million ($0.02 per diluted share) of additional tax expense related to the decision to carryback net operating losses incurred in 2016 against taxable income reported in 2014. Excluding these charges in the first nine months of 2017, the net loss would have been $44.5 million, or $0.89 per diluted share. These results compare to a net loss of $35.8 million, or $0.71 per diluted share for the nine months ended September 30, 2016, which included $4.6 million ($3.0 million after-tax, or $0.06 per diluted share) of severance and other downsizing charges. Excluding these charges in the first nine months of 2016, the net loss would have been $32.8 million, or $0.65 per diluted share.
During the third quarter of 2017, the Company’s consolidated results of operations were adversely affected by Hurricane Harvey which caused widespread damage and logistical challenges in Houston and the surrounding region where we operate five manufacturing facilities and employ about 500 individuals. The Company was impacted by lower revenues and under-absorption of manufacturing facility costs primarily in its Offshore/Manufactured Products segment but also suffered some field-level downtime due to employee dislocations resulting from the storm. One of the Company's Houston facilities experienced significant flooding and is not yet operational but was fully insured. Project work in that facility has been shifted to other manufacturing locations to meet customer delivery requirements.
Our consolidated results of operations also reflect current industry trends and customer spending activities which are focused on growth in the U.S. shale play regions with weaker U.S. Gulf of Mexico and international activity. In addition, investments in deepwater markets globally have slowed since the start of the recent industry downturn in 2014.
Revenues. Consolidated revenues in the first nine months of 2017 decreased $37.6 million, or 7%, from the first nine months of 2016 due to declines in our Offshore/Manufactured Products segment, partially offset by improvements in our Well Site Services segment. In the first nine months of 2017, over 50% of consolidated revenues were driven by U.S. shale play activity.
Revenues.Our Well Site Services segment revenues decreased $12.6 million, or 10%, in the third quarter of 2019 compared to the prior-year quarter. Completion Services revenue decreased $7.7 million, or 7%, due to the impact of a decline in U.S. land-based customer completion and production activity following the material decline in commodity prices in the fourth quarter of 2018. Our Drilling Services revenues decreased $4.9 million, or 29%, in the third quarter of 2019 from the third quarter of 2018 due to lower rig utilization.
Operating Loss. Our Well Site Services segment operating loss increased $75.9$29.3 million in the third quarter of 2019 from the prior-year period. Reported results for the Well Site Services segment for the third quarter of 2019 included the impact within Drilling Services of the $33.7 million non-cash fixed asset impairment charge discussed previously as well as $0.6 million of incremental reserves for uncollectible accounts receivable due to uncertainties with respect to future collection. Well Site Services segment revenues and cost of services for the third quarter of 2019 decreased 10% and 17%, respectively, from the prior-year quarter, with other costs and expenses remaining relatively consistent. Our Completion Services operating income in the third quarter of 2019 was $1.7 million, compared to an operating loss of $3.3 million in the prior-year quarter, reflecting the impact of lower revenues
partially offset by reduced equipment repair, maintenance and rental expense. Additionally, results in the third quarter of 2018 included a $2.6 million charge associated with the additional reserves established for previous FLSA claims. Our Drilling Services operating loss increased $34.3 million in the third quarter of 2019 from the third quarter of 2018 due primarily to the $33.7 million non-cash fixed asset impairment charge discussed previously and a decline in customer activity levels.
Downhole Technologies
Revenues. Our Downhole Technologies segment revenues decreased $13.7 million, or 24%, in the third quarter of 2019 from the prior-year period due to a decline in U.S. land-based customer completion activity, a shift in sales mix and competitive pricing pressures for certain of its conventional perforating products.
Operating Income. Our Downhole Technologies segment operating income declined $5.8 million in the third quarter of 2019 from the prior-year period due primarily to the decline in revenues coupled with higher product and engineering costs and an expansion of field support operations. Prior-year results included $3.5 million in patent defense costs incurred in the third quarter of 2018.
Offshore/Manufactured Products
Revenues. Our Offshore/Manufactured Products segment revenues increased $15.4 million, or 17%, in the third quarter of 2019 compared to the third quarter of 2018 driven primarily by higher project-driven product demand.
Operating Income. Our Offshore/Manufactured Products segment operating income increased $4.1 million, or 58%, in the first nine monthsthird quarter of 20172019 compared to the prior-year periodthird quarter of 2018 due to growth of both Completion Services and Drilling Services revenues. Our Completion Services revenues increased $50.8 million, or 44%, in the first nine months of 2017 compared to the first nine months of 2016, with the impact of a higher commodity price environment and lower service costs driving increased U.S. land-based activity, partially offset by the timing of customer activity in certain international markets. The number of Completion Services job tickets in the first nine months of 2017 increased 23% over the prior-year period and revenue per Completion Services job increased 17% year-over-year as a result of increased completions activity, a more favorable job mix and improved pricing. Our Drilling Services revenues increased $25.1 million, or 179%, to $39.1 million in the first nine months of 2017 from the first nine months of 2016 due to higher utilization of our land drilling rigs, which increased from an average of 10% during the first nine months of 2016 to an average of 28% in the first nine months of 2017.
Our Offshore/Manufactured Products segment revenues decreased $113.5 million, or 29%, in the first nine months of 2017 compared to the first nine months of 2016 primarily as a result of a decline in demand for deepwater project-driven products (primarily subsea pipeline infrastructure, offshore production and drilling products), lower levels of service activities and a backlog position that has trended lower since mid-2014. These deepwater project-driven revenue declines were partially offset by a 76% increase in sales of our short-cycle products. Shorter-cycle products, such as elastomers and valves, have benefited from increased land-based drilling and completion activity in the United States.revenues.
Backlog. Bidding and quoting activity, along with orders from customers, for our Offshore/Manufactured Products segment continued albeit at a much slower pace. Reflectingto improve during the impactthird quarter of customer delays and deferrals in approving major, capital intensive projects in light2019 with deepwater project awards increasing after several years of the prolonged low commodity price environment, backlogreduced award activity. Backlog in our Offshore/Manufactured Products segment decreasedincreased $10 million from $340$283 million at December 31, 2015June 30, 2019 to $199total $293 million at December 31,as of September 30, 2019 – the highest level recorded since the first quarter of 2016. WithOrders totaled $123 million in the third quarter of 2019 resulting in a book-to-bill ratio of 1.0x1.2x.
Corporate
Expenses increased $0.1 million, or 1%, in the third quarter of 2019 from the prior-year period.
Nine Months Ended September 30, 2019 Compared to Nine Months Ended September 30, 2018
Consolidated Operating Results
We reported a net loss for the nine months ended September 30, 2019 of $56.3 million, or $0.95 per diluted share, which included a non-cash fixed asset impairment charge of $33.7 million ($26.6 million after-tax, or $0.45 per diluted share) and $2.9 million ($2.3 million after-tax, or $0.04 per diluted share) of severance and downsizing costs. These results compare to a net loss for the nine months ended September 30, 2018 of $4.8 million, or $0.08 per diluted share, which included $5.9 million ($4.7 million after-tax, or $0.08 per diluted share) of charges related to legal fees incurred for patent defense and $3.3 million ($2.6 million after-tax, or $0.04 per diluted share) in provisions for prior years' FLSA claim settlements, $2.6 million ($2.0 million after-tax, or $0.03 per diluted share) of transaction-related expense and $0.8 million ($0.6 million after-tax, or $0.01 per diluted share) of severance. Additionally, during the nine months ended September 30, 2018 the Company recognized a $5.8 million ($0.10 per diluted share) income tax benefit related to a change in its December 2017 provisional estimates with respect to U.S. tax reform legislation.
Our consolidated results of operations include the GEODynamics (Downhole Technologies segment) and Falcon acquisitions completed in the first quarter of 2018. Our reported results of operations reflect the impact of current industry trends and customer spending activities with investments weighted toward U.S. shale play regions. However, in 2019, we are beginning to see a general improvement in the level of planned investments in deepwater markets globally.
Revenues. Consolidated total revenues in the first nine months of 2017,2019 decreased $35.0 million, or 4%, from the first nine months of 2018. Consolidated product revenues in the first nine months of 2019 decreased $21.9 million, or 6%, from the first nine months of 2018, due primarily to lower U.S. land-based customer activity and the impact of competitive pricing pressures for conventional perforating products in our backlog remained relatively flat at $198Downhole Technologies segment, partially offset by higher project-driven sales within our Offshore/Manufactured Products segment. Consolidated service revenues in the first nine months of 2019 decreased $13.1 million, asor 3%, from the first nine months of 2018, with the impact of lower customer spending in the U.S. shale play regions in the Well Site Services segment partially offset by the impact of two additional months of revenue generated by the Falcon operations (acquired February 28, 2018) in the 2019 period. As can be derived from the following table, 75% of our consolidated revenues in the first nine months of 2019 were derived from sales of our short-cycle product and service offerings, which compares to 77% in the same period in 2018.
The following table provides supplemental disaggregated revenue from contracts with customers by operating segment for the nine months ended September 30, 2017.2019 and 2018 (in thousands):
|
| | | | | | | | | | | | | | | | | | | | | | | | | | | | | | | |
| | Well Site Services | | Downhole Technologies | | Offshore/ Manufactured Products | | Total |
| Nine months ended September 30 | 2019 | | 2018 | | 2019 | | 2018 | | 2019 | | 2018 | | 2019 | | 2018 |
| Major revenue categories - | | | | | | | | | | | | | | | |
| Project-driven products | $ | — |
| | $ | — |
| | $ | — |
| | $ | — |
| | $ | 105,236 |
| | $ | 98,301 |
| | $ | 105,236 |
| | $ | 98,301 |
|
| Short-cycle: | | | | | | | | | | | | | | | |
| Completion products and services | 307,928 |
| | 302,877 |
| | 143,912 |
| | 161,626 |
| | 80,250 |
| | 90,218 |
| | 532,090 |
| | 554,721 |
|
| Drilling services | 32,430 |
| | 51,235 |
| | — |
| | — |
| | — |
| | — |
| | 32,430 |
| | 51,235 |
|
| Other products | — |
| | — |
| | — |
| | — |
| | 21,472 |
| | 21,718 |
| | 21,472 |
| | 21,718 |
|
| Total short-cycle | 340,358 |
| | 354,112 |
| | 143,912 |
| | 161,626 |
| | 101,722 |
| | 111,936 |
| | 585,992 |
| | 627,674 |
|
| Other products and services | — |
| | — |
| | — |
| | — |
| | 87,765 |
| | 88,040 |
| | 87,765 |
| | 88,040 |
|
| | $ | 340,358 |
| | $ | 354,112 |
| | $ | 143,912 |
| | $ | 161,626 |
| | $ | 294,723 |
| | $ | 298,277 |
| | $ | 778,993 |
| | $ | 814,015 |
|
|
| | | | | | | | | | | | | | | | | | | | | | | |
| Percentage of total revenue by type - | | | | | | | | | | | | | | | |
| Products | — | % | | — | % | | 97 | % | | 98 | % | | 76 | % | | 76 | % | | 47 | % | | 47 | % |
| Services | 100 | % | | 100 | % | | 3 | % | | 2 | % | | 24 | % | | 24 | % | | 53 | % | | 53 | % |
Cost of SalesRevenues (exclusive of Depreciation and ServicesAmortization Expense). Our consolidated total cost of salesrevenues (exclusive of depreciation and servicesamortization expense) decreased $21.0$9.9 million, or 2%, in the first nine months of 2019 compared to the first nine months of 2018. Consolidated product costs in the first nine months of 2019 were comparable to the level reported in the first nine months of 2018 despite a 6% decrease in product revenue as a result of higher costs within the Downhole Technologies segment. The Downhole Technologies segment experienced an unfavorable shift in product mix, incurred higher product costs and recorded $1.4 million of inventory write-offs due to product design changes during the nine months ended September 30, 2019. Consolidated service costs in the first nine months of 2019 decreased $9.1 million, or 3%, from the first nine months of 2018, which included the impact of $3.3 million in costs associated with the settlement of prior-year FLSA claims. The balance of the decrease in service costs
from the 2018 period is due primarily to the activity-driven revenue decline within the Well Site Services segment, partially offset by incremental costs in our Downhole Technologies segment associated with an expansion of field support operations.
Selling, General and Administrative Expense. Selling, general and administrative expense decreased $8.9 million, or 9%, in the first nine months of 2019 from the first nine months of 2018. The first nine months of 2018 included $5.9 million of patent defense costs and $0.9 million of transaction-related costs. Excluding these items from the first nine months of 2018, selling, general and administrative expense declined $2.1 million, or 2%, due primarily to a year-over-year reduction in stock-based compensation expense.
Depreciation and Amortization Expense. Depreciation and amortization expense increased $4.1 million, or 5%, in the first nine months of 20172019 compared to the prior-year period reflecting the impact of the GEODynamics and Falcon operations acquired in the first nine monthsquarter of 2016 as a result of decreased cost of sales and services at our Offshore/Manufactured Products segment of $76.6 million, or 28%,2018, which was partially offset by the effect of certain assets becoming fully depreciated. Note 13, "Segments and Related Information," presents depreciation and amortization expense by segment.
Impairment of Fixed Assets. During the third quarter of 2019, our Drilling Services business recorded a $55.5non-cash impairment charge of $33.7 million or 44%, increaseto decrease the carrying value of the unit’s fixed assets as discussed previously. See Note 4, “Details of Selected Balance Sheet Accounts,” to the unaudited condensed consolidated financial statements included in costthis Quarterly Report on Form 10‑Q, for further discussion.
Other Operating (Income) Expense, Net. Other operating income of services at our Well Site Services segment. Consolidated gross profit as a percentage of revenues decreased from 24%$2.1 million in the first nine months of 2016 to 22%2018 included a $3.6 million gain recognized upon settlement of a Hurricane Harvey flood insurance claim, partially offset by $1.7 million in transaction-related expenses.
Operating Income (Loss). Our consolidated operating loss was $52.1 million in the first nine months of 2017 with gross margin expansion within our Well Site Services segment offset by2019, which included the impact of the $33.7 million fixed asset impairment charge discussed previously and $2.9 million of severance and downsizing charges. This compares to a significant reduction in sales of project-driven products in our Offshore/Manufactured Products segment.
Our Well Site Services segment cost of services increased $55.5 million, or 44%, in the first nine months of 2017 compared to the first nine months of 2016 as a result of a $35.1 million, or 31%, increase in Completion Services cost of services and a $20.4 million, or 142%, increase in service costs in our Drilling Services business. These increases in cost of services, which are strongly correlated to the revenue increases in these businesses, reflect the increase in land-based activity in the United States. Costs increases included higher personnel costs from increased employee overtime and costs associated with headcount additions made during the nine months of 2017. Our Well Site Services segment gross profit as a percentage of revenues increased from 4% in the first nine months of 2016 to 12% in the first nine months of 2017. Our Completion Services gross profit as a percentage of revenues increased from 4% in the first nine months of 2016 to 12% in the first nine months of 2017 primarily due to the increase in revenues. Our Drilling Services gross profit as a percentage of revenues improved from (3)% in the first nine months of 2016 to 11% in the first nine months of 2017 primarily due to increased rig utilization and cost absorption.
Our Offshore/Manufactured Products segment cost of sales decreased $76.6 million, or 28%, in the first nine months of 2017 compared to the first nine months of 2016 reflecting the decrease in project-driven revenues. Gross profit as a percentage of revenues decreased from 30% in the first nine months of 2016 to 29% in the first nine months of 2017, due primarily to the reported 62% decline in sales of project-driven products, which was partially offset by a 76% increase in sales of short-cycle products.
Selling, General and Administrative Expenses. Selling, general and administrative expenses decreased $6.8 million, or 7%, in the first nine months of 2017 from the prior-year period primarily due to the impact of 2016 cost reduction initiatives and lower employee severance-related charges in the first nine months of 2017, partially offset by higher incentive compensation accruals.
Depreciation and Amortization. Depreciation and amortization expense decreased $7.1 million, or 8%, in the first nine months of 2017 compared to the first nine months of 2016 primarily due to certain assets becoming fully depreciated coupled with overall lower levels of capital expenditures.
Other Operating (Income) Expense, Net. Other operating (income) expense, net moved from otherconsolidated operating income of $4.1 million in the first nine months of 2016 to other operating2018, which included the $3.6 million insurance settlement gain discussed previously, offset by $9.2 million of costs associated with patent defense and settlement of FLSA claims and $3.4 million of transaction-related, severance and downsizing charges.
Interest Expense, Net. Net interest expense of $0.4was $13.7 million in the first nine months of 2017, reflecting primarily the impact2019, which is comparable to net interest expense of foreign currency exchange gains or losses recognized$14.1 million in the respective periods.
Operating Loss. Our consolidated operating loss increased from $52.9 millionsame period of 2018. Interest expense, which includes amortization of debt discount and deferred financing costs, as a percentage of total debt outstanding was approximately 6% in both the first nine months of 2016 to $60.0 million in the first nine months of 2017 primarily as a result of a decrease in operating income from our Offshore/Manufactured Products segment of $40.4 million due to a continued decline in offshore-related activity, partially offset by a decreased operating loss of $35.7 million from our Well Site Services segment. Corporate expenses were $37.3 million in the first nine months of 2017, an increase of $2.5 million from the prior-year period due primarily to higher incentive compensation accruals2019 and increased stock-based compensation expense.
Interest Expense and Interest Income. Net2018. Our contractual cash interest expense decreased $0.7 million, or 18%, in the first nine months of 2017 compared to the first nine months of 2016 primarily due to a reduction in amounts outstanding under the Revolving Credit Facility partially offset by higher unused commitment fees paid to our lenders. Interest expense as a percentage of total debt outstanding increased from 5.6%was substantially lower – averaging approximately 3% in both the first nine months of 2016 to 14.5% in the first nine months of 2017 due to an increased proportion of interest expense associated with unused commitment fees, lower average borrowings outstanding under the Revolving Credit Facilityended September 30, 2019 and non-cash amortization of debt issuance costs.2018.
Income TaxBenefit.Tax. The income tax provision for interim periods is based on estimates of the effective tax rate for the entire fiscal year. The Company’s income tax provisionbenefit for the nine months ended September 30, 20172019 was ancalculated using a discrete approach. This methodology was used because minor changes in our results of operations and non-deductible expenses can materially impact the estimated annual effective tax rate. For the nine months ended September 30, 2019, our income tax benefit of $15.7was $6.7 million, or 25%10.7% of pre-tax losses, comparedlosses. This compares to an income tax benefit of $20.5$3.3 million, or 36%41.1% of pre-tax losses, for the nine months ended September 30, 2016.2018. The lower effective tax rate benefit infor the first nine months of 2017ended September 30, 2019 was below the U.S. statutory rate primarily attributabledue to a shift in the mix between domestic pre-tax losses and foreign pre-tax income compared to the prior-year period, additional valuation allowances provided against net operating losses in certain domestic and foreign jurisdictions, and incremental tax expense related to the decision to carryback 2016 U.S. net operating losses against 2014 taxable income.non-deductible expenses.
Other ComprehensiveIncome(Loss).Loss. Reported comprehensive loss is the sum of reported net loss and other comprehensive loss. Other comprehensive incomeloss was $13.5$5.5 million in the first nine months of 20172019 compared to a loss of $12.5$11.2 million in the first nine months of 20162018 due to fluctuations in foreign currency exchange rates compared to the U.S. dollar for certain of the international operations of our reportable segments. For the nine months ended September 30, 20172019 and 2016,2018, currency translation adjustments recognized as a component of other comprehensive income (loss)loss were primarily attributable to the United Kingdom and Brazil. During the first nine months of 2017,both periods, the exchange ratesrate for the British pound and the Brazilian real strengthened compared to the U.S. dollar. This compares todollar weakened.
Segment Operating Results
Well Site Services
Revenues. Our Well Site Services segment revenues decreased $13.8 million, or 4%, in the first nine months of 2016, when exchange rates for the British pound weakened2019 compared to the prior-year period. Completion Services revenue increased $5.1 million, or 2%, reflecting two additional months of revenue generated by the acquired Falcon operations (acquired February 28, 2018) in the 2019 period, partially offset by the impact of a decline in U.S. dollar, whileland-based customer completion and production activity following the Brazilian real strengtheneddecline in commodity prices in the fourth quarter of 2018. Our Drilling Services revenues decreased $18.8 million, or 37%, to $32.4 million in the first nine months of 2019 from the same period in 2018 due to a reduction in customer vertical drilling operations following the material decline in commodity prices in the fourth quarter of 2018.
Operating Loss. Our Well Site Services segment operating loss increased $31.9 million in the first nine months of 2019 from the prior-year period due primarily to the impact within Drilling Services of the $33.7 million non-cash fixed asset impairment charge discussed above. Well Site Services segment cost of services for the first nine months of 2019 decreased 6% from the prior-year period, with other costs and expenses remaining relatively flat. Our Completion Services operating loss in the first nine months of 2019 decreased $4.3 million, or 65%, from the prior-year period, which included $3.3 million in charges associated with additional reserves established for prior-year FLSA claims. Our Drilling Services operating loss increased $36.2 million in the first nine months of 2019 from the same period in 2018 due to the $33.7 million non-cash fixed asset impairment charge discussed previously and, to a lesser extent, the impact of a 46% reduction in rig utilization.
Downhole Technologies
Revenues. Our Downhole Technologies segment revenues decreased $17.7 million, or 11%, in the first nine months of 2019 from the prior-year period due primarily to a decline in U.S. land-based customer completion activity, a shift in sales mix and competitive pricing pressures for certain of its conventional perforating products.
Operating Income. Our Downhole Technologies segment operating income declined $22.9 million, or 88%, in the first nine months of 2019 from the prior-year period due primarily to the decline in revenues coupled with an expansion of field support operations, higher product and engineering costs and $1.4 million of inventory write-offs due to product design changes. Prior-year results included $5.9 million in patent defense costs incurred after our acquisition of GEODynamics.
Offshore/Manufactured Products
Revenues. Our Offshore/Manufactured Products segment revenues declined $3.6 million, or 1%, in the first nine months of 2019 compared to the U.S. dollar.prior-year period, with a decrease in sales of short-cycle products substantially offset by higher sales of project-driven products.
Operating Income. Our Offshore/Manufactured Products segment operating income decreased $6.0 million, or 19%, in the first nine months of 2019 compared to the same period in 2018, due to the 2018 period including a non-recurring gain of $3.6 million from an insurance settlement discussed above. Excluding this gain in the prior-year period, operating income decreased $2.4 million, or 7%, due to a shift in product and service mix.
Backlog. Bidding and quoting activity, along with orders from customers, for our Offshore/Manufactured Products segment improved during the first nine months of 2019 with deepwater project awards increasing after several years of reduced award activity. Backlog in our Offshore/Manufactured Products segment increased $114 million from $179 million at December 31, 2018 to total $293 million as of September 30, 2019 – the highest level recorded since the first quarter of 2016. Orders totaled $430 million in the first nine months of 2019 resulting in a book-to-bill ratio of 1.5x.
Corporate
Expenses decreased $4.6 million, or 11%, in the first nine months of 2019 from the prior-year period, which included transaction related expenses of $2.4 million. The British pound was impacted bybalance of the United Kingdom’s voteyear-over-year decrease is attributable to exit the European Union in late June 2016.lower stock-based compensation expenses.
Liquidity, Capital Resources and Other Matters
Our primary liquidity needs are to fund operating and capital expenditures which, in the past, have included expanding and upgrading our Offshore/Manufactured Products and Downhole Technologies manufacturing facilities and equipment, replacing and increasing Completion Services assets, funding new product development, and general working capital needs. In addition, capital has been used to repay debt, fund strategic business acquisitions and fund our share repurchase program, and fund strategic business acquisitions.program. Our primary sources of funds have been cash flow from operations, proceeds from borrowings under the Revolving Credit Facility,our credit facilities and capital markets transactions.
The crude oil and natural gas industry is highly cyclical which may result in declines in the demand for, and prices of, our products and services, or the inability or failure of our customers to meet their obligations to us.us or a sustained decline in our market capitalization. These and other potentially adverse market conditions could require us to incur additional asset impairment charges, record additional deferred tax valuation allowances and/or write down the value of our goodwill and other intangible assets, and may otherwise adversely impact our results of operations, and our cash flows and our financial position. See Note 4, "Details of Selected Balance Sheet Accounts," for further information.
Operating Activities
Despite generally weak market conditions, cashCash flows from operations totaling $76.3$115.9 million were provided by continuing operationsgenerated during the first nine months of 20172019 compared to $107.8$80.1 million provided by continuing operationsgenerated during the same period of 2016.2018. During the first nine months of 2017, $25.52019, $38.0 million was provided fromby net working capital reductions with decreases, primarily due to a reduction in accounts receivable. These working capital benefits were partially offset by an increase in inventories. During the first nine months of 2018, $24.9 million was used to fund net working capital increases, driven primarily by increases in accounts receivable, income taxes receivable and inventories, partially offset by the impact of a $17.3 million increase in income taxes receivable. During the first nine months of 2016, $64.6 million was provided from net working capital reductions primarily due to decreasesincreases in accounts receivablepayable and inventories.
accrued liabilities.
Investing Activities
Cash used in investing activities during the first nine months of 2017 was $32.72019 totaled $43.7 million, compared to $24.4$446.8 million used in investing activities during the first nine months of 2016. 2018, when we invested net cash of $379.7 million for the acquisitions of GEODynamics and Falcon.
On January 12, 2018, we acquired GEODynamics for a purchase price consisting of (i) $295.4 million in cash (net of cash acquired), which we funded from borrowings under our Revolving Credit Facility, (ii) 8.66 million shares of our common stock and (iii) an unsecured $25 million promissory note.
On February 28, 2018, we acquired Falcon for cash consideration of $84.2 million (net of cash acquired), which we funded from borrowings under our Revolving Credit Facility.
Capital expenditures totaled $20.3$45.8 million and $23.9$71.3 million during the first nine months of 20172019 and 2016,2018, respectively. During the first nine months
We expect to spend a total of 2017, we also invested $12.9$60 million withinto $62 million in capital expenditures during 2019 to replace and upgrade our Completion Services equipment, to expand and maintain Downhole Technologies' facilities and equipment, to upgrade and maintain our Offshore/Manufactured Products segmentfacilities and equipment, and to acquire complementary intellectual property and assets to expand our global crane manufacturing and service operations as well as our riser testing, inspection and repair service offerings.
After considering the $20.3 million invested during the first nine months of 2017, we expect to spend between $30 million and $35 million in totalfund various other capital expenditures during 2017, which compares to $30 million spent in 2016.spending projects. Whether planned expenditures will actually be spent in 20172019 depends on industry conditions, project approvals and schedules, vendor delivery timing, free cash flow generation and careful monitoring of our levels of liquidity. We plan to fund these capital expenditures with available cash, internally generated funds and borrowings under theour Revolving Credit Facility. The foregoing capital expenditure forecast doesexpectations do not include any funds forthat might be spent on future strategic acquisitions, which the Company could pursue depending on the economic environment in our industry and the availability of transactions at prices deemed to be attractive to the Company.
At September 30, 2017, substantially all of our cash was held by our international subsidiaries. Our intent is to utilize at least a portion of these cash balances for future investment outside of the United States. Approximately $37 million of cash held by our international subsidiaries can be repatriated by us without triggering any incremental tax consequences.
Financing Activities
During the nine months ended September 30, 2017,2019, net cash of $48.6$76.9 million was used in financing activities, primarily as a result of repayment of $26.6including $71.1 million of borrowingsnet repayments under theour Revolving Credit Facility and repurchases of our common stock totaling $16.3 million in the second quarter of 2017.Facility. This compares to $63.7$348.6 million of cash used inprovided by financing activities during the nine months ended September 30, 2016,2018, primarily as a result of repaying outstanding debtour issuance of $200.0 million in 1.50% convertible senior notes and $160.6 million in net borrowings under theour Revolving Credit Facility.Facility used to fund acquisitions.
At September 30, 2019, we had cash totaling $14.7 million, the majority of which was held by our international subsidiaries.
We believe that cash on hand, cash flow from operations and available borrowings under theour Revolving Credit Facility will be sufficient to meet our liquidity needs in the coming twelve months. If our plans or assumptions change, or are inaccurate, or if we make further acquisitions, we may need to raise additional capital. Acquisitions have been, and our management believes acquisitions will continue to be, a key element of our business strategy. The timing, size or success of any acquisition effort and the associated potential capital commitments are unpredictable and uncertain. We may seek to fund all or part of any such efforts with proceeds from debt and/or equity issuances. Our ability to obtain capital for additional projects to implement our growth strategy over the longer term will depend upon our future operating performance, financial condition and, more broadly, on the availability of equity and debt financing. Capital availability will be affected by prevailing conditions in our industry, the global economy, the global financial markets and other factors, many of which are beyond our control. In addition, such additional debt service requirements could be based on higher interest rates and shorter maturities and could impose a significant burden on our results of operations and financial condition, and any issuance of additional equity securities could result in significant dilution to stockholders.
Share Repurchase Program. On July 29, 2015,Revolving Credit Facility. Our Revolving Credit Facility is governed by a credit agreement dated as of January 30, 2018, as amended, (the "Credit Agreement") by and among the Company’s Board of Directors approved a new share repurchase program providingCompany, the Lenders party thereto, Wells Fargo Bank, N.A., as administrative agent for the repurchase oflenders party thereto and collateral agent for the secured parties thereunder, and the lenders and other financial institutions from time to time party thereto. Our Revolving Credit Facility provides for up to $150.0$350 million of the Company’s common stock, which, following extension, was scheduled to expire on July 29, 2017. On July 26, 2017, our Board of Directors extended the share repurchase program for one year to July 29, 2018. During the first nine months of 2017, the Company repurchased 562 thousand shares of common stock under the program at a total cost of $16.3 million. The amount remaining under our share repurchase authorization as of September 30, 2017 was $120.5 million. Subject to applicable securities laws, such purchases will be at such times and in such amounts as the Company deems appropriate.
Credit Facility. The Company has a $600 million senior secured revolving credit facility (the “Revolving Credit Facility”)lender commitments with an option to increase the maximum borrowings to $750$500 million subject to additional lender commitments prior to its maturityand matures on May 28, 2019. January 30, 2022.
Under our Revolving Credit Facility, $50 million is available for the issuance of letters of credit. See Note 6, "Long-term Debt," for further information regarding the terms of the Credit Agreement.
As of September 30, 2017,2019, we had $15.6$65.0 million inof borrowings outstanding under the Credit Agreement (as defined below) and an additional $21.6$22.6 million of outstanding letters of credit, leaving $146.5$139.1 million available to be drawn under the Revolving Credit Facility. As of September 30, 2017, amounts available to be drawn under the Revolving Credit Facility plus cash and cash equivalents totaled $212.4 million.drawn. The total amount available to be drawn was less than the lender commitments as of September 30, 2017,2019, due to the maximum leverage ratio covenant in the Credit Agreement which serves to limit borrowings. We expect our availability to continue to be limitedlimits imposed by the maximum leverage ratio covenant during the remainder of 2017 and into 2018 based upon our forecast of our trailing twelve-month EBITDA (as defined in the Credit Agreement and further discussed below).
The Revolving Credit Facility is governed by a Credit Agreement dated as of May 28, 2014, as amended, (the “Credit Agreement”) by and among the Company, the Lenders party thereto, Wells Fargo Bank, N.A., as administrative agent, the Swing Line Lender and an Issuing Bank; Royal Bank of Canada, as Syndication agent; and Compass Bank, as Documentation agent. Amounts outstanding under the Revolving Credit Facility bear interest at LIBOR plus a margin of 1.50% to 2.50%, or at a base rate plus a margin of 0.50% to 1.50%, in each case based on a ratio of the Company’s total leverage to EBITDA. During the first nine months of 2017, our applicable margin over LIBOR was 1.50%. We must also pay a quarterly commitment fee, based on our leverage ratio, on the unused commitments under the Credit Agreement. The unused commitment fee was 0.375% during the first nine months of 2017. Interest expense as a percentage of total debt outstanding increased from 5.6% in the first nine months of 2016 to 14.5% in the first nine months of 2017. The increase in the weighted average interest rate was attributable to an increased proportion of interest expense associated with unused commitment fees, lower average borrowings outstanding under the Revolving Credit Facility and non-cash amortization of debt issuance costs.
The Credit Agreement contains customary financialmaintenance covenants and restrictions. Specifically, we must maintain an interest coverage ratio, defined as the ratio of consolidated EBITDA to consolidated interest expense, of at least 3.0 to 1.0 and a maximum leverage ratio, defined as the ratio of total debt to consolidated EBITDA, of no greater than 3.25 to 1.0. Each of the factors considered in the calculations of these ratios are defined in the Credit Agreement. EBITDA and consolidated interest, as defined, exclude goodwill impairments, losses on extinguishment of debt, debt discount amortization, and other non-cash charges. As of September 30, 2017,2019, we were in compliance with our debt covenants and expect to continue to be in compliance duringover the remaindernext twelve months.
1.50% Convertible Senior Notes. On January 30, 2018, we issued $200 million aggregate principal amount of 2017. Borrowingsthe Notes pursuant to an indenture, dated as of January 30, 2018 (the "Indenture"), between the Company and Wells Fargo Bank, National Association, as trustee. Net proceeds from the Notes, after deducting issuance costs, were approximately $194.0 million, which we used to repay a portion of the outstanding borrowings under our Revolving Credit Facility.
During the third quarter of 2019, we repurchased $1.0 million in principal amount of the outstanding Notes for $0.9 million, which approximated the net carrying value.
The initial carrying amount of the Notes recorded in the consolidated balance sheet was less than the $200 million in principal amount of the Notes, in accordance with applicable accounting principles, reflective of the estimated fair value of a similar debt instrument that does not have a conversion feature. We recorded the value of the conversion feature as a debt discount, which is amortized as interest expense over the term of the Notes, with a similar amount allocated to additional paid-in capital. As a result of this amortization, the interest expense we recognize related to the Notes for accounting purposes is based on an effective interest rate of approximately 6.0%, which is greater than the cash interest payments we are obligated to pay on the Notes. Recorded interest expense associated with the Notes for the three and nine months ended September 30, 2019 was $2.6 million and $7.7 million, respectively, while the related contractual cash interest expense totaled $0.8 million and $2.3 million, respectively. Recorded interest expense associated with the Notes for the three and nine months ended September 30, 2018 was $2.5 million and $6.6 million, respectively, while the related contractual cash interest expense totaled $0.8 million and $2.0 million, respectively. See Note 6, "Long-term Debt," for further information regarding the Notes. As of September 30, 2019, none of the conditions allowing holders of the Notes to convert, or requiring us to repurchase the Notes, had been met.
Promissory Note. In connection with the GEODynamics Acquisition, we issued a $25.0 million promissory note that bears interest at 2.5% per annum and was scheduled to mature on July 12, 2019. Payments due under the Credit Agreementpromissory note are secured bysubject to set-off, in full or in part, against certain indemnification claims related to matters occurring prior to our acquisition of GEODynamics. As more fully described in Note 14, "Commitments and Contingencies," the Company has provided notice to and asserted an indemnification claim against the seller of GEODynamics. As a pledge of substantially all of our assets and the assets of our domestic subsidiaries. Our obligations under the Credit Agreement are guaranteed by our significant domestic subsidiaries.
Under the Credit Agreement, the occurrence of specified change of control events involving our Company would constitute an event of default that would permit the banks to, among other things, accelerateresult, the maturity date of the facility and cause it to become immediately due and payablenote is extended until the resolution of the indemnity claim. The Company expects that the amount ultimately paid in full.
respect of such note may be reduced as a result of this indemnification claim.
Our total debt represented 1.6%16.1% of our combined total debt and stockholders’stockholders' equity at September 30, 20172019 compared to 3.7%18.7% at December 31, 2016.2018.
Stock Repurchase Program. We maintain a share repurchase program which was extended to July 29, 2020 by our Board of Directors. During the first nine months of 2019, we repurchased approximately 51 thousand shares of our common stock under the program at a total cost of $757 thousand. The amount remaining under our share repurchase authorization as of September 30, 2019 was $119.8 million. Subject to applicable securities laws, any purchases will be at such times and in such amounts as the Company deems appropriate.
Critical Accounting Policies
For a discussion of the critical accounting policies and estimates that we use in the preparation of our condensed consolidated financial statements, see “Item"Part II Item 7. Management’sManagement's Discussion and Analysis of Financial Condition and Results of Operations”Operations" in our 20162018 Form 10-K.10‑K. These estimates require significant judgments, assumptions and estimates. We have discussed the development, selection, and disclosure of these critical accounting policies and estimates with the audit committee of our Board of Directors. There have been no material changes to the judgments, assumptions, and estimates upon which our critical accounting estimates are based. ForSee Note 2, "Recent Accounting Pronouncements," for a discussion of recent accounting pronouncements, see Note 2, “Recent Accounting Pronouncements.”
including our adoption of the new lease accounting standard effective January 1, 2019.
Off-Balance Sheet Arrangements
As of September 30, 2017,2019, we had no off-balance sheet arrangements as defined in Item 303(a)(4)(ii) of Regulation S-K.
ITEM 3.Quantitative and Qualitative Disclosures about Market Risk
Market risk refers to the potential losses arising from changes in interest rates, foreign currency fluctuations and exchange rates, equity prices, and commodity prices, including the correlation among these factors and their volatility.
Our principal market risks are our exposure to changes in interest rates and foreign currency exchange rates. We enter into derivative instruments only to the extent considered necessary to meet risk management objectives and do not use derivative contracts for speculative purposes.
Interest Rate Risk
We have a revolving credit facility that is subject to the risk of higher interest charges associated with increases in interest rates. As of September 30, 2017,2019, we had floating-rate obligations totaling $15.6$65.0 million drawn under theour Revolving Credit Facility. These floating-rate obligations expose us to the risk of increased interest expense in the event of increases in short-term interest rates. If the floating interest rates increased by 1% from September 30, 20172019 levels, our consolidated interest expense would increase by a total of approximately $0.2$0.7 million annually.
Foreign Currency Exchange Rate Risk
Our operations are conducted in various countries around the world and we receive revenue from these operations in a number of different currencies. As such, our earnings are subject to movements in foreign currency exchange rates when transactions are denominated in (i) currencies other than the U.S. dollar, which is our functional currency, or (ii) the functional currency of our subsidiaries, which is not necessarily the U.S. dollar. In order to mitigate the effects of foreign currency exchange rate risks in areas outside of the United States (primarily in our Offshore/Manufactured Products segment), we generally pay a portion of our expenses in local currencies and a substantial portion of our contracts provide for collections from customers in U.S. dollars. During the nine months ended September 30, 2017,2019, our reported foreign currency exchange losses were $0.6$0.2 million and are included in “Other"Other operating (income) expense, net”net" in the Consolidated Statementscondensed consolidated statements of Operations. In order to reduce our exposure to fluctuations in foreign currency exchange rates, we may enter into foreign currency exchange agreements with financial institutions. As of September 30, 2017 and December 31, 2016, we had outstanding foreign currency forward purchase contracts with notional amounts of $2.4 million related to expected cash flows denominated in Euros.
operations.
Our accumulated other comprehensive loss, reported as a component of stockholders’stockholders' equity, decreasedincreased $5.5 million from $70.3$71.4 million at December 31, 20162018 to $56.8$76.9 million at September 30, 2017,2019, due to changes in currency exchange rates. Accumulated other comprehensive loss is primarily related to fluctuations in the currency exchange rates compared to the U.S. dollar which are used to translate certain of the international operations of our reportable segments. For the nine months ended September 30, 2017, currency translation adjustments recognized as a component of other comprehensive income were primarily attributable to the United Kingdom and Brazil. As of September 30, 2017, the exchange rates for the British pound and the Brazilian real compared to the U.S. dollar strengthened by 8% and 3%, respectively, compared to the exchange rates at December 31, 2016, contributing to other comprehensive income of $13.5 million reported for the nine months ended September 30, 2017.
ITEM 4.Controls and Procedures
Evaluation of Disclosure Controls and Procedures
As of the end of the period covered by this Quarterly Report on Form 10-Q, we carried out an evaluation, under the supervision and with the participation of our management, including our Chief Executive Officer and Chief Financial Officer, of the effectiveness of the design and operation of our disclosure controls and procedures (as defined in Rules 13a-15(e) and 15d-15(e)) of the Exchange Act. Our disclosure controls and procedures are designed to provide reasonable assurance that the information required to be disclosed by us in reports that we file under the Exchange Act is accumulated and communicated to our management, including our Chief Executive Officer and Chief Financial Officer, as appropriate, to allow timely decisions regarding required disclosure and is recorded, processed, summarized and reported within the time periods specified in the rules and forms of the Commission. Based upon that evaluation, our Chief Executive Officer and Chief Financial Officer concluded that our disclosure controls and procedures were effective as of September 30, 20172019 at the reasonable assurance level.
Changes in Internal ControlOverFinancial Reporting
During the nine months ended September 30, 2017, there wereThere have been no changes in ourthe Company's internal control over financial reporting (as that term is defined in Rules 13a-15(f) and 15d-15(f) ofunder the Exchange Act), which have that occurred during the three months ended September 30, 2019, that has materially affected, our internal control over financial reporting, or areis reasonably likely to materially affect, our internal control over financial reporting.
PART II -- OTHER INFORMATION
ITEM 1.Legal Proceedings
The information with respect to this Item 1 is set forth under Note 13, “Commitments14, "Commitments and Contingencies.”
"
ITEM 1A.Risk Factors
“"Part I, Item 1A. Risk Factors”Factors" of our 20162018 Form 10-K10‑K includes a detailed discussion of our risk factors. The risks described in this Quarterly Report on Form 10-Q10‑Q and our 20162018 Form 10-K10‑K are not the only risks we face. Additional risks and uncertainties not currently known to us, or that we currently deem to be immaterial, also may materially adversely affect our business, financial conditionconditions or future results. There have been no material changes to our risk factors as set forth in our 20162018 Form 10-K.
10‑K.
ITEM 2.Unregistered Sales of Equity Securities and Use of Proceeds
None.
Purchases of Equity Securities by the Issuer and Affiliated Purchasers
|
| | | | | | | | | | | | | | |
| Period | | Total Number of Shares Purchased(1) | | Average Price Paid per Share(1) | | Total Number of Shares Purchased as Part of Publicly Announced Plans or Programs | | Approximate Dollar Value of Shares That May Yet Be Purchased Under the Plans or Programs(2) |
| July 1 through July 31, 2017 | | 57 |
| | $ | 26.55 |
| | — |
| | $ | 120,544,560 |
|
| August 1 through August 31, 2017 | | 4,354 |
| | 21.52 |
| | — |
| | 120,544,560 |
|
| September 1 through September 30, 2017 | | 420 |
| | 24.45 |
| | — |
| | 120,544,560 |
|
| Total | | 4,831 |
| | $ | 21.83 |
| | — |
| | |
|
|
| | | | | | | | | | | | | | |
| Period | | Total Number of Shares Purchased(1) | | Average Price Paid per Share(1) | | Total Number of Shares Purchased as Part of Publicly Announced Plans or Programs | | Approximate Dollar Value of Shares That May Yet Be Purchased Under the Plans or Programs(2) |
| July 1 through July 31, 2019 | | 627 |
| | $ | 14.87 |
| | — |
| | $ | 119,788,435 |
|
| August 1 through August 31, 2019 | | 4,199 |
| | 13.27 |
| | — |
| | 119,788,435 |
|
| September 1 through September 30, 2019 | | 692 |
| | 15.52 |
| | — |
| | 119,788,435 |
|
| Total | | 5,518 |
| | $ | 13.73 |
| | — |
| | |
| |
| (1) | All of the 4,831 shares purchased during the three-month period ended September 30, 20172019 were acquired from employees in connection with the settlement of income tax and related benefit withholding obligations arising from vesting in restricted stock grants. These shares were not part of a publicly announced program to purchase common stock. |
| |
| (2) | On July 29, 2015, the Company’s Board of Directors approvedWe maintain a new share repurchase program providing for the repurchase of up to $150 million of the Company’sCompany's common stock, which, following extension,extensions, was scheduled to expire on July 29, 2017.2019. On July 26, 2017,24, 2019, our Board of Directors extended the share repurchase program for one year to July 29, 2018.2020. |
ITEM 3.Defaults Upon Senior Securities
None.
ITEM4.Mine Safety Disclosures.
Disclosures
Not applicable.
ITEM 5.Other Information
None.
ITEM 6.Exhibits
The exhibits required to be filed by Item 6. are set forth in the Exhibit Index accompanying this Quarterly Report on Form 10‑Q.
SIGNATURES
Pursuant to the requirements of the Securities Exchange Act of 1934, the registrant has duly caused this report to be signed on its behalf by the undersigned thereunto duly authorized.
OIL STATES INTERNATIONAL, INC.
|
| | | | | |
| | | | | |
Date: | October 27, 2017 | | By | /s/ LLOYD A. HAJDIK | |
| | | | Lloyd A. Hajdik | |
| | | | Executive Vice President, Chief Financial Officer and | |
| | | | Treasurer (Duly Authorized Officer and Principal Financial Officer) | |
Exhibit Index
|
| | |
| Exhibit No. | | Description |
| | | |
| — | |
| | | |
| — | |
| | | |
| — | |
| | | |
| — | |
| | |
| — | |
| | |
| — | |
| | | |
| — | |
| | | |
| — | |
| | | |
| — | |
| | | |
| 101.INS* | — | XBRL Instance Document |
| | | |
| 101.SCH* | — | XBRL Taxonomy Extension Schema Document |
| | | |
| 101.CAL* | — | XBRL Taxonomy Extension Calculation Linkbase Document |
| | | |
| 101.DEF* | — | XBRL Taxonomy Extension Definition Linkbase Document.Document |
| | | |
| 101.LAB* | — | XBRL Taxonomy Extension Label Linkbase Document |
| | | |
| 101.PRE* | — | XBRL Taxonomy Extension Presentation Linkbase Document |
---------
* Filed herewith.
** Furnished herewith.
SIGNATURES
Pursuant to the requirements of the Securities Exchange Act of 1934, the registrant has duly caused this report to be signed on its behalf by the undersigned thereunto duly authorized.
|
| | | | | |
| | | | OIL STATES INTERNATIONAL, INC. | |
| | | | | |
| | | | | |
| Date: | October 28, 2019 | | By | /s/ LLOYD A. HAJDIK | |
| | | | Lloyd A. Hajdik | |
| | | | Executive Vice President, Chief Financial Officer and | |
| | | | Treasurer (Duly Authorized Officer and Principal Financial Officer) | |