UNITED STATES
SECURITIES AND EXCHANGE COMMISSION
WASHINGTON, D.C.  20549
FORM 10-Q

QUARTERLY REPORT PURSUANT TO SECTION 13 OR 15(d) OF THE SECURITIES EXCHANGE ACT OF 1934
 For the quarterly period ended March 31, 20222023
 Or
TRANSITION REPORT PURSUANT TO SECTION 13 OR 15(d) OF THE SECURITIES EXCHANGE ACT OF 1934
 For the transition period from _____________ to _____________

Commission file number 001-31220

COMMUNITY TRUST BANCORP, INC.
(Exact name of registrant as specified in its charter)

Kentucky61-0979818
(State or other jurisdiction of incorporation or organization)(IRS Employer Identification No.)
  
346 North Mayo Trail
P.O. Box 2947
Pikeville, Kentucky
41502
(Address of principal executive offices)(Zip code)

(606) 432-1414
(Registrant’s telephone number)

Securities registered pursuant to Section 12(b) of the Act:

(606) 432-1414
(Registrant’s telephone number)
Securities registered pursuant to Section 12(b) of the Act:
Common Stock
(Title of class)

CTBI
NasdaqNASDAQ Global Select Market
(Trading symbol)(Name of exchange on which registered)

Indicate by check mark whether the registrant (1) has filed all reports required to be filed by Section 13 or 15(d) of the Securities Exchange Act of 1934 during the preceding 12 months (or for such shorter period that the registrant was required to file such reports) and (2) has been subject to such filing requirements for the past 90 days.

Yes 
No

Indicate by check mark whether the registrant has submitted electronically every interactive data file required to be submitted pursuant to Rule 405 of Regulation S-T during the preceding 12 months (or for such shorter period that the registrant was required to submit such files).

Yes 
No

Indicate by check mark whether the registrant is a large accelerated filer, an accelerated filer, a non-accelerated filer, a smaller reporting company, or an emerging growth company.  See definitions of “large accelerated filer,” “accelerated filer,” “smaller reporting company,” and “emerging growth company” in Rule 12b-2 of the Exchange Act.

Large Accelerated Filer
Accelerated Filer 
Non-accelerated Filer 
   
Smaller Reporting Company
Emerging Growth Company
 

If an emerging growth company, indicate by check mark if the registrant has elected not to use the extended transition period for complying with any new or revised financial accounting standards provided pursuant to Section 13(a) of the Exchange Act.       

Indicate by check mark whether the registrant is a shell company (as defined in Rule 12b-2 of the Exchange Act).

Yes
   No

Indicate the number of shares outstanding of each of the issuer’s classes of common stock, as of the latest practical date.

Common stock – 17,895,18117,983,700 shares outstanding at April 30, 20222023


CAUTIONARY STATEMENT
REGARDING FORWARD LOOKING STATEMENTS

Certain of the statements contained herein that are not historical facts are forward-looking statements within the meaning of the Private Securities Litigation Reform Act. Community Trust Bancorp, Inc.’s (“CTBI”) actual results may differ materially from those included in the forward-looking statements. Forward-looking statements are typically identified by words or phrases such as “believe,” “expect,” “anticipate,” “intend,” “estimate,” “may increase,” “may fluctuate,” and similar expressions or future or conditional verbs such as “will,” “should,” “would,” and “could.” These forward-looking statements involve risks and uncertainties including, but not limited to, economic conditions, portfolio growth, the credit performance of the portfolios, including bankruptcies, and seasonal factors; changes in general economic conditions including the performance of financial markets, prevailing inflation and interest rates, realized gains from sales of investments, gains from asset sales, and losses on commercial lending activities; the effects ofepidemics, pandemics, or other infectious disease outbreaks, including the continuation of the COVID-19 pandemic on our business operations and credit quality and on general economic and financial market conditions, as well as our ability to respond to the related challenges; our participation in the Paycheck Protection Program administered by the Small Business Administration;; results of various investment activities; the effects of competitors’ pricing policies, changes in laws and regulations, competition, and demographic changes on target market populations’ savings and financial planning needs; industry changes in information technology systems on which we are highly dependent; failure of acquisitions to produce revenue enhancements or cost savings at levels or within the time frames originally anticipated or unforeseen integration difficulties; and the resolution of legal  proceedings and related matters. In addition, the banking industry in general is subject to various monetary, operational, and fiscal policies and regulations, which include, but are not limited to, those determined by the Federal Reserve Board, the Federal Deposit Insurance Corporation, the Consumer Financial Protection Bureau, and state regulators, whose policies, regulations, and enforcement actions could affect CTBI’s results.  These statements are representative only on the date hereof, and CTBI undertakes no obligation to update any forward-looking statements made.

PART I - FINANCIAL INFORMATION

Item 1. Condensed Consolidated Financial Statements

The accompanying information has not been audited by our independent registered public accountants; however, in the opinion of management such information reflects all adjustments necessary for a fair presentation of the results for the interim period.  All such adjustments are of a normal and recurring nature.

The accompanying condensed consolidated financial statements are presented in accordance with the requirements of Form 10-Q and consequently do not include all of the disclosures normally required by accounting principles generally accepted in the United States of America or those normally made in the Registrant’s annual report on Form 10-K.  Accordingly, the reader of the Form 10-Q should refer to the Registrant’s Form 10-K for the year ended December 31, 20212022 for further information in this regard.

1


Community Trust Bancorp, Inc.
Condensed Consolidated Balance Sheets

(dollars in thousands) 
(unaudited)
March 31
2022
  
December 31
2021
  
(unaudited)
March 31
2023
  
December 31
2022
 
Assets:            
Cash and due from banks $58,352  $46,558  $60,762  $51,306 
Interest bearing deposits  106,133   265,198   175,112   77,380 
Cash and cash equivalents  164,485   311,756   235,874   128,686 
                
Certificates of deposit in other banks  245   245   245   245 
Debt securities available-for-sale at fair value (amortized cost of $1,588,129 and $1,461,829, respectively)
  1,503,165   1,455,429 
Debt securities available-for-sale at fair value (amortized cost of $1,390,747 and $1,430,605, respectively)
  1,241,080   1,256,226 
Equity securities at fair value  2,352   2,253   2,380   2,166 
Loans held for sale  1,941   2,632   182   109 
                
Loans  3,515,541   3,408,813   3,777,359   3,709,290 
Allowance for credit losses  (42,309)  (41,756)  (46,683)  (45,981)
Net loans  3,473,232   3,367,057   3,730,676   3,663,309 
                
Premises and equipment, net  40,738   40,479   42,636   42,633 
Right-of-use assets  11,941   12,148 
Operating right-of-use assets  13,805
   13,809
 
Finance right-of-use assets  3,232   3,262 
Federal Home Loan Bank stock  8,139   8,139   4,826   6,676 
Federal Reserve Bank stock  4,887   4,887   4,887   4,887 
Goodwill  65,490   65,490   65,490   65,490 
Bank owned life insurance  91,530   91,097   93,324   92,746 
Mortgage servicing rights  7,748   6,774   8,121   8,468 
Other real estate owned  2,299   3,486   2,776   3,671 
Deferred tax asset
  19,574   0   31,653   39,878 
Accrued interest receivable  15,024   15,415   19,012   19,592 
Other assets  30,343   30,970   29,121   28,463 
Total assets $5,443,133  $5,418,257  $5,529,320  $5,380,316 
                
Liabilities and shareholders’ equity:                
Deposits:                
Noninterest bearing $1,398,529  $1,331,103  $1,409,839  $1,394,915 
Interest bearing  3,029,775   3,013,189   3,133,585   3,031,228 
Total deposits  4,428,304   4,344,292   4,543,424   4,426,143 
                
Repurchase agreements  254,623   271,088   208,777   215,431 
Federal funds purchased  500   500   500   500 
Advances from Federal Home Loan Bank  370   375   350   355 
Long-term debt  57,841   57,841   64,404   57,841 
Deferred tax liability  0   546 
Operating lease liability  11,380   11,583   14,148   14,160 
Finance lease liability  1,416   1,422   3,471   3,468 
Accrued interest payable  1,306   1,016   4,138   2,237 
Other liabilities  34,022   31,392   33,287   32,134 
Total liabilities  4,789,762   4,720,055   4,872,499   4,752,269 
                
Shareholders’ equity:                
Preferred stock, 300,000 shares authorized and unissued
  0   0   -   - 
Common stock, $5.00 par value, shares authorized 25,000,000; shares outstanding 202217,884,106; 202117,843,081
  89,420   89,215 
Common stock, $5.00 par value, shares authorized 25,000,000; shares issued and outstanding 202317,976,345; 202217,918,280
  89,881   89,591 
Capital surplus  227,589   227,085   229,333   229,012 
Retained earnings  399,347   386,750   450,044   438,596 
Accumulated other comprehensive loss, net of tax  (62,985)  (4,848)  (112,437)  (129,152)
Total shareholders’ equity  653,371   698,202   656,821   628,047 
                
Total liabilities and shareholders’ equity $5,443,133  $5,418,257  $5,529,320  $5,380,316 

See notes to condensed consolidated financial statements.

2

Community Trust Bancorp, Inc.
Condensed Consolidated Statements of Income and Comprehensive Income (Loss)
(unaudited)

 Three Months Ended  Three Months Ended 
 March 31  March 31 
(in thousands except per share data) 2022  2021  2023  2022 
Interest income:            
Interest and fees on loans, including loans held for sale $38,167  $40,689  $51,947  $38,167 
Interest and dividends on securities                
Taxable  4,384   2,575   6,758   4,384 
Tax exempt  772   739   682   772 
Interest and dividends on Federal Reserve Bank and Federal Home Loan Bank stock  114   124   174   114 
Interest on Federal Reserve Bank deposits  82   76   1,350   82 
Other, including interest on federal funds sold  8   8   84   8 
Total interest income  43,527   44,211   60,995   43,527 
                
Interest expense:                
Interest on deposits  2,954   3,387   14,391   2,954 
Interest on repurchase agreements and federal funds purchased  254   304   1,616   254 
Interest on advances from Federal Home Loan Bank  43   0 
Interest on long-term debt  287   278   1,029   287 
Total interest expense  3,495   3,969   17,079   3,495 
                
Net interest income  40,032   40,242   43,916   40,032 
Provision for credit losses (recovery)
  875   (2,499)
Net interest income after provision for credit losses (recovery)
  39,157   42,741 
Provision for credit losses
  1,116   875 
Net interest income after provision for credit losses
  42,800   39,157 
                
Noninterest income:                
Deposit related fees
  6,746   6,022   7,287   6,746 
Gains on sales of loans, net  597   2,433   121   597 
Trust and wealth management income  3,248   2,951   3,079   3,248 
Loan related fees  2,062   2,270   845   2,062 
Bank owned life insurance  691   573   858   691 
Brokerage revenue  590   457   348   590 
Securities gains (losses)  99   (168)
Securities gains
  218   99 
Other noninterest income  932   1,039   926   932 
Total noninterest income  14,965   15,577   13,682   14,965 
                
Noninterest expense:                
Officer salaries and employee benefits  3,882   3,738   4,152   3,882 
Other salaries and employee benefits  13,656   13,095   14,756   13,656 
Occupancy, net  2,245   2,195   2,302   2,245 
Equipment  609   633   726   609 
Data processing  2,201   2,159   2,303   2,201 
Bank franchise tax  415   360   419   415 
Legal fees  301   352   268   301 
Professional fees  566   541   548   566 
Advertising and marketing  752   722   820   752 
FDIC insurance  355   326   606   355 
Other real estate owned provision and expense  353   318   119   353 
Repossession expense  100   199   231   100 
Amortization of limited partnership investments  733   837   597   733 
Other noninterest expense  3,191   2,835   4,043   3,191 
Total noninterest expense  29,359   28,310   31,890   29,359 
                
Income before income taxes  24,763   30,008   24,592   24,763 
Income taxes  5,035   6,390   5,279   5,035 
Net income  19,728   23,618   19,313   19,728 
                
Other comprehensive income (loss):                
Unrealized holding losses on debt securities available-for-sale:        
Unrealized holding losses arising during the period  (78,564)  (13,456)
Unrealized holding gains (losses) on debt securities available-for-sale:        
Unrealized holding gains (losses) arising during the period  24,716   (78,564)
Less: Reclassification adjustments for realized gains included in net income  0   60   4   0 
Tax benefit  (20,427)  (3,514)
Other comprehensive loss, net of tax  (58,137)  (10,002)
Tax expense (benefit)
  7,997   (20,427)
Other comprehensive income (loss), net of tax  16,715   (58,137)
Comprehensive income (loss)
 $(38,409) $13,616  $36,028  $(38,409)
                
Basic earnings per share $1.11  $1.33  $1.08  $1.11 
Diluted earnings per share $1.11  $1.33  $1.08  $1.11 
                
Weighted average shares outstanding-basic  17,820   17,774   17,872   17,820 
Weighted average shares outstanding-diluted  17,832   17,787   17,884   17,832 

See notes to condensed consolidated financial statements.

3

Consolidated Statements of Changes in Shareholders’ Equity
(unaudited)

(in thousands except per share and share amounts) 
Common
Shares
  
Common
Stock
  
Capital
Surplus
  
Retained
Earnings
  
Accumulated
Other
Comprehensive
Income (Loss),
Net of Tax
  Total  
Common
Shares
  
Common
Stock
  
Capital
Surplus
  
Retained
Earnings
  
Accumulated
Other
Comprehensive
Income (Loss),
Net of Tax
  Total 
Balance, January 1, 2022
  17,843,081  $89,215  $227,085  $386,750  $(4,848) $698,202 
Balance, January 1, 2023
  17,918,280  $89,591  $229,012  $438,596  $(129,152) $628,047 
Net income              19,728       19,728               19,313       19,313 
Other comprehensive loss
                  (58,137)  (58,137)
Cash dividends declared ($0.40 per share)
              (7,131)      (7,131)
Other comprehensive income
                  16,715   16,715 
Cash dividends declared ($0.44 per share)
              (7,865)      (7,865)
Issuance of common stock  32,491   163   85           248   26,118   131   147           278 
Issuance of restricted stock  35,438   177   (177)          0   52,865   264   (264)          0 
Vesting of restricted stock  (26,904)  (135)  135           0   (20,128)  (101)  101           0 
Forfeiture of restricted stock
  (790)  (4)  4           0 
Stock-based compensation          461           461           333           333 
Balance, March 31, 2022
  17,884,106  $89,420  $227,589  $399,347  $(62,985) $653,371 
Balance, March 31, 2023
  17,976,345  $89,881  $229,333  $450,044  $(112,437) $656,821 

(in thousands except per share and share amounts) 
Common
Shares
  
Common
Stock
  
Capital
Surplus
  
Retained
Earnings
  
Accumulated
Other
Comprehensive
Income (Loss),
Net of Tax
  Total  
Common
Shares
  
Common
Stock
  
Capital
Surplus
  
Retained
Earnings
  
Accumulated
Other
Comprehensive
Income (Loss),
Net of Tax
  Total 
Balance, January 1, 2021  17,810,401  $
89,052  $
225,507  $
326,738  $
13,568  $
654,865 
Balance, January 1, 2022  17,843,081  $89,215  $227,085  $386,750  $(4,848) $698,202 
Net income              23,618       23,618               19,728       19,728 
Other comprehensive loss
                  (10,002)  (10,002)                  (58,137)  (58,137)
Cash dividends declared ($0.385 per share)
              (6,845)      (6,845)
Cash dividends declared ($0.40 per share)
              (7,131)      (7,131)
Issuance of common stock  24,163   121   117           238   32,491   163   85           248 
Issuance of restricted stock  9,193   46   (46)          0   35,438   177   (177)          0 
Vesting of restricted stock  (17,681)  (88)  88           0   (26,904)  (135)  135           0 
Stock-based compensation          195           195           461           461 
Balance, March 31, 2021
  17,826,076  $89,131  $225,861  $343,511  $3,566  $662,069 
Balance, March 31, 2022
  17,884,106  $89,420  $227,589  $399,347  $(62,985) $653,371 

See notes to condensed consolidated financial statements.

4

Community Trust Bancorp, Inc.
Condensed Consolidated Statements of Cash Flows
(unaudited)

 
Three Months Ended
March 31
 
(in thousands) 2022  2021 
Cash flows from operating activities:      
Net income $19,728  $23,618 
Adjustments to reconcile net income to net cash provided by operating activities:        
Depreciation and amortization  1,286   1,265 
Deferred taxes  307   (643)
Stock-based compensation  484   213 
Provision for credit losses (recovery)
  875   (2,499)
Write-downs of other real estate owned and other repossessed assets  246   154 
Gains on sale of mortgage loans held for sale  (597)  (2,433)
Securities gains
  0   (60)
Fair value adjustment in equity securities  (99)  228 
Gains on sale of assets, net  (5)  (214)
Proceeds from sale of mortgage loans held for sale  26,257   109,014 
Funding of mortgage loans held for sale  (24,969)  (101,070)
Amortization of securities premiums and discounts, net  1,801   1,893 
Change in cash surrender value of bank owned life insurance  (434)  (337)
Payment of operating lease liabilities  (469)  (445)
Mortgage servicing rights:        
Fair value adjustments  (745)  (780)
New servicing assets created  (229)  (736)
Changes in:        
Accrued interest receivable  391   630 
Other assets  627   1,634 
Accrued interest payable  290   122 
Other liabilities  2,605   2,152 
Net cash provided by operating activities  27,350   31,706 
         
Cash flows from investing activities:        
Securities available-for-sale (AFS):        
Purchase of AFS securities  (176,730)  (304,167)
Proceeds from sales of AFS securities  0   1,080 
Proceeds from prepayments, calls, and maturities of AFS securities  48,630   129,804 
Change in loans, net  (106,591)  15,747 
Purchase of premises and equipment  (1,072)  (403)
Proceeds from sale and retirement of premises and equipment  0   812 
Proceeds from sale of stock by Federal Home Loan Bank
  0   77 
Proceeds from sale of other real estate owned and repossessed assets  486   762 
Proceeds from settlement of bank owned life insurance
  1   0 
Net cash used in investing activities  (235,276)  (156,288)
         
Cash flows from financing activities:        
Change in deposits, net  84,012   217,690 
Change in repurchase agreements and federal funds purchased, net  (16,465)  (1,627)
Payments on advances from Federal Home Loan Bank  (5)  (5)
Payment of finance lease liabilities  (6)  (3)
Issuance of common stock  248   238 
Dividends paid  (7,129)  (6,841)
Net cash provided by financing activities  60,655   209,452 
Net increase (decrease) in cash and cash equivalents  (147,271)  84,870 
Cash and cash equivalents at beginning of period  311,756   338,235 
Cash and cash equivalents at end of period $164,485  $423,105 
         
Supplemental disclosures:        
Income taxes paid
 $50  $87 
Interest paid  3,205   3,847 
Non-cash activities:        
Loans to facilitate the sale of other real estate owned and repossessed assets  597   381 
Common stock dividends accrued, paid in subsequent quarter  250   242 
Real estate acquired in settlement of loans  137   (136)
 Three Months Ended
 
  March 31 
(in thousands) 2023  2022 
Cash flows from operating activities:      
Net income $19,313  $19,728 
Adjustments to reconcile net income to net cash provided by operating activities:        
Depreciation and amortization  907   813 
Non-cash operating lease expense  398   207 
Deferred taxes  228   307 
Stock-based compensation  377   484 
Provision for credit losses
  1,116   875 
Write-downs of other real estate owned and other repossessed assets  81   246 
Gains on sale of mortgage loans held for sale  (121)  (597)
Securities gains
  (4)  0 
Fair value adjustments in equity securities  (214)  (99)
Gains on sale of assets, net  (37)  (5)
Proceeds from sale of mortgage loans held for sale  4,658   26,257 
Funding of mortgage loans held for sale  (4,610)  (24,969)
Amortization of securities premiums and discounts, net  752   1,801 
Change in cash surrender value of bank owned life insurance  (578)  (434)
Changes in lease liabilities  (376)  (203)
Mortgage servicing rights:        
Fair value adjustments  397   (745)
New servicing assets created  (50)  (229)
Changes in:        
Accrued interest receivable  580   391 
Other assets  (658)  627 
Accrued interest payable  1,901   290 
Other liabilities  1,113   2,605 
Net cash provided by operating activities  25,173   27,350 
         
Cash flows from investing activities:        
Securities available-for-sale (AFS):        
Purchase of AFS securities  (161)  (176,730)
Proceeds from sales of AFS securities  18,561   0 
Proceeds from prepayments, calls, and maturities of AFS securities  20,710   48,630 
Change in loans, net  (67,837)  (106,591)
Purchase of premises and equipment  (910)  (1,072)
Proceeds from sale of stock by Federal Home Loan Bank
  1,850   0 
Proceeds from sale of other real estate owned and repossessed assets  204   486 
Proceeds from settlement of bank owned life insurance
  0   1 
Net cash used in investing activities  (27,583)  (235,276)
         
Cash flows from financing activities:        
Change in deposits, net  117,281   84,012 
Change in repurchase agreements and federal funds purchased, net  (6,654)  (16,465)
Proceeds from Federal Home Loan Bank advances  50,000   0 
Payments on advances from Federal Home Loan Bank  (50,005)  (5)
Payment of finance lease liabilities  0   (6)
Proceeds from long term debt/other borrowings  6,563   0 
Issuance of common stock  278   248 
Dividends paid  (7,865)  (7,129)
Net cash provided by financing activities  109,598   60,655 
Net increase (decrease) in cash and cash equivalents  107,188   (147,271)
Cash and cash equivalents at beginning of period  128,686   311,756 
Cash and cash equivalents at end of period $235,874  $164,485 
         
Supplemental disclosures:     
 

Income taxes paid
 $578  $50 
Interest paid  15,177   3,205 
Non-cash activities:        
Loans to facilitate the sale of other real estate owned and repossessed assets  698   597 
Common stock dividends accrued, paid in subsequent quarter  279   250 
Real estate acquired in settlement of loans  51   137 
Right-of-use assets obtained in exchange for new lease liabilities  364   0 

See notes to condensed consolidated financial statements.
5

Community Trust Bancorp, Inc.
Notes to Condensed Consolidated Financial Statements (unaudited)

Note 1 - Summary of Significant Accounting Policies


InIn the opinion of management, the unaudited condensed consolidated financial statements include all adjustments (which consist of normal recurring adjustments) necessary, to present fairly the condensed consolidated financial position as of March 31, 2022 and2023, the results of operations, other comprehensive income (loss), changes in shareholders’ equity, and the cash flows for the three months ended March 31, 20222023 and 2021.2022.  In accordance with accounting principles generally accepted in the United States of America for interim financial information, these statements do not include certain information and footnote disclosures required by accounting principles generally accepted in the United States of America for complete annual financial statements.  The results of operations, other comprehensive income (loss), changes in shareholders’ equity, and the cash flows for the three months ended March 31, 20222023 and 20212022 are not necessarily indicative of the results to be expected for the full year.  The condensed consolidated balance sheet as of December 31, 20212022 has been derived from the audited consolidated financial statements of Community Trust Bancorp, Inc. (“CTBI”) for that period.  For further information, refer to the consolidated financial statements and footnotes thereto for the year ended December 31, 2021,2022, included in our annual report on Form 10-K.


Principles of Consolidation – The unaudited condensed consolidated financial statements include the accounts of CTBI and its separate and distinct, wholly owned subsidiaries Community Trust Bank, Inc. (“CTB”) and Community Trust and Investment Company.  All significant intercompany transactions have been eliminated in consolidation.


New Accounting Standards


       Facilitation of the Effects of Reference Rate Reform on Financial ReportingIn April 2020,December 2022, the Financial Accounting Standards Board (“FASB”) issued Accounting Standards Update (“ASU”) 2020-04, No. 2022-06, Reference Rate Reform (Topic 848): Deferral of the Sunset Date of Topic 848, which extends the period of time preparers can utilize the reference rate reform relief guidance.  The amendments in ASU No. 2022-06 are effective for all entities upon issuance.  In 2020, the FASB issued ASU No. 2020-04, Reference Rate Reform (Topic 848): Facilitation of the Effects of Reference Rate Reform on Financial ReportingIn response, which provides optional guidance to concerns about structural risksease the potential burden in accounting for (or recognizing the effects of) reference rate reform on financial reporting.  The objective of interbank offered rates, and, particularly, the riskguidance in Topic 848 is to provide relief during the temporary transition period, so the FASB included a sunset provision within Topic 848 based on expectations of cessation ofwhen the London Interbank Offered Rate (“LIBOR”), regulators around the world have undertaken reference rate reform initiatives to identify alternative reference rates that are more observable or transaction-based and less susceptible to manipulation. would cease being published.  The amendments in this ASU No. 2020-04 provide optional guidance for a limited time to ease the potential burden in accounting for (or recognizing the effects of) reference rate reform on financial reporting and provide optional expedients and exceptions for applying generally accepted accounting principles (“GAAP”) to contracts, hedging relationships, and other transactions affected by reference rate reform if certain criteria are met.  This ASU applies only to contracts and hedging relationships that reference LIBOR or another reference rate expected to be discontinued due to reference rate reform.  The expedients and exceptions provided by the amendments do not apply to contract modifications made and hedging relationships entered into or evaluated after December 31, 2022.  An entityIn 2021, the UK Financial Conduct Authority delayed the intended cessation date of certain tenors of USD LIBOR to June 30, 2023. To ensure the relief in Topic 848 covers the period of time during which a significant number of modifications may elect to applytake place, ASU 2020-04 for contract modifications asNo. 2022-06 defers the sunset date of January 1, 2020, or prospectivelyTopic 848 from a date within an interim period that includes or is subsequent to March 12, 2020, up to the date that the financial statements are available to be issued.  We anticipate this ASU will simplify any modifications we execute between the selected start date (yet to be determined) and December 31, 2022, that are directly related to LIBOR transition.December 31, 2024, after which entities will no longer be permitted to apply the relief in Topic 848.  At this time, we do not anticipate any material adverse impact to our business operation or financial results during the period of transition.


➢     Financial InstrumentsCredit Losses (Topic 326):  Troubled Debt Restructurings and Vintage Disclosures – In February 2022, the FASB issued ASU 2022-02, Financial Instruments – Credit Losses (Topic 326): Troubled Debt Restructurings and Vintage Disclosures.  The amendments in this ASU eliminate the accounting guidance for troubled debt restructurings (“TDRs”) by creditors in Subtopic 310-40, Receivables—Troubled Debt Restructurings by Creditors, while enhancing disclosure requirements for certain loan refinancings and restructurings by creditors when a borrower is experiencing financial difficulty.  Specifically, rather than applying the recognition and measurement guidance for TDRs, an entity must apply the loan refinancing and restructuring guidance in paragraphs 310-20-35-9 through 35-11 to determine whether a modification results in a new loan or a continuation of an existing loan.   Additionally, for public business entities, the amendments in this ASU require that an entity disclose current-period gross write-offs by year of origination for financing receivables and net investments in leases within the scope of Subtopic 326-20, Financial Instruments—Credit Losses—Measured at Amortized Cost, in the vintage disclosures required by paragraph 326-20-50-6.  The amendments in the ASU have been implemented and did not have a significant impact to our consolidated financial statements.


6


➢       Fair Value Measurement of Equity Securities Subject to Contractual Sale Restrictions – In June 2022, the FASB issued ASU 2022-03, Fair Value Measurement Topic 820: Fair Value Measurement of Equity Securities Subject to Contractual Sale Restrictions.  The FASB issued this ASU to (1) clarify the guidance in Topic 820, Fair Value Measurement, when measuring the fair value of an equity security subject to contractual restrictions that prohibit the sale of an equity security, (2) amend a related illustrative example, and (3) introduce new disclosure requirements for equity securities subject to contractual sale restrictions that are measured at fair value in accordance with Topic 820.  The amendments in this ASU clarify that a contractual restriction on the sale of an equity security is not considered part of the unit of account of the equity security and, therefore, is not considered in measuring fair value.  The amendments also clarify that an entity cannot, as a separate unit of account, recognize and measure a contractual sale restriction.  The amendments in this ASU also require the following disclosures for equity securities subject to contractual sale restrictions: (1) the fair value of equity securities subject to contractual sale restrictions reflected in the balance sheet; (2) the nature and remaining duration of the restriction(s); and (3) the circumstances that could cause a lapse in the restriction(s).  For public business entities, the amendments in this ASU are effective for fiscal periodsyears beginning after December 22, 2022,15, 2023, and interim periods within those fiscal years.  Early adoption is permitted for both interim and annual financial statements that have not yet been issued or made available for issuance. We do not anticipate a significant impact to our consolidated financial statements.


➢         FASB Improves the Accounting for Investments in Tax Credit StructuresThe FASB issued, ASU No. 2023-02,Investments—Equity Method and Joint Ventures (Topic 323): Accounting for Investments in Tax Credit Structures Using the Proportional Amortization Method, which is intended to improve the accounting and disclosures for investments in tax credit structures. This ASU is a consensus of the FASB’s Emerging Issues Task Force (EITF).  This ASU allows reporting entities to elect to account for qualifying tax equity investments using the proportional amortization method, regardless of the program giving rise to the related income tax credits. This ASU responds to stakeholder feedback that the proportional amortization method provides investors and other allocators of capital with a better understanding of the returns from investments that are made primarily for the purpose of receiving income tax credits and other income tax benefits.  Reporting entities were previously permitted to apply the proportional amortization method only to qualifying tax equity investments in low-income housing tax credit (“LIHTC”) structures. In recent years, stakeholders asked the FASB to extend the application of the proportional amortization method to qualifying tax equity investments that generate tax credits through other programs, which resulted in the EITF addressing this issue.  For public business entities, the amendments are effective for fiscal years beginning after December 15, 2023, including interim periods within those fiscal years. The changes can beFor all other entities, the amendments are effective for fiscal years beginning after December 15, 2024, including interim periods within those fiscal years. Early adoption is permitted for all entities in any interim period; however, we do not plan to early adopted, separately by topic.adopt. We do not anticipate a significant impact to our consolidated financial statements.

67

Significant Accounting Policies –


The preparation of consolidated financial statements in conformity with accounting principles generally accepted in the United States of America requires the appropriate application of certain accounting policies, many of which require us to make estimates and assumptions about future events and their impact on amounts reported in our consolidated financial statements and related notes.  Since future events and their impact cannot be determined with certainty, the actual results will inevitably differ from our estimates.  Such differences could be material to our consolidated financial statements.


We believe the application of accounting policies and the estimates required therein are reasonable.  These accounting policies and estimates are constantly reevaluated, and adjustments are made when facts and circumstances dictate a change.  Historically, we have found our application of accounting policies to be appropriate, and actual results have not differed materially from those determined using necessary estimates.


We have identified the following significant accounting policies:


        Investments  Management determines the classification of securities at purchase.  We classify debt securities into held-to-maturity, trading, or available-for-sale categories.  Held-to-maturity (“HTM”) securities are those which we have the positive intent and ability to hold to maturity and are reported at amortized cost.  In accordance with FASB Accounting Standards Codification (“ASC”) 320, Investments – Debt Securities, investments in debt securities that are not classified as held-to-maturity shall be classified in one of the following categories and measured at fair value in the statement of financial position:

a. Trading securities. Securities that are bought and held principally for the purpose of selling them in the near term (thus held for only a short period of time) shall be classified as trading securities. Trading generally reflects active and frequent buying and selling, and trading securities are generally used with the objective of generating profits on short-term differences in price.

b. Available-for-sale securities. Investments not classified as trading securities (nor as HTM securities) shall be classified as available-for-sale (“AFS”) securities.


We do not have any securities that are classified as trading securities.  AFS securities are reported at fair value, with unrealized gains and losses included as a separate component of shareholders’ equity, net of tax.  If declines in fair value are other than temporary, the carrying value of the securities is written down to fair value as a realized loss with a charge to income for the portion attributable to credit losses and a charge to other comprehensive income for the portion that is not credit related.


For AFS debt securities in an unrealized loss position, we evaluate the securities to determine whether the decline in the fair value below the amortized cost basis (impairment) is due to credit-related factors or non-credit related factors.  Any impairment that is not credit-related is recognized in accumulated other comprehensive income, net of tax.  Credit-related impairment is recognized as an allowance for credit losses (“ACL”) for AFS debt securities on the balance sheet, limited to the amount by which the amortized cost basis exceeds the fair value, with a corresponding adjustment to earnings.  Accrued interest receivable on AFS debt securities is excluded from the estimate of credit losses.  Both the ACL for AFS debt securities and the adjustment to net income may be reversed if conditions change.  However, if we intend to sell an impaired AFS debt security or more likely than not will be required to sell such a security before recovering its amortized cost basis, the entire impairment amount would be recognized in earnings with a corresponding adjustment to the security’s amortized cost basis.  Because the security’s amortized cost basis is adjusted to fair value, there is no ACL for AFS debt securities in this situation.


In evaluating AFS debt securities in unrealized loss positions for impairment and the criteria regarding its intent or requirement to sell such securities, we consider the extent to which fair value is less than amortized cost, whether the securities are issued by the federal government or its agencies, whether downgrades by bond rating agencies have occurred, and the results of reviews of the issuers’ financial condition, among other factors.  There were no credit related factors underlying unrealized losses on AFS debt securities at March 31, 2023 and December 31, 2022, therefore, no ACL for AFS securities was recorded.

8


Changes in the ACL for AFS debt securities are recorded as expense.  Losses are charged against the ACL for AFS debt securities when management believes the uncollectability of an AFS debt security is confirmed or when either of the criteria regarding intent or requirement to sell is met.


Gains or losses on disposition of debt securities are computed by specific identification for those securities.  Interest and dividend income, adjusted by amortization of purchase premium or discount, is included in earnings.


An allowance is recognized for credit losses relative to AFS securities rather than as a reduction in the cost basis of the security.  Subsequent improvements in credit quality or reductions in estimated credit losses are recognized immediately as a reversal of the previously recorded allowance, which aligns the income statement recognition of credit losses with the reporting period in which changes occur.

7


HTM securities are subject to an allowance for lifetime expected credit losses, determined by adjusting historical loss information for current conditions and reasonable and supportable forecasts.  The forward-looking evaluation of lifetime expected losses will be performed on a pooled basis for debt securities that share similar risk characteristics.  These allowances for expected losses must be made by the holder of the HTM debt security when the security is purchased.  At March 31, 20222023 and December 31, 2021,2022, CTBI held 0no securities designated as held-to-maturity.HTM.


CTBI accounts for equity securities in accordance with ASC 321, Investments – Equity Securities. ASC 321 requires equity investments (except those accounted for under the equity method and those that result in the consolidation of the investee) to be measured at fair value, with changes in fair values recognized in net income.


Equity securities with a readily determinable fair value are required to be measured at fair value, with changes in fair value recognized in net income.  Equity securities without a readily determinable fair value are carried at cost, less any impairment, if any, plus or minus changes resulting from observable price changes for identical or similar investments.  As permitted by ASC 321-10-35-2, CTBI can make an irrevocable election to subsequently measure an equity security without a readily determinable fair value, and all identical or similar investments of the same issuer, including future purchases of identical or similar investments of the same issuer, at fair value.  CTBI has made this election for our Visa Class B equity securities.  The fair value of these securities was determined by a third party service provider using Level 3 inputs as defined in ASC 820, Fair Value Measurement, and changes in fair value are recognized in income.


        Loans  Loans with the ability and the intent to be held until maturity and/or payoff are reported at the carrying value of unpaid principal reduced by unearned interest, an allowance for credit losses, and unamortized deferred fees or costs and premiums.  Income is recorded on the level yield basis.  Interest accrual is discontinued when management believes, after considering economic and business conditions, collateral value, and collection efforts, that the borrower’s financial condition is such that collection of interest is doubtful.  Any loan greater than 90 days past due must be well secured and in the process of collection to continue accruing interest.  Cash payments received on nonaccrual loans generally are applied against principal, and interest income is only recorded once principal recovery is reasonably assured.  Loans are not reclassified as accruing until principal and interest payments remain current for a period of time, generally six months, and future payments appear reasonably certain. A restructuringWith the implementation of a debt constitutes a TDR ifASU 2022-02 described above in the creditorNew Accountings Standards, TDRs have been eliminated while enhanced disclosure requirements have been implemented for economic or legal reasons related to the debtor’s financial difficulties grants a concession to the debtor that it would not otherwise consider.


The Coronavirus Aid, Relief, and Economic Security Act (the “CARES Act”) included an election for banking institutions to not apply the guidance on accounting for TDRs tocertain loan modifications such as extensions or deferrals, related to COVID-19 made between March 1, 2020 and the earlier of (i) December 31, 2020 or (ii) 60 days after the end of the COVID-19 national emergency.  The relief can only be applied to modifications for borrowers that were not more than 30 days past due as of December 31, 2019.  The ability to exclude COVID-19-related modifications as TDRs was extended under the Consolidated Appropriations Act 2021 to the earlier of (i) 60 days after the end of the COVID-19 national emergency and (ii) January 1, 2022.  CTBI elected to adopt these provisions of the CARES Act, as extended by the Consolidated Appropriations Act 2021.when a borrower is experiencing financial difficulty.


Loan origination and commitment fees and certain direct loan origination costs are deferred and the net amount amortized over the estimated life of the related loans, or commitments as a yield adjustment.


        Allowance for Credit Losses  CTBI accounts for the allowance for credit losses under ASC 326. CTBI measures expected credit losses of financial assets on a collective (pool) basis using loss-rate methods when the financial assets share similar risk characteristics. Loans that do not share risk characteristics are evaluated on an individual basis. Regardless of an initial measurement method, once it is determined that foreclosure is probable, the allowance for credit losses is measured based on the fair value of the collateral as of the measurement date. As a practical expedient, the fair value of the collateral may be used for a loan when determining the allowance for credit losses for which the repayment is expected to be provided substantially through the operation or sale of the collateral when the borrower is experiencing financial difficulty. The fair value shall be adjusted for selling costs when foreclosure is probable. For collateral-dependent financial assets, the credit loss expected may be zero if the fair value less costs to sell exceed the amortized cost of the loan. Loans shall not be included in both collective assessments and individual assessments.

89


In the event that collection of principal becomes uncertain, CTBI has policies in place to reverse accrued interest in a timely manner. Therefore, CTBI elected ASU2019-04 which allows that accrued interest would continue to be presented separately and not part of the amortized cost of the loan. The methodology used by CTBI is developed using the current loan balance, which is then compared to amortized cost balances to analyze the impact. The difference in amortized cost basis versus consideration of loan balances impacts the allowance for credit losses calculation by one1 basis point and is considered immaterial. The primary difference is for indirect lending premiums.


We maintain an allowance for credit losses (“ACL”)ACL at a level that is appropriate to cover estimated credit losses on individually evaluated loans, as well as estimated credit losses inherent in the remainder of the loan and lease portfolio.  Credit losses are charged and recoveries are credited to the ACL.


We utilize an internal risk grading system for commercial credits. Those credits that meet the following criteria are subject to individual evaluation: the loan has an outstanding bank share balance of $1 million or greater and has a criticized risk rating and meets one of the following criteria: (i) has a criticized risk rating, (ii) is in nonaccrual status, (iii)(ii) the borrower is a TDR,experiencing financial difficulty with significant payment delay, or (iv)(iii) is 90 days or more past due. The borrower’s cash flow, adequacy of collateral coverage, and other options available to CTBI, including legal remedies, are evaluated. We evaluate the collectability of both principal and interest when assessing the need for loss provision. Historical loss rates are analyzed and applied to other commercial loan segments not subject to individual evaluation.


Homogenous loans, such as consumer installment, residential mortgages, and home equity lines are not individually risk graded.  The associated ACL for these loans is measured in pools with similar risk characteristics under ASC 326.


When any secured commercial loan is considered uncollectable, whether past due or not, a current assessment of the value of the underlying collateral is made. If the balance of the loan exceeds the fair value of the collateral, the loan is placed on nonaccrual and the loan is charged down to the value of the collateral less estimated cost to sell. For commercial loans greater than $1 million and classifiedthat are categorized as criticized, TDR, or nonaccrual,individually evaluated based on the criteria listed above, a specific reserve is established if a loss is determined to be possible and then charged-off once it is probable. When the foreclosed collateral has been legally assigned to CTBI, the estimated fair value of the collateral less costs to sell is then transferred to other real estate owned or other repossessed assets, and a charge-off is taken for any remaining balance.  When any unsecured commercial loan is considered uncollectable the loan is charged off no later than at 90 days days past due.


All closed-end consumer loans (excluding conventional 1-4 family residential loans and installment and revolving loans secured by real estate) are charged off no later than 120 days (5(five monthly payments) delinquent.  If a loan is considered uncollectable, it is charged off earlier than 120 days delinquent. For conventional 1-4 family residential loans and installment and revolving loans secured by real estate, when a loan is 90 days past due, a current assessment of the value of the real estate is made.  If the balance of the loan exceeds the fair value of the property, the loan is placed on nonaccrual. Foreclosure proceedings are normally initiated after 120 days. When the foreclosed property has been legally assigned to CTBI, the fair value less estimated costs to sell is transferred to other real estate owned and the remaining balance is taken as a charge-off.

10


Historical loss rates for loans are adjusted for significant factors that, in management’s judgment, reflect the impact of any current conditions on loss recognition.  With the implementation of ASC 326, weighted average life (“WAL”) calculations were completed as a tool to determine the life of CTBI’s various loan segments. Vintage modeling was used to determine the life of loan losses for consumer and residential real estate loans. Static pool modeling was used to determine the life of loan losses for commercial loan segments. Qualitative factors used to derive CTBI’s total ACL include delinquency trends, current economic conditions and trends, strength of supervision and administration of the loan portfolio, levels of underperforming loans, trends in loan losses, and underwriting exceptions.  Forecasting factors including unemployment rates and industry specific forecasts for industries in which our total exposure is 5% of capital or greater are also included as factors in the ACL model.  Management continually reevaluates the other subjective factors included in our ACL analysis.

9


        Goodwill and Core Deposit Intangible  We evaluate total goodwill and core deposit intangible for impairment, based upon ASC 350, Intangibles-Goodwill and Other, using fair value techniques including multiples of price/equity.  Goodwill and core deposit intangible are evaluated for impairment on an annual basis or as other events may warrant.


The balance of goodwill, at $65.5 million, has not changed since January 1, 2015.   Our core deposit intangible has been fully amortized since December 31, 2017.
 

        Income TaxesIncome tax expense is based on the taxes due on the consolidated tax return plus deferred taxes based on the expected future tax benefits and consequences of temporary differences between carrying amounts and tax bases of assets and liabilities, using enacted tax rates.  Any interest and penalties incurred in connection with income taxes are recorded as a component of income tax expense in our consolidated financial statements. During the quartersthree months ended March 31, 20222023 and 2021,2022, CTBI has not recognized a significant amount of interest expense or penalties in connection with income taxes. taxes.

Note 2 – Stock-Based Compensation


Restricted stock expense for the three months ended March 31, 2023 and 2022 and 2021 was $484$377 thousand and $213$484 thousand, respectively, including $23$44 thousand and $18$23 thousand, respectively, in dividends paid for those periods.  Restricted stock expense for the first quarter 2022 included the accelerated vesting of restricted stock related to employee retirement in the amount of $245 thousand, pursuant to the terms of CTBI’s 2015 Stock Ownership Incentive Plan.As of March 31, 2022,2023, there was a total of $2.2$4.0 million of unrecognized compensation expense related to restricted stock grants that will be recognized as expense as the awards vest over a weighted average period of 3.13.6 years.  There were 35,43852,865 and 9,19335,438 shares of restricted stock granted during the three months ended March 31, 20222023 and 2021,2022, respectively.  The restricted stock was issued pursuant to the terms of CTBI’s 2015 Stock Ownership Incentive Plan. The restrictions on the restricted stock will lapse ratably over four years. However, in the event of certain participant employee termination events occurring within 24 months of a change in control of CTBI or the death of the participant, the restrictions will lapse, and in the event of the participant’s disability, the restrictions will lapse on a pro rata basis.  The Compensation Committee will have discretion to review and revise restrictions applicable to a participant’s restricted stock in the event of the participant’s retirement. There were 790 shares of restricted stock forfeited during the three months ended March 31, 2023.  No shares were forfeited during the three months ended March 31, 2022.


There was 0no compensation expense related to stock option grants for the three months ended March 31, 2022 or 2021,2023 and 2022.As of March 31, 2023, there was no unrecognized compensation expense related to unvested stock option awards, as all stock option awards have fully vested.  There were 0no stock options granted in the first three months of 20222023 or 2021.2022.

Note 3 – Securities


Debt securities are classified into HTM and AFS categories.  HTM securities are those that CTBI has the positive intent and ability to hold to maturity and are reported at amortized cost.  AFS securities are those that CTBI may decide to sell if needed for liquidity, asset-liability management or other reasons.  AFS securities are reported at fair value, with unrealized gains or losses included as a separate component of equity, net of tax.  As of March 31, 20222023 and December 31, 2021,2022, CTBI had 0no HTM securities.

1011


The amortized cost and fair value of debt securities at March 3131,2022, 2023 are summarized as follows:

Available-for-Sale

(in thousands) 
Amortized
Cost
  
Gross
Unrealized
Gains
  
Gross
Unrealized
Losses
  Fair Value  
Amortized
Cost
  
Gross
Unrealized
Gains
  
Gross
Unrealized
Losses
  Fair Value 
U.S. Treasury and government agencies $472,210  $95  $(20,574) $451,731  $409,700  $153  $(30,632) $379,221 
State and political subdivisions  331,756   823   (29,917)  302,662   314,884   66   (50,787)  264,163 
U.S. government sponsored agency mortgage-backed securities  690,098   895   (35,780)  655,213   575,723   2   (66,640)  509,085 
Asset-backed securities  94,065   55   (561)  93,559   90,440   0   (1,829)  88,611 
Total available-for-sale securities $1,588,129  $1,868  $(86,832) $1,503,165  $1,390,747  $221  $(149,888) $1,241,080 


The amortized cost and fair value of debt securities at December 31, 20212022 are summarized as follows:

Available-for-Sale

(in thousands) 
Amortized
Cost
  
Gross
Unrealized
Gains
  
Gross
Unrealized
Losses
  Fair Value  
Amortized
Cost
  
Gross
Unrealized
Gains
  
Gross
Unrealized
Losses
  Fair Value 
U.S. Treasury and government agencies $299,606  $351  $(4,187) $295,770  $418,579  $212  $(36,859) $381,932 
State and political subdivisions  334,218   5,524   (5,539)  334,203   326,746   32   (61,676)  265,102 
U.S. government sponsored agency mortgage-backed securities  733,467   5,107   (7,765)  730,809   593,917   1   (73,833)  520,085 
Asset-backed securities  94,538   301   (192)  94,647   91,363   0   (2,256)  89,107 
Total available-for-sale securities $1,461,829  $11,283  $(17,683) $1,455,429  $1,430,605  $245  $(174,624) $1,256,226 


The amortized cost and fair value of debt securities at March 3131,2022, 2023 by contractual maturity are shown below.  Expected maturities will differ from contractual maturities because issuers may have the right to call or prepay obligations with or without call or prepayment penalties.

 Available-for-Sale  Available-for-Sale 
(in thousands) Amortized Cost  Fair Value  Amortized Cost  Fair Value 
Due in one year or less $47,754  $47,673  $40,644  $39,959 
Due after one through five years  245,157   235,839   287,061   265,661 
Due after five through ten years  280,613   263,396   212,371   187,803 
Due after ten years  230,442   207,485   184,508   149,961 
U.S. government sponsored agency mortgage-backed securities  690,098   655,213   575,723   509,085 
Asset-backed securities  94,065   93,559   90,440   88,611 
Total debt securities $1,588,129  $1,503,165  $1,390,747  $1,241,080 


During the three months ended March 31, 2023, we had a net securities gain of $218 thousand, consisting of a pre-tax gain of $4 thousand realized on the sale of AFS securities and an unrealized gain of $214 thousand from the fair value adjustment of equity securities.  During the three months ended March 31, 2022, we had a net securities gain of $99 thousand realized from the fair value adjustment of equity securities.  During the three months ended March 31,2021, we had a net securities loss of $168 thousand, consisting of a pre-tax gain of $60 thousand realized on sales and calls of AFS securities and an unrealized loss of $228 thousand from the fair value adjustment of equity securities.


Equity Securities at Fair Value


CTBI made the election permitted by ASC 321-10-35-2 to record its Visa Class B shares at fair value.  Equity securities at fair value as of March 31,2022 2023 were $2.4 million, as a result of a $99214 thousand increase in the fair value in the first quarter 2022.2023.  The fair value of equity securities decreasedincreased $22899 thousand in the first quarter 2021.2022.  NaNNo equity securities were sold during the three months ended March 31, 202331,2022 and 20212022.

1112


The amortized cost of securities pledged as collateral, to secure public deposits and for other purposes, was $499.8713.4 million at March 31, 202331,2022 and $545.6725.0 million at December 31, 2021.2022.


The amortized cost of securities sold under agreements to repurchase amounted to $347.4309.2 million at March 31, 202331,2022 and $314.1316.9 million at December 31, 2021.2022.


CTBI evaluates its investment portfolio on a quarterly basis for impairment.  The analysis performed as of March 31, 202331,2022 indicates that all impairment is considered temporary, market and interest rate driven, and not credit-related.  The percentage of total debt securities with unrealized losses as of March 31, 202331,2022 was 87.7%98.0%, compared to 72.4%97.4% as of December 31, 2021.2022.  The following table provides the amortized cost, gross unrealized losses, and fair value, aggregated by investment category and length of time the individual securities have been in a continuous unrealized loss position as of March 31, 202331,2022 that are not deemed to have credit losses.  As stated above, CTBI had no HTM securities as of March 31, 202331,2022.

Available-for-Sale

(in thousands) 
Amortized
Cost
  
Gross
Unrealized
Losses
  Fair Value  
Amortized
Cost
  
Gross
Unrealized
Losses
  Fair Value��
Less Than 12 Months                  
U.S. Treasury and government agencies $395,941  $(17,249) $378,692  $5,825  $(4) $5,821 
State and political subdivisions  204,547   (19,287)  185,260   28,387   (1,148)  27,239 
U.S. government sponsored agency mortgage-backed securities  524,844   (29,719)  495,125   65,273   (1,837)  63,436 
Asset-backed securities  75,952   (554)  75,398   7,446   (157)  7,289 
Total <12 months temporarily impaired AFS securities  1,201,284   (66,809)  1,134,475   106,931   (3,146)  103,785 
                        
12 Months or More                        
U.S. Treasury and government agencies  50,328   (3,325)  47,003   389,733   (30,628)  359,105 
State and political subdivisions  67,941   (10,630)  57,311   275,555   (49,639)  225,916 
U.S. government sponsored agency mortgage-backed securities  84,800   (6,061)  78,739   510,356   (64,803)  445,553 
Asset-backed securities  1,294   (7)  1,287   82,994   (1,672)  81,322 
Total ≥12 months temporarily impaired AFS securities  204,363   (20,023)  184,340   1,258,638   (146,742)  1,111,896 
                        
Total                        
U.S. Treasury and government agencies  446,269   (20,574)  425,695   395,558   (30,632)  364,926 
State and political subdivisions  272,488   (29,917)  242,571   303,942   (50,787)  253,155 
U.S. government sponsored agency mortgage-backed securities  609,644   (35,780)  573,864   575,629   (66,640)  508,989 
Asset-backed securities  77,246   (561)  76,685   90,440   (1,829)  88,611 
Total temporarily impaired AFS securities $1,405,647  $(86,832) $1,318,815  $1,365,569  $(149,888) $1,215,681 

1213


The analysis performed as of December 31, 20212022 indicated that all impairment was considered temporary, market and interest rate driven, and not credit-related.  The following table provides the amortized cost, gross unrealized losses, and fair value, aggregated by investment category and length of time the individual securities have been in a continuous unrealized loss position as of December 31, 20212022 that are not deemed to be other-than-temporarily impaired.  As stated above, CTBI had no HTM securities as of December 31, 2021.2022.

Available-for-Sale

(in thousands) 
Amortized
Cost
  
Gross
Unrealized
Losses
  Fair Value  
Amortized
Cost
  
Gross
Unrealized
Losses
  Fair Value 
Less Than 12 Months                  
U.S. Treasury and government agencies $249,990  $(4,123) $245,867  $144,305  $(6,953) $137,352 
State and political subdivisions  197,592   (4,779)  192,813   94,277   (6,257)  88,020 
U.S. government sponsored agency mortgage-backed securities  473,831   (6,759)  467,072   139,314   (6,883)  132,431 
Asset-backed securities  52,229   (190)  52,039   38,882   (1,231)  37,651 
Total <12 months temporarily impaired AFS securities  973,642   (15,851)  957,791   416,778   (21,324)  395,454 
                        
12 Months or More                        
U.S. Treasury and government agencies  14,505   (64)  14,441   249,424   (29,906)  219,518 
State and political subdivisions  19,126   (760)  18,366   225,019   (55,419)  169,600 
U.S. government sponsored agency mortgage-backed securities  62,330   (1,006)  61,324   454,357   (66,950)  387,407 
Asset-backed securities  1,368   (2)  1,366   52,480   (1,025)  51,455 
Total ≥12 months temporarily impaired AFS securities  97,329   (1,832)  95,497   981,280   (153,300)  827,980 
                        
Total                        
U.S. Treasury and government agencies  264,495   (4,187)  260,308   393,729   (36,859)  356,870 
State and political subdivisions  216,718   (5,539)  211,179   319,296   (61,676)  257,620 
U.S. government sponsored agency mortgage-backed securities  536,161   (7,765)  528,396   593,671   (73,833)  519,838 
Asset-backed securities  53,597   (192)  53,405   91,362   (2,256)  89,106 
Total temporarily impaired AFS securities $1,070,971  $(17,683) $1,053,288  $1,398,058  $(174,624) $1,223,434 

U.S. Treasury and Government Agencies


The unrealized losses in U.S. Treasury and government agencies were caused by interest rate changes.  The contractual terms of those investments do not permit the issuer to settle the securities at a price less than par which will equal amortized cost at maturity.  CTBI does not intend to sell the investments and it is not more likely than not that we will be required to sell the investments before recovery of their amortized cost.

State and Political Subdivisions


The unrealized losses in securities of state and political subdivisions were caused by interest rate changes.  The contractual terms of those investments do not permit the issuer to settle the securities at a price less than par which will equal amortized cost at maturity.  CTBI does not intend to sell the investments before recovery of their amortized cost and it is not more likely than not that we will be required to sell the investments before recovery of their amortized cost.

U.S. Government Sponsored Agency Mortgage-Backed Securities


The unrealized losses in U.S. government sponsored agency mortgage-backed securities were caused by interest rate changes.  CTBI expects to recover the amortized cost basis over the term of the securities.  CTBI does not intend to sell the investments and it is not more likely than not that we will be required to sell the investments before recovery of their amortized cost.

1314

Asset-Backed Securities


The unrealized losses in asset-backed securities were caused by interest rate changes.  The contractual terms of those investments do not permit the issuer to settle the securities at a price less than par which will equal amortized cost at maturity.  CTBI does not intend to sell the investments and it is not more likely than not that we will be required to sell the investments before recovery of their amortized cost.

Note 4 – Loans


Major classifications of loans, net of unearned income, deferred loan origination costs and fees, and net premiums on acquired loans, are summarized as follows:

(in thousands) 
March 31
2022
  
December 31
2021
  
March 31
2023
  
December 31
2022
 
Hotel/motel $274,256  $257,062  $348,876  $343,640 
Commercial real estate residential  337,447   335,233   385,328   372,914 
Commercial real estate nonresidential  774,791   757,893   750,498   762,349 
Dealer floorplans  72,766   69,452   75,443   77,533 
Commercial other  322,109   290,478   316,955   312,422 
Commercial unsecured SBA PPP  22,482   47,335 
Commercial loans  1,803,851   1,757,453   1,877,100   1,868,858 
                
Real estate mortgage  780,453   767,185   846,435   824,996 
Home equity lines  107,230   106,667   124,096   120,540 
Residential loans  887,683   873,852   970,531   945,536 
                
Consumer direct  156,620   156,683   157,158   157,504 
Consumer indirect  667,387   620,825   772,570   737,392 
Consumer loans  824,007   777,508   929,728   894,896 
                
Loans and lease financing $3,515,541  $3,408,813  $3,777,359  $3,709,290 


The loan portfolios presented above are net of unearned fees and unamortized premiums. Unearned fees included above totaled $2.4$1.1 million as of March 31, 20222023 and $4.0$1.0 million as of December 31, 20212022 while the unamortized premiums on the indirect lending portfolio totaled $26.0$29.7 million as of March 31, 20222023 and $24.1$28.5 million as of December 31, 2021.2022.


CTBI has segregated and evaluates its loan portfolio through 10nine portfolio segments with similar risk characteristics. CTBI serves customers in small and mid-sized communities in eastern, northeastern, central, and south central Kentucky, southern West Virginia, and northeastern Tennessee.  Therefore, CTBI’s exposure to credit risk is significantly affected by changes in these communities.


Hotel/motel loans are a significant concentration for CTBI, representing approximately 7.8%9.2% of total loans.  This industry has unique risk characteristics as it is highly susceptible to changes in the domestic and global economic environments, which can cause the industry to experience substantial volatility.  Additionally, any hotel/motel construction loans would be included in this segment as CTBI’s construction loans are primarily completed as one loan going from construction to permanent financing.  These loans are originated based on the borrower’s ability to service the debt and secondarily based on the fair value of the underlying collateral.


Commercial real estate residential loans are commercial purpose construction and permanent financed loans for commercial purpose 1-4 family/multi-family properties.  These loans are originated based on the borrower’s ability to service the debt and secondarily based on the fair value of the underlying collateral.

1415


Commercial real estate nonresidential loans are secured by nonfarm, nonresidential properties, farmland, and other commercial real estate.  These loans are originated based on the borrower’s ability to service the debt and secondarily based on the fair value of the underlying collateral.  Construction for commercial real estate nonresidential loans are also included in this segment as these loans are generally one loan for construction to permanent financing.


Dealer floorplans consist of loans to dealerships to finance inventory and are collateralized under a blanket security agreement and without specific liens on individual units.  This risk is mitigated by the use of periodic inventory audits.  These audits are performed monthly and follow up is required on any out of compliance items identified.  These audits are subject to increasing frequency when fact patterns suggest more scrutiny is required.


Commercial other loans consist of agricultural loans, receivable financing, loans to financial institutions, loans for purchasing or carrying securities, the remaining balance of the loans made under the Paycheck Protection Program (“PPP”) established by the Coronavirus Aid, Relief, and Economic Security Act (the “CARES Act”), and other commercial purpose loans.  Commercial loans are underwritten based on the borrower’s ability to service debt from the business’s underlying cash flows.  As a general practice, we obtain collateral such as equipment, or other assets, although such loans may be uncollateralized but guaranteed.


CTBI’s participation in the Paycheck Protection Program (“PPP”) established by the CARES Act resulted in the creation of a new loan segment of unsecured commercial other loans that are one hundred percent guaranteed by the Small Business Administration (“SBA”).  These loans, which are subject to forgiveness, have maturities of either two or three to five years, depending on when the loan was made.  These loans currently have no allowance for credit losses.


Residential real estate loans are a mixture of fixed rate and adjustable rate first and second lien residential mortgage loans and also include real estate construction loans which are typically for owner-occupied properties.  The terms of the real estate construction loans are generally short-term with permanent financing upon completion.  As a policy, CTBI holds adjustable rate loans and sells the majority of its fixed rate first lien mortgage loans into the secondary market.  Changes in interest rates or market conditions may impact a borrower’s ability to meet contractual principal and interest payments.  Residential real estate loans are secured by real property.


Home equity lines are primarily revolving adjustable rate credit lines secured by real property.


Consumer direct loans are a mixture of fixed rate and adjustable rate products comprised of unsecured loans, consumer revolving credit lines, deposit secured loans, and all other consumer purpose loans.


Consumer indirect loans are primarily consumer fixed rate loans secured by automobiles, trucks, vans, and recreational vehicles originated at the selling dealership underwritten and purchased by CTBI’s indirect lending department.  Both new and used products are financed.  Only dealers who have executed dealer agreements with CTBI participate in the indirect lending program.


Not included in the loan balances above were loans held for sale in the amount of $1.9$0.2 million at March 31, 20222023 and $2.6$0.1 million at December 31, 2021.2022.


1516


The following tables present the balance in the allowance for credit losses (“ACL”)ACL for the periods ended March 31, 2022,2023,  December 31, 20212022, and March 31, 2021:2022:

 
Three Months Ended
March 31, 2022
  
Three Months Ended
March 31, 2023
 
(in thousands) Beginning Balance  Provision Charged to Expense  Losses Charged Off  Recoveries  Ending Balance  
Beginning
Balance
  
Provision
Charged to
Expense
  
Losses
Charged Off
  Recoveries  
Ending
Balance
 
ACL                              
Hotel/motel
 
$
5,080
  
$
(153
)
 
$
(216
)
 
$
0
  
$
4,711
  
$
5,171
  
$
116
  
$
0
  
$
0
  
$
5,287
 
Commercial real estate residential
  
3,986
   
110
   
(31
)
  
5
   
4,070
   
4,894
   
186
   
0
   
77
   
5,157
 
Commercial real estate nonresidential
  
8,884
   
174
   
0
   
111
   
9,169
   
9,419
   
(553
)
  
0
   
144
   
9,010
 
Dealer floorplans
  
1,436
   
83
   
0
   
0
   
1,519
   
1,776
   
(82
)
  
0
   
0
   
1,694
 
Commercial other
  
4,422
   
478
   
(157
)
  
101
   
4,844
   
5,285
   
(416
)
  
(187
)
  
100
   
4,782
 
Real estate mortgage
  
7,637
   
97
   
(93
)
  
21
   
7,662
   
7,932
   
21
   
(40
)
  
4
   
7,917
 
Home equity
  
866
   
(33
)
  
(19
)
  
5
   
819
   
1,106
   
(64
)
  
0
   
2
   
1,044
 
Consumer direct
  
1,951
   
(180
)
  
(170
)
  
186
   
1,787
   
1,694
   
105
   
(156
)
  
103
   
1,746
 
Consumer indirect
  
7,494
   
299
   
(634
)
  
569
   
7,728
   
8,704
   
1,803
   
(1,382
)
  
921
   
10,046
 
Total
 
$
41,756
  
$
875
  
$
(1,320
)
 
$
998
  
$
42,309
  
$
45,981
  
$
1,116
  
$
(1,765
)
 
$
1,351
  
$
46,683


Year Ended
December 31, 2021
  
Year Ended
December 31, 2022
 
(in thousands) Beginning Balance  Provision Charged to Expense  Losses Charged Off  Recoveries  Ending Balance  
Beginning
Balance
  
Provision
Charged to
Expense
  
Losses
Charged Off
  Recoveries  
Ending
Balance
 
ACL                              
Hotel/motel
 
$
6,356
  
$
(1,276
)
 
$
0
  
$
0
  
$
5,080
  
$
5,080
  
$
307
  
$
(216
)
 
$
0
  
$
5,171
 
Commercial real estate residential
  
4,464
   
(488
)
  
(28
)
  
38
   
3,986
   
3,986
   
951
   
(92
)
  
49
   
4,894
 
Commercial real estate nonresidential
  
11,086
   
(2,233
)
  
(306
)
  
337
   
8,884
   
8,884
   
(154
)
  
(46
)
  
735
   
9,419
 
Dealer floorplans
  
1,382
   
54
   
0
   
0
   
1,436
   
1,436
   
340
   
0
   
0
   
1,776
 
Commercial other
  
4,289
   
388
   
(644
)
  
389
   
4,422
   
4,422
   
947
   
(1,082
)
  
998
   
5,285
 
Real estate mortgage
  
7,832
   
3
   
(266
)
  
68
   
7,637
   
7,637
   
466
   
(223
)
  
52
   
7,932
 
Home equity
  
844
   
39
   
(36
)
  
19
   
866
   
866
   
257
   
(37
)
  
20
   
1,106
 
Consumer direct
  
1,863
   
256
   
(684
)
  
516
   
1,951
   
1,951
   
(210
)
  
(609
)
  
562
   
1,694
 
Consumer indirect
  
9,906
   
(3,129
)
  
(2,361
)
  
3,078
   
7,494
   
7,494
   
2,001
   
(3,041
)
  
2,250
   
8,704
 
Total
 
$
48,022
  
$
(6,386
)
 
$
(4,325
)
 
$
4,445
  
$
41,756
  
$
41,756
  
$
4,905
  
$
(5,346
)
 
$
4,666
  
$
45,981


Three Months Ended
March 31, 2021
  
Three Months Ended
March 31, 2022
 
(in thousands) Beginning Balance  Provision Charged to Expense  Losses Charged Off  Recoveries  Ending Balance  
Beginning
Balance
  
Provision
Charged to
Expense
  
Losses
Charged Off
  Recoveries  
Ending
Balance
 
ACL                              
Hotel/motel
 
$
6,356
  
$
308
  
$
0
  
$
0
  
$
6,664
  
$
5,080
  
$
(153
)
 
$
(216
)
 
$
0
  
$
4,711
 
Commercial real estate residential
  
4,464
   
199
   
(24
)
  
2
   
4,641
   
3,986
   
110
   
(31
)
  
5
   
4,070
 
Commercial real estate nonresidential
  
11,086
   
(135
)
  
(151
)
  
13
   
10,813
   
8,884
   
174
   
0
   
111
   
9,169
 
Dealer floorplans
  
1,382
   
(64
)
  
0
   
0
   
1,318
   
1,436
   
83
   
0
   
0
   
1,519
 
Commercial other
  
4,289
   
269
   
(112
)
  
125
   
4,571
   
4,422
   
478
   
(157
)
  
101
   
4,844
 
Real estate mortgage
  
7,832
   
(690
)
  
(8
)
  
9
   
7,143
   
7,637
   
97
   
(93
)
  
21
   
7,662
 
Home equity
  
844
   
(93
)
  
(5
)
  
4
   
750
   
866
   
(33
)
  
(19
)
  
5
   
819
 
Consumer direct
  
1,863
   
(14
)
  
(154
)
  
116
   
1,811
   
1,951
   
(180
)
  
(170
)
  
186
   
1,787
 
Consumer indirect
  
9,906
   
(2,279
)
  
(1,016
)
  
1,024
   
7,635
   
7,494
   
299
   
(634
)
  
569
   
7,728
 
Total
 
$
48,022
  
$
(2,499
)
 
$
(1,470
)
 
$
1,293
  
$
45,346
  
$
41,756
  
$
875
  
$
(1,320
)
 
$
998
  
$
42,309
 
 
17


CTBI derived itsour ACL balance by using vintage modeling for the consumer and residential portfolios.  Static pool models incorporating losses by credit risk rating were developed to determine credit loss balances for the commercial loan segments.

16


Qualitative loss factors are based on CTBI’s judgment of delinquency trends, level of nonperforming loans, trend in loan losses, supervision and administration, quality control exceptions, and reasonable and supportable forecasts based on unemployment rates and industry concentrations.  CTBI has determined that twelve months represents a reasonable and supportable forecast period and reverts back to a historical loss rate immediately.   CTBI leverages economic projections from a reputable and independent third party to form its loss driver forecasts over the twelve month forecast period. Other internal and external indicators of economic forecasts are also considered by CTBI when developing the forecast metrics.


CTBI also has an inherent model risk allocation included in itsour ACL calculation to allow for certain known model limitations as well as other potential risks not quantified elsewhere.  Management has identifiedOne limitation is the following known model limitations and made adjustments through this portion of the calculation for them:

(1) The inability to completely identify revolving linesline of credit within the commercial other segment.Management had to make assumptions regarding commercial renewals as those renewals are not tracked well by its loan system.

(2) The inability within the model to estimate the value of modifications made under TDRs.  Management has manually calculated the estimated impact based on research of modified terms for TDRs.


With the continued impact of global uncertainty, the global COVID-19 pandemic, including thecurrent historically high rate of inflation, the potentialsignificant rising rate environment, and the fact that there is no immediate end foreseen, this has been identified as a significant specific event that could impact our customers’ ability to pay.  Given this uncertainty, management continues to have a significant event qualitativeallocation factor to anticipate the continued impact of COVID-19 as deferments have ended and the SBA Paycheck Protection Programs are largely over with no approved capacity to fund new loans.adjust for this uncertainty.


ProvisionDuring the quarter ended March 31, 2023, an allocation was made for loancollateral values in segments with industry concentrations.  With respect to collateral risk, the ACL Committee discussed that the rapid rise in interest rates would result in an increase in capitalization rates used to value income-producing commercial real estate, resulting in lower collateral values and an increased risk of loss.  An increase in such capitalization rates would be expected to correspond to a decrease in the values of income-producing commercial real estate.


Our provision for credit losses was $1.1 million for the first quarter was $0.9 million,2023, compared to provision of $0.5$1.5 million for the quarter ended December 31, 20212022 and a recovery of provision of $2.5$0.9 million for the first quarter 2021.2022.  Our reserve coverage (allowance for credit losses to nonperforming loans) at March 31, 20222023 was 309.1%382.3%, compared to 251.2%300.4% at December 31, 20212022 and 215.5%309.1% at March 31, 2021.2022.  Our credit loss reserve as a percentage of total loans outstanding at March 31, 2023 remained at 1.24% from December 31, 2022 was 1.20% (1.21% excluding PPP loans) compared to 1.22% at December 31, 2021 (1.24% excluding PPP loans) and 1.28%1.20% at March 31, 2021 (1.38% excluding PPP loans).2022.


1718


Refer to Note 1 to the condensed consolidated financial statements for further information regarding our nonaccrual policy.  Nonaccrual loans and loans 90 days past due and still accruing segregated by class of loans for both March 31, 20222023 and December 31, 20212022 were as follows:

 March 31, 2022  March 31, 2023 
(in thousands) 
Nonaccrual Loans
with No ACL
  
Nonaccrual Loans
with ACL
  
90+ and Still
Accruing
  
Total
Nonperforming
Loans
  
Nonaccrual Loans
with No ACL
  
Nonaccrual Loans
with ACL
  
90+ and Still
Accruing
  
Total
Nonperforming
Loans
 
                        
Hotel/motel $0  $0  $0  $0  $0  $0  $0  $0 
Commercial real estate residential  0   216   202   418   0   352   55   407 
Commercial real estate nonresidential  2,431   1,430   414   4,275   0   1,054   790   1,844 
Commercial other  0   269   52   321   0   991   544   1,535 
Commercial unsecured SBA PPP
  0   0   8   8 
Total commercial loans  2,431   1,915   676   5,022   0   2,397   1,389   3,786 
                                
Real estate mortgage  0   3,985   3,509   7,494   0   3,358   4,174   7,532 
Home equity lines  0   501   471   972   0   238   495   733 
Total residential loans  0   4,486   3,980   8,466   0   3,596   4,669   8,265 
                                
Consumer direct  0   0   23   23   0   0   28   28 
Consumer indirect  0   0   179   179   0   0   132   132 
Total consumer loans  0   0   202   202   0   0   160   160 
                                
Loans and lease financing $2,431  $6,401  $4,858  $13,690  $0  $5,993  $6,218  $12,211 

 December 31, 2021  December 31, 2022 
(in thousands) 
Nonaccrual Loans
with No ACL
  
Nonaccrual Loans
with ACL
  
90+ and Still
Accruing
  
Total
Nonperforming
Loans
  
Nonaccrual Loans
with No ACL
  
Nonaccrual Loans
with ACL
  
90+ and Still
Accruing
  
Total
Nonperforming
Loans
 
                        
Hotel/motel $0  $1,075  $0  $1,075  $0  $0  $0  $0 
Commercial real estate residential  0   585   312   897   0   355   258   613 
Commercial real estate nonresidential  2,447   1,602   144   4,193   0   1,116   1,947   3,063 
Commercial other  0   302   76   378   0   982   369   1,351 
Total commercial loans  2,447   3,564   532   6,543   0   2,453   2,574   5,027 
                                
Real estate mortgage  0   4,081   4,659   8,740   0   4,069   4,929   8,998 
Home equity lines  0   579   513   1,092   0   291   487   778 
Total residential loans  0   4,660   5,172   9,832   0   4,360   5,416   9,776 
                                
Consumer direct  0   0   44   44   0   0   41   41 
Consumer indirect  0   0   206   206   0   0   465   465 
Total consumer loans  0   0   250   250   0   0   506   506 
                                
Loans and lease financing $2,447  $8,224  $5,954  $16,625  $0  $6,813  $8,496  $15,309 

Discussion of the Nonaccrual Policy


The accrual of interest income on loans is discontinued when management believes, after considering economic and business conditions, collateral value, and collection efforts, that the borrower’s financial condition is such that the collection of interest is doubtful.  Cash payments received on nonaccrual loans generally are applied against principal, and interest income is only recorded once principal recovery is reasonably assured.  Any loans greater than 90 days past due must be well secured and in the process of collection to continue accruing interest.  See Note 1 to the condensed consolidated financial statements for further discussion on our nonaccrual policy.

1819


The following tables present CTBI’s loan portfolio aging analysis, segregated by class, as of March 31, 20222023 and December 31, 20212022 (includes loans 90 days past due and still accruing as well):

March 31, 2022 
 March 31, 2023 
(in thousands) 
30-59 Days
Past Due
  
60-89
Days Past
Due
  
90+ Days
Past Due
  
Total Past
Due
  Current  
Total
Loans
  
30-59 Days
Past Due
  
60-89
Days Past
Due
  
90+ Days
Past Due
  
Total Past
Due
  Current  Total Loans
 
Hotel/motel $0  $0  $0  $0  $274,256  $274,256  $0  $0  $0  $0  $348,876  $348,876 
Commercial real estate residential  2,019   202   369   2,590   334,857   337,447   597   663   371   1,631   383,697   385,328 
Commercial real estate nonresidential  1,119   305   3,756   5,180   769,611   774,791   1,513   125   1,447   3,085   747,413   750,498 
Dealer floorplans  0   0   0   0   72,766   72,766   0   0   0   0   75,443   75,443 
Commercial other  923   10   82   1,015   321,094   322,109   1,183   473   1,321   2,977   313,978   316,955 
Commercial unsecured SBA PPP  0   279   8   287   22,195   22,482 
Total commercial loans  4,061   796   4,215   9,072   1,794,779   1,803,851   3,293   1,261   3,139   7,693   1,869,407   1,877,100 
                                                
Real estate mortgage  1,249   3,206   5,001   9,456   770,997   780,453   1,872   2,246   6,219   10,337   836,098   846,435 
Home equity lines  479   205   775   1,459   105,771   107,230   761   93   617   1,471   122,625   124,096 
Total residential loans  1,728   3,411   5,776   10,915   876,768   887,683   2,633   2,339   6,836   11,808   958,723   970,531 
                                                
Consumer direct  371   182   22   575   156,045   156,620   284   13   28   325   156,833   157,158 
Consumer indirect  1,516   339   178   2,033   665,354   667,387   2,006   593   132   2,731   769,839   772,570 
Total consumer loans  1,887   521   200   2,608   821,399   824,007   2,290   606   160   3,056   926,672   929,728 
                                                
Loans and lease financing $7,676  $4,728  $10,191  $22,595  $3,492,946  $3,515,541  $8,216  $4,206  $10,135  $22,557  $3,754,802  $3,777,359 

December 31, 2021 
                 December 31, 2022 
(in thousands) 
30-59 Days
Past Due
  
60-89
Days Past
Due
  
90+ Days
Past Due
  
Total Past
Due
  Current  
Total
Loans
  
30-59 Days
Past Due
  
60-89
Days Past
Due
  
90+ Days
Past Due
  
Total Past
Due
  Current  Total Loans
 
Hotel/motel $0  $0  $0  $0  $257,062  $257,062  $0  $0  $0  $0  $343,640  $343,640 
Commercial real estate residential  274   116   845   1,235   333,998   335,233   602   225   574   1,401   371,513   372,914 
Commercial real estate nonresidential  1,303   147   3,509   4,959   752,934   757,893   2,549   395   2,611   5,555   756,794   762,349 
Dealer floorplans  0   0   0   0   69,452   69,452   0   0   0   0   77,533   77,533 
Commercial other  1,225   175   108   1,508   288,970   290,478   1,029   850   496   2,375   310,047   312,422 
Commercial unsecured SBA PPP  14   34   0   48   47,287   47,335 
Total commercial loans  2,816   472   4,462   7,750   1,749,703   1,757,453   4,180   1,470   3,681   9,331   1,859,527   1,868,858 
                                                
Real estate mortgage  1,171   2,707   6,859   10,737   756,448   767,185   869   3,402   7,067   11,338   813,658   824,996 
Home equity lines  656   315   903   1,874   104,793   106,667   786   44   740   1,570   118,970   120,540 
Total residential loans  1,827   3,022   7,762   12,611   861,241   873,852   1,655   3,446   7,807   12,908   932,628   945,536 
                                                
Consumer direct  396   179   44   619   156,064   156,683   555   126   41   722   156,782   157,504 
Consumer indirect  2,889   533   206   3,628   617,197   620,825   4,407   764   465   5,636   731,756   737,392 
Total consumer loans  3,285   712   250   4,247   773,261   777,508   4,962   890   506   6,358   888,538   894,896 
                                                
Loans and lease financing $7,928  $4,206  $12,474  $24,608  $3,384,205  $3,408,813  $10,797  $5,806  $11,994  $28,597  $3,680,693  $3,709,290 

19


The risk characteristics of CTBI’s material portfolio segments are as follows:


Hotel/motel loans are a significant concentration for CTBI, representing approximately 7.8%9.2% of total loans.  This industry has unique risk characteristics as it is highly susceptible to changes in the domestic and global economic environments, which can cause the industry to experience substantial volatility.  These loans are viewed primarily as cash flow loans and secondarily as loans secured by real estate.  Hotel/motel lending typically involves higher loan principal amounts and the repayment of these loans is generally dependent on the successful operation of the property securing the loan or the business conducted on the property securing the loan.  Management monitors and evaluates all commercial real estate loans based on collateral and risk grade criteria.  Commercial construction loans generally are made to customers for the purpose of building income-producing properties, and any hotel/motel construction loan would be included in this segment.  Personal guarantees of the principals are generally required.  Such loans are made on a projected cash flow basis and are secured by the project being constructed.  Construction loan draw procedures are included in each specific loan agreement, including required documentation items and inspection requirements.  Construction loans may convert to term loans at the end of the construction period, or may be repaid by the take-out commitment from another financing source.  If the loan is to convert to a term loan, the repayment ability is based on the borrower’s projected cash flow.  Risk is mitigated during the construction phase by requiring proper documentation and inspections whenever a draw is requested.  Loans in amounts greater than $500,000 generally require a performance bond to be posted by the general contractor to assure completion of the project.

20


Commercial real estate residential loans are commercial purpose construction and permanent financed loans for commercial purpose 1-4 family/multi-family properties.  All commercial real estate loans are viewed primarily as cash flow loans and secondarily as loans secured by real estate.  Management monitors and evaluates all commercial real estate loans based on collateral and risk grade criteria.  Commercial residential construction loans generally are made to customers for the purpose of building income-producing properties.  Personal guarantees of the principals are generally required.  Such loans are made on a projected cash flow basis and are secured by the project being constructed.  Construction loan draw procedures are included in each specific loan agreement, including required documentation items and inspection requirements.  Construction loans may convert to term loans at the end of the construction period, or may be repaid by the take-out commitment from another financing source.  If the loan is to convert to a term loan, the repayment ability is based on the borrower’s projected cash flow.  Risk is mitigated during the construction phase by requiring proper documentation and inspections whenever a draw is requested.  Loans in amounts greater than $500,000 generally require a performance bond to be posted by the general contractor to assure completion of the project.


Commercial real estate nonresidential loans are secured by nonfarm, nonresidential properties, farmland, and other commercial real estate.  Construction for commercial real estate nonresidential loans are also included in this segment as these loans are generally one loan for construction to permanent financing.  All commercial real estate loans are viewed primarily as cash flow loans and secondarily as loans secured by real estate.  Management monitors and evaluates all commercial real estate loans based on collateral and risk grade criteria.  Commercial nonresidential construction loans generally are made to customers for the purpose of building income-producing properties.  Personal guarantees of the principals are generally required.  Such loans are made on a projected cash flow basis and are secured by the project being constructed.  Construction loan draw procedures are included in each specific loan agreement, including required documentation items and inspection requirements.  Construction loans may convert to term loans at the end of the construction period, or may be repaid by the take-out commitment from another financing source.  If the loan is to convert to a term loan, the repayment ability is based on the borrower’s projected cash flow.  Risk is mitigated during the construction phase by requiring proper documentation and inspections whenever a draw is requested.  Loans in amounts greater than $500,000 generally require a performance bond to be posted by the general contractor to assure completion of the project.


Dealer floorplans are segmented separately as they are a unique product with unique risk factors.  CTBI maintains strict processing procedures over itsour floorplan product with any exceptions requested by a loan officer approved by the appropriate loan committee and the floorplan manager.

20


Commercial other loans are primarily based on the identified cash flows of the borrower and secondarily on the underlying collateral provided by the borrower.  The cash flows of borrowers, however, may not be as expected and the collateral securing these loans may fluctuate in value.  Most commercial loans are secured by the assets being financed or other business assets such as accounts receivable or inventory and may incorporate a personal guarantee; however, some short-term loans may be made on an unsecured basis.  In the case of loans secured by accounts receivable, the availability of funds for the repayment of these loans may be substantially dependent on the ability of the borrower to collect amounts due from itsour customers.  As we underwrite our equipment lease financing in a manner similar to our commercial loan portfolio described below, the risk characteristics for this portfolio mirror that of the commercial loan portfolio.


CTBI’s participation in the CARES Act PPP loan program hashad previously resulted in a new loan segment of unsecured commercial other loans that are one hundred percent100% guaranteed by the SBA.U.S. Small Business Administration (“SBA”). As the balances are now less than $1.0 million, these loans have been collapsed into the commercial other segment.  These loans, which are subject to forgiveness, have maturities of either two or three to five years, depending on when the loans were made.  These loans currently have no allowance for credit losses.

21


With respect to residential loans that are secured by 1-4 family residences and are generally owner occupied, CTBI generally establishes a maximum loan-to-value ratio and requires private mortgage insurance if that ratio is exceeded.  Home equity loans are typically secured by a subordinate interest in 1-4 family residences. Residential construction loans are handled through the home mortgage area of the bank.  The repayment ability of the borrower and the maximum loan-to-value ratio are calculated using the normal mortgage lending criteria.  Draws are processed based on percentage of completion stages including normal inspection procedures.  Such loans generally convert to term loans after the completion of construction.


Consumer loans are secured by consumer assets such as automobiles or recreational vehicles.  Some consumer loans are unsecured such as small installment loans and certain lines of credit.  Our determination of a borrower’s ability to repay these loans is primarily dependent on the personal income and credit rating of the borrowers, which can be impacted by economic conditions in their market areas such as unemployment levels.  Repayment can also be impacted by changes in property values on residential properties.  Risk is mitigated by the fact that the loans are of smaller individual amounts and spread over a large number of borrowers.


The indirect lending area of the bank is generally deals withresponsible for purchasing/funding consumer contracts withfor new and used automobiles, as well as ATVs and motorcycles.  Our indirect portfolio consists primarily of automobile dealers.loans at 94%.  The dealers generate consumer loan applications which are forwardeddigitally submitted to the indirect loan processing area for approval or denial.decisioning.  Loan approvals, denials, or denialsconditional decisions are based on the overall creditworthiness and repayment ability of the borrower,borrowers.  In addition, other factors such as collateral value versus requested loan amount, past installment history related to auto loans, and on the collateral value.  Thepast previous credit experience with bank and others is taken into consideration.  On occasion, dealers may havebe required to provide limited or full recourse agreements with CTB.to qualify an application.  Monitoring of the indirect lending area of the bank is accomplished primarily by consistent review of delinquency and loss ratios within the indirect portfolio by management.  In depth review of the portfolio is presented by the indirect lending manager on a quarterly basis to the Loan Portfolio Risk Management Committee.  Indirect lending is also monitored by the loan review, internal audit, and compliance functions of the bank.  From these reviews, any identified issues are escalated for remediation.  In addition, the indirect lending policy and procedures are consistently updated and strengthened from these reviews.

Credit Quality Indicators:


CTBI categorizes loans into risk categories based on relevant information about the ability of borrowers to service their debt such as: current financial information, historical payment experience, credit documentation, public information, and current economic trends, among other factors.  CTBI also considers the fair value of the underlying collateral and the strength and willingness of the guarantor(s).  CTBI analyzes commercial loans individually by classifying the loans as to credit risk.  Loans classified as loss, doubtful, substandard, or special mention are reviewed quarterly by CTBI for further deterioration or improvement to determine if appropriately classified and valued if deemed impaired.  All other commercial loan reviews are completed every 12 to 18 months.  In addition, during the renewal process of any loan, as well as if a loan becomes past due or if other information becomes available, CTBI will evaluate the loan grade.  CTBI uses the following definitions for risk ratings:

Pass grades include investment grade, low risk, moderate risk, and acceptable risk loans.  The loans range from loans that have no chance of resulting in a loss to loans that have a limited chance of resulting in a loss.  Customers in this grade have excellent to fair credit ratings.  The cash flows are adequate to meet required debt repayments.

21

Watch graded loans are loans that warrant extra management attention but are not currently criticized.  Loans on the watch list may be potential troubled credits or may warrant “watch” status for a reason not directly related to the asset quality of the credit.  The watch grade is a management tool to identify credits which may be candidates for future classification or may temporarily warrant extra management monitoring.

22

Other assets especially mentioned (OAEM) reflects loans that are currently protected but are potentially weak.  These loans constitute an undue and unwarranted credit risk but not to the point of justifying a classification of substandard.  The credit risk may be relatively minor yet constitute an unwarranted risk in light of circumstances surrounding a specific asset. Loans in this grade display potential weaknesses which may, if unchecked or uncorrected, inadequately protect CTBI’s credit position at some future date.  The loans may be adversely affected by economic or market conditions.

Substandard grading indicates that the loan is inadequately protected by the current sound worth and paying capacity of the obligor or of the collateral pledged.  These loans have a well-defined weakness or weaknesses that jeopardize the orderly liquidation of the debt with the distinct possibility that CTBI will sustain some loss if the deficiencies are not corrected.

Doubtful graded loans have the weaknesses inherent in the substandard grading with the added characteristic that the weaknesses make collection or liquidation in full, on the basis of currently existing facts, conditions, and values, highly questionable and improbable.  The probability of loss is extremely high, but because of certain important and reasonably specific pending factors which may work to CTBI’s advantage or strengthen the asset(s), its classification as an estimated loss is deferred until its more exact status may be determined.  Pending factors include proposed merger, acquisition, or liquidation procedures, capital injection, perfecting liens on additional collateral, and refinancing plans.

22


The following tables present the credit risk profile of CTBI’s commercial loan portfolio based on rating category and payment activity, segregated by class of loans and based on last credit decision or year of origination:

March 31, 2022 Term Loans Amortized Cost Basis by Origination Year 
March 31, 2023 Term Loans Amortized Cost Basis by Origination Year 
(in thousands)
 2022  2021  2020  2019  2018  Prior  
Revolving
Loans
  Total  2023  2022  2021  2020  2019  Prior  
Revolving
Loans
  Total 
Hotel/motel                                                
Risk rating:                                                
Pass $37,289  $27,824  $11,120  $53,233  $18,607  $49,251  $0  $197,324  $10,397  $144,932  $28,671  $17,556  $47,870  $47,835  $3,545  $300,806 
Watch  3,960   9,149   13,921   8,741   8,709   29,113   0   73,593   848   6,977   8,980   5,485   3,433   13,376   0   39,099 
OAEM  0   0   0   0   0   0   0   0   0   0   7,038   0   0   1,933   0   8,971 
Substandard  0   0   0   0   3,339   0   0   3,339   0   0   0   0   0   0   0   0 
Doubtful  0   0   0   0   0   0   0   0   0   0   0   0   0   0   0   0 
Total hotel/motel $41,249  $36,973  $25,041  $61,974  $30,655  $78,364  $0  $274,256  
11,245  
151,909  
44,689  
23,041  
51,303  
63,144  
3,545  
348,876 
                                                                
Commercial real estate residential                                                                
Risk rating:                                                                
Pass $26,018  $135,618  $48,239  $17,798  $18,552  $52,486  $10,157  $308,868  
35,101  
109,784  
106,509  
36,768  
13,441  
44,088  
13,828  
359,519 
Watch  614   2,214   2,367   2,000   2,409   7,488   37   17,129   315   1,163   756   1,575   632   8,446   63   12,950 
OAEM  0   0   0   0   0   15   0   15   0   0   0   0   181   326   28   535 
Substandard  322   4,260   1,917   383   1,715   2,614   224   11,435   79   656   4,361   954   179   6,095   0   12,324 
Doubtful  0   0   0   0   0   0   0   0   0   0   0   0   0   0   0   0 
Total commercial real estate residential $26,954  $142,092  $52,523  $20,181  $22,676  $62,603  $10,418  $337,447  
35,495  
111,603  
111,626  
39,297  
14,433  
58,955  
13,919  
385,328 
                                                                
Commercial real estate nonresidential                                                                
Risk rating:                                                                
Pass $46,930  $213,550  $97,038  $80,023  $52,560  $198,565  $29,254  $717,920  
23,413  
156,272  
170,048  
81,516  
61,444  
169,219  
23,175  
685,087 
Watch  2,647   4,430   2,688   3,072   2,602   13,046   1,041   29,526   307   3,139   5,703   10,036   7,684   10,851   1,661   39,381 
OAEM  0   0   0   0   0   112   20   132   0   2,535   0   0   0   84   0   2,619 
Substandard  1,347   4,883   5,499   3,416   1,119   10,618   24   26,906   856   1,955   2,538   4,597   3,162   9,999   0   23,107 
Doubtful  0   0   0   0   0   307   0   307   0   0   0   0   0   304   0   304 
Total commercial real estate nonresidential $50,924  $222,863  $105,225  $86,511  $56,281  $222,648  $30,339  $774,791  
24,576  
163,901  
178,289  
96,149  
72,290  
190,457  
24,836  
750,498 
                                                                
Dealer floorplans                                                                
Risk rating:                                                                
Pass $0  $0  $0  $0  $0  $0  $72,309  $72,309  
0  
0  
0  
0  
0  
0  
75,443  
75,443 
Watch  0   0   0   0   0   0   457   457   0   0   0   0   0   0   0   0 
OAEM  0   0   0   0   0   0   0   0   0   0   0   0   0   0   0   0 
Substandard  0   0   0   0   0   0   0   0   0   0   0   0   0   0   0   0 
Doubtful  0   0   0   0   0   0   0   0   0   0   0   0   0   0   0   0 
Total dealer floorplans $0  $0  $0  $0  $0  $0  $72,766  $72,766  
0  
0  
0  
0  
0  
0  
75,443  
75,443 
                                                                
Commercial other                                                                
Risk rating:                                                                
Pass $38,977  $60,835  $39,687  $13,194  $29,265  $29,659  $80,968  $292,585  
22,368  
64,329  
57,072  
32,436  
7,059  
24,241  
85,994  
293,499 
Watch  949   648   702   364   473   1,177   6,728   11,041   372   1,177   526   221   177   885   5,789   9,147 
OAEM  0   0   0   0   3   0   0   3   0   30   0   0   0   0   66   96 
Substandard  1,357   6,954   2,844   1,254   329   795   4,947   18,480   386   5,405   5,143   823   316   690   746   13,509 
Doubtful  0   0   0   0   0   0   0   0   0   466   129   0   109   0   0   704 
Total commercial other $41,283  $68,437  $43,233  $14,812  $30,070  $31,631  $92,643  $322,109  
23,126  
71,407  
62,870  
33,480  
7,661  
25,816  
92,595  
316,955 
                                                                
Commercial unsecured SBA PPP                                
Risk rating:                                
Pass $0  $22,176  $306  $0  $0  $0  $0  $22,482 
Watch  0   0   0   0   0   0   0   0 
OAEM  0   0   0   0   0   0   0   0 
Substandard  0   0   0   0   0   0   0   0 
Doubtful  0   0   0   0   0   0   0   0 
Total commercial unsecured SBA PPP $0  $22,176  $306  $0  $0  $0  $0  $22,482 
Commercial other current period gross charge-offs
  156   20   0   0   0   11   0   187 
                                                                
Commercial loans                                                                
Risk rating:                                                                
Pass $149,214  $460,003  $196,390  $164,248  $118,984  $329,961  $192,688  $1,611,488  
91,279  
475,317  
362,300  
168,276  
129,814  
285,383  
201,985  
1,714,354 
Watch  8,170   16,441   19,678   14,177   14,193   50,824   8,263   131,746   1,842   12,456   15,965   17,317   11,926   33,558   7,513   100,577 
OAEM  0   0   0   0   3   127   20   150   0   2,565   7,038   0   181   2,343   94   12,221 
Substandard  3,026   16,097   10,260   5,053   6,502   14,027   5,195   60,160   1,321   8,016   12,042   6,374   3,657   16,784   746   48,940 
Doubtful  0   0   0   0   0   307   0   307   0   466   129   0   109   304   0   1,008 
Total commercial loans $160,410  $492,541  $226,328  $183,478  $139,682  $395,246  $206,166  $1,803,851  $94,442  $498,820  $397,474  $191,967  $145,687  $338,372  $210,338  $1,877,100 
                                
Total commercial loans current period gross charge-offs
 $
156  $
20  $
0  $
0  $
0  $
11  $
0  $
187 
23


December 31, 2021 Term Loans Amortized Cost Basis by Origination Year 
December 31, 2022 Term Loans Amortized Cost Basis by Origination Year 
(in thousands)
 2021  2020  2019  2018  2017  Prior  
Revolving
Loans
  Total  2022  2021  2020  2019  2018  Prior  
Revolving
Loans
  Total 
Hotel/motel                                                
Risk rating:                                                
Pass $42,056  $11,231  $53,713  $18,752  $32,765  $20,087  $0  $178,604  $145,262  $36,002  $17,742  $54,328  $13,178  $35,179  $545  $302,236 
Watch  9,234   14,021   8,813   8,780   2,678   30,502   0   74,028   7,921   8,996   5,523   3,453   0   13,555   0   39,448 
OAEM  0   0   0   0   0   0   0   0   0   0   0   0   0   1,956   0   1,956 
Substandard  0   0   0   3,355   1,075   0   0   4,430   0   0   0   0   0   0   0   0 
Doubtful  0   0   0   0   0   0   0   0   0   0   0   0   0   0   0   0 
Total hotel/motel $51,290  $25,252  $62,526  $30,887  $36,518  $50,589  $0  $257,062  
153,183  
44,998  
23,265  
57,781  
13,178  
50,690  
545  
343,640 
                                                                
Commercial real estate residential                                                                
Risk rating:                                                                
Pass $142,364  $54,380  $22,320  $19,826  $11,919  $45,791  $9,544  $306,144  
119,826  
110,963  
38,423  
15,467  
10,492  
36,307  
14,297  
345,775 
Watch  2,643   2,359   1,962   2,119   554   6,949   156   16,742   1,474   898   1,675   848   2,136   7,015   152   14,198 
OAEM  0   0   0   0   16   0   0   16   0   0   0   39   0   0   29   68 
Substandard  4,822   1,990   620   1,835   596   2,468   0   12,331   182   4,289   1,878   346   3,639   2,539   0   12,873 
Doubtful  0   0   0   0   0   0   0   0   0   0   0   0   0   0   0   0 
Total commercial real estate residential $149,829  $58,729  $24,902  $23,780  $13,085  $55,208  $9,700  $335,233  
121,482  
116,150  
41,976  
16,700  
16,267  
45,861  
14,478  
372,914 
                                                                
Commercial real estate nonresidential                                                                
Risk rating:                                                                
Pass $214,563  $99,131  $82,386  $57,397  $55,422  $168,533  $22,389  $699,821  
175,220  
171,311  
80,932  
70,848  
44,099  
137,575  
23,166  
703,151 
Watch  5,130   2,865   3,981   2,802   3,655   11,828   767   31,028   3,331   5,765   10,090   2,178   1,962   10,022   1,550   34,898 
OAEM  0   0   0   0   0   178   20   198   19   0   0   0   0   90   0   109 
Substandard  5,201   5,098   3,764   600   2,016   9,659   200   26,538   1,939   2,537   4,877   3,135   508   10,865   25   23,886 
Doubtful  0   0   0   0   0   308   0   308   0   0   0   0   0   305   0   305 
Total commercial real estate nonresidential $224,894  $107,094  $90,131  $60,799  $61,093  $190,506  $23,376  $757,893  
180,509  
179,613  
95,899  
76,161  
46,569  
158,857  
24,741  
762,349 
                                                                
Dealer floorplans                                                                
Risk rating:                                                                
Pass $0  $0  $0  $0  $0  $0  $69,105  $69,105  
0  
0  
0  
0  
0  
0  
77,153  
77,153 
Watch  0   0   0   0   0   0   347   347   0   0   0   0   0   0   380   380 
OAEM  0   0   0   0   0   0   0   0   0   0   0   0   0   0   0   0 
Substandard  0   0   0   0   0   0   0   0   0   0   0   0   0   0   0   0 
Doubtful  0   0   0   0   0   0   0   0   0   0   0   0   0   0   0   0 
Total dealer floorplans $0  $0  $0  $0  $0  $0  $69,452  $69,452  
0  
0  
0  
0  
0  
0  
77,533  
77,533 
                                                                
Commercial other                                                                
Risk rating:                                                                
Pass $72,650  $43,838  $16,495  $29,858  $9,105  $13,346  $75,119  $260,411  
78,846  
60,550  
34,841  
8,922  
2,333  
23,961  
77,355  
286,808 
Watch  7,196   1,967   1,582   599   332   1,071   11,792   24,539   1,622   393   604   217   159   780   6,402   10,177 
OAEM  0   0   268   383   12   1   482   1,146   30   0   0   0   0   0   30   60 
Substandard  1,600   1,589   147   184   287   451   124   4,382   6,090   5,489   885   356   143   758   952   14,673 
Doubtful  0   0   0   0   0   0   0   0   466   129   0   109   0   0   0   704 
Total commercial other $81,446  $47,394  $18,492  $31,024  $9,736  $14,869  $87,517  $290,478  
87,054  
66,561  
36,330  
9,604  
2,635  
25,499  
84,739  
312,422 
                                                                
Commercial unsecured SBA PPP                                
Risk rating:                                
Pass $46,227  $1,108  $0  $0  $0  $0  $0  $47,335 
Watch  0   0   0   0   0   0   0   0 
OAEM  0   0   0   0   0   0   0   0 
Substandard  0   0   0   0   0   0   0   0 
Doubtful  0   0   0   0   0   0   0   0 
Total commercial unsecured SBA PPP $46,227  $1,108  $0  $0  $0  $0  $0  $47,335 
                                
Commercial loans                                                                
Risk rating:                                                                
Pass $517,860  $209,688  $174,914  $125,833  $109,211  $247,757  $176,157  $1,561,420  
519,154  
378,826  
171,938  
149,565  
70,102  
233,022  
192,516  
1,715,123 
Watch  24,203   21,212   16,338   14,300   7,219   50,350   13,062   146,684   14,348   16,052   17,892   6,696   4,257   31,372   8,484   99,101 
OAEM  0   0   268   383   28   179   502   1,360   49   0   0   39   0   2,046   59   2,193 
Substandard  11,623   8,677   4,531   5,974   3,974   12,578   324   47,681   8,211   12,315   7,640   3,837   4,290   14,162   977   51,432 
Doubtful  0   0   0   0   0   308   0   308   466   129   0   109   0   305   0   1,009 
Total commercial loans $553,686  $239,577  $196,051  $146,490  $120,432  $311,172  $190,045  $1,757,453  $542,228  $407,322  $197,470  $160,246  $78,649  $280,907  $202,036  $1,868,858 

24


The following tables present the credit risk profile of CTBI’s residential real estate and consumer loan portfolios based on performing or nonperforming status, segregated by class:

March 31, 2022 Term Loans Amortized Cost Basis by Origination Year 
March 31, 2023 Term Loans Amortized Cost Basis by Origination Year 
(in thousands) 2022  2021  2020  2019  2018  Prior  
Revolving
Loans
  Total  2023  2022  2021  2020  2019  Prior  
Revolving
Loans
  Total 
Home equity lines                                                
Performing $0  $0  $0  $0  $0  $11,934  $94,324  $106,258  $0  $0  $0  $0  $0  $9,768  $113,595  $123,363 
Nonperforming  0   0   0   0   0   635   337   972   0   0   0   0   0   491   242   733 
Total home equity lines $0  $0  $0  $0  $0  $12,569  $94,661  $107,230  
0  
0  
0  
0  
0  
10,259  
113,837  
124,096 
                                                                
Mortgage loans                                                                
Performing $44,293  $196,891  $151,515  $70,288  $35,606  $274,366  $0  $772,959  
34,180  
182,233  
173,212  
129,393  
61,486  
258,399  
0  
838,903 
Nonperforming  0   0   0   485   415   6,594   0   7,494   0   0   167   0   756   6,609   0   7,532 
Total mortgage loans $44,293  $196,891  $151,515  $70,773  $36,021  $280,960  $0  $780,453  
34,180  
182,233  
173,379  
129,393  
62,242  
265,008  
0  
846,435 
                                                                
Mortgage loans current period gross charge-offs
  0   0   0   0   0   40   0   40 
                                
Residential loans                                                                
Performing $44,293  $196,891  $151,515  $70,288  $35,606  $286,300  $94,324  $879,217  
34,180  
182,233  
173,212  
129,393  
61,486  
268,167  
113,595  
962,266 
Nonperforming  0   0   0   485   415   7,229   337   8,466   0   0   167   0   756   7,100   242   8,265 
Total residential loans $44,293  $196,891  $151,515  $70,773  $36,021  $293,529  $94,661  $887,683  $34,180  $182,233  $
173,379  $129,393  $62,242  $275,267  $113,837  $970,531 
                                
Total residential loans current period gross charge-offs
 $
0  $
0  $
0  $
0  $
0  $
40  $
0  $
40 
                                                                
Consumer direct loans                                                                
Performing $19,055  $62,560  $34,193  $16,419  $9,332  $15,038  $0  $156,597  $18,047  $53,577  $37,333  $21,420  $9,991  $16,762  $0  $157,130 
Nonperforming  0   0   14   0   9   0   0   23   0   28   0   0   0   0   0   28 
Total consumer direct loans $19,055  $62,560  $34,207  $16,419  $9,341  $15,038  $0  $156,620  
18,047  
53,605  
37,333  
21,420  
9,991  
16,762  
0  
157,158 
                                                                
Total consumer direct loans current period gross charge-offs  0   80   34   29   12   1   0   156 
                                
Consumer indirect loans                                                                
Performing $123,676  $235,189  $167,492  $70,474  $46,187  $24,190  $0  $667,208  
112,812  
338,385  
152,303  
102,696  
39,298  
26,944  
0  
772,438 
Nonperforming  0   105   7   53   0   14   0   179   0   16   68   21   7   20   0   132 
Total consumer indirect loans $123,676  $235,294  $167,499  $70,527  $46,187  $24,204  $0  $667,387  
112,812  
338,401  
152,371  
102,717  
39,305  
26,964  
0  
772,570 
                                                                
Total consumer indirect loans current period gross charge-offs
  0   525   617   153   44   43   0   1,382 
                                
Consumer loans                                                                
Performing $142,731  $297,749  $201,685  $86,893  $55,519  $39,228  $0  $823,805  
130,859  
391,962  
189,636  
124,116  
49,289  
43,706  
0  
929,568 
Nonperforming  0   105   21   53   9   14   0   202   0   44   68   21   7   20   0   160 
Total consumer loans $142,731  $297,854  $201,706  $86,946  $55,528  $39,242  $0  $824,007  $130,859  $392,006  $189,704  $124,137  $49,296  $
43,726  $
0  $
929,728 
                                
Total consumer loans current period gross charge-offs
 $
0  $
605  $
651  $
182  $
56  $
44  $
0  $
1,538 
25


December 31, 2021 Term Loans Amortized Cost Basis by Origination Year 
December 31, 2022
 Term Loans Amortized Cost Basis by Origination Year 
(in thousands) 2021  2020  2019  2018  2017  Prior  
Revolving
Loans
  Total  2022  2021  2020  2019  2018  Prior  
Revolving
Loans
  Total 
Home equity lines                                                
Performing $0  $0  $0  $0  $0  $10,909  $94,666  $105,575  $0  $0  $0  $0  $0  $10,195  $109,567  $119,762 
Nonperforming  0   0   0   0   0   520   572   1,092   0   0   0   0   0   502   276   778 
Total home equity lines $0  $0  $0  $0  $0  $11,429  $95,238  $106,667  
0  
0  
0  
0  
0  
10,697  
109,843  
120,540 
                                                                
Mortgage loans                                                                
Performing $195,731  $161,471  $75,792  $37,188  $42,597  $245,666  $0  $758,445  
176,736  
177,469  
132,795  
62,415  
30,473  
236,110  
0  
815,998 
Nonperforming  0   63   424   364   558   7,331   0   8,740   0   282   98   791   422   7,405   0   8,998 
Total mortgage loans $195,731  $161,534  $76,216  $37,552  $43,155  $252,997  $0  $767,185  
176,736  
177,751  
132,893  
63,206  
30,895  
243,515  
0  
824,996 
                                                                
Residential loans                                                                
Performing $195,731  $161,471  $75,792  $37,188  $42,597  $256,575  $94,666  $864,020  
176,736  
177,469  
132,795  
62,415  
30,473  
246,305  
109,567  
935,760 
Nonperforming  0   63   424   364   558   7,851   572   9,832   0   282   98   791   422   7,907   276   9,776 
Total residential loans $195,731  $161,534  $76,216  $37,552  $43,155  $264,426  $95,238  $873,852  $176,736  $177,751  $132,893  $63,206  $30,895  $254,212  $109,843  $945,536 
                                                                
Consumer direct loans                                                                
Performing $71,626  $39,312  $18,492  $10,468  $4,490  $12,251  $0  $156,639  $62,239  $42,014  $23,921  $11,166  $6,766  $11,357  $0  $157,463 
Nonperforming  0   4   3   34   3   0   0   44   25   11   5   0   0   0   0   41 
Total consumer direct loans $71,626  $39,316  $18,495  $10,502  $4,493  $12,251  $0  $156,683  
62,264  
42,025  
23,926  
11,166  
6,766  
11,357  
0  
157,504 
                                                                
Consumer indirect loans                                                                
Performing $263,127  $190,145  $80,793  $54,437  $23,449  $8,668  $0  $620,619  
371,079  
168,513  
116,267  
45,748  
26,247  
9,073  
0  
736,927 
Nonperforming  24   135   20   0   23   4   0   206   65   251   96   30   1   22   0   465 
Total consumer indirect loans $263,151  $190,280  $80,813  $54,437  $23,472  $8,672  $0  $620,825  
371,144  
168,764  
116,363  
45,778  
26,248  
9,095  
0  
737,392 
                                                                
Consumer loans                                                                
Performing $334,753  $229,457  $99,285  $64,905  $27,939  $20,919  $0  $777,258  
433,318  
210,527  
140,188  
56,914  
33,013  
20,430  
0  
894,390 
Nonperforming  24   139   23   34   26   4   0   250   90   262   101   30   1   22   0   506 
Total consumer loans $334,777  $229,596  $99,308  $64,939  $27,965  $20,923  $0  $777,508  $433,408  $210,789  $140,289  $56,944  $33,014  $20,452  $0  $894,896 

* A loan is considered nonperforming if it is 90 days or more past due and/or on nonaccrual.

26


The total of consumer mortgage loans secured by real estate properties for which formal foreclosure proceedings are in process was $3.2 million at March 31, 2023.  The total of consumer mortgage loans secured by real estate properties for which formal foreclosure proceedings have resumed with restricted parameters was $4.3$3.3 million at March 31, 2022.  The total of consumer mortgage loans secured by real estate properties for which formal foreclosure proceedings began, but had been suspended, at December 31, 2021 was $2.3 million.2022.

26


In accordance with ASC 326-20-30-2, if a loan does not share risk characteristics with other pooled loans in determining the allowance for credit losses, the loan shall be evaluated for expected credit losses on an individual basis. Of the loans that CTBI has individually evaluated, the loans listed below by segment are those that are collateral dependent:

 March 31, 2022  March 31, 2023 
(in thousands) 
Number of
Loans
  
Recorded
Investment
  
Specific
Reserve
  
Number of
Loans
  
Recorded
Investment
  
Specific
Reserve
 
Hotel/motel  1  $8,348  $0   2  $8,193  $0 
Commercial real estate residential  4   7,119   0   3   6,380   0 
Commercial real estate nonresidential  11   19,827   200   6   11,712   0 
Commercial other  4   11,634   300   2
   8,043   0 
Total collateral dependent loans  20  $46,928  $500   13  $34,328  $0 

 December 31, 2021  December 31, 2022 
(in thousands) 
Number of
Loans
  
Recorded
Investment
  
Specific
Reserve
  
Number of
Loans
  
Recorded
Investment
  
Specific
Reserve
 
Hotel/motel  2  $9,462  $600   1  $1,168  $0 
Commercial real estate residential  4   7,255   0   4   7,786   0 
Commercial real estate nonresidential  11   19,943   200   8   14,718   200 
Commercial other  1   1,113   350   2   8,926   1,000 
Total collateral dependent loans  18  $37,773  $1,150   15  $32,598  $1,200 

 March 31, 2021  March 31, 2022 
(in thousands) 
Number of
Loans
  
Recorded
Investment
  
Specific
Reserve
  
Number of
Loans
  
Recorded
Investment
  
Specific
Reserve
 
Hotel/motel  6  $34,174  $550   1  $8,348  $0 
Commercial real estate residential  5   8,679   0   4   7,119   0 
Commercial real estate nonresidential  10   19,431   200   11   19,827   200 
Commercial other  1   1,267   0   4   11,634   300 
Total collateral dependent loans  22  $63,551  $750   20  $46,928  $500 


The hotel/motel, commercial real estate residential, and commercial real estate nonresidential segments are all collateralized with real estate.  NaN of the 4The two loans listed in the commercial other segment at March 31, 2022 is collateralized by various chattel, including surface mining equipment, preparation plant equipment, and a first mortgage on a preparation plant, real estate, and improvements.  The other 3 loans in this category2023 are collateralized by accounts receivable,inventory, equipment, and inventory.accounts receivable.

27


Certain loans have been modified in TDRs, where the customer is facing financial difficulty and economic concessions were granted to borrowers consisting of reductions in the interest rates, payment extensions, forgiveness of principal, and forbearances.  Those loans, segregated by class of loans and concession granted, are presented below as of March 31, 2023:

 Interest Rate Reduction Term Extension 
(in thousands)
Amortized
Cost at March
31, 2023
 % of total 
Amortized
Cost at March
31, 2023
 % of total 
Hotel/motel $0   0.00% $0   0.00%
Commercial real estate residential  358   0.09   1,369   0.36 
Commercial real estate nonresidential  4,506   0.60   4,715   0.63 
Dealer floorplans  0   0.00   0   0.00 
Commercial other  0   0.00   963   0.30 
Commercial loans  4,864   0.26   7,047   0.38 
                 
Real estate mortgage  59   0.01   2,446   0.29 
Home equity lines  0   0.00   55   0.04 
Residential loans  59   0.01   2,501   0.26 
                 
Consumer direct  0   0.00 �� 178   0.11 
Consumer indirect  0   0.00   396   0.05 
Consumer loans  0   0.00   574   0.06 
                 
Loans and lease financing $4,923   0.13% $10,122   0.27%
                 
 
Combination – Term Extension
and Interest Rate Reduction
 Payment Change 
(in thousands)
Amortized
Cost at March
  31, 2023
 % of total 
Amortized
Cost at March
31, 2023
 % of total 
Hotel/motel $
0   0.00% $0   0.00%
Commercial real estate residential  45   0.01   0   0.00 
Commercial real estate nonresidential  0   0.00   0   0.00 
Dealer floorplans  0   0.00   0   0.00 
Commercial other  0   0.00   111   0.04 
Commercial loans  45   0.00   111   0.01 
                 
Real estate mortgage  217   0.03   0   0.00 
Home equity lines  35   0.03   60   0.05 
Residential loans  252   0.03   60   0.01 
                 
Consumer direct  0   0.00   21   0.01 
Consumer indirect  0   0.00   0   0.00 
Consumer loans  0   0.00   21   0.00 
                 
Loans and lease financing $297   0.01% $192   0.01%

28


The following table describes the financial effect of the modifications made to borrowers experiencing financial difficulty:

Interest Rate ReductionTerm Extension
Loan TypeFinancial ImpactFinancial Impact
Hotel/motel
Commercial real estate residentialReduced weighted-average contractual interest rate from 9.6% to 8.0%The weighted-average term was not increased with the changes to this portfolio
Commercial real estate nonresidentialReduced weighted-average contractual interest rate from 9.5% to 7.5%The weighted-average term was not increased with the changes to this portfolio
Dealer floorplans
Commercial otherAdded a weighted-average 1.8 years to life of the loans, which reduced monthly payment amounts to the borrower
Real estate mortgageChanged from an adjustable rate to a fixed rate mortgage maintaining the contractual interest rate of 3.0%Added a weighted-average 2.3 years to life of the loans, which reduced monthly payment amounts to the borrower
Home equity linesAdded a weighted-average 6.67 years to life of the loans, which reduced monthly payment amounts to the borrower
Consumer directAdded a weighted-average 0.2 years to the life of the loans
Consumer indirectAdded a weighted-average 0.3 years to the life of the loans

Combination – Term Extension and
Interest Rate Reduction
Payment Changes
Loan TypeFinancial ImpactFinancial Impact
Hotel/motel
Commercial real estate residentialReduced weighted-average contractual interest rate from 10.8% to 6.5% and increased the weighted-average life by 0.3 years
Commercial real estate nonresidential
Dealer floorplans
Commercial otherProvided payment changes that will be added to the end of the original loan term
Real estate mortgageReduced weighted-average contractual interest rate from 7.4% to 6.1% and increased the weighted-average life by 12.9 years
Home equity linesWhile the weighted-average contractual interest rate did not change materially from 7.7%, the weighted-average life increased by 5.0 yearsProvided payment changes that will be added to the end of the original loan term
Consumer directProvided payment changes that will be added to the end of the original loan term
Consumer indirect


29


Presented below, segregated by class of loans, are TDRs that occurred during the three months ended March 31, 2022 and 2021 and the year ended December 31, 2021:2022:

 
Three Months Ended
March 31, 2022
  
Three Months Ended
March 31, 2022
 
 Pre-Modification Outstanding Balance  Pre-Modification Outstanding Balance 
(in thousands) Number of Loans  Term Modification  Combination  Total Modification  
Number of
Loans
 
Term
Modification
 Combination 
Total
Modification
 
Hotel/motel 0  $0  $0  $0  0  $
0  $
0  $
0 
Commercial real estate residential 2  154  0  154  2  154  0  154 
Commercial real estate nonresidential 2  245  0  245  2  245  0  245 
Commercial other 4  964  0  964  4  964  0  964 
Total commercial loans 8  1,363  0  1,363  8  1,363  0  1,363 
                        
Real estate mortgage  2   0   916   916   2   0   916   916 
Total residential loans 2  0  916  916  2  0  916  916 
                        
Total troubled debt restructurings 10  $1,363  $916  $2,279  10  $1,363  $916  $2,279 

  
Three Months Ended
March 31, 2022
 
  Post-Modification Outstanding Balance 
(in thousands) 
Number of
Loans
  
Term
Modification
  Combination  
Total
Modification
 
Hotel/motel
  0  $
0  $
0  $
0 
Commercial real estate residential  2   154   0   154 
Commercial real estate nonresidential  2   244   0   244 
Commercial other  4   963   0   963 
Total commercial loans  8   1,361   0   1,361 
                 
Real estate mortgage  2   0   916   916 
Total residential loans  2   0   916   916 
                 
Total troubled debt restructurings  10  $1,361  $916  $2,277 

  
Year Ended
December 31, 2022
 
  Pre-Modification Outstanding Balance 
(in thousands) 
Number of
Loans
  
Term
Modification
  Combination  Other  
Total
Modification
 
Commercial real estate residential
  
6
  
$
659
  
$
0
  
$
66  $
725
 
Commercial real estate nonresidential
  
8
   
1,206
   
0
   118   
1,324
 
Hotel/motel
  0   0   0   0   0 
Commercial other
  
22
   
12,812
   
0
   
66
   
12,878
 
Total commercial loans
  
36
   
14,677
   
0
   
250
   
14,927
 
                     
Real estate mortgage
  
5
   
593
   
1,309
   
0
   
1,902
 
Total residential loans
  
5
   
593
   
1,309
   
0
   
1,902


Total troubled debt restructurings  
41
  
$
15,270
  
$
1,309
  
$
250
  
$
16,829
 

2730

  
Three Months Ended
March 31, 2022
 
  Post-Modification Outstanding Balance 
(in thousands) Number of Loans  Term Modification  Combination  Total Modification 
Hotel/motel  0  $0  $0  $0 
Commercial real estate residential  2   154   0   154 
Commercial real estate nonresidential  2   244   0   244 
Commercial other  4   963   0   963 
Total commercial loans  8   1,361   0   1,361 
                 
Real estate mortgage  2   0   916   916 
Total residential loans  2   0   916   916 
                 
Total troubled debt restructurings  10  $1,361  $916  $2,277 

  
Year Ended
December 31, 2021
 
  Pre-Modification Outstanding Balance 
(in thousands) Number of Loans  Term Modification  Combination  Other  Total Modification 
Hotel/motel
  
0
  $
0
  $
0
  $
0
  $
0
 
Commercial real estate residential
  
6
  

388
  

0
  

0  
388
 
Commercial real estate nonresidential
  
9
   
4,179
   
2,988
   0   
7,167
 
Commercial other
  
5
   
417
   
0
   
0
   
417
 
Total commercial loans
  
20
   
4,984
   
2,988
   
0
   
7,972
 
                     
Real estate mortgage
  
3
   
278
   
277
   
262
   
817
 
Total residential loans
  
3
   
278
   
277
   
262
   
817


Total troubled debt restructurings  
23
  
$
5,262
  
$
3,265
  
$
262
  
$
8,789


Year Ended
December 31, 2021
 
  Post-Modification Outstanding Balance 
(in thousands) Number of Loans  Term Modification  Combination  Other  Total Modification 
Commercial real estate residential
  
6
  
$
424
  
$
0
  
$
0  
$
424
 
Commercial real estate nonresidential
  
9
   
4,282
   
3,000
   
0
   
7,282
 
Hotel/motel
  
0
   
0
   
0
   0   
0
 
Commercial other
  
5
   
340
   
0
   
0
   
340
 
Total commercial loans
  
20
   
5,046
   
3,000
   
0
   
8,046
 
                     
Real estate mortgage
  
3
   
279
   
277
   
262
   
818
 
Total residential loans
  
3
   
279
   
277
   
262
   
818
 
                     
Total troubled debt restructurings  
23
  
$
5,325
  
$
3,277
  
$
262
  
$
8,864
 

28

  
Three Months Ended
March 31, 2021
 
  Pre-Modification Outstanding Balance 
(in thousands) Number of Loans  Term Modification  Combination  Total Modification 
Hotel/motel  0  $0  $0  $0 
Commercial real estate residential  0   0   0   0 
Commercial real estate nonresidential  1   0   284   284 
Commercial other  0   0   0   0 
Total commercial loans  1   0   284   284 
                 
Real estate mortgage  0   0   0   0 
Total residential loans  0   0   0   0 
                 
Total troubled debt restructurings  1  $0  $284  $284 

 
Three Months Ended
March 31, 2021
  
Year Ended
December 31, 2022
 
 Post-Modification Outstanding Balance  Post-Modification Outstanding Balance 
(in thousands) Number of Loans  Term Modification  Combination  Total Modification  
Number of
Loans
 
Term
Modification
 Combination Other 
Total
Modification
 
Hotel/motel 0  $0  $0  $0 
Commercial real estate residential 0  0  0  0  
6
  
$
659
  
$
0
  
$
66  
$
725
 
Commercial real estate nonresidential 1  0  284  284  
8
  
1,342
  
0
  
118
  
1,460
 
Hotel/motel
 0  0  0  0  0 
Commercial other 0  0  0  0  
22
  
12,811
  
0
  
66
  
12,877
 
Total commercial loans 1  0  284  284  
36
  
14,812
  
0
  
250
  
15,062
 
                           
Real estate mortgage  0   0   0   0   
5
   
593
   
1,309
   
0
   
1,902
 
Total residential loans 0  0  0  0  
5
  
593
  
1,309
  
0
  
1,902
 
                                    
Total troubled debt restructurings 1  $0  $284  $284  
41
  
$
15,405
  
$
1,309
  
$
250
  
$
16,964


No charge-offs have resulted from modifications for any of the presented periods.  We had commitments to extend additional credit in the amount of $175 thousand and $52 thousand at March 31, 2022 and December 31, 2021, respectively, on loans that were considered TDRs.


Loans retain their accrual status at the time of their modification.  As a result, if a loan is on nonaccrual at the time it is modified, it stays as nonaccrual, and if a loan is on accrual at the time of the modification, it generally stays on accrual.  Commercial and consumer loans modified indue to a TDRborrower’s financial difficulty are closely monitored for delinquency as an early indicator of possible future default.  If loans modified in a TDRloan to a borrower experiencing financial difficulty subsequently default,defaults, CTBI evaluates the loan for possible further impairment.The table below represents the payment status of loans to borrowers experiencing financial difficulty.

  Past Due Status (Amortized Cost Basis) 
  Current   30-89   90+ Nonaccrual 
Hotel/motel
 
$
0
  
$
0
  
$
0
  
$
0
 
Commercial real estate residential
  
1,772
   
0
   
0
   
0
 
Commercial real estate nonresidential
  
9,222
   
0
   
0
   
0
 
Dealer floorplans
  
0
   
0
   
0
   
0
 
Commercial other
  
720
   
353
   
0
   
0
 
Real estate mortgage
  
2,663
   
59
   
0
   
0
 
Home equity lines
  
150
   
0
   
0
   
0
 
Consumer direct
  
199
   
0
   
0
   
0
 
Consumer indirect
  
381
   
15
   
0
   
0
 
  
$
15,107
  
$
427
  
$
0
  
$
0


The allowance for loan losses may be increased, adjustments may be made in the allocation of the allowance, or partial charge-offs may be taken to further write-down the carrying value of the loan.  Presented below, segregated by class ofDuring the quarter ended March 31, 2023, there were no loans are loansto borrowers experiencing financial difficulty that were modified as TDRs within the past twelve months which have subsequently defaulted.  CTBI considers a loan in default when it is 90 days or more past due or transferred to nonaccrual.


Presented below, segregated by segment,class of loans, are loans that were modified as TDRs for which there was a payment default during the periods indicated and such default was within twelve months of the loan modification.  There were 0 defaulted restructured loans for the three monthsquarter ended March 31, 2022.2022 and the year ended December 31, 2022:


Three Months Ended
March 31, 2022
  
Year Ended
December 31, 2022
 
(in thousands)
 Number of
 Loans
  
Recorded
Balance
  
Number of
Loans
  
Recorded
Balance
 
Commercial:
            
Hotel/motel  
0
  
$
0
   
0
  
$
0
 
Residential:
                
Real estate mortgage  
0
   
0
   
2
   
751
 
Total defaulted restructured loans  
0
  
$
0
   
2
  
$
751
 

2931

(in thousands) 
Three Months Ended
March 31, 2022
  
Year Ended
December 31, 2021
 
  Number of Loans  Recorded Balance  Number of Loans  Recorded Balance 
Commercial:
            
Hotel/motel  
0
  
$
0
   
1
  
$
1,113
 
Commercial other  
0
   
0
   
0
   
0
 
Residential:
                
Real estate mortgage  
0
   
0
   
1
   
275
 
Total defaulted restructured loans  
0
  
$
0
   
2
  
$
1,388
 

Note 5 – Other Real Estate Owned


Activity for other real estate owned was as follows:

 Three Months Ended
 
 
Three Months Ended
March 31
  
March 31
 
(in thousands) 2022  2021  2023  2022 
Beginning balance of other real estate owned $3,486  $7,694  $3,671  $3,486 
New assets acquired  137   (170)  51   137
Fair value adjustments  (246)  (154)  (81)  (246)
Sale of assets  (1,078)  (1,146)  (865)  (1,078)
Ending balance of other real estate owned $2,299  $6,224  $2,776  $2,299 


Carrying costs and fair value adjustments associated with foreclosed properties for the three months ended March 31, 2023 and 2022 were $0.1 million and 2021 were $0.4 million, and $0.3 million, respectively.  ForSee Note 1 for a description of our accounting policies relative to foreclosed properties and other real estate owned, see Note 1 to our consolidated financial statements included in our annual report on Form 10-K for the year ended December 31, 2021.owned.


The major classifications of foreclosed properties are shown in the following table:

(in thousands) 
March 31
2022
  
December 31
2021
  
March 31
2023
  
December 31
2022
 
1-4 family $940  $1,130  $743  $859 
Construction/land development/other  465   480   687   867 
Multifamily  0   88 
Non-farm/non-residential  894   1,788   1,346   1,945 
Total foreclosed properties $2,299  $3,486  $2,776  $3,671 

Note 6 – Repurchase Agreements


We utilize securities sold under agreements to repurchase to facilitate the needs of our customers and provide additional funding to our balance sheet. Repurchase agreements are transactions whereby we offer to sell to a counterparty an undivided interest in an eligible security at an agreed upon purchase price, and which obligates CTBI to repurchase the security on an agreed upon date at an agreed upon repurchase price plus interest at an agreed upon rate. Securities sold under agreements to repurchase are recorded at the amount of cash received in connection with the transaction and are reflected in the accompanying consolidated balance sheets.

30


We monitor collateral levels on a continuous basis and maintain records of each transaction specifically describing the applicable security and the counterparty’s fractional interest in that security, and we segregate the security from its general assets in accordance with regulations governing custodial holdings of securities. The primary risk with our repurchase agreements is market risk associated with the securities securing the transactions, as we may be required to provide additional collateral based on fair value changes of the underlying securities. Securities pledged as collateral under repurchase agreements are maintained with our safekeeping agents. The carrying value of investment securities available-for-sale pledged as collateral under repurchase agreements totaled $330.9$273.2 million and $317.1$273.8 million at March 31, 20222023 and December 31, 2021,2022, respectively.

32


The remaining contractual maturity of the securities sold under agreements to repurchase by class of collateral pledged included in the accompanying consolidated balance sheets as of March 31, 20222023 and December 31, 20212022 is presented in the following tables:

 March 31, 2022  March 31, 2023 
 Remaining Contractual Maturity of the Agreements  Remaining Contractual Maturity of the Agreements 
(in thousands) 
Overnight
and
Continuous
  
Up to
30 days
  30-90 days  
Greater
Than
90 days
  Total  
Overnight
and
Continuous
  
Up to
30 days
  30-90 days  
Greater
Than
90 days
  Total 
Repurchase agreements and repurchase-to-maturity transactions:                              
U.S. Treasury and government agencies $2,470  $0  $25,000  $14,209  $41,679  $20,470  $0  $0  $2,830  $23,300 
State and political subdivisions  82,075   0   0   22,045   104,120   97,997   0   0   7,209   105,206 
U.S. government sponsored agency mortgage-backed securities  25,228   0   0   83,596   108,824   25,967   0   0   53,081   79,048 
Asset-backed securities
  1,223   0   0   0   1,223 
Total $109,773  $0  $25,000  $119,850  $254,623  $145,657  $0  $0  $63,120  $208,777 

 December 31, 2021  December 31, 2022 
 Remaining Contractual Maturity of the Agreements  Remaining Contractual Maturity of the Agreements 
(in thousands) 
Overnight
and
Continuous
  
Up to
30 days
  30-90 days  
Greater
Than
90 days
  Total  
Overnight
and
Continuous
  
Up to
30 days
  30-90 days  
Greater
Than
90 days
  Total 
Repurchase agreements and repurchase-to-maturity transactions:                              
U.S. Treasury and government agencies $3,176  $16  $5,400  $10,040  $18,632  $21,679  $34  $2,979  $1,832  $26,524 
State and political subdivisions  83,375   484   13,633   9,427   106,919   96,627   466   9,634   2,140   108,867 
U.S. government sponsored agency mortgage-backed securities  24,689   0   85,967   34,881   145,537   17,964   0   52,387   9,385   79,736 
Asset-backed securities
  304   0   0   0   304 
Total $111,240  $500  $105,000  $54,348  $271,088  $136,574  $500  $65,000  $13,357  $215,431 

Note 7 – Fair Value of Financial Assets and Liabilities

Fair Value Measurements


ASC 820, Fair Value Measurements, defines fair value, establishes a framework for measuring fair value in GAAP, and expands disclosures about fair value measurements.  ASC 820 applies whenever other standards require (or permit) assets or liabilities to be measured at fair value but does not expand the use of fair value in any new circumstances.  Fair value measurements must maximize the use of observable inputs and minimize the use of unobservable inputs.  In this standard, the FASB clarifies the principle that fair value should be based on the exit price when pricing the asset or liability.  In support of this principle, ASC 820 establishes a fair value hierarchy that prioritizes the information used to develop those assumptions.  The fair value hierarchy is as follows:

Level 1 Inputs – Quoted prices in active markets for identical assets or liabilities.

Level 2 Inputs – Inputs other than quoted prices included in Level 1 that are observable for the asset or liability, either directly or indirectly. These might include quoted prices for similar assets and liabilities in active markets, and inputs other than quoted prices that are observable for the asset or liability, such as interest rates and yield curves that are observable at commonly quoted intervals.

3133

Level 3 Inputs – Unobservable inputs for determining the fair values of assets or liabilities that reflect an entity’s own assumptions about the assumptions that market participants would use in determining an exit price for the assets or liabilities.

Recurring Measurements


The following tables present the fair value measurements of assets recognized in the accompanying balance sheets measured at fair value on a recurring basis as of March 31, 20222023 and December 31, 20212022 and indicate the level within the fair value hierarchy of the valuation techniques.


Fair Value Measurements at
March 31, 2023 Using
 
(in thousands)    
Fair Value Measurements at
March 31, 2022 Using
  Fair Value  
Quoted
Prices in
Active
Markets for
Identical
Assets
(Level 1)
  
Significant
Other
Observable
Inputs
(Level 2)
  
Significant
Unobservable
Inputs
(Level 3)
 

 Fair Value  
Quoted
Prices in
Active
Markets for
Identical
Assets
(Level 1)
  
Significant
Other
Observable
Inputs
(Level 2)
  
Significant
Unobservable
Inputs
(Level 3)
 
Assets measured – recurring basis                        
Available-for-sale securities:                        
U.S. Treasury and government agencies $451,731  $402,275  $49,456  $0  $379,221  $352,714  $26,507  $0 
State and political subdivisions  302,662   0   302,662   0   264,163   0   264,163   0 
U.S. government sponsored agency mortgage-backed securities  655,213   0   655,213   0   509,085   0   509,085   0 
Asset-backed securities  93,559   0   93,559   0   88,611   0   88,611   0 
Equity securities at fair value  2,352   0   0   2,352   2,380   0   0   2,380 
Mortgage servicing rights  7,748   0   0   7,748   8,121   0   0   8,121 


Fair Value Measurements at
December 31, 2022 Using
 
(in thousands)    
Fair Value Measurements at
December 31, 2021 Using
  Fair Value  
Quoted
Prices in
Active
Markets for
Identical
Assets
(Level 1)
  
Significant
Other
Observable
Inputs
(Level 2)
  
Significant
Unobservable
Inputs
(Level 3)
 

 Fair Value  
Quoted
Prices in
Active
Markets for
Identical
Assets
(Level 1)
  
Significant
Other
Observable
Inputs
(Level 2)
  
Significant
Unobservable
Inputs
(Level 3)
 
Assets measured – recurring basis                        
Available-for-sale securities:                        
U.S. Treasury and government agencies $295,770  $242,214  $53,556  $0  $381,932  $346,265  $35,667  $0 
State and political subdivisions  334,203   0   334,203   0   265,102   0   265,102   0 
U.S. government sponsored agency mortgage-backed securities  730,809   0   730,809   0   520,085   0   520,085   0 
Asset-backed securities  94,647   0   94,647   0   89,107   0   89,107   0 
Equity securities at fair value  2,253   0   0   2,253   2,166   0   0   2,166 
Mortgage servicing rights  6,774   0   0   6,774   8,468   0   0   8,468 


Following is a description of the valuation methodologies and inputs used for assets measured at fair value on a recurring basis and recognized in the accompanying balance sheets, as well as the general classification of such assets pursuant to the valuation hierarchy.  These valuation methodologies were applied to all of CTBI’s financial assets carried at fair value.  CTBI had no liabilities measured and recorded at fair value as of March 31, 20222023 and December 31, 2021.2022.  There have been no significant changes in the valuation techniques during the quarter ended March 31, 2022.2023.  For assets classified within Level 3 of the fair value hierarchy, the process used to develop the reported fair value is described below.

3234

Available-for-Sale Securities


Securities classified as AFS are reported at fair value on a recurring basis.  U.S. Treasury and government agencies are classified as Level 1 of the valuation hierarchy where quoted market prices are available in the active market on which the individual securities are traded.


If quoted market prices are not available, CTBI obtains fair value measurements from an independent pricing service, such as Interactive Data, which utilizes pricing models to determine fair value measurement.  CTBI reviews the pricing quarterly to verify the reasonableness of the pricing.  The fair value measurements consider observable data that may include dealer quotes, market spreads, cash flows, the U.S. Treasury yield curve, live trading levels, trade execution data, market consensus prepayment speeds, credit information, and the bond’s terms and conditions, among other factors.  U.S. Treasury and government agencies, state and political subdivisions, U.S. government sponsored agency mortgage-backed securities, and asset-backed securities are classified as Level 2 inputs.


In certain cases where Level 1 or Level 2 inputs are not available, securities are classified within Level 3 of the hierarchy.  Fair value determinations for Level 3 measurements are estimated on a quarterly basis where assumptions used are reviewed to ensure the estimated fair value complies with accounting standards generally accepted in the United States.

Equity Securities at Fair Value


As of March 31, 20222023 and December 31, 2021,2022, the only securities owned by CTBI that were valued using Level 3 criteria are Visa Class B Stock (included in equity securities at fair value).  Fair value for Visa Class B Stock is determined by an independent third party utilizing assumptions about factors such as quarterly common stock dividend payments, the conversion of the securities to the relevant Class A Stock shares subject to the prevailing conversion rate, and conversion date.  We have concluded the third party assumptions, processes, and conclusions to be reasonable and appropriate in determining the fair value of this asset.  See the table below for inputs and valuation techniques used for Level 3 equity securities.

Mortgage Servicing Rights


Mortgage servicing rights (“MSRs”) do not trade in an active, open market with readily observable prices.  CTBI reports MSRs at fair value on a recurring basis with subsequent remeasurement of MSRs based on change in fair value.


In determining fair value, CTBI utilizes the expertise of an independent third party.  Accordingly, fair value is determined by the independent third party by utilizing assumptions about factors such as mortgage interest rates, discount rates, mortgage loan prepayment speeds, market trends, and industry demand.  Due to the nature of the valuation inputs, MSRs are classified within Level 3 of the hierarchy.  Fair value determinations for Level 3 measurements of MSRs are tested for impairment on a quarterly basis where assumptions used are reviewed to ensure the estimated fair value complies with accounting standards generally accepted in the United States.  We have reviewed the assumptions, processes, and conclusions of the third party provider.  We have determined these assumptions, processes, and conclusions to be reasonable and appropriate in determining the fair value of this asset.  See the table below for inputs and valuation techniques used for Level 3 MSRs.

3335

Level 3 Reconciliation


Following is a reconciliation of the beginning and ending balances of recurring fair value measurements, for the periods indicated, using significant unobservable (Level 3) inputs:


Three Months Ended
March 31, 2023
  
Three Months Ended
March 31, 2022
 
(in thousands) 
Three Months Ended
March 31, 2022
  
Three Months Ended
March 31, 2021
  
Equity
Securities
at Fair
Value
  
Mortgage
Servicing
Rights
  
Equity
Securities
at Fair Value
  
Mortgage
Servicing
Rights
 
 
Equity
Securities
at Fair
Value
  
Mortgage
Servicing
Rights
  
Equity
Securities
at Fair Value
  
Mortgage
Servicing
Rights
 
Beginning balance $2,253  $6,774  $2,471  $4,068  $2,166  $8,468  $2,253  $6,774 
Total unrealized gains (losses)
Included in net income
  99   983   (228)  1,030   214   (214)  99   983 
Issues  0   229   0   736   0   50   0   229 
Settlements  0   (238)  0   (250)  0   (183)  0   (238)
Ending balance $2,352  $7,748  $2,243  $5,584  $2,380  $8,121  $2,352  $7,748 
                                
Total gains (losses) for the period included in net income attributable to the change in unrealized gains or losses related to assets still held at the reporting date $99  $983  $(228) $1,030  $214  $(214) $99  $983 


Realized and unrealized gains and losses for items reflected in the table above are included in net income in the consolidated statements of income as follows:

Noninterest Income
 Three Months Ended
 
 
Three Months Ended
March 31
  March 31
 
(in thousands) 2022  2021  2023  2022 
Total gains
 $844 $552
Total gains (losses)
 $(183) $844

Nonrecurring Measurements


The following tables present the fair value measurements of assets recognized in the accompanying balance sheets measured at fair value on a nonrecurring basis as of March 31, 20222023 and December 31, 20212022 and indicate the level within the fair value hierarchy of the valuation techniques.


Fair Value Measurements at
March 31, 2023 Using
 
(in thousands)    
Fair Value Measurements at
March 31, 2022 Using
  Fair Value  
Quoted
Prices in
Active
Markets for
Identical
Assets
(Level 1)
  
Significant
Other
Observable
Inputs
(Level 2)
  
Significant
Unobservable
Inputs
(Level 3)
 

 Fair Value  
Quoted
Prices in
Active
Markets for
Identical
Assets
(Level 1)
  
Significant
Other
Observable
Inputs
(Level 2)
  
Significant
Unobservable
Inputs
(Level 3)
 
Assets measured – nonrecurring basis                        
Collateral dependent loans $759  $0  $0  $759 
Other real estate owned  688   0   0   688  $
221  $
0  $
0  $
221 

3436


Fair Value Measurements at
December 31, 2022 Using
 
(in thousands)    
Fair Value Measurements at
December 31, 2021 Using
  Fair Value  
Quoted
Prices in
Active
Markets for
Identical
Assets
(Level 1)
  
Significant
Other
Observable
Inputs
(Level 2)
  
Significant
Unobservable
Inputs
(Level 3)
 

 Fair Value  
Quoted
Prices in
Active
Markets for
Identical
Assets
(Level 1)
  
Significant
Other
Observable
Inputs
(Level 2)
  
Significant
Unobservable
Inputs
(Level 3)
 
Assets measured – nonrecurring basis                        
Collateral-dependent loans $1,238  $0  $0  $1,238 
Collateral dependent loans $2,703  $0  $0  $2,703 
Other real estate owned  1,487   0   0   1,487   570   0   0   570 


Following is a description of the valuation methodologies and inputs used for assets measured at fair value on a nonrecurring basis and recognized in the accompanying balance sheet, as well as the general classification of such assets pursuant to the valuation hierarchy.  For assets classified within Level 3 of the fair value hierarchy, the process used to develop the reported fair value is described below.

Collateral Dependent Loans


The estimated fair value of collateral-dependent loans is based on the appraised fair value of the collateral, less estimated cost to sell.  Collateral-dependent loans are classified within Level 3 of the fair value hierarchy.


CTBI considers the appraisal or evaluation as the starting point for determining fair value and then considers other factors and events in the environment that may affect the fair value.  Appraisals of the collateral underlying collateral-dependent loans are obtained when the loan is determined to be collateral-dependent and subsequently as deemed necessary by the Chief Credit Officer.  Appraisals are reviewed for accuracy and consistency by the Chief Credit Officer.  Appraisers are selected from the list of approved appraisers maintained by management.  The appraised values are reduced by discounts to consider lack of marketability and estimated cost to sell if repayment or satisfaction of the loan is dependent on the sale of the collateral.  These discounts and estimates are developed by the Chief Credit Officer by comparison to historical results.


Loans considered collateral dependent are loans for which the repayment is expected to be provided substantially through the operation or sale of the collateral when the borrower is experiencing financial difficulty in accordance with ASC 326-20-35-5.  Quarter-to-date fair value adjustments on collateral- dependent loans disclosed above was a recovery of $0.1$0.2 million at March 31, 2022, and expense of $0.4 million and $0.3 million for the quartersquarter ended December 31, 2021 and March 31,2021, respectively.2022.

Other Real Estate Owned


In accordance with the provisions of ASC 360, Property, Plant, and Equipment, other real estate owned (“OREO”) is carried at the lower of fair value at acquisition date or current estimated fair value, less estimated cost to sell when the real estate is acquired.  Estimated fair value of OREO is based on appraisals or evaluations.  OREO is classified within Level 3 of the fair value hierarchy.  Long-lived assets are subject to nonrecurring fair value adjustments to reflect subsequent partial write-downs that are based on the observable market price or current appraised value of the collateral.  Quarter-to-date fair value adjustments on OREO disclosed above were $0.20.1 million for each of the quartersquarter ended March 31,2022, 2023 and $7.4 thousand for the quarter ended December 31,2021, and March 31,2021. 2022.


Our policy for determining the frequency of periodic reviews is based upon consideration of the specific properties and the known or perceived market fluctuations in a particular market and is typically between 12 and 18 months but generally not more than 24 months.  Appraisers are selected from the list of approved appraisers maintained by management.

3537

Unobservable (Level 3) Inputs


The following tables present quantitative information about unobservable inputs used in recurring and nonrecurring Level 3 fair value measurements at March 31, 20222023 and December 31, 2021.2022.


 Quantitative Information about Level 3 Fair Value Measurements
(in thousands) Quantitative Information about Level 3 Fair Value Measurements 
Fair Value at
March 31,
2023
 
Valuation
Technique(s)
Unobservable Input 
Range
(Weighted
Average)
 
Fair Value at
March 31,
2022
 
Valuation
Technique(s)
Unobservable Input 
Range
(Weighted
Average)
Equity securities at fair value $2,352 Discount cash flows, computer pricing modelDiscount rate  
8.0% - 12.0%
(10.0%)
 $2,380 Discount cash flows, computer pricing modelDiscount rate  
8.0% - 12.0%
(10.0%)
         Conversion date 
Dec 2024
Dec 2028
(Dec 2026)
         Conversion date 
Dec 2025
Dec 2029
(Dec 2027)
                
Mortgage servicing rights $7,748 Discount cash flows, computer pricing modelConstant prepayment rate  
7.0% - 28.3%
(8.1%)
 $8,121 Discount cash flows, computer pricing modelConstant prepayment rate  
6.5% - 35.1%
(7.6%)
         Probability of default  
0.0% - 66.7%
(1.3%)
         Probability of default  
0.0% - 66.7%
(1.4%)
         Discount rate  
10.0% - 11.5%
(10.1%)
         Discount rate  
9.5% - 12.0%
(10.0%)
                
Collateral dependent loans $759 Market comparable propertiesMarketability discount  
20.0% - 20.0%
(20.0%)
        
Other real estate owned $688 Market comparable propertiesComparability adjustments  
10.0% - 34.15%
(14.3%)
 $221 Market comparable propertiesComparability adjustments  
10.0% - 82.18%
(32.94%)

 Quantitative Information about Level 3 Fair Value Measurements
(in thousands) Quantitative Information about Level 3 Fair Value Measurements 
Fair Value at
December 31,
2022
 
Valuation
Technique(s)
Unobservable Input 
Range
(Weighted
Average)
 
Fair Value at
December 31,
2021
 
Valuation
Technique(s)
Unobservable Input 
Range
(Weighted
Average)
Equity securities at fair value $2,253 Discount cash flows, computer pricing modelDiscount rate  
8.0% - 12.0%
(10.0%)
 $2,166 Discount cash flows, computer pricing modelDiscount rate  
8.0% - 12.0%
(10.0%)
         Conversion date 
Dec 2024 - Dec 2028
(Dec 2026)
         Conversion date 
Dec 2025 - Dec 2029
(Dec 2027)
                  
Mortgage servicing rights $6,774 Discount cash flows, computer pricing modelConstant prepayment rate  
7.0% - 26.7%
(10.0%)
 $8,468 Discount cash flows, computer pricing modelConstant prepayment rate  
6.5% - 28.0%
(7.1%)
         Probability of default  
0.0% - 75.0%
(1.4%)
         Probability of default  
0.0% - 100.0%
(1.2%)
         Discount rate  
10.0% - 11.5%
(10.1%)
         Discount rate  
9.5% - 12.0%
(10.0%)
                  
Collateral-dependent loans $1,238 Market comparable propertiesMarketability discount  
20.0% - 62.0%
(41.0%)
 $2,703 Market comparable propertiesMarketability discount  
52.0% - 52.0%
(52.0%)
                  
Other real estate owned $1,487 Market comparable propertiesComparability adjustments  
10.0% - 45.5%
(15.1%)
 $570 Market comparable propertiesComparability adjustments  
10.0% - 30.6%
(10.9%)

Uncertainty of Fair Value Measurements


The following is a discussion of the uncertainty of fair value measurements, the interrelationships between those inputs and other unobservable inputs used in recurring fair value measurement, and of how those inputs might magnify or mitigate the effect of changes in the unobservable inputs on the fair value measurement.

3638

Equity Securities at Fair Value


Fair value for equity securities is derived based on unobservable inputs, such as the discount rate, quarterly dividends payable to the Visa Class B common stock, and the prevailing conversion rate at the conversion date.  The most recent conversion rate of 1.61811.5991 and the most recent dividend rate of 0.60680.7196 were used to derive the fair value estimate.  Significant increases (decreases) in either of those inputs in isolation would result in a significantly lower (higher) fair value measurement.  Generally, a change in the assumption used for discount rate is accompanied by a directionally opposite change in the fair value estimate.

Mortgage Servicing Rights


Fair value for MSRs is derived based on unobservable inputs, such as prepayment speeds of the underlying loans generated using the Andrew Davidson Prepayment Model, FHLMC/FNMA guidelines, the weighted average life of the loan, the discount rate, the weighted average coupon, and the weighted average default rate.  Significant increases (decreases) in either of those inputs in isolation would result in a significantly lower (higher) fair value measurement.  Generally, a change in the assumption used for prepayment speeds is accompanied by a directionally opposite change in the assumption for interest rates.

3739

Fair Value of Financial Instruments


The following table presents estimated fair value of CTBI’s financial instruments as of March 31, 20222023 and indicates the level within the fair value hierarchy of the valuation techniques.  In accordance with the adoption of ASU 2016-01, the fair values as of March 31, 20222023 were measured using an exit price notion.

    
Fair Value Measurements
at March 31, 2022 Using
     
Fair Value Measurements
at March 31, 2023 Using
 
(in thousands) 
Carrying
Amount
  
Quoted
Prices in
Active
Markets for
Identical
Assets
(Level 1)
  
Significant
Other
Observable
Inputs
(Level 2)
  
Significant
Unobservable
Inputs
(Level 3)
  
Carrying
Amount
  
Quoted
Prices in
Active
Markets for
Identical
Assets
(Level 1)
  
Significant
Other
Observable
Inputs
(Level 2)
  
Significant
Unobservable
Inputs
(Level 3)
 
Financial assets:                        
Cash and cash equivalents $164,485  $164,485  $0  $0  $235,874  $235,874  $0  $0 
Certificates of deposit in other banks  245   0   245   0   245   0   245   0 
Debt securities available-for-sale  1,503,165   402,275   1,100,890   0   1,241,080   352,714   888,366   0 
Equity securities at fair value  2,352   0   0   2,352   2,380   0   0   2,380 
Loans held for sale  1,941   1,979   0   0   182   188   0   0 
Loans, net  3,473,232   0   0   3,565,567   3,730,676   0   0   3,603,902 
Federal Home Loan Bank stock  8,139   0   8,139   0   4,826   0   4,826   0 
Federal Reserve Bank stock  4,887   0   4,887   0   4,887   0   4,887   0 
Accrued interest receivable  15,024   0   15,024   0   19,012   0   19,012   0 
                                
                                
Financial liabilities:                                
Deposits $4,428,304  $1,398,529  $3,046,220  $0  $4,543,424  $1,409,839  $3,149,951  $0 
Repurchase agreements  254,623   0   0   254,885   208,777   0   0   208,930 
Federal funds purchased  500   0   500   0   500   0   500   0 
Advances from Federal Home Loan Bank  370   0   392   0   350   0   366   0 
Long-term debt  57,841   0   0   47,415   64,404   0   0   60,191 
Accrued interest payable  1,306   0   1,306   0   4,138   0   4,138   0 
                                
Unrecognized financial instruments:                                
Letters of credit $0  $0  $0  $0  $0  $0  $0  $0 
Commitments to extend credit  0   0   0   0   0   0   0   0 
Forward sale commitments  0   0   0   0   0   0   0   0 

3840


The following table presents estimated fair value of CTBI’s financial instruments as of December 31, 20212022 and indicates the level within the fair value hierarchy of the valuation techniques.

    
Fair Value Measurements
at December 31, 2021 Using
     
Fair Value Measurements
at December 31, 2022 Using
 
(in thousands) 
Carrying
Amount
  
Quoted
Prices in
Active
Markets for
Identical
Assets
(Level 1)
  
Significant
Other
Observable
Inputs (Level 2)
  
Significant
Unobservable
Inputs
(Level 3)
  
Carrying
Amount
  
Quoted
Prices in
Active
Markets for
Identical
Assets
(Level 1)
  
Significant
Other
Observable
Inputs (Level 2)
  
Significant
Unobservable
Inputs
(Level 3)
 
Financial assets:                        
Cash and cash equivalents $311,756  $311,756  $0  $0  $128,686  $128,686  $0  $0 
Certificates of deposit in other banks  245   0   245   0   245   0   245   0 
Debt securities available-for-sale  1,455,429   242,214   1,213,215   0   1,256,226   346,265   909,961   0 
Equity securities at fair value  2,253   0   0   2,253   2,166   0   0   2,166 
Loans held for sale  2,632   2,693   0   0   109   112   0   0 
Loans, net  3,367,057   0   0   3,480,803   3,663,309   0   0   3,511,810 
Federal Home Loan Bank stock  8,139   0   8,139   0   6,676   0   6,676   0 
Federal Reserve Bank stock  4,887   0   4,887   0   4,887   0   4,887   0 
Accrued interest receivable  15,415   0   15,415   0   19,592   0   19,592   0 
                                
                                
Financial liabilities:                                
Deposits $4,344,292  $1,331,103  $3,043,339  $0  $4,426,143  $1,394,915  $3,050,144  $0 
Repurchase agreements  271,088   0   0   271,186   215,431   0   0   215,542 
Federal funds purchased  500   0   500   0   500   0   500   0 
Advances from Federal Home Loan Bank  375   0   400   0   355   0   380   0 
Long-term debt  57,841   0   0   45,854   57,841   0   0   55,860 
Accrued interest payable  1,016   0   1,016   0   2,237   0   2,237   0 
                                
Unrecognized financial instruments:                                
Letters of credit $0  $0  $0  $0  $0  $0  $0  $0 
Commitments to extend credit  0   0   0   0   0   0   0   0 
Forward sale commitments  0   0   0   0   0   0   0   0 

Note 8 – Revenue Recognition


CTBI’s primary source of revenue is interest income generated from loans and investment securities.  Interest income is recognized according to the terms of the financial instrument agreement over the life of the loan or investment security unless it is determined that the counterparty is unable to continue making interest payments.  Interest income also includes prepaid interest fees from commercial customers, which approximates the interest foregone on the balance of the loan prepaid.


CTBI’s additional source of income, also referred to as noninterest income, includes service charges on deposit accounts, gains/lossesgains on the salesales of OREO, gains/losses on the sale of property, plant and equipment,loans, trust and wealth management income, loan related fees, brokerage revenue, and other miscellaneous income and is largely based on contracts with customers.  In these cases, CTBI recognizes revenue when it satisfies a performance obligation by transferring control over a product or service to a customer. CTBI considers a customer to be any party to which we will provide goods or services that are an output of CTBI’s ordinary activities in exchange for consideration.  There is little seasonality with regards to revenue from contracts with customers and all inter-company revenue is eliminated when CTBI’s financial statements are consolidated.

39


Generally, CTBI enters into contracts with customers that are short-term in nature where the performance obligations are fulfilled and payment is processed at the same time.  Such examples include revenue related to merchant fees, interchange fees, and investment services income.  In addition, revenue generated from existing customer relationships such as deposit accounts are also considered short-term in nature, because the relationship may be terminated at any time and payment is processed at the time performance obligations are fulfilled.  As a result, CTBI does 0not have contract assets, contract liabilities, or related receivable accounts for contracts with customers.   In cases where collectability is a concern, CTBI does not record revenue.

41


Generally, the pricing of transactions between CTBI and each customer is either (i) established within a legally enforceable contract between the two parties, as is the case with loan sales, or (ii) disclosed to the customer at a specific point in time, as is the case when a deposit account is opened or before a new loan is underwritten.  Fees are usually fixed at a specific amount or as a percentage of a transaction amount.  No judgment or estimates by management are required to record revenue related to these transactions and pricing is clearly identified within these contracts.


CTBI primarily operates in Kentucky and contiguous areas. Therefore, all significant operating decisions are based upon analysis of CTBI as 1one operating segment.


We disaggregate our revenue from contracts with customers by contract-type and timing of revenue recognition, as we believe it best depicts how the nature, amount, timing, and uncertainty of our revenue and cash flows are affected by economic factors.  Noninterest income not generated under accounting guidance for revenue from contracts with customers during CTBI’s ordinary activities primarily relates to gains on sales of loans, MSRs, gains/losses on the sale of investment securities, gains/losses on the sale of OREO, gains/losses on the sale of property, plant and equipment, and income from bank owned life insurance.


For more information related to our components of noninterest income, see the Condensed Consolidated Statements of Income and Comprehensive Income above.

Note 9 – Earnings Per Share


The following table sets forth the computation of basic and diluted earnings per share:

 Three Months Ended
 
 
Three Months Ended
March 31
  March 31 
(in thousands except per share data) 2022  2021  2023  2022 
Numerator:            
Net income $19,728  $23,618  $19,313  $19,728 
                
Denominator:                
Basic earnings per share:                
Weighted average shares  17,820   17,774   17,872   17,820 
Diluted earnings per share:                
Effect of dilutive stock options and restricted stock grants  12   13   12   12 
Adjusted weighted average shares  17,832   17,787   17,884   17,832 
                
Earnings per share:                
Basic earnings per share $1.11  $1.33  $1.08  $1.11 
Diluted earnings per share  1.11   1.33   1.08   1.11 


There were 0no options to purchase common shares that were excluded from the diluted calculations above for the three months ended March 31, 20222023 and 2021.2022. In addition to in-the-money stock options, unvested restricted stock grants were also used in the calculation of diluted earnings per share based on the treasury method.

4042

Note 10 – Accumulated Other Comprehensive Income (Loss)

Unrealized gains (losses) on AFS securities


Amounts reclassified from accumulated other comprehensive income (loss) (AOCI) and the affected line items in the statements of income during the three months ended March 31, 20222023 and 20212022 were:

 
Amounts Reclassified from
AOCI
 
 
Amounts Reclassified from
AOCI
  
Three Months Ended
March 31
 
(in thousands) 
Three Months Ended
March 31
  2023  2022 
 2022  2021 
Affected line item in the statements of income            
Securities gains $0  $60  $4  $0 
Tax expense  0   16   1   0 
Total reclassifications out of AOCI $0  $44  $3  $0 

4143


Item 2. Management’s Discussion and Analysis of Financial Condition and Results of Operations

Overview

The following Management’s Discussion and Analysis of Financial Condition and Results of Operations (“MD&A”) is intended to help the reader understand Community Trust Bancorp, Inc. (“CTBI”), our operations, and our present business environment.  The MD&A is provided as a supplement to—and should be read in conjunction with—our condensed consolidated financial statements and the accompanying notes thereto contained in Part I, Item 1 of this quarterly report, as well as our consolidated financial statements, the accompanying notes thereto, and the related Management’s Discussion and Analysis of Financial Condition and Results of Operations in our annual report on Form 10-K for the year ended December, 31, 2021.2022.  The MD&A includes the following sections:

Our Business

Financial Goals and Performance

Results of Operations and Financial Condition

Liquidity and Market Risk

Interest Rate Risk

Capital Resources

Impact of Inflation, Changing Prices, and Economic Conditions

Stock Repurchase Program

Critical Accounting Policies and Estimates

Our Business

CTBICommunity Trust Bancorp, Inc. (“CTBI”) is a bank holding company headquartered in Pikeville, Kentucky.  Currently, we own one commercial bank, Community Trust Bank, Inc. (“CTB”) and one trust company, Community Trust and Investment Company.  Through our subsidiaries, we have seventy-nine banking locations in eastern, northeastern, central, and south central Kentucky, southern West Virginia, and northeastern Tennessee, four trust offices across Kentucky, and one trust office in northeastern Tennessee.  At March 31, 2022,2023, we had total consolidated assets of $5.4$5.5 billion and total consolidated deposits, including repurchase agreements, of $4.7$4.8 billion.  Total shareholders’ equity at March 31, 20222023 was $653.4$656.8 million.  Trust assets under management at March 31, 20222023 were $3.6$3.3 billion, including CTB’s investment portfolio totaling $1.5$1.2 billion.

Through our subsidiaries, CTBI engages in a wide range of commercial and personal banking and trust and wealth management activities, which include accepting time and demand deposits; making secured and unsecured loans to corporations, individuals, and others; providing cash management services to corporate and individual customers; issuing letters of credit; renting safe deposit boxes; and providing funds transfer services.  The lending activities of CTB include making commercial, construction, mortgage, and personal loans.  Lease-financing, linesLines of credit, revolving lines of credit, term loans, and other specialized loans, including asset-based financing, are also available.  Our corporate subsidiaries act as trustees of personal trusts, as executors of estates, as trustees for employee benefit trusts, as paying agents for bond and stock issues, as investment agent, as depositories for securities, and as providers of full servicefull-service brokerage and insurance services.  For further information, see Item 1 of our annual report on Form 10-K for the year ended December 31, 2021.2022.

4244

Results of Operations and Financial Condition

We reported earnings for the first quarter 20222023 of $19.7$19.3 million, or $1.11$1.08 per basic share, compared to $19.2$22.4 million, or $1.08$1.26 per basic share, earned during the fourth quarter 20212022 and $23.6$19.7 million, or $1.33$1.11 per basic share, earned during the first quarter 2021.  Noninterest income remained relatively flat2022.  Total revenue was $0.9 million below prior quarter but $2.6 million above prior year same quarter.  Net interest revenue decreased $0.8 million compared to prior quarter but decreased fromincreased $3.9 million compared to prior year same quarter; however, our total revenue declined from both periods, primarily as a result of a decline in interestquarter, and noninterest income on U.S. Small Business Administration (“SBA”) Paycheck Protection Program (“PPP”) loans.  Provisiondecreased $0.1 million compared to prior quarter and $1.3 million compared to prior year same quarter.  Our provision for loancredit losses for the quarter was $0.9$1.1 million compared to provision of $0.5$1.5 million for the quarter ended December 31, 20212022 and a recovery of provision of $2.5$0.9 million for the first quarter 2021.2022.  Noninterest expense increased $1.6 million compared to prior quarter and $2.5 million compared to prior year same quarter.  Net income was also impacted quarter over quarter by a $1.0 million increase in income taxes as a result of tax credits taken in the fourth quarter 2022.

As a result of the recent bank failures and turmoil in the banking sector, management has thoroughly reviewed our financial condition, liquidity position, and interest rate risk to ensure there are no issues which raise concern.  We are a conservative bank holding company which prudently manages our risk profile to ensure a safe and secure environment.  We are very well-capitalized, and our liquidity position is strong.  We have not seen a decline in deposit balances as a result of the recent turmoil in the banking industry, nor did we realize loan growth as a direct result of the turmoil.  Our deposit growth has remained strong.  We are focused on balance sheet strength and stability and intend to maintain our portfolio by remaining competitive in loan and deposit pricing.  We have no wholesale funding, and there has been no change in our wholesale debt.  We did experience loan growth during the quarter; however, none of this growth could be directly attributable to the current environment.  There have been no changes to our underwriting standards, yet we have seen a decrease in delinquencies.  We feel comfortable with the conservative nature of our investment portfolio, and we do not expect to make significant changes to the composition of our portfolio or the management of it.  The effective duration of our investment portfolio remains low at 4.05 years at March 31, 2023 compared to 4.11 years at December 31, 2022 and 4.16 years at March 31, 2022.  We also see no need to raise capital, as our liquidity position is strong, and we do not anticipate any stock repurchases or change in our cash dividend policy in 2023.  We have a community bank leverage ratio (“CBLR”) ratio as of March 31, 2023 of 13.71% compared to the required 9.00%.

The Bank Term Funding Program (“BTFP”) was created by the Federal Reserve to support American businesses and households by making additional funding available to eligible depository institutions to help assure banks have the ability to meet the needs of all their depositors.  We have registered and are eligible to use the newly created BTFP, but we do not intend to do so.

Quarterly Highlights

Net interest income for the quarter of $40.0$43.9 million was $0.8 million or 1.9%, below prior quarter and $0.2but $3.9 million or 0.5%, below firstabove prior year same quarter, 2021.as our net interest margin decreased 2 basis points from prior quarter but increased 31 basis points from prior year same quarter.

Provision for loancredit losses for the quarter was $0.9decreased $0.4 million compared to provision of $0.5from prior quarter but increased $0.2 million for the quarter ended December 31, 2021 and a recovery of provision of $2.5 million for the first quarter 2021.from prior year same quarter.

Our loan portfolio increased $106.7$68.1 million, an annualized 12.7%7.4%, during the quarter but decreased $23.3from December 31, 2022 and $261.8 million, or 0.7%7.4%, from March 31, 2021.  Loans, excluding PPP loans, increased $131.6 million during the quarter.2022.

NetWe had net loan charge-offs were $0.3 million,of $414 thousand, or 0.04% of average loans annualized for the first quarter 2023 compared to a net recovery of loan charge-offs for the fourth quarter 2022 of $9 thousand and net loan charge-offs of $322 thousand, or 0.04% of average loans annualized, for the quarter ended March 31, 2022 compared to a net recovery of loan charge-offs for the fourth quarter 2021 of $8 thousand and net loan charge-offs of $0.2 million, or 0.02% of average loans annualized, for the first quarter 2021.2022.

45

Asset quality remains strong from prior quarter as ourOur total nonperforming loans excluding troubled debt restructurings (“TDRs”), decreased to $12.2 million at March 31, 2023 from $15.3 million at December 31, 2022 and $13.7 million at March 31, 2022 from $16.6 million at December 31, 2021 and $21.0 million at March 31, 2021.2022.  Nonperforming assets at $16.0$15.0 million decreased $4.1$4.0 million from December 31, 20212022 and $11.3$1.0 million from March 31, 2021.2022.

Deposits, including repurchase agreements, at $4.8 billion increased $67.5$110.6 million, or an annualized 5.9%9.7%, during the quarterfrom December 31, 2022 and $94.9$69.3 million, or 2.1%1.5%, from March 31, 2021.2022.

Shareholders’ equity declined $44.8at $656.8 million increased $28.8 million, or 6.4%an annualized 18.6%, during the quarter due to a $58.1and $3.5 million, net after tax increase in unrealized losses on our securities portfolioor 0.5%, from March 31, 2022.

Noninterest income for the quarter ended March 31, 20222023 of $15.0$13.7 million remained relatively flat towas $0.1 million, or 0.6%, below prior quarter but decreased $0.6and $1.3 million, or 3.9%8.6%, frombelow prior year same quarter.

Noninterest expense for the quarter ended March 31, 20222023 of $29.4$31.9 million decreased $1.8was $1.6 million, or 5.7%5.4%, fromabove prior quarter but increased $1.0and $2.5 million, or 3.7%8.6%, fromabove prior year same quarter.

43

Income Statement Review

(dollars in thousands)       Change 2022 vs. 2021        Change 2023 vs. 2022 
Quarter Ended March 31 2022  2021  Amount  Percent 
Three Months Ended March 31 2023  2022  Amount  Percent 
Net interest income 
$
40,032
  
$
40,242
  
$
(210
)
 
(0.5
)%
 
$
43,916
  
$
40,032
  
$
3,884
   
9.7
%
Provision for credit losses 
875
  
(2,499
)
 
3,374
  
(139.0
)%
  
1,116
   
875
   
241
   
27.6
%
Noninterest income 
14,965
  
15,577
  
(612
)
 
(3.9
)%
  
13,682
   
14,965
   
(1,283
)
  
(8.6
)%
Noninterest expense 
29,359
  
28,310
  
1,049
  
3.7
%
  
31,890
   
29,359
   
2,531
   
8.6
%
Income taxes 
5,035
  
6,390
  
(1,355
)
 
(21.2
)%
  
5,279
   
5,035
   
244
   
4.8
%
Net income 
$
19,728
  
$
23,618
  
$
(3,890
)
 
(16.5
)%
 
$
19,313
  
$
19,728
  
$
(415
)
  
(2.1
)%
                            
Average earning assets 
$
5,134,150
  
$
4,957,636
  
$
176,514
  
3.6
%
 
$
5,131,385
  
$
5,134,150
  
$
(2,765
)
  
(0.1
)%
                            
Yield on average earnings assets, tax equivalent* 
3.46
%
 
3.63
%
 
(0.17
)%
 
(4.9
)%
  
4.84
%
  
3.46
%
  
1.38
%
  
40.1
%
Cost of interest bearing funds 
0.42
%
 
0.48
%
 
(0.06
)%
 
(12.3
)%
  
2.06
%
  
0.42
%
  
1.64
%
  
386.9
%
                            
Net interest margin, tax equivalent* 
3.18
%
 
3.31
%
 
(0.13
)%
 
(3.9
)%
  
3.49
%
  
3.18
%
  
0.31
%
  
9.9
%

*Yield on average earning assets and net interest margin are computed on a taxable equivalent basis using a 24.95% tax rate.

4446

Net Interest Income

           
Percent Change
1Q 2022 Compared to:
 
(dollars in thousands)
Quarterly Periods
  
Q1
2022
   
Q4
2021
   
Q1
2021
   
Q4
2021
   
Q1
2021
 
Components of net interest income                    
Income on earning assets, tax equivalent:                    
Financial assets $5,595  $5,430  $3,883   3.0%  44.1%
Loans and leases:                    
Commercial  20,698   21,613   22,634   (4.2)%  (8.6)%
Residential  8,175   8,073   8,287   1.3%  (1.4)%
Consumer  9,294   9,465   9,624   (1.8)%  (3.4)%
Total loans and leases  38,167   39,151   40,545   (2.5)%  (5.9)%
Interest income, tax equivalent  43,762   44,581   44,428   (1.8)%  (1.5)%
                     
Expense on interest bearing liabilities:                    
Deposits, including repurchase agreements  3,208   3,276   3,691   (2.1)%  (13.1)%
Other financial liabilities  287   265   278   8.3%  3.1%
Interest expense  3,495   3,541   3,969   (1.3)%  (11.9)%
                     
Net interest income, tax equivalent $40,267  $41,040  $40,459   (1.9)%  (0.5)%
                     
Average yield and rates paid                    
Earnings assets yield  3.46%  3.45%  3.63%  0.3%  (4.9)%
Rate paid on interest bearing liabilities  0.42%  0.42%  0.48%  0.5%  (12.3)%
Gross interest margin  3.04%  3.03%  3.15%  0.3%  (3.7)%
Net interest margin  3.18%  3.17%  3.31%  0.3%  (3.9)%
                     
Average balances                    
Investment securities $1,486,799  $1,498,781  $1,063,773   (0.8)%  39.8%
Loans $3,440,439  $3,381,206  $3,548,358   1.8%  (3.0)%
Earning assets $5,134,150  $5,133,843  $4,957,636   0.0%  3.6%
Interest-bearing liabilities $3,350,208  $3,337,053  $3,335,206   0.4%  0.4%
Consolidated Average Balance Sheets and Taxable Equivalent Income/Expense and Yields/Rates

For the Quarter Ended March 31, 2023  December 31, 2022 
(in thousands) 
Average
Balances
  Interest  
Average
Rate
  
Average
Balances
  Interest  
Average
Rate
 
Earning assets:                  
                   
Loans (1)(2)(3) 
$
3,739,443
  
$
52,011
   
5.64
%
 
$
3,662,221
  
$
49,002
   
5.31
%
Loans held for sale  
221
   
8
   
14.68
   
266
   
11
   
16.41
 
Securities:                        
U.S. Treasury and agencies  
900,146
   
4,410
   
1.99
   
935,433
   
4,322
   
1.83
 
Tax exempt state and political subdivisions (3)  
108,819
   
909
   
3.39
   
109,434
   
929
   
3.37
 
Other securities  
245,151
   
2,348
   
3.88
   
241,575
   
2,215
   
3.64
 
Federal Reserve Bank and Federal Home Loan Bank stock  
10,373
   
174
   
6.80
   
11,563
   
181
   
6.21
 
Federal funds sold  
344
   
3
   
3.54
   
1,151
   
13
   
4.48
 
Interest bearing deposits  
124,787
   
1,400
   
4.55
   
115,434
   
1,010
   
3.47
 
Other investments  
245
   
0
   
0.00
   
245
   
0
   
0.00
 
Investment in unconsolidated subsidiaries  
1,856
   
30
   
6.56
   
1,854
   
24
   
5.14
 
Total earning assets 
$
5,131,385
  
$
61,293
   
4.84
%
 
$
5,079,176
  
$
57,707
   
4.51
%
Allowance for credit losses  
(46,252
)
          
(44,881
)
        
   
5,085,133
           
5,034,295
         
Nonearning assets:                        
Cash and due from banks  
61,911
           
62,042
         
Premises and equipment and right of use assets, net  
59,949
           
56,819
         
Other assets  
251,074
           
259,596
         
Total assets 
$
5,458,067
          
$
5,412,752
         
                         
Interest bearing liabilities:                        
Deposits:                        
Savings and demand deposits 
$
2,145,808
  
$
10,666
   
2.02
%
 
$
2,104,368
  
$
8,411
   
1.59
%
Time deposits  
935,393
   
3,724
   
1.61
   
936,182
   
2,208
   
0.94
 
Repurchase agreements and federal funds purchased  
208,987
   
1,616
   
3.14
   
219,156
   
1,284
   
2.32
 
Advances from Federal Home Loan Bank  
4,240
   
43
   
4.11
   
2,259
   
19
   
3.34
 
Long-term debt  
64,434
   
990
   
6.23
   
57,841
   
761
   
5.22
 
Finance lease liability  
3,469
   
40
   
4.68
   
2,108
   
31
   
5.83
 
Total interest bearing liabilities 
$
3,362,331
  
$
17,079
   
2.06
%
 
$
3,321,914
  
$
12,714
   
1.52
%
                         
Noninterest bearing liabilities:                        
Demand deposits  
1,398,415
           
1,422,808
         
Other liabilities  
46,313
           
50,692
         
Total liabilities  
4,807,059
           
4,795,414
         
                         
Shareholders’ equity  
651,008
           
617,338
         
Total liabilities and shareholders’ equity 
$
5,458,067
          
$
5,412,752
         
                         
Net interest income, tax equivalent     
$
44,214
          
$
44,993
     
Less tax equivalent interest income      
298
           
248
     
Net interest income     
$
43,916
          
$
44,745
     
Net interest spread          
2.78
%
          
2.99
%
Benefit of interest free funding          
0.71
           
0.52
 
Net interest margin          
3.49
%
          
3.51
%

(1) Interest includes fees on loans of $0.5 million and $0.4 million in March 31, 2023 and December 31, 2022, respectively.
(2) Loan balances include deferred loan origination costs and principal balances on nonaccrual loans.
(3) Tax exempt income on securities and loans is reported on a fully taxable equivalent basis using a 24.95% rate.

47

The following table illustrates the approximate effect of volume and rate changes on net interest differentials between the three months ended March 31, 2023 and December 31, 2022.

Net Interest Differential 
       
  Total Change  Change Due to 
(in thousands)  Q1 2023/Q4 2022  Volume  Rate 
Interest income:          
Loans 
$
3,009
  
$
16,887
  
$
(13,878
)
Loans held for sale  
(3
)
  
(32
)
  
29
 
U.S. Treasury and agencies  
88
   
(2,555
)
  
2,643
 
Tax exempt state and political subdivisions  
(20
)
  
(84
)
  
64
 
Other securities  
133
   
534
   
(401
)
Federal Reserve Bank and Federal Home Loan Bank stock  
(7
)
  
(285
)
  
278
 
Federal funds sold  
(10
)
  
(170
)
  
160
 
Interest bearing deposits  
390
   
1,401
   
(1,011
)
Other investments  
0
   
0
   
0
 
Investment in unconsolidated subsidiaries  
6
   
0
   
6
 
Total interest income  
3,586
   
15,696
   
(12,110
)
             
Interest expense:            
Savings and demand deposits  
2,255
   
2,714
   
(459
)
Time deposits  
1,516
   
(30
)
  
1,546
 
Repurchase agreements and federal funds purchased  
332
   
(919
)
  
1,251
 
Advances from Federal Home Loan Bank  
24
   
317
   
(293
)
Long-term debt  
229
   
1,496
   
(1,267
)
Finance lease liability  
9
   
273
   
(264
)
Total interest expense  
4,365
   
3,851
   
514
 
             
Net interest income 
$
(779
)
 
$
11,845
  
$
(12,624
)

For purposes of the above table, changes which are due to both rate and volume are allocated based on a percentage basis using the absolute values of rate and volume variance as a basis for percentages.  Income is stated at a fully taxable equivalent basis, using a 24.95% tax rate.

Net interest income for the quarter ended March 31, 2022 of $40.0$43.9 million was $0.8 million or 1.9%, below prior quarter and $0.2but $3.9 million or 0.5%, below first quarter 2021.  Our net interest income excluding PPP loans for the quarter ended March 31, 2022 was $38.6 million compared to $38.3 million for the quarter ended December 31, 2021 and $36.3 million for the quarter ended March 31, 2021.above prior year same quarter.  Our net interest margin, on a fully tax equivalent basis, at 3.18% increased 13.49% decreased 2 basis pointpoints from prior quarter but decreased 13increased 31 basis points from prior year same quarter, as ourquarter.  Our average earning assets increased $0.3$52.2 million from prior quarter and $176.5but decreased $2.8 million from prior year same quarter.  Our yield on average earning assets increased 133 basis pointpoints from prior quarter but decreased 17and 138 basis points from prior year same quarter, and our cost of funds remained unchangedincreased 54 basis points from prior quarter but decreased 6and 164 basis points from prior year same quarter.  As discussed more fully below, the impact of the PPP loans to the net interest margin for the first quarter 2022 was 11 basis points.

The PPP loan portfolio had an annualized yield for the quarter of 17.03% compared to 13.61% for the fourth quarter 2021.  Interest income on the portfolio was $86 thousand during the quarter, down $98 thousand from prior quarter, while the amortization of net loan origination fees from current outstanding loans and recognition of net fee income from paid and forgiven loans was $1.4 million, down $0.9 million from prior quarter.  These fees are amortized over the life of the loan with any unamortized balance fully recognized at the time of loan forgiveness.  The impact of the PPP loan portfolio to the net interest margin was an increase of 11 basis points for the first quarter 2022 compared to an increase of 15 basis points for the fourth quarter 2021.

4548

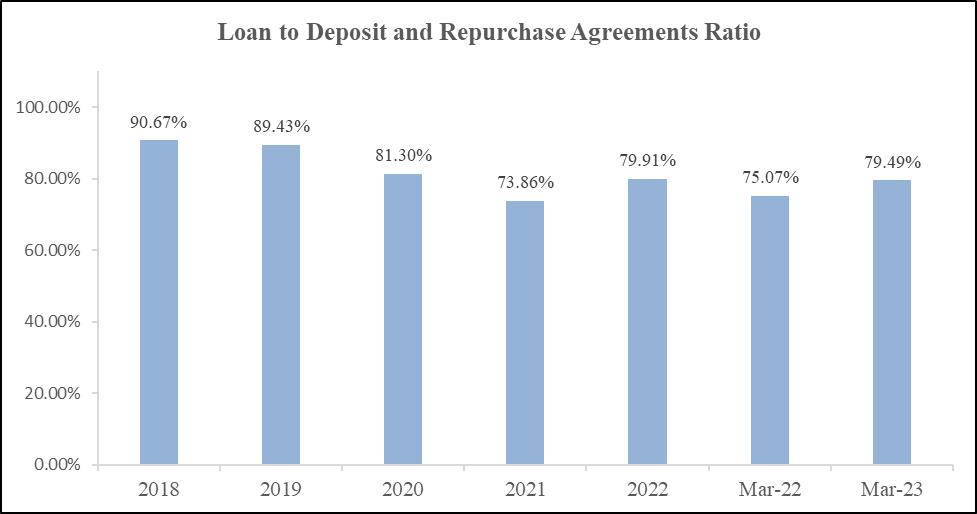
Our ratio of average loans to deposits, including repurchase agreements, was 79.8% for the quarter ended March 31, 2023 compared to 78.2% for the quarter ended December 31, 2022 and 74.2% for the quarter ended March 31, 2022 compared to 73.3% for the quarter ended December 31, 2021 and 79.9% for the quarter ended March 31, 2021.

Provision for Credit Losses

Provision Provision for loancredit losses for the quarter ended March 31, 2023 was $0.9$1.1 million, compared to provision of $0.5$1.5 million for the quarter ended December 31, 20212022 and a recovery of provision of $2.5$0.9 million for the first quarter 2021.2022See below for a discussion of our allowance for credit losses.

Noninterest Income

        
Percent Change
1Q 2022 Compared to:
        Percent Change 
(dollars in thousands)
Quarterly Periods
 
1Q
2022
 
4Q
2021
 
1Q
2021
  
4Q
2021
  
1Q
2021
 
Deposit service charges $6,746 $7,083 $6,022  (4.8)% 12.0%
       1Q 2023 Compared to: 
($ in thousands) 
1Q
2023
 
4Q
2022
 
1Q
2022
 
4Q
2022
 
1Q
2022
 
Deposit related fees $7,287 $7,411 $6,746 (1.7%) 8.0%
Trust revenue 3,248 3,305 2,951  (1.7)% 10.1% 3,079 2,959 3,248 4.0% (5.2%)
Gains on sales of loans 597 1,241 2,433  (51.9)% (75.5)% 121 174 597 (30.3%) (79.7%)
Loan related fees 2,062 1,254 2,270  64.4% (9.2)% 845 1,119 2,062 (24.5%) (59.0%)
Bank owned life insurance revenue 691 1,036 573  (33.3)% 20.5% 858 572 691 50.0% 24.2%
Brokerage revenue 590 432 457  36.5% 29.3% 348 344 590 1.1% (41.0%)
Other  1,031  626  871   64.8%  18.4%  1,144  1,192  1,031  (4.1%)  11.0%
Total noninterest income $14,965 $14,977 $15,577  (0.1)% (3.9)% $13,682 $13,771 $14,965 (0.6%) (8.6%)

Noninterest income for the quarter ended March 31, 20222023 of $15.0$13.7 million was relatively flat to$0.1 million, or 0.6%, below prior quarter but a decrease of $0.6and $1.3 million, or 3.9%8.6%, frombelow prior year same quarter.  Decreases from prior quarter in gains on salesThe year over year decrease was primarily the result of loans ($0.6 million) and deposit related fees ($0.3 million) were offset by increasesa $1.2 million decrease in loan related fees ($0.8 million) and securities gains ($0.3 million).  The decrease from prior year same quarter included decreases in gains on sales of loans ($1.8 million) and loan related fees ($0.2 million), partially offset by increases in deposit related fees ($0.7 million), trust revenue ($0.3 million), and securities gains ($0.2 million).  Gains on sales of loans were impacted by the slowdown in the industry-wide mortgage refinancing boom.  Deposit related fees were primarily impacted by debit card income.  Loan related fees were primarily impacted bydue to the change in the fair market value of MSRs.our mortgage servicing rights. The primary driver in determining the fair value is the change in interest rates, which resulted in a $1.0 million increase in the first quarter of 2022 and a $0.2 million decrease in the first quarter of 2023.

Noninterest Expense

        
Percent Change
1Q 2022 Compared to:
        Percent Change 
(dollars in thousands)
Quarterly Periods
 
1Q
2022
 
4Q
2021
 
1Q
2021
  
4Q
2021
  
1Q
2021
 
       1Q 2023 Compared to: 
($ in thousands) 
1Q
2023
 
4Q
2022
 
1Q
2022
 
4Q
2022
 
1Q
2022
 
Salaries $11,739 $11,982 $11,412  (2.0)% 2.9% $12,633 $12,439 $11,739 1.6% 7.6%
Employee benefits 5,799 7,486 5,421  (22.5)% 7.0% 6,275 5,433 5,799 15.5% 8.2%
Net occupancy and equipment 2,854 2,625 2,828  8.7% 0.9% 3,028 2,576 2,854 17.6% 6.1%
Data processing 2,201 2,099 2,159  4.8% 1.9% 2,303 2,344 2,201 (1.7%) 4.7%
Legal and professional fees 867 868 893  (0.1)% (2.8)% 816 931 867 (12.4%) (5.9%)
Advertising and marketing 752 676 722  11.2% 4.1% 820 826 752 (0.7%) 9.0%
Taxes other than property and payroll 426 542 370  (21.3)% 15.2% 432 296 426 45.8% 1.3%
Net other real estate owned expense 353 299 318  17.8% 11.0% 119 18 353 554.7% (66.6%)
Other  4,368  4,572  4,187   (4.4)%  4.3%  5,464  5,396  4,368  1.3%  25.1%
Total noninterest expense $29,359 $31,149 $28,310  (5.7)% 3.7% $31,890 $30,259 $29,359 5.4% 8.6%

46N

Noninterestoninterest expense for the quarter ended March 31, 20222023 of $29.4$31.9 million decreased $1.8was $1.6 million, or 5.7%5.4%, fromhigher than prior quarter but increased $1.0and $2.5 million, or 3.7%8.6%, fromabove prior year same quarter.  The decreaseincrease in noninterest expense quarter over quarter was primarily the result of a decrease$1.3 million decline in personnel expense ($1.9 million), which was primarily due topost retirement benefits (included in employee benefits) during the fourth quarter 2022 and a lower accrual for bonuses$0.5 million increase in occupancy and incentives.equipment during the first quarter 2023.  The year over year increase from prior year same quarter was primarily the result of anincluded a $1.4 million increase in personnel expense year over year ($0.7 million) and loan related expenses ($0.2 million).  Thisa $0.3 million increase in personnel expense included increases in salaries, group medical and lifeFDIC insurance expense, and other employee benefits.premiums.

49

Balance Sheet Review

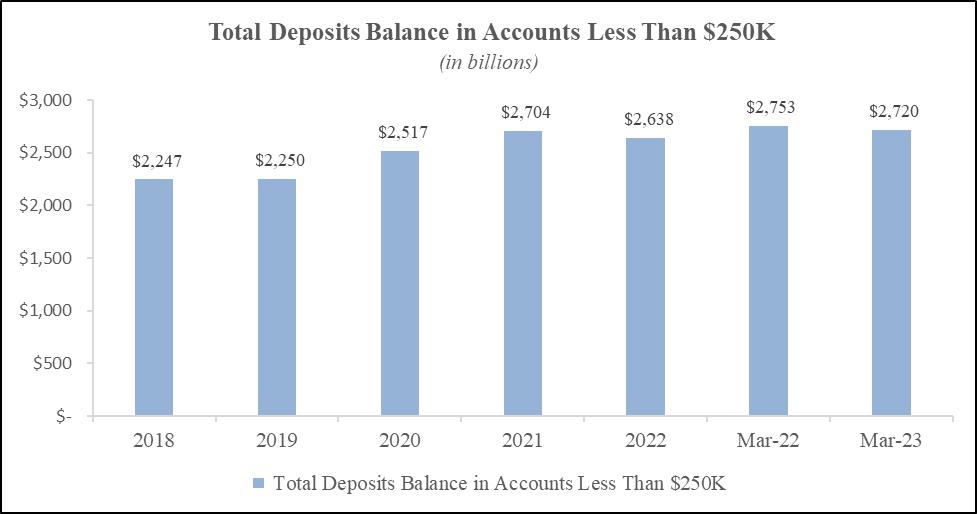
CTBI’s total assets at March 31, 20222023 of $5.4$5.5 billion increased $24.9$149.0 million, or 1.9%11.2% annualized, from December 31, 20212022 and $83.0$86.2 million, or 1.5%1.6%, from March 31, 2021.2022.  Loans outstanding at March 31, 20222023 were $3.5$3.8 billion, an increase of $106.7$68.1 million, an annualized 12.7%7.4%, from December 31, 2021 but a decrease of $23.32022 and $261.8 million, or 0.7%7.4%, from March 31, 2021.  Loans, excluding PPP2022.  The increase in loans increased $131.6 million during thefrom prior quarter with a $71.3included an $8.2 million increase in the commercial loan portfolio, a $46.5$25.0 million increase in the residential loan portfolio, and a $35.2 million increase in the indirect consumer loan portfolio, andoffset partially by a $13.8$0.3 million increasedecrease in the residentialconsumer direct loan portfolio.  The PPP loan portfolio declined $24.9 million during the quarter as a result of SBA forgiveness.  CTBI’s investment portfolio increased $47.8decreased $14.9 million, or an annualized 13.3%4.8%, from December 31, 20212022 and $348.1$262.1 million, or 30.1%17.4%, from March 31, 2021.2022.  Deposits in other banks decreased $159.1increased $97.7 million from prior quarter and $250.3$69.0 million from prior year same quarter.  Deposits in other banks were used during the quarter to fund loan growth and additional investments in available-for-sale securities.March 31, 2022.  Deposits, including repurchase agreements, at $4.7$4.8 billion increased $67.5$110.6 million, or an annualized 5.9%2.4%, from December 31, 20212022 and $94.9$69.3 million, or 2.1%1.5%, from March 31, 2021.2022.  Our uninsured deposits, as defined by the Federal Financial Institutions Examination Council, were 27.6% at March 31, 2023 compared to 27.5% at December 31, 2022 and 25.3% at March 31, 2022.

Shareholders’ equity at March 31, 20222023 was $653.4$656.8 million, a $44.8$28.8 million, or 6.4%, decreaseincrease from the $698.2$628.0 million at December 31, 20212022 and an $8.7a $3.5 million, or 1.3%0.5%, decreaseincrease from the $662.1$653.4 million at March 31, 2021.  The decline in shareholders’ equity is due to a $58.1 million net after tax increase during the quarter in2022, as unrealized losses on our securities portfolio.portfolio have begun to decrease.  CTBI’s annualized dividend yield to shareholders as of March 31, 20222023 was 3.88%4.64%.

47

Loans

(dollars in thousands) March 31, 2022  March 31, 2023 
Loan Category Balance  
Variance
from Prior
Year
  Net (Charge-Offs)/ Recoveries  Nonperforming  ACL  Balance  Variance from Prior Year  Net (Charge-Offs)/ Recoveries  Nonperforming  ACL 
Commercial:
                              
Hotel/motel
 
$
274,256
  
6.7
%
 
$
(216
)
 
$
0
  
$
4,711
  
$
348,876
  
1.5
%
 
$
0
  
$
0
  
$
5,287
 
Commercial real estate residential
 
337,447
  
0.7
  
(26
)
 
418
  
4,070
  
385,328
  
3.3
  
77
  
407
  
5,157
 
Commercial real estate nonresidential
 
774,791
  
2.2
  
111
  
4,275
  
9,169
  
750,498
  
(1.6
)
 
144
  
1,844
  
9,010
 
Dealer floorplans
 
72,766
  
4.8
  
0
  
0
  
1,519
  
75,443
  
(2.7
)
 
0
  
0
  
1,694
 
Commercial other
 
322,109
  
10.9
  
(56
)
 
321
  
4,844
   
316,955
   
1.7
   
(87
)
  
1,535
   
4,782
 
Commercial unsecured SBA PPP
 
22,482
  
(52.5
)
 
0
  
8
  
0
 
Total commercial
 
1,803,851
  
2.6
  
(187
)
 
5,022
  
24,313
  
1,877,100
  
0.4
  
134
  
3,786
  
25,930
 
                              
Residential:
                              
Real estate mortgage
 
780,453
  
1.7
  
(72
)
 
7,494
  
7,662
  
846,435
  
2.6
  
(36
)
 
7,532
  
7,917
 
Home equity
  
107,230
   
0.5
   
(14
)
  
972
   
819
  
124,096
  
3.0
  
2
  
733
  
1,044
 
Total residential
 
887,683
  
1.6
  
(86
)
 
8,466
  
8,481
  
970,531
  
2.6
  
(34
)
 
8,265
  
8,961
 
                              
Consumer:
                              
Consumer direct
 
156,620
  
(0.0
)
 
16
  
23
  
1,787
  
157,158
  
(0.2
)
 
(53
)
 
28
  
1,746
 
Consumer indirect
 
667,387
  
7.5
  
(65
)
 
179
  
7,728
   
772,570
   
4.8
   
(461
)
  
132
   
10,046
 
Total consumer
  
824,007
   
6.0
   
(49
)
  
202
   
9,515
  
929,728
  
3.9
  
(514
)
 
160
  
11,792
 
                              
Total loans
 
$
3,515,541
  
3.1
%
 
$
(322
)
 
$
13,690
  
$
42,309
  
$
3,777,359
  
1.8
%
 
$
(414
)
 
$
12,211
  
$
46,683
 

50

Total Deposits and Repurchase Agreements

        
Percent Change
1Q 2022 Compared to:
         
Percent Change
1Q 2023 Compared to:
 
(dollars in thousands) 
1Q
2022
 
4Q
2021
 
1Q
2021
  
4Q
2021
  
1Q
2021
  
1Q
2023
 
4Q
2022
 
1Q
2022
  
4Q
2022
  
1Q
2022
 
Non-interest bearing deposits $1,398,529 $1,331,103 $1,283,309  5.1% 9.0% 
$
1,409,839
 
$
1,394,915
 
$
1,398,529
  
1.1
%
 
0.8
%
Interest bearing deposits                          
Interest checking 89,863 97,064 91,803  (7.4)% (2.1)% 
120,678
 
112,265
 
89,863
  
7.5
%
 
34.3
%
Money market savings 1,200,408 1,206,401 1,240,530  (0.5)% (3.2)% 
1,408,314
 
1,348,809
 
1,200,408
  
4.4
%
 
17.3
%
Savings accounts 666,874 632,645 574,181  5.4% 16.1% 
642,232
 
654,380
 
666,874
  
(1.9
%)
 
(3.7
%)
Time deposits 1,072,630 1,077,079 1,043,949  (0.4)% 2.7% 
962,361
 
915,774
 
1,072,630
  
5.1
%
 
(10.3
%)
Repurchase agreements  254,623  271,088  354,235   (6.1)%  (28.1)%  
208,777
  
215,431
  
254,623
   
(3.1
%)
  
(18.0
%)
Total interest bearing deposits and repurchase agreements 3,284,398 3,284,277 3,304,698  0.0% (0.6)% 
3,342,362
 
3,246,659
 
3,284,398
  
2.9
%
 
1.8
%
Total deposits and repurchase agreements $4,682,927 $4,615,380 $4,588,007  1.5% 2.1% 
$
4,752,201
 
$
4,641,574
 
$
4,682,927
  
2.4
%
 
1.5
%

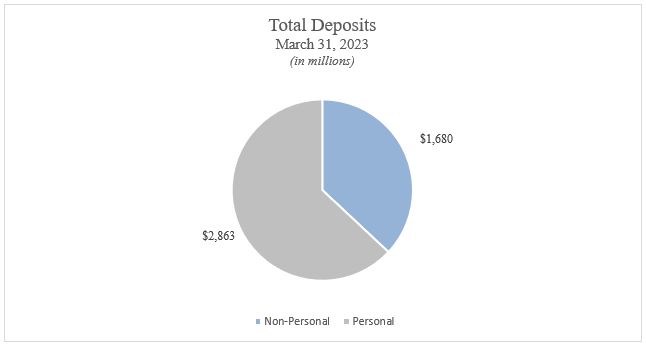
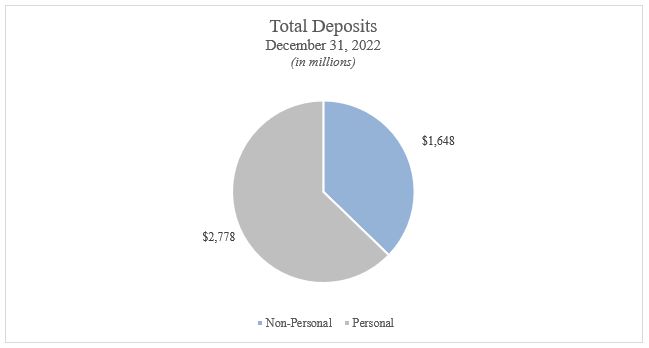
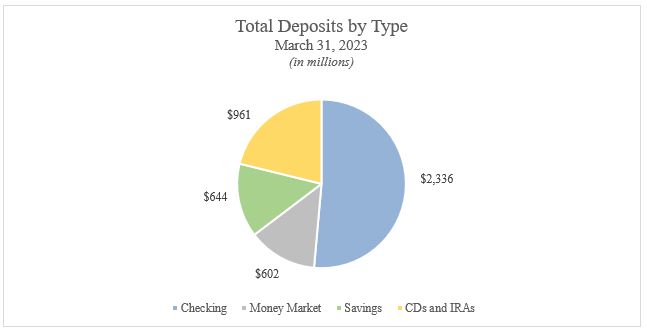
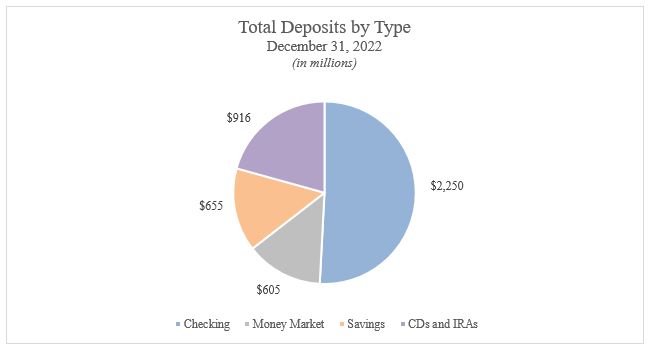
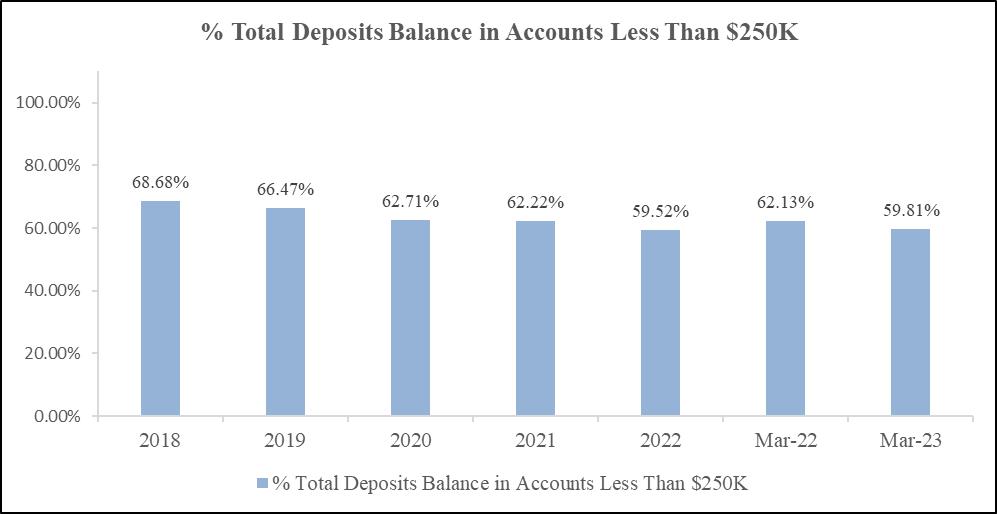
The charts below show a comparison of our deposit composition as of March 31, 2023 compared to December 31, 2022.

Total Number of Deposit Accounts      
  March 31, 2023  December 31, 2022 
Nonpersonal  
20,535
   
20,430
 
Personal  
186,758
   
186,448
 
Total  
207,293
   
206,878
 

graphic

51

graphic

Total Number of Deposit Accounts by Type      
       
  March 31, 2023  December 31, 2022 
Checking  
135,895
   
136,025
 
Money market  
2,441
   
2,501
 
Savings  
46,716
   
46,698
 
CDs & IRAs  
22,144
   
21,565
 
NOW accounts  
97
   
89
 
Total  
207,293
   
206,878
 

48graphic

52

graphic

graphic

53

graphic

graphic

Asset Quality

CTBI’sOur total nonperforming loans excluding TDRs, decreased to $12.2 million at March 31, 2023 from $15.3 million at December 31, 2022 and $13.7 million at March 31, 2022 from $16.6 million at December 31, 2021 and $21.0 million at March 31, 2021.2022.  Prior period nonperforming loans, as previously reported, exclude troubled debt restructurings which have been eliminated in the current period due to implementation of Accounting Standard Update 2022-02.  Accruing loans 90+ days past due at $4.9$6.2 million decreased $1.1$2.3 million from prior quarter but increased $1.4 million from March 31, 2022.  Nonaccrual loans at $6.0 million decreased $0.8 million from prior quarter and $4.0$2.8 million from March 31, 2021.  Nonaccrual loans at $8.8 million decreased $1.8 million during the quarter and $3.4 million from March 31, 2021.2022.  Accruing loans 30-89 days past due at $10.8$11.7 million remained relatively stabledecreased $3.6 million from prior quarter but decreased $2.4increased $0.9 million from March 31, 2021.2022.  Our loan portfolio management processes focus on the immediate identification, management, and resolution of problem loans to maximize recovery and minimize loss.  Our loan portfolio risk management processes include weekly delinquent loan review meetings at the market levels and monthly delinquent loan review meetings involving senior corporate management to review all nonaccrual loans and loans 30 days or more past due.  Any activity regarding a criticized/classified loan (i.e. problem loan) must be approved by CTB’s Watch List Asset Committee (i.e. Problem Loan Committee).  CTB’s Watch List Asset Committee also meets on a quarterly basis and reviews every criticized/classified loan of $100,000 or greater.  CTB’s Loan Portfolio Risk Management Committee also meets quarterly focusing on the overall asset quality and risk metrics of the loan portfolio.  We also have a Loan Review Department that reviews every market within CTB annually and performs extensive testing of the loan portfolio to assure the accuracy of loan grades and classifications for delinquency, TDR,if a borrower is experiencing financial difficulty with significant payment delay, nonaccrual status, and adequate loan loss reserves.  The Loan Review Department has annually reviewed, on average, 96% of the outstanding commercial loan portfolio for the past three years.  The average annual review percentage of the consumer and residential loan portfolio for the past three years was 86% based on the loan production during the number of months included in the review scope.  The review scope is generally four to six months of production.  CTBI generally does not offer high risk loans such as option ARM products, high loan to value ratio mortgages, interest-only loans, loans with initial teaser rates, or loans with negative amortizations, and therefore, CTBI would have no significant exposure to these products.

54

For further information regarding nonperforming loans, see noteNote 4 to the condensed consolidated financial statements contained herein.

Our reserve coverage (allowance for credit losses to nonperforming loans) at March 31, 2022 was 309.1% compared to 251.2% at December 31, 2021 and 215.5% at March 31, 2021.  Our credit loss reserve as a percentage of total loans outstanding at March 31, 2022 was 1.20% (1.21% excluding PPP loans) compared to 1.22% at December 31, 2021 (1.24% excluding PPP loans) and 1.28% at March 31, 2021 (1.38% excluding PPP loans).

Our level of foreclosed properties at $2.8 million at March 31, 2023 was a $0.9 million decrease from the $3.7 million at December 31, 2022 but a $0.5 million increase from the $2.3 million at March 31, 2022 was a $1.2 million decrease from the $3.5 million at December 31, 2021 and a $3.9 million decrease from the $6.2 million at March 31, 2021.2022.  Sales of foreclosed properties for the quarter ended March 31, 20222023 totaled $1.1$0.9 million while new foreclosed properties totaled $0.1 million.  At March 31, 2022,2023, the book value of properties under contracts to sell was $0.3$0.6 million; however, the closings had not occurred at quarter-end.

When foreclosed properties are acquired, appraisals are obtained and the properties are booked at the current market value less expected sales costs.  Additionally, periodic updated appraisals are obtained on unsold foreclosed properties.  When an updated appraisal reflects a fair market value below the current book value, a charge is booked to current earnings to reduce the property to its new market value less expected sales costs.  Charges to earnings inWe had net loan charge-offs of $414 thousand, or 0.04% of average loans annualized for the first quarter 2022 to reflect the decrease in current market values of foreclosed properties totaled $0.2 million,2023 compared to $0.2 million during eacha net recovery of the quarters ended December 31, 2021 and March 31, 2021.  Our policy for determining the frequency of periodic reviews is based upon consideration of the specific properties and the known or perceived market fluctuations in a particular market and is typically between 12 and 18 months but generally not more than 24 months.  Approximately 97% of our other real estate owned (“OREO”) properties and approximately 94% of the book value of our OREO properties have appraisals dated within the past 18 months.

49

The appraisal aging analysis of foreclosed properties, as well as the holding period, at March 31, 2022 is shown below:

(dollars in thousands)   
Appraisal Aging Analysis Holding Period Analysis 
Days Since Last
Appraisal
 Number of Properties  Current Book Value Holding Period Current Book Value 
Up to 3 months  
20
  
$
1,379
 Less than one year 
$
499
 
3 to 6 months  
4
   
140
 1 year  
513
 
6 to 9 months  
5
   
137
 2 years  
231
 
9 to 12 months  
2
   
35
 3 years  
113
 
12 to 18 months  
3
   
478
 4 years  
85
 
18 to 24 months  
1
   
130
 5 years  
0
 
Total  
35
  
$
2,299
 6 years  
234
 
         7 years  
597
 
         8 years  
0
 
         9 years  
27
 
         Total 
$
2,299
 

          Regulatory approval is required and has been obtained to hold foreclosed properties beyond the initial period of five years.  Additionally, CTBI is required to dispose of any foreclosed property that has not been sold within ten years.  As of March 31, 2022, one foreclosed property with a total book value of $27 thousand had been held by us for at least nine years.

Net loan charge-offs were $0.3 million,for the fourth quarter 2022 of $9 thousand and net loan charge-offs of $322 thousand, or 0.04% of average loans annualized, for the quarter ended March 31, 2022 compared to a net recovery of loan charge-offs for the fourth quarter 2021 of $8 thousand and net loan charge-offs of $0.2 million, or 0.02% of average loans annualized, for the first quarter 2021.2022.

Dividends

The following schedule shows the quarterly cash dividends paid for the past six quarters:

Pay DateRecord Date Amount Per Share 
April 1, 2022March 15, 2022 
$
0.400
 
January 1, 2022December 15, 2021 
$
0.400
 
October 1, 2021September 15, 2021 
$
0.400
 
July 1, 2021June 15, 2021 
$
0.385
 
April 1, 2021March 15, 2021 
$
0.385
 
January 1, 2021December 15, 2020 
$
0.385
 
Pay DateRecord Date Amount Per Share 
April 1, 2023March 15, 2023 
$
0.440
 
January 1, 2023December 15, 2022 
$
0.440
 
October 1, 2022September 15, 2022 
$
0.440
 
July 1, 2022June 15, 2022 
$
0.400
 
April 1, 2022March 15, 2022 
$
0.400
 
January 1, 2022December 15, 2021 
$
0.400
 

Allowance for Credit Losses

Our reserve coverage (allowance for credit losses to nonperforming loans) at March 31, 2023 was 382.3% compared to 300.4% at December 31, 2022 and 309.1% at March 31, 2022.  Our credit loss reserve as a percentage of total loans outstanding at March 31, 2023 remained at 1.24% from December 31, 2022 compared to 1.20% at and March 31, 2022.

55

Liquidity and Market Risk

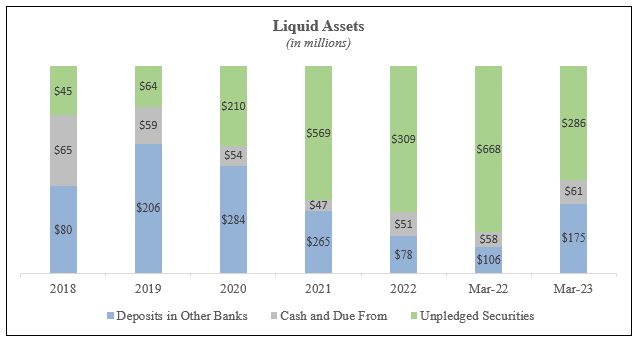
The objective of CTBI’s Asset/Liability management function is to maintain consistent growth in net interest income within our policy limits.  This objective is accomplished through management of our consolidated balance sheet composition, liquidity, and interest rate risk exposures arising from changing economic conditions, interest rates, and customer preferences.  The goal of liquidity management is to provide adequate funds to meet changes in loan and lease demand or deposit withdrawals.  This is accomplished by maintaining liquid assets in the form of cash and cash equivalents and investment securities, sufficient unused borrowing capacity, and growth in core deposits. As of March 31, 2022,2023, we had approximately $164.5$235.9 million in cash and cash equivalents and approximately $1.5 billion$286.4 million in unpledged securities valued at estimated fair value designated as available-for-sale and available to meet liquidity needs on a continuing basis compared to $311.8$128.7 million and $1.5 billion$309.2 million at December 31, 2021.2022.  The unpledged securities at March 31, 2023, with an estimated fair value of $286.4 million, have a par value of $317.5 million.  The par amount of these securities would be available to be used as collateral in the new Bank Term Funding Program described in the Results of Operations and Financial Condition above.  Additional asset-driven liquidity is provided by the remainder of the securities portfolio and the repayment of loans.  In addition to core deposit funding, we also have a variety of other short-term and long-term funding sources available.  We also rely on Federal Home Loan Bank advances for both liquidity and management of our asset/liability position.  Federal Home Loan Bank advances were $0.4 million at March 31, 20222023 and at December 31, 2021.2022.  As of March 31, 2022,2023, we had a $490.5$517.6 million available borrowing position with the Federal Home Loan Bank, compared to $484.4$501.0 million at December 31, 2021.2022.  We generally rely upon net inflows of cash from financing activities, supplemented by net inflows of cash from operating activities, to provide cash for our investing activities.  As is typical of many financial institutions, significant financing activities include deposit gathering, use of short-term borrowing facilities such as repurchase agreements and federal funds purchased, and issuance of long-term debt.  At March 31, 2022 and at December 31, 2021,2023 we had $75$50 million in lines of credit with various correspondent banks available to meet any future cash needs.needs compared to $75 million at December 31, 2022.  Our primary investing activities include purchases of securities and loan originations.  We do not rely on any one source of liquidity and manage availability in response to changing consolidated balance sheet needs.  Included in our cash and cash equivalents at March 31, 20222023 were deposits with the Federal Reserve of $103.3$173.2 million, compared to $262.4$72.6 million at December 31, 2021.2022.  Additionally, we project cash flows from our investment portfolio to generate additional liquidity over the next 90 days.

50

The investment portfolio consists of investment grade short-term issues suitable for bank investments.  The majority of the investment portfolio is in U.S. government and government sponsored agency issuances.  At March 31, 2022,2023, available-for-sale (“AFS”) securities comprised all of the total investment portfolio, and the AFS portfolio was approximately 230%189% of equity capital.  Fifty-nineSeventy-seven percent of the pledge-eligible portfolio was pledged.

The charts below show our liquid assets and our liquidity position.

graphic

56

Liquidity         
At March 31, 2023
(in thousands)
 Total Available  Amount Used  Net Availability 
Internal sources         
Balance at Federal Reserve 
$
173,238
  
$
0
  
$
173,238
 
Cash and due from banks  
60,762
       
60,762
 
Unpledged AFS securities  
286,398
   
0
   
286,398
 
Lines of credit            
Fifth Third Bank  
25,000
   
0
   
25,000
 
PNC Bank  
25,000
   
0
   
25,000
 
Federal Home Loan Bank (repurchase advance line)  
100,000
   
0
   
100,000
 
Federal Home Loan Bank (cash management advance)  
100,000
   
0
   
100,000
 
Total liquidity 
$
770,398
  
$
0
  
$
770,398
 

Interest Rate Risk

We consider interest rate risk one of our most significant market risks.  Interest rate risk is the exposure to adverse changes in net interest income due to changes in interest rates.  Consistency of our net interest revenue is largely dependent upon the effective management of interest rate risk.  We employ a variety of measurement techniques to identify and manage our interest rate risk, including the use of an earnings simulation model to analyze net interest income sensitivity to changing interest rates.  The model is based on actual cash flows and repricing characteristics for on and off-balance sheet instruments and incorporates market-based assumptions regarding the effect of changing interest rates on the prepayment rates of certain assets and liabilities.  Assumptions based on the historical behavior of deposit rates and balances in relation to changes in interest rates are also incorporated into the model.  These assumptions are inherently uncertain, and as a result, the model cannot precisely measure net interest income or precisely predict the impact of fluctuations in interest rates on net interest income.  Actual results will differ from simulated results due to timing, magnitude, and frequency of interest rate changes as well as changes in market conditions and management strategies.

CTBI’s Asset/Liability Management Committee (ALCO), which includes executive and senior management representatives and reports to the Board of Directors, monitors and manages interest rate risk within Board-approved policy limits.  Our current exposure to interest rate risks is determined by measuring the anticipated change in net interest income spread evenly over the twelve-month period.

The following table shows our estimated earnings sensitivity profile as of March 31, 2023:

Change in Interest Rates
(basis points)
Percentage Change in Net Interest Income
(12 Months)
+40012.00%
+3008.82%
+2005.65%
+1002.47%
-100(2.28)%
-200(4.71)%
-300(7.12)%
-400(9.57)%

57

The following table shows our estimated earnings sensitivity profile as of December 31, 2022:

Change in Interest Rates
(basis points)
Percentage Change in Net Interest Income
(12 Months)
+4009.98%
+3007.26%
+2004.60%
+1001.94%
-100(1.95)%
-200(3.92)%
-300(5.96)%
-400(7.91)%

The simulation model used the yield curve spread evenly over a twelve-month period.  The measurement at March 31, 2023 estimates that our net interest income in an up-rate environment would increase by 12.00% at a 400 basis point change, increase by 8.82% at a 300 basis point change, increase by 5.65% at a 200 basis point change, and increase by 2.47% at a 100 basis point change.  In a down-rate environment, net interest income would decrease 2.28% at a 100 basis point change, decrease by 4.71% at a 200 basis point change, decrease by 7.12% at a 300 basis point change, and decrease by 9.57% at a 400 basis point change over one year.  We actively manage our balance sheet and limit our exposure to long-term fixed rate financial instruments, including loans.  In order to reduce the exposure to interest rate fluctuations and to manage liquidity, we have developed sale procedures for several types of interest-sensitive assets.  Primarily all long-term, fixed rate single family residential mortgage loans underwritten according to Federal Home Loan Mortgage Corporation guidelines are sold for cash upon origination or originated under terms where they could be sold.  Periodically, additional assets such as commercial loans are also sold.  Proceeds of $4.7 million and $26.2 million were realized on the sale of fixed rate mortgages for quarters ended March 31, 2023 and March 31, 2022, respectively.  We focus our efforts on consistent net interest revenue and net interest margin growth through each of the retail and wholesale business lines.  We do not currently engage in trading activities.

The preceding analysis was prepared using a rate ramp analysis which attempts to spread changes evenly over a specified time period as opposed to a rate shock which measures the impact of an immediate change.  Had these measurements been prepared using the rate shock method, the results would vary.

Capital Resources

We continue to offer a dividend to our shareholders, providing an annualized dividend yield for the quarter ended March 31, 2022 of 3.88%4.64%.  Shareholders’ equity decreased 6.4%increased $28.8 million, or an annualized 18.6%, during the quarter and $3.5 million, or 0.5%, from December 31, 2021 to $653.4 million at March 31, 2022, as a result of a $58.1 million net after tax increase during the quarter in unrealized losses on our securities portfolio.portfolio have begun to decrease.  Our primary source of capital growth is the retention of earnings.  Cash dividends were $0.400$0.44 per share and $0.385$0.40 per share for the three months ended March 31, 20222023 and 2021,2022, respectively.  We retained 64.0%59.3% of our earnings for the first three months of 20222023 compared to 71.1%64.0% for the first three months of 2021.2022.

Insured depository institutions are required to meet certain capital level requirements.  On October 29, 2019, federal banking regulators adopted a final rule to simplify the regulatory capital requirements for eligible community banks and holding companies that opt-in to the community bank leverage ratio (“CBLR”framework (the “CBLR framework”) framework,, as required by Section 201 of the Economic Growth, Relief and Consumer Protection Act of 2018.  Under the final rule, which became effective as of January 1, 2020, community banks and holding companies (which includes CTB and CTBI) that satisfy certain qualifying criteria, including having less than $10 billion in average total consolidated assets and a leverage ratio (referred to as the “community bank leverage ratio”) of greater than 9%, were eligible to opt-in to the CBLR framework.  The community bank leverage ratio is the ratio of a banking organization’s Tier 1 capital to its average total consolidated assets, both as reported on the banking organization’s applicable regulatory filings.  Accordingly, a qualifying community banking organization that has a community bank leverage ratio greater than 9% will be considered to have met: (i) the risk-based and leverage capital requirements of the generally applicable capital rules; (ii) the capital ratio requirements in order to be considered well-capitalized under the prompt corrective action framework; and (iii) any other applicable capital or leverage requirements.

5158

In April 2020, as directed by Section 4012 of the Coronavirus Aid, Relief, and Economic SecurityCARES Act, the regulatory agencies introduced temporary changes to the CBLR framework.CBLR.  These changes, which subsequently were adopted as a final rule, temporarily reduced the CBLR requirement to 8% through the end of calendar year 2020.  Beginning in calendar year 2021, the CBLR requirement increased to 8.5% for the calendar year before returning to 9% in calendar year 2022.  The final rule also provides for a two-quarter grace period for qualifying community banking organizations whose leverage ratios fall no more than 100 basis points below the applicable CBLR requirement.  Management elected to use the CBLR framework for CTBI and CTB.  CTBI’s CBLR ratio as of March 31, 20222023 was 13.15%13.71%.  CTB’s CBLR ratio as of March 31, 20222023 was 12.53%13.10%.  Under either framework, CTBI and CTB would be considered well-capitalized under the applicable guidelines.

As of March 31, 2022,2023, we are not aware of any current recommendations by banking regulatory authorities which, if they were to be implemented, would have, or are reasonably likely to have, a material adverse impact on our liquidity, capital resources, or operations.

Impact of Inflation, Changing Prices, and Economic Conditions

The majority of our assets and liabilities are monetary in nature.  Therefore, CTBI differs greatly from most commercial and industrial companies that have significant investment in nonmonetary assets, such as fixed assets and inventories.  However, inflation does have an important impact on the growth of assets in the banking industry and on the resulting need to increase equity capital at higher than normal rates in order to maintain an appropriate equity to assets ratio.  Inflation also affects other expenses, which tend to rise during periods of general inflation.

We believe one of the most significant impacts on financial and operating results is our ability to react to changes in interest rates.  We seek to maintain an essentially balanced position between interest rate sensitive assets and liabilities in order to protect against the effects of wide interest rate fluctuations.

We are all finding ourselves living and operating in unprecedented times as the COVID-19 pandemic is causing personal and financial hardship to our customers, employees, and communities.  During these challenging times, we have instituted programs to support our customers with loan modifications, forbearance, and fee waivers and participated in programs created by the government stimulus programs like the Paycheck Protection Program, focused on helping small businesses keep their employees and meet their expenses as they were unable to operate due to mandated closures.  We instituted programs supporting our employees focused on healthcare, childcare, and remote and split schedule work, as well as work space changes that allow for proper social distancing to keep our employees safe as we continue to operate as a critical part of the economy.  We continue to support our communities through donations to non-profit organizations as they strive to continue their commitments of serving those in need.  We also continue to manage our company for the long term and our strong capital position and culture of building communities built on trust will facilitate our ability to manage through these challenging times.  We will continue to serve our constituents while we all meet the challenges of living with COVID-19.

Stock Repurchase Program

CTBI’s stock repurchase program began in December 1998 with the authorization to acquire up to 500,000 shares and was increased by an additional 1,000,000 shares in each of July 2000, May 2003, and March 2020.  CTBI repurchased 32,664 shares of its common stock during the first quarter 2020, leaving 1,034,706 shares remaining under our current repurchase authorization.  As of March 31, 2022,2023, a total of 2,465,294 shares have been repurchased through this program.

52On August 16, 2022, the Inflation Reduction Act (“ IRA” ) was signed into law in the United States.  Among other provisions, the IRA imposes an excise tax of 1% tax on the fair market value of net stock repurchases made after December 31, 2022.  The impact of this provision will be dependent on the extent of share repurchases made in future periods.


Critical Accounting Policies and Estimates

The preparation of consolidated financial statements in conformity with accounting principles generally accepted in the United States of America requires the appropriate application of certain accounting policies, many of which require us to make estimates and assumptions about future events and their impact on amounts reported in our consolidated financial statements and related notes.  Since future events and their impact cannot be determined with certainty, the actual results will inevitably differ from our estimates.  Such differences could be material to ourthe consolidated financial statements.

We believe the application of accounting policies and the estimates required therein are reasonable.  These accounting policies and estimates are constantly reevaluated, and adjustments are made when facts and circumstances dictate a change.  Historically, we have found our application of accounting policies to be appropriate, and actual results have not differed materially from those determined using necessary estimates.

59

Our accounting policies are described in Note 1 to the condensed consolidated financial statements contained herein.  We have identified the following critical accounting policies:

Allowance for Credit Losses  CTBI accounts for the allowance for credit losses (“ACL”) and the reserve for unfunded commitments in accordance with Accounting Standards Update (“ASU”) 2016-13, Financial Instruments—Credit Losses (Topic 326): Measurement of Credit Losses on Financial Instruments, and its related subsequent amendments, commonly known as CECL.

We disaggregate our portfolio loans into portfolio segments for purposes of determining the ACL.  Our loan portfolio segments include commercial, residential mortgage, and consumer.  We further disaggregate our portfolio segments into classes for purposes of monitoring and assessing credit quality based on certain risk characteristics.  For an analysis of CTBI’s ACL by portfolio segment and credit quality information by class, refer to Note 4 to the condensed consolidated financial statements contained herein.

CTBI maintains the ACL to absorb the amount of credit losses that are expected to be incurred over the remaining contractual terms of the related loans.  Contractual terms are adjustedEffective January 1, 2023, CTBI implemented ASU 2022-02, Financial Instruments-Credit Losses (Topic 326) Troubled Debt Restructurings and Vintage Disclosures, an amendment to 2016-13, Financial Instruments—Credit Losses (Topic 326): Measurement of Credit Losses on Financial Instruments.  The amendments in this ASU eliminate the accounting guidance for expected prepayments but are not extendedtroubled debt restructurings by creditors in Subtopic 310-40, Receivables—Troubled Debt Restructurings by Creditors, while enhancing disclosure requirements for expected extensions, renewals or modifications except in circumstances where CTBI reasonably expects to executecertain loan refinancings and restructurings by creditors when a TDRborrower is experiencing financial difficulty along with the borrower or where certain extension or renewal options are embedded in the original contract and not unconditionally cancellablerequiring that disclosures be added by CTBI.year of origination for gross charge-off information for financing receivables.  Accrued interest receivable on loans is presented in ourthe consolidated financial statements as a component of other assets.  When accrued interest is deemed to be uncollectible (typically when a loan is placed on nonaccrual status), interest income is reversed.  In the event that collection of principal becomes uncertain, CTBI has policies in place to reverse accrued interest in a timely manner.  Therefore, CTBI elected ASU 2019-04 which allows that accrued interest would continue to be presented separately and not part of the amortized cost of the loan.  For additional information on CTBI’s accounting policies related to nonaccrual loans, refer to Note 1 to the condensed consolidated financial statements contained herein.

Credit losses are charged and recoveries are credited to the ACL.  The ACL is maintained at a level CTBI considers to be adequate and is based on ongoing quarterly assessments and evaluations of the collectability of loans, including historical credit loss experience, current and forecasted market and economic conditions, and consideration of various qualitative factors that, in management’s judgment, deserve consideration in estimating expected credit losses.  Provisions for credit losses are recorded for the amounts necessary to adjust the ACL to CTBI’s current estimate of expected credit losses on portfolio loans.  CTBI’s strategy for credit risk management includes a combination of conservative exposure limits significantly below legal lending limits and conservative underwriting, documentation, and collection standards.  The strategy also emphasizes diversification on a geographic, industry, and customer level, regular credit examinations, and quarterly management reviews of large credit exposures and loans experiencing deterioration of credit quality.

53

CTBI’s methodology for determining the ACL requires significant management judgment and includes an estimate of expected credit losses on a collective basis for groups of loans with similar risk characteristics and specific allowances for loans which are individually evaluated.

60

Larger commercial loans with balances exceeding $1 million that exhibit probable or observed credit weaknesses are individually evaluated for an ACL if such loans,and (i) have a criticized risk rating, (ii) are on nonaccrual status, (iii) are classified as TDRs,have a borrower experiencing financial difficulty with significant payment delay, or (iv) are 90 days or more past due.due, are individually evaluated for an ACL.  CTBI considers the current value of collateral, credit quality of any guarantees, the guarantor’s liquidity and willingness to cooperate, the loan structure and other factors when determining the amount of the ACL.  Other factors may include the borrower’s susceptibility to risks presented by the forecasted macroeconomic environment, the industry and geographic region of the borrower, size and financial condition of the borrower, cash flow and leverage of the borrower, and our evaluation of the borrower’s management.  Significant management judgment is required when evaluating which of these factors are most relevant in individual circumstances, and when estimating the amount of expected credit losses based on those factors.  When loans are individually evaluated, allowances are determined based on management’s estimate of the borrower’s ability to repay the loan given the availability of collateral and other sources of cash flow, as well as an evaluation of legal options available to CTBI.  Allowances for individually evaluated loans that are collateral-dependent are typically measured based on the fair value of the underlying collateral, less expected costs to sell where applicable.  For collateral-dependent financial assets, the credit loss expected may be zero if the fair value less costs to sell exceeds the amortized cost of the loan.  Loans shall not be included in both collective assessments and individual assessments.  Individually evaluated loans that are not collateral-dependent are measured based on the present value of expected future cash flows discounted at the loan’s effective interest rate.  Specific allowances on individually evaluated commercial loans, including TDRs,loans to borrowers experiencing financial difficulty, are reviewed quarterly and adjusted as necessary based on changing borrower and/or collateral conditions and actual collection and charge-off experience.  Regardless of an initial measurement method, once it is determined that foreclosure is probable, the allowance for credit lossesACL is measured based on the fair value of the collateral as of the measurement date.  As a practical expedient, the fair value of the collateral may be used for a loan when determining the allowance for credit lossesACL for which the repayment is expected to be provided substantially through the operation or sale of the collateral when the borrower is experiencing financial difficulty.  The fair value shall be adjusted for selling costs when foreclosure is probable.

Expected credit losses are estimated on a collective basis for loans that are not individually evaluated.  These include commercial loans that do not meet the criteria for individual evaluation as well as homogeneous loans in the residential mortgage and consumer portfolio segments.  For collectively evaluated commercial loans, CTBI uses a static pool methodology based on our risk rating system.  See Note 4 to the condensed consolidated financial statements contained herein for information on CTBI’s risk rating system.  Other homogenous loans such as the residential mortgage and consumer portfolio segments derive their ACL from vintage modeling.  Vintage modeling was chosen primarily because these loans have fixed amortization schedules, and it allows CTBI to track loans from origination to completion, including repayments and prepayments, and captures net charge-offs by the different vintages providing historical loss rates.  These are the two primary models utilized for ACL determination although there are additional models for specific processes in addition.  CTBI’s expected credit loss models were developed based on historical credit loss experience and observations of migration patterns for various credit risk characteristics (such as internal credit risk grades, external credit ratings or scores, delinquency status, etc.) over time, with those observations evaluated in the context of concurrent macroeconomic conditions.  CTBI developed our models from historical observations capturing a full economic cycle when possible.

CTBI’s expected credit loss models consider historical credit loss experience, current market and economic conditions, and forecasted changes in market and economic conditions if such forecasts are considered reasonable and supportable.  Generally, CTBI considers our forecasts to be reasonable and supportable for a period of up to one year from the estimation date.  For periods beyond the reasonable and supportable forecast period, expected credit losses are estimated by reverting to historical loss information.  CTBI evaluates the length of our reasonable and supportable forecast period, our reversion period, and reversion methodology at least annually, or more often if warranted by economic conditions or other circumstances.

54

Other qualitative factors are used by CTBI in determining the ACL. These considerations inherently require significant management judgment to determine the appropriate factors to be considered and the extent of their impact on the ACL estimate.  Qualitative factors are used to capture characteristics in the portfolio that impact expected credit losses but that are not fully captured within CTBI’s expected credit loss models.  These include adjustments for changes in policies or procedures in underwriting, monitoring or collections, lending and risk management personnel, and results of internal audit and quality control reviews.  These may also include adjustments, when deemed necessary, for specific idiosyncratic risks such as geopolitical events, natural disasters and their effects on regional borrowers, and changes in product structures.  Qualitative factors may also be used to address the impacts of unforeseen events on key inputs and assumptions within CTBI’s expected credit loss models, such as the reasonable and supportable forecast period, changes to historical loss information, or changes to the reversion period or methodology.  When evaluating the adequacy of allowances, consideration is also given to regional geographic concentrations and the closely associated effect that changing economic conditions may have on CTBI’s customers.


61

Overall, the collective evaluation process requires significant management judgment when determining the estimation methodology and inputs into the models, as well as in evaluating the reasonableness of the modeled results and the appropriateness of qualitative adjustments.  CTBI’s forecasts of market and economic conditions and the internal risk grades assigned to loans in the commercial portfolio segment are examples of inputs to the expected credit loss models that require significant management judgment.  These inputs have the potential to drive significant variability in the resulting ACL.

The reserve for unfunded commitments is maintained at a level believed by management to be sufficient to absorb estimated expected credit losses related to unfunded credit facilities and is included in other liabilities in the consolidated balance sheets.  The determination of the adequacy of the reserve is based upon expected credit losses over the remaining contractual life of the commitments, taking into consideration the current funded balance and estimated exposure over the reasonable and supportable forecast period.  This process takes into consideration the same risk elements that are analyzed in the determination of the adequacy of CTBI’s ACL, as previously discussed.  Net adjustments to the reserve for unfunded commitments are included in other noninterest expense in the consolidated statements of income.

Goodwill – Business combinations entered into by CTBI typically include the recognition of goodwill.  U.S. generally accepted accounting principles (“GAAP”) require goodwill to be tested for impairment on an annual basis, which for CTBI is October 1, and more frequently if events or circumstances indicate that there may be impairment.  Refer to Note 1 to the condensed consolidated financial statements contained herein for a discussion on the methodology used by CTBI to assess goodwill for impairment.

Impairment exists when a reporting unit’s carrying amount of goodwill exceeds its implied fair value.  In testing goodwill for impairment, U.S. GAAP permits CTBIcompanies to first assess qualitative factors to determine whether it is more likely than not that its fair value is less than its carrying amount.  In this qualitative assessment, CTBI evaluates events and circumstances which may include, but are not limited to, the general economic environment, banking industry and market conditions, the overall financial performance of CTBI, and the performance of CTBI’s common stock, to determine if it is not more likely than not that the fair value is less than its carrying amount.  If the quantitative impairment test is required or the decision to bypass the qualitative assessment is elected, CTBI performs the goodwill impairment test by comparing its fair value with its carrying amount, including goodwill.  If the carrying amount exceeds its fair value, an impairment loss is recognized in an amount equal to that excess, limited to the total amount of goodwill recorded.  A recognized impairment loss cannot be reversed in future periods even if the fair value of the reporting unit subsequently recovers.

The fair value of CTBI is the price that would be received to sell the company as a whole in an orderly transaction between market participants at the measurement date.  The determination of the fair value is a subjective process that involves the use of estimates and judgments, particularly related to cash flows, the appropriate discount rates and an applicable control premium.  CTBI employs an income-based approach, utilizing forecasted cash flows and the estimated cost of equity as the discount rate.  Significant management judgment is necessary in the preparation of the forecasted cash flows surrounding expectations for earnings projections, growth and credit loss expectations, and actual results may differ from forecasted results.

55

Income TaxesIncome tax liabilities or assets are established for the amount of taxes payable or refundable for the current year.  Deferred tax liabilities (“DTLs”) and deferred tax assets (“DTAs”) are also established for the future tax consequences of events that have been recognized in CTBI’s financial statements or tax returns.  A DTL or DTA is recognized for the estimated future tax effects attributable to temporary differences and deductions that can be carried forward (used) in future years.  The valuation of current and deferred income tax liabilities and assets is considered critical, as it requires management to make estimates based on provisions of the enacted tax laws.  The assessment of tax liabilities and assets involves the use of estimates, assumptions, interpretations, and judgments concerning certain accounting pronouncements and federal and state tax codes.

62

Fair Value Measurements – As a financial services company, the carrying value of certain financial assets and liabilities is impacted by the application of fair value measurements, either directly or indirectly.  In certain cases, an asset or liability is measured and reported at fair value on a recurring basis, such as available-for-sale investment securities.  In other cases, management must rely on estimates or judgments to determine if an asset or liability not measured at fair value warrants an impairment write-down or whether a valuation reserve should be established.  Given the inherent volatility, the use of fair value measurements may have a significant impact on the carrying value of assets or liabilities or result in material changes to ourthe consolidated financial statements from period to period.  Detailed information regarding fair value measurements can be found in Note 7 to the condensed consolidated financial statements contained herein.

Item 3. Quantitative and Qualitative Disclosures About Market Risk

Interest rate risk management focuses on maintaining consistent growth in net interest income within Board-approved policy limits.  CTBI uses an earnings simulation model to analyze net interest income sensitivity to movements in interest rates.  Given a 200 basis point increase to the yield curve used in the simulation model, it is estimated net interest income for CTBI would increase by 3.99 percent3.83% over one year and 7.46 percent6.30% over two years.  A 25200 basis point decrease in the yield curve would decrease net interest income by an estimated 0.54 percent4.74% over one year and 1.02 percent7.04% over two years.  For further discussion of CTBI’s market risk, see the Management’s Discussion and Analysis of Financial Condition and Results of Operations—Liquidity and Market Risk included in the annual report on Form 10-K for the year ended December 31, 2021.2022.

Item 4. Controls and Procedures

EVALUATION OF DISCLOSURE CONTROLS AND PROCEDURES

CTBI’s management is responsible for establishing and maintaining effective disclosure controls and procedures, as defined under Rules 13a-15(e) and 15d-15(e) under the Securities Exchange Act of 1934.  As of the end of the period covered by this report, an evaluation was carried out by CTBI’s management, with the participation of our Vice Chairman, President, and Chief Executive Officer and the Executive Vice President, Chief Financial Officer, and Treasurer, of the effectiveness of the design and operation of our disclosure controls and procedures.  Based on this evaluation, management concluded that disclosure controls and procedures as of March 31, 20222023 were effective in ensuring material information required to be disclosed in this quarterly report on Form 10-Q was recorded, processed, summarized, and reported on a timely basis.

56

CHANGES IN INTERNAL CONTROL OVER FINANCIAL REPORTING

There were no changes in CTBI’s internal control over financial reporting that occurred during the three months ended March 31, 20222023 that have materially affected, or are reasonably likely to materially affect, CTBI’s internal control over financial reporting.

63

PART II - OTHER INFORMATION

Item 1.Legal ProceedingsNone
   
Item 1A.Risk FactorsNone
   
Item 2.Unregistered Sales of Equity Securities and Use of ProceedsNone
   
Item 3.
Defaults Upon Senior Securities
None
   
Item 4.
Mine Safety Disclosure
Not applicable
   
Item 5.
Other Information:
 
 CTBI’s Principal Executive Officer and Principal Financial Officer have furnished to the SEC the certifications with respect to this Form 10-Q that are required by Sections 302 and 906 of the Sarbanes-Oxley Act of 2002 
   
Item 6.Exhibits: 
 (1)   Certifications Pursuant to 18 U.S.C. Section 1350, as adopted pursuant to Section 302 of the Sarbanes-Oxley Act of 2002
 (2)   Certifications Pursuant to 18 U.S.C. Section 1350, as adopted pursuant to Section 906 of the Sarbanes-Oxley Act of 2002
 (3)   XBRL Instance Document – the instance document does not appear in the Interactive Data File because its XBRL tags are embedded within the Inline XBRLExhibit 101.INS
 (4)   XBRL Taxonomy Extension Schema DocumentExhibit 101.SCH
 (5)   XBRL Taxonomy Extension Calculation LinkbaseExhibit 101.CAL
 (6)   XBRL Taxonomy Extension Definition LinkbaseExhibit 101.DEF
 (7)   XBRL Taxonomy Extension Label LinkbaseExhibit 101.LAB
 (8)   XBRL Taxonomy Extension Presentation LinkbaseExhibit 101.PRE
 (9)  Cover Page Interactive Data File (formatted as inline XBRL and contained in Exhibit 101)Exhibit 104

5764

SIGNATURES

Pursuant to the requirements of the Securities Exchange Act of 1934, CTBI has duly caused this report to be signed on its behalf by the undersigned thereunto duly authorized.

 COMMUNITY TRUST BANCORP, INC.
  
Date:  May 9, 20222023By:
  
 /s/ Mark A. Gooch
 Mark A. Gooch
 Vice Chairman, President, and Chief Executive Officer
  
 /s/ Kevin J. Stumbo
 Kevin J. Stumbo
 Executive Vice President, Chief Financial Officer,
and Treasurer


58
65