Directors’ Fees and Expenses
USOF is responsible for paying its portion of the directors’ and officers’ liability insurance of the General Partner and the fees and expenses of the independent directors of the General Partner who are also the General Partner’s audit committee members. Effective as of April 1, 2010, USOF is responsible for paying its portion of any payments that may become due to the independent directors pursuant to the deferred compensation agreements entered into between the independent directors, the General Partner and each of the funds. USOF shares these fees and expenses with USNG, US12OF, UGA, USHO, USSO and USSOUS12NG based on the relative assets of each fund, computed on a daily basis. These fees and expenses for the calendar year 20092010 are estimated to be a total of $477,000$538,870 for all funds.
9
Licensing Fees
As discussed in Note 4, USOF entered into a licensing agreement with the NYMEX on May 30, 2007. Pursuant to the agreement, USOF and the affiliated funds managed by the General Partner pay a licensing fee that is equal to 0.04% for the first $1,000,000,000 of combined assets of the funds and 0.02% for combined assets above $1,000,000,000. During the ninethree months ended September 30,March 31, 2010 and 2009, and 2008, USOF incurred $491,498$116,765 and $194,845,$198,364, respectively, under this arrangement.
Investor Tax Reporting Cost
The fees and expenses associated with USOF’s audit expenses and tax accounting and reporting requirements with the exception of certain initial implementation service fees and base service fees which are borne by the General Partner, are paid by USOF. These costs were approximately $367,695 for the three months ended March 31, 2010.
Other Expenses and Fees
In addition to the fees described above, USOF pays all brokerage fees taxes and other expenses in connection with the operation of USOF, excluding costs and expenses paid by the General Partner as outlined in Note 4.
NOTE 4 - CONTRACTS AND AGREEMENTS
USOF is party to a marketing agent agreement, dated as of March 13, 2006, with the Marketing Agent and the General Partner, whereby the Marketing Agent provides certain marketing services for USOF as outlined in the agreement. The fees of the Marketing Agent, which are borne by the General Partner, include a marketing fee of $425,000 per annum plus the following incentive fee: 0.00% on USOF’s assets from $0 - $500 million; 0.04% on USOF’s assets from $500 million - $4 billion; and 0.03% on USOF’s assets in excess of $4 billion.
The above fees do not include the following expenses, which are also borne by the General Partner: the cost of placing advertisements in various periodicals; web construction and development; or the printing and production of various marketing materials.
USOF is also party to a custodian agreement, dated March 13, 2006, with Brown Brothers Harriman & Co. (“BBH&Co.”) and the General Partner, whereby BBH&Co. holds investments on behalf of USOF. The General Partner pays the fees of the custodian, which are determined by the parties from time to time. In addition, USOF is party to an administrative agency agreement, dated March 13, 2006, with the General Partner and BBH&Co., whereby BBH&Co. acts as the administrative agent, transfer agent and registrar for USOF. The General Partner also pays the fees of BBH&Co. for its services under this agreement and such fees are determined by the parties from time to time.
Currently, the General Partner pays BBH&Co. for its services, in the foregoing capacities, a minimum amount of $75,000 annually for its custody, fund accounting and fund administration services rendered to USOF and each of the affiliated funds managed by the General Partner, as well as a $20,000 annual fee for its transfer agency services. In addition, the General Partner pays BBH&Co. an asset-based charge of (a) 0.06% for the first $500 million of USOF’s, USNG’s, US12OF’s, UGA’s, USHO’s, USSO’s and USSO’sUS12NG’s combined net assets, (b) 0.0465% for USOF’s, USNG’s, US12OF’s, UGA’s, USHO’s, USSO’s and USSO’sUS12NG’s combined net assets greater than $500 million but less than $1 billion, and (c) 0.035% once USOF’s, USNG’s, US12OF’s, UGA’s, USHO’s, USSO’s and USSO’sUS12NG’s combined net assets exceed $1 billion. The annual minimum amount will not apply if the asset-based charge for all accounts in the aggregate exceeds $75,000. The General Partner also pays transaction fees ranging from $7.00 to $15.00 per transaction.
USOF has entered into a brokerage agreement with UBS Securities LLC (“UBS Securities”). The agreement requires UBS Securities to provide services to USOF in connection with the purchase and sale of Oil Futures Contracts and Other Oil Interests that may be purchased and sold by or through UBS Securities for USOF’s account. The agreement provides that UBS Securities charge USOF commissions of approximately $7 per round-turn trade, plusincluding applicable exchange and NFA fees for Oil Futures Contracts and options on Oil Futures Contracts.
10
On May 30, 2007, USOF and the NYMEX entered into a licensing agreement whereby USOF was granted a non-exclusive license to use certain of the NYMEX’s settlement prices and service marks. The agreement has an effective date of April 10, 2006. Under the licensing agreement, USOF and the affiliated funds managed by the General Partner pay the NYMEX an asset-based fee for the license, the terms of which are described in Note 3.
USOF expressly disclaims any association with the NYMEX or endorsement of USOF by the NYMEX and acknowledges that “NYMEX” and “New York Mercantile Exchange” are registered trademarks of the NYMEX.
NOTE 5 - FINANCIAL INSTRUMENTS, OFF-BALANCE SHEET RISKS AND CONTINGENCIES
USOF engages in the trading of futures contracts, options on futures contracts and cleared swaps (collectively, “derivatives”). USOF is exposed to both market risk, which is the risk arising from changes in the market value of the contracts, and credit risk, which is the risk of failure by another party to perform according to the terms of a contract.
USOF may enter into futures contracts, options on futures contracts and cleared swaps to gain exposure to changes in the value of an underlying commodity. A futures contract obligates the seller to deliver (and the purchaser to accept) the future delivery of a specified quantity and type of a commodity at a specified time and place. Some futures contracts may call for physical delivery of the asset, while others are settled in cash. The contractual obligations of a buyer or seller may generally be satisfied by taking or making physical delivery of the underlying commodity or by making an offsetting sale or purchase of an identical futures contract on the same or linked exchange before the designated date of delivery.
The purchase and sale of futures contracts, options on futures contracts and cleared swaps require margin deposits with a futures commission merchant. Additional deposits may be necessary for any loss on contract value. The Commodity Exchange Act requires a futures commission merchant to segregate all customer transactions and assets from the futures commission merchant’s proprietary activities.
Futures contracts and cleared swaps involve, to varying degrees, elements of market risk (specifically commodity price risk) and exposure to loss in excess of the amount of variation margin. The face or contract amounts reflect the extent of the total exposure USOF has in the particular classes of instruments. Additional risks associated with the use of futures contracts are an imperfect correlation between movements in the price of the futures contracts and the market value of the underlying securities and the possibility of an illiquid market for a futures contract.
All of the futures contracts currently traded by USOF are exchange-traded. The risks associated with exchange-traded contracts are generally perceived to be less than those associated with over-the-counter transactions since, in over-the-counter transactions, USOF must rely solely on the credit of its respective individual counterparties. However, in the future, if USOF were to enter into non-exchange traded contracts, it would be subject to the credit risk associated with counterparty non-performance. The credit risk from counterparty non-performance associated with such instruments is the net unrealized gain, if any. USOF also has credit risk since the sole counterparty to all domestic and foreign futures contracts is the clearinghouse for the exchange on which the relevant contracts are traded. In addition, USOF bears the risk of financial failure by the clearing broker.
USOF’s cash and other property, such as U.S. Treasuries, deposited with a futures commission merchant are considered commingled with all other customer funds subject to the futures commission merchant’s segregation requirements. In the event of a futures commission merchant’s insolvency, recovery may be limited to a pro rata share of segregated funds available. It is possible that the recovered amount could be less than the total of cash and other property deposited. The insolvency of a futures commission merchant could result in the complete loss of USOF’s assets posted with that futures commission merchant; however, the vast majority of USOF’s assets are held in Treasuries, cash and/or cash equivalents with USOF’s custodian and would not be impacted by the insolvency of a futures commission merchant. Also, the failure or insolvency of USOF’s custodian could result in a substantial loss of USOF’s assets.
11
USOF invests a portion of its cash in money market funds that seek to maintain a stable net asset value. USOF is exposed to any risk of loss associated with an investment in these money market funds. As of September 30, 2009March 31, 2010 and December 31, 2008,2009, USOF had deposits in domestic and foreign financial institutions, including cash investments in money market funds, in the amounts of $2,324,411,842$1,744,588,808 and $2,381,842,321,$2,395,095,731, respectively. This amount is subject to loss should these institutions cease operations.
For derivatives, risks arise from changes in the market value of the contracts. Theoretically, USOF is exposed to a market risk equal to the value of futures contracts purchased and unlimited liability on such contracts sold short. As both a buyer and a seller of options, USOF pays or receives a premium at the outset and then bears the risk of unfavorable changes in the price of the contract underlying the option.
USOF’s policy is to continuously monitor its exposure to market and counterparty risk through the use of a variety of financial, position and credit exposure reporting controls and procedures. In addition, USOF has a policy of requiring review of the credit standing of each broker or counterparty with which it conducts business.
The financial instruments held by USOF are reported in its condensed statement of financial condition at market or fair value, or at carrying amounts that approximate fair value, because of their highly liquid nature and short-term maturity.
NOTE 6 – FAIR VALUE OF FINANCIAL INSTRUMENTS
Level I – Quoted prices (unadjusted) in active markets for identical assets or liabilities that the reporting entity has the ability to access at the measurement date.
Level II – Inputs other than quoted prices included within Level I that are observable for the asset or liability, either directly or indirectly. Level II assets include the following: quoted prices for similar assets or liabilities in active markets, quoted prices for identical or similar assets or liabilities in markets that are not active, inputs other than quoted prices that are observable for the asset or liability, and inputs that are derived principally from or corroborated by observable market data by correlation or other means (market-corroborated inputs).
Level III – Unobservable pricing input at the measurement date for the asset or liability. Unobservable inputs shall be used to measure fair value to the extent that observable inputs are not available.
In some instances, the inputs used to measure fair value might fall in different levels of the fair value hierarchy. The level in the fair value hierarchy within which the fair value measurement in its entirety falls shall be determined based on the lowest input level that is significant to the fair value measurement in its entirety.
The following table summarizes the valuation of USOF’s securities at March 31, 2010 using the fair value hierarchy:
| At March 31, 2010 | Total | Level I | Level II | Level III | ||||||||||||
| Short-Term Investments | $ | 1,389,798,065 | $ | 1,389,798,065 | $ | - | $ | - | ||||||||
| Exchange-Traded Futures Contracts | ||||||||||||||||
| Foreign Contracts | 18,888,680 | 18,888,680 | - | - | ||||||||||||
| United States Contracts | 12,118,120 | 12,118,120 | - | - | ||||||||||||
12
Effective January 1, 2009, USOF adopted the provisions of USOF’s securities at September 30, 2009Accounting Standards Codification 815 —Derivatives and Hedging, which require presentation of qualitative disclosures about objectives and strategies for using thederivatives, quantitative disclosures about fair value hierarchy:amounts and gains and losses on derivatives.
Fair Value of Derivative Instruments
| At September 30, 2009 | Total | Level I | Level II | Level III | ||||||||
| Short-Term Investments | $ | 1,614,306,640 | $ | 1,614,306,640 | $ | — | $ | — | ||||
| Exchange-Traded Futures Contracts | ||||||||||||
| Foreign Contracts | (11,968,680 | ) | (11,968,680 | ) | — | — | ||||||
| United States Contracts | 11,213,700 | 11,213,700 | — | — | ||||||||
| At | At | |||||||
| March 31, 2010 | December 31, 2009 | |||||||
| Derivatives not | Statement of | |||||||
| Accounted | Financial | |||||||
| for as Hedging | Condition | |||||||
| Instruments | Location | Fair Value | Fair Value | |||||
| Futures - Commodity Contracts | Assets | $ | (67,884) | $ | 5,883,944 | |||
The Effect of Derivative Instruments on the Statements of Operations
| For the three months ended | For the three months ended | |||||||||||||||||
| March 31, 2010 | March 31, 2009 | |||||||||||||||||
| Location of | Realized | Change in | Realized | Change in | ||||||||||||||
| Derivatives not | Gain or (Loss) | Gain or (Loss) | Unrealized | Gain or (Loss) | Unrealized | |||||||||||||
| Accounted | on Derivatives | on Derivatives | Gain or (Loss) | on Derivatives | Gain or (Loss) | |||||||||||||
| for as Hedging | Recognized | Recognized | Recognized | Recognized | Recognized | |||||||||||||
| Instruments | in Income | in Income | in Income | in Income | in Income | |||||||||||||
| Futures - Commodity | Realized gain (loss) on | $ | 9,548,503 | $ | 7,734,947 | |||||||||||||
Contracts Contracts | closed positions | |||||||||||||||||
| Change in unrealized gain (loss) on open positions | $ | (5,951,828) | $ | (2,995,902) | ||||||||||||||
NOTE 7 - - FINANCIAL HIGHLIGHTS
The following table presents per unit performance data and other supplemental financial data for the ninethree months ended September 30,March 31, 2010 and 2009 and 2008 for the unitholders. This information has been derived from information presented in the condensed financial statements.
For the three months ended | For the three months ended | |||||||
| March 31, 2010 | March 31, 2009 | |||||||
| (Unaudited) | (Unaudited) | |||||||
| Per Unit Operating Performance: | ||||||||
| Net asset value, beginning of period | $ | 39.16 | $ | 34.31 | ||||
| Total income (loss) | 1.50 | (4.89 | ) | |||||
| Total expenses | (0.07 | ) | (0.06 | ) | ||||
| Net increase (decrease) in net asset value | 1.43 | (4.95 | ) | |||||
| Net asset value, end of period | $ | 40.59 | $ | 29.36 | ||||
| Total Return | 3.65 | % | (14.43 | )% | ||||
| Ratios to Average Net Assets | ||||||||
| Total income (loss) | 3.82 | % | (7.67 | )% | ||||
| Expenses excluding management fees* | 0.25 | % | 0.35 | % | ||||
| Management fees* | 0.45 | % | 0.45 | % | ||||
| Net income (loss) | 3.65 | % | (7.86 | )% | ||||
| *Annualized | ||||||||
13
For the nine months ended | For the nine months ended | |||||||
| September 30, 2009 | September 30, 2008 | |||||||
| (Unaudited) | (Unaudited) | |||||||
| Per Unit Operating Performance: | ||||||||
| Net asset value, beginning of period | $ | 34.31 | $ | 75.82 | ||||
| Total income | 2.19 | 5.98 | ||||||
| Total expenses | (0.19 | ) | (0.62 | ) | ||||
| Net increase in net asset value | 2.00 | 5.36 | ||||||
| Net asset value, end of period | $ | 36.31 | $ | 81.18 | ||||
| Total Return | 5.83 | % | 7.07 | % | ||||
| Ratios to Average Net Assets | ||||||||
| Total income (loss) | 15.93 | % | (12.59 | ) % | ||||
| Expenses excluding management fees* | 0.35 | % | 0.45 | % | ||||
| Management fees* | 0.45 | % | 0.46 | % | ||||
| Net income (loss) | 15.34 | % | (13.27 | ) % | ||||
| *Annualized | ||||||||
Total returns are calculated based on the change in value during the period. An individual unitholder’s total return and ratio may vary from the above total returns and ratios based on the timing of contributions to and withdrawals from USOF.
NOTE 8 – RECENTLY ADOPTEDRECENT ACCOUNTING STANDARDSPRONOUNCEMENTS
In March 2008,January 2010, the Financial Accounting Standards Board releasedissued Accounting Standards Codification 815 – DerivativesUpdate (“ASU”) No. 2010-06 “Improving Disclosures about Fair Value Measurements.” ASU No. 2010-06 clarifies existing disclosure and Hedging (“ASC 815”). ASC 815 requires qualitativeadditional disclosures about objectives and strategies for using derivatives, quantitative disclosures aboutregarding fair value amountsmeasurements. Effective for fiscal years beginning after December 15, 2010, and for interim periods within those fiscal years, entities will need to disclose information about purchases, sales, issuances and settlements of and gains and lossesLevel 3 securities on derivative instruments, and disclosures about credit-risk-related contingent features in derivative agreements. USOF adopted ASC 815a gross basis, rather than as a net number as currently required. The General Partner is currently evaluating the impact ASU No. 2010-06 will have on January 1, 2009.USOF’s financial statement disclosures.
NOTE 9 – SUBSEQUENT EVENTS
USOF has performed an evaluation of subsequent events through November 9, 2009, which is the date the financial statements were available to be issued. This evaluation did not result in any subsequent events that necessitated disclosures and/or adjustments.
Item 2. Management’s Discussion and Analysis of Financial Condition and Results of Operations.
The following discussion should be read in conjunction with the condensed financial statements and the notes thereto of the United States Oil Fund, LP (“USOF”) included elsewhere in this quarterly report on Form 10-Q.
Forward-Looking Information
This quarterly report on Form 10-Q, including this “Management’s Discussion and Analysis of Financial Condition and Results of Operations,” contains forward-looking statements regarding the plans and objectives of management for future operations. This information may involve known and unknown risks, uncertainties and other factors that may cause USOF’s actual results, performance or achievements to be materially different from future results, performance or achievements expressed or implied by any forward-looking statements. Forward-looking statements, which involve assumptions and describe USOF’s future plans, strategies and expectations, are generally identifiable by use of the words “may,” “will,” “should,” “expect,” “anticipate,” “estimate,” “believe,” “intend” or “project,” the negative of these words, other variations on these words or comparable terminology. These forward-looking statements are based on assumptions that may be incorrect, and USOF cannot assure investors that the projections included in these forward-looking statements will come to pass. USOF’s actual results could differ materially from those expressed or implied by the forward-looking statements as a result of various factors.
USOF has based the forward-looking statements included in this quarterly report on Form 10-Q on information available to it on the date of this quarterly report on Form 10-Q, and USOF assumes no obligation to update any such forward-looking statements. Although USOF undertakes no obligation to revise or update any forward-looking statements, whether as a result of new information, future events or otherwise, investors are advised to consult any additional disclosures that USOF may make directly to them or through reports that USOF in the future files with the U.S. Securities and Exchange Commission (the “SEC”), including annual reports on Form 10-K, quarterly reports on Form 10-Q and current reports on Form 8-K.
Introduction
USOF, a Delaware limited partnership, is a commodity pool that issues units that may be purchased and sold on the NYSE Arca, Inc. (the “NYSE Arca”). The investment objective of USOF is to havefor the changes in percentage terms of its units’ net asset value (“NAV”) to reflect the changes in percentage terms of the spot price of light, sweet crude oil delivered to Cushing, Oklahoma, as measured by the changes in the price of the futures contract onfor light, sweet crude oil as traded on the New York Mercantile Exchange (the “NYMEX”) that is the near month contract to expire, except when the near month contract is within two weeks of expiration, in which case it will become, over a 4-day period, the futures contract that is the next month contract to expire (the “Benchmark Oil Futures Contract”), less USOF’s expenses.
USOF seeks to achieve its investment objective by investing in a combination of oil futures contracts and other oil interests such that changes in its NAV, measured in percentage terms, will closely track the changes in the price of the Benchmark Oil Futures Contract, also measured in percentage terms. USOF’s general partner believes the changes in the price of the Benchmark Oil Futures Contract have historically has exhibited a close correlation with the changes in the spot price of light, sweet crude oil. It is not the intent of USOF to be operated in a fashion such that the NAV will equal, in dollar terms, the spot price of light, sweet crude oil or any particular futures contract based on light, sweet crude oil. Management believes that it is not practical to manage the portfolio to achieve such an investment goal when investing in listed crude oil futures contracts and other oil interests.
On any valuation day, the Benchmark Oil Futures Contract is the near month futures contract for light, sweet crude oil traded on the NYMEX unless the near month contract will expireis within two weeks of the valuation day,expiration, in which case the Benchmark Oil Futures Contract becomes, over a 4-day period, the next month contract for light, sweet crude oil traded on the NYMEX. “Near month contract” means the next contract traded on the NYMEX due to expire. “Next month contract” means the first contract traded on the NYMEX due to expire after the near month contract.
USOF invests in futures contracts for light, sweet crude oil, other types of crude oil, heating oil, gasoline, natural gas and other petroleum-based fuels that are traded on the NYMEX, ICE Futures or other U.S. and foreign exchanges (collectively, “Oil Futures Contracts”) and other oil interests such as cash-settled options on Oil Futures Contracts, forward contracts for oil, cleared swap contracts and over-the-counter transactions that are based on the price of crude oil, other petroleum-based fuels, Oil Futures Contracts and indices based on the foregoing (collectively, “Other Oil Interests”). For convenience and unless otherwise specified, Oil Futures Contracts and Other Oil Interests collectively are referred to as “Oil Interests” in this quarterly report on Form 10-Q.
The regulation of Oil Interestscommodity interests in the United States is a rapidly changing area of law and is subject to ongoing modification by governmental and judicial action. As stated under the heading, “Risk Factors” in the section “What are the Risk Factors Involved with an Investment in USOF?”Item 1A of USOF’s prospectus as filed withannual report on Form 10-K for the SEC,year ended December 31, 2009, regulation of the commodity interests and energy markets is extensive and constantly changing; future regulatory developments in the commodity interests and energy markets are impossible to predict but may significantly and adversely affect USOF.
Currently, a number of proposals to alter the regulation of Oil Interestscommodity interests are being considered by federal regulators and legislators. These proposals include the imposition of hard position limits on energy-based commodity futures contracts, the extension of position and accountability limits to futures contracts on non-U.S. exchanges previously exempt from such limits, and the forced use of clearinghouse mechanisms for all over-the-counter transactions. An additional proposal would aggregate and limit all positions in energy futures held by a single entity, whether such positions exist on U.S. futures exchanges, non-U.S. futures exchanges, or in over-the-counter contracts. The U.S. Commodity Futures Trading Commission (the “CFTC”) has also recently published a proposed rule that would impose fixed position limits on certain energy futures contracts, including the Benchmark Oil Futures Contract, without the need for any new legislation to be passed. If any of the aforementioned proposals is implemented, USOF’s ability to meet its investment objective may be negatively impacted.impacted and investors could be adversely affected.
The general partner of USOF, United States Commodity Funds LLC (formerly, Victoria Bay Asset Management, LLC) (the “General Partner”), which is registered as a commodity pool operator (“CPO”) with the U.S. Commodity Futures Trading Commission (the “CFTC”),CFTC, is authorized by the Fifth Amended and Restated Agreement of Limited Partnership of USOF (the “LP Agreement”) to manage USOF. The General Partner is authorized by USOF in its sole judgment to employ and establish the terms of employment for, and termination of, commodity trading advisors or futures commission merchants.
Crude oil futures prices were volatile during the ninethree months ended September 30, 2009March 31, 2010 and exhibited wide daily swings along with an uneven upward trend from late February 2009January to late March 2009.2010. The price of the Benchmark Oil Futures Contract started the period at the $44.60$79.36 per barrel level.barrel. The low of the period was on February 18, 20092, 2010 when prices dropped to $37.41$71.19 per barrel. Prices rose over the course of the period and hit a peak on August 24, 2009March 31, 2010 of $74.97$83.76 per barrel. The period ended with the Benchmark Oil Futures Contract at $70.61$83.76 per barrel, up approximately 58.32%5.54% over the period. USOF’s NAV rose during the period from a starting level of $34.31$39.16 per unit and reached its high for the period on June 11, 2009January 6, 2010 at $39.78$41.05 per unit. USOF’s NAV reached its low for the period on February 18, 20095, 2010 at $22.88$34.88 per unit. USOF’s NAV on September 30, 2009March 31, 2010 was $36.31,$40.59, up approximately 5.83%3.65% over the period. The Benchmark Oil Futures Contract prices listed above begin with the February 20092010 contract and end with the November 2009May 2010 contract. The return of approximately 58.32%5.54% on the Benchmark Oil Futures Contract listed above is a hypothetical return only and could not actually be achieved by an investor holding futures contracts. An investment in oil futures contracts would need to be rolled forward during the time period described in order to achieve such a result.
Returns.”
Valuation of Oil Futures Contracts and the Computation of the NAV
The NAV of USOFUSOF’s units is calculated once each NYSE Arca trading day. The NAV for a particular trading day is released after 4:00 p.m. New York time. Trading during the core trading session on the NYSE Arca typically closes at 4:00 p.m. New York time. USOF’s administrator uses the NYMEX closing price (determined at the earlier of the close of the NYMEX or 2:30 p.m. New York time) for the contracts held on the NYMEX, but calculates or determines the value of all other USOF investments, including ICE Futures contracts or other futures contracts, as of the earlier of the close of the New York Stock ExchangeNYSE Arca or 4:00 p.m. New York time.
16
Results of Operations and the Crude Oil Market
Results of Operations. On April 10, 2006, USOF listed its units on the American Stock Exchange (the “AMEX”) under the ticker symbol “USO.” On that day, USOF established its initial offering price at $67.39 per unit and issued 200,000 units to the initial authorized purchaser, KV Execution Services LLC, in exchange for $13,479,000 in cash. As a result of the acquisition of the AMEX by NYSE Euronext, USOF’s units no longer trade on the AMEX and commenced trading on the NYSE Arca on November 25, 2008.
Since its initial offering of 17,000,000 units, USOF has made seven subsequent offerings of its units: 30,000,000 units which were registered with the SEC on October 18, 2006, 50,000,000 units which were registered with the SEC on January 30, 2007, 30,000,000 units which were registered with the SEC on December 4, 2007, 100,000,000 units which were registered with the SEC on February 7, 2008, 100,000,000 units which were registered with the SEC on September 29, 2008, 300,000,000 units which were registered with the SEC on January 16, 2009 and 1,000,000,000 units which were registered with the SEC on June 29, 2009. Units offered by USOF in the subsequent offerings were sold by it for cash at the units’ NAV as described in the applicable prospectus. As of September 30, 2009,March 31, 2010, USOF had issued 438,100,000475,100,000 units, 66,800,00042,000,000 of which were outstanding. As of September 30, 2009,March 31, 2010, there were 1,188,900,0001,151,800,000 units registered but not yet issued.
More units may have been issued by USOF than are outstanding due to the redemption of units. Unlike funds that are registered under the Investment Company Act of 1940, as amended, units that have been redeemed by USOF cannot be resold by USOF. As a result, USOF contemplates that additional offerings of its units will be registered with the SEC in the future in anticipation of additional issuances and redemptions.
For the NineThree Months Ended September 30, 2009March 31, 2010 Compared to the NineThree Months Ended September 30, 2008March 31, 2009
As of September 30, 2009,March 31, 2010, the total unrealized lossgain on Oil Futures Contracts owned or held on that day was $754,980$31,006,800 and USOF established cash deposits, including cash investments in money market funds, that were equal to $2,324,411,842.$1,744,588,808. USOF held 80.27%86.06% of its cash assets in overnight deposits and money market funds at its custodian bank, while 19.73%13.94% of the cash balance was held with the futures commission merchant as margin deposits for the Oil Futures Contracts purchased. The ending per unit NAV on September 30, 2009March 31, 2010 was $36.31.$40.59.
By comparison, as of September 30, 2008,March 31, 2009, the total unrealized lossgain on Oil Futures Contracts owned or held on that day was $26,658,040$187,512,250 and USOF established cash deposits, including cash investments in money market funds, that were equal to $1,701,783,696.$2,780,809,660. USOF held 71.91%80.77% of its cash assets in overnight deposits and money market funds at its custodian bank, while 28.09%19.23% of the cash balance was held with the futures commission merchant as margin deposits for the Oil Futures Contracts purchased. The ending per unit NAV on September 30, 2008March 31, 2009 was $81.18.$29.36. The decreaseincrease in the per unit NAV from September 30, 2008March 31, 2009 compared to September 30, 2009March 31, 2010 was primarily a result of sharply lowerhigher prices for crude oil and the related declineincrease in the value of the Oil Futures Contracts that USOF had invested in between the period ended September 30, 2008March 31, 2009 and the period ended September 30, 2009.March 31, 2010.
Portfolio Expenses. USOF’s expenses consist of investment management fees, brokerage fees and commissions, certain offering costs, licensing fees, and the fees and expenses of the independent directors of the General Partner.Partner and expenses relating to tax accounting and reporting requirements. The management fee that USOF pays to the General Partner is calculated as a percentage of the total net assets of USOF. USOF pays the General Partner a management fee of 0.45% of NAV on its average net assets. The fee is accrued daily. Prior to January 1, 2009, the management fee was 0.50% for total net assets of up to $1 billiondaily and the management fee was 0.20% on the incremental amount of total net assets over $1 billion, and was accrued daily.paid monthly.
During the ninethree months ended September 30, 2009,March 31, 2010, the daily average total net assets of USOF were $2,714,172,313.$2,038,730,955. The management fee paid by USOF during the period amounted to $9,135,235. Management fees as a percentage of total net assets averaged 0.45% over the course of this nine month period.$2,262,154. By comparison, during the ninethree months ended September 30, 2008,March 31, 2009, the daily average total net assets of USOF were $810,780,060. During the nine months ended September 30, 2008, the total net assets of USOF exceeded $1 billion.$3,223,209,553. The management fee paid by USOF for this ninethree month period amounted to $2,805,644, which was calculated at the 0.50% rate for total net assets up to and including $1 billion and at the rate of 0.20% on average net assets over $1 billion, and accrued daily. Management fees as a percentage of total net assets averaged 0.46% over the course of this nine month period. USOF’s management fees as a percentage of total net assets were lower for the nine months ended September 30, 2009 compared to the nine months ended September 30, 2008 due to USOF’s reduced expense ratio schedule.$3,576,438.
17
In addition to the management fee, USOF pays all brokerage fees taxes and other expenses, including certain tax reporting costs, licensing fees for the use of intellectual property, ongoing registration or other fees paid to the SEC, the Financial Industry Regulatory Authority (“FINRA”) and any other regulatory agency in connection with offers and sales of its units subsequent to the initial offering and all legal, accounting, printing and other expenses associated therewith. The total of these fees taxes and expenses for the ninethree months ended September 30, 2009March 31, 2010 was $7,013,201,$1,264,624, as compared to $2,706,902$2,790,047 for the ninethree months ended September 30, 2008.March 31, 2009. The increasedecrease in expenses from the ninethree months ended September 30, 2008March 31, 2010 as compared to the ninethree months ended September 30,March 31, 2009 was primarily due to the relative size of USOF and activity that resulted from its increaseddecreased size, including reduced costs associated with the registration and the offering of additional units, increaseddecreased brokerage fees, increaseddecreased licensing fees and increaseddecreased tax reporting costs due to the greaterfewer number of unitholders during the ninethree months ended September 30, 2009.March 31, 2010. For the ninethree months ended September 30, 2009,March 31, 2010, USOF incurred $1,202,600$22,500 in ongoing registration fees and other expenses relating to the registration and offering of additional units. By comparison, for the ninethree months ended September 30, 2008,March 31, 2009, USOF incurred $393,787$453,200 in ongoing registration fees and other expenses relating to the registration and offering of additional units.
USOF is responsible for paying its portion of the directors’ and officers’ liability insurance of the General Partner and the fees and expenses of the independent directors of the General Partner who are also the General Partner’s audit committee members. USOF shares these fees and expenses with the United States Natural Gas Fund, LP (“USNG”), the United States 12 Month Oil Fund, LP (“US12OF”), the United States Gasoline Fund, LP (“UGA”), the United States Heating Oil Fund, LP (“USHO”) and, the United States Short Oil Fund, LP (“USSO”) based onand the relative assets of each fund computed on a daily basis.United States 12 Month Natural Gas Fund, LP (“US12NG”), These fees for calendar year 20092010 are estimated to be a total of $477,000$538,870 for all funds. By comparison, for the year ended December 31, 2008,2009, these fees amounted to a total of $282,000$433,046 for all funds, and USOF’s portion of such fees was $145,602. $254,952. Directors’ expenses are expected to increase in 20092010 due to payment foran increase in the amount of directors’ and officers’ liability insurance and an increase in the compensation awarded to the independent directors of the General Partner.coverage. Effective as of March 3, 2009, the General Partner has obtained directors’ and officers’ liability insurance covering all of the directors and officers of the General Partner. Previously, the General Partner did not have liability insurance for its directors and officers; instead, the independent directors received a payment in lieu of directors’ and officers’ liability insurance coverage. Effective as of April 1, 2010, USOF is also responsible for paying its portion of any payments that may become due to the independent directors pursuant to the deferred compensation agreements entered into between the independent directors, the General Partner and each of the funds.
USOF also incurs commissions to brokers for the purchase and sale of Oil Futures Contracts, Other Oil Interests or short-term obligations of the United States of two years or less (“Treasuries”). During the ninethree months ended September 30,March 31, 2010, total commissions paid to brokers amounted to $468,036. By comparison, during the three months ended March 31, 2009, total commissions paid to brokers amounted to $3,313,812. By comparison, during the nine months ended September 30, 2008, total commissions paid to brokers amounted to $891,642.$1,793,482. The increasedecrease in the total commissions paid to brokers from the ninethree months ended September 30, 2008March 31, 2009 to the ninethree months ended September 30, 2009March 31, 2010 was primarily a function of increaseddecreased brokerage fees due to a higherlower number of futures contracts being held and traded as a result of the increasedecrease in USOF’s average total net assets, the decreaseincrease in the price of Oil Futures Contracts and the increasedecrease in redemptions and creations of units during the ninethree months ended September 30, 2009.March 31, 2010. The increasedecrease in assets required USOF to purchase a greaterfewer number of Oil Futures Contracts and incur a largersmaller amount of commissions. As an annualized percentage of total net assets, the figure for the ninethree months ended September 30, 2009March 31, 2010 represents approximately 0.16%0.09% of total net assets. By comparison, the figure for the ninethree months ended September 30, 2008March 31, 2009 represented approximately 0.15%0.23% of total net assets. However, there can be no assurance that commission costs and portfolio turnover will not cause commission expenses to rise in future quarters.
Interest Income. USOF seeks to invest its assets such that it holds Oil Futures Contracts and Other Oil Interests in an amount equal to the total net assets of its portfolio. Typically, such investments do not require USOF to pay the full amount of the contract value at the time of purchase, but rather require USOF to post an amount as a margin deposit against the eventual settlement of the contract. As a result, USOF retains an amount that is approximately equal to its total net assets, which USOF invests in Treasuries, cash and/or cash equivalents. This includes both the amount on deposit with the futures commission merchant as margin, as well as unrestricted cash and cash equivalents held with USOF’s custodian bank. The Treasuries, cash and/or cash equivalents earn interest that accrues on a daily basis. For the three months ended September 30, 2009,March 31, 2010, USOF earned $665,832$106,694 in interest income on such cash holdings.and/or cash equivalents. Based on USOF’s average daily total net assets, this was equivalent to an annualized yield of 0.12%0.02%. USOF did not purchase Treasuries during the three months ended September 30, 2009March 31, 2010 and held all of its funds inonly cash and/or cash equivalents during this time period. By comparison, for the three months ended September 30, 2008,March 31, 2009, USOF earned $5,868,040$1,839,120 in interest income on such cash holdings.and/or cash equivalents. Based on USOF’s average daily total net assets, this was equivalent to an annualized yield of 1.85%0.23%. USOF did not purchase Treasuries during the three months ended September 30, 2008March 31, 2009 and held all of its funds inonly cash and/or cash equivalents during this time period. Interest rates on short-term investments in the United States, including cash, cash equivalents, and short-term Treasuries, were sharply lower during the three months ended September 30, 2009March 31, 2010 compared to the same time period in 2008.2009. As a result, the amount of interest earned by USOF as a percentage of total net assets was lower during the three months ended September 30, 2009March 31, 2010 compared to the three months ended September 30, 2008.March 31, 2009.
18
Tracking USOF’s Benchmark
USOF seeks to manage its portfolio such that changes in its average daily NAV, on a percentage basis, closely track the changes in the average daily price of the Benchmark Oil Futures Contract, also on a percentage basis. Specifically, USOF seeks to manage the portfolio such that over any rolling period of 30 valuation days, the average daily change in theits NAV is within a range of 90% to 110% (0.9 to 1.1) of the average daily change in the price of the Benchmark Oil Futures Contract. As an example, if the average daily movement of the price of the Benchmark Oil Futures Contract for a particular 30-day time period was 0.5% per day, USOF management would attempt to manage the portfolio such that the average daily movement of the NAV during that same time period fell between 0.45% and 0.55% (i.e., between 0.9 and 1.1 of the benchmark’s results). USOF’s portfolio management goals do not include trying to make the nominal price of USOF’s NAV equal to the nominal price of the current Benchmark Oil Futures Contract or the spot price for light, sweet crude oil. Management believes that it is not practical to manage the portfolio to achieve such an investment goal when investing in listed Oil Futures Contracts.
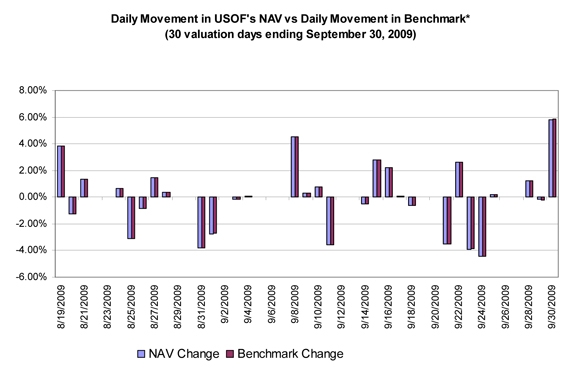
For the 30 valuation days ended September 30, 2009,March 31, 2010, the simple average daily change in the Benchmark Oil Futures Contract was -0.011%0.244%, while the simple average daily change in the NAV of USOF over the same time period was -0.014%0.242%. The average daily difference was -0.002% (or 0.2-0.00002 basis points, where 1 basis point equals 1/100 of 1%). As a percentage of the daily movement of the Benchmark Oil Futures Contract, the average error in daily tracking by the NAV was -1.018%-3.497%, meaning that over this time period USOF’s tracking error was within the plus or minus 10% range established as its benchmark tracking goal. A significant portion of the level of USOF’s relative tracking error as a percentage of the benchmark move can be explained by periods of flat price returns. For example, on March 11th, 2010 the return on the benchmark was 0.006%, while the return on USOF was 0.000%. While the absolute difference between USOF’s return and the benchmark contract’s return was only -0.006%, the error as a percentage of the benchmark change was 100%. This caused USOF’s running 30-day tracking error to fall from 0.904% above the average 30-day benchmark return to -2.427% below the average 30-day benchmark return. As discussed above, the absolute difference between USOF’s return and the benchmark return is very small. The first chart below shows the daily movement of USOF’s NAV versus the daily movement of the Benchmark Oil Futures Contract for the 30-day period ended September 30, 2009.March 31, 2010.
19

*PAST PERFORMANCE IS NOT NECESSARILY INDICATIVE OF FUTURE RESULTS
*PAST PERFORMANCE IS NOT NECESSARILY INDICATIVE OF FUTURE RESULTS
20

Since the offering of USOF’s units to the public on April 10, 2006 to September 30, 2009,March 31, 2010, the simple average daily change in the Benchmark Oil Futures Contract was - -0.039%-0.21%, while the simple average daily change in the NAV of USOF over the same time period was -0.033%-0.016%. The average daily difference was 0.007%-0.005% (or 0.7-0.5 basis points, where 1 basis point equals 1/100 of 1%). As a percentage of the daily movement of the Benchmark Oil Futures Contract, the average error in daily tracking by the NAV was 1.759%1.393%, meaning that over this time period USOF’s tracking error was within the plus or minus 10% range established as its benchmark tracking goal.
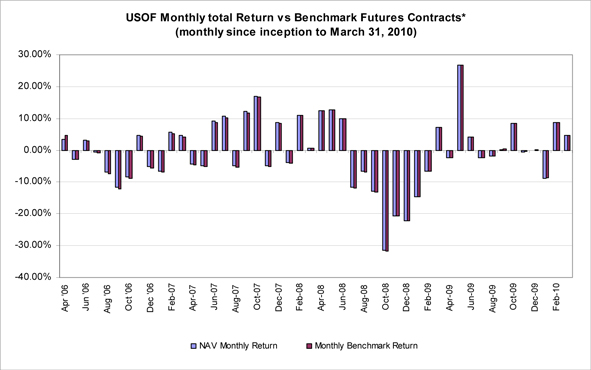
An alternative tracking measurement of the return performance of USOF versus the return of its Benchmark Oil Futures Contract can be calculated by comparing the actual return of USOF, measured by changes in its NAV, versus the expected changes in its NAV under the assumption that USOF’s returns had been exactly the same as the daily changes in its Benchmark Oil Futures Contract.
For the ninethree months ended September 30, 2009,March 31, 2010, the actual total return of USOF as measured by changes in its NAV was 5.83%3.65%. This is based on an initial NAV of $34.31$39.16 on December 31, 20082009 and an ending NAV as of September 30, 2009March 31, 2010 of $36.31.$40.59. During this time period, USOF made no distributions to its unitholders. However, if USOF’s daily changes in its NAV had instead exactly tracked the changes in the daily return of the Benchmark Oil Futures Contract, USOF would have ended the thirdfirst quarter of 20092010 with an estimated NAV of $36.47,$40.65, for a total return over the relevant time period of 6.30%3.81%. The difference between the actual NAV total return of USOF of 5.83%3.65% and the expected total return based on the Benchmark Oil Futures Contract of 6.30%3.81% was an error over the time period of 0.47%-0.16%, which is to say that USOF’s actual total return trailed the benchmark result by that percentage. Management believes that a portion of the difference between the actual return and the expected benchmark return can be attributed to the net impact of the expenses and the interest that USOF collects on its cash and cash equivalent holdings. During the ninethree months ended September 30, 2009,March 31, 2010, USOF received interest income of $3,959,228,$106,693, which is equivalent to a weighted average interest rate of 0.20%0.02% for the nine months ended September 30, 2009.such period. In addition, during the ninethree months ended September 30, 2009,March 31, 2010, USOF also collected $308,000$52,000 from its authorized purchasers (“Authorized Purchasers”) creating or redeeming baskets of units. This income also contributed to USOF’s actual return. However, if the total assets of USOF continue to increase, management believes that the impact on total returns of these fees from creations and redemptions will diminish as a percentage of the total return. During the ninethree months ended September 30, 2009,March 31, 2010, USOF incurred total expenses of $16,148,436.$3,526,778. Income from interest and Authorized Purchaser collections net of expenses was $(11,881,208)$(3,368,084), which is equivalent to a weighted average net interest rate of -0.59%(0.67)% for the ninethree months ended September 30, 2009.
March 31, 2010.
By comparison, for the ninethree months ended September 30, 2008,March 31, 2009, the actual total return of USOF as measured by changes in its NAV was 7.07%-14.43%. This was based on an initial NAV of $75.82$34.31 on December 31, 20072008 and an ending NAV as of September 30, 2008March 31, 2009 of $81.18.$29.36. During this time period, USOF made no distributions to its unitholders. However, if USOF’s daily changes in its NAV had instead exactly tracked the changes in the daily return of the Benchmark Oil Futures Contract, USOF would have ended the thirdfirst quarter of 20082009 with an estimated NAV of $80.46,$29.40, for a total return over the relevant time period of 6.13%-14.30%. The difference between the actual NAV total return of USOF of 7.07%-14.43% and the expected total return based on the Benchmark Oil Futures Contract of 6.13%-14.30% was an error over the time period of 0.94%-0.13%, which is to say that USOF’s actual total return exceeded the benchmark result by that percentage. Management believes that a portion of the difference between the actual return and the expected benchmark return can be attributed to the impact of the interest that USOF collected on its cash and cash equivalent holdings. During the ninethree months ended September 30, 2008,March 31, 2009, USOF received interest income of $12,213,272,$1,839,120, which is equivalent to a weighted average interest rate of 2.01%0.23% for the nine months ended September 30, 2008.such period. In addition, during the ninethree months ended September 30, 2008,March 31, 2009, USOF also collected $227,000$156,000 from Authorized Purchasers creating or redeeming baskets of units. This income also contributed to USOF’s actual return. During the ninethree months ended September 30, 2008,March 31, 2009, USOF incurred total expenses of $5,512,546.$6,366,485. Income from interest and Authorized Purchaser collections net of expenses was $6,927,726,$(4,371,365), which is equivalent to a weighted average net interest rate of 1.14%(0.55)% for the ninethree months ended September 30, 2008. This income also contributed to USOF’s actual return exceeding the benchmark results.March 31, 2009.
There are currently three factors that have impacted or are most likely to impact USOF’s ability to accurately track its Benchmark Oil Futures Contract.
21
First, USOF may buy or sell its holdings in the then current Benchmark Oil Futures Contract at a price other than the closing settlement price of that contract on the day during which USOF executes the trade. In that case, USOF may pay a price that is higher, or lower, than that of the Benchmark Oil Futures Contract, which could cause the changes in the daily NAV of USOF to either be too high or too low relative to the changes in the Benchmark Oil Futures Contract. During the ninethree months ended September 30, 2009,March 31, 2010, management attempted to minimize the effect of these transactions by seeking to execute its purchase or sale of the Benchmark Oil Futures Contract at, or as close as possible to, the end of the day settlement price. However, it may not always be possible for USOF to obtain the closing settlement price and there is no assurance that failure to obtain the closing settlement price in the future will not adversely impact USOF’s attempt to track the Benchmark Oil Futures Contract over time.
Second, USOF earns interest on its cash, cash equivalents and Treasury holdings. USOF is not required to distribute any portion of its income to its unitholders and did not make any distributions to unitholders during the ninethree months ended September 30, 2009.March 31, 2010. Interest payments, and any other income, were retained within the portfolio and added to USOF’s NAV. When this income exceeds the level of USOF’s expenses for its management fee, brokerage commissions and other expenses (including ongoing registration fees, licensing fees and the fees and expenses of the independent directors of the General Partner), USOF will realize a net yield that will tend to cause daily changes in the NAV of USOF to track slightly higher than daily changes in the Benchmark Oil Futures Contract. During the ninethree months ended September 30, 2009,March 31, 2010, USOF earned, on an annualized basis, approximately 0.20%0.02% on its cash holdings. It also incurred cash expenses on an annualized basis of 0.45% for management fees and approximately 0.16%0.09% in brokerage commission costs related to the purchase and sale of futures contracts, and 0.19%0.16% for other expenses. The foregoing fees and expenses resulted in a net yield on an annualized basis of approximately -0.60%(0.68)% and affected USOF’s ability to track its benchmark. If short-term interest rates rise above the current levels, the level of deviation created by the yield would decrease. Conversely, if short-term interest rates were to decline, the amount of error created by the yield would increase. When short-term yields drop to a level lower than the combined expenses of the management fee and the brokerage commissions, then the tracking error becomes a negative number and would tend to cause the daily returns of the NAV to underperform the daily returns of the Benchmark Oil Futures Contract.
Third, USOF may hold Other Oil Interests in its portfolio that may fail to closely track the Benchmark Oil Futures Contract’s total return movements. In that case, the error in tracking the Benchmark Oil Futures Contract could result in daily changes in the NAV of USOF that are either too high, or too low, relative to the daily changes in the Benchmark Oil Futures Contract. During the ninethree months ended September 30, 2009,March 31, 2010, USOF did not hold any Other Oil Interests. Due,If USOF increases in part,size, and due to the increased size of USOF over the last several quarters and its obligations to comply with regulatory limits, USOF is likely tomay invest in Other Oil Interests which may have the effect of increasing transaction related expenses and result in increased tracking error.
Term Structure of Crude Oil Futures Prices and the Impact on Total Returns. Several factors determine the total return from investing in a futures contract position. One factor that impacts the total return that will result from investing in near month crude oil futures contracts and “rolling” those contracts forward each month is the price relationship between the current near month contract and the next month contract. For example, if the price of the near month contract is higher than the next month contract (a situation referred to as “backwardation” in the futures market), then absent any other change there is a tendency for the price of a next month contract to rise in value as it becomes the near month contract and approaches expiration. Conversely, if the price of a near month contract is lower than the next month contract (a situation referred to as “contango” in the futures market), then absent any other change there is a tendency for the price of a next month contract to decline in value as it becomes the near month contract and approaches expiration.
As an example, assume that the price of crude oil for immediate delivery (the “spot” price), was $50 per barrel, and the value of a position in the near month futures contract was also $50. Over time, the price of the barrel of crude oil will fluctuate based on a number of market factors, including demand for oil relative to its supply. The value of the near month contract will likewise fluctuate in reaction to a number of market factors. If investors seek to maintain their position in a near month contract and not take delivery of the oil, every month they must sell their current near month contract as it approaches expiration and invest in the next month contract.
22
If the futures market is in backwardation, e.g., when the expected price of crude oil in the future would be less, the investor would be buying a next month contract for a lower price than the current near month contract. Hypothetically, and assuming no other changes to either prevailing crude oil prices or the price relationship between the spot price, the near month contract and the next month contract (and ignoring the impact of commission costs and the interest earned on Treasuries, cash and/or cash equivalents), the value of the next month contract would rise as it approaches expiration and becomes the new near month contract. In this example, the value of the $50 investment would tend to rise faster than the spot price of crude oil, or fall slower. As a result, it would be possible in this hypothetical example for the spot price of spot crude oil to have risen to $60 after some period of time, while the value of the investment in the futures contract would have risen to $65, assuming backwardation is large enough or enough time has elapsed. Similarly, the spot price of crude oil could have fallen to $40 while the value of an investment in the futures contract could have fallen to only $45. Over time, if backwardation remained constant, the difference would continue to increase.
If the futures market is in contango, the investor would be buying a next month contract for a higher price than the current near month contract. Hypothetically, and assuming no other changes to either prevailing crude oil prices or the price relationship between the spot price, the near month contract and the next month contract (and ignoring the impact of commission costs and the interest earned on cash), the value of the next month contract would fall as it approaches expiration and becomes the new near month contract. In this example, it would mean that the value of the $50 investment would tend to rise slower than the spot price of crude oil, or fall faster. As a result, it would be possible in this hypothetical example for the spot price of crude oil to have risen to $60 after some period of time, while the value of the investment in the futures contract will have risen to only $55, assuming contango is large enough or enough time has elapsed. Similarly, the spot price of crude oil could have fallen to $45 while the value of an investment in the futures contract could have fallen to $40. Over time, if contango remained constant, the difference would continue to increase.
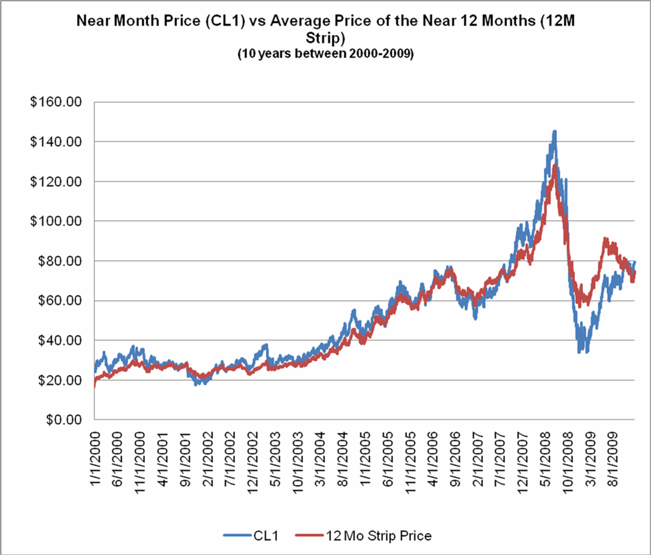
The chart below compares the price of the near month contract to the average price of the near 12 monthsmonth contracts over the last 10 years (1999-2008)(2000-2009) for light, sweet crude oil. When the price of the near month contract is higher than the average price of the near 12 month contracts, the market would be described as being in backwardation. When the price of the near month contract is lower than the average price of the near 12 month contracts, the market would be described as being in contango. Although the prices of the near month contract and the average price of the near 12 month contracts do tend to move up or down together, it can be seen that at times the near month prices are clearly higher than the average price of the near 12 month contracts (backwardation), and other times they are below the average price of the near 12 month contracts (contango).
23

*PAST PERFORMANCE IS NOT NECESSARILY INDICATIVE OF FUTURE RESULTS
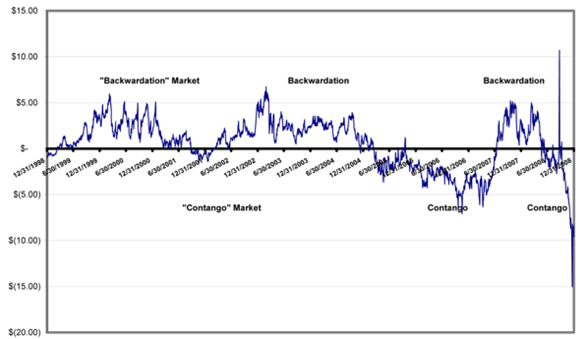
An alternative way to view the same data is to subtract the dollar price of the average dollar price of the near 12 month contracts for light, sweet crude oil from the dollar price of the near month contract for light, sweet crude oil. If the resulting number is a positive number, then the near month price is higher than the average price of the near 12 months and the market could be described as being in backwardation. If the resulting number is a negative number, then the near month price is lower than the average price of the near 12 months and the market could be described as being in contango. The chart below shows the results from subtracting the average dollar price of the near 12 month contracts from the near month price for the 10 year period between 19992000 and 2008.2009.
24

*PAST PERFORMANCE IS NOT NECESSARILY INDICATIVE OF FUTURE RESULTS
An investment in a portfolio that involved owning only the near month contract would likely produce a different result than an investment in a portfolio that owned an equal number of each of the near 12 months’ worth of contracts. Generally speaking, when the crude oil futures market is in backwardation, the near month only portfolio would tend to have a higher total return than the 12 month portfolio. Conversely, if the crude oil futures market was in contango, the portfolio containing 12 months’ worth of contracts would tend to outperform the near month only portfolio. The chart below shows the annual results of owning a portfolio consisting of the near month contract and a portfolio containing the near 12 months’ worth of contracts. In addition, the chart shows the annual change in the spot price of light, sweet crude oil. In this example, each month, the near month only portfolio would sell the near month contract at expiration and buy the next month out contract. The portfolio holding an equal number of the near 12 months’ worth of contracts would sell the near month contract at expiration and replace it with the contract that becomes the new twelfth month contract.
25


*PAST PERFORMANCE IS NOT NECESSARILY INDICATIVE OF FUTURE RESULTS
As seen in the chart above, there have been periods of both positive and negative annual total returns for both hypothetical portfolios over the last 10 years. In addition, there have been periods during which the near month only approach had higher returns, and periods where the 12 month approach had higher total returns. The above chart does not represent the performance history of USOF or any affiliated funds.
Historically, the crude oil futures markets have experienced periods of contango and backwardation, with backwardation being in place more often than contango. During 2006 and the first half of 2007, these markets have experienced contango. However, starting early in the third quarter of 2007, the crude oil futures market moved into backwardation. The crude oil markets remained in backwardation until late in the second quarter of 2008 when they moved into contango. The crude oil markets remained in contango until late in the third quarter of 2008, when the markets moved into backwardation. Early in the fourth quarter of 2008, the crude oil market moved back into contango and remained in contango for the balance of 2008. Throughout the first nine months of 2009, the crude oil market remained in contango. During parts of January and February 2009, the level of contango was unusually steep. Crude oil inventories, which reached historic levels in January and February 2009 and which appear to be the primary cause of the steep level of contango, began to drop in March 2009 and for the balance of 2009 and the first halfbeginning of 2009.2010. The crude oil futurefutures market remained in contango through September 30, 2009.
the end of March 2010.
Periods of contango or backwardation do not materially impact USOF’s investment objective of having the percentage changes in its per unit NAV track the percentage changes in the price of the Benchmark Oil Futures Contract since the impact of backwardation and contango tended to equally impact the percentage changes in price of both USOF’s units and the Benchmark Oil Futures Contract. It is impossible to predict with any degree of certainty whether backwardation or contango will occur in the future. It is likely that both conditions will occur during different periods.
26
Crude Oil Market. During the ninethree months ended September 30, 2009,March 31, 2010, crude oil prices were impacted by several factors. On the consumption side, demand remained weakimproved inside and outside the United States as global economic growth, including emerging economies such as China and India, remained weak to negativeimproved for the first quarter of the year. On the supply side, efforts to reduce production by the Organization of the Petroleum Exporting Countries to more closely match global consumption were only partially successful. This divergence between production and consumption has led to large build-ups in crude oil inventories and contributed to weak oil prices. However, crudeCrude oil prices did finish the thirdfirst quarter of 20092010 approximately 58.32%5.54% higher than at the beginning of the year, as investors looked forward to continued improvements in the global economy. Management believes, however, that should the global economic situation remain weak,cease to improve, or decline, there is a meaningful possibility that crude oil prices could retreat from their current levels.
Crude Oil Price Movements in Comparison to otherOther Energy Commodities and Investment Categories. The General Partner believes that investors frequently measure the degree to which prices or total returns of one investment or asset class move up or down in value in concert with another investment or asset class. Statistically, such a measure is usually done by measuring the correlation of the price movements of the two different investments or asset classes over some period of time. The correlation is scaled between 1 and -1, where 1 indicates that the two investment options move up or down in price or value together, known as “positive correlation,” and -1 indicating that they move in completely opposite directions, known as “negative correlation.” A correlation of 0 would mean that the movements of the two are neither positively or negatively correlated, known as “non-correlation.” That is, the investment options sometimes move up and down together and other times move in opposite directions.
For the ten year time period between 19982000 and 2008,2009, the chart below compares the monthly movements of crude oil prices versus the monthly movements of the prices of several other energy commodities, such as natural gas, heating oil, and unleaded gasoline, as well as several major non-commodity investment asset classes, such as large cap U.S. equities, U.S. government bonds and global equities. It can be seen that over this particular time period, the movement of crude oil on a monthly basis was not strongly correlated, positively or negatively, with the movements of large cap U.S. equities, U.S. government bonds or global equities. However, movements in crude oil had a strong positive correlation to movements in heating oil and unleaded gasoline. Finally, crude oil had a positive, but weaker, correlation with natural gas.
10 Year Correlation Matrix 1998-2008 | Large Cap U.S. Equities (S&P 500) | U.S. Govt. Bonds (EFFAS U.S. Government Bond Index) | Global Equities (FTSE World Index) | Unleaded Gasoline | Natural Gas | Heating Oil | Crude Oil | |||||||||||||||||||||||||||||||||||||||||||||||||
10 Year Correlation Matrix 2000-2009 | Large Cap U.S. Equities (S&P 500) | U.S. Govt. Bonds (EFFAS U.S. Government Bond Index) | Global Equities (FTSE World Index) | Unleaded Gasoline | Natural Gas | Heating Oil | Crude Oil | |||||||||||||||||||||||||||||||||||||||||||||||||
| Large Cap U.S. Equities (S&P 500) | 1.000 | -0.223 | 0.936 | 0.266 | 0.045 | 0.003 | 0.063 | 1.000 | -0.259 | 0.966 | 0.135 | 0.087 | 0.023 | 0.152 | ||||||||||||||||||||||||||||||||||||||||||
| U.S. Govt. Bonds (EFFAS U.S. Government Bond Index) | 1.000 | -0.214 | -0.134 | 0.054 | 0.037 | -0.29 | 1.000 | -0.237 | -0.214 | -0.078 | 0.128 | -0.127 | ||||||||||||||||||||||||||||||||||||||||||||
| Global Equities (FTSE World Index) | 1.000 | 0.384 | 0.072 | 0.084 | 0.155 | 1.000 | 0.196 | 0.165 | 0.084 | 0.246 | ||||||||||||||||||||||||||||||||||||||||||||||
| Unleaded Gasoline | 1.000 | 0.254 | 0.787 | 0.747 | 1.000 | 0.613 | 0.257 | 0.724 | ||||||||||||||||||||||||||||||||||||||||||||||||
| Natural Gas | 1.000 | 0.394 | 0.292 | 1.000 | 0.466 | 0.334 | ||||||||||||||||||||||||||||||||||||||||||||||||||
| Heating Oil | 1.000 | 0.738 | 1.000 | 0.783 | ||||||||||||||||||||||||||||||||||||||||||||||||||||
| Crude Oil | 1.000 | 1.000 | ||||||||||||||||||||||||||||||||||||||||||||||||||||||
| source: Bloomberg, NYMEX | ||||||||||||||||||||||||||||||||||||||||||||||||||||||||
source: Bloomberg, NYMEX
PAST PERFORMANCE IS NOT NECESSARILY INDICATIVE OF FUTURE RESULTS
The chart below covers a more recent, but much shorter, range of dates than the above chart. Over the one year period ended September 30, 2009,March 31, 2010, crude oil continued to have a strong positive correlation with heating oil and unleaded gasoline. During this period, it also had a slightly weaker correlation with the movements of natural gas than it had displayed over the ten year period ended December 31, 2008.2009. Notably, the correlation between crude oil and both large cap U.S. equities and global equities, which had been essentially non-correlated over the ten year period ended December 31, 2008,2009, displayed results that indicated that they had a mildly positive correlation over this shorter time period, particularly due to the recent downturn in the U.S. economy. Finally, the results showed that crude oil and U.S. government bonds, which had essentially been non-correlated for the ten year period ended December 31, 2008,2009, were weakly negatively correlated over this more recent time period.
Correlation Matrix – 12 months ended September 30, 2009 | Large Cap U.S. Equities (S&P 500) | U.S. Govt. Bonds (EFFAS U.S. Government Bond Index) | Global Equities (FTSE World Index) | Unleaded Gasoline | Heating Oil | Natural Gas | Crude Oil | |||||||||||||||||||||||||||||||||||||||||||||||||
12 months ended March 31, 2010 | Large Cap U.S. Equities (S&P 500) | U.S. Gov't Bonds (EFFAS U.S. Govt Bond Index) | Global Equities (FTSE World Index) | Unleaded Gasoline | Heating Oil | Natural Gas | Crude Oil | |||||||||||||||||||||||||||||||||||||||||||||||||
| Large Cap U.S. Equities (S&P 500) | 1.000 | 0.088 | 0.988 | 0.522 | 0.694 | 0.205 | 0.706 | 1.000 | -0.086 | 0.952 | 0.317 | 0.204 | -0.146 | 0.243 | ||||||||||||||||||||||||||||||||||||||||||
| U.S. Govt. Bonds (EFFAS U.S. Government Bond Index) | 1.000 | 0.102 | -0.423 | -0.303 | 0.082 | -0.313 | ||||||||||||||||||||||||||||||||||||||||||||||||||
| U.S. Gov't Bonds (EFFAS U.S. Govt Bond Index) | 1.000 | -0.229 | -0.316 | -0.321 | -0.088 | -0.273 | ||||||||||||||||||||||||||||||||||||||||||||||||||
| Global Equities (FTSE World Index) | 1.000 | 0.552 | 0.697 | 0.205 | 0.705 | 1.000 | 0.425 | 0.329 | -0.056 | 0.372 | ||||||||||||||||||||||||||||||||||||||||||||||
| Unleaded Gasoline | 1.000 | 0.865 | -0.089 | 0.768 | 1.000 | 0.856 | -0.267 | 0.848 | ||||||||||||||||||||||||||||||||||||||||||||||||
| Heating Oil | 1.000 | 0.252 | 0.810 | 1.000 | 0.152 | 0.937 | ||||||||||||||||||||||||||||||||||||||||||||||||||
| Natural Gas | 1.000 | 0.193 | 1.000 | 0.098 | ||||||||||||||||||||||||||||||||||||||||||||||||||||
| Crude Oil | 1.000 | 1.000 | ||||||||||||||||||||||||||||||||||||||||||||||||||||||
| source: Bloomberg, NYMEX | ||||||||||||||||||||||||||||||||||||||||||||||||||||||||
| Source: Bloomberg, NYMEX | ||||||||||||||||||||||||||||||||||||||||||||||||||||||||
PAST PERFORMANCE IS NOT NECESSARILY INDICATIVE OF FUTURE RESULTS
Investors are cautioned that the historical price relationships between crude oil and various other energy commodities, as well as other investment asset classes, as measured by correlation may not be reliable predictors of future price movements and correlation results. The results pictured above would have been different if a different range of dates had been selected. The General Partner believes that crude oil has historically not demonstrated a strong correlation with equities or bonds over long periods of time. However, the General Partner also believes that in the future it is possible that crude oil could have long term correlation results that indicate prices of crude oil more closely track the movements of equities or bonds. In addition, the General Partner believes that, when measured over time periods shorter than ten years, there will always be some periods where the correlation of crude oil to equities and bonds will be either more strongly positively correlated or more strongly negatively correlated than the long term historical results suggest.
The correlations between crude oil, natural gas, heating oil and gasoline are relevant because the General Partner endeavors to invest USOF’s assets in Oil Futures Contracts and Other Crude Oil-Related InvestmentsOil Interests so that daily changes in percentage terms in USOF’s NAV correlate as closely as possible with daily changes in percentage terms in the price of the Benchmark Oil Futures Contract. If certain other fuel-based commodity futures contracts do not closely correlate with the Oil Futures Contract, then their use could lead to greater tracking error. As noted above, the General Partner also believes that the changes in percentage terms in the price of the Benchmark Oil Futures Contract will closely correlate with changes in percentage terms in the spot price of light, sweet crude oil.
Critical Accounting Policies
Preparation of the condensed financial statements and related disclosures in compliance with accounting principles generally accepted in the United States of America requires the application of appropriate accounting rules and guidance, as well as the use of estimates. USOF’s application of these policies involves judgments and actual results may differ from the estimates used.
28
The General Partner has evaluated the nature and types of estimates that it makes in preparing USOF’s condensed financial statements and related disclosures and has determined that the valuation of its investments which are not traded on a United States or internationally recognized futures exchange (such as forward contracts and over-the-counter contracts) involves a critical accounting policy. The values which are used by USOF for its forwardfutures contracts are provided by its commodity broker who uses market prices when available, while over-the-counter contracts are valued based on the present value of estimated future cash flows that would be received from or paid to a third party in settlement of these derivative contracts prior to their delivery date and valued on a daily basis. In addition, USOF estimates interest income on a daily basis using prevailing interest rates earned on its cash and cash equivalents. These estimates are adjusted to the actual amount received on a monthly basis and the difference, if any, is not considered material.
Liquidity and Capital Resources
USOF has not made, and does not anticipate making, use of borrowings or other lines of credit to meet its obligations. USOF has met, and it is anticipated that USOF will continue to meet, its liquidity needs in the normal course of business from the proceeds of the sale of its investments, or from the Treasuries, cash and/or cash equivalents that it intends to hold at all times. USOF’s liquidity needs include: redeeming units, providing margin deposits for its existing Oil Futures Contracts or the purchase of additional Oil Futures Contracts and posting collateral for its over-the-counter contracts and payment of its expenses, summarized below under “Contractual Obligations.”
USOF currently generates cash primarily from (i) the sale of baskets consisting of 100,000 units (“Creation Baskets”) and (ii) interest earned on Treasuries, cash and/or cash equivalents. USOF has allocated substantially all of its net assets to trading in Oil Interests. USOF invests in Oil Interests to the fullest extent possible without being leveraged or unable to satisfy its current or potential margin or collateral obligations with respect to its investments in Oil Futures Contracts and Other Oil Interests. A significant portion of the NAV is held in cash and cash equivalents that are used as margin and as collateral for USOF’s trading in Oil Interests. The balance of the net assets is held in USOF’s account at its custodian bank. Interest earned on USOF’s interest-bearing funds is paid to USOF. In prior periods, the amount of cash earned by USOF from the sale of Creation Baskets and from interest earned has exceeded the amount of cash required to pay USOF’s expenses. However, during the ninethree months ended September 30, 2009,March 31, 2010, USOF’s expenses exceeded the interest income USOF earned and the cash earned by the sale of Creation Baskets. During the ninethree months ended September 30, 2009,March 31, 2010, USOF was forced to use other assets to pay cash expenses, which could cause a drop in USOF’s NAV over time.
To the extent expenses have exceeded interest income, USOF’s NAV will be negatively impacted.
USOF’s investmentinvestments in Oil Interests may be subject to periods of illiquidity because of market conditions, regulatory considerations and other reasons. For example, most commodity exchanges limit the fluctuations in futures contracts prices during a single day by regulations referred to as “daily limits.” During a single day, no trades may be executed at prices beyond the daily limit. Once the price of a futures contract has increased or decreased by an amount equal to the daily limit, positions in the contracts can neither be taken nor liquidated unless the traders are willing to effect trades at or within the specified daily limit. Such market conditions could prevent USOF from promptly liquidating its positions in Oil Futures Contracts. During the ninethree months ended September 30, 2009,March 31, 2010, USOF was not forced to purchase or liquidate any of its positions while daily limits were in effect; however, USOF cannot predict whether such an event may occur in the future.
Since March 23, 2007, USOF has been responsible for expenses relating to (i) management fees, (ii) brokerage fees and commissions, (iii) licensing fees for the use of intellectual property, (iv) ongoing registration expenses in connection with offers and sales of its units subsequent to the initial offering, (v) taxes and other expenses, including certain tax reporting costs, (vi) fees and expenses of the independent directors of the General Partner and (vii) other extraordinary expenses not in the ordinary course of business, while the General Partner has been responsible for expenses relating to the fees of USOF’s marketing agent, administrator and custodian and registration expenses relating to the initial offering of units. If the General Partner and USOF are unsuccessful in raising sufficient funds to cover these respective expenses or in locating any other source of funding, USOF will terminate and investors may lose all or part of their investment.
29
Market Risk
Trading in Oil Futures Contracts and Other Oil Interests, such as forwards, involves USOF entering into contractual commitments to purchase or sell oil at a specified date in the future. The aggregate market value of the contracts will significantly exceed USOF’s future cash requirements since USOF intends to close out its open positions prior to settlement. As a result, USOF is generally only subject to the risk of loss arising from the change in value of the contracts. USOF considers the “fair value” of its derivative instruments to be the unrealized gain or loss on the contracts. The market risk associated with USOF’s commitments to purchase oil is limited to the aggregate market value of the contracts held. However, should USOF enter into a contractual commitment to sell oil, it would be required to make delivery of the oil at the contract price, repurchase the contract at prevailing prices or settle in cash. Since there are no limits on the future price of oil, the market risk to USOF could be unlimited.
USOF’s exposure to market risk depends on a number of factors, including the markets for oil, the volatility of interest rates and foreign exchange rates, the liquidity of the Oil Futures Contracts and Other Oil Interests markets and the relationships among the contracts held by USOF. Drastic market occurrences could ultimately lead to the loss of all or substantially all of an investor’s capital.
Credit Risk
When USOF enters into Oil Futures Contracts and Other Oil Interests, it is exposed to the credit risk that the counterparty will not be able to meet its obligations. The counterparty for the Oil Futures Contracts traded on the NYMEX and on most other futures exchanges is the clearinghouse associated with the particular exchange. In general, in addition to margin required to be posted by the exchange or clearinghouse in connection with trades on the exchange or through the clearinghouse, clearinghouses are backed by their members who may be required to share in the financial burden resulting from the nonperformance of one of their members and, therefore, this additional member support should significantly reduce credit risk. Some foreign exchanges are not backed by their clearinghouse members but may be backed by a consortium of banks or other financial institutions. There can be no assurance that any counterparty, clearinghouse, or their members or their financial backers will satisfy their obligations to USOF in such circumstances.
The General Partner attempts to manage the credit risk of USOF by following various trading limitations and policies. In particular, USOF generally posts margin and/or holds liquid assets that are approximately equal to the market value of its obligations to counterparties under the Oil Futures Contracts and Other Oil Interests it holds. The General Partner has implemented procedures that include, but are not limited to, executing and clearing trades only with creditworthy parties and/or requiring the posting of collateral or margin by such parties for the benefit of USOF to limit its credit exposure. UBS Securities LLC, USOF’s commodity broker, or any other broker that may be retained by USOF in the future, when acting as USOF’s futures commission merchant in accepting orders to purchase or sell Oil Futures Contracts on United States exchanges, is required by CFTC regulations to separately account for and segregate as belonging to USOF, all assets of USOF relating to domestic Oil Futures Contracts trading. These futures commission merchants are not allowed to commingle USOF’s assets with its other assets. In addition, the CFTC requires commodity brokers to hold in a secure account USOF’s assets related to foreign Oil Futures Contracts trading. During the ninethree months ended September 30, 2009,March 31, 2010, the only foreign exchange on which USOF made investments was the ICE Futures, which is a London based futures exchange. Those crude oil contracts are denominated in U.S. dollars.
As of September 30, 2009,March 31, 2010, USOF had deposits in domestic and foreign financial institutions, including cash investments in money market funds, in the amount of $2,324,411,842.$1,744,588,808. This amount is subject to loss should these institutions cease operations.
30
Off Balance Sheet Financing
As of September 30, 2009,March 31, 2010, USOF has no loan guarantee, credit support or other off-balance sheet arrangements of any kind other than agreements entered into in the normal course of business, which may include indemnification provisions relating to certain risks that service providers undertake in performing services which are in the best interests of USOF. While USOF’s exposure under these indemnification provisions cannot be estimated, they are not expected to have a material impact on USOF’s financial position.
Redemption Basket Obligation
In order to meet its investment objective and pay its contractual obligations described below, USOF requires liquidity to redeem units, which redemptions must be in blocks of 100,000 units called “Redemption Baskets”. USOF has to date satisfied this obligation by paying from the cash or cash equivalents it holds or through the sale of its Treasuries in an amount proportionate to the number of units being redeemed.
Contractual Obligations
USOF’s primary contractual obligations are with the General Partner. In return for its services, the General Partner is entitled to a management fee calculated monthly as a fixed percentage of USOF’s NAV, currently 0.45% of NAV on its average daily net assets.
The General Partner agreed to pay the start-up costs associated with the formation of USOF, primarily its legal, accounting and other costs in connection with the General Partner’s registration with the CFTC as a CPO and the registration and listing of USOF and its units with the SEC, FINRA and the AMEX, respectively. However, followingsince USOF’s initial offering of units, offering costs incurred in connection with registering and listing additional units of USOF are directly borne on an ongoing basis by USOF, and not by the General Partner.
The General Partner pays the fees of USOF’s marketing agent, ALPS Distributors, Inc., and the fees of the custodian and transfer agent, Brown Brothers Harriman & Co. (“BBH&Co.”), as well as BBH&Co.’s fees for performing administrative services, including those in connection with the preparation of USOF’s condensed financial statements and its SEC and CFTC reports. The General Partner and USOF have also entered into a licensing agreement with the NYMEX pursuant to which USOF and the affiliated funds managed by the General Partner pay a licensing fee to the NYMEX. USOF also pays the fees and expenses associated with its tax accounting and reporting requirements with the exception of certain initial implementation service fees and base service fees which are paid by the General Partner.requirements.
In addition to the General Partner’s management fee, USOF pays its brokerage fees (including fees to a futures commission merchant), over-the-counter dealer spreads, any licensing fees for the use of intellectual property, and, subsequent to the initial offering, registration and other fees paid to the SEC, FINRA, or other regulatory agencies in connection with the offer and sale of units, as well as legal, printing, accounting and other expenses associated therewith, and extraordinary expenses. The latter are expenses not incurred in the ordinary course of USOF’s business, including expenses relating to the indemnification of any person against liabilities and obligations to the extent permitted by law and under the LP Agreement, the bringing or defending of actions in law or in equity or otherwise conducting litigation and incurring legal expenses and the settlement of claims and litigation. Commission payments to a futures commission merchant are on a contract-by-contract, or round turn, basis. USOF also pays a portion of the fees and expenses of the independent directors of the General Partner. See Note 3 to the Notes to Condensed Financial Statements (Unaudited).
The parties cannot anticipate the amount of payments that will be required under these arrangements for future periods, as USOF’s NAVs and trading levels to meet its investment objectives will not be known until a future date. These agreements are effective for a specific term agreed upon by the parties with an option to renew, or, in some cases, are in effect for the duration of USOF’s existence. Either party may terminate these agreements earlier for certain reasons described in the agreements.
On March 31, 2010, USOF's portfolio consisted of 2,000 Crude Oil Financial Futures WS Contracts traded on NYMEX, 5,854 Crude Oil Futures CL Contracts traded on NYMEX and 12,500 WTI Crude Oil Futures traded on the ICE Futures. For a list of USOF's current holdings, please see USOF's website at www.unitedstatesoilfund.com.
Item 3. Quantitative and Qualitative Disclosures About Market Risk.
Over-the-Counter Derivatives
In the future, USOF may purchase over-the-counter contracts. Unlike most of the exchange-traded Oil Futures Contracts or exchange-traded options on such futures, each party to an over-the-counter contract bears the credit risk that the other party may not be able to perform its obligations under its contract.
31
Some crude oil-based derivatives transactions contain fairly generic terms and conditions and are available from a wide range of participants. Other crude oil-based derivatives have highly customized terms and conditions and are not as widely available. Many of these over-the-counter contracts are cash-settled forwards for the future delivery of crude oil- or petroleum-based fuels that have terms similar to the Oil Futures Contracts. Others take the form of “swaps” in which the two parties exchange cash flows based on pre-determined formulas tied to the spot price of crude oil, forward crude oil prices or crude oil futures prices. For example, USOF may enter into over-the-counter derivative contracts whose value will be tied to changes in the difference between the spot price of light, sweet crude oil, the price of Oil Futures Contracts traded on the NYMEX and the prices of other Oil Futures Contracts in which USOF may invest.
To protect itself from the credit risk that arises in connection with such contracts, USOF may enter into agreements with each counterparty that provide for the netting of its overall exposure to such counterparty, such as the agreements published by the International Swaps and Derivatives Association, Inc. USOF also may require that the counterparty be highly rated and/or provide collateral or other credit support to address USOF’s exposure to the counterparty. In addition, it is also possible for USOF and its counterparty to agree to clear their agreement through an established futures clearinghouse such as those connected to the NYMEX or the ICE Futures. In that event, USOF would no longer havebear the credit risk of its original counterparty, as the clearinghouse would now be USOF’s counterparty. USOF would still retain any price risk associated with its transaction.
The creditworthiness of each potential counterparty is assessed by the General Partner. The General Partner assesses or reviews, as appropriate, the creditworthiness of each potential or existing counterparty to an over-the-counter contract pursuant to guidelines approved by the General Partner’s board of directors (the “Board”). Furthermore, the General Partner on behalf of USOF only enters into over-the-counter contracts with counterparties who are, or are affiliates of, (a) banks regulated by a United States federal bank regulator, (b) broker-dealers regulated by the SEC, (c) insurance companies domiciled in the United States, andor (d) producers, users or traders of energy, whether or not regulated by the CFTC. Any entity acting as a counterparty shall be regulated in either the United States or the United Kingdom unless otherwise approved by the Board after consultation with its legal counsel. Existing counterparties are also reviewed periodically by the General Partner.
USOF anticipates that the use of Other Oil Interests together with its investments in Oil Futures Contracts will produce price and total return results that closely track the investment goals of USOF. However, there can be no assurance of this. Over-the-counter contracts may result in higher transaction-related expenses than the brokerage commissions paid in connection with the purchase of Futures Contracts, which may impact USOF’s ability to successfully track the Benchmark Oil Futures Contract.
USOF may employ spreads or straddles in its trading to mitigate the differences in its investment portfolio and its goal of tracking the price of the Benchmark Oil Futures Contract. USOF would use a spread when it chooses to take simultaneous long and short positions in futures written on the same underlying asset, but with different delivery months. The effect of holding such combined positions is to adjust the sensitivity of USOF to changes in the price relationship between futures contracts which will expire sooner and those that will expire later. USOF would use such a spread if the General Partner felt that taking such long and short positions, when combined with the rest of its holdings, would more closely track the investment goals of USOF, or if the General Partner felt it would lead to an overall lower cost of trading to achieve a given level of economic exposure to movements in oil prices. USOF would enter into a straddle when it chooses to take an option position consisting of a long (or short) position in both a call option and put option. The economic effect of holding certain combinations of put options and call options can be very similar to that of owning the underlying futures contracts. USOF would make use of such a straddle approach if, in the opinion of the General Partner, the resulting combination would more closely track the investment goals of USOF or if it would lead to an overall lower cost of trading to achieve a given level of economic exposure to movements in oil prices.
During the ninethree months ended September 30, 2009,March 31, 2010, USOF did not employ any hedging methods such as those described above since all of its investments were made over an exchange. Therefore, during the ninethree months ended September 30, 2009,March 31, 2010, USOF was not exposed to counterparty risk.
32
Item 4. Controls and Procedures.
Disclosure Controls and Procedures
USOF maintains disclosure controls and procedures that are designed to ensure that material information required to be disclosed in USOF’s periodic reports filed or submitted under the Securities Exchange Act of 1934, as amended, is recorded, processed, summarized and reported within the time period specified in the SEC’s rules and forms.
The duly appointed officers of the General Partner, including its chief executive officer and chief financial officer, who perform functions equivalent to those of a principal executive officer and principal financial officer of USOF if USOF had any officers, have evaluated the effectiveness of USOF’s disclosure controls and procedures and have concluded that the disclosure controls and procedures of USOF have been effective as of the end of the period covered by this quarterly report on Form 10-Q.
Change in Internal Control Over Financial Reporting
There were no changes in USOF’s internal control over financial reporting during USOF’s last fiscal quarter that have materially affected, or are reasonably likely to materially affect, USOF’s internal control over financial reporting.
Part II. OTHER INFORMATION
Item 1. Legal Proceedings.
Not applicable.
Item 1A. Risk Factors.
Item 2. Unregistered Sales of Equity Securities and Use of Proceeds.
Not applicable.
Item 3. Defaults Upon Senior Securities.
Not applicable.
Item 4. Submission of Matters to a Vote of Security Holders.Reserved.
Item 5. Other Information.
Monthly Account Statements
Pursuant to the requirement under Rule 4.22 under the Commodity Exchange Act, each month USOF publishes an account statement for its unitholders, which includes a Statement of Income (Loss) and a Statement of Changes in NAV. The account statement is furnished to the SEC on a current report on Form 8-K pursuant to Section 13 or 15(d) of the Exchange Act and posted each month on USOF’s website at www.unitedstatesoilfund.com.
Item 6. Exhibits.
Listed below are the exhibits which are filed as part of this quarterly report on Form 10-Q (according to the number assigned to them in Item 601 of Regulation S-K):
33
| Exhibit | ||
| Number | Description of Document | |
| 31.1* | Certification by Principal Executive Officer Pursuant to Section 302 of the Sarbanes-Oxley Act of 2002. | |
| 31.2* | Certification by Principal Financial Officer Pursuant to Section 302 of the Sarbanes-Oxley Act of 2002. | |
| 32.1* | Certification by Principal Executive Officer Pursuant to 18 U.S.C. Section 1350, as Adopted Pursuant to Section 906 of the Sarbanes-Oxley Act of 2002. | |
| 32.2* | Certification by Principal Financial Officer Pursuant to 18 U.S.C. Section 1350, as Adopted Pursuant to Section 906 of the Sarbanes-Oxley Act of 2002. | |
| 99.1** | Form of United States Commodity Funds LLC Director Deferred Compensation Agreement. |
* Filed herewithherewith.
** Incorporated by reference to the Registrant’s Current Report on Form 8-K filed on April 1, 2010.
SIGNATURES
Pursuant to the requirements of the Securities Exchange Act of 1934, the registrant has duly caused this report to be signed on its behalf by the undersigned thereunto duly authorized.
| United States Oil Fund, LP (Registrant) | |||
| By: United States Commodity Funds LLC, its general partner | |||
| By: | /s/ Nicholas D. Gerber | ||
| Nicholas D. Gerber | |||
| President and Chief Executive Officer | |||
| (Principal executive officer) | |||
| Date: | |||
| By: | /s/ Howard Mah | ||
| Howard Mah | |||
| Chief Financial Officer | |||
| (Principal financial and accounting officer) | |||
| Date: | |||