UNITED STATES
SECURITIES AND EXCHANGE COMMISSION
WASHINGTON, D.C. 20549
FORM 10-Q
| |
☒ | Quarterly Report Pursuant to Section 13 or 15(d) of the Securities Exchange Act of 1934 for the quarterly period ended September 30, 2017 |
OR | |
☐ | Transition Report Pursuant to Section 13 or 15(d) of the Securities Exchange Act of 1934 |
Commission File Number 0-21719
|
|
|
|
|
|
Steel Dynamics, Inc. | ||
(Exact name of registrant as specified in its charter) | ||
|
|
|
Indiana |
| 35-1929476 |
(State or other jurisdiction of incorporation or organization) |
| (I.R.S. Employer Identification No.) |
|
|
|
7575 West Jefferson Blvd, Fort Wayne, IN |
|
|
(Address of principal executive offices) |
| (Zip Code) |
|
|
|
Registrant’s telephone number, including area code: (260) 969-3500 | ||
Indicate by check mark whether the registrant (1) has filed all reports required to be filed by Section 13 or 15(d) of the Securities Exchange Act of 1934 during the preceding 12 months (or for such shorter period that the registrant was required to file such reports), and (2) has been subject to such filing requirements for the past 90 days. Yes ☒ No ☐
Indicate by check mark whether the registrant has submitted electronically and posted on its corporate website, if any, every Interactive Data File required to be submitted and posted pursuant to Rule 405 of Regulation S-T (§232.405 of this chapter) during the preceding 12 months (or for such shorter period that the registrant was required to submit and post such files). Yes ☒ No ☐
Indicate by check mark whether the registrant is a large accelerated filer, an accelerated filer, a non-accelerated filer, or a smaller reporting company, or an emerging growth company (see definitions of “large accelerated filer,” “accelerated filer”filer,” “smaller reporting company,” and “smaller reporting“emerging growth company” in Rule 12b-2 of the Exchange Act).
(Check one): | Large accelerated filer ☒ | Accelerated filer ☐ |
|
Smaller reporting company ☐ | Emerging growth company ☐ |
If an emerging growth company, indicate by check mark if the registrant has elected not to use the extended transition period for complying with any new or revised financial accounting standards provided pursuant to Section 13(a) of the Exchange Act. ☐
Indicate by check mark whether the registrant is a shell company (as defined in Rule 12b-2 of the Exchange Act). Yes ☐ No☒
As of November 1, 2016,2017, Registrant had 243,815,236236,951,784 outstanding shares of common stock.
|
|
|
STEEL DYNAMICS, INC. Table of Contents | ||
| ||
| ||
Page | ||
|
|
|
| Consolidated Balance Sheets as of September 30, | 1 |
|
|
|
| 2 | |
|
|
|
| 3 | |
|
|
|
| 4 | |
|
|
|
Item 2. | Management’s Discussion and Analysis of Financial Condition and Results of Operations |
|
|
|
|
25 | ||
|
|
|
| ||
|
|
|
|
|
|
|
|
|
|
| |
|
|
|
| ||
|
|
|
Item 1A. |
| |
|
|
|
| ||
|
|
|
Item 3. |
| |
|
|
|
Item 4. |
| |
|
|
|
Item 5. |
| |
|
|
|
| ||
|
|
|
|
| |
|
|
|
STEEL DYNAMICS, INC.
(in thousands, except share data)
|
|
|
|
|
| |||||||
|
|
|
|
|
|
|
|
|
|
| ||
|
|
|
|
|
|
| September 30, |
|
| December 31, | ||
| September 30, |
|
| December 31, | 2017 |
|
| 2016 | ||||
Assets | 2016 |
|
| 2015 | (unaudited) |
|
|
|
| |||
| (unaudited) |
|
|
|
| |||||||
Current assets |
|
|
|
|
|
|
|
|
|
| ||
Cash and equivalents | $ | 1,051,489 |
|
| $ | 727,032 | $ | 1,101,964 |
|
| $ | 841,483 |
Accounts receivable, net |
| 752,232 |
|
|
| 579,333 |
| 897,838 |
|
|
| 703,565 |
Accounts receivable-related parties |
| 27,227 |
|
|
| 34,272 |
| 25,179 |
|
|
| 26,219 |
Inventories |
| 1,275,575 |
|
|
| 1,149,390 |
| 1,487,516 |
|
|
| 1,275,211 |
Other current assets |
| 30,121 |
|
|
| 47,914 |
| 59,648 |
|
|
| 83,197 |
Total current assets |
| 3,136,644 |
|
|
| 2,537,941 |
| 3,572,145 |
|
|
| 2,929,675 |
|
|
|
|
|
|
|
|
|
|
|
|
|
Property, plant and equipment, net |
| 2,928,226 |
|
|
| 2,951,210 |
| 2,708,777 |
|
|
| 2,787,215 |
|
|
|
|
|
|
|
|
|
|
|
|
|
Restricted cash |
| 19,571 |
|
|
| 19,565 |
| 17,092 |
|
|
| 18,060 |
Intangible assets, net |
| 291,814 |
|
|
| 278,960 |
| 263,357 |
|
|
| 283,977 |
Goodwill |
| 399,867 |
|
|
| 397,470 |
| 388,518 |
|
|
| 393,351 |
Other assets |
| 11,440 |
|
|
| 16,936 |
| 10,848 |
|
|
| 11,454 |
Total assets | $ | 6,787,562 |
|
| $ | 6,202,082 | $ | 6,960,737 |
|
| $ | 6,423,732 |
Liabilities and Equity |
|
|
|
|
|
|
|
|
|
|
|
|
Current liabilities |
|
|
|
|
|
|
|
|
|
|
|
|
Accounts payable | $ | 427,790 |
|
| $ | 276,725 | $ | 512,290 |
|
| $ | 382,126 |
Accounts payable-related parties |
| 10,046 |
|
|
| 6,630 |
| 16,393 |
|
|
| 13,070 |
Income taxes payable |
| 35,733 |
|
|
| 2,023 |
| 5,596 |
|
|
| 5,593 |
Accrued payroll and benefits |
| 143,986 |
|
|
| 94,906 |
| 171,508 |
|
|
| 164,543 |
Accrued interest |
| 47,882 |
|
|
| 38,502 |
| 49,380 |
|
|
| 30,295 |
Accrued expenses |
| 112,521 |
|
|
| 99,824 |
| 128,701 |
|
|
| 113,556 |
Current maturities of long-term debt |
| 16,155 |
|
|
| 16,680 |
| 182,661 |
|
|
| 3,632 |
Total current liabilities |
| 794,113 |
|
|
| 535,290 |
| 1,066,529 |
|
|
| 712,815 |
|
|
|
|
|
|
|
|
|
|
|
|
|
Long-term debt |
| 2,570,837 |
|
|
| 2,577,976 |
| 2,351,483 |
|
|
| 2,353,194 |
Deferred income taxes |
| 450,159 |
|
|
| 400,770 |
| 461,399 |
|
|
| 448,375 |
Other liabilities |
| 20,751 |
|
|
| 16,595 |
| 20,305 |
|
|
| 20,649 |
Total liabilities |
| 3,899,716 |
|
|
| 3,535,033 | ||||||
|
|
|
|
|
|
|
|
|
|
|
|
|
Commitments and contingencies |
|
|
|
|
|
|
|
|
|
| ||
|
|
|
|
|
|
|
|
|
|
| ||
Redeemable noncontrolling interests |
| 126,340 |
|
| 126,340 |
| 111,240 |
|
| 111,240 | ||
|
|
|
|
|
|
|
|
|
|
|
|
|
Equity |
|
|
|
|
|
|
|
|
|
|
|
|
Common stock voting, $.0025 par value; 900,000,000 shares authorized; |
|
|
|
|
|
|
|
|
|
| ||
263,396,348, and 262,937,139 shares issued; and 243,770,777, and 243,089,514 |
|
|
|
|
| |||||||
shares outstanding, as of September 30, 2016 and December 31, 2015, respectively |
| 640 |
|
| 638 | |||||||
Treasury stock, at cost; 19,625,571, and 19,847,625 shares, |
|
|
|
|
| |||||||
as of September 30, 2016 and December 31, 2015 respectively |
| (392,051) |
|
| (396,455) | |||||||
264,161,359 and 264,130,544 shares issued; and 236,951,784 and 243,785,485 |
|
|
|
|
| |||||||
shares outstanding, as of September 30, 2017 and December 31, 2016, respectively |
| 641 |
|
| 641 | |||||||
Treasury stock, at cost; 27,209,575 and 20,345,059 shares, |
|
|
|
|
| |||||||
as of September 30, 2017 and December 31, 2016 respectively |
| (650,210) |
|
| (416,829) | |||||||
Additional paid-in capital |
| 1,132,365 |
|
|
| 1,110,253 |
| 1,147,463 |
|
|
| 1,132,749 |
Retained earnings |
| 2,224,963 |
|
|
| 1,965,291 |
| 2,606,831 |
|
|
| 2,210,459 |
Total Steel Dynamics, Inc. equity |
| 2,965,917 |
|
|
| 2,679,727 |
| 3,104,725 |
|
|
| 2,927,020 |
Noncontrolling interests |
| (140,555) |
|
|
| (134,616) |
| (154,944) |
|
|
| (149,561) |
Total equity |
| 2,825,362 |
|
|
| 2,545,111 |
| 2,949,781 |
|
|
| 2,777,459 |
Total liabilities and equity | $ | 6,787,562 |
|
| $ | 6,202,082 | $ | 6,960,737 |
|
| $ | 6,423,732 |
See notes to consolidated financial statements.
1
STEEL DYNAMICS, INC.
CONSOLIDATED STATEMENTS OF INCOME (UNAUDITED)
(in thousands, except per share data)
|
|
|
|
|
|
|
|
|
|
|
|
|
|
|
|
| ||||||
|
|
|
|
|
|
|
|
|
|
|
|
|
|
|
|
| ||||||
| Three Months Ended |
| Nine Months Ended | Three Months Ended |
| Nine Months Ended | ||||||||||||||||
| September 30, |
| September 30, | September 30, |
| September 30, | ||||||||||||||||
| 2016 |
| 2015 |
| 2016 |
| 2015 | 2017 |
| 2016 |
| 2017 |
| 2016 | ||||||||
|
|
|
|
|
|
|
|
|
|
|
|
|
|
|
|
|
|
|
|
|
|
|
Net sales |
|
|
|
|
|
|
|
|
|
|
|
|
|
|
|
| ||||||
Unrelated parties | $ | 2,060,596 |
| $ | 1,901,415 |
| $ | 5,737,584 |
| $ | 5,851,371 | $ | 2,399,116 |
| $ | 2,060,596 |
| $ | 7,066,083 |
| $ | 5,737,584 |
Related parties |
| 40,714 |
|
| 49,508 |
|
| 128,929 |
|
| 151,994 |
| 44,266 |
|
| 40,714 |
|
| 136,235 |
|
| 128,929 |
Total net sales |
| 2,101,310 |
|
| 1,950,923 |
|
| 5,866,513 |
|
| 6,003,365 |
| 2,443,382 |
|
| 2,101,310 |
|
| 7,202,318 |
|
| 5,866,513 |
|
|
|
|
|
|
|
|
|
|
|
|
|
|
|
|
| ||||||
Costs of goods sold |
| 1,692,807 |
|
| 1,722,197 |
|
| 4,841,591 |
|
| 5,415,854 |
| 2,046,864 |
|
| 1,692,807 |
|
| 5,941,128 |
|
| 4,841,591 |
Gross profit |
| 408,503 |
|
| 228,726 |
|
| 1,024,922 |
|
| 587,511 |
| 396,518 |
|
| 408,503 |
|
| 1,261,190 |
|
| 1,024,922 |
|
|
|
|
|
|
|
|
|
|
|
|
|
|
|
|
| ||||||
Selling, general and administrative expenses |
| 95,185 |
| 82,648 |
| 279,899 |
| 242,207 |
| 97,056 |
| 95,185 |
| 298,422 |
| 279,899 | ||||||
Profit sharing |
| 22,255 |
| 9,008 |
| 51,722 |
| 18,637 |
| 21,175 |
| 22,255 |
| 69,714 |
| 51,722 | ||||||
Amortization of intangible assets |
| 7,208 |
|
| 6,041 |
|
| 21,359 |
|
| 18,308 |
| 7,272 |
|
| 7,208 |
|
| 22,120 |
|
| 21,359 |
Operating income |
| 283,855 |
|
| 131,029 |
|
| 671,942 |
|
| 308,359 |
| 271,015 |
|
| 283,855 |
|
| 870,934 |
|
| 671,942 |
|
|
|
|
|
|
|
|
|
|
|
|
|
|
|
|
| ||||||
Interest expense, net of capitalized interest |
| 36,199 |
| 37,084 |
| 109,888 |
| 117,334 |
| 34,177 |
| 36,199 |
| 102,019 |
| 109,888 | ||||||
Other expense, net |
| 4,351 |
|
| 239 |
|
| 741 |
|
| 15,219 | |||||||||||
Other expense (income), net |
| 2,526 |
|
| 4,351 |
|
| (4,968) |
|
| 741 | |||||||||||
Income before income taxes |
| 243,305 |
|
| 93,706 |
|
| 561,313 |
|
| 175,806 |
| 234,312 |
|
| 243,305 |
|
| 773,883 |
|
| 561,313 |
|
|
|
|
|
|
|
|
|
|
|
|
|
|
|
|
| ||||||
Income taxes |
| 88,892 |
|
| 34,839 |
|
| 205,139 |
|
| 64,660 | |||||||||||
Income tax expense |
| 83,300 |
|
| 88,892 |
|
| 271,258 |
|
| 205,139 | |||||||||||
Net income |
| 154,413 |
|
| 58,867 |
|
| 356,174 |
|
| 111,146 |
| 151,012 |
|
| 154,413 |
|
| 502,625 |
|
| 356,174 |
|
|
|
|
|
|
|
|
|
|
|
|
|
|
|
|
| ||||||
Net loss attributable to noncontrolling interests |
| 2,984 |
|
| 1,750 |
|
| 5,929 |
|
| 11,782 |
| 2,246 |
|
| 2,984 |
|
| 5,383 |
|
| 5,929 |
Net income attributable to Steel Dynamics, Inc. | $ | 157,397 |
| $ | 60,617 |
| $ | 362,103 |
| $ | 122,928 | $ | 153,258 |
| $ | 157,397 |
| $ | 508,008 |
| $ | 362,103 |
|
|
|
|
|
|
|
|
|
|
|
|
|
|
|
|
|
|
|
|
|
|
|
|
|
|
|
|
|
|
|
|
|
|
|
|
|
|
|
| ||||||
|
|
|
|
|
|
|
|
|
|
|
|
|
|
|
|
| ||||||
Basic earnings per share attributable to Steel Dynamics, |
|
|
|
|
|
|
|
|
|
|
|
|
|
|
|
| ||||||
Inc. stockholders | $ | 0.65 |
| $ | 0.25 |
| $ | 1.49 |
| $ | 0.51 | $ | 0.64 |
| $ | 0.65 |
| $ | 2.11 |
| $ | 1.49 |
|
|
|
|
|
|
|
|
|
|
|
|
|
|
|
|
|
|
|
|
|
|
|
Weighted average common shares outstanding |
| 243,761 |
|
| 242,074 |
|
| 243,539 |
|
| 241,836 |
| 239,066 |
|
| 243,761 |
|
| 241,117 |
|
| 243,539 |
|
|
|
|
|
|
|
|
|
|
|
|
|
|
|
|
|
|
|
|
|
|
|
|
|
|
|
|
|
|
|
| ||||||||||||||
|
|
|
|
|
|
|
|
| ||||||||||||||
Diluted earnings per share attributable to Steel Dynamics, Inc. |
|
|
|
|
|
|
|
|
|
|
|
|
|
|
|
| ||||||
stockholders, including the effect of assumed conversions |
|
|
|
|
|
|
|
|
|
|
|
|
|
|
|
| ||||||
when dilutive | $ | 0.64 |
| $ | 0.25 |
| $ | 1.48 |
| $ | 0.51 | $ | 0.64 |
| $ | 0.64 |
| $ | 2.09 |
| $ | 1.48 |
|
|
|
|
|
|
|
|
|
|
|
|
|
|
|
|
|
|
|
|
|
|
|
Weighted average common shares and share equivalents outstanding |
| 245,682 |
|
| 243,822 |
|
| 245,227 |
|
| 243,393 |
| 240,880 |
|
| 245,682 |
|
| 242,816 |
|
| 245,227 |
|
|
|
|
|
|
|
|
|
|
|
|
|
|
|
|
|
|
|
|
|
|
|
Dividends declared per share | $ | 0.1400 |
| $ | 0.1375 |
| $ | 0.4200 |
| $ | 0.4125 | $ | 0.155 |
| $ | 0.140 |
| $ | 0.465 |
| $ | 0.420 |
See notes to consolidated financial statements.
2
STEEL DYNAMICS, INC.
CONSOLIDATED STATEMENTS OF CASH FLOWS (UNAUDITED)
(in thousands)
|
|
|
|
|
|
|
|
|
|
|
|
|
|
|
|
| ||||||
|
|
|
|
|
|
|
|
|
|
|
|
|
|
|
|
| ||||||
| Three Months Ended |
| Nine Months Ended | Three Months Ended |
| Nine Months Ended | ||||||||||||||||
| September 30, |
| September 30, | September 30, |
| September 30, | ||||||||||||||||
| 2016 |
| 2015 |
| 2016 |
| 2015 | 2017 |
| 2016 |
| 2017 |
| 2016 | ||||||||
|
|
|
|
|
|
|
|
|
|
|
|
|
|
|
|
|
|
|
|
|
|
|
Operating activities: |
|
|
|
|
|
|
|
|
|
|
|
|
|
|
|
| ||||||
Net income | $ | 154,413 |
| $ | 58,867 |
| $ | 356,174 |
| $ | 111,146 | $ | 151,012 |
| $ | 154,413 |
| $ | 502,625 |
| $ | 356,174 |
|
|
|
|
|
|
|
|
|
|
|
|
|
|
|
|
| ||||||
Adjustments to reconcile net income to net cash provided by |
|
|
|
|
|
|
|
|
|
|
|
|
|
|
|
| ||||||
operating activities: |
|
|
|
|
|
|
|
|
|
|
|
|
|
|
|
| ||||||
Depreciation and amortization |
| 74,190 |
| 74,211 |
| 222,970 |
| 221,306 |
| 75,210 |
| 74,190 |
| 224,068 |
| 222,970 | ||||||
Equity-based compensation |
| 5,924 |
| 5,332 |
| 21,565 |
| 20,232 |
| 6,875 |
| 5,946 |
| 24,558 |
| 23,716 | ||||||
Deferred income taxes |
| 18,478 |
| 13,130 |
| 53,879 |
| 46,214 |
| 3,284 |
| 18,478 |
| 17,849 |
| 53,879 | ||||||
Loss on disposal of assets |
| 161 |
| 655 |
| 1,178 |
| 6,638 | ||||||||||||||
Other adjustments |
| 8,202 |
| 161 |
| 8,055 |
| 1,376 | ||||||||||||||
Changes in certain assets and liabilities: |
|
|
|
|
|
|
|
|
|
|
|
|
|
|
|
| ||||||
Accounts receivable |
| 29,384 |
| 36,361 |
| (149,810) |
| 122,296 |
| (36,123) |
| 29,384 |
| (193,233) |
| (149,810) | ||||||
Inventories |
| (76,013) |
| (8,763) |
| (102,339) |
| 317,410 |
| (67,285) |
| (76,013) |
| (211,726) |
| (102,339) | ||||||
Other assets |
| 694 |
| (3,100) |
| 12,053 |
| 8,794 |
| (9,234) |
| 694 |
| (1,703) |
| 11,855 | ||||||
Accounts payable |
| (49,171) |
| (62,757) |
| 117,220 |
| (127,075) |
| 44,887 |
| (49,171) |
| 133,251 |
| 117,220 | ||||||
Income taxes receivable/payable |
| (7,421) |
| 19,888 |
| 40,960 |
| 29,309 |
| (12,929) |
| (7,421) |
| 5,803 |
| 40,960 | ||||||
Accrued expenses |
| 45,701 |
|
| 30,554 |
|
| 69,361 |
|
| (47,973) |
| 62,249 |
|
| 45,701 |
|
| 38,058 |
|
| 69,361 |
Net cash provided by operating activities |
| 196,340 |
|
| 164,378 |
|
| 643,211 |
|
| 708,297 |
| 226,148 |
|
| 196,362 |
|
| 547,605 |
|
| 645,362 |
|
|
|
|
|
|
|
|
|
|
|
|
|
|
|
|
| ||||||
Investing activities: |
|
|
|
|
|
|
|
|
|
|
|
|
|
|
|
| ||||||
Purchases of property, plant and equipment |
| (59,774) |
| (30,286) |
| (123,168) |
| (86,458) |
| (42,795) |
| (59,774) |
| (127,746) |
| (123,168) | ||||||
Acquisition of business, net of cash acquired |
| (109,065) |
| (45,000) |
| (109,065) |
| (45,000) |
| (5,518) |
| (109,065) |
| (5,518) |
| (109,065) | ||||||
Other investing activities |
| 1,507 |
|
| 3,715 |
|
| 5,767 |
|
| 6,184 |
| 1,081 |
|
| 1,507 |
|
| 30,386 |
|
| 5,767 |
Net cash used in investing activities |
| (167,332) |
|
| (71,571) |
|
| (226,466) |
|
| (125,274) |
| (47,232) |
|
| (167,332) |
|
| (102,878) |
|
| (226,466) |
|
|
|
|
|
|
|
|
|
|
|
|
|
|
|
|
| ||||||
Financing activities: |
|
|
|
|
|
|
|
|
|
|
|
|
|
|
|
| ||||||
Issuance of current and long-term debt |
| 12,911 |
| 67,999 |
| 97,018 |
| 179,033 |
| 450,215 |
| 12,911 |
| 501,448 |
| 97,018 | ||||||
Repayment of current and long-term debt |
| (9,999) |
| (73,420) |
| (95,253) |
| (561,428) |
| (294,913) |
| (9,999) |
| (331,339) |
| (95,253) | ||||||
Dividends paid |
| (34,124) |
| (33,282) |
| (101,639) |
| (94,281) |
| (37,180) |
| (34,124) |
| (108,837) |
| (101,639) | ||||||
Stock option exercise proceeds, including related tax effect |
| 1,027 |
| 302 |
| 7,602 |
| 7,261 | ||||||||||||||
Purchases of treasury stock |
| (99,085) |
| - |
| (237,154) |
| - | ||||||||||||||
Other financing activities |
| - |
|
| (17) |
|
| (16) |
|
| (1,181) |
| (4,832) |
|
| 1,005 |
|
| (8,364) |
|
| 5,435 |
Net cash used in financing activities |
| (30,185) |
|
| (38,418) |
|
| (92,288) |
|
| (470,596) | |||||||||||
Net cash provided by (used in) financing activities |
| 14,205 |
|
| (30,207) |
|
| (184,246) |
|
| (94,439) | |||||||||||
|
|
|
|
|
|
|
|
|
|
|
|
|
|
|
|
|
|
|
|
|
|
|
Increase (decrease) in cash and equivalents |
| (1,177) |
| 54,389 |
| 324,457 |
| 112,427 |
| 193,121 |
| (1,177) |
| 260,481 |
| 324,457 | ||||||
Cash and equivalents at beginning of period |
| 1,052,666 |
|
| 419,401 |
|
| 727,032 |
|
| 361,363 |
| 908,843 |
|
| 1,052,666 |
|
| 841,483 |
|
| 727,032 |
|
|
|
|
|
|
|
|
|
|
|
|
|
|
|
|
|
|
|
|
|
|
|
Cash and equivalents at end of period | $ | 1,051,489 |
| $ | 473,790 |
| $ | 1,051,489 |
| $ | 473,790 | $ | 1,101,964 |
| $ | 1,051,489 |
| $ | 1,101,964 |
| $ | 1,051,489 |
|
|
|
|
|
|
|
|
|
|
|
|
|
|
|
|
|
|
|
|
|
|
|
|
|
|
|
|
|
|
|
|
|
|
|
|
|
|
|
| ||||||
Supplemental disclosure information: |
|
|
|
|
|
|
|
|
|
|
|
|
|
|
|
| ||||||
Cash paid for interest | $ | 26,225 |
| $ | 26,701 |
| $ | 97,605 |
| $ | 115,345 | $ | 13,530 |
| $ | 26,225 |
| $ | 80,155 |
| $ | 97,605 |
Cash paid (received) for federal and state income taxes, net | $ | 75,860 |
| $ | 1,172 |
| $ | 104,124 |
| $ | (10,321) | |||||||||||
Cash paid for income taxes, net | $ | 93,123 |
| $ | 75,860 |
| $ | 246,793 |
| $ | 104,124 | |||||||||||
See notes to consolidated financial statements.
3
STEEL DYNAMICS, INC.
NOTES TO CONSOLIDATED FINANCIAL STATEMENTS (UNAUDITED)
Note 1. Description of the Business and Significant Accounting Policies
Description of the Business
Steel Dynamics, Inc. (SDI), together with its subsidiaries (the company), is onea domestic manufacturer of the largest domestic steel producersproducts and metals recyclers.recycler. The company has three reportable segments, consistent with how it manages the business:reporting segments: steel operations, metals recycling operations, and steel fabrication operations.
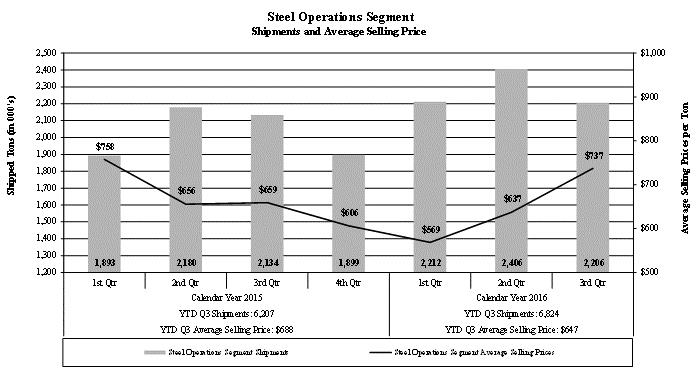
Steel Operations Segment. Steel operations include the company’s Butler Flat Roll Division, Columbus Flat Roll Division, The Techs galvanizing lines, Structural and Rail Division, Engineered Bar Products Division, Vulcan Threaded Products, (since its acquisition onInc. – acquired August 1, 2016),2016, Roanoke Bar Division, Steel of West Virginia, and Iron Dynamics, (IDI), a liquid pig iron (scrap substitute) production facility that supplies solely the Butler Flat Roll Division. These operations include electric arc furnace steel mills, producing steel from ferrous scrap and scrap substitutes, utilizing continuous casting, automated rolling mills and tennumerous downstream coating lines, and one downstream SBQbar processing facility.lines. Steel operations accounted for 74%73% and 69%74% of the company’s consolidated external net sales during the three months ended September 30, 2017 and 2016, respectively, and 2015,73% and 72% and 69% of the company’s consolidated external net sales during the nine months ended September 30, 20162017 and 2015,2016, respectively.
Metals Recycling Operations Segment. Metals recycling operations include the company’s metals recycling processing locations, and ferrous scrap procurement operations,consists solely of OmniSource Corporation.Corporation (OmniSource), and includes both ferrous and nonferrous processing, transportation, marketing, brokerage, and consulting services. Metals recycling operations accounted for 15%14% and 18%15% of the company’s consolidated external net sales during the three months ended September 30, 2017 and 2016, and 2015,respectively, and 15% and 19% of the company’s consolidated external net sales duringfor the nine months ended September 30, 20162017 and 2015, respectively.2016.
Steel Fabrication Operations Segment. Steel fabrication operations include the company’s eight New Millennium Building Systems’ joist and deck plants located throughout the United States, and in Northern Mexico. Revenues from these plants are generated from the fabrication of trusses, girders, steel joists and steel deck used within the non-residential construction industry. Steel fabrication operations accounted for approximately9% and 8% and 9% of the company’s consolidated external net sales during the three months ended September 30, 2017 and 2016, respectively, and 2015,8% and 9% and 8% of the company’s consolidated external net sales during the nine months ended September 30, 20162017 and 2015,2016, respectively.
Other. The “Other” categoryOther operations consists of subsidiary operations that are below the quantitative thresholds required for reportable segments and primarily consist of our idled Minnesota ironmaking operations that were indefinitely idled in May 2015, and severalother smaller joint ventures. Also included in “Other” are certain unallocated corporate accounts, such as the company’s senior secured credit facility, senior notes, certain other investments and certain profit sharing expenses.
Significant Accounting Policies
Principles of Consolidation. The consolidated financial statements include the accounts of SDI, together with its wholly and majority-owned or controlled subsidiaries, after elimination of significant intercompany accounts and transactions. Noncontrolling interests represent the noncontrolling owner’s proportionate share in the equity, income, or losses of the company’s majority-owned or controlled consolidated subsidiaries.
Use of Estimates. These financial statements are prepared in conformity with accounting principles generally accepted in the United States, and accordingly, include amounts that require management to make estimates and assumptions that affect the amounts reported in the financial statements and in the notes thereto. Significant items subject to such estimates and assumptions include the carrying value of property, plant and equipment, intangible assets, and goodwill; valuation allowances for trade receivables, inventories and deferred income tax assets; unrecognized tax benefits; potential environmental liabilities; and litigation claims and settlements. Actual results may differ from these estimates and assumptions.
In the opinion of management, these financial statements reflect all normal recurring adjustments necessary for a fair presentation of the interim period results. These financial statements and notes should be read in conjunction with the audited financial statements and notes thereto included in the company’s Annual Report on Form 10-K for the year ended December 31, 2015.2016.
4
STEEL DYNAMICS, INC.
NOTES TO CONSOLIDATED FINANCIAL STATEMENTS (UNAUDITED)
Note 1. Description of the Business and Significant Accounting Policies (Continued)
Goodwill. The company’s goodwill is allocated to the following reporting units at September 30, 2016,2017, and December 31, 2015,2016, (in thousands):
|
|
|
|
|
|
|
|
|
|
|
|
|
|
|
|
|
|
| September 30, |
| December 31, | ||
|
|
| 2016 |
| 2015 | ||
Metals Recycling Segment: |
| OmniSource | $ | 104,247 |
| $ | 109,039 |
|
| Butler Flat Roll Division, Structural and Rail Division, |
|
|
|
|
|
|
| and Engineered Bar Division |
| 95,000 |
|
| 95,000 |
Steel Segment: |
| The Techs |
| 142,783 |
|
| 142,783 |
|
| Roanoke Bar Division |
| 29,041 |
|
| 29,041 |
|
| Columbus Flat Roll Division |
| 19,682 |
|
| 19,682 |
|
| Vulcan Threaded Products |
| 7,189 |
|
| - |
Fabrication Segment: |
| New Millennium Building Systems |
| 1,925 |
|
| 1,925 |
|
|
| $ | 399,867 |
| $ | 397,470 |
|
|
|
|
|
|
|
|
|
|
|
|
|
|
|
|
|
|
|
|
| September 30, |
| December 31, |
| ||
|
|
| 2017 |
| 2016 |
| ||
| Steel Operations Segment: |
|
|
|
|
|
|
|
| Columbus Flat Roll Division |
| $ | 19,682 |
| $ | 19,682 |
|
| The Techs |
|
| 142,783 |
|
| 142,783 |
|
| Vulcan Threaded Products |
|
| 7,824 |
|
| 7,824 |
|
| Roanoke Bar Division |
|
| 29,041 |
|
| 29,041 |
|
| Metals Recycling Operations Segment: |
|
|
|
|
|
|
|
| Butler Flat Roll Division, Structural and Rail Division, and |
|
|
|
|
|
|
|
| Engineered Bar Division |
|
| 95,000 |
| �� | 95,000 |
|
| OmniSource |
|
| 92,263 |
|
| 97,096 |
|
| Steel Fabrication Operations Segment |
|
| 1,925 |
|
| 1,925 |
|
|
|
| $ | 388,518 |
| $ | 393,351 |
|
OmniSource goodwill decreased $4.8$4.8 million from December 31, 20152016 to September 30, 2016,2017, in recognition of the 20162017 tax benefit related to the normal amortization of the component of OmniSource tax-deductible goodwill in excess of book goodwill.
Recently Adopted/Issued Accounting Standards
In July 2015, the FASB issued ASU 2015-11, Inventory (Topic 330): Simplifying the Measurement of Inventory (ASU 2015-11), which requires an entity to measure inventory at the lower of cost and net realizable value, rather than at the lower of cost or market. The company adopted ASU 2015-11 as required in the first quarter of 2017 on a prospective basis, and the adoption had no impact on its financial condition, results of operations, or cash flow.
In May 2014, the FASB issued guidanceASU 2014-09, which is codified in ASC 606, Revenue Recognition – Revenue from Contracts with Customers, which amends the guidance in former ASC 605, Revenue Recognition.Recognition. FASB has since issued clarifying guidance in the form of ASU 2016-08, Revenue from Contracts with Customers: Principal versus Agent Consideration (Reporting Revenue Gross versus Net), ASU 2016-10, Revenue from Contract with Customers : Identifying Performance Obligations and Licensing, and ASU 2016-12, Revenue from Contracts with Customers: Narrow-Scope Improvements and Practical Expedients, collectively (ASC 606). The core principle of ASC 606 is that an entity should recognize revenue to depict the transfer of promised goods or services to customers in an amount that reflects the consideration to which the entity expects to be entitled in exchange for those goods or services. Because the guidance in ASC 606 is principles-based, it can be applied to all contracts with customers regardless of industry-specific or transaction-specific fact patterns. Additionally, ASC 606also requires additional disclosures to help users of financial statements better understand the nature, amount, timing, and potential uncertainty of revenue that is recognized. ThisASC 606 guidance is effective for annual and interim periods beginning after December 15, 2017, but can be early adopted for annual and interim periods ending after December 15, 2016.2016, using a full retrospective or modified retrospective approach. The company is currently evaluatingfinalizing its adoption plan in which it has identified current revenue streams and analyzed those revenue streams pursuant to the impact of the provisions of ASC 606, including the timing and method of adoption.
In July 2015, the FASB issued ASU 2015-11, Inventory (Topic 330): Simplifying the Measurement of Inventory, which requires an entity to measure inventory at the lower of cost and net realizable value, rather than at the lower of cost or market. This new guidance is effective for annual and interim periods beginning after December 15, 2016, but can be early adopted.accounting requirements. The company is currently evaluatingwill complete the impactadoption plan during the fourth quarter of this ASU’s adoption.2017, including assessment of new required disclosures. Based on our analysis within the adoption plan completed to date, the company does not believe there will be significant change in the amount or timing of revenue recognized under the new standard, or significant changes required to the company’s functions, processes or systems. The company intends to adopt ASU 2014-09 effective January 1, 2018, using the modified retrospective approach.
In February 2016, the FASB issued ASU 2016-02, Leases (Topic 842): which establishes a new lease accounting model that requires lessees to recognize a right of use asset and related lease liability for most leases having lease terms of more than 12 months.months (ASU 2016-02). Leases with a term of 12 months or less will be accounted for similar to existing guidance for operating leases. This new guidance is effective for annual and interim periods beginning after December 15, 2018, but can be early adopted. The company is currently evaluating the impact of the provisions of ASU 2016-02, including the timing of adoption.
In MarchReclassifications
The company early adopted, effective December 31, 2016, the FASB issued ASU 2016-09, Improvement to Employee Share-based Payment Accounting which simplifies several aspects of accounting for share-based payment transactions, including recognizing excess (ASU 2016-09). Cash paid to tax benefits and deficiencies asauthorities from shares withheld to satisfy the company’s statutory income tax expense or benefitwithholding obligation of $2.2 million were reclassified to financing activities from operating activities in the income statement and as operating activities within thenine-month period ended September 30, 2016, statement of cash flows, and an option to recognize gross stock compensation expense with actual forfeitures recognized as incurred. This new guidance is effective for annual and interim periods beginning after December 15, 2016, but can be early adopted. The company is currently evaluating the impact of the provisions of ASU 2016-09, including the timing of adoption.
Note 2. Acquisitions
Vulcan Threaded Products, Inc.flows.
On August 1, 2016, the company completed its acquisition of 100% of Vulcan Threaded Products, Inc. (Vulcan) for $113.0 million, inclusive of $29.2 million in working capital, which is subject to typical post-closing adjustments. The purchase price was paid in cash from available funds. Post-closing operating results of Vulcan are reflected in the steel operations reporting segment. Unaudited proforma operating results as if the acquisition had occurred on January 1, 2015, have not been presented as the effect to 2015 and 2016 consolidated operating results is not significant. Vulcan is the nation’s largest manufacturer and supplier of threaded rod products, and also cold drawn and heat treated steel bar. The acquisition of Vulcan is consistent with one of our target growth objectives – higher-margin downstream business opportunities that utilize our steel products in their manufacturing processes. Vulcan utilizes special-bar-quality products produced at our Engineered Bar Products Division.
5
STEEL DYNAMICS, INC.
NOTES TO CONSOLIDATED FINANCIAL STATEMENTS (UNAUDITED)
Note 2. Acquisitions (Continued)
The aggregate purchase price was allocated on a preliminarily basis to the opening balance sheet of Vulcan as of the August 1, 2016, acquisition date. The following initial allocation of the purchase price (in thousands) is preliminary. The accounting for the acquisition has not yet been finalized based on the company’s valuation of the acquired assets, assumed liabilities and identifiable intangible assets, including goodwill, if any. The preliminary fair values were determined using various valuation techniques that in each case used Level 3 inputs as provided for under ASC 820.
|
| |
| ||
| ||
| ||
| ||
| ||
|
|
The preliminary assessment allocates $32.9 million of the purchase price to the following intangible assets, including customer relationships, trade name, and noncompete agreements. The company plans to utilize an accelerated amortization methodology to follow the pattern in which the economic benefits of the customer relationship intangible asset is anticipated to be consumed. The company plans to amortize the intangible assets related to the trade name and noncompete agreements using a straight line methodology. However, the expected lives and specific amortization methods are subject to finalization of the company’s valuation process.
Consolidated Systems, Inc.
On September 14, 2015, the company purchased from CSi certain of its steel deck facilities (including associated assets) and net working capital of approximately $30.0 million, for a purchase price of $45.0 million in cash. Operating results of these facilities have been reflected in the company’s financial statements under the steel fabrication operations since the September 14, 2015, purchase date. The purchased assets include two deck facilities located in Memphis, Tennessee, and Phoenix, Arizona. Producing both standard and premium specialty deck profiles, the new locations will allow for enhanced geographic reach into the southwestern and western markets, and further diversify New Millennium Building Systems’ product offerings.
Note 3.2. Earnings Per Share
Basic earnings per share is based on the weighted average shares of common stock outstanding during the period. Diluted earnings per share assumes the weighted average dilutive effect of common share equivalents outstanding during the period applied to the company’s basic earnings per share. Common share equivalents represent potentially dilutive stock options, restricted stock units, and deferred stock units;units, stock options and other equity-based awards; and are excluded from the computation in periods in which they have an anti-dilutive effect. There were no anti-dilutive common share equivalents at or for the three-three and nine- month periodsnine months ended September 30, 20162017 and 2015.2016.
The following table presentstables present a reconciliation of the numerators and the denominators of the company’s basic and diluted earnings per share computations for the three and nine months ended September 30, 20162017 and 20152016 (in thousands, except per share data):
|
|
|
|
|
|
|
|
|
|
|
|
|
|
|
|
|
|
|
|
|
|
|
|
|
|
|
|
|
|
| ||||
|
|
|
|
|
|
|
|
|
|
|
|
|
|
|
|
|
|
|
|
|
|
|
|
|
|
|
|
|
|
| ||||
| Three Months Ended September 30, | Three Months Ended September 30, | ||||||||||||||||||||||||||||||||
| 2016 |
| 2015 | 2017 |
| 2016 | ||||||||||||||||||||||||||||
| Net Income |
| Shares |
| Per Share |
| Net Income |
| Shares |
| Per Share | Net Income |
| Shares |
| Per Share |
| Net Income |
| Shares |
| Per Share | ||||||||||||
| (Numerator) |
| (Denominator) |
| Amount |
| (Numerator) |
| (Denominator) |
| Amount | (Numerator) |
|
| (Denominator) |
| Amount |
| (Numerator) |
|
| (Denominator) |
| Amount | ||||||||||
Basic earnings per share | $ | 157,397 |
| 243,761 |
| $ | 0.65 |
| $ | 60,617 |
| 242,074 |
| $ | 0.25 | $ | 153,258 |
|
| 239,066 |
| $ | 0.64 |
| $ | 157,397 |
|
| 243,761 |
| $ | 0.65 | ||
Dilutive common share equivalents |
| - |
|
| 1,921 |
|
|
|
|
| - |
|
| 1,748 |
|
|
|
| - |
|
| 1,814 |
|
|
|
|
| - |
|
| 1,921 |
|
|
|
Diluted earnings per share | $ | 157,397 |
|
| 245,682 |
| $ | 0.64 |
| $ | 60,617 |
|
| 243,822 |
| $ | 0.25 | $ | 153,258 |
|
| 240,880 |
| $ | 0.64 |
| $ | 157,397 |
|
| 245,682 |
| $ | 0.64 |
|
|
|
|
|
|
|
|
|
|
|
|
|
|
|
|
|
|
|
|
|
|
|
|
|
|
|
|
|
|
|
|
|
|
|
|
| Nine Months Ended September 30, | ||||||||||||||||
| 2017 |
| 2016 | ||||||||||||||
| Net Income |
| Shares |
| Per Share |
| Net Income |
| Shares |
| Per Share | ||||||
| (Numerator) |
| (Denominator) |
| Amount |
| (Numerator) |
| (Denominator) |
| Amount | ||||||
Basic earnings per share | $ | 508,008 |
|
| 241,117 |
| $ | 2.11 |
| $ | 362,103 |
|
| 243,539 |
| $ | 1.49 |
Dilutive common share equivalents |
| - |
|
| 1,699 |
|
|
|
|
| - |
|
| 1,688 |
|
|
|
Diluted earnings per share | $ | 508,008 |
|
| 242,816 |
| $ | 2.09 |
| $ | 362,103 |
|
| 245,227 |
| $ | 1.48 |
Note 3. Inventories
Inventories are stated at lower of cost or net realizable value. Cost is determined using a weighted average cost method for raw materials and supplies, and on a first-in, first-out, basis for other inventory. Inventory consisted of the following (in thousands):
|
|
|
|
|
|
|
|
|
|
|
|
|
|
|
|
|
|
|
|
|
|
|
|
|
|
|
|
|
|
|
|
|
|
|
|
| Nine Months Ended September 30, | ||||||||||||||||
| 2016 |
| 2015 | ||||||||||||||
| Net Income |
| Shares |
| Per Share |
| Net Income |
| Shares |
| Per Share | ||||||
| (Numerator) |
| (Denominator) |
| Amount |
| (Numerator) |
| (Denominator) |
| Amount | ||||||
Basic earnings per share | $ | 362,103 |
|
| 243,539 |
| $ | 1.49 |
| $ | 122,928 |
|
| 241,836 |
| $ | 0.51 |
Dilutive common share equivalents |
| - |
|
| 1,688 |
|
|
|
|
| - |
|
| 1,557 |
|
|
|
Diluted earnings per share | $ | 362,103 |
|
| 245,227 |
| $ | 1.48 |
| $ | 122,928 |
|
| 243,393 |
| $ | 0.51 |
|
|
|
|
|
|
|
|
|
|
|
|
|
|
|
|
|
|
|
|
|
|
| September 30, |
| December 31, |
|
| ||
|
|
| 2017 |
| 2016 |
|
| ||
|
| Raw materials | $ | 677,187 |
| $ | 515,924 |
|
|
|
| Supplies |
| 376,984 |
|
| 383,134 |
|
|
|
| Work in progress |
| 119,735 |
|
| 103,606 |
|
|
|
| Finished goods |
| 313,610 |
|
| 272,547 |
|
|
|
| Total inventories | $ | 1,487,516 |
| $ | 1,275,211 |
|
|
6
STEEL DYNAMICS, INC.
NOTES TO CONSOLIDATED FINANCIAL STATEMENTS (UNAUDITED)
Note 4. Inventories
Inventories are stated at lower of cost or market. Cost is determined using a weighted average cost method for scrap, and on a first-in, first-out, basis for other inventory. Inventory consisted of the following (in thousands):
|
|
|
|
|
|
|
|
|
|
|
|
|
|
|
|
|
|
|
|
|
|
| September 30, |
| December 31, |
|
| ||
|
|
| 2016 |
| 2015 |
|
| ||
|
| Raw materials | $ | 490,164 |
| $ | 419,608 |
|
|
|
| Supplies |
| 392,433 |
|
| 396,349 |
|
|
|
| Work in progress |
| 124,428 |
|
| 90,486 |
|
|
|
| Finished goods |
| 268,550 |
|
| 242,947 |
|
|
|
| Total inventories | $ | 1,275,575 |
| $ | 1,149,390 |
|
|
Note 5.4. Debt
On March 16, 2015,In September 2017, the company called and repaid allissued $350.0 million of its outstanding 7 5/8% Senior Notes4.125% senior notes due 20202025 (the “Notes”"2025 Notes"), the proceeds of which, along with available cash, were used to fund the September 2017 tender to purchase at a redemption price of 103.813%103.563%, $182.9 million principal amount, plus accrued and unpaid interest to, but not including, the date of repurchase, of the company's 6.375% senior notes due 2022 (the "2022 Notes"), and the October 2017 call and repayment at a redemption price of 103.188% of the $167.1 million remaining outstanding principal amount of the 2022 Notes, plus accrued and unpaid interest to, but not including, the date of redemption. Associatedrepayment. The $167.1 remaining outstanding principal amount is included in current maturities of long-term debt in the company’s September 30, 2017, balance sheet. The company recorded expenses related to tender premiums, and the write off of deferred financingunamortized debt issuance costs, and other expenses of approximately $16.7$8.0 million, were recordedwhich are reflected in other expenseexpenses in conjunction with the redemption.consolidated statements of income for the three- and nine-months ended September 30, 2017. Additional call premiums of $6.6 million related to the October 2017 call and repayment will be recorded as other expenses in the consolidated statements of income for the three months and year ended
December 31, 2017.
Note 6.5. Changes in Equity
The following table provides a reconciliation of the beginning and ending carrying amounts of total equity, equity attributable to stockholders of Steel Dynamics, Inc. and equity and redeemable amounts attributable to the noncontrolling interests (in thousands):
|
|
|
|
|
|
|
|
|
|
|
|
|
|
|
|
|
|
|
|
|
|
|
|
|
|
|
|
|
|
|
|
|
|
|
|
|
|
|
|
|
|
| Stockholders of Steel Dynamics, Inc. |
|
|
|
|
|
|
|
|
| ||||||||||
|
|
| Additional |
|
|
|
|
|
|
|
|
| Redeemable | |||||||
| Common |
| Paid-In |
| Retained |
| Treasury |
| Noncontrolling |
| Total |
| Noncontrolling | |||||||
| Stock |
| Capital |
| Earnings |
| Stock |
| Interests |
| Equity |
| Interests | |||||||
Balances at December 31, 2015 | $ | 638 |
| $ | 1,110,253 |
| $ | 1,965,291 |
| $ | (396,455) |
| $ | (134,616) |
| $ | 2,545,111 |
| $ | 126,340 |
Exercise of stock options proceeds, |
|
|
|
|
|
|
|
|
|
|
|
|
|
|
|
|
|
|
|
|
including related tax effect |
| 2 |
|
| 7,874 |
|
| - |
|
| - |
|
| - |
|
| 7,876 |
|
| - |
Dividends declared |
| - |
|
| - |
|
| (102,342) |
|
| - |
|
| - |
|
| (102,342) |
|
| - |
Distributions to noncontrolling |
|
|
|
|
|
|
|
|
|
|
|
|
|
|
|
|
|
|
|
|
investors, net |
| - |
|
| - |
|
| - |
|
| - |
|
| (10) |
|
| (10) |
|
| - |
Equity-based compensation |
| - |
|
| 14,238 |
|
| (89) |
|
| 4,404 |
|
| - |
|
| 18,553 |
|
| - |
Comprehensive and net income (loss) |
| - |
|
| - |
|
| 362,103 |
|
| - |
|
| (5,929) |
|
| 356,174 |
|
| - |
Balances at September 30, 2016 | $ | 640 |
| $ | 1,132,365 |
| $ | 2,224,963 |
| $ | (392,051) |
| $ | (140,555) |
| $ | 2,825,362 |
| $ | 126,340 |
|
|
|
|
|
|
|
|
|
|
|
|
|
|
|
|
|
|
|
|
|
|
|
|
|
|
|
|
|
|
|
|
|
|
|
|
|
|
|
|
|
|
| Stockholders of Steel Dynamics, Inc. |
|
|
|
|
|
|
|
|
| ||||||||||
|
|
|
|
|
| Additional |
|
|
|
|
|
|
| Redeemable | ||||||
| Common |
| Treasury |
| Paid-In |
| Retained |
| Noncontrolling |
| Total |
| Noncontrolling | |||||||
| Stock |
| Stock |
| Capital |
| Earnings |
| Interests |
| Equity |
| Interests | |||||||
Balances at December 31, 2016 | $ | 641 |
| $ | (416,829) |
| $ | 1,132,749 |
| $ | 2,210,459 |
| $ | (149,561) |
| $ | 2,777,459 |
| $ | 111,240 |
Dividends declared |
| - |
|
| - |
|
| - |
|
| (111,435) |
|
| - |
|
| (111,435) |
|
| - |
Share repurchases |
| - |
|
| (237,154) |
|
| - |
|
| - |
|
| - |
|
| (237,154) |
|
| - |
Equity-based compensation |
| - |
|
| 3,773 |
|
| 14,714 |
|
| (201) |
|
| - |
|
| 18,286 |
|
| - |
Comprehensive and net income (loss) |
| - |
|
| - |
|
| - |
|
| 508,008 |
|
| (5,383) |
|
| 502,625 |
|
| - |
Balances at September 30, 2017 | $ | 641 |
| $ | (650,210) |
| $ | 1,147,463 |
| $ | 2,606,831 |
| $ | (154,944) |
| $ | 2,949,781 |
| $ | 111,240 |
Note 7.6. Derivative Financial Instruments
The company is exposed to certain risks relating to its ongoing business operations. The company utilizes derivative instruments to mitigate commodity margin risk, interest rate risk and foreign currency exchange rate risk. The company routinely enters into forward exchange traded futures and option contracts to manage the price risk associated with nonferrous metals inventory as well as purchases and sales of nonferrous metals (primarily aluminum and copper). The company offsets fair value amounts recognized for derivative instruments executed with the same counterparty under master netting agreements.
7
STEEL DYNAMICS, INC.
NOTES TO CONSOLIDATED FINANCIAL STATEMENTS (UNAUDITED)
Note 7. Derivative Financial Instruments (Continued)
Commodity Futures Contracts. If the company is “long” on futures contracts, it means the company has more futures contracts purchased than futures contracts sold for the underlying commodity. If the company is “short” on a futures contract, it means the company has more futures contracts sold than futures contracts purchased for the underlying commodity. The following summarizes the company’s futures contract commitments as of September 30, 2016 (MT represents metric tons):2017:
|
|
|
|
|
|
| |
|
|
|
|
|
|
| |
| Commodity Futures |
| Long/Short |
|
| Metric Tons |
|
| Aluminum |
| Long |
|
|
| |
| Aluminum |
| Short |
|
|
| |
| Copper |
| Long |
|
|
| |
| Copper |
| Short |
|
|
| |
|
|
|
|
|
|
|
The following summarizes the location and amounts of the fair values reported on the company’s balance sheets as of September 30, 2016,2017, and December 31, 2015,2016, and gains and losses related to derivatives included in the company’s statement of income for the three and nine months ended September 30, 20162017 and 20152016 (in thousands):
7
STEEL DYNAMICS, INC.
NOTES TO CONSOLIDATED FINANCIAL STATEMENTS (UNAUDITED)
Note 6. Derivative Financial Instruments (Continued)
|
|
|
|
|
|
|
|
|
|
|
|
|
|
|
|
|
|
| ||||||||
|
|
|
|
|
|
|
|
|
|
|
|
|
|
|
|
|
|
| ||||||||
| Asset Derivatives |
| Liability Derivatives | Asset Derivatives |
| Liability Derivatives | ||||||||||||||||||||
| Balance sheet |
| Fair Value |
| Fair Value | Balance sheet |
| Fair Value |
| Fair Value | ||||||||||||||||
| location |
| September 30, 2016 |
| December 31, 2015 |
| September 30, 2016 |
| December 31, 2015 | location |
| September 30, 2017 |
| December 31, 2016 |
| September 30, 2017 |
| December 31, 2016 | ||||||||
Derivative instruments designated |
|
|
|
|
|
|
|
|
|
|
|
|
|
|
|
|
|
|
|
|
|
|
|
|
|
|
as fair value hedges - |
|
|
|
|
|
|
|
|
| |||||||||||||||||
as fair value hedges |
|
|
|
|
|
|
|
|
| |||||||||||||||||
Commodity futures | Other current assets |
| $ | 451 |
| $ | 857 |
| $ | 1,156 |
| $ | 2,860 | Other current assets |
| $ | 2,576 |
| $ | 2,910 |
| $ | 396 |
| $ | 1,300 |
|
|
|
|
|
|
|
|
|
|
|
|
|
|
|
|
|
|
| ||||||||
Derivative instruments not designated |
|
|
|
|
|
|
|
|
|
|
|
|
|
|
|
|
|
| ||||||||
as hedges - |
|
|
|
|
|
|
|
|
| |||||||||||||||||
as hedges |
|
|
|
|
|
|
|
|
| |||||||||||||||||
Commodity futures | Other current assets |
|
| 171 |
|
| 908 |
|
| 1,037 |
|
| 1,065 | Other current assets |
|
| 1,573 |
|
| 1,150 |
|
| 497 |
|
| 783 |
Total derivative instruments |
|
| $ | 622 |
| $ | 1,765 |
| $ | 2,193 |
| $ | 3,925 |
|
| $ | 4,149 |
| $ | 4,060 |
| $ | 893 |
| $ | 2,083 |
The fair value of the above derivative instruments along with required margin deposit amounts with the same counterparty under master netting arrangements totaled $1$6.0.7 million at September 30, 2016,2017, and $3.4$3.2 million at December 31, 2015,2016, are reflected in other current assets in the consolidated balance sheets.
|
|
|
|
|
|
|
|
|
|
|
|
|
|
|
|
|
|
|
|
|
|
|
|
|
|
|
|
|
|
|
|
|
|
|
|
|
|
|
|
|
| Amount of gain (loss) recognized |
|
|
| Location of gain |
| Amount of gain (loss) recognized | ||||||||
|
| Location of gain |
| in income on derivatives |
|
|
| (loss) recognized |
| in income on related hedged items | ||||||||
|
| (loss) recognized |
| for the three months ended |
| Hedged items in |
| in income on |
| for the three months ended | ||||||||
|
| in income on |
| September 30, |
| September 30, |
| fair value hedge |
| related hedged |
| September 30, |
| September 30, | ||||
|
| derivatives |
| 2017 |
| 2016 |
| relationships |
| items |
| 2017 |
| 2016 | ||||
Derivatives in fair value |
|
|
|
|
|
|
|
|
|
|
|
|
|
|
|
|
|
|
hedging relationships |
|
|
|
|
|
|
|
|
|
|
|
|
|
|
|
|
|
|
Commodity futures |
| Costs of goods sold |
| $ | 4,122 |
| $ | 826 |
| Firm commitments |
| Costs of goods sold |
| $ | (1,711) |
| $ | (793) |
|
|
|
|
|
|
|
|
|
| Inventory |
| Costs of goods sold |
|
| (1,330) |
|
| (177) |
Derivatives not designated |
|
|
|
|
|
|
|
|
|
|
|
|
| $ | (3,041) |
| $ | (970) |
as hedging instruments |
|
|
|
|
|
|
|
|
|
|
|
|
|
|
|
|
|
|
Commodity futures |
| Costs of goods sold |
| $ | (10,566) |
| $ | (638) |
|
|
|
|
|
|
|
|
|
|
|
|
|
|
|
|
|
|
|
|
|
|
|
|
|
|
|
|
| ||||||||||||||||||
|
|
|
|
|
|
|
|
|
|
|
|
|
|
|
|
|
|
|
|
|
|
|
|
|
|
|
|
|
|
|
|
|
|
|
| |
|
|
|
|
|
|
|
|
|
|
|
|
|
|
|
|
|
|
|
|
|
|
|
|
|
|
|
|
|
|
|
|
|
|
|
| |
|
|
|
| Amount of gain (loss) recognized |
|
|
| Location of gain |
| Amount of gain (loss) recognized |
|
|
| Amount of gain (loss) recognized |
|
|
| Location of gain |
| Amount of gain (loss) recognized | ||||||||||||||||
|
| Location of gain |
| in income on derivatives |
|
|
| (loss) recognized |
| in income on related hedged items |
| Location of gain |
| in income on derivatives |
|
|
| (loss) recognized |
| in income on related hedged items | ||||||||||||||||
|
| (loss) recognized |
| for the three months ended |
| Hedged items in |
| in income on |
| for the three months ended |
| (loss) recognized |
| for the nine months ended |
| Hedged items in |
| in income on |
| for the nine months ended | ||||||||||||||||
|
| in income on |
| September 30, |
| September 30, |
| fair value hedge |
| related hedged |
| September 30, |
| September 30, |
| in income on |
| September 30, |
| September 30, |
| fair value hedge |
| on related |
| September 30, |
| September 30, | ||||||||
|
| derivatives |
| 2016 |
| 2015 |
| relationships |
| items |
| 2016 |
| 2015 |
| derivatives |
| 2017 |
| 2016 |
| relationships |
| hedged items |
| 2017 |
| 2016 | ||||||||
Derivatives in fair value |
|
|
|
|
|
|
|
|
|
|
|
|
|
|
|
|
|
|
|
|
|
|
|
|
|
|
|
|
|
|
|
|
|
|
|
|
hedging relationships - |
|
|
|
|
|
|
|
|
|
|
|
|
|
|
|
|
|
| ||||||||||||||||||
hedging relationships |
|
|
|
|
|
|
|
|
|
|
|
|
|
|
|
|
| |||||||||||||||||||
Commodity futures |
| Costs of goods sold |
| $ | 826 |
| $ | (2,825) |
| Firm commitments |
| Costs of goods sold |
| $ | (793) |
| $ | 662 |
| Costs of goods sold |
| $ | 571 |
| $ | 1,281 |
| Firm commitments |
| Costs of goods sold |
| $ | 995 |
| $ | (2,223) |
|
|
|
|
|
|
|
|
|
| Inventory |
| Costs of goods sold |
|
| (177) |
|
| 800 |
|
|
|
|
|
|
|
|
| Inventory |
| Costs of goods sold |
|
| 179 |
|
| 642 |
Derivatives not designated |
|
|
|
|
|
|
|
|
|
|
|
|
| $ | (970) |
| $ | 1,462 |
|
|
|
|
|
|
|
|
|
|
|
|
| $ | 1,174 |
| $ | (1,581) |
as hedging instruments - |
|
|
|
|
|
|
|
|
|
|
|
|
|
|
|
|
|
| ||||||||||||||||||
as hedging instruments |
|
|
|
|
|
|
|
|
|
|
|
|
|
|
|
|
|
| ||||||||||||||||||
Commodity futures |
| Costs of goods sold |
| $ | (638) |
| $ | 6,707 |
|
|
|
|
|
|
|
|
|
|
| Costs of goods sold |
| $ | (12,528) |
| $ | (394) |
|
|
|
|
|
|
|
|
| |
Derivatives accounted for as fair value hedges had ineffectiveness resulting in losses of $35,000 and $84,000 during the three-month periods ended September 30, 2017 and 2016, respectively; and a gain of $62,000 and loss of $175,000 during the nine-month periods ended September 30, 2017 and 2016, respectively. Gains excluded from hedge effectiveness testing of $1.1 million decreased cost of goods sold during the three-month period ended September 30, 2017, and losses excluded from hedge effectiveness testing of $60,000 increased costs of goods sold during the three-month period ended September 30, 2016. Gains of $1.7 million decreased costs of goods sold during the nine-month period ended September 30, 2017, and losses of $125,000 increased costs of goods sold during the nine month period ended September 30, 2016.
8
STEEL DYNAMICS, INC.
NOTES TO CONSOLIDATED FINANCIAL STATEMENTS (UNAUDITED)
Note 7. Derivative Financial Instruments (Continued)
|
|
|
|
|
|
|
|
|
|
|
|
|
|
|
|
|
|
|
|
|
|
|
|
|
|
|
|
|
|
|
|
|
|
|
|
|
|
|
|
|
| Amount of gain (loss) recognized |
|
|
| Location of gain |
| Amount of gain (loss) recognized | ||||||||
|
| Location of gain |
| in income on derivatives |
|
|
| (loss) recognized |
| in income on related hedged items | ||||||||
|
| (loss) recognized |
| for the nine months ended |
| Hedged items in |
| in income on |
| for the nine months ended | ||||||||
|
| in income on |
| September 30, |
| September 30, |
| fair value hedge |
| income on related |
| September 30, |
| September 30, | ||||
|
| derivatives |
| 2016 |
| 2015 |
| relationships |
| hedged items |
| 2016 |
| 2015 | ||||
Derivatives in fair value |
|
|
|
|
|
|
|
|
|
|
|
|
|
|
|
|
|
|
hedging relationships - |
|
|
|
|
|
|
|
|
|
|
|
|
|
|
|
|
|
|
Commodity futures |
| Costs of goods sold |
| $ | 1,281 |
| $ | (4,063) |
| Firm commitments |
| Costs of goods sold |
| $ | (2,223) |
| $ | 1,518 |
|
|
|
|
|
|
|
|
|
| Inventory |
| Costs of goods sold |
|
| 642 |
|
| 1,291 |
Derivatives not designated |
|
|
|
|
|
|
|
|
|
|
|
|
| $ | (1,581) |
| $ | 2,809 |
as hedging instruments - |
|
|
|
|
|
|
|
|
|
|
|
|
|
|
|
|
|
|
Commodity futures |
| Costs of goods sold |
| $ | (394) |
| $ | 13,377 |
|
|
|
|
|
|
|
|
|
|
Derivatives accounted for as fair value hedges had ineffectiveness resulting in losses of $84,000 and $191,000 during the three months ended September 30, 2016 and 2015, respectively; and losses of $175,000 and $64,000 during the nine months ended September 30, 2016 and 2015, respectively. Losses excluded from hedge effectiveness testing of $60,000 and $1.2 million increased cost of goods sold during the three months ended September 30, 2016, and September 30, 2015. Losses excluded from hedge effectiveness testing of $125,000 and $1.2 million increased costs of goods sold during the nine months ended September 30, 2016 and 2015, respectively.
Note 8.7. Fair Value Measurements
FASB accounting standards provide a comprehensive framework for measuring fair value and sets forth a definition of fair value and establishes a hierarchy prioritizing the inputs to valuation techniques, giving the highest priority to quoted prices in active markets for identical assets and liabilities and the lowest priority to unobservable value inputs. Levels within the hierarchy are defined as follows:
· | Level 1—Unadjusted quoted prices for identical assets and liabilities in active markets; |
· | Level 2—Quoted prices for similar assets and liabilities in active markets (other than those included in Level 1) which are observable for |
the asset or liability, either directly or indirectly; and
· | Level 3—Valuations derived from valuation techniques in which one or more significant inputs or significant value drivers are unobservable. |
unobservable.
The following table sets forth financial assets and liabilities measured at fair value on a recurring basis in the consolidated balance sheet and the respective levels to which the fair value measurements are classified within the fair value hierarchy as of September 30, 2016,2017, and December 31, 20152016 (in thousands):
|
|
|
|
|
|
|
|
|
|
|
|
|
|
|
|
| ||||||
|
|
|
|
|
|
|
|
|
|
|
|
|
|
|
|
| ||||||
|
|
|
| Quoted Prices |
| Significant |
|
|
|
|
| Quoted Prices |
| Significant |
|
| ||||||
|
|
|
| in Active |
| Other |
| Significant |
|
|
| in Active |
| Other |
| Significant | ||||||
|
|
|
| Markets for |
| Observable |
| Unobservable |
|
|
| Markets for |
| Observable |
| Unobservable | ||||||
|
|
|
| Identical Assets |
| Inputs |
| Inputs |
|
|
| Identical Assets |
| Inputs |
| Inputs | ||||||
| Total |
| (Level 1) |
| (Level 2) |
| (Level 3) | Total |
| (Level 1) |
| (Level 2) |
| (Level 3) | ||||||||
September 30, 2016 |
|
|
|
|
|
|
|
|
|
|
| |||||||||||
September 30, 2017 |
|
|
|
|
|
|
|
|
|
|
| |||||||||||
Commodity futures – financial assets | $ | 622 |
| $ | - |
| $ | 622 |
| $ | - | $ | 4,149 |
| $ | - |
| $ | 4,149 |
| $ | - |
Commodity futures – financial liabilities |
| 2,193 |
| - |
| 2,193 |
| - |
| 893 |
| - |
| 893 |
| - | ||||||
|
|
|
|
|
|
|
|
|
|
|
|
|
|
|
|
| ||||||
December 31, 2015 |
|
|
|
|
|
|
|
|
|
|
| |||||||||||
December 31, 2016 |
|
|
|
|
|
|
|
|
|
|
| |||||||||||
Commodity futures – financial assets | $ | 1,765 |
| $ | - |
| $ | 1,765 |
| $ | - | $ | 4,060 |
| $ | - |
| $ | 4,060 |
| $ | - |
Commodity futures – financial liabilities |
| 3,925 |
| - |
| 3,925 |
| - |
| 2,083 |
| - |
| 2,083 |
| - | ||||||
The carrying amounts of financial instruments including cash and equivalents approximate fair value. The fair values of commodity futures contracts are estimated by the use of quoted market prices, estimates obtained from brokers, and other appropriate valuation techniques based on references available. The fair value of long-term debt, including current maturities, as determined by quoted market prices (Level 2), was approximately $2.7$2.6 billion and $2.5 billion at September 30, 2016,2017 and December 31, 2015,2016, respectively (with a corresponding carrying amount in the consolidated balance sheet of $2.6$2.5 and $2.4 billion at September 30, 2016,2017, and December 31, 2015)2016, respectively).
9
STEEL DYNAMICS, INC.
NOTES TO CONSOLIDATED FINANCIAL STATEMENTS (UNAUDITED)
Note 9.8. Commitments and Contingencies
Although, as noted below, a tentative settlement has been reached in the case, the company has to date been involved, along with two other remaining non-settling defendant steel manufacturing companies, from an original group of eight, in a direct purchaser class action antitrust suit in federal court in Chicago, Illinois, under the caption of Standard Iron Works v Arcelor Mittal, et al. Two other complaints, not yet settled, were brought on behalf of a purported class of indirect purchasers of steel products within the same time period. The company has a pending motion to dismiss in that case. The complaints allege a conspiracy to limit output on the part of the defendants, in order to fix, raise, maintain and stabilize the price at which steel products were sold in the United States during a specified period between 2005 and 2007. The complaints seek treble damages and costs, including reasonable attorney fees, pre- and post-judgment interest and injunctive relief. In September 2015, the Court denied class certification on the issue of antitrust impact and damages, but granted class certification on the limited issue of the alleged conspiracy.
In October 2016, the company announced that it had entered into an agreement to settle the direct purchaser case for a payment of $4.6 million. Preliminary approval was granted by the court on November 3, 2016, and final approval by the Court is also expected to be forthcoming. During the approval process, members of the class will be given an opportunity to opt-out of the class and retain their own individual rights.
Due to the uncertain nature of litigation, the company cannot presently predict either the final outcome of the proposed settlement process, including whether there may be opt-outs from the settlement, or the outcome of the remaining indirect purchaser case. Based on the information available at this time, however, the company has determined that, apart from the proposed settlement amount in the direct case, there is not presently a “reasonable possibility” (as that term is defined in ASC 450-20-20), that the outcome of the remaining unresolved matters will have a material impact on the Company’s financial condition, results of operations, or liquidity. Although not presently necessary or appropriate to make a dollar estimate of exposure to loss, if any, in connection with these remaining matters, the company may in the future determine that a further loss accrual may be necessary. Further, although the company may make loss accruals, if and as warranted, any amounts that it may accrue from time to time could vary significantly from the amounts it actually pays, due to inherent uncertainties and the inherent shortcomings of the estimation process, the uncertainties involved in litigation and other factors. Additionally, an adverse result could have a material effect on the company’s financial condition, results of operations and liquidity.
The company is additionally involved in various routine litigation matters, including administrative proceedings, regulatory proceedings, governmental investigations, environmental matters, and commercial and construction contract disputes, none of which are expected to have a material impact on our financial condition, results of operations, or liquidity.
10
STEEL DYNAMICS, INC.
NOTES TO CONSOLIDATED FINANCIAL STATEMENTS (UNAUDITED)
Note 10.9. Segment Information
The company’s operations are primarily organized and managed by reportable operating segment,segments, which are steel operations, metals recycling operations, and steel fabrication operations. The segment operations are more fully described in Note 1 to thethese financial statements. Operating segment performance and resource allocations are primarily based on operating results before income taxes. The accounting policies of the reportable segments are consistent with those described in Note 1 to thethese financial statements. Intra‑segment sales and any related profits are eliminated in consolidation. Amounts included in the category “Other” are from subsidiary operations that are below the quantitative thresholds required for reportable segments and primarily consist of our Minnesota ironmaking operations and several small joint ventures. In addition, “Other” also includes certain unallocated corporate accounts, such as the company’s senior secured credit facility, senior notes, certain other investments and certain profit sharing expenses.
9
STEEL DYNAMICS, INC.
NOTES TO CONSOLIDATED FINANCIAL STATEMENTS (UNAUDITED)
Note 9. Segment Information (Continued)
The company’s segment results for the three and nine months ended September 30, 2016 and 2015, each adjusted consistent with our current reportable segments presentation, are as follows (in thousands):
|
|
|
|
|
|
|
|
|
|
|
|
|
|
|
|
|
|
|
|
|
|
|
|
|
|
|
|
| ||||||||
|
|
|
|
|
|
|
|
|
|
|
|
|
|
|
|
|
|
|
|
|
|
|
|
|
|
|
|
| ||||||||
|
|
|
| Metals |
| Steel |
|
|
|
|
|
|
|
|
|
|
| Metals |
| Steel |
|
|
|
|
|
|
|
| ||||||||
For the three months ended |
| Steel |
| Recycling |
| Fabrication |
|
|
|
|
|
|
|
|
| Steel |
| Recycling |
| Fabrication |
|
|
|
|
|
|
|
| ||||||||
September 30, 2016 |
| Operations |
| Operations |
| Operations |
| Other |
| Eliminations |
| Consolidated | ||||||||||||||||||||||||
September 30, 2017 |
| Operations |
| Operations |
| Operations |
| Other |
| Eliminations |
| Consolidated | ||||||||||||||||||||||||
|
|
|
|
|
|
|
|
|
|
|
|
|
|
|
|
|
|
|
|
|
|
|
|
|
|
|
|
|
|
|
|
|
|
|
|
|
Net Sales |
|
|
|
|
|
|
|
|
|
|
|
|
|
|
|
|
|
|
|
|
|
|
|
|
|
|
|
| ||||||||
External |
| $ | 1,502,726 |
| $ | 260,518 |
| $ | 177,341 |
| $ | 60,282 |
| $ | - |
| $ | 2,000,867 |
| $ | 1,700,707 |
| $ | 301,422 |
| $ | 211,271 |
| $ | 101,057 |
| $ | - |
| $ | 2,314,457 |
External Non-U.S. |
|
| 54,776 |
| 45,574 |
| 88 |
| 5 |
|
| - |
|
| 100,443 |
|
| 82,098 |
| 46,793 |
| 34 |
| - |
|
| - |
|
| 128,925 | ||||||
Other segments |
|
| 70,384 |
|
| 259,171 |
|
| 1,211 |
|
| 1,108 |
|
| (331,874) |
|
| - |
|
| 65,321 |
|
| 360,982 |
|
| 89 |
|
| 116 |
|
| (426,508) |
|
| - |
|
|
| 1,627,886 |
|
| 565,263 |
|
| 178,640 |
|
| 61,395 |
|
| (331,874) |
|
| 2,101,310 |
|
| 1,848,126 |
|
| 709,197 |
|
| 211,394 |
|
| 101,173 |
|
| (426,508) |
|
| 2,443,382 |
Operating income (loss) |
|
| 307,553 |
|
| 6,154 |
|
| 17,744 |
|
| (47,687) | (1) |
| 91 | (2) |
| 283,855 |
|
| 276,547 |
|
| 17,624 |
|
| 21,862 |
|
| (44,326) | (1) |
| (692) |
|
| 271,015 |
Income (loss) before income taxes |
| 285,131 |
| 2,437 |
|
| 15,645 |
| (59,999) |
|
| 91 |
|
| 243,305 |
| 255,539 |
| 16,020 |
|
| 20,199 |
| (56,754) |
|
| (692) |
|
| 234,312 | ||||||
Depreciation and amortization |
| 53,456 |
| 13,836 |
| 2,848 |
| 4,101 |
|
| (51) |
|
| 74,190 |
| 57,644 |
| 12,020 |
| 2,866 |
| 2,680 |
|
| - |
|
| 75,210 | ||||||||
Capital expenditures |
| 49,200 |
| 9,506 |
| 747 |
| 321 |
|
| - |
|
| 59,774 |
| 31,654 |
| 8,589 |
| 1,524 |
| 1,028 |
|
| - |
|
| 42,795 | ||||||||
|
|
|
|
|
|
|
|
|
|
|
|
|
|
|
|
|
|
|
|
|
|
|
|
|
|
|
|
| ||||||||
As of September 30, 2016 |
|
|
|
|
|
|
|
|
|
|
|
|
|
| ||||||||||||||||||||||
As of September 30, 2017 |
|
|
|
| �� |
|
|
|
|
|
|
|
|
|
| |||||||||||||||||||||
Assets |
| $ | 4,147,447 |
| $ | 1,034,637 |
| $ | 353,560 |
| $ | 1,374,469 | (3) | $ | (122,551) | (4) | $ | 6,787,562 |
| $ | 4,353,904 |
| $ | 1,032,018 |
| $ | 381,931 |
| $ | 1,346,968 | (2) | $ | (154,084) | (3) | $ | 6,960,737 |
|
|
|
|
|
|
|
|
|
|
|
|
|
|
|
|
|
|
|
|
|
|
|
|
|
|
|
|
|
|
|
|
|
|
|
| |
|
|
|
|
|
|
|
|
|
Footnotes related to the three months ended September 30, 2016 segment results (in millions): | ||||||||
|
|
|
|
|
|
|
|
|
(1) | Corporate SG&A | $ | (12.6) |
| (2) | Gross profit increase from intra-company sales | $ | - |
| Company-wide equity-based compensation |
| (6.1) |
|
|
|
|
|
| Profit sharing |
| (21.0) |
|
|
|
|
|
| Minnesota ironmaking operations |
| (4.1) |
|
|
|
|
|
| Other, net |
| (3.9) |
|
|
|
|
|
|
| $ | (47.7) |
|
|
|
|
|
|
|
|
|
|
|
|
|
|
(3) | Cash and equivalents | $ | 982.2 |
| (4) | Elimination of intra-company receivables | $ | (98.0) |
| Accounts receivable |
| 14.7 |
|
| Elimination of intra-company debt |
| (12.1) |
| Inventories |
| 36.2 |
|
| Other |
| (12.5) |
| Property, plant and equipment, net |
| 295.7 |
|
|
| $ | (122.6) |
| Intra-company debt |
| 12.1 |
|
|
|
|
|
| Other |
| 33.6 |
|
|
|
|
|
|
| $ | 1,374.5 |
|
|
|
|
|
|
|
|
|
|
|
|
|
|
|
| Footnotes related to the three months ended September 30, 2017, segment results (in millions): | ||||||||
|
|
|
|
|
|
|
|
|
|
(1) | Corporate SG&A | $ | (12.1) |
|
| (3) | Elimination of intra-company receivables | $ | (130.4) |
| Company-wide equity-based compensation |
| (6.8) |
|
|
| Elimination of intra-company debt |
| (10.7) |
| Profit sharing |
| (20.2) |
|
|
| Other |
| (13.0) |
| Other, net |
| (5.2) |
|
|
|
| $ | (154.1) |
|
| $ | (44.3) |
|
|
|
|
|
|
|
|
|
|
|
|
|
|
|
|
(2) | Cash and equivalents | $ | 1,065.9 |
|
|
|
|
|
|
| Accounts receivable |
| 14.0 |
|
|
|
|
|
|
| Inventories |
| 42.8 |
|
|
|
|
|
|
| Property, plant and equipment, net |
| 162.4 |
|
|
|
|
|
|
| Intra-company debt |
| 10.7 |
|
|
|
|
|
|
| Other |
| 51.2 |
|
|
|
|
|
|
|
| $ | 1,347.0 |
|
|
|
|
|
|
10
STEEL DYNAMICS, INC.
NOTES TO CONSOLIDATED FINANCIAL STATEMENTS (UNAUDITED)
Note 9. Segment Information (Continued)
|
|
|
|
|
|
|
|
|
|
|
|
|
|
|
|
|
|
|
|
|
|
|
|
|
|
|
|
|
|
|
|
|
|
|
|
|
|
|
|
|
|
| Metals |
| Steel |
|
|
|
|
|
|
|
|
| ||
For the three months ended |
| Steel |
| Recycling |
| Fabrication |
|
|
|
|
|
|
|
|
| |||
September 30, 2016 |
| Operations |
| Operations |
| Operations |
| Other |
| Eliminations |
| Consolidated | ||||||
|
|
|
|
|
|
|
|
|
|
|
|
|
|
|
|
|
|
|
Net Sales |
|
|
|
|
|
|
|
|
|
|
|
|
|
|
|
|
|
|
External |
| $ | 1,502,726 |
| $ | 260,518 |
| $ | 177,341 |
| $ | 60,282 |
| $ | - |
| $ | 2,000,867 |
External Non-U.S. |
|
| 54,776 |
|
| 45,574 |
|
| 88 |
|
| 5 |
|
| - |
|
| 100,443 |
Other segments |
|
| 70,384 |
|
| 259,171 |
|
| 1,211 |
|
| 1,108 |
|
| (331,874) |
|
| - |
|
|
| 1,627,886 |
|
| 565,263 |
|
| 178,640 |
|
| 61,395 |
|
| (331,874) |
|
| 2,101,310 |
Operating income (loss) |
|
| 307,553 |
|
| 6,154 |
|
| 17,744 |
|
| (47,687) | (1) |
| 91 |
|
| 283,855 |
Income (loss) before income taxes |
|
| 285,131 |
|
| 2,437 |
|
| 15,645 |
|
| (59,999) |
|
| 91 |
|
| 243,305 |
Depreciation and amortization |
|
| 53,456 |
|
| 13,836 |
|
| 2,848 |
|
| 4,101 |
|
| (51) |
|
| 74,190 |
Capital expenditures |
|
| 49,200 |
|
| 9,506 |
|
| 747 |
|
| 321 |
|
| - |
|
| 59,774 |
|
|
|
|
|
|
|
|
|
|
|
|
|
|
|
|
|
|
|
|
|
|
|
|
|
|
|
|
Footnotes related to the three months ended September 30, 2016, segment results (in millions): | ||||||||
|
|
|
|
|
|
|
|
|
(1) | Corporate SG&A | $ | (12.6) |
|
|
|
|
|
| Company-wide equity-based compensation |
| (6.1) |
|
|
|
|
|
| Profit sharing |
| (21.0) |
|
|
|
|
|
| Other, net |
| (8.0) |
|
|
|
|
|
|
| $ | (47.7) |
|
|
|
|
|
|
|
|
|
|
|
|
|
|
|
|
|
|
|
|
|
|
|
|
|
|
|
|
|
|
|
|
|
|
|
|
|
|
|
|
|
|
|
|
|
|
|
| Metals |
| Steel |
|
|
|
|
|
|
|
|
| ||
For the nine months ended |
| Steel |
| Recycling |
| Fabrication |
|
|
|
|
|
|
|
|
| |||
September 30, 2017 |
| Operations |
| Operations |
| Operations |
| Other |
| Eliminations |
| Consolidated | ||||||
|
|
|
|
|
|
|
|
|
|
|
|
|
|
|
|
|
|
|
Net Sales |
|
|
|
|
|
|
|
|
|
|
|
|
|
|
|
|
|
|
External |
| $ | 5,025,310 |
| $ | 910,830 |
| $ | 603,140 |
| $ | 281,091 |
| $ | - |
| $ | 6,820,371 |
External Non-U.S. |
|
| 237,070 |
|
| 144,750 |
|
| 127 |
|
| - |
|
| - |
|
| 381,947 |
Other segments |
|
| 183,374 |
|
| 1,067,770 |
|
| 244 |
|
| 1,065 |
|
| (1,252,453) |
|
| - |
|
|
| 5,445,754 |
|
| 2,123,350 |
|
| 603,511 |
|
| 282,156 |
|
| (1,252,453) |
|
| 7,202,318 |
Operating income (loss) |
|
| 895,008 |
|
| 51,968 |
|
| 65,735 |
|
| (141,406) | (1) |
| (371) |
|
| 870,934 |
Income (loss) before income taxes |
|
| 830,865 |
|
| 46,674 |
|
| 61,171 |
|
| (164,456) |
|
| (371) |
|
| 773,883 |
Depreciation and amortization |
|
| 170,125 |
|
| 37,048 |
|
| 8,743 |
|
| 8,152 |
|
| - |
|
| 224,068 |
Capital expenditures |
|
| 101,939 |
|
| 18,539 |
|
| 5,748 |
|
| 1,520 |
|
| - |
|
| 127,746 |
|
|
|
|
|
|
|
|
|
|
|
|
|
|
|
|
|
|
|
|
|
|
|
|
|
|
|
|
Footnotes related to the nine months ended September 30, 2017, segment results (in millions): | ||||||||
|
|
|
|
|
|
|
|
|
(1) | Corporate SG&A | $ | (37.9) |
|
|
|
|
|
| Company-wide equity-based compensation |
| (23.5) |
|
|
|
|
|
| Profit sharing |
| (66.8) |
|
|
|
|
|
| Other, net |
| (13.2) |
|
|
|
|
|
|
| $ | (141.4) |
|
|
|
|
|
11
STEEL DYNAMICS, INC.
NOTES TO CONSOLIDATED FINANCIAL STATEMENTS (UNAUDITED)
Note 10.9. Segment Information (Continued)
|
|
|
|
|
|
|
|
|
|
|
|
|
|
|
|
|
|
|
|
|
|
|
|
|
|
|
|
| ||||||||
|
|
|
|
|
|
|
|
|
|
|
|
|
|
|
|
|
|
|
|
|
|
|
|
|
|
|
|
| ||||||||
|
|
|
| Metals |
| Steel |
|
|
|
|
|
|
|
|
|
|
| Metals |
| Steel |
|
|
|
|
|
|
|
| ||||||||
For the three months ended |
| Steel |
| Recycling |
| Fabrication |
|
|
|
|
|
|
|
| ||||||||||||||||||||||
September 30, 2015 |
| Operations |
| Operations |
| Operations |
| Other |
| Eliminations |
| Consolidated | ||||||||||||||||||||||||
For the nine months ended |
| Steel |
| Recycling |
| Fabrication |
|
|
|
|
|
|
|
| ||||||||||||||||||||||
September 30, 2016 |
| Operations |
| Operations |
| Operations |
| Other |
| Eliminations |
| Consolidated | ||||||||||||||||||||||||
|
|
|
|
|
|
|
|
|
|
|
|
|
|
|
|
|
|
|
|
|
|
|
|
|
|
|
|
|
|
|
|
|
|
|
|
|
Net Sales |
|
|
|
|
|
|
|
|
|
|
|
|
|
|
|
|
|
|
|
|
|
|
|
|
|
|
|
| ||||||||
External |
| $ | 1,285,459 |
| $ | 294,357 |
| $ | 173,047 |
| $ | 78,802 |
| $ | - |
| $ | 1,831,665 |
| $ | 4,068,688 |
| $ | 769,260 |
| $ | 527,859 |
| $ | 210,358 |
| $ | - |
| $ | 5,576,165 |
External Non-U.S. |
|
| 65,928 |
| 51,215 |
| 1,907 |
| 208 |
|
| - |
|
| 119,258 |
|
| 172,694 |
| 117,299 |
| 167 |
| 188 |
|
| - |
|
| 290,348 | ||||||
Other segments |
|
| 56,146 |
|
| 270,888 |
|
| 2 |
|
| 4,209 |
|
| (331,245) |
|
| - |
|
| 178,190 |
|
| 756,613 |
|
| 2,415 |
|
| 3,603 |
|
| (940,821) |
|
| - |
|
|
| 1,407,533 |
|
| 616,460 |
|
| 174,956 |
|
| 83,219 |
|
| (331,245) |
|
| 1,950,923 |
|
| 4,419,572 |
|
| 1,643,172 |
|
| 530,441 |
|
| 214,149 |
|
| (940,821) |
|
| 5,866,513 |
Operating income (loss) |
|
| 124,712 |
|
| (3,555) |
|
| 36,733 |
|
| (28,401) | (1) |
| 1,540 | (2) |
| 131,029 |
|
| 712,939 |
|
| 20,014 |
|
| 73,230 |
|
| (125,186) | (1) |
| (9,055) | (2) |
| 671,942 |
Income (loss) before income taxes |
| 102,566 |
| (6,967) |
|
| 35,108 |
| (38,541) |
|
| 1,540 |
|
| 93,706 |
| 645,189 |
| 10,300 |
|
| 67,175 |
| (152,296) |
|
| (9,055) |
|
| 561,313 | ||||||
Depreciation and amortization |
| 52,404 |
| 15,913 |
| 2,300 |
| 3,645 |
|
| (51) |
|
| 74,211 |
| 159,614 |
| 42,666 |
| 8,431 |
| 12,413 |
|
| (154) |
|
| 222,970 | ||||||||
Capital expenditures |
| 21,975 |
| 6,286 |
| 935 |
| 1,090 |
|
| - |
|
| 30,286 |
| 103,202 |
| 17,068 |
| 1,918 |
| 980 |
|
| - |
|
| 123,168 | ||||||||
|
|
|
|
|
|
|
|
|
|
|
|
|
|
|
|
|
|
|
|
|
|
|
|
|
|
|
|
|
|
|
| |||||
As of September 30, 2015 |
|
|
|
|
|
|
|
|
|
|
|
|
|
| ||||||||||||||||||||||
Assets |
| $ | 4,096,188 |
| $ | 1,588,821 |
| $ | 372,673 |
| $ | 898,772 | (3) | $ | (113,913) | (4) | $ | 6,842,541 | ||||||||||||||||||
|
|
|
|
|
|
|
|
|
|
|
|
|
|
|
|
|
|
| ||||||||||||||||||
|
|
|
|
|
|
|
|
|
Footnotes related to the three months ended September 30, 2015 segment results (in millions): | ||||||||
|
|
|
|
|
|
|
|
|
(1) | Corporate SG&A | $ | (9.5) |
| (2) | Gross profit increase from intra-company sales | $ | 1.5 |
| Company-wide equity-based compensation |
| (5.3) |
|
|
|
|
|
| Profit sharing |
| (7.5) |
|
|
|
|
|
| Minnesota ironmaking operations |
| (4.1) |
|
|
|
|
|
| Other, net |
| (2.0) |
|
|
|
|
|
|
| $ | (28.4) |
|
|
|
|
|
|
|
|
|
|
|
|
|
|
(3) | Cash and equivalents | $ | 415.7 |
| (4) | Elimination of intra-company receivables | $ | (100.8) |
| Accounts receivable |
| 30.0 |
|
| Elimination of intra-company debt |
| (6.5) |
| Inventories |
| 36.8 |
|
| Other |
| (6.6) |
| Property, plant and equipment, net |
| 309.6 |
|
|
| $ | (113.9) |
| Intra-company debt |
| 6.5 |
|
|
|
|
|
| Other |
| 100.2 |
|
|
|
|
|
|
| $ | 898.8 |
|
|
|
|
|
|
|
|
|
|
|
|
|
|
Footnotes related to the nine months ended September 30, 2016, segment results (in millions): | ||||||||
|
|
|
|
|
|
|
|
|
(1) | Corporate SG&A | $ | (38.5) |
| (2) | Gross profit decrease from intra-company sales | $ | (9.1) |
| Company-wide equity-based compensation |
| (20.4) |
|
|
|
|
|
| Profit sharing |
| (47.7) |
|
|
|
|
|
| Other, net |
| (18.6) |
|
|
|
|
|
|
| $ | (125.2) |
|
|
|
|
|
12
STEEL DYNAMICS, INC.
NOTES TO CONSOLIDATED FINANCIAL STATEMENTS (UNAUDITED)
Note 10. Segment Information (Continued)
|
|
|
|
|
|
|
|
|
|
|
|
|
|
|
|
|
|
|
|
|
|
|
|
|
|
|
|
|
|
|
|
|
|
|
|
|
|
|
|
|
|
| Metals |
| Steel |
|
|
|
|
|
|
|
|
| ||
For the nine months ended |
| Steel |
| Recycling |
| Fabrication |
|
|
|
|
|
|
|
|
| |||
September 30, 2016 |
| Operations |
| Operations |
| Operations |
| Other |
| Eliminations |
| Consolidated | ||||||
|
|
|
|
|
|
|
|
|
|
|
|
|
|
|
|
|
|
|
Net Sales |
|
|
|
|
|
|
|
|
|
|
|
|
|
|
|
|
|
|
External |
| $ | 4,068,688 |
| $ | 769,260 |
| $ | 527,859 |
| $ | 210,358 |
| $ | - |
| $ | 5,576,165 |
External Non-U.S. |
|
| 172,694 |
|
| 117,299 |
|
| 167 |
|
| 188 |
|
| - |
|
| 290,348 |
Other segments |
|
| 178,190 |
|
| 756,613 |
|
| 2,415 |
|
| 3,603 |
|
| (940,821) |
|
| - |
|
|
| 4,419,572 |
|
| 1,643,172 |
|
| 530,441 |
|
| 214,149 |
|
| (940,821) |
|
| 5,866,513 |
Operating income (loss) |
|
| 712,939 |
|
| 20,014 |
|
| 73,230 |
|
| (125,186) | (1) |
| (9,055) | (2) |
| 671,942 |
Income (loss) before income taxes |
|
| 645,189 |
|
| 10,300 |
|
| 67,175 |
|
| (152,296) |
|
| (9,055) |
|
| 561,313 |
Depreciation and amortization |
|
| 159,614 |
|
| 42,666 |
|
| 8,431 |
|
| 12,413 |
|
| (154) |
|
| 222,970 |
Capital expenditures |
|
| 103,202 |
|
| 17,068 |
|
| 1,918 |
|
| 980 |
|
| - |
|
| 123,168 |
|
|
|
|
|
|
|
|
|
|
|
|
|
|
|
|
|
|
|
|
|
|
|
|
|
|
|
|
Footnotes related to the nine months ended September 30, 2016 segment results (in millions): | ||||||||
|
|
|
|
|
|
|
|
|
(1) | Corporate SG&A | $ | (38.5) |
| (2) | Gross profit decrease from intra-company sales | $ | (9.1) |
| Company-wide equity-based compensation |
| (20.4) |
|
|
|
|
|
| Profit sharing |
| (47.7) |
|
|
|
|
|
| Minnesota ironmaking operations |
| (12.4) |
|
|
|
|
|
| Other, net |
| (6.2) |
|
|
|
|
|
|
| $ | (125.2) |
|
|
|
|
|
|
|
|
|
|
|
|
|
|
|
|
|
|
|
|
|
|
|
|
|
|
|
|
|
|
|
|
|
|
|
|
|
|
|
|
|
|
|
|
|
|
|
| Metals |
| Steel |
|
|
|
|
|
|
|
|
| ||
For the nine months ended |
| Steel |
| Recycling |
| Fabrication |
|
|
|
|
|
|
|
|
| |||
September 30, 2015 |
| Operations |
| Operations |
| Operations |
| Other |
| Eliminations |
| Consolidated | ||||||
|
|
|
|
|
|
|
|
|
|
|
|
|
|
|
|
|
|
|
Net Sales |
|
|
|
|
|
|
|
|
|
|
|
|
|
|
|
|
|
|
External |
| $ | 3,902,162 |
| $ | 1,014,753 |
| $ | 488,584 |
| $ | 237,501 |
| $ | - |
| $ | 5,643,000 |
External Non-U.S. |
|
| 210,320 |
|
| 147,626 |
|
| 1,907 |
|
| 512 |
|
| - |
|
| 360,365 |
Other segments |
|
| 158,609 |
|
| 751,542 |
|
| 18 |
|
| 29,114 |
|
| (939,283) |
|
| - |
|
|
| 4,271,091 |
|
| 1,913,921 |
|
| 490,509 |
|
| 267,127 |
|
| (939,283) |
|
| 6,003,365 |
Operating income (loss) |
|
| 338,690 |
|
| 229 |
|
| 85,754 |
|
| (117,273) | (1) |
| 959 | (2) |
| 308,359 |
Income (loss) before income taxes |
|
| 269,187 |
|
| (12,780) |
|
| 80,581 |
|
| (162,141) |
|
| 959 |
|
| 175,806 |
Depreciation and amortization |
|
| 154,616 |
|
| 50,207 |
|
| 6,688 |
|
| 9,948 |
|
| (153) |
|
| 221,306 |
Capital expenditures |
|
| 52,324 |
|
| 17,332 |
|
| 2,506 |
|
| 14,296 |
|
| - |
|
| 86,458 |
|
|
|
|
|
|
|
|
|
|
|
|
|
|
|
|
|
|
|
|
|
|
|
|
|
|
|
|
Footnotes related to the nine months ended September 30, 2015 segment results (in millions): | ||||||||
|
|
|
|
|
|
|
|
|
(1) | Corporate SG&A | $ | (27.1) |
| (2) | Gross profit increase from intra-company sales | $ | 1.0 |
| Company-wide equity-based compensation |
| (17.5) |
|
|
|
|
|
| Profit sharing |
| (14.4) |
|
|
|
|
|
| Minnesota ironmaking operations |
| (50.3) |
|
|
|
|
|
| Other, net |
| (8.0) |
|
|
|
|
|
|
| $ | (117.3) |
|
|
|
|
|
13
STEEL DYNAMICS, INC.
NOTES TO CONSOLIDATED FINANCIAL STATEMENTS (UNAUDITED)
Note 11.10. Condensed Consolidating Information
Certain 100%‑owned subsidiaries of SDI have fully and unconditionally guaranteed all of the indebtedness relating to the issuance of the company’s senior unsecured notes due 2019, 2021, 2022, 2023, 2024, 2025 and 2024.2026. Following are the company’s condensed consolidating financial statements, including the guarantors, which present the financial position, results of operations, and cash flows of (i) SDI (in each case, reflecting investments in its consolidated subsidiaries under the equity method of accounting), (ii) the guarantor subsidiaries of SDI, (iii) the non-guarantor subsidiaries of SDI, and (iv) the eliminations necessary to arrive at the information on a consolidated basis. The following statements should be read in conjunction with the accompanying consolidated financial statements and the company’s Annual Report on Form 10-K for the year ended December 31, 2015.
2016.
|
|
|
|
|
|
|
|
|
|
|
|
|
|
|
|
|
|
|
|
| ||||||||||
|
|
|
|
|
|
|
|
|
|
|
|
|
|
|
|
|
|
|
|
| ||||||||||
Condensed Consolidating Balance Sheets (in thousands) | Condensed Consolidating Balance Sheets (in thousands) |
|
|
|
|
|
|
|
| Condensed Consolidating Balance Sheets (in thousands) |
|
|
|
|
|
|
|
| ||||||||||||
|
|
|
|
|
| Combined |
| Consolidating |
| Total |
|
|
|
|
| Combined |
| Consolidating |
| Total | ||||||||||
As of September 30, 2016 |
| Parent |
| Guarantors |
| Non-Guarantors |
| Adjustments |
| Consolidated | ||||||||||||||||||||
As of September 30, 2017 |
| Parent |
| Guarantors |
| Non-Guarantors |
| Adjustments |
| Consolidated | ||||||||||||||||||||
Cash and equivalents |
| $ | 972,610 |
| $ | 61,054 |
| $ | 17,825 |
| $ | - |
| $ | 1,051,489 |
| $ | 1,064,499 |
| $ | 32,968 |
| $ | 4,497 |
| $ | - |
| $ | 1,101,964 |
Accounts receivable, net |
| 238,290 |
|
| 1,248,565 |
|
| 41,667 |
|
| (749,063) |
|
| 779,459 |
| 294,753 |
|
| 1,450,968 |
|
| 48,082 |
|
| (870,786) |
|
| 923,017 | ||
Inventories |
| 588,583 |
|
| 634,942 |
|
| 59,837 |
|
| (7,787) |
|
| 1,275,575 |
| 669,076 |
|
| 754,526 |
|
| 72,990 |
|
| (9,076) |
|
| 1,487,516 | ||
Other current assets |
|
| 17,109 |
|
| 10,598 |
|
| 4,373 |
|
| (1,959) |
|
| 30,121 |
|
| 36,828 |
|
| 21,404 |
|
| 5,124 |
|
| (3,708) |
|
| 59,648 |
Total current assets |
|
| 1,816,592 |
|
| 1,955,159 |
|
| 123,702 |
|
| (758,809) |
|
| 3,136,644 |
|
| 2,065,156 |
|
| 2,259,866 |
|
| 130,693 |
|
| (883,570) |
|
| 3,572,145 |
Property, plant and equipment, net |
| 921,850 |
|
| 1,684,925 |
|
| 323,308 |
|
| (1,857) |
|
| 2,928,226 |
| 873,015 |
|
| 1,634,215 |
|
| 201,547 |
|
| - |
|
| 2,708,777 | ||
Intangible assets, net |
| - |
|
| 259,231 |
|
| 32,583 |
|
| - |
|
| 291,814 |
| - |
|
| 231,838 |
|
| 31,519 |
|
| - |
|
| 263,357 | ||
Goodwill |
| - |
|
| 392,678 |
|
| 7,189 |
|
| - |
|
| 399,867 |
| - |
|
| 380,695 |
|
| 7,823 |
|
| - |
|
| 388,518 | ||
Other assets, including investments in subs |
|
| 2,916,319 |
|
| 8,023 |
|
| 6,411 |
|
| (2,899,742) |
|
| 31,011 |
|
| 2,611,965 |
|
| 7,060 |
|
| 5,578 |
|
| (2,596,663) |
|
| 27,940 |
Total assets |
| $ | 5,654,761 |
| $ | 4,300,016 |
| $ | 493,193 |
| $ | (3,660,408) |
| $ | 6,787,562 |
| $ | 5,550,136 |
| $ | 4,513,674 |
| $ | 377,160 |
| $ | (3,480,233) |
| $ | 6,960,737 |
|
|
|
|
|
|
|
|
|
|
|
|
|
|
|
|
|
|
|
|
|
|
|
|
|
|
|
|
|
|
|
Accounts payable |
| $ | 171,302 |
| $ | 274,873 |
| $ | 80,690 |
| $ | (89,029) |
| $ | 437,836 |
| $ | 196,177 |
| $ | 348,347 |
| $ | 106,208 |
| $ | (122,049) |
| $ | 528,683 |
Accrued expenses |
| 229,039 |
|
| 212,493 |
|
| 8,068 |
|
| (109,478) |
|
| 340,122 |
| 224,156 |
|
| 251,694 |
|
| 9,437 |
|
| (130,102) |
|
| 355,185 | ||
Current maturities of long-term debt |
|
| 13,161 |
|
| 700 |
|
| 32,248 |
|
| (29,954) |
|
| 16,155 |
|
| 167,840 |
|
| - |
|
| 40,482 |
|
| (25,661) |
|
| 182,661 |
Total current liabilities |
|
| 413,502 |
|
| 488,066 |
|
| 121,006 |
|
| (228,461) |
|
| 794,113 |
|
| 588,173 |
|
| 600,041 |
|
| 156,127 |
|
| (277,812) |
|
| 1,066,529 |
Long-term debt |
|
| 2,541,145 |
|
| - |
|
| 171,622 |
|
| (141,930) |
|
| 2,570,837 |
|
| 2,324,240 |
|
| - |
|
| 172,243 |
|
| (145,000) |
|
| 2,351,483 |
Other liabilities |
| (265,803) |
|
| 1,155,611 |
|
| 61,932 |
|
| (480,830) |
|
| 470,910 |
|
| (467,002) |
|
| 983,737 |
|
| 27,238 |
|
| (62,269) |
|
| 481,704 | |
Total liabilities |
|
| 2,445,411 |
|
| 1,583,778 |
|
| 355,608 |
|
| (485,081) |
|
| 3,899,716 | |||||||||||||||
|
|
|
|
|
|
|
|
|
|
|
|
|
|
|
|
|
|
|
|
|
|
|
|
|
|
|
|
| ||
Redeemable noncontrolling interests |
| - |
|
| - |
|
| 126,340 |
|
| - |
|
| 126,340 |
| - |
|
| - |
|
| 111,240 |
|
| - |
|
| 111,240 | ||
|
|
|
|
|
|
|
|
|
|
|
|
|
|
|
|
|
|
|
|
|
|
|
|
|
|
|
|
| ||
Common stock |
| 640 |
|
| 1,727,859 |
|
| 18,120 |
|
| (1,745,979) |
|
| 640 |
| 641 |
|
| 1,727,859 |
|
| 14,908 |
|
| (1,742,767) |
|
| 641 | ||
Treasury stock |
| (392,051) |
|
| - |
|
| - |
|
| - |
|
| (392,051) |
| (650,210) |
|
| - |
|
| - |
|
| - |
|
| (650,210) | ||
Additional paid-in-capital |
| 1,132,365 |
|
| 128,076 |
|
| 773,793 |
|
| (901,869) |
|
| 1,132,365 |
| 1,147,463 |
|
| 128,076 |
|
| 791,196 |
|
| (919,272) |
|
| 1,147,463 | ||
Retained earnings (deficit) |
|
| 2,224,963 |
|
| 800,404 |
|
| (639,065) |
|
| (161,339) |
|
| 2,224,963 |
|
| 2,606,831 |
|
| 1,073,961 |
|
| (740,848) |
|
| (333,113) |
|
| 2,606,831 |
Total Steel Dynamics, Inc. equity |
|
| 2,965,917 |
|
| 2,656,339 |
|
| 152,848 |
|
| (2,809,187) |
|
| 2,965,917 |
|
| 3,104,725 |
|
| 2,929,896 |
|
| 65,256 |
|
| (2,995,152) |
|
| 3,104,725 |
Noncontrolling interests |
|
| - |
|
| - |
|
| (140,555) |
|
| - |
|
| (140,555) |
|
| - |
|
| - |
|
| (154,944) |
|
| - |
|
| (154,944) |
Total equity |
|
| 2,965,917 |
|
| 2,656,339 |
|
| 12,293 |
|
| (2,809,187) |
|
| 2,825,362 |
|
| 3,104,725 |
|
| 2,929,896 |
|
| (89,688) |
|
| (2,995,152) |
|
| 2,949,781 |
Total liabilities and equity |
| $ | 5,654,761 |
| $ | 4,300,016 |
| $ | 493,193 |
| $ | (3,660,408) |
| $ | 6,787,562 |
| $ | 5,550,136 |
| $ | 4,513,674 |
| $ | 377,160 |
| $ | (3,480,233) |
| $ | 6,960,737 |
13
STEEL DYNAMICS, INC.
NOTES TO CONSOLIDATED FINANCIAL STATEMENTS (UNAUDITED)
Note 10. Condensed Consolidating Information (Continued)
|
|
|
|
|
|
|
|
|
|
|
|
|
|
|
|
|
|
|
|
|
|
|
|
|
|
|
|
|
|
|
|
|
|
|
|
|
|
|
| Combined |
| Consolidating |
| Total | |||
As of December 31, 2016 |
| Parent |
| Guarantors |
| Non-Guarantors |
| Adjustments |
| Consolidated | |||||
Cash and equivalents |
| $ | 766,685 |
| $ | 54,677 |
| $ | 20,121 |
| $ | - |
| $ | 841,483 |
Accounts receivable, net |
|
| 229,148 |
|
| 1,257,245 |
|
| 23,689 |
|
| (780,298) |
|
| 729,784 |
Inventories |
|
| 587,319 |
|
| 639,148 |
|
| 58,696 |
|
| (9,952) |
|
| 1,275,211 |
Other current assets |
|
| 45,049 |
|
| 36,062 |
|
| 4,447 |
|
| (2,361) |
|
| 83,197 |
Total current assets |
|
| 1,628,201 |
|
| 1,987,132 |
|
| 106,953 |
|
| (792,611) |
|
| 2,929,675 |
Property, plant and equipment, net |
|
| 899,370 |
|
| 1,679,751 |
|
| 208,094 |
|
| - |
|
| 2,787,215 |
Intangible assets, net |
|
| - |
|
| 251,919 |
|
| 32,058 |
|
| - |
|
| 283,977 |
Goodwill |
|
| - |
|
| 385,527 |
|
| 7,824 |
|
| - |
|
| 393,351 |
Other assets, including investments in subs |
|
| 2,769,884 |
|
| 7,335 |
|
| 5,832 |
|
| (2,753,537) |
|
| 29,514 |
Total assets |
| $ | 5,297,455 |
| $ | 4,311,664 |
| $ | 360,761 |
| $ | (3,546,148) |
| $ | 6,423,732 |
|
|
|
|
|
|
|
|
|
|
|
|
|
|
|
|
Accounts payable |
| $ | 141,089 |
| $ | 265,764 |
| $ | 89,659 |
| $ | (101,316) |
| $ | 395,196 |
Accrued expenses |
|
| 198,085 |
|
| 220,917 |
|
| 8,793 |
|
| (113,808) |
|
| 313,987 |
Current maturities of long-term debt |
|
| 674 |
|
| 700 |
|
| 29,347 |
|
| (27,089) |
|
| 3,632 |
Total current liabilities |
|
| 339,848 |
|
| 487,381 |
|
| 127,799 |
|
| (242,213) |
|
| 712,815 |
Long-term debt |
|
| 2,324,298 |
|
| - |
|
| 168,566 |
|
| (139,670) |
|
| 2,353,194 |
Other liabilities |
|
| (293,711) |
|
| 1,219,444 |
|
| 42,482 |
|
| (499,191) |
|
| 469,024 |
Total liabilities |
|
| 2,370,435 |
|
| 1,706,825 |
|
| 338,847 |
|
| (881,074) |
|
| 3,535,033 |
|
|
|
|
|
|
|
|
|
|
|
|
|
|
|
|
Redeemable noncontrolling interests |
|
| - |
|
| - |
|
| 111,240 |
|
| - |
|
| 111,240 |
|
|
|
|
|
|
|
|
|
|
|
|
|
|
|
|
Common stock |
|
| 641 |
|
| 1,727,859 |
|
| 14,908 |
|
| (1,742,767) |
|
| 641 |
Treasury stock |
|
| (416,829) |
|
| - |
|
| - |
|
| - |
|
| (416,829) |
Additional paid-in-capital |
|
| 1,132,749 |
|
| 128,076 |
|
| 779,678 |
|
| (907,754) |
|
| 1,132,749 |
Retained earnings (deficit) |
|
| 2,210,459 |
|
| 748,904 |
|
| (734,351) |
|
| (14,553) |
|
| 2,210,459 |
Total Steel Dynamics, Inc. equity |
|
| 2,927,020 |
|
| 2,604,839 |
|
| 60,235 |
|
| (2,665,074) |
|
| 2,927,020 |
Noncontrolling interests |
|
| - |
|
| - |
|
| (149,561) |
|
| - |
|
| (149,561) |
Total equity |
|
| 2,927,020 |
|
| 2,604,839 |
|
| (89,326) |
|
| (2,665,074) |
|
| 2,777,459 |
Total liabilities and equity |
| $ | 5,297,455 |
| $ | 4,311,664 |
| $ | 360,761 |
| $ | (3,546,148) |
| $ | 6,423,732 |
14
STEEL DYNAMICS, INC.
NOTES TO CONSOLIDATED FINANCIAL STATEMENTS (UNAUDITED)
Note 11.10. Condensed Consolidating Information (Continued)
|
|
|
|
|
|
|
|
|
|
|
|
|
|
|
|
|
|
|
|
|
|
|
|
|
|
|
|
|
|
|
|
Condensed Consolidating Statements of Operations (in thousands) |
|
|
|
|
|
|
|
|
|
|
|
| |||
|
|
|
|
|
|
|
|
|
|
|
|
|
|
|
|
For the three months ended, |
|
|
|
|
|
|
| Combined |
| Consolidating |
| Total | |||
September 30, 2017 |
| Parent |
| Guarantors |
| Non-Guarantors |
| Adjustments |
| Consolidated | |||||
Net sales |
| $ | 946,136 |
| $ | 2,641,067 |
| $ | 161,556 |
| $ | (1,305,377) |
| $ | 2,443,382 |
Costs of goods sold |
|
| 763,310 |
|
| 2,402,670 |
|
| 157,564 |
|
| (1,276,680) |
|
| 2,046,864 |
Gross profit |
|
| 182,826 |
|
| 238,397 |
|
| 3,992 |
|
| (28,697) |
|
| 396,518 |
Selling, general and administrative |
|
| 51,464 |
|
| 74,151 |
|
| 4,896 |
|
| (5,008) |
|
| 125,503 |
Operating income (loss) |
|
| 131,362 |
|
| 164,246 |
|
| (904) |
|
| (23,689) |
|
| 271,015 |
Interest expense, net of capitalized interest |
|
| 18,831 |
|
| 14,481 |
|
| 3,181 |
|
| (2,316) |
|
| 34,177 |
Other (income) expense, net |
|
| 2,660 |
|
| (2,492) |
|
| 42 |
|
| 2,316 |
|
| 2,526 |
Income (loss) before income taxes and |
|
|
|
|
|
|
|
|
|
|
|
|
|
|
|
equity in net income of subsidiaries |
|
| 109,871 |
|
| 152,257 |
|
| (4,127) |
|
| (23,689) |
|
| 234,312 |
Income taxes |
|
| 35,309 |
|
| 55,183 |
|
| 1,169 |
|
| (8,361) |
|
| 83,300 |
|
|
| 74,562 |
|
| 97,074 |
|
| (5,296) |
|
| (15,328) |
|
| 151,012 |
Equity in net income of subsidiaries |
|
| 78,696 |
|
| - |
|
| - |
|
| (78,696) |
|
| - |
Net loss attributable to noncontrolling interests |
|
| - |
|
| - |
|
| 2,246 |
|
| - |
|
| 2,246 |
Net income (loss) attributable to Steel Dynamics, Inc. |
| $ | 153,258 |
| $ | 97,074 |
| $ | (3,050) |
| $ | (94,024) |
| $ | 153,258 |
|
|
|
|
|
|
|
|
|
|
|
|
|
|
|
|
|
|
|
|
|
|
|
|
|
|
|
|
|
|
|
|
|
|
|
|
|
|
|
| Combined |
| Consolidating |
| Total | |||
As of December 31, 2015 |
| Parent |
| Guarantors |
| Non-Guarantors |
| Adjustments |
| Consolidated | |||||
Cash and equivalents |
| $ | 636,877 |
| $ | 81,976 |
| $ | 8,179 |
| $ | - |
| $ | 727,032 |
Accounts receivable, net |
|
| 200,094 |
|
| 1,056,285 |
|
| 29,775 |
|
| (672,549) |
|
| 613,605 |
Inventories |
|
| 539,963 |
|
| 573,924 |
|
| 35,004 |
|
| 499 |
|
| 1,149,390 |
Other current assets |
|
| 21,654 |
|
| 25,415 |
|
| 1,676 |
|
| (831) |
|
| 47,914 |
Total current assets |
|
| 1,398,588 |
|
| 1,737,600 |
|
| 74,634 |
|
| (672,881) |
|
| 2,537,941 |
Property, plant and equipment, net |
|
| 958,212 |
|
| 1,703,932 |
|
| 291,077 |
|
| (2,011) |
|
| 2,951,210 |
Intangible assets, net |
|
| - |
|
| 278,960 |
|
| - |
|
| - |
|
| 278,960 |
Goodwill |
|
| - |
|
| 397,470 |
|
| - |
|
| - |
|
| 397,470 |
Other assets, including investments in subs |
|
| 2,941,710 |
|
| 10,040 |
|
| 6,137 |
|
| (2,921,386) |
|
| 36,501 |
Total assets |
| $ | 5,298,510 |
| $ | 4,128,002 |
| $ | 371,848 |
| $ | (3,596,278) |
| $ | 6,202,082 |
|
|
|
|
|
|
|
|
|
|
|
|
|
|
|
|
Accounts payable |
| $ | 100,751 |
| $ | 183,344 |
| $ | 68,948 |
| $ | (69,688) |
| $ | 283,355 |
Accrued expenses |
|
| 141,552 |
|
| 185,873 |
|
| 4,779 |
|
| (96,949) |
|
| 235,255 |
Current maturities of long-term debt |
|
| 13,122 |
|
| 700 |
|
| 24,975 |
|
| (22,117) |
|
| 16,680 |
Total current liabilities |
|
| 255,425 |
|
| 369,917 |
|
| 98,702 |
|
| (188,754) |
|
| 535,290 |
Long-term debt |
|
| 2,546,606 |
|
| 361 |
|
| 177,897 |
|
| (146,888) |
|
| 2,577,976 |
Other liabilities |
|
| (183,248) |
|
| 1,342,541 |
|
| 63,020 |
|
| (804,948) |
|
| 417,365 |
|
|
|
|
|
|
|
|
|
|
|
|
|
|
|
|
Redeemable noncontrolling interests |
|
| - |
|
| - |
|
| 126,340 |
|
| - |
|
| 126,340 |
|
|
|
|
|
|
|
|
|
|
|
|
|
|
|
|
Common stock |
|
| 638 |
|
| 1,727,859 |
|
| 18,120 |
|
| (1,745,979) |
|
| 638 |
Treasury stock |
|
| (396,455) |
|
| - |
|
| - |
|
| - |
|
| (396,455) |
Additional paid-in-capital |
|
| 1,110,253 |
|
| 117,737 |
|
| 646,787 |
|
| (764,524) |
|
| 1,110,253 |
Retained earnings (deficit) |
|
| 1,965,291 |
|
| 569,587 |
|
| (624,402) |
|
| 54,815 |
|
| 1,965,291 |
Total Steel Dynamics, Inc. equity |
|
| 2,679,727 |
|
| 2,415,183 |
|
| 40,505 |
|
| (2,455,688) |
|
| 2,679,727 |
Noncontrolling interests |
|
| - |
|
| - |
|
| (134,616) |
|
| - |
|
| (134,616) |
Total equity |
|
| 2,679,727 |
|
| 2,415,183 |
|
| (94,111) |
|
| (2,455,688) |
|
| 2,545,111 |
Total liabilities and equity |
| $ | 5,298,510 |
| $ | 4,128,002 |
| $ | 371,848 |
| $ | (3,596,278) |
| $ | 6,202,082 |
|
|
|
|
|
|
|
|
|
|
|
|
|
|
|
|
|
|
|
|
|
|
|
|
|
|
|
|
|
|
|
|
For the three months ended, |
|
|
|
|
|
|
| Combined |
| Consolidating |
| Total | |||
September 30, 2016 |
| Parent |
| Guarantors |
| Non-Guarantors |
| Adjustments |
| Consolidated | |||||
Net sales |
| $ | 845,585 |
| $ | 2,258,466 |
| $ | 96,409 |
| $ | (1,099,150) |
| $ | 2,101,310 |
Costs of goods sold |
|
| 647,983 |
|
| 2,016,874 |
|
| 100,470 |
|
| (1,072,520) |
|
| 1,692,807 |
Gross profit (loss) |
|
| 197,602 |
|
| 241,592 |
|
| (4,061) |
|
| (26,630) |
|
| 408,503 |
Selling, general and administrative |
|
| 52,995 |
|
| 72,605 |
|
| 4,134 |
|
| (5,086) |
|
| 124,648 |
Operating income (loss) |
|
| 144,607 |
|
| 168,987 |
|
| (8,195) |
|
| (21,544) |
|
| 283,855 |
Interest expense, net of capitalized interest |
|
| 17,818 |
|
| 17,741 |
|
| 2,847 |
|
| (2,207) |
|
| 36,199 |
Other (income) expense, net |
|
| 2,342 |
|
| 3,937 |
|
| (4,135) |
|
| 2,207 |
|
| 4,351 |
Income (loss) before income taxes and |
|
|
|
|
|
|
|
|
|
|
|
|
|
|
|
equity in net income of subsidiaries |
|
| 124,447 |
|
| 147,309 |
|
| (6,907) |
|
| (21,544) |
|
| 243,305 |
Income taxes |
|
| 40,242 |
|
| 55,684 |
|
| 797 |
|
| (7,831) |
|
| 88,892 |
|
|
| 84,205 |
|
| 91,625 |
|
| (7,704) |
|
| (13,713) |
|
| 154,413 |
Equity in net income of subsidiaries |
|
| 73,192 |
|
| - |
|
| - |
|
| (73,192) |
|
| - |
Net loss attributable to noncontrolling interests |
|
| - |
|
| - |
|
| 2,984 |
|
| - |
|
| 2,984 |
Net income (loss) attributable to Steel Dynamics, Inc. |
| $ | 157,397 |
| $ | 91,625 |
| $ | (4,720) |
| $ | (86,905) |
| $ | 157,397 |
15
STEEL DYNAMICS, INC.
NOTES TO CONSOLIDATED FINANCIAL STATEMENTS (UNAUDITED)
Note 11.10. Condensed Consolidating Information (Continued)
|
|
|
|
|
|
|
|
|
|
|
|
|
|
|
|
|
|
|
|
|
|
|
|
|
|
|
|
|
|
|
|
For the nine months ended, |
|
|
|
|
|
|
| Combined |
| Consolidating |
| Total | |||
September 30, 2017 |
| Parent |
| Guarantors |
| Non-Guarantors |
| Adjustments |
| Consolidated | |||||
Net sales |
| $ | 2,797,557 |
| $ | 7,827,981 |
| $ | 449,902 |
| $ | (3,873,122) |
| $ | 7,202,318 |
Costs of goods sold |
|
| 2,241,936 |
|
| 7,054,938 |
|
| 432,657 |
|
| (3,788,403) |
|
| 5,941,128 |
Gross profit (loss) |
|
| 555,621 |
|
| 773,043 |
|
| 17,245 |
|
| (84,719) |
|
| 1,261,190 |
Selling, general and administrative |
|
| 164,061 |
|
| 226,153 |
|
| 15,253 |
|
| (15,211) |
|
| 390,256 |
Operating income (loss) |
|
| 391,560 |
|
| 546,890 |
|
| 1,992 |
|
| (69,508) |
|
| 870,934 |
Interest expense, net of capitalized interest |
|
| 55,353 |
|
| 44,245 |
|
| 9,494 |
|
| (7,073) |
|
| 102,019 |
Other (income) expense, net |
|
| (4,463) |
|
| (7,305) |
|
| (273) |
|
| 7,073 |
|
| (4,968) |
Income (loss) before income taxes and |
|
|
|
|
|
|
|
|
|
|
|
|
|
|
|
equity in net income of subsidiaries |
|
| 340,670 |
|
| 509,950 |
|
| (7,229) |
|
| (69,508) |
|
| 773,883 |
Income taxes |
|
| 106,036 |
|
| 184,891 |
|
| 4,651 |
|
| (24,320) |
|
| 271,258 |
|
|
| 234,634 |
|
| 325,059 |
|
| (11,880) |
|
| (45,188) |
|
| 502,625 |
Equity in net income of subsidiaries |
|
| 273,374 |
|
| - |
|
| - |
|
| (273,374) |
|
| - |
Net loss attributable to noncontrolling interests |
|
| - |
|
| - |
|
| 5,383 |
|
| - |
|
| 5,383 |
Net income (loss) attributable to Steel Dynamics, Inc. |
| $ | 508,008 |
| $ | 325,059 |
| $ | (6,497) |
| $ | (318,562) |
| $ | 508,008 |
|
|
|
|
|
|
|
|
|
|
|
|
|
|
|
|
|
|
|
|
|
|
| ||||||||
|
|
|
|
|
|
|
|
|
|
|
|
|
|
|
|
|
|
|
|
|
|
| ||||||||
Condensed Consolidating Statements of Operations (in thousands) |
|
|
|
|
|
|
|
| ||||||||||||||||||||||
|
|
|
|
|
|
|
|
|
|
|
| |||||||||||||||||||
For the three months ended, |
|
|
|
|
|
| Combined |
| Consolidating |
| Total | |||||||||||||||||||
For the nine months ended, |
|
|
|
|
|
| Combined |
| Consolidating |
| Total | |||||||||||||||||||
September 30, 2016 |
| Parent |
| Guarantors |
| Non-Guarantors |
| Adjustments |
| Consolidated |
| Parent |
| Guarantors |
| Non-Guarantors |
| Adjustments |
| Consolidated | ||||||||||
Net sales |
| $ | 845,585 |
| $ | 2,258,466 |
| $ | 96,409 |
| $ | (1,099,150) |
| $ | 2,101,310 |
| $ | 2,297,389 |
| $ | 6,322,158 |
| $ | 271,694 |
| $ | (3,024,728) |
| $ | 5,866,513 |
Costs of goods sold |
|
| 647,983 |
|
| 2,016,874 |
|
| 100,470 |
|
| (1,072,520) |
|
| 1,692,807 |
|
| 1,823,408 |
|
| 5,676,265 |
|
| 286,486 |
|
| (2,944,568) |
|
| 4,841,591 |
Gross profit (loss) |
|
| 197,602 |
|
| 241,592 |
|
| (4,061) |
|
| (26,630) |
|
| 408,503 |
|
| 473,981 |
|
| 645,893 |
|
| (14,792) |
|
| (80,160) |
|
| 1,024,922 |
Selling, general and administrative |
|
| 52,995 |
|
| 72,605 |
|
| 4,134 |
|
| (5,086) |
|
| 124,648 |
|
| 145,596 |
|
| 212,613 |
|
| 9,352 |
|
| (14,581) |
|
| 352,980 |
Operating income (loss) |
|
| 144,607 |
|
| 168,987 |
|
| (8,195) |
|
| (21,544) |
|
| 283,855 |
|
| 328,385 |
|
| 433,280 |
|
| (24,144) |
|
| (65,579) |
|
| 671,942 |
Interest expense, net of capitalized interest |
|
| 17,818 |
|
| 17,741 |
|
| 2,847 |
|
| (2,207) |
|
| 36,199 |
|
| 53,842 |
| 54,493 |
| 7,558 |
| (6,005) |
| 109,888 | ||||
Other (income) expense, net |
|
| 2,342 |
|
| 3,937 |
|
| (4,135) |
|
| 2,207 |
|
| 4,351 |
|
| (2,137) |
|
| 8,012 |
|
| (11,139) |
|
| 6,005 |
|
| 741 |
Income (loss) before income taxes and |
|
|
|
|
|
|
|
|
|
|
|
|
|
|
|
|
|
|
|
|
|
|
|
|
|
|
|
|
|
|
equity in net income of subsidiaries |
|
| 124,447 |
|
| 147,309 |
|
| (6,907) |
|
| (21,544) |
|
| 243,305 |
|
| 276,680 |
| 370,775 |
| (20,563) |
| (65,579) |
| 561,313 | ||||
Income taxes |
|
| 40,242 |
|
| 55,684 |
|
| 797 |
|
| (7,831) |
|
| 88,892 | |||||||||||||||
Income taxes (benefit) |
|
| 89,210 |
|
| 139,958 |
|
| (63) |
|
| (23,966) |
|
| 205,139 | |||||||||||||||
|
|
| 84,205 |
|
| 91,625 |
|
| (7,704) |
|
| (13,713) |
|
| 154,413 |
|
| 187,470 |
|
| 230,817 |
|
| (20,500) |
|
| (41,613) |
|
| 356,174 |
Equity in net income of subsidiaries |
|
| 73,192 |
|
| - |
|
| - |
|
| (73,192) |
|
| - |
|
| 174,633 |
| - |
| - |
| (174,633) |
| - | ||||
Net loss attributable to noncontrolling interests |
|
| - |
|
| - |
|
| 2,984 |
|
| - |
|
| 2,984 |
|
|
|
|
|
|
|
| 5,929 |
|
|
|
|
| 5,929 |
Net income (loss) attributable to Steel Dynamics, Inc. |
| $ | 157,397 |
| $ | 91,625 |
| $ | (4,720) |
| $ | (86,905) |
| $ | 157,397 |
| $ | 362,103 |
| $ | 230,817 |
| $ | (14,571) |
| $ | (216,246) |
| $ | 362,103 |
|
|
|
|
|
|
|
|
|
|
|
|
|
|
|
|
|
|
|
|
|
|
|
|
|
|
|
|
|
|
|
|
For the three months ended, |
|
|
|
|
|
|
| Combined |
| Consolidating |
| Total | |||
September 30, 2015 |
| Parent |
| Guarantors |
| Non-Guarantors |
| Adjustments |
| Consolidated | |||||
Net sales |
| $ | 735,250 |
| $ | 2,103,824 |
| $ | 96,204 |
| $ | (984,355) |
| $ | 1,950,923 |
Costs of goods sold |
|
| 619,833 |
|
| 1,965,364 |
|
| 99,864 |
|
| (962,864) |
|
| 1,722,197 |
Gross profit (loss) |
|
| 115,417 |
|
| 138,460 |
|
| (3,660) |
|
| (21,491) |
|
| 228,726 |
Selling, general and administrative |
|
| 35,235 |
|
| 64,259 |
|
| 2,845 |
|
| (4,642) |
|
| 97,697 |
Operating income (loss) |
|
| 80,182 |
|
| 74,201 |
|
| (6,505) |
|
| (16,849) |
|
| 131,029 |
Interest expense, net of capitalized interest |
|
| 18,312 |
|
| 18,138 |
|
| 1,692 |
|
| (1,058) |
|
| 37,084 |
Other (income) expense, net |
|
| 252 |
|
| (631) |
|
| (440) |
|
| 1,058 |
|
| 239 |
Income (loss) before income taxes and |
|
|
|
|
|
|
|
|
|
|
|
|
|
|
|
equity in net income of subsidiaries |
|
| 61,618 |
|
| 56,694 |
|
| (7,757) |
|
| (16,849) |
|
| 93,706 |
Income taxes (benefit) |
|
| 20,169 |
|
| 21,697 |
|
| (421) |
|
| (6,606) |
|
| 34,839 |
|
|
| 41,449 |
|
| 34,997 |
|
| (7,336) |
|
| (10,243) |
|
| 58,867 |
Equity in net income of subsidiaries |
|
| 19,168 |
|
| - |
|
| - |
|
| (19,168) |
|
| - |
Net loss attributable to noncontrolling interests |
|
| - |
|
| - |
|
| 1,750 |
|
| - |
|
| 1,750 |
Net income (loss) attributable to Steel Dynamics, Inc. |
| $ | 60,617 |
| $ | 34,997 |
| $ | (5,586) |
| $ | (29,411) |
| $ | 60,617 |
16
STEEL DYNAMICS, INC.
NOTES TO CONSOLIDATED FINANCIAL STATEMENTS (UNAUDITED)
Note 11.10. Condensed Consolidating Information (Continued)
|
|
|
|
|
|
|
|
|
|
|
|
|
|
|
|
|
|
|
|
|
|
|
|
|
|
|
|
|
|
|
|
For the nine months ended, |
|
|
|
|
|
|
| Combined |
| Consolidating |
| Total | |||
September 30, 2016 |
| Parent |
| Guarantors |
| Non-Guarantors |
| Adjustments |
| Consolidated | |||||
Net sales |
| $ | 2,297,389 |
| $ | 6,322,158 |
| $ | 271,694 |
| $ | (3,024,728) |
| $ | 5,866,513 |
Costs of goods sold |
|
| 1,823,408 |
|
| 5,676,265 |
|
| 286,486 |
|
| (2,944,568) |
|
| 4,841,591 |
Gross profit (loss) |
|
| 473,981 |
|
| 645,893 |
|
| (14,792) |
|
| (80,160) |
|
| 1,024,922 |
Selling, general and administrative |
|
| 145,596 |
|
| 212,613 |
|
| 9,352 |
|
| (14,581) |
|
| 352,980 |
Operating income (loss) |
|
| 328,385 |
|
| 433,280 |
|
| (24,144) |
|
| (65,579) |
|
| 671,942 |
Interest expense, net of capitalized interest |
|
| 53,842 |
|
| 54,493 |
|
| 7,558 |
|
| (6,005) |
|
| 109,888 |
Other (income) expense, net |
|
| (2,137) |
|
| 8,012 |
|
| (11,139) |
|
| 6,005 |
|
| 741 |
Income (loss) before income taxes and |
|
|
|
|
|
|
|
|
|
|
|
|
|
|
|
equity in net income of subsidiaries |
|
| 276,680 |
|
| 370,775 |
|
| (20,563) |
|
| (65,579) |
|
| 561,313 |
Income taxes (benefit) |
|
| 89,210 |
|
| 139,958 |
|
| (63) |
|
| (23,966) |
|
| 205,139 |
|
|
| 187,470 |
|
| 230,817 |
|
| (20,500) |
|
| (41,613) |
|
| 356,174 |
Equity in net income of subsidiaries |
|
| 174,633 |
|
| - |
|
| - |
|
| (174,633) |
|
| - |
Net loss attributable to noncontrolling interests |
|
| - |
|
| - |
|
| 5,929 |
|
| - |
|
| 5,929 |
Net income (loss) attributable to Steel Dynamics, Inc. |
| $ | 362,103 |
| $ | 230,817 |
| $ | (14,571) |
| $ | (216,246) |
| $ | 362,103 |
|
|
|
|
|
|
|
|
|
|
|
|
|
|
|
|
Condensed Consolidating Statements of Cash Flows (in thousands) |
|
|
|
|
|
|
|
|
|
|
|
| |||
|
|
|
|
|
|
|
|
|
|
|
|
|
|
|
|
For the nine months ended, |
|
|
|
|
|
|
| Combined |
| Consolidating |
| Total | |||
September 30, 2017 |
| Parent |
| Guarantors |
| Non-Guarantors |
| Adjustments |
| Consolidated | |||||
|
|
|
|
|
|
|
|
|
|
|
|
|
|
|
|
Net cash provided (used in) by operating activities |
| $ | 126,267 |
| $ | 434,450 |
| $ | (17,762) |
| $ | 4,650 |
| $ | 547,605 |
Net cash used in investing activities |
|
| (48,799) |
|
| (50,975) |
|
| (7,006) |
|
| 3,902 |
|
| (102,878) |
Net cash provided by (used in) financing activities |
|
| 220,346 |
|
| (405,184) |
|
| 9,144 |
|
| (8,552) |
|
| (184,246) |
Increase (decrease) in cash and equivalents |
|
| 297,814 |
|
| (21,709) |
|
| (15,624) |
|
| - |
|
| 260,481 |
Cash and equivalents at beginning of period |
|
| 766,685 |
|
| 54,677 |
|
| 20,121 |
|
| - |
|
| 841,483 |
Cash and equivalents at end of period |
| $ | 1,064,499 |
| $ | 32,968 |
| $ | 4,497 |
| $ | - |
| $ | 1,101,964 |
|
|
|
|
|
|
|
|
|
|
|
|
|
|
|
|
|
|
|
|
|
|
|
|
|
|
|
|
|
|
|
|
For the nine months ended, |
|
|
|
|
|
|
| Combined |
| Consolidating |
| Total | |||
September 30, 2015 |
| Parent |
| Guarantors |
| Non-Guarantors |
| Adjustments |
| Consolidated | |||||
Net sales |
| $ | 2,300,024 |
| $ | 6,447,974 |
| $ | 302,657 |
| $ | (3,047,290) |
| $ | 6,003,365 |
Costs of goods sold |
|
| 1,982,667 |
|
| 6,056,514 |
|
| 352,980 |
|
| (2,976,307) |
|
| 5,415,854 |
Gross profit (loss) |
|
| 317,357 |
|
| 391,460 |
|
| (50,323) |
|
| (70,983) |
|
| 587,511 |
Selling, general and administrative |
|
| 95,883 |
|
| 188,028 |
|
| 8,878 |
|
| (13,637) |
|
| 279,152 |
Operating income (loss) |
|
| 221,474 |
|
| 203,432 |
|
| (59,201) |
|
| (57,346) |
|
| 308,359 |
Interest expense, net of capitalized interest |
|
| 57,015 |
|
| 58,354 |
|
| 5,084 |
|
| (3,119) |
|
| 117,334 |
Other (income) expense, net |
|
| 15,131 |
|
| (597) |
|
| (2,434) |
|
| 3,119 |
|
| 15,219 |
Income (loss) before income taxes and |
|
|
|
|
|
|
|
|
|
|
|
| �� |
|
|
equity in net income of subsidiaries |
|
| 149,328 |
|
| 145,675 |
|
| (61,851) |
|
| (57,346) |
|
| 175,806 |
Income taxes (benefit) |
|
| 35,207 |
|
| 53,903 |
|
| (4,047) |
|
| (20,403) |
|
| 64,660 |
|
|
| 114,121 |
|
| 91,772 |
|
| (57,804) |
|
| (36,943) |
|
| 111,146 |
Equity in net income of subsidiaries |
|
| 8,807 |
|
| - |
|
| - |
|
| (8,807) |
|
| - |
Net loss attributable to noncontrolling interests |
|
| - |
|
| - |
|
| 11,782 |
|
| - |
|
| 11,782 |
Net income (loss) attributable to Steel Dynamics, Inc. |
| $ | 122,928 |
| $ | 91,772 |
| $ | (46,022) |
| $ | (45,750) |
| $ | 122,928 |
|
|
|
|
|
|
|
|
|
|
|
|
|
|
|
|
|
|
|
|
|
|
|
|
|
|
|
|
|
|
|
|
For the nine months ended, |
|
|
|
|
|
|
| Combined |
| Consolidating |
| Total | |||
September 30, 2016 |
| Parent |
| Guarantors |
| Non-Guarantors |
| Adjustments |
| Consolidated | |||||
|
|
|
|
|
|
|
|
|
|
|
|
|
|
|
|
Net cash provided by operating activities |
| $ | 282,918 |
| $ | 358,657 |
| $ | 52 |
| $ | 3,735 |
| $ | 645,362 |
Net cash used in investing activities |
|
| (143,427) |
|
| (81,983) |
|
| (3,935) |
|
| 2,879 |
|
| (226,466) |
Net cash provided by (used in) financing activities |
|
| 196,242 |
|
| (297,596) |
|
| 13,529 |
|
| (6,614) |
|
| (94,439) |
Increase (decrease) in cash and equivalents |
|
| 335,733 |
|
| (20,922) |
|
| 9,646 |
|
| - |
|
| 324,457 |
Cash and equivalents at beginning of period |
|
| 636,877 |
|
| 81,976 |
|
| 8,179 |
|
| - |
|
| 727,032 |
Cash and equivalents at end of period |
| $ | 972,610 |
| $ | 61,054 |
| $ | 17,825 |
| $ | - |
| $ | 1,051,489 |
17
STEEL DYNAMICS, INC.
NOTES TO CONSOLIDATED FINANCIAL STATEMENTS (UNAUDITED)
Note 11. Condensed Consolidating Information (Continued)
|
|
|
|
|
|
|
|
|
|
|
|
|
|
|
|
Condensed Consolidating Statements of Cash Flows (in thousands) |
|
|
|
|
|
|
|
|
|
|
|
| |||
|
|
|
|
|
|
|
|
|
|
|
|
|
|
|
|
For the nine months ended, |
|
|
|
|
|
|
| Combined |
| Consolidating |
| Total | |||
September 30, 2016 |
| Parent |
| Guarantors |
| Non-Guarantors |
| Adjustments |
| Consolidated | |||||
|
|
|
|
|
|
|
|
|
|
|
|
|
|
|
|
Net cash provided by operating activities |
| $ | 280,767 |
| $ | 358,657 |
| $ | 52 |
| $ | 3,735 |
| $ | 643,211 |
Net cash used in investing activities |
|
| (143,427) |
|
| (81,983) |
|
| (3,935) |
|
| 2,879 |
|
| (226,466) |
Net cash provided by (used in) financing activities |
|
| 198,393 |
|
| (297,596) |
|
| 13,529 |
|
| (6,614) |
|
| (92,288) |
Increase (decrease) in cash and equivalents |
|
| 335,733 |
|
| (20,922) |
|
| 9,646 |
|
| - |
|
| 324,457 |
Cash and equivalents at beginning of period |
|
| 636,877 |
|
| 81,976 |
|
| 8,179 |
|
| - |
|
| 727,032 |
Cash and equivalents at end of period |
| $ | 972,610 |
| $ | 61,054 |
| $ | 17,825 |
| $ | - |
| $ | 1,051,489 |
|
|
|
|
|
|
|
|
|
|
|
|
|
|
|
|
|
|
|
|
|
|
|
|
|
|
|
|
|
|
|
|
For the nine months ended, |
|
|
|
|
|
|
| Combined |
| Consolidating |
| Total | |||
September 30, 2015 |
| Parent |
| Guarantors |
| Non-Guarantors |
| Adjustments |
| Consolidated | |||||
|
|
|
|
|
|
|
|
|
|
|
|
|
|
|
|
Net cash provided by (used in) operating activities |
| $ | 306,941 |
| $ | 400,910 |
| $ | (4,302) |
| $ | 4,748 |
| $ | 708,297 |
Net cash used in investing activities |
|
| (35,100) |
|
| (82,737) |
|
| (12,796) |
|
| 5,359 |
|
| (125,274) |
Net cash provided by (used in) financing activities |
|
| (126,984) |
|
| (347,111) |
|
| 13,606 |
|
| (10,107) |
|
| (470,596) |
Increase (decrease) in cash and equivalents |
|
| 144,857 |
|
| (28,938) |
|
| (3,492) |
|
| - |
|
| 112,427 |
Cash and equivalents at beginning of period |
|
| 265,313 |
|
| 81,690 |
|
| 14,360 |
|
| - |
|
| 361,363 |
Cash and equivalents at end of period |
| $ | 410,170 |
| $ | 52,752 |
| $ | 10,868 |
| $ | - |
| $ | 473,790 |
1817
ITEM 2.MANAGEMENT’S DISCUSSION AND ANALYSIS OF FINANCIAL CONDITION AND RESULTS OF OPERATIONS
Forward-Looking Statements
This report contains some predictive statements about future events, including statements related to conditions in the steel and metallic scrap markets, ourSteel Dynamics’ revenues, costs of purchased materials, future profitability and earnings, and the operation of new or existing facilities. These statements, which we generally precede or accompany by such typical conditional words as “anticipate,” “intend,” “believe,” “estimate,” “plan,” seek,” “project’”"anticipate," "intend," "believe," "estimate," "plan," "seek," "project" or “expect,”"expect," or by the words “may,” “will,”"may," "will," or “should,”"should," are intended to be made as “forward-looking,” subject to many risks and uncertainties, within the safe harbor protections of the Private Securities Litigation Reform Act of 1995, incorporated in Section 27A of the Securities Act of 1933 and Section 21E of the Securities Exchange Act of 1934. Such forward-looking statements involve both known and unknown risks, uncertainties and other factors that may cause our actual results, performance or achievements to be materially different from any future results, performance or achievements expressed or implied by such forward-looking statements.1995. These statements speak only as of this date and are based upon information and assumptions, which we consider reasonable as of this date, concerning our businesses and the environments in which they operate. Such predictive statements are not guarantees of future performance, and we undertake no duty to update or revise any such statements. Some factors that could cause such forward-looking statements to turn out differently than anticipated include: (1) the effects of uncertain economic conditions; (2) cyclical and changing industrial demand; (3) changes in conditions in any of the steel or scrap-consuming sectors of the economy which affect demand for our products, including the strength of the non-residential and residential construction, automotive, appliance, pipe and tube, and other steel-consuming industries; (4) fluctuations in the cost of key raw materials (including steel scrap, iron units, and energy costs) and our ability to pass-onpass on any cost increases; (5) the impact of domestic and foreign import price competition; (6) unanticipated difficulties in integrating or starting up new or acquired businesses; (7) risks and uncertainties involving product and/or technology development; and (8) occurrences of unexpected plant outages or equipment failures.
More specifically, we refer you to our more detailed explanation of these and other factors and risks that may cause such predictive statements to turn out differently, as set forth under the headings Special NotesNote Regarding Forward-Looking Statements and Risk Factors, in our most recent Annual Report on Form 10-K for the year ended December 31, 2015,2016, in our quarterly reports on Form 10-Q or in other reports which we from time to time file with the Securities and Exchange Commission. These reports are available publicly on the Securities and Exchange Commission website, www.sec.gov, and on our website, www.steeldynamics.com.under “Investors – SEC Filings.”
Description of the Business
We are aone of the largest domestic manufacturersteel producers and metal recyclers in the United States based on current estimated steelmaking and coating capacity of 11 million tons and actual metals recycling volumes. The primary source of revenues are from the manufacture and sale of steel products, processing and sale of recycled ferrous and nonferrous metals, recycler.and fabrication and sale of steel joists and deck products. We have three reportable segments: steel operations, metals recycling operations, and steel fabrication operations. Steel operations include our Butler Flat Roll Division, Columbus Flat Roll Division, The Techs galvanizing lines, Structural and Rail Division, Engineered Bar Products Division, Vulcan Threaded Products – acquired August 1, 2016 (Vulcan), Roanoke Bar Division, Steel of West Virginia, and Iron Dynamics, a liquid pig iron (scrap substitute) production facility that supplies solely the Butler Flat Roll Division. These operations include electric arc furnace steel mills, producing steel from ferrous scrap and scrap substitutes, utilizing continuous casting, automated rolling mills, and ten downstream coating facilities, and one downstream SBQ processing facility. Metals recycling operations include our metals recycling processing locations, and ferrous scrap procurement operations, of OmniSource Corporation. Steel fabrication operations include our eight New Millennium Building Systems’ joist and deck plants located throughout the United States, and in Northern Mexico. Revenues from these plants are generated from the fabrication of trusses, girders, steel joists and steel deck used within the non-residential construction industry. The “Other” category consists of subsidiary operations that are below the quantitative thresholds required for reportable segments and primarily consist of our Minnesota ironmaking operations that were indefinitely idled in May 2015, and several smaller joint ventures. Also included in “Other” are certain unallocated corporate accounts, such as our senior secured credit facility, senior notes, certain other investments and certain profit sharing expenses.
Operating Statement Classifications
Net Sales. Net sales from our operations are a factor of volumes shipped, product mix and related pricing. We charge premium prices for certain grades of steel, product dimensions, certain smaller volumes, and for value-added processing or coating of the steel products. Except for ourthe steel fabrication operations, we recognize revenuerevenues from sales and the allowance for estimated costs associated with returns and claims from these sales at the time the title of the product is transferred to the customer.transfers, upon shipment. Provision is made for estimated product returns and customer claims based on estimates and actual historical experience. Net sales fromIf the historical data used in the estimates does not reflect future returns and claims trends, additional provision may be necessary. Our steel fabrication operations are recognizedrecognizes revenues from construction contracts utilizing a percentage of completion methodology based on steel tons used on completed units to date as a percentage of estimated total steel tons required for each contract.
Costs of Goods Sold. Our costs of goods sold represent all direct and indirect costs associated with the manufacture of our products. The principal elements of these costs are scrap and scrap substitutes (which represent the most significant single component of our consolidated costs of goods sold), steel, direct and indirect labor and related benefits, alloys, zinc, transportation and freight, repairs and maintenance, utilities (most notably electricity, and natural gas), and depreciation.
Selling, General and Administrative Expenses. Selling, general and administrative expenses consist of all costs associated with our sales, finance and accounting, and administrative departments. These costs include, among other items, labor and related benefits, professional services, insurance premiums, property taxes, company-wide profit sharing, and amortization of intangible and other assets.
Interest Expense, net of Capitalized Interest. Interest expense consists of interest associated with our senior credit facilities and other debt net of interest costs that are required to be capitalized during the construction period of certain capital investment projects.
19
Other Expense (Income) Expense,, net. Other income consists of interest income earned on our temporary cash deposits and investments; any other non-operating income activity, including income from non-consolidated investments accounted for under the equity method. Other expense consists of any non-operating costs, such as certain acquisition and financing expenses.
Results Overview
Consolidated operating income increased $152.8decreased $12.8 million, or 117%5%, to $283.9$271.0 million for the third quarter 2016,2017, compared to $131.0 million for the third quarter 2015.2016. Third quarter 20162017 net income increased $96.8attributable to Steel Dynamics, Inc. decreased $4.1 million, or 160%3%, to $157.4$153.3 million, from $60.6 million forcompared to the third quarter 2015.2016.
18
Consolidated operating income increased $363.6$199.0 million, or 118%30%, to $870.9 million for the first nine months of 2017, compared to $671.9 million for the first nine months of 2016,2016. First nine months 2017 net income attributable to Steel Dynamics, Inc. increased $145.9 million, or 40%, to $508.0 million, compared to $308.4 million for the first nine months of 2015. First nine months 2016 net income increased $239.2 million, or 195%, to $362.1 million, from $122.9 million for the first nine months of 2015.2016.
Our consolidated results for the third quarter and first nine months of 20162017 benefited from continued positive momentum instrong demand primarily for our sheet and special-bar-quality steel products coupled with continued low customer inventory levels. However, increased import levels continued hindering the sheet steel supply environment, driving improved sheet steel metal spreads, as well as increased metal spread and operating cost reductions in our metals recycling operations. Underlyingability of domestic steel consumption remains relatively consistent,prices to keep pace with the heavy equipment, agriculture and energy markets remaining weak, while automotive and non-residential construction markets remain steady. Sheet steel import levels declined approximately 20% during the first nine months of 2016 as compared to the first nine months of 2015, amidst the duties levied pursuant to the trade cases filed with the US International Trade Commission, and customer inventory levels remained low compared to historical averages. While domestic steel mill utilization rates have flattened in the first nine months of 2016 compared to the first nine months of 2015, resulting in lower ferrousraw material costs. Decreased scrap volumes infor our metals recycling operations ourwere offset by improved pricing and ferrous metal spreads have improved, particularlyand reduced operating expenses, resulting in nonferrous materials,significantly increased operating income during the 2017 third quarter and we have benefited from continued operational cost cutting efforts.year-to-date periods compared to the same periods in 2016. The non-residential construction market remained strong, resulting in record quarterly shipments for our steel fabrication operations remains strong, resulting in increased shipments; however, average selling prices have contracted and rising steel input costs have resulted in compressed metal spread during 2016.for the third straight quarter.
Segment Operating Results 20162017 vs. 20152016 (dollars in thousands)
|
|
|
|
|
|
|
|
|
|
|
|
|
|
|
|
|
|
|
|
|
|
|
|
|
| |||||
|
|
|
|
|
|
|
|
|
|
|
|
|
|
|
|
|
|
|
|
|
|
|
|
|
| |||||
| Three Months Ended September 30, |
| Nine Months Ended September 30, | Three Months Ended September 30, |
| Nine Months Ended September 30, | ||||||||||||||||||||||||
| 2016 |
| % Change |
| 2015 |
| 2016 |
| % Change |
| 2015 | 2017 |
| % Change |
|
| 2016 |
| 2017 |
| % Change |
| 2016 | |||||||
Net sales: |
|
|
|
|
|
|
|
|
|
|
|
|
|
|
|
|
|
|
|
|
|
|
|
|
|
|
|
|
| |
Steel Operations Segment | $ | 1,627,886 |
| 16% |
| $ | 1,407,533 |
| $ | 4,419,572 |
| 3% |
| $ | 4,271,091 | $ | 1,848,126 |
| 14% |
| $ | 1,627,886 |
| $ | 5,445,754 |
| 23% |
| $ | 4,419,572 |
Metals Recycling Operations Segment |
| 565,263 |
| (8)% |
|
| 616,460 |
|
| 1,643,172 |
| (14)% |
|
| 1,913,921 |
| 709,197 |
| 25% |
|
| 565,263 |
|
| 2,123,350 |
| 29% |
|
| 1,643,172 |
Steel Fabrication Operations Segment |
| 178,640 |
| 2% |
|
| 174,956 |
|
| 530,441 |
| 8% |
|
| 490,509 |
| 211,394 |
| 18% |
|
| 178,640 |
|
| 603,511 |
| 14% |
|
| 530,441 |
Other |
| 61,395 |
| (26)% |
|
| 83,219 |
|
| 214,149 |
| (20)% |
|
| 267,127 |
| 101,173 |
| 65% |
|
| 61,395 |
|
| 282,156 |
| 32% |
|
| 214,149 |
|
| 2,433,184 |
|
|
|
| 2,282,168 |
|
| 6,807,334 |
|
|
|
| 6,942,648 |
| 2,869,890 |
|
|
|
| 2,433,184 |
|
| 8,454,771 |
|
|
|
| 6,807,334 |
Intra-company |
| (331,874) |
|
|
|
| (331,245) |
|
| (940,821) |
|
|
|
| (939,283) |
| (426,508) |
|
|
|
| (331,874) |
|
| (1,252,453) |
|
|
|
| (940,821) |
| $ | 2,101,310 |
| 8% |
| $ | 1,950,923 |
| $ | 5,866,513 |
| (2)% |
| $ | 6,003,365 | $ | 2,443,382 |
| 16% |
| $ | 2,101,310 |
| $ | 7,202,318 |
| 23% |
| $ | 5,866,513 |
|
|
|
|
|
|
|
|
|
|
|
|
|
|
|
|
|
|
|
|
|
|
|
|
|
|
|
|
|
|
|
Operating income (loss): |
|
|
|
|
|
|
|
|
|
|
|
|
|
|
|
|
|
|
|
|
|
|
|
|
|
| ||||
Steel Operations Segment | $ | 307,553 |
| 147% |
| $ | 124,712 |
| $ | 712,939 |
| 110% |
| $ | 338,690 | $ | 276,547 |
| (10)% |
| $ | 307,553 |
| $ | 895,008 |
| 26% |
| $ | 712,939 |
Metals Recycling Operations Segment |
| 6,154 |
| 273% |
|
| (3,555) |
|
| 20,014 |
| 8640% |
|
| 229 |
| 17,624 |
| 186% |
|
| 6,154 |
|
| 51,968 |
| 160% |
|
| 20,014 |
Steel Fabrication Operations Segment |
| 17,744 |
| (52)% |
|
| 36,733 |
|
| 73,230 |
| (15)% |
|
| 85,754 |
| 21,862 |
| 23% |
|
| 17,744 |
|
| 65,735 |
| (10)% |
|
| 73,230 |
Other |
| (47,687) |
| (68)% |
|
| (28,401) |
|
| (125,186) |
| (7)% |
|
| (117,273) |
| (44,326) |
| 7% |
|
| (47,687) |
|
| (141,406) |
| (13)% |
|
| (125,186) |
|
| 283,764 |
|
|
|
| 129,489 |
|
| 680,997 |
|
|
|
| 307,400 |
| 271,707 |
|
|
|
| 283,764 |
|
| 871,305 |
|
|
|
| 680,997 |
Intra-company |
| 91 |
|
|
|
| 1,540 |
|
| (9,055) |
|
|
|
| 959 |
| (692) |
|
|
|
| 91 |
|
| (371) |
|
|
|
| (9,055) |
| $ | 283,855 |
| 117% |
| $ | 131,029 |
| $ | 671,942 |
| 118% |
| $ | 308,359 | $ | 271,015 |
| (5)% |
| $ | 283,855 |
| $ | 870,934 |
| 30% |
| $ | 671,942 |
20
|
Steel Operations Segment |
Steel Operations Segment. Steel operations consist of our six electric arc furnace steel mills, producing steel from ferrous scrap and scrap substitutes, utilizing continuous casting, automated rolling mills and teneleven downstream steel coating lines, one downstream SBQand several bar processing facility, and IDI,lines, as well as Iron Dynamics, our liquid pig iron production facility that supplies solely ourthe Butler Flat Roll Division mill.Division. Our steel operations sell directly to end usersend-users, steel fabricators, and service centers. These products are used in numerous industry sectors, including the construction, automotive, construction, manufacturing, transportation, heavy and agriculture equipment, and pipe and tube (including OCTG) markets. Steel operations accounted for 74%73% and 69%74% of our consolidated external net sales during the third quarter of 2017 and 2016, respectively, and 2015,73% and 72% and 69% of our consolidated external net sales during the first nine months of 20162017 and 2015,2016, respectively.
Sheet Steel Products. Our sheet steel products operations consist of Butler and Columbus Flat Roll Divisions, and our downstream coating lines, including The Techs.lines. These operations sell a broad range of sheet steel products, such asconsisting of hot roll, cold roll and coated steel products, including a wide variety of specialty products, such as light gauge hot roll, galvanized, and Galvalume®. Butler Flat Roll Division currently sells, and painted products, while Columbus Flat Roll Division is in the final construction phase of a $100 million expansion to add painted capacity.products. The Techs is comprised of three galvanizing lines which sell specialized galvanized sheet steels used in primarily non-automotive applications.
Long Products. Our Structural and Rail Division sells structural steel beams and pilings to the construction market, as well as standard‑grade and premium rail to the railroad industry. Our Engineered Bar Products Division primarily sells engineered special-bar-quality, and merchant-bar-quality, rounds, round‑cornered squares, and smaller-diameter engineered round engineered bars. Vulcan SteelThreaded Products manufacturesproduces threaded rod products and also cold drawn and heat treated steel bar. Our Roanoke Bar Division primarily sells merchant steel products, including angles, merchant rounds, flats and channels, and reinforcing bar. Steel of West Virginia primarily sells beams, channels and specialty steel sections.
Steel Operations Segment Shipments (tons):
|
|
|
|
|
|
|
|
|
|
|
|
|
|
|
|
|
|
|
|
|
|
|
|
| Three Months Ended September 30, |
| Nine Months Ended September 30, | ||||||||
| 2016 |
| % Change |
| 2015 |
| 2016 |
| % Change |
| 2015 |
|
|
|
|
|
|
|
|
|
|
|
|
Total shipments | 2,271,230 |
| 4% |
| 2,191,204 |
| 7,039,801 |
| 10% |
| 6,382,632 |
Intra-segment shipments | (65,438) |
|
|
| (56,836) |
| (216,217) |
|
|
| (175,347) |
Steel Operations Segment Shipments | 2,205,792 |
| 3% |
| 2,134,368 |
| 6,823,584 |
| 10% |
| 6,207,285 |
|
|
|
|
|
|
|
|
|
|
|
|
External shipments | 2,104,219 |
| 4% |
| 2,031,096 |
| 6,517,253 |
| 10% |
| 5,926,152 |
2119
Steel Operations Segment Shipments (tons):
|
|
|
|
|
|
|
|
|
|
|
|
|
|
|
|
|
|
|
|
|
|
|
|
| Three Months Ended September 30, |
| Nine Months Ended September 30, | ||||||||
| 2017 |
| % Change |
| 2016 |
| 2017 |
| % Change |
| 2016 |
|
|
|
|
|
|
|
|
|
|
|
|
Total shipments | 2,458,992 |
| 8% |
| 2,271,230 |
| 7,362,636 |
| 5% |
| 7,039,801 |
Intra-segment shipments | (88,211) |
|
|
| (65,438) |
| (279,567) |
|
|
| (216,217) |
Steel Operations Segment Shipments | 2,370,781 |
| 7% |
| 2,205,792 |
| 7,083,069 |
| 4% |
| 6,823,584 |
|
|
|
|
|
|
|
|
|
|
|
|
External shipments | 2,279,228 |
| 8% |
| 2,104,219 |
| 6,830,877 |
| 5% |
| 6,517,253 |
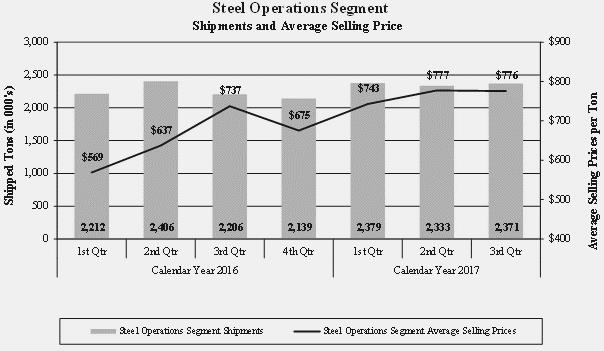
Segment Results 20162017 vs. 20152016
Overall domestic steel demand remained strong, but elevated levels of steel imports persisted during the quarter, hindering the ability for domestic steel prices to keep pace with raw material costs. Steel operations performancesegment shipments increased 7% in the third quarter and first nine months of 2016 benefited from continued positive momentum in the sheet steel supply environment. Sheet steel import levels have declined approximately 20% during the first nine months of 20162017, as compared to the first nine months of 2015, amidst the duties levied pursuant to the trade case rulingssame period in 2016, driven by improved flat roll and engineered bar shipments. Demand from the US International Trade Commission,construction sector continues to improve, and customer inventory levels remained low compared to historical levels, supporting higherenergy has shown a continued positive demand trend. Demand has also improved for heavy off-road equipment and more general industrial manufacturing. Conversely, demand from the domestic shipments, and thus higher company steel mill utilization.automotive sectors has softened somewhat, but still remains near historically high levels. Our sheet steel mill utilization rate averaged 97%92% for the third quarter 2016,2017, as compared to 89%85% in the third quarter 2015.2016. The domestic steel demand outlook remained relatively unchanged and steady, with the heavy equipment, agricultural and energy markets remaining weak, while automotive continues to be strong and construction continues to improve. Sheet steel average selling prices dropped throughout 2015, before rebounding duringincreased 4% in the first nine months of 2016.third quarter 2017 compared to the same period in 2016, while long products rose 8%. Net sales for the steel operations increased 16%14% in the third quarter 2016,2017, when compared to the same period in 2015, as2016, due to an increase of $39 per ton, or 5%, in average selling prices combined with a 3%7% increase in steel operations shipments combined with an increase of $78 per ton, or 12%, in average selling prices.shipments. Net sales for the steel operations increased 3%23% in the first nine months of 2016,2017, when compared to the same period in 2015, as2016, due to a 10%4% increase in steel operations segment shipments was more than offset by a decreasecombined with an increase of $41$118 per ton, or 6%18%, in average selling prices. The increase in shipments and pricing for the first nine months of 2017 was the result of much stronger markets in the first and third quarters 2017, compared to the same periods in 2016.
Metallic raw materials used in our electric arc furnaces represent our single most significant steel manufacturing cost. During the third quarter 2016 and 2015, our metallic raw material costs represented 57%cost, generally comprising approximately 60% of our steel operations’ manufacturing costs, excluding the operations of The Techs and Vulcan, which purchase, rather than produce, the steel they further process. Our metallic raw material cost per net ton consumed in our steel operations decreased $2,increased $55, or 1%22%, in the third quarter 2016,2017, compared to the same period in 2015. 2016, consistent with overall increased domestic scrap pricing. In the first nine months of 2016,2017, our metallic raw material cost per net ton consumed decreased $50,increased $70, or 19%32%, compared to the same period in 2015.2016.
20
Operating income for the steel operations increased 147%decreased 10%, to $307.6$276.5 million, in the third quarter 2016,2017, compared to the same period in 2015,2016, due to increased steel shipments and overall steel operationsa 3% decrease in metal spread (which we define as the difference between average selling prices and the cost of ferrous scrap consumed) expansion. Sheetmore than offsetting increased steel metal spread expanded 37%, while long products metal spread contracted 7%.shipments. FirstOperating income for the first nine months 2016 operating income2017 increased 110%26%, to $712.9$895.0 million, compared to the first nine months of 2015,2016, due to an 11% expansion of steel segment operations metal spread, coupled with a 10%4% increase in steel shipments coupled with a 2% increase in overall steel operations metal spread. Sheet steel metal spread expanded 11%, while long products metal spread contracted 10%.shipments.
|
Metals Recycling Operations Segment |
Metals Recycling Operations Segment. Metals recycling operations includeconsists solely of OmniSource and includes both ferrous and nonferrous scrap metal processing, transportation, marketing, brokerage, and consulting services strategically located primarily in close proximity to our metals recycling processing locations, and ferrous scrap procurement operations of OmniSource. OmniSource sells ferrous metals to steel mills and foundries,other end-user scrap consumers throughout the eastern half of the United States. In addition, OmniSource designs, installs, and nonferrous metals,manages customized scrap management programs for industrial manufacturing companies at hundreds of locations throughout North America. Our steel mills utilize a large portion (61% - 63% for the periods presented) of the ferrous scrap sold by OmniSource as raw material in our steelmaking operations, and the remainder is sold to other consumers, such as copper, brass, aluminumother steel manufacturers and stainless steel to, among others, ingot manufacturers, copper refineries and mills, smelters, and specialty mills.foundries. Our metals recycling operations accounted for 15%14% and 18%15% of our consolidated external net sales during the third quarter of 2017 and 2016, and 2015,respectively, and 15% and 19%for each of our consolidated external net sales during the first nine months of 20162017 and 2015, respectively.2016.
Metals Recycling Operations Shipments:
|
|
|
|
|
|
|
|
|
|
|
|
|
|
|
|
|
|
|
|
|
|
|
|
|
|
|
|
|
|
|
|
|
|
|
|
|
|
|
|
|
|
|
|
|
|
| Three Months Ended September 30, |
| Nine Months Ended September 30, | Three Months Ended September 30, |
| Nine Months Ended September 30, | ||||||||||||||||
| 2016 |
| % Change |
| 2015 |
| 2016 |
| % Change |
| 2015 | 2017 |
| % Change |
| 2016 |
| 2017 |
| % Change |
| 2016 |
Ferrous metal (gross tons) |
|
|
|
|
|
|
|
|
|
|
|
|
|
|
|
|
|
|
|
|
|
|
Total | 1,243,277 |
| (8)% |
| 1,354,339 |
| 3,894,755 |
| (1)% |
| 3,945,095 | 1,219,582 |
| (2)% |
| 1,243,277 |
| 3,780,958 |
| (3)% |
| 3,894,755 |
Inter-company | (774,779) |
|
|
| (803,263) |
| (2,383,223) |
|
|
| (2,125,675) | (756,899) |
|
|
| (774,779) |
| (2,366,355) |
|
|
| (2,383,223) |
External shipments | 468,498 |
| (15)% |
| 551,076 |
| 1,511,532 |
| (17)% |
| 1,819,420 | 462,683 |
| (1)% |
| 468,498 |
| 1,414,603 |
| (6)% |
| 1,511,532 |
|
|
|
|
|
|
|
|
|
|
|
|
|
|
|
|
|
|
|
|
|
|
|
Nonferrous metals (thousands of pounds) |
|
|
|
|
|
|
|
|
|
|
|
|
|
|
|
|
|
|
|
|
|
|
Total | 280,107 |
| (3)% |
| 287,898 |
| 828,715 |
| 1% |
| 823,240 | 261,716 |
| (7)% |
| 280,107 |
| 815,763 |
| (2)% |
| 828,715 |
Inter-company | (25,185) |
|
|
| (26,826) |
| (83,741) |
|
|
| (67,315) | (37,316) |
|
|
| (25,185) |
| (107,863) |
|
|
| (83,741) |
External shipments | 254,922 |
| (2)% |
| 261,072 |
| 744,974 |
| (1)% |
| 755,925 | 224,400 |
| (12)% |
| 254,922 |
| 707,900 |
| (5)% |
| 744,974 |
Segment Results 20162017 vs. 20152016
Metals recycling operations operating income in the third quarter 20162017 of $6.2$17.6 million was 273%186% higher than the third quarter 20152016 operating lossincome of $3.6$6.2 million, due to significant improvements in ferrous and nonferrous metal spread (which we define as the difference between average selling prices and the cost of purchased scrap) that more than offset shipment declines in both ferrous, and nonferrous metals.reduced operating costs. Net sales decreased 8%increased 25% in the third quarter 20162017 as compared to the same period in 2015, due primarily to decreased shipments. Ferrous metal spread2016, driven by increased 16%,pricing, which more than offsetting an 8% decrease in ferrousoffset decreased shipments. Overall domestic steel mill utilization was slightly lower75% in the third quarter 2016of 2017, compared to 70% in the third quarter 2015, even as our own steel mill utilization improved.same 2016 period. Ferrous shipments to our own steel mills increased to 62% of total ferrous shipmentsdecreased by 2% in the third quarter 2016, compared to 59% during the same period in 2015. Nonferrous scrap costs declined more than the 8% decline in average selling prices during the third quarter 20162017, compared to the same period in 2015,2016. Ferrous scrap average selling prices increased 30% during the third quarter 2017 compared to the same period in 2016, while nonferrous average selling prices increased 36% compared to the same period in 2016, resulting in a 27% improvement inferrous metal spread asincreasing 11%, and nonferrous shipments declined slightly.
22metal spread increasing 2%.
Operating income for the metalsMetals recycling operations operating income in the first nine months of 20162017 of $20.0$52.0 million was $19.8 million160% higher than the first nine months 2016 operating income of 2015,$20.0 million, due to our continued focus on reduction ofincreased selling prices resulting in a 17% improvement in ferrous metal spread, and reduced operating costs, along with improved nonferrous metal spread.expenses. Net sales decreased 14%increased 29% in the first nine months of 2016 compared to the same period in 2015, with ferrous and nonferrous pricing decreasing 13% and 15%, respectively. While ferrous and nonferrous shipments were comparable during the first nine months of 20162017 as compared to the same period in 2015, metal spreads2016, driven by increased pricing for both ferrous metal were flat year over year, whileand nonferrous materials metal spread improved 14%.
products, which increased 40% and 27%, respectively, during the first nine months of 2017 compared to the same period in 2016.
|
Steel Fabrication Operations Segment |
Steel fabrication operations include our eight New Millennium Building Systems’ joist and deck plants located throughout the United States and in Northern Mexico.Mexico. Revenues from these plants are generated from the fabrication of steel joists, trusses, girders steel joists and steel deck used within the non-residential construction industry. Steel fabrication operations accounted for 8%9% and 9%8% of our consolidated external net sales during the third quarter of 2017 and 2016, respectively, and 2015,8% and 9% and 8% of our consolidated external net sales during the first nine months of 2017 and 2016, and 2015, respectively.
21
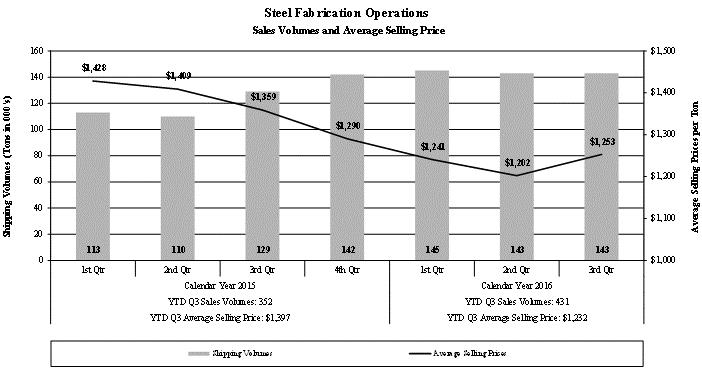
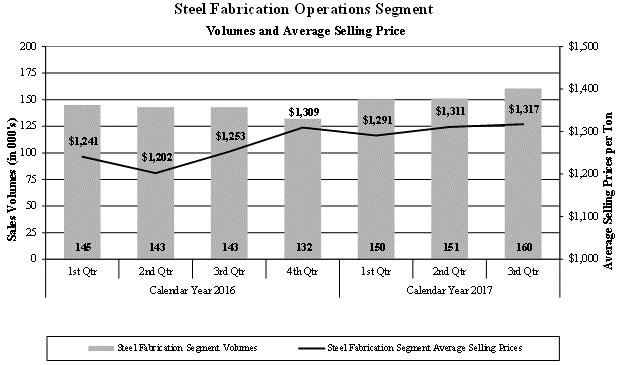
Segment Results 20162017 vs. 20152016
The overall non-residential construction market has continued to remain strong; however, declinesstrong, demonstrating a positive growth profile, as our fabrication operations achieved a third consecutive quarterly shipments record in selling prices coupled with increased steel input costs during the third quarter 2016 compared to the same period in 2015 resulted in metal spread (which we define as the difference between average selling prices and the cost of purchased steel) compression.2017. Net sales for the steel fabrication operations increased $3.7$32.8 million, or 2%18%, during the third quarter 2016,2017, compared to the same period in 2015,2016, as shipments increased 11%13%, while average selling prices decreased $106increased $64 per ton, or 8%5%. Net sales for the segment increased $39.9$73.1 million, or 8%14%, in the first nine months of 2016,2017, compared to the first nine months of 2015,2016, as shipmentsvolumes increased 23%, offsetting a 12% decrease in average7% and selling prices.prices increased 6%. Our steel fabrication operations continue to realize strength in order activity and resulting shipments, as we continue to leverage our national operating footprint to sustain and improve market share, and market demand continues to be steady.improve.
The purchase of various steel products is the largest single cost of production for our steel fabrication operations, generally representing approximately two-thirds of the total cost of manufacturing. The average cost of steel consumed increased by 5%12% in the third quarter 2016,2017, as compared to the same period in 2015. In addition,2016, while average selling prices declined 8% causing metal spread to decline 19%increased only 5%, resulting in a 52% decrease inmetal spread (which we define as the difference between average selling prices and the cost of purchased steel) declining 2%. However, operating income increased 23% to $17.8$21.9 million in the third quarter 2016, as2017 compared to $36.7 million in the same period in 2015. Segment2016, as increased shipments more than offset metal spread contraction. Segment operating income of $73.3$65.7 million in the first nine months of 2017 decreased 10%, from $73.2 million in the first nine months of 2016, decreased 15%, from $85.8 milliondespite a 7% increase in the first nine months of 2015,shipments, as increased shipments of 23% were more than offset by an 11% decrease in metal spreads decreased 7% year over year..
23
|
Other Operations |
Other operations consists of subsidiary operations that are below the quantitative thresholds required for reportable segments and primarily consist of our idled Minnesota ironmaking operations that were indefinitely idled in May 2015, and several smaller joint ventures. Also included in “Other” are certain unallocated corporate accounts, such as the company’s senior secured credit facility, senior notes, certain other investments and certain profit sharing expenses. Prior to being indefinitely idled, our Minnesota ironmaking operations experienced operating losses, which have been significantly curtailed post-idling. The second quarter 2015 Minnesota ironmaking operations operating losses included $21.0 million of inventory lower-of-cost or market charges associated with the idle decision.
Third Quarter Consolidated Results 2017 vs. 2016 vs. 2015
Selling, General and Administrative Expenses. Selling, general and administrative expenses (including profit sharing and amortization of intangible assets) of $125.5 million during the third quarter 2017 were consistent with the $124.6 million during the third quarter 2016, increased 28% from $97.7 million during the third quarter 2015, representing approximately 5.9%5.1% and 5.0%5.9% of net sales, respectively. The increase in the third quarter 2016 compared to the same period in 2015 is due most notably to increased performance-based incentive compensation, including profit sharing, associated with our increased profitability.
Interest Expense, net of Capitalized Interest. During the third quarter 2016,2017, interest expense ofdecreased 6% to $34.2 million from $36.2 million was comparable to $37.1 million during the same period in 2015, on comparable debt levels.
Other Expense, net. During2016, due primarily to the third quarterDecember 2016 refinancing of 2016, net other expense was $4.4 million compared to $239,000 in the same period in 2015. The increase in 2016 was due to $4.6$400.0 million of estimated litigation settlement charges.6.125% senior notes due 2019 with 5.000% senior notes due 2026. In addition, in December 2016 we repaid the remaining $228.1 million of outstanding Senior Term Loan debt, which was set to mature on November 14, 2019.
Income Tax Expense. During the third quarter 2016,2017, our income tax expense was $83.3 million at an effective income tax rate of 35.6%, as compared to $88.9 million at an effective income tax rate of 36.5%, as compared to $34.8 million at a comparable effective income tax rate of 37.2%, during the third quarter 2015.2016. The lower effective tax rate in 2017 is due
22
primarily to additional permanent tax benefit items, most notably the 2017 domestic manufacturing deduction, resulting from increases in taxable income.
First Nine Months Consolidated Results 20162017 vs. 2015
2016
Selling, General and Administrative Expenses. Selling, general and administrative expenses (including profit sharing and amortization of intangible assets) of $390.3 million during the first nine months of 2017 increased 11% from $353.0 million during the first nine months of 2016, increased 26% from $279.2 million during the first nine months of 2015, representing approximately 6.0%5.4% and 4.6%6.0% of net sales, respectively. The increase in the first nine months 20162017 expenses compared to the same period in 20152016 is due most notably to increased performance-based incentive compensation, including profit sharing, associated with our increased profitability.
Interest Expense, net of Capitalized Interest. During the first nine months of 2016,2017, interest expense decreased $7.4$7.9 million to $109.9$102.0 million, when compared to the same period in 2015.2016. The decrease in interest expense is due primarily to the call and prepaymentDecember 2016 refinancing of our $350.0 million 7 5/8% Senior Notes due 2020, in March 2015.
Other Expense, net. During the first nine months of 2016, net other expense was $741,000 compared to $15.2 million in the same period in 2015, which included $16.7$400.0 million of call premium and other finance expenses associated6.125% senior notes due 2019 with 5.000% senior notes due 2026. In addition, in December 2016 we repaid the March 2015 senior note call and prepayment.remaining $228.1 million of outstanding Senior Term Loan debt, which was set to mature on November 14, 2019.
Income Tax Expense. During the first nine months of 2016,2017, our income tax expense was $271.3 million at an effective income tax rate of 35.1%, as compared to $205.1 million at an effective income tax rate of 36.5%, as compared to $64.7 million at comparable effective income tax rate of 36.8%, during the first nine months of 2015.2016. The lower effective tax rate in 2017 is due primarily to additional permanent tax benefit items, most notably the 2017 domestic manufacturing deduction, resulting from increases in taxable income.
Liquidity and Capital Resources
Capital Resources and Long‑term Debt. Our business is capital intensive and requires substantial expenditures for, among other things, the purchase and maintenance of equipment used in our steel, metals recycling, and steel fabrication operations, and to remain in compliance with environmental laws. Our short-term and long-term liquidity needs arise primarily from working capital requirements, capital expenditures, principal and interest payments related to our outstanding indebtedness, dividends to our shareholders, and acquisitions. We have met these liquidity requirements primarily with cash provided by operations and long-term borrowings, and we also have availability under our Revolver. Our liquidity at September 30, 2016,2017, is as follows (in thousands):
|
|
|
|
|
|
|
|
|
|
|
|
|
|
|
|
|
|
|
|
|
|
| Cash and |
| $ |
|
|
| |
|
|
| Revolver availability |
|
|
|
|
| |
|
|
| Total liquidity |
| $ |
|
| ||
* Adjusted to reflect the October 13, 2017, repayment of the remaining $167.1 million 6.375% Senior Notes due 2022. |
| ||||||||
Our total outstanding debt remained relatively unchanged during the first nine months of 20162017 at $2.6 billion.$2.4 billion (adjusted to reflect the October 13, 2017, repayment of the remaining $167.1 million 6.375% Senior Notes due 2022). Our total adjusted long-term debt to capitalization ratio (representing our long-term debt, including current maturities, divided by the sum of our long-term debt, redeemable noncontrolling interests, and our total stockholders’ equity) was 46.7%43.9% at September 30, 2016,2017, compared to 49.3%44.9% at December 31, 2015.2016.
2423
We haveIn September 2017, we issued $350.0 million of 4.125% senior notes due 2025 (the "2025 Notes"), the proceeds of which, along with available cash, were used to fund the September 2017 tender to purchase at a redemption price of 103.563%, $182.9 million principal amount, plus accrued and unpaid interest to, but not including, the date of repurchase, of our 6.375% senior notes due 2022 (the "2022 Notes"), and the October 2017 call and repayment at a redemption price of 103.188% of the $167.1 million remaining outstanding principal amount of the 2022 Notes, plus accrued and unpaid interest to, but not including, the date of repayment. The $167.1 remaining outstanding principal amount is included in current maturities of long-term debt in our September 30, 2017, balance sheet.
Our November 2014 senior secured credit facility (Facility) that matures in November 2019, which provides for a $1.2 billion Revolver, along with a term loan facility.matures November 2019. Subject to certain conditions, we also have the abilityopportunity to increase the combined facilityRevolver size by a minimum of $750at least $750.0 million. The Facility is guaranteed by certain of our subsidiaries; and is secured by substantially all of our and our wholly-owned subsidiaries’ receivables and inventories, and by pledges of all shares of our wholly-owned subsidiaries’ capital stock or other equity interests, and intercompany debt held by us as collateral. The Revolver is available to fund working capital, capital expenditures, and other general corporate purposes. The Facility contains financial covenants and other covenants pertaining to our ability (which may under certain circumstances be limited) to make capital expenditures; incur indebtedness; permit liens on property; enter into transactions with affiliates; make restricted payments or investments; enter into mergers, acquisitions or consolidations; conduct asset sales; pay dividends or distributions, andor enter into other specified transactions and activities. Our ability to borrow funds within the terms of the Revolver is dependent upon our continued compliance with the financial and other covenants. At September 30, 2016,2017, we had $1.2 billion of availability on the Revolver, $12.1$11.9 million of outstanding letters of credit and other obligations which reduce availability, and there were no borrowings outstanding.
The financial covenants under our Facility state that we must maintain an interest coverage ratio of not less than 2.50:1.00. Our interest coverage ratio is calculated by dividing our last-twelve trailing monthslast-twelve-months (LTM) consolidated adjusted EBITDA (earnings before interest, taxes, depreciation, amortization, and certain other non-cash transactions as allowed in ourthe Facility) by our LTM gross interest expense, less amortization of financing fees. In addition, a net debt (as defined in the Facility) to consolidated LTM adjusted EBITDA (net debt leverage ratio) of not more than 5.00:1.00 must be maintained. If the net debt leverage ratio exceeds 3.50:1:00 at any time, our ability to make certain payments as defined in the Facility (which includes cash dividends to stockholders and share purchases, among other things), is limited. At September 30, 2016,2017, our interest coverage ratio and net debt leverage ratio were 7.36:10.22:1.00 and 2.01:1.49:1.00, respectively. We were, therefore, in compliance with these covenants at September 30, 2016,2017, and we anticipate we will continue to be in compliance during the next twelve months. months.
Working Capital. We generated cash flow from operations of $643.2$547.6 million in the first nine months of 2016.2017. Operational working capital (representing amounts invested in trade receivables and inventories, less current liabilities other than income taxes payable and debt) of $1.3increased $230.9 million to $1.5 billion at September 30, 2016, was comparable to that at December 31, 2015.2017. Increases in volumes, pricing and profitability have resulted in increased accounts receivable, and related increases in inventory, which have beenwere only partially offset by related increases in accounts payable and accrued expenses.
Capital Investments. During the first nine months of 2016,2017, we invested $123.2$127.7 million in property, plant and equipment, primarily within our steel operations segment, compared with $86.5$123.2 million invested during the same period in 2015. The increase in 2016 is primarily due to our Columbus Flat Roll Division’s $100 million expansion to add painted and Galvalume® capacity.2016.
Cash Dividends. As a reflection of continued confidence in our current and future cash flow generation ability and financial position, we increased our quarterly cash dividend by 2%11% to $0.1400$0.155 per share in the first quarter 20162017 (from $0.1375$0.140 per share in 2015)2016), resulting in declared cash dividends of $102.3$111.4 million during the first nine months of 2016,2017, compared to $99.8$102.3 million during the same period in 2015.2016. We paid cash dividends of $101.6$108.8 million and $94.3$101.6 million during the first nine months of 20162017 and 2015,2016, respectively. Our board of directors, along with executive management, approves the payment of dividends on a quarterly basis. The determination to pay cash dividends in the future is at the discretion of our board of directors, after taking into account various factors, including our financial condition, results of operations, outstanding indebtedness, current and anticipated cash needs and growth plans. In addition, the terms of our senior secured credit facilityFacility and the indentureindentures relating to our senior notes may restrict the amount of cash dividends we can pay.
Other. Our ability to meet our debt service obligations and reduce our total debt will depend upon our future performance which, in turn, will depend upon general economic, financial and business conditions, along with competition, legislation and regulatory factors that are largely beyond our control. In addition, we cannot assure that our operating results, cash flows, access to credit markets and capital resources will be sufficient for repayment of our indebtedness in the future. We believe that based upon current levels of operations and anticipated growth, cash flows from operations, together with other available sources of funds, including additional borrowings under our Revolver through its term, will be adequate for the next twelve months for making required payments of principal and interest on our indebtedness, funding working capital requirements, and anticipated capital expenditures.
In October 2016, the board of directors authorized a share repurchase program of up to $450 million of our common stock. Under the share repurchase program, purchases will take place as and when we determine in open market or private transactions made based upon the market price of our common stock, the nature of other investment opportunities or growth projects, our cash flows from operations, and general economic conditions. The share repurchase program does not require us to acquire any specific number of shares, and may be modified, suspended, extended or terminated by us at any time. We acquired 7.0 million shares of our common stock for $237.2 million in the first nine months of 2017 pursuant to this program. See Part II Other Information, Item 2 Unregistered Sales of Equity Securities and Use of Proceeds for additional information.
Our ability to meet our debt service obligations and reduce our total debt will depend upon our future performance which, in turn, will depend upon general economic, financial and business conditions, along with competition, legislation and regulatory factors that are largely beyond our control. In addition, we cannot assure that our operating results, cash flows, access to credit markets and capital resources will be sufficient for repayment of our indebtedness in the future. We believe that based upon current levels of operations and anticipated growth, cash flows from operations, together with other available sources of funds, including if necessary borrowings under our Revolver through its term, will be adequate for the next twelve months for making required payments of principal and interest on our indebtedness, funding working capital requirements, and anticipated capital expenditures.
24
ITEM 3.QUANTITATIVE AND QUALITATIVE DISCLOSURES ABOUT MARKET RISK
Interest Rate Risk
In the normal course of business, we are exposed to interest rate changes. Our objectives in managing exposure to interest rate changes are to limit the impact of these rate changes on earnings and cash flows and to lower overall borrowing costs. To achieve these objectives, we occasionally use interest rate swaps to manage net exposure to interest rate changes related to our portfolio of borrowings. We did not have any interest rate swaps during the three- and nine-month periods ended September 30, 2016 or 2015.
Commodity Risk
In the normal course of business we are exposed to the market risk and price fluctuations related to the sale of our products and to the purchase of raw materials used in our operations, such as metallic raw materials, electricity, natural gas and its transportation services, fuel, air products, and zinc. Our risk strategy associated with product sales has generally been to obtain competitive prices for our products and to allow operating results to reflect market price movements dictated by supply and demand.
25
Our risk strategy associated with the purchase of raw materials utilized within our operations has generally been to make some commitments with suppliers relating to future expected requirements for some commodities such as electricity, natural gas and its transportation services, fuel, air products, and zinc. Certain of these commitments contain provisions which require us to “take or pay” for specified quantities without regard to actual usage generally for periods of up to 24 months4 years for physical commodity requirements (in certain cases up to 60 months), for up to 4 years forand commodity transportation requirements, and for up to 12 years for air products. We utilized such “take or pay” requirements during the past three years under these contracts, except for certain air products at our Minnesota ironmaking operations which were idled in May 2015. We believe that production requirements will be such that consumption of the products or services purchased under these commitments will occur in the normal production process, other than certain air products related to our Minnesota ironmaking operations during the idle period. We also purchase electricity consumed at our Butler Flat Roll Division pursuant to a contract which extends through December 2017. The contract designates 160 hours annually as “interruptible service” and establishes an agreed fixed-rate energy charge per Mill/kWh consumed for each year through the expiration of the agreement.
In our metals recycling operations, we have certain fixed price contracts with various customers and suppliers for future delivery of nonferrous metals. Our risk strategy has been to enter into base metal financial contracts with the goal to protect the profit margin, within certain parameters, that was contemplated when we entered into the transaction with the customer or vendor. At September 30, 2016,2017, we had a cumulative unrealized lossgain associated with these financial contracts of $1.6$3.3 million, substantially all of which have a settlement date within the next twelve months. We believe the customer contracts associated with the financial contracts will be fully consummated.
ITEM 4.CONTROLS AND PROCEDURES
(a) Evaluation of Disclosure Controls and Procedures. Our management, with the participation of our principal executive officer and principal financial officer, evaluated the effectiveness of our disclosure controls and procedures as of September 30, 2016.2017. The term “disclosure controls and procedures,” as defined in Rules 13a-15(e) and 15d-15(e) under the Exchange Act, means controls and other procedures of a company that are designed to ensure that information required to be disclosed by a company in the reports that it files or submits under the Exchange Act is recorded, processed, summarized and reported, within the time periods specified in the Commission’s rules and forms. Disclosure controls and procedures include, without limitation, controls and procedures designed to ensure that information required to be disclosed by a company in the reports that it files or submits under the Exchange Act is accumulated and communicated to the company’s management, including its principal executive and principal financial officers, as appropriate to allow timely decisions regarding required disclosure. Based on the evaluation of our disclosure controls and procedures as of September 30, 2016,2017, our principal executive officer and principal financial officer concluded that, as of such date, our disclosure controls and procedures were effective.
(b) Changes in Internal Controls Over Financial Reporting. No change in our internal control over financial reporting (as defined in Rules 13a-15(f) and 15d-15(f) under the Exchange Act) occurred during the fiscal quarter ended September 30, 2016,2017, that has materially affected, or is reasonably likely to materially affect, our internal control over financial reporting.
2625
PART II OTHER INFORMATION
Although, as noted below, a tentative settlement has been reached in the case, we have to date been involved, along with two other remaining non-settling defendant steel manufacturing companies, from an original group of eight, in a direct purchaser class action antitrust suit in federal court in Chicago, Illinois, under the caption of Standard Iron Works v Arcelor Mittal, et al. Two other complaints, not yet settled, were brought on behalf of a purported class of indirect purchasers of steel products within the same time period. We have a pending motion to dismiss in that case. The complaints allege a conspiracy to limit output on the part of the defendants, in order to fix, raise, maintain and stabilize the price at which steel products were sold in the United States during a specified period between 2005 and 2007. The complaints seek treble damages and costs, including reasonable attorney fees, pre- and post-judgment interest and injunctive relief. In September 2015, the Court denied class certification on the issue of antitrust impact and damages, but granted class certification on the limited issue of the alleged conspiracy.
In October 2016, we announced that we have entered into an agreement to settle the direct purchaser case for a payment of $4.6 million. Preliminary approval was granted by the court on November 3, 2016, and final approval by the Court is also expected to be forthcoming. During the approval process, members of the class will be given an opportunity to opt-out of the class and retain their own individual rights.
Due to the uncertain nature of litigation, we cannot presently predict either the final outcome of the proposed settlement process, including whether there may be opt-outs from the settlement, or the outcome of the remaining indirect purchaser case. Based on the information available at this time, however, we have determined that, apart from the proposed settlement amount in the direct case, there is not presently a “reasonable possibility” (as that term is defined in ASC 450-20-20), that the outcome of the remaining unresolved matters will have a material impact on our financial condition, results of operations, or liquidity. Although not presently necessary or appropriate to make a dollar estimate of exposure to loss, if any, in connection with these remaining matters, we may in the future determine that a further loss accrual may be necessary. Further, although we may make loss accruals, if and as warranted, any amounts that we may accrue from time to time could vary significantly from the amounts we actually pay, due to inherent uncertainties and the inherent shortcomings of the estimation process, the uncertainties involved in litigation and other factors. Additionally, an adverse result could have a material effect on our financial condition, results of operations and liquidity.
We are additionally involved in various routine litigation matters, including administrative proceedings, regulatory proceedings, governmental investigations, environmental matters, and commercial and construction contract disputes, none of which are expected to have a material impact on our financial condition, results of operations, or liquidity.liquidity.
We may also be involved from time to time in various governmental investigations, regulatory proceedings or judicial actions seeking remediation under federal, state and local environmental laws and regulations. The United States EPA has conducted such investigations and proceedings involving us, in some instances along with state environmental regulators, under various environmental laws, including RCRA, CERCLA, the Clean Water Act and the Clean Air Act. Some of these matters have resulted in fines or penalties, for which a total of $420,000 is recorded in our financial statements as of September 30, 2017.
No material changes have occurred to the indicated risk factors as disclosed in our Annual Report on Form 10-K for the year ended
December 31, 2015.2016.
ITEM 2.UNREGISTERED SALES OF EQUITY SECURITIES AND USE OF PROCEEDS
(c) Issuer Purchases of Equity Securities
NoneWe purchased the following equity securities registered by us pursuant to Section 12 of the Exchange Act during the three months ended.September 30, 2017.
|
|
|
|
|
|
|
|
|
|
|
|
|
|
|
|
| Period |
| Total Number of Shares Purchased |
| Average Price Paid per Share |
| Total Number of Shares Purchased as Part of Publicly Announced Program (1) |
| Maximum Dollar Value of Shares That May Yet be Purchased Under the Program (in thousands) (1) |
| |||||
| Quarter ended September 30, 2017 |
|
|
|
|
|
|
|
|
|
|
|
| ||
|
|
|
|
|
|
|
|
|
|
|
|
|
|
|
|
| July 1 - 31 |
| - |
|
| $ | - |
|
| - |
|
| $ | 286,897 |
|
| August 1 - 31 |
| 947,396 |
|
|
| 34.41 |
|
| 947,396 |
|
|
| 254,296 |
|
| September 1 - 30 |
| 1,973,694 |
|
|
| 33.69 |
|
| 1,973,694 |
|
|
| 187,812 |
|
|
|
| 2,921,090 |
|
|
|
|
|
| 2,921,090 |
|
|
|
|
|
|
|
|
|
|
|
|
|
|
|
|
|
|
|
|
|
(1) | On October 18, 2016, we announced that our board of directors had authorized a share repurchase program of up to $450.0 million of our common stock. Our board of directors cancelled the previously authorized program with respect to which no shares had been repurchased for a number of years. |
ITEM 3.DEFAULTS UPON SENIOR SECURITIES
None.
ITEM 4.MINE SAFETY DISCLOSURES
Information normally required to be furnished, in Exhibit 95 to this Quarterly Report, pursuant to Item 4 concerning mine safety disclosure matters, if applicable, by Section 1503(a) of the Dodd-Frank Wall Street Reform and Consumer Protection Act and Item 104 of Regulation S-K (17 CFR 229.104), is not included in this report, as there are no applicable mine safety disclosure matters to report for the three months ended September 30, 2016.2017. Accordingly, there is no Exhibit 95 attached to this report.
None.
None.
2726
Executive Officer Certifications
31.1*Certification of Principal Executive Officer required by Item 307 of Regulation S-K as promulgated by the
Securities and Exchange Commission and pursuant to Section 302 of the Sarbanes‑Oxley Act of 2002.
31.2*Certification of Principal Financial Officer required by Item 307 of Regulation S-K as promulgated by the
Securities and Exchange Commission and pursuant to Section 302 of the Sarbanes‑Oxley Act of 2002.
32.1*Certification of Chief Executive Officer Pursuant to 18 U.S.C Section 1350, as Adopted Pursuant to
Section 906 of the Sarbanes‑Oxley Act of 2002.
32.2*Certification of Chief Financial Officer Pursuant to 18 U.S.C Section 1350, as Adopted Pursuant to
Section 906 of the Sarbanes‑Oxley Act of 2002.
Other
95**Mine Safety Disclosures.
XBRL Documents
101.INS*XBRL Instance Document
101.SCH*XBRL Taxonomy Extension Schema Document
101.CAL*XBRL Taxonomy Extension Calculation Document
101.DEF*XBRL Taxonomy Definition Document
101.LAB*XBRL Taxonomy Extension Label Document
101.PRE*XBRL Taxonomy Presentation Document
| ||||
ITEM 6. | ||||
Articles of Incorporation | ||||
3.2c* | ||||
Executive Officer Certifications | ||||
31.1* | ||||
31.2* | ||||
�� | ||||
32.1* | ||||
32.2* | ||||
Other | ||||
95** | Mine Safety Disclosures. | |||
XBRL Documents | ||||
101.INS* | XBRL Instance Document | |||
101.SCH* | XBRL Taxonomy Extension Schema Document | |||
101.CAL* | XBRL Taxonomy Extension Calculation Document | |||
101.DEF* | XBRL Taxonomy Definition Document | |||
101.LAB* | XBRL Taxonomy Extension Label Document | |||
101.PRE* | XBRL Taxonomy Presentation Document | |||
*Filed concurrently herewith
**Inapplicable for purposes of this report
2827
Pursuant to the requirements of the Securities Exchange Act of 1934, the registrant has duly caused this report to be signed on its behalf by the undersigned, thereunto duly authorized.
November 9, 20162017
|
|
|
STEEL DYNAMICS, | ||
|
|
|
By: |
| /s/ Theresa E. Wagler |
|
| Theresa E. Wagler |
|
| Executive Vice President and Chief Financial Officer |
|
| (Principal Financial Officer and Principal Accounting Officer) |
2928