FORM 10-Q
1934 March 31, 2024 (I.R.S. Employer Identification No.) 111 North Washington Street ☒x1934.September 30, 201715(d)15(d) OF THE SECURITIES EXCHANGE ACT OF 1934numbernumber: 001-37700nameName of registrantRegistrant as specifiedSpecified in its charter)Charter)WISCONSINWisconsin 47-0871001 (State or other jurisdictionOther Jurisdiction of incorporationIncorporation or organization)Organization)47-0871001Green Bay, Wisconsin 54301 (920) 430-1400including zip code,of Principal Executive Offices)(Zip Code) (920) 430-1400 (Registrant’s Telephone Number, Including Area Code) telephone number, including area code, ofRegistrant’s principal executive offices)Former Fiscal Year, if Changed Since Last Report)Securities registered pursuant to Section 12(b) of the Act: Title of each class Trading Symbol(s) Name of each exchange on which registered Common Stock, par value $0.01 per share NIC New York Stock Exchange registrant:registrant (1) has filed all reports required to be filed by Section 13 or 15(d) of the Securities Exchange Act of 1934 during the preceding 12 months (or for such shorter period that the registrant was required to file such reports), and (2) has been subject to such filing requirements for the past 90 days. Yesx☒ No¨☐and posted on its corporate Web site, if any, every Interactive DateData File required to be submitted and posted pursuant to Rule 405 of Regulation S-T (§232.405 of this chapter) during the preceding 12 months (or for such shorter period that the registrant was required to submit and post such files). Yesx☒ No¨☐Large accelerated filer ¨☒ Accelerated filer x☐ Non-accelerated filer ¨☐ Smaller reporting company ¨☐ Emerging growth company ☐ (Do not check if a smaller reporting company)Emerging Growth Companyx¨☐¨ ☐ NoxOctober 27, 2017April 30, 2024 there were 9,801,61314,933,474 shares of $0.01 par value common stock outstanding.
Nicolet Bankshares, Inc.
TABLE OF CONTENTS
| PAGE | |||||||||||||
| September 30, 2017 (Unaudited) | December 31, 2016 (Audited) | |||||||
| Assets | ||||||||
| Cash and due from banks | $ | 64,075 | $ | 68,056 | ||||
| Interest-earning deposits | 31,297 | 60,320 | ||||||
| Federal funds sold | 731 | 727 | ||||||
| Cash and cash equivalents | 96,103 | 129,103 | ||||||
| Certificates of deposit in other banks | 2,494 | 3,984 | ||||||
| Securities available for sale (“AFS”) | 408,217 | 365,287 | ||||||
| Other investments | 14,931 | 17,499 | ||||||
| Loans held for sale | 6,963 | 6,913 | ||||||
| Loans | 2,051,122 | 1,568,907 | ||||||
| Allowance for loan losses | (12,610 | ) | (11,820 | ) | ||||
| Loans, net | 2,038,512 | 1,557,087 | ||||||
| Premises and equipment, net | 47,432 | 45,862 | ||||||
| Bank owned life insurance (“BOLI”) | 63,989 | 54,134 | ||||||
| Goodwill and other intangibles | 129,588 | 87,938 | ||||||
| Accrued interest receivable and other assets | 37,501 | 33,072 | ||||||
| Total assets | $ | 2,845,730 | $ | 2,300,879 | ||||
| Liabilities and Stockholders’ Equity | ||||||||
| Liabilities: | ||||||||
| Demand | $ | 638,447 | $ | 482,300 | ||||
| Money market and NOW accounts | 1,107,360 | 964,509 | ||||||
| Savings | 274,828 | 221,282 | ||||||
| Time | 346,316 | 301,895 | ||||||
| Total deposits | 2,366,951 | 1,969,986 | ||||||
| Short-term borrowings | 12,900 | - | ||||||
| Notes payable | 41,571 | 1,000 | ||||||
| Junior subordinated debentures | 29,497 | 24,732 | ||||||
| Subordinated notes | 11,912 | 11,885 | ||||||
| Accrued interest payable and other liabilities | 21,827 | 16,911 | ||||||
| Total liabilities | 2,484,658 | 2,024,514 | ||||||
| Stockholders’ Equity: | ||||||||
| Common stock | 98 | 86 | ||||||
| Additional paid-in capital | 267,396 | 209,700 | ||||||
| Retained earnings | 92,935 | 68,888 | ||||||
| Accumulated other comprehensive loss (“AOCI”) | (3 | ) | (2,727 | ) | ||||
| Total Nicolet Bankshares, Inc. stockholders’ equity | 360,426 | 275,947 | ||||||
| Noncontrolling interest | 646 | 418 | ||||||
| Total stockholders’ equity and noncontrolling interest | 361,072 | 276,365 | ||||||
| Total liabilities, noncontrolling interest and stockholders’ equity | $ | 2,845,730 | $ | 2,300,879 | ||||
| Preferred shares authorized (no par value) | 10,000,000 | 10,000,000 | ||||||
| Preferred shares issued and outstanding | - | - | ||||||
| Common shares authorized (par value $0.01 per share) | 30,000,000 | 30,000,000 | ||||||
| Common shares outstanding | 9,798,724 | 8,553,292 | ||||||
| Common shares issued | 9,826,197 | 8,596,241 | ||||||
| March 31, 2024 | December 31, 2023 | ||||||||||
| (Unaudited) | (Audited) | ||||||||||
| Assets | |||||||||||
| Cash and due from banks | $ | 81,677 | $ | 129,898 | |||||||
| Interest-earning deposits | 345,747 | 361,533 | |||||||||
| Cash and cash equivalents | 427,424 | 491,431 | |||||||||
| Certificates of deposit in other banks | 5,639 | 6,374 | |||||||||
| Securities available for sale (“AFS”), at fair value | 803,963 | 802,573 | |||||||||
| Other investments | 60,464 | 57,560 | |||||||||
| Loans held for sale | 5,022 | 4,160 | |||||||||
| Loans | 6,397,617 | 6,353,942 | |||||||||
| Allowance for credit losses - loans (“ACL-Loans”) | (64,347) | (63,610) | |||||||||
| Loans, net | 6,333,270 | 6,290,332 | |||||||||
| Premises and equipment, net | 119,962 | 118,756 | |||||||||
| Bank owned life insurance (“BOLI”) | 170,746 | 169,392 | |||||||||
| Goodwill and other intangibles, net | 393,183 | 394,366 | |||||||||
| Accrued interest receivable and other assets | 126,989 | 133,734 | |||||||||
| Total assets | $ | 8,446,662 | $ | 8,468,678 | |||||||
| Liabilities and Stockholders’ Equity | |||||||||||
| Liabilities: | |||||||||||
| Noninterest-bearing demand deposits | $ | 1,665,229 | $ | 1,958,709 | |||||||
| Interest-bearing deposits | 5,500,503 | 5,239,091 | |||||||||
| Total deposits | 7,165,732 | 7,197,800 | |||||||||
| Short-term borrowings | — | — | |||||||||
| Long-term borrowings | 162,257 | 166,930 | |||||||||
| Accrued interest payable and other liabilities | 55,018 | 64,941 | |||||||||
| Total liabilities | 7,383,007 | 7,429,671 | |||||||||
| Stockholders’ Equity: | |||||||||||
| Common stock | 149 | 149 | |||||||||
| Additional paid-in capital | 636,621 | 633,770 | |||||||||
| Retained earnings | 482,295 | 458,261 | |||||||||
| Accumulated other comprehensive income (loss) | (55,410) | (53,173) | |||||||||
| Total stockholders’ equity | 1,063,655 | 1,039,007 | |||||||||
| Total liabilities and stockholders’ equity | $ | 8,446,662 | $ | 8,468,678 | |||||||
| Preferred shares authorized (no par value) | 10,000,000 | 10,000,000 | |||||||||
| Preferred shares issued and outstanding | — | — | |||||||||
| Common shares authorized (par value $0.01 per share) | 30,000,000 | 30,000,000 | |||||||||
| Common shares outstanding | 14,930,549 | 14,894,209 | |||||||||
| Common shares issued | 14,987,207 | 14,951,367 | |||||||||
(Loss)
| Three Months Ended September 30, | Nine Months Ended September 30, | |||||||||||||||
| 2017 | 2016 | 2017 | 2016 | |||||||||||||
| Interest income: | ||||||||||||||||
| Loans, including loan fees | $ | 27,329 | $ | 21,049 | $ | 73,098 | $ | 49,455 | ||||||||
| Investment securities: | ||||||||||||||||
| Taxable | 1,114 | 902 | 3,422 | 2,068 | ||||||||||||
| Non-taxable | 604 | 493 | 1,761 | 1,146 | ||||||||||||
| Other interest income | 407 | 351 | 1,136 | 906 | ||||||||||||
| Total interest income | 29,454 | 22,795 | 79,417 | 53,575 | ||||||||||||
| Interest expense: | ||||||||||||||||
| Money market and NOW accounts | 1,380 | 631 | 2,755 | 1,726 | ||||||||||||
| Savings and time deposits | 984 | 719 | 2,461 | 2,102 | ||||||||||||
| Short-term borrowings | - | - | 72 | 5 | ||||||||||||
| Notes payable | 81 | 6 | 133 | 230 | ||||||||||||
| Junior subordinated debentures | 459 | 376 | 1,284 | 926 | ||||||||||||
| Subordinated notes | 159 | 159 | 477 | 477 | ||||||||||||
| Total interest expense | 3,063 | 1,891 | 7,182 | 5,466 | ||||||||||||
| Net interest income | 26,391 | 20,904 | 72,235 | 48,109 | ||||||||||||
| Provision for loan losses | 975 | 450 | 1,875 | 1,350 | ||||||||||||
| Net interest income after provision for loan losses | 25,416 | 20,454 | 70,360 | 46,759 | ||||||||||||
| Noninterest income: | ||||||||||||||||
| Service charges on deposit accounts | 1,238 | 1,051 | 3,367 | 2,514 | ||||||||||||
| Mortgage income, net | 1,774 | 2,010 | 4,022 | 3,713 | ||||||||||||
| Trust services fee income | 1,479 | 1,373 | 4,431 | 4,000 | ||||||||||||
| Brokerage fee income | 1,500 | 992 | 4,192 | 2,090 | ||||||||||||
| Bank owned life insurance | 459 | 318 | 1,314 | 880 | ||||||||||||
| Rent income | 285 | 285 | 852 | 820 | ||||||||||||
| Investment advisory fees | 92 | 146 | 357 | 341 | ||||||||||||
| Gain on sale or writedown of assets, net | 1,305 | 453 | 2,071 | 548 | ||||||||||||
| Other income | 2,032 | 1,904 | 5,412 | 3,874 | ||||||||||||
| Total noninterest income | 10,164 | 8,532 | 26,018 | 18,780 | ||||||||||||
| Noninterest expense: | ||||||||||||||||
| Personnel | 11,488 | 10,516 | 32,404 | 24,748 | ||||||||||||
| Occupancy, equipment and office | 3,559 | 3,018 | 9,613 | 7,324 | ||||||||||||
| Business development and marketing | 1,113 | 985 | 3,359 | 2,353 | ||||||||||||
| Data processing | 2,238 | 1,831 | 6,428 | 4,408 | ||||||||||||
| FDIC assessments | 205 | 247 | 582 | 629 | ||||||||||||
| Intangibles amortization | 1,173 | 1,172 | 3,514 | 2,295 | ||||||||||||
| Other expense | 1,086 | 1,250 | 3,598 | 4,799 | ||||||||||||
| Total noninterest expense | 20,862 | 19,019 | 59,498 | 46,556 | ||||||||||||
| Income before income tax expense | 14,718 | 9,967 | 36,880 | 18,983 | ||||||||||||
| Income tax expense | 5,132 | 3,438 | 12,605 | 6,432 | ||||||||||||
| Net income | 9,586 | 6,529 | 24,275 | 12,551 | ||||||||||||
| Less: net income attributable to noncontrolling interest | 74 | 65 | 228 | 176 | ||||||||||||
| Net income attributable to Nicolet Bankshares, Inc. | 9,512 | 6,464 | 24,047 | 12,375 | ||||||||||||
| Less: preferred stock dividends | - | 247 | - | 633 | ||||||||||||
| Net income available to common shareholders | $ | 9,512 | $ | 6,217 | $ | 24,047 | $ | 11,742 | ||||||||
| Basic earnings per common share | $ | 0.97 | $ | 0.72 | $ | 2.58 | $ | 1.76 | ||||||||
| Diluted earnings per common share | $ | 0.91 | $ | 0.69 | $ | 2.45 | $ | 1.67 | ||||||||
| Weighted average common shares outstanding: | ||||||||||||||||
| Basic | 9,836,646 | 8,607,719 | 9,316,814 | 6,689,367 | ||||||||||||
| Diluted | 10,408,683 | 8,969,735 | 9,820,724 | 7,024,169 | ||||||||||||
| Three Months Ended March 31, | |||||||||||||||||||||||
| 2024 | 2023 | ||||||||||||||||||||||
| Interest income: | |||||||||||||||||||||||
| Loans, including loan fees | $ | 93,648 | $ | 79,142 | |||||||||||||||||||
| Investment securities: | |||||||||||||||||||||||
| Taxable | 4,557 | 4,961 | |||||||||||||||||||||
| Tax-exempt | 1,238 | 1,737 | |||||||||||||||||||||
| Other interest income | 4,588 | 1,536 | |||||||||||||||||||||
| Total interest income | 104,031 | 87,376 | |||||||||||||||||||||
| Interest expense: | |||||||||||||||||||||||
| Deposits | 38,990 | 24,937 | |||||||||||||||||||||
| Short-term borrowings | — | 3,212 | |||||||||||||||||||||
| Long-term borrowings | 2,234 | 2,506 | |||||||||||||||||||||
| Total interest expense | 41,224 | 30,655 | |||||||||||||||||||||
| Net interest income | 62,807 | 56,721 | |||||||||||||||||||||
| Provision for credit losses | 750 | 3,090 | |||||||||||||||||||||
| Net interest income after provision for credit losses | 62,057 | 53,631 | |||||||||||||||||||||
| Noninterest income: | |||||||||||||||||||||||
| Wealth management fee income | 6,485 | 5,512 | |||||||||||||||||||||
| Mortgage income, net | 1,364 | 1,466 | |||||||||||||||||||||
| Service charges on deposit accounts | 1,581 | 1,480 | |||||||||||||||||||||
| Card interchange income | 3,098 | 3,033 | |||||||||||||||||||||
| BOLI income | 1,347 | 1,200 | |||||||||||||||||||||
| Deferred compensation plan asset market valuations | 59 | 946 | |||||||||||||||||||||
| LSR income, net | 1,134 | 1,155 | |||||||||||||||||||||
| Asset gains (losses), net | 1,909 | (38,468) | |||||||||||||||||||||
| Other income | 2,445 | 1,832 | |||||||||||||||||||||
| Total noninterest income | 19,422 | (21,844) | |||||||||||||||||||||
| Noninterest expense: | |||||||||||||||||||||||
| Personnel | 26,510 | 24,328 | |||||||||||||||||||||
| Occupancy, equipment and office | 8,944 | 8,783 | |||||||||||||||||||||
| Business development and marketing | 2,142 | 2,121 | |||||||||||||||||||||
| Data processing | 4,270 | 3,988 | |||||||||||||||||||||
| Intangibles amortization | 1,833 | 2,161 | |||||||||||||||||||||
| FDIC assessments | 1,033 | 540 | |||||||||||||||||||||
| Merger-related expense | — | 163 | |||||||||||||||||||||
| Other expense | 2,415 | 2,791 | |||||||||||||||||||||
| Total noninterest expense | 47,147 | 44,875 | |||||||||||||||||||||
| Income (loss) before income tax expense (benefit) | 34,332 | (13,088) | |||||||||||||||||||||
| Income tax expense (benefit) | 6,542 | (4,190) | |||||||||||||||||||||
| Net income (loss) | $ | 27,790 | $ | (8,898) | |||||||||||||||||||
| Earnings (loss) per common share: | |||||||||||||||||||||||
| Basic | $ | 1.86 | $ | (0.61) | |||||||||||||||||||
| Diluted | $ | 1.82 | $ | (0.61) | |||||||||||||||||||
| Weighted average common shares outstanding: | |||||||||||||||||||||||
| Basic | 14,907,124 | 14,694,451 | |||||||||||||||||||||
| Diluted | 15,249,179 | 14,694,451 | |||||||||||||||||||||
(Loss)
| Three Months Ended September 30, | Nine Months Ended September 30, | |||||||||||||||
| 2017 | 2016 | 2017 | 2016 | |||||||||||||
| Net income | $ | 9,586 | $ | 6,529 | $ | 24,275 | $ | 12,551 | ||||||||
| Other comprehensive income, net of tax: | ||||||||||||||||
| Unrealized gains on securities AFS: | ||||||||||||||||
| Net unrealized holding gains (losses) arising during the period | 834 | (984 | ) | 5,685 | 2,257 | |||||||||||
| Reclassification adjustment for net gains included in net income | (1,221 | ) | (37 | ) | (1,220 | ) | (77 | ) | ||||||||
| Income tax benefit (expense) | 125 | 397 | (1,741 | ) | (851 | ) | ||||||||||
| Total other comprehensive income (loss) | (262 | ) | (624 | ) | 2,724 | 1,329 | ||||||||||
| Comprehensive income | $ | 9,324 | $ | 5,905 | $ | 26,999 | $ | 13,880 | ||||||||
| Three Months Ended March 31, | |||||||||||||||||||||||
| 2024 | 2023 | ||||||||||||||||||||||
| Net income (loss) | $ | 27,790 | $ | (8,898) | |||||||||||||||||||
| Other comprehensive income (loss), net of tax: | |||||||||||||||||||||||
| Unrealized gains (losses) on securities AFS: | |||||||||||||||||||||||
| Net unrealized holding gains (losses) | (1,770) | 15,294 | |||||||||||||||||||||
| Net realized (gains) losses included in income | (968) | 213 | |||||||||||||||||||||
| Reclassification adjustment for securities transferred from held to maturity to available for sale | — | (20,434) | |||||||||||||||||||||
| Income tax (expense) benefit | 501 | 1,330 | |||||||||||||||||||||
| Total other comprehensive income (loss) | (2,237) | (3,597) | |||||||||||||||||||||
| Comprehensive income (loss) | $ | 25,553 | $ | (12,495) | |||||||||||||||||||
| Nicolet Bankshares, Inc. Stockholders’ Equity | ||||||||||||||||||||||||
| Common Stock | Additional Paid-In Capital | Retained Earnings | Accumulated Other Comprehensive Income (loss) | Noncontrolling Interest | Total | |||||||||||||||||||
| Balance December 31, 2016 | $ | 86 | $ | 209,700 | $ | 68,888 | $ | (2,727 | ) | $ | 418 | $ | 276,365 | |||||||||||
| Comprehensive income: | ||||||||||||||||||||||||
| Net income | - | - | 24,047 | - | 228 | 24,275 | ||||||||||||||||||
| Other comprehensive income | - | - | - | 2,724 | - | 2,724 | ||||||||||||||||||
| Stock compensation expense | - | 1,871 | - | - | - | 1,871 | ||||||||||||||||||
| Exercise of stock options, net | 1 | 1,285 | - | - | - | 1,286 | ||||||||||||||||||
| Issuance of common stock | - | 175 | - | - | - | 175 | ||||||||||||||||||
| Issuance of common stock in acquisitions, net of capitalized issuance costs of $186 | 13 | 62,047 | - | - | - | 62,060 | ||||||||||||||||||
| Purchase and retirement of common stock | (2 | ) | (7,682 | ) | - | - | - | (7,684 | ) | |||||||||||||||
| Balance, September 30, 2017 | $ | 98 | $ | 267,396 | $ | 92,935 | $ | (3 | ) | $ | 646 | $ | 361,072 | |||||||||||
| Common Stock | Additional Paid-In Capital | Retained Earnings | Accumulated Other Comprehensive Income (Loss) | Total | |||||||||||||||||||||||||
| Balances at December 31, 2023 | $ | 149 | $ | 633,770 | $ | 458,261 | $ | (53,173) | $ | 1,039,007 | |||||||||||||||||||
| Comprehensive income: | |||||||||||||||||||||||||||||
| Net income, three months ended March 31, 2024 | — | — | 27,790 | — | 27,790 | ||||||||||||||||||||||||
| Other comprehensive income (loss) | — | — | — | (2,237) | (2,237) | ||||||||||||||||||||||||
| Stock-based compensation expense | — | 1,381 | — | — | 1,381 | ||||||||||||||||||||||||
| Cash dividends on common stock, $0.25 per share | — | — | (3,756) | — | (3,756) | ||||||||||||||||||||||||
| Exercise of stock options, net | — | 1,268 | — | — | 1,268 | ||||||||||||||||||||||||
| Issuance of common stock | — | 202 | — | — | 202 | ||||||||||||||||||||||||
| Balances at March 31, 2024 | $ | 149 | $ | 636,621 | $ | 482,295 | $ | (55,410) | $ | 1,063,655 | |||||||||||||||||||
| Balances at December 31, 2022 | $ | 147 | $ | 621,988 | $ | 407,864 | $ | (57,470) | $ | 972,529 | |||||||||||||||||||
| Comprehensive income: | |||||||||||||||||||||||||||||
| Net income (loss), three months ended March 31, 2023 | — | — | (8,898) | — | (8,898) | ||||||||||||||||||||||||
| Other comprehensive income (loss) | — | — | — | (3,597) | (3,597) | ||||||||||||||||||||||||
| Stock-based compensation expense | — | 1,424 | — | — | 1,424 | ||||||||||||||||||||||||
| Exercise of stock options, net | — | 148 | — | — | 148 | ||||||||||||||||||||||||
| Issuance of common stock | — | 186 | — | — | 186 | ||||||||||||||||||||||||
| Balances at March 31, 2023 | $ | 147 | $ | 623,746 | $ | 398,966 | $ | (61,067) | $ | 961,792 | |||||||||||||||||||
(In thousands) (Unaudited)
| Nine Months Ended September 30, | ||||||||
| 2017 | 2016 | |||||||
| Cash Flows From Operating Activities, net of effects of business combinations: | ||||||||
| Net income | $ | 24,275 | $ | 12,551 | ||||
| Adjustments to reconcile net income to net cash provided by operating activities: | ||||||||
| Depreciation, amortization, and accretion | 7,038 | 4,227 | ||||||
| Provision for loan losses | 1,875 | 1,350 | ||||||
| Increase in cash surrender value of life insurance | (1,314 | ) | (880 | ) | ||||
| Stock compensation expense | 1,871 | 1,123 | ||||||
| Gain on sale or writedown of assets, net | (2,071 | ) | (548 | ) | ||||
| Gain on sale of loans held for sale, net | (3,614 | ) | (3,713 | ) | ||||
| Proceeds from sale of loans held for sale | 164,726 | 179,967 | ||||||
| Origination of loans held for sale | (164,806 | ) | (179,581 | ) | ||||
| Net change in: | ||||||||
| Accrued interest receivable and other assets | 239 | 1,182 | ||||||
| Accrued interest payable and other liabilities | 1,733 | (3,888 | ) | |||||
| Net cash provided by operating activities | 29,952 | 11,790 | ||||||
| Cash Flows From Investing Activities, net of effects of business combinations: | ||||||||
| Net decrease in certificates of deposit in other banks | 1,490 | 239 | ||||||
| Net decrease (increase) in loans | (126,499 | ) | 15,582 | |||||
| Purchases of securities AFS | (49,119 | ) | (57,510 | ) | ||||
| Proceeds from sales of securities AFS | 10,798 | 30,319 | ||||||
| Proceeds from calls and maturities of securities AFS | 34,426 | 22,962 | ||||||
| Purchase of other investments | (3,256 | ) | (3,745 | ) | ||||
| Proceeds from sales of other investments | 6,519 | - | ||||||
| Net increase in premises and equipment | (2,958 | ) | (3,802 | ) | ||||
| Proceeds from sales of other real estate and other assets | 3,410 | 1,661 | ||||||
| Purchase of BOLI | (70 | ) | (20,000 | ) | ||||
| Proceeds from redemption of BOLI | - | 21,549 | ||||||
| Intangible from acquired customer relationships | (870 | ) | - | |||||
| Net cash received in business combination | 9,119 | 66,517 | ||||||
| Net cash provided (used) by investing activities | (117,010 | ) | 73,772 | |||||
| Cash Flows From Financing Activities, net of effects of business combinations: | ||||||||
| Net increase in deposits | 22,054 | 55,332 | ||||||
| Net increase (decrease) in short-term borrowings | 12,900 | (49,087 | ) | |||||
| Proceeds from notes payable | 30,000 | - | ||||||
| Repayments of notes payable | (4,487 | ) | (56,519 | ) | ||||
| Redemption of preferred stock | - | (12,200 | ) | |||||
| Purchase and retirement of common stock | (7,462 | ) | (3,046 | ) | ||||
| Capitalized issuance costs, net | (186 | ) | (260 | ) | ||||
| Proceeds from issuance of common stock | 175 | 101 | ||||||
| Proceeds from exercise of common stock options, net | 1,064 | 1,502 | ||||||
| Cash dividends paid on preferred stock | - | (633 | ) | |||||
| Net cash provided (used) by financing activities | 54,058 | (64,810 | ) | |||||
| Net increase (decrease) in cash and cash equivalents | (33,000 | ) | 20,752 | |||||
| Cash and cash equivalents: | ||||||||
| Beginning | $ | 129,103 | $ | 83,619 | ||||
| Ending | $ | 96,103 | $ | 104,371 | ||||
| Supplemental Disclosures of Cash Flow Information: | ||||||||
| Cash paid for interest | $ | 7,117 | $ | 5,787 | ||||
| Cash paid for taxes | 8,805 | 7,150 | ||||||
| Transfer of loans and bank premises to other real estate owned | 828 | 33 | ||||||
| Capitalized mortgage servicing rights | 679 | 492 | ||||||
| Transfer of loans from held for sale to held for investment | 3,236 | - | ||||||
| Acquisitions | ||||||||
| Fair value of assets acquired | 439,000 | 1,035,000 | ||||||
| Fair value of liabilities assumed | 398,000 | 937,000 | ||||||
| Net assets acquired | 41,000 | 98,000 | ||||||
| (In thousands) | Three Months Ended March 31, | ||||||||||
| 2024 | 2023 | ||||||||||
| Cash Flows From Operating Activities: | |||||||||||
| Net income (loss) | $ | 27,790 | $ | (8,898) | |||||||
| Adjustments to reconcile net income (loss) to net cash provided by (used in) operating activities: | |||||||||||
| Depreciation, amortization, and accretion | 4,797 | 4,197 | |||||||||
| Provision for credit losses | 750 | 3,090 | |||||||||
| Increase in cash surrender value of life insurance | (1,347) | (1,087) | |||||||||
| Stock-based compensation expense | 1,381 | 1,424 | |||||||||
| Asset (gains) losses, net | (1,909) | 38,468 | |||||||||
| Gain on sale of loans held for sale, net | (1,090) | (612) | |||||||||
| Proceeds from sale of loans held for sale | 29,261 | 17,789 | |||||||||
| Origination of loans held for sale | (29,360) | (20,861) | |||||||||
| Net change due to: | |||||||||||
| Accrued interest receivable and other assets | 3,032 | (2,326) | |||||||||
| Accrued interest payable and other liabilities | (9,923) | (15,642) | |||||||||
| Net cash provided by (used in) operating activities | 23,382 | 15,542 | |||||||||
| Cash Flows From Investing Activities: | |||||||||||
| Net (increase) decrease in loans | (42,188) | (41,764) | |||||||||
| Net (increase) decrease in certificates of deposit in other banks | 735 | 1,225 | |||||||||
| Purchases of securities AFS | (48,042) | — | |||||||||
| Proceeds from sales of securities AFS | 4,987 | 22,565 | |||||||||
| Proceeds from sales of securities HTM | — | 460,051 | |||||||||
| Proceeds from calls and maturities of securities AFS | 39,009 | 42,028 | |||||||||
| Proceeds from calls and maturities of securities HTM | — | 2,916 | |||||||||
| Purchases of other investments | (230) | (3,801) | |||||||||
| Proceeds from sales of other investments | 625 | 11,108 | |||||||||
| Proceeds from redemption of BOLI | — | 117 | |||||||||
| Net (increase) decrease in premises and equipment | (3,325) | (5,646) | |||||||||
| Net (increase) decrease in other real estate and other assets | (596) | — | |||||||||
| Net cash provided by (used in) investing activities | (49,025) | 488,799 | |||||||||
| Cash Flows From Financing Activities: | |||||||||||
| Net increase (decrease) in deposits | (32,068) | (250,218) | |||||||||
| Net increase (decrease) in short-term borrowings | — | (267,000) | |||||||||
| Repayments of long-term borrowings | (4,010) | (28,000) | |||||||||
| Cash dividends paid on common stock | (3,756) | — | |||||||||
| Proceeds from issuance of common stock | 202 | 186 | |||||||||
| Proceeds from exercise of stock options | 1,268 | 148 | |||||||||
| Net cash provided by (used in) financing activities | (38,364) | (544,884) | |||||||||
| Net increase (decrease) in cash and cash equivalents | (64,007) | (40,543) | |||||||||
| Cash and cash equivalents: | |||||||||||
| Beginning | 491,431 | 154,723 | |||||||||
| Ending * | $ | 427,424 | $ | 114,180 | |||||||
| Supplemental Disclosures of Cash Flow Information: | |||||||||||
| Cash paid for interest | $ | 41,267 | $ | 30,825 | |||||||
| Cash paid for taxes | 50 | — | |||||||||
| Transfer of securities from HTM to AFS | — | 177,727 | |||||||||
| Transfer of loans and bank premises to other real estate owned | 27 | — | |||||||||
| Capitalized mortgage servicing rights | 327 | 204 | |||||||||
2023.
valuation of loans acquired, the determination of the allowance for credit losses, and income taxes.
2023.
Note 1 – Basis of Presentation, continued
Operating Segment
While the chief decision makers monitor the revenue streams of the various products and services, and evaluate costs, balance sheet positions and quality, all such products, services and activities are directly or indirectly related to the business of community banking, with no regular, formal or material segment delineations. Operations are managed and financial performance is evaluated on a company-wide basis, and accordingly, all the financial service operations are considered by management to be aggregated in one reportable operating segment.
Note 2 – Acquisitions
First Menasha Bancshares, Inc. (“First Menasha”):
On April 28, 2017, the Company consummated its merger with First Menasha pursuant to the Agreement and Plan of Merger by and between the Company and First Menasha dated November 3, 2016, (the “Merger Agreement”), whereby First Menasha was merged with and into the Company, and The First National Bank-Fox Valley, the wholly owned commercial bank subsidiary of First Menasha serving the Fox Valley area of Wisconsin, was merged with and into Nicolet National Bank (the “Bank”). The system integration was completed, and five branches of First Menasha opened on May 1, 2017, as Nicolet National Bank branches, expanding its presence into Calumet and Winnebago Counties, Wisconsin. Concurrently, Nicolet closed one of its Calumet County locations, bringing the Bank’s footprint to 38 branches as of September 30, 2017.
The purpose of the merger was to continue Nicolet’s interest in strategic growth, consistent with its plan to improve profitability through efficiency, leverage the strengths of each bank across the combined customer base, and add shareholder value. With the merger, Nicolet became the leading community bank to serve the Fox Valley area of Wisconsin.
Pursuant to the Merger Agreement, the final purchase price consisted of issuing 1,309,885 shares of the Company’s common stock (given the final stock-for-stock exchange ratio of 3.126 except for First Menasha shares owned by the Company immediately prior to the time of the merger), for common stock consideration of $62.2 million (based on $47.52 per share, the volume weighted average closing price of the Company’s common stock over the preceding 20 trading day period) plus cash consideration of $19.3 million. Approximately $0.2 million in direct stock issuance costs for the merger were incurred and charged against additional paid in capital.
Upon consummation, the Company added $480 million in assets, $351 million in loans, $375 million in deposits, $4 million in core deposit intangible, and $41 million of goodwill. The Company accounted for the transaction under the acquisition method of accounting, and thus, the financial position and results of operations of First Menasha prior to the consummation date These reclassifications were not included in the accompanying consolidated financial statements. The accounting required assets purchasedmaterial and liabilities assumed to be recorded at their respective estimated fair values at the date of acquisition. The estimated fair values may be subject to refinement as additional information relative to the closing date fair values becomes available through the measurement period of approximately one year from consummation. During the third quarter of 2017, adjustments were made based on additional information. Goodwill was increased by $1.0 million to account for the gain in the Company’s pre-acquisition equity interest holding in First Menasha, resulting in a $1.2 million gain in pre-tax earnings.
Financial advisor business acquired:
During the first quarter of 2016, Nicolet agreed in a private transaction to hire a select group of financial advisors and purchase their respective books of business, as well as their operating platform, to enhance the leadership and future growth of the Company’s wealth management business. The transaction was effected in phases and completed April 1, 2016. The Company paid $4.9 million total initial consideration, including $0.8 million cash, $2.6 million of Nicolet common stock, and recorded a $1.5 million earn-out liability payable to one principal in the future. The Company initially recorded $0.4 million of goodwill, $0.2 million of fixed assets, and $4.3 million of customer relationship intangibles (a portion amortizing straight-line over 10 years and a portion over 15 years). During the third quarter of 2017, thedid not impact previously variable earn-out liability was agreed to be modified to a fixed amount. Therefore, the earn-out liability was adjusted to $2.4 million, with a corresponding $0.9 million increase in the customer relationship intangible, being amortized over the original term. The transaction impacts thereported net income statement primarily within brokerage income, personnel expense, and intangibles amortization.
Note 2 – Acquisitions, continued
Baylake Corp. (“Baylake”):
On April 29, 2016, the Company consummated its merger with Baylake. The system integration was completed, and 21 branches of Baylake opened, on May 2, 2016, as branches of the Bank, expanding its presence into Door, Kewaunee, and Manitowoc Counties, Wisconsin. The Company closed one of its Brown County locations concurrently with the Baylake merger, and closed an additional six branches in the fourth quarter of 2016.
The purpose of the Baylake merger was for strategic reasons beneficial to the Company. The acquisition was consistent with its plan to drive growth and efficiency through increased scale, leverage the strengths of each bank across the combined customer base, enhance profitability, and add liquidity and shareholder value.
Baylake shareholders received 0.4517 shares of the Company’s common stock for each outstanding share of Baylake common stock (except for Baylake shares pre-owned by the Company at the time of the merger), and cash in lieu of any fractional share. Pre-existing Baylake equity awards (restricted stock units and stock options) immediately vested upon consummation of the merger. The Company issued 0.4517 shares of its common stock for each vesting Baylake restricted stock unit, and Nicolet assumed, after appropriate adjustment by the 0.4517 exchange ratio, all pre-existing Baylake stock options. As a result, the Company issued 4,344,243 shares of the Company’s common stock, for common stock consideration of $163.3 million (based on $37.58 per share, the volume weighted average closing price of the Company’s common stock over the preceding 20 trading day period) and recorded an additional $1.2 million consideration for the assumed stock options. Approximately $0.3 million in direct stock issuance costs for the merger were incurred and charged against additional paid in capital.
The Company accounted for the transaction under the acquisition method of accounting, and thus, the financial position and results of operations of Baylake prior to the consummation date were not included in the accompanying consolidated financial statements.
The fair value of the assets acquired and liabilities assumed on April 29, 2016 was as follows:
| (in millions) | As recorded by Baylake Corp | Fair Value Adjustments | As Recorded by Nicolet | |||||||||
| Cash, cash equivalents and securities available for sale | $ | 262 | $ | 1 | $ | 263 | ||||||
| Loans | 710 | (19 | ) | 691 | ||||||||
| Other real estate owned | 3 | (2 | ) | 1 | ||||||||
| Core deposit intangible | 1 | 16 | 17 | |||||||||
| Fixed assets and other assets | 71 | (8 | ) | 63 | ||||||||
| Total assets acquired | $ | 1,047 | $ | (12 | ) | $ | 1,035 | |||||
| Deposits | $ | 822 | $ | - | $ | 822 | ||||||
| Junior subordinated debentures, borrowings and other liabilities | 116 | (1 | ) | 115 | ||||||||
| Total liabilities acquired | $ | 938 | $ | (1 | ) | $ | 937 | |||||
| Excess of assets acquired over liabilities acquired | $ | 109 | $ | (11 | ) | $ | 98 | |||||
| Less: purchase price | 164 | |||||||||||
| Goodwill | $ | 66 | ||||||||||
The following unaudited pro forma information presents the results of operations for the three and nine months ended September 30, 2016, as if the Baylake acquisition had occurred January 1 of that year. These unaudited pro forma results are presented for illustrative purposes and are not intended to represent or be indicative of the actual results of operations of the combined company that would have been achieved had the acquisition occurred at the beginning of each period presented, nor are they intended to represent or be indicative of future results of operations.
| (in thousands, except per share data) | Three Months Ended September 30, 2016 | Nine Months Ended September 30, 2016 | ||||||
| Total revenues, net of interest expense | $ | 29,436 | $ | 82,870 | ||||
| Net income | 6,827 | 17,042 | ||||||
| Diluted earnings per share | 0.74 | 1.85 | ||||||
| Three Months Ended September 30, | Nine Months Ended September 30, | |||||||||||||||
| 2017 | 2016 | 2017 | 2016 | |||||||||||||
| (In thousands except per share data) | ||||||||||||||||
| Net income, net of noncontrolling interest | $ | 9,512 | $ | 6,464 | $ | 24,047 | $ | 12,375 | ||||||||
| Less: preferred stock dividends | - | 247 | - | 633 | ||||||||||||
| Net income available to common shareholders | $ | 9,512 | $ | 6,217 | $ | 24,047 | $ | 11,742 | ||||||||
| Weighted average common shares outstanding | 9,837 | 8,608 | 9,317 | 6,689 | ||||||||||||
| Effect of dilutive stock instruments | 572 | 362 | 504 | 335 | ||||||||||||
| Diluted weighted average common shares outstanding | 10,409 | 8,970 | 9,821 | 7,024 | ||||||||||||
| Basic earnings per common share* | $ | 0.97 | $ | 0.72 | $ | 2.58 | $ | 1.76 | ||||||||
| Diluted earnings per common share* | $ | 0.91 | $ | 0.69 | $ | 2.45 | $ | 1.67 | ||||||||
| Three Months Ended March 31, | |||||||||||||||||||||||
| (In thousands, except per share data) | 2024 | 2023 | |||||||||||||||||||||
| Net income (loss) | $ | 27,790 | $ | (8,898) | |||||||||||||||||||
| Weighted average common shares outstanding | 14,907 | 14,694 | |||||||||||||||||||||
| Effect of dilutive common stock awards | 342 | — | |||||||||||||||||||||
| Diluted weighted average common shares outstanding | 15,249 | 14,694 | |||||||||||||||||||||
| Basic earnings (loss) per common share* | $ | 1.86 | $ | (0.61) | |||||||||||||||||||
| Diluted earnings (loss) per common share* | $ | 1.82 | $ | (0.61) | |||||||||||||||||||
There were no
| Nine Months Ended September 30, 2017 | Year Ended December 31, 2016 | |||||||
| Dividend yield | 0 | % | 0 | % | ||||
| Expected volatility | 25 | % | 25 | % | ||||
| Risk-free interest rate | 2.13 | % | 1.52 | % | ||||
| Expected average life | 7 years | 7 years | ||||||
| Weighted average per share fair value of options | $ | 15.44 | $ | 11.04 | ||||
| Three Months Ended March 31, 2024 | |||||||||||
| Dividend yield | % | ||||||||||
| Expected volatility | 30 | % | |||||||||
| Risk-free interest rate | 4.31 | % | |||||||||
| Expected average life | 7 years | ||||||||||
| Weighted average per share fair value of options | $ | 27.67 | |||||||||
Note 4 – Stock-based Compensation, continued
Activity in
| Option Shares Stock Options Outstanding | Weighted- Average Exercise Price | Exercisable Shares | Weighted- Average Exercise Price | |||||||||||||
| Balance – December 31, 2015 | 746,004 | $ | 21.56 | 325,979 | $ | 19.09 | ||||||||||
| Granted(1) | 170,500 | 36.86 | ||||||||||||||
| Options assumed in acquisition | 91,701 | 21.03 | ||||||||||||||
| Exercise of stock options* | (84,723 | ) | 20.98 | |||||||||||||
| Forfeited | (1,456 | ) | 21.71 | |||||||||||||
| Balance – December 31, 2016 | 922,026 | 24.39 | 439,639 | $ | 19.97 | |||||||||||
| Granted(2) | 814,500 | 48.86 | ||||||||||||||
| Exercise of stock options* | (65,833 | ) | 19.52 | |||||||||||||
| Forfeited | (400 | ) | 16.50 | |||||||||||||
| Balance – September 30, 2017 | 1,670,293 | $ | 36.51 | 471,043 | $ | 21.49 | ||||||||||
below.
| Stock Options | Option Shares Outstanding | Weighted Average Exercise Price | Weighted Average Remaining Life (Years) | Aggregate Intrinsic Value (in thousands) | ||||||||||||||||||||||
| Outstanding - December 31, 2023 | 1,623,088 | $ | 62.09 | |||||||||||||||||||||||
| Granted | 20,000 | 78.72 | ||||||||||||||||||||||||
| Exercise of stock options * | (34,534) | 39.87 | ||||||||||||||||||||||||
| Forfeited | (3,500) | 73.54 | ||||||||||||||||||||||||
| Outstanding - March 31, 2024 | 1,605,054 | $ | 62.75 | 5.2 | $ | 37,443 | ||||||||||||||||||||
| Exercisable - March 31, 2024 | 1,160,497 | $ | 57.34 | 4.2 | $ | 33,301 | ||||||||||||||||||||
(1) The weighted average per share fair value of options granted was $11.04 for the period.
(2) The weighted average per share fair value of options granted was $15.44 for the period.
The following options were outstanding at September 30, 2017:
| Number of Shares | Weighted-Average Exercise Price | Weighted-Average Remaining Life (Years) | ||||||||||||||||||||||
| Outstanding | Exercisable | Outstanding | Exercisable | Outstanding | Exercisable | |||||||||||||||||||
| $9.19 – $20.00 | 257,750 | 238,000 | $ | 16.30 | $ | 16.28 | 3.78 | 3.71 | ||||||||||||||||
| $20.01 – $25.00 | 241,455 | 110,055 | 23.68 | 23.54 | 6.54 | 5.89 | ||||||||||||||||||
| $25.01 – $30.00 | 153,724 | 71,524 | 26.00 | 26.11 | 6.91 | 6.44 | ||||||||||||||||||
| $30.01 – $40.00 | 202,864 | 51,464 | 35.88 | 34.76 | 8.64 | 8.27 | ||||||||||||||||||
| $40.01 – $49.30 | 814,500 | - | 48.86 | - | 9.63 | - | ||||||||||||||||||
| 1,670,293 | 471,043 | $ | 36.51 | $ | 21.49 | 7.91 | 5.14 | |||||||||||||||||
Company.
| Restricted Stock | Weighted- Average Grant Date Fair Value | Restricted Shares Outstanding | ||||||
| Balance – December 31, 2015 | $ | 18.70 | 36,690 | |||||
| Granted | 33.68 | 31,466 | ||||||
| Vested* | 23.58 | (25,207 | ) | |||||
| Forfeited | - | - | ||||||
| Balance – December 31, 2016 | 26.80 | 42,949 | ||||||
| Granted | - | - | ||||||
| Vested * | 22.47 | (15,346 | ) | |||||
| Forfeited | 16.50 | (130 | ) | |||||
| Balance – September 30, 2017 | $ | 29.27 | 27,473 | |||||
| Restricted Stock | Weighted Average Grant Date Fair Value | Restricted Shares Outstanding | ||||||||||||
| Outstanding - December 31, 2023 | $ | 76.61 | 57,158 | |||||||||||
| Granted | — | — | ||||||||||||
| Vested * | 72.00 | (500) | ||||||||||||
| Outstanding - March 31, 2024 | $ | 76.65 | 56,658 | |||||||||||
Note 4 – Stock-based Compensation, continued
The Company recognized approximately $1.9 million and $1.1$1.4 million of stock-based employee compensation expense during(included in personnel on the nineconsolidated statements of income) for both the three months ended September 30, 2017March 31, 2024 and 2016, respectively,the three months ended March 31, 2023, associated with its common stock equity awards.awards granted to officers and employees. As of September 30, 2017,March 31, 2024, there was approximately $15.2$12.8 million of unrecognized compensation cost related to equity award grants. The costgrants, which is expected to be recognized over the weighted average remaining vesting period of approximately fourthree years.
The Company recognized a tax benefit of approximately $0.2 million and less than $0.1 million for the three months ended March 31, 2024 and 2023, respectively, for the tax impact of stock option exercises and vesting of restricted stock.
Amortized costsan indefinite period of time, but not necessarily to maturity, and are carried at fair value on the consolidated balance sheets. HTM securities include those securities which the Company has both the positive intent and ability to hold to maturity, and are carried at amortized cost on the consolidated balance sheets. Premiums and discounts on investment securities are amortized or accreted into interest income over the estimated life of the related securities using the effective interest method.
| March 31, 2024 | |||||||||||||||||||||||
| (in thousands) | Amortized Cost | Gross Unrealized Gains | Gross Unrealized Losses | Estimated Fair Value | |||||||||||||||||||
| Securities AFS: | |||||||||||||||||||||||
| U.S. Treasury securities | $ | 15,940 | $ | — | $ | 1,998 | $ | 13,942 | |||||||||||||||
| U.S. government agency securities | 7,038 | — | 59 | 6,979 | |||||||||||||||||||
| State, county and municipals | 340,665 | 226 | 27,826 | 313,065 | |||||||||||||||||||
| Mortgage-backed securities | 423,325 | 1,007 | 38,242 | 386,090 | |||||||||||||||||||
| Corporate debt securities | 92,347 | — | 8,460 | 83,887 | |||||||||||||||||||
| Total securities AFS | $ | 879,315 | $ | 1,233 | $ | 76,585 | $ | 803,963 | |||||||||||||||
| December 31, 2023 | |||||||||||||||||||||||
| (in thousands) | Amortized Cost | Gross Unrealized Gains | Gross Unrealized Losses | Estimated Fair Value | |||||||||||||||||||
| Securities AFS: | |||||||||||||||||||||||
| U.S. Treasury securities | $ | 15,988 | $ | — | $ | 1,865 | $ | 14,123 | |||||||||||||||
| U.S. government agency securities | 7,430 | — | 46 | 7,384 | |||||||||||||||||||
| State, county and municipals | 360,496 | 651 | 26,325 | 334,822 | |||||||||||||||||||
| Mortgage-backed securities | 388,378 | 1,437 | 37,193 | 352,622 | |||||||||||||||||||
| Corporate debt securities | 102,895 | 26 | 9,299 | 93,622 | |||||||||||||||||||
| Total securities AFS | $ | 875,187 | $ | 2,114 | $ | 74,728 | $ | 802,573 | |||||||||||||||
| September 30, 2017 | ||||||||||||||||
| (in thousands) | Amortized Cost | Gross Unrealized Gains | Gross Unrealized Losses | Fair Value | ||||||||||||
| U.S. government sponsored enterprises | $ | 26,394 | $ | - | $ | 122 | $ | 26,272 | ||||||||
| State, county and municipals | 189,226 | 521 | 1,031 | 188,716 | ||||||||||||
| Mortgage-backed securities | 159,113 | 261 | 1,438 | 157,936 | ||||||||||||
| Corporate debt securities | 32,203 | 541 | - | 32,744 | ||||||||||||
| Equity securities | 1,288 | 1,261 | - | 2,549 | ||||||||||||
| $ | 408,224 | $ | 2,584 | $ | 2,591 | $ | 408,217 | |||||||||
| December 31, 2016 | ||||||||||||||||
| (in thousands) | Amortized Cost | Gross Unrealized Gains | Gross Unrealized Losses | Fair Value | ||||||||||||
| U.S. government sponsored enterprises | $ | 1,981 | $ | - | $ | 18 | $ | 1,963 | ||||||||
| State, county and municipals | 191,721 | 160 | 4,638 | 187,243 | ||||||||||||
| Mortgage-backed securities | 161,309 | 242 | 2,422 | 159,129 | ||||||||||||
| Corporate debt securities | 12,117 | 52 | - | 12,169 | ||||||||||||
| Equity securities | 2,631 | 2,152 | - | 4,783 | ||||||||||||
| $ | 369,759 | $ | 2,606 | $ | 7,078 | $ | 365,287 | |||||||||
follows.
| Three Months Ended March 31, | |||||||||||
| (in thousands) | 2024 | 2023 | |||||||||
| Securities AFS: | |||||||||||
| Gross gains | $ | 1,038 | $ | 126 | |||||||
| Gross losses | (70) | (339) | |||||||||
| Gains (losses) on sales of securities AFS, net | $ | 968 | $ | (213) | |||||||
| Proceeds from sales of securities AFS | $ | 4,987 | $ | 22,565 | |||||||
| Securities HTM: | |||||||||||
| Gross gains | $ | — | $ | — | |||||||
| Gross losses | — | (37,723) | |||||||||
| Gains (losses) on sales of securities HTM, net | $ | — | $ | (37,723) | |||||||
| Proceeds from sales of securities HTM | $ | — | $ | 460,051 | |||||||
| September 30, 2017 | ||||||||||||||||||||||||
| Less than 12 months | 12 months or more | Total | ||||||||||||||||||||||
| (in thousands) | Fair Value | Unrealized Losses | Fair Value | Unrealized Losses | Fair Value | Unrealized Losses | ||||||||||||||||||
| U.S. government sponsored enterprises | $ | 26,272 | $ | 122 | $ | - | $ | - | $ | 26,272 | $ | 122 | ||||||||||||
| State, county and municipals | 63,924 | 352 | 46,677 | 679 | 110,601 | 1,031 | ||||||||||||||||||
| Mortgage-backed securities | 94,850 | 747 | 35,475 | 691 | 130,325 | 1,438 | ||||||||||||||||||
| $ | 185,046 | $ | 1,221 | $ | 82,152 | $ | 1,370 | $ | 267,198 | $ | 2,591 | |||||||||||||
| December 31, 2016 | ||||||||||||||||||||||||
| Less than 12 months | 12 months or more | Total | ||||||||||||||||||||||
| (in thousands) | Fair Value | Unrealized Losses | Fair Value | Unrealized Losses | Fair Value | Unrealized Losses | ||||||||||||||||||
| U.S. government sponsored enterprises | $ | 1,963 | $ | 18 | $ | - | $ | - | $ | 1,963 | $ | 18 | ||||||||||||
| State, county and municipals | 167,457 | 4,629 | 1,300 | 9 | 168,757 | 4,638 | ||||||||||||||||||
| Mortgage-backed securities | 134,770 | 2,311 | 3,653 | 111 | 138,423 | 2,422 | ||||||||||||||||||
| $ | 304,190 | $ | 6,958 | $ | 4,953 | $ | 120 | $ | 309,143 | $ | 7,078 | |||||||||||||
| March 31, 2024 | |||||||||||||||||||||||||||||||||||||||||
| Less than 12 months | 12 months or more | Total | |||||||||||||||||||||||||||||||||||||||
| ($ in thousands) | Fair Value | Unrealized Losses | Fair Value | Unrealized Losses | Fair Value | Unrealized Losses | Number of Securities | ||||||||||||||||||||||||||||||||||
| Securities AFS: | |||||||||||||||||||||||||||||||||||||||||
| U.S. Treasury securities | $ | — | $ | — | $ | 13,942 | $ | 1,998 | $ | 13,942 | $ | 1,998 | 1 | ||||||||||||||||||||||||||||
| U.S. government agency securities | 5,245 | 36 | 1,734 | 23 | 6,979 | 59 | 11 | ||||||||||||||||||||||||||||||||||
| State, county and municipals | 32,220 | 574 | 247,255 | 27,252 | 279,475 | 27,826 | 536 | ||||||||||||||||||||||||||||||||||
| Mortgage-backed securities | 41,197 | 274 | 278,448 | 37,968 | 319,645 | 38,242 | 444 | ||||||||||||||||||||||||||||||||||
| Corporate debt securities | 5,492 | 49 | 75,597 | 8,411 | 81,089 | 8,460 | 55 | ||||||||||||||||||||||||||||||||||
| Total | $ | 84,154 | $ | 933 | $ | 616,976 | $ | 75,652 | $ | 701,130 | $ | 76,585 | 1,047 | ||||||||||||||||||||||||||||
Note 5 – Securities Available for Sale, continued
At September 30, 2017
| December 31, 2023 | |||||||||||||||||||||||||||||||||||||||||
| Less than 12 months | 12 months or more | Total | |||||||||||||||||||||||||||||||||||||||
| ($ in thousands) | Fair Value | Unrealized Losses | Fair Value | Unrealized Losses | Fair Value | Unrealized Losses | Number of Securities | ||||||||||||||||||||||||||||||||||
| Securities AFS: | |||||||||||||||||||||||||||||||||||||||||
| U.S. Treasury securities | $ | — | $ | — | $ | 14,123 | $ | 1,865 | $ | 14,123 | $ | 1,865 | 1 | ||||||||||||||||||||||||||||
| U.S. government agency securities | 4,621 | 31 | 1,793 | 15 | 6,414 | 46 | 10 | ||||||||||||||||||||||||||||||||||
| State, county and municipals | 29,336 | 330 | 257,916 | 25,995 | 287,252 | 26,325 | 528 | ||||||||||||||||||||||||||||||||||
| Mortgage-backed securities | 6 | — | 291,124 | 37,193 | 291,130 | 37,193 | 433 | ||||||||||||||||||||||||||||||||||
| Corporate debt securities | — | — | 85,265 | 9,299 | 85,265 | 9,299 | 59 | ||||||||||||||||||||||||||||||||||
| Total | $ | 33,963 | $ | 361 | $ | 650,221 | $ | 74,367 | $ | 684,184 | $ | 74,728 | 1,031 | ||||||||||||||||||||||||||||
allowance for credit losses on AFS securities was recognized.
| As of March 31, 2024 | Securities AFS | ||||||||||||||||||||||
| (in thousands) | Amortized Cost | Fair Value | |||||||||||||||||||||
| Due in less than one year | $ | 39,136 | $ | 38,732 | |||||||||||||||||||
| Due in one year through five years | 135,670 | 124,331 | |||||||||||||||||||||
| Due after five years through ten years | 181,049 | 161,532 | |||||||||||||||||||||
| Due after ten years | 100,135 | 93,278 | |||||||||||||||||||||
| 455,990 | 417,873 | ||||||||||||||||||||||
| Mortgage-backed securities | 423,325 | 386,090 | |||||||||||||||||||||
| Total investment securities | $ | 879,315 | $ | 803,963 | |||||||||||||||||||
| September 30, 2017 | ||||||||
| (in thousands) | Amortized Cost | Fair Value | ||||||
| Due in less than one year | $ | 13,262 | $ | 13,261 | ||||
| Due in one year through five years | 96,098 | 96,410 | ||||||
| Due after five years through ten years | 130,477 | 129,769 | ||||||
| Due after ten years | 7,986 | 8,292 | ||||||
| 247,823 | 247,732 | |||||||
| Mortgage-backed securities | 159,113 | 157,936 | ||||||
| Equity securities | 1,288 | 2,549 | ||||||
| Securities available for sale | $ | 408,224 | $ | 408,217 | ||||
Proceeds from sales of securities available for sale during the first nine months of 2017 and 2016 were approximately $10.8 million and $30.3 million, respectively. During the first nine months of 2017, gross gains and losses realized were $1.2 million and $7,000, respectively, while gross gains and gross losses were $90,000 and $13,000, respectively, for the comparable nine months of 2016.
| March 31, 2024 | December 31, 2023 | ||||||||||
| (in thousands) | Amount | Amount | |||||||||
| Federal Reserve Bank stock | $ | 32,871 | $ | 33,087 | |||||||
| Federal Home Loan Bank (“FHLB”) stock | 9,674 | 9,674 | |||||||||
| Equity securities with readily determinable fair values | 8,771 | 4,240 | |||||||||
| Other investments | 9,148 | 10,559 | |||||||||
| Total other investments | $ | 60,464 | $ | 57,560 | |||||||
| Total | ||||||||||||||||
| September 30, 2017 | December 31, 2016 | |||||||||||||||
| (in thousands) | Amount | % of Total | Amount | % of Total | ||||||||||||
| Commercial & industrial | $ | 625,729 | 30.5 | % | $ | 428,270 | 27.3 | % | ||||||||
| Owner-occupied commercial real estate (“CRE”) | 428,054 | 20.9 | 360,227 | 23.0 | ||||||||||||
| Agricultural (“AG”) production | 36,352 | 1.8 | 34,767 | 2.2 | ||||||||||||
| AG real estate | 48,443 | 2.4 | 45,234 | 2.9 | ||||||||||||
| CRE investment | 303,448 | 14.8 | 195,879 | 12.5 | ||||||||||||
| Construction & land development | 87,649 | 4.3 | 74,988 | 4.8 | ||||||||||||
| Residential construction | 33,163 | 1.6 | 23,392 | 1.5 | ||||||||||||
| Residential first mortgage | 363,116 | 17.7 | 300,304 | 19.1 | ||||||||||||
| Residential junior mortgage | 102,654 | 5.0 | 91,331 | 5.8 | ||||||||||||
| Retail & other | 22,514 | 1.0 | 14,515 | 0.9 | ||||||||||||
| Loans | 2,051,122 | 100.0 | % | 1,568,907 | 100.0 | % | ||||||||||
| Less allowance for loan losses | 12,610 | 11,820 | ||||||||||||||
| Loans, net | $ | 2,038,512 | $ | 1,557,087 | ||||||||||||
| Allowance for loan losses to loans | 0.61 | % | 0.75 | % | ||||||||||||
| Originated | ||||||||||||||||
| September 30, 2017 | December 31, 2016 | |||||||||||||||
| (in thousands) | Amount | % of Total | Amount | % of Total | ||||||||||||
| Commercial & industrial | $ | 470,700 | 40.4 | % | $ | 330,073 | 36.6 | % | ||||||||
| Owner-occupied CRE | 221,556 | 19.0 | 182,776 | 20.3 | ||||||||||||
| AG production | 11,605 | 1.0 | 9,192 | 1.0 | ||||||||||||
| AG real estate | 23,876 | 2.0 | 18,858 | 2.1 | ||||||||||||
| CRE investment | 98,328 | 8.4 | 72,930 | 8.1 | ||||||||||||
| Construction & land development | 55,387 | 4.7 | 44,147 | 4.9 | ||||||||||||
| Residential construction | 27,129 | 2.3 | 20,768 | 2.3 | ||||||||||||
| Residential first mortgage | 180,509 | 15.5 | 164,949 | 18.3 | ||||||||||||
| Residential junior mortgage | 60,207 | 5.2 | 48,199 | 5.3 | ||||||||||||
| Retail & other | 17,092 | 1.5 | 10,095 | 1.1 | ||||||||||||
| Loans | 1,166,389 | 100.0 | % | 901,987 | 100.0 | % | ||||||||||
| Less allowance for loan losses | 10,406 | 9,449 | ||||||||||||||
| Loans, net | $ | 1,155,983 | $ | 892,538 | ||||||||||||
| Allowance for loan losses to loans | 0.89 | % | 1.05 | % | ||||||||||||
| Acquired | ||||||||||||||||
| September 30, 2017 | December 31, 2016 | |||||||||||||||
| (in thousands) | Amount | % of Total | Amount | % of Total | ||||||||||||
| Commercial & industrial | $ | 155,029 | 17.5 | % | $ | 98,197 | 14.7 | % | ||||||||
| Owner-occupied CRE | 206,498 | 23.3 | 177,451 | 26.6 | ||||||||||||
| AG production | 24,747 | 2.8 | 25,575 | 3.8 | ||||||||||||
| AG real estate | 24,567 | 2.8 | 26,376 | 4.0 | ||||||||||||
| CRE investment | 205,120 | 23.2 | 122,949 | 18.4 | ||||||||||||
| Construction & land development | 32,262 | 3.7 | 30,841 | 4.6 | ||||||||||||
| Residential construction | 6,034 | 0.7 | 2,624 | 0.4 | ||||||||||||
| Residential first mortgage | 182,607 | 20.6 | 135,355 | 20.3 | ||||||||||||
| Residential junior mortgage | 42,447 | 4.8 | 43,132 | 6.5 | ||||||||||||
| Retail & other | 5,422 | 0.6 | 4,420 | 0.7 | ||||||||||||
| Loans | 884,733 | 100.0 | % | 666,920 | 100.0 | % | ||||||||||
| Less allowance for loan losses | 2,204 | 2,371 | ||||||||||||||
| Loans, net | $ | 882,529 | $ | 664,549 | ||||||||||||
| Allowance for loan losses to loans | 0.25 | % | 0.36 | % | ||||||||||||
| March 31, 2024 | December 31, 2023 | ||||||||||||||||||||||
| (in thousands) | Amount | % of Total | Amount | % of Total | |||||||||||||||||||
| Commercial & industrial | $ | 1,307,490 | 20 | % | $ | 1,284,009 | 20 | % | |||||||||||||||
| Owner-occupied commercial real estate (“CRE”) | 955,786 | 15 | 956,594 | 15 | |||||||||||||||||||
| Agricultural | 1,190,371 | 19 | 1,161,531 | 18 | |||||||||||||||||||
| CRE investment | 1,188,722 | 18 | 1,142,251 | 18 | |||||||||||||||||||
| Construction & land development | 241,730 | 4 | 310,110 | 5 | |||||||||||||||||||
| Residential construction | 84,370 | 2 | 75,726 | 1 | |||||||||||||||||||
| Residential first mortgage | 1,167,069 | 18 | 1,167,109 | 19 | |||||||||||||||||||
| Residential junior mortgage | 206,434 | 3 | 200,884 | 3 | |||||||||||||||||||
| Retail & other | 55,645 | 1 | 55,728 | 1 | |||||||||||||||||||
| Loans | 6,397,617 | 100 | % | 6,353,942 | 100 | % | |||||||||||||||||
| Less allowance for credit losses - Loans (“ACL-Loans”) | 64,347 | 63,610 | |||||||||||||||||||||
| Loans, net | $ | 6,333,270 | $ | 6,290,332 | |||||||||||||||||||
| Allowance for credit losses - Loans to loans | 1.01 | % | 1.00 | % | |||||||||||||||||||
Note 6 – Loans,
Practically all- Loans
The
| Three Months Ended | Year Ended | ||||||||||||||||||||||||||||
| (in thousands) | March 31, 2024 | March 31, 2023 | December 31, 2023 | ||||||||||||||||||||||||||
| Beginning balance | $ | 63,610 | $ | 61,829 | $ | 61,829 | |||||||||||||||||||||||
| Provision for credit losses | 750 | 750 | 2,650 | ||||||||||||||||||||||||||
| Charge-offs | (216) | (184) | (1,653) | ||||||||||||||||||||||||||
| Recoveries | 203 | 17 | 784 | ||||||||||||||||||||||||||
| Net (charge-offs) recoveries | (13) | (167) | (869) | ||||||||||||||||||||||||||
| Ending balance | $ | 64,347 | $ | 62,412 | $ | 63,610 | |||||||||||||||||||||||
| Three Months Ended March 31, 2024 | |||||||||||||||||||||||||||||||||||||||||||||||||||||||||||
| (in thousands) | Commercial & industrial | Owner- occupied CRE | Agricultural | CRE investment | Construction & land development | Residential construction | Residential first mortgage | Residential junior mortgage | Retail & other | Total | |||||||||||||||||||||||||||||||||||||||||||||||||
| ACL-Loans | |||||||||||||||||||||||||||||||||||||||||||||||||||||||||||
| Beginning balance | $ | 15,225 | $ | 9,082 | $ | 12,629 | $ | 12,693 | $ | 2,440 | $ | 916 | $ | 7,320 | $ | 2,098 | $ | 1,207 | $ | 63,610 | |||||||||||||||||||||||||||||||||||||||
| Provision | (349) | 274 | (184) | 1,468 | (445) | 86 | (246) | (6) | 152 | 750 | |||||||||||||||||||||||||||||||||||||||||||||||||
| Charge-offs | (82) | (30) | — | — | — | — | — | — | (104) | (216) | |||||||||||||||||||||||||||||||||||||||||||||||||
| Recoveries | 7 | 192 | — | — | — | — | — | 3 | 1 | 203 | |||||||||||||||||||||||||||||||||||||||||||||||||
| Net (charge-offs) recoveries | (75) | 162 | — | — | — | — | — | 3 | (103) | (13) | |||||||||||||||||||||||||||||||||||||||||||||||||
| Ending balance | $ | 14,801 | $ | 9,518 | $ | 12,445 | $ | 14,161 | $ | 1,995 | $ | 1,002 | $ | 7,074 | $ | 2,095 | $ | 1,256 | $ | 64,347 | |||||||||||||||||||||||||||||||||||||||
| As % of ACL-Loans | 23 | % | 15 | % | 19 | % | 22 | % | 3 | % | 2 | % | 11 | % | 3 | % | 2 | % | 100 | % | |||||||||||||||||||||||||||||||||||||||
| Year Ended December 31, 2023 | |||||||||||||||||||||||||||||||||||||||||||||||||||||||||||
| (in thousands) | Commercial & industrial | Owner- occupied CRE | Agricultural | CRE investment | Construction & land development | Residential construction | Residential first mortgage | Residential junior mortgage | Retail & other | Total | |||||||||||||||||||||||||||||||||||||||||||||||||
| ACL-Loans | |||||||||||||||||||||||||||||||||||||||||||||||||||||||||||
| Beginning balance | $ | 16,350 | $ | 9,138 | $ | 9,762 | $ | 12,744 | $ | 2,572 | $ | 1,412 | $ | 6,976 | $ | 1,846 | $ | 1,029 | $ | 61,829 | |||||||||||||||||||||||||||||||||||||||
| Provision | (1,205) | 470 | 2,930 | (51) | (132) | (496) | 346 | 347 | 441 | 2,650 | |||||||||||||||||||||||||||||||||||||||||||||||||
| Charge-offs | (440) | (773) | (66) | — | — | — | (5) | (96) | (273) | (1,653) | |||||||||||||||||||||||||||||||||||||||||||||||||
| Recoveries | 520 | 247 | 3 | — | — | — | 3 | 1 | 10 | 784 | |||||||||||||||||||||||||||||||||||||||||||||||||
| Net (charge-offs) recoveries | 80 | (526) | (63) | — | — | — | (2) | (95) | (263) | (869) | |||||||||||||||||||||||||||||||||||||||||||||||||
| Ending balance | $ | 15,225 | $ | 9,082 | $ | 12,629 | $ | 12,693 | $ | 2,440 | $ | 916 | $ | 7,320 | $ | 2,098 | $ | 1,207 | $ | 63,610 | |||||||||||||||||||||||||||||||||||||||
| As % of ACL-Loans | 24 | % | 14 | % | 20 | % | 20 | % | 4 | % | — | % | 12 | % | 4 | % | 2 | % | 100 | % | |||||||||||||||||||||||||||||||||||||||
The allocation methodology used by the Company includes specific allocations for impaired loans evaluated individually for impairment based on collateral values and for the remaining loan portfolio collectively evaluated for impairment primarily based on historical loss rates and(x) other qualitative factors. Loan charge-offs and recoveries are based on actual amounts charged-off or recovered by loan category. quantitative factors which could affect expected credit losses. Assessing these numerous factors involves significant judgment.
portfolio segment. The allocation methodology consists of the following tables present the balancecomponents. First, a specific reserve is established for individually evaluated credit-deteriorated loans, which management defines as nonaccrual credit relationships over $250,000, collateral dependent loans, purchased credit deteriorated loans, and activityother loans with evidence of credit deterioration. The specific reserve in the ALLLACL-Loans for these credit deteriorated loans is equal to the aggregate collateral or discounted cash flow shortfall. Management allocates the ACL-Loans with historical loss rates by portfolioloan segment. The loss factors are measured on a quarterly basis and applied to each loan segment based on current loan balances and projected for their expected remaining life. Next, management allocates the recorded investment in loans by portfolio atACL-Loans using the qualitative factors mentioned above. Consideration is given to those current qualitative or forenvironmental factors that are likely to cause estimated credit losses as of the nine months ended September 30, 2017:
| TOTAL – Nine Months Ended September 30, 2017 | ||||||||||||||||||||||||||||||||||||||||||||
| (in thousands) ALLL: | Commercial & industrial | Owner- occupied CRE | AG production | AG real estate | CRE investment | Construction & land development | Residential construction | Residential first mortgage | Residential junior mortgage | Retail & other | Total | |||||||||||||||||||||||||||||||||
| Beginning balance | $ | 3,919 | $ | 2,867 | $ | 150 | $ | 285 | $ | 1,124 | $ | 774 | $ | 304 | $ | 1,784 | $ | 461 | $ | 152 | $ | 11,820 | ||||||||||||||||||||||
| Provision | 2,183 | (253 | ) | 16 | (17 | ) | 132 | (19 | ) | (137 | ) | (124 | ) | 4 | 90 | 1,875 | ||||||||||||||||||||||||||||
| Charge-offs | (1,097 | ) | - | - | - | - | (13 | ) | - | (8 | ) | - | (38 | ) | (1,156 | ) | ||||||||||||||||||||||||||||
| Recoveries | 20 | 29 | - | - | 1 | - | - | 6 | 2 | 13 | 71 | |||||||||||||||||||||||||||||||||
| Net charge-offs | (1,077 | ) | 29 | - | - | 1 | (13 | ) | - | (2 | ) | 2 | (25 | ) | (1,085 | ) | ||||||||||||||||||||||||||||
| Ending balance | $ | 5,025 | $ | 2,643 | $ | 166 | $ | 268 | $ | 1,257 | $ | 742 | $ | 167 | $ | 1,658 | $ | 467 | $ | 217 | $ | 12,610 | ||||||||||||||||||||||
| As percent of ALLL | 39.9 | % | 21.0 | % | 1.3 | % | 2.1 | % | 10.0 | % | 5.9 | % | 1.3 | % | 13.1 | % | 3.7 | % | 1.7 | % | 100.0 | % | ||||||||||||||||||||||
| ALLL: | ||||||||||||||||||||||||||||||||||||||||||||
| Individually evaluated | $ | 226 | $ | - | $ | - | $ | - | $ | - | $ | - | $ | - | $ | - | $ | - | $ | - | $ | 226 | ||||||||||||||||||||||
| Collectively evaluated | 4,799 | 2,643 | 166 | 268 | 1,257 | 742 | 167 | 1,658 | 467 | 217 | 12,384 | |||||||||||||||||||||||||||||||||
| Ending balance | $ | 5,025 | $ | 2,643 | $ | 166 | $ | 268 | $ | 1,257 | $ | 742 | $ | 167 | $ | 1,658 | $ | 467 | $ | 217 | $ | 12,610 | ||||||||||||||||||||||
| Loans: | ||||||||||||||||||||||||||||||||||||||||||||
| Individually evaluated | $ | 5,071 | $ | 1,116 | $ | - | $ | 218 | $ | 4,845 | $ | 723 | $ | 80 | $ | 1,619 | $ | 60 | $ | - | $ | 13,732 | ||||||||||||||||||||||
| Collectively evaluated | 620,658 | 426,938 | 36,352 | 48,225 | 298,603 | 86,926 | 33,083 | 361,497 | 102,594 | 22,514 | 2,037,390 | |||||||||||||||||||||||||||||||||
| Total loans | $ | 625,729 | $ | 428,054 | $ | 36,352 | $ | 48,443 | $ | 303,448 | $ | 87,649 | $ | 33,163 | $ | 363,116 | $ | 102,654 | $ | 22,514 | $ | 2,051,122 | ||||||||||||||||||||||
| Less ALLL | $ | 5,025 | $ | 2,643 | $ | 166 | $ | 268 | $ | 1,257 | $ | 742 | $ | 167 | $ | 1,658 | $ | 467 | $ | 217 | $ | 12,610 | ||||||||||||||||||||||
| Net loans | $ | 620,704 | $ | 425,411 | $ | 36,186 | $ | 48,175 | $ | 302,191 | $ | 86,907 | $ | 32,996 | $ | 361,458 | $ | 102,187 | $ | 22,297 | $ | 2,038,512 | ||||||||||||||||||||||
Note 6 – Loans, Allowance for LoanCredit Losses-Unfunded Commitments:
| Originated – Nine Months Ended September 30, 2017 | ||||||||||||||||||||||||||||||||||||||||||||
| (in thousands) ALLL: | Commercial & industrial | Owner- occupied CRE | AG production | AG real estate | CRE investment | Construction & land development | Residential construction | Residential first mortgage | Residential junior mortgage | Retail & other | Total | |||||||||||||||||||||||||||||||||
| Beginning balance | $ | 3,150 | $ | 2,263 | $ | 122 | $ | 222 | $ | 893 | $ | 656 | $ | 266 | $ | 1,372 | $ | 373 | $ | 132 | $ | 9,449 | ||||||||||||||||||||||
| Provision | 2,128 | (167 | ) | 19 | (11 | ) | 140 | (20 | ) | (135 | ) | (44 | ) | 13 | 82 | 2,005 | ||||||||||||||||||||||||||||
| Charge-offs | (1,043 | ) | - | - | - | - | - | - | (8 | ) | - | (38 | ) | (1,089 | ) | |||||||||||||||||||||||||||||
| Recoveries | 1 | 24 | - | - | - | - | - | 1 | 2 | 13 | 41 | |||||||||||||||||||||||||||||||||
| Net charge-offs | (1,042 | ) | 24 | - | - | - | - | - | (7 | ) | 2 | (25 | ) | (1,048 | ) | |||||||||||||||||||||||||||||
| Ending balance | $ | 4,236 | $ | 2,120 | $ | 141 | $ | 211 | $ | 1,033 | $ | 636 | $ | 131 | $ | 1,321 | $ | 388 | $ | 189 | $ | 10,406 | ||||||||||||||||||||||
| As percent of ALLL | 40.7 | % | 20.4. | % | 1.4 | % | 2.0 | % | 9.9 | % | 6.1 | % | 1.3 | % | 12.7 | % | 3.7 | % | 1.8 | % | 100.0 | % | ||||||||||||||||||||||
| ALLL: | ||||||||||||||||||||||||||||||||||||||||||||
| Individually evaluated | $ | 226 | $ | - | $ | - | $ | - | $ | - | $ | - | $ | - | $ | - | $ | - | $ | - | $ | 226 | ||||||||||||||||||||||
| Collectively evaluated | 4,010 | 2,120 | 141 | 211 | 1,033 | 636 | 131 | 1,321 | 388 | 189 | 10,180 | |||||||||||||||||||||||||||||||||
| Ending balance | $ | 4,236 | $ | 2,120 | $ | 141 | $ | 211 | $ | 1,033 | $ | 636 | $ | 131 | $ | 1,321 | $ | 388 | $ | 189 | $ | 10,406 | ||||||||||||||||||||||
| Loans: | ||||||||||||||||||||||||||||||||||||||||||||
| Individually evaluated | $ | 615 | $ | - | $ | - | $ | - | $ | - | $ | - | $ | - | $ | - | $ | - | $ | - | $ | 615 | ||||||||||||||||||||||
| Collectively evaluated | 470,085 | 221,556 | 11,605 | 23,876 | 98,328 | 55,387 | 27,129 | 180,509 | 60,207 | 17,092 | 1,165,774 | |||||||||||||||||||||||||||||||||
| Total loans | $ | 470,700 | $ | 221,556 | $ | 11,605 | $ | 23,876 | $ | 98,328 | $ | 55,387 | $ | 27,129 | $ | 180,509 | $ | 60,207 | $ | 17,092 | $ | 1,166,389 | ||||||||||||||||||||||
| Less ALLL | $ | 4,236 | $ | 2,120 | $ | 141 | $ | 211 | $ | 1,033 | $ | 636 | $ | 131 | $ | 1,321 | $ | 388 | $ | 189 | $ | 10,406 | ||||||||||||||||||||||
| Net loans | $ | 466,464 | $ | 219,436 | $ | 11,464 | $ | 23,665 | $ | 97,295 | $ | 54,751 | $ | 26,998 | $ | 179,188 | $ | 59,819 | $ | 16,903 | $ | 1,155,983 | ||||||||||||||||||||||
| Acquired – Nine Months Ended September 30, 2017 | ||||||||||||||||||||||||||||||||||||||||||||
| (in thousands) ALLL: | Commercial & industrial | Owner- occupied CRE | AG production | AG real estate | CRE investment | Construction & land development | Residential construction | Residential first mortgage | Residential junior mortgage | Retail & other | Total | |||||||||||||||||||||||||||||||||
| Beginning balance | $ | 769 | $ | 604 | $ | 28 | $ | 63 | $ | 231 | $ | 118 | $ | 38 | $ | 412 | $ | 88 | $ | 20 | $ | 2,371 | ||||||||||||||||||||||
| Provision | 55 | (86 | ) | (3 | ) | (6 | ) | (8 | ) | 1 | (2 | ) | (80 | ) | (9 | ) | 8 | (130 | ) | |||||||||||||||||||||||||
| Charge-offs | (54 | ) | - | - | - | - | (13 | ) | - | - | - | - | (67 | ) | ||||||||||||||||||||||||||||||
| Recoveries | 19 | 5 | - | - | 1 | - | - | 5 | - | - | 30 | |||||||||||||||||||||||||||||||||
| Net charge-offs | (35 | ) | 5 | - | - | 1 | (13 | ) | - | 5 | - | - | (37 | ) | ||||||||||||||||||||||||||||||
| Ending balance | $ | 789 | $ | 523 | $ | 25 | $ | 57 | $ | 224 | $ | 106 | $ | 36 | $ | 337 | $ | 79 | $ | 28 | $ | 2,204 | ||||||||||||||||||||||
| As percent of ALLL | 35.8 | % | 23.7 | % | 1.1 | % | 2.6 | % | 10.2 | % | 4.8 | % | 1.6 | % | 15.3 | % | 3.6 | % | 1.3 | % | 100.0 | % | ||||||||||||||||||||||
| Loans: | ||||||||||||||||||||||||||||||||||||||||||||
| Individually evaluated | $ | 4,456 | $ | 1,116 | $ | - | $ | 218 | $ | 4,845 | $ | 723 | $ | 80 | $ | 1,619 | $ | 60 | $ | - | $ | 13,117 | ||||||||||||||||||||||
| Collectively evaluated | 150,573 | 205,382 | 24,747 | 24,349 | 200,275 | 31,539 | 5,954 | 180,988 | 42,387 | 5,422 | 871,616 | |||||||||||||||||||||||||||||||||
| Total loans | $ | 155,029 | $ | 206,498 | $ | 24,747 | $ | 24,567 | $ | 205,120 | $ | 32,262 | $ | 6,034 | $ | 182,607 | $ | 42,447 | $ | 5,422 | $ | 884,733 | ||||||||||||||||||||||
| Less ALLL | $ | 789 | $ | 523 | $ | 25 | $ | 57 | $ | 224 | $ | 106 | $ | 36 | $ | 337 | $ | 79 | $ | 28 | $ | 2,204 | ||||||||||||||||||||||
| Net loans | $ | 154,240 | $ | 205,975 | $ | 24,722 | $ | 24,510 | $ | 204,896 | $ | 32,156 | $ | 5,998 | $ | 182,270 | $ | 42,368 | $ | 5,394 | $ | 882,529 | ||||||||||||||||||||||
off-balance sheet credit exposures after net charge-offs have been deducted to bring the ACL to a level that, in management’s judgment, is necessary to absorb expected credit losses over the lives of the respective financial instruments. See Note 6 – Loans, Allowance4 for Loan Losses, and Credit Quality, continued
additional information regarding the ACL related to investment securities. The following table presents the components of the provision for credit losses.
| Three Months Ended | Year Ended | ||||||||||||||||||||||||||||
| (in thousands) | March 31, 2024 | March 31, 2023 | December 31, 2023 | ||||||||||||||||||||||||||
| Provision for credit losses on: | |||||||||||||||||||||||||||||
| Loans | $ | 750 | $ | 750 | $ | 2,650 | |||||||||||||||||||||||
| Unfunded commitments | — | — | — | ||||||||||||||||||||||||||
| Investment securities | — | 2,340 | 2,340 | ||||||||||||||||||||||||||
| Total | $ | 750 | $ | 3,090 | $ | 4,990 | |||||||||||||||||||||||
| March 31, 2024 | Collateral Type | ||||||||||||||||||||||
| (in thousands) | Real Estate | Other Business Assets | Total | Without an Allowance | With an Allowance | Allowance Allocation | |||||||||||||||||
| Commercial & industrial | $ | — | $ | 2,157 | $ | 2,157 | $ | 2,157 | $ | — | $ | — | |||||||||||
| Owner-occupied CRE | 4,010 | — | 4,010 | 3,863 | 147 | 24 | |||||||||||||||||
| Agricultural | 7,093 | 5,324 | 12,417 | 7,596 | 4,821 | 94 | |||||||||||||||||
| CRE investment | 1,195 | — | 1,195 | 1,195 | — | — | |||||||||||||||||
| Residential first mortgage | 517 | — | 517 | 517 | — | — | |||||||||||||||||
| Total loans | $ | 12,815 | $ | 7,481 | $ | 20,296 | $ | 15,328 | $ | 4,968 | $ | 118 | |||||||||||
| December 31, 2023 | Collateral Type | ||||||||||||||||||||||
| (in thousands) | Real Estate | Other Business Assets | Total | Without an Allowance | With an Allowance | Allowance Allocation | |||||||||||||||||
| Commercial & industrial | $ | — | $ | 2,576 | $ | 2,576 | $ | 2,164 | $ | 412 | $ | 196 | |||||||||||
| Owner-occupied CRE | 3,614 | — | 3,614 | 3,465 | 149 | 24 | |||||||||||||||||
| Agricultural | 6,931 | 5,219 | 12,150 | 7,261 | 4,889 | 117 | |||||||||||||||||
| CRE investment | 1,261 | — | 1,261 | 871 | 390 | 18 | |||||||||||||||||
| Residential first mortgage | 674 | — | 674 | 674 | — | — | |||||||||||||||||
| Total loans | $ | 12,480 | $ | 7,795 | $ | 20,275 | $ | 14,435 | $ | 5,840 | $ | 355 | |||||||||||
| TOTAL – Nine Months Ended September 30, 2016 | ||||||||||||||||||||||||||||||||||||||||||||
| (in thousands) ALLL: | Commercial & industrial | Owner- occupied CRE | AG production | AG real estate | CRE investment | Construction & land development | Residential construction | Residential first mortgage | Residential junior mortgage | Retail & other | Total | |||||||||||||||||||||||||||||||||
| Beginning balance | $ | 3,721 | $ | 1,933 | $ | 85 | $ | 380 | $ | 785 | $ | 1,446 | $ | 147 | $ | 1,240 | $ | 496 | $ | 74 | $ | 10,307 | ||||||||||||||||||||||
| Provision | 745 | 710 | 40 | (77 | ) | 23 | (586 | ) | 176 | 188 | 42 | 89 | 1,350 | |||||||||||||||||||||||||||||||
| Charge-offs | (279 | ) | (61 | ) | - | - | - | - | - | - | (53 | ) | (39 | ) | (432 | ) | ||||||||||||||||||||||||||||
| Recoveries | 17 | 3 | - | - | 221 | - | - | 5 | 7 | 3 | 256 | |||||||||||||||||||||||||||||||||
| Net charge-offs | (262 | ) | (58 | ) | - | - | 221 | - | - | 5 | (46 | ) | (36 | ) | (176 | ) | ||||||||||||||||||||||||||||
| Ending balance | $ | 4,204 | $ | 2,585 | $ | 125 | $ | 303 | $ | 1,029 | $ | 860 | $ | 323 | $ | 1,433 | $ | 492 | $ | 127 | $ | 11,481 | ||||||||||||||||||||||
| As percent of ALLL | 36.6 | % | 22.5 | % | 1.1 | % | 2.6 | % | 9.0 | % | 7.5 | % | 2.8 | % | 12.5 | % | 4.3 | % | 1.1 | % | 100.0 | % | ||||||||||||||||||||||
| ALLL: | ||||||||||||||||||||||||||||||||||||||||||||
| Individually evaluated | $ | 96 | $ | - | $ | - | $ | - | $ | - | $ | - | $ | - | $ | - | $ | - | $ | - | $ | 96 | ||||||||||||||||||||||
| Collectively evaluated | 4,108 | 2,585 | 125 | 303 | 1,029 | 860 | 323 | 1,433 | 492 | 127 | 11,385 | |||||||||||||||||||||||||||||||||
| Ending balance | $ | 4,204 | $ | 2,585 | $ | 125 | $ | 303 | $ | 1,029 | $ | 860 | $ | 323 | $ | 1,433 | $ | 492 | $ | 127 | $ | 11,481 | ||||||||||||||||||||||
| Loans: | ||||||||||||||||||||||||||||||||||||||||||||
| Individually evaluated | $ | 662 | $ | 2,666 | $ | 53 | $ | 240 | $ | 13,466 | $ | 722 | $ | 287 | $ | 2,303 | $ | 181 | $ | - | $ | 20,580 | ||||||||||||||||||||||
| Collectively evaluated | 423,128 | 359,888 | 34,024 | 45,431 | 184,418 | 67,439 | 27,044 | 282,350 | 95,720 | 14,102 | 1,533,544 | |||||||||||||||||||||||||||||||||
| Total loans | $ | 423,790 | $ | 362,554 | $ | 34,077 | $ | 45,671 | $ | 197,884 | $ | 68,161 | $ | 27,331 | $ | 284,653 | $ | 95,901 | $ | 14,102 | $ | 1,554,124 | ||||||||||||||||||||||
| Less ALLL | $ | 4,204 | $ | 2,585 | $ | 125 | $ | 303 | $ | 1,029 | $ | 860 | $ | 323 | $ | 1,433 | $ | 492 | $ | 127 | $ | 11,481 | ||||||||||||||||||||||
| Net loans | $ | 419,586 | $ | 359,969 | $ | 33,952 | $ | 45,368 | $ | 196,855 | $ | 67,301 | $ | 27,008 | $ | 283,220 | $ | 95,409 | $ | 13,975 | $ | 1,542,643 | ||||||||||||||||||||||
| Originated – Nine Months Ended September 30, 2016 | ||||||||||||||||||||||||||||||||||||||||||||
| (in thousands) ALLL: | Commercial & industrial | Owner- occupied CRE | AG production | AG real estate | CRE investment | Construction & land development | Residential construction | Residential first mortgage | Residential junior mortgage | Retail & other | Total | |||||||||||||||||||||||||||||||||
| Beginning balance | $ | 3,135 | $ | 1,567 | $ | 71 | $ | 299 | $ | 646 | $ | 1,381 | $ | 147 | $ | 987 | $ | 418 | $ | 63 | $ | 8,714 | ||||||||||||||||||||||
| Provision | 426 | 408 | 29 | (73 | ) | (70 | ) | (633 | ) | 130 | 85 | 16 | 80 | 398 | ||||||||||||||||||||||||||||||
| Charge-offs | (262 | ) | (3 | ) | - | - | - | - | - | - | (53 | ) | (38 | ) | (356 | ) | ||||||||||||||||||||||||||||
| Recoveries | - | 3 | - | - | 221 | - | - | - | 6 | 2 | 232 | |||||||||||||||||||||||||||||||||
| Net charge-offs | (262 | ) | - | - | - | 221 | - | - | - | (47 | ) | (36 | ) | (124 | ) | |||||||||||||||||||||||||||||
| Ending balance | $ | 3,299 | $ | 1,975 | $ | 100 | $ | 226 | $ | 797 | $ | 748 | $ | 277 | $ | 1,072 | $ | 387 | $ | 107 | $ | 8,988 | ||||||||||||||||||||||
| As percent of ALLL | 36.7 | % | 22.0 | % | 1.1 | % | 2.5 | % | 8.9 | % | 8.3 | % | 3.1 | % | 11.9 | % | 4.3 | % | 1.2 | % | 100.0 | % | ||||||||||||||||||||||
| ALLL: | ||||||||||||||||||||||||||||||||||||||||||||
| Individually evaluated | $ | 96 | $ | - | $ | - | $ | - | $ | - | $ | - | $ | - | $ | - | $ | - | $ | - | $ | 96 | ||||||||||||||||||||||
| Collectively evaluated | 3,203 | 1,975 | 100 | 226 | 797 | 748 | 277 | 1,072 | 387 | 107 | 8,892 | |||||||||||||||||||||||||||||||||
| Ending balance | $ | 3,299 | $ | 1,975 | $ | 100 | $ | 226 | $ | 797 | $ | 748 | $ | 277 | $ | 1,072 | $ | 387 | $ | 107 | $ | 8,988 | ||||||||||||||||||||||
| Loans: | ||||||||||||||||||||||||||||||||||||||||||||
| Individually evaluated | $ | 319 | $ | - | $ | - | $ | - | $ | - | $ | - | $ | - | $ | - | $ | - | $ | - | $ | 319 | ||||||||||||||||||||||
| Collectively evaluated | 321,203 | 181,107 | 8,857 | 18,222 | 72,182 | 34,916 | 20,964 | 138,103 | 47,346 | 9,179 | 852,079 | |||||||||||||||||||||||||||||||||
| Total loans | $ | 321,522 | $ | 181,107 | $ | 8,857 | $ | 18,222 | $ | 72,182 | $ | 34,916 | $ | 20,964 | $ | 138,103 | $ | 47,346 | $ | 9,179 | $ | 852,398 | ||||||||||||||||||||||
| Less ALLL | $ | 3,299 | $ | 1,975 | $ | 100 | $ | 226 | $ | 797 | $ | 748 | $ | 277 | $ | 1,072 | $ | 387 | $ | 107 | $ | 8,988 | ||||||||||||||||||||||
| Net loans | $ | 318,223 | $ | 179,132 | $ | 8,757 | $ | 17,996 | $ | 71,385 | $ | 34,168 | $ | 20,687 | $ | 137,031 | $ | 46,959 | $ | 9,072 | $ | 843,410 | ||||||||||||||||||||||
| March 31, 2024 | |||||||||||||||||||||||
| (in thousands) | 30-89 Days Past Due (accruing) | 90 Days & Over or nonaccrual | Current | Total | |||||||||||||||||||
| Commercial & industrial | $ | 799 | $ | 3,761 | $ | 1,302,930 | $ | 1,307,490 | |||||||||||||||
| Owner-occupied CRE | 1,457 | 4,721 | 949,608 | 955,786 | |||||||||||||||||||
| Agricultural | 35 | 12,418 | 1,177,918 | 1,190,371 | |||||||||||||||||||
| CRE investment | 83 | 1,430 | 1,187,209 | 1,188,722 | |||||||||||||||||||
| Construction & land development | 14 | 10 | 241,706 | 241,730 | |||||||||||||||||||
| Residential construction | — | — | 84,370 | 84,370 | |||||||||||||||||||
| Residential first mortgage | 5,020 | 3,983 | 1,158,066 | 1,167,069 | |||||||||||||||||||
| Residential junior mortgage | 156 | 171 | 206,107 | 206,434 | |||||||||||||||||||
| Retail & other | 353 | 183 | 55,109 | 55,645 | |||||||||||||||||||
| Total loans | $ | 7,917 | $ | 26,677 | $ | 6,363,023 | $ | 6,397,617 | |||||||||||||||
| Percent of total loans | 0.1 | % | 0.4 | % | 99.5 | % | 100.0 | % | |||||||||||||||
Note 6 – Loans, Allowance for Loan Losses, and Credit Quality, continued
| Acquired – Nine Months Ended September 30, 2016 | ||||||||||||||||||||||||||||||||||||||||||||
| (in thousands) ALLL: | Commercial & industrial | Owner- occupied CRE | AG production | AG real estate | CRE investment | Construction & land development | Residential construction | Residential first mortgage | Residential junior mortgage | Retail & other | Total | |||||||||||||||||||||||||||||||||
| Beginning balance | $ | 586 | $ | 366 | $ | 14 | $ | 81 | $ | 139 | $ | 65 | $ | - | $ | 253 | $ | 78 | $ | 11 | $ | 1,593 | ||||||||||||||||||||||
| Provision | 319 | 302 | 11 | (4 | ) | 93 | 47 | 46 | 103 | 26 | 9 | 952 | ||||||||||||||||||||||||||||||||
| Charge-offs | (17 | ) | (58 | ) | - | - | - | - | - | - | - | (1 | ) | (76 | ) | |||||||||||||||||||||||||||||
| Recoveries | 17 | - | - | - | - | - | - | 5 | 1 | 1 | 24 | |||||||||||||||||||||||||||||||||
| Net charge-offs | - | (58 | ) | - | - | - | - | - | 5 | 1 | - | (52 | ) | |||||||||||||||||||||||||||||||
| Ending balance | $ | 905 | $ | 610 | $ | 25 | $ | 77 | $ | 232 | $ | 112 | $ | 46 | $ | 361 | $ | 105 | $ | 20 | $ | 2,493 | ||||||||||||||||||||||
| As percent of ALLL | 36.3 | % | 24.5 | % | 1.0 | % | 3.1 | % | 9.3 | % | 4.5 | % | 1.8 | % | 14.5 | % | 4.2 | % | 0.8 | % | 100.0 | % | ||||||||||||||||||||||
| Loans: | ||||||||||||||||||||||||||||||||||||||||||||
| Individually evaluated | $ | 343 | $ | 2,666 | $ | 53 | $ | 240 | $ | 13,466 | $ | 722 | $ | 287 | $ | 2,303 | $ | 181 | $ | - | $ | 20,261 | ||||||||||||||||||||||
| Collectively evaluated | 101,925 | 178,781 | 25,167 | 27,209 | 112,236 | 32,523 | 6,080 | 144,247 | 48,374 | 4,923 | 681,465 | |||||||||||||||||||||||||||||||||
| Total loans | $ | 102,268 | $ | 181,447 | $ | 25,220 | $ | 27,449 | $ | 125,702 | $ | 33,245 | $ | 6,367 | $ | 146,550 | $ | 48,555 | $ | 4,923 | $ | 701,726 | ||||||||||||||||||||||
| Less ALLL | $ | 905 | $ | 610 | $ | 25 | $ | 77 | $ | 232 | $ | 112 | $ | 46 | $ | 361 | $ | 105 | $ | 20 | $ | 2,493 | ||||||||||||||||||||||
| Net loans | $ | 101,363 | $ | 180,837 | $ | 25,195 | $ | 27,372 | $ | 125,470 | $ | 33,133 | $ | 6,321 | $ | 146,189 | $ | 48,450 | $ | 4,903 | $ | 699,233 | ||||||||||||||||||||||
| December 31, 2023 | |||||||||||||||||||||||
| (in thousands) | 30-89 Days Past Due (accruing) | 90 Days & Over or nonaccrual | Current | Total | |||||||||||||||||||
| Commercial & industrial | $ | 540 | $ | 4,046 | $ | 1,279,423 | $ | 1,284,009 | |||||||||||||||
| Owner-occupied CRE | 2,123 | 4,399 | 950,072 | 956,594 | |||||||||||||||||||
| Agricultural | 12 | 12,185 | 1,149,334 | 1,161,531 | |||||||||||||||||||
| CRE investment | 3,060 | 1,453 | 1,137,738 | 1,142,251 | |||||||||||||||||||
| Construction & land development | 171 | 161 | 309,778 | 310,110 | |||||||||||||||||||
| Residential construction | — | — | 75,726 | 75,726 | |||||||||||||||||||
| Residential first mortgage | 2,663 | 4,059 | 1,160,387 | 1,167,109 | |||||||||||||||||||
| Residential junior mortgage | 547 | 150 | 200,187 | 200,884 | |||||||||||||||||||
| Retail & other | 327 | 172 | 55,229 | 55,728 | |||||||||||||||||||
| Total loans | $ | 9,443 | $ | 26,625 | $ | 6,317,874 | $ | 6,353,942 | |||||||||||||||
| Percent of total loans | 0.1 | % | 0.4 | % | 99.5 | % | 100.0 | % | |||||||||||||||
Note 6 – Loans, Allowance for Loan Losses, and Credit Quality, continued
| Total Nonaccrual Loans | ||||||||||||||||
| (in thousands) | September 30, 2017 | % to Total | December 31, 2016 | % to Total | ||||||||||||
| Commercial & industrial | $ | 5,078 | 35.2 | % | $ | 358 | 1.8 | % | ||||||||
| Owner-occupied CRE | 1,276 | 8.8 | 2,894 | 14.3 | ||||||||||||
| AG production | 2 | - | 9 | 0.1 | ||||||||||||
| AG real estate | 186 | 1.3 | 208 | 1.0 | ||||||||||||
| CRE investment | 4,537 | 31.4 | 12,317 | 60.6 | ||||||||||||
| Construction & land development | 723 | 5.0 | 1,193 | 5.9 | ||||||||||||
| Residential construction | 80 | 0.6 | 260 | 1.3 | ||||||||||||
| Residential first mortgage | 2,301 | 16.0 | 2,990 | 14.7 | ||||||||||||
| Residential junior mortgage | 239 | 1.7 | 56 | 0.3 | ||||||||||||
| Retail & other | - | - | - | - | ||||||||||||
| Nonaccrual loans - Total | $ | 14,422 | 100.0 | % | $ | 20,285 | 100.0 | % | ||||||||
| Originated | ||||||||||||||||
| (in thousands) | September 30, 2017 | % to Total | December 31, 2016 | % to Total | ||||||||||||
| Commercial & industrial | $ | 615 | 62.3 | % | $ | 4 | 1.6 | % | ||||||||
| Owner-occupied CRE | 38 | 3.8 | 42 | 16.3 | ||||||||||||
| AG production | 2 | 0.2 | 7 | 2.7 | ||||||||||||
| AG real estate | - | - | - | - | ||||||||||||
| CRE investment | - | - | - | - | ||||||||||||
| Construction & land development | - | - | - | - | ||||||||||||
| Residential construction | - | - | - | - | ||||||||||||
| Residential first mortgage | 333 | 33.7 | 204 | 79.4 | ||||||||||||
| Residential junior mortgage | - | - | - | - | ||||||||||||
| Retail & other | - | - | - | - | ||||||||||||
| Nonaccrual loans - Originated | $ | 988 | 100.0 | % | $ | 257 | 100.0 | % | ||||||||
| Acquired | ||||||||||||||||
| (in thousands) | September 30, 2017 | % to Total | December 31, 2016 | % to Total | ||||||||||||
| Commercial & industrial | $ | 4,463 | 33.2 | % | $ | 354 | 1.8 | % | ||||||||
| Owner-occupied CRE | 1,238 | 9.2 | 2,852 | 14.2 | ||||||||||||
| AG production | - | - | 2 | 0.1 | ||||||||||||
| AG real estate | 186 | 1.4 | 208 | 1.0 | ||||||||||||
| CRE investment | 4,537 | 33.8 | 12,317 | 61.4 | ||||||||||||
| Construction & land development | 723 | 5.4 | 1,193 | 6.0 | ||||||||||||
| Residential construction | 80 | 0.6 | 260 | 1.3 | ||||||||||||
| Residential first mortgage | 1,968 | 14.6 | 2,786 | 13.9 | ||||||||||||
| Residential junior mortgage | 239 | 1.8 | 56 | 0.3 | ||||||||||||
| Retail & other | - | - | - | - | ||||||||||||
| Nonaccrual loans – Acquired | $ | 13,434 | 100.0 | % | $ | 20,028 | 100.0 | % | ||||||||
| March 31, 2024 | December 31, 2023 | ||||||||||||||||
| (in thousands) | Nonaccrual Loans | % of Total | Nonaccrual Loans | % of Total | |||||||||||||
| Commercial & industrial | $ | 3,761 | 13 | % | $ | 4,046 | 15 | % | |||||||||
| Owner-occupied CRE | 4,721 | 18 | 4,399 | 16 | |||||||||||||
| Agricultural | 12,418 | 47 | 12,185 | 46 | |||||||||||||
| CRE investment | 1,430 | 5 | 1,453 | 5 | |||||||||||||
| Construction & land development | 10 | — | 161 | 1 | |||||||||||||
| Residential construction | — | — | — | — | |||||||||||||
| Residential first mortgage | 3,983 | 15 | 4,059 | 15 | |||||||||||||
| Residential junior mortgage | 171 | 1 | 150 | 1 | |||||||||||||
| Retail & other | 183 | 1 | 172 | 1 | |||||||||||||
| Nonaccrual loans | $ | 26,677 | 100 | % | $ | 26,625 | 100 | % | |||||||||
| Percent of total loans | 0.4 | % | 0.4 | % | |||||||||||||
Note 6 – Loans, Allowance for Loan Losses, and
Information
:| March 31, 2024 | Amortized Cost Basis by Origination Year | ||||||||||||||||||||||||||||
| (in thousands) | 2024 | 2023 | 2022 | 2021 | 2020 | Prior | Revolving | Revolving to Term | TOTAL | ||||||||||||||||||||
| Commercial & industrial | |||||||||||||||||||||||||||||
| Grades 1-4 | $ | 53,800 | $ | 217,996 | $ | 219,568 | $ | 161,847 | $ | 60,248 | $ | 115,279 | $ | 368,107 | $ | — | $ | 1,196,845 | |||||||||||
| Grade 5 | 288 | 2,883 | 14,017 | 7,691 | 3,189 | 8,857 | 28,460 | — | 65,385 | ||||||||||||||||||||
| Grade 6 | — | 93 | 855 | 175 | 181 | 1,547 | 15,411 | — | 18,262 | ||||||||||||||||||||
| Grade 7 | 44 | 5,803 | 4,001 | 2,418 | 2,421 | 10,572 | 1,739 | — | 26,998 | ||||||||||||||||||||
| Total | $ | 54,132 | $ | 226,775 | $ | 238,441 | $ | 172,131 | $ | 66,039 | $ | 136,255 | $ | 413,717 | $ | — | $ | 1,307,490 | |||||||||||
| Current period gross charge-offs | $ | — | $ | — | $ | — | $ | (2) | $ | (19) | $ | (22) | $ | (39) | $ | — | $ | (82) | |||||||||||
| Owner-occupied CRE | |||||||||||||||||||||||||||||
| Grades 1-4 | $ | 22,733 | $ | 109,635 | $ | 160,965 | $ | 173,754 | $ | 87,951 | $ | 317,931 | $ | 3,384 | $ | — | $ | 876,353 | |||||||||||
| Grade 5 | 603 | 7,439 | 3,024 | 6,820 | 5,044 | 35,089 | 25 | — | 58,044 | ||||||||||||||||||||
| Grade 6 | — | — | — | 4,848 | 636 | 11 | — | — | 5,495 | ||||||||||||||||||||
| Grade 7 | — | — | 2,415 | 1,057 | 6,873 | 5,324 | 225 | — | 15,894 | ||||||||||||||||||||
| Total | $ | 23,336 | $ | 117,074 | $ | 166,404 | $ | 186,479 | $ | 100,504 | $ | 358,355 | $ | 3,634 | $ | — | $ | 955,786 | |||||||||||
| Current period gross charge-offs | $ | — | $ | — | $ | — | $ | — | $ | — | $ | (30) | $ | — | $ | — | $ | (30) | |||||||||||
| Agricultural | |||||||||||||||||||||||||||||
| Grades 1-4 | $ | 29,159 | $ | 138,632 | $ | 262,622 | $ | 132,375 | $ | 77,638 | $ | 152,042 | $ | 278,803 | $ | — | $ | 1,071,271 | |||||||||||
| Grade 5 | 2,355 | 6,304 | 14,070 | 5,666 | 1,663 | 34,967 | 17,636 | — | 82,661 | ||||||||||||||||||||
| Grade 6 | — | — | — | — | — | 336 | 91 | — | 427 | ||||||||||||||||||||
| Grade 7 | 105 | 2,490 | 6,727 | 6,207 | 448 | 14,707 | 5,328 | — | 36,012 | ||||||||||||||||||||
| Total | $ | 31,619 | $ | 147,426 | $ | 283,419 | $ | 144,248 | $ | 79,749 | $ | 202,052 | $ | 301,858 | $ | — | $ | 1,190,371 | |||||||||||
| Current period gross charge-offs | $ | — | $ | — | $ | — | $ | — | $ | — | $ | — | $ | — | $ | — | $ | — | |||||||||||
| CRE investment | |||||||||||||||||||||||||||||
| Grades 1-4 | $ | 24,742 | $ | 40,089 | $ | 222,858 | $ | 252,208 | $ | 168,792 | $ | 390,814 | $ | 10,770 | $ | — | $ | 1,110,273 | |||||||||||
| Grade 5 | — | 2,777 | 7,631 | 17,691 | 6,455 | 32,140 | 49 | — | 66,743 | ||||||||||||||||||||
| Grade 6 | — | — | — | — | 1,435 | 1,323 | 47 | — | 2,805 | ||||||||||||||||||||
| Grade 7 | — | — | — | 19 | — | 8,882 | — | — | 8,901 | ||||||||||||||||||||
| Total | $ | 24,742 | $ | 42,866 | $ | 230,489 | $ | 269,918 | $ | 176,682 | $ | 433,159 | $ | 10,866 | $ | — | $ | 1,188,722 | |||||||||||
| Current period gross charge-offs | $ | — | $ | — | $ | — | $ | — | $ | — | $ | — | $ | — | $ | — | $ | — | |||||||||||
| Construction & land development | |||||||||||||||||||||||||||||
| Grades 1-4 | $ | 7,879 | $ | 50,418 | $ | 93,190 | $ | 61,462 | $ | 9,208 | $ | 12,418 | $ | 2,229 | $ | — | $ | 236,804 | |||||||||||
| Grade 5 | — | — | 19 | 3,025 | 1,241 | 586 | — | — | 4,871 | ||||||||||||||||||||
| Grade 6 | — | — | — | — | — | — | — | — | — | ||||||||||||||||||||
| Grade 7 | — | 45 | — | — | — | 10 | — | — | 55 | ||||||||||||||||||||
| Total | $ | 7,879 | $ | 50,463 | $ | 93,209 | $ | 64,487 | $ | 10,449 | $ | 13,014 | $ | 2,229 | $ | — | $ | 241,730 | |||||||||||
| Current period gross charge-offs | $ | — | $ | — | $ | — | $ | — | $ | — | $ | — | $ | — | $ | — | $ | — | |||||||||||
| Residential construction | |||||||||||||||||||||||||||||
| Grades 1-4 | $ | 6,349 | $ | 66,030 | $ | 8,077 | $ | 2,773 | $ | 143 | $ | 598 | $ | 400 | $ | — | $ | 84,370 | |||||||||||
| Grade 5 | — | — | — | — | — | — | — | — | — | ||||||||||||||||||||
| Grade 6 | — | — | — | — | — | — | — | — | — | ||||||||||||||||||||
| Grade 7 | — | — | — | — | — | — | — | — | — | ||||||||||||||||||||
| Total | $ | 6,349 | $ | 66,030 | $ | 8,077 | $ | 2,773 | $ | 143 | $ | 598 | $ | 400 | $ | — | $ | 84,370 | |||||||||||
| Current period gross charge-offs | $ | — | $ | — | $ | — | $ | — | $ | — | $ | — | $ | — | $ | — | $ | — | |||||||||||
| Residential first mortgage | |||||||||||||||||||||||||||||
| Grades 1-4 | $ | 27,598 | $ | 163,636 | $ | 384,613 | $ | 241,463 | $ | 125,902 | $ | 209,364 | $ | 476 | $ | 2 | $ | 1,153,054 | |||||||||||
| Grade 5 | — | 320 | 1,481 | 1,075 | 987 | 4,474 | — | — | 8,337 | ||||||||||||||||||||
| Grade 6 | — | — | — | 573 | — | — | — | — | 573 | ||||||||||||||||||||
| Grade 7 | — | 24 | 384 | 611 | 432 | 3,654 | — | — | 5,105 | ||||||||||||||||||||
| Total | $ | 27,598 | $ | 163,980 | $ | 386,478 | $ | 243,722 | $ | 127,321 | $ | 217,492 | $ | 476 | $ | 2 | $ | 1,167,069 | |||||||||||
| Current period gross charge-offs | $ | — | $ | — | $ | — | $ | — | $ | — | $ | — | $ | — | $ | — | $ | — | |||||||||||
| Residential junior mortgage | |||||||||||||||||||||||||||||
| Grades 1-4 | $ | 6,398 | $ | 12,482 | $ | 7,037 | $ | 3,271 | $ | 4,121 | $ | 6,375 | $ | 160,217 | $ | 6,106 | $ | 206,007 | |||||||||||
| Grade 5 | — | — | — | — | — | — | 25 | — | 25 | ||||||||||||||||||||
| Grade 6 | — | — | — | — | — | — | — | — | — | ||||||||||||||||||||
| Grade 7 | — | 30 | 30 | 200 | — | 26 | 116 | — | 402 | ||||||||||||||||||||
| Total | $ | 6,398 | $ | 12,512 | $ | 7,067 | $ | 3,471 | $ | 4,121 | $ | 6,401 | $ | 160,358 | $ | 6,106 | $ | 206,434 | |||||||||||
| Current period gross charge-offs | $ | — | $ | — | $ | — | $ | — | $ | — | $ | — | $ | — | $ | — | $ | — | |||||||||||
| Retail & other | |||||||||||||||||||||||||||||
| Grades 1-4 | $ | 2,451 | $ | 6,827 | $ | 7,212 | $ | 5,011 | $ | 2,126 | $ | 5,291 | $ | 26,502 | $ | — | $ | 55,420 | |||||||||||
| Grade 5 | — | — | — | 20 | — | — | — | — | 20 | ||||||||||||||||||||
| Grade 6 | — | — | — | — | — | — | — | — | — | ||||||||||||||||||||
| Grade 7 | — | 93 | — | 23 | 7 | 82 | — | — | 205 | ||||||||||||||||||||
| Total | $ | 2,451 | $ | 6,920 | $ | 7,212 | $ | 5,054 | $ | 2,133 | $ | 5,373 | $ | 26,502 | $ | — | $ | 55,645 | |||||||||||
| Current period gross charge-offs | $ | — | $ | (68) | $ | (9) | $ | — | $ | — | $ | — | $ | (27) | $ | — | $ | (104) | |||||||||||
| Total loans | $ | 184,504 | $ | 834,046 | $ | 1,420,796 | $ | 1,092,283 | $ | 567,141 | $ | 1,372,699 | $ | 920,040 | $ | 6,108 | $ | 6,397,617 | |||||||||||
| December 31, 2023 | Amortized Cost Basis by Origination Year | ||||||||||||||||||||||||||||
| (in thousands) | 2023 | 2022 | 2021 | 2020 | 2019 | Prior | Revolving | Revolving to Term | TOTAL | ||||||||||||||||||||
| Commercial & industrial | |||||||||||||||||||||||||||||
| Grades 1-4 | $ | 223,515 | $ | 234,193 | $ | 171,555 | $ | 66,026 | $ | 49,054 | $ | 81,272 | $ | 359,284 | $ | — | $ | 1,184,899 | |||||||||||
| Grade 5 | 3,252 | 13,656 | 7,516 | 3,388 | 5,074 | 7,020 | 18,753 | — | 58,659 | ||||||||||||||||||||
| Grade 6 | — | 562 | 502 | 187 | 3 | 1,009 | 10,974 | — | 13,237 | ||||||||||||||||||||
| Grade 7 | 5,742 | 3,702 | 2,655 | 2,409 | 1,769 | 9,244 | 1,693 | — | 27,214 | ||||||||||||||||||||
| Total | $ | 232,509 | $ | 252,113 | $ | 182,228 | $ | 72,010 | $ | 55,900 | $ | 98,545 | $ | 390,704 | $ | — | $ | 1,284,009 | |||||||||||
| Current period gross charge-offs | $ | — | $ | (89) | $ | (114) | $ | — | $ | — | $ | (222) | $ | (15) | $ | — | $ | (440) | |||||||||||
| Owner-occupied CRE | |||||||||||||||||||||||||||||
| Grades 1-4 | $ | 114,704 | $ | 156,723 | $ | 181,128 | $ | 91,038 | $ | 85,430 | $ | 247,730 | $ | 4,181 | $ | — | $ | 880,934 | |||||||||||
| Grade 5 | 5,416 | 4,024 | 7,858 | 5,092 | 3,994 | 27,585 | 52 | — | 54,021 | ||||||||||||||||||||
| Grade 6 | — | — | 3,905 | — | 1,531 | 12 | — | — | 5,448 | ||||||||||||||||||||
| Grade 7 | — | 1,304 | 1,071 | 6,988 | 338 | 6,340 | 150 | — | 16,191 | ||||||||||||||||||||
| Total | $ | 120,120 | $ | 162,051 | $ | 193,962 | $ | 103,118 | $ | 91,293 | $ | 281,667 | $ | 4,383 | $ | — | $ | 956,594 | |||||||||||
| Current period gross charge-offs | $ | — | $ | — | $ | — | $ | — | $ | — | $ | (773) | $ | — | $ | — | $ | (773) | |||||||||||
| Agricultural | |||||||||||||||||||||||||||||
| Grades 1-4 | $ | 120,200 | $ | 274,491 | $ | 134,706 | $ | 78,944 | $ | 22,985 | $ | 139,212 | $ | 277,170 | $ | — | $ | 1,047,708 | |||||||||||
| Grade 5 | 6,345 | 11,975 | 5,718 | 703 | 394 | 33,658 | 15,522 | — | 74,315 | ||||||||||||||||||||
| Grade 6 | — | 130 | 1,017 | — | 51 | 2,256 | 194 | — | 3,648 | ||||||||||||||||||||
| Grade 7 | 2,519 | 6,691 | 5,360 | 428 | 1,679 | 12,098 | 7,085 | — | 35,860 | ||||||||||||||||||||
| Total | $ | 129,064 | $ | 293,287 | $ | 146,801 | $ | 80,075 | $ | 25,109 | $ | 187,224 | $ | 299,971 | $ | — | $ | 1,161,531 | |||||||||||
| Current period gross charge-offs | $ | — | $ | — | $ | — | $ | — | $ | — | $ | (66) | $ | — | $ | — | $ | (66) | |||||||||||
| CRE investment | |||||||||||||||||||||||||||||
| Grades 1-4 | $ | 30,720 | $ | 194,442 | $ | 256,765 | $ | 169,078 | $ | 113,510 | $ | 283,339 | $ | 11,146 | $ | — | $ | 1,059,000 | |||||||||||
| Grade 5 | 2,790 | 7,746 | 17,899 | 9,857 | 11,232 | 23,108 | 49 | — | 72,681 | ||||||||||||||||||||
| Grade 6 | — | — | — | — | — | 1,340 | 65 | — | 1,405 | ||||||||||||||||||||
| Grade 7 | — | 51 | 21 | — | 1,034 | 8,059 | — | — | 9,165 | ||||||||||||||||||||
| Total | $ | 33,510 | $ | 202,239 | $ | 274,685 | $ | 178,935 | $ | 125,776 | $ | 315,846 | $ | 11,260 | $ | — | $ | 1,142,251 | |||||||||||
| Current period gross charge-offs | $ | — | $ | — | $ | — | $ | — | $ | — | $ | — | $ | — | $ | — | $ | — | |||||||||||
| Construction & land development | |||||||||||||||||||||||||||||
| Grades 1-4 | $ | 51,253 | $ | 149,155 | $ | 64,761 | $ | 9,441 | $ | 4,939 | $ | 22,548 | $ | 2,883 | $ | — | $ | 304,980 | |||||||||||
| Grade 5 | — | 23 | 3,044 | 1,264 | 504 | 88 | — | — | 4,923 | ||||||||||||||||||||
| Grade 6 | — | — | — | — | — | — | — | — | — | ||||||||||||||||||||
| Grade 7 | 46 | — | — | — | — | 86 | 75 | — | 207 | ||||||||||||||||||||
| Total | $ | 51,299 | $ | 149,178 | $ | 67,805 | $ | 10,705 | $ | 5,443 | $ | 22,722 | $ | 2,958 | $ | — | $ | 310,110 | |||||||||||
| Current period gross charge-offs | $ | — | $ | — | $ | — | $ | — | $ | — | $ | — | $ | — | $ | — | $ | — | |||||||||||
| Residential construction | |||||||||||||||||||||||||||||
| Grades 1-4 | $ | 57,033 | $ | 13,035 | $ | 3,316 | $ | 1,118 | $ | 130 | $ | 1,094 | $ | — | $ | — | $ | 75,726 | |||||||||||
| Grade 5 | — | — | — | — | — | — | — | — | — | ||||||||||||||||||||
| Grade 6 | — | — | — | — | — | — | — | — | — | ||||||||||||||||||||
| Grade 7 | — | — | — | — | — | — | — | — | — | ||||||||||||||||||||
| Total | $ | 57,033 | $ | 13,035 | $ | 3,316 | $ | 1,118 | $ | 130 | $ | 1,094 | $ | — | $ | — | $ | 75,726 | |||||||||||
| Current period gross charge-offs | $ | — | $ | — | $ | — | $ | — | $ | — | $ | — | $ | — | $ | — | $ | — | |||||||||||
| Residential first mortgage | |||||||||||||||||||||||||||||
| Grades 1-4 | $ | 164,917 | $ | 389,246 | $ | 247,957 | $ | 130,857 | $ | 56,223 | $ | 162,424 | $ | 887 | $ | 2 | $ | 1,152,513 | |||||||||||
| Grade 5 | — | 1,286 | 1,088 | 1,250 | 2,239 | 2,913 | — | — | 8,776 | ||||||||||||||||||||
| Grade 6 | — | — | — | — | — | — | — | — | — | ||||||||||||||||||||
| Grade 7 | 28 | 392 | 616 | 388 | 1,117 | 3,279 | — | — | 5,820 | ||||||||||||||||||||
| Total | $ | 164,945 | $ | 390,924 | $ | 249,661 | $ | 132,495 | $ | 59,579 | $ | 168,616 | $ | 887 | $ | 2 | $ | 1,167,109 | |||||||||||
| Current period gross charge-offs | $ | — | $ | — | $ | — | $ | — | $ | — | $ | (5) | $ | — | $ | — | $ | (5) | |||||||||||
| Residential junior mortgage | |||||||||||||||||||||||||||||
| Grades 1-4 | $ | 14,020 | $ | 7,277 | $ | 4,053 | $ | 4,187 | $ | 2,753 | $ | 3,909 | $ | 157,960 | $ | 6,342 | $ | 200,501 | |||||||||||
| Grade 5 | — | — | — | — | — | — | — | — | — | ||||||||||||||||||||
| Grade 6 | — | — | — | — | — | — | — | — | — | ||||||||||||||||||||
| Grade 7 | 31 | 31 | 202 | — | — | 27 | 92 | — | 383 | ||||||||||||||||||||
| Total | $ | 14,051 | $ | 7,308 | $ | 4,255 | $ | 4,187 | $ | 2,753 | $ | 3,936 | $ | 158,052 | $ | 6,342 | $ | 200,884 | |||||||||||
| Current period gross charge-offs | $ | — | $ | — | $ | — | $ | — | $ | — | $ | (96) | $ | — | $ | — | $ | (96) | |||||||||||
| Retail & other | |||||||||||||||||||||||||||||
| Grades 1-4 | $ | 8,207 | $ | 8,107 | $ | 5,345 | $ | 2,434 | $ | 1,689 | $ | 3,869 | $ | 25,891 | $ | — | $ | 55,542 | |||||||||||
| Grade 5 | — | — | 38 | — | — | — | — | — | 38 | ||||||||||||||||||||
| Grade 6 | — | — | — | — | — | — | — | — | — | ||||||||||||||||||||
| Grade 7 | 31 | — | 25 | 8 | 19 | 65 | — | — | 148 | ||||||||||||||||||||
| Total | $ | 8,238 | $ | 8,107 | $ | 5,408 | $ | 2,442 | $ | 1,708 | $ | 3,934 | $ | 25,891 | $ | — | $ | 55,728 | |||||||||||
| Current period gross charge-offs | $ | (7) | $ | (1) | $ | — | $ | (1) | $ | — | $ | (52) | $ | (212) | $ | — | $ | (273) | |||||||||||
| Total loans | $ | 810,769 | $ | 1,478,242 | $ | 1,128,121 | $ | 585,085 | $ | 367,691 | $ | 1,083,584 | $ | 894,106 | $ | 6,344 | $ | 6,353,942 | |||||||||||
| September 30, 2017 | ||||||||||||||||
| (in thousands) | 30-89 Days Past Due (accruing) | 90 Days & Over or nonaccrual | Current | Total | ||||||||||||
| Commercial & industrial | $ | 303 | $ | 5,078 | $ | 620,348 | $ | 625,729 | ||||||||
| Owner-occupied CRE | 229 | 1,276 | 426,549 | 428,054 | ||||||||||||
| AG production | - | 2 | 36,350 | 36,352 | ||||||||||||
| AG real estate | - | 186 | 48,257 | 48,443 | ||||||||||||
| CRE investment | - | 4,537 | 298,911 | 303,448 | ||||||||||||
| Construction & land development | 38 | 723 | 86,888 | 87,649 | ||||||||||||
| Residential construction | 1,085 | 80 | 31,998 | 33,163 | ||||||||||||
| Residential first mortgage | 537 | 2,301 | 360,278 | 363,116 | ||||||||||||
| Residential junior mortgage | 23 | 239 | 102,392 | 102,654 | ||||||||||||
| Retail & other | 4 | - | 22,510 | 22,514 | ||||||||||||
| Total loans | $ | 2,219 | $ | 14,422 | $ | 2,034,481 | $ | 2,051,122 | ||||||||
| As a percent of total loans | 0.1 | % | 0.7 | % | 99.2 | % | 100.0 | % | ||||||||
| December 31, 2016 | ||||||||||||||||
| (in thousands) | 30-89 Days Past Due (accruing) | 90 Days & Over or nonaccrual | Current | Total | ||||||||||||
| Commercial & industrial | $ | 22 | $ | 358 | $ | 427,890 | $ | 428,270 | ||||||||
| Owner-occupied CRE | 268 | 2,894 | 357,065 | 360,227 | ||||||||||||
| AG production | - | 9 | 34,758 | 34,767 | ||||||||||||
| AG real estate | - | 208 | 45,026 | 45,234 | ||||||||||||
| CRE investment | - | 12,317 | 183,562 | 195,879 | ||||||||||||
| Construction & land development | - | 1,193 | 73,795 | 74,988 | ||||||||||||
| Residential construction | - | 260 | 23,132 | 23,392 | ||||||||||||
| Residential first mortgage | 486 | 2,990 | 296,828 | 300,304 | ||||||||||||
| Residential junior mortgage | 200 | 56 | 91,075 | 91,331 | ||||||||||||
| Retail & other | 15 | - | 14,500 | 14,515 | ||||||||||||
| Total loans | $ | 991 | $ | 20,285 | $ | 1,547,631 | $ | 1,568,907 | ||||||||
| As a percent of total loans | 0.1 | % | 1.3 | % | 98.6 | % | 100.0 | % | ||||||||
may be assigned allocations for loss based on specific review of the weaknesses observed in the individual credits. Such loans are monitored by the loan review function to help ensure early identification of any deterioration. A description of the loan risk categories used by the Company follows:
follows.
8 Doubtful: Assets with this rating exhibit all
| (in thousands) | Payment Delay | Term Extension | Interest Rate Reduction | Term Extension & Interest Rate Reduction | Total | % of Total Loans | ||||||||||||||
| Three Months Ended March 31, 2024 | ||||||||||||||||||||
| Commercial & industrial | $ | — | $ | — | $ | — | $ | — | $ | — | — | % | ||||||||
| Owner-occupied CRE | 1,530 | — | — | — | 1,530 | 0.16 | % | |||||||||||||
| Agricultural | — | — | — | — | — | — | % | |||||||||||||
| CRE investment | — | — | — | — | — | — | % | |||||||||||||
| Total | $ | 1,530 | $ | — | $ | — | $ | — | $ | 1,530 | 0.02 | % | ||||||||
| Three Months Ended March 31, 2023 | ||||||||||||||||||||
| Commercial & industrial | $ | — | $ | — | $ | — | $ | — | $ | — | — | % | ||||||||
| Owner-occupied CRE | — | — | — | — | — | — | % | |||||||||||||
| Agricultural | 110 | — | — | — | 110 | 0.01 | % | |||||||||||||
| CRE investment | — | — | — | — | — | — | % | |||||||||||||
| Total | $ | 110 | $ | — | $ | — | $ | — | $ | 110 | — | % | ||||||||
Note 6 – Loans, Allowance for Loan Losses, and Credit Quality, continued
9 Loss: Assets in this category are considered uncollectible. Pursuing any recovery or salvage value is impractical but does not preclude partial recovery
The following tables present total loans by loan grade as of September 30, 2017 and December 31, 2016:
| September 30, 2017 | ||||||||||||||||||||||||||||
| (in thousands) | Grades 1- 4 | Grade 5 | Grade 6 | Grade 7 | Grade 8 | Grade 9 | Total | |||||||||||||||||||||
| Commercial & industrial | $ | 594,129 | $ | 15,356 | $ | 4,585 | $ | 11,659 | $ | - | $ | - | $ | 625,729 | ||||||||||||||
| Owner-occupied CRE | 402,021 | 22,058 | 1,348 | 2,627 | - | - | 428,054 | |||||||||||||||||||||
| AG production | 31,245 | 4,067 | - | 1,040 | - | - | 36,352 | |||||||||||||||||||||
| AG real estate | 40,982 | 4,845 | - | 2,616 | - | - | 48,443 | |||||||||||||||||||||
| CRE investment | 288,346 | 9,191 | - | 5,911 | - | - | 303,448 | |||||||||||||||||||||
| Construction & land development | 85,932 | 627 | 17 | 1,073 | - | - | 87,649 | |||||||||||||||||||||
| Residential construction | 33,083 | - | - | 80 | - | - | 33,163 | |||||||||||||||||||||
| Residential first mortgage | 356,985 | 2,207 | 779 | 3,145 | - | - | 363,116 | |||||||||||||||||||||
| Residential junior mortgage | 102,281 | 17 | - | 356 | - | - | 102,654 | |||||||||||||||||||||
| Retail & other | 22,514 | - | - | - | - | - | 22,514 | |||||||||||||||||||||
| Total loans | $ | 1,957,518 | $ | 58,368 | $ | 6,729 | $ | 28,507 | $ | - | $ | - | $ | 2,051,122 | ||||||||||||||
| Percent of total | 95.4 | % | 2.9 | % | 0.3 | % | 1.4 | % | - | - | 100.0 | % | ||||||||||||||||
| December 31, 2016 | ||||||||||||||||||||||||||||
| (in thousands) | Grades 1- 4 | Grade 5 | Grade 6 | Grade 7 | Grade 8 | Grade 9 | Total | |||||||||||||||||||||
| Commercial & industrial | $ | 401,954 | $ | 16,633 | $ | 2,133 | $ | 7,550 | $ | - | $ | - | $ | 428,270 | ||||||||||||||
| Owner-occupied CRE | 340,846 | 14,758 | 193 | 4,430 | - | - | 360,227 | |||||||||||||||||||||
| AG production | 31,026 | 3,191 | 70 | 480 | - | - | 34,767 | |||||||||||||||||||||
| AG real estate | 41,747 | 2,727 | - | 760 | - | - | 45,234 | |||||||||||||||||||||
| CRE investment | 173,652 | 8,137 | - | 14,090 | - | - | 195,879 | |||||||||||||||||||||
| Construction & land development | 69,097 | 4,318 | - | 1,573 | - | - | 74,988 | |||||||||||||||||||||
| Residential construction | 22,030 | 1,102 | - | 260 | - | - | 23,392 | |||||||||||||||||||||
| Residential first mortgage | 295,109 | 1,348 | 192 | 3,655 | - | - | 300,304 | |||||||||||||||||||||
| Residential junior mortgage | 91,123 | - | 114 | 94 | - | - | 91,331 | |||||||||||||||||||||
| Retail & other | 14,515 | - | - | - | - | - | 14,515 | |||||||||||||||||||||
| Total loans | $ | 1,481,099 | $ | 52,214 | $ | 2,702 | $ | 32,892 | $ | - | $ | - | $ | 1,568,907 | ||||||||||||||
| Percent of total | 94.4 | % | 3.3 | % | 0.2 | % | 2.1 | % | - | - | 100.0 | % | ||||||||||||||||
Management considers a loan to be impaired when it is probabletable above have had more than insignificant payment delays (which the Company will be unablehas defined as payment delays in excess of three months). These modified loans are closely monitored by the Company to collect all contractual principalunderstand the effectiveness of its modification efforts, and interest payments duesuch loans generally remain in nonaccrual status pending a sustained period of performance in accordance with the termsmodified terms.
In determining the appropriateness of the ALLL, management includes allocations for specifically identified impaired loans and loss factor allocations for all remaining loans, with a component primarily based on historical loss rates and another component primarily based on other qualitative factors. Impaired loans are individually assessed and are measured based on the present value of expected future cash flows discounted at the loan’s effective interest rate or, as a practical expedient, at the loan’s observable market price or the fair value of the collateral if the loan is collateral dependent.
Loans that are determined notfunds to be impaired are collectively evaluated for impairment, stratified by type and allocated loss ranges based on the Company’s actual historical loss ratios for each strata, and adjustments are also provided for certain current environmental and qualitative factors. An internal loan review function rates loans using a grading system based on nine different categories. Loans with grades of seven or higher (“classified loans”) represent loans with a greater risk of loss and may be assigned allocations for loss based on specific review of the weaknesses observed in the individual credits if classified as impaired. Classified loans are constantly monitored by the loan review function to ensure early identification of any deterioration.
The following tables present impaired loansOther Intangibles and then as a further breakdown by originated or acquired as of September 30, 2017 and December 31, 2016.
| Total Impaired Loans – September 30, 2017 | ||||||||||||||||||||
| (in thousands) | Recorded Investment | Unpaid Principal Balance | Related Allowance | Average Recorded Investment | Interest Income Recognized | |||||||||||||||
| Commercial & industrial | $ | 5,071 | $ | 12,275 | $ | 226 | $ | 5,057 | $ | 469 | ||||||||||
| Owner-occupied CRE | 1,116 | 2,793 | - | 1,185 | 96 | |||||||||||||||
| AG production | - | 15 | - | - | - | |||||||||||||||
| AG real estate | 218 | 308 | - | 229 | 25 | |||||||||||||||
| CRE investment | 4,845 | 8,863 | - | 5,099 | 353 | |||||||||||||||
| Construction & land development | 723 | 1,189 | - | 743 | 44 | |||||||||||||||
| Residential construction | 80 | 983 | - | 94 | 27 | |||||||||||||||
| Residential first mortgage | 1,619 | 2,971 | - | 1,699 | 121 | |||||||||||||||
| Residential junior mortgage | 60 | 500 | - | 64 | 6 | |||||||||||||||
| Retail & Other | - | 14 | - | - | - | |||||||||||||||
| Total | $ | 13,732 | $ | 29,911 | $ | 226 | $ | 14,170 | $ | 1,141 | ||||||||||
| Originated Impaired Loans – September 30, 2017 | ||||||||||||||||||||
| (in thousands) | Recorded Investment | Unpaid Principal Balance | Related Allowance | Average Recorded Investment | Interest Income Recognized | |||||||||||||||
| Commercial & industrial | $ | 615 | $ | 615 | $ | 226 | $ | 615 | $ | 91 | ||||||||||
| Owner-occupied CRE | - | - | - | - | - | |||||||||||||||
| AG production | - | - | - | - | - | |||||||||||||||
| AG real estate | - | - | - | - | - | |||||||||||||||
| CRE investment | - | - | - | - | - | |||||||||||||||
| Construction & land development | - | - | - | - | - | |||||||||||||||
| Residential construction | - | - | - | - | - | |||||||||||||||
| Residential first mortgage | - | - | - | - | - | |||||||||||||||
| Residential junior mortgage | - | - | - | - | - | |||||||||||||||
| Retail & Other | - | - | - | - | - | |||||||||||||||
| Total | $ | 615 | $ | 615 | $ | 226 | $ | 615 | $ | 91 | ||||||||||
| Acquired Impaired Loans – September 30, 2017 | ||||||||||||||||||||
| (in thousands) | Recorded Investment | Unpaid Principal Balance | Related Allowance | Average Recorded Investment | Interest Income Recognized | |||||||||||||||
| Commercial & industrial | $ | 4,456 | $ | 11,660 | $ | - | $ | 4,442 | $ | 378 | ||||||||||
| Owner-occupied CRE | 1,116 | 2,793 | - | 1,185 | 96 | |||||||||||||||
| AG production | - | 15 | - | - | - | |||||||||||||||
| AG real estate | 218 | 308 | - | 229 | 25 | |||||||||||||||
| CRE investment | 4,845 | 8,863 | - | 5,099 | 353 | |||||||||||||||
| Construction & land development | 723 | 1,189 | - | 743 | 44 | |||||||||||||||
| Residential construction | 80 | 983 | - | 94 | 27 | |||||||||||||||
| Residential first mortgage | 1,619 | 2,971 | - | 1,699 | 121 | |||||||||||||||
| Residential junior mortgage | 60 | 500 | - | 64 | 6 | |||||||||||||||
| Retail & Other | - | 14 | - | - | - | |||||||||||||||
| Total | $ | 13,117 | $ | 29,296 | $ | - | $ | 13,555 | $ | 1,050 | ||||||||||
Note 6 – Loans, Allowance for Loan Losses, and Credit Quality, continued
| Total Impaired Loans – December 31, 2016 | ||||||||||||||||||||
| (in thousands) | Recorded Investment | Unpaid Principal Balance | Related Allowance | Average Recorded Investment | Interest Income Recognized | |||||||||||||||
| Commercial & industrial | $ | 338 | $ | 720 | $ | - | $ | 348 | $ | 34 | ||||||||||
| Owner-occupied CRE | 2,588 | 4,661 | - | 2,700 | 271 | |||||||||||||||
| AG production | 41 | 163 | - | 48 | 6 | |||||||||||||||
| AG real estate | 240 | 332 | - | 245 | 26 | |||||||||||||||
| CRE investment | 12,552 | 19,695 | - | 12,982 | 1,051 | |||||||||||||||
| Construction & land development | 694 | 2,122 | - | 752 | 112 | |||||||||||||||
| Residential construction | 261 | 1,348 | - | 287 | 82 | |||||||||||||||
| Residential first mortgage | 2,204 | 3,706 | - | 2,312 | 190 | |||||||||||||||
| Residential junior mortgage | 299 | 639 | - | 209 | 17 | |||||||||||||||
| Retail & Other | - | 36 | - | - | - | |||||||||||||||
| Total | $ | 19,217 | $ | 33,422 | $ | - | $ | 19,883 | $ | 1,789 | ||||||||||
There were no originated impaired loans as of December 31, 2016. All loans in the table above were acquired loans.
In April 2017, the First Menasha merger added purchased credit impaired loans at a fair value of $5.4 million, net of an initial $5.9 million non-accretable mark. Also, during the third quarter a loan of $3.1 million was acquired, net of an initial $2.4 million non-accretable mark. Including these credit impaired loans acquired in the First Menasha merger and third quarter acquisition, total purchased credit impaired loans acquired in aggregate were initially recorded at a fair value of $43.6 million on their respective acquisition dates, net of an initial $34.4 million non-accretable mark and a zero accretable mark. At September 30, 2017, $12.3 million of the $43.6 million remain in impaired loans and $0.8 million of acquired loans have subsequently become impaired, bringing acquired impaired loans to $13.1 million.
| Non-accretable discount on purchase credit impaired (“PCI”) loans: | Nine Months Ended | Year ended | ||||||
| (in thousands) | September 30, 2017 | December 31, 2016 | ||||||
| Balance at beginning of period | $ | 14,327 | $ | 4,229 | ||||
| Acquired balance, net | 8,352 | 13,923 | ||||||
| Accretion to loan interest income | (5,925 | ) | (3,458 | ) | ||||
| Disposals of loans | (1,121 | ) | (367 | ) | ||||
| Balance at end of period | $ | 15,633 | $ | 14,327 | ||||
Troubled Debt Restructurings
During the quarter ended September 30, 2017, there were two additional loans that were restructured. One loan was an existing PCI loan which was restructured as part of a new agreement with a loan amount of $3.5 million. The other loan was an acquired loan for $0.7 million in which terms were extended subsequent to acquisition. At September 30, 2017, there were seven loans classified as troubled debt restructurings totaling $5.2 million. These seven loans had a combined premodification balance of $5.2 million. There were no other loans which were modified and classified as troubled debt restructurings at September 30, 2017. There were no loans classified as troubled debt restructurings during the previous twelve months that subsequently defaulted as of September 30, 2017. Loans which were considered troubled debt restructurings by First Menasha and Baylake prior to acquisition are not required to be classified as troubled debt restructurings in the Company’s consolidated financial statements unless and until such loans subsequently meet criteria to be classified as such, since acquired loans were recorded at their estimated fair values at the time of the acquisition.
Note 7 – Goodwill, Intangible Assets and Mortgage Servicing Rights
| (in thousands) | March 31, 2024 | December 31, 2023 | |||||||||
| Goodwill | $ | 367,387 | $ | 367,387 | |||||||
| Core deposit intangibles | 23,424 | 25,112 | |||||||||
| Customer list intangibles | 2,372 | 1,867 | |||||||||
| Other intangibles | 25,796 | 26,979 | |||||||||
| Goodwill and other intangibles, net | $ | 393,183 | $ | 394,366 | |||||||
Note 7 – Goodwill, Intangible Assets and Mortgage Servicing Rights, continued
Goodwill: Goodwill was $107.4 million at September 30, 2017 and $66.7 million at December 31, 2016. There was an addition to the carrying amount of goodwill in the second quarter of 2017 of $39.7 million related to the First Menasha merger. In accordance with business combination accounting standards, an additional increase to goodwill of $1.0 million occurred in the third quarter of 2017 due to the Company recording its previously held equity interest in First Menasha at its then acquisition date fair value, resulting in a $1.2 million gain in pre-tax earnings. See Note 2 for additional information on the acquisitions.
Other intangible assets: Other intangible assets, consisting of core deposit intangibles (related to branch or bank acquisitions) and customer list intangibles, (related to the customer relationships acquired in the 2016 financial advisor business acquisition), are amortized over their estimated finite lives. There was an additionDuring first quarter 2024, Nicolet purchased a financial advisory book of $3.7 million to the core deposit intangibles related to the First Menasha merger in the second quarter of 2017. Thebusiness and established a corresponding customer relationship intangible was increased $0.9 million in the third quarter of 2017 due to a modification to the contingent earn-out payment, fixing the previously variable earn-out payment on a portion of the purchase price. See Note 2 for additional information on the acquisitions.
| (in thousands) | September 30, 2017 | December 31, 2016 | ||||||
| Core deposit intangibles: | ||||||||
| Gross carrying amount | $ | 29,015 | $ | 25,345 | ||||
| Accumulated amortization | (11,469 | ) | (8,244 | ) | ||||
| Net book value | $ | 17,546 | $ | 17,101 | ||||
| Additions during the period | $ | 3,670 | $ | 17,259 | ||||
| Amortization during the period | $ | 3,225 | $ | 3,189 | ||||
| Customer list intangibles: | ||||||||
| Gross carrying amount | $ | 5,233 | $ | 4,363 | ||||
| Accumulated amortization | (558 | ) | (269 | ) | ||||
| Net book value | $ | 4,675 | $ | 4,094 | ||||
| Additions during the period | $ | 870 | $ | 4,363 | ||||
| Amortization during the period | $ | 289 | $ | 269 | ||||
Mortgage servicing rights:list intangible. A summary of the mortgageother intangible assets was as follows.
| Three Months Ended | Year Ended | ||||||||||
| (in thousands) | March 31, 2024 | December 31, 2023 | |||||||||
| Core deposit intangibles: | |||||||||||
| Gross carrying amount | $ | 60,724 | $ | 60,724 | |||||||
| Accumulated amortization | (37,300) | (35,612) | |||||||||
| Net book value | $ | 23,424 | $ | 25,112 | |||||||
| Additions during the period | $ | — | $ | — | |||||||
| Amortization during the period | $ | 1,688 | $ | 7,589 | |||||||
| Customer list intangibles: | |||||||||||
| Gross carrying amount | $ | 6,173 | $ | 5,523 | |||||||
| Accumulated amortization | (3,801) | (3,656) | |||||||||
| Net book value | $ | 2,372 | $ | 1,867 | |||||||
| Additions during the period | $ | 650 | $ | — | |||||||
| Amortization during the period | $ | 145 | $ | 483 | |||||||
| (in thousands) | September 30, 2017 | December 31, 2016 | ||||||
| Mortgage servicing rights (MSR) asset: | ||||||||
| MSR asset at beginning of year | $ | 1,922 | $ | 193 | ||||
| Capitalized MSR | 679 | 1,023 | ||||||
| MSR asset acquired | 874 | 885 | ||||||
| Amortization during the period | (339 | ) | (179 | ) | ||||
| Valuation allowance at end of period | - | - | ||||||
| Net book value at end of period | $ | 3,136 | $ | 1,922 | ||||
| Fair value of MSR asset at end of period | $ | 4,116 | $ | 2,013 | ||||
| Residential mortgage loans serviced for others | 509,897 | $ | 295,353 | |||||
| Net book value of MSR asset to loans serviced for others | 0.62 | % | 0.65 | % | ||||
sheets. The Company periodically evaluates its mortgage servicing rights asset for impairment. At each reporting date, impairment is assessed based on an estimated fair value using estimated prepayment speeds of the underlying mortgage loans serviced and stratificationsstratification based on the risk characteristics of the underlying loans serviced (predominantly loan type and note interest rate). No valuation or impairment chargeA summary of the changes in the mortgage servicing rights asset was recorded for 2016 or yearas follows.
| Three Months Ended | Year Ended | ||||||||||
| (in thousands) | March 31, 2024 | December 31, 2023 | |||||||||
| Mortgage servicing rights asset: | |||||||||||
| MSR asset at beginning of year | $ | 11,655 | $ | 13,080 | |||||||
| Capitalized MSR | 327 | 1,540 | |||||||||
| Amortization during the period | (782) | (2,965) | |||||||||
| MSR asset at end of period | $ | 11,200 | $ | 11,655 | |||||||
| Valuation allowance at beginning of year | $ | — | $ | (500) | |||||||
| Reversals | — | 500 | |||||||||
| Valuation allowance at end of period | $ | — | $ | — | |||||||
| MSR asset, net | $ | 11,200 | $ | 11,655 | |||||||
| Fair value of MSR asset at end of period | $ | 17,587 | $ | 16,810 | |||||||
| Residential mortgage loans serviced for others | $ | 1,603,173 | $ | 1,609,395 | |||||||
| Net book value of MSR asset to loans serviced for others | 0.70 | % | 0.72 | % | |||||||
| Three Months Ended | Year Ended | ||||||||||
| (in thousands) | March 31, 2024 | December 31, 2023 | |||||||||
| Loan servicing rights asset: | |||||||||||
| LSR asset at beginning of year | $ | 8,831 | $ | 11,039 | |||||||
| Amortization during the period | (491) | (2,208) | |||||||||
| LSR asset at end of period | $ | 8,340 | $ | 8,831 | |||||||
| Agricultural loans serviced for others | $ | 481,651 | $ | 492,137 | |||||||
Note 7 – Goodwill, Intangible Assets and Mortgage Servicing Rights, continued
| (in thousands) | Core deposit intangibles | Customer list intangibles | MSR asset | |||||||||
| Year ending December 31, | ||||||||||||
| 2017 (remaining three months) | $ | 1,070 | $ | 112 | $ | 136 | ||||||
| 2018 | 3,915 | 449 | 544 | |||||||||
| 2019 | 3,337 | 449 | 544 | |||||||||
| 2020 | 2,657 | 449 | 677 | |||||||||
| 2021 | 2,167 | 449 | 301 | |||||||||
| Thereafter | 4,400 | 2,767 | 934 | |||||||||
| Total | $ | 17,546 | $ | 4,675 | $ | 3,136 | ||||||
| (in thousands) | Core deposit intangibles | Customer list intangibles | MSR asset | LSR asset | |||||||||||||||||||
| Year ending December 31, | |||||||||||||||||||||||
| 2024 (remaining nine months) | $ | 4,610 | $ | 435 | $ | 2,113 | $ | 1,471 | |||||||||||||||
| 2025 | 5,161 | 579 | 2,158 | 1,717 | |||||||||||||||||||
| 2026 | 3,983 | 379 | 1,583 | 1,472 | |||||||||||||||||||
| 2027 | 3,218 | 296 | 1,582 | 1,227 | |||||||||||||||||||
| 2028 | 2,622 | 296 | 1,581 | 981 | |||||||||||||||||||
| 2029 | 1,911 | 166 | 1,569 | 736 | |||||||||||||||||||
| Thereafter | 1,919 | 221 | 614 | 736 | |||||||||||||||||||
| Total | $ | 23,424 | $ | 2,372 | $ | 11,200 | $ | 8,340 | |||||||||||||||
Short and Long-Term Borrowings
| (in thousands) | September 30, 2017 | December 31, 2016 | ||||||
| Federal Home Loan Bank (“FHLB”) advances | $ | 41,571 | $ | 1,000 | ||||
| Notes payable | $ | 41,571 | $ | 1,000 | ||||
year. The Company’s components of long-term borrowings were as follows.
| (in thousands) | March 31, 2024 | December 31, 2023 | |||||||||
| FHLB advances | $ | 5,000 | $ | 5,000 | |||||||
| Junior subordinated debentures | 40,760 | 40,552 | |||||||||
| Subordinated notes | 116,497 | 121,378 | |||||||||
| Total long-term borrowings | $ | 162,257 | $ | 166,930 | |||||||
The following table shows the maturity schedule of the notes payable as of September 30, 2017:
| Maturing in | (in thousands) | |||
| 2017 (remaining three months) | $ | 5,018 | ||
| 2018 | 1,000 | |||
| 2019 | - | |||
| 2020 | 10,000 | |||
| 2021 | - | |||
| 2022 | 25,553 | |||
| $ | 41,571 | |||
The Company has a $10 million line of credit with a third party bank, bearing a variable rate of interest based on one-month LIBOR plus a margin, but subject to a floor rate, with quarterly payments of interest only. At September 30, 2017, the available line was $10 million, the rate was one-month LIBOR plus 2.25% with a 3.25% floor. The outstanding balance was zero at September 30, 2017 and December 31, 2016, and the line was not used during 2017 or 2016.
Note 9 – 2023.
At September 30, 2017 and December 31, 2016,
The following table shows the breakdown of junior subordinated debentures as of September 30, 2017 and December 31, 2016. Interest on all debentures is current. Any applicable discounts (initially recordedissued to carry an acquired debenture at its then estimated fair market value) are being accreted to interest expense over the remaining life of the debentures. All the debentures below are currently callable and may be redeemed in part or in full plus any accrued but unpaid interest.
Note 9 – Junior Subordinated Debentures, continued
| Junior Subordinated Debentures | ||||||||||||||||||
| (in thousands) | Maturity Date | Par | 9/30/2017 Unamortized Discount | 9/30/2017 Carrying Value | 12/31/2016 Carrying Value | |||||||||||||
| 2004 Nicolet Bankshares Statutory Trust(1) | 7/15/2034 | $ | 6,186 | $ | - | $ | 6,186 | $ | 6,186 | |||||||||
| 2005 Mid-Wisconsin Financial Services, Inc.(2) | 12/15/2035 | 10,310 | (3,620 | ) | 6,690 | 6,540 | ||||||||||||
| 2006 Baylake Corp.(3) | 9/30/2036 | 16,598 | (4,415 | ) | 12,183 | 12,006 | ||||||||||||
| 2004 First Menasha Bancshares, Inc.(4) | 3/17/2034 | 5,155 | (717 | ) | 4,438 | - | ||||||||||||
| Total | $ | 38,249 | $ | (8,752 | ) | $ | 29,497 | $ | 24,732 | |||||||||
Underlying respectiveunderlying statutory truststrust (the “statutory trusts”), which issued trust preferred securities and common securities. Thesecurities and used the proceeds from the issuance of the common and the trust preferred securities were used by each trust to purchase the junior subordinated debentures of the Company. The debentures represent the sole asset of the statutory trusts. All of the common securities of the statutory trusts are owned by the Company. The statutory trusts are not included in the consolidated financial statements. The net effect of all the documents entered into with respect to the trust preferred securities is that the Company, through payments on its debentures, is liable for the distributions and other payments required on the trust preferred securities.
Note 10 – Interest on all debentures is current. Any applicable discounts (initially recorded to carry an acquired debenture at its then estimated fair value) are being accreted to interest expense over the remaining life of the debenture. All the junior subordinated debentures are currently callable and may be redeemed in part or in full, at par, plus any accrued but unpaid interest. At both March 31, 2024 and December 31, 2023, approximately $39 million of trust preferred securities qualify as Tier 1 capital.
(the “Notes”)
: In| As of March 31, 2024 | As of December 31, 2023 | |||||||||||||||||||||||||
| (in thousands) | Maturity Date | Interest Rate | Par | Unamortized Premium /(Discount) / Debt Issue Costs (1) | Carrying Value | Interest Rate | Carrying Value | |||||||||||||||||||
| Junior Subordinated Debentures: | ||||||||||||||||||||||||||
Mid-Wisconsin Statutory Trust I (2) | 12/15/2035 | 7.02 | % | $ | 10,310 | $ | (2,331) | $ | 7,979 | 7.08 | % | $ | 7,930 | |||||||||||||
Baylake Capital Trust II (3) | 9/30/2036 | 6.91 | % | 16,598 | (2,879) | 13,719 | 6.94 | % | 13,660 | |||||||||||||||||
First Menasha Statutory Trust (4) | 3/17/2034 | 8.38 | % | 5,155 | (432) | 4,723 | 8.43 | % | 4,712 | |||||||||||||||||
County Bancorp Statutory Trust II (5) | 9/15/2035 | 7.12 | % | 6,186 | (714) | 5,472 | 7.18 | % | 5,433 | |||||||||||||||||
County Bancorp Statutory Trust III (6) | 6/15/2036 | 7.28 | % | 6,186 | (772) | 5,414 | 7.34 | % | 5,375 | |||||||||||||||||
Fox River Valley Capital Trust (7) | 5/30/2033 | 7.89 | % | 3,610 | (157) | 3,453 | 7.89 | % | 3,442 | |||||||||||||||||
| Total | $ | 48,045 | $ | (7,285) | $ | 40,760 | $ | 40,552 | ||||||||||||||||||
| Subordinated Notes: | ||||||||||||||||||||||||||
| Subordinated Notes due 2031 | 7/15/2031 | 3.13 | % | $ | 94,150 | $ | (471) | $ | 93,679 | 3.13 | % | $ | 98,476 | |||||||||||||
| County Subordinated Notes due 2030 | 6/30/2030 | 7.00 | % | 22,400 | 418 | 22,818 | 7.00 | % | 22,902 | |||||||||||||||||
| Total | $ | 116,550 | $ | (53) | $ | 116,497 | $ | 121,378 | ||||||||||||||||||
| (in thousands) | March 31, 2024 | December 31, 2023 | |||||||||
| Commitments to extend credit | $ | 1,832,964 | $ | 1,877,327 | |||||||
| Financial standby letters of credit | 17,850 | 17,500 | |||||||||
| Performance standby letters of credit | 11,830 | 11,381 | |||||||||
The $180,000 debt issuance costs associated with the $12a net gain of $0.1 million Notes are being amortized on a straight line basis over the first five years, representing the no-call periods, as additional interest expense. As of September 30, 2017at both March 31, 2024 and December 31, 2016, respectively, $88,0002023.
As provided for by accounting standards, the The Company records and/or discloses certain financial instruments on a fair value basis. These financial assets and financial liabilities are measured at fair value in three levels, based on the markets in which the assets and liabilities are traded and the observability of the assumptions used to determine fair value. TheseObservable inputs are inputs that market participants would use in pricing the asset or liability based on market data obtained from independent sources. Unobservable inputs are inputs that reflect assumptions of the reporting entity about how market participants would price the asset or liability based on the best information available under the circumstances. The three fair value levels are:
Disclosure of the fair value of financial instruments, whether recognized or not recognized in the balance sheet, is required for those instruments for which it is practicable to estimate that value, with the exception of certain financial instruments and all nonfinancial instruments as provided for by the accounting standards. For financial instruments recognized at fair value in the consolidated balance sheets, the fair value disclosure requirements also apply.
| Fair Value Measurements Using | ||||||||||||||||
| Measured at Fair Value on a Recurring Basis: | Total | Level 1 | Level 2 | Level 3 | ||||||||||||
| (in thousands) | ||||||||||||||||
| U.S. government sponsored enterprises | $ | 26,272 | $ | - | $ | 26,272 | $ | - | ||||||||
| State, county and municipals | 188,716 | - | 188,057 | 659 | ||||||||||||
| Mortgage-backed securities | 157,936 | - | 157,929 | 7 | ||||||||||||
| Corporate debt securities | 32,744 | - | 24,254 | 8,490 | ||||||||||||
| Equity securities | 2,549 | 2,549 | - | - | ||||||||||||
| Securities AFS, September 30, 2017 | $ | 408,217 | $ | 2,549 | $ | 396,512 | $ | 9,156 | ||||||||
| (in thousands) | ||||||||||||||||
| U.S. government sponsored enterprises | $ | 1,963 | $ | - | $ | 1,963 | $ | - | ||||||||
| State, county and municipals | 187,243 | - | 186,717 | 526 | ||||||||||||
| Mortgage-backed securities | 159,129 | - | 159,076 | 53 | ||||||||||||
| Corporate debt securities | 12,169 | - | 3,640 | 8,529 | ||||||||||||
| Equity securities | 4,783 | 4,783 | - | - | ||||||||||||
| Securities AFS, December 31, 2016 | $ | 365,287 | $ | 4,783 | $ | 351,396 | $ | 9,108 | ||||||||
| (in thousands) | Fair Value Measurements Using | |||||||||||||||||||||||||
| Measured at Fair Value on a Recurring Basis: | Total | Level 1 | Level 2 | Level 3 | ||||||||||||||||||||||
| March 31, 2024 | ||||||||||||||||||||||||||
| U.S. Treasury securities | $ | 13,942 | $ | — | $ | 13,942 | $ | — | ||||||||||||||||||
| U.S. government agency securities | 6,979 | — | 6,979 | — | ||||||||||||||||||||||
| State, county and municipals | 313,065 | — | 311,648 | 1,417 | ||||||||||||||||||||||
| Mortgage-backed securities | 386,090 | — | 385,134 | 956 | ||||||||||||||||||||||
| Corporate debt securities | 83,887 | — | 80,188 | 3,699 | ||||||||||||||||||||||
| Securities AFS | $ | 803,963 | $ | — | $ | 797,891 | $ | 6,072 | ||||||||||||||||||
| Other investments (equity securities) | $ | 8,771 | $ | 8,771 | $ | — | $ | — | ||||||||||||||||||
| Derivative assets | $ | 170 | $ | — | $ | — | $ | 170 | ||||||||||||||||||
| Derivative liabilities | $ | 42 | $ | — | $ | — | $ | 42 | ||||||||||||||||||
| December 31, 2023 | ||||||||||||||||||||||||||
| U.S. Treasury securities | $ | 14,123 | $ | — | $ | 14,123 | $ | — | ||||||||||||||||||
| U.S. government agency securities | 7,384 | — | 7,384 | — | ||||||||||||||||||||||
| State, county and municipals | 334,822 | — | 333,401 | 1,421 | ||||||||||||||||||||||
| Mortgage-backed securities | 352,622 | — | 351,658 | 964 | ||||||||||||||||||||||
| Corporate debt securities | 93,622 | — | 89,944 | 3,678 | ||||||||||||||||||||||
| Securities AFS | $ | 802,573 | $ | — | $ | 796,510 | $ | 6,063 | ||||||||||||||||||
| Other investments (equity securities) | $ | 4,240 | $ | 4,240 | $ | — | $ | — | ||||||||||||||||||
| Derivative assets | $ | 152 | $ | — | $ | — | $ | 152 | ||||||||||||||||||
| Derivative liabilities | $ | 79 | $ | — | $ | — | $ | 79 | ||||||||||||||||||
Note 11 – Fair Value Measurements, continued
| (in thousands) | Three Months Ended | Year Ended | ||||||||||||
| Level 3 Fair Value Measurements: | March 31, 2024 | December 31, 2023 | ||||||||||||
| Balance at beginning of year | $ | 6,063 | $ | 8,153 | ||||||||||
| Maturities / Paydowns | (13) | (2,425) | ||||||||||||
| Unrealized gain / (loss) | 22 | 335 | ||||||||||||
| Balance at end of period | $ | 6,072 | $ | 6,063 | ||||||||||
Measured at Fair Value on a Nonrecurring Basis
| Fair Value Measurements Using | ||||||||||||||||
| (in thousands) | Total | Level 1 | Level 2 | Level 3 | ||||||||||||
| September 30, 2017: | ||||||||||||||||
| Impaired loans | $ | 13,506 | $ | - | $ | - | $ | 13,506 | ||||||||
| OREO | 1,314 | - | - | 1,314 | ||||||||||||
| December 31, 2016: | ||||||||||||||||
| Impaired loans | $ | 19,217 | $ | - | $ | - | $ | 19,217 | ||||||||
| OREO | 2,059 | - | - | 2,059 | ||||||||||||
fair value hierarchy within which those measurements fall.
| (in thousands) | Fair Value Measurements Using | |||||||||||||||||||||||||
| Measured at Fair Value on a Nonrecurring Basis: | Total | Level 1 | Level 2 | Level 3 | ||||||||||||||||||||||
| March 31, 2024 | ||||||||||||||||||||||||||
| Collateral dependent loans | $ | 20,178 | $ | — | $ | — | $ | 20,178 | ||||||||||||||||||
| Other real estate owned (“OREO”) | 1,245 | — | — | 1,245 | ||||||||||||||||||||||
| MSR asset | 11,200 | — | — | 11,200 | ||||||||||||||||||||||
| December 31, 2023 | ||||||||||||||||||||||||||
| Collateral dependent loans | $ | 19,920 | $ | — | $ | — | $ | 19,920 | ||||||||||||||||||
| OREO | 1,267 | — | — | 1,267 | ||||||||||||||||||||||
| MSR asset | 11,655 | — | — | 11,655 | ||||||||||||||||||||||
Note 11 – Fair Value Measurements, continued
Financial instruments:
The carrying amounts and estimated fair values of the Company’s financial instruments at September 30, 2017 and December 31, 2016 are shown below.
| September 30, 2017 | ||||||||||||||||||||
| (in thousands) | Carrying Amount | Estimated Fair Value | Level 1 | Level 2 | Level 3 | |||||||||||||||
| Financial assets: | ||||||||||||||||||||
| Cash and cash equivalents | $ | 96,103 | $ | 96,103 | $ | 96,103 | $ | - | $ | - | ||||||||||
| Certificates of deposit in other banks | 2,494 | 2,495 | - | 2,495 | - | |||||||||||||||
| Securities AFS | 408,217 | 408,217 | 2,549 | 396,512 | 9,156 | |||||||||||||||
| Other investments | 14,931 | 14,931 | - | 13,236 | 1,695 | |||||||||||||||
| Loans held for sale | 6,963 | 7,089 | - | 7,089 | - | |||||||||||||||
| Loans, net | 2,038,512 | 2,030,248 | - | - | 2,030,248 | |||||||||||||||
| BOLI | 63,989 | 63,989 | 63,989 | - | - | |||||||||||||||
| MSR asset | 3,136 | 4,116 | - | - | 4,116 | |||||||||||||||
| Financial liabilities: | ||||||||||||||||||||
| Deposits | $ | 2,366,951 | $ | 2,366,199 | $ | - | $ | - | $ | 2,366,199 | ||||||||||
| Short-term borrowings | 12,900 | 12,900 | 12,900 | - | - | |||||||||||||||
| Notes payable | 41,571 | 41,708 | - | 41,708 | - | |||||||||||||||
| Junior subordinated debentures | 29,497 | 28,907 | - | - | 28,907 | |||||||||||||||
| Subordinated notes | 11,912 | 11,417 | - | - | 11,417 | |||||||||||||||
| December 31, 2016 | ||||||||||||||||||||
| (in thousands) | Carrying Amount | Estimated Fair Value | Level 1 | Level 2 | Level 3 | |||||||||||||||
| Financial assets: | ||||||||||||||||||||
| Cash and cash equivalents | $ | 129,103 | $ | 129,103 | $ | 129,103 | $ | - | $ | - | ||||||||||
| Certificates of deposit in other banks | 3,984 | 3,992 | - | 3,992 | - | |||||||||||||||
| Securities AFS | 365,287 | 365,287 | 4,783 | 351,396 | 9,108 | |||||||||||||||
| Other investments | 17,499 | 17,499 | - | 15,779 | 1,720 | |||||||||||||||
| Loans held for sale | 6,913 | 6,968 | - | 6,968 | - | |||||||||||||||
| Loans, net | 1,557,087 | 1,568,676 | - | - | 1,568,676 | |||||||||||||||
| BOLI | 54,134 | 54,134 | 54,134 | - | - | |||||||||||||||
| MSR asset | 1,922 | 2,013 | - | - | 2,013 | |||||||||||||||
| Financial liabilities: | ||||||||||||||||||||
| Deposits | $ | 1,969,986 | $ | 1,969,973 | $ | - | $ | - | $ | 1,969,973 | ||||||||||
| Notes payable | 1,000 | 1,002 | - | 1,002 | - | |||||||||||||||
| Junior subordinated debentures | 24,732 | 24,095 | - | - | 24,095 | |||||||||||||||
| Subordinated notes | 11,885 | 11,459 | - | - | 11,459 | |||||||||||||||
Not all the financial instruments listed in the table above are subject to the disclosure provisions of Accounting Standards Codification (“ASC”) 820,Fair Value Measurements and Disclosures,as certain assets and liabilities result in their carrying value approximating fair value. These include cash and cash equivalents, BOLI, short-term borrowings, and nonmaturing deposits. For those financial instruments not previously disclosed the following is a description of the evaluation methodologies used.
Certificates of deposits in other banks: Fair values are estimated using discounted cash flow analysis based on current interest rates being offered by instruments with similar terms and represents a Level 2 measurement.
Note 11 – Fair Value Measurements, continued
Other investments: The carrying amount of Federal Reserve Bank, Bankers Bank, Farmer Mac, and FHLB stock is a reasonably accepted fair value estimate given their restricted nature. Fair value is the redeemable (carrying) value based on the redemption provisions of the instruments which is considered a Level 2 measurement. The carrying amount of the remaining other investments (particularly common stocks of companies or other banks that are not publicly traded) approximates their fair value, determined primarily by analysis of company financial statements and recent capital issuances of the respective companies or banks, if any, and represents a Level 3 measurement.
Loans held for sale:The fair value estimation process for the loans held for sale portfolio is segregated by loan type. The estimated fair value was based on what secondary markets are currently offering for portfolios with similar characteristics and represents a Level 2 measurement.
Loans, netMSR asset: For variable-rate loans that reprice frequently and with no significant change in credit risk or other optionality, fair values are based on carrying values. Fair values for all other loans are estimated by discounting contractual cash flows using estimated market discount rates, which reflect the credit and interest rate risk inherent in the loan. Collateral-dependent impaired loans are included in loans, net. The fair value of loans is considered to be a Level 3 measurement due to internally developed discounted cash flow measurements.
Mortgage servicing rights asset: To estimate the fair value of the MSR asset, the underlying serviced loan pools are stratified by interest rate tranche and term of the loan, and a valuation model is used to calculate the present value of the expected future cash flows for each stratum. When the carrying value of the MSR asset related to a stratum exceeds its fair value, the stratum is recorded at fair value. The servicing valuation model incorporates assumptions that market participants would use in estimating future net servicing income, such as costs to service, a discount rate, ancillary income, default rates and losses, and prepayment speeds. Although some of these assumptions are based on observable market data, other assumptions are based on unobservable estimates of what market participants would use to measure fair value. As a result, the fair value measurement of mortgage servicing rights is considered a Level 3 measurement
Deposits: The fair value of deposits with no stated maturity (such as demand deposits, savings, interest and non-interest checking, and money market accounts) is, by definition, equal to the amount payable on demand at the reporting date. Fair values for fixed-rate certificates of deposit are estimated using a discounted cash flow calculation that applies interest rates currently being offered in the market place on certificates of similar remaining maturities. Use of internal discounted cash flows provides a Level 3 fair value measurement.
Notes payable: The fair value of the Federal Home Loan Bank advances is obtained from the Federal Home Loan Bank which uses a discounted cash flow analysis based on current market rates of similar maturity debt securities and represents a Level 2 measurement. The fair values of any remaining notes payable are estimated using discounted cash flow analysis based on current interest rates being offered by instruments with similar terms and credit quality which represents a Level 3 measurement.
Junior subordinated debentures and subordinated notes: The fair values of these debt instruments utilize a discounted cash flow analysis based on an estimate of current interest rates being offered by instruments with similar terms and credit quality. Since the market for these instruments is limited, the internal evaluation represents a Level 3 measurement.
Off-balance-sheet instruments: At September 30, 2017 and December 31, 2016, the estimated fair value of letters of credit, loan commitments on which the committed interest rate is less than the current market rate, and of outstanding mandatory commitments to sell mortgages into the secondary market were not significant.
Limitations: Fair value estimates are made at a specific point in time, based on relevant market information and information about the financial instrument. These estimates do not reflect any premium or discount that could result from offering for sale at one time the Company’s entire holdings of a particular financial instrument. Fair value estimates may not be realizable in an immediate settlement of the instrument. In some instances, there are no quoted market prices for the Company’s various financial instruments in which case fair values may be based on estimates using present value or otherare shown below.
| March 31, 2024 | ||||||||||||||||||||||||||||||||
| (in thousands) | Carrying Amount | Estimated Fair Value | Level 1 | Level 2 | Level 3 | |||||||||||||||||||||||||||
| Financial assets: | ||||||||||||||||||||||||||||||||
| Cash and cash equivalents | $ | 427,424 | $ | 427,424 | $ | 427,424 | $ | — | $ | — | ||||||||||||||||||||||
| Certificates of deposit in other banks | 5,639 | 5,596 | — | 5,596 | — | |||||||||||||||||||||||||||
| Securities AFS | 803,963 | 803,963 | — | 797,891 | 6,072 | |||||||||||||||||||||||||||
| Other investments, including equity securities | 60,464 | 60,464 | 8,771 | 43,872 | 7,821 | |||||||||||||||||||||||||||
| Loans held for sale | 5,022 | 5,146 | — | 5,146 | — | |||||||||||||||||||||||||||
| Loans, net | 6,333,270 | 6,112,184 | — | — | 6,112,184 | |||||||||||||||||||||||||||
| MSR asset | 11,200 | 17,587 | — | — | 17,587 | |||||||||||||||||||||||||||
| LSR asset | 8,340 | 8,340 | — | — | 8,340 | |||||||||||||||||||||||||||
| Accrued interest receivable | 25,852 | 25,852 | 25,852 | — | — | |||||||||||||||||||||||||||
| Financial liabilities: | ||||||||||||||||||||||||||||||||
| Deposits | $ | 7,165,732 | $ | 7,154,175 | $ | — | $ | — | $ | 7,154,175 | ||||||||||||||||||||||
| Long-term borrowings | 162,257 | 150,112 | — | 4,834 | 145,278 | |||||||||||||||||||||||||||
| Accrued interest payable | 7,722 | 7,722 | 7,722 | — | — | |||||||||||||||||||||||||||
| December 31, 2023 | ||||||||||||||||||||||||||||||||
| (in thousands) | Carrying Amount | Estimated Fair Value | Level 1 | Level 2 | Level 3 | |||||||||||||||||||||||||||
| Financial assets: | ||||||||||||||||||||||||||||||||
| Cash and cash equivalents | $ | 491,431 | $ | 491,431 | $ | 491,431 | $ | — | $ | — | ||||||||||||||||||||||
| Certificates of deposit in other banks | 6,374 | 6,293 | — | 6,293 | — | |||||||||||||||||||||||||||
| Securities AFS | 802,573 | 802,573 | — | 796,510 | 6,063 | |||||||||||||||||||||||||||
| Other investments | 57,560 | 57,560 | 4,240 | 44,010 | 9,310 | |||||||||||||||||||||||||||
| Loans held for sale | 4,160 | 4,276 | — | 4,276 | — | |||||||||||||||||||||||||||
| Loans, net | 6,290,332 | 6,083,942 | — | — | 6,083,942 | |||||||||||||||||||||||||||
| MSR asset | 11,655 | 16,810 | — | — | 16,810 | |||||||||||||||||||||||||||
| LSR asset | 8,831 | 8,831 | — | — | 8,831 | |||||||||||||||||||||||||||
| Accrued interest receivable | 24,237 | 24,237 | 24,237 | — | — | |||||||||||||||||||||||||||
| Financial liabilities: | ||||||||||||||||||||||||||||||||
| Deposits | $ | 7,197,800 | $ | 7,184,712 | $ | — | $ | — | $ | 7,184,712 | ||||||||||||||||||||||
| Long-term borrowings | 166,930 | 155,179 | — | 4,820 | 150,359 | |||||||||||||||||||||||||||
| Accrued interest payable | 7,765 | 7,765 | 7,765 | — | — | |||||||||||||||||||||||||||
Company. 19.5%. the table above. The tax-equivalent adjustments bring tax-exempt interest to a level that would yield the same after-tax income by applying the effective Federal corporate tax rates to the underlying assets. Tables 2 and 3 present information to facilitate the review and discussion of selected average balance sheet items, tax-equivalent net interest income, interest rate spread and net interest margin. The provision for bank subordinated debt investment which was fully charged-off during first quarter 2023. year-end 2023), including favorable market-related changes. nonqualified deferred compensation plan liabilities. See also “Noninterest Income” for the offsetting fair value change to the nonqualified deferred compensation plan assets. professional fees. investment changes partly offset by dividend payments. controls. Factors that are important to managing overall credit quality are sound loan underwriting and administration, systematic monitoring of existing loans and commitments, effective loan review on an ongoing basis, early problem loan identification and remedial action to minimize losses, an largest segment of Nicolet’s loan portfolio at 20% of the total portfolio, followed by agricultural and CRE investment at 19% and 18%, respectively, of the loan portfolio. The loan portfolio is widely diversified permanent loan product. Notes to Consolidated Financial Statements, included in Part II, Item 8 of the Company’s 2023 Annual Report on Form 10-K. The Assessing these numerous factors involves significant judgment; therefore, management considers the ACL-Loans a critical accounting estimate. collectability of future cash flows. Table loss. For additional disclosures on credit quality, see Note 5, “Loans, Allowance for Credit Losses - Loans, and Credit Quality” of the Notes to Unaudited Consolidated Financial Statements under Part I, Item 1. For additional information on loans see “BALANCE SHEET ANALYSIS – Loans” and for additional information on the ACL-Loans see “BALANCE SHEET ANALYSIS – Allowance for Credit Losses-Loans.” 2023, and down from $41 million or 0.50% of total assets at March 31, 2023. obligations. and Impact of Inflation policy guidelines. A summary of Wisconsin, providingWisconsin. Nicolet provides a diversified range of traditional banking and wealth management services to individuals and businesses in its market area and through the 38 branch offices of its banking subsidiary, Nicolet National Bank (the “Bank”), primarily in northeasternWisconsin, Michigan, and central WisconsinMinnesota. In this Quarterly Report on Form 10-Q, unless the context indicates otherwise, all references to “we,” “us” and Menominee, Michigan.OverviewAt September 30, 2017, Nicolet Bankshares, Inc. and its subsidiaries (“Nicolet” or the “Company”) had total assets of $2.8 billion, loans of $2.0 billion, deposits of $2.4 billion and total stockholders’ equity of $360 million, representing increases over December 31, 2016 of 24%, 31%, 20% and 31% in assets, loans, deposits and total equity, respectively. This balance sheet growth was predominately attributable“our” refer to the April 28, 2017 acquisition of First Menasha Bancshares, Inc. (“First Menasha”), which added assets of $480 million (about 20% of Nicolet’s pre-merger asset size), loans of $351 million, deposits of $375 million, core deposit intangible of $4 million and goodwill of $41 million (as of the consummation date and based on estimated fair values), for a total purchase price that included the issuance of $62 million of common equity (or 1.3 million shares) and $19 million of cash, and which is further described in Note 2, “Acquisitions” of the notes to unaudited consolidated financial statements. In particular, organic loan growth has been strong since year end 2016, with loans, excluding $351 million of loans at acquisition of First Menasha, up $131 million or 8%.For the nine months ended September 30, 2017, net income was $24.0 million (94% above the comparable period of 2016), and net income available to common shareholders was $24.0 million or $2.45 per diluted common share. Evaluation of financial performance between 2017 and 2016 periods was impacted in general from the timing of the 2017 acquisition and the 2016 acquisitions, and inclusion of non-recurring merger-based expenses and integration costs, as described more fully under the section “Management’s Discussion and Analysis.”Nicolet’s profitability is significantly dependent upon net interest income (interest income earned on loans and other interest-earning assets such as investments, net of interest expense on deposits and other borrowed funds), and noninterest income sources (including but not limited to service charges on deposits, trust and brokerage fees, mortgage income from sales of residential mortgages into the secondary market and related servicing fees, and other fees or revenue from financial services provided to customers or ancillary to loans and deposits), offset by the level of the provision for loan losses, noninterest expenses (largely employee compensation and overhead expenses tied to processing and operating the Bank’s business), and income taxes. Business volumes and pricing drive revenue potential and tend to be influenced by overall economic factors, including market interest rates, business spending, consumer confidence, economic growth and competitive conditions within the marketplace.ShareholdersForward-looking statements include discussions of strategy, financial projections, guidance and estimates (including their underlying assumptions), statements regarding plans, objectives, expectations or consequences of various transactions or events, and statements about our future performance, operations, products and services, and should be viewed with caution. Investors should note that many factors, some of which are discussed elsewhere in this document, could affect the future financial results of Nicolet and could cause those results to differ materially from those expressed inimplied or anticipated by the statements. Except as required by law, we expressly disclaim any obligations to publicly update any forward-looking statements contained in this document. Thesewhether written or oral, that may be made from time to time, whether as a result of new information, future developments or otherwise. Important factors, many of which are beyond Nicolet’s control, that could cause our actual results and financial condition to differ materially from those indicated in the forward-looking statements, in addition to those described in detail under Item 1A, “Risk Factors” of Nicolet’s 2023 Annual Report on Form 10-K include, but are not necessarily limited to the following:·operating, legal and regulatory risks, including the effects of the Dodd-Frank Wall Street Reform and Consumer Protection Act and regulations promulgated thereunder, as well as the rules by the Federal bank regulatory agencies to implement the Basel III capital accord;·economic, political and competitive forces affecting Nicolet’s banking and wealth management businesses;·changes in interest rates, monetary policy and general economic conditions, which may impact Nicolet’s net interest income;·potential difficulties in integrating the operations of Nicolet with those of acquired entities, if any;·compliance or operational risks related to new products, services, ventures, or lines of business, if any, that Nicolet may pursue or implement; and·the risk that Nicolet’s analyses of these risks and forces could be incorrect and/or that the strategies developed to address them could be unsuccessful.32 Nicolet specifically disclaims any obligation to update factors or to publicly announce the results of revisions to any of the forward-looking statements or comments included herein to reflect future events or developments.Branch ClosuresIn April 2017, Nicolet closed one branch in conjunction with the 2017 acquisition due to overlapping geography. In March 2017, Nicolet closed two branches, one in close proximity to another Nicolet branch and one that was an outlier branch. Nicolet closed seven branches in 2016 that were in close proximity to other Nicolet branches, one concurrent with the Baylake merger, one in October and five in December 2016. As a result, Nicolet operates 38 branches as of September 30, 2017. Nicolet started its effort to eliminate costs associated with branches in overlapping or outlier geographies in 2015 from its acquisition activity, and will continue to evaluate opportunities for efficiencies.Critical Accounting PoliciesThe consolidated financial statements of Nicolet are prepared in conformity with U.S. GAAP and follow general practices within the industry in which it operates. This preparation requires management to make estimates, assumptions and judgments that affect the amounts reported in the consolidated financial statements and accompanying notes. These estimates, assumptions and judgments are based on information available as of the date of the consolidated financial statements; accordingly, as this information changes, actual results could differ from the estimates, assumptions and judgments reflected in the consolidated financial statements. Certain policies inherently have a greater reliance on the use of estimates, assumptions and judgments and, as such, have a greater possibility of producing results that could be materially different than originally reported. Estimates that are particularly susceptible to significant change include the valuation of loans acquired in business combinations, as well as the determination of the allowance for loan losses and income taxes and, therefore, are critical accounting policies.Valuation of Loans Acquired in Business CombinationsAcquisitions accounted for under ASC Topic 805,Business Combinations, require the use of the acquisition method of accounting. Assets acquired and liabilities assumed in a business combination are recorded at estimated fair value on their purchase date. In particular, the valuation of acquired loans involves significant estimates, assumptions and judgment based on information available as of the acquisition date. Substantially all loans acquired in the transaction are evaluated either individually or in pools of loans with similar characteristics; and since the estimated fair value of acquired loans includes a credit consideration, no carryover of any previously recorded allowance for loan losses is recorded at acquisition. A number of factors are considered in determining the estimated fair value of purchased loans including, among other things, the remaining life of the acquired loans, estimated prepayments, estimated loss ratios, estimated value of the underlying collateral, estimated holding periods, contractual interest rates compared to market interest rates, and net present value of cash flows expected to be received.In determining the Day 1 Fair Values of acquired loans, management calculates a non-accretable difference (the credit mark component of the acquired loans) and an accretable difference (the market rate or yield component of the acquired loans). The non-accretable difference is the difference between the undiscounted contractually required payments and the undiscounted cash flows expected to be collected in accordance with management’s determination of the Day 1 Fair Values. Subsequent decreases to the expected cash flows will generally result in a provision for loan losses. Subsequent increases in cash flows will result in a reversal of the provision for loan losses to the extent of prior charges and then an adjustment to the accretable and non-accretable differences, which would have a positive impact on interest income.The accretable yield on acquired loans is the difference between the expected cash flows and the initial investment in the acquired loans. The accretable yield is recognized into earnings through interest income using the effective yield method over the term of the loans. Management separately monitors the acquired loan portfolio and periodically reviews loans contained within this portfolio against the factors and assumptions used in determining the Day 1 Fair Values.33Allowance for Loan Losses (“ALLL”)The ALLL is a reserve for estimated credit losses on individually evaluated loans determined to be impaired as well as estimated credit losses inherent in the loan portfolio. Actual credit losses, net of recoveries, are deducted from the ALLL. Loans are charged off when management believes that the collectability of the principal is unlikely. Subsequent recoveries, if any, are credited to the ALLL. A provision for loan losses, which is a charge against earnings, is recorded to bring the ALLL to a level that, in management’s judgment, is adequate to absorb probable losses in the loan portfolio. Management’s evaluation process used to determine the appropriateness of the ALLL is subject to the use of estimates, assumptions, and judgment. The evaluation process involves gathering and interpreting many qualitative and quantitative factors which could affect probable credit losses. Because interpretation and analysis involves judgment, current economic or business conditions can change, and future events are inherently difficult to predict, the anticipated amount of estimated loan losses and therefore the appropriateness of the ALLL could change significantly.The allocation methodology applied by Nicolet is designed to assess the appropriateness of the ALLL and includes allocations for specifically identified impaired loans and loss factor allocations for all remaining loans, with a component primarily based on historical loss rates and a component primarily based on other qualitative factors. The methodology includes evaluation and consideration of several factors, such as, but not limited to, management’s ongoing review and grading of loans, facts and issues related to specific loans, historical loan loss and delinquency experience, trends in past due and nonaccrual loans, existing risk characteristics of specific loans or loan pools, the fair value of underlying collateral, current economic conditions and other qualitative and quantitative factors which could affect potential credit losses. While management uses the best information available to make its evaluation, future adjustments to the allowance may be necessary if there are significant changes in economic conditions or circumstances underlying the collectability of loans. Because each of the criteria used is subject to change, the allocation of the ALLL is made for analytical purposes and is not necessarily indicative of the trend of future loan losses in any particular loan category. The total allowance is available to absorb losses from any segment of the loan portfolio. Management believes the ALLL is appropriate at September 30, 2017. The allowance analysis is reviewed by the board of directors on a quarterly basis in compliance with regulatory requirements. In addition, various regulatory agencies periodically review the ALLL. These agencies may require Nicolet to make additions to the ALLL based on their judgments of collectability based on information available to them at the time of their examination. Acquired loans were purchased at fair value without any ALLL, and subsequent to acquisition such acquired loans will be evaluated and ALLL will be recorded on them to the extent necessary.Income TaxesThe assessment of income tax assets and liabilities involves the use of estimates, assumptions, interpretation, and judgment concerning certain accounting pronouncements and federal and state tax codes. There can be no assurance that future events, such as court decisions or positions of federal and state taxing authorities, will not differ from management’s current assessment, the impact of which could be significant to the consolidated results of operations and reported earnings.Nicolet files a consolidated federal income tax return and a combined state income tax return (both of which include Nicolet and its wholly owned subsidiaries). Accordingly, amounts equal to tax benefits of those companies having taxable federal losses or credits are reimbursed by the companies that incur federal tax liabilities. Amounts provided for income tax expense are based on income reported for financial statement purposes and do not necessarily represent amounts currently payable under tax laws. Deferred income tax assets and liabilities are computed annually for differences between the financial statement and tax bases of assets and liabilities that will result in taxable or deductible amounts in the future based on enacted tax law rates applicable to the periods in which the differences are expected to affect taxable income. As changes in tax laws or rates are enacted, deferred tax assets and liabilities are adjusted through provision for income tax expense. Valuation allowances are established when it is more likely than not that a portion of the full amount of the deferred tax asset will not be realized. In assessing the ability to realize deferred tax assets, management considers the scheduled reversal of deferred tax liabilities, projected future taxable income and tax planning strategies. Nicolet may also recognize a liability for unrecognized tax benefits from uncertain tax positions. Unrecognized tax benefits represent the differences between a tax position taken or expected to be taken in a tax return and the benefit recognized and measured in the financial statements. Penalties related to unrecognized tax benefits are classified as income tax expense.34Management’s Discussion and AnalysisNicolet management’s analysis of theNicolet’s consolidated financial condition as of September 30, 2017March 31, 2024 and December 31, 20162023 and results of operations for the three and nine-monththree-month periods ended September 30, 2017March 31, 2024 and 2016.2023. It should be read in conjunction with Nicolet’sour audited consolidated financial statements as of December 31, 2016 and 2015, and for the three years ended December 31, 2016, included in Nicolet’s 2023 Annual Report on Form 10-K10-K.year ended December 31, 2016.EvaluationS&P 500 nears record levels) and real estate gains, while the less wealthy have pulled back as wages have not kept pace with inflation resulting in rising credit card and auto loan delinquencies.At or for the Three Months Ended (In thousands, except per share data) 3/31/2024 12/31/2023 9/30/2023 6/30/2023 3/31/2023 Results of operations: Net interest income $ 62,807 $ 64,282 $ 61,474 $ 59,039 $ 56,721 Provision for credit losses 750 1,000 450 450 3,090 Noninterest income 19,422 24,434 16,541 16,841 (21,844) Noninterest expense 47,147 50,296 45,738 44,957 44,875 Income tax expense (benefit) 6,542 6,759 14,669 7,878 (4,190) Net income (loss) $ 27,790 $ 30,661 $ 17,158 $ 22,595 $ (8,898) Earnings (loss) per common share: Basic $ 1.86 $ 2.07 $ 1.16 $ 1.54 $ (0.61) Diluted $ 1.82 $ 2.02 $ 1.14 $ 1.51 $ (0.61) Common Shares: Basic weighted average 14,907 14,823 14,740 14,711 14,694 Diluted weighted average 15,249 15,142 15,100 14,960 14,694 Outstanding (period end) 14,931 14,894 14,758 14,718 14,698 Period-End Balances: Loans $ 6,397,617 $ 6,353,942 $ 6,239,257 $ 6,222,776 $ 6,223,732 Allowance for credit losses - loans 64,347 63,610 63,160 62,811 62,412 Total assets 8,446,662 8,468,678 8,416,162 8,482,628 8,192,354 Deposits 7,165,732 7,197,800 7,182,388 7,198,604 6,928,579 Stockholders’ equity (common) 1,063,655 1,039,007 974,461 977,638 961,792 Book value per common share 71.24 69.76 66.03 66.42 65.44 44.91 43.28 39.18 39.37 38.20 Return on average assets 1.33 % 1.45 % 0.81 % 1.10 % (0.42) % Return on average common equity 10.66 12.20 6.92 9.37 (3.72) 17.07 20.22 11.62 15.95 (6.34) Stockholders’ equity to assets 12.59 12.27 11.58 11.53 11.74 8.33 7.98 7.21 7.17 7.21 Reconciliation of Non-GAAP Financial Measures: Net income (loss) (GAAP) $ 27,790 $ 30,661 $ 17,158 $ 22,595 $ (8,898) Adjustments: — — — — 2,340 Assets (gains) losses, net (1,909) (5,947) (31) 318 38,468 Merger-related expense — — — 26 163 Contract termination charge — 2,689 — — — Adjustments subtotal (1,909) (3,258) (31) 344 40,971 (372) (635) (6) 86 10,243 — — 6,151 — — Adjusted net income (Non-GAAP) $ 26,253 $ 28,038 $ 23,284 $ 22,853 $ 21,830 Adjusted diluted earnings per common share (Non-GAAP) $ 1.72 $ 1.85 $ 1.54 $ 1.53 $ 1.45 Total assets $ 8,446,662 $ 8,468,678 $ 8,416,162 $ 8,482,628 $ 8,192,354 Goodwill and other intangibles, net 393,183 394,366 396,208 398,194 400,277 Tangible assets $ 8,053,479 $ 8,074,312 $ 8,019,954 $ 8,084,434 $ 7,792,077 Stockholders’ equity (common) $ 1,063,655 $ 1,039,007 $ 974,461 $ 977,638 $ 961,792 Goodwill and other intangibles, net 393,183 394,366 396,208 398,194 400,277 Tangible common equity $ 670,472 $ 644,641 $ 578,253 $ 579,444 $ 561,515 Average stockholders’ equity (common) $ 1,048,596 $ 996,745 $ 983,133 $ 967,142 $ 970,108 Average goodwill and other intangibles, net 393,961 395,158 397,052 399,080 401,212 Average tangible common equity $ 654,635 $ 601,587 $ 586,081 $ 568,062 $ 568,896 and average balances between 2017 and 2016 was impacted in general fromto the timing and sizesfinancial performance of peer banks. See section “Non-GAAP Financial Measures” below.2017Wisconsin tax law change assumed an effective tax rate of 25%, and 2016 acquisitions. Sinceperiods subsequent to the balances and resultseffective date assumed an effective tax rate of operations of the acquired entities are appropriately not included in the accompanying consolidated financial statements until their consummation dates, income statement results and average balances for 2017 included full contributions from the 2016 acquisitions and no or partial contributions from the 2017 acquisition. Similarly for 2016 income statement and average balance results, the 2016 acquisitions provided no to partial contributions and the 2017 acquisition provided no contribution.inclusion of the Baylake balance sheet (at about 83% of Nicolet’s then pre-merger asset size) and operational results for approximately eight months in 2016 (and approximately five months in the nine month period ended September 30, 2016) analytically explains most of the increase in certain average balances and income statement line items between 2017 and 2016 periods. To a lesser extent, the inclusion of the First Menasha balance sheet (at about 20% of Nicolet’s then pre-merger asset size) and operational results for approximately five of nine months in 2017 analytically explains a portion of the increase in certain average balances and income statement line items between 2017 and 2016 periods. The 2016 financial advisory business acquisition primarily impacts the brokerage fee income, personnel expense and certain other expense line items. Last, the 2016 and 2017 acquisitions impacted pre-taxadjusted net income by inclusion of non-recurring direct merger expenses of approximately $1.3 million in 2016 ($0.4 million, $0.4 million, $0.1 million and $0.4 million in first through fourth quarters, respectively) and $0.5 million in 2017 ($0.2 million and $0.3 million in thereconciliation for first and second quarter 2023 is as originally reported, and has not been restated to reflect the $3 million excess tax expense of those quarters respectively), alongthat was subsequently reversed in third quarter 2023 due to the Wisconsin tax law change. Thus, the adjusted net income reconciliation for the quarters of 2023 will not sum to the full year impact.a $1.7 million lease termination chargethe SEC’s rules, we identify certain financial measures as non-GAAP financial measures if such financial measures exclude or include amounts in second quarter 2016 relatedthe most directly comparable measures calculated and presented in accordance with generally accepted accounting principles (“GAAP”) in effect in the United States in our statements of income, balance sheets or statements of cash flows. Non-GAAP financial measures do not include operating and other statistical measures, ratios or statistical measures calculated using exclusively financial measures calculated in accordance with GAAP.Nicolet branch closed concurrent withproper understanding of our operating performance and trends, (b) enables a more complete understanding of factors and trends affecting our business, and (c) allows investors to compare our financial performance to the Baylake merger.Nicolet remains focused on gaining efficiencies from its increased scale fromfinancial performance of our peers and to evaluate our performance in a manner similar to management, the acquisitions,financial services industry, bank stock analysts, and bank regulators. Management uses non-GAAP measures as well as on organic growthfollows: in the preparation of our operating budgets, monthly financial performance reporting, and in our expanded marketspresentation to investors of our performance. However, we acknowledge that these non-GAAP financial measures have a number of limitations. Limitations associated with non-GAAP financial measures include the risk that persons might disagree as to the appropriateness of items comprising these measures and that different companies might calculate these measures differently. These disclosures should not be considered an alternative to our GAAP results. A reconciliation of non-GAAP financial measures to the most directly comparable GAAP financial measures is presented in brokerage services.reportedrecognized a net income of $24.0$28 million for the nine months ended September 30, 2017, a 94% increase over $12.4 million for the first nine months of 2016. Net income available to common shareholders was $24.0 million, or $2.45(or earnings per diluted common share of $1.82) for the first nine months of 2017. Comparatively, after $633,000 of preferred stock dividends,quarter 2024, compared to net income available to common shareholders was $11.7of $31 million or $1.67(or earnings per diluted common share of $2.02) for fourth quarter 2023, and net loss of $9 million (or loss per diluted common share of $0.61) for first quarter 2023.nine monthsquarter 2024 and beyond.2016. Beginning$44 million (1%) from December 31, 2023, with growth in agricultural, commercial and industrial, and residential real estate loans. For additional information regarding loans, see “BALANCE SHEET ANALYSIS — Loans.”1, 2016,31, 2024, down $32 million from December 31, 2023, mostly noninterest-bearing demand deposits. For additional information regarding deposits, see “BALANCE SHEET ANALYSIS – Deposits.”annual dividend ratecomparable 2023 period. The yield on preferred stock moved from 1%earning assets increased 95 bps to 9% in accordance with the contractual terms. Nicolet redeemed its outstanding preferred stock in full in September 2016, explaining the difference in preferred stock dividends between the nine-month periods.The results for the first nine months of 2017 include full contributions from the 2016 acquisitions and five months from First Menasha,5.44%, while the comparative 2016 period includes approximately five months from the 2016 acquisitions and nothing from First Menasha.·Net interest income was $72.2 million for the first nine months of 2017, an increase of $24.1 million or 50% over the comparable period of 2016, including $4.5 million higher aggregate discount accretion income between the periods. The improvement was primarily the result of favorable volume and mix variances (driven by the addition of acquired net interest-earning assets albeit at lower yields, as well as organic growth), and net favorable rate variances, largely from higher earning asset yields partially offset by a higher cost of funds. On a tax-equivalent basis, the earning asset yield was 4.69% for the first nine months of 2017, 25 basis points (“bps”) higher than the comparable period in 2016, influenced by more earning assets in loans and investments than in low-earning cash and higher aggregate discount accretion income. The cost of funds was 0.56% for the first nine months of 2017, 2 bps lower than 2016, driven by a lower cost of deposits (largely due to the addition of Baylake deposits at lower rates) between the comparable periods. As a result, the interest rate spread was 4.13% for the first nine months of 2017, 27 bps higher than the comparable period in 2016. The net interest margin was 4.27%, 28 bps over the comparable period of 2016.35·Noninterest income was $26.0 million for the first nine months of 2017, an increase of $7.2 million or 39% over the first nine months of 2016, aided largely by the 2016 acquisitions and, to a lesser extent, the 2017 acquisition. Excluding net gains on sale or write-down of assets from both periods, noninterest income increased $5.7 million or 31%cost of funds increased 71 bps to 3.01%. Brokerage fee income led the increase, growing $2.1 million or 101%, attributable to the 2016 financial advisor business acquisition and subsequent new growth. Between the nine-month periods, increases due primarily to higher volumes and activity were also experienced in service charges on deposits (up $0.9 million or 34%), net mortgage income (up $0.3 million or 8%), trust fee income (up $0.4 million or 11%), card interchange fees were up $1.2 million or 54% on higher volume and activity, and other income (up $0.4 million or 21%).·Noninterest expense for the first nine months of 2017 was $59.5 million (including $0.5 million attributable to non-recurring merger-based expenses) compared to $46.6 million for the comparable period in 2016 (including $2.6 million merger-related expenses). Excluding the noted merger-based expenses from both periods, noninterest expense increased approximately $15 million or 34%. The increase between the nine-month periods was primarily due to a larger operating base, attributable to the acquisitions. Personnel expense accounted for the majority of the increase in total expense, up $7.7 million or 31% over the first nine months of 2016, commensurate with the 32% increase in average full time equivalent employees for the comparable periods.·Loans were $2.05 billion at September 30, 2017, up $482 million or 31% from $1.57 billion at December 31, 2016, and up $497 million or 32% over September 30, 2016, largely driven by $351 million of loans acquired with First Menasha at acquisition. Excluding the impact of First Menasha, loans increased $131 million or 8% organically since year end 2016. Between the comparative nine-month periods, average loans were $1.84 billion yielding 5.26% in 2017, compared to $1.27 billion yielding 5.13% in 2016, a 45% increase in average balances. The 13 bps increase in loan yield was largely due to $4.5 million of higher aggregate discount accretion income on acquired loans between the nine-month periods (inclusive of $3.2 million higher discount income related to favorably resolved purchased credit impaired loans), partially offset by pressure on rates of new and renewing loans in the competitive rate environment.·Total deposits were $2.37 billion at September 30, 2017, up $397 million or 20% from $1.97 billion at December 31, 2016, and up $433 million or 22% over September 30, 2016, primarily due to $375 million of deposits acquired with First Menasha at acquisition). Excluding the impact of First Menasha, deposits increased $22 million or 1% since year end 2016. Between the comparative nine-month periods, average total deposits were up $631 million or 41%, attributable to the acquisitions, with noninterest-bearing demand deposits representing 24% and 23% of total deposits for the nine-month periods ended September 30, 2017 and 2016, respectively. Interest-bearing deposits cost 0.42% for the first nine months of 2017, down 1 bp from 0.43% for the same period in 2016, benefiting mostly from the lower-costing Baylake deposits acquired, offset partly by the higher-costing First Menasha deposits acquired, an increase in selected deposit rates that began in July 2017, and general rate pressures influenced by a 75 bps increase in the federal funds rate since January 1, 2016.·Asset quality measures remained strong with continued improvement. Nonperforming assets declined to $15.7 million at September 30, 2017, from $22.3 million at year end 2016 and $23.7 million a year ago. As a percentage of total assets, nonperforming assets were 0.55% at September 30, 2017, 0.97% at December 31, 2016, and 1.04% at September 30, 2016. The allowance for loan losses was $12.6 million at September 30, 2017 (representing 0.61% of loans), compared to $11.8 million at December 31, 2016 (representing 0.75% of loans), and $11.5 million at September 30, 2016 (representing 0.74% of loans). The decline in the ratio of the ALLL to loans primarily resulted from recording the acquired loan portfolios at fair value with no carryover of allowance at the time of each merger. The provision for loan losses was $1.9 million with net charge-offs of $1.1 million for the first nine months of 2017, versus provision of $1.4 million and $0.2 million of net charge-offs for the comparable 2016 period.Net Interest IncomeNicolet’s earnings are substantially dependent on net interest income. Net interest income is the primary source of Nicolet’s revenue and is the difference betweenincreased $6.1 million (11%) over first quarter 2023, including a $16.7 million increase in interest income earned on interest earning assets, such as loans and investments, and interest expense on interest-bearing liabilities, such as deposits and other borrowings. Net interest income is directly impactedoffset by the sensitivity of the balance sheet to changesa $10.6 million increase in interest rates and by the amount and composition of earning assets and interest-bearing liabilities, including characteristics such as the fixed or variable nature of the financial instruments, contractual maturities, and repricing frequencies.36Net interest income in the consolidated statements of income (which excludes any taxable equivalent adjustment) was $72.2 million in the first nine months of 2017, $24.1 million or 50% higher than $48.1 million in the first nine months of 2016, including $4.5 million higher aggregate discount accretion between the periods and impacted by the timing of the acquisitions (with 2017 including five months of First Menasha and full contribution from Baylake, while the 2016 period included only five months from Baylake). Taxable equivalent adjustments (adjustments to bring tax-exempt interest to a level that would yield the same after-tax income had that been subject to a 35% tax rate) were $1.8 million and $1.3 million for the first nine months of 2017 and 2016, respectively, resulting in taxable equivalentexpense. For additional information regarding net interest income, see “INCOME STATEMENT ANALYSIS — Net Interest Income.”$74.0$2.3 million and $49.4(5%) over first quarter 2023. Personnel costs increased $2.2 million respectively.Taxable equivalent(9%), while non-personnel expenses combined increased $0.1 million compared to first quarter 2023. For additional information regarding noninterest expense, see “INCOME STATEMENT ANALYSIS — Noninterest Expense.”1: Year-To-Date2: Average Balance Sheet and Net Interest Income Analysis For the Nine Months Ended September 30, 2017 2016 (in thousands) Average
Balance Interest Average
Rate Average
Balance Interest Average
Rate ASSETS Earning assets Loans, including loan fees (1)(2) $ 1,842,695 $ 73,377 5.26 % $ 1,274,405 $ 49,634 5.13 % Investment securities Taxable 236,275 3,422 1.93 % 147,720 2,068 1.87 % Tax-exempt (2) 160,815 3,267 2.71 % 122,850 2,265 2.46 % Other interest-earning assets 51,803 1,136 2.92 % 87,840 906 1.38 % Total interest-earning assets 2,291,588 $ 81,202 4.69 % 1,632,815 $ 54,873 4.44 % Cash and due from banks 76,992 43,001 Other assets 211,546 147,070 Total assets $ 2,580,126 $ 1,822,886 LIABILITIES AND STOCKHOLDERS’ EQUITY Interest-bearing liabilities Savings $ 249,099 $ 271 0.15 % $ 184,156 $ 166 0.12 % Interest-bearing demand 419,266 1,590 0.51 % 310,801 1,310 0.56 % MMA 581,277 1,165 0.27 % 421,920 415 0.13 % Core CDs and IRAs 288,524 1,568 0.73 % 249,788 1,657 0.89 % Brokered deposits 120,782 622 0.69 % 28,897 280 1.29 % Total interest-bearing deposits 1,658,948 5,216 0.42 % 1,195,562 3,828 0.43 % Other interest-bearing liabilities 62,414 1,966 4.17 % 52,470 1,638 4.11 % Total interest-bearing liabilities 1,721,362 7,182 0.56 % 1,248,032 5,466 0.58 % Noninterest-bearing demand 516,412 348,765 Other liabilities 19,079 16,779 Total equity 323,273 209,310 Total liabilities and stockholders’ equity $ 2,580,126 $ 1,822,886 Net interest income and rate spread $ 74,020 4.13 % $ 49,407 3.86 % Net interest margin 4.27 % 3.99 % (1)Nonaccrual loans are included in the daily average loan balances outstanding.(2)The yield on tax-exempt loans and tax-exempt investment securities is computed on a tax-equivalent basis using a federal tax rate of 35% and adjusted for the disallowance of interest expense.
- Tax-Equivalent Basis37For the Three Months Ended March 31, 2024 2023 (in thousands) Average
BalanceInterest Average
Yield/RateAverage
BalanceInterest Average
Yield/RateASSETS Interest-earning assets $ 6,398,838 $ 93,744 5.81 % $ 6,201,780 $ 79,186 5.11 % Investment securities: Taxable 689,563 4,557 2.64 % 1,224,395 4,961 1.63 % 195,212 1,640 3.36 % 284,140 2,285 3.22 % Total investment securities 884,775 6,197 2.80 % 1,508,535 7,246 1.93 % Other interest-earning assets 345,507 4,588 5.26 % 120,275 1,536 5.11 % Total non-loan earning assets 1,230,282 10,785 3.49 % 1,628,810 8,782 2.16 % Total interest-earning assets 7,629,120 $ 104,529 5.44 % 7,830,590 $ 87,968 4.49 % Other assets, net 751,475 740,033 Total assets $ 8,380,595 $ 8,570,623 LIABILITIES AND STOCKHOLDERS’ EQUITY Interest-bearing liabilities Savings $ 758,698 $ 2,458 1.30 % $ 888,979 $ 2,365 1.08 % Interest-bearing demand 897,919 3,828 1.71 % 985,778 3,339 1.37 % Money market accounts (“MMA”) 1,931,576 13,866 2.89 % 1,847,701 11,190 2.46 % Core time deposits 1,076,477 11,104 4.15 % 602,882 2,693 1.81 % Total interest-bearing core deposits 4,664,670 31,256 2.69 % 4,325,340 19,587 1.84 % Brokered deposits 680,124 7,734 4.57 % 566,282 5,350 3.83 % Total interest-bearing deposits 5,344,794 38,990 2.93 % 4,891,622 24,937 2.07 % Wholesale funding 165,088 2,234 5.35 % 499,485 5,718 4.58 % Total interest-bearing liabilities 5,509,882 41,224 3.01 % 5,391,107 30,655 2.30 % Noninterest-bearing demand 1,768,177 2,168,640 Other liabilities 53,940 40,768 Stockholders’ equity 1,048,596 970,108 Total liabilities and stockholders’ equity $ 8,380,595 $ 8,570,623 Net interest income and rate spread $ 63,305 2.43 % $ 57,313 2.19 % Tax-equivalent adjustment & net free funds 498 0.83 % 592 0.72 % Net interest income and net interest margin $ 62,807 3.26 % $ 56,721 2.91 % 2: Year-To-Date3: Volume/Rate VarianceComparison - Tax-Equivalent BasisIncrease (Decrease) Due to Changes in (in thousands) Volume Rate Interest-earning assets $ 1,726 $ 12,832 $ 14,558 Investment securities: Taxable (1,409) 1,005 (404) (743) 98 (645) Total investment securities (2,152) 1,103 (1,049) Other interest-earning assets 3,141 (89) 3,052 Total non-loan earning assets 989 1,014 2,003 Total interest-earning assets $ 2,715 $ 13,846 $ 16,561 Interest-bearing liabilities Savings $ (371) $ 464 $ 93 Interest-bearing demand (312) 801 489 MMA 550 2,126 2,676 Core time deposits 3,183 5,228 8,411 Total interest-bearing core deposits 3,050 8,619 11,669 Brokered deposits 1,214 1,170 2,384 Total interest-bearing deposits 4,264 9,789 14,053 Wholesale funding (3,524) 40 (3,484) Total interest-bearing liabilities 740 9,829 10,569 Net interest income $ 1,975 $ 4,017 $ 5,992 nine months ended September 30, 2017 versusdaily average loan balances outstanding.nine months ended September 30, 2016 follows: Increase (decrease)
Due to Changes in (in thousands) Volume Rate Net Earning assets Loans(1)(2) $ 22,613 $ 1,130 $ 23,743 Investment securities Taxable 1,382 (28 ) 1,354 Tax-exempt(2) 752 250 1,002 Other interest-earning assets (234 ) 464 230 Total interest-earning assets $ 24,513 $ 1,816 $ 26,329 Interest-bearing liabilities Savings deposits $ 66 $ 39 $ 105 Interest-bearing demand 421 (141 ) 280 MMA 200 550 750 Core CDs and IRAs 234 (323 ) (89 ) Brokered deposits 525 (183 ) 342 Total interest-bearing deposits 1,446 (58 ) 1,388 Other interest-bearing liabilities 412 (84 ) 328 Total interest-bearing liabilities 1,858 (142 ) 1,716 Net interest income $ 22,655 $ 1,958 $ 24,613 (1)Nonaccrual loans are included in the daily average loan balances outstanding.(2)The yield on tax-exempt loans and tax-exempt investment securities is computed on a tax-equivalent basis using a federal tax rate of 35% and adjusteddisallowance of interest expense. the disallowance of interest expense.38Table 3: Quarterly Net Interest Income Analysis For the Three Months Ended September 30, 2017 2016 (in thousands) Average
Balance Interest Average
Rate Average
Balance Interest Average
Rate ASSETS Earning assets Loans, including loan fees(1)(2) $ 2,035,277 $ 27,420 5.29 % $ 1,562,151 $ 21,138 5.32 % Investment securities Taxable 248,579 1,114 1.79 % 199,843 902 1.80 % Tax-exempt(2) 160,965 1,107 2.75 % 152,959 969 2.53 % Other interest-earning assets 60,252 407 2.69 % 84,782 351 1.66 % Total interest-earning assets 2,505,073 $ 30,048 4.72 % 1,999,735 $ 23,360 4.57 % Cash and due from banks 54,925 59,573 Other assets 265,544 206,774 Total assets $ 2,825,542 $ 2,266,082 LIABILITIES AND STOCKHOLDERS’ EQUITY Interest-bearing liabilities Savings $ 268,552 $ 129 0.19 % $ 216,055 $ 60 0.11 % Interest-bearing demand 441,409 758 0.68 % 367,854 451 0.49 % MMA 606,737 622 0.41 % 539,160 180 0.13 % Core CDs and IRAs 297,318 595 0.79 % 300,827 583 0.77 % Brokered deposits 172,200 260 0.60 % 29,639 76 1.02 % Total interest-bearing deposits 1,786,216 2,364 0.53 % 1,453.535 1,350 0.37 % Other interest-bearing liabilities 68,123 699 4.04 % 39,898 541 5.35 % Total interest-bearing liabilities 1,854,339 3,063 0.65 % 1,493,433 1,891 0.50 % Noninterest-bearing demand 591,013 464,131 Other liabilities 21,962 22,616 Total equity 358,228 285,902 Total liabilities and stockholders’ equity $ 2,825,542 $ 2,266,082 Net interest income and rate spread $ 26,985 4.07 % $ 21,469 4.07 % Net interest margin 4.24 % 4.19 % (1)Nonaccrual loans are included in the daily average loan balances outstanding.(2)The yield on tax-exempt loans and tax-exempt investment securities is computed on a tax-equivalent basis using a federal tax rate of 35% and adjusted for the disallowance of interest expense.39Table 4: Quarterly Volume/Rate VarianceComparison of the three months ended September 30, 2017 versusMarch 31, 2024, an increase of $6 million (10%) over the three months ended September 30, 2016 follows: Increase (decrease)
Due to Changes in (in thousands) Volume Rate Net Earning assets Loans (1) (2) $ 6,462 $ (180 ) $ 6,282 Investment securities Taxable 182 30 212 Tax-exempt(2) 52 86 138 Other interest-earning assets (144 ) 200 56 Total interest-earning assets $ 6,552 $ 136 $ 6,688 Interest-bearing liabilities Savings deposits $ 17 $ 52 $ 69 Interest-bearing demand 103 204 307 MMA 25 417 442 Core CDs and IRAs (7 ) 19 12 Brokered deposits 228 (44 ) 184 Total interest-bearing deposits 366 648 1,014 Other interest-bearing liabilities 143 15 158 Total interest-bearing liabilities 509 663 1,172 Net interest income $ 6,043 $ (527 ) $ 5,516 (1)Nonaccrual loans are includedMarch 31, 2023. The $6 million increase in the daily average loan balances outstanding.(2)The yield on tax-exempt loans and tax-exempt investment securities is computed on a tax-equivalent basis using a federal tax rate of 35% and adjusted for the disallowance of interest expense.Table 5: Interest Rate Spread, Margin and Average Balance Mix — Taxable Equivalent Basis Nine Months Ended September 30, 2017 2016 (in thousands) Average
Balance % of
Earning
Assets Yield/Rate Average
Balance % of
Earning
Assets Yield/Rate Total loans $ 1,842,695 80.4 % 5.26 % $ 1,274,405 78.0 % 5.13 % Securities and other earning assets 448,893 19.6 % 2.32 % 358,410 22.0 % 1.95 % Total interest-earning assets $ 2,291,588 100.0 % 4.69 % $ 1,632,815 100.0 % 4.44 % Interest-bearing liabilities $ 1,721,362 75.1 % 0.56 % $ 1,248,032 76.4 % 0.58 % Noninterest-bearing funds, net 570,226 24.9 % 384,783 23.6 % Total funds sources $ 2,291,588 100.0 % 0.56 % $ 1,632,815 100.0 % 0.43 % Interest rate spread 4.13 % 3.86 % Contribution from net free funds 0.14 % 0.13 % Net interest margin 4.27 % 3.99 % Taxable-equivalent net interest income was $74.0attributable to favorable volumes and favorable rates, which added $2 million and $49.4$4 million, forrespectively, to net interest income.nine months of 2017 and 2016, respectively, up $24.6 million or 50%, with $22.7 million from net favorable volume and mix variances (duecomparable 2023 period, primarily due to the addition of acquired netfirst quarter 2023 balance sheet repositioning (as discussed in further detail under “Performance Summary” above). Between the comparable three-month periods, average loans increased $197 million (3%), on solid organic loan growth. Average investment securities decreased $624 million between the comparable three-month periods, while other interest-earning assets as well as organic growth)increased $225 million, with both attributable to the first quarter 2023 balance sheet repositioning. As a result, the mix of average interest-earning assets shifted to 84% loans, 12% investments and 4% other interest-earning assets (mostly cash) for first quarter 2024, compared to 79%, 19% and 2%, respectively, for first quarter 2023.$1.9 million from net favorable rate variances (from both a lower cost of funds and higher earning asset yield) between the periods. Taxable equivalent interest income on earning assets increased $26.3 million or 48% between the nine-month periods, with $23.7 million more interest from loans ($22.6 million from greater volume and $1.1 million from rates (with $4.5 million in higher aggregate discount accretion income, including $3.2 million higher discount income related to favorably resolved purchased credit impaired loans, more than offsetting lower underlying loan yields mainly from the acquired portfolios))9%, $2.4 million more interest from total investments (mostly volume-based), and $0.2 million more interest from other earning assets. Interest expense increased $1.7 million, led by $1.9 million higher interest on interest-bearing liabilities due to volume and mix variances (mostly acquired deposits and a higher proportion of brokered deposits), partially offset by $0.2 million of net favorable rate variances due to lower cost funding (largely from lower-costing Baylake deposits acquired, offset partly by higher-costing First Menasha deposits acquired, an increase in select deposit rates that began in July 2017, and general rate pressures influenced by a 75 bps increase in the federal funds rate since January 1, 2016).
respectively, for first quarter 2023.40The taxable-equivalent net interest margin was 4.27% for the first nine months of 2017, up 28 bps versus the first nine months of 2016. The interest rate spread increased 2724 bps between the comparable three-month periods, withas the repricing of liabilities has slowed (with fewer interest rate increases during 2023 and none in 2024), while new and renewed loans continue to reprice in a favorable increase in the earninghigher interest rate environment. The interest-earning asset yield (up 25increased 95 bps to 4.69%5.44% for the first ninethree months of 2017)2024, due to the changing mix of interest-earning assets (noted above), as well as the higher interest rate environment. The loan yieldan improvement inrenewed loans, while the yield on investment securities increased 87 bps to 2.80%. The cost of funds (down 2increased 71 bps to 0.56%3.01% for first quarter 2024, also reflecting the first nine monthshigher interest rate environment as well as a migration of 2017).customer deposits into higher rate deposit products. The contribution from net free funds increased by 1 bp,11 bps, mostly due to lower costs on the funding side of the balance sheet. Since January 1, 2016, the Federal Reserve raised short-term interest rates by 75 bps to 125 bps as of September 30, 2017 (up 25 bps in each of December 2016, March 2017 and June 2017). These increases have impacted the rate earned on cash and the cost of shorter-term deposits and borrowings, but have not significantly influenced rates further out on the yield curve; and thus, have only minimally impacted new investment yields or new loan pricing. Additionally, while both 2017 and 2016 periods are experiencing favorable income from discount accretion on acquired loans, particularly where such loans pay or resolve at better than their carrying values, such favorable interest flow can be sporadic and will diminish over time.The earning asset yield was influenced largely by the mix of underlying earning assets, particularly carrying a higher proportion of loans and investments (each at higher yields in the 2017 period than the 2016 period) and a lower proportion of low-earning cash. Loans, investments and other interest earning assets (mostly low-earning cash) represented 80%, 18% and 2% of average earning assets, respectively, for the first nine months of 2017, and 78%, 17%, and 5%, respectively, for the comparable 2016 period. Loans yielded 5.26% and 5.13%, respectively, for the first nine months of 2017 and 2016, while non-loan earning assets combined yielded 2.32% and 1.95%, respectively, for the periods. The 13 bps increase in loan yield between the nine-month periods was largely due to the higher aggregate discount accretion on acquired loans between periods, more than offsetting lower underlying loan yields mainly fromvalue in the acquired loan portfolios and competitive pricing.Average interest-earning assets were $2.29 billioncurrent interest rate environment. As a result, the tax-equivalent net interest margin was 3.26% for the first nine months of 2017, $659 million, or 40% higher than the first nine months of 2016, largely attributable to acquired balances as well as strong organic loan growth. The change consisted of a $568 million increase in average loans (up 45% to $1.8 billion), a $127 million increase in investment securities (up 47% to $397 million) and a $36 million decrease in other interest-earning assets, predominantly low earning cash.Nicolet’s cost of funds decreased 2quarter 2024, up 35 bps to 0.56% for the first nine months of 2017 compared to a year ago. The average cost of interest-bearing deposits (which represented 96% of average interest-bearing liabilities2.91% for the nine months ended September 30, 2017 and 2016),first quarter 2023.0.42%$105 million for the first nine months of 2017, down 1 bp from the first nine months of 2016, largely benefiting from the lower-costing Baylake deposits acquired, offset partly by the higher-costing First Menasha deposits acquired, an increase in select deposit rates that began in July 2017, and general rate pressures influenced by a 75 bps increase in the federal funds rate since January 1, 2016.Average interest-bearing liabilities were $1.72 billion for the first nine months of 2017,quarter 2024, up $473$17 million or 38% from the comparable period in 2016, predominantly attributableof 2023, comprised of $3 million higher volumes and $14 million higher average rates. Interest income on loans increased $15 million over first quarter 2023, due to acquired balances. Interest-bearing deposits represented 96%higher rates from the rising interest rate environment, as well as solid loan growth. Interest expense increased to $41 million for first quarter 2024, up $11 million compared to first quarter 2023, mostly due to a higher cost of average interest-bearing liabilitiesfunds.the first nine months of 2017 and 2016, while the mix of average interest-bearing deposits moved from higher costing core CDs to lower costing transaction accounts, improving the overall deposit cost slightly between the nine-month periods. Average brokered deposits were $121Credit Lossesfirst ninethree months ended March 31, 2024 (entirely related to the ACL-Loans), compared to $3.1 million for the three months ended March 31, 2023 (comprised of 2017, up $92$0.8 million or 318% fromrelated to the comparable period in 2016, with average yields declining from 1.29% to 0.69%ACL-Loans and $2.3 million for the ACL on securities AFS). The increase in brokered deposits was partly due to brokered deposits assumed in the 2017 acquisition. The Company has reduced yields on these brokered deposits by repricing to market rates.Provision for Loan Lossesloancredit losses for the nine months ended September 30, 2017on loans was attributable to growth and 2016 was $1.9 million and $1.4 million, respectively, exceeding net charge offs of $1.1 million and $0.2 million, respectively. Asset quality measures have been strong and improving with continued resolutions of problem loans. The ALLL was $12.6 million (0.61% of loans) at September 30, 2017, compared to $11.8 million (0.75% of loans) at December 31, 2016 and $11.5 million (0.74% of loans) at September 30, 2016. The declinechanges in the ratiounderlying loan portfolio, while the 2023 provision for credit losses on securities AFS was due to the expected loss on a result of recording the acquired loan portfolios at fair value with no carryover of allowance at the time of each merger.loancredit losses is predominantly a function of Nicolet’s methodology and judgment as to qualitative and quantitative factors used to determine the adequacyappropriateness of the ALLL.ACL. The adequacyappropriateness of the ALLLACL-Loans is affected by changes in the size and character of the loan portfolio, changes in levels of impairedcollateral dependent and other nonperforming loans, historical losses and delinquencies in each portfolio segment, the risk inherent in specific loans, concentrations of loans to specific borrowers or industries, existing and future economic conditions, the fair value of underlying collateral, and other factors which could affect potentialexpected credit losses. The ACL for securities is affected by risk of the underlying issuer, while the ACL for unfunded commitments is affected by many of the same factors as the ACL-Loans, as well as funding assumptions relative to lines of credit. See also Note 5, “Loans, Allowance for Credit Losses - Loans, and Credit Quality” of the Notes to Unaudited Consolidated Financial Statements under Part I, Item 1, for additional disclosures. For additional information regarding asset quality and the ALLL,ACL-Loans, see “Balance Sheet Analysis“BALANCE SHEET ANALYSIS — Loans,” “— Allowance for Loan and LeaseCredit Losses - Loans,” and “— Impaired Loans and Nonperforming Assets.”416:4: Noninterest Income For the three months ended September 30, For the nine months ended September 30, 2017 2016 $ Change % Change 2017 2016 $ Change % Change (in thousands) Service charges on deposit accounts $ 1,238 $ 1,051 $ 187 17.8 % $ 3,367 $ 2,514 $ 853 33.9 % Mortgage income, net 1,774 2,010 (236 ) (11.7 ) 4,022 3,713 309 8.3 Trust services fee income 1,479 1,373 106 7.7 4,431 4,000 431 10.8 Brokerage fee income 1,500 992 508 51.2 4,192 2,090 2,102 100.6 BOLI income 459 318 141 44.3 1,314 880 434 49.3 Rent income 285 285 - - 852 820 32 3.9 Investment advisory fees 92 146 (54 ) (37.0 ) 357 341 16 4.7 Gain on sale or write-down of assets, net 1,305 453 852 188.1 2,071 548 1,523 277.9 Card interchange income 1,224 922 302 32.8 3,378 2,199 1,179 53.6 Other income 808 982 (174 ) (17.7 ) 2,034 1,675 359 21.4 Total noninterest income $ 10,164 $ 8,532 $ 1,632 19.1 % $ 26,018 $ 18,780 $ 7,238 38.5 % Noninterest income without net gains $ 8,859 $ 8,079 $ 780 9.7 % $ 23,947 $ 18,232 $ 5,715 31.3 % Components of the gain on sale or write-down of assets, net: Gain on sale of AFS securities, net $ 1,221 $ 37 $ 1,184 3200.0 % $ 1,220 $ 77 $ 1,143 1,484.4 % Gain on sale of OREO, net 84 439 (355 ) (80.9 ) 253 582 (329 ) (56.5 ) Write-down of OREO - - - - (126 ) - (126 ) N/M Gain/(loss) on sale or disposition of assets, net - (23 ) 23 N/M 724 (111 ) 835 752.3 Gain on sale or write-down of assets, net $ 1,305 $ 453 $ 852 188.1 % $ 2,071 $ 548 $ 1,523 277.9 % N/M means not meaningfulComparison of the nine months ending September 30, 2017 versus 2016Three Months Ended March 31, (in thousands) 2024 2023 $ Change % Change Trust services fee income $ 2,339 $ 2,033 $ 306 15 % Brokerage fee income 4,146 3,479 667 19 Wealth management fee income 6,485 5,512 973 18 Mortgage income, net 1,364 1,466 (102) (7) Service charges on deposit accounts 1,581 1,480 101 7 Card interchange income 3,098 3,033 65 2 BOLI income 1,347 1,200 147 12 Deferred compensation plan asset market valuations 59 946 (887) N/M LSR income, net 1,134 1,155 (21) (2) Other income 2,445 1,832 613 33 Subtotal 17,513 16,624 889 5 Asset gains (losses), net 1,909 (38,468) 40,377 N/M Total noninterest income $ 19,422 $ (21,844) $ 41,266 (189) % N/M means not meaningful. $26.0$19.4 million for the first ninethree months of 2017,2024, a favorable change of $41.3 million compared to $18.8 millionthe first three months of 2023, primarily due to the 2023 balance sheet repositioning. Excluding net asset gains (losses), noninterest income for the first ninethree months of 2016, aided largely by the 2016 acquisitions and, to2024 was $17.5 million, a lesser extent, the 2017 acquisition. Excluding net gains on sale or write-down of assets from both nine-month periods, noninterest income increased $5.7 million or 31.3%.The 2017 activity in net gain on sale or write-down of assets consisted of a $1.2 million gain to record the fair value of Nicolet’s pre-acquisition interest in First Menasha, a $0.3 million net gain on the sale of OREO, a $0.1 million write-down of OREO properties, and a $0.7 million gain on the sale or disposition of assets (consisting of $0.9 million of gain(5%) increase over the comparable period in 2023.sale two vacated bank branches, a $0.4 million loss from the transfer of bank branches to OREO, and a $0.2 million gain from the sale of an other investment). The 2016 activity included gains of $0.6 million from the sale of OREO properties.Service charges on deposit accounts were $3.4 million for the first ninethree months of 2017, up $0.9 million or 33.9% over the first nine months of 2016, resulting2023, on growth in accounts and assets under management (up 8% from an increased number of accounts mostly attributable to the bank acquisitions and an increase to the fee charged on overdrafts implemented in May 2017.representsincludes net gains received from the sale of residential real estate loans service-released and service-retained into the secondary market, capitalized mortgage servicing rights (“MSRs”MSR”), servicing fees offsettingnet of MSR amortization, fair value marks on the mortgage interest rate lock commitments and forward commitments (“mortgage derivatives”), and MSR valuation changes, if any, and to a smaller degree some related income.any. Net mortgage income increased $0.3of $1.4 million, or 8.3%decreased $0.1 million (7%) between the comparable nine-monththree-month periods, due to greaterchanges in the MSR valuation (first quarter 2023 included a $0.5 million recovery to the MSR valuation versus none in first quarter 2024), partly offset by higher secondary mortgage productionmarket volumes and sales aided by a broader geographic footprintthe related gains on sales. See also Note 6, “Goodwill and increased net servicing feesOther Intangibles and Servicing Rights” of the Notes to Unaudited Consolidated Financial Statements under Part I, Item 1, for additional disclosures on the growing portfolioMSR asset.mortgage loans serviced$2.4 million for others.Trust service fees werethe three months ended March 31, 2024 was up $0.4$0.6 million or 10.8% betweenfrom the nine-month periodscomparable 2023 period, largely due to higher assets under management. Between the nine-month periods, brokerage fees were up significantly, up $2.1 million or 100.6%, attributable to the 2016 financial advisor business acquisition as well as subsequent new growth and pricing.BOLI income was up $0.4 million or 49.3% between the nine-month periods, commensurate with the growth in average BOLI investments, including additional insurance purchases in 2016. Card interchange fees were up $1.2 million or 53.6% on higher volume and activity. Other noninterest income was $2.0 million, up $0.4 million or 21.4% over the comparable periodcard incentive income.2016 with income from equity in UFS, a data processing company acquired in the Baylake merger, up $0.3 million.42Noninterest ExpenseTable 7: Noninterest Expense For the three months ended September 30, For the nine months ended September 30, 2017 2016 $ Change % Change 2017 2016 $ Change % Change (in thousands) Personnel $ 11,488 $ 10,516 $ 972 9.2 % $ 32,404 $ 24,748 $ 7,656 30.9 % Occupancy, equipment and office 3,559 3,018 541 17.9 9,613 7,324 2,289 31.3 Business development and marketing 1,113 985 128 13.0 3,359 2,353 1,006 42.8 Data processing 2,238 1,831 407 22.2 6,428 4,408 2,020 45.8 FDIC assessments 205 247 (42 ) (17.0 ) 582 629 (47 ) (7.5 ) Intangibles amortization 1,173 1,172 1 0.1 3,514 2,295 1,219 53.1 Other expense 1,086 1,250 (164 ) (13.1 ) 3,598 4,799 (1,201 ) (25.0 ) Total noninterest expense $ 20,862 $ 19,019 $ 1,843 9.7 % $ 59,498 $ 46,556 $ 12,942 27.8 % Non-personnel expenses $ 9,374 $ 8,503 $ 871 10.2 % $ 27,094 $ 21,808 $ 5,286 24.2 % Comparison of the nine months ending September 30, 2017 versus 2016Total noninterest expense was $59.5$1.9 million for the first ninethree months of 2017 (including $0.5 million2024 were primarily attributable to non-recurring, merger-baseda $1.0 million gain on sale of an investment security and $0.9 million gain on the early extinguishment of Nicolet subordinated notes, while net asset losses of $38.5 million for the first three months of 2023 were primarily attributable to losses on the sale of approximately $500 million (par value) U.S. Treasury held to maturity securities as part of a balance sheet repositioning.Three Months Ended March 31, ($ in thousands) 2024 2023 Change % Change Personnel $ 26,510 $ 24,328 $ 2,182 9 % Occupancy, equipment and office 8,944 8,783 161 2 Business development and marketing 2,142 2,121 21 1 Data processing 4,270 3,988 282 7 Intangibles amortization 1,833 2,161 (328) (15) FDIC assessments 1,033 540 493 91 Merger-related expense — 163 (163) (100) Other expense 2,415 2,791 (376) (13) Total noninterest expense $ 47,147 $ 44,875 $ 2,272 5 % Non-personnel expenses $ 20,637 $ 20,547 $ 90 — % Average full-time equivalent (“FTE”) employees 948 943 5 1 % such as legal and conversion processing costs),combined increased $0.1 million compared to $46.6the first three months of 2023.2016 (including $2.6 million merger-related expenses, of which $1.7 million was a lease termination charge). Excluding the noted merger-based expenses from both periods, noninterest2023. Salary expense increased approximately $15.0$1.0 million or 34.2%, primarily attributable to the larger operating base as a result of the 2016 and 2017 acquisitions.Personnel expense was $32.4 million for(5%) over the first ninethree months of 2017, up $7.7 million or 30.9% compared to the first nine months of 2016, largely due to the expanded workforce, with average full time equivalent employees up 32% (from 393 to 519 for the first nine months of 2016 and 2017, respectively). Also contributing to the increase were2023, reflecting merit increases between the periods,years, higher incentives timing, equity grantscommensurate with current period earnings, and a slightly larger employee base (with average full-time equivalent employees up 1%). Fringe benefits increased $1.2 million over the first three months of 2023, mostly due to higher overall health care expenses. Salary expense was also impacted by the change in the second quarterfair value of 2017, and higher health and other benefits costs.$9.6$8.9 million for the first ninethree months of 2017,2024, up $2.3$0.2 million or 31.3%(2%) compared to 2016, primarily the resultfirst three months of the larger operating base2023, largely due to software and software needs, offset partly by branch closure savings.Business development and marketingtechnology solutions.increased $1.0was $4.3 million, or 42.8%,up $0.3 million (7%) between the comparable nine-monththree-month periods, largelymostly due to the expanded operating basevolume-based increases in core, brokerage, and branding efforts influencing additional marketing, promotions and media.Datacard processing expenses, which are primarily volume-based, rose $2.0charges. or 45.8% between the nine-monthcomparable three-month periods predominantly attributabledue to lower amortization from the acquisitions, higher card processing, and expanded functionalities. Intangible amortization increased $1.2aging intangibles.due exclusively to timing of and the addition of intangibles recorded as part of the acquisitions.Other noninterest expense decreased $1.2down $0.4 million or 25.0%(13%) between the nine-monthcomparable three-month periods, mostly due primarily to $2.1 million lower merger-related expenses, partially offset by a $0.9 million increase in all other costs, which were largely a function of higher other operating costs associated with size (such as OREO expenses, legal, audit and bank insurance costs) and a $0.4 million increase in 2017 associated with implementing the customer relationship system that began in the fourth quarter of 2016.For the nine-month periods ending September 30, 2017 and 2016, income$12.6$6.5 million and $6.4 million, respectively. The increase was primarily attributable(effective tax rate of 19.1%) for the first three months of 2024, compared to higher pre-tax income between the two periods. Included in 2017 is a tax benefit of $0.2$4.2 million related to the exercise(effective tax rate of stock options and restricted stock vesting in accordance with ASU 2016-09. U.S. GAAP requires that deferred income taxes be analyzed to determine if a valuation allowance is required. A valuation allowance is required if it is more likely than not that some portion of the deferred tax asset will not be realized. No valuation allowance was determined to be necessary as of September 30, 2017 or December 31, 2016.Comparison of the three months ending September 30, 2017 versus 2016Nicolet reported net income of $9.5 million for the three months ended September 30, 2017, up $3.0 million or 47% over $6.5 million32.0%) for the comparable period of 2016. Net2023. The change in income available to common shareholders for the third quarter of 2017tax was $9.5 million, or $0.91 per diluted common share, compared to net income available to common shareholders of $6.2 million, or $0.69 per diluted common share, for the third quarter of 2016.43Pre-tax earnings of the third quarter of 2016 was negatively impacted by $0.1 million merger-based expenses compared to no merger-based expense in the third quarter of 2017.Net interest income in the consolidated statements of income (which excludes any taxable equivalent adjustment) was $26.4 million in the third quarter of 2017 versus $20.9 million in the third quarter of 2016, including $0.4 million higher aggregate discount income between the periods. Taxable equivalent adjustments (adjustments to bring tax-exempt interest to a level that would yield the same after-tax income had that been subject to a 35% tax rate) were $0.6 million in each of the three months ended September 30, 2017 and 2016, resulting in taxable equivalent net interest income of $27.0 million and $21.5 million, respectively. Taxable equivalent net interest income for third quarter 2017 was up $5.5 million or 26% versus third quarter 2016, with $6.0 million of the increase due to net favorable volume variances (predominatelymostly due to the First Menashafirst quarter 2023 pretax loss, and also reflects the lower effective tax rate beginning in the second half of 2023 related to the Wisconsin tax law change noted above in the “Performance Summary” section.includedwere $8.4 billion, down slightly ($22 million) from December 31, 2023, mostly lower cash balances, partly offset by growth in 2017 but notloans. Total loans increased $44 million (1%) from December 31, 2023, with growth in 2016),agricultural, commercial and $0.5industrial, and residential real estate loans. Total deposits of $7.2 billion at March 31, 2024, decreased $32 million lower net interest income from net unfavorable rate variances (especially from higher costing deposits).The earning asset yieldDecember 31, 2023, mostly noninterest-bearing demand deposits. Total stockholders’ equity was 4.72% for third quarter 2017, 15 bps higher than third quarter 2016, mainly due to a higher mix$1.1 billion at March 31, 2024, an increase of loans as a percent of earning assets. Loans earned 5.29% and represented 81% of average earning assets for third quarter 2017, compared to 5.32% and 78%, respectively, for third quarter 2016. The 3 bps decrease in loan yield between the three-month periods was negatively impacted$25 million over December 31, 2023, with earnings partly offset by the underlying rate pressure on loan yields from competitionquarterly dividend payment.the flatter yield curve environment, partiallycash balances partly offset by higher aggregate discount accretion on loans. Non-loan earning assets which earn less than loan assets represented 19% of average earning assets for third quarter 2017 (including higher low-earning cash)investment securities maturities and earned 2.24%paydowns. Total loans increased $174 million (3%), versus 22% of earning assets yielding 2.03% for third quarter 2016.The cost of funds was 0.65% for third quarter 2017, 15 bps higher than third quarter 2016, drivenprimarily in residential mortgage and agricultural loans, while total deposits increased $237 million from March 31, 2023, with growth in time and money market deposits partly offset by an increase in the cost of deposits (up 16 bps to 0.53% for third quarter 2017), mostlylower noninterest-bearing demand deposits. Stockholders’ equity increased $102 million from higher-costing First Menasha deposits acquiredMarch 31, 2023, with solid net income and an increase in select deposit rates that began in July 2017. The cost of other interest-bearing liabilities decreased 131 bps to 4.04% between the third quarter periods, mostly due to a higher proportion of lower-cost, shorter term funding in the mix.Noninterest income was $10.2 million for third quarter 2017, up $1.6 million over the third quarter 2016. Noninterest income withoutfavorable net gains was up $0.8 million or 10%, with service charges on deposits up $0.2 million (given the larger deposit base), and trust and brokerage fees up $0.6 million combined (mostly attributable to the 2016 financial advisor business acquisition and market improvements). Card interchange income was up $0.3 million on greater activity. Other income decreased $0.2 million between the third quarter periods, although there was an increase in UFS, Inc. income of $0.1 million. Net gain on sale or write-down of assets increased by $0.9 million between the third quarter periods, mostly due to a $1.2 million gain to record the fair value of Nicolet’s pre-acquisition interest in First Menasha in the third quarter of 2017.Noninterest expense was $20.9 million for the third quarter of 2017, up $1.8 million or 9.7% from third quarter 2016. There were no non-recurring merger-based expenses in the third quarter 2017 compared to $0.1 million in the third quarter of 2016. Excluding the noted merger-based expenses, noninterest expense increased approximately $1.9 million or 10.2%. Salaries and employee benefits for the third quarter of 2017 were $11.5 million, $1.0 million or 9.2% higher than the third quarter of 2016, due to merit increases, higher equity award costs, and an increase in average full time equivalent employees attributable to the 2017 acquisition. Occupancy, equipment and office expense was $0.6 million higher due to the larger operating base and software needs. Data processing was $0.4 million higher than third quarter 2016 from increased accounts, higher card processing costs and expanded functionalities.The provision for loan losses was $1.0 million and $0.5 million for third quarter 2017 and 2016, respectively. Net charge-offs for the quarter ending September 30, 2017 were $1.1 million (due to the charge off of a large commercial loan) compared to a net recovery of $0.1 million for the third quarter of 2016. At September 30, 2017, the ALLL was $12.6 million (or 0.61% of total loans) compared to $11.5 million (or 0.74% of total loans) at September 30, 2016. The decline in the ratio was a result of recording the First Menasha loan portfolio at fair value with no carryover of their allowance at the time of the merger.Income tax expense was $5.1 million and $3.4 million for the third quarters of 2017 and 2016, respectively. The effective tax rates were 34.9% for third quarter 2017 and 34.5% for third quarter 2016.BALANCE SHEET ANALYSISNortheastWisconsin, Michigan and Central Wisconsin and in Menominee, Michigan including the following industries: manufacturing, agriculture, wholesaling, retail, service, and businesses supporting, among others, the general building and paper industries. It continues toMinnesota. We concentrate its efforts inon originating loans in itsour local markets and assisting its current loan customers. ItNicolet actively utilizes government loan programs such as those provided by the U.S. Small Business Administration (“SBA”) and the U.S. Department of Agriculture’s Farm Service Agency (“FSA”).help customers weather current economic conditionsensure that sound and position their businesses for the future.44Nicolet’s primary lending functionconsistent credit decisions are made. The credit management process is to make 1) commercial loans, consisting of commercialregularly reviewed and industrial business loans, agricultural (“AG”) production, and owner-occupied commercial real estate (“CRE”) loans; 2) CRE loans, consisting of commercial investment real estate loans, AG real estate, and construction and land development loans; 3) residential real estate loans, including residential first mortgages, residential junior mortgages (such as home equity loans and lines), and residential construction loans; and 4) retail and other loans. Using these four broad groups the mix of loans at September 30, 2017 was 53% commercial, 22% CRE loans, 24% residential real estate, and 1% retail and other loans; and grouped further the loan mix was 75% commercial-based and 25% retail-based.Total loans were $2.1 billion at September 30, 2017 compared to $1.6 billion at December 31, 2016. Compared to September 30, 2016, loans grew $497 million or 32%, primarily as a result of the $351 million loans added from First Menasha at acquisition in April 2017 and also through strong organic growth. On average, loans were $1.8 billion and $1.3 billion for the first nine months of 2017 and 2016, respectively, up 45%, largely attributable to the timing of inclusion of acquired loans. At the time of the merger, the acquired First Menasha loan portfolio was somewhat similar to Nicolet’s pre-merger loan mix, with the most notable differences being a higher mix in CRE investment and a lower mix in commercial and industrial loans. The majority of organic growth experienced in the first nine months of 2017 has been in commercial and industrial loans.Table 8: Period End Loan Composition September 30, 2017 December 31, 2016 September 30, 2016 Amount % of
Total Amount % of
Total Amount % of
Total Commercial & industrial $ 625,729 30.5 % $ 428,270 27.3 % $ 423,790 27.3 % Owner-occupied CRE 428,054 20.9 360,227 23.0 362,554 23.3 AG production 36,352 1.8 34,767 2.2 34,077 2.2 AG real estate 48,443 2.4 45,234 2.9 45,671 2.9 CRE investment 303,448 14.8 195,879 12.5 197,884 12.7 Construction & land development 87,649 4.3 74,988 4.8 68,161 4.4 Residential construction 33,163 1.6 23,392 1.5 27,331 1.8 Residential first mortgage 363,116 17.7 300,304 19.1 284,653 18.3 Residential junior mortgage 102,654 5.0 91,331 5.8 95,901 6.2 Retail & other 22,514 1.0 14,515 0.9 14,102 0.9 Total loans $ 2,051,122 100.0 $ 1,568,907 100.0 % $ 1,554,124 100.0 % Broadly, loans were 75% commercial-based and 25% retail-based at September 30, 2017 comparedmodified over the past several years to 73% commercial-based and 27% retail-based at December 31, 2016. Commercial-based loans are considered to have more inherent risk of default than retail-based loans, in part because offurther strengthen the broader list of factors that could impact a commercial borrower negatively as well as the commercial balance per borrower is typically larger than that for retail-based loans, implying higher potential losses on an individual customer basis.Commercial and industrial loans consist primarily of commercial loans to small businesses within a diverse range of industries and, to a lesser degree, to municipalities. The credit risk related to commercial and industrial loans is largely influenced by general economic conditions and the resulting impact on a borrower’s operations, or on the value of underlying collateral, if any. Commercial and industrial loans increased $197 million to $626 million since year end 2016, largely attributable to acquired First Menasha loans and strong organic growth. Commercial and industrial loans continue to be the largest segment of Nicolet’s portfolio and increased to 30.5% of the total portfolio at September 30, 2017, up from 27.3% at December 31, 2016.Owner-occupied CRE loans decreased to 20.9% of loans at September 30, 2017 from 23.0% at December 31, 2016. Owner-occupied CRE loans primarily consist of loans within a diverse range of industries secured by business real estate that is occupied by borrowers (i.e. who operate their businesses out of the underlying collateral) and who may also have commercial and industrial loans. The credit risk related to owner-occupied CRE loans is largely influenced by general economic conditions and the resulting impact on a borrower’s operations, or on the value of underlying collateral.AG production and AG real estate loans combined consist of loans secured by farmland and related farming operations. The credit risk related to agricultural loans is largely influenced by the prices farmers can get for their production and/or the underlying value of the farmland. In total, agricultural loans increased $5 million since year end 2016, representing 4.2% of total loans at September 30, 2017, versus 5.1% at December 31, 2016.45The CRE investment loan classification primarily includes commercial-based mortgage loans that are secured by non-owner occupied, nonfarm/nonresidential real estate properties, and multi-family residential properties. Lending in this segment has been focused on loans that are secured by commercial income-producing properties as opposed to speculative real estate development. The balance of these loans increased $108 million since year end 2016, largely attributable to the acquired First Menasha loan mix, representing 14.8% of total loans at September 30, 2017 compared to 12.5% of total loans at December 31, 2016.Loans in the construction and land development portfolio provide financing for the development of commercial income properties, multi-family residential development, and land designated for future development. Nicolet controls the credit risk on these types of loans by making loans in familiar markets, reviewing the merits of individual projects, controlling loan structure, and monitoring the progress of projects through the analysis of construction advances. Credit risk is managed by employing sound underwriting guidelines, lending primarily to borrowers in local markets, periodically evaluating the underlying collateral, and formally reviewing the borrower’s financial soundness and relationships on an ongoing basis. Lending on originated loans in this category has remained relatively steady as a percent of loans. Since December 31, 2016, balances have increased $13 million, and this category represented 4.3% and 4.8% of total loans at September 30, 2017 and year-end 2016, respectively.On a combined basis, Nicolet’s residential real estate loans represent 24.3% of total loans at September 30, 2017, down from 26.4% at December 31, 2016. Residential first mortgage loans include conventional first-lien home mortgages. Residential junior mortgage real estate loans consist mainly of home equity lines and term loans secured by junior mortgage liens. Across the industry, home equities generally involve loans that are in second or junior lien positions, but Nicolet has secured many such loans in a first lien position, further mitigating the portfolio risks. Nicolet has not experienced significant losses in its residential real estate loans; however, if market values in the residential real estate markets decline, particularly in Nicolet’s market area, rising loan-to-value ratios could cause an increase in the provision for loan losses. As part of its management of originating residential mortgage loans, the vast majority of Nicolet’s long-term, fixed-rate residential real estate mortgage loans are sold in the secondary market without retaining the servicing rights. Mortgage loans retained in the portfolio are typically of high quality and have historically had low net charge off rates.Loans in the retail and other classification represent less than 1% of the total loan portfolio, and include predominantly short-term and other personal installment loans not secured by real estate. Credit risk is primarily controlled by reviewing the creditworthiness of the borrowers, monitoring payment histories, and taking appropriate collateral and/or guaranty positions. The loan balances in this portfolio increased $8 million from December 31, 2016 to September 30, 2017.adequate ALLL,appropriate ACL-Loans, and sound nonaccrual and charge-off policies. An activemanagement processare described in Note 1, “Nature of Business and Significant Accounting Policies,” of the Notes to Consolidated Financial Statements, included in Part II, Item 8 of the Company’s 2023 Annual Report on Form 10-K.March 31, 2024 December 31, 2023 March 31, 2023 (in thousands) Amount % of Total Amount % of Total Amount % of Total Commercial & industrial $ 1,307,490 20 % $ 1,284,009 20 % $ 1,330,052 21 % Owner-occupied CRE 955,786 15 956,594 15 969,064 16 Agricultural 1,190,371 19 1,161,531 18 1,065,909 17 Commercial 3,453,647 54 3,402,134 53 3,365,025 54 CRE investment 1,188,722 18 1,142,251 18 1,146,388 19 Construction & land development 241,730 4 310,110 5 333,370 5 Commercial real estate 1,430,452 22 1,452,361 23 1,479,758 24 Commercial-based loans 4,884,099 76 4,854,495 76 4,844,783 78 Residential construction 84,370 2 75,726 1 134,782 2 Residential first mortgage 1,167,069 18 1,167,109 19 1,014,166 16 Residential junior mortgage 206,434 3 200,884 3 177,026 3 Residential real estate 1,457,873 23 1,443,719 23 1,325,974 21 Retail & other 55,645 1 55,728 1 52,975 1 Retail-based loans 1,513,518 24 1,499,447 24 1,378,949 22 Total loans $ 6,397,617 100 % $ 6,353,942 100 % $ 6,223,732 100 % usedtypically larger than that for commercialretail-based loans, to further ensure that sound and consistent credit decisions are made. The credit management processimplying higher potential losses on an individual customer basis. Credit risk on commercial-based loans is regularly reviewedlargely influenced by general economic conditions and the process has been modified overresulting impact on a borrower’s operations or on the past several years to further strengthenvalue of underlying collateral, if any.controls.by typesand included the following industries: manufacturing, wholesaling, paper, packaging, food production and processing, agriculture, forest products, hospitality, retail, service, and businesses supporting the general building industry. The following chart provides the industry distribution of borrowers, industry groups, and market areas. Significantour commercial loan concentrations are consideredportfolio at March 31, 2024.Commercial Loan Portfolio by Industry Type (based on NAICS codes) 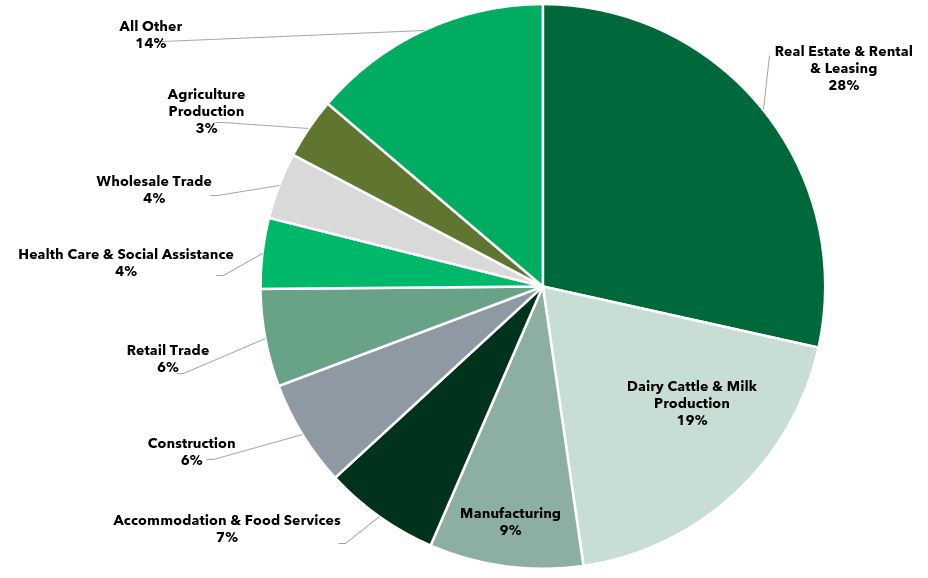
As of March 31, 2024 Loan Maturity (in thousands) One Year
or LessAfter One Year
to Five YearsAfter Five Years to Fifteen Years After Fifteen Years Total Commercial & industrial $ 488,465 $ 677,297 $ 130,152 $ 11,576 $ 1,307,490 Owner-occupied CRE 108,932 657,026 155,637 34,191 955,786 Agricultural 440,731 371,092 338,745 39,803 1,190,371 CRE investment 164,539 768,889 229,804 25,490 1,188,722 Construction & land development 55,502 139,010 36,919 10,299 241,730 Residential construction * 42,729 8,461 849 32,331 84,370 Residential first mortgage 29,971 261,617 171,796 703,685 1,167,069 Residential junior mortgage 20,616 16,909 36,286 132,623 206,434 Retail & other 31,030 12,400 8,507 3,708 55,645 Total loans $ 1,382,515 $ 2,912,701 $ 1,108,695 $ 993,706 $ 6,397,617 Percent by maturity distribution 22 % 46 % 17 % 15 % 100 % Total fixed rate loans $ 629,377 $ 2,653,059 $ 716,811 $ 323,819 $ 4,323,066 Total floating rate loans $ 753,138 $ 259,642 $ 391,884 $ 669,887 $ 2,074,551 As of December 31, 2023 Loan Maturity (in thousands) One Year
or LessAfter One Year
to Five YearsAfter Five Years to Fifteen Years After Fifteen Years Total Commercial & industrial $ 444,176 $ 691,364 $ 137,823 $ 10,646 $ 1,284,009 Owner-occupied CRE 85,945 663,791 179,103 27,755 956,594 Agricultural 441,792 335,670 343,717 40,352 1,161,531 CRE investment 120,674 789,093 206,789 25,695 1,142,251 Construction & land development 44,467 169,343 80,015 16,285 310,110 Residential construction * 31,777 7,832 766 35,351 75,726 Residential first mortgage 25,996 268,442 178,786 693,885 1,167,109 Residential junior mortgage 14,709 18,878 36,548 130,749 200,884 Retail & other 30,799 12,637 8,319 3,973 55,728 Total loans $ 1,240,335 $ 2,957,050 $ 1,171,866 $ 984,691 $ 6,353,942 Percent by maturity distribution 20 % 47 % 18 % 15 % 100 % Total fixed rate loans $ 547,023 $ 2,718,410 $ 794,080 $ 326,346 $ 4,385,859 Total floating rate loans $ 693,312 $ 238,640 $ 377,786 $ 658,345 $ 1,968,083 exist for a financial institution when there are amounts loaned to multiple numbers of borrowers engaged in similar activities that would cause them to be similarly impacted by economic or other conditions. At September 30, 2017, no significant industry concentrations existed in Nicolet’s portfolio in excess of 25% of total loans. Nicolet has also developed guidelines to manage its exposure to various types of concentration risks.Loan and LeaseCredit LossesIn addition to - Loansdiscussion that follows,allowance for credit losses, see also Note 1, “Basis of Presentation,” and Note 6,5, “Loans, Allowance for LoanCredit Losses - Loans, and Credit Quality,” in the notesNotes to Unaudited Consolidated Financial Statements under Part I, Item 1. A detailed discussion of the unaudited consolidated financial statementsloan portfolio accounting policies, general loan portfolio characteristics, and credit risk are described in Note 1, “Nature of Business and Significant Accounting Policies,” of the “Critical Accounting Policies” within management’s discussion and analysis.type as described under “Balance Sheet Analysis-Loans.”type. Credit risk is controlled and monitored through the use of lending standards, a thorough review of potential borrowers, and on-goingongoing review of loan payment performance. Active asset quality administration, including early problem loan identification and timely resolution of problems, aids in the management of credit risk and minimization of loan losses.
Loans charged off are subject to continuous review, and specific efforts are taken to achieve maximum recovery of principal, interest, and related expenses. For additional information regarding nonperforming assets see also “BALANCE SHEET ANALYSIS – Nonperforming Assets.”46ALLL is established through a provision for loan losses charged to expense to appropriately provide for potentialACL-Loans represents management’s estimate of expected credit losses in the existing loan portfolio. Loans are charged off against the ALLL when management believes that the collection of principal is unlikely. The level of the ALLL represents management’s estimate of an amount of reserves that provides for estimated probable credit losses in theCompany’s loan portfolio at the balance sheet date. To assess the ALLL,overall appropriateness of the ACL-Loans, management applies an allocation methodology is applied by Nicolet which focuses on evaluation of qualitative and environmental factors, including but not limited to: (i) evaluation of facts and issues related to specific loans; (ii) management’s ongoing review and grading of the loan portfolio; (iii) consideration of historical loan loss and delinquency experience on each portfolio segment; (iv) trends in past due and nonperformingnonaccrual loans; (v) the risk characteristics of the various loan segments; (vi) changes in the size and character of the loan portfolio; (vii) concentrations of loans to specific borrowers or industries; (viii) existing and forecasted economic conditions; (ix) the fair value of underlying collateral; and (x)potentialexpected credit losses. Nicolet’s methodology reflects guidance by regulatory agencies to all financial institutions.ALLLACL-Loans by pools of risk within each loan portfolio segment. The allocation methodology consists of the following components. First, a specific reserve for the estimated shortfall is established for allindividually evaluated credit deteriorated loans, determined to be impaired.which management defines as nonaccrual credit relationships over $250,000, collateral dependent loans, purchased credit deteriorated loans, and other loans with evidence of credit deterioration. The specific reserve in the ALLLACL-Loans for these credit deteriorated loans is equal to the aggregate collateral or discounted cash flow shortfall calculated from the impairment analyses. Loans measured for impairment include nonaccrual loans, non-performing troubled debt-restructurings (“restructured loans”), or other loans determined to be impaired by management.shortfall. Second, Nicolet’s management allocates ALLLthe ACL-Loans with historical loss rates by loan segment. The loss factors are measured on a quarterly basis and applied in the methodology are periodically re-evaluatedto each loan segment based on current loan balances and adjusted to reflect changes in historical loss levels on an annual basis. The look-back period on which the average historical loss rates are determined is a rolling 20-quarter (5 year) average. Lastly,projected for their expected remaining life. Next, management allocates ALLL to the remaining loan portfolioACL-Loans using the qualitative and environmental factors mentioned above. Consideration is given to those current qualitative or environmental factors that are likely to cause estimated credit losses as ofat the evaluation date to differ from the historical loss experience of each loan segment. Management conducts its allocation methodology on bothLastly, management considers reasonable and supportable forecasts to assess the originated loans and on the acquired loans separately to account for differences, such as different loss histories and qualitative factors, between the two segments.analysesanalysis of itsthe loan portfolio to allow for early identification of customers experiencing financial difficulties, maintains prudent underwriting standards, understands the economy inof its markets, and considers the trend of deterioration in loan quality in establishing the level of the ALLL.Consolidated net income and stockholders’ equity could be affected if management’s estimate of the ALLL necessary to cover expected losses is subsequently materially different, requiring a change in the level of provision for loan losses to be recorded. While management uses currently available information to recognize losses on loans, future adjustments to the ALLL may be necessary based on newly received appraisals, updated commercial customer financial statements, rapidly deteriorating customer cash flow, and changes in economic conditions that affect Nicolet’s customers. As an integral part of their examination process, federalACL-Loans. In addition, various regulatory agencies alsoperiodically review the ALLL. Such agenciesACL-Loans, and may require the Company to make additions to the ALLLACL-Loans or may require that certain loan balances be charged-offcharged off or downgraded into criticizedclassified loan categories when their credit evaluations differ from those of management based on their judgments aboutof collectability from information available to them at the time of their examination.September 30, 2017,March 31, 2024, the ALLLACL-Loans was $12.6$64 million compared to $11.8(representing 1.01% of period end loans), minimally changed from $64 million (or 1.00% of period end loans) at December 31, 2016.2023 and up from $62 million (or 1.00% of period end loans) at March 31, 2023. The nine-month increase was a result of a 2017 provision of $1.9 million exceeding 2017 net charge offs of $1.1 million. Comparatively, the provision for loan losses in the first nine months of 2016 was $1.4 million and net charge offs were $0.2 million. Annualized net charge offs as a percent of average loans were 0.08% in the first nine months of 2017 compared to 0.02% for the first nine months of 2016 and 0.02% for the entire 2016 year. Loans charged off are subject to continuous review, and specific efforts are taken to achieve maximum recovery of principal, accrued interest, and related expenses. The levelcomponents of the provision for loan losses is directly correlated to the assessment of the adequacy of the allowance, including, but not limited to, consideration of the amount of net charge-offs, loan growth, levels of nonperforming loans, and trends in the risk profile of the loan portfolio.The ratio of the ALLL as a percentage of period-end loans was 0.61% at September 30, 2017 (with a 0.89% ratio on originated loans and a 0.25% ratio on acquired loans) compared to 0.75% at December 31, 2016 (with a 1.05% ratio on originated loans and a 0.36% ratio on acquired loans). The ALLL to loans ratio is impacted by the accounting treatment of Nicolet’s 2013, 2016 and 2017 bank acquisitions, which combined at their acquisition dates added no ALLL to the numerator and $1.3 billion of loans into the denominator. Acquired loans were $885 million and $667 million at September 30, 2017 and December 31, 2016, respectively, representing 43% of total loans at both September 30, 2017 and December 31, 2016. The change in the ALLL to loans ratio was driven by the increase in the denominator from acquired loans in 2016 and 2017.The largest portions of the ALLL were allocated to commercial & industrial (“C&I”) loans and owner-occupied CRE loans combined, representing 60.9% and 57.5% of the ALLL at September 30, 2017 and December 31, 2016, respectively. Most notably since December 31, 2016, the increased allocations to C&I (from 33.2% to 39.9%), and the decreased allocation in owner-occupied CRE investment (from 24.3% to 21.0%) was largely the result of changes to allowance allocations in conjunction with changes in past due and loss histories and balance mix changes. The large $1.0 million charge-off in the third quarter of 2017 was an originated C&I loan.47Table 9: Loan Loss Experience For the nine months ended Year ended (in thousands) September 30,
2017 September 30,
2016 December 31,
2016 Allowance for loan losses (ALLL): Balance at beginning of period $ 11,820 $ 10,307 $ 10,307 Provision for loan losses 1,875 1,350 1,800 Charge-offs (1,156 ) 432 (584 ) Recoveries 71 (256 ) 297 Net charge-offs (1,085 ) 176 (287 ) Balance at end of period $ 12,610 $ 11,481 $ 11,820 Net loan charge-offs (recoveries): Commercial & industrial $ 1,077 $ 262 $ 253 Owner-occupied CRE (29 ) 58 103 Agricultural production - - - Agricultural real estate - - - CRE investment (1 ) (221 ) (221 ) Construction & land development 13 - - Residential construction - - - Residential first mortgage 2 (5 ) 49 Residential junior mortgage (2 ) 46 49 Retail & other 25 36 54 Total net loans charged-off $ 1,085 $ 176 $ 287 ALLL to total loans 0.61 % 0.74 % 0.75 % ALLL to net charge-offs 1,162.2 % 6,523.3 % 4,118.5 % Net charge-offs to average loans, annualized 0.08 % 0.02 % 0.02 % The allocation of the ALLL is based on Nicolet’s estimate of loss exposure by category of loans and is shownACL-Loans are detailed further in Table 10 for September 30, 2017 and December 31, 2016.
8 below.4810: Allocation of the8: Allowance for LoanCredit Losses(in thousands) September 30, 2017 % of Loan
Type to
Total
Loans December 31, 2016 % of Loan
Type to
Total
Loans ALLL allocation Commercial & industrial $ 5,025 30.5 % $ 3,919 27.3 % Owner-occupied CRE 2,643 20.9 2,867 23.0 Agricultural production 166 1.8 150 2.2 Agricultural real estate 268 2.4 285 2.9 CRE investment 1,257 14.8 1,124 12.5 Construction & land development 742 4.3 774 4.8 Residential construction 167 1.6 304 1.5 Residential first mortgage 1,658 17.7 1,784 19.1 Residential junior mortgage 467 5.0 461 5.8 Retail & other 217 1.0 152 0.9 Total ALLL $ 12,610 100.0 % $ 11,820 100.0 % ALLL category as a percent of total ALLL: Commercial & industrial 39.9 % 33.2 % Owner-occupied CRE 21.0 24.3 Agricultural production 1.3 1.3 Agricultural real estate 2.1 2.4 CRE investment 10.0 9.5 Construction & land development 5.9 6.5 Residential construction 1.3 2.6 Residential first mortgage 13.1 15.1 Residential junior mortgage 3.7 3.9 Retail & other 1.7 1.2 Total ALLL 100.0 % 100.0 % Impaired - Loans and Three Months Ended Year Ended (in thousands) March 31, 2024 March 31, 2023 December 31, 2023 ACL-Loans: Balance at beginning of period $ 63,610 $ 61,829 $ 61,829 Provision for credit losses 750 750 2,650 Charge-offs (216) (184) (1,653) Recoveries 203 17 784 Net (charge-offs) recoveries (13) (167) (869) Balance at end of period $ 64,347 $ 62,412 $ 63,610 Net loan (charge-offs) recoveries: Commercial & industrial $ (75) $ (108) $ 80 Owner-occupied CRE 162 — (526) Agricultural — 2 (63) CRE investment — — — Construction & land development — — — Residential construction — — — Residential first mortgage — 1 (2) Residential junior mortgage 3 — (95) Retail & other (103) (62) (263) Total net (charge-offs) recoveries $ (13) $ (167) $ (869) Ratios: ACL-Loans to total loans 1.01 % 1.00 % 1.00 % Net charge-offs to average loans, annualized 0.00 % 0.01 % 0.01 % Nicolet’s management has beenis committed to an aggressive problem loan identification philosophy. This philosophy has been implemented through the ongoing monitoring and review of all pools of risk in the loan portfolio to ensure thatidentify problem loans are identified early and minimize the risk of loss is minimized. including those defined as impaired under current accounting standards, and loans 90 days or more past due but still accruing interest. Loans are generally placed on nonaccrual status when contractually past due 90 days or more as to interest or principal payments. Additionally, whenever management becomes aware of facts or circumstances that may adversely impact the collectability of principal or interest on loans, it is management’s practice to place such loans on nonaccrual status immediately. Nonaccrual loans were $14.4 million (consisting of $1.0 million originated loans and $13.4 million acquired loans) at September 30, 2017 compared to $20.3 million at December 31, 2016 (consisting of $0.3 million originated loans and $20.0 million acquired loans). Nonperforming assets (which include nonperforming loans and other real estate owned “OREO”(“OREO”). At March 31, 2024, nonperforming assets were $15.7$28 million at September 30, 2017 compared to $22.3 million at December 31, 2016. OREO was $1.3 million at September 30, 2017, down from $2.1 million at year end 2016, the majority of which is closed bank branch property. Nonperforming assets as a percentand represented 0.33% of total assets, were 0.55% at September 30, 2017 compared to 0.97% atunchanged from December 31, 2016.adequacyappropriate level of the ALLL.ACL-Loans. Potential problem loans are generally defined by management to include loans rated as Substandard by management but that are in performing status; however, there are circumstances present which might adversely affect the ability of the borrower to comply with present repayment terms. The decision of management to include performing loans in potential problem loans does not necessarily mean that Nicolet expects losses to occur, but that management recognizes a higher degree of risk associated with these loans. The loans that have been reported as potential problem loans are predominantly commercial-based loans covering a diverse range of businesses and real estate property types. Potential problem loans were $14.1$67 million (0.7%(1% of loans) and $12.6$68 million (0.8%(1% of loans) at September 30, 2017March 31, 2024 and December 31, 2016,2023, respectively. Potential problem loans require a heightened management review ofgiven the pace at which a credit may deteriorate, the potential duration of asset quality stress, and uncertainty around the magnitude and scope of economic stress that may be felt by Nicolet’s customers and on underlying real estate values.4911:9: Nonperforming Assets(in thousands) September 30,
2017 December 31,
2016 September 30,
2016 Nonaccrual loans: Commercial & industrial $ 5,078 $ 358 $ 680 Owner-occupied CRE 1,276 2,894 2,986 AG production 2 9 23 AG real estate 186 208 208 CRE investment 4,537 12,317 13,216 Construction & land development 723 1,193 1,220 Residential construction 80 260 287 Residential first mortgage 2,301 2,990 2,656 Residential junior mortgage 239 56 212 Retail & other — — — Total nonaccrual loans 14,422 20,285 21,488 Accruing loans past due 90 days or more — — — Total nonperforming loans $ 14,422 $ 20,285 $ 21,488 OREO: Commercial & industrial $ — $ 64 $ 64 Owner-occupied CRE 25 304 278 CRE investment 160 — — Construction & land development 90 623 651 Residential real estate owned — 29 109 Bank property real estate owned 1,039 1,039 1,087 Total OREO 1,314 2,059 2,189 Total nonperforming assets $ 15,736 $ 22,344 $ 23,677 Total restructured loans accruing $ — $ — $ — Ratios Nonperforming loans to total loans 0.70 % 1.29 % 1.38 % Nonperforming assets to total loans plus OREO 0.77 % 1.42 % 1.52 % Nonperforming assets to total assets 0.55 % 0.97 % 1.04 % ALLL to nonperforming loans 87.4 % 58.3 % 53.4 % ALLL to total loans 0.61 % 0.75 % 0.74 % Table 12: Investment Securities Portfolio September 30, 2017 December 31, 2016 (in thousands) Amortized
Cost Fair
Value %of
Fair
Value Amortized
Cost Fair
Value %of
Fair
Value U.S. government sponsored enterprises $ 26,394 $ 26,272 6 % $ 1,981 $ 1,963 1 % State, county and municipals 189,226 188,716 46 191,721 187,243 51 Mortgage-backed securities 159,113 157,936 39 161,309 159,129 44 Corporate debt securities 32,203 32,744 8 12,117 12,169 3 Equity securities 1,288 2,549 1 2,631 4,783 1 Total $ 408,224 $ 408,217 100 % $ 369,759 $ 365,287 100 % At September 30, 2017 the total carrying value of investment securities was $408.2 million, up from $365.3 million at December 31, 2016, and represented 14.3% and 15.9% of total assets at September 30, 2017 and December 31, 2016, respectively. The increase since year end 2016 was largely attributable to investment securities added from First Menasha at acquisition in April 2017 as well as purchase activity. At September 30, 2017, the securities portfolio did not contain securities of any single issuer that were payable from and secured by the same source of revenue or taxing authority where the aggregate carrying value of such securities exceeded 10% of stockholders’ equity.50(in thousands) March 31, 2024 December 31, 2023 March 31, 2023 Nonperforming loans: Commercial & industrial $ 3,761 $ 4,046 $ 2,874 Owner-occupied CRE 4,721 4,399 7,128 Agricultural 12,418 12,185 18,782 Commercial 20,900 20,630 28,784 CRE investment 1,430 1,453 4,126 Construction & land development 10 161 748 Commercial real estate 1,440 1,614 4,874 Commercial-based loans 22,340 22,244 33,658 Residential construction — — — Residential first mortgage 3,983 4,059 4,986 Residential junior mortgage 171 150 196 Residential real estate 4,154 4,209 5,182 Retail & other 183 172 55 Retail-based loans 4,337 4,381 5,237 Total nonaccrual loans 26,677 26,625 38,895 Accruing loans past due 90 days or more — — — Total nonperforming loans $ 26,677 $ 26,625 $ 38,895 Nonaccrual loans (included above) covered by guarantees $ 6,088 $ 5,785 $ 5,372 OREO: Commercial real estate owned $ 305 $ 305 $ 628 Residential real estate owned 132 154 — Bank property real estate owned 808 808 1,347 Total OREO 1,245 1,267 1,975 Total nonperforming assets $ 27,922 $ 27,892 $ 40,870 Ratios: Nonperforming loans to total loans 0.42 % 0.42 % 0.62 % Nonperforming assets to total loans plus OREO 0.44 % 0.44 % 0.66 % Nonperforming assets to total assets 0.33 % 0.33 % 0.50 % ACL-Loans to nonperforming loans 241 % 239 % 160 % In addition to securities available for sale, Nicolet has other investments, consisting of capital stock in the Federal Reserve and the FHLB (required as members of the Federal Reserve Bank System and the Federal Home Loan Bank System), and the Federal Agricultural Mortgage Corporation, as well as equity investments in other privately-traded companies. The FHLB and Federal Reserve investments are “restricted” in that they can only be sold back to the respective institutions or another member institution at par, and are thus not liquid, have no ready market or quoted market value, and are carried at cost. The remaining investments have no quoted market prices, and are carried at cost less other than temporary impairment (“OTTI”) charges, if any. Nicolet’s management evaluates all these other investments periodically for impairment, considering financial condition and other available relevant information. Other investments totaled $14.9 million at September 30, 2017 and $17.5 million at December 31, 2016, with the decline primarily attributable to redeemed FHLB stock. One equity investment had an OTTI charge of $0.5 million recorded in the fourth quarter of 2016. There were no OTTI charges recorded in 2017.Table 13: Investment Securities Portfolio Maturity Distribution As of September 30, 2017 Within
One Year After One
but Within
Five Years After Five
but Within
Ten Years After
Ten Years Mortgage-
related
and Equity
Securities Total
Amortized
Cost Total
Fair
Value Amount Yield Amount Yield Amount Yield Amount Yield Amount Yield Amount Yield Amount (in thousands) U.S. government sponsored enterprises $ — — % $ 10,406 0.1 % $ 15,988 0.1 % $ — — % $ — — % $ 26,394 0.3 % $ 26,272 State and county municipals (1) 13,262 2.5 74,612 2.8 100,339 2.5 1,013 2.9 — — 189,226 2.6 188,716 Mortgage-backed securities — — — — — — — — 159,113 2.9 159,113 3.0 157,936 Corporate debt securities — — 11,080 4.2 14,150 2.9 6,973 5.8 — — 32,203 3.9 32,744 Equity securities — — — — — — — — 1,288 2.4 1,288 2.4 2,549 Total amortized cost $ 13,262 2.5 % $ 96,098 2.7 % $ 130,477 2.2 % $ 7,986 5.4 % $ 160,401 2.9 % $ 408,224 2.7 % $ 408,217 Total fair value and carrying value $ 13,261 $ 96,410 $ 129,769 $ 8,292 $ 160,485 $ 408,217 As a percent of total fair value 3 % 24 % 32 % 2 % 39 % 100 % (1)The yield on tax-exempt investment securities is computed on a tax-equivalent basis using a federal tax rate of 35% adjusted for the disallowance of interest expense.funds. Nicolet competesfunds, which provide a stable and lower-cost funding source. Deposit levels may be impacted by competition with other bank and nonbank institutions, for deposits, as well as with a growing number of non-deposit investment alternatives available to depositors, such as mutual funds, money market funds, annuities, and other brokerage investment products. Challenges todepositors. Deposit challenges include competitive deposit growth includeproduct features, price changes on deposit products given movements in the interest rate environment and other competitive pricing pressures, and customer preferences regarding higher-costinghigher rate deposit products or non-deposit investment alternatives. Included in14 are brokered10 below.March 31, 2024 December 31, 2023 March 31, 2023 (in thousands) Amount % of Total Amount % of Total Amount % of Total Noninterest-bearing demand $ 1,665,229 23 % $ 1,958,709 27 % $ 2,094,623 30 % Interest-bearing demand 1,121,030 16 % 1,055,520 15 % 1,138,415 17 % Money market 2,027,559 28 % 1,891,287 26 % 1,886,879 27 % Savings 765,084 11 % 768,401 11 % 865,824 12 % Time 1,586,830 22 % 1,523,883 21 % 942,838 14 % Total deposits $ 7,165,732 100 % $ 7,197,800 100 % $ 6,928,579 100 % Brokered transaction accounts $ 265,818 4 % $ 166,861 2 % $ 233,393 4 % Brokered and listed time deposits 517,190 7 % 448,582 6 % 289,181 4 % Total brokered deposits $ 783,008 11 % $ 615,443 8 % $ 522,574 8 % Customer transaction accounts $ 5,313,084 74 % $ 5,507,056 77 % $ 5,752,348 83 % Customer time deposits 1,069,640 15 % 1,075,301 15 % 653,657 9 % Total customer deposits (core) $ 6,382,724 89 % $ 6,582,357 92 % $ 6,406,005 92 % $126 milliontotal deposits) at September 30, 2017 and $21 millionMarch 31, 2024, unchanged from $2.1 billion (representing 29% of total deposits) at December 31, 2016.Table 14: Deposits September 30, 2017 December 31, 2016 (in thousands) Amount % of
Total Amount % of
Total Demand $ 638,447 27.0 % $ 482,300 24.5 % Money market and NOW accounts 1,107,360 46.8 964,509 49.0 Savings 274,828 11.6 221,282 11.2 Time 346,316 14.6 301,895 15.3 Total deposits $ 2,366,951 100.0 % $ 1,969,986 100.0 % Total deposits were $2.4 billion at September 30, 2017, up $397 million or 20% since December 31, 2016, largely attributable to the $375 million deposits added from First Menasha at acquisition in April 2017. On average for the first nine months of 2017, total deposits were $2.2 billion, up $631 million, or 41%, from the comparable 2016 period, largely attributable to the inclusion of acquired Baylake deposits for all of 2017 versus five of nine months in 2016 and acquired First Menasha deposits for five months of 2017 versus no months in 2016. On average, the mix of deposits changed between the comparable nine-month periods, with 2017 carrying more in brokered deposits, demand (i.e. noninterest bearing) deposits and money market and NOW accounts, and less in savings and time deposits.
2023.51Table 15: Average Deposits For the nine months ended September 30, 2017 September 30, 2016 (in thousands) Amount % of
Total Amount % of
Total Demand $ 516,412 23.7 % $ 348,765 22.6 % Money market and NOW accounts 1,064,585 48.9 732,721 47.4 Savings 249,099 11.5 184,156 11.9 Time 345,264 15.9 278,685 18.1 Total $ 2,175,360 100.0 % $ 1,544,327 100.0 % Table 16: Maturity Distribution of Certificates of Deposit of $100,000 or More(in thousands) September 30,
2017 3 months or less $ 19,226 Over 3 months through 6 months 25,973 Over 6 months through 12 months 44,218 Over 12 months 71,655 Total $ 161,072 Other Funding SourcesOther funding sources included short-term borrowings ($12.9 million at September 30, 2017 and zero at December 31, 2016) and long-term borrowings (totaling $83.0 million at September 30, 2017 and $37.6 million at December 31, 2016). Short-term borrowings, when used, consist mainly of federal funds purchased, overnight borrowings with correspondent financial institutions, FHLB advances with original maturities of one year or less, and customer repurchase agreements maturing in less than six months. Long-term borrowings include notes payable (consisting of FHLB advances with original maturities greater than one year), junior subordinated debentures (largely qualifying as Tier 1 capital for regulatory purposes, given their long maturity dates, even though they are redeemable in whole or in part at par), and subordinated debt (issued in 2015 with 10-year maturities, callable on or after the fifth anniversary date of their respective issuance dates, and qualifying as Tier 2 capital for regulatory purposes). Further information regarding these long-term borrowings is included in Note 8 – Notes Payable, Note 9 – Junior Subordinated Debentures, and Note 10 – Subordinated Notes in the notes to the unaudited consolidated financial statements. Given the high level of deposits to assets, other funding sources are currently utilized modestly, mainly for their capital equivalent characteristics and term funding.At September 30, 2017, additional funding sources consist of a $10 million available and unused line of credit at the holding company, $158 million of available and unused federal funds purchased lines, and remaining available total borrowing capacity at the FHLB of $115 million.Off-Balance Sheet ObligationsAs of September 30, 2017 and December 31, 2016, Nicolet had the following commitments that did not appear on its balance sheet:Table 17: Commitments September 30, December 31, 2017 2016 (in thousands) Commitments to extend credit — fixed and variable rate $ 660,578 $ 554,980 Financial letters of credit 9,381 12,444 Standby letters of credit 8,006 4,898 Interest rate lock commitments to originate residential mortgage loans held for sale and forward commitments to sell residential mortgage loans held for sale are considered derivative instruments and represented $32.2 million and $5.9 million, respectively, at September 30, 2017. Fair value approximates the notional amounts.52cash isadequate liquid funds are available in a timely and cost-effective manner to meet the current and future cash flow requirementsobligations arising in the daily operations of depositors and borrowers and to meet other commitments as they fall due, includingthe Company. These cash flow obligations include the ability to meet the commitments to borrowers for extensions of credit, accommodate deposit cycles and trends, fund capital expenditures, pay dividends to shareholders, service debt, invest in subsidiaries, repurchase common stock,stockholders (if any), and satisfy other operating requirements.Fundsexpenses. The Company’s most liquid assets are availablecash and due from a numberbanks and interest-earning deposits, which totaled $427 million and $491 million at March 31, 2024 and December 31, 2023, respectively. Balances of basic banking activitythese liquid assets are dependent on our operating, investing, and financing activities during any given period.including but not limited toof funds include the core deposit base, the repayment and maturity of loans, investment securities calls, maturities, and sales, and funds obtained throughprocurement of brokered deposits. All investment securities are classified as available for sale and are reported at fair value on the consolidated balance sheet. Approximately $77 milliondeposits or other wholesale funding. At March 31, 2024, approximately 46% of the $408 million investment securities portfolio at September 30, 2017 was pledged as collateral to secure public deposits short termand borrowings, repurchase agreements,as applicable, and for liquidity or for other purposes as required by law. Other fundingregulation. Liquidity sources available to the Company at March 31, 2024, are presented in Table 12 below.(in millions) March 31, 2024 $ 622 Fed Funds Lines 175 Fed Discount Window 11 Immediate Funding Availability $ 808 Brokered Capacity 1,008 Guaranteed portion of SBA loans 88 Other funding sources 78 $ 1,174 Total Contingent Funding Availability $ 1,982 (1) Excludes outstanding FHLB borrowings of $5 million at March 31, 2024. (2) Short-term funding availability defined as funding that could be secured between 2 and 30 days. short-term borrowings, federal funds purchased,access to the public or private markets to issue new equity, subordinated notes or other debt. Dividends from the Bank and, long-term borrowings.Cash and cash equivalents at September 30, 2017 and December 31, 2016 were $96 million and $129 million, respectively. These levels have decreased through the first nine months of 2017 with $117 million net cash used by investing activities (mostly due to a net increaselesser extent, stock option exercises, represent significant sources of cash flows for the Parent Company. The Bank is required by federal law to obtain prior approval of the OCC for payments of dividends if the total of all dividends declared by the Bank in loans and securities), partially offset by $30 million net cash provided by operating activities and $54 million net cash provided by financing activities (mostly due to a net increase in deposits). Nicolet’s liquidity resources were sufficient as of September 30, 2017 to fund loans, accommodate deposit trends and cycles, andany year will exceed certain thresholds. Management does not believe that regulatory restrictions on dividends from the Bank will adversely affect its ability to meet otherits cash needs as necessary.itsour financial strategy and risk management, Nicolet attemptswe attempt to understand and manage the impact of fluctuations in market interest rates on itsour net interest income. The consolidated balance sheet consists mainly of interest-earning assets (loans, investments and cash) which are primarily funded by interest-bearing liabilities (deposits and other borrowings). Such financial instruments have varying levels of sensitivity to changes in market rates of interest. Market rates are highly sensitive to many factors beyond our control, including but not limited to general economic conditions and policies of governmental and regulatory authorities. Our operating income and net income depends, to a substantial extent, on “rate spread” (i.e., the difference between the income earned on loans, investments and other earning assets and the interest expense paid to obtain deposits and other funding liabilities).boardBoard of directors’Directors’ Asset and Liability Committee.Nicolet measures itswe measure our overall interest rate sensitivity through a net interest income analysis, which calculates the change in net interest income in the event of hypothetical changes in interest rates under different scenarios versus a baseline scenario. Such scenarios can involve static balance sheets, balance sheets with projected growth, parallel (or non-parallel) yield curve slope changes, immediate or gradual changes in market interest rates, and one-year or longer time horizons. The simulation modeling uses assumptions involving market spreads, prepayments of rate-sensitive instruments, renewal rates on maturing or new loans, deposit retention rates, and other assumptions.Nicoletdecreasechange in market rates (parallel to the change in prime rate) over a one-year time horizon to a static (flat) balance sheet. The results provided include the liquidity measures mentioned above and reflect the current interest rate environment. The interest rate scenarios are used for analytical purposes only and do not necessarily represent management’s view of future market interest rate movements. Based on this analysis on financial data at September 30, 2017,March 31, 2024 and December 31, 2023, the projected changes in net interest income over a one-year time horizon, versus the baseline, was -0.5%, -0.2%, 0.3%are presented in Table 13 below, and 0.6% forreflect a shift from an asset sensitive position to a liability sensitive position due to the -200, -100, +100 and +200 bps scenarios, respectively; suchdeposit mix shift to higher cost deposit products that are more sensitive to changes in interest rates. The results are withinin compliance with Nicolet’s guidelines of not greater than -10% for +/- 100 bps and not greater than -15% for +/- 200 bps.March 31, 2024 December 31, 2023 200 bps decrease in interest rates 0.6 % (1.1) % 100 bps decrease in interest rates 0.3 % (0.6) % 100 bps increase in interest rates (0.3) % 0.6 % 200 bps increase in interest rates (0.5) % 1.2 % guidelinesguidelines. The capital position and strategies are actively reviews capital strategiesreviewed in light of perceived business risks associated with current and prospective earning levels, liquidity, asset quality, economic conditions in the markets served, and level of returns available to shareholders. Management intends to maintain an optimal capital and leverage mix for growth and for shareholder return.
For details on the change in capital see “BALANCE SHEET ANALYSIS.”53At September 30, 2017, Nicolet’s capital structure consisted of $360.4 million of common stock equity compared to $275.9 million of common equity at December 31, 2016. Nicolet’s common equity, representing 12.7% of total assets at September 30, 2017The Company’s and 12.0% at December 31, 2016, continues to reflect capacity to capitalize on opportunities. Nicolet’s common stock was accepted by shareholders as the primary consideration in the recent 2017 and 2016 acquisitions, as described in Note 2 – “Acquisitions,” in the notes to the unaudited consolidated financial statements.On April 28, 2017 as part of the First Menasha merger, Nicolet issued 1.3 million shares of common stock for common stock consideration of $62.2 million. On April 29, 2016 as part of the Baylake merger, Nicolet issued 4.3 million shares of common stock for common stock consideration of $163.3 million, and recorded $1.2 million consideration for assumed stock options. In connection with the financial advisor business acquisition that completed on April 1, 2016, Nicolet issued $2.6 million in common stock consideration. Book value per common share increased 14% to $36.78 at September 30, 2017 from $32.26 at year end 2016 aided mostly by the common equity issued in the 2017 acquisition and retained earnings exceeding stock purchases.As shown in Table 18, Nicolet’sBank’s regulatory capital ratios remain well above minimum regulatory ratios. Also, at September 30, 2017,ratios, including the capital conservation buffer. At March 31, 2024, the Bank’s regulatory capital ratios qualify the Bank as well-capitalized under the prompt-corrective action framework with hurdles of 10.0%, 8.0%, 6.5% and 5.0%, respectively.framework. This strong base of capital has allowed Nicolet to be opportunistic in the current environment and in strategic growth.The primary source of income and funds for the parent company is dividends from the Bank. Dividends declared by the Bank that exceed the retained net income for the most current year plus retained net income for the preceding two years must be approved by federal regulatory agencies. At September 30, 2017, the Bank could pay dividends of approximately $13.9 million without seeking regulatory approval. During 2016, the Bank paid $35.5 million of dividends (which included a special dividend of $15 million out of Bank surplus) to the parent company, and paid $10 million of dividends during the first nine months of 2017. On October 17, 2017, the Bank declared and paid a $12 million dividend to the Company.Nicolet’sthe Company’s and Nicolet Nationalthe Bank’s regulatory capital amounts and ratios, as of September 30, 2017 and December 31, 2016well as selected capital metrics are presented in the following table.18:14: Capital Actual For Capital
Adequacy Purposes To Be Well
Capitalized
Under Prompt
Corrective Action
Provisions (2) (in thousands) Amount Ratio (1) Amount Ratio (1) Amount Ratio (1) As of September 30, 2017: Company Total capital $ 293,800 12.8 % $ 183,929 8.0 % Tier 1 capital 269,277 11.7 137,947 6.0 CET 1 capital 240,351 10.5 103,460 4.5 Leverage 269,277 10.0 108,169 4.0 Bank Total capital $ 279,665 12.2 % $ 183,696 8.0 % $ 229,620 10.0 % Tier 1 capital 267,055 11.6 137,772 6.0 183,696 8.0 CET 1 capital 267,055 11.6 103,329 4.5 149,253 6.5 Leverage 267,055 9.9 108,053 4.0 135,067 5.0 As of December 31, 2016: Company Total capital $ 249,723 13.9 % $ 144,195 8.0 % Tier 1 capital 226,018 12.5 108,146 6.0 CET 1 capital 202,313 11.2 81,110 4.5 Leverage 226,018 10.3 87,566 4.0 Bank Total capital $ 217,682 12.1 % $ 144,322 8.0 % $ 180,403 10.0 % Tier 1 capital 205,862 11.4 108,242 6.0 144,322 8.0 CET 1 capital 205,862 11.4 81,181 4.5 117,262 6.5 Leverage 205,862 9.4 87,329 4.0 109,161 5.0 54(1)The total capital ratio is defined as Tier1 capital plus Tier 2 capital divided by total risk-weighted assets. The Tier 1 capital ratio is defined as Tier1 capital divided by total risk-weighted assets. CET 1 capital ratio is defined as Tier 1 capital, with deductions for goodwill and other intangible assets (other than mortgage servicing assets), net of associated deferred tax liabilities, and limitations on the inclusion of deferred tax assets, mortgage servicing assets and investments in other financial institutions, in each case as provided further in the rules, divided by total risk-weighted assets. The leverage ratio is defined as Tier 1 capital divided by the most recent quarter’s average total assets, adjusted in accordance with regulatory guidelines.(2)Prompt corrective action provisions are not applicable at the bank holding company level.
In At or for the Three Months Ended At or for the
Year Ended($ in thousands) March 31, 2024 December 31, 2023 Company Stock Repurchases: * Common stock repurchased during the period (dollars) $ — $ 1,519 Common stock repurchased during the period (full shares) — 26,853 Company Risk-Based Capital: Total risk-based capital $ 955,514 $ 930,804 Tier 1 risk-based capital 775,693 750,811 Common equity Tier 1 capital 736,714 712,040 Total capital ratio 13.3 % 13.0 % Tier 1 capital ratio 10.8 % 10.5 % Common equity tier 1 capital ratio 10.2 % 9.9 % Tier 1 leverage ratio 9.6 % 9.2 % Bank Risk-Based Capital: Total risk-based capital $ 859,098 $ 827,341 Tier 1 risk-based capital 795,774 768,726 Common equity Tier 1 capital 795,774 768,726 Total capital ratio 12.0 % 11.5 % Tier 1 capital ratio 11.1 % 10.7 % Common equity tier 1 capital ratio 11.1 % 10.7 % Tier 1 leverage ratio 9.9 % 9.4 % * Reflects common stock repurchased under board of director authorizations for the common stock repurchase program. July 2013,managing capital for optimal return, we evaluate capital sources and uses, pricing and availability of our stock in the Federal Reservemarket, and alternative uses of capital (such as the level of organic growth or acquisition opportunities, dividends, or repayment of equity-equivalent debt) in light of strategic plans. Through an ongoing repurchase program, the Board has authorized the repurchase of Nicolet’s common stock as an alternative use of capital. At March 31, 2024, there remained $46 million authorized under this repurchase program, as modified, to be utilized from time-to-time to repurchase shares in the open market, through block transactions or in private transactions.OCC issued final rules implementing the Basel III regulatory capital frameworkaccounting estimate requires management to make assumptions about matters that are highly uncertain and related Dodd-Frank Act changes. The final rules took effectdifferent estimates that management reasonably could have used for the Company and Bank on January 1, 2015, subjectaccounting estimate in the current period, or changes in the accounting estimate that are reasonably likely to a transitionoccur from period for certain parts of the rules. The rules permitted certain banking organizations to retain, through a one-time election, the existing treatment for accumulated other comprehensive income. Nicolet and the Bank made the election in 2015 to retain the existing treatment for accumulated other comprehensive income.The tables above calculate and present regulatory capital based upon the new regulatory capital ratio requirements under Basel III that became effective on January 1, 2015. Beginning in 2016, an additional capital conservation buffer was added to the minimum requirements for capital adequacy purposes, subject to a three year phase-in period. The capital conservation buffer will be fully phased-in on January 1, 2019 at 2.5 percent. A banking organization with a conservation buffer of less than 2.5 percent (or the required phase-in amount in years prior to 2019) will be subject to limitations on capital distributions, including dividend payments and certain discretionary bonus payments to executive officers. At the present time, the ratios for the Company and Bank are sufficient to meet the fully phased-in conservation buffer.Future Accounting PronouncementsIn May 2014, the FASB issued ASU 2014-09,Revenue from Contracts with Customers (Topic 606).The core principle of the guidance is that an entity should recognize revenue to depict the transfer of promised goods and services to customers in an amount that reflects the consideration to which the entity expects to be entitled in exchange for those goods and services. In August 2015, the FASB issued an amendment to defer the effective date for all entities by one year. The updated guidance is effective for annual reporting periods beginning after December 15, 2017, including interim periods within that reporting period. Since a significant number of business transactions are not subject to the guidance, it is not expected toperiod, could have a material impact on the Company’s financial statements when it goes into effectstatements. The accounting estimates we consider to be critical include business combinations and the first quartervaluation of 2018.In August 2017,loans acquired, the FASB issued updated guidance to ASU 2017-12,Derivatives and Hedging (Topic 815): Targeted Improvements to Accounting for Hedging Activities.ASU 2017-12 expands the activities that qualify for hedge accounting and simplifies the rules for reporting hedging transactions. The updated guidance is effective for interim and annual reporting periods beginning after December 15, 2018, with early adoption permitted. The Company is currently assessing the impactdetermination of the new guidanceallowance for credit losses, and income taxes. A discussion of these estimates can be found in the “Critical Accounting Estimates” section in Management’s Discussion and Analysis of Financial Condition and Results of Operations included in the Company’s 2023 Annual Report on its consolidated financial statements,Form 10-K. There have been no changes in the Company’s determination of critical accounting policies and it is not expected to have a significant impact on its consolidated financial statements because the Company does not have any significant derivatives and does not currently apply hedge accounting to derivatives.In May 2017, the FASB issued updated guidance to ASU 2017-09,Compensation - Stock Compensation (Topic 718).ASU 2017-09 applies to entities that change the terms or conditions of a share-based payment award to provide clarity and reduce diversity in practice as well as cost and complexity when applying the guidance in Topic 718 to the modification to the terms and conditions of a share-based payment award. The updated guidance is effective for interim and annual reporting periods beginning afterestimates since December 15, 2017, with early adoption permitted. The Company is currently assessing the impact of the new guidance on its consolidated financial statements.” and Impact of Inflation” within Management’s Discussion and Analysis of Financial Condition and Results of Operations under Part I, Item 2.2, for our interest rate sensitivity position at March 31, 2024.Asreport, management, under the supervision and with the participation of our President and Chief Executive Officer and Chiefreport.Officer, evaluated the effectiveness of the design and operation of our disclosure controls and procedures (as such term in Rule 13a-15(e) and 15d-15(e) under the Exchange Act pursuant to Exchange Act Rule 13a-15. Based upon, and as of the date of such evaluation, the President and Chief Executive Officer and the Chief Financial Officer concluded that our disclosure controls and proceduresReporting. There were effective.55There have been no changes in the Company’s internal controls or, to the Company’s knowledge,control over financial reporting (as such term is defined in other factorsExchange Act Rule 13a-15(f)) during the quarter covered by this report that have materially affected, or are reasonably likely to materially affect, the Company’s internal controlscontrol over financial reporting. Because of its inherent limitations, internal control over financial reporting may not prevent or detect misstatements. Also projections of any evaluation of effectiveness to future periods are subject to the risk that controls may become inadequate because of changes in conditions, or that the degree of compliance with the policies or procedures may deteriorate.Weourits subsidiaries may be involved from time to time in various routine legal proceedings incidental to our respective businesses. Neither wethe Company nor any of ourits subsidiaries are currently engaged in any legal proceedings that are expected to have a material adverse effect on our results of operations or financial position.2016.2023.Following are monthly common stock purchasesmade during first quarter 2024 by or on behalf of the thirdCompany or any “affiliated purchaser,” as defined by Rule 10b-18(a)(3) of the Exchange Act.Average Price
Paid per ShareTotal Number of
Shares Purchased as
Part of Publicly
Announced Plans
or Programs(#) ($) (#) (#) Period January 1 – January 31, 2024 360 $ 80.74 — February 1 – February 29, 2024 — $ — — March 1 – March 31, 2024 946 $ 84.77 — Total 1,306 $ 83.66 — 535,000 2017. Total Number of
Shares Purchased (a) Average Price
Paid per Share Total Number of
Shares Purchased as
Part of Publicly
Announced Plans
or Programs Maximum Number of
Shares that May Yet
Be Purchased Under
the Plans
or Programs(a) (#) ($) (#) (#) Period July 1 – July 31, 2017 338 $ 54.82 — 458,000 August 1– August 31, 2017 49,699 $ 53.45 49,699 408,000 September 1 – September 30, 2017 17,316 $ 54.14 16,846 391,000 Total 67,353 $ 53.63 66,545 391,000 (a)During the third quarter of 2017, the Company repurchased 0 and 808 shares for minimum tax withholding settlements on restricted stock and net settlements of stock options, respectively. These purchases do not count against the maximum number of shares that may yet be purchased under the board of directors’ authorization.
shares that may yet be purchased under the Board of Directors’ authorization.(b)During early 2014, a common stock repurchase program was approved which authorized, with subsequent modifications the use of up to $30 million to repurchase up to 1,050,000 shares of outstanding common stock. At September 30, 2017, approximately $8.6 million remained available to repurchase up to 391,000 common shares. Using the closing stock price on September 30, 2017 of $57.53, a total of approximately 149,000 shares of common stock could be repurchased under this plan. Nicolet resumed repurchases of its shares under this program during the second quarter of 2017.None.56Exhibit
NumberDescription Number10.1Description31.110.231.1 31.2 32.1 32.2 101*101pursuant to Rule 405 of Regulation S-T:for Nicolet Bankshares, Inc.’s Quarterly Report on Form 10-Q for the quarter ended March 31, 2024, formatted in Inline XBRL: (i) the Consolidated Balance Sheets (unaudited), (ii) the Consolidated Statements of Income (Loss) (unaudited), (iii) the Consolidated Statements of Comprehensive Income (Loss) (unaudited), (iv) the Consolidated Statements of Stockholders’ Equity (unaudited), (v) the Consolidated StatementStatements of Cash Flows (unaudited), and (vi) Notes to Unaudited Consolidated Financial Statements tagged as blocks of text.Statements.104 Cover Page from Nicolet Bankshares, Inc.’s Quarterly Report on Form 10-Q for the quarter ended March 31, 2024 (formatted in Inline XBRL and contained in Exhibit 101) *Indicates information that is furnished and notor a part of a registration statement or prospectuson February 28, 2024 (File No. 001-37700).purposes of sections 11 or 12 of the Securities Act of 1933, is deemed notfiscal year ended December 31, 2023, filed for purposes of section 18 of the Securities Exchange Act of 1934, and otherwise is not subject to liability under these sections.NICOLET BANKSHARES, INC. May 8, 2024 /s/ Michael E. Daniels November 3, 2017/s/ Robert B. AtwellMichael E. DanielsRobert B. AtwellChairman, President, and Chief Executive Officer May 8, 2024 /s/ H. Phillip Moore, Jr. November 3, 2017/s/ Ann K. LawsonH. Phillip Moore, Jr.Ann K. LawsonChief Financial Officer 57