Delaware | Delaware | | 20-2830691 | (State or other jurisdiction of | | (I.R.S. Employer | incorporation or organization) | | Identification No.) |
1999 Harrison Street,1850 Mt. Diablo Boulevard, Suite 1530640
Oakland, Walnut Creek, California 9461294596
(Address of principal executive offices) (Zip code)Code) (510) (510) 522-9600
(Registrant’s telephone number, including area code) N/A (Former name, former address and former fiscal year, if changed since last report) Securities registered or to be registered pursuant to Section 12(b) of the Act. Title of each class: |
| Trading Symbol(s) |
| Name of each exchange
on which registered: | Shares of United States Oil Fund, LP | | USO | | NYSE Arca, Inc. |
Indicate by check mark whether the registrant (1) has filed all reports required to be filed by Section 13 or 15(d) of the Securities Exchange Act of 1934 during the preceding 12 months (or for such shorter period that the registrant was required to file such reports), and (2) has been subject to such filing requirements for the past 90 days.x☒Yes¨☐ No Indicate by check mark whether the registrant has submitted electronically and posted on its corporate Website, if any, every Interactive Data File required to be submitted and posted pursuant to Rule 405 of Regulation S-T (§232.405 of this chapter) during the preceding 12 months (or for such shorter period that the registrant was required to submit and post such files).x☒ Yes¨☐ No Indicate by check mark whether the registrant is a large accelerated filer, an accelerated filer, a non-accelerated filer, a smaller reporting company, or an emerging growth company. See the definitions of “large accelerated filer,”filer”, “accelerated filer,”filer”, “smaller reporting company” and “emerging growth company” in Rule 12b-2 of the Exchange Act. Large accelerated filerAccelerated Filer | x☒ | | Accelerated Filer | Accelerated filer | ¨☐ | Non-Accelerated Filer | ☐ | | Smaller Reporting Company | | ☐ | Non-accelerated filerEmerging Growth Company | ¨☐ | | (Do not check if a smaller reporting company) | | Smaller reporting company¨ | | | | | | | | | Emerging growth company | ¨ |
If an emerging growth company, indicate by check mark if the registrant has elected not to use the extended transition period for complying with any new or revised financial accounting standards provided toin Section 7(a)(2)(B)13(a) of the SecuritiesExchange Act.¨☐ Indicate by check mark whether the registrant is a shell company (as defined in Rule 12b-2 of the Exchange Act)Act.).¨☐ Yesx☒ No The registrant had 206,500,00018,523,603 outstanding shares outstanding as of November 2,2017.May 3, 2024. United States Oil Fund, LP Table of Contents Part I. FINANCIAL INFORMATION Item 1. Condensed Financial Statements. Index to Condensed Financial Statements Documents | | Page | | | | Condensed Statements of Financial Condition at September 30, 2017March 31, 2024 (Unaudited) and December 31, 20162023 | | 2 | | | | Condensed Schedules of Investments at March 31, 2024 (Unaudited) and December 31, 2023 | | 3 | | Condensed Schedule of Investments (Unaudited) at September 30, 2017 | | 3 | | | | Condensed Statements of Operations (Unaudited) for the three and nine months ended September 30, 2017March 31, 2024 and 20162023 | | 5 | | | | | Condensed StatementStatements of Changes in Partners’ Capital (Unaudited) for the ninethree months ended September 30, 2017March 31, 2024 and 2023 | | 6 | | | | | Condensed Statements of Cash Flows (Unaudited) for the ninethree months ended September 30, 2017March 31, 2024 and 20162023 | | 7 | | | | | Notes to Condensed Financial Statements (Unaudited) for the period ended September 30, 2017 (Unaudited)March 31, 2024 | | 8 |
United States Oil Fund, LP Condensed Statements of Financial Condition At September 30, 2017March 31, 2024 (Unaudited) and December 31, 20162023 | | | September 30, 2017 | | | December 31, 2016 | | | Assets | | | | | | | | | Cash and cash equivalents (at cost $2,052,310,579 and $2,920,517,807, respectively)
(Notes 2 and 5) | | $ | 2,052,310,579 | | | $ | 2,920,517,807 | | | Equity in trading accounts: | | | | | | | | | | Cash and cash equivalents (at cost $154,585,900 and $249,864,944, respectively) | | | 154,585,900 | | | | 249,864,944 | | | Unrealized gain (loss) on open commodity futures contracts | | | 122,542,660 | | | | 111,290,560 | | | Receivable for shares sold | | | 33,387,540 | | | | — | | | Dividends receivable | | | 265,315 | | | | 222,951 | | | Interest receivable | | | 58,562 | | | | — | | | Directors' fees and insurance receivable | | | 11,035 | | | | — | | | Prepaid registration fees | | | 1,016,229 | | | | 1,276,832 | | | ETF transaction fees receivable | | | 2,000 | | | | 5,000 | | | | | | | | | | | | | Total assets | | $ | 2,364,179,820 | | | $ | 3,283,178,094 | | | | | | | | | | | | | Liabilities and Partners' Capital | | | | | | | | | | Payable due to Broker | | $ | 53,119,135 | | | $ | 110,778,928 | | | Payable for shares redeemed | | | — | | | | 66,943,788 | | | General Partner management fees payable (Note 3) | | | 906,095 | | | | 1,256,212 | | | Professional fees payable | | | 1,154,777 | | | | 1,829,494 | | | Brokerage commissions payable | | | 187,961 | | | | 235,961 | | | Directors' fees and insurance payable | | | — | | | | 26,116 | | | License fees payable | | | 89,665 | | | | 150,926 | | | | | | | | | | | | | Total liabilities | | | 55,457,633 | | | | 181,221,425 | | | | | | | | | | | | | Commitments and Contingencies (Notes 3, 4 and 5) | | | | | | | | | | | | | | | | | | | | Partners' Capital | | | | | | | | | | General Partner | | | — | | | | — | | | Limited Partners | | | 2,308,722,187 | | | | 3,101,956,669 | | | Total Partners' Capital | | | 2,308,722,187 | | | | 3,101,956,669 | | | | | | | | | | | | | Total liabilities and partners' capital | | $ | 2,364,179,820 | | | $ | 3,283,178,094 | | | | | | | | | | | | | Limited Partners' shares outstanding | | | 221,100,000 | | | | 265,000,000 | | | Net asset value per share | | $ | 10.44 | | | $ | 11.71 | | | Market value per share | | $ | 10.43 | | | $ | 11.72 | |
| | | | | | | | | March 31, 2024 | | December 31, 2023 | Assets | | | | | | | Cash and cash equivalents (at cost $909,064,898 and $952,408,574, respectively) (Notes 2 and 5) | | $ | 909,064,898 | | $ | 952,408,574 | Equity in trading accounts: | | | | | | | Cash and cash equivalents (at cost $359,674,710 and $511,287,941, respectively) | | | 359,674,710 | | | 511,287,941 | Unrealized gain (loss) on open commodity futures contracts | | | 56,477,810 | | | 3,051,930 | Unrealized gain (loss) on open swap contracts | | | (2,088) | | | (1,906) | Receivable for shares sold | | | 132,771,216 | | | 113,785,226 | Dividends receivable | | | 1,449,170 | | | 1,460,430 | Interest receivable | | | 4,129,547 | | | 4,646,281 | Prepaid insurance | | | 242,909 | | | 72,180 | ETF transaction fees receivable | | | 4,000 | | | 2,000 | | | | | | | | Total Assets | | $ | 1,463,812,172 | | $ | 1,586,712,656 | | | | | | | | Liabilities and Partners’ Capital | | | | | | | Payable due to Broker | | $ | 63,264 | | $ | 16,928,846 | Payable for shares redeemed | | | 39,464,986 | | | — | General Partner management fees payable (Note 3) | | | 519,097 | | | 574,149 | Professional fees payable | | | 942,990 | | | 1,629,830 | Brokerage commissions payable | | | 119,336 | | | 119,336 | Directors’ fees payable | | | 33,570 | | | 32,993 | License fees payable | | | 74,912 | | | 81,961 | | | | | | | | Total Liabilities | | | 41,218,155 | | | 19,367,115 | | | | | | | | Commitments and Contingencies (Notes 3, 4 & 5) | | | | | | | | | | | | | | Partners’ Capital | | | | | | | General Partners | | | — | | | — | Limited Partners | | | 1,422,594,017 | | | 1,567,345,541 | Total Partners’ Capital | | | 1,422,594,017 | | | 1,567,345,541 | | | | | | | | Total Liabilities and Partners’ Capital | | $ | 1,463,812,172 | | $ | 1,586,712,656 | | | | | | | | Limited Partners’ shares outstanding | | | 18,023,603 | | | 23,423,603 | Net asset value per share | | $ | 78.93 | | $ | 66.91 | Market value per share | | $ | 78.73 | | $ | 66.65 |
See accompanying notes to condensed financial statements. United States Oil Fund, LP Condensed Schedule of Investments (Unaudited) At September 30, 2017 March 31, 2024 | | | Notional
Amount | | | Number of
Contracts | | | Value/
Unrealized Gain
(Loss) on Open
Commodity
Contracts | | | % of
Partners'
Capital | | | Open Futures Contracts - Long | | | | | | | | | | | | | | | | | | United States Contracts | | | | | | | | | | | | | | | | | | NYMEX WTI Crude Oil Futures CL November 2017 contracts, expiring October 2017* | | $ | 2,186,176,280 | | | | 44,682 | | | $ | 122,542,660 | | | | 5.31 | |
| | | | | | | | | | | | | | | | | | Fair | | | | | | | | | | Value/Unrealized | | | | | | | | | | Gain (Loss) on | | | | | | | Number of | | Open Commodity | | % of Partners’ | | | Notional Amount | | Contracts | | Contracts | | Capital | Open Commodity Futures Contracts - Long | | | | | | | | | | | United States Contracts | | | | | | | | | | | NYMEX WTI Crude Oil Futures CL May 2024 contracts, expiring April 2024* | | $ | 1,049,766,360 | | 13,301 | | $ | 56,477,810 | | 3.97 |
| | | Principal
Amount | | | Market
Value | | | | | | Cash Equivalents | | | | | United States Treasury Obligations | | | | | | | | | | | | | | U.S. Treasury Bills: | | | | | | | | | | | | | | 0.90%, 10/05/2017 | | $ | 75,000,000 | | | $ | 74,992,542 | | | | 3.25 | | | 0.92%, 10/12/2017 | | | 60,000,000 | | | | 59,983,225 | | | | 2.60 | | | 0.91%, 10/19/2017 | | | 75,000,000 | | | | 74,966,062 | | | | 3.25 | | | 0.95%, 10/26/2017 | | | 90,000,000 | | | | 89,940,625 | | | | 3.89 | | | 0.97%, 11/02/2017 | | | 75,000,000 | | | | 74,935,667 | | | | 3.25 | | | 1.01%, 11/09/2017 | | | 80,000,000 | | | | 79,912,900 | | | | 3.46 | | | 0.98%, 11/16/2017 | | | 75,000,000 | | | | 74,906,083 | | | | 3.24 | | | 1.05%, 11/24/2017 | | | 80,000,000 | | | | 79,874,600 | | | | 3.46 | | | 1.05%, 11/30/2017 | | | 75,000,000 | | | | 74,869,375 | | | | 3.24 | | | 1.08%, 12/07/2017 | | | 75,000,000 | | | | 74,850,646 | | | | 3.24 | | | 1.09%, 12/14/2017 | | | 80,000,000 | | | | 79,822,400 | | | | 3.46 | | | 1.11%, 12/21/2017 | | | 80,000,000 | | | | 79,802,000 | | | | 3.46 | | | 1.10%, 12/28/2017 | | | 80,000,000 | | | | 79,785,867 | | | | 3.46 | | | 1.12%, 1/04/2018 | | | 75,000,000 | | | | 74,779,323 | | | | 3.24 | | | 1.11%, 1/11/2018 | | | 75,000,000 | | | | 74,765,187 | | | | 3.24 | | | 1.10%, 1/18/2018 | | | 75,000,000 | | | | 74,752,479 | | | | 3.24 | | | 1.12%, 1/25/2018 | | | 75,000,000 | | | | 74,730,542 | | | | 3.24 | | | 1.12%, 2/01/2018 | | | 75,000,000 | | | | 74,714,281 | | | | 3.24 | | | 1.13%, 2/08/2018 | | | 50,000,000 | | | | 49,796,875 | | | | 2.16 | | | 1.12%, 2/15/2018 | | | 75,000,000 | | | | 74,683,187 | | | | 3.23 | | | 1.10%, 2/22/2018 | | | 75,000,000 | | | | 74,673,000 | | | | 3.23 | | | 1.09%, 3/01/2018 | | | 100,000,000 | | | | 99,544,903 | | | | 4.31 | | | 1.14%, 3/08/2018 | | | 75,000,000 | | | | 74,627,219 | | | | 3.23 | | | 1.14%, 3/15/2018 | | | 75,000,000 | | | | 74,611,562 | | | | 3.23 | | | 1.16%, 3/22/2018 | | | 75,000,000 | | | | 74,587,917 | | | | 3.23 | | | 1.17%, 3/29/2018 | | | 50,000,000 | | | | 49,711,611 | | | | 2.15 | | | Total Treasury Obligations | | | | | | | 1,944,620,078 | | | | 84.23 | |
| | | | | | | | | | Shares/Principal | | | | % of Partners’ | | | Amount | | Market Value | | Capital | Cash Equivalents | | | | | | | | United States Money Market Funds | | | | | | | | Morgan Stanley Institutional Liquidity Funds - Government Portfolio - Institutional Shares, 5.22%# | | 327,450,000 | | $ | 327,450,000 | | 23.02 | Total United States Money Market Funds | | | | | 327,450,000 | | 23.02 |
Open OTC Commodity Swap Contracts | | | | | | | | | | | | | | | | | | | | | | | | | | | | | | | | | Unrealized | | | | | | | | | | | | | Fair | | | | Gain (Loss) | | | | | | | | | | | | | Value/Open | | Upfront | | on | Fund Receives | | | | | | | | | | | | Commodity | | Payments/ | | Commodity | from | | Fund Pays | | | | Payment | | Expiration | | Notional | | Swap | | (Premiums | | Swap | Counterparty | | Counterparty | | Counterparty | | Frequency | | Date | | Amount | | Contracts | | Received) | | Contracts(a) | SOC GEN SGIXCWTI 12282023Index(b) | | 0.25 | % | Societe Generale | | monthly | | 06/28/2024 | | 133,507,753 | | 133,506,965 | | — | | (788) | MACQUARIE MQCP361E 01182024Index(b) | | 0.26 | | Macquarie Bank Ltd. | | monthly | | 07/19/2024 | | 182,442,678 | | 182,441,378 | | — | | (1,300) | Total Open OTC Commodity Swap Contracts˄ | | 315,950,431 | | 315,948,343 | | — | | (2,088) |
(a)Reflects the value at reset date of March 28, 2024. United States Oil Fund, LP
Condensed Schedule(b)Custom index comprised of Investments (Unaudited)(Continued)
At September 30, 2017a basket of underlying instruments.
| | | Principal
Amount | | | Market
Value | | | % of
Partners'
Capital | | | United States - Money Market Funds | | | | | | | | | | | | | | Fidelity Investments Money Market Funds - Government Portfolio | | $ | 100,000,000 | | | $ | 100,000,000 | | | | 4.33 | | | Goldman Sachs Financial Square Funds - Government Fund - Class FS | | | 50,000,000 | | | | 50,000,000 | | | | 2.17 | | | Morgan Stanley Institutional Liquidity Funds - Government Portfolio | | | 100,000,000 | | | | 100,000,000 | | | | 4.33 | | | Total Money Market Funds | | | | | | | 250,000,000 | | | | 10.83 | | | Total Cash Equivalents | | | | | | $ | 2,194,620,078 | | | | 95.06 | |
#Reflects the 7 - day yield at March 31, 2024. * ÙCollateral amounted to $154,585,900$13,580,000 on open OTC commodity swap contracts.
*Collateral amounted to $346,094,710 on open commodity futures contracts. See accompanying notes to condensed financial statements.
United States Oil Fund, LP
Condensed Statements of Operations (Unaudited)
For the three and nine months ended September 30, 2017 and 2016
| | | Three months ended
September 30, 2017 | | | Three months ended
September 30, 2016 | | | Nine months ended
September 30, 2017 | | | Nine months ended
September 30, 2016 | | | Income | | | | | | | | | | | | | | | | | | Gain (loss) on trading of commodity futures contracts: | | | | | | | | | | | | | | | | | | Realized gain (loss) on closed futures contracts | | $ | 135,353,709 | | | $ | (384,554,840 | ) | | $ | (257,378,501 | ) | | $ | 119,714,110 | | | Change in unrealized gain (loss) on open futures contracts | | | 128,797,560 | | | | 303,367,830 | | | | 11,252,100 | | | | 270,039,300 | | | Dividend income | | | 988,616 | | | | 560,858 | | | | 2,883,444 | | | | 1,481,741 | | | Interest income* | | | 5,365,328 | | | | 2,300,456 | | | | 12,400,479 | | | | 6,369,237 | | | ETF transaction fees | | | 110,000 | | | | 82,000 | | | | 268,000 | | | | 236,000 | | | | | | | | | | | | | | | | | | | | | Total income (loss) | | | 270,615,213 | | | | (78,243,696 | ) | | | (230,574,478 | ) | | | 397,840,388 | | | | | | | | | | | | | | | | | | | | | Expenses | | | | | | | | | | | | | | | | | | General Partner management fees (Note 3) | | | 2,943,845 | | | | 3,619,261 | | | | 9,401,948 | | | | 11,462,884 | | | Professional fees | | | 336,088 | | | | 643,479 | | | | 1,521,840 | | | | 1,989,912 | | | Brokerage commissions | | | 1,248,593 | | | | 1,544,097 | | | | 3,775,114 | | | | 5,376,805 | | | Directors' fees and insurance | | | 90,856 | | | | 95,863 | | | | 271,193 | | | | 277,504 | | | License fees | | | 98,128 | | | | 120,642 | | | | 313,398 | | | | 382,096 | | | Registration fees | | | 87,822 | | | | 87,823 | | | | 260,603 | | | | 252,159 | | | | | | | | | | | | | | | | | | | | | Total expenses | | | 4,805,332 | | | | 6,111,165 | | | | 15,544,096 | | | | 19,741,360 | | | | | | | | | | | | | | | | | | | | | Net income (loss) | | $ | 265,809,881 | | | $ | (84,354,861 | ) | | $ | (246,118,574 | ) | | $ | 378,099,028 | | | Net income (loss) per limited partnership share | | $ | 0.97 | | | $ | (0.56 | ) | | $ | (1.27 | ) | | $ | (0.02 | ) | | Net income (loss) per weighted average limited partnership share | | $ | 1.00 | | | $ | (0.28 | ) | | $ | (0.91 | ) | | $ | 1.14 | | | Weighted average limited partnership shares outstanding | | | 264,872,826 | | | | 303,886,957 | | | | 271,439,560 | | | | 331,528,832 | |
* Interest income does not exceed paid in kind of 5%.
See accompanying notes to condensed financial statements.
United States Oil Fund, LP
Condensed Statement of Changes in Partners' Capital (Unaudited)
For the nine months ended September 30, 2017
| | | General Partner | | | Limited Partners | | | Total | | | | | | | | | | | | | | Balances, at December 31, 2016 | | $ | — | | | $ | 3,101,956,669 | | | $ | 3,101,956,669 | | | Addition of 348,000,000 partnership shares | | | — | | | | 3,482,048,137 | | | | 3,482,048,137 | | | Redemption of 391,900,000 partnership shares | | | — | | | | (4,029,164,045 | ) | | | (4,029,164,045 | ) | | Net income (loss) | | | — | | | | (246,118,574 | ) | | | (246,118,574 | ) | | | | | | | | | | | | | | | | Balances, at September 30, 2017 | | $ | — | | | $ | 2,308,722,187 | | | $ | 2,308,722,187 | | | | | | | | | | | | | | | | | Net Asset Value Per Share: | | | | | | | | | | | | | | At December 31, 2016 | | | | | | | | | | $ | 11.71 | | | At September 30, 2017 | | | | | | | | | | $ | 10.44 | |
See accompanying notes to condensed financial statements. United States Oil Fund, LP Schedule of Investments At December 31, 2023 | | | | | | | | | | | | | | | | | | Fair | | | | | | | | | | Value/ | | | | | | | | | | Unrealized Gain | | | | | | | | | | (Loss) on Open | | | | | Notional | | Number of | | Commodity | | % of Partners’ | | | Amount | | Contracts | | Contracts | | Capital | Open Commodity Futures Contracts - Long | | | | | | | | | | | United States Contracts | | | | | | | | | | | NYMEX WTI Crude Oil Futures CL February 2024 contracts, expiring January 2024 | | $ | 1,225,940,440 | | 17,200 | | $ | 6,439,560 | | 0.41 | NYMEX WTI Crude Oil Futures CL March 2024 contracts, expiring February 2024 | | | 68,259,150 | | 903 | | | (3,387,630) | | (0.22) | Total Open Futures Contracts* | | $ | 1,294,199,590 | | 18,103 | | $ | 3,051,930 | | 0.19 |
| | | | | | | | | | | Shares/Principal | | | | | % of Partners’ | | | Amount | | Market Value | | Capital | Cash Equivalents | | | | | | | | | United States Money Market Funds | | | | | | | | | Morgan Stanley Institutional Liquidity Funds - Government Portfolio - Institutional Shares, 5.27%# | | | 327,450,000 | | $ | 327,450,000 | | 20.89 | Total United States Money Market Funds | | | | | $ | 327,450,000 | | 20.89 |
| | | | | | | | | | | | | | | | | | | | | | | | | | | | | | | | | | | | | | Unrealized | | | | | | | | | | | | | | Fair | | | | Gain (Loss) | | | | | | | | | | | | | | Value/Open | | | | on | Fund Receives | | | | | | | | | | | | | Commodity | | Upfront | | Commodity | from | | Fund Pays | | | | Payment | | Expiration | | Notional | | Swap | | Payments/(Premiums | | Swap | Counterparty | | Counterparty | | Counterparty | | Frequency | | Date | | Amount | | Contracts | | Received) | | Contracts(a) | MACQUARIE MQCP361E 01192024Index(b) | | 0.26 | % | Macquarie Bank Ltd. | | monthly | | 01/19/2024 | | $ | 156,190,238 | | $ | 156,189,126 | | — | | $ | (1,112) | SOC GEN SGIXCWTI 12292023Index(b) | | 0.25 | % | Societe Generale | | monthly | | 06/28/2024 | | | 114,296,974 | | | 114,296,180 | | — | | | (794) | Total Open OTC Commodity Swap ContractsÙ | | | | | | | | | | $ | 270,487,212 | | $ | 270,485,306 | | — | | $ | (1,906) |
(a)Reflects the value at reset date of December 29, 2023. (b)Custom index comprised of a basket of underlying instruments. #Reflects the 7-day yield at December 31, 2023. ÙCollateral amounted to $27,568,431 on open OTC commodity swap contracts. *Collateral amounted to $483,719,510 on open commodity futures contracts. See accompanying notes to financial statements. United States Oil Fund, LP Condensed Statements of Cash FlowsOperations (Unaudited) For the ninethree months ended September 30, 2017March 31, 2024 and 20162023 | | | Nine months ended
September 30, 2017 | | | Nine months ended
September 30, 2016 | | | Cash Flows from Operating Activities: | | | | | | | | | | Net income (loss) | | $ | (246,118,574 | ) | | $ | 378,099,028 | | | Adjustments to reconcile net income (loss) to net cash provided by (used in) operating activities: | | | | | | | | | | (Increase) decrease in commodity futures trading account - cash and cash equivalents | | | 95,279,044 | | | | 311,843,294 | | | Unrealized (gain) loss on open futures contracts | | | (11,252,100 | ) | | | (270,039,300 | ) | | (Increase) decrease in dividends receivable | | | (42,364 | ) | | | (166,865 | ) | | (Increase) decrease in interest receivable | | | (58,562 | ) | | | — | | | (Increase) decrease in directors' fees and insurance receivable | | | (11,035 | ) | | | (15,931 | ) | | (Increase) decrease in prepaid registration fees | | | 260,603 | | | | (638,599 | ) | | (Increase) decrease in ETF transaction fees receivable | | | 3,000 | | | | — | | | Increase (decrease) in payable due to Broker | | | (57,659,793 | ) | | | 64,960,641 | | | Increase (decrease) in General Partner management fees payable | | | (350,117 | ) | | | (25,434 | ) | | Increase (decrease) in professional fees payable | | | (674,717 | ) | | | 5,887 | | | Increase (decrease) in brokerage commissions payable | | | (48,000 | ) | | | (25,000 | ) | | Increase (decrease) in directors' fees and insurance payable | | | (26,116 | ) | | | (42,863 | ) | | Increase (decrease) in license fees payable | | | (61,261 | ) | | | 35,611 | | | Net cash provided by (used in) operating activities | | | (220,759,992 | ) | | | 483,990,469 | | | | | | | | | | | | | Cash Flows from Financing Activities: | | | | | | | | | | Addition of partnership shares | | | 3,448,660,597 | | | | 3,046,756,478 | | | Redemption of partnership shares | | | (4,096,107,833 | ) | | | (3,148,075,673 | ) | | Net cash provided by (used in) financing activities | | | (647,447,236 | ) | | | (101,319,195 | ) | | | | | | | | | | | | Net Increase (Decrease) in Cash and Cash Equivalents | | | (868,207,228 | ) | | | 382,671,274 | | | | | | | | | | | | | Cash and Cash Equivalents, beginning of period | | | 2,920,517,807 | | | | 2,725,177,054 | | | Cash and Cash Equivalents, end of period | | $ | 2,052,310,579 | | | $ | 3,107,848,328 | |
| | | | | | | | | Three months ended | | Three months ended | | | March 31, 2024 | | March 31, 2023 | Income | | | | | | | Gain (loss) on trading of commodity futures and swap contracts: | | | | | | | Realized gain (loss) on closed commodity futures contracts | | $ | 127,430,470 | | $ | (29,687,453) | Realized gain (loss) on closed OTC commodity swap contracts | | | 45,287,234 | | | (17,423,934) | Change in unrealized gain (loss) on open commodity futures contracts | | | 53,425,880 | | | (36,340,617) | Change in unrealized gain (loss) on open OTC commodity swap contracts | | | (182) | | | 2,194 | Dividend income | | | 4,225,433 | | | 5,094,474 | Interest income | | | 12,692,307 | | | 11,448,517 | ETF transaction fees | | | 108,000 | | | 71,000 | Total Income (Loss) | | $ | 243,169,142 | | $ | (66,835,819) | | | | | | | | Expenses | | | | | | | General Partner management fees (Note 3) | | $ | 1,583,453 | | $ | 1,875,162 | Professional fees | | | 727,464 | | | 516,580 | Brokerage commissions | | | 394,046 | | | 175,146 | Directors’ fees and insurance | | | 116,227 | | | 194,237 | License fees | | | 52,781 | | | 62,505 | Total Expenses | | $ | 2,873,971 | | $ | 2,823,630 | Net Income (Loss) | | $ | 240,295,171 | | $ | (69,659,449) | Net Income (Loss) per limited partner share | | $ | 12.02 | | $ | (3.58) | Net Income (Loss) per weighted average limited partner share | | $ | 12.21 | | $ | (2.76) | Weighted average limited partner shares outstanding | | | 19,677,449 | | | 25,225,825 |
See accompanying notes to condensed financial statements. United States Oil Fund, LP Condensed Statements of Changes in Partners’ Capital (Unaudited) For the three months ended March 31, 2024 and 2023 | | | | | | | | | Limited Partners* | | | Three months ended | | Three months ended | | | March 31, 2024 | | March 31, 2023 | Balances at beginning of period | | $ | 1,567,345,541 | | $ | 1,977,015,338 | Addition of 33,400,000 and 13,300,000 partnership shares, respectively | | | 2,396,976,031 | | | 861,028,987 | Redemption of (38,800,000) and (17,000,000) partnership shares, respectively | | | (2,782,022,726) | | | (1,138,183,917) | Net income (loss) | | | 240,295,171 | | | (69,659,449) | | | | | | | | Balances at end of period | | $ | 1,422,594,017 | | $ | 1,630,200,959 |
| * | General Partners’ shares outstanding and capital for the periods presented were zero. |
See accompanying notes to condensed financial statements. United States Oil Fund, LP Condensed Statements of Cash Flows (Unaudited) For the three months ended March 31, 2024 and 2023 | | | | | | | | | Three months ended | | Three months ended | | | March 31, 2024 | | March 31, 2023 | Cash Flows from Operating Activities: | | | | | | | Net income (loss) | | $ | 240,295,171 | | $ | (69,659,449) | Adjustments to reconcile net income (loss) to net cash provided by (used in) operating activities: | | | | | | | Change in unrealized (gain) loss on open commodity futures contracts | | | (53,425,880) | | | 36,340,617 | Change in unrealized (gain) loss on open swap contracts | | | 182 | | | (2,194) | (Increase) decrease in dividends receivable | | | 11,260 | | | 3,156,834 | (Increase) decrease in interest receivable | | | 516,734 | | | (1,816,387) | (Increase) decrease in investment securities sold | | | — | | | — | (Increase) decrease in prepaid insurance | | | (170,729) | | | (355,089) | (Increase) decrease in ETF transaction fees receivable | | | (2,000) | | | — | Increase (decrease) payable due to custody | | | — | | | (1,012,851) | Increase (decrease) in payable due to Broker | | | (16,865,582) | | | 3,309,888 | Increase (decrease) in General Partner management fees payable | | | (55,052) | | | (254,263) | Increase (decrease) in professional fees payable | | | (686,840) | | | (1,049,376) | Increase (decrease) in brokerage commissions payable | | | — | | | 2,151 | Increase (decrease) in directors’ fees payable | | | 577 | | | (8,333) | Increase (decrease) in license fees payable | | | (7,049) | | | (19,534) | Net cash provided by (used in) operating activities | | | 169,610,792 | | | (31,367,986) | | | | | | | | Cash Flows from Financing Activities: | | | | | | | Addition of partnership shares | | | 2,377,990,041 | | | 861,028,987 | Redemption of partnership shares | | | (2,742,557,740) | | | (1,138,183,917) | Net cash provided by (used in) financing activities | | | (364,567,699) | | | (277,154,930) | | | | | | | | Net Increase (Decrease) in Cash and Cash Equivalents | | | (194,956,907) | | | (308,522,916) | | | | | | | | Total Cash, Cash Equivalents and Equity in Trading Accounts, beginning of period | | | 1,463,696,515 | | | 1,953,896,501 | Total Cash, Cash Equivalents and Equity in Trading Accounts, end of period | | $ | 1,268,739,608 | | $ | 1,645,373,585 | | | | | | | | Components of Cash and Cash Equivalents, and Equity in Trading Account: | | | | | | | Cash and cash equivalents | | $ | 909,064,898 | | $ | 563,367,949 | Equity in Trading Accounts: | | | | | | | Cash and cash equivalents | | | 359,674,710 | | | 1,082,005,636 | Total Cash, Cash Equivalents and Equity in Trading Accounts | | $ | 1,268,739,608 | | $ | 1,645,373,585 |
See accompanying notes to condensed financial statements. United States Oil Fund, LP Notes to Condensed Financial Statements (Unaudited) For the period ended September 30, 2017 (Unaudited) March 31, 2024 NOTE 1 — ORGANIZATION AND BUSINESS The United States Oil Fund, LP (“USO”) was organized as a limited partnership under the laws of the state of Delaware on May 12, 2005. USO is a commodity pool that issues limited partnership sharesinterests (“shares”) that may be purchased and soldare traded on the NYSE Arca, Inc. (the “NYSE Arca”). Prior to November 25, 2008, USO’s shares traded on the American Stock Exchange (the “AMEX”). USO will continue in perpetuity, unless terminated sooner upon the occurrence of one or more events as described in its SixthSeventh Amended and Restated Agreement of Limited Partnership dated as of March 1, 2013December 15, 2017 (the “LP Agreement”), which grants full management control to its general partner, United States Commodity Funds LLC (“USCF”). The investment objective of USO is for the daily changes in percentage terms of its shares’ per share net asset value (“NAV”) to reflect the daily changes in percentage terms of the spot price of light, sweet crude oil delivered to Cushing, Oklahoma, as measured by the daily changes in the price of the Benchmark Oil Futures Contract, plus interest earned on USO’s collateral holdings, less USO’s expenses. The Benchmark Oil Futures Contract is the futures contract for light, sweet crude oil as traded on the New York Mercantile Exchange (the “NYMEX”) that is the near month contract to expire except whenand changes, over a ten-day period, into the NYMEX futures contract that is the next month to expire. The change from the near month contract is within two weeks of expiration, in which case the futures contract will beto the next month contract occurs at the beginning of each month and will be approximately proportional, relative to expire (the “Benchmark Oil Futures Contract”), less USO’s expenses.total net assets, over each day of the ten-day roll period. USO’sUSO seeks to achieve its investment objective isnot for its NAV or market price of shares to equal, in dollar terms,by investing so that the spot price of light, sweet crude oil or any particular futures contract based on light, sweet crude oil,nor is USO’s investment objective for theaverage daily percentage change in itsUSO’s NAV to reflectfor any period of 30 successive valuation days will be within plus/minus ten percent (10)% of the average daily percentage change ofin the price of any particular futures contract as measuredthe Benchmark Oil Futures Contract over the same period. As a time periodgreater than one day.result, investors should be aware that USO would meet its investment objective even if there are significant deviations between changes in its daily NAV and changes in the daily price of the Benchmark Oil Futures Contract provided that the average daily percentage change in USO’s NAV over 30 successive valuation days is within plus/minus ten percent (10%) of the average daily percentage change in the price of the Benchmark Oil Futures Contract over the same period.
United States Commodity Funds LLC (“USCF”), the general partner of USO believes that it is not practical to manage the portfolioseeks to achieve such anits investment goal whenobjective by investing in Oil Futures Contracts (as defined below) and Other Oil-Related Investments (as defined below). USO accomplishes its objective through investmentsprimarily in futures contracts for light, sweet crude oil and other types of crude oil, diesel-heating oil, gasoline, natural gas and other petroleum-based fuels that are traded on the NYMEX, ICE Futures or other U.S. and foreign exchanges (collectively, “Oil Futures Contracts”) and to a lesser extent, in order to comply with regulatory requirements, risk mitigation measures (including those that may be taken by USO, USO’s FCMs, counterparties or other market participants), liquidity requirements, or in view of market conditions, and other oil-related investments such as cash-settled options on Oil Futures Contracts, forward contracts for oil, cleared swap contracts and over-the-counter (“OTC”) transactions that are based on the price of crude oil, diesel-heating oil, gasoline, natural gas and other petroleum-based fuels, Oil Futures Contracts and indices based on the foregoing (collectively, “Other Oil-Related Investments”). As of September 30, 2017,March 31, 2024, USO held 44,68213,301 Oil Futures Contracts for light, sweet crude oil traded on the NYMEX and did not hold any Oil Futures Contracts for light, sweet crude oil traded on the ICE Futures Europe.
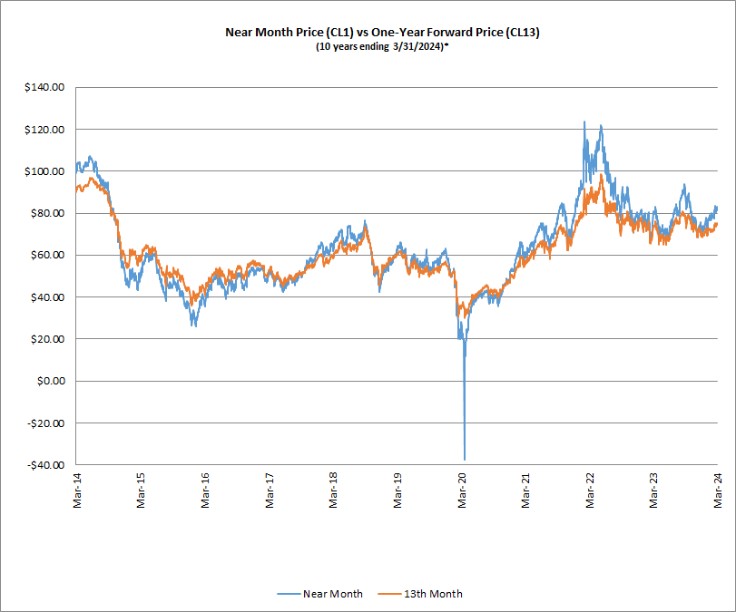
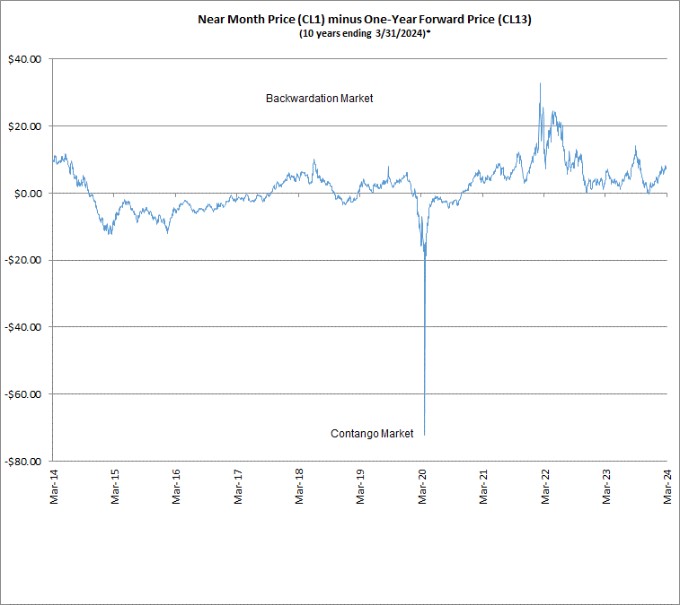
Following the significant market volatility that occurred in the Spring of 2020 and the market conditions, regulatory requirements and risk mitigation measures taken by USO and USO’s FCM that impacted USO as a result thereof, USO previously disclosed the parameters for making decisions regarding the permitted investments USO would hold, including the intended order of priority in selecting investments and the type of investments to be held in its portfolio. Beginning with the monthly roll in September 2023 and ending with the monthly roll in January 2024, USO began transitioning its investment portfolio so that it primarily invests in Benchmark Oil Futures Contracts, consistent with USO’s investment strategy prior to the Spring of 2020. However, USO has had, and will continue to have, the ability to invest in Oil Futures Contracts beyond the Benchmark Oil Futures Contract and Other Oil-Related Investments, such as OTC swaps, and USO may make such investments if market conditions, regulatory requirements, risk mitigation measures (including those that may be taken by USO, USO’s FCMs, counterparties or other market participants), liquidity requirements, or other factors require USO to do so in order to meet its investment objective. USO may invest in Oil Futures Contracts beyond the Benchmark Oil Futures Contract, and/or Other Oil-Related Investments, as a result or in response to any of the foregoing factors. Investors should be aware that USO’s investment objective is not for its NAV or market price of shares to equal, in dollar terms, the spot price of light, sweet crude oil or any particular futures contract based on light, sweet crude oil, nor is USO’s investment objective for the percentage change in its NAV to reflect the percentage change of the price of any particular futures contract as measured over a time period greater than one day. This is because natural market forces called contango and backwardation may impact and have impacted the total return on an investment in USO’s shares relative to a hypothetical direct investment in crude oil and, in the future, it is likely that the relationship between the market price of USO’s shares and changes in the spot prices of light, sweet crude oil will continue to be impacted by contango and backwardation. While USO’s shares may be impacted by contango and backwardation, the potential costs associated with physically owning and storing crude oil, could be substantial. USCF believes that it is not practical to manage the portfolio to achieve the foregoing investment objective when investing in Oil Futures Contracts (as defined below) and Other Oil-Related Investments (as defined below). USO commenced investment operations on April 10, 2006 and has a fiscal year ending on December 31. USCF is responsible for the management of USO. USCF is a member of the National Futures Association (the “NFA”) and became registered as a commodity pool operator with the Commodity Futures Trading Commission (the “CFTC”) effective December 1, 2005 and a swaps firm on August 8, 2013. USCF is also the general partner of the United States Natural Gas Fund, LP (“UNG”), the United States 12 Month Oil Fund, LP (“USL”), the United States Gasoline Fund, LP (“UGA”) and the United States Diesel-Heating Oil Fund, LP (“UHN”), which listed their limited partnership shares on the AMEX under the ticker symbols “UNG” on April 18, 2007, “USL” on December 6, 2007, “UGA” on February 26, 2008 and “UHN” on April 9, 2008, respectively. As a result of the acquisition of the AMEX by NYSE Euronext, each of UNG’s, USL’s, UGA’s and UHN’s shares commenced trading on the NYSE Arca on November 25, 2008. USCF is also the general partner of the United States Short Oil Fund, LP (“DNO”), the United States 12 Month Natural Gas Fund, LP (“UNL”) and the United States Brent Oil Fund, LP (“BNO”), which listed their limited partnership shares on the NYSE Arca under the ticker symbols “DNO” on September 24, 2009, “UNL” on November 18, 2009 and “BNO” on June 2, 2010, respectively. . USCF is also the sponsor of the United States Commodity Index Funds Trust (“USCIFT”), a Delaware statutory trust and each of its series: the United States Commodity Index Fund (“USCI”), and the United States Copper Index Fund (“CPER”), the United States Agriculture Index Fund (“USAG”). UNG, UGA, UNL, USL, BNO, USCI and the USCF Canadian Crude Oil Index Fund (“UCCO”), each a series of the United States Commodity Index Funds Trust. USCI, CPER and USAG listed their shares on the NYSE Arca under the ticker symbol “USCI” on August 10, 2010, “CPER” on November 15, 2011 and “USAG” on April 13, 2012, respectively. UCCO is currently in registration and has not commenced operations. In addition, USCF is the sponsor of the USCF Funds Trust, a Delaware statutory trust, and each of its series, the REX S&P MLP Fund and the REX S&P MLP Inverse Fund, which are currently in registration and have not commenced operations (together, the “REX Funds”), and the United States 3x Oil Fund (“USOU”) and the United States 3x Short Oil Fund (“USOD”), which commenced operations on July 20, 2017.
All funds listed previously, other than UCCO and the REX Funds, are referred to collectively herein as the “Related Public Funds.”
USO issues shares to certain authorized purchasers (“Authorized Participants”) by offering baskets consisting of 100,000 shares (“Creation Baskets”) through ALPS Distributors, Inc., as the marketing agent (the “Marketing Agent”). The purchase price for a Creation Basket is based upon the NAV of a share calculated shortly after the close of the core trading session on the NYSE Arca on the day the order to create the basket is properly received. In addition, Authorized Participants pay USO a transaction fee of $1,000 fee for each order placedthey place to create one or more Creation Baskets or to redeem one or more baskets (“Redemption Baskets”), consisting of 100,000 shares. Shares may be purchased or sold on a nationally recognized securities exchange in smaller increments than a Creation Basket or Redemption Basket. Shares purchased or sold on a nationally recognized securities exchange are not purchased or sold at the per share NAV of USO but rather at market prices quoted on such exchange.
On April 28, 2020, after the close of trading on the NYSE Arca, USO effected a 1-for-8 reverse share split and post-split shares of USO began trading on April 29, 2020. As a result of the reverse share split, every eight pre-split shares of USO were automatically exchanged for one post-split share. Immediately prior to the reverse split, there were 1,482,900,000 shares of USO issued and outstanding, representing a per share NAV of $2.04. Immediately after the effect of the reverse share split, the number of issued and outstanding shares of USO decreased to 185,362,500, not accounting for fractional shares, and the per share NAV increased to $16.35. In connection with the reverse share split, the CUSIP number for USO’s shares changed to 91232N207. USO’s ticker symbol, “USO,” remains the same. The accompanying financial statements have been adjusted to reflect the effect of the reverse share split on a retroactive basis. In April 2006, USO initially registered 17,000,000 shares on Form S-1 with the U.S. Securities and Exchange Commission (the “SEC”). On April 10, 2006, USO listed its shares on the AMEX under the ticker symbol “USO” and switched to trading on the NYSE Arca under the same ticker symbol on November 25, 2008. On that day, USO established its initial per share NAV by setting the price at $67.39 and issued 200,000 shares in exchange for $13,479,000. USO also commenced investment operations on April 10, 2006, by purchasing Oil Futures Contracts traded on the NYMEX based on light, sweet crude oil. USO has an unlimited number of shares registered and available for issuance. On August 29, 2023, the SEC declared effective a registration statement filed by USO that registered an unlimited number of shares. As a result, USO has an unlimited number of September 30, 2017, USO had registered a totalshares that can be issued in the form of 3,127,000,000 shares. Creation Baskets. The accompanying unaudited condensed financial statements have been prepared in accordance with Rule 10-01 of Regulation S-X promulgated by the SEC and, therefore, do not include all information and footnote disclosure required under generally accepted accounting principles in the United States of America (“U.S. GAAP”). The financial information included herein is unaudited; however, such financial information reflects all adjustments, consisting only of normal recurring adjustments, which are, in the opinion of USCF, necessary for the fair presentation of the condensed financial statements for the interim period. NOTE 2 — SUMMARY OF SIGNIFICANT ACCOUNTING POLICIES Basis of Presentation The condensed financial statements have been prepared in conformity with U.S. GAAP as detailed in the Financial Accounting Standards Board’s (“FASB”) Accounting Standards Codification. USO is an investment company for accounting purposes and follows the accounting and reporting guidance in FASB Topic 946. Revenue Recognition Commodity futures contracts, swap and forward contracts, physical commodities and related options are recorded on the trade date. All such transactions are recorded on the identified cost basis and marked to market daily. Unrealized gains or losses on open contracts are reflected in the condensed statements of financial condition and represent the difference between the original contract amount and the market value (as determined by exchange settlement prices for futures contracts and related options and cash dealer prices at a predetermined time for swap and forward contracts, physical commodities, and their related options) as of the last business day of the year or as of the last date of the condensed financial statements. Changes in the unrealized gains or losses between periods are reflected in the condensed statements of operations. USO earns income on funds held at the custodian or futures commission merchantmerchants (“FCM”FCMs”) at prevailing market rates earned on such investments. Brokerage Commissions Brokerage commissions on all open commodity futures contracts are accrued on a full-turn basis. Income Taxes USO is not subject to federal income taxes; each partner reports his/her allocable share of income, gain, loss, deductions or credits on his/her own income tax return. In accordance with U.S. GAAP, USO is required to determine whether a tax position is more likely than not to be sustained upon examination by the applicable taxing authority, including resolution of any tax related appeals or litigation processes, based on the technical merits of the position. USO files an income tax return in the U.S. federal jurisdiction and may file income tax returns in various U.S. states. USO is not subject to income tax return examinations by major taxing authorities for years before 2014.2019. The tax benefit recognized is measured as the largest amount of benefit that has a greater than fifty percent likelihood of being realized upon ultimate settlement. De-recognition of a tax benefit previously recognized results in USO recording a tax liability that reduces net assets. However, USO’s conclusions regarding this policy may be subject to review and adjustment at a later date based on factors including, but not limited to, on-going analysis of and changes to tax laws, regulations and interpretations thereof. USO recognizes interest accrued related to unrecognized tax benefits and penalties related to unrecognized tax benefits in income tax fees payable, if assessed. No interest expense or penalties have been recognized as of and for the period ended September 30, 2017. March 31, 2024. Creations and Redemptions Authorized Participants may purchase Creation Baskets or redeem Redemption Baskets only in blocks of 100,000 shares at a price equal to the NAV of the shares calculated shortly after the close of the core trading session on the NYSE Arca on the day the order is placed. USO receives or pays the proceeds from shares sold or redeemed within threetwo business days after the trade date of the purchase or redemption. The amounts due from Authorized Participants are reflected in USO’s condensed statements of financial condition as receivable for shares sold and amounts payable to Authorized Participants upon redemption are reflected as payable for shares redeemed. Authorized Participants pay USO a $1,000 transaction fee of $1,000 for each order placed to create one or more Creation Baskets or to redeem one or more Redemption Baskets. Partnership Capital and Allocation of Partnership Income and Losses Profit or loss shall be allocated among the partners of USO in proportion to the weighted-average number of shares each partner holds as of the close of each month. USCF may revise, alter or otherwise modify this method of allocation as described in the LP Agreement. Calculation of Per Share NAV USO’s per share NAV is calculated on each NYSE Arca trading day by taking the current market value of its total assets, subtracting any liabilities and dividing that amount by the total number of shares outstanding. USO uses the closing price for the contracts on the relevant exchange on that day to determine the value of contracts held on such exchange. Net Income (Loss) Per Share Net income (loss) per share is the difference between the per share NAV at the beginning of each period and at the end of each period. The weighted average number of shares outstanding was computed for purposes of disclosing net income (loss) per weighted average share. The weighted average shares are equal to the number of shares outstanding at the end of the period, adjusted proportionately for shares added and redeemed based on the amount of time the shares were outstanding during such period. There were no shares held by USCF at September 30, 2017.March 31, 2024. Offering Costs Offering costs incurred in connection with the registration of additional shares after the initial registration of shares are borne by USO. These costs include registration fees paid to regulatory agencies and all legal, accounting, printing and other expenses associated with such offerings. These costs are accounted for as a deferred charge and thereafter amortized to expense over twelve months on a straight-line basis or a shorter period if warranted. Cash Equivalents Cash equivalents include money market funds and overnight deposits or time deposits with original maturity dates of sixthree months or less. Reclassification
Certain amounts in the accompanying condensed financial statements were reclassified to conform to the current presentation.
Use of Estimates The preparation of condensed financial statements in conformity with U.S. GAAP requires USCF to make estimates and assumptions that affect the reported amount of assets and liabilities and disclosure of contingent assets and liabilities at the date of the condensed financial statements, and the reported amounts of the revenue and expenses during the reporting period. Actual results may differ from those estimates and assumptions. NOTE 3 — FEES PAID BY THE FUND AND RELATED PARTY TRANSACTIONS USCF Management Fee Under the LP Agreement, USCF is responsible for investing the assets of USO in accordance with the objectives and policies of USO. In addition, USCF has arranged for one or more third parties to provide administrative, custody, accounting, transfer agency and other necessary services to USO. For these services, USO is contractually obligated to pay USCF a fee, which is paid monthly, equal to 0.45% per annum of average daily total net assets. Ongoing Registration Fees and Other Offering Expenses USO pays all costs and expenses associated with the ongoing registration of its shares subsequent to the initial offering. These costs include registration or other fees paid to regulatory agencies in connection with the offer and sale of shares, and all legal, accounting, printing and other expenses associated with such offer and sale. For the ninethree months ended September 30, 2017March 31, 2024 and 2016,2023, USO incurred $260,603 and $252,159, respectively, indid not incur registration fees and other offering expenses. Independent Directors’ and Officers’ Expenses USO is responsible for paying its portion of the directors’ and officers’ liability insurance for USO and the Related Public Funds and the fees and expenses of the independent directors who also serve as audit committee members of USO and the Related Public Funds. USO shares the fees and expenses on a pro rata basis with each Related Public Fund, as described above, based on the relative assets of each Related Public Fund computed on a daily basis. These fees and expenses for the year ending December 31, 20172024 are estimated to be a total of $361,350$441,000 for USO and, in the aggregate for USO and the Related Public Funds, $539,350. $945,000. Licensing Fees As discussed in Note 4 below, USO entered into a licensing agreement with the NYMEX on December April 10, 2006, as amended on October 20, 2011. Pursuant to the agreement, USO and the Related Public Funds, other than BNO, USCI CPER and USAG,CPER, pay a licensing fee that is equal to 0.015% on all net assets. During the ninethree months ended September 30, 2017March 31, 2024 and 2016,2023, USO incurred $313,398$52,781 and $382,096,$62,505, respectively under this arrangement.
Investor Tax Reporting Cost The fees and expenses associated with USO’s audit expenses and tax accounting and reporting requirements are paid by USO. These costs are estimated to be $2,100,000$2,300,000 for the year ending December 31, 2017.2024. Tax reporting costs fluctuate between years due to the number of shareholders during any given year. Other Expenses and Fees In addition to the fees described above, USO pays all brokerage fees and other expenses in connection with the operation of USO, excluding costs and expenses paid by USCF as outlined inNote 4 – Contracts and Agreements below. below. NOTE 4 — CONTRACTS AND AGREEMENTS Marketing Agent Agreement USO is party to a marketing agent agreement, dated as of March 13, 2006, as amended from time to time, with the Marketing Agent and USCF, whereby the Marketing Agent provides certain marketing services for USO as outlined in the agreement. The fees of the Marketing Agent through September 30, 2022, which arewere borne by USCF, includeincluded a marketing fee of $425,000 per annum plus the following incentive fee: 0.00% on USO’s assets from $0 – $500 million; 0.04% on USO’s assets from $500 million – $4 billion and 0.03% on USO'sUSO’s assets in excess of $4 billion. The agreement with the Marketing Agent was amended and, commencing October 1, 2022, the fee of the Marketing Agent, which is calculated daily and payable monthly by USCF, is equal to 0.025% of USO’s total net assets. In no event may the aggregate compensation paid to the Marketing Agent and any affiliate of USCF for distribution-related services exceed 10% of the gross proceeds of USO’s offering. The above fee does not include website construction and development, which are also borne by USCF. Brown Brothers Harriman & Co.Custody, Transfer Agency and Fund Administration and Accounting Services Agreements
USCF engaged The Bank of New York Mellon, a New York corporation authorized to conduct a banking business (“BNY Mellon”), to provide USO is also partyand each of the Related Public Funds with certain custodial, administrative and accounting, and transfer agency services, pursuant to the following agreements with BNY Mellon dated as of March 20, 2020 (together, the “BNY Mellon Agreements”), which were effective as of April 1, 2020: (i) a custodian agreement, dated March 13, 2006, as amended from time to time, with Brown Brothers Harriman & Co. (“BBH&Co.”)Custody Agreement; (ii) a Fund Administration and USCF, whereby BBH&Co. holds investments on behalf of USO.Accounting Agreement; and (iii) a Transfer Agency and Service Agreement. USCF pays the fees of the custodian, which are determined by the parties from time to time. In addition, USO is party to an administrative agency agreement, dated March 13, 2006, as amended from time to time, with USCF and BBH&Co., whereby BBH&Co. acts as the administrative agent, transfer agent and registrar for USO. USCF also pays the fees of BBH&Co.BNY Mellon for its services under such agreementthe BNY Mellon Agreements and such fees are determined by the parties from time to time. Currently, USCF pays BBH&Co. for its services, in the foregoing capacities, a minimum amount of $75,000 annually for its custody, fund accounting and fund administration services rendered to USO and each of the Related Public Funds, as well as a $20,000 annual fee for its transfer agency services. In addition, USCF pays BBH&Co. an asset-based charge of (a) 0.06% for the first $500 million of the Related Public Funds’ combined net assets, (b) 0.0465% for the Related Public Funds’ combined net assets greater than $500 million but less than $1 billion, and (c) 0.035% once the Related Public Funds’ combined net assets exceed $1 billion. The annual minimum amount will not apply if the asset-based charge for all accounts in the aggregate exceeds $75,000. USCF also pays BBH&Co. transaction fees ranging from $7 to $15 per transaction.
Brokerage and Futures Commission Merchant Agreements On October 8, 2013, USO entered into a brokerage agreement with RBC Capital Markets LLC (“RBC Capital” or “RBC”RBC”) to serve as USO’s FCM effective October 10, 2013. USO has engaged each of Marex North America, LLC, formerly RCG Division of Marex Spectron (“MNA”), Marex Capital Markets Inc., formerly E D & F Man Capital Markets Inc. (“MCM”), Macquarie Futures USA LLC (“MFUSA”) and ADM Investor Services, Inc. (“ADMIS”) to serve as additional FCMs to USO effective on May 28, 2020, June 5, 2020, December 3, 2020 and August 8, 2023, respectively. The agreementagreements with RBC requires itUSO’s FCMs require the FCMs to provide services to USO in connection with the purchase and sale of Oil Futures Contracts and Other Oil-Related Investments that may be purchased and sold by or through RBC Capitalthe applicable FCM for USO’s account. In accordance with the agreement, RBC Capital chargesFCM agreements, USO pays each FCM commissions of approximately $7 to $8 per round-turn trade, including applicable exchange, clearing and NFA fees for Oil Futures Contracts and options on Oil Futures Contracts. Such fees include those incurred when purchasing Oil Futures Contracts and options on Oil Futures Contracts when USO issues shares as a result of a Creation Basket, as well as fees incurred when selling Oil Futures Contracts and options on Oil Futures Contracts when USO redeems shares as a result of a Redemption Basket. Such fees are also incurred when Oil Futures Contracts and options on Oil Futures Contracts are purchased or redeemed for the purpose of rebalancing the portfolio. USO also incurs commissions to brokers for the purchase and sale of Oil Futures Contracts, Other Oil-Related Investments or short-term obligations of the United States of two years or less (“Treasuries”).
| | | For the nine months
ended September 30,
2017 | | | For the nine months
ended September 30,
2016 | | | Total commissions accrued to brokers | | $ | 3,775,114 | | | $ | 5,376,805 | | | Total commissions as an annualized percentage of average total net assets | | | 0.18 | % | | | 0.21 | % | | Commissions accrued as a result of rebalancing | | $ | 3,311,727 | | | $ | 4,920,092 | | | Percentage of commissions accrued as a result of rebalancing | | | 87.73 | % | | | 91.51 | % | | Commissions accrued as a result of creation and redemption activity | | $ | 463,387 | | | $ | 456,713 | | | Percentage of commissions accrued as a result of creation and redemption activity | | | 12.27 | % | | | 8.49 | % |
| | | | | | | | | | Three months ended | | Three months ended | | | | March 31, 2024 | | March 31, 2023 | | Total commissions accrued to brokers | | $ | 394,046 | | $ | 175,146 | | Total commissions as annualized percentage of average total net assets | | | 0.11 | % | | 0.04 | % |
The decreaseincrease in the total commissions accrued to brokers by USO for the ninethree months ended September 30, 2017, asMarch 31, 2024, compared to the ninethree months ended September 30, 2016,March 31, 2023, was due primarily to a lesserhigher number of crude oil futures contracts being held and tradedtraded. For the three months ended March 31, 2024 and 2023, the monthly average volume of open futures contract notional value was $1,099,028,412 and $1,422,127,536, respectively. Swap Dealer Agreements USO entered into ISDA 2002 Master Agreements with each of Macquarie Bank Limited (the “Macquarie ISDA”) and Société Générale S.A. (“Société Générale ISDA”) on November 30, 2021 and June 13, 2022, respectively, pursuant to which each of Macquarie Bank Limited and Société Générale has agreed to serve as a resultan over-the-counter (“OTC”) swap counterparty for USO. The Macquarie ISDA and the Société Générale ISDA each provide USO with the ability to invest in OTC swaps in furtherance of USO’s smaller sizeinvestment objective by providing it with investment flexibility in termslight of average net assets.market conditions, liquidity, regulatory requirements, and risk diversification. USO may enter into OTC swap transactions under each of the Macquarie ISDA and Société Générale ISDA in light of the foregoing. Any OTC swap transactions of USO that are outstanding under the Macquarie ISDA and the Société Générale ISDA, along with USO’s other holdings, are posted on USO’s webpage, www.uscfinvestments.com. In accordance with each of the swap agreements described above, USO pays each swap dealer a flat fee in a range between 0.20% and 0.30% on the daily notional value of each OTC swap transaction. NYMEX Licensing Agreement
USO and the NYMEX entered into a licensing agreement on April 10, 2006, as amended on October 20, 2011, whereby USO was granted a non-exclusive license to use certain of the NYMEX’s settlement prices and service marks. Under the licensing agreement, USO and the Related Public Funds, other than BNO, USCI, CPER and USAG,CPER, pay the NYMEX an asset-based fee for the license, the terms of which are described in Note 3. USO expressly disclaims any association with the NYMEX or endorsement of USO by the NYMEX and acknowledges that “NYMEX” and “New York Mercantile Exchange” are registered trademarks of the NYMEX. NOTE 5 — FINANCIAL INSTRUMENTS, OFF-BALANCE SHEET RISKS AND CONTINGENCIES USO may engage in the trading of futures contracts, options on futures contracts, cleared swaps and OTC swaps (collectively, “derivatives”). USO is exposed to both market risk, which is the risk arising from changes in the market value of the contracts, and credit risk, which is the risk of failure by another party to perform according to the terms of a contract. USO may enter into futures contracts, options on futures contracts, cleared swaps, and OTC swaps to gain exposure to changes in the value of an underlying commodity. A futures contract obligates the seller to deliver (and the purchaser to accept) the future delivery of a specified quantity and type of a commodity at a specified time and place. Some futures contracts may call for physical delivery of the asset, while others are settled in cash. The contractual obligations of a buyer or seller may generally be satisfied by taking or making physical delivery of the underlying commodity or by making an offsetting sale or purchase of an identical futures contract on the same or linked exchange before the designated date of delivery. Cleared swaps are agreements that are eligible to be cleared by a clearinghouse, e.g., ICE Clear Europe, and provide the efficiencies and benefits that centralized clearing on an exchange offers to traders of futures contracts, including credit risk intermediation and the ability to offset positions initiated with different counterparties. OTC swaps are entered into between two parties in private contracts. In an OTC swap, each party bears credit risk to the other party, i.e., the risk that the other party may not be able to perform its obligations under the OTC swap. The purchase and sale of futures contracts, options on futures contracts and cleared swaps require margin deposits with an FCM. Additional deposits may be necessary for any loss on contract value. The Commodity Exchange Act requires an FCMFCMs to segregate all customer transactions and assets from the FCM’s proprietary activities. transactions and assets. To reduce the credit risk that arises in connection with OTC swaps, USO will generally enter into an agreement with each counterparty based on the Master Agreement published by the International Swaps and Derivatives Association, Inc., which provides for the netting of its overall exposure to its counterparty. The Master Agreement is negotiated as between the parties and would address, among other things, the exchange of margin between the parties. Futures contracts, options on futures contracts and cleared swaps involve, to varying degrees, elements of market risk (specifically commodity price risk) and exposure to loss in excess of the amount of variation margin. The face or contract amounts reflect the extent of the total exposure USO has in the particular classes of instruments. Additional risks associated with the use of futures contracts are an imperfect correlation between movements in the price of the futures contracts and the market value of the underlying securities and the possibility of an illiquid market for a futures contract. Buying and selling options on futures contracts exposes investors to the risks of purchasing or selling futures contracts. As to OTC swaps, valuing OTC derivatives is less certain than valuing actively traded financial instruments such as exchange-traded futures contracts and securities or cleared swaps, because the price and terms on which such OTC derivatives are entered into or can be terminated are individually negotiated, and those prices and terms may not reflect the best price or terms available from other sources. In addition, while market makers and dealers generally quote indicative prices or terms for entering into or terminating OTC contracts, they typically are not contractually obligated to do so, particularly if they are not a party to the transaction. As a result, it may be difficult to obtain an independent value for an outstanding OTC derivatives transaction. Significant market volatility has recently occurred in the crude oil markets and the crude oil futures markets. Such volatility is attributable in part to the COVID-19 pandemic, related supply chain disruptions, war, including the Russia-Ukraine war, attacks or threats of attack by terrorists, conflicts in the Middle East, and continuing disputes among oil-producing countries. These and other factors could cause continuing or increased volatility in the future, which may affect the value, pricing and liquidity of some investments or other assets, including those held by or invested in by USO and the impact of which could limit USO’s ability to have a substantial portion of its assets invested in the Futures Contracts and/or Other Oil-Related Investments, such as OTC swaps. All of the futures contracts held by USO through September 30, 2017March 31, 2024 were exchange-traded. The risks associated with exchange-traded contracts are generally perceived to be less than those associated with OTC swaps since, in OTC swaps, a party must rely solely on the credit of its respective individual counterparties. However, inUSO entered OTC swaps during the future, if USO were to enter into non-exchange traded contracts, it would beperiod ended March 31, 2022. These OTC swaps are subject to the credit risk associated with counterparty non-performance. The credit risk from counterparty non-performance associated with such instruments is the net unrealized gain, if any, on the transaction. USO also has credit risk under its futures contracts sinceto the sole counterparty to all domestic and foreign futures contracts, is the clearinghouse for the exchange on which the relevant contracts are traded. In addition, USO bears the risk of financial failure by the clearing broker. USO’s cash and other property, such as Treasuries, deposited with an FCMits FCMs are considered commingled with all other customer funds, subject to thesuch FCM’s segregation requirements. In the event of an FCM’s insolvency, recovery may be limited to a pro rata share of segregated funds available. It is possible that the recovered amount could be less than the total of cash and other property deposited. The insolvency of an FCM could result in the complete loss of USO’s assets posted with that FCM; however, the majority of USO’s assets are held in investments in Treasuries, cash and/or cash equivalents with USO’s custodian and would not be impacted by the insolvency of an FCM. The failure or insolvency of USO’s custodian, however, could result in a substantial loss of USO’s assets. USCF invests a portion of USO’s cash in money market funds that seek to maintain a stable per share NAV. USO is exposed to any risk of loss associated with an investment in such money market funds. As of September 30, 2017March 31, 2024 and December 31, 2016,2023, USO held investments in money market funds in the amounts of $250,000,000$327,450,000 and $748,000,001,$327,450,000, respectively. USO also holds cash deposits with its custodian. Pursuant to a written agreement with BBH&Co., uninvested overnight cash balances are swept to offshore branches of U.S. regulated and domiciled banks located in Toronto, Canada; London, United Kingdom; Grand Cayman, Cayman Islands; and Nassau, Bahamas; which are subject to U.S. regulation and regulatory oversight. As of September 30, 2017March 31, 2024 and December 31, 2016,2023, USO held cash deposits and investments in Treasuries in the amounts of $1,956,896,479$941,289,608 and $2,422,382,750,$1,136,246,515 respectively, with the custodian and FCM.FCMs. Some or all of these amounts may be subject to loss should USO’s custodian and/or FCMFCMs cease operations. For derivatives, risks arise from changes in the market value of the contracts. Theoretically, USO is exposed to market risk equal to the value of futures contracts purchased and unlimited liability on such contracts sold short.short or that the value of the futures contract could fall below zero. As both a buyer and a seller of options, USO pays or receives a premium at the outset and then bears the risk of unfavorable changes in the price of the contract underlying the option. USO’s policy is to continuously monitor its exposure to market and counterparty risk through the use of a variety of financial, position and credit exposure reporting controls and procedures. In addition, USO has a policy of requiring review of the credit standing of each broker or counterparty with which it conducts business. The financial instruments held by USO are reported in its condensed statements of financial condition at market or fair value, or at carrying amounts that approximate fair value, because of their highly liquid nature and short-term maturity. For the three months ended March 31, 2024, the monthly average volume of open future and swap contract notional value was $1,099,028,412 and $6,639,291, respectively. For the three months ended March 31, 2023, the monthly average volume of open future and swap contract notional values were $1,422,127,536 and $6,639,291, respectively. Settlement of SEC and CFTC Investigations On November 8, 2021, USCF and USO announced a resolution with each of the SEC and the CFTC relating to matters set forth in certain Wells Notices issued by the staffs of each of the SEC and CFTC as more fully described below. On August 17, 2020, USCF, USO, and John Love received a “Wells Notice” from the staff of the SEC (the “SEC Wells Notice”). The SEC Wells Notice stated that the SEC staff made a preliminary determination to recommend that the SEC file an enforcement action against USCF, USO, and Mr. Love alleging violations of Sections 17(a)(1) and 17(a)(3) of the Securities Act of 1933, as amended (the “1933 Act”), and Section 10(b) of the 1934 Act, and Rule 10b-5 thereunder. Subsequently, on August 19, 2020, USCF, USO, and Mr. Love received a Wells Notice from the staff of the CFTC (the “CFTC Wells Notice”). The CFTC Wells Notice stated that the CFTC staff made a preliminary determination to recommend that the CFTC file an enforcement action against USCF, USO, and Mr. Love alleging violations of Sections 4o(1)(A) and (B) and 6(c)(1) of the Commodity Exchange Act of 1936, as amended (the “CEA”), 7 U.S.C. §§ 6o(1)(A) and (B) and 9(1) (2018), and CFTC Regulations 4.26, 4.41, and 180.1(a), 17 C.F.R. §§ 4.26, 4.41, 180.1(a) (2019). On November 8, 2021, acting pursuant to an offer of settlement submitted by USCF and USO, the SEC issued an order instituting cease-and-desist proceedings, making findings, and imposing a cease-and-desist order pursuant to Section 8A of the 1933 Act, directing USCF and USO to cease and desist from committing or causing any violations of Section 17(a)(3) of the 1933 Act, 15 U.S.C. § 77q(a)(3) (the “SEC Order”). In the SEC Order, the SEC made findings that, from April 24, 2020 to May 21, 2020, USCF and USO violated Section 17(a)(3) of 1933 Act, which provides that it is “unlawful for any person in the offer or sale of any securities to engage in any transaction, practice, or course of business which operates or would operate as a fraud or deceit upon the purchaser.” USCF and USO consented to entry of the SEC Order without admitting or denying the findings contained therein, except as to jurisdiction. Separately, on November 8, 2021, acting pursuant to an offer of settlement submitted by USCF, the CFTC issued an order instituting cease-and-desist proceedings, making findings, and imposing a cease-and-desist order pursuant to Section 6(c) and (d) of the CEA, directing USCF to cease and desist from committing or causing any violations of Section 4o(1)(B) of the CEA, 7 U.S.C. § 6o(1) (B), and CFTC Regulation 4.41(a)(2), 17 C.F.R. § 4.41(a)(2) (the “CFTC Order”). In the CFTC Order, the CFTC made findings that, from on or about April 22, 2020 to June 12, 2020, USCF violated Section 4o(1)(B) of the CEA and CFTC Regulation 4.41(a)(2), which make it unlawful for any commodity pool operator (“CPO”) to engage in “any transaction, practice, or course of business which operates as a fraud or deceit upon any client or participant or prospective client or participant” and prohibit a CPO from advertising in a manner which “operates as a fraud or deceit upon any client or participant or prospective client or participant,” respectively. USCF consented to entry of the CFTC Order without admitting or denying the findings contained therein, except as to jurisdiction. Pursuant to the SEC Order and the CFTC Order, in addition to the command to cease and desist from committing or causing any violations of Section 17(a)(3) of the 1933 Act, Section 4o(1)(B) of the CEA, and CFTC Regulation 4.14(a)(2), civil monetary penalties totaling two million five hundred thousand dollars ($2,500,000) in the aggregate were required to be paid to the SEC and CFTC, of which one million two hundred fifty thousand dollars ($1,250,000) was paid by USCF to each of the SEC and the CFTC, respectively, pursuant to the offsets permitted under the orders. In re: United States Oil Fund, LP Securities Litigation On June 19, 2020, USCF, USO, John P. Love, and Stuart P. Crumbaugh were named as defendants in a putative class action filed by purported shareholder Robert Lucas (the “Lucas Class Action”). The Court thereafter consolidated the Lucas Class Action with two related putative class actions filed on July 31, 2020 and August 13, 2020, and appointed a lead plaintiff. The consolidated class action is pending in the U.S. District Court for the Southern District of New York under the caption In re: United States Oil Fund, LP Securities Litigation, Civil Action No. 1:20-cv-04740. On November 30, 2020, the lead plaintiff filed an amended complaint (the “Amended Lucas Class Complaint”). The Amended Lucas Class Complaint asserts claims under the 1933 Act, the Exchange Act, and Rule 10b-5. The Amended Lucas Class Complaint challenges statements in registration statements that became effective on February 25, 2020 and March 23, 2020 as well as subsequent public statements through April 2020 concerning certain extraordinary market conditions and the attendant risks that caused the demand for oil to fall precipitously, including the COVID-19 global pandemic and the Saudi Arabia-Russia oil price war. The Amended Lucas Class Complaint purports to have been brought by an investor in USO on behalf of a class of similarly-situated shareholders who purchased USO securities between February 25, 2020 and April 28, 2020 and pursuant to the challenged registration statements. The Amended Lucas Class Complaint seeks to certify a class and to award the class compensatory damages at an amount to be determined at trial as well as costs and attorney’s fees. The Amended Lucas Class Complaint named as defendants USCF, USO, John P. Love, Stuart P. Crumbaugh, Nicholas D. Gerber, Andrew F Ngim, Robert L. Nguyen, Peter M. Robinson, Gordon L. Ellis, and Malcolm R. Fobes III, as well as the marketing agent, ALPS Distributors, Inc., and the Authorized Participants: ABN Amro, BNP Paribas Securities Corporation, Citadel Securities LLC, Citigroup Global Markets, Inc., Credit Suisse Securities USA LLC, Deutsche Bank Securities Inc., Goldman Sachs & Company, J.P. Morgan Securities Inc., Merrill Lynch Professional Clearing Corporation, Morgan Stanley & Company Inc., Nomura Securities International Inc., RBC Capital Markets LLC, SG Americas Securities LLC, UBS Securities LLC, and Virtu Financial BD LLC. The lead plaintiff has filed a notice of voluntary dismissal of its claims against BNP Paribas Securities Corporation, Citadel Securities LLC, Citigroup Global Markets Inc., Credit Suisse Securities USA LLC, Deutsche Bank Securities Inc., Morgan Stanley & Company, Inc., Nomura Securities International, Inc., RBC Capital Markets, LLC, SG Americas Securities LLC, and UBS Securities LLC. USCF, USO, and the individual defendants in In re: United States Oil Fund, LP Securities Litigation intend to vigorously contest such claims and have moved for their dismissal. Wang Class Action On July 10, 2020, purported shareholder Momo Wang filed a putative class action complaint, individually and on behalf of others similarly situated, against defendants USO, USCF, John P. Love, Stuart P. Crumbaugh, Nicholas D. Gerber, Andrew F Ngim, Robert L. Nguyen, Peter M. Robinson, Gordon L. Ellis, Malcolm R. Fobes, III, ABN Amro, BNP Paribas Securities Corp., Citadel Securities LLC, Citigroup Global Markets Inc., Credit Suisse Securities USA LLC, Deutsche Bank Securities Inc., Goldman Sachs & Company, JP Morgan Securities Inc., Merrill Lynch Professional Clearing Corp., Morgan Stanley & Company Inc., Nomura Securities International Inc., RBC Capital Markets LLC, SG Americas Securities LLC, UBS Securities LLC, and Virtu Financial BD LLC, in the U.S. District Court for the Northern District of California as Civil Action No. 3:20-cv-4596 (the “Wang Class Action”). The Wang Class Action asserted federal securities claims under the 1933 Act, challenging disclosures in a March 19, 2020 registration statement. It alleged that the defendants failed to disclose to investors in USO certain extraordinary market conditions and the attendant risks that caused the demand for oil to fall precipitously, including the COVID-19 global pandemic and the Saudi Arabia-Russia oil price war. The Wang Class Action was voluntarily dismissed on August 4, 2020. Mehan Action On August 10, 2020, purported shareholder Darshan Mehan filed a derivative action on behalf of nominal defendant USO, against defendants USCF, John P. Love, Stuart P. Crumbaugh, Nicholas D. Gerber, Andrew F Ngim, Robert L. Nguyen, Peter M. Robinson, Gordon L. Ellis, and Malcolm R. Fobes, III (the “Mehan Action”). The action is pending in the Superior Court of the State of California for the County of Alameda as Case No. RG20070732. The Mehan Action alleges that the defendants breached their fiduciary duties to USO and failed to act in good faith in connection with a March 19, 2020 registration statement and offering and disclosures regarding certain extraordinary market conditions that caused demand for oil to fall precipitously, including the COVID-19 global pandemic and the Saudi Arabia-Russia oil price war. The complaint seeks, on behalf of USO, compensatory damages, restitution, equitable relief, attorney’s fees, and costs. All proceedings in the Mehan Action are stayed pending disposition of the motion(s) to dismiss in In re: United States Oil Fund, LP Securities Litigation. USCF, USO, and the other defendants intend to vigorously contest such claims. In re United States Oil Fund, LP Derivative Litigation On August 27, 2020, purported shareholders Michael Cantrell and AML Pharm. Inc. DBA Golden International filed two separate derivative actions on behalf of nominal defendant USO, against defendants USCF, John P. Love, Stuart P. Crumbaugh, Andrew F Ngim, Gordon L. Ellis, Malcolm R. Fobes, III, Nicholas D. Gerber, Robert L. Nguyen, and Peter M. Robinson in the U.S. District Court for the Southern District of New York at Civil Action No. 1:20-cv-06974 (the “Cantrell Action”) and Civil Action No. 1:20-cv-06981 (the “AML Action”), respectively. The complaints in the Cantrell and AML Actions are nearly identical. They each allege violations of Sections 10(b), 20(a), and 21D of the Exchange Act, Rule 10b-5 thereunder, and common law claims of breach of fiduciary duties, unjust enrichment, abuse of control, gross mismanagement, and waste of corporate assets. These allegations stem from USO’s disclosures and defendants’ alleged actions in light of the extraordinary market conditions in 2020 that caused demand for oil to fall precipitously, including the COVID-19 global pandemic and the Saudi Arabia-Russia oil price war. The complaints seek, on behalf of USO, compensatory damages, restitution, equitable relief, attorney’s fees, and costs. The plaintiffs in the Cantrell and AML Actions have marked their actions as related to the Lucas Class Action. The Court consolidated the Cantrell and AML Actions under the caption In re United States Oil Fund, LP Derivative Litigation, Civil Action No. 1:20-cv-06974 and appointed co-lead counsel. All proceedings in In re United States Oil Fund, LP Derivative Litigation are stayed pending disposition of the motion(s) to dismiss in In re: United States Oil Fund, LP Securities Litigation. USCF, USO, and the other defendants intend to vigorously contest the claims in In re United States Oil Fund, LP Derivative Litigation. Optimum Strategies Action On April 6, 2022, USO and USCF were named as defendants in an action filed by Optimum Strategies Fund I, LP, a purported investor in call option contracts on USO (the “Optimum Strategies Action”). The action was in the U.S. District Court for the District of Connecticut at Civil Action No. 3:22-cv-00511. The Optimum Strategies Action asserted claims under the Securities Exchange Act of 1934, as amended (the “1934 Act”), Rule 10b-5 thereunder, and the Connecticut Uniform Securities Act (“CUSA”). It purported to challenge statements in registration statements that became effective in February 2020, March 2020, and on April 20, 2020, as well as public statements between February 2020 and May 2020, in connection with certain extraordinary market conditions and the attendant risks that caused the demand for oil to fall precipitously, including the COVID-19 global pandemic and the Saudi Arabia-Russia oil price war. The complaint was seeking damages, interest, costs, attorney’s fees, and equitable relief. On March 15, 2023, the court granted the USO defendants’ motion to dismiss the complaint. In its ruling, the court granted the USO defendants’ motion to dismiss, with prejudice, the plaintiff’s claims under Section 10(b) of the Exchange Act and Rule 10b-5 thereunder, and a claim for control person liability under Section 20(a) of the Exchange Act. Having dismissed all claims over which the court had original jurisdiction, the court declined to exercise supplemental jurisdiction over the plaintiff’s state law claim under CUSA and dismissed the claim without prejudice. No notice of appeal was filed. NOTE 6 — FINANCIAL HIGHLIGHTS The following table presents per share performance data and other supplemental financial data for the ninethree months ended September 30, 2017March 31, 2024 and 20162023 for the shareholders. This information has been derived from information presented in the condensed financial statements. | | | For the nine months ended
September 30, 2017
(Unaudited) | | | For the nine months ended
September 30, 2016
(Unaudited) | | | Per Share Operating Performance: | | | | | | | | | | Net asset value, beginning of period | | $ | 11.71 | | | $ | 11.02 | | | Total income (loss) | | | (1.21 | ) | | | 0.04 | | | Total expenses | | | (0.06 | ) | | | (0.06 | ) | | Net increase (decrease) in net asset value | | | (1.27 | ) | | | (0.02 | ) | | Net asset value, end of period | | $ | 10.44 | | | $ | 11.00 | | | | | | | | | | | | | Total Return | | | (10.85 | )% | | | (0.18 | )% | | | | | | | | | | | | Ratios to Average Net Assets | | | | | | | | | | Total income (loss) | | | (8.25 | )% | | | 11.69 | % | | Management fees* | | | 0.45 | % | | | 0.45 | % | | Expenses excluding management fees* | | | 0.29 | % | | | 0.32 | % | | Net income (loss) | | | (8.81 | )% | | | 11.11 | % |
| | | | | | | | | | Three months ended | | Three months ended | | | | March 31, 2024 | | March 31, 2023 | | | | (Unaudited) | | (Unaudited) | | Per Share Operating Performance: | | | | | | | | Net asset value, beginning of period | | $ | 66.91 | | $ | 70.05 | | Total income (loss) | | | 12.17 | | | (3.47) | | Total expenses | | | (0.15) | | | (0.11) | | Net increase (decrease) in net asset value | | | 12.02 | | | (3.58) | | Net asset value, end of period | | $ | 78.93 | | $ | 66.47 | | | | | | | | | | Total Return | | | 17.96 | % | | (5.11) | % | | | | | | | | | Ratios to Average Net Assets | | | | | | | | Total income (loss) | | | 17.15 | % | | (3.95) | % | Management fees# | | | 0.45 | % | | 0.45 | % | Total expenses excluding management fees# | | | 0.37 | % | | 0.23 | % | Net income (loss) | | | 16.95 | % | | (4.12) | % |
Total returns are calculated based on the change in value during the period. An individual shareholder’s total return and ratio may vary from the above total returns and ratios based on the timing of contributions to and withdrawals from USO. Additionally, only Authorized Participants purchase and redeem shares from the Fund at the NAV per share. Most shareholders will purchase and sell shares in the secondary market at market prices, which may differ from the NAV per share and result in a higher or lower total return. NOTE 7 — FAIR VALUE OF FINANCIAL INSTRUMENTS USO values its investments in accordance with Accounting Standards Codification 820 – Fair Value Measurements and Disclosures (“ASC 820”). ASC 820 defines fair value, establishes a framework for measuring fair value in generally accepted accounting principles, and expands disclosures about fair value measurement. The changes to past practice resulting from the application of ASC 820 relate to the definition of fair value, the methods used to measure fair value, and the expanded disclosures about fair value measurement. ASC 820 establishes a fair value hierarchy that distinguishes between: (1) market participant assumptions developed based on market data obtained from sources independent of USO (observable inputs) and (2) USO’s own assumptions about market participant assumptions developed based on the best information available under the circumstances (unobservable inputs). The three levels defined by the ASC 820 hierarchy are as follows: Level I – Quoted prices (unadjusted) in active markets foridenticalassets or liabilities that the reporting entity has the ability to access at the measurement date. Level II – Inputs other than quoted prices included within Level I that are observable for the asset or liability, either directly or indirectly. Level II assets include the following: quoted prices forsimilarassets or liabilities in active markets, quoted prices for identical or similar assets or liabilities in markets that are not active, inputs other than quoted prices that are observable for the asset or liability, and inputs that are derived principally from or corroborated by observable market data by correlation or other means (market-corroborated inputs). Level III – Unobservable pricing input at the measurement date for the asset or liability. Unobservable inputs shall be used to measure fair value to the extent that observable inputs are not available. In some instances, the inputs used to measure fair value might fall within different levels of the fair value hierarchy. The level in the fair value hierarchy within which the fair value measurement in its entirety falls shall be determined based on the lowest input level that is significant to the fair value measurement in its entirety. The following table summarizes the valuation of USO’s securities at September 30, 2017March 31, 2024 using the fair value hierarchy: | At September 30, 2017 | | Total | | | Level I | | | Level II | | | Level III | | | | | | | | | | | | | | | | | At March 31, 2024 | | | Total | | Level I | | Level II | | Level III | | Short-Term Investments | | $ | 2,194,620,078 | | | $ | 2,194,620,078 | | | $ | — | | | $ | — | | | $ | 327,450,000 | | $ | 327,450,000 | | $ | — | | $ | — | | Exchange-Traded Futures Contracts | | | | | | | | | | | | | | | | | | | | | | | | | | | | | | United States Contracts | | | 122,542,660 | | | | 122,542,660 | | | | — | | | | — | | | | 56,477,810 | | | 56,477,810 | | | — | | | — | OTC Commodity Swap Contracts | | | | (2,088) | | | — | | | (2,088) | | | — |
During the nine months ended September 30, 2017, there were no transfers between Level I and Level II.
The following table summarizes the valuation of USO’s securities at December 31, 20162023 using the fair value hierarchy: | At December 31, 2016 | | Total | | | Level I | | | Level II | | | Level III | | | | | | | | | | | | | | | | | At December 31, 2023 | | | Total | | Level I | | Level II | | Level III | | Short-Term Investments | | $ | 2,770,212,015 | | | $ | 2,770,212,015 | | | $ | — | | | $ | — | | | $ | 327,450,000 | | $ | 327,450,000 | | $ | — | | $ | — | | Exchange-Traded Futures Contracts | | | | | | | | | | | | | | | | | | | | | | | | | | | | | | United States Contracts | | | 111,290,560 | | | | 111,290,560 | | | | — | | | | — | | | | 3,051,930 | | | 3,051,930 | | | — | | | — | OTC Commodity Swap Contracts | | | | (1,906) | | | — | | | (1,906) | | | — |
During the year ended December 31, 2016, there were no transfers between Level I and Level II.
Effective January 1, 2009, USO adopted the provisions of Accounting Standards Codification 815 — Derivatives and Hedging, which require presentation of qualitative disclosures about objectives and strategies for using derivatives, quantitative disclosures about fair value amounts and gains and losses on derivatives. Fair Value of Derivative Instruments | | | | | | | | | | | | | | | Fair Value at | | Fair Value at | Derivatives not
Accounted for
as Hedging
Instruments | | Condensed
Statements of
Financial
Condition Location | | Fair Value
At September 30,
2017 | | | Fair Value
At December 31,
2016 | | | Condensed Statements of Financial Condition Location | | March 31, 2024 | | December 31, 2023 | | Futures - Commodity Contracts | | Assets | | $ | 122,542,660 | | | $ | 111,290,560 | | | Unrealized gain (loss) on open commodity futures contracts | | $ | 56,477,810 | | $ | 3,051,930 | Swap - Commodity Contracts | | | Unrealized gain (loss) on open OTC commodity swap contracts | | $ | (2,088) | | $ | (1,906) |
The volume of open OTC swap positions relative to the net assets of USO at the date of this report is generally representative of open positions throughout the reporting period. The Effect of Derivative Instruments on the Condensed Statements of Operations | | | | | For the nine months ended
September 30, 2017 | | | For the nine months ended
September 30, 2016 | | | Derivatives not
Accounted for
as Hedging
Instruments | | Location of
Gain (Loss)
on Derivatives
Recognized in
Income | | Realized
Gain (Loss)
on Derivatives
Recognized in
Income | | | Change in
Unrealized
Gain (Loss) on
Derivatives
Recognized in
Income | | | Realized
Gain (Loss)
on Derivatives
Recognized in
Income | | | Change in
Unrealized
Gain (Loss) on
Derivatives
Recognized in
Income | | | | | | | | | | | | | | | | | | | | | | | | For the three months ended | | For the three months ended | | | | | | March 31, 2024 | | March 31, 2023 | | | | | | | | Change in | | | | Change in | | | | Location of Gain | | Realized Gain | | Unrealized Gain | | Realized Gain | | Unrealized Gain | Derivatives not | | | (Loss) on | | (Loss) on | | (Loss) on | | (Loss) in | | (Loss) on | Accounted for as | | | Derivatives | | Derivatives | | Derivatives | | Derivatives | | Derivatives | Hedging | | | Recognized in | | Recognized in | | Recognized in | | Recognized in | | Recognized in | Instruments | | | Income | | Income | | Income | | Income | | Income | | Futures - Commodity Contracts | | Realized gain (loss) on
closed futures contracts | | $ | (257,378,501 | ) | | | | | | $ | 119,714,110 | | | | | | | Realized gain (loss) on closed commodity futures contracts | | $ | 127,430,470 | | | | | $ | (29,687,453) | | | | | | | | | | | | | | | | | | | | | | | | | | Change in unrealized
gain (loss) on open
contracts | | | | | | $ | 11,252,100 | | | | | | | $ | 270,039,300 | | | | | | | | | | | | | | | | | | | | | | Change in unrealized gain (loss) on open commodity futures contracts | | | | | $ | 53,425,880 | | | | | $ | (36,340,617) | | | | | | | | | | | | | | | | | OTC Swap - Commodity Contracts | | | Realized gain (loss) on closed OTC commodity swap contracts | | $ | 45,287,234 | | | | | $ | (17,423,934) | | | | | | | | | | | | | | | | | | | | | | | Change in unrealized gain (loss) on open OTC commodity swap contracts | | | | | $ | (182) | | | | | $ | 2,194 |
NOTE 8 — SUBSEQUENT EVENTS USO has performed an evaluation of subsequent events through the date the condensed financial statements were issued. This evaluation did not result in any subsequent events that necessitated disclosures and/or adjustments. Item 2. | Item 2. Management’s Discussion and Analysis of Financial Condition and Results of Operations. |
The following discussion should be read in conjunction with the condensed financial statements and the notes thereto of the United States Oil Fund, LP (“USO”) included elsewhere in this quarterly report on Form 10-Q. Forward-Looking Information This quarterly report on Form 10-Q, including this “Management’s Discussion and Analysis of Financial Condition and Results of Operations,” contains forward-looking statements regarding the plans and objectives of management for future operations. This information may involve known and unknown risks, uncertainties and other factors that may cause USO’s actual results, performance or achievements to be materially different from future results, performance or achievements expressed or implied by any forward-looking statements. USO believes these factors include, but are not limited to, the following: changes in inflation in the United States, movements in U.S. and foreign currencies, market volatility in the crude oil markets and futures markets in part attributable to the COVID-19 pandemic in February 2020, the Russia-Ukraine war and conflicts in the Middle East. Forward-looking statements, which involve assumptions and describe USO’s future plans, strategies and expectations, are generally identifiable by use of the words “may,” “will,” “should,” “expect,” “anticipate,” “estimate,” “believe,” “intend” or “project,” the negative of these words, other variations on these words or comparable terminology. These forward-looking statements are based on assumptions that may be incorrect, and USO cannot assure investors that the projections included in these forward-looking statements will come to pass. USO’s actual results could differ materially from those expressed or implied by the forward-looking statements as a result of various factors. USO has based the forward-looking statements included in this quarterly report on Form 10-Q on information available to it on the date of this quarterly report on Form 10-Q, and USO assumes no obligation to update any such forward-looking statements. Although USO undertakes no obligation to revise or update any forward-looking statements, whether as a result of new information, future events or otherwise, investors are advised to consult any additional disclosures that USO may make directly to them or through reports that USO files in the future files with the U.S. Securities and Exchange Commission (the “SEC”),SEC, including annual reports on Form 10-K, quarterly reports on Form 10-Q and current reports on Form 8-K. Introduction USO, a Delaware limited partnership, is a commodity pool that issues shares that may be purchased and sold on the NYSE Arca, Inc. (the “NYSE Arca”).Arca. The investment objective of USO is for the daily changes in percentage terms of its shares’ per share net asset value (“NAV”)NAV to reflect the daily changes in percentage terms of the spot price of light, sweet crude oil delivered to Cushing, Oklahoma, as measured by the daily changes in the price of a specified short-termthe futures contract onfor light, sweet crude oil traded on the New York Mercantile Exchange (the “NYMEX”)NYMEX that is the near month contract to expire except whenand changes, over a ten-day period, into the near month contract is within two weeks of expiration, in which case it will be measured by theNYMEX futures contract that is the next month contract to expire (the “Benchmark Oil Futures Contract”), plus interest earned on USO’s collateral holdings, less USO’s expenses. The change from the near month contract to the next month contract occurs at the beginning of each month and will be approximately proportional, relative to total net assets, over each day of the ten-day roll period. “Near month contract” means the next contract traded on the NYMEX due to expire. “Next month contract” means the first contract traded on the NYMEX due to expire after the near month contract. USO’s USO seeks to achieve its investment objective isnotfor its NAV or market price of shares to equal, in dollar terms,by investing so that the spot price of light, sweet crude oil or any particular futures contract based on light, sweet crude oil,nor is USO’s investment objective for theaverage daily percentage change in itsUSO’s NAV to reflectfor any period of 30 successive valuation days will be within plus/minus ten percent (10%) of the average daily percentage change ofin the price of any particular futures contract as measured over a time periodgreater than one day. The general partner of USO, United States Commodity Funds LLC (“USCF”), believes that it is not practical to manage the portfolio to achieve such an investment goal when investing inBenchmark Oil Futures Contracts (as defined below)Contract over the same period. As a result, investors should be aware that USO would meet its investment objective even if there are significant deviations between changes in its daily NAV and Other Oil-Related Investments (as defined below).
changes in the daily price of the Benchmark Oil Futures Contract provided that the average daily percentage change in USO’s NAV over 30 successive valuation days is within plus/minus ten percent (10%) of the average daily percentage change in the price of the Benchmark Oil Futures Contract over the same period. USO invests primarily in futures contracts for light, sweet crude oil, other types of crude oil, heating oil, gasoline, natural gas and other petroleum-based fuels that are traded on the NYMEX, ICE Futures or other U.S. and foreign exchanges (collectively, “Oil Futures Contracts”) and to a lesser extent, in order to comply with regulatory requirements, risk mitigation measures (including those that may be taken by USO, USO’s FCMs, counterparties or other market participants), liquidity requirements, or in view of market conditions, other oil-related investments such as cash-settled options on Oil Futures Contracts, forward contracts for oil, cleared swap contracts and over-the-counter (“OTC”)OTC swaps that are based on the price of oil, other petroleum-based fuels, Oil Futures Contracts and indices based on the foregoing (collectively, “Other Oil-Related Investments”). For convenience and unless otherwise specified, Oil Futures Contracts and Other Oil-Related Investments collectively are referred to as “Oil Interests” in this quarterly report on Form 10-Q. USO’s investment objective is not for its NAV or market price of shares to equal, in dollar terms, the spot price of light, sweet crude oil or any particular futures contract based on light, sweet crude oil, nor is USO’s investment objective for the percentage change in its NAV to reflect the percentage change of the price of any particular futures contract as measured over a time period greater than one day. The general partner of USO, United States Commodity Funds, LLC (“USCF”), believes that it is not practical to manage the portfolio to achieve such an investment goal when investing in Oil Futures Contracts and Other Oil-Related Investments. USCF believes that market arbitrage opportunities will cause daily changes in USO’s share price on the NYSE Arca on a percentage basis to closely track daily changes in USO’s per share NAV on a percentage basis.NAV. USCF further believes that the daily changes in pricesthe price of the Benchmark Oil Futures Contract have historically closely tracked the daily changes in spot prices of light, sweet crude oil. USCF believes that the net effect of these relationships will be that the daily changes in the price of USO’s shares on the NYSE Arca on a percentage basis will closely track the daily changes in the spot price of a barrel of light, sweet crude oil on a percentage basis, plus interest earned on USO’s collateral holdings, less USO’s expenses. The following chart shows, for the period ending March 31, 2024, the rolling 30-day average difference between USO’s NAV and the Benchmark Oil Futures Contract. This is measured by subtracting the return of the Benchmark Oil Futures Contract from the return on USO’s NAV for each of the last thirty business days, and then averaging those thirty differences. The calculation is repeated daily. *PAST PERFORMANCE IS NOT NECESSARILY INDICATIVE OF FUTURE RESULTS 
Prior to the Spring of 2020, USO seeks to achieveachieved its investment objective by primarily investing in the Benchmark Oil Futures Contract and Oil Futures Contracts for light, sweet crude oil traded on NYMEX and ICE Futures with the same maturity month as the Benchmark Oil Futures Contract. In the Spring of 2020, significant market volatility occurred in the crude oil markets and the oil futures markets. Such volatility was attributable to the COVID-19 pandemic, related supply chain disruptions and disputes among oil-producing countries over the potential limits on the production of crude oil, and a corresponding collapse in demand for crude oil and a lack of on-land storage for crude oil. Certain circumstances, including the market conditions, regulatory requirements, and risk mitigation measures imposed by its FCMs, resulting from such volatility caused, as discussed below, USO to invest in Oil Futures Contracts other than the Benchmark Oil Futures Contract and to invest in Other Oil-Related Investments, such as swap transactions based on the price of oil. These conditions severely limited USO’s ability to have a substantial portion of its assets invested in the Benchmark Oil Futures Contract and certain other Oil Futures Contracts of the same month, such as cash-settled, but substantially similar, oil futures contracts traded on ICE Futures (the “ICE WTI Contract”). Accordingly, USO invested in other permitted Oil Futures Contracts with expirations in later months than the Benchmark Oil Futures Contract. USO also invested in other permitted investments, including Other Oil-Related Investments, including OTC swaps. In addition, during the Spring of 2020, USO had to rebalance and adjust the types of holdings in its portfolio more frequently than it had in the past. Beginning with the monthly roll in September 2023 and ending with the monthly roll in January 2024, USO transitioned its investment portfolio and now primarily invests in Benchmark Oil Futures Contracts, consistent with USO’s investment strategy prior to the Spring of 2020. However, USO has had, and will continue to have, the ability to invest in Oil Futures Contracts beyond the Benchmark Oil Futures Contract and Other Oil-Related Investments, such as OTC swaps, and USO may make such investments if market conditions, regulatory requirements, risk mitigation measures (including those that may be taken by USO, USO’s FCMs, counterparties or other market participants), liquidity requirements, or other factors require USO to do so thatin order to meet its investment objective. USO may invest in Oil Futures Contracts beyond the average daily percentage changeBenchmark Oil Futures Contract, and/or Other Oil-Related Investments, as a result or in response to any of the foregoing factors. In addition, USO may need to hold significant portions of its portfolio in cash beyond what it has historically held for reasons including (but not limited to) the need to address the changes in market conditions, regulatory requirements or risk mitigation measures or the need to satisfy potential margin requirements. Investments in Oil Futures Contracts beyond the Benchmark Oil Futures Contract and Other Oil-Related Investments could result in wider deviations between the performance of USO’s investments and the Benchmark Oil Futures Contract than if USO’s investments primarily consisted of the Benchmark Oil Futures Contract, and changes in USO’s NAV for any period of 30 successive valuation days willshare price may not be within plus/minus ten percent (10%) of the average daily percentage changeable to track changes in the price of the Benchmark Oil Futures Contract overwithin as narrow a percentage change difference for any period of 30 successive valuation days as it would if USO’s investments primarily consisted of the same period.Benchmark Oil Futures Contract. Although permitted to do so under its LP Agreement, USO has not leveraged, and does not intend to leverage, its assets through borrowings or otherwise, and makes its investments accordingly. Consistent with the foregoing, USO’s investments will take into account the need for USO to maintain adequate liquidity to meet its margin and collateral requirements and to avoid, to the extent reasonably possible, USO becoming leveraged. If market conditions require it, these risk reduction procedures, including changes to USO’s investments, may occur on short notice. Regulatory Disclosure The regulation of commodity interest trading in the United States and other countries is an evolving area of the law. Below are certain key regulatory requirements that are, or may be, relevant to USO. The various statements made in this summary are subject to modification by legislative action and changes in the rules and regulations of the SEC, Financial Industry Regulatory Authority (“FINRA”), CFTC, NFA, the futures exchanges, clearing organizations and other regulatory bodies. Pending final resolution of all applicable regulatory requirements, some examples of how new rules and regulations could impact USO are discussed in “Item 1. Business” in this quarterly report on Form 10-Q. Exchange Accountability Levels, Position Limits and Price Fluctuation LimitsLimits.. Designated contract markets (“DCMs”), such as the NYMEX and ICE Futures, have established accountability levels and position limits on the maximum net long or net short futures contracts in commodity interests that any person or group of persons under common trading control (other than as a hedge, which an investment by USO is not) may hold, own or control. These levels and position limits apply to the futures contracts that USO invests in to meet its investment objective. In addition to accountability levels and position limits, the NYMEX and ICE Futures may also set daily price fluctuation limits on futures contracts. The daily price fluctuation limit establishes the maximum amount that the price of a futures contract may vary either up or down from the previous day’s settlement price. Once the daily price fluctuation limit has been reached in a particular futures contract, no trades may be made at a price beyond that limit. The accountability levels for the Benchmark Oil Futures Contract and other Oil Futures Contracts traded on U.S.-based futures exchanges, such as the NYMEX, are not a fixed ceiling, but rather a threshold above which the NYMEX may exercise greater scrutiny and control over an investor’s positions. The current accountability level for investments for any one month in the Benchmark Oil Futures Contract is 10,000 contracts. In addition, the NYMEX imposes an accountability level for all months of 20,000 net futures contracts for light, sweet crude oil. In addition, the ICE Futures maintains the same accountability levels, position limits and monitoring authority for its futures contracts for light, sweet crude oil contract as the NYMEX. If USO and the Related Public Funds exceed these accountability levels for investments in the futures contracts for light, sweet crude oil, the NYMEX and ICE Futures will monitor such exposure and may ask for further information on their activities including the total size of all positions, investment and trading strategy, and the extent of liquidity resources of USO and the Related Public Funds. If deemed necessary by the NYMEX and/or ICE Futures, USO could be ordered to reduce its Crude Oil Futures CL contracts to below the 10,000 single month and/or 20,000 all month accountability level. As of September 30, 2017,March 31, 2024, USO held 44,68213,301 NYMEX WTI Crude Oil Futures CL contracts and did not hold any ICE WTI Crude Oil Futures Contracts.contracts. USO exceeded accountability levels of the NYMEX during the ninethree months ended September 30, 2017,March 31, 2024, including when it held a maximum of 71,15518,287 Crude Oil Futures CL contracts.contracts on the NYMEX, exceeding the “any” month limit. No action was taken by the NYMEX and USO did not have to reduce the number of Crude Oil Futures Contracts held as a result. USO did not exceed accountability levels imposed by the ICE Futures during the nine months ended September 30, 2017. positions held. Position limits differ from accountability levels in that they represent fixed limits on the maximum number of futures contracts that any person may hold and cannot allow such limits to be exceeded without express CFTC authority to do so. In addition to accountability levels and position limits that may apply at any time, the NYMEX and ICE Futures impose position limits on contracts held in the last few days of trading in the near month contract to expire. It is unlikelyInvestors should note that USO will run up against suchthe foregoing accountability levels and position limits because USO’s investment strategy isare subject to close out its positionschange, which in turn could change the amount and “roll” from the near month contract to expire to the next month contract during a four-day period beginning two weeks from expirationtype of the contract.permitted investments in which USO invests. For the ninethree months ended September 30, 2017,March 31, 2024, USO did not exceed any position limits imposed by the NYMEX and ICE Futures. The regulation of commodity interest trading in the United Statesforegoing accountability levels and other countries is an evolving area of the law. The various statements made in this summaryposition limits are subject to modificationchange. Due to evolving market conditions, remaining within relevant accountability levels and position limits, and, any additional or different risk mitigation measures taken by legislative action and changesUSO’s FCMs in the rulesfuture with respect to USO acquiring additional Oil Futures contracts, USO has invested and regulationsintends to invest in other permitted investments, beyond the Benchmark Oil Futures Contract. Federal Position Limits Part 150 of the SEC, Financial Industry Regulatory Authority (“FINRA”CFTC’s regulations (the “Position Limits Rule”) establishes federal position limits for 25 core referenced futures contracts (comprised of agricultural, energy and metals futures contracts), CFTC, the National Futures Association (the “NFA”), the futures exchanges, clearing organizations and other regulatory bodies. Futures Contracts and Position Limits
The CFTC is generally prohibited by statute from regulating trading on non-U.S. futures exchanges and markets. The CFTC, however, has adopted regulations relatingoptions linked to the marketing of non-U.S.core referenced futures contracts, in the United States. These regulations permit certain contracts on non-U.S. exchanges to be offered and sold in the United States.
The CFTC has proposed to adopt limits on speculative positions in 25 physical commodity futures, and option contracts as well as swaps that are economically equivalent to suchthe core referenced futures contracts that all market participants must comply with, with certain exemptions. The Benchmark Futures Contract is subject to position limits under the Position Limits Rule, and USO’s trading does not qualify for an exemption therefrom. Accordingly, the Position Limits Rule could inhibit USO’s ability to invest in the agriculture, energyBenchmark Oil Futures Contract and metals markets (the “Position Limit Rules”). The Position Limit Rules would, among other things: identify which contracts are subject to speculative position limits; set thresholds that restrict the size of speculative positions that a person may hold in the spot month, other individual months, and all months combined; create an exemption for positions that constitute bona fide hedging transactions; impose responsibilities on designated contract markets (“DCMs”) and swap execution facilities (“SEFs”) to establish position limits or, in some cases, position accountability rules; and apply to both futures and swaps across four relevant venues: OTC, DCMs, SEFs as well as certain non-U.S. located platforms. The CFTC’s first attempt at finalizing the Position Limit Rules, in 2011, was successfully challenged by market participants in 2012 and, since then, the CFTC has re-proposed them and solicited comments from market participants multiple times. At this time, it is unclear how the Position Limit Rules may affect USO, but the effect may be substantial and adverse. By way of example, the Position Limit Rules maythereby could negatively impact the ability of USO to meet its investment objectives through limits that may inhibit USCF’s ability to sell additional Creation Baskets of USO.objective.
Until such time as the Position Limit Rules are adopted, the regulatory architecture in effect prior to the adoption of the Position Limit Rules will govern transactions in commodities and related derivatives (collectively, “Referenced Contracts”). Under that system, the CFTC enforces federal limits on speculation in agricultural products (e.g., corn, wheat and soy), while futures exchanges establish and enforce position limits and accountability levels for other agricultural and certain energy products (e.g., oil and natural gas). As a result, USO may behas not limited with respect to the size of its investments in any commodities subjectoffering and intends to these limits.
Under existingutilize substantially all of its proceeds to purchase Oil Futures Contracts and recently adopted CFTC regulations, forOther Oil-Related Investments to the purpose ofextent possible. If USO encounters accountability levels, position limits a market participant is generally required, subject to certain narrow exceptions, to aggregate all positions for which that participant controls the trading decisions with all positions for which the participant has a 10 percent or greater ownership interest in an account or position, as well as the positions of two or more persons acting pursuant to an express or implied agreement or understanding with that participant (the “Aggregation Rules”). The Aggregation Rules will also apply with respect to(including those set by the Position Limit RulesLimits Rule), or price fluctuation limits for Oil Futures Contracts on the NYMEX or ICE Futures, it may then, if and when such Position Limit Rules are adopted.
“Swap” Transactions
The Dodd-Frank Wall Street Reform and Consumer Protection Act (the “Dodd-Frank Act”) imposespermitted under applicable regulatory requirements, purchase Oil Futures Contracts on certain “swap” transactionsother exchanges that USO is authorized to engage in that may ultimately impact the ability of USOtrade listed crude oil futures or enter into swaps or other permitted investments to meet its investment objective. In addition, if USO exceeds accountability levels on either the NYMEX or ICE Futures and is required by such exchanges to reduce its holdings, such reduction could potentially cause a tracking error between the price of USO’s shares and the price of the Benchmark Oil Futures Contract.
Margin for OTC Swaps Rules put in place by U.S. federal banking regulators, the CFTC and the SEC require the daily exchange of variation margin and initial margin for swaps between swap dealers, major swap participants, security-based swap dealers, and major security-based swap participants (“Swap Entities”) and swaps between Swap Entities and their counterparties that are “financial end-users” (such rules, the “Margin Rules”). The term “swap”Margin Rules require Swap Entities to exchange variation margin with all of their counterparties who are financial end-users. The minimum variation margin amount is broadly definedthe daily mark-to-market change in the value of the swap, taking into account the amount of variation margin previously posted or collected. Swap Entities are required to include variousexchange initial margin with their financial end-users who have “material swaps exposure” (i.e., an average daily aggregate notional of $8 billion or more in non-cleared swaps calculated in accordance with the Margin Rules). The Margin Rules specify the types of OTC derivatives, includingcollateral that may be posted or collected as initial margin or variation margin (generally cash, certain government, government-sponsored enterprise securities, certain liquid debt, certain equity securities, certain eligible publicly traded debt, and gold) and sets forth haircuts for certain collateral asset classes. USO is not a Swap Entity under the Margin Rules, but it is a financial end-user. Accordingly, USO will be subject to the variation margin requirements of the Margin Rules for any swaps that it enters into. However, USO does not have material swaps exposure under the Margin Rules and, options.accordingly, USO will not be subject to the initial margin requirements of the Margin Rules. Mandatory Trading and Clearing of Swaps CFTC regulations require that certain swap transactions ultimately falling within the definition of “swap” be executed on organized exchanges or “swap execution facilities” and cleared through regulated clearing organizations (“CCPs”derivative clearing organizations” (“DCOs”). “Clearing” refers), if the CFTC mandates the central clearing of a particular class of swap and such swap is “made available to the process by whichtrade” on a tradeswap execution facility. Currently, swap dealers, major swap participants, commodity pools, certain private funds and entities predominantly engaged in activities that are financial in nature are required to execute on a swap execution facility, and clear, certain interest rate swaps and index-based credit default swaps. As a result, if USO enters into an interest rate or index-based credit default swap that is bilaterallysubject to these requirements, such swap will be required to be executed by two parties is submittedon a swap execution facility and centrally cleared. Mandatory clearing and “made available to a CCP, via a clearing member (i.e., an “FCM”), and replaced by two mirrortrade” determinations with respect to additional types of swaps with the CCP becoming the counterparty to both of the initial parties to the swap. CCPs have several layers of protection against default including margin, member capital contributions and FCM guarantees of their customers’ transactions with the CCP. FCMs also pre-qualify the counterparties to all swaps that are sent to the CCP from a credit perspective, setting limits for each counterparty and collecting initial and variation margin daily from each counterparty for changesmay be issued in the value offuture, and, when finalized, could require USO to electronically execute and centrally clear certain OTC instruments presently entered into and settled on a bi-lateral basis. If a swap is required to be cleared, swaps. The margin collected from both parties to the swap protects against credit risk in the event a counterparty defaults. The initial and variation margin requirements are set by the relevant clearing organization, subject to certain regulatory requirements and held for the benefit of the CCP.guidelines. Additional initial margin may be required and held by the FCM.USO’s FCMs. Other Requirements for Swaps Current rules and regulations require enhanced customer protections, risk management programs, internal monitoring and controls, capital and liquidity standards, customer disclosures and auditing and examination programs for FCMs. The rules are intended to afford greater assurances to market participants that customer segregated funds and secured amounts are protected, customers are provided with appropriate notice of the risks of futures trading and of the FCMs with which they may choose to do business, FCMs are monitoring and managing risks in a robust manner, the capital and liquidity of FCMs are strengthened to safeguard the continued operations and the auditing and examination programs of the CFTC and the self-regulatory organizations are monitoring the activities of FCMs in a thorough manner.
Certain index-based credit default swaps and interest rate swaps are subject to mandatory clearing. If USO enters into index-based credit default swaps or interest rate swaps that are subject to mandatory clearing, USO will be required to centrally clear those swaps.
To the extent that a swap is required to be cleared, it must also be executed on a SEF or DCM if it is designated as “made available to trade” by a SEF or DCM. “Made available to trade” refersIn addition to the regulatory process by which the SEF or DCM execution requirement is implemented by the CFTC. To date, only certain of the index-based credit defaultmargin requirements described above, swaps and interest rate swaps that are required to be cleared are made available to trade on a SEF. If USO enters into index-based credit default swaps or interest rate swaps that are subject to mandatory clearing, USO will be required to execute those swaps on a SEF if they are designated as made available to trade. In order to execute swaps on a SEF, USO will have to be a member of a SEF or it may access the SEF through an intermediary. Members of a SEF are subject to additional requirements under CFTC regulations and are subject to the rules and jurisdiction of the relevant SEF.
Swaps that are not required to be cleared and executed on a SEF but that are executed bilaterally are also subject to various requirements pursuant to CFTC regulations, including, among others,other things, reporting and recordkeeping requirements and, depending on the status of the counterparties, trading documentation requirements and dispute resolution requirements. In addition, U.S. regulators have adopted rules to impose initial and variation margin requirements that will apply to swap dealers and major swap participants and their counterparties. If USO engages in non-cleared swap transactions it will be subject to some or all of the requirements of the margin rules, which include a requirement that swap dealers and major swap participants collect variation margin daily, beginning in March 2017, and potentially initial margin, beginning in September 2020.
Derivatives Regulations in Non-U.S. Jurisdictions In addition to U.S. laws and regulations, USO may be subject to non-U.S. derivatives laws and regulations if it engages in futures and/or swapsswap transactions with non-U.S. persons. For example, USO may be impacted by European laws and regulations to the extent that it engages in futures transactions on European exchanges or derivatives transactions with European entities. Other jurisdictions impose requirements applicable to futures and derivatives that are similar to those imposed by the U.S., including position limits, margin, clearing and trade execution requirements. The CFTC is generally prohibited by statute from regulating trading on non-U.S. futures exchanges and markets. The CFTC, however, has adopted regulations relating to the marketing of non-U.S. futures contracts in the United States. These regulations permit certain contracts on non-U.S. exchanges to be offered and sold in the United States. Infectious disease outbreaks like COVID-19 could negatively affect USO and the valuation and performance of USO’s investments. Infectious disease outbreaks like the COVID-19 pandemic may arise in the future and could adversely affect USO and, more generally, individual issuers and capital markets, in ways that cannot necessarily be foreseen. For example, COVID-19 resulted in numerous deaths, travel restrictions, closed international borders, enhanced health screenings at ports of entry and elsewhere, disruption of and delays in healthcare service preparation and delivery, prolonged quarantines and the imposition of both local and more widespread “work from home” measures, cancellations, loss of employment, supply chain disruptions, and lower consumer and institutional demand for goods and services, as well as general concern and uncertainty. The COVID-19 pandemic that occurred in 2020 had a material adverse impact on local economies in the affected jurisdictions and also on the global economy, as cross border commercial activity and market sentiment were impacted by the outbreak and government and other measures seeking to contain COVID-19’s spread. COVID-19 also had a material adverse impact on the oil markets and oil futures markets because economic activity and the use of oil were curtailed, which in turn had a significant adverse effect on the prices of Oil Futures Contracts, including the Benchmark Oil Futures Contracts, and Other Oil-Related Investments. An infectious disease outbreak may arise in the future and could have the same or similar effects as the COVID-19 pandemic, or different effects that cannot be foreseen. Moreover, as was the case with the COVID-19 pandemic, actions taken by government and quasi-governmental authorities and regulators throughout the world in response to an infectious disease outbreak, including the potential for significant fiscal and monetary policy changes, may affect the value, volatility, pricing and liquidity of some investments or other assets, including those held by or invested in by USO. Public health crises caused by infectious disease outbreaks may exacerbate other pre-existing political, social and economic risks in certain countries or globally and their duration cannot be determined with certainty. In a rising rate environment, USO may not be able to fully invest at prevailing rates until any current investments in Treasury Bills mature in order to avoid selling those investments at a loss. When interest rates rise, the value of fixed income securities typically falls. In a rising interest rate environment, USO may not be able to fully invest at prevailing rates until any current investments in Treasury Bills mature in order to avoid selling those investments at a loss. Interest rate risk is generally lower for shorter term investments and higher for longer term investments. The risk to USO of rising interest rates may be greater in the future due to the end of a long period of historically low rates, the effect of potential monetary policy initiatives, including actions taken by the U.S. Federal Reserve and other foreign equivalents to curb inflation, and resulting market reaction to those initiatives. When interest rates fall, USO may be required to reinvest the proceeds from the sale, redemption or early prepayment of a Treasury Bill or money market security at a lower interest rate. Money Market ReformUSO may potentially lose money by investing in government money market funds.
The SEC adopted Rule 2a-7 under the Investment Company Act of 1940, which became effectiveUSO invests in 2016, to reformgovernment money market funds. Although such government money market funds (“MMFs”). Whileseek to preserve the new rule applies onlyvalue of an investment at $1.00 per share, there is no guarantee that they will be able to MMFs, itdo so and USO may indirectly affect institutional investors such as USO. A portion of USO’s assets that are not used for margin or collateral in the Futures Contracts currently are invested in government MMFs. USO does not hold any non-government MMFs and, particularly in light of recent changes to the rule governing the operation of MMFs, does not anticipate investing in any non-government MMFs. However, if USO invests in other types of MMFs besides government MMFs in the future, USO could be negatively impactedlose money by investing in a government money market fund. An investment in a government money market fund is not insured or guaranteed by the Federal Deposit Insurance Corporation (the “FDIC”), or any other government agency. The share price of a government money market fund can fall below the $1.00 share price. USO cannot rely on or expect a government money market fund’s adviser or its affiliates to enter into support agreements or take other actions to maintain the government money market fund’s $1.00 share price. The credit quality of a government money market fund’s holdings can change rapidly in certain markets, and the default of a single holding could have an MMF that does not maintainadverse impact on the government money market fund’s share price. Due to fluctuations in interest rates, the market value of securities held by a stable $1.00 net asset value government money market fund may vary. A government money market fund’s share price can also be negatively affected during periods of high redemption pressures and/or that has the potential to impose redemption fees and gates (temporary suspension of redemptions).
illiquid markets. Price Movements Crude oil futures prices were volatile during the ninethree months ended September 30, 2017.March 31, 2024. The price of the Benchmark Oil Futures Contract started the period at $53.720$71.65 per barrel. It hit a peakThe high of the period was on February 23, 2017 at aMarch 28, 2024 when the price of $54.450reached $83.17 per barrel. The low of the period was on June 21, 2017January 2, 2024 when the price dropped to $42.530$70.38 per barrel. The period ended with the Benchmark Oil Futures Contract at $51.670$83.17 per barrel, downan increase of approximately (3.82)%16.08% over the period. USO’s per share NAV began the period at $11.71$66.91 and ended the period at $10.44$78.93 on September 30, 2017, a decreaseMarch 31, 2024, an increase of approximately (10.85)%17.96% over the period. USO’s per share NAV reached its high for the period on January 6, 2017 at $11.76 and reached its low for the period on June 21, 2017 at $8.74. The Benchmark Oil Futures Contract prices listed above began with the $71.65 February 20172024 contracts and ended with the November 2017May 2024 contracts. The decreaseincrease of approximately (3.82)%16.08% on the Benchmark Oil Futures Contract listed above is a hypothetical return only and couldwould not actually be achievedrealized by an investor holding Oil Futures Contracts. An investment in Oil Futures Contracts would need to be rolled forward during the time period described in order to simulate such a result. Furthermore, the change in the nominal price of these differing crude Oil Futures Contracts, measured from the start of the periodyear to the end of the period,year, does not represent the actual benchmark results that USO seeks to track, which are more fully described below in the section titled “Tracking“Tracking USO’s Benchmark.” During the ninethree months ended September 30, 2017,March 31, 2024, the crude oil futures market experienced states of both contango and backwardation. On days when the market was in a state of contango meaning that the price of the near month crude Oil Futures Contract was lower than the price of the next month crude Oil Futures Contract, andor contracts further away from expiration. (OnOn days when the market iswas in backwardation, the price of the near month crude Oil Futures Contract is typicallywas higher than the price of the next month crude Oil Futures Contract or contracts further away from expiration.) For a discussion of the impact of backwardation and contango on total returns, see“Term “Term Structure of Crude Oil Prices and the Impact on Total Returns” below. Valuation of Oil Futures Contracts and the Computation of the Per Share NAV The per share NAV of USO’s shares is calculated once each NYSE Arca trading day. The per share NAV for a particular trading day is released after 4:00 p.m. New York time. Trading during the core trading session on the NYSE Arca typically closes at 4:00 p.m. New York time. USO’s administratorAdministrator uses the settlement price determined by NYMEX closing price (determined at the earlier of the close of the NYMEX or 2:30 p.m. New York time)Eastern time for the contractsOil Futures Contracts held on the NYMEX and the settlement price determined by ICE Futures at 2:30 p.m. Eastern time for the Oil Futures Contracts held on ICE Futures, but calculates or determines the value of all other USO investments, including ICE Futures contracts or other futures contracts, as of the earlier of the close of the NYSE Arca or 4:00 p.m. New York time. Results of Operations and the Crude Oil Market Results of Operations. As of March 31, 2024, USO had 18,023,603 shares outstanding. On April 10, 2006,August 29, 2023, the SEC declared effective a registration statement filed by USO listed its shares on the American Stock Exchange (the “AMEX”) under the ticker symbol “USO.” On that day, USO established its initial offering price at $67.39 per share and issued 200,000 shares to the initial Authorized Participant in exchange for $13,479,000 in cash.registered an unlimited number of shares. As a result, of the acquisition of the AMEX by NYSE Euronext, USO’s shares ceased trading on the AMEX and commenced trading on the NYSE Arca on November 25, 2008. Since its initial offering of 17,000,000 shares, USO has registered nine subsequent offeringsan unlimited number of its shares: 30,000,000 shares which were registered with the SEC on October 18, 2006, 50,000,000 shares which were registered with the SEC on January 30, 2007, 30,000,000 shares which were registered with the SEC on December 4, 2007, 100,000,000 shares which were registered with the SEC on February 7, 2008, 100,000,000 shares which were registered with the SEC on September 29, 2008, 300,000,000 shares which were registered with the SEC on January 16, 2009, 1,000,000,000 shares which were registered with the SEC on June 29, 2009, 500,000,000 shares which were registered with the SEC on April 28, 2015, and 1,000,000,000 shares which were registered with the SEC on February 29, 2016. Shares offered by USOthat can be issued in the subsequent offerings were sold for cash at the per share NAV as described in the applicable prospectus. Asform of September 30, 2017, USO had issued 2,469,200,000 shares, 221,100,000 of which were outstanding. As of September 30, 2017, there were 657,800,000 shares registered but not yet issued.
Creation Baskets. More shares may have been issued by USO than are outstanding due to the redemption of shares. Unlike funds that are registered under On April 28, 2020, after the Investment Company Actclose of 1940, as amended,trading on the NYSE Arca, USO effected a 1-for-8 reverse share split and post-split shares that have been redeemed byof USO cannot be resold by USO.began trading on April 29, 2020. As a result of the reverse share split, every eight pre-split shares of USO contemplates that additional offeringswere automatically exchanged for one post-split share. Immediately prior to the reverse split, there were 1,482,900,000 shares of itsUSO issued and outstanding, representing a per share NAV of $2.04. Immediately after the effect of the reverse share split, the number of issued and outstanding shares will be registeredof USO decreased to 185,362,500, not accounting for fractional shares, and the per share NAV increased to $16.35. In connection with the SEC inreverse share split, the future in anticipationCUSIP number for USO’s shares changed to 91232N207. USO’s ticker symbol, “USO,” remained the same. The accompanying unaudited financial statements have been adjusted to reflect the effect of additional issuances and redemptions. the reverse share split on a retroactive basis. As of September 30, 2017,March 31, 2024, USO had the following Authorized Participants: ABN Amro, BNP Paribas Prime Brokerage Inc.,AMRO Clearing USA LLC, BNP Paribas Securities Corp., Citadel Securities LLC, Citigroup Global Markets Inc., Credit Suisse Securities USA LLC, Deutsche Bank Securities Inc., Goldman Sachs & Company, Goldman Sachs Execution & Clearing LP, JP Morgan Securities Inc.,LLC, Merrill Lynch Professional Clearing Corp., Morgan Stanley & Company Inc., Nomura Securities International Inc., RBC Capital Markets LLC, SG Americas Securities LLC, UBS Securities LLC and Virtu Financial BD LLC and Wedbush Securities Inc.Americas LLC. For the NineThree Months Ended September 30, 2017March 31, 2024 Compared to the NineThree Months Ended September 30, 2016March 31, 2023 | | | For the nine
months ended
September 30, 2017 | | | For the nine
months ended
September 30, 2016 | | | | | | | | | | | | | | | Three months | | Three months | | | | | ended | | ended | | | | | March 31, 2024 | | March 31, 2023 | | | Average daily total net assets | | $ | 2,793,415,494 | | | $ | 3,402,607,890 | | | $ | 1,418,071,175 | | $ | 1,689,960,375 | | | Dividend and interest income earned on Treasuries, cash and/or cash equivalents | | $ | 15,283,923 | | | $ | 7,850,978 | | | $ | 16,921,740 | | $ | 16,542,991 | | | Annualized approximate yield based on average daily total net assets | | | 0.73 | % | | | 0.31 | % | | Annualized yield based on average daily total net assets | | | | 4.80 | % | | 3.97 | % | | Management fee | | $ | 9,401,948 | | | $ | 11,462,884 | | | $ | 1,583,453 | | $ | 1,875,162 | | | Total fees and other expenses excluding management fees | | $ | 6,142,148 | | | $ | 8,278,476 | | | $ | 1,290,518 | | $ | 948,468 | | | Fees and expenses related to the registration or offering of additional shares | | $ | 260,603 | | | $ | 252,159 | | | | Total commissions accrued to brokers | | $ | 3,775,114 | | | $ | 5,376,805 | | | $ | 394,046 | | $ | 175,146 | | | Total commissions as annualized percentage of average total net assets | | | 0.18 | % | | | 0.21 | % | | | 0.11 | % | | 0.04 | % | | Commissions accrued as a result of rebalancing | | $ | 3,311,727 | | | $ | 4,920,092 | | | | Percentage of commissions accrued as a result of rebalancing | | | 87.73 | % | | | 91.51 | % | | | Commissions accrued as a result of creation and redemption activity | | $ | 463,387 | | | $ | 456,713 | | | | Percentage of commissions accrued as a result of creation and redemption activity | | | 12.27 | % | | | 8.49 | % | |
Portfolio Expenses.Expenses. USO’s expenses consist of investment management fees, brokerage fees and commissions, certain offering costs, licensing fees, registration fees, the fees and expenses of the independent directors of USCF and expenses relating to tax accounting and reporting requirements. The management fee that USO pays to USCF is calculated as a percentage of the total net assets of USO. The fee is accrued daily and paid monthly. Average interest rates earned on short-term investments held by USO, including cash, cash equivalents and Treasuries, were higher during the nine months ended September 30, 2017, compared to the nine months ended September 30, 2016. As a result, the amount of income earned by USO as a percentage of average daily total net assets was higher during the nine months ended September 30, 2017, compared to the nine months ended September 30, 2016.
The decrease in total fees and expenses excluding management fees for the nine months ended September 30, 2017, compared to the nine months ended September 30, 2016, was due to USO’s smaller size as measured by total net assets.
The decrease in the total commissions accrued to brokers by USO for the nine months ended September 30, 2017, as compared to the nine months ended September 30, 2016, was due primarily to a lower number of futures contracts being held and traded as a result of USO’s smaller size in terms of average net assets.
For the Three Months Ended September 30, 2017 Compared to the Three Months Ended September 30, 2016
| | | For the three
months ended
September 30, 2017 | | | For the three
months ended
September 30, 2016 | | | Average daily total net assets | | $ | 2,595,418,451 | | | $ | 3,199,636,635 | | | Dividend and interest income earned on Treasuries, cash and/or cash equivalents | | $ | 6,353,944 | | | $ | 2,861,314 | | | Annualized approximate yield based on average daily total net assets | | | 0.97 | % | | | 0.36 | % | | Management fee | | $ | 2,943,845 | | | $ | 3,619,261 | | | Total fees and other expenses excluding management fees | | $ | 1,861,487 | | | $ | 2,491,904 | | | Fees and expenses related to the registration or offering of additional shares | | $ | 87,822 | | | $ | 87,823 | | | Total commissions accrued to brokers | | $ | 1,248,593 | | | $ | 1,544,097 | | | Total commissions as annualized percentage of average total net assets | | | 0.19 | % | | | 0.19 | % | | Commissions accrued as a result of rebalancing | | $ | 1,073,724 | | | $ | 1,415,711 | | | Percentage of commissions accrued as a result of rebalancing | | | 85.99 | % | | | 91.69 | % | | Commissions accrued as a result of creation and redemption activity | | $ | 174,869 | | | $ | 128,386 | | | Percentage of commissions accrued as a result of creation and redemption activity | | | 14.01 | % | | | 8.31 | % |
Portfolio Expenses. USO’s expenses consist of investment management fees, brokerage fees and commissions, certain offering costs, licensing fees, registration fees, the fees and expenses of the independent directors of USCF and expenses relating to tax accounting and reporting requirements. The management fee that USO pays to USCF is calculated as a percentage of the total net assets of USO. The fee is accrued daily and paid monthly.
Average interest rates earned on short-term investments held by USO, including cash, cash equivalents and Treasuries, were higher during the three months ended September 30, 2017,March 31, 2024, compared to the three months ended September 30, 2016.March 31, 2023. As a result, the amount of income earned by USO as a percentage of average daily total net assets was higher during the three months ended September 30, 2017,March 31, 2024, compared to the three months ended September 30, 2016.March 31, 2023. To the degree that the aggregate yield is higher, the net expense ratio, inclusive of income, will be lower. The decreaseincrease in total fees and other expenses excluding management fees for the three months ended September 30, 2017,March 31, 2024, compared to the three months ended September 30, 2016,March 31, 2023, was due primarily to USO’s smaller size as measured by total net assets.an increase in professional fees and Brokerage commissions. The decreaseincrease in the total commissions accrued to brokers by USO for the three months ended September 30, 2017, asMarch 31, 2024, compared to the three months ended September 30, 2016,March 31, 2023, was due primarily to a lowerhigher number of futures contractsOil Futures Contracts being held and traded as a resulttraded. Table of USO’s smaller size in terms of average net assets.Contents Tracking USO’s Benchmark USCF seeks to manage USO’s portfolio such that changes in its average daily per share NAV, on a percentage basis, closely track the daily changes in the average price of the Benchmark Oil Futures Contract, also on a percentage basis. Specifically, USCF seeks to manage the portfolio such that over any rolling period of 30-valuation days, the average daily change in USO’s per share NAV is within a range of 90% to 110% (0.9 to 1.1) of the average daily change in the price of the Benchmark Oil Futures Contract. As an example, if the average daily movement of the price of the Benchmark Oil Futures Contract for a particular 30-valuation day time period was 0.50% per day, USCF would attempt to manage the portfolio such that the average daily movement of the per share NAV during that same time period fell between 0.45% and 0.55% (i.e.(i.e., between 0.9 and 1.1 of the benchmark’s results). USO’s portfolio management goals do not include trying to make the nominal price of USO’s per share NAV equal to the nominal price of the current Benchmark Oil Futures Contract or the spot price for light, sweet crude oil. USCF believes that it is not practical to manage the portfolio to achieve such an investment goal when investing in Oil Futures Contracts and otherOther Oil-Related Investments. For the 30-valuation days ended September 30, 2017,March 31, 2024, the simple average daily change in the Benchmark Oil Futures Contract was 0.2771%0.319%, while the simple average daily change in the per share NAV of USO over the same time period was 0.2787%0.335%. The average daily difference was 0.0016%0.016%% (or 0.161.6 basis points, where 1 basis point equals 1/100 of 1%). As a percentage of the daily movement of the Benchmark Oil Futures Contract, the average error in daily tracking by the per share NAV was 1.8306%, meaning that over this time period USO’s tracking error wasNAV performed within the plus or minus 10% range established as its benchmark tracking goal. A significant portion of the level of USO’s relative tracking error as a percentage of the benchmark was due to periods of flat price returns. Since the commencement of the offering of USO’s shares to the public on April 10, 2006 to September 30, 2017,March 31, 2024, the simple average daily change in the Benchmark Oil Futures Contract was (0.0385)%0.004%, while the simple average daily change in the per share NAV of USO over the same time period was (0.0387)(0.010)%. The average daily difference was (0.0002)(0.014)% (or (0.02)(1.4) basis points, where 1 basis point equals 1/100 of 1%). As a percentage of the daily movement of the Benchmark Oil Futures Contract, the average error in daily tracking by the per share NAV was 0.0803%, meaning that over this time period USO’s tracking error wasNAV performed within the plus or minus 10% range established as its benchmark tracking goal. The following two graphscharts demonstrate the correlation between the changes in USO’s NAV and the changes in the Benchmark Oil Futures Contract. The first graph exhibitschart below shows the daily changes inmovement of USO’s per share NAV versus the lastdaily movement of the Benchmark Oil Futures Contract for the 30 valuation daysday period ended September 30, 2017.March 31, 2024. The second graph measureschart below shows the monthly changes since September 30, 2012 through September 30, 2017.total returns of USO as compared to the monthly value of the Benchmark Oil Futures Contract for the five years ended March 31, 2024. 
*PAST PERFORMANCE IS NOT NECESSARILY INDICATIVE OF FUTURE RESULTS 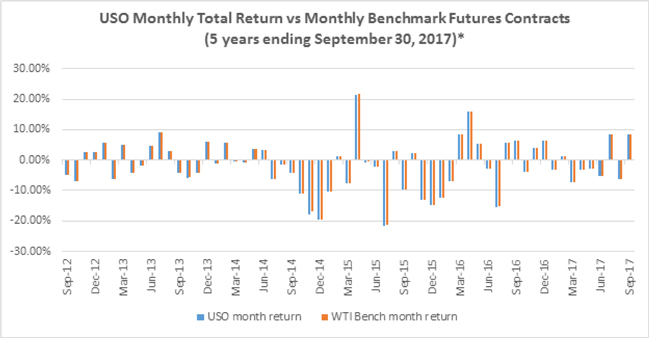 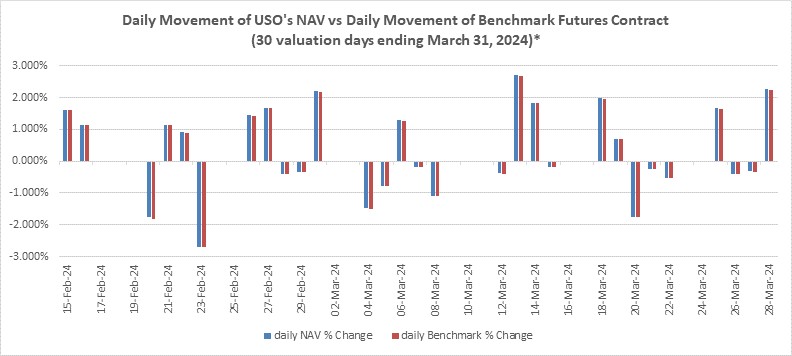
*PAST PERFORMANCE IS NOT NECESSARILY INDICATIVE OF FUTURE RESULTS 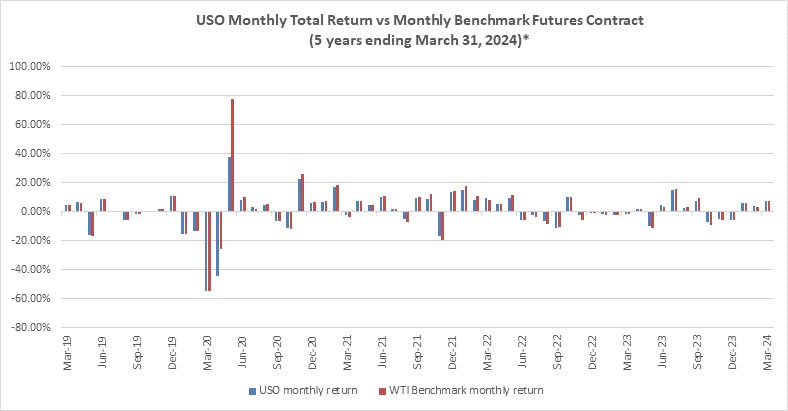
An alternative tracking measurement of the return performance of USO versus the return of its Benchmark Oil Futures Contract can be calculated by comparing the actual return of USO, measured by changes in its per share NAV, versus the expected changes in its per share NAV under the assumption that USO’s returns had been exactly the same as the daily changes in its Benchmark Oil Futures Contract. For the ninethree months ended September 30, 2017,March 31, 2024, the actual total return of USO as measured by changes in its per share NAV was (10.85)%17.96%. This is based on an initial per share NAV of $11.71$66.91 as of December 31, 20162023 and an ending per share NAV as of September 30, 2017March 31, 2024 of $10.44. During this time period, USO made no distributions to its shareholders. However, if USO’s daily changes in its per share NAV had instead exactly tracked the changes in the daily total return of the Benchmark Futures Contract, USO would have had an estimated per share NAV of $10.44 as of September 30, 2017, for a total return over the relevant time period of (10.85)%. There was no difference between the actual per share NAV total return of USO of (10.85)% and the expected total return based on the Benchmark Oil Futures Contract of (10.85)%, which is to say that USO’s actual total return performed exactly the same as the benchmark result. USO incurs expenses primarily composed of the management fee, brokerage commissions for the buying and selling of futures contracts, and other expenses. The impact of these expenses, offset by interest and dividend income, and net of positive or negative execution, tends to cause daily changes in the per share NAV of USO to track differently than daily changes in the price of the Benchmark Oil Futures Contract. By comparison, for the nine months ended September 30, 2016, the actual total return of USO as measured by changes in its per share NAV was (0.18)%. This was based on an initial per share NAV of $11.02 as of December 31, 2015 and an ending per share NAV as of September 30, 2016 of $11.00.$78.93. During this time period, USO made no distributions to its shareholders. However, if USO’s daily changes in its per share NAV had instead exactly tracked the changes in the daily total return of the Benchmark Oil Futures Contract, USO would have had an estimated per share NAV of $11.04$78.17 as of September 30, 2016,March 31, 2024, for a total return over the relevant time period of 0.18%16.81%. The difference
between the actual per share NAV total return of USO of (0.18)%17.96% and the expected total return based on the Benchmark Oil Futures Contract of 0.18%16.81% was an errora difference over the time period of 0.36%1.15%, which is to say that USO’s actual total return underperformed theoutperformed its benchmark result by that percentage. USO incurredincurs expenses primarily composed of the management fee, brokerage commissions for the buying and selling of futures contracts, and other expenses. The impact of these expenses, offset by interest and dividend income, and net of positive or negative execution, and net the difference in returns between USO’s current holdings and the Benchmark Oil Futures Contract tended to cause daily changes in the per share NAV of USO to track slightly lowerhigher than daily changes in the price of the Benchmark Oil Futures Contract. By comparison, for the three months ended March 31, 2023, the actual total return of USO as measured by changes in its per share NAV was (5.11)%. This is based on an initial per share NAV of $70.05 as of December 31, 2022 and an ending per share NAV as of March 31, 2023 of $66.47. During this time period, USO made no distributions to its shareholders. However, if USO’s daily changes in its per share NAV had instead exactly tracked the changes in the daily total return of the Benchmark Oil Futures Contract, USO would have had an estimated per share NAV of $65.49 as of March 31, 2023, for a total return over the relevant time period of (6.51)%. The difference between the actual per share NAV total return of USO of (5.11)% and the expected total return based on the Benchmark Oil Futures Contract of (6.51)% was a difference over the time period of 1.40%, which is to say that USO’s actual total return outperformed its benchmark by that percentage. USO incurs expenses primarily composed of the management fee, brokerage commissions for the buying and selling of futures contracts, and other expenses. The impact of these expenses, offset by interest and dividend income, and net of positive or negative execution, and net the difference in returns between USO’s current holdings and the Benchmark Futures contract tended to cause daily changes in the per share NAV of USO to track slightly higher than daily changes in the price of the Benchmark Oil Futures Contract. As a result of market conditions and the regulatory response that occurred in March 2020 and thereafter, large numbers of USO shares that were purchased during a short period of time, and regulatory accountability levels and position limits on oil futures contracts that were imposed on USO, and risk mitigation measures imposed by its FCMs, USO invested in Oil Futures Contracts in months other than the Benchmark Oil Futures Contract. Beginning with the monthly roll in September 2023 and ending with the monthly roll in January 2024, USO began transitioning its investment portfolio so that primarily invests in Benchmark Oil Futures Contracts, consistent with USO’s investment strategy prior to the Spring of 2020. However, USO has had, and will continue to have, the ability to invest in Oil Futures Contracts beyond the Benchmark Oil Futures Contract and Other Oil-Related Investments, such as OTC swaps, and USO may make such investments if market conditions, regulatory requirements, risk mitigation measures (including those that may be taken by USO, USO’s FCMs, counterparties or other market participants), liquidity requirements, or other factors require USO to do so in order to meet its investment objective. USO may invest in Oil Futures Contracts beyond the Benchmark Oil Futures Contract, and/or Other Oil-Related Investments, as a result or in response to any of the foregoing factors. During the first quarter of 2024 the rolling 30 day average daily difference between the return of USO’s NAV and the Benchmark Futures Contract was 0.017% or 1.7 basis points). There are currently three factors that typically have impacted or are most likely to impact USO’s ability to accurately its track its Benchmark Oil Futures Contract. Contract in addition to the foregoing. First, USO may buy or sell its holdings in the then current Benchmark Oil Futures Contract at a price other than the closing settlement price of that contract on the day during which USO executes the trade. In that case, USO may pay a price that is higher, or lower, than thatthe closing settlement price of the Benchmark Oil Futures Contract, which could cause the changes in the daily per share NAV of USO to either be too high or too low relative to the daily changes in the Benchmark Oil Futures Contract. During the ninethree months ended September 30, 2017,March 31, 2024, USCF attempted to minimize the effect of these transactions by seeking to execute its purchase or sale of the Benchmark Oil Futures ContractContracts at, or as close as possible to, the end of the day settlement price. However, it may not always be possible for USO to obtain the closing settlement price and there is no assurance that failure to obtain the closing settlement price in the future will not adversely impact USO’s attempt to track the Benchmark Oil Futures Contract over time.Contract. Second, USO incurs expenses primarily composed of the management fee, brokerage commissions for the buying and selling of futures contracts, and other expenses. The impact of these expenses tends to cause daily changes in the per share NAV of USO to track slightly lower than daily changes in the price of the Benchmark Oil Futures Contract. At the same time, USO earns dividend and interest income on its cash, cash equivalents and Treasuries. USO is not required to distribute any portion of its income to its shareholders and did not make any distributions to shareholders during the ninethree months ended September 30, 2017.March 31, 2024. Interest payments, and any other income, were retained within the portfolio and added to USO’s NAV. When this income exceeds the level of USO’s expenses for its management fee, brokerage commissions and other expenses (including ongoing registration fees, licensing fees and the fees and expenses of the independent directors of USCF), USO will realize a net yield that will tend to cause daily changes in the per share NAV of USO to track slightly higher than daily changes in the Benchmark Oil Futures Contract. If short-term interest rates rise above the currentthese levels, the level of deviation created by the yield would decrease.increase. Conversely, if short-term interest rates were to decline, the amount of error created by the yield would increase.decrease. When short-term yields drop to a level lower than the combined expenses of the management fee and the brokerage commissions, then the tracking error becomes a negative number and would tend to cause the daily returns of the per share NAV to underperform the daily returns of the Benchmark Oil Futures Contract. USCF anticipates that interest rates willmay continue to remain at historical lows and, therefore, itstagnate over the near future. It is anticipated that fees and expenses paid by USO willmay continue to be higherlower than interest earned by USO. As such, USCF anticipates that USO will continue to underperformcould possibly outperform its benchmark until such a time whenso long as interest earned at least equals or exceedsis greater than the fees and expenses paid by USO. Third, USO may hold Other Oil-Related Investments in its portfolio that may fail to closely track the Benchmark Oil Futures Contract’s total return movements. In that case, the error in tracking the Benchmark Oil Futures Contract could result in daily changes in the per share NAV of USO that are either too high, or too low, relative to the daily changes in the Benchmark Oil Futures Contract. During the ninethree months ended September 30, 2017,March 31, 2024, USO did not hold anyheld OTC swaps, which are considered Other Oil-Related Investments. If USO increases in size, and due to its obligations to comply with market conditions, regulatory limits, and risk mitigation measures imposed by its FCMs, USO may invest in additional Other Oil-Related Investments, such as OTC swaps, which may have the effect of increasing transaction related expenses and may result in increased tracking error. OTC swaps increase transaction-related expenses due to the fact that USO must pay to the swap counterparty certain fees that USO does not have to pay for transactions executed on an exchange. Term Structure of Crude Oil Futures Prices and the Impact on Total Returns. Several factors determine the total return from investing in futures contracts. One factor arises from “rolling” futures contracts that will expire at the end of the current month (the “near” or “front” month contract) forward each month prior to expiration. For a strategy that entails holding the near month contract, the price relationship between that futures contract and the next month futures contract will impact returns. For example, if the price of the near month futures contract is higher than the next futures month contract (a situation referred to as “backwardation”), then absent any other change, the price of a next month futures contract tends to rise in value as it becomes the near month futures contract and approaches expiration. Conversely, if the price of a near month futures contract is lower than the next month futures contract (a situation referred to as “contango”), then absent any other change, the price of a next month futures contract tends to decline in value as it becomes the near month futures contract and approaches expiration. As an example, assume that the price of crude oil for immediate delivery, is $50 per barrel, and the value of a position in the near month futures contract is also $50. Over time, the price of crude oil will fluctuate based on a number of market factors, including demand for oil relative to supply. The value of the near month futures contract will likewise fluctuate in reaction to a number of market factors. If an investor seeks to maintain a position in a near month futures contract and not take delivery of physical barrels of crude oil, the investor must sell the current near month futures contract as it approaches expiration and invest in the next month futures contract. In order to continue holding a position in the current near month futures contract, this “roll” forward of the futures contract must be executed every month. Contango and backwardation are natural market forces that have impacted the total return on an investment in USO’s shares during the past year relative to a hypothetical direct investment in crude oil. In the future, it is likely that the relationship between the market price of USO’s shares and changes in the spot prices of light, sweet crude oil will continue to be impacted by contango and backwardation. It is important to note that this comparison ignores the potential costs associated with physically owning and storing crude oil, which could be substantial. If the futures market is in backwardation, e.g., when the price of the near month futures contract is higher than the price of the next month futures contract, the investor would buy a next month futures contract for a lower price than the current near month futures contract. Assuming the price of the next month futures contract was $49 per barrel, or 2% cheaper than the $50 near month futures contract, then, hypothetically, and assuming no other changes (e.g., to either prevailing crude oil prices or the price relationship between the spot price, the near month contract and the next month contract, and, ignoring the impact of commission costs and the income earned on cash and/or cash equivalents), the value of the $49 next month futures contract would rise to $50 as it approaches expiration. In this example, the value of an investment in the next month futures contract would tend to outperform the spot price of crude oil. As a result, it would be possible for the new near month futures contract to rise 12% while the spot price of crude oil may have risen a lower amount, e.g., only 10%. Similarly, the spot price of crude oil could have fallen 10% while the value of an investment in the futures contract might have fallen another amount, e.g., only 8%. Over time, if backwardation remained constant, this difference between the spot price and the futures contract price would continue to increase. If the futures market is in contango, an investor would be buying a next month futures contract for a higher price than the current near month futures contract. Again, assuming the near month futures contract is $50 per barrel, the price of the next month futures contract might be $51 per barrel, or 2% more expensive than the front month futures contract. Hypothetically, and assuming no other changes, the value of the $51 next month futures contract would fall to $50 as it approaches expiration. In this example, the value of an investment in the second month would tend to underperform the spot price of crude oil. As a result, it would be possible for the new near month futures contract to rise only 10% while the spot price of crude oil may have risen a higher amount, e.g., 12%. Similarly, the spot price of crude oil could have fallen 10% while the value of an investment in the second month futures contract might have fallen another amount, e.g., 12%. Over time, if contango remained constant, this difference between the spot price and the futures contract price would continue to increase. The chart below compares the daily price of the near month crude oil futures contract to the price of the 13th month crude oil futures contract (i.e., a contract one year forward) over the last 10 years. When the price of the near month futures contract is higher than the price of the near 13th month futures contracts,contract, the market would be described as being in backwardation. When the price of the near month futures contract is lower than the 13th month futures contracts,contract, the market would be described as being in contango. Although the price of the near month futures contract and the price of the near 13th month futures contractscontract tend to move together, it can be seen that at times the near month futures contract prices are higher than the 13th month futures contractscontract prices (backwardation), and, at other times, the near month futures contract prices are lower than the 13th month futures contract prices (contango). *PAST PERFORMANCE IS NOT NECESSARILY INDICATIVE OF FUTURE RESULTS An alternative way to view the same data is to subtract the dollar price of the 13th month crude oil futures contract from the dollar price of the near month crude oil futures contract, as shown in the chart below. When the difference is positive, the market is in backwardation. When the difference is negative, the market is in contango. The crude oil market spent time in both backwardation and contango during the last ten years. *PAST PERFORMANCE IS NOT NECESSARILY INDICATIVE OF FUTURE RESULTS An investment in a portfolio that owned only the near month crude oil futures contract would likely produce a different result than an investment in a portfolio that owned an equal number of each of the near 12 months’months of crude oil futures contracts. Generally speaking, when the crude oil futures market is in backwardation, a portfolio of only the near month crude oil futures contract may tend to have a higher total return than a portfolio of 12 months’months of the crude oil futures contract. Conversely, if the crude oil futures market was in contango, the portfolio containing only 12 months’months of crude oil futures contracts may tend to outperform the portfolio holding only the near month crude oil futures contract. Historically, the crude oil futures markets have experienced periods of contango and backwardation, with backwardation being in place roughly assomewhat less often asthan contango since oil futures trading started in 1982.1983. Following the global financial crisis in the fourth quarter of 2008, the crude oil market moved into contango and remained primarily in contango for a period of several years. During parts of 2009, the level of contango was unusually steep as a combination of slack U.S. and global demand for crude oil and issues involving the physical transportation and storage of crude oil at Cushing, Oklahoma, the primary pricing point for oil traded in the U.S., led to unusually high inventories of crude oil. A combination of improved transportation and storage capacity, along with growing demand for crude oil globally, moderated the inventory build-up and led to reduced levels of contango by 2011. However, at the end of November,until 2013. In 2014, global crude oil inventories grew rapidly after the Organization of Petroleum Exporting Countries’ (“OPEC”) decidedOPEC voted to defend its market share against U.S. shale-oil producers, resulting in another period during which the crude oil market remained primarily in contango, sometimes steep contango. This period of contango continued through December 31, 2016. 2017. Declining global crude oil inventories caused the market to flip into backwardation at the beginning of 2018 through late October 2018, at which point ongoing supply growth in the U.S., combined with increased OPEC production, once again led market participants to fear another global glut of crude oil. The crude oil market was primarily in contango the first half of 2019 and in backwardation during the second half of 2019. Crude oil flipped back into contango in January 2020 and remained predominantly in contango throughout 2020. In addition,March 2020, contango dramatically increased and reached historic levels during the economic crisis arising from the COVID-19 pandemic, related supply chain disruptions and ongoing disputes among oil producing countries. This level of contango was due to significant market volatility that occurred in crude oil markets as well as oil futures markets. Crude oil prices collapsed in the wake of the COVID-19 demand shock, which reduced global petroleum consumption, and the price war launched by Saudi Arabia at the beginning of March 2020 in response to Russia’s unwillingness to participate in extending previously agreed upon supply cuts. An estimated twenty million barrels a day of crude demand evaporated as a result of quarantines and massive drops in industrial and manufacturing activity. Eventually, the United States, OPEC, Russia, and other oil producers around the world agreed to a historic 9.7 million barrel per day cut to crude supply. The supply cut along with the partial reopening of economies during the third quarter of 2020 reduced some of the unprecedented volatility that oil markets experienced in the Spring of 2020. During the twelve months ended December 31, 2020, the crude oil markets are expected to remainfutures market spent time in both a state of contango until U.S. and global oil inventories decline significantly. If OPEC’s recent cuts in oil production have their intended effect onbackwardation as measured by the difference between the front month and the second month contract, whereas during the twelve months ended December 31, 2021, the crude oil futures market then suchwas primarily in a decline may occurstate of backwardation as measured by the difference between the front month and the second month contract. During the year ended December 31, 2022, the crude oil futures market experienced states of both contango and backwardation as measured by the difference between the front month and the second month contract, and during the three-month period ended March 31, 2024, the crude oil futures market also experienced states of both contango. and backwardation. As a result of market and regulatory conditions, including significant market volatility, large numbers of USO shares purchased during a short period of time, applicable regulatory accountability levels and position limits on oil futures contracts and risk mitigation measures that were taken by USO and USO’s FCM in 2017. Periods of contango or backwardation do not materially impact USO’s investment objective of having the daily percentage changes2020, USO invested in, its per share NAV track the daily percentage changesand continues to invest in, the priceOil Futures Contracts with expiration dates for months later than that of the Benchmark Oil Futures Contract sinceContract. Holdings in later month contracts will typically cause USO to experience lesser effects from contango and backwardation than would be the impact of backwardationcase if USO’s holdings were primarily in oil futures contracts in the first month or second month. Beginning with the monthly roll in September 2023 and contango tendending with the monthly roll in January 2024, USO’s intention is to equally impactbegin transitioning its investment portfolio so that it will primarily invest in Benchmark Oil Futures Contracts, consistent with USO’s investment strategy prior to 2020. However, USO has had, and will continue to have, the daily percentage changesability to invest in price of both USO’s shares andOil Futures Contracts beyond the Benchmark Oil Futures Contract. It is impossibleContract and Other Oil-Related Investments, such as OTC swaps, and USO may make such investments if market conditions, regulatory requirements, risk mitigation measures (including those that may be taken by USO, USO’s FCMs, counterparties or other market participants), liquidity requirements, or other factors require USO to predict withdo so in order to meet its investment objective. USO may invest in Oil Futures Contracts beyond the Benchmark Oil Futures Contract, and/or Other Oil-Related Investments, as a result or in response to any degree of certainty whether backwardation or contango will occur in the future. It is likely that both conditions will occur during different periods.
foregoing factors. Crude Oil Market.Market. During the ninethree months ended September 30, 2017,March 31, 2024, the price of the front month WTI crude oil prices havefutures contract traded in a range between $43$70.38 to $53$83.47. Prices increased from December 31, 2023 through March 31, 2024, finishing the quarter at $83.17. The simultaneous demand and supply shocks from the COVID-19 pandemic and Saudi-Russia price war precipitated unparalleled risk and volatility in crude oil markets during the first half of 2020. Global demand for crude oil plummeted by as much as 30% in the spring of 2020 as workers around the world stopped driving, airlines cut flight schedules, and companies suspended operations. Meanwhile, U.S. crude oil supply reached 13 million barrels per day (mbd), capping a period of almost continuous growth since 2016. To offset the seemingly unstoppable U.S. production growth threatenedjuggernaut, OPEC+ (a loose coalition between OPEC and non-member nations such as Russia and Mexico) had maintained an uneasy series of agreements to overwhelmcurtail their crude oil output in order to support crude oil prices. However, in early March of 2020, Russia refused Saudi Arabia’s proposal to extend cuts in response to the impactCOVID-19 demand shock. The kingdom retaliated with a massive production increase, launching an all-out price war in the middle of a pandemic. Although the members of OPEC+ reached a record-shattering agreement in mid-April of 2020, the implementation of new supply cuts came too late to prevent crude oil prices from plummeting to historic lows, culminating in a drop into negative territory for the May WTI crude oil futures contract on April 20, 2020. During the second quarter of 2020, the International Energy Agency (IEA) reported that crude oil demand fell an average of 16.4 mbd while global crude oil supply declined by an average of 13.7 mbd. Demand evaporated as a result of quarantines and massive drops in industrial and manufacturing activity. Supply declined largely due to the historic agreement in April of 2020 between the United States, OPEC, Russia, and other oil producers. The bulk of the supply cuts. Prices rosedecline came from voluntary OPEC+ cuts while 2.8 mbd resulted from market driven cuts in the United States. As of June 30, 2020, U.S. production had dropped over 15%, rapidly falling back to 11 mbd. Oil producing rigs in the United States fell to 180 from over 670 at the start of the year, a massive decline that will likely see U.S. supply fall further. Finally, in late June of 2020 storage in the U.S. spiked to 541 million barrels while global storage reached 3.351 billion barrels. The unprecedented twin crises described above caused unparalleled effects on oil futures markets during the third quarter as U.S. and global inventories declined. U.S. storage fell faster than the normal seasonal pace and dropped2020. First, front month WTI Oil Futures Contract prices dipped below prior-year inventory levels$20 for the first time since 2014.2002 and hit an all-time closing low of $(37.63). Multiple record-breaking returns occurred between March and May of 2020. The price of the front month WTI Oil Futures Contract averaged $28 during the second quarter of 2020 compared to $46 during the first quarter of 2020 and $57 during calendar year 2019. Second, crude oil price volatility went off-the-charts. For example, the 30-day annualized volatility of front month WTI crude oil futures prices reached 984% in May 2020 after averaging 35% in 2019 and 25% in the first two months of 2020. (If May crude oil futures had not gone negative on April 20, 2020, volatility would “only” have reached 416%.) Third, futures curves, which can exhibit conditions known as “contango” and “backwardation” as discussed above, moved into a condition that some market experts referred to as “super contango.” This was a result of extreme bearishness at the front of the futures curve due to rapidly filling storage facilities in the U.S. production ramped up steadily throughoutand around the world. Specifically, the price of the front month WTI Oil Futures Contract detached from the rest of the futures curve and fell to an extreme position relative to futures contracts with expiration dates in later months. On a percentage basis, the difference in price between the front month WTI Oil Futures Contract and the second month WTI Oil Futures Contract was more than double the previous record. This divergence caused the price of WTI Oil Futures Contracts with different expiration dates to move in different directions. For example, the price of the front month WTI Oil Futures Contract and second month WTI Oil Futures Contract typically move together (i.e., increase or decrease) about 99% of the time. However, in late April of 2020, the correlation of the price of the front and second month WTI Oil Futures Contracts was (24)%, meaning that these contracts were moving in opposite directions. Fourth, USO, among other market participants, diversified its portfolio away from the front of the futures curve in favor of deferred contract months, as discussed in this Form 10-Q. The move by USO and other market participants to deferred contract months caused a historic change during 2020 to relative levels of open interest among the different futures contracts. For example, open interest in the front month futures contract fell an average of 40% during April, May, and June of 2020 compared to the average level of open interest during those same calendar months during the previous five years. As economies reopened and OPEC+ supply cuts were absorbed by the market, WTI crude oil prices rose from all-time lows in the spring of 2020 to an average of $68.00 per barrel during calendar year returning2021. WTI crude oil inventories in the United States fell from a modern record of 541 mb in June 2020 to record levels last seen during summer 2015. However, production and rig count growth both appeared to level off towards418 mb by the end of the fourth quarter of 2021. Crude oil production in the United States fell below 10 mbd twice in 2020 and once in early 2021 after peaking at 13.1 mbd in March of 2020. U.S. production rose to 11.8 mbd by December 31, 2021. Similarly, OPEC production declined from over 30 mbd pre-COVID-19 to a pandemic low of 22.5 mbd before gradually recovering to 28.1 mbd by December 31, 2021. While the impact of the COVID-19 pandemic appears to have decreased, elevated risk from the pandemic remains in the oil markets until the current and future COVID-19 pandemic mitigation measures have fully subsided. Bullish fundamentals for crude oil prices were in place when Russia invaded Ukraine in February of 2022, causing the United States and other countries and certain international organizations to impose broad-ranging economic sanctions on Russia and certain Russian individuals, banking entities and corporations as a response. The war in Ukraine, sanctions and the corresponding disruption in the supply of Russian oil, resulted in significant volatility in the oil markets, particularly in early March when WTI crude oil briefly rose to over $123.70 per barrel on March 8, 2022 then fell back to $95.04 per barrel on March 16, 2022, before rising and the falling again to end the first quarter of 2022 at $100.28 per barrel. A bullish trend for crude oil emerged from mid-April through early June 2022 when WTI crude oil again topped $120 per barrel before, once again, giving up gains to end the fourth quarter of 2022 at $80.26. Crude oil prices struggled to find direction during the first half of 2023 with seventeen notable price reversals, most of which exceeded $5. Prices rose dramatically in the third quarter, from approximately $70 to over $90. This strong bull market completely reversed in the fourth quarter and may represent cautionby December crude had plunged back to the $70 to $75 range. U.S. crude oil production growth accelerated in late July and rose until the end of the year, finally surpassing pre-pandemic levels and reaching a record of 13.3 mbd in December. According to the U.S. Department of Energy, global crude oil demand was roughly in-line with supply during January and March of 2024 and exceeded supply by over one million barrels per day (mbd) in February of 2024. U.S. crude oil production was volatile in the winter months, dropping to as low as 12.3 mbd before recovering to match 2023’s record 13.3 mbd in February. Production declined again in March 2024 to end the quarter at 13.1 mbd. OPEC crude production has mostly declined since late 2022 and fell again in the first quarter of 2024 to 26.85 mbd. Russia and OPEC have still not returned to pre-pandemic production levels, while the U.S. has become the world’s largest crude oil producing nation. OPEC has fiercely supported prices with voluntary cuts by and production quotas on member nations over the partlast several years. In November 2023 and April 2024, OPEC and cooperating countries agreed to extension of producers. Temporary disruptions also occurred as a resultvoluntary cuts and expansion of hurricane Harvey.collective curbs that amounted to 2.2 mbd until at least the end of June 2024. Looking ahead, if OPEC's strategic focus shifts from price support to market share defense, prices could come under pressure. Conversely, demand for crude oil has increased since the onset of the pandemic in 2020. According to the U.S. Department of Energy, crude oil consumption reached an all-time high at the end of 2023 and is expected to continue increasing through 2025 at least. However, growth forecasts from the U.S. Energy Information Administration (EIA) and the International Energy Agency (IEA) have declined from more optimistic projections earlier in 2023. Nevertheless, ongoing demand growth appears strong whileduring a time when OPEC has stated it is preparedcontinues to take any action necessary to perpetuate the current trend towards a balanced market. Should global demand growth forecasts fail to be realized, or if OPEC is unable to counter growing U.S. production, there is a meaningful possibility that crude prices could fall again. On the other hand, increasing global tensions and the possibility of any number of conflicts escalatingrestrain supply could lead to price shocksstable or higher prices over time. Supply constraints, worker shortages, infrastructure and manufacturing energy usage, the Russia-Ukraine war, the terror attacks by Hamas on Israel, the Israel/Iran conflict, and other conflict in the Middle East, and other geopolitical tensions, political unrest, and attacks or threats of attack by terrorists, are other factors that could contribute to future increases in crude oil prices. Conversely, changes in OPEC policy, further non-OPEC production growth, and any sluggishness in the global economy could weigh on prices. Geopolitical risk remains particularly high in 2024. The Russia-Ukraine war and Middle East conflict have the potential to create further supply disruptions and sanctions, which could lead to further volatility. However, if a resolution to the upside. conflicts were to occur, volatility could decrease and prices could decline somewhat in a short period of time. Even short-term changes in perceived geopolitical risk can cause the market to change swiftly. Crude oil prices may also be highly reactive to developments as global buyers and sellers of crude reposition their relationships. Crude Oil Price Movements in Comparison to Other Energy Commodities and Investment Categories. USCF believes that investors frequently measure the degree to which prices or total returns of one investment or asset class move up or down in value in concert with another investment or asset class. Statistically, such a measure is usually done by measuring the correlation of the price movements of the two different investments or asset classes over some period of time. The correlation is scaled between 1 and -1, where 1 indicates that the two investment options move up or down in price or value together, known as “positive correlation,” and -1 indicates that they move in completely opposite directions, known as “negative correlation.” A correlation of 0 would mean that the movements of the two are neither positively nor negatively correlated, known as “non-correlation.” That is, the investment options sometimes move up and down together and other times move in opposite directions. For the ten-year time period between September 30, 2007March 31, 2014 and September 30, 2017,March 31, 2024, the table below compares the monthly movements of crude oil prices versus the monthly movements of the prices of several other energy commodities, such as natural gas, diesel-heating oil, and unleaded gasoline, as well as several major non-commodity investment asset classes, such as large cap U.S. equities, U.S. government bonds and global equities. It can be seen that over this particular time period, the movement of crude oil on a monthly basis exhibited strong correlation with unleaded gasoline and diesel-heating oil, moderate correlation with the movements of large cap U.S. equities and global equities, limited correlation with natural gas, and limited negative correlation with U.S. government bonds. | | | | | | U.S. | | | | | | | | | | | | | | | | | | | | | | | Gov’t. | | | | | | | | | | | | | | | | | | | | | | | Bonds | | | | | | | | | | | | | | | | | | | | Large | | | (EFFAS | | | Global | | | | | | | | | | | | | | | | | Cap U.S. | | | U.S. | | | Equities | | | | | | | | | | | | | | | | | Equities | | | Gov’t. | | | (FTSE | | | | | | Diesel- | | | | | | | | | Correlation Matrix | | (S&P | | | Bond | | | World | | | Unleaded | | | Heating | | | Natural | | | Crude | | | September 30, 2007 – September 30, 2017* | | 500) | | | Index) | | | Index) | | | Gasoline | | | Oil | | | Gas | | | Oil | | | Large Cap U.S. Equities (S&P 500) | | | 1.000 | | | | (0.287 | ) | | | 0.965 | | | | 0.446 | | | | 0.436 | | | | 0.083 | | | | 0.464 | | | U.S. Gov’t. Bonds (EFFAS U.S. Gov’t. Bond Index) | | | | | | | 1.000 | | | | (0.257 | ) | | | (0.349 | ) | | | (0.331 | ) | | | (0.041 | ) | | | (0.390 | ) | | Global Equities (FTSE World Index) | | | | | | | | | | | 1.000 | | | | 0.484 | | | | 0.476 | | | | 0.121 | | | | 0.514 | | | Unleaded Gasoline | | | | | | | | | | | | | | | 1.000 | | | | 0.729 | | | | 0.154 | | | | 0.700 | | | Diesel-Heating Oil | | | | | | | | | | | | | | | | | | | 1.000 | | | | 0.258 | | | | 0.805 | | | Natural Gas | | | | | | | | | | | | | | | | | | | | | | | 1.000 | | | | 0.263 | | | Crude Oil | | | | | | | | | | | | | | | | | | | | | | | | | | | 1.000 | |
Source: Bloomberg, NYMEX
*PAST PERFORMANCE IS NOT NECESSARILY INDICATIVE OF FUTURE RESULTS | | | | | | | | | | | | | | | Crude Oil - 10 Years | | | | | | | | | | | | | | | | | Large | | US | | Global | | | | | | | | | | | Cap US | | Gov’t | | Equities | | | | | | | | | | | Equities | | Bonds | | (FTSE | | | | | | | | | | | (S&P | | (BEUSG4 | | World | | Unleaded | | Heating | | Natural | | Crude | Correlation Matrix 10 Years | | 500) | | Index) | | Index) | | Gasoline | | Oil | | Gas | | Oil | Large Cap US Equities (S&P 500) | | 1.000 | | 0.094 | | 0.978 | | 0.467 | | 0.211 | | 0.109 | | 0.358 | US Gov't Bonds (BEUSG4 Index) | | | | 1.000 | | 0.106 | | (0.192) | | (0.410) | | (0.183) | | (0.261) | Global Equities (FTSE World Index) | | | | | | 1.000 | | 0.515 | | 0.260 | | 0.072 | | 0.410 | Unleaded Gasoline | | | | | | | | 1.000 | | 0.641 | | 0.085 | | 0.751 | Heating Oil | | | | | | | | | | 1.000 | | 0.103 | | 0.747 | Natural Gas | | | | | | | | | | | | 1.000 | | 0.057 | Crude Oil | | | | | | | | | | | | | | 1.000 | Source: Bloomberg, NYMEX | | | | | | | | | | | | | | |
Source: Bloomberg, NYMEX The table below covers a more recent, but much shorter, range of dates than the above table. Over the one year period ended September 30, 2017, movements of crude oil displayed strong correlation with large cap U.S. equities and diesel-heating oil, moderate correlation with movements of global equities, and limited negative to little correlation with movements with U.S. Government bonds, unleaded gasoline and natural gas. | | | | | | U.S. | | | | | | | | | | | | | | | | | | | | | | | Gov’t. | | | | | | | | | | | | | | | | | | | | | | | Bonds | | | | | | | | | | | | | | | | | | | | Large | | | (EFFAS | | | Global | | | | | | | | | | | | | | | | | Cap U.S. | | | U.S. | | | Equities | | | | | | | | | | | | | | | | | Equities | | | Gov’t. | | | (FTSE | | | | | | Diesel- | | | | | | | | | Correlation Matrix | | (S&P | | | Bond | | | World | | | Unleaded | | | Heating | | | Natural | | | Crude | | | 12 Months ended September 30, 2017* | | 500) | | | Index) | | | Index) | | | Gasoline | | | Oil | | | Gas | | | Oil | | | Large Cap U.S. Equities (S&P 500) | | | 1.000 | | | | (0.229 | ) | | | 0.768 | | | | (0.150 | ) | | | 0.326 | | | | (0.331 | ) | | | 0.620 | | | U.S. Gov’t. Bonds (EFFAS U.S. Gov’t. Bond Index) | | | | | | | 1.000 | | | | 0.288 | | | | 0.319 | | | | (0.103 | ) | | | (0.271 | ) | | | (0.393 | ) | | Global Equities (FTSE World Index) | | | | | | | | | | | 1.000 | | | | (0.124 | ) | | | 0.223 | | | | (0.516 | ) | | | 0.515 | | | Unleaded Gasoline | | | | | | | | | | | | | | | 1.000 | | | | 0.497 | | | | 0.408 | | | | (0.212 | ) | | Diesel-Heating Oil | | | | | | | | | | | | | | | | | | | 1.000 | | | | 0.185 | | | | 0.676 | | | Natural Gas | | | | | | | | | | | | | | | | | | | | | | | 1.000 | | | | (0.119 | ) | | Crude Oil | | | | | | | | | | | | | | | | | | | | | | | | | | | 1.000 | |
Source: Bloomberg, NYMEX
*PAST PERFORMANCE IS NOT NECESSARILY INDICATIVE OF FUTURE RESULTS | | | | | | | | | | | | | | | Crude Oil - 1 Year | | | | | | | | | | | | | | | | | Large | | US | | Global | | | | | | | | | | | Cap US | | Gov’t | | Equities | | | | | | | | | | | Equities | | Bonds | | (FTSE | | | | | | | | | | | (S&P | | (BEUSG4 | | World | | Unleaded | | Heating | | Natural | | Crude | Correlation Matrix 1 Year | | 500) | | Index) | | Index) | | Gasoline | | Oil | | Gas | | Oil | Large Cap US Equities (S&P 500) | | 1.000 | | 0.612 | | 0.986 | | 0.496 | | (0.074) | | (0.423) | | (0.047) | US Gov't Bonds (BEUSG4 Index) | | | | 1.000 | | 0.661 | | 0.237 | | (0.365) | | (0.593) | | (0.287) | Global Equities (FTSE World Index) | | | | | | 1.000 | | 0.464 | | (0.057) | | (0.434) | | 0.006 | Unleaded Gasoline | | | | | | | | 1.000 | | 0.256 | | (0.421) | | 0.396 | Heating Oil | | | | | | | | | | 1.000 | | 0.019 | | 0.793 | Natural Gas | | | | | | | | | | | | 1.000 | | (0.008) | Crude Oil | | | | | | | | | | | | | | 1.000 | Source: Bloomberg, NYMEX | | | | | | | | | | | | | | |
Source: Bloomberg, NYMEX Investors are cautioned that the historical price relationships between crude oil and various other energy commodities, as well as other investment asset classes, as measured by correlation may not be reliable predictors of future price movements and correlation results. The results pictured above would have been different if a different range of dates had been selected. USCF believes that crude oil has historically not demonstrated a strong correlation with equities or bonds over long periods of time. However, USCF also believes that in the future it is possible that crude oil could have long term correlation results that indicate prices of crude oil more closely track the movements of equities or bonds. In addition, USCF believes that, when measured over time periods shorter than ten years, there will always be some periods where the correlation of crude oil to equities and bonds will be either more strongly positively correlated or more strongly negatively correlated than the long term historical results suggest. The correlations between crude oil, natural gas, diesel-heating oil and gasoline are relevant because USCF endeavors to invest USO’s assets in Oil Futures Contracts and Other Oil-Related Investments so that daily changes in percentage terms in USO’s per share NAV correlate as closely as possible with daily changes in percentage terms in the price of the Benchmark Oil Futures Contract. If certain other fuel-based commodity futures contracts do not closely correlate with the crude oilcrude-oil futures contract, then their use could lead to greater tracking error. As noted above, USCF also believes that the changes in percentage terms in the price of the Benchmark Oil Futures Contract will closely correlate with changes in percentage terms in the spot price of light, sweet crude oil. Critical Accounting Policies Preparation of the condensed financial statements and related disclosures in compliance with accounting principles generally accepted in the United States of America requires the application of appropriate accounting rules and guidance, as well as the use of estimates. USO’s application of these policies involves judgments and actual results may differ from the estimates used. USCF has evaluated the nature and types of estimates that it makes in preparing USO’s condensed financial statements and related disclosures and has determined that the valuation of its investments, which are not traded on a United States or internationally recognized futures exchange (such as forward contracts and OTC swaps) involves a critical accounting policy. The values which are used by USO for its Oil Futures Contracts are provided by its commodity broker who uses market prices when available, while OTC swaps are valued based on the present value of estimated future cash flows that would be received from or paid to a third party in settlement of these derivative contracts prior to their delivery date and valued on a daily basis. In addition, USO estimates interest and dividend income on a daily basis using prevailing rates earned on its cash and cash equivalents. These estimates are adjusted to the actual amount received on a monthly basis and the difference, if any, is not considered material. Liquidity and Capital Resources USO has not made, and does not anticipate making, use of borrowings or other lines of credit to meet its obligations. USO has met, and it is anticipated that USO will continue to meet, its liquidity needs in the normal course of business from the proceeds of the sale of its investments, or from the Treasuries, cash and/or cash equivalents that it intends to hold at all times. USO’s liquidity needs include: redeeming shares, providing margin deposits for its existing Oil Futures Contracts or the purchase of additional Oil Futures Contracts and posting collateral for its OTC swaps, if applicable, and payment of its expenses, summarized below under “Contractual Obligations.“Contractual Obligations.” USO currently generates cash primarily from: (i) the sale of baskets consisting of 100,000 shares (“Creation Baskets”) and (ii) income earned on Treasuries, cash and/or cash equivalents. USO has allocated substantially all of its net assets to trading in Oil Interests. USO invests in Oil Interests to the fullest extent possible without being leveraged or unable to satisfy its current or potential margin or collateral obligations with respect to its investments in Oil Futures Contracts and Other Oil-Related Investments. A significant portion of USO’s NAV is held in cash and cash equivalents that are used as margin and as collateral for its trading in Oil Interests. The balance of the assets is held in USO’s account at its custodian bank and in investments in money market funds and Treasuries at the FCM.FCMs. Income received from USO’s investments in money market funds and Treasuries is paid to USO. During the ninethree months ended September 30, 2017,March 31, 2024, USO’s expenses did not exceed the income USO earned and the cash earned from the sale of Creation Baskets and the redemption of Redemption Baskets. During the ninethree months ended September 30, 2017,March 31, 2024, USO useddid not use other assets to pay expenses, which could cause a decrease in USO’s NAV over time.expenses. To the extent income exceeded expenses, exceed income, USO’s NAV will be negativelypositively impacted. Although permitted to do so under its LP Agreement, USO has not leveraged, and does not intend to leverage, its assets through borrowings or otherwise, and makes its investments accordingly. Consistent with the foregoing, USO’s investments will take into account the need for USO to maintain adequate liquidity to meet its margin and collateral requirements and to avoid, to the extent reasonably possible, USO becoming leveraged. If market conditions require it, these risk reduction procedures, including changes to USO’s investments, may occur on short notice. USO does not and will not borrow money or use debt to satisfy its margin or collateral obligations in respect of its investments, but it could become leveraged if USO were to hold insufficient assets that would allow it to meet not only the current, but also future, margin or collateral obligations required for such investments. Such a circumstance could occur if USO were to hold assets that have a value of less than zero. USCF endeavors to have the value of USO’s Treasuries, cash and cash equivalents, whether held by USO or posted as margin or other collateral, at all times approximate the aggregate market value of its obligations under its Oil Futures Contracts and Other Oil-Related Investments. USO’s investments in Oil Interests may be subject to periods of illiquidity because of market conditions, regulatory considerations and other reasons. For example, most commodity exchanges limit the fluctuations in futures contracts prices during a single day by regulations referred to as “daily limits.” During a single day, no trades may be executed at prices beyond the daily limit. Once the price of a futures contract has increased or decreased by an amount equal to the daily limit, positions in the contracts can neither be taken nor liquidated unless the traders are willing to effect trades at or within the specified daily limit. Such market conditions could prevent USO from promptly liquidating its positions in Oil Futures Contracts. During the ninethree months ended September 30, 2017,March 31, 2024, USO did not purchase or liquidate any of its positions while daily limits were in effect; however, USO cannot predict whether such an event may occur in the future. Since March 23, 2007, USO has been responsible for expenses relating to: (i) management fees, (ii) brokerage fees and commissions, (iii) licensing fees for the use of intellectual property, (iv) ongoing registration expenses in connection with offers and sales of its shares subsequent to the initial offering, (v) other expenses, including tax reporting costs, (vi) fees and expenses of the independent directors of USCF and (vii) other extraordinary expenses not in the ordinary course of business, while USCFbusiness. USO may terminate at any time, regardless of whether USO has been responsible for expenses relatingincurred losses, subject to the feesterms of the LP Agreement. In particular, unforeseen circumstances, including, but not limited to, (i) market conditions, regulatory requirements, risk mitigation measures (including those that may be taken by USO, USO’s Marketing Agent, Administrator and Custodian and registration expenses relatingFCMs, counterparties or other market participants) that would lead USO to the initial offering of shares. If USCF and USO are unsuccessfuldetermine that it could no longer foreseeably meet its investment objective or that USO’s aggregate net assets in raising sufficient fundsrelation to cover these respectiveits operating expenses or its margin or collateral requirements make the continued operation of USO unreasonable or imprudent, or (ii) adjudication of incompetence, bankruptcy, dissolution, withdrawal, or removal of USCF as the general partner of USO could cause USO, to terminate unless a majority interest of the limited partners within 90 days of the event elects to continue the partnership and appoints a successor general partner, or the affirmative vote of a majority in locating any other sourceinterest of funding, USOthe limited partners subject to certain conditions. However, no level of losses will require USCF to terminate USO. USO’s termination would cause the liquidation and investors may lose all or partpotential loss of theiran investor’s investment. Termination could also negatively affect the overall maturity and timing of an investor’s investment portfolio. Market Risk Trading in Oil Futures Contracts and Other Oil-Related Investments, such as forwards, involves USO entering into contractual commitments to purchase or sell oil at a specified date in the future. The aggregate market value of the contracts will significantly exceed USO’s future cash requirements since USO intends to close out its open positions prior to settlement. As a result, USO is generally only subject to the risk of loss arising from the change in value of the contracts. USO considers the “fair value” of its derivative instruments to be the unrealized gain or loss on the contracts. The market risk associated with USO’s commitments to purchase oil is limited to the aggregate market value of the contracts held. However, should USO enter into a contractual commitment to sell oil, it would be required to make delivery of the oil at the contract price, repurchase the contract at prevailing prices or settle in cash. Since there are no limits on the future price of oil, the market risk to USO could be unlimited. USO’s exposure to market risk depends on a number of factors, including the markets for oil, the volatility of interest rates and foreign exchange rates, the liquidity of the Oil Futures Contracts and Other Oil-Related Investments markets and the relationships among the contracts held by USO. Drastic market occurrences could ultimately lead to the loss of all or substantially all of an investor’s capital. Credit Risk When USO enters into Oil Futures Contracts and Other Oil-Related Investments, it is exposed to the credit risk that the counterparty will not be able to meet its obligations. The counterparty for the Oil Futures Contracts traded on the NYMEX and on most other futures exchanges is the clearinghouse associated with the particular exchange. In general, in addition to margin required to be posted by the clearinghouse in connection with cleared trades, clearinghouses are backed by their members who may be required to share in the financial burden resulting from the nonperformance of one of their members and, therefore, this additional member support should significantly reduce credit risk. USO is not currently a member of any clearinghouse. Some foreign exchanges are not backed by their clearinghouse members but may be backed by a consortium of banks or other financial institutions. There can be no assurance that any counterparty, clearinghouse, or their members or their financial backers will satisfy their obligations to USO in such circumstances. USCF attempts to manage the credit risk of USO by following various trading limitations and policies. In particular, USO generally posts margin and/or holds liquid assets that are approximately equal to the market value of its obligations to counterparties under the Oil Futures Contracts and Other Oil-Related Investments it holds. USCF has implemented procedures that include, but are not limited to, executing and clearing trades only with creditworthy parties and/or requiring the posting of collateral or margin by such parties for the benefit of USO to limit its credit exposure. An FCM, when acting on behalf of USO in accepting orders to purchase or sell Oil Futures Contracts on United States exchanges, is required by CFTC regulations to separately account for and segregate as belonging to USO, all assets of USO relating to domestic Oil Futures Contracts trading. These FCMs are not allowed to commingle USO’s assets with their other assets. In addition, the CFTC requires commodity brokersFCMs to hold in a secure account USO’s assets related to foreign Oil Futures Contracts trading.and, in some cases, to cleared swaps executed through the FCMs. Similarly, under its current OTC agreements, USO requires that collateral it posts or receives be posted with its custodian, and under agreements among the custodian, USO and its counterparties, such collateral is segregated. In the future, USO may purchase OTC swaps in the future periods, see“Item 3. “Item 3 Quantitative and Qualitative Disclosures About Market Risk” in this quarterly report on Form 10-Q for a discussion of OTC swaps.
As of September 30, 2017,March 31, 2024, USO held cash deposits and investments in Treasuries and money market funds in the amount of $2,206,896,479$1,268,739,608 with the custodian and FCM.FCMs. Some or all of these amounts held by a custodian or an FCM, as applicable, may be subject to loss should USO’s custodian or FCM,FCMs, as applicable, cease operations. Off Balance Sheet Financing As of September 30, 2017,March 31, 2024, USO had no loan guarantee, credit support or other off-balance sheet arrangements of any kind other than agreements entered into in the normal course of business, which may include indemnification provisions relating to certain risks that service providers undertake in performing services which are in the best interests of USO. While USO’s exposure under these indemnification provisions cannot be estimated, they are not expected to have a material impact on USO’s financial position. European Sovereign Debt
USO had no direct exposure to European sovereign debt as of September 30, 2017 and has no direct exposure to European sovereign debt as of the filing of this quarterly report on Form 10-Q.
Redemption Basket Obligation In order to meet its investment objective and pay its contractual obligations described below, USO requires liquidity to redeem shares, which redemptions must be in blocks of 100,000 shares called “Redemption Baskets.” USO has to date satisfied this obligation by paying from the cash or cash equivalents it holds or through the sale of its Treasuries in an amount proportionate to the number of shares being redeemed. Contractual Obligations USO’s primary contractual obligations are with USCF. In return for its services, USCF is entitled to a management fee calculated daily and paid monthly as a fixed percentage of USO’s NAV, currently 0.45% of NAV on its average daily total net assets. USCF agreed to pay the start-up costs associated with the formation of USO, primarily its legal, accounting and other costs in connection with USCF’s registration with the CFTC as a CPO and the registration and listing of USO and its shares with the SEC, FINRA and NYSE Arca (formerly, AMEX), respectively. However, since USO’s initial offering of shares, offering costs incurred in connection with registering and listing additional shares of USO have been directly borne on an ongoing basis by USO, and not by USCF. USCF pays the fees of the Marketing Agent and the fees of BBH&Co., as well as BBH&Co.’sBNY Mellon’s fees for performing administrative, custodial, and transfer agency services. BNY Mellon’s fees for performing administrative services includinginclude those in connection with the preparation of USO’s condensed financial statements and its SEC, NFA and CFTC reports. USCF and USO have also entered into a licensing agreement with the NYMEX pursuant to which USO and the Related Public Funds, other than BNO, USCI CPER and USAG,CPER, pay a licensing fee to the NYMEX. USO also pays the fees and expenses associated with its tax accounting and reporting requirements. In addition to USCF’s management fee, USO pays its brokerage fees (including fees to an FCM)FCMs), OTC dealer spreads, any licensing fees for the use of intellectual property, and, subsequent to the initial offering, registration and other fees paid to the SEC, FINRA, or other regulatory agencies in connection with the offer and sale of shares, as well as legal, printing, accounting and other expenses associated therewith, and extraordinary expenses. The latter are expenses not incurred in the ordinary course of USO’s business, including expenses relating to the indemnification of any person against liabilities and obligations to the extent permitted by law and under the LP Agreement, the bringing or defending of actions in law or in equity or otherwise conducting litigation and incurring legal expenses and the settlement of claims and litigation. Commission payments to an FCMFCMs are on a contract-by-contract, or round turn, basis. USO also pays a portion of the fees and expenses of the independent directors of USCF. SeeNote 3to theNotes to Condensedcondensed Financial Statements (Unaudited) inItem 1 of this quarterly report on Form 10-Q. The parties cannot anticipate the amount of payments that will be required under these arrangements for future periods, as USO’s per share NAVs and trading levels to meet its investment objective will not be known until a future date. These agreements are effective for a specific term agreed upon by the parties with an option to renew, or, in some cases, are in effect for the duration of USO’s existence. Either party may terminate these agreements earlier for certain reasons described in the agreements. As of September 30, 2017,March 31, 2024, USO’s portfolio consisted of 44,682 WTI Crudeheld 13,301 Oil Futures CL November 2017 Contracts traded on the NYMEX. As of September 30, 2017,March 31, 2024, USO did not hold any Oil Futures Contracts traded on the ICE Futures Europe.Futures. For a list of USO’s current holdings, please see USO’s website at www.uscfinvestments.com. The end of day portfolio disclosed on USO’s website would reflect any investments in Futures Contracts beyond the Benchmark Futures Contract, and/or Other Oil-Related Investments, including any made in light of market conditions, regulatory requirements, risk mitigation measures (including those that may be taken by USO, USO’s FCMs, counterparties or other market participants), liquidity requirements, or other factors. Independent of the USO website, USO may make available portfolio holdings information to Authorized Participants that reflects USO’s anticipated holdings. Item 3. | Item 3. Quantitative and Qualitative Disclosures About Market Risk. |
Commodity Price Risk.Risk USO is exposed to commodity price risk. In particular, USO is exposed to crude oil price risk through its holdings of Oil Futures Contracts together with any other derivatives in which it may invest, which are discussed below. As a result, fluctuations in the value of the Oil Futures Contracts that USO holds in its portfolio, as described in “Contractual Obligations”“Contractual Obligations”under“Item “Item 2. Management’s Discussion and Analysis of Financial Condition and Results of Operations”above, are expected to directly affect the value of USO’s shares.
OTC Contract Risk Currently, OTC transactions are subject to changing regulation.
USO may purchase OTC Oil Interestscontracts, such as forward contracts or swap or spot contracts. Unlike most exchange-traded futures contracts or exchange-traded options on such futures, each party to an OTC swap bears the credit risk that the other party may not be able to perform its obligations under its contract. USO may enter into certain transactions where an OTC component is exchanged for a corresponding futures contract (“Exchange for Related Position” or “EFRP” transactions). In the most common type of EFRP transaction entered into by USO, the OTC component is the purchase or sale of one or more baskets of USO shares. These EFRP transactions may expose USO to counterparty risk during the interim period between the execution of the OTC component and the exchange for a corresponding futures contract. Generally, the counterparty risk from the EFRP transaction will exist only on the day of execution. Swap transactions, like other financial transactions, involve a variety of significant risks. The specific risks presented by a particular swap transaction necessarily depend upon the terms and circumstances of the transaction. In general, however, all swap transactions involve some combination of market risk, credit risk, counterparty credit risk, funding risk, liquidity risk and operational risk. Highly customized swap transactions in particular may increase liquidity risk, which may result in a suspension of redemptions. Highly leveraged transactions may experience substantial gains or losses in value as a result of relatively small changes in the value or level of an underlying or related market factor. In evaluating the risks and contractual obligations associated with a particular swap transaction, it is important to consider that a swap transaction may be modified or terminated only by mutual consent of the original parties and subject to agreement on individually negotiated terms. Therefore, it may not be possible for USCF to modify, terminate or offset USO’s obligations or its exposure to the risks associated with a transaction prior to its scheduled termination date. To reduce the credit risk that arises in connection with such contracts, USO will generally enter into an agreement with each counterparty based on the Master Agreement published by the International Swaps and Derivatives Association that provides for the netting of its overall exposure to its counterparty, if the counterparty is unable to meet its obligations to USO due to the occurrence of a specified event, such as the insolvency of the counterparty, and requires the posting by each party to cover the mark-to-market exposure of a counterparty to the other counterparty. USCF assesses or reviews, as appropriate, the creditworthiness of each potential or existing counterparty to an OTC swap pursuant to guidelines approved by USCF’s board of directors (the “Board”). Furthermore, USCF on behalf of USO only enters into OTC swaps with counterparties who are, or are affiliates of, (a) banks regulated by a United States federal bank regulator, (b) broker-dealers regulated by the SEC, (c) insurance companies domiciled in the United States, or (d) producers, users or traders of energy, whether or not regulated by the CFTC. Any entity acting as a counterparty shall be regulated in either the United States or the United Kingdom unless otherwise approved by the Board after consultation with its legal counsel. Existing counterparties are also reviewed periodically by USCF. USO will also require that the counterparty be highly rated and/or provide collateral or other credit support. Even if collateral is used to reduce counterparty credit risk, sudden changes in the value of OTC transactions may leave a party open to financial risk due to a counterparty default since the collateral held may not cover a party’s exposure on the transaction in such situations. In general, valuing OTC derivatives is less certain than valuing actively traded financial instruments such as exchange-traded futures contracts and securities or cleared swaps because the price and terms on which such OTC derivatives are entered into or can be terminated are individually negotiated, and those prices and terms may not reflect the best price or terms available from other sources. In addition, while market makers and dealers generally quote indicative prices or terms for entering into or terminating OTC swaps, they typically are not contractually obligated to do so, particularly if they are not a party to the transaction. As a result, it may be difficult to obtain an independent value for an outstanding OTC derivatives transaction. During the nine monthsthree-month reporting period ended September 30, 2017, USO limited itsMarch 31, 2024, USO’s OTC activitiestransactions comprised OTC swaps intended to reflect the return on USO’s investments in Oil Futures Contracts’ and EFRP transactions. USO anticipates that the use of Other Oil-Related Investments together with its investments in Oil Futures Contracts will produce price and total return results that closely track the investment goals of USO. However, there can be no assurance of this. OTC swaps may result in higher transaction-related expenses than the brokerage commissions paid in connection with the purchase of Oil Futures Contracts, which may impact USO’s ability to successfully track the Benchmark Oil Futures Contract. Item 4. | Item 4. Controls and Procedures. |
Disclosure Controls and Procedures USO maintains disclosure controls and procedures that are designed to ensure that information required to be disclosed in USO’s periodic reports filed or submitted under the Securities Exchange Act of 1934, as amended, is recorded, processed, summarized and reported within the time period specified in the SEC’s rules and forms. The duly appointed officers of USCF, including its chief executive officer and chief financial officer, who perform functions equivalent to those of a principal executive officer and principal financial officer of USO if USO had any officers, have evaluated the effectiveness of USO’s disclosure controls and procedures and have concluded that the disclosure controls and procedures of USO have been effective as of the end of the period covered by this quarterly report on Form 10-Q. Change in Internal Control Over Financial Reporting There were no changes in USO’s internal control over financial reporting during USO’s last fiscal quarter that have materially affected, or are reasonably likely to materially affect, USO’s internal control over financial reporting.
Part II. OTHER INFORMATION Item 1. Legal Proceedings. From time to time, USO may be involved in legal proceedings arising primarily from the ordinary course of its business. In addition, USCF, as the general partner of USO and the Related Public Funds may, from time to time, be involved in litigation arising out of its operations in the ordinary course of business. Except as described herein, neither USO nor USCF is not currently party to any material legal proceedings. Optimum Strategies Action On April 6, 2022, USO and USCF were named as defendants in an action filed by Optimum Strategies Fund I, LP, a purported investor in call option contracts on USO (the “Optimum Strategies Action”). The action was in the U.S. District Court for the District of Connecticut at Civil Action No. 3:22-cv-00511. The Optimum Strategies Action asserted claims under the Securities Exchange Act of 1934, as amended (the “1934 Act”), Rule 10b-5 thereunder, and the Connecticut Uniform Securities Act (“CUSA”). It purported to challenge statements in registration statements that became effective in February 2020, March 2020, and on April 20, 2020, as well as public statements between February 2020 and May 2020, in connection with certain extraordinary market conditions and the attendant risks that caused the demand for oil to fall precipitously, including the COVID-19 global pandemic and the Saudi Arabia-Russia oil price war. The complaint was seeking damages, interest, costs, attorney’s fees, and equitable relief. On March 15, 2023, the court granted the USO defendants’ motion to dismiss the complaint. In its ruling, the court granted the USO defendants’ motion to dismiss, with prejudice, the plaintiff’s claims under Section 10(b) of the Exchange Act and Rule 10b-5 thereunder, and a claim for control person liability under Section 20(a) of the Exchange Act. Having dismissed all claims over which the court had original jurisdiction, the court declined to exercise supplemental jurisdiction over the plaintiff’s state law claim under CUSA and dismissed the claim without prejudice. No notice of appeal was filed. Settlement of SEC and CFTC Investigations On November 8, 2021, USCF and USO announced a resolution with each of the SEC and the CFTC relating to matters set forth in certain Wells Notices issued by the staffs of each of the SEC and CFTC as more fully described below. On August 17, 2020, USCF, USO, and John Love received a “Wells Notice” from the staff of the SEC (the “SEC Wells Notice”). The SEC Wells Notice stated that the SEC staff made a preliminary determination to recommend that the SEC file an enforcement action against USCF, USO, and Mr. Love alleging violations of Sections 17(a)(1) and 17(a)(3) of the Securities Act of 1933, as amended (the “1933 Act”), and Section 10(b) of the 1934 Act, and Rule 10b-5 thereunder. Subsequently, on August 19, 2020, USCF, USO, and Mr. Love received a Wells Notice from the staff of the CFTC (the “CFTC Wells Notice”). The CFTC Wells Notice stated that the CFTC staff made a preliminary determination to recommend that the CFTC file an enforcement action against USCF, USO, and Mr. Love alleging violations of Sections 4o(1)(A) and (B) and 6(c)(1) of the Commodity Exchange Act of 1936, as amended (the “CEA”), 7 U.S.C. §§ 6o(1)(A) and (B) and 9(1) (2018), and CFTC Regulations 4.26, 4.41, and 180.1(a), 17 C.F.R. §§ 4.26, 4.41, 180.1(a) (2019). On November 8, 2021, acting pursuant to an offer of settlement submitted by USCF and USO, the SEC issued an order instituting cease-and-desist proceedings, making findings, and imposing a cease-and-desist order pursuant to Section 8A of the 1933 Act, directing USCF and USO to cease and desist from committing or causing any violations of Section 17(a)(3) of the 1933 Act, 15 U.S.C. § 77q(a)(3) (the “SEC Order”). In the SEC Order, the SEC made findings that, from April 24, 2020 to May 21, 2020, USCF and USO violated Section 17(a)(3) of 1933 Act, which provides that it is “unlawful for any person in the offer or sale of any securities to engage in any transaction, practice, or course of business which operates or would operate as a fraud or deceit upon the purchaser.” USCF and USO consented to entry of the SEC Order without admitting or denying the findings contained therein, except as to jurisdiction. Separately, on November 8, 2021, acting pursuant to an offer of settlement submitted by USCF, the CFTC issued an order instituting cease-and-desist proceedings, making findings, and imposing a cease-and-desist order pursuant to Section 6(c) and (d) of the CEA, directing USCF to cease and desist from committing or causing any violations of Section 4o(1)(B) of the CEA, 7 U.S.C. § 6o(1) (B), and CFTC Regulation 4.41(a)(2), 17 C.F.R. § 4.41(a)(2) (the “CFTC Order”). In the CFTC Order, the CFTC made findings that, from on or about April 22, 2020 to June 12, 2020, USCF violated Section 4o(1)(B) of the CEA and CFTC Regulation 4.41(a)(2), which make it unlawful for any commodity pool operator (“CPO”) to engage in “any transaction, practice, or course of business which operates as a fraud or deceit upon any client or participant or prospective client or participant” and prohibit a CPO from advertising in a manner which “operates as a fraud or deceit upon any client or participant or prospective client or participant,” respectively. USCF consented to entry of the CFTC Order without admitting or denying the findings contained therein, except as to jurisdiction. Pursuant to the SEC Order and the CFTC Order, in addition to the command to cease and desist from committing or causing any violations of Section 17(a)(3) of the 1933 Act, Section 4o(1)(B) of the CEA, and CFTC Regulation 4.14(a)(2), civil monetary penalties totaling two million five hundred thousand dollars ($2,500,000) in the aggregate were required to be paid to the SEC and CFTC, of which one million two hundred fifty thousand dollars ($1,250,000) was paid by USCF to each of the SEC and the CFTC, respectively, pursuant to the offsets permitted under the orders. In re: United States Oil Fund, LP Securities Litigation On June 19, 2020, USCF, USO, John P. Love, and Stuart P. Crumbaugh were named as defendants in a putative class action filed by purported shareholder Robert Lucas (the “Lucas Class Action”). The Court thereafter consolidated the Lucas Class Action with two related putative class actions filed on July 31, 2020 and August 13, 2020, and appointed a lead plaintiff. The consolidated class action is pending in the U.S. District Court for the Southern District of New York under the caption In re: United States Oil Fund, LP Securities Litigation, Civil Action No. 1:20-cv-04740. On November 30, 2020, the lead plaintiff filed an amended complaint (the “Amended Lucas Class Complaint”). The Amended Lucas Class Complaint asserts claims under the 1933 Act, the Exchange Act, and Rule 10b-5. The Amended Lucas Class Complaint challenges statements in registration statements that became effective on February 25, 2020 and March 23, 2020 as well as subsequent public statements through April 2020 concerning certain extraordinary market conditions and the attendant risks that caused the demand for oil to fall precipitously, including the COVID-19 global pandemic and the Saudi Arabia-Russia oil price war. The Amended Lucas Class Complaint purports to have been brought by an investor in USO on behalf of a class of similarly-situated shareholders who purchased USO securities between February 25, 2020 and April 28, 2020 and pursuant to the challenged registration statements. The Amended Lucas Class Complaint seeks to certify a class and to award the class compensatory damages at an amount to be determined at trial as well as costs and attorney’s fees. The Amended Lucas Class Complaint named as defendants USCF, USO, John P. Love, Stuart P. Crumbaugh, Nicholas D. Gerber, Andrew F Ngim, Robert L. Nguyen, Peter M. Robinson, Gordon L. Ellis, and Malcolm R. Fobes III, as well as the marketing agent, ALPS Distributors, Inc., and the Authorized Participants: ABN Amro, BNP Paribas Securities Corporation, Citadel Securities LLC, Citigroup Global Markets, Inc., Credit Suisse Securities USA LLC, Deutsche Bank Securities Inc., Goldman Sachs & Company, J.P. Morgan Securities Inc., Merrill Lynch Professional Clearing Corporation, Morgan Stanley & Company Inc., Nomura Securities International Inc., RBC Capital Markets LLC, SG Americas Securities LLC, UBS Securities LLC, and Virtu Financial BD LLC. The lead plaintiff has filed a notice of voluntary dismissal of its claims against BNP Paribas Securities Corporation, Citadel Securities LLC, Citigroup Global Markets Inc., Credit Suisse Securities USA LLC, Deutsche Bank Securities Inc., Morgan Stanley & Company, Inc., Nomura Securities International, Inc., RBC Capital Markets, LLC, SG Americas Securities LLC, and UBS Securities LLC. USCF, USO, and the individual defendants in In re: United States Oil Fund, LP Securities Litigation intend to vigorously contest such claims and have moved for their dismissal. Wang Class Action On July 10, 2020, purported shareholder Momo Wang filed a putative class action complaint, individually and on behalf of others similarly situated, against defendants USO, USCF, John P. Love, Stuart P. Crumbaugh, Nicholas D. Gerber, Andrew F Ngim, Robert L. Nguyen, Peter M. Robinson, Gordon L. Ellis, Malcolm R. Fobes, III, ABN Amro, BNP Paribas Securities Corp., Citadel Securities LLC, Citigroup Global Markets Inc., Credit Suisse Securities USA LLC, Deutsche Bank Securities Inc., Goldman Sachs & Company, JP Morgan Securities Inc., Merrill Lynch Professional Clearing Corp., Morgan Stanley & Company Inc., Nomura Securities International Inc., RBC Capital Markets LLC, SG Americas Securities LLC, UBS Securities LLC, and Virtu Financial BD LLC, in the U.S. District Court for the Northern District of California as Civil Action No. 3:20-cv-4596 (the “Wang Class Action”). The Wang Class Action asserted federal securities claims under the 1933 Act, challenging disclosures in a March 19, 2020 registration statement. It alleged that the defendants failed to disclose to investors in USO certain extraordinary market conditions and the attendant risks that caused the demand for oil to fall precipitously, including the COVID-19 global pandemic and the Saudi Arabia-Russia oil price war. The Wang Class Action was voluntarily dismissed on August 4, 2020. Mehan Action On August 10, 2020, purported shareholder Darshan Mehan filed a derivative action on behalf of nominal defendant USO, against defendants USCF, John P. Love, Stuart P. Crumbaugh, Nicholas D. Gerber, Andrew F Ngim, Robert L. Nguyen, Peter M. Robinson, Gordon L. Ellis, and Malcolm R. Fobes, III (the “Mehan Action”). The Action is pending in the Superior Court of the State of California for the County of Alameda as Case No. RG20070732. The Mehan Action alleges that the defendants breached their fiduciary duties to USO and failed to act in good faith in connection with a March 19, 2020 registration statement and offering and disclosures regarding certain extraordinary market conditions that caused demand for oil to fall precipitously, including the COVID-19 global pandemic and the Saudi Arabia-Russia oil price war. The complaint seeks, on behalf of USO, compensatory damages, restitution, equitable relief, attorney’s fees, and costs. All proceedings in the Mehan Action are stayed pending disposition of the motion(s) to dismiss in In re: United States Oil Fund, LP Securities Litigation. USCF, USO, and the other defendants intend to vigorously contest such claims. In re United States Oil Fund, LP Derivative Litigation On August 27, 2020, purported shareholders Michael Cantrell and AML Pharm. Inc. DBA Golden International filed two separate derivative actions on behalf of nominal defendant USO, against defendants USCF, John P. Love, Stuart P. Crumbaugh, Andrew F Ngim, Gordon L. Ellis, Malcolm R. Fobes, III, Nicholas D. Gerber, Robert L. Nguyen, and Peter M. Robinson in the U.S. District Court for the Southern District of New York at Civil Action No. 1:20-cv-06974 (the “Cantrell Action”) and Civil Action No. 1:20-cv-06981 (the “AML Action”), respectively. The complaints in the Cantrell and AML Actions are nearly identical. They each allege violations of Sections 10(b), 20(a), and 21D of the Exchange Act, Rule 10b-5 thereunder, and common law claims of breach of fiduciary duties, unjust enrichment, abuse of control, gross mismanagement, and waste of corporate assets. These allegations stem from USO’s disclosures and defendants’ alleged actions in light of the extraordinary market conditions in 2020 that caused demand for oil to fall precipitously, including the COVID-19 global pandemic and the Saudi Arabia-Russia oil price war. The complaints seek, on behalf of USO, compensatory damages, restitution, equitable relief, attorney’s fees, and costs. The plaintiffs in the Cantrell and AML Actions have marked their actions as related to the Lucas Class Action. The Court consolidated the Cantrell and AML Actions under the caption In re United States Oil Fund, LP Derivative Litigation, Civil Action No. 1:20-cv-06974 and appointed co-lead counsel. All proceedings in In re United States Oil Fund, LP Derivative Litigation are stayed pending disposition of the motion(s) to dismiss in In re: United States Oil Fund, LP Securities Litigation. USCF, USO, and the other defendants intend to vigorously contest the claims in In re United States Oil Fund, LP Derivative Litigation. Item 1. | Legal Proceedings. |
Not applicable.
Item 1A. | Item 1A. Risk Factors. |
There have been no material changes to the risk factors previously disclosed in USO’s Annual Report on Form 10-K for the fiscal year ended December 31, 2016,2023, filed on February 24, 2017.29, 2024 (the “Form 10-K”), except as follows: Geopolitical risk, including as a result of the Russia-Ukraine war and Middle East conflict, has the potential to create further supply disruptions and sanctions, which could lead to further volatility. The Russia-Ukraine war and sanctions brought by the United States and other countries against Russia and others, the terror attacks by Hamas on Israel and ensuing conflict in the Middle East, and other geopolitical tensions, political unrest, and attacks or threats of attack by terrorists, are factors that could contribute to supply constraints, worker shortages, infrastructure and manufacturing energy usage and increase volatility in certain commodity prices. The Russia-Ukraine war and sanctions have adversely impacted and are expected to continue to adversely impact the economies of Russia and Ukraine. In addition, the Russia-Ukraine war and the Middle East conflict, any sanctions, future market or supply disruptions, and the potential for wider conflicts may increase financial market volatility generally, have severe adverse effects on regional and global economic markets, and could lead to further volatility, including in the markets for commodities, commodity futures, and the NAV or share price of USO. However, if a resolution to the conflicts were to occur, volatility could decrease and prices could decline in a short period of time. The longer-term impact on commodities and futures prices, including the prices of the Benchmark Oil Futures Contracts, is difficult to predict and depends on a number of factors that may have a negative impact on USO in the future. Item 2. | Item 2. Unregistered Sales of Equity Securities and Use of Proceeds. |
(c) | (c) | USO does not purchase shares directly from its shareholders. In connection with its redemption of baskets held by Authorized Participants, USO redeemed 1,889388 baskets (comprising 188,900,00038,800,000 shares) during the thirdfirst quarter of the year endedending December 31, 2017.2024. The following table summarizes the redemptions by Authorized Participants during the three months ended September 30, 2017:March 31, 2024: |
Issuer Purchases of Equity Securities | Period | | Total
Number of
Shares
Redeemed | | | Average Price Per
Share | | | 7/1/17 to 7/31/17 | | | 103,200,000 | | | $ | 9.69 | | | 8/1/17 to 8/31/17 | | | 29,700,000 | | | $ | 9.97 | | | 9/1/17 to 9/30/17 | | | 56,000,000 | | | $ | 10.21 | | | Total | | | 188,900,000 | | | | | |
| | | | | | | | Total | | | | | | Number of | | | | | | Shares | | Average Price Per | Period | | Redeemed | | Share | 1/1/24 to 1/31/24 | | 16,700,000 | | $ | 68.67 | 2/1/24 to 2/29/24 | | 12,400,000 | | $ | 71.95 | 3/1/24 to 3/31/24 | | 9,700,000 | | $ | 76.60 | Total | | 38,800,000 | | | |
Item 3. | Item 3. Defaults Upon Senior Securities. |
Not applicable. Item 4. | Item 4. Mine Safety Disclosures. |
Not applicable. Item 5. Other Information. No officers or directors of the Company have adopted, modified or terminated trading plans under either a Rule 10b5-1 or non-Rule 10b5-1 trading arrangement (as such terms are defined in Item 408 of Regulation S-K of the Securities Act of 1933) for the three-month period ended March 31, 2024. Monthly Account Statements Pursuant to the requirement under Rule 4.22 under the Commodity Exchange Act, each month USO publishes an account statement for its shareholders, which includes a Statement of Income (Loss) and a Statement of Changes in Net Asset Value. The account statement is furnished to the SEC on a current report on Form 8-K pursuant to Section 13 or 15(d) of the Exchange Act and posted each month on USO’s website at www.uscfinvestments.com. | Other Information. |
Not applicable.
Listed below are the exhibits, which are filed as part of this quarterly report on Form 10-Q (according to the number assigned to them in Item 601 of Regulation S-K): SIGNATURES Pursuant to the requirements of the Securities Exchange Act of 1934, the registrant has duly caused this report to be signed on its behalf by the undersigned thereunto duly authorized. United States Oil Fund, LP (Registrant) By: United States Commodity Funds LLC, its general partner By: | /s/ John P. Love | | | John P. Love | | | President and Chief Executive Officer | | | (Principal executive officer) | | | | | Date: November 6, 2017May 9, 2024 | | | | By: | /s/ Stuart P. Crumbaugh | | | Stuart P. Crumbaugh | | | Chief Financial Officer | | | (Principal financial and accounting officer) | | | | | Date: November 6, 2017May 9, 2024 | |
|