Delaware | Delaware | 27-1537655 | (State or other jurisdiction of | | (I.R.S. Employer | incorporation or organization) | | Identification No.) |
1999 Harrison Street,1850 Mt. Diablo Boulevard, Suite 1530640
Oakland, Walnut Creek, California 9461294596
(Address of principal executive offices) (Zip code)Code) (510) 522-9600 (510) 522-9600
(Registrant’s telephone number, including area code) N/A N/A
(Former name, former address and former fiscal year, if changed since last report) Securities registered or to be registered pursuant to Section 12(b) of the Act. Title of each class: | | Trading Symbol(s) | | Name of each exchange on which registered: | Shares of United States Commodity Index Fund | | USCI | | NYSE Arca, Inc. | Shares of United States Copper Index Fund | | CPER | | NYSE Arca, Inc. |
Indicate by check mark whether the registrant (1) has filed all reports required to be filed by Section 13 or 15(d) of the Securities Exchange Act of 1934 during the preceding 12 months (or for such shorter period that the registrant was required to file such reports), and (2) has been subject to such filing requirements for the past 90 days. x☒ Yes ¨☐ No Indicate by check mark whether the registrant has submitted electronically and posted on its corporate Website, if any, every Interactive Data File required to be submitted and posted pursuant to Rule 405 of Regulation S-T (§232.405 of this chapter) during the preceding 12 months (or for such shorter period that the registrant was required to submit and post such files). x☒ Yes ¨☐ No Indicate by check mark whether the registrant is a large accelerated filer, an accelerated filer, a non-accelerated filer, a smaller reporting company, or an emerging growth company. See the definitions of “large accelerated filer,”filer”, “accelerated filer”, “smaller reporting company” and “emerging growth company” in Rule 12b-2 of the Exchange Act. Large accelerated filerAccelerated Filer | ¨☐ | | Accelerated filerFiler | x☒ | Non-Accelerated Filer | ☐ | | Smaller Reporting Company | ☐ | Non-accelerated filerEmerging Growth Company | ¨ (Do not check if a smaller reporting company)☐ | Smaller reporting company | ¨ | | | | | | | Emerging growth company | ¨ |
If an emerging growth company, indicate by check mark if the registrant has elected not to use the extended transition period for complying with any new or revised financial accounting standards provided toin Section 7(a)(2)(B)13(a) of the SecuritiesExchange Act.¨☐ Indicate by check mark whether the registrant is a shell company (as defined in Rule 12b-2 of the Exchange Act)Act.). ¨☐ Yes x☒ No The number of outstanding shares outstanding of each series of the registrant as of November 2, 2017May 1, 2023 are included in the table below: | | | | |
| Number of Outstanding Shares as
of November 2, 2017May 1, 2023 |
| United States Commodity Index Fund | | 3,600,000 | 12,050,000 | | United States Copper Index Fund | | 5,850,000 | 400,000 | | United States Agriculture Index FundTotal | | 9,450,000 | 100,000 | | Total | | | 12,550,000 | |
UNITED STATES COMMODITY INDEX FUNDS TRUST
Table of Contents United States Commodity Index Funds Trust Table of Contents Part I. FINANCIAL INFORMATION Item 1. Condensed Financial Statements. Index to Condensed Financial Statements Documents | | Page | Documents |
| Page | | | | Condensed Statements of Financial Condition at September 30,2017March 31, 2023 (Unaudited) and December 31, 20162022 | | 2 -4 | | | | Condensed SchedulesSchedule of Investments (Unaudited) at September 30, 2017March 31, 2023 | | 65-7 | | | | Condensed Statements of Operations (Unaudited) for the three and nine months ended September 30, 2017March 31, 2023 and 20162022 | | 118-10 | | | | Condensed Statements of Changes in Capital (Unaudited) for the ninethree months ended September 30, 2017March 31, 2023 and Condensed Statements of Changes in Shares Outstanding (Unaudited) for the nine months ended September 30, 20172022 | | 1511-13 | | | | Condensed Statements of Cash Flows (Unaudited) for the ninethree months ended September 30, 2017March 31, 2023 and 20162022 | | 1914-16 | | | | Notes to Condensed Financial Statements (Unaudited) for the period ended September 30, 2017 (Unaudited)March 31, 2023 | | 2317-30 |
United States Commodity Index Funds Trust Condensed Statements of Financial Condition At September 30, 2017March 31, 2023 (Unaudited) and December 31, 2016 2022 United States Commodity Index Fund | | | September 30, 2017 | | | December 31, 2016 | | | Assets | | | | | | | | | Cash and cash equivalents (at cost $448,269,924 and $601,266,026, respectively)
(Notes 2 and 6) | | $ | 448,269,924 | | | $ | 601,266,026 | | | Equity in trading accounts: | | | | | | | | | | Cash and cash equivalents (at cost $25,357,391 and $40,050,520, respectively) | | | 25,357,391 | | | | 40,050,520 | | | Unrealized gain (loss) on open commodity futures contracts | | | 5,957,453 | | | | 2,055,460 | | | Interest receivable | | | 10,015 | | | | 1,261 | | | Directors' fees and insurance receivable | | | 2,642 | | | | — | | | ETF transaction fees receivable | | | — | | | | 350 | | | | | | | | | | | | | Total assets | | $ | 479,597,425 | | | $ | 643,373,617 | | | | | | | | | | | | | Liabilities and Capital | | | | | | | | | | Payable for shares redeemed | | $ | — | | | $ | 6,015,383 | | | Management fees payable (Note 4) | | | 322,929 | | | | 445,163 | | | Professional fees payable | | | 318,112 | | | | 560,068 | | | Brokerage commissions payable | | | 43,305 | | | | 54,015 | | | Directors' fees and insurance payable | | | — | | | | 6,164 | | | | | | | | | | | | | Total liabilities | | | 684,346 | | | | 7,080,793 | | | | | | | | | | | | | Commitments and Contingencies (Notes 4, 5 and 6) | | | | | | | | | | | | | | | | | | | | Capital | | | | | | | | | | Sponsor | | | — | | | | — | | | Shareholders | | | 478,913,079 | | | | 636,292,824 | | | Total Capital | | | 478,913,079 | | | | 636,292,824 | | | | | | | | | | | | | Total liabilities and capital | | $ | 479,597,425 | | | $ | 643,373,617 | | | | | | | | | | | | | Shares outstanding | | | 11,950,000 | | | | 15,900,000 | | | Net asset value per share | | $ | 40.08 | | | $ | 40.02 | | | Market value per share | | $ | 40.04 | | | $ | 40.00 | |
| | | | | | | | | March 31, 2023 | | December 31, 2022 | Assets | | | | | | | Cash and cash equivalents (at cost $187,274,466 and $233,130,983, respectively) (Notes 2 and 6) | | $ | 187,274,466 | | $ | 233,130,983 | Equity in trading accounts: | | | | | | | Cash and cash equivalents (at cost $13,784,503 and $12,926,388, respectively) | | | 13,784,503 | | | 12,926,388 | Unrealized gain (loss) on open commodity futures contracts | | | 2,068,955 | | | 9,398,730 | Dividends receivable | | | 525,188 | | | 833,949 | Interest receivable | | | 146,906 | | | 64,059 | Prepaid insurance* | | | 65,445 | | | 11,886 | | | | | | | | Total Assets | | $ | 203,865,463 | | $ | 256,365,995 | | | | | | | | Liabilities and Capital | | | | | | | Management fees payable (Note 4) | | $ | 142,119 | | $ | 178,702 | Professional fees payable | | | 173,029 | | | 340,128 | Brokerage commissions payable | | | 3,955 | | | 3,955 | Directors’ fees payable* | | | 5,127 | | | 5,696 | | | | | | | | Total Liabilities | | | 324,230 | | | 528,481 | | | | | | | | Commitments and Contingencies (Notes 4, 5 & 6) | | | | | | | | | | | | | | Capital | | | | | | | Sponsor | | | — | | | — | Shareholders | | | 203,541,233 | | | 255,837,514 | Total Capital | | | 203,541,233 | | | 255,837,514 | | | | | | | | Total Liabilities and Capital | | $ | 203,865,463 | | $ | 256,365,995 | | | | | | | | Shares outstanding | | | 3,750,000 | | | 4,550,000 | Net asset value per share | | $ | 54.28 | | $ | 56.23 | Market value per share | | $ | 54.26 | | $ | 56.28 |
* Certain prior year amounts have been reclassified for consistency with the current presentation. See accompanying notes to condensed financial statements. United States Commodity Index Funds Trust Condensed Statements of Financial Condition At September 30, 2017March 31, 2023 (Unaudited) and December 31, 2016 2022 United States Copper Index Fund | | | September 30, 2017 | | | December 31, 2016 | | | Assets | | | | | | | | | Cash and cash equivalents (at cost $6,706,326 and $5,387,655, respectively)
(Notes 2 and 6) | | $ | 6,706,326 | | | $ | 5,387,655 | | | Equity in trading accounts: | | | | | | | | | | Cash and cash equivalents (at cost $797,417 and $253,165, respectively) | | | 797,417 | | | | 253,165 | | | Unrealized gain (loss) on open commodity futures contracts | | | 726,713 | | | | 88,575 | | | Interest receivable | | | 736 | | | | — | | | Receivable from Sponsor (Note 4) | | | 35,579 | | | | 75,640 | | | Directors' fees and insurance receivable | | | 336 | | | | — | | | | | | | | | | | | | Total assets | | $ | 8,267,107 | | | $ | 5,805,035 | | | | | | | | | | | | | Liabilities and Capital | | | | | | | | | | Payable due to Broker | | $ | 631,854 | | | $ | — | | | Management fees payable (Note 4) | | | 4,601 | | | | 3,038 | | | Professional fees payable | | | 43,342 | | | | 77,296 | | | Directors' fees and insurance payable | | | — | | | | 47 | | | | | | | | | | | | | Total liabilities | | | 679,797 | | | | 80,381 | | | | | | | | | | | | | Commitments and Contingencies (Notes 4, 5 and 6) | | | | | | | | | | | | | | | | | | | | Capital | | | | | | | | | | Sponsor | | | — | | | | — | | | Shareholders | | | 7,587,310 | | | | 5,724,654 | | | Total Capital | | | 7,587,310 | | | | 5,724,654 | | | | | | | | | | | | | Total liabilities and capital | | $ | 8,267,107 | | | $ | 5,805,035 | | | | | | | | | | | | | Shares outstanding | | | 400,000 | | | | 350,000 | | | Net asset value per share | | $ | 18.97 | | | $ | 16.36 | | | Market value per share | | $ | 18.95 | | | $ | 16.35 | |
| | | | | | | | | March 31, 2023 | | December 31, 2022 | Assets | | | | | | | Cash and cash equivalents (at cost $143,255,058 and $158,307,387, respectively) (Notes 2 and 6) | | $ | 143,255,058 | | $ | 158,307,387 | Equity in trading accounts: | | | | | | | Cash and cash equivalents (at cost $7,768,485 and $6,906,529, respectively) | | | 7,768,485 | | | 6,906,529 | Unrealized gain (loss) on open commodity futures contracts | | | 2,461,874 | | | 3,972,853 | Dividends receivable | | | 403,260 | | | 549,553 | Interest receivable | | | 148,570 | | | 35,104 | Prepaid professional fees | | | 8,496 | | | 6,112 | Prepaid insurance* | | | 39,374 | | | 13,045 | | | | | | | | Total Assets | | $ | 154,085,117 | | $ | 169,790,583 | | | | | | | | Liabilities and Capital | | | | | | | Management fees payable (Note 4) | | $ | 84,701 | | $ | 94,784 | Professional fees payable | | | 21,835 | | | 152,375 | Directors’ fees payable* | | | 6,955 | | | 7,049 | | | | | | | | Total Liabilities | | | 113,491 | | | 254,208 | | | | | | | | Commitments and Contingencies (Notes 4, 5 & 6) | | | | | | | | | | | | | | Capital | | | | | | | Sponsor | | | — | | | — | Shareholders | | | 153,971,626 | | | 169,536,375 | Total Capital | | | 153,971,626 | | | 169,536,375 | | | | | | | | Total Liabilities and Capital | | $ | 154,085,117 | | $ | 169,790,583 | | | | | | | | Shares outstanding | | | 6,150,000 | | | 7,350,000 | Net asset value per share | | $ | 25.04 | | $ | 23.07 | Market value per share | | $ | 24.94 | | $ | 23.09 |
* Certain prior year amounts have been reclassified for consistency with the current presentation. See accompanying notes to condensed financial statements. United States Commodity Index Funds Trust Condensed Statements of Financial Condition At September 30, 2017March 31, 2023 (Unaudited) and December 31, 2016 United States Agriculture Index Fund
| | | September 30, 2017 | | | December 31, 2016 | | | Assets | | | | | | | | | Cash and cash equivalents (at cost $1,643,267 and $1,781,515, respectively)
(Notes 2 and 6) | | $ | 1,643,267 | | | $ | 1,781,515 | | | Equity in trading accounts: | | | | | | | | | | Cash and cash equivalents (at cost $161,234 and $208,306, respectively) | | | 161,234 | | | | 208,306 | | | Unrealized gain (loss) on open commodity futures contracts | | | (51,571 | ) | | | (89,700 | ) | | Interest receivable | | | 236 | | | | — | | | Receivable from Sponsor (Note 4) | | | 36,825 | | | | 72,173 | | | Directors' fees and insurance receivable | | | 488 | | | | — | | | | | | | | | | | | | Total assets | | $ | 1,790,479 | | | $ | 1,972,294 | | | | | | | | | | | | | Liabilities and Capital | | | | | | | | | | Management fees payable (Note 4) | | $ | 2,023 | | | $ | 2,129 | | | Professional fees payable | | | 36,792 | | | | 69,395 | | | Directors' fees and insurance payable | | | — | | | | 15 | | | | | | | | | | | | | Total liabilities | | | 38,815 | | | | 71,539 | | | | | | | | | | | | | Commitments and Contingencies (Notes 4, 5 and 6) | | | | | | | | | | | | | | | | | | | | Capital | | | | | | | | | | Sponsor | | | — | | | | — | | | Shareholders | | | 1,751,664 | | | | 1,900,755 | | | Total Capital | | | 1,751,664 | | | | 1,900,755 | | | | | | | | | | | | | Total liabilities and capital | | $ | 1,790,479 | | | $ | 1,972,294 | | | | | | | | | | | | | Shares outstanding | | | 100,000 | | | | 100,000 | | | Net asset value per share | | $ | 17.52 | | | $ | 19.01 | | | Market value per share | | $ | 16.42 | | | $ | 18.07 | |
See accompanying notes to condensed financial statements.
United States Commodity Index Funds Trust
Condensed Statements of Financial Condition
At September 30, 2017 (Unaudited) and December 31, 2016
2022 United States Commodity Index Funds Trust | | | September 30, 2017 | | | December 31, 2016 | | | Assets | | | | | | | | | Cash and cash equivalents (at cost $456,619,517 and 608,435,196, respectively)
(Notes 2 and 6) | | $ | 456,619,517 | | | $ | 608,435,196 | | | Equity in trading accounts: | | | | | | | | | | Cash and cash equivalents (at cost $26,316,042 and 40,511,991, respectively) | | | 26,316,042 | | | | 40,511,991 | | | Unrealized gain (loss) on open commodity futures contracts | | | 6,632,595 | | | | 2,054,335 | | | Interest receivable | | | 10,987 | | | | 1,261 | | | Receivable from Sponsor (Note 4) | | | 72,404 | | | | 147,813 | | | Directors' fees and insurance receivable | | | 3,466 | | | | — | | | ETF transaction fees receivable | | | — | | | | 350 | | | | | | | | | | | | | Total assets | | $ | 489,655,011 | | | $ | 651,150,946 | | | | | | | | | | | | | Liabilities and Capital | | | | | | | | | | Payable due to Broker | | $ | 631,854 | | | $ | — | | | Payable for shares redeemed | | | — | | | | 6,015,383 | | | Management fees payable (Note 4) | | | 329,553 | | | | 450,330 | | | Professional fees payable | | | 398,246 | | | | 706,759 | | | Brokerage commissions payable | | | 43,305 | | | | 54,015 | | | Directors' fees and insurance payable | | | — | | | | 6,226 | | | | | | | | | | | | | Total liabilities | | | 1,402,958 | | | | 7,232,713 | | | | | | | | | | | | | Commitments and Contingencies (Notes 4, 5 and 6) | | | | | | | | | | | | | | | | | | | | Capital | | | | | | | | | | Sponsor | | | — | | | | — | | | Shareholders | | | 488,252,053 | | | | 643,918,233 | | | Total Capital | | | 488,252,053 | | | | 643,918,233 | | | | | | | | | | | | | Total liabilities and capital | | $ | 489,655,011 | | | $ | 651,150,946 | | | | | | | | | | | | | Shares outstanding | | | 12,450,000 | | | | 16,350,000 | |
| | | | | | | | | March 31, 2023 | | December 31, 2022 | Assets | | | | | | | Cash and cash equivalents (at cost $330,529,524 and $391,438,370, respectively) (Notes 2 and 6) | | $ | 330,529,524 | | $ | 391,438,370 | Equity in trading accounts: | | | | | | | Cash and cash equivalents (at cost $21,552,988 and $19,832,917, respectively) | | | 21,552,988 | | | 19,832,917 | Unrealized gain (loss) on open commodity futures contracts | | | 4,530,829 | | | 13,371,583 | Dividends receivable | | | 928,448 | | | 1,383,502 | Interest receivable | | | 295,476 | | | 99,163 | Prepaid professional fees | | | 8,496 | | | 6,112 | Prepaid insurance* | | | 104,819 | | | 24,931 | | | | | | | | Total Assets | | $ | 357,950,580 | | $ | 426,156,578 | | | | | | | | Liabilities and Capital | | | | | | | Management fees payable (Note 4) | | $ | 226,820 | | $ | 273,486 | Professional fees payable | | | 194,864 | | | 492,503 | Brokerage commissions payable | | | 3,955 | | | 3,955 | Directors’ fees payable* | | | 12,082 | | | 12,745 | | | | | | | | Total Liabilities | | | 437,721 | | | 782,689 | | | | | | | | Commitments and Contingencies (Notes 4, 5 and 6) | | | | | | | | | | | | | | Capital | | | | | | | Sponsor | | | — | | | — | Shareholders | | | 357,512,859 | | | 425,373,889 | Total Capital | | | 357,512,859 | | | 425,373,889 | | | | | | | | Total Liabilities and Capital | | $ | 357,950,580 | | $ | 426,156,578 | | | | | | | | Shares Outstanding | | | 9,900,000 | | | 11,900,000 |
* Certain prior year amounts have been reclassified for consistency with the current presentation. See accompanying notes to condensed financial statements. United States Commodity Index Funds Trust
Condensed Schedule of Investments (Unaudited)
At September 30, 2017 March 31, 2023 United States Commodity Index Fund | | | Notional
Amount | | | Number of
Contracts | | | Value/
Unrealized Gain
(Loss) on Open
Commodity
Contracts | | | % of
Capital | | | Open Futures Contracts - Long | | | | | | | | | | | | | | | | | | Foreign Contracts | | | | | | | | | | | | | | | | | | LME Tin Futures LT November 2017 contracts, expiring November 2017 | | $ | 42,654,445 | | | | 425 | | | $ | 1,481,805 | | | | 0.31 | | | LME Zinc Futures LX November 2017 contracts, expiring November 2017 | | | 43,458,175 | | | | 616 | | | | 5,332,936 | | | | 1.11 | | | ICE Brent Crude Oil Futures CO January 2018 contracts, expiring November 2017 | | | 34,149,650 | | | | 597 | | | | (365,420 | ) | | | (0.08 | ) | | ICE-US Gas Oil Futures QS December 2017 contracts, expiring December 2017 | | | 30,594,875 | | | | 644 | | | | 3,778,625 | | | | 0.79 | | | LME Aluminum Futures LA February 2018 contracts, expiring February 2018 | | | 41,236,156 | | | | 836 | | | | 2,909,869 | | | | 0.61 | | | LME Lead Futures LL April 2018 contracts, expiring April 2018 | | | 34,829,200 | | | | 582 | | | | 1,422,125 | | | | 0.30 | | | LME Nickel Futures LN April 2018 contracts, expiring April 2018 | | | 35,062,350 | | | | 495 | | | | (3,618,960 | ) | | | (0.76 | ) | | | | | 261,984,851 | | | | 4,195 | | | | 10,940,980 | | | | 2.28 | | | United States Contracts | | | | | | | | | | | | | | | | | | NYMEX WTI Crude Oil Futures CL December 2017 contracts, expiring November 2017 | | | 34,343,210 | | | | 659 | | | | (108,160 | ) | | | (0.02 | ) | | NYMEX RBOB Gasoline Futures RB December 2017 contracts, expiring November 2017 | | | 33,887,851 | | | | 504 | | | | (469,930 | ) | | | (0.10 | ) | | ICE-US Cotton #2 Futures CT December 2017 contracts, expiring December 2017 | | | 36,726,710 | | | | 1,000 | | | | (2,501,710 | ) | | | (0.52 | ) | | COMEX Copper Futures HG December 2017 contracts, expiring December 2017 | | | 32,264,425 | | | | 471 | | | | 2,530,700 | | | | 0.53 | | | COMEX Gold Futures GC December 2017 contracts, expiring December 2017 | | | 34,777,890 | | | | 264 | | | | (859,170 | ) | | | (0.18 | ) | | CME Feeder Cattle Futures FC January 2018 contracts, expiring January 2018 | | | 34,853,825 | | | | 460 | | | | (3,075 | ) | | | 0.00 | * | | NYMEX Heating Oil Futures HO June 2018 contracts, expiring May 2018 | | | 34,098,259 | | | | 468 | | | | (187,727 | ) | | | (0.04 | ) | | CBOT Wheat Futures W July 2018 contracts, expiring July 2018 | | | 34,351,312 | | | | 1,379 | | | | (514,100 | ) | | | (0.11 | ) | | | | | 275,303,482 | | | | 5,205 | | | | (2,113,172 | ) | | | (0.44 | ) | | Open Futures Contracts - Short** | | | | | | | | | | | | | | | | | | Foreign Contracts | | | | | | | | | | | | | | | | | | LME Tin Futures LT November 2017 contracts, expiring November 2017 | | | (9,444,045 | ) | | | 94 | | | | (319,540 | ) | | | (0.07 | ) | | LME Zinc Futures LX November 2017 contracts, expiring November 2017 | | | (12,115,119 | ) | | | 175 | | | | (1,748,461 | ) | | | (0.37 | ) | | LME Aluminum Futures LA February 2018 contracts, expiring February 2018 | | | (9,545,838 | ) | | | 192 | | | | (596,336 | ) | | | (0.12 | ) | | LME Lead Futures LL April 2018 contracts, expiring April 2018 | | | (2,050,919 | ) | | | 33 | | | | (6,604 | ) | | | 0.00 | * | | LME Nickel Futures LN April 2018 contracts, expiring April 2018 | | | (31,247,256 | ) | | | 495 | | | | (199,414 | ) | | | (0.04 | ) | | | | | (64,403,177 | ) | | | 989 | | | | (2,870,355 | ) | | | (0.60 | ) | | Total Open Futures Contracts*** | | $ | 472,885,156 | | | | 10,389 | | | $ | 5,957,453 | | | | 1.24 | |
| | | | | | | | | | | | | | | | | | Fair | | | | | | | | | | Value/Unrealized | | | | | | | | | | Gain (Loss) on | | | | | | | | | | Open | | | | | | | | Number of | | Commodity | | % of Partners' | | | Notional Amount | | Contracts | | Contracts | | Capital | Open Commodity Futures Contracts - Long | | | | | | | | | | | United States Contracts | | | | | | | | | | | NYMEX NY Harbour ULSD Futures HO June 2023 contracts, expiring May 2023 | | $ | 14,290,794 | | 134 | | $ | 156,282 | | 0.08 | CME Live Cattle Futures LC June 2023 contracts, expiring June 2023 | | | 14,630,200 | | 227 | | | 90,750 | | 0.04 | ICE Sugar #11 Futures SB July 2023 contracts, expiring June 2023 | | | 14,726,186 | | 619 | | | 408,117 | | 0.20 | ICE Cocoa Futures CC July 2023 contracts, expiring July 2023 | | | 14,461,470 | | 503 | | | 95,350 | | 0.05 | ICE Coffee Futures KC July 2023 contracts, expiring July 2023 | | | 14,163,695 | | 222 | | | (36,170) | | (0.02) | NYMEX Platinum Futures PL July 2023 contracts, expiring July 2023 | | | 14,004,075 | | 297 | | | 891,960 | | 0.44 | CBOT Soybean Oil Futures S August 2023 contracts, expiring August 2023 | | | 14,478,163 | | 206 | | | 165,862 | | 0.08 | NYMEX RBOB Gasoline Futures RB September 2023 contracts, expiring August 2023 | | | 14,404,854 | | 141 | | | 172,741 | | 0.08 | CBOT Corn Futures C September 2023 contracts, expiring September 2023 | | | 14,374,650 | | 497 | | | (29,988) | | (0.01) | CBOT Soybean Meal Futures SM September 2023 contracts, expiring September 2023 | | | 14,479,871 | | 335 | | | 116,080 | | 0.06 | United Kingdom Contracts | | | | | | | | | | | ICE Low Sulphur Gasoil Futures QS May 2023 contracts, expiring May 2023 | | | 14,233,625 | | 189 | | | (25,550) | | (0.01) | ICE Brent Crude Futures CO September 2023 contracts, expiring July 2023 | | | 14,476,160 | | 186 | | | 238,300 | | 0.12 | Foreign Contracts | | | | | | | | | | | LME Lead Futures LL April 2023 contracts, expiring April 2023* | | | 15,721,216 | | 302 | | | 211,171 | | 0.10 | LME Lead Futures LL May 2023 contracts, expiring May 2023* | | | 14,373,900 | | 270 | | | (163,463) | | (0.08) | LME Zinc Futures LX July 2023 contracts, expiring July 2023* | | | 15,692,481 | | 210 | | | (359,856) | | (0.18) | Open Commodity Futures Contracts - Short** | | | | | | | | | | | Foreign Contracts | | | | | | | | | | | LME Lead Futures LL April 2023 contracts, expiring April 2023* | | | (16,083,693) | | 302 | | | 151,305 | | 0.07 | LME Zinc Futures LX July 2023 contracts, expiring July 2023* | | | (935,226) | | 13 | | | (13,936) | | (0.01) | Total Open Futures Contracts* | | $ | 201,492,421 | | 4,653 | | $ | 2,068,955 | | 1.01 |
See accompanying notes to condensed financial statements.
United States Commodity Index Funds Trust Condensed Schedule of Investments (Unaudited) (Continued) At March 31, 2023 (continued) At September 30, 2017
United States Commodity Index Fund | | | | | | | | | | | Shares/Principal | | | | | % of Partners' | | | Amount | | Market Value | | Capital | Cash Equivalents | | | | | | | | | United States Treasury Obligations | | | | | | | | | U.S. Treasury Bills: | | | | | | | | | 4.70%, 5/18/2023 | | $ | 10,000,000 | | $ | 9,939,357 | | 4.88 | 4.86%, 6/20/2023 | | | 10,000,000 | | | 9,893,778 | | 4.86 | 4.90%, 6/27/2023 | | | 10,000,000 | | | 9,883,638 | | 4.86 | 5.08%, 7/05/2023 | | | 10,000,000 | | | 9,868,319 | | 4.85 | Total United States Treasury Obligations | | | | | | 39,585,092 | | 19.45 | United States Money Market Funds | | | | | | | | | Dreyfus Institutional Preferred Government Money Market Fund - Institutional Shares, 4.79%# | | | 122,800,000 | | | 122,800,000 | | 60.33 | Total United States Money Market Funds | | | | | | 122,800,000 | | 60.33 | Total Cash Equivalents | | | | | $ | 162,385,092 | | 79.78 |
# Reflects the 7-day yield at March 31, 2023. | | | Principal
Amount | | | Market
Value | | | % of
Capital | | | Cash Equivalents | | | | | | | | | | | | | | United States Treasury Obligations | | | | | | | | | | | | | | U.S. Treasury Bills: | | | | | | | | | | | | | | 0.96%, 10/05/2017 | | $ | 5,000,000 | | | $ | 4,999,469 | | | | 1.04 | | | 0.92%, 10/12/2017 | | | 10,000,000 | | | | 9,997,204 | | | | 2.09 | | | 0.91%, 10/19/2017 | | | 18,000,000 | | | | 17,991,855 | | | | 3.76 | | | 0.95%, 10/26/2017 | | | 30,000,000 | | | | 29,980,208 | | | | 6.26 | | | 0.97%, 11/02/2017 | | | 25,000,000 | | | | 24,978,556 | | | | 5.22 | | | 1.01%, 11/09/2017 | | | 10,000,000 | | | | 9,989,113 | | | | 2.09 | | | 0.98%, 11/16/2017 | | | 25,000,000 | | | | 24,968,694 | | | | 5.21 | | | 1.05%, 11/24/2017 | | | 10,000,000 | | | | 9,984,325 | | | | 2.08 | | | 1.08%, 12/07/2017 | | | 10,000,000 | | | | 9,980,086 | | | | 2.08 | | | 1.09%, 12/14/2017 | | | 25,000,000 | | | | 24,944,500 | | | | 5.21 | | | 1.11%, 12/21/2017 | | | 10,000,000 | | | | 9,975,250 | | | | 2.08 | | | 1.10%, 12/28/2017 | | | 15,000,000 | | | | 14,959,850 | | | | 3.12 | | | 1.12%, 1/04/2018 | | | 30,000,000 | | | | 29,911,729 | | | | 6.25 | | | 1.11%, 1/11/2018 | | | 5,000,000 | | | | 4,984,346 | | | | 1.04 | | | 1.10%, 1/18/2018 | | | 10,000,000 | | | | 9,966,997 | | | | 2.08 | | | 1.12%, 1/25/2018 | | | 25,000,000 | | | | 24,910,181 | | | | 5.20 | | | 0.83%, 2/01/2018 | | | 10,000,000 | | | | 9,971,813 | | | | 2.08 | | | 1.12%, 2/15/2018 | | | 5,000,000 | | | | 4,978,879 | | | | 1.04 | | | 1.06%, 3/01/2018 | | | 12,000,000 | | | | 11,947,276 | | | | 2.49 | | | 1.14%, 3/08/2018 | | | 12,000,000 | | | | 11,940,355 | | | | 2.49 | | | 1.16%, 3/22/2018 | | | 10,000,000 | | | | 9,945,056 | | | | 2.08 | | | 1.07%, 3/29/2018 | | | 15,000,000 | | | | 14,921,141 | | | | 3.12 | | | 1.07%, 4/26/2018 | | | 20,000,000 | | | | 19,878,244 | | | | 4.15 | | | 1.17%, 5/24/2018 | | | 15,000,000 | | | | 14,887,069 | | | | 3.11 | | | 1.20%, 6/21/2018 | | | 15,000,000 | | | | 14,869,778 | | | | 3.10 | | | 1.20%, 7/19/2018 | | | 5,000,000 | | | | 4,952,025 | | | | 1.03 | | | 1.21%, 8/16/2018 | | | 16,000,000 | | | | 15,830,354 | | | | 3.31 | | | 1.28%, 9/13/2018 | | | 5,000,000 | | | | 4,939,179 | | | | 1.03 | | | Total Treasury Obligations | | | | | | | 401,583,532 | | | | 83.84 | | | | | | | | | | | | | | | | | United States - Money Market Funds | | | | | | | | | | | | | | Fidelity Investments Money Market Funds - Government Portfolio | | | 3,000,000 | | | | 3,000,000 | | | | 0.63 | | | Goldman Sachs Financial Square Funds - Government Fund - Class FS | | | 3,000,000 | | | | 3,000,000 | | | | 0.63 | | | Morgan Stanley Institutional Liquidity Funds - Government Portfolio | | | 3,000,000 | | | | 3,000,000 | | | | 0.63 | | | Total Money Market Funds | | | | | | | 9,000,000 | | | | 1.89 | | | Total Cash Equivalents | | | | | | $ | 410,583,532 | | | | 85.73 | |
* Represents less than 0.005%.Collateral amounted to $13,784,503 on open commodity futures contracts. ** All short contracts are offset by the same number oflong positions in Commodity Futures Contracts in the corresponding long positions and are acquired solely for the purpose of reducing a long position (e.g., due to a redemption or to reflect a rebalancing of the SDCI). **
See accompanying notes to condensed financial statements. United States Commodity Index Funds Trust Condensed Schedule of Investments (Unaudited) At March 31, 2023 United States Copper Index Fund | | | | | | | | | | | | | | | | | | Fair | | | | | | | | | | Value/Unrealized | | | | | | | | | | Gain (Loss) on | | | | | | | | | | Open | | | | | | | | Number of | | Commodity | | % of Partners' | | | Notional Amount | | Contracts | | Contracts | | Capital | Open Commodity Futures Contracts - Long | | | | | | | | | | | United States Contracts | | | | | | | | | | | COMEX Copper Futures HG, May 2023 contracts, expiring May 2023 | | $ | 48,401,488 | | 501 | | $ | 2,882,125 | | 1.87 | COMEX Copper Futures HG July 2023 contracts, expiring July 2023 | | | 51,510,725 | | 500 | | | (229,475) | | (0.15) | COMEX Copper Futures HG September 2023 contracts, expiring September 2023 | | | 51,419,363 | | 499 | | | (190,776) | | (0.12) | Total Open Futures Contracts* | | $ | 151,331,576 | | 1,500 | | $ | 2,461,874 | | 1.60 |
| | | | | | | | | | | Shares/Principal | | | | | % of Partners' | | | Amount | | Market Value | | Capital | Cash Equivalents | | | | | | | | | United States Treasury Obligations | | | | | | | | | U.S. Treasury Bills: | | | | | | | | | 4.70%, 5/18/2023 | | $ | 5,000,000 | | $ | 4,969,678 | | 3.23 | 4.86%, 6/20/2023 | | | 5,000,000 | | | 4,946,889 | | 3.21 | 4.90%, 6/27/2023 | | | 5,000,000 | | | 4,941,819 | | 3.21 | 5.08%, 7/05/2023 | | | 5,000,000 | | | 4,934,160 | | 3.20 | Total United States Treasury Obligations | | | | | | 19,792,546 | | 12.85 | United States Money Market Funds | | | | | | | | | Dreyfus Institutional Preferred Government Money Market Fund - Institutional Shares, 4.79%# | | | 97,950,000 | | | 97,950,000 | | 63.62 | Total United States Money Market Funds | | | | | | 97,950,000 | | 63.62 | Total Cash Equivalents | | | | | $ | 117,742,546 | | 76.47 |
# Reflects the 7-day yield at March 31, 2023. * Collateral amounted to $25,357,391$7,768,485 on open commodity futures contracts. See accompanying notes to condensed financial statements.
United States Commodity Index Funds Trust
Condensed ScheduleStatements of InvestmentsOperations (Unaudited)
At September 30, 2017 For the three months ended March 31, 2023 and 2022 United States Commodity Index Fund | | | | | | | | | Three months ended | | Three months ended | | | March 31, 2023 | | March 31, 2022 | Income | | | | | | | Gain (loss) on trading of commodity futures contracts: | | | | | | | Realized gain (loss) on closed commodity futures contracts | | $ | (3,511,508) | | $ | 56,808,970 | Change in unrealized gain (loss) on open commodity futures contracts | | | (7,329,775) | | | 9,065,852 | Dividend income | | | 2,082,717 | | | 40,288 | Interest income* | | | 443,656 | | | 164 | ETF transaction fees | | | 4,550 | | | 5,250 | Total Income (Loss) | | $ | (8,310,360) | | $ | 65,920,524 | | | | | | | | Expenses | | | | | | | Management fees (Note 4) | | $ | 457,636 | | $ | 565,816 | Professional fees | | | 96,198 | | | 49,199 | Brokerage commissions | | | 54,445 | | | 51,836 | Directors’ fees and insurance | | | 18,198 | | | 13,451 | Registration fees | | | — | | | 6,617 | Total Expenses | | $ | 626,477 | | $ | 686,919 | Net Income (Loss) | | $ | (8,936,837) | | $ | 65,233,605 | Net Income (Loss) per share | | $ | (1.95) | | $ | 11.76 | Net Income (Loss) per weighted average share | | $ | (2.11) | | $ | 11.43 | Weighted average shares outstanding | | | 4,235,556 | | | 5,708,889 |
* | Interest income does not exceed paid in kind of 5%. |
See accompanying notes to condensed financial statements. United States Commodity Index Funds Trust Condensed Statements of Operations (Unaudited) For the three months ended March 31, 2023 and 2022 United States Copper Index Fund | | | Notional
Amount | | | Number of
Contracts | | | Value/
Unrealized Gain
(Loss) on Open
Commodity
Contracts | | | % of
Capital | | | Open Futures Contracts - Long | | | | | | | | | | | | | | | | | | United States Contracts | | | | | | | | | | | | | | | | | | COMEX Copper Futures HG December 2017 contracts, expiring December 2017* | | $ | 6,882,413 | | | | 103 | | | $ | 726,713 | | | | 9.58 | |
| | | | | | | | | Three months ended | | Three months ended | | | March 31, 2023 | | March 31, 2022 | Income | | | | | | | Gain (loss) on trading of commodity futures contracts: | | | | | | | Realized gain (loss) on closed commodity futures contracts | | $ | 14,036,387 | | $ | 10,114,375 | Change in unrealized gain (loss) on open commodity futures contracts | | | (1,510,979) | | | 3,840,106 | Dividend income | | | 1,464,907 | | | 30,055 | Interest income* | | | 296,190 | | | 56 | ETF transaction fees | | | 7,000 | | | 5,250 | Total Income (Loss) | | $ | 14,293,505 | | $ | 13,989,842 | | | | | | | | Expenses | | | | | | | Management fees (Note 4) | | $ | 256,037 | | $ | 370,162 | Professional fees | | | 101,467 | | | 67,522 | Brokerage commissions | | | 16,912 | | | 11,366 | Directors’ fees and insurance | | | 21,210 | | | 15,580 | Registration fees | | | — | | | 24,092 | Total Expenses | | $ | 395,626 | | | 488,722 | Net Income (Loss) | | $ | 13,897,879 | | $ | 13,501,120 | Net Income (Loss) per share | | $ | 1.97 | | $ | 1.66 | Net Income (Loss) per weighted average share | | $ | 2.15 | | $ | 1.62 | Weighted average shares outstanding | | | 6,451,111 | | | 8,344,444 |
* | Interest income does not exceed paid in kind of 5%. |
| | | Principal
Amount | | | Market
Value | | | % of
Capital | | | Cash Equivalents | | | | | | | | | | | | | | United States Treasury Obligations | | | | | | | | | | | | | | U.S. Treasury Bills: | | | | | | | | | | | | | | 0.90%, 10/05/2017 | | $ | 750,000 | | | $ | 749,925 | | | | 9.89 | | | 0.92%, 10/12/2017 | | | 300,000 | | | | 299,916 | | | | 3.95 | | | 0.91%, 10/19/2017 | | | 400,000 | | | | 399,819 | | | | 5.27 | | | 0.95%, 10/26/2017 | | | 250,000 | | | | 249,835 | | | | 3.29 | | | 0.97%, 11/02/2017 | | | 200,000 | | | | 199,828 | | | | 2.63 | | | 0.98%, 11/16/2017 | | | 200,000 | | | | 199,750 | | | | 2.63 | | | 1.05%, 11/24/2017 | | | 300,000 | | | | 299,530 | | | | 3.95 | | | 1.09%, 12/14/2017 | | | 100,000 | | | | 99,778 | | | | 1.32 | | | 1.11%, 12/21/2017 | | | 200,000 | | | | 199,505 | | | | 2.63 | | | 0.92%, 1/04/2018 | | | 250,000 | | | | 249,400 | | | | 3.29 | | | 1.12%, 1/25/2018 | | | 100,000 | | | | 99,641 | | | | 1.31 | | | 0.82%, 2/01/2018 | | | 200,000 | | | | 199,445 | | | | 2.63 | | | 1.13%, 2/08/2018 | | | 100,000 | | | | 99,594 | | | | 1.31 | | | 1.12%, 2/15/2018 | | | 250,000 | | | | 248,944 | | | | 3.28 | | | 1.02%, 3/01/2018 | | | 500,000 | | | | 497,887 | | | | 6.56 | | | 1.14%, 3/15/2018 | | | 300,000 | | | | 298,446 | | | | 3.93 | | | 1.16%, 3/22/2018 | | | 500,000 | | | | 497,253 | | | | 6.56 | | | 1.02%, 3/29/2018 | | | 250,000 | | | | 248,744 | | | | 3.28 | | | 1.06%, 4/26/2018 | | | 200,000 | | | | 198,798 | | | | 2.62 | | | 1.17%, 5/24/2018 | | | 100,000 | | | | 99,246 | | | | 1.31 | | | 1.19%, 6/21/2018 | | | 100,000 | | | | 99,138 | | | | 1.31 | | | 1.25%, 8/16/2018 | | | 100,000 | | | | 98,906 | | | | 1.30 | | | 1.27%, 9/13/2018 | | | 100,000 | | | | 98,795 | | | | 1.30 | | | Total Treasury Obligations | | | | | | | 5,732,123 | | | | 75.55 | | | | | | | | | | | | | | | | | United States - Money Market Funds | | | | | | | | | | | | | | Fidelity Investments Money Market Funds - Government Portfolio | | | 330,000 | | | | 330,000 | | | | 4.35 | | | Goldman Sachs Financial Square Funds - Government Fund - Class FS | | | 330,000 | | | | 330,000 | | | | 4.35 | | | Morgan Stanley Institutional Liquidity Funds - Government Portfolio | | | 330,000 | | | | 330,000 | | | | 4.35 | | | Total Money Market Funds | | | | | | | 990,000 | | | | 13.05 | | | Total Cash Equivalents | | | | | | $ | 6,722,123 | | | | 88.60 | |
* Collateral amounted to $797,417 on open futures contracts.
See accompanying notes to condensed financial statements. United States Commodity Index Funds Trust
Condensed Schedule of Investments (Unaudited)
At September 30, 2017
United States Agriculture Index Fund
| | | Notional
Amount | | | Number of
Contracts | | | Value/
Unrealized Gain
(Loss) on Open
Commodity
Contracts | | | % of
Capital | | | Open Futures Contracts - Long | | | | | | | | | | | | | | | | | | Foreign Contracts | | | | | | | | | | | | | | | | | | ICE-Canola Futures RS March 2018 contracts, expiring March 2018 | | $ | 88,871 | | | | 11 | | | $ | (10 | ) | | | 0.00 | * | | | | | | | | | | | | | | | | | | | | United States Contracts | | | | | | | | | | | | | | | | | | ICE-US Cotton #2 Futures CT December 2017 contracts, expiring December 2017 | | | 145,775 | | | | 4 | | | | (8,875 | ) | | | (0.51 | ) | | CBOT Corn Futures C December 2017 contracts, expiring December 2017 | | | 203,337 | | | | 11 | | | | (7,950 | ) | | | (0.45 | ) | | CBOT Soybean Oil Futures BO December 2017 contracts, expiring December 2017 | | | 103,266 | | | | 5 | | | | (4,806 | ) | | | (0.27 | ) | | CME Lean Hogs Futures LH December 2017 contracts, expiring December 2017 | | | 71,290 | | | | 3 | | | | 650 | | | | 0.04 | | | ICE-US Coffee-C Futures KC December 2017 contracts, expiring December 2017 | | | 153,862 | | | | 3 | | | | (9,806 | ) | | | (0.56 | ) | | KCBT Hard Red Winter Wheat Futures KW December 2017 contracts, expiring December 2017 | | | 53,000 | | | | 2 | | | | (8,725 | ) | | | (0.50 | ) | | CBOT Soybean Meal Futures SM January 2018 contracts, expiring January 2018 | | | 59,980 | | | | 2 | | | | 3,580 | | | | 0.20 | | | CME Feeder Cattle Futures FC January 2018 contracts, expiring January 2018 | | | 76,100 | | | | 1 | | | | (338 | ) | | | (0.02 | ) | | CME Live Cattle Futures LC February 2018 contracts, expiring February 2018 | | | 141,780 | | | | 3 | | | | 570 | | | | 0.03 | | | CBOT Wheat Futures W March 2018 contracts, expiring March 2018 | | | 174,725 | | | | 7 | | | | (11,450 | ) | | | (0.65 | ) | | ICE-US Cocoa Futures CC March 2018 contracts, expiring March 2018 | | | 141,320 | | | | 7 | | | | 1,060 | | | | 0.06 | | | ICE-US Sugar #11 Futures SB May 2018 contracts, expiring April 2018 | | | 149,184 | | | | 9 | | | | (5,846 | ) | | | (0.33 | ) | | CBOT Soybean Futures S November 2018 contracts, expiring November 2018 | | | 246,188 | | | | 5 | | | | 375 | | | | 0.02 | | | | | | 1,719,807 | | | | 62 | | | | (51,561 | ) | | | (2.94 | ) | | Total Open Futures Contracts** | | $ | 1,808,678 | | | | 73 | | | $ | (51,571 | ) | | | (2.94 | ) |
See accompanying notes to condensed financial statements.
United States Commodity Index Funds Trust
Condensed Schedule of Investments (Unaudited) (Continued)
At September 30, 2017
United States Agriculture Index Fund
| | | Principal
Amount | | | Market
Value | | | % of
Capital | | | Cash Equivalents | | | | | | | | | | | | | | United States Treasury Obligations | | | | | | | | | | | | | | U.S. Treasury Bills: | | | | | | | | | | | | | | 0.95%, 10/05/2017 | | $ | 100,000 | | | $ | 99,989 | | | | 5.71 | | | 0.97%, 11/02/2017 | | | 100,000 | | | | 99,914 | | | | 5.70 | | | 0.98%, 11/16/2017 | | | 100,000 | | | | 99,875 | | | | 5.70 | | | 1.05%, 11/24/2017 | | | 100,000 | | | | 99,843 | | | | 5.70 | | | 1.06%, 12/07/2017 | | | 100,000 | | | | 99,803 | | | | 5.70 | | | 1.11%, 12/21/2017 | | | 100,000 | | | | 99,753 | | | | 5.69 | | | 1.12%, 1/04/2018 | | | 100,000 | | | | 99,706 | | | | 5.69 | | | 1.11%, 1/11/2018 | | | 100,000 | | | | 99,687 | | | | 5.69 | | | 1.12%, 2/01/2018 | | | 100,000 | | | | 99,619 | | | | 5.69 | | | 1.12%, 2/15/2018 | | | 250,000 | | | | 248,944 | | | | 14.21 | | | 1.14%, 3/08/2018 | | | 50,000 | | | | 49,751 | | | | 2.84 | | | 1.16%, 3/22/2018 | | | 50,000 | | | | 49,725 | | | | 2.84 | | | Total Treasury Obligations | | | | | | | 1,246,609 | | | | 71.16 | | | | | | | | | | | | | | | | | United States - Money Market Funds | | | | | | | | | | | | | | Fidelity Investments Money Market Funds - Government Portfolio | | | 100,000 | | | | 100,000 | | | | 5.71 | | | Goldman Sachs Financial Square Funds - Government Fund - Class FS | | | 100,000 | | | | 100,000 | | | | 5.71 | | | Morgan Stanley Institutional Liquidity Funds - Government Portfolio | | | 100,000 | | | | 100,000 | | | | 5.71 | | | Total Money Market Funds | | | | | | | 300,000 | | | | 17.13 | | | Total Cash Equivalents | | | | | | $ | 1,546,609 | | | | 88.29 | |
* Represents less than 0.005%.
** Collateral amounted to $161,234 on open futures contracts.
See accompanying notes to condensed financial statements.
United States Commodity Index Funds Trust
Condensed Statements of Operations (Unaudited) For the three and nine months ended September 30, 2017March 31, 2023 and 20162022 United States Commodity Index Fund
| | | Three months ended
September 30, 2017 | | | Three months ended
September 30, 2016 | | | Nine months ended
September 30, 2017 | | | Nine months ended
September 30, 2016 | | | Income | | | | | | | | | | | | | | | | | | Gain (loss) on trading of commodity futures contracts: | | | | | | | | | | | | | | | | | | Realized gain (loss) on closed positions | | $ | 1,905,313 | | | $ | (7,271,517 | ) | | $ | (4,363,021 | ) | | $ | 7,757,295 | | | Change in unrealized gain (loss) on open positions | | | 18,307,792 | | | | (16,842,561 | ) | | | 3,901,993 | | | | 3,666,595 | | | Interest income* | | | 1,123,783 | | | | 575,836 | | | | 2,703,656 | | | | 1,368,961 | | | ETF transaction fees | | | 3,500 | | | | 5,950 | | | | 12,950 | | | | 14,700 | | | | | | | | | | | | | | | | | | | | | Total income (loss) | | | 21,340,388 | | | | (23,532,292 | ) | | | 2,255,578 | | | | 12,807,551 | | | | | | | | | | | | | | | | | | | | | Expenses | | | | | | | | | | | | | | | | | | Management fees (Note 4) | | | 978,618 | | | | 1,373,276 | | | | 3,147,138 | | | | 3,487,542 | | | Professional fees | | | 101,105 | | | | 134,857 | | | | 403,025 | | | | 423,261 | | | Brokerage commissions | | | 89,000 | | | | 247,791 | | | | 441,006 | | | | 607,696 | | | Directors' fees and insurance | | | 17,393 | | | | 18,728 | | | | 51,312 | | | | 55,923 | | | | | | | | | | | | | | | | | | | | | Total expenses | | | 1,186,116 | | | | 1,774,652 | | | | 4,042,481 | | | | 4,574,422 | | | | | | | | | | | | | | | | | | | | | Net income (loss) | | $ | 20,154,272 | | | $ | (25,306,944 | ) | | $ | (1,786,903 | ) | | $ | 8,233,129 | | | Net income (loss) per share | | $ | 1.62 | | | $ | (1.57 | ) | | $ | 0.06 | | | $ | 0.98 | | | Net income (loss) per weighted average share | | $ | 1.64 | | | $ | (1.56 | ) | | $ | (0.13 | ) | | $ | 0.58 | | | Weighted average shares outstanding | | | 12,289,130 | | | | 16,240,761 | | | | 13,373,443 | | | | 14,095,985 | |
* Interest income does not exceed paid in kind of 5%.
See accompanying notes to condensed financial statements.
United States Commodity Index Funds Trust
Condensed Statements of Operations (Unaudited)
For the three and nine months ended September 30, 2017 and 2016
United States Copper Index Fund
| | | Three months ended
September 30, 2017 | | | Three months ended
September 30, 2016 | | | Nine months ended
September 30, 2017 | | | Nine months ended
September 30, 2016 | | | Income | | | | | | | | | | | | | | | | | | Gain (loss) on trading of commodity futures contracts: | | | | | | | | | | | | | | | | | | Realized gain (loss) on closed positions | | $ | 466,813 | | | $ | 4,887 | | | $ | 638,588 | | | $ | (241,163 | ) | | Change in unrealized gain (loss) on open positions | | | 341,000 | | | | 2,175 | | | | 638,138 | | | | 263,038 | | | Realized gain (loss) on short-term investments | | | (23 | ) | | | — | | | | (23 | ) | | | — | | | Interest income* | | | 21,584 | | | | 2,343 | | | | 57,244 | | | | 5,809 | | | ETF transaction fees | | | 1,400 | | | | — | | | | 3,500 | | | | 350 | | | | | | | | | | | | | | | | | | | | | Total income (loss) | | | 830,774 | | | | 9,405 | | | | 1,337,447 | | | | 28,034 | | | | | | | | | | | | | | | | | | | | | Expenses | | | | | | | | | | | | | | | | | | Management fees (Note 4) | | | 15,723 | | | | 4,664 | | | | 53,031 | | | | 12,744 | | | Professional fees | | | 13,055 | | | | 22,705 | | | | 42,352 | | | | 57,484 | | | Brokerage commissions | | | 564 | | | | 346 | | | | 4,144 | | | | 1,242 | | | Directors' fees and insurance | | | 503 | | | | 77 | | | | 1,323 | | | | 299 | | | | | | | | | | | | | | | | | | | | | Total expenses | | | 29,845 | | | | 27,792 | | | | 100,850 | | | | 71,769 | | | | | | | | | | | | | | | | | | | | | Expense waiver (Note 4) | | | (10,493 | ) | | | (22,051 | ) | | | (35,579 | ) | | | (56,084 | ) | | | | | | | | | | | | | | | | | | | | Net expenses | | | 19,352 | | | | 5,741 | | | | 65,271 | | | | 15,685 | | | | | | | | | | | | | | | | | | | | | Net income (loss) | | $ | 811,422 | | | $ | 3,664 | | | $ | 1,272,176 | | | $ | 12,349 | | | Net income (loss) per share | | $ | 1.47 | | | $ | 0.02 | | | $ | 2.61 | | | $ | 0.30 | | | Net income (loss) per weighted average share | | $ | 1.57 | | | $ | 0.02 | | | $ | 2.03 | | | $ | 0.07 | | | Weighted average shares outstanding | | | 517,391 | | | | 200,000 | | | | 625,641 | | | | 184,854 | |
* Interest income does not exceed paid in kind of 5%.
See accompanying notes to condensed financial statements.
United States Commodity Index Funds Trust
Condensed Statements of Operations (Unaudited)
For the three and nine months ended September 30, 2017 and 2016
United States Agriculture Index Fund
| | | Three months ended
September 30, 2017 | | | Three months ended
September 30, 2016 | | | Nine months ended
September 30, 2017 | | | Nine months ended
September 30, 2016 | | | Income | | | | | | | | | | | | | | | | | | Gain (loss) on trading of commodity futures contracts: | | | | | | | | | | | | | | | | | | Realized gain (loss) on closed positions | | $ | (64,061 | ) | | $ | (116,422 | ) | | $ | (185,566 | ) | | $ | (42,575 | ) | | Change in unrealized gain (loss) on open positions | | | (53,749 | ) | | | (89,660 | ) | | | 38,129 | | | | (6,224 | ) | | Realized gain (loss) on foreign currency transactions | | | 126 | | | | (98 | ) | | | (83 | ) | | | (113 | ) | | Change in unrealized gain (loss) on foreign currency translations | | | (37 | ) | | | (79 | ) | | | 602 | | | | 797 | | | Interest income* | | | 4,060 | | | | 1,646 | | | | 9,123 | | | | 4,491 | | | | | | | | | | | | | | | | | | | | | Total income (loss) | | | (113,661 | ) | | | (204,613 | ) | | | (137,795 | ) | | | (43,624 | ) | | | | | | | | | | | | | | | | | | | | Expenses | | | | | | | | | | | | | | | | | | Management fees (Note 4) | | | 2,984 | | | | 3,268 | | | | 9,136 | | | | 9,731 | | | Professional fees | | | 14,082 | | | | 21,410 | | | | 36,671 | | | | 53,280 | | | Brokerage commissions | | | 575 | | | | 772 | | | | 1,513 | | | | 1,788 | | | Directors' fees and insurance | | | 340 | | | | 60 | | | | 801 | | | | 242 | | | | | | | | | | | | | | | | | | | | | Total expenses | | | 17,981 | | | | 25,510 | | | | 48,121 | | | | 65,041 | | | | | | | | | | | | | | | | | | | | | Expense waiver (Note 4) | | | (14,271 | ) | | | (21,453 | ) | | | (36,825 | ) | | | (53,011 | ) | | | | | | | | | | | | | | | | | | | | Net expenses | | | 3,710 | | | | 4,057 | | | | 11,296 | | | | 12,030 | | | | | | | | | | | | | | | | | | | | | Net income (loss) | | $ | (117,371 | ) | | $ | (208,670 | ) | | $ | (149,091 | ) | | $ | (55,654 | ) | | Net income (loss) per share | | $ | (1.17 | ) | | $ | (2.09 | ) | | $ | (1.49 | ) | | $ | (0.56 | ) | | Net income (loss) per weighted average share | | $ | (1.17 | ) | | $ | (2.09 | ) | | $ | (1.49 | ) | | $ | (0.56 | ) | | Weighted average shares outstanding | | | 100,000 | | | | 100,000 | | | | 100,000 | | | | 100,000 | |
* Interest income does not exceed paid in kind of 5%.
See accompanying notes to condensed financial statements.
United States Commodity Index Funds Trust
Condensed Statements of Operations (Unaudited)
For the three and nine months ended September 30, 2017 and 2016
United States Commodity Index Funds Trust | | | Three months ended
September 30, 2017 | | | Three months ended
September 30, 2016 | | | Nine months ended
September 30, 2017 | | | Nine months ended
September 30, 2016 | | | Income | | | | | | | | | | | | | | | | | | Gain (loss) on trading of commodity futures contracts: | | | | | | | | | | | | | | | | | | Realized gain (loss) on closed positions | | $ | 2,308,065 | | | $ | (7,383,052 | ) | | $ | (3,909,999 | ) | | $ | 7,473,557 | | | Change in unrealized gain (loss) on open positions | | | 18,595,043 | | | | (16,930,046 | ) | | | 4,578,260 | | | | 3,923,409 | | | Realized gain (loss) on foreign currency transactions | | | 126 | | | | (98 | ) | | | (83 | ) | | | (113 | ) | | Realized gain (loss) on short-term investments | | | (23 | ) | | | — | | | | (23 | ) | | | — | | | Change in unrealized gain (loss) on foreign currency translations | | | (37 | ) | | | (79 | ) | | | 602 | | | | 797 | | | Interest income* | | | 1,149,427 | | | | 579,825 | | | | 2,770,023 | | | | 1,379,261 | | | ETF transaction fees | | | 4,900 | | | | 5,950 | | | | 16,450 | | | | 15,050 | | | | | | | | | | | | | | | | | | | | | Total income (loss) | | | 22,057,501 | | | | (23,727,500 | ) | | | 3,455,230 | | | | 12,791,961 | | | | | | | | | | | | | | | | | | | | | Expenses | | | | | | | | | | | | | | | | | | Management fees (Note 4) | | | 997,325 | | | | 1,381,208 | | | | 3,209,305 | | | | 3,510,017 | | | Professional fees | | | 128,242 | | | | 178,972 | | | | 482,048 | | | | 534,025 | | | Brokerage commissions | | | 90,139 | | | | 248,909 | | | | 446,663 | | | | 610,726 | | | Directors' fees and insurance | | | 18,236 | | | | 18,865 | | | | 53,436 | | | | 56,464 | | | | | | | | | | | | | | | | | | | | | Total expenses | | | 1,233,942 | | | | 1,827,954 | | | | 4,191,452 | | | | 4,711,232 | | | | | | | | | | | | | | | | | | | | | Expense waiver (Note 4) | | | (24,764 | ) | | | (43,504 | ) | | | (72,404 | ) | | | (109,095 | ) | | | | | | | | | | | | | | | | | | | | Net expenses | | | 1,209,178 | | | | 1,784,450 | | | | 4,119,048 | | | | 4,602,137 | | | | | | | | | | | | | | | | | | | | | Net income (loss) | | $ | 20,848,323 | | | $ | (25,511,950 | ) | | $ | (663,818 | ) | | $ | 8,189,824 | |
| | | | | | | | | Three months ended | | Three months ended | | | March 31, 2023 | | March 31, 2022 | Income | | | | | | | Realized gain (loss) on closed commodity futures contracts | | $ | 10,524,879 | | $ | 66,923,345 | Change in unrealized gain (loss) on open commodity futures contracts | | | (8,840,754) | | | 12,905,958 | Dividend income | | | 3,547,624 | | | 70,343 | Interest income* | | | 739,846 | | | 220 | ETF transaction fees | | | 11,550 | | | 10,500 | Total Income (Loss) | | $ | 5,983,145 | | $ | 79,910,366 | | | | | | | | Expenses | | | | | | | Management fees (Note 4) | | $ | 713,673 | | $ | 935,978 | Professional fees | | | 197,665 | | | 116,721 | Brokerage commissions | | | 71,357 | | | 63,202 | Directors’ fees and insurance | | | 39,408 | | | 29,031 | Registration fees | | | — | | | 30,709 | Total Expenses | | | 1,022,103 | | | 1,175,641 | Expense waiver (Note 4) | | | — | | | — | Net Income (Loss) | | $ | 4,961,042 | | $ | 78,734,725 |
* | Interest income does not exceed paid in kind of 5%. |
* Interest income does not exceed paid in kind of 5%.
See accompanying notes to condensed financial statements. United States Commodity Index Funds Trust Condensed StatementStatements of Changes in Capital (Unaudited) For the ninethree months ended September 30, 2017 March 31, 2023 and 2022 United States Commodity Index Fund | | | Sponsor | | | Shareholders | | | Total | | | | | | | | | | | | | | Balances, at December 31, 2016 | | $ | — | | | $ | 636,292,824 | | | $ | 636,292,824 | | | Additions | | | — | | | | 35,194,643 | | | | 35,194,643 | | | Redemptions | | | — | | | | (190,787,485 | ) | | | (190,787,485 | ) | | Net income (loss) | | | — | | | | (1,786,903 | ) | | | (1,786,903 | ) | | | | | | | | | | | | | | | | Balances, at September 30, 2017 | | $ | — | | | $ | 478,913,079 | | | $ | 478,913,079 | |
| | | | | | | | | Shareholders* | | | Three months ended | | Three months ended | | | March 31, 2023 | | March 31, 2022 | Balances at beginning of period | | $ | 255,837,514 | | $ | 234,520,505 | Addition of 150,000 and 1,250,000 shares, respectively | | | 8,146,814 | | | 66,425,839 | Redemption of (950,000) and (300,000) shares, respectively | | | (51,506,258) | | | (15,720,266) | Net income (loss) | | | (8,936,837) | | | 65,233,605 | | | | | | | | Balances at end of period | | $ | 203,541,233 | | $ | 350,459,683 |
* | Sponsor’s shares outstanding and capital for the periods presented were zero. |
Condensed Statement of Changes in Shares Outstanding (Unaudited)
For the nine months ended September 30, 2017
| | | Sponsor | | | Shareholders | | | Total | | | | | | | | | | | | | | Shares Outstanding, at December 31, 2016 | | | — | | | | 15,900,000 | | | | 15,900,000 | | | Additions | | | — | | | | 900,000 | | | | 900,000 | | | Redemptions | | | — | | | | (4,850,000 | ) | | | (4,850,000 | ) | | | | | | | | | | | | | | | | Shares Outstanding, at September 30, 2017 | | | — | | | | 11,950,000 | | | | 11,950,000 | | | | | | | | | | | | | | | | | Net Asset Value Per Share: | | | | | | | | | | | | | | At December 31, 2016 | | | | | | | | | | $ | 40.02 | | | At September 30, 2017 | | | | | | | | | | $ | 40.08 | |
See accompanying notes to condensed financial statements. United States Commodity Index Funds Trust Condensed StatementStatements of Changes in Capital (Unaudited) For the ninethree months ended September 30, 2017 March 31, 2023 and 2022 United States Copper Index Fund | | | Sponsor | | | Shareholders | | | Total | | | | | | | | | | | | | | Balances, at December 31, 2016 | | $ | — | | | $ | 5,724,654 | | | $ | 5,724,654 | | | Additions | | | — | | | | 8,617,733 | | | | 8,617,733 | | | Redemptions | | | — | | | | (8,027,253 | ) | | | (8,027,253 | ) | | Net income (loss) | | | — | | | | 1,272,176 | | | | 1,272,176 | | | | | | | | | | | | | | | | | Balances, at September 30, 2017 | | $ | — | | | $ | 7,587,310 | | | $ | 7,587,310 | |
| | | | | | | | | Shareholders* | | | Three months ended | | Three months ended | | | March 31, 2023 | | March 31, 2022 | Balances at beginning of period | | $ | 169,536,375 | | $ | 228,783,408 | Addition of 1,300,000 and 1,800,000 shares, respectively | | | 32,717,196 | | | 51,201,330 | Redemption of (2,500,000) and (650,000) shares, respectively | | | (62,179,824) | | | (17,501,848) | Net income (loss) | | | 13,897,879 | | | 13,501,120 | | | | | | | | Balances at end of period | | $ | 153,971,626 | | $ | 275,984,010 |
* Sponsor’s shares outstanding and capital for the periods presented were zero. Condensed Statement of Changes in Shares Outstanding (Unaudited)
For the nine months ended September 30, 2017
| | | Sponsor | | | Shareholders | | | Total | | | | | | | | | | | | | | Shares Outstanding, at December 31, 2016 | | | — | | | | 350,000 | | | | 350,000 | | | Additions | | | — | | | | 500,000 | | | | 500,000 | | | Redemptions | | | — | | | | (450,000 | ) | | | (450,000 | ) | | | | | | | | | | | | | | | | Shares Outstanding, at September 30, 2017 | | | — | | | | 400,000 | | | | 400,000 | | | | | | | | | | | | | | | | | Net Asset Value Per Share: | | | | | | | | | | | | | | At December 31, 2016 | | | | | | | | | | $ | 16.36 | | | At September 30, 2017 | | | | | | | | | | $ | 18.97 | |
See accompanying notes to condensed financial statements. United States Commodity Index Funds Trust Condensed StatementStatements of Changes in Capital (Unaudited) For the ninethree months ended September 30, 2017 United States Agriculture Index Fund
| | | Sponsor | | | Shareholders | | | Total | | | | | | | | | | | | | | Balances, at December 31, 2016 | | $ | — | | | $ | 1,900,755 | | | $ | 1,900,755 | | | Net income (loss) | | | — | | | | (149,091 | ) | | | (149,091 | ) | | | | | | | | | | | | | | | | Balances, at September 30, 2017 | | $ | — | | | $ | 1,751,664 | | | $ | 1,751,664 | |
Condensed Statement of Changes in Shares Outstanding (Unaudited)
For the nine months ended September 30, 2017
| | | Sponsor | | | Shareholders | | | Total | | | | | | | | | | | | | | Shares Outstanding, at December 31, 2016 | | | — | | | | 100,000 | | | | 100,000 | | | Additions | | | — | | | | — | | | | — | | | Redemptions | | | — | | | | — | | | | — | | | | | | | | | | | | | | | | | Shares Outstanding, at September 30, 2017 | | | — | | | | 100,000 | | �� | | 100,000 | | | | | | | | | | | | | | | | | Net Asset Value Per Share: | | | | | | | | | | | | | | At December 31, 2016 | | | | | | | | | | $ | 19.01 | | | At September 30, 2017 | | | | | | | | | | $ | 17.52 | |
See accompanying notes to condensed financial statements.
United States Commodity Index Funds Trust
Condensed Statement of Changes in Capital (Unaudited)
For the nine months ended September 30, 2017
March 31, 2023 and 2022 United States Commodity Index Funds Trust | | | Sponsor | | | Shareholders | | | Total | | | | | | | | | | | | | | Balances, at December 31, 2016 | | $ | — | | | $ | 643,918,233 | | | $ | 643,918,233 | | | Additions | | | — | | | | 43,812,376 | | | | 43,812,376 | | | Redemptions | | | — | | | | (198,814,738 | ) | | | (198,814,738 | ) | | Net income (loss) | | | — | | | | (663,818 | ) | | | (663,818 | ) | | | | | | | | | | | | | | | | Balances, at September 30, 2017 | | $ | — | | | $ | 488,252,053 | | | $ | 488,252,053 | |
| | | | | | | | | Shareholders | | | Three months ended | | Three months ended | | | March 31, 2023 | | March 31, 2022 | Balances at beginning of period | | $ | 425,373,889 | | $ | 463,303,913 | Addition of 1,450,000 and 3,050,000 shares, respectively | | | 40,864,010 | | | 117,627,169 | Redemption of (3,450,000) and (950,000) shares, respectively | | | (113,686,082) | | | (33,222,114) | Net income (loss) | | | 4,961,042 | | | 78,734,725 | | | | | | | | Balances at end of period | | $ | 357,512,859 | | $ | 626,443,693 |
Condensed Statement of Changes in Shares Outstanding (Unaudited)
For* Sponsor’s shares outstanding and capital for the nine months ended September 30, 2017periods presented were zero.
| | | Sponsor | | | Shareholders | | | Total | | | | | | | | | | | | | | Shares Outstanding, at December 31, 2016 | | | — | | | | 16,350,000 | | | | 16,350,000 | | | Additions | | | — | | | | 1,400,000 | | | | 1,400,000 | | | Redemptions | | | — | | | | (5,300,000 | ) | | | (5,300,000 | ) | | | | | | | | | | | | | | | | Shares Outstanding, at September 30, 2017 | | | — | | | | 12,450,000 | | | | 12,450,000 | |
See accompanying notes to condensed financial statements.
United States Commodity Index Funds Trust Condensed Statements of Cash Flows (Unaudited) For the ninethree months ended September 30, 2017March 31, 2023 and 2016 2022 United States Commodity Index Fund | | | Nine months ended
September 30, 2017 | | | Nine months ended
September 30, 2016 | | | Cash Flows from Operating Activities: | | | | | | | | | | Net income (loss) | | $ | (1,786,903 | ) | | $ | 8,233,129 | | | Adjustments to reconcile net income (loss) to net cash provided by (used in) operating activities: | | | | | | | | | | (Increase) decrease in commodity futures trading account - cash and cash equivalents | | | 14,693,129 | | | | 6,281,564 | | | Unrealized (gain) loss on open futures contracts | | | (3,901,993 | ) | | | (3,666,595 | ) | | (Increase) decrease in interest receivable | | | (8,754 | ) | | | — | | | (Increase) decrease in directors' fees and insurance receivable | | | (2,642 | ) | | | 5,741 | | | (Increase) decrease in ETF transaction fees receivable | | | 350 | | | | — | | | Increase (decrease) in management fees payable | | | (122,234 | ) | | | 81,969 | | | Increase (decrease) in professional fees payable | | | (241,956 | ) | | | (240,022 | ) | | Increase (decrease) in brokerage commissions payable | | | (10,710 | ) | | | 11,200 | | | Increase (decrease) in directors' fees and insurance payable | | | (6,164 | ) | | | — | | | Net cash provided by (used in) operating activities | | | 8,612,123 | | | | 10,706,986 | | | | | | | | | | | | | Cash Flows from Financing Activities: | | | | | | | | | | Addition of shares | | | 35,194,643 | | | | 192,587,054 | | | Redemption of shares | | | (196,802,868 | ) | | | (57,471,182 | ) | | Net cash provided by (used in) financing activities | | | (161,608,225 | ) | | | 135,115,872 | | | | | | | | | | | | | Net Increase (Decrease) in Cash and Cash Equivalents | | | (152,996,102 | ) | | | 145,822,858 | | | | | | | | | | | | | Cash and Cash Equivalents, beginning of period | | | 601,266,026 | | | | 474,315,271 | | | Cash and Cash Equivalents, end of period | | $ | 448,269,924 | | | $ | 620,138,129 | |
| | | | | | | | | Three months ended | | Three months ended | | | March 31, 2023 | | March 31, 2022 | Cash Flows from Operating Activities: | | | | | | | Net income (loss) | | $ | (8,936,837) | | $ | 65,233,605 | Adjustments to reconcile net income (loss) to net cash provided by (used in) operating activities: | | | | | | | Change in unrealized (gain) loss on open commodity futures contracts | | | 7,329,775 | | | (9,065,852) | (Increase) decrease in dividends receivable | | | 308,761 | | | (26,026) | (Increase) decrease in interest receivable | | | (82,847) | | | 20 | (Increase) decrease in prepaid insurance* | | | (53,559) | | | (44,767) | (Increase) decrease in prepaid registration fees | | | — | | | 6,616 | Increase (decrease) payable due to custody | | | — | | | — | Increase (decrease) in Management fees payable | | | (36,583) | | | 76,915 | Increase (decrease) in professional fees payable | | | (167,099) | | | (117,342) | Increase (decrease) in directors’ fees payable* | | | (569) | | | 364 | Net cash provided by (used in) operating activities | | | (1,638,958) | | | 56,063,533 | | | | | | | | Cash Flows from Financing Activities: | | | | | | | Addition of shares | | | 8,146,814 | | | 66,425,839 | Redemption of shares | | | (51,506,258) | | | (15,720,266) | Net cash provided by (used in) financing activities | | | (43,359,444) | | | 50,705,573 | | | | | | | | Net Increase (Decrease) in Cash and Cash Equivalents | | | (44,998,402) | | | 106,769,106 | | | | | | | | Total Cash, Cash Equivalents and Equity in Trading Accounts, beginning of period | | | 246,057,371 | | | 230,015,638 | Total Cash, Cash Equivalents and Equity in Trading Accounts, end of period | | $ | 201,058,969 | | $ | 336,784,744 | | | | | | | | Components of Cash, Cash Equivalents, and Equity in Trading Accounts | | | | | | | Cash and cash equivalents | | $ | 187,274,466 | | $ | 319,330,798 | Equity in Trading Accounts: | | | | | | | Cash and cash equivalents | | | 13,784,503 | | | 17,453,946 | Total Cash, Cash Equivalents and Equity in Trading Accounts | | $ | 201,058,969 | | $ | 336,784,744 |
* Certain prior year amounts have been reclassified for consistency with the current presentation. See accompanying notes to condensed financial statements.
United States Commodity Index Funds Trust
Condensed Statements of Cash Flows (Unaudited)
For the nine months ended September 30, 2017 and 2016
United States Copper Index Fund
| | | Nine months ended
September 30, 2017 | | | Nine months ended
September 30, 2016 | | | Cash Flows from Operating Activities: | | | | | | | | | | Net income (loss) | | $ | 1,272,176 | | | $ | 12,349 | | | Adjustments to reconcile net income (loss) to net cash provided by (used in) operating activities: | | | | | | | | | | (Increase) decrease in commodity futures trading account - cash and cash equivalents | | | (544,252 | ) | | | 201,766 | | | Unrealized (gain) loss on open futures contracts | | | (638,138 | ) | | | (263,038 | ) | | (Increase) decrease in receivable from Sponsor | | | 40,061 | | | | 3,517 | | | (Increase) decrease in interest receivable | | | (736 | ) | | | — | | | (Increase) decrease in directors' fees and insurance receivable | | | (336 | ) | | | 32 | | | Increase (decrease) in payable due to Broker | | | 631,854 | | | | — | | | Increase (decrease) in management fees payable | | | 1,563 | | | | 340 | | | Increase (decrease) in professional fees payable | | | (33,954 | ) | | | 9,619 | | | Increase (decrease) in directors' fees and insurance payable | | | (47 | ) | | | — | | | Net cash provided by (used in) operating activities | | | 728,191 | | | | (35,415 | ) | | | | | | | | | | | | Cash Flows from Financing Activities: | | | | | | | | | | Addition of shares | | | 8,617,733 | | | | 760,489 | | | Redemption of shares | | | (8,027,253 | ) | | | — | | | Net cash provided by (used in) financing activities | | | 590,480 | | | | 760,489 | | | | | | | | | | | | | Net Increase (Decrease) in Cash and Cash Equivalents | | | 1,318,671 | | | | 725,074 | | | | | | | | | | | | | Cash and Cash Equivalents, beginning of period | | | 5,387,655 | | | | 1,871,256 | | | Cash and Cash Equivalents, end of period | | $ | 6,706,326 | | | $ | 2,596,330 | |
See accompanying notes to condensed financial statements.
United States Commodity Index Funds Trust
Condensed Statements of Cash Flows (Unaudited)
For the nine months ended September 30, 2017 and 2016
United States Agriculture Index Fund
| | | Nine months ended
September 30, 2017 | | | Nine months ended
September 30, 2016 | | | Cash Flows from Operating Activities: | | | | | | | | | | Net income (loss) | | $ | (149,091 | ) | | $ | (55,654 | ) | | Adjustments to reconcile net income (loss) to net cash provided by (used in) operating activities: | | | | | | | | | | (Increase) decrease in commodity futures trading account - cash and cash equivalents | | | 47,072 | | | | 18,518 | | | Unrealized (gain) loss on open futures contracts | | | (38,129 | ) | | | 6,224 | | | (Increase) decrease in receivable from Sponsor | | | 35,348 | | | | 3,313 | | | (Increase) decrease in interest receivable | | | (236 | ) | | | — | | | (Increase) decrease in directors' fees and insurance receivable | | | (488 | ) | | | (10 | ) | | Increase (decrease) in management fees payable | | | (106 | ) | | | (53 | ) | | Increase (decrease) in professional fees payable | | | (32,603 | ) | | | 8,990 | | | Increase (decrease) in directors' fees and insurance payable | | | (15 | ) | | | (64 | ) | | Net cash provided by (used in) operating activities | | | (138,248 | ) | | | (18,736 | ) | | | | | | | | | | | | Cash Flows from Financing Activities: | | | | | | | | | | Addition of shares | | | — | | | | — | | | Redemption of shares | | | — | | | | — | | | Net cash provided by (used in) financing activities | | | — | | | | — | | | | | | | | | | | | | Net Increase (Decrease) in Cash and Cash Equivalents | | | (138,248 | ) | | | (18,736 | ) | | | | | | | | | | | | Cash and Cash Equivalents, beginning of period | | | 1,781,515 | | | | 1,820,742 | | | Cash and Cash Equivalents, end of period | | $ | 1,643,267 | | | $ | 1,802,006 | |
See accompanying notes to condensed financial statements.
United States Commodity Index Funds Trust | | | Nine months ended
September 30, 2017 | | | Nine months ended
September 30, 2016 | | | Cash Flows from Operating Activities: | | | | | | | | | | Net income (loss) | | $ | (663,818 | ) | | $ | 8,189,824 | | | Adjustments to reconcile net income (loss) to net cash provided by (used in) operating activities: | | | | | | | | | | (Increase) decrease in commodity futures trading account - cash and cash equivalents | | | 14,195,949 | | | | 6,501,848 | | | Unrealized (gain) loss on open futures contracts | | | (4,578,260 | ) | | | (3,923,409 | ) | | (Increase) decrease in receivable from Sponsor | | | 75,409 | | | | 6,830 | | | (Increase) decrease in interest receivable | | | (9,726 | ) | | | — | | | (Increase) decrease in directors' fees and insurance receivable | | | (3,466 | ) | | | 5,763 | | | (Increase) decrease in ETF transaction fees receivable | | | 350 | | | | — | | | Increase (decrease) in payable due to Broker | | | 631,854 | | | | — | | | Increase (decrease) in management fees payable | | | (120,777 | ) | | | 82,256 | | | Increase (decrease) in professional fees payable | | | (308,513 | ) | | | (221,413 | ) | | Increase (decrease) in brokerage commissions payable | | | (10,710 | ) | | | 11,200 | | | Increase (decrease) in directors' fees and insurance payable | | | (6,226 | ) | | | (64 | ) | | Net cash provided by (used in) operating activities | | | 9,202,066 | | | | 10,652,835 | | | | | | | | | | | | | Cash Flows from Financing Activities: | | | | | | | | | | Addition of shares | | | 43,812,376 | | | | 193,347,543 | | | Redemption of shares | | | (204,830,121 | ) | | | (57,471,182 | ) | | Net cash provided by (used in) financing activities | | | (161,017,745 | ) | | | 135,876,361 | | | | | | | | | | | | | Net Increase (Decrease) in Cash and Cash Equivalents | | | (151,815,679 | ) | | | 146,529,196 | | | | | | | | | | | | | Cash and Cash Equivalents, beginning of period | | | 608,435,196 | | | | 478,007,269 | | | Cash and Cash Equivalents, end of period | | $ | 456,619,517 | | | $ | 624,536,465 | |
Condensed Statements of Cash Flows (Unaudited) For the three months ended March 31, 2023 and 2022 United States Copper Index Fund | | | | | | | | | Three months ended | | Three months ended | | | March 31, 2023 | | March 31, 2022 | Cash Flows from Operating Activities: | | | | | | | Net income (loss) | | $ | 13,897,879 | | $ | 13,501,120 | Adjustments to reconcile net income (loss) to net cash provided by (used in) operating activities: | | | | | | | Change in unrealized (gain) loss on open commodity futures contracts | | | 1,510,979 | | | (3,840,106) | (Increase) decrease in dividends receivable | | | 146,293 | | | (16,671) | (Increase) decrease in interest receivable | | | (113,466) | | | 65 | (Increase) decrease in prepaid professional fees | | | (2,384) | | | — | (Increase) decrease in prepaid insurance* | | | (26,329) | | | (49,692) | (Increase) decrease in prepaid registration fees | | | — | | | 24,092 | (Increase) decrease in ETF transaction fees receivable | | | — | | | (350) | Increase (decrease) payable due to custody | | | — | | | — | Increase (decrease) in Management fees payable | | | (10,083) | | | 3,074 | Increase (decrease) in professional fees payable | | | (130,540) | | | (79,316) | Increase (decrease) in directors’ fees payable* | | | (94) | | | (94) | Net cash provided by (used in) operating activities | | | 15,272,255 | | | 9,542,122 | | | | | | | | Cash Flows from Financing Activities: | | | | | | | Addition of shares | | | 32,717,196 | | | 46,866,524 | Redemption of shares | | | (62,179,824) | | | (17,501,848) | Net cash provided by (used in) financing activities | | | (29,462,628) | | | 29,364,676 | | | | | | | | Net Increase (Decrease) in Cash and Cash Equivalents | | | (14,190,373) | | | 38,906,798 | | | | | | | | Total Cash, Cash Equivalents and Equity in Trading Accounts, beginning of period | | | 165,213,916 | | | 221,835,541 | Total Cash, Cash Equivalents and Equity in Trading Accounts, end of period | | $ | 151,023,543 | | $ | 260,742,339 | | | | | | | | Components of Cash, Cash Equivalents, and Equity in Trading Accounts | | | | | | | Cash and cash equivalents | | $ | 143,255,058 | | $ | 255,303,820 | Equity in Trading Accounts: | | | | | | | Cash and cash equivalents | | | 7,768,485 | | | 5,438,519 | Total Cash, Cash Equivalents and Equity in Trading Accounts | | $ | 151,023,543 | | $ | 260,742,339 |
*Certain prior year amounts have been reclassified for consistency with the current presentation. See accompanying notes to condensed financial statements. United States Commodity Index Funds Trust Condensed Statements of Cash Flows (Unaudited) For the three months ended March 31, 2023 and 2022 United States Commodity Index Funds Trust | | | | | | | | | Three months ended | | Three months ended | | | March 31, 2023 | | March 31, 2022 | Cash Flows from Operating Activities: | | | | | | | Net income (loss) | | $ | 4,961,042 | | $ | 78,734,725 | Adjustments to reconcile net income (loss) to net cash provided by (used in) operating activities: | | | | | | | Change in unrealized (gain) loss on open commodity futures contracts | | | 8,840,754 | | | (12,905,958) | (Increase) decrease in dividends receivable | | | 455,054 | | | (42,697) | (Increase) decrease in interest receivable | | | (196,313) | | | 85 | (Increase) decrease in prepaid professional fees | | | (2,384) | | | — | (Increase) decrease in prepaid insurance* | | | (79,888) | | | (94,459) | (Increase) decrease in prepaid registration fees | | | — | | | 30,708 | (Increase) decrease in ETF transaction fees receivable | | | — | | | (350) | Increase (decrease) in Management fees payable | | | (46,666) | | | 79,989 | Increase (decrease) in professional fees payable | | | (297,639) | | | (196,658) | Increase (decrease) in directors’ fees payable* | | | (663) | | | 270 | Net cash provided by (used in) operating activities | | | 13,633,297 | | | 65,605,655 | | | | | | | | Cash Flows from Financing Activities: | | | | | | | Addition of shares | | | 40,864,010 | | | 113,292,363 | Redemption of shares | | | (113,686,082) | | | (33,222,114) | Net cash provided by (used in) financing activities | | | (72,822,072) | | | 80,070,249 | | | | | | | | Net Increase (Decrease) in Cash and Cash Equivalents | | | (59,188,775) | | | 145,675,904 | | | | | | | | Total Cash, Cash Equivalents and Equity in Trading Accounts, beginning of period | | | 411,271,287 | | | 451,851,179 | Total Cash, Cash Equivalents and Equity in Trading Accounts, end of period | | $ | 352,082,512 | | $ | 597,527,083 | | | | | | | | Components of Cash, Cash Equivalents, and Equity in Trading Accounts | | | | | | | Cash and cash equivalents | | $ | 330,529,524 | | $ | 574,634,618 | Equity in Trading Accounts: | | | | | | | Cash and cash equivalents | | | 21,552,988 | | | 22,892,465 | Total Cash, Cash Equivalents and Equity in Trading Accounts | | $ | 352,082,512 | | $ | 597,527,083 |
*Certain prior year amounts have been reclassified for consistency with the current presentation. See accompanying notes to condensed financial statements. United States Commodity Index Funds Trust Notes to Condensed Financial Statements (Unaudited) For the period ended September 30, 2017 (Unaudited) March 31, 2023 NOTE 1 - —ORGANIZATION AND BUSINESS The United States Commodity Index Funds Trust (the “Trust”) was organized as a Delaware statutory trust on December 21, 2009. The Trust is a series trust formed pursuant to the Delaware Statutory Trust Act and includes the United States Commodity Index Fund (“USCI”), a commodity pool formed on April 1, 2010 and first made available to the public on August 10, 2010, and the United States Copper Index Fund (“CPER”), a commodity pool formed on November 26, 2010 and first made available to the public on November 15, 2011, and the United States Agriculture Index Fund (“USAG”), a commodity pool formed on November 26, 2010 and first made available to the public on April 13, 2012. United States Commodity Funds LLC (“USCF”), as the sponsor of the Trust and its series the United States Metals Index Fund (“USMI”), terminated USMI effective March 18, 2015 and USMI was also delisted from NYSE Arca. On March 24, 2015, USMI liquidated all its assets and distributed cash pro rata to all remaining shareholders as of such date. 2011. USCI CPER and USAGCPER each issue shares (“shares”) that may be purchased and sold on the NYSE Arca, Inc. (“NYSE Arca”). USCI CPER, and USAGCPER are collectively referred to herein as the “Trust Series.” The Trust, and each Trust Series operateof its series operates pursuant to the ThirdFourth Amended and Restated Declaration of Trust and Trust Agreement dated as of March 22, 2013December 15, 2017 (the “Trust Agreement”). USCFUnited States Commodity Funds LLC (“USCF”) is the sponsor of the Trust and the Trust Series and is also responsible for the management of the Trust and the Trust Series. For purposes of the financial statement presentation, unless specified otherwise, all references will be to the Trust Series. USCF has the power and authority to establish and designate one or more series of the Trust and to issue shares thereof, from time to time as it deems necessary or desirable. USCF has exclusive power to fix and determine the relative rights and preferences as between the shares of any series as to right of redemption, special and relative rights as to dividends and other distributions and on liquidation, conversion rights, and conditions under which the series shall have separate voting rights or no voting rights. The term for which the Trust is to exist commenced on the date of the filing of the Certificate of Trust, and the Trust and any Trust Series will exist in perpetuity, unless earlier terminated in accordance with the provisions of the Trust Agreement. Separate and distinct records must be maintained for each Trust Series and the assets associated with a Trust Series must be held in such separate and distinct records (directly or indirectly, including a nominee or otherwise) and accounted for in such separate and distinct records separately from the assets of any other Trust Series. Each Trust Series is separate from all other Trust Series created as series of the Trust in respect of the assets and liabilities allocated to that Trust Series and represents a separate investment portfolio of the Trust. In connection with the Third Amended and Restated Declaration of Trust, dated March 22, 2013, a new series of the Trust was designated on June 1, 2016, the USCF Canadian Crude Oil Index Fund (“UCCO”). UCCO is currently in registration and has not commenced operations as of the filing of this quarterly report on Form 10-Q.
The sole Trustee of the Trust is Wilmington Trust Company (the “Trustee”), a Delaware banking corporation. The Trustee is unaffiliated with USCF. The Trustee’s duties and liabilities with respect to the offering of shares and the management of the Trust are limited to its express obligations under the Trust Agreement. USCF is a member of the National Futures Association (the “NFA”) and became a commodity pool operator (“CPO”) registered with the Commodity Futures Trading Commission (the “CFTC”) effective December 1, 2005. The Trust and each Trust Series havehas a fiscal year ending on December 31. USCF is also the general partner of the United States Oil Fund, LP (“USO”), the United States Natural Gas Fund, LP (“UNG”), the United States 12 Month Oil Fund, LP (“USL”), the United States Gasoline Fund, LP (“UGA”) and the United States Diesel-Heating Oil Fund, LP (“UHN”), which listed their limited partnership shares on the American Stock Exchange (the “AMEX”) under the ticker symbols “USO” on April 10, 2006, “UNG” on April 18, 2007, “USL” on December 6, 2007, “UGA” on February 26, 2008 and “UHN” on April 9, 2008, respectively. As a result of the acquisition of the AMEX by NYSE Euronext, each of USO’s, UNG’s, USL’s, UGA’s and UHN’s shares commenced trading on the NYSE Arca on November 25, 2008. USCF is also the general partner of the United States Short Oil Fund, LP (“DNO”), the United States 12 Month Natural Gas Fund, LP (“UNL”) and the United States Brent Oil Fund, LP (“BNO”), which listed their limited partnership shares on the NYSE Arca under the ticker symbols “DNO” on September 24, 2009, “UNL” on November 18, 2009. The respective Trust Series, USO, UNG, UGA, UNL, USL and “BNO” on June 2, 2010, respectively. In addition, USCF is the sponsor of the USCF Funds Trust, a Delaware statutory trust, and each of its series, the REX S&P MLP Fund and the REX S&P MLP Inverse Fund which are currently in registration and have not commenced operations (together, the “REX Funds”), and the United States 3x Oil Fund (“USOU”) and the United States 3x Short Oil Fund (“USOD”), which commenced operations on July 20, 2017.
All funds listed previously, other than UCCO and the REX Funds,BNO are referred to collectively herein as the “Related Public Funds.”
Effective as of May 1, 2012, eachEach of USCI CPER and USAGCPER issue shares to certain authorized purchasers (“Authorized Participants”) by offering baskets consisting of 50,000 shares (“Creation Baskets”) through ALPS Distributors, Inc., as the marketing agent (the “Marketing Agent”). Prior to May 1, 2012, each of USCI, CPER and USAG issued shares to Authorized Participants by offering baskets consisting of 100,000 shares through the Marketing Agent. The purchase price for a Creation Basket is based upon the net asset value (“NAV”) of a share calculated shortly after the close of the core trading session on the NYSE Arca on the day the order to create the basket is properly received.
Authorized Participants pay USCIeach Trust Series a $350 transaction fee of $350 for each order placed to create one or more Creation Baskets or to redeem one or more baskets (“Redemption Baskets”), consisting of 50,000 shares; prior to July 1, 2011, Authorized Participants paid USCI a transaction fee of $1,000 for each order placed to create one or more Creation Baskets or to redeem one or more Redemption Baskets. Since May 1, 2012, Authorized Participants paid to CPER and USAG a transaction fee of $350 for each order placed to create one or more Creation Baskets or to redeem one or more Redemption Baskets; prior to May 1, 2012, Authorized Participants paid $1,000 for each order placed to create one or more Creation Baskets or to redeem one or more Redemption Baskets.shares. Shares may be purchased or sold on a nationally recognized securities exchange in smaller increments than a Creation Basket or Redemption Basket. Shares purchased or sold on a nationally recognized securities exchange are not purchased or sold at the per share NAV of each Trust Series but rather at market prices quoted on such exchange. The accompanying unaudited condensed financial statements have been prepared in accordance with Rule 10-01 of Regulation S-X promulgated by the U.S. Securities and Exchange Commission (the “SEC”)SEC and, therefore, do not include all information and footnote disclosure required under generally accepted accounting principles in the United States of America (“U.S. GAAP”). The financial information included herein is unaudited; however, such financial information reflects all adjustments, consisting only of normal recurring adjustments, which are, in the opinion of USCF, necessary for the fair presentation of the condensed financial statements for the interim period. NOTE 2 -— SUMMARY OF SIGNIFICANT ACCOUNTING POLICIES Basis of Presentation The condensed financial statements have been prepared in conformity with U.S. GAAP as detailed in the Financial Accounting Standards Board’s (“FASB”) Accounting Standards Codification. Each Trust Series is an investment company for accounting purposes and follows the accounting and reporting guidance in FASB Topic 946. The Trust financial statements included its respective series of fundsinclude the financial statements includingof USCI CPER, and USAGCPER through March 31, 2015.2023. For reporting commencing with the June 30, 2015December 31, 2021 reporting period, and in conjunction with the terminationliquidation of USMIthe United States Agriculture Index Fund (“USAG”) on March 18, 2015September 12, 2018, the USMIwithdrawal of the registration statement for the USCF Canadian Crude Oil Index Fund (“UCCO”) on December 19, 2018, and the withdrawal of XBET’s registration statement on June 25, 2020, the USAG and UCCO financial statements have not been included, but are included in the overall Trust financial statements for the applicable reporting periods. Revenue Recognition Commodity futures contracts, forward contracts, physical commodities and related options are recorded on the trade date. All such transactions are recorded on the identified cost basis and marked to market daily. Unrealized gains or losses on open contracts are reflected in the condensed statements of financial condition and represent the difference between the original contract amount and the market value (as determined by exchange settlement prices for futures contracts and related options and cash dealer prices at a predetermined time for forward contracts, physical commodities, and their related options) as of the last business day of the year or as of the last date of the condensed financial statements. Changes in the unrealized gains or losses between periods are reflected in the condensed statements of operations. Each Trust Series earns income on funds held at the custodian or a futures commission merchant (“FCM”) at prevailing market rates earned on such investments. Brokerage Commissions Brokerage commissions on all open commodity futures contracts are accrued on a full-turn basis. Income Taxes The Trust Series are not subject to federal income taxes; each investor reports his/her allocable share of income, gain, loss deductions or credits on his/her own income tax return. In accordance with U.S. GAAP, each Trust Series is required to determine whether a tax position is more likely than not to be sustained upon examination by the applicable taxing authority, including resolution of any tax related appeals or litigation processes, based on the technical merits of the position. Each Trust Series files an income tax return in the U.S. federal jurisdiction and may file income tax returns in various U.S. states. None of the Trust Series is subject to income tax return examinations by major taxing authorities for years before 2014.2019. The tax benefit recognized is measured as the largest amount of benefit that has a greater than fifty percent likelihood of being realized upon ultimate settlement. De-recognition of a tax benefit previously recognized results in each Trust Series recording a tax liability that reduces net assets. However, each Trust Series’ conclusions regarding this policy may be subject to review and adjustment at a later date based on factors including, but not limited to, on-going analysis of and changes to tax laws, regulations and interpretations thereof. Each Trust Series recognizes interest accrued related to unrecognized tax benefits and penalties related to unrecognized tax benefits in income tax fees payable, if assessed. No interest expense or penalties have been recognized as of and for the period ended September 30, 2017March 31, 2023 for any Trust Series. Trust Capital and AllocationTable of Income and Losses
Profit or loss shall be allocated among the shareholders of each Trust Series in proportion to the number of shares each investor holds as of the close of each month. USCF may revise, alter or otherwise modify this method of allocation as described in the Trust Agreement.
Creations and Redemptions Effective as of May 1, 2012, Authorized Participants may purchase Creation Baskets or redeem Redemption Baskets for USCI CPER and USAGCPER only in blocks of 50,000 shares at a price equal to the NAV of the shares calculated shortly after the close of the core trading session on the NYSE Arca on the day the order is placed. Each Trust Series receives or pays the proceeds from shares sold or redeemed within threetwo business days after the trade date of the purchase or redemption. The amounts due from Authorized Participants are reflected in each Trust Series’ condensed statements of financial condition as receivable for shares sold and amounts payable to Authorized Participants upon redemption are reflected as payable for shares redeemed. Authorized Participants pay each Trust Series a $350 transaction fee of $350 for each order placed to create one or more Creation Baskets or to redeem one or more Redemption Baskets. Trust Capital and Allocation of Income and Losses Profit or loss shall be allocated among the shareholders of each Trust Series in proportion to the weighted-average number of shares each investor holds as of the close of each month. USCF may revise, alter or otherwise modify this method of allocation as described in the Trust Agreement. Calculation of Per Share NAV Each Trust Series’ per share NAV is calculated on each NYSE Arca trading day by taking the current market value of its total assets, subtracting any liabilities and dividing thethat amount by the total number of shares issued and outstanding. Each Trust Series uses the closing prices on the relevant Futures Exchanges (as defined in Note 3 below) of the Applicable Benchmark Component Futures Contracts (as defined in Note 3 below) that at any given time make up the Applicable Index (as defined in Note 3 below) (determined at the earlier of the close of such exchange or 2:30 p.m. New York time) for the contracts traded on the Futures Exchanges, but calculates or determines the value of all other investments of each Trust Series using market quotations, if available, or other information customarily used to determine the fair value of such investments. Net Income (Loss) Per Share Net income (loss) per share is the difference between the per share NAV at the beginning of each period and the per share NAV at the end of each period. The weighted average number of shares outstanding was computed for purposes of disclosing net income (loss) per weighted average share. The weighted average shares are equal to the number of shares outstanding at the end of the period, adjusted proportionately for shares added and redeemed based on the amount of time the shares were outstanding during such period. As of September 30, 2017,March 31, 2023, USCF held 5 shares of USCI and 40 shares of CPER, and 5 shares of USAG. as a limited partner. Offering Costs Offering costs incurred in connection with the registration of shares prior to the commencement of the offering are borne by USCF. Offering costs incurred in connection with the registration of additional shares after the commencement of the offering are borne by each Trust Series. These costs include registration fees paid to regulatory agencies and all legal, accounting, printing and other expenses associated with such offerings. Costs borne by the Trust Series after the commencement of an offering are accounted for as a deferred charge and thereafter amortized to expense over twelve months on a straight-line basis or a shorter period if warranted. Cash Equivalents Cash equivalents include money market funds and overnight deposits or time deposits with original maturity dates of six months or less. Reclassifications
Reclassification Certain prior year amounts have beenin the accompanying condensed financial statements were reclassified to conform to the current year presentation. Use of Estimates The preparation of condensed financial statements in conformity with U.S. GAAP requires USCF to make estimates and assumptions that affect the reported amount of assets and liabilities and disclosure of contingent assets and liabilities at the date of the condensed financial statements, and the reported amounts of the revenue and expenses during the reporting period. Actual results may differ from those estimates and assumptions. NOTE 3 -— TRUST SERIES In connection with the execution of the First Trust Agreement on April 1, 2010, USCI was designated as the first series of the Trust. USCF contributed $1,000 to the Trust upon its formation on December 21, 2009, representing an initial contribution of capital to the Trust. Following the designation of USCI as the first series of the Trust, the initial capital contribution of $1,000 was transferred from the Trust to USCI and deemed an initial contribution to USCI. In connection with the commencement of USCI’s initial offering of shares, USCF received 20 Sponsor Shares of USCI in exchange for the previously received capital contribution, representing a beneficial ownership interest in USCI.
On July 30, 2010, USCI received a notice of effectiveness from the U.S. Securities and Exchange Commission (the “SEC”)SEC for its registration of 50,000,000 shares on Form S-1 with the SEC. On August 10, 2010, USCI listed its shares on the NYSE Arca under the ticker symbol “USCI.”“USCI”. USCI established its’its initial per share NAV by setting the price at $50.00 and issued 100,000 shares in exchange for $5,000,000 on August 10, 2010. USCI also commenced investment operations on August 10, 2010 by purchasing Futures Contracts traded on the Futures Exchanges. In order to satisfy NYSE Arca listing standards that at least 100,000 shares be outstanding at the beginning of the trading day on the NYSE Arca, USCF purchased the initial Creation Basket from the initial Authorized Participant at the initial offering price. The $1,000 fee that would otherwise be charged to the Authorized Participant in connection with an order to create or redeem was waived in connection with the initial Creation Basket. USCF held such initial Creation Basket until September 3, 2010, at which time the initial Authorized Participant repurchased the shares comprising such basket in accordance with the specified conditions noted above. On September 14, 2011, USCF redeemed the 20 Sponsor Shares of USCI and, on September 19, 2011, USCF purchased five5 shares of USCI in the open market. In connection with the Second Amended and Restated Trust Agreement dated November 10, 2010, USMI, USAG and CPER werewas designated as three additional series of the Trust. USCF and the Trustee entered into the Fourth Amended and Restated Declaration of Trust and Trust Agreement effective as of December 15, 2017. Following the designation of theCPER as an additional series, USCF made an initial capital contribution of $3,000 was transferred from USCF to the Trust. OnTrust and on November 10, 2010, the Trust transferred $1,000 to each of USMI, USAG and CPER, which was deemed a capital contribution to eachthe series. On November 14, 2011, USCF received 40 Sponsor Shares of CPER in exchange for the previously received capital contribution, representing a beneficial interest in CPER. On December 7, 2011, USCF redeemed the 40 Sponsor Shares of CPER and purchased 40 shares of CPER in the open market. On April 13, 2012, USCF received 40 Sponsor Shares of USAG in exchange for the previously received capital contribution, representing a beneficial interest in USAG. On June 28, 2012, USCF redeemed the 40 Sponsor Shares of USAG and on October 3, 2012, purchased 5 shares of USAG on the open market. On June 10, 2012, USCF received 40 Sponsor Shares of USMI in exchange for the previously received capital contribution, representing a beneficial interest in USMI. On August 27, 2012, USCF redeemed the 40 Sponsor Shares of USMI and on September 4, 2013, purchased 5 shares of USMI on the open market. On March 18, 2015, all Sponsor Shares of USMI were redeemed and USMI discontinued trading. CPER and USAG received notice of effectiveness from the SEC for its registration of 30,000,000 CPER shares and 20,000,000 USAG shares on September 6, 2011. The order to permit listing CPER and USAG on the NYSE Arca was received on October 20, 2011. On November 15, 2011, CPER listed its shares on the NYSE Arca under the ticker symbol “CPER.” CPER established its initial per share NAV by setting the price at $25 and issued 100,000 shares to the initial Authorized Participant, Merrill Lynch Professional Clearing Corp., in exchange for $2,500,000 in cash on November 15, 2011. The $1,000 fee that would otherwise be charged to the Authorized Participant in connection with an order to create or redeem was waived in connection with the initial Creation Basket. On April 13, 2012, USAG listed its shares on the NYSE Arca under the ticker symbol “USAG.” USAG established its initial per share NAV by setting the price at $25. On April 14, 2012, USCF purchased two initial Creation Baskets of USAG. In accordance with applicable requirements of Regulation M under the Securities Exchange Act of 1934, as amended, (“Exchange Act”), no Creation Baskets were offered to Authorized Participants nor were the shares listed on the NYSE Arca until five business days had elapsed from the date of USCF’s purchase of the initial Creation Basket on April 4, 2012. The $1,000 fee that would have otherwise been charged in connection with an order to create or redeem was waived in connection with the initial Creation Basket.
In connection with the Third Amended and Restated Declaration of Trust, dated March 22, 2013, a new series of the Trust was designated on June 1, 2016, the USCF Canadian Crude Oil Index Fund (“UCCO”). UCCO is currently in registration and has not commenced operations as of the filing of this quarterly report on Form 10-Q.
USCI’s Investment Objective USCI invests in futures contracts for commodities that are currently traded on the New York Mercantile Exchange (the “NYMEX”), ICE Futures (“ICE Futures”), Chicago Board of Trade (“CBOT”), Chicago Mercantile Exchange (“CME”), London Metal Exchange (“LME”), Commodity Exchange, Inc. (“COMEX”) or on other foreign exchanges (the NYMEX, ICE Futures, CBOT, CME, LME, COMEX and other foreign exchanges, collectively, the “Futures Exchanges”) (such futures contracts, collectively, “Futures Contracts”) and, to a lesser extent, in order to comply with regulatory requirements or in view of market conditions, other commodity-based contracts and instruments such as cash-settled options on Futures Contracts, forward contracts relating to commodities, cleared swap contracts and other non-exchange traded over-the-counter (“OTC”) transactions that are based on the price of commodities and Futures Contracts (collectively, “Other Commodity-Related Investments”). Market conditions that USCF currently anticipates could cause USCI to invest in Other Commodity Related Investments would be those allowing USCI to obtain greater liquidity or to execute transactions with more favorable pricing. Futures Contracts and Other Commodity-Related Investments collectively are referred to as “Commodity Interests.”
The investment objective of USCI is for the daily changes in percentage terms of its shares’ per share NAVnet asset value (“NAV”) to reflect the daily changes in percentage terms of the SummerHaven Dynamic Commodity Index Total ReturnSM (the “SDCI”), less USCI’s expenses. USCF does not intend to operate USCI in a fashion such that its per share NAV will equal, in dollar terms, the spot prices of the commodities underlying the Benchmark Component Futures Contracts (as defined below) that comprise the SDCI or the prices of any particular group of Futures Contracts. USCI will not seekseeks to achieve its stated investment objective over aby investing so that the average daily percentage change in USCI’s NAV for any period of time greater than one day. USCI believes that it is not practical to manage30 successive valuation days will be within plus/minus ten percent (10%) of the portfolio to achieve such an investment goal when investingaverage daily percentage change in Futures Contracts and Other Commodity-Related Investments. the price of the SDCI over the same period. The SDCI is designed to reflect the performance of a diversified group of commodities. The SDCI is comprisedowned and maintained by SummerHaven Index Management, LLC (“SHIM”) and is calculated and published by Bloomberg L.P. Futures contracts for the commodities comprising the SDCI are traded on the New York Mercantile Exchange (“NYMEX”), ICE Futures (“ICE Futures”), Chicago Board of Trade (“CBOT”), Chicago Mercantile Exchange (“CME”), London Metal Exchange (“LME”), and Commodity Exchange, Inc. (“COMEX” together with the NYMEX, ICE Futures, Contracts thatCBOT, CME and LME, the “Futures Exchanges”) and are selected on a monthly basis from a list of 27 possible Futurescollectively referred to herein as “Futures Contracts.” The Futures Contracts that at any given time make up the SDCI are referred to herein as “Benchmark Component Futures Contracts.” The SDCI is owned and maintainedrelative weighting of the Benchmark Component Futures Contracts will change on a monthly basis, based on quantitative formulas relating to the prices of the Benchmark Component Futures Contracts developed by SummerHaven Index Management, LLC (“SHIM”) and calculated and publishedSHIM. USCI seeks to achieve its investment objective by Bloomberg, L.P. USCI invests firstinvesting to the fullest extent possible in the current ApplicableBenchmark Component Futures Contracts. Then, if constrained by regulatory requirements or in view of market conditions, USCI will invest next in other Futures Contracts based on the same commodity as the futures contracts subject to such regulatory constraints or market conditions, and finally, to a lesser extent, in other exchange-traded futures contracts that are economically identical or substantially similar to the Benchmark Component Futures Contracts if one or more other Futures Contracts is not available. When USCI has invested to the fullest extent possible in exchange-traded futures contracts, USCI may then invest in other contracts and instruments based on the Benchmark Component Futures Contracts, other Futures Contracts or the commodities included in the SDCI, such as cash-settled options, forward contracts, cleared swap contracts and swap contracts other than cleared swap contracts. Other exchange-traded futures contracts that are economically identical or substantially similar to the Benchmark Component Futures Contracts and other contracts and instruments based on the Benchmark Component Futures Contracts are collectively referred to as “Other Commodity-Related Investments,” and together with Benchmark Component Futures Contracts and other Futures Contracts, intended“Commodity Interests.” USCI seeks to replicateachieve its investment objective by investing so that the returnaverage daily percentage change in USCI’s NAV for any period of 30 successive valuation days will be within plus/minus ten percent (10%) of the average daily percentage change in the price of the SDCI over the same period. USCF believes that the market arbitrage opportunities will cause the daily changes in USCI’s share price on the currentNYSE Arca on a percentage basis to closely track the daily changes in USCI’s per share NAV on a percentage basis. USCF believes that the net effect of this expected relationship and the expected relationship described above between USCI’s per share NAV and the SDCI will be that the daily changes in the price of USCI’s shares on the NYSE Arca on a percentage basis will closely track the daily changes in the SDCI on a percentage basis, less USCI’s expenses. While USCI is composed of Benchmark Component Futures Contracts and thereafter may hold Futures Contracts inis therefore a particular commodity other than one specified asmeasure of the prices of the corresponding commodities comprising the SDCI for future delivery, there is nonetheless expected to be a reasonable degree of correlation between the SDCI and the cash or spot prices of the commodities underlying the Benchmark Component Futures Contract,Contracts. Investors should be aware that USCI’s investment objective is not for its NAV or may hold Other Commodity-Related Investments that are intendedmarket price of shares to replicateequal, in dollar terms, the return onspot prices of the Benchmark Component Futures Contracts, but may fail to closely track the SDCI’s total return movements. If USCI increases in size, and due to its obligations to comply with regulatory limits or due to other market pricing or liquidity factors, USCI may invest in Futures Contract months other than the designated month specified ascommodities underlying the Benchmark Component Futures Contracts or the prices of any particular group of futures contracts. USCI will not seek to achieve its stated investment objective over a period of time greater than one day. This is because natural market forces called contango and backwardation have impacted the total return on an investment in Other Commodity-Related Investments,USCI’s shares during the past year relative to a hypothetical direct investment in the various commodities and, in the future, it is likely that the relationship between the market price of USCI’s shares and changes in the spot prices of the underlying commodities will continue to be so impacted by contango and backwardation. (It is important to note that the disclosure above ignores the potential costs associated with physically owning and storing the commodities, which may have the effect of increasing transaction related expenses and may result in increased tracking error.
could be substantial.) USCI’s shares began trading on August 10, 2010. As of September 30, 2017,March 31, 2023, USCI held 1,631572 Futures Contracts on the NYMEX, 2,241held 1,719 Futures Contracts on the ICE Futures, 1,379held 1,038 Futures Contracts on the CBOT, 460held 227 Futures Contracts on the CME, 3,943held 1,097 Futures Contracts on the LME and 735did not hold any Futures Contracts on the COMEX, totaling 10,3894,653 futures contracts. CPER’s Investment Objective The investment objective of CPER is for the daily changes in percentage terms of its shares’ per share NAV to reflect the daily changes in percentage terms of the SummerHaven Copper Index Total ReturnSM (the “SCI”), plus interest earned on CPER’s collateral holdings, less CPER’s expenses. USCF does not intendCPER seeks to operate CPERachieve its investment objective by investing so that the average daily percentage change in a fashion such that its per shareCPER’s NAV for any period of 30 successive valuation days will equal, in dollar terms, the spot pricesbe within plus/minus 10 percent (10%) of the commodities underlyingaverage daily percentage change in the price of the Benchmark Component Copper Futures Contracts (as defined below) that compriseover the SCI or the prices of any particular group of Futures Contracts. CPER will not seek to achieve a stated investment objective over a period of time greater than one day. USCF believes that it is not practical to manage the portfolio to achieve such an investment goal when investing in Futures Contracts and Other Copper-Related Investments (as defined below). same period. The SCI is designed to reflect the performance of the investment returns from a portfolio of copper futures contracts.contracts on the COMEX. The SCI is owned and maintained by SHIM and calculated and published by the NYSE Arca. The SCI is comprised of either twoone or three Eligible Copper Futures Contracts that are selected on a monthly basis based on quantitative formulas relating to the prices of the Eligible Copper Futures Contracts developed by SHIM. The Eligible Copper Futures Contracts that at any given time make up the SCI are referred to herein as “Benchmark Component Copper Futures Contracts.” CPER seeks to achieve its investment objective by investing to the fullest extent possible in the Benchmark Component Copper Futures Contracts. Then, if constrained by regulatory requirements or in view of market conditions, CPER will invest next in other Eligible Copper Futures Contracts based on the same copper as the futures contracts subject to such regulatory constraints or market conditions, and finally to a lesser extent, in other exchange traded futures contracts that are economically identical or substantially similar to the Benchmark Component Copper Futures Contracts if one or more other Eligible Copper Futures Contracts is not available. When CPER has invested to the fullest extent possible in exchange-traded futures contracts, CPER may then invest in other contracts and instruments based on the Benchmark Component Copper Futures Contracts, other Eligible Copper Futures Contracts or other items based on copper, such as cash-settled options, forward contracts, cleared swap contracts and swap contracts other than cleared swap contracts. Other exchange-traded futures contracts that are economically identical or substantially similar to the Benchmark Component Copper Futures Contracts and other contracts and instruments based on the Benchmark Component Copper Futures Contracts, are collectively referred to collectively as “Other Copper-Related Investments,” and together with Benchmark Component Copper Futures Contracts and other Eligible Copper Futures Contracts, “Copper Interests.” CPER seeks to achieve its investment objective by investing so that the average daily percentage change in CPER’s shares began trading on November 15, 2011. AsNAV for any period of September 30 2017, CPER held 103successive valuation days will be within plus/minus ten percent (10%) of the average daily percentage change in the price of the Benchmark Component Copper Futures Contracts over the same period. USCF believes that market arbitrage opportunities will cause daily changes in CPER’s share price on the COMEX. USAG’s Investment Objective
The investment objective of USAG is forNYSE Arca on a percentage basis, to closely track the daily changes in percentage terms of its shares’CPER’s per share NAV to reflecton a percentage basis. USCF believes that the net effect of this expected relationship and the expected relationship described above between CPER’s per share NAV and the SCI will be that the daily changes in the price of CPER’s shares on the NYSE Arca on a percentage termsbasis will closely track the daily changes in the SCI on a percentage basis, less CPER’s expenses. While CPER is composed of Benchmark Component Copper Futures Contracts and is therefore a measure of the SummerHaven Dynamic Agriculture Index Total ReturnSM (the “SDAI”), less USAG’s expenses. USCF doesprices of the corresponding commodities comprising the SCI for future delivery, there is nonetheless expected to be a reasonable degree of correlation between the SCI and the cash or spot prices of the commodities underlying the Benchmark Component Copper Futures Contracts.
Investors should be aware that CPER’s investment objective is not intendfor its NAV or market price of shares to operate USAG in a fashion such that its per share NAV will equal, in dollar terms, the spot prices of the commodities underlying the Benchmark Component AgricultureCopper Futures Contracts (as defined below) that comprise the SDAI or the prices of any particular group of Futures Contracts. USAGfutures contracts. CPER will not seek to achieve its stated investment objective over a period of time greater than one day. USCF believes thatThis is because natural market forces called contango and backwardation have impacted the total return on an investment in CPER’s shares during the past year relative to a hypothetical direct investment in various commodities and, in the future, it is not practical to managelikely that the portfolio to achieve such an investment goal when investingrelationship between the market price of CPER’s shares and changes in Futures Contracts and Other Agriculture-Related Investments (as defined below). The SDAI is designed to reflect the performance of a diversified group of agricultural commodities. The SDAI is owned and maintained by SHIM and calculated and published by the NYSE Arca. Futures contracts for the agricultural commodities comprising the SDAI are traded on ICE Future US, ICE Futures Canada, the CBOT, the Kansas City Board of Trade (“KCBT”) and the CME and are collectively referred to herein as “Eligible Agriculture Futures Contracts.” The SDAI is comprised of 14 Eligible Agriculture Futures Contracts that are selected on a monthly basis based on quantitative formulas developed by SHIM. The Eligible Agriculture Futures Contracts that at any given time make up the SDAI are referred to herein as “Benchmark Component Agriculture Futures Contracts.” The relative weighting of the Benchmark Component Agriculture Futures Contracts will change on a monthly basis, based on quantitative formulas relating to thespot prices of the Benchmark Component Agriculture Futures Contracts developedunderlying commodities will continue to be so impacted by SHIM. USAG seekscontango and backwardation. (It is important to achieve its investment objective by investing tonote that the fullest extent possible indisclosure above ignores the Benchmark Component Agriculture Futures Contracts. Then, if constrained by regulatory requirements or in view of market conditions, USAG will invest next in other Eligible Agriculture Futures Contracts based onpotential costs associated with physically owning and storing the same agricultural commodity as the futures contracts subject to such regulatory constraints or market conditions, and finally, to a lesser extent, in other exchange traded futures contracts that are economically identical or substantially similar to the Benchmark Component Agriculture Futures Contracts if one or more other Eligible Agriculture Futures Contracts is not available. When USAG has invested to the fullest extent possible in exchange-traded futures contracts, USAG may then invest in other contracts and instruments based on the Benchmark Component Agriculture Futures Contracts, other Eligible Agriculture Futures Contracts or the agricultural commodities, included in the SDAI, such as cash-settled options, forward contracts, cleared swap contracts and swap contracts other than cleared swap contracts. Other exchange-traded futures contracts that are economically identical or substantially similar to the Benchmark Component Agriculture Futures Contracts and other contracts and instruments based on the Benchmark Component Agriculture Futures Contracts, as well as metals included in the SDAI, are collectively referred to as “Other Agriculture-Related Investments,” and together with Benchmark Component Agriculture Futures Contracts and other Eligible Agriculture Futures Contracts, “Agriculture Interests.” USAG’swhich could be substantial.) CPER’s shares began trading on April 13, 2012.November 15, 2011. As of September 30, 2017, USAGMarch 31, 2023, CPER held 341,500 Futures Contracts on the ICE Futures, 30 Futures Contracts on the CBOT, 7 Futures Contracts on the CME, and 2 Futures Contracts on the KCBT, totaling 73 futures contracts.COMEX.
Other Defined Terms – Trust Series The SDCI the SCI and the SDAISCI are referred to throughout these Notes to Condensed Financial Statements collectively as the “Applicable Index” or “Indices.” Benchmark Component Futures Contracts, Benchmark Component Copper Futures Contracts and Benchmark Component AgricultureCopper Futures Contracts are referred to throughout these Notes to Condensed Financial Statements collectively as “Applicable Benchmark Component Futures Contracts.” Other Commodity-Related Investments and Other Copper-Related Investments and Other Agriculture-Related Interests are referred to throughout these Notes to Condensed Financial Statements collectively as “Other Related Investments.” Trading Advisor and Trustee The Trust Series’ trading advisor is SummerHaven Investment Management, LLC (“SummerHaven”), a Delaware limited liability company that is registered as a commodity trading advisor and CPO with the CFTC and is a member of the NFA. In addition, SummerHaven is registered as an investment adviser under the Investment Advisers Act of 1940 with the SEC. SummerHaven provides advisory services to USCF with respect to the Applicable Index of each Trust Series and the investment decisions of each Trust Series. The Trustee accepts service of legal process on the Trust in the State of Delaware and makes certain filings under the Delaware Statutory Trust Act. The Trustee does not owe any other duties to the Trust, USCF or the shareholders. NOTE 4 -— FEES PAID BY EACH TRUST SERIES AND RELATED PARTY TRANSACTIONS USCF Management Fee Under the Trust Agreement, USCF is responsible for investing the assets of each Trust Series in accordance with the objectives and policies of each such Trust Series. In addition, USCF has arranged for one or more third parties to provide trading advisory, administrative, custody, accounting, transfer agency and other necessary services to each Trust Series. For these services, each of USCI CPER and USAGCPER is contractually obligated to pay USCF a fee, which is paid monthly, equal to 0.95% per annum of average daily total net assets. Effective January 1, 2016, USCF permanently lowered the management fee toof 0.80% (80 basis points) per annum of average daily total net assets for USCI and 0.65% (65 basis points) per annum of average daily total net assets for both CPER and USAG, respectively. CPER. Trustee Fee The Trustee is the Delaware trustee of the Trust. In connection with the Trustee’s services, USCF is responsible for paying the Trustee’s annual fee in the amount of $3,000. $3,300. Ongoing Registration Fees and Other Offering Expenses Each Trust Series pays the costs and expenses associated with the ongoing registration of its shares subsequent to the initial offering. These costs include registration or other fees paid to regulatory agencies in connection with the offer and sale of shares, and all legal, accounting, printing and other expenses associated with such offer and sale. DuringFor the ninethree months ended September 30, 2017March 31, 2023 and 2016, no Trust Series2022, USCI incurred any$0 and $6,617 respectively, in registration fees or otherand offering expenses. For the three months ended March 31, 2023 and 2022, CPER incurred $0 and $24,092 respectively, in registration fees and offering expenses. On April 30, 2021, 10,000,000 additional shares were registered for USCI and 50,000,000 additional shares were registered for CPER. On January 27, 2023 the SEC declared effective registration statements filed by each of USCI and CPER that registered an unlimited number of shares. As a result, USCI and CPER each have an unlimited number of shares that can be issued in the form of Creation Baskets. Independent Directors’ and Officers’ Expenses Each Trust Series is responsible for paying its portion of the directors’ fees and directors’ and officers’ liability insurance for such Trust Series and the other Related Public Funds. Each Trust Series shares the fees and expenses on a pro rata basis with each other Trust Series and each other Related Public Fund, as described above, based on the relative assets of each fund computed on a daily basis. These fees and expenses for the year endedending December 31, 2017,2023 are estimated to be a total of $539,350$1,210,000 for the Trust Series and the other Related Public Funds. USCI’s portion of such fees and expenses for the year endedending December 31, 2017 are2023 is estimated to be a total of $71,700,$91,000 and CPER’s portion of such fees and expenses for the year endedending December 31, 2017 are2023 is estimated to be a total of $1,500 and USAG’s portion of such fees and expenses for year ended December 31, 2017 are estimated to be a total of $1,500.$56,000.
Investor Tax Reporting Cost The fees and expenses associated with each Trust Series’ audit expenses and tax accounting and reporting requirements are paid by such Trust Series. These costs are estimated to be $620,000$215,000 and for the year endedending December 31, 20172023 for USCI $48,000and $250,000 for the year endedending December 31, 20172023 for CPER, and $43,000 for the year ended December 31, 2017 for USAG.CPER. Tax reporting costs fluctuate between years due to the number of shareholders during any given year. Other Expenses and Fees and Expense Waivers In addition to the fees described above, each Trust Series pays all brokerage fees and other expenses in connection with the operation of such Trust Series, excluding costs and expenses paid by USCF as outlined inNote 5–5 – Contracts and Agreements below. In addition, USCF payspreviously paid certain expenses normally borne by each of CPER and USAG to the extent that such expenses exceed 0.15% (15 basis points) of each of CPER’s and USAG’s NAV, on an annualized basis. USCF has no obligation to continueterminated such payments into subsequent periods. For the nine months ended September 30, 2017, USCF waived $35,579 in expenses for CPER and $36,825 for USAG. This voluntary expense waiver is in addition to those amounts USCF is contractually obligated to pay as described inNote 5 – Contracts and Agreements below.of April 30, 2021. NOTE 5 –— CONTRACTS AND AGREEMENTS Marketing Agent Agreement USCF and the Trust, each on its own behalf and on behalf of each Trust Series, are party to a marketing agent agreement, dated as of July 22, 2010, as amended from time to time, with the Marketing Agent, whereby the Marketing Agent provides certain marketing services for each Trust Series as outlined in the agreement. TheThrough September 30, 2022, the fee of the Marketing Agent, which is borne by USCF, iswas equal to 0.06% on each Trust Series’ assets up to $3 billion and 0.04% on each Trust Series’ assets in excess of $3 billion. The agreement with the Marketing Agent has been amended and, commencing October 1, 2022, the fee of the Marketing Agent, which is calculated daily and payable monthly and borne by USCF, is equal to 0.10% of USCI’s total net assets and 0.025% of CPER’s total net assets. In no event may the aggregate compensation paid to the Marketing Agent and any affiliate of USCF for distribution relateddistribution-related services exceed 10% of the gross proceeds of each Trust Series’ offering. The above fee does not include website construction and development costs, which are also borne by USCF. Brown Brothers Harriman & Co.Custody, Transfer Agency and Fund Administration and Accounting Services Agreements
USCF andengaged The Bank of New York Mellon, a New York corporation authorized to do a banking business (“BNY Mellon”), to provide the Trust on its own behalfSeries and on behalfeach of each Trust Series, are also partythe other Related Public Funds with certain custodial, administrative and accounting, and transfer agency services, pursuant to a custodian agreement,the following agreements with BNY Mellon dated July 22, 2010, as amended from time to time, with Brown Brothers Harriman & Co. (“BBH&Co.”of March 20, 2020 (together, the “BNY Mellon Agreements”), whereby BBH&Co. holds investments on behalfwhich were effective as of each Trust Series.April 1, 2020: (i) a Custody Agreement; (ii) a Fund Administration and Accounting Agreement; and (iii) a Transfer Agency and Service Agreement. USCF pays the fees of the custodian, which are determined by the parties from time to time. In addition, USCF and the Trust, on its own behalf and on behalf of each Trust Series, are party to an administrative agency agreement, dated July 22, 2010, as amended from time to time, with BBH&Co., whereby BBH&Co. acts as the administrative agent, transfer agent and registrar for each Trust Series. USCF also pays the fees of BBH&Co.BNY Mellon for its services under such agreementthe BNY Mellon Agreements and such fees are determined by the parties from time to time. Currently, USCF pays BBH&Co. for its services, in the foregoing capacities, a minimum amount of $75,000 annually for its custody, fund accounting and fund administration services rendered to each Trust Series and each of the Related Public Funds, as well as a $20,000 annual fee for its transfer agency services. In addition, USCF pays BBH&Co. an asset-based charge of: (a) 0.06% for the first $500 million of the Related Public Funds’ combined net assets, (b) 0.0465% for the Related Public Funds’ combined net assets greater than $500 million but less than $1 billion, and (c) 0.035% once the Related Public Funds’ combined net assets exceed $1 billion. The annual minimum amount will not apply if the asset-based charge for all accounts in the aggregate exceeds $75,000. USCF also pays BBH&Co. transaction fees ranging from $7 to $15 per transaction.
Brokerage and Futures Commission Merchant Agreements On July 7, 2014, theThe Trust, on behalf of each Trust Seriesof USCI and CPER, entered into a Futures and Cleared SwapsDerivatives Transactions Customer Account Agreement with Wells Fargo Securities,RBC Capital Markets LLC (“WFS”RBC”). WFS is, in June of 2018. The Trust, on behalf of each of USCI and CPER, entered into a Commodity Futures Customer Agreement with Marex North America, LLC (“MNA”), in August of 2021. RBC and MNA are each referred to as thea “Futures Commissions Merchant” or “FCM.” The agreements with the FCMs for each Trust Series require the FCMFCMs to provide services to eachthe applicable Trust Series in connection with the purchase and sale of Futures Contracts and Other Related Investments that may be purchased and sold by or through the applicable FCM for eachthe applicable Trust Series’ account. In accordance with theeach agreement, the FCM charges eachthe applicable Trust Series commissions of approximately $7 to $8 per round-turn trade, including applicable exchange, clearing and NFA fees for Futures Contracts and options on Futures Contracts. Such fees include those incurred when purchasing Futures Contracts and options on Futures Contracts when each Trust Series issues shares as a result of a Creation Basket, as well as fees incurred when selling Futures ContactsContracts and options on Futures Contracts when each Trust Series redeems shares as a result of a Redemption Basket. Such fees are also incurred when Futures Contracts and options on Futures Contracts are purchased or redeemed for the purpose of rebalancing the portfolio. Each Trust Series also incurs commissions to brokers for the purchase and sale of Futures Contracts, Other Commodity-Related Investments or short-term obligations of the United States of two years or less (“Treasuries”).
USCI | | | | | | | | | | Three months ended | | Three months ended | | | | March 31, 2023 | | March 31, 2022 | | Total commissions accrued to brokers | | $ | 54,445 | | $ | 51,836 | | Total commissions as annualized percentage of average total net assets | | | 0.10 | % | | 0.07 | % |
| | | For the nine
months ended
September 30,
2017 | | | For the nine
months ended
September 30,
2016 | | | Total commissions accrued to brokers | | $ | 441,006 | | | $ | 607,696 | | | Total commissions as an annualized percentage of average total net assets | | | 0.11 | % | | | 0.14 | % | | Commissions accrued as a result of rebalancing | | $ | 421,225 | | | $ | 584,776 | | | Percentage of commissions accrued as a result of rebalancing | | | 95.51 | % | | | 96.23 | % | | Commissions accrued as a result of creation and redemption activity | | $ | 19,781 | | | $ | 22,920 | | | Percentage of commissions accrued as a result of creation and redemption activity | | | 4.49 | % | | | 3.77 | % |
The decreaseincrease in USCI’s total commissions accrued to brokers for the ninethree months ended September 30, 2017,March 31, 2023, compared to the ninethree months ended September 30, 2016,2022, was due primarily due to a decrease in thehigher number of contracts traded during the rebalancing periods.held and traded. CPER | | | | | | | | | | Three months ended | | Three months ended | | | | March 31, 2023 | | March 31, 2022 | | Total commissions accrued to brokers | | $ | 16,912 | | $ | 11,366 | | Total commissions as annualized percentage of average total net assets | | | 0.04 | % | | 0.02 | % |
| | | For the nine
months ended
September 30,
2017 | | | For the nine
months ended
September 30,
2016 | | | Total commissions accrued to brokers | | $ | 4,144 | | | $ | 1,242 | | | Total commissions as an annualized percentage of average total net assets | | | 0.05 | % | | | 0.06 | % | | Commissions accrued as a result of rebalancing | | $ | 3,214 | | | $ | 1,146 | | | Percentage of commissions accrued as a result of rebalancing | | | 77.56 | % | | | 92.27 | % | | Commissions accrued as a result of creation and redemption activity | | $ | 930 | | | $ | 96 | | | Percentage of commissions accrued as a result of creation and redemption activity | | | 22.44 | % | | | 7.73 | % |
CPER’sThe increase in total commissions accrued to brokers for the ninethree months ended September 30, 2017,March 31, 2023, compared to the ninethree months ended September 30, 2016, increasedMarch 31, 2022, was due primarily to thea higher level of creation and redemption activity during the nine month period.
USAG
| | | For the nine
months ended
September 30,
2017 | | | For the nine
months ended
September 30,
2016 | | | Total commissions accrued to brokers | | $ | 1,513 | | | $ | 1,788 | | | Total commissions as an annualized percentage of average total net assets | | | 0.11 | % | | | 0.12 | % | | Commissions accrued as a result of rebalancing | | $ | 1,513 | | | $ | 1,788 | | | Percentage of commissions accrued as a result of rebalancing | | | 100.00 | % | | | 100.00 | % | | Commissions accrued as a result of creation and redemption activity | | $ | — | | | $ | — | | | Percentage of commissions accrued as a result of creation and redemption activity | | | — | % | | | — | % |
USAG’s total commissions accrued to brokers for the nine months ended September 30, 2017, compared to the nine months ended September 30, 2016, decreased slightly due to the lower number of contracts traded during the rebalancing periods.
held and traded. SummerHaven Agreements USCF is party to an Amended and Restated Advisory Agreement, dated Julyas of May 1, 2011,2018, as amended from time to time, with SummerHaven, whereby SummerHaven provides advisory services to USCF with respect to the Applicable Index for each Trust Series and investment decisions for each Trust Series. SummerHaven’s advisory services include, but are not limited to, general consultation regarding the calculation and maintenance of the Applicable Index for each Trust Series anticipated changes to each Applicable Index and the nature of each Applicable Index’s current or anticipated component securities.investments. For these services, USCF pays SummerHaven a fee based on a percentage of the average total net assets of each Trust Series. For USCI,USCF pays SummerHaven an annual fee of $15,000 per each Trust Series as well as an annual fee of 0.06% of the fee is equal to the percentage fees paid to USCF minus 0.14%, with that result multiplied by 0.5, minus 0.06% to arrive at the actual fee paid. Foraverage daily total net assets of each of CPER and USAG, the fee is equal to the percentage fees paid to USCF minus 0.18%, with that result multiplied by 0.5, minus 0.06% to arrive at the actual fee paid. Trust Series. USCF is also party to an Amended and Restated Licensing Agreement, dated Julyas of May 1, 2011,2018, as amended by that certain Amendment to Amended and Restated Licensing Agreement dated as of September 15, 2020, and as further amended from time to time, with SummerHaven whereby SummerHaven sub-licensedand SHIM, pursuant to each Trust Serieswhich SHIM grants a license to USCF for the use of certain names and marks, including the Applicable Index for each Trust Series in exchange for whicha fee to be paid by USCF to SHIM. USCF pays licensing fees to SummerHaven has a sub-license from SHIM, the owner of each Applicable Index. Under the Licensing Agreement, USCF paid SummerHavenequal to an annual fee of $15,000 per each Trust Series, for the year ended December 31, 2016, plus an annual fee of 0.06% of the average daily total net assets of each Trust Series. As a result of the amendment and restatement of the Licensing Agreement and Advisory Agreement in May of 2018, the fees required to be paid by USCF to SummerHaven and SHIM in the aggregate have not changed from the aggregate fees paid by USCF under the two agreements prior to the amendment and restatement. NOTE 6 –— FINANCIAL INSTRUMENTS, OFF-BALANCE SHEET RISKS AND CONTINGENCIES Each Trust Series engages in the trading of futures contracts, options on futures contracts, cleared swaps and clearedOTC swaps (collectively, “derivatives”). As such, each Trust Series is exposed to both market risk, which is the risk arising from changes in the market value of the contracts, and credit risk, which is the risk of failure by another party to perform according to the terms of a contract. Each Trust Series may enter into futures contracts, and options on futures contracts and cleared swaps to gain exposure to changes in the value of an underlying commodity. A futures contract obligates the seller to deliver (and the purchaser to accept) the future delivery of a specified quantity and type of a commodity at a specified time and place. Some futures contracts may call for physical delivery of the asset, while others are settled in cash. The contractual obligations of a buyer or seller may generally be satisfied by taking or making physical delivery of the underlying commodity or by making an offsetting sale or purchase of an identical futures contract on the same or linked exchange before the designated date of delivery. Cleared swaps are agreements that are eligible to be cleared by a clearinghouse,e.g., ICE Clear Europe, and provide the efficiencies and benefits that centralized clearing on an exchange offers to traders of futures contracts, including credit risk intermediation and the ability to offset positions initiated with different counterparties. The purchase and sale of futures contracts, and options on futures contracts requireand cleared swaps requires margin deposits with an FCM. Additional deposits may be necessary for any loss on contract value. The Commodity Exchange Act requires an FCM to segregate all customer transactions and assets from the FCM’s proprietary activities. transactions and assets. Futures contracts, options on futures contracts and cleared swaps involve, to varying degrees, elements of market risk (specifically commodity price risk) and exposure to loss in excess of the amount of variation margin. The face or contract amounts reflect the extent of the total exposure each Trust Series has in the particular classes of instruments. Additional risks associated with the use of futures contracts are an imperfect correlation between movements in the price of the futures contracts and the market value of the underlying securities and the possibility of an illiquid market for a futures contract. Buying and selling options on futures contracts exposes investors to the risks of purchasing or selling futures contracts. All of the Futures Contractsfutures contracts held by each Trust Series through March 31, 2023 were exchange-traded through September 30, 2017.exchange-traded. The risks associated with exchange-traded contracts are generally perceived to be less than those associated with OTC swaps since, in OTC swaps, a party must rely solely on the credit of its respective individual counterparties. However, in the future, if each Trust Series were to enter into non-exchange traded contracts (including Exchange for Related Position or EFRP), it would be subject to the credit risk associated with counterparty non-performance. The credit risk from counterparty non-performance associated with such instruments is the net unrealized gain, if any, on the transaction. Currently, each Trust Series has credit risk under its futures contracts since the sole counterparty to all domestic and foreign futures contracts is the clearinghouse for the exchange on which the relevant contracts are traded. In addition, each Trust Series bears the risk of financial failure by the clearing broker. Significant market volatility has recently occurred in the commodity markets and the commodity futures markets. Such volatility is attributable in part to the COVID-19 pandemic, related supply chain disruptions, war, including the war between Russia and Ukraine, and continuing disputes among natural gas-producing countries. These and other events could cause continuing or increased volatility in the future, which may affect the value, pricing and liquidity of some investments or other assets, including those held by or invested in by a Trust Series and have a negative impact on such Trust Series or it ability to have all of its assets invested in the Benchmark Component Futures Contracts. A Trust Series’ cash and other property, such as Treasuries, deposited with an FCM are considered commingled with all other customer funds, subject to the FCM’s segregation requirements. In the event of an FCM’s insolvency, recovery may be limited to a pro rata share of segregated funds available. It is possible that the recovered amount could be less than the total of cash and other property deposited. The insolvency of an FCM could result in the complete loss of a Trust Series’ assets posted with that FCM; however, the majority of each Trust Series’ assets are held in investments in Treasuries, cash and/or cash equivalents with the Trust Series’ custodian and would not be impacted by the insolvency of an FCM. The failure or insolvency of the Trust Series’ custodian, however, could result in a substantial loss of each Trust Series’ assets. USCF may invest a portion of each Trust Series’ cash in money market funds that seek to maintain a stable per share NAV. Each Trust Series may be exposed to any risk of loss associated with an investment in such money market funds. As of September 30, 2017,March 31, 2023 and December 31, 2022, USCI CPER, and USAG all held investments in money market funds in the amounts of $9,000,000, $990,000$122,800,000 and $300,000$233,050,000, respectively. As of March 31, 2023 and December 31, 2016, none of the Trust Series2022, CPER held investments in money market funds.funds in the amounts of $97,950,000 and $158,200,000, respectively. Each Trust Series also holds cash deposits with its custodian. Pursuant to a written agreement with BBH&Co., uninvested overnight cash balances are swept to offshore branches of U.S. regulated and domiciled banks located in Toronto, Canada; London, United Kingdom; Grand Cayman, Cayman Islands; and Nassau, Bahamas; which are subject to U.S. regulation and regulatory oversight. As of September 30, 2017March 31, 2023 and December 31, 2016,2022, USCI held cash deposits and investments in Treasuries in the amounts of $464,627,315$78,258,969 and $641,316,546,$13,007,371, respectively, with the custodian and FCM.FCMs. As of September 30, 2017March 31, 2023 and December 31, 2016,2022, CPER held cash deposits and investments in Treasuries in the amounts of $6,513,743$53,073,543 and $5,640,820,$7,013,916, respectively, with the custodian and FCM. As of September 30, 2017 and December 31, 2016, USAG held cash deposits and investments in Treasuries in the amounts of $1,504,501 and $1,989,821, respectively, with the custodian and FCM.FCMs. Some or all of these amounts may be subject to loss should the Trust Series’ custodian and/or FCMFCMs cease operations. For derivatives, risks arise from changes in the market value of the contracts. Theoretically, each Trust Series is exposed to market risk equal to the value of Futures Contracts purchased and unlimited liability on such contracts sold short. As both a buyer and a seller of options, each Trust Series pays or receives a premium at the outset and then bears the risk of unfavorable changes in the price of the contract underlying the option. The Trust Series’ policy is to continuously monitor its exposure to market and counterparty risk through the use of a variety of financial, position and credit exposure reporting controls and procedures. In addition, the Trust Series or USCF have a policy of requiring review of the credit standing of each broker or counterparty with which they conduct business. The financial instruments held by the applicable Trust Series are reported in its condensed statements of financial condition at market or fair value, or at carrying amounts that approximate fair value, because of their highly liquid nature and short-term maturity.
NOTE 7 –— FINANCIAL HIGHLIGHTS The following tables presenttable presents per share performance data and other supplemental financial data for each Trust Series for the ninethree months ended September 30, 2017March 31, 2023 and 20162022 for the shareholders. This information has been derived from information presented in the condensed financial statements. USCI | | | For the nine
months ended
September 30,
2017
(Unaudited) | | | For the nine
months ended
September 30,
2016
(Unaudited) | | | Per Share Operating Performance: | | | | | | | | | | Net asset value, beginning of period | | $ | 40.02 | | | $ | 40.52 | | | Total income (loss) | | | 0.36 | | | | 1.30 | | | Net expenses | | | (0.30 | ) | | | (0.32 | ) | | Net increase (decrease) in net asset value | | | 0.06 | | | | 0.98 | | | Net asset value, end of period | | $ | 40.08 | | | $ | 41.50 | | | | | | | | | | | | | Total Return | | | 0.15 | % | | | 2.42 | % | | | | | | | | | | | | Ratios to Average Net Assets | | | | | | | | | | Total income (loss) | | | 0.43 | % | | | 2.20 | % | | Management fees* | | | 0.80 | %** | | | 0.80 | %** | | Total expenses excluding management fees* | | | 0.23 | % | | | 0.25 | % | | Expenses waived* | | | — | %** | | | — | %** | | Net expenses excluding management fees* | | | 0.23 | % | | | 0.25 | % | | Net income (loss) | | | (0.34 | )% | | | 1.41 | % |
| | | | | | | | | | Three months ended | | Three months ended | | | | March 31, 2023 | | March 31, 2022 | | | | (Unaudited) | | (Unaudited) | | Per Share Operating Performance: | | | | | | Net asset value, beginning of period | | $ | 56.23 | | $ | 43.43 | | Total income (loss) | | | (1.80) | | | 11.88 | | Total expenses | | | (0.15) | | | (0.12) | | Net increase (decrease) in net asset value | | | (1.95) | | | 11.76 | | Net asset value, end of period | | $ | 54.28 | | $ | 55.19 | | | | | | | | | | Total Return | | | (3.47) | % | | 27.08 | % | | | | | | | | | Ratios to Average Net Assets | | | | | | | | Total income (loss) | | | (3.58) | % | | 22.98 | % | Management fees#* | | | 0.80 | % | | 0.80 | % | Total expenses excluding management fees#* | | | 0.30 | % | | 0.17 | % | Expense waived#* | | | — | % | | — | % | Net expense excluding management fees# | | | 0.30 | % | | 0.17 | % | Net income (loss) | | | (3.85) | % | | 22.74 | % |
| ** | Effective January 1, 2016, USCF permanently lowered the management fee to 0.80% (80 basis points) per annum of average daily total net assets for USCI. |
CPER | | | For the nine
months ended
September 30,
2017
(Unaudited) | | | For the nine
months ended
September 30,
2016
(Unaudited) | | | | | | | | | | | | | | | Three months ended | | Three months ended | | | | | March 31, 2023 | | March 31, 2022 | | | | | (Unaudited) | | (Unaudited) | | | Per Share Operating Performance: | | | | | | | | | | | | | | | | | Net asset value, beginning of period | | $ | 16.36 | | | $ | 14.24 | | | $ | 23.07 | | $ | 27.24 | | | Total income (loss) | | | 2.71 | | | | 0.38 | | | | 2.03 | | | 1.72 | | | Net expenses | | | (0.10 | ) | | | (0.08 | ) | | Total expenses | | | | (0.06) | | | (0.06) | | | Net increase (decrease) in net asset value | | | 2.61 | | | | 0.30 | | | | 1.97 | | | 1.66 | | | Net asset value, end of period | | $ | 18.97 | | | $ | 14.54 | | | $ | 25.04 | | $ | 28.90 | | | | | | | | | | | | | | | | | | | | | | | Total Return | | | 15.95 | % | | | 2.11 | % | | | 8.54 | % | | 6.09 | % | | | | | | | | | | | | | | | | | | | | | | Ratios to Average Net Assets | | | | | | | | | | | | | | | | | Total income (loss) | | | 12.26 | % | | | 1.07 | % | | | 8.95 | % | | 6.06 | % | | Management fees* | | | 0.65 | %** | | | 0.65 | %** | | | Total expenses excluding management fees* | | | 0.59 | % | | | 3.01 | % | | | Expenses waived* | | | (0.44 | )%**† | | | (2.86 | )%**† | | | Net expenses excluding management fees* | | | 0.15 | % | | | 0.15 | % | | Management fees#* | | | | 0.65 | % | | 0.65 | % | Total expenses excluding management fees#* | | | | 0.35 | % | | 0.21 | % | Expense waived#* | | | | — | % | | — | % | Net expense excluding management fees# | | | | 0.35 | % | | 0.21 | % | | Net income (loss) | | | 11.66 | % | | | 0.47 | % | | | 8.70 | % | | 5.85 | % |
* | Annualized. | ** | Effective January 1, 2016, USCF permanently lowered the management fee to 0.65% (65 basis points) per annum of average daily total net assets for CPER. | † | USCF paid certain expenses on a discretionary basis typically borne by CPER where expenses exceeded 0.15% (15 basis points) of CPER’s NAV, on an annualized basis. USCF has no obligation to continue such payments into subsequent periods. |
USAG
| | | For the nine
months ended
September 30,
2017
(Unaudited) | | | For the nine
months ended
September 30,
2016
(Unaudited) | | | Per Share Operating Performance: | | | | | | | | | | Net asset value, beginning of period | | $ | 19.01 | | | $ | 19.80 | | | Total income (loss) | | | (1.38 | ) | | | (0.44 | ) | | Net expenses | | | (0.11 | ) | | | (0.12 | ) | | Net increase (decrease) in net asset value | | | (1.49 | ) | | | (0.56 | ) | | Net asset value, end of period | | $ | 17.52 | | | $ | 19.24 | | | | | | | | | | | | | Total Return | | | (7.84 | )% | | | (2.83 | )% | | | | | | | | | | | | Ratios to Average Net Assets | | | | | | | | | | Total income (loss) | | | (7.33 | )% | | | (2.18 | )% | | Management fees* | | | 0.65 | %** | | | 0.65 | %** | | Total expenses excluding management fees* | | | 2.77 | % | | | 3.69 | % | | Expenses waived* | | | (2.62 | )%**† | | | (3.54 | )%**† | | Net expenses excluding management fees* | | | 0.15 | % | | | 0.15 | % | | Net income (loss) | | | (7.93 | )% | | | (2.78 | )% |
*# | Annualized. | ** | Effective January 1, 2016, USCF permanently lowered the management fee to 0.65% (65 basis points) per annum of average daily total net assets for USAG. | † | USCF paid certain expenses on a discretionary basis typically borne by USAG where expenses exceeded 0.15% (15 basis points) of USAG’s NAV, on an annualized basis. USCF has no obligation to continue such payments into subsequent periods. |
Total returns are calculated based on the change in value during the period. An individual shareholder’s total return and ratio may vary from the above total returns and ratios based on the timing of contributions to and withdrawals from each Trust Series. NOTE 8 — FAIR VALUE OF FINANCIAL INSTRUMENTS The Trust and each Trust Series value their investments in accordance with Accounting Standards Codification 820 – Fair Value Measurements and Disclosures (“ASC 820”). ASC 820 defines fair value, establishes a framework for measuring fair value in generally accepted accounting principles, and expands disclosures about fair value measurement. The changes to past practice resulting from the application of ASC 820 relate to the definition of fair value, the methods used to measure fair value, and the expanded disclosures about fair value measurement. ASC 820 establishes a fair value hierarchy that distinguishes between: (1) market participant assumptions developed based on market data obtained from sources independent of the Trust and each Trust Series (observable inputs) and (2) the Trust’s and each Trust Series’ own assumptions about market participant assumptions developed based on the best information available under the circumstances (unobservable inputs). The three levels defined by the ASC 820 hierarchy are as follows: Level I – Quoted prices (unadjusted) in active markets foridentical assets or liabilities that the reporting entity has the ability to access at the measurement date. Level II – Inputs other than quoted prices included within Level I that are observable for the asset or liability, either directly or indirectly. Level II assets include the following: quoted prices for similarsimilarassets or liabilities in active markets, quoted prices for identical or similar assets or liabilities in markets that are not active, inputs other than quoted prices that are observable for the asset or liability, and inputs that are derived principally from or corroborated by observable market data by correlation or other means (market-corroborated inputs). Level III – Unobservable pricing input at the measurement date for the asset or liability. Unobservable inputs shall be used to measure fair value to the extent that observable inputs are not available.
In some instances, the inputs used to measure fair value might fall within different levels of the fair value hierarchy. The level in the fair value hierarchy within which the fair value measurement in its entirety falls shall be determined based on the lowest input level that is significant to the fair value measurement in its entirety. The following table summarizes the valuation of USCI’s securities at September 30, 2017March 31, 2023 using the fair value hierarchy: | | | | | | | | | | | | | At March 31, 2023 | | Total | | Level I | | Level II | | Level III | Short-Term Investments | | $ | 162,385,092 | | $ | 162,385,092 | | $ | — | | $ | — | Exchange-Traded Futures Contracts | | | | | | | | | | | | | United States Contracts | | | 2,030,984 | | | 2,030,984 | | | — | | | — | Foreign Contracts | | | 37,971 | | | 37,971 | | | — | | | — |
| At September 30, 2017 | | Total | | | Level I | | | Level II | | | Level III | | | Short-Term Investments | | $ | 410,583,532 | | | $ | 410,583,532 | | | $ | — | | | $ | — | | | Exchange-Traded Futures Contracts | | | | | | | | | | | | | | | | | | Foreign Contracts | | | 8,070,625 | | | | 8,070,625 | | | | — | | | | — | | | United States Contracts | | | (2,113,172 | ) | | | (2,113,172 | ) | | | — | | | | — | |
During the nine months ended September 30, 2017, there were no transfers between Level I and Level II.
The following table summarizes the valuation of USCI’s securities at December 31, 20162022 using the fair value hierarchy: | | | | | | | | | | | | | At December 31, 2022 | | Total | | Level I | | Level II | | Level III | Short-Term Investments | | $ | 233,050,000 | | $ | 233,050,000 | | $ | — | | $ | — | Exchange-Traded Futures Contracts | | | | | | | | | | | | | United States Contracts | | | 6,744,521 | | | 6,744,521 | | | — | | | — | Foreign Contracts | | | 2,654,209 | | | 2,654,209 | | | — | | | — |
| At December 31, 2016 | | Total | | | Level I | | | Level II | | | Level III | | | Short-Term Investments | | $ | 514,192,445 | | | $ | 514,192,445 | | | $ | — | | | $ | — | | | Exchange-Traded Futures Contracts | | | | | | | | | | | | | | | | | | Foreign Contracts | | | (3,366,242 | ) | | | (3,366,242 | ) | | | — | | | | — | | | United States Contracts | | | 5,421,702 | | | | 5,421,702 | | | | — | | | | — | |
During the year ended December 31, 2016, there were no transfers between Level I and Level II.
The following table summarizes the valuation of CPER’s securities at September 30, 2017March 31, 2023 using the fair value hierarchy: | | | | | | | | | | | | | At March 31, 2023 | | Total | | Level I | | Level II | | Level III | Short-Term Investments | | $ | 117,742,546 | | $ | 117,742,546 | | $ | — | | $ | — | Exchange-Traded Futures Contracts | | | | | | | | | | | | | United States Contracts | | | 2,461,874 | | | 2,461,874 | | | — | | | — |
| At September 30,2017 | | Total | | | Level I | | | Level II | | | Level III | | | Short-Term Investments | | $ | 6,722,123 | | | $ | 6,722,123 | | | $ | — | | | $ | — | | | Exchange-Traded Futures Contracts | | | | | | | | | | | | | | | | | | United States Contracts | | | 726,713 | | | | 726,713 | | | | — | | | | — | |
During the nine months ended September 30, 2017, there were no transfers between Level I and Level II.Table of Contents
The following table summarizes the valuation of CPER’s securities at December 31, 20162022 using the fair value hierarchy: | | | | | | | | | | | | | At December 31, 2022 | | Total | | Level I | | Level II | | Level III | Short-Term Investments | | $ | 158,200,000 | | $ | 158,200,000 | | $ | — | | $ | — | Exchange-Traded Futures Contracts | | | | | | | | | | | | | United States Contracts | | | 3,972,853 | | | 3,972,853 | | | — | | | — |
| At December 31, 2016 | | Total | | | Level I | | | Level II | | | Level III | | | Short-Term Investments | | $ | 4,541,320 | | | $ | 4,541,320 | | | $ | — | | | $ | — | | | Exchange-Traded Futures Contracts | | | | | | | | | | | | | | | | | | United States Contracts | | | 88,575 | | | | 88,575 | | | | — | | | | — | |
During the year ended December 31, 2016, there were no transfers between Level I and Level II.
The following table summarizes the valuation of USAG’s securities at September 30, 2017 using the fair value hierarchy:
| At September 30,2017 | | Total | | | Level I | | | Level II | | | Level III | | | Short-Term Investments | | $ | 1,546,609 | | | $ | 1,546,609 | | | $ | — | | | $ | — | | | Exchange-Traded Futures Contracts | | | | | | | | | | | | | | | | | | Foreign Contracts | | | (10 | ) | | | (10 | ) | | | — | | | | — | | | United States Contracts | | | (51,561 | ) | | | (51,561 | ) | | | — | | | | — | |
During the nine months ended September 30, 2017, there were no transfers between Level I and Level II.
The following table summarizes the valuation of USAG’s securities at December 31, 2016 using the fair value hierarchy:
| At December 31, 2016 | | Total | | | Level I | | | Level II | | | Level III | | | Short-Term Investments | | $ | 1,397,843 | | | $ | 1,397,843 | | | $ | — | | | $ | — | | | Exchange-Traded Futures Contracts | | | | | | | | | | | | | | | | | | Foreign Contracts | | | (90,442 | ) | | | (90,442 | ) | | | — | | | | — | | | United States Contracts | | | 742 | | | | 742 | | | | — | | | | — | |
During the year ended December 31, 2016, there were no transfers between Level I and Level II.
The Trust and each Trust Series have adopted the provisions of Accounting Standards Codification 815 –— Derivatives and Hedging, which require presentation of qualitative disclosures about objectives and strategies for using derivatives, quantitative disclosures about fair value amounts and gains and losses on derivatives. Fair Value of Derivative Instruments Held by USCI | | | | | | | | | | | Condensed | | | | | | | | | Statements of | | | | | | | | Financial | | | | | | | | | Condition | | Fair Value at | | Fair Value at | Derivatives not Accounted for as Hedging Instruments | | Location | | March 31, 2023 | | December 31, 2022 | Futures - Commodity Contracts | | Assets | | $ | 2,068,955 | | $ | 9,398,730 |
Derivatives not Accounted for
as Hedging Instruments | | Condensed
Statements of Financial
Condition Location | | Fair Value
At September 30,
2017 | | | Fair Value
At December 31,
2016 | | | Futures - Commodity Contracts | | Assets | | $ | 5,957,453 | | | $ | 2,055,460 | |
Fair Value of Derivative Instruments Held by CPER | | | | | | | | | | | Condensed | | | | | | | | | Statements of | | | | | | | | Financial | | | | | | | | Condition | | Fair Value at | | Fair Value at | Derivatives not Accounted for as Hedging Instruments | | Location | | March 31, 2023 | | December 31, 2022 | Futures - Commodity Contracts | | Assets | | $ | 2,461,874 | | $ | 3,972,853 |
Derivatives not Accounted for
as Hedging Instruments | | Condensed
Statements of Financial
Condition Location | | Fair Value
At September 30,
2017 | | | Fair Value
At December 31,
2016 | | | Futures - Commodity Contracts | | Assets | | $ | 726,713 | | | $ | 88,575 | |
Fair Value of Derivative Instruments Held by USAG
Derivatives not Accounted for
as Hedging Instruments | | Condensed
Statements of Financial
Condition Location | | Fair Value
At September 30,
2017 | | | Fair Value
At December 31,
2016 | | | Futures - Commodity Contracts | | Assets | | $ | (51,571 | ) | | $ | (89,700 | ) |
The Effect of Derivative Instruments on the Condensed Statements of Operations of USCI | | | | | | | | | | | | | | | | | | | For the three months ended | | For the three months ended | | | | | March 31, 2023 | | March 31, 2022 | | | | | | | | Change in Unrealized | | | | | Change in Unrealized | Derivatives not | | Location of Gain | | Realized Gain (Loss) | | Gain (Loss) on | | Realized Gain (Loss) | | Gain (Loss) on | Accounted for as | | (Loss) on Derivatives | | on Derivatives | | Derivatives | | in Derivatives | | Derivatives | Hedging Instruments | | Recognized in Income | | Recognized in Income | | Recognized in Income | | Recognized in Income | | Recognized in Income | Futures - Commodity Contracts | | Realized gain (loss) on closed positions | | $ | (3,511,508) | | | | | $ | 56,808,970 | | | | | | | | | | | | | | | | | | | | | Change in unrealized gain (loss) on open positions | | | | | $ | (7,329,775) | | | | | $ | 9,065,852 |
| | | For the nine months ended
September 30, 2017 | | | For the nine months ended
September 30, 2016 | | Derivatives
not Accounted
for as
Hedging
Instruments | | Location of
Gain (Loss)
on Derivatives
Recognized
in Income | | Realized
Gain (Loss)
on Derivatives
Recognized
in Income | | | Change in
Unrealized
Gain (Loss)
on Derivatives
Recognized
in Income | | | Realized
Gain (Loss)
on Derivatives
Recognized
in Income | | | Change in
Unrealized
Gain (Loss)
on Derivatives
Recognized
in Income | | | | | | | | | | | | | | | | | | | Futures – Commodity Contracts | | Realized gain (loss) on closed contracts | | $ | (4,363,021 | ) | | | | | | $ | 7,757,295 | | | | | | | | | Change in unrealized gain (loss) on open contracts | | | | | | $ | 3,901,993 | | | | | | | $ | 3,666,595 | |
The Effect of Derivative Instruments on the Condensed Statements of Operations of CPER | | | | | | | | | | | | | | | | | | | For the three months ended | | For the three months ended | | | | | March 31, 2023 | | March 31, 2022 | | | | | | | | Change in Unrealized | | | | | Change in Unrealized | Derivatives not | | Location of Gain | | Realized Gain (Loss) | | Gain (Loss) on | | Realized Gain (Loss) | | Gain (Loss) on | Accounted for as | | (Loss) on Derivatives | | on Derivatives | | Derivatives | | in Derivatives | | Derivatives | Hedging Instruments | | Recognized in Income | | Recognized in Income | | Recognized in Income | | Recognized in Income | | Recognized in Income | Futures - Commodity Contracts | | Realized gain (loss) on closed positions | | $ | 14,036,387 | | | | | $ | 10,114,375 | | | | | | | | | | | | | | | | | | | | | Change in unrealized gain (loss) on open positions | | | | | $ | (1,510,979) | | | | | $ | 3,840,106 |
| | | For the nine months ended
September 30,2017 | | | For the nine months ended
September 30,2016 | | Derivatives
not Accounted
for as
Hedging
Instruments | | Location of
Gain (Loss)
on Derivatives
Recognized
in Income | | Realized
Gain (Loss)
on Derivatives
Recognized
in Income | | | Change in
Unrealized
Gain (Loss)
on Derivatives
Recognized
in Income | | | Realized
Gain (Loss)
on Derivatives
Recognized
in Income | | | Change in
Unrealized
Gain (Loss)
on Derivatives
Recognized
in Income | | | | | | | | | | | | | | | | | | | Futures – Commodity Contracts | | Realized gain (loss) on closed contracts | | $ | 638,588 | | | | | | | $ | (241,163 | ) | | | | | | | | Change in unrealized gain (loss) on open contracts | | | | | | $ | 638,138 | | | | | | | $ | 263,038 | |
The Effect of Derivative Instruments on the Condensed Statements of Operations of USAG
| | | For the nine months ended
September 30,2017 | | | For the nine months ended
September 30,2016 | | Derivatives
not Accounted
for as
Hedging
Instruments | | Location of
Gain (Loss)
on Derivatives
Recognized
in Income | | Realized
Gain (Loss)
on Derivatives
Recognized
in Income | | | Change in
Unrealized
Gain (Loss)
on Derivatives
Recognized
in Income | | | Realized
Gain (Loss)
on Derivatives
Recognized
in Income | | | Change in
Unrealized
Gain (Loss)
on Derivatives
Recognized
in Income | | | | | | | | | | | | | | | | | | | Futures – Commodity Contracts | | Realized gain (loss) on closed contracts | | $ | (185,566 | ) | | | | | | $ | (42,575 | ) | | | | | | | | Change in unrealized gain (loss) on open contracts | | | | | | $ | 38,129 | | | | | | | $ | (6,224 | ) |
NOTE 9 –— SUBSEQUENT EVENTS The Trust and each Trust Series have performed an evaluation of subsequent events through the date the condensed financial statements were issued. This evaluation did not result in any subsequent events that necessitated disclosures and/or adjustments. Item 2. Management’s Discussion and Analysis of Financial Condition and Results of Operations. The following discussion should be read in conjunction with the condensed financial statements and the notes thereto of the United States Commodity Index Funds Trust (the “Trust”) included elsewhere in this quarterly report on Form 10-Q. Forward-Looking Information This quarterly report on Form 10-Q, including this “Management’s Discussion and Analysis of Financial Condition and Results of Operations,” contains forward-looking statements regarding the plans and objectives of management for future operations. This information may involve known and unknown risks uncertainties and other factors that may cause the Trust’s actual results, performancewhich generally relate to future events or achievements to be materially different from future results, performance or achievements expressed or impliedperformance. In some cases, you can identify forward-looking statements by any forward-looking statements. Forward-looking statements, which involve assumptions and describe the Trust’s future plans, strategies and expectations, are generally identifiable by use of the wordsterminology such as “may,” “will,” “should,” “expect,” “plan,” “anticipate,” “believe,” “estimate,” “believe,“predict,” “intend”“potential,” or “project,” the negative of these words,terms or other variations on these words or comparable terminology. All statements (other than statements of historical fact) included in this Form-Q that address activities, events or developments that will or may occur in the future, including such matters as changes in inflation in the United States, movements in the stock market, movements in U.S. and foreign currencies, and movements in the commodities markets and indexes that track such movements, each Trust Series’ operations, USCF’s plans and references to each Trust Series’ future success and other similar matters, are forward-looking statements. These forward-lookingstatements are only predictions. Actual events or results may differ materially. These statements are based upon certain assumptions and analyses USCF has made based on assumptions that may be incorrect,its perception of historical trends, current conditions and expected future developments, as well as other factors appropriate in the Trust cannot assure investors that the projections included in these forward-looking statements will come to pass. The Trust’scircumstances. Whether or not actual results could differ materially fromand developments will conform to USCF’s expectations and predictions, however, is subject to a number of risks and uncertainties, including the special considerations discussed in this prospectus, general economic, market and business conditions, changes in laws or regulations, including those expressedconcerning taxes, made by governmental authorities or implied by the forward-looking statements as a result of various factors. regulatory bodies, and other world economic and political developments. The Trust has based the forward-looking statements included in this quarterly report on Form 10-Q on information available to it on the date of this quarterly report on Form 10-Q, and the Trust assumes no obligation to update any such forward-looking statements. Although the Trust undertakes no obligation to revise or update any forward-looking statements, whether as a result of new information, future events or otherwise, investors are advised to consult any additional disclosures that the Trust may make directly to them or through reports that the Trust files in the future files with the U.S. Securities and Exchange Commission (the “SEC”), including annual reports on Form 10-K, quarterly reports on Form 10-Q and current reports on Form 8-K. Introduction Introduction
The United States Commodity Index Fund (“USCI”), the United States Copper Index Fund (“CPER”) and the United States Agriculture Index Fund (“USAG”) are eachEach Trust Series is a commodity pool that issues shares representing fractional undivided beneficial interests in USCI, CPER and USAG, respectively (“shares”)such Trust Series that may be purchased and sold on the NYSE Arca, Inc. (the “NYSE Arca”). USCI, CPER and USAG are collectively referred to herein as the “Trust Series.” In addition, a fourth series of the Trust, the USCF Canadian Crude Oil Index Fund (“UCCO”) was formed on June 1, 2016. UCCO is currently in registration and has not commenced operations as of the filing of this quarterly report on Form 10-Q.Arca. The Trust Series and UCCO are series of the Trust, a Delaware statutory trust formed on December 21, 2009. The Trust and each of its series operate pursuant to the Trust’s Third Amended and Restated Declaration of Trust and Trust Agreement (the “Trust Agreement”), dated March 22, 2013. Wilmington Trust Company (the “Trustee”), a Delaware banking corporation, is the Delaware trustee of the Trust. The Trust and each of its series are managed and controlled by United States Commodity Funds LLC (“USCF”).
United States Commodity Index Fund USCI invests in futures contracts for commodities that are traded on the New York Mercantile Exchange (the “NYMEX”), ICE Futures (“ICE Futures”), Chicago Board of Trade (“CBOT”), Chicago Mercantile Exchange (“CME”), London Metal Exchange (“LME”), Commodity Exchange, Inc. (“COMEX”) or on other domestic or foreign exchanges (such exchanges, collectively, the “Futures Exchanges”) (such futures contracts, collectively, “Futures Contracts”)Exchanges and, to a lesser extent, in order to comply with regulatory requirements or in view of market conditions, other commodity-based contracts and instruments such as cash-settled options on Futures Contracts, forward contracts relating to commodities, cleared swap contracts and other over-the-counter (“OTC”) swaps that are based on the price of commodities and Futures Contracts (collectively, “OtherOther Commodity-Related Investments”).Investments. Market conditions that USCF currently anticipates could cause USCI to invest in Other Commodity Related Investments would beinclude, but are not limited to, those allowing USCI to obtain greater liquidity or to execute transactions with more favorable pricing.
The investment objective of USCI is for the daily changes in percentage terms of its shares’ per share net asset value (“NAV”) to reflect the daily changes in percentage terms of the SummerHaven Dynamic Commodity Index Total ReturnSM (the “SDCI”), less USCI’s expenses. USCF does not intend USCI seeks to operate USCIachieve its investment objective by investing so that the average daily percentage change in a fashion such that its per shareUSCI’s NAV for any period of 30 successive valuation days will equal, in dollar terms, the spot pricesbe within plus/minus 10 percent (10%) of the commodities underlyingaverage daily percentage change in the Benchmark Component Futures Contracts (as defined below) that compriseprice of the SDCI orover the pricessame period. The SDCI is designed to reflect the performance of any particulara diversified group of Futures Contracts.commodities. The SDCI is owned and maintained by SummerHaven Index Management, LLC (“SHIM”) and is calculated and published by Bloomberg L.P. Futures contracts for the NYSE Arca. Thecommodities comprising the SDCI is comprisedare traded on the New York Mercantile Exchange (“NYMEX”), ICE Futures (“ICE Futures”), Chicago Board of 14Trade (“CBOT”), Chicago Mercantile Exchange (“CME”), London Metal Exchange (“LME”), and Commodity Exchange, Inc. (“COMEX”) (the NYMEX, ICE Futures, Contracts thatCBOT, CME, LME and COMEX, collectively, the “Futures Exchanges”) and are selected on a monthly basis from a list of 27 possible Futurescollectively referred to herein as “Futures Contracts.” The Futures Contracts that at any given time make up the SDCI are referred to herein as “Benchmark Component Futures Contracts.” USCI invests first inThe relative weighting of the current Benchmark Component Futures Contracts and other Futures Contracts intendedwill change on a monthly basis, based on quantitative formulas relating to replicate the return onprices of the current Benchmark Component Futures Contracts and, thereafter may hold Futures Contracts in a particular commodity other than one specified as the Benchmark Component Futures Contract, or may hold Other Commodity-Related Investments that may fail to closely track the SDCI’s total return movements. If USCI increases in size, and due to its obligations to comply with regulatory limits or due to other market pricing or liquidity factors, USCI may invest in Futures Contract months other than the designated month specified as the Benchmark Component Futures Contract, or in Other Commodity-Related Investments, which may have the effect of increasing transaction related expenses and may result in increased tracking error. developed by SHIM. USCI seeks to achieve its investment objective by investing to the fullest extent possible in the Benchmark Component Futures Contracts. Then, if constrained by regulatory requirements or in view of market conditions, USCI will invest next in other Futures Contracts based on the same commodity as the futures contracts subject to such regulatory constraints or market conditions, and finally, to a lesser extent, in other exchange-traded futures contracts that are economically identical or substantially similar to the Benchmark Component Futures Contracts if one or more other Futures Contracts is not available. When USCI has invested to the fullest extent possible in exchange-traded futures contracts, USCI may then invest in other contracts and instruments based on the Benchmark Component Futures Contracts, other Futures Contracts or the commodities included in the SDCI, such as cash-settled options, forward contracts, cleared swap contracts and swap contracts other than cleared swap contracts. Other exchange-traded futures contracts that are economically identical or substantially similar to the Benchmark Component Futures Contracts and Otherother contracts and instruments based on the Benchmark Component Futures Contracts are collectively referred to as “Other Commodity-Related Investments, such” and together with Benchmark Component Futures Contracts and other Futures Contracts, “Commodity Interests.” USCI seeks to achieve its investment objective by investing so that the average daily percentage change in USCI’s NAV for any period of 30 successive valuation days will be within plus/minus 10 percent (10%) of the average daily percentage change in the price of the SDCI over the same period. USCF believes that the market arbitrage opportunities will cause the daily changes in its’USCI’s share price on the NYSE Arca on a percentage basis to closely track the daily changes in USCI’s per share NAV on a percentage basis. USCF believes that the net effect of this expected relationship and the expected relationship described above between USCI’s per share NAV and the SDCI will be that the daily changes in the price of USCI’s shares on the NYSE Arca on a percentage basis will closely track the daily changes in the price of the SDCI. USCI’s positions in Commodity Interests are rebalancedSDCI on a monthlypercentage basis, in order to track the changing natureless USCI’s expenses. While USCI is composed of the SDCI. If Futures Contracts relating to a particular commodity remain in the SDCI from one month to the next, such Futures Contracts are rebalanced to the 7.14% target weight. Specifically, on a specified day near the end of each month (the “Selection Date”), it will be determined if a current Benchmark Component Futures Contract willContracts and is therefore a measure of the prices of the corresponding commodities comprising the SDCI for future delivery, there is nonetheless expected to be replaced by a new Futures Contract in eitherreasonable degree of correlation between the sameSDCI and the cash or differentspot prices of the commodities underlying commodity as athe Benchmark Component Futures Contract for the following month, in which case USCI’s investments would have toContracts. Investors should be changed accordingly. In orderaware that USCI’s trading doesinvestment objective is not unduly cause extraordinaryfor its NAV or market movements, andprice of shares to make it more difficult for third parties to profit by trading based on market movements that could be expected from changesequal, in dollar terms, the spot prices of the commodities underlying the Benchmark Component Futures Contracts USCI’s investments typically areor the prices of any particular group of futures contracts. USCI will not rebalanced entirely on a single day, but rather typically rebalancedseek to achieve its stated investment objective over a period of four days. After fulfillingtime greater than one day. This is because natural market forces called contango and backwardation have impacted the margintotal return on an investment in USCI’s shares during the past year relative to a hypothetical direct investment in the various commodities and, collateral requirements with respect to its Commodity Interests, USCF investsin the remainderfuture, it is likely that the relationship between the market price of USCI’s proceeds fromshares and changes in the sale of shares in short-term obligationsspot prices of the United States government (“Treasuries”underlying commodities will continue to be so impacted by contango and backwardation. (It is important to note that the disclosure above ignores the potential costs associated with physically owning and storing the commodities, which could be substantial.) or cash equivalents, and/or merely hold such assets in cash (generally in interest-bearing accounts). As of September 30, 2017,March 31, 2023, USCI held 1,631572 Futures Contracts on the NYMEX, 2,241held 1,719 Futures Contracts on the ICE Futures, 1,379held 1,038 Futures Contracts on the CBOT, 460held 227 Futures Contracts on the CME, 3,943held 1,097 Futures Contracts on the LME and 735did not hold any Futures Contracts on the COMEX, totaling 10,3894,653 futures contracts. United States Copper Index Fund CPER invests in Futures Contracts for commodities that are traded on the COMEX and, to a lesser extent, in order to comply with regulatory requirements or in view of market conditions, Other Copper-Related Investments. Market conditions that USCF currently anticipates could cause CPER to invest in Other Copper-Related Investments would beinclude, but are not limited to, those allowing CPER to obtain greater liquidity or to execute transactions with more favorable pricing. The investment objective of CPER is for the daily changes in percentage terms of its shares’ per share NAV to reflect the daily changes in percentage terms of the SummerHaven Copper Index Total ReturnSM (the “SCI”), less CPER’s expenses. USCF does not intendCPER seeks to operate CPERachieve its investment objective by investing so that the average daily percentage change in a fashion such that its per shareCPER’s NAV for any period of 30 successive valuation days will equal, in dollar terms, the spot pricesbe within plus/minus 10 percent (10%) of the commodities underlyingaverage daily percentage change in the price of the Benchmark Component Copper Futures Contracts (as defined below) that compriseover the SCI or the prices of any particular group of Futures Contracts.same period. The SCI is designed to reflect the performance of the investment returns formfrom a portfolio of copper futures contracts.contracts on the COMEX. The SCI is owned and maintained by SHIM and calculated and published by the NYSE Arca. The SCI is comprised of either twoone or three Eligible Copper Futures Contracts that are selected on a monthly basis based on quantitative formulas relating to the prices of the Eligible Copper Futures Contracts developed by SHIM. The Eligible Copper Futures Contracts that at any given time make up the SCI are referred to herein as “Benchmark Component Copper Futures Contracts.” CPER seeks to achieve its investment objective by investing to the fullest extent possible in the Benchmark Component Copper Futures Contracts. Then, if constrained by regulatory requirements or in view of market conditions, CPER will invest next in other Eligible Copper Futures Contracts based on the same copper as the futures contracts subject to such regulatory constraints or market conditions, and finally to a lesser extent, in other exchange traded futures contracts that are economically identical or substantially similar to the Benchmark Component Copper Futures Contracts if one or more other Eligible Copper Futures Contracts is not available. When CPER has invested to the fullest extent possible in exchange-traded futures contracts, CPER may then invest in other contracts and instruments based on the Benchmark Component Copper Futures Contracts, other Eligible Copper Futures Contracts or other items based on copper, such as cash-settled options, forward contracts, cleared swap contracts and swap contracts other than cleared swap contracts. Other exchange-traded futures contracts that are economically identical or substantially similar to the Benchmark Component Copper Futures Contracts and other contracts and instruments based on the Benchmark Component Copper Futures Contracts, are collectively referred to collectively as “Other Copper-Related Investments,” and together with Benchmark Component Copper Futures Contracts and other Eligible Copper Futures Contracts, “Copper Interests.” As CPER seeks to achieve its investment objective by investing so that the average daily percentage change in CPER’s NAV for any period of September 30 2017, CPER held 103successive valuation days will be within plus/minus ten percent (10%) of the average daily percentage change in the price of the Benchmark Component Copper Futures Contracts over the same period. USCF believes that market arbitrage opportunities will cause daily changes in CPER’s share price on the COMEX.
United States Agriculture Index Fund
USAG invests in Futures Contracts for commodities that are tradedNYSE Arca on the ICE Futures US, the ICE Futures Canada, the CBOT, the CME and the Kansas City Board of Trade (“KCBT”) anda percentage basis, to a lesser extent, in order to comply with regulatory requirements or in view of market conditions, Other Agriculture-Related Investments (as defined below). Market conditions that USCF currently anticipates could cause USAG to invest in Other Agriculture-Related Investments would be those allowing USAG to obtain greater liquidity or to execute transactions with more favorable pricing.
The investment objective of USAG is forclosely track the daily changes in percentage terms of its shares’CPER’s per share NAV to reflecton a percentage basis. USCF believes that the net effect of this expected relationship and the expected relationship described above between CPER’s per share NAV and the SCI will be that the daily changes in the price of CPER’s shares on the NYSE Arca on a percentage termsbasis will closely track the daily changes in the SCI on a percentage basis, less CPER’s expenses. While CPER is composed of Benchmark Component Copper Futures Contracts and is therefore a measure of the SummerHaven Dynamic Agriculture Index Total ReturnSM (the “SDAI”), less USAG’s expenses. USCF doesprices of the corresponding commodities comprising the SCI for future delivery, there is nonetheless expected to be a reasonable degree of correlation between the SCI and the cash or spot prices of the commodities underlying the Benchmark Component Copper Futures Contracts.
Investors should be aware that CPER’s investment objective is not intendfor its NAV or market price of shares to operate USAG in a fashion such that its per share NAV will equal, in dollar terms, the spot prices of the commodities underlying the Benchmark Component AgricultureCopper Futures Contracts (as defined below) that comprise the SDAI or the prices of any particular group of Agriculture Futures Contracts. The SDAI is designed to reflect the performance of a diversified group of agricultural commodities. The SDAI is owned and maintained by SHIM and calculated and published by the NYSE Arca comprised of 14 Eligible Agriculture Futures Contracts that are selected on a monthly basis based on quantitative formulas developed by SHIM. The Eligible Agriculture Futures Contracts that at any given time make up the SDAI are referred to herein as “Benchmark Component Agriculture Futures Contracts.” USAG seeksfutures contracts. CPER will not seek to achieve its stated investment objective by investing toover a period of time greater than one day. This is because natural market forces called contango and backwardation have impacted the fullest extent possibletotal return on an investment in Benchmark Component Agriculture Futures Contracts. Then, if constrained by regulatory requirements or in view of market conditions, USAG will invest next in other Eligible Agriculture Futures Contracts based onCPER’s shares during the same agricultural commodity as the futures contracts subject to such regulatory constraints or market conditions, and finally,past year relative to a lesser extent,hypothetical direct investment in other exchange traded futures contracts that are economically identical or substantially similar to the Benchmark Component Agriculture Futures Contracts, if one or more Eligible Agriculture Futures Contracts is not available. When USAG has invested to the fullest extent possible in exchange-traded futures contracts, USAG may then invest in other contractsvarious commodities and, instruments based on the Benchmark Component Agriculture Futures Contracts, other Eligible Agriculture Futures Contracts or the agricultural commodities included in the SDAI, such as cash-settled options, forward contracts, cleared swap contractsfuture, it is likely that the relationship between the market price of CPER’s shares and swap contracts other than cleared swap contracts. Other exchange-traded futures contractschanges in the spot prices of the underlying commodities will continue to be so impacted by contango and backwardation. (It is important to note that are economically identical or substantially similar to the Benchmark Component Agriculture Futures Contractsdisclosure above ignores the potential costs associated with physically owning and other contracts and instruments basedstoring the commodities, which could be substantial.) CPER’s shares began trading on the Benchmark Component Agriculture Futures Contracts, are collectively referred to as “Other Agriculture-Related Investments,” and together with Benchmark Component Agriculture Futures Contracts and other Eligible Agriculture Futures Contracts, “Agriculture Interests.”November 15, 2011. As of September 30, 2017, USAGMarch 31, 2023, CPER held 341,500 Futures Contracts on the ICE Futures, 30 Futures Contracts on the CBOT, 7 Futures Contracts on the CME, and 2 Futures Contracts on the KCBT, totaling 73 futures contracts.COMEX.
Other Defined Terms The SCI, together with the SDCI, and the SDAI are referred to throughout this quarterly report on Form 10-Q collectively as the “Applicable Index” or “Indices.” Benchmark Component Futures Contracts, Benchmark Component Copper Futures Contracts and Benchmark Component AgricultureCopper Futures Contracts are referred to throughout this quarterly report on Form 10-Q collectively as “Applicable Benchmark Component Futures Contracts.” Other Commodity-Related Investments Other Copper-Related Investments and Other Agriculture-RelatedCopper-Related Investments are collectively referred to herein as “Other Related Investments.” Commodity Interests Copper Interests and AgricultureCopper Interests are collectively referred to herein as “Applicable Interests” throughout this quarterly report on Form 10-Q. Regulatory Disclosure The regulation of commodity interest trading in the United States and other countries is an evolving area of the law. Below are certain key regulatory requirements that are, or may be, relevant to the Trust Series. The various statements made in this summary are subject to modification by legislative action and changes in the rules and regulations of the SEC, Financial Industry Regulatory Authority (“FINRA”), CFTC, NFA, the futures exchanges, clearing organizations and other regulatory bodies. Pending final resolution of all applicable regulatory requirements, some examples of how new rules and regulations could impact the Trust Series are discussed in “Item 1. Business” in this quarterly report on Form 10-Q. Exchange Accountability Levels, Position Limits and Price Fluctuation LimitsLimits. . Designated contract markets (“DCMs”), such as the NYMEX and ICE Futures, have established accountability levels and position limits on the maximum net long or net short futures contracts in commodity interests that any person or group of persons under common trading control (other than as a hedge, which is not applicable to the Trust Series’ investments) may hold, own or control. These levels and position limits apply to the futures contracts that theeach Trust Series invests in to meet itsthe investment objective.objective of such Trust Series. In addition to accountability levels and position limits, the NYMEX and ICE Futures also set daily price fluctuation limits on futures contracts. The daily price fluctuation limit establishedestablishes the maximum amount that the price of a futures contract may vary either up or down from the previous day’s settlement price. Once thatthe daily price fluctuation limit has been reached in a particular futures contract, no trades may be made at a price beyond that limit. The accountability levels for the commodities comprising an Applicable Index and other futures contracts traded on U.S.-basedU.S. based futures exchanges are not a fixed ceiling, but rather a threshold above which such exchanges may exercise greater scrutiny and control over an investor’s positions. As of September 30, 2017,March 31, 2023, USCI held 1,631572 Futures Contracts on the NYMEX, 2,241held 1,719 Futures Contracts on the ICE Futures, 1,379held 1,038 Futures Contracts on the CBOT, 460held 227 Futures Contracts on the CME, 3,943held 1,097 Futures Contracts on the LME and 735did not hold any Futures Contracts on the COMEX, totaling 10,3894,653 futures contracts. As of September 30, 2017,March 31, 2023, CPER held 1031,500 Futures Contracts on the COMEX. As of September 30, 2017, USAG held 34 Futures Contracts on[For the ICE Futures, 30 Futures Contracts on the CBOT, 7 Futures Contracts on the CME, and 2 Futures Contracts on the KCBT, totaling 73 futures contracts. For the ninethree months ended September 30, 2017,March 31, 2023, no Trust Series exceeded accountability levels imposed by the NYMEX, COMEX, CME, CBOT, KCBT, LME or ICE Futures. Position limits differ from accountability levels in that they represent fixed limits on the maximum number of futures contracts that any person may hold and cannot allow such limits to be exceeded without express CFTC authority to do so. In addition to accountability levels and position
limits that may apply at any time, the Futures Exchanges may impose position limits on contracts held in the last few days of trading in the near month contract to expire. It is unlikely that a Trust Series will run up against such position limits. A Trust Series does not typically hold the near month contract in its Applicable Benchmark Component Futures Contracts. In addition, each Trust Series’ investment strategy is to close out its positions during each Rebalancing Period in advance of the period right before expiration and purchase new contracts. As such, none of the Trust Series anticipates that position limits that apply to the last few days prior to a contract’s expiration will impact it. For the ninethree months ended September 30, 2017,March 31, 2023, no Trust Series exceeded position limits imposed by the NYMEX, COMEX, CME, CBOT, KCBT, LME or ICE Futures. Regulation of Commodity InterestsFederal Position Limits
The regulation of commodity interest trading in the United States and other countries is an evolving areaPart 150 of the law. The various statements made in this summary are subject to modification by legislative actionCFTC’s regulations (the “Position Limits Rule”) establishes federal position limits for 25 core referenced futures contracts (comprised of agricultural, energy and changes in the rulesmetals futures contracts), futures and regulations of Financial Industry Regulatory Authority (“FINRA”), the CFTC, the National Futures Association (the “NFA”), the SEC, the futures exchanges, clearing organizations and other regulatory bodies.
Futures Contracts and Position Limits
The CFTC is generally prohibited by statute from regulating trading on non-U.S. futures exchanges and markets. The CFTC, however, has adopted regulations relatingoptions linked to the marketing of non-U.S.core referenced futures contracts in the United States. These regulations permit certain contracts on non-U.S. exchanges to be offered and sold in the United States.
The CFTC has proposed to adopt limits on speculative positions in 25 physical commodity futures, and option contracts, and swaps that are economically equivalent to suchthe core referenced futures contracts in the agriculture, energy and metals markets. The Position Limit Rules would, among other things: identify which contractsthat all market participants must comply with, with certain exemptions.
Certain Applicable Benchmark Component Futures Contracts are subject to speculative position limits; set thresholds that restrictlimits under the size of speculative positions that a person may hold inPosition Limits Rule, and the spot month, other individual months, and all months combined; createtrading by each Trust Series does not qualify for an exemption for positions that constitute bona fide hedging transactions; impose responsibilities on designated contract markets (“DCMs”) and swap execution facilities (“SEFs”) to establish position limits or, in some cases, position accountability rules; and apply to both futures and swaps across four relevant venues: OTC, DCMs, SEFs as well as certain non-U.S. located platforms. The CFTC’s first attempt at finalizingtherefrom. Accordingly, the Position Limit Rules, in 2011, was successfully challenged by market participants in 2012 and, since then, the CFTC has re-proposed them and solicited comments from market participants multiple times. At this time, it is unclear how the Position Limit Rules may affect a Trust Series, but the effect may be substantial and adverse. By way of example, the Position Limit Rules mayLimits Rule could negatively impact the ability of a Trust Series to meet its investment objectives through limits that may inhibitby inhibiting USCF’s ability to sell additionaleffectively invest the proceeds from sales of Creation Baskets of athe Trust Series.Series in particular amounts and types of its permitted investments. Margin for OTC Swaps Until such time as the Position Limit Rules are adopted, the regulatory architectureput in effect prior to the adoption of the Position Limit Rules will govern transactions in commodities and related derivatives (collectively, “Referenced Contracts”). Under that system,place by U.S. federal banking regulators, the CFTC enforces federal limits on speculation in nine agricultural products (e.g., corn, wheat and soy), while futures exchanges establishthe SEC require the daily exchange of variation margin and enforce position limitsinitial margin for swaps between swap dealers, major swap participants, security-based swap dealers, and accountability levels for other agricultural productsmajor security-based swap participants (“Swap Entities”) and certain energy products (e.g., oilswaps between Swap Entities and natural gas). As a result, a Trust Series may be limited with respect totheir counterparties that are “financial end-users” (such rules, the size
Under existing and recently adopted CFTC regulations, for the purpose of position limits, a market participant is generally required, subject to certain narrow exceptions, to aggregate all positions for which the market participant controls the trading decisions with all positions for which the participant has a 10 percent or greater ownership interest in an account or position, as well as the positions of two or more persons acting pursuant to an express or implied agreement or understanding with that participant (the “Aggregation“Margin Rules”). The AggregationMargin Rules will also applyrequire Swap Entities to exchange variation margin with respectall of their counterparties who are financial end-users. The minimum variation margin amount is the daily mark-to-market change in the value of the swap, taking into account the amount of variation margin previously posted or collected. Swap Entities are required to exchange initial margin with their financial end-users who have “material swaps exposure” (i.e., an average daily aggregate notional of $8 billion or more in non-cleared swaps calculated in accordance with the Position LimitMargin Rules). The Margin Rules ifspecify the types of collateral that may be posted or collected as initial margin or variation margin (generally cash, certain government, government-sponsored enterprise securities, certain liquid debt, certain equity securities, certain eligible publicly traded debt, and when such Position Limit Rules are adopted.gold) and sets forth haircuts for certain collateral asset classes.
“Swap” Transactions
The Dodd-Frank Wall Street Reform and Consumer Protection Act (the “Dodd-Frank Act”) imposes regulatory requirements on certain “swap” transactions that aNo Trust Series is authorized to engage in that may ultimately impacta Swap Entity under the ability ofMargin Rules, but each is a financial end-user. Accordingly, each Trust Series will be subject to meet its investment objective. The term “swap” is broadly definedthe variation margin requirements of the Margin Rules for any swaps that it enters into. However, no Trust Series has material swaps exposure and, accordingly, no Trust Series will be subject to include various typesthe initial margin requirements of OTC derivatives, including swapsthe Margin Rules.
Mandatory Trading and options. Clearing of Swaps CFTC regulations require that certain swap transactions ultimately falling within the definition of “swap” be executed on organized exchanges or “swap execution facilities” and cleared through regulated clearing organizations (“CCPs”derivative clearing organizations” (“DCOs”). “Clearing” refers), if the CFTC mandates the central clearing of a particular class of swap and such swap is “made available to the process by whichtrade” on a tradeswap execution facility. Currently, swap dealers, major swap participants, commodity pools, certain private funds and entities predominantly engaged in activities that are financial in nature are required to execute on a swap execution facility, and clear, certain interest rate swaps and index-based credit default swaps. As a result, if a Trust Series enters into an interest rate or index-based credit default swap that is bilaterallysubject to these requirements, such swap will be required to be executed by two parties is submittedon a swap execution facility and centrally cleared. Mandatory clearing and “made available to a CCP, via a clearing member (i.e., an FCM), and replaced by two mirrortrade” determinations with respect to additional types of swaps with the CCP becoming the counterparty to both of the initial parties to the swap. CCPs have several layers of protection against default including margin, member capital contributions and FCM guarantees of their customers’ transactions with the CCP. FCMs also pre-qualify the counterparties to all swaps that are sent to the CCP from a credit perspective, setting limits for each counterparty and collecting initial and variation margin daily from each counterparty for changesmay be issued in the value offuture, and, when finalized, could require each Trust Series to electronically execute and centrally clear certain OTC instruments presently entered into and settled on a bi-lateral basis. If a swap is required to be cleared, swaps. The margin collected from both parties to the swap protects against credit risk in the event a counterparty defaults. The initial and variation margin requirements are set by the relevant clearing organization, subject to certain regulatory requirements and held for the benefit of the CCP.guidelines. Additional initial margin may be required and held by thea Trust Series’ FCM. Current rules and regulations require enhanced customer protections, risk management programs, internal monitoring and controls, capital and liquidity standards, customer disclosures and auditing and examination programsOther Requirements for FCMs. The rules are intended to afford greater assurances to market participants that customer segregated funds and secured amounts are protected, customers are provided with appropriate notice of the risks
of futures trading and of the FCMs with which they may choose to do business, FCMs are monitoring and managing risks in a robust manner, the capital and liquidity of FCMs are strengthened to safeguard the continued operations and the auditing and examination programs of the CFTC and the self-regulatory organizations are monitoring the activities of FCMs in a thorough manner.
Certain index-based credit default swaps and interest rate swaps are subject to mandatory clearing. If a Trust Series enters into index-based credit default swaps or interest rate swaps that are subject to mandatory clearing, the Trust Series will be required to centrally clear those swaps.
To the extent that a swap is required to be cleared, it must also be executed on a SEF or DCM if it is designated as “made available to trade” by a SEF or DCM. “Made available to trade” refers to the regulatory process by which the SEF or DCM execution requirement is implemented by the CFTC. To date, only certain of the index-based credit default swaps and interest rate swaps that are required to be cleared are made available to trade on a SEF. If a Trust Series enters into index-based credit default swaps or interest rate swaps that are subject to mandatory clearing, such Trust Series will be required to execute those swaps on a SEF if they are designated as made available to trade. In order to execute swaps on a SEF, a Trust Series will have to be a member of a SEF or it may access the SEF through an intermediary. Members of a SEF are subject to additional requirements under CFTC regulations and are subject to the rules and jurisdiction of the relevant SEF.
Swaps Swaps that are not required to be cleared and executed on a SEF but that are executed bilaterally are also subject to various requirements pursuant to CFTC regulations, including, among others,other things, reporting and recordkeeping requirements and, depending on the status of the counterparties, trading documentation requirements and dispute resolution requirements. In addition, U.S. regulators have adopted rules to impose initial and variation margin requirements that will apply to swap dealers and major swap participants and their counterparties. If a Trust Series engages in non-cleared swap transactions it may be subject to some or all of these requirements.
Derivatives Regulations in Non-U.S. Jurisdictions In addition to U.S. laws and regulations, thea Trust Series may be subject to non-U.S. derivatives laws and regulations if it engages in futures and/or swapsswap transactions with non-U.S. persons. For example, theeach Trust Series may be impacted by European laws and regulations to the extent that it engages in futures transactions on European exchanges or derivatives transactions with European entities. Other jurisdictions impose requirements applicable to futures and derivatives that are similar to those imposed by the U.S., including position limits, margin, clearing and trade execution requirements. The CFTC is generally prohibited by statute from regulating trading on non-U.S. futures exchanges and markets. The CFTC, however, has adopted regulations relating to the marketing of non-U.S. futures contracts in the United States. These regulations permit certain contracts on non-U.S. exchanges to be offered and sold in the United States. Money Market ReformInfectious disease outbreaks like COVID-19 could negatively affect the valuation and performance of a Trust Series’ investments.
An outbreak of infectious respiratory illness caused by a novel coronavirus known as COVID-19 was first detected in China in December 2019 and spread globally. In March 2020, the World Health Organization declared the COVID-19 outbreak a pandemic. COVID-19 resulted in numerous deaths, travel restrictions, closed international borders, enhanced health screenings at ports of entry and elsewhere, disruption of and delays in healthcare service preparation and delivery, prolonged quarantines and the imposition of both local and more widespread “work from home” measures, cancellations, loss of employment, supply chain disruptions, and lower consumer and institutional demand for goods and services, as well as general concern and uncertainty. The spread of COVID-19 had a material adverse impact on local economies in the affected jurisdictions and also on the global economy, as cross border commercial activity and market sentiment were impacted by the outbreak and government and other measures seeking to contain its spread. COVID-19 had a material adverse impact on the crude oil markets and oil futures markets to the extent economic activity and the use of crude oil continues to be curtailed, which in turn had a significant adverse effect on the prices of Natural Gas Futures Contracts, including the Benchmark Futures Contracts, and Other Natural Gas-Related Contracts. Infectious disease outbreaks like COVID-19 may arise in the future and could adversely affect individual issuers and capital markets in ways that cannot necessarily be foreseen. In addition, actions taken by government and quasi-governmental authorities and regulators throughout the world in response to such an outbreak, including the potential for significant fiscal and monetary policy changes, may affect the value, volatility, pricing and liquidity of some investments or other assets, including those held by or invested in by each Trust Series. Public health crises caused by infectious disease outbreaks may exacerbate other pre-existing political, social and economic risks in certain countries or globally and their duration cannot be determined with certainty. In a rising rate environment, the Trust Series may not be able to fully invest at prevailing rates until any current investments in Treasury Bills mature in order to avoid selling those investments at a loss. When interest rates rise, the value of fixed income securities typically falls. In a rising interest rate environment, a Trust Series may not be able to fully invest at prevailing rates until any current investments in Treasury Bills mature in order to avoid selling those investments at a loss. Interest rate risk is generally lower for shorter term investments and higher for longer term investments. The risk to the Trust Series of rising interest rates may be greater in the future due to the end of a long period of historically low rates, the effect of potential monetary policy initiatives, including actions taken by the U.S. Federal Reserve and other foreign equivalents to curb inflation, and resulting market reaction to those initiatives. When interest rates fall, a Trust Series may be required to reinvest the proceeds from the sale, redemption or early prepayment of a Treasury Bill or money market security at a lower interest rate. A Trust Series may lose money by investing in government money market funds. The SEC adopted Rule 2a-7 under the Investment Company Act of 1940, which became effectiveTrust Series invest in 2016, to reformgovernment money market funds. Although such government money market funds (“MMFs”). Whileseek to preserve the new rule applies onlyvalue of an investment at $1.00 per share, there is no guarantee that they will be able to MMFs, itdo so and a Trust Series may indirectly affect institutional investors such as the Trust. A portion of the Trust’s assets that are not used for margin or collateral in the Futures Contracts currently are invested in government MMFs. The Trust does not hold any non-government MMFs and, particularly in light of recent changes to the rule governing the operation of MMFs, does not anticipate investing in any non-government MMFs. However, if the Trust invests in other types of MMFs besides government MMFs in the future, the Trust could be negatively impactedlose money by investing in a government money market fund. An investment in a government money market fund is not insured or guaranteed by the Federal Deposit Insurance Corporation, referred to herein as the FDIC, or any other government agency. The share price of a government money market fund can fall below the $1.00 share price. A Trust Series cannot rely on or expect a government money market fund’s adviser or its affiliates to enter into support agreements or take other actions to maintain the government money market fund’s $1.00 share price. The credit quality of a government money market fund’s holdings can change rapidly in certain markets, and the default of a single holding could have an MMF that does not maintainadverse impact on the government money market fund’s share price. Due to fluctuations in interest rates, the market value of securities held by a stable $1.00 net asset value government money market fund may vary. A government money market fund’s share price can also be negatively affected during periods of high redemption pressures and/or that has the potential to impose redemption fees and gates (temporary suspension of redemptions).illiquid markets. Commodity Markets Commodity Futures Price Movements Nine months ended September 30, 2017
Three Months Ended March 31, 2023 As measured by the four major diversified commodity indexes listed below, commodity futures prices exhibited an a mostly upward/downward trend during the ninethree months ended September 30, 2017.March 31, 2023. The table below compares the total returns of the SDCI to the three major diversified commodity indexes over this time period. | | | | SummerHaven Dynamic Commodity Index Total ReturnSM(1)SM (“SDCI”)(1) | | (3.12) | 1.56 | % | S&P GSCI Commodity Index (GSCI®) Total Return(2) Return(2) | | (4.94) | (3.76 | )% | Bloomberg Commodity Index Total ReturnSM(2) Return(2) | | (5.36) | (2.87 | )% | Deutsche Bank Liquid Commodity Index-Optimum Yield Total ReturnTM(2)TM (2) | | (3.38) | (2.02 | )% |
| (1) | (1) | The inception date for the SummerHaven Dynamic Commodity Index Total ReturnSM is December 2009. |
The value of the SDCI as of December 31, 20162022 was $1,262.46.$1,933.23. As of September 30, 2017,March 31, 2023, the value of the SDCI was $1,282.17, up$1,872.88, down approximately 1.56%(3.12)% over the ninethree months ended September 30, 2017.March 31, 2023. [Of the 27 components of SummerHaven Dynamic Commodity Index (SDCI), sixteen had positive returns for first-half 2022. Gas Oil returned 57.7% in the first-half 2022 while Copper declined by -17.4%. The best performing sector was energy (up 57.7%). Commodities have continued the 2021 rally as inflation grew from 1.4% in 2020 to 9.1% in 2022. Inflation is a headwind for stocks and bonds and a tailwind for real assets such as commodities. Historically, commodities have been a hedge against inflation and positive inflation shocks. In 2022, as the fact of high inflation became more evident, stocks and Bonds suffered losses while commodities continued to perform well. The age-old wisdom of stock-bond diversification has been challenged in an unprecedented way. Since the inception in 1976 of US aggregate bond index, 2022 is the only year where both US stocks and bonds have experience significant negative returns (-20.0% and -10.3% respectively). In contrast, USCI’s NAV was down (3.47)% for the three months ended March 31, 2023.]* * USCF to Confirm The return of approximately 1.56%(3.12)% on the SDCI listed above is a hypothetical return only and could not actually be achieved by an investor holding Futures Contracts due to the impact of trading costs and other expenses. USCI’s per share NAV began the yearperiod at $40.02$56.23 and ended the period at $40.08$54.28 on September 30, 2017, an increaseMarch 31, 2023, a decrease of approximately 0.15%(3.47)% over the period. USCI’s per share NAV reached its high for the period on September 6, 2017 at $41.00 and reached its low for the period on June 20, 2017 at $37.13. See “Tracking“Tracking Each Trust Series’ BenchmarkBenchmark”” below for information about how expenses and income affect USCI’s per share NAV.
The war in Ukraine has raised concerns among investors that a global shortage of many commodities is possible. Russia, Ukraine, and Belarus are major producers and exporters of many metals, grains, and energy products that are critical to global supply. Substantial productive capacity has been halted in Ukraine, and Russia may be unable or unwilling to export what it produces. This has put upward pressure on commodity prices globally, beyond the impact of bullish fundamentals that were already in place. Should the war continue or escalate, or if sanctions or retaliation lead to a further reduction in production and exports from Ukraine, Russia, and Belarus, then commodity prices could rise further and prices could become more volatile. Conversely, should concerns about commodity shortages resulting from the war in Ukraine ebb due to an expected or actual resolution of the war, then commodity prices could stabilize or decline. Copper Markets Copper Futures Price Movements Nine months ended September 30, 2017
Three Months Ended March 31, 2023 As measured by the two major copper indexes, copper futures prices exhibited daily swings with an upwarda mostly upward/downward trend during the ninethree months ended September 30, 2017.March 31, 2023. The table below compares the total returns of the SCI to the Bloomberg Copper Subindex Total Return over this time period. | | | | SummerHaven Copper Index Total ReturnTM(1)SM(“SCI”)(1) | | 8.93 | 17.64 | % | Bloomberg Copper Subindex Total Return(2) Return(2) | | 8.36 | 16.05 | % |
| (1) | (1) | The inception date for the SummerHaven Copper Index Total ReturnTMSM is November 2010. |
The value of the SCI as of December 31, 20162022 was $815.94.$1,222.97. As of September 30, 2017,March 31, 2023, the value of the SCI was $959.85,$1,332.24, up approximately 17.64%8.93% over the ninethree months ended September 30, 2017. March 31, 2023. The return of approximately 17.64%8.93% on the SCI listed above is a hypothetical return only and could not actually be achieved by an investor holding Futures Contracts due to the impact of trading costs and other expenses. CPER’s per share NAV began the yearperiod at $16.36$23.07 and ended the period at $18.97$25.04 on September 30, 2017,March 31, 2023, an increase of approximately 15.95%8.54% over the period. CPER’s per share NAV reached its high for the period on September 6, 2017 at $20.23 and reached its low for the period on May 10, 2017 at $16.18. See “Trackingthe Each Trust Series’ Benchmark” for information about how expenses and income affect CPER’s NAV. Agriculture Markets
Agriculture Futures Price Movements
Nine months ended September 30, 2017
As measured by the three major agriculture indexes listed below, agriculture futures prices exhibited moderate daily swings along with a downward trend during the nine months ended September 30, 2017. The table below compares the total returns of the SDAI to the two major agriculture indexes over this time period.
SummerHaven Dynamic Agriculture Index Total ReturnSM(1) | | | (7.50 | )% | Bloomberg Agriculture Subindex Total ReturnSM(2) | | | (9.23 | )% | Deutsche Bank Liquid Commodity Index-Optimum Yield Agriculture ReturnTM(2) | | | (4.52 | )% |
| (1) | The inception date for the SummerHaven Dynamic Agriculture Index Total ReturnSM is September 2010. |
The value of the SDAI as of December 31, 2016 was $273.11. As of September 30, 2017, the value of the SDAI was $252.64, down approximately (7.50)% over the nine months ended September 30, 2017.
The return of approximately (7.50)% on the SDAI listed above is a hypothetical return only and could not actually be achieved by an investor holding Futures Contracts due to the impact of trading costs and other expenses. USAG’s per share NAV began the year at $19.01 and ended the period at $17.52 on September 30, 2017, a decrease of approximately 7.84% over the period. USAG’s per share NAV reached its high for the period on January 23, 2017 at $20.07 and reached its low for the period on August 29, 2017 at $17.46. See“Tracking Each Trust Series’ Benchmark” below for information about how expenses and income affect USAG’sCPER’s per share NAV.
[During the quarter ended March 31, 2023, the price of the front month copper futures contract traded in a range between $3.2105 per pound and $4.9290 per pound. Prices decreased by 16.78% between December 31, 2022 to March 31, 2023 finishing the period at $3.8105. Copper futures markets rose dramatically from 2020 to mid-April 2022. Copper prices declined sharply from late spring to mid-summer due to concerns about demand from the manufacturing sector, monetary tightening and related concerns about a slowdown in global growth, and COVID-19 flare ups in China. In the second half of 2022, Copper recovered some of its earlier losses for the year, partially as a result of China reopening its economy. Long-term, copper demand is likely to remain robust and supply is also likely to remain constrained and slow to respond to demand increases.]* * USCF to Confirm The war in Ukraine has affected many commodities in which Russia, Ukraine, and Belarus are major producers and exports, such as certain metals, grains, and energy products. However, copper is not one of the metals that depends heavily on supply from the region. As a result, copper prices rose only modestly from the outbreak of the war in comparison to other metals, such as Nickel. Copper supply is more affected by events, such as protests and labor strikes, that impact mining in south American nations, including Chile and Peru. Meanwhile, copper demand typical depends on the state of the global economy, particularly China, which drives industrial, commercial, and manufacturing use. Valuation of Futures Contracts and the Computation of the Per Share NAV Each Trust Series’ NAV is calculated once each NYSE Arca trading day. The per share NAV for a particular trading day is released after 4:00 p.m. New York time. Trading during the core trading session on the NYSE Arca typically closes at 4:00 p.m. New York time. The Trust Series’ Administrator uses the closing prices on the relevant Futures Exchanges of the Applicable Benchmark Component Futures Contracts (determined at the earlier of the close of such exchange or 2:30 p.m. New York time) for the contracts held on the Futures Exchanges, but calculates or determines the value of all other investments of such Trust Series using market quotations, if available, or other information customarily used to determine the fair value of such investments. Results of Operations On July 30, 2010, USCI received a notice of effectiveness from the SEC for its registration of 50,000,000 shares on Form S-1 with the SEC. On August 10, 2010, USCI listed its shares on the NYSE Arca under the ticker symbol “USCI.” USCI established its initial offering per share NAV by setting the price at $50 and issued 100,000 shares to the initial Authorized Participant, Merrill Lynch Professional Clearing Corp., in exchange for $5,000,000 in cash on August 10, 2010. USCI commenced investment operations on August 10, 2010 by purchasing Futures Contracts traded on the Futures Exchanges. In order to satisfy NYSE Arca listing standards that at least 100,000 shares be outstanding at the beginning of the trading day on the NYSE Arca, USCF purchased the initial Creation Basket from the initial Authorized Participant at the initial offering price. The $1,000 fee that would otherwise be charged to the Authorized Participant in connection with an order to create or redeem was waived in connection with the initial Creation Basket. USCF agreed not to resell the shares comprising such basket except that it may require the initial Authorized Participant to repurchase all of these shares at a per share price equal to USCI’s per share NAV within five days following written notice from USCF, subject to the conditions that: (i) on the date of repurchase, the initial Authorized Participant must immediately redeem these shares in accordance with the terms of the Authorized Participant Agreement and (ii) immediately following such redemption at least 100,000 shares of USCI remain outstanding. USCF held such initial Creation Basket until September 3, 2010, at which time the initial Authorized Participant repurchased the shares comprising such basket in accordance with the specified conditions noted above. On September 14, 2011, USCF redeemed the 20 Sponsor Shares of USCI, and on September 19, 2011, USCF purchased five shares of USCI in the open market. USCF redeemed all Sponsor Shares of USMI on March 18, 2015. On March 18, 2015, at the close of markets, USMI ceased all trading and all of USMI’s assets were liquidated on March 24, 2015. Since its initial offering of 50,000,000 shares, USCI has not registered any subsequent offerings10,000,000 additional shares as of its shares.March 31, 2023. As of September 30, 2017,March 31, 2023, USCI had issued 30,450,00041,300,000 shares, 11,950,0003,750,000 of which were outstanding. As of September 30, 2017, there were 19,550,000 remainingMarch 31, 2023, USCI had an unlimited number of shares registered but not yet issued.for issuance. More shares may have been issued by USCI than are outstanding due to the redemption of shares. In connection with the Second Amended and Restated Trust Agreement dated November 10, 2010, USMI, USAG and CPER were designated as three additional series of the Trust. Following the designation of the additional series, an initial capital contribution of $3,000 was transferred from USCF to the Trust. On November 10, 2010, the Trust transferred $1,000 to each of USMI, USAG and CPER, which was deemed a capital contribution to each series. On November 14, 2011, USCF received 40 Sponsor Shares of CPER in exchange for the previously received capital contribution, representing a beneficial interest in CPER. On December 7, 2011, USCF redeemed the 40 Sponsor Shares of CPER and purchased 40 shares of CPER in the open market. On April 13, 2012, USCF received 40 Sponsor Shares of USAG in exchange for the previously received capital contribution, representing a beneficial interest in USAG. On June 28, 2012, USCF redeemed the 40 Sponsor shares of USAG and on October 3, 2012, purchased 5 shares of USAG on the open market. On June 19, 2012, USCF received 40 Sponsor Shares of USMI in exchange for the previously received capital contribution, representing a beneficial interest in USMI. On August 27, 2012, USCF redeemed the 40 Sponsor shares of USMI and on September 4, 2013, USCF purchased 5 shares of USMI on the open market. USCF redeemed all Sponsor Shares of USMI on March 18, 2015. On March 18, 2015, at the close of markets, USMI ceased all trading and all of USMI’s assets were liquidated on March 24, 2015.
CPER and USAG received notice of effectiveness from the SEC for its registration of 30,000,000 CPER shares and 20,000,000 USAG shares on September 6, 2011. The order to permit listing CPER and USAG on the NYSE Arca was received on October 20, 2011. On November 15, 2011, CPER listed its shares on the NYSE Arca under the ticker symbol “CPER.” CPER established its initial offering per share NAV by setting the price at $25 and issued 100,000 shares to the initial Authorized Participant, Merrill Lynch Professional Clearing Corp., in exchange for $2,500,000 in cash on November 15, 2011. The $1,000 fee that would otherwise be charged to the Authorized Participant in connection with an order to create or redeem was waived in connection with the initial Creation Basket.
Since its initial offering of 30,000,000 shares, CPER has not registered any subsequent offerings50,000,000 additional shares as of its shares.March 31, 2023. As of September 30, 2017,March 31, 2023, CPER had issued 1,050,00025,200,000 shares, 400,0006,150,000 of which were outstanding. As of September 30, 2017, there were 28,950,000 remainingMarch 31, 2023, CPER had an unlimited number of shares registered but not yet issued.for issuance. More shares may have been issued by CPER than are outstanding due to the redemption of shares. On April 13, 2012, USAG listed its shares onUSCF and the NYSE Arca underTrustee entered into the ticker symbol “USAG.” USAG established its’ initial per share NAV by setting the price at $25.00. On April 14, 2012, USCF purchased 2 initial Creation BasketsFourth Amended and Restated Declaration of USAG. In accordance with applicable requirementsTrust and Trust Agreement effective as of Regulation M under the Exchange Act, no Creation Baskets were offered to Authorized Participants nor were the shares listed on the NYSE Arca until five business days had elapsed from the date of USCF’s purchase of the initial Creation Basket on April 4, 2012. The fee that would have otherwise been charged in connection with an order to create or redeem was waived in connection with the initial Creation Basket.
Since its initial offering of 20,000,000 shares, USAG has not registered any subsequent offerings of its shares. As of September 30, 2017, USAG had issued 200,000 shares, 100,000 of which were outstanding. As of September 30, 2017, there were 19,800,000 remaining shares registered but not yet issued. More shares may have been issued by USAG than are outstanding due to the redemption of shares.
Unlike funds that are registered under the Investment Company Act, shares that have been redeemed by the Trust Series cannot be resold. As a result, each Trust Series contemplates that additional offerings of its shares will be registered with the SEC in the future in anticipation of additional issuances and redemptions.
December 15, 2017. As of September 30, 2017,March 31, 2023, USCI CPER and USAGCPER had the following Authorized Participants: BNP Paribas Prime Brokerage, Inc., BNP Paribas Securities Corp., Citadel Securities LLC, Credit Suisse Securities (USA) LLC, Goldman Sachs & Company, Jefferies & Company Inc.LLC., JP Morgan Securities Inc., Merrill Lynch Professional Clearing Corp., Morgan Stanley & Co. LLC,Company Inc., RBC Capital Markets LLC and Virtu Financial BDAmericas LLC. For the NineThree Months Ended September 30, 2017March 31, 2023 Compared to the NineThree Months Ended September 30, 2016March 31, 2022 USCI | | | | | | | | | | Three months ended | | Three months ended | | | | March 31, 2023 | | March 31, 2022 | | Average daily total net assets | | $ | 231,996,221 | | $ | 286,837,344 | | Dividend and interest income earned on Treasuries, cash and/or cash equivalents | | $ | 2,526,373 | | $ | 40,452 | | Annualized yield based on average daily total net assets | | | 4.42 | % | | 0.06 | % | Management fee | | $ | 457,636 | | $ | 565,816 | | Total fees and other expenses excluding management fees | | $ | 168,841 | | $ | 121,103 | | Fees and expenses related to the registration or offering of additional shares | | $ | — | | $ | 6,617 | | Total commissions accrued to brokers | | $ | 54,445 | | $ | 51,836 | | Total commissions as annualized percentage of average total net assets | | | 0.10 | % | | 0.07 | % |
USCI
| | | For the nine
months ended
September 30,
2017 | | | For the nine
months ended
September 30,
2016 | | | Average daily total net assets | | $ | 525,963,966 | | | $ | 582,317,646 | | | Dividend and interest income earned on Treasuries, cash and/or cash equivalents | | $ | 2,703,656 | | | $ | 1,368,961 | | | Annualized yield based on average daily total net assets | | | 0.69 | % | | | 0.31 | % | | Management fee | | $ | 3,147,138 | | | $ | 3,487,542 | | | Total fees and other expenses excluding management fees | | $ | 895,343 | | | $ | 1,086,880 | | | Fees and expenses related to the registration or offering of additional shares | | $ | — | | | $ | — | | | Total commissions accrued to brokers | | $ | 441,006 | | | $ | 607,696 | | | Total commissions as annualized percentage of average total net assets | | | 0.11 | % | | | 0.14 | % | | Commissions accrued as a result of rebalancing | | $ | 421,225 | | | $ | 548,776 | | | Percentage of commissions accrued as a result of rebalancing | | | 95.51 | % | | | 96.23 | % | | Commissions accrued as a result of creation and redemption activity | | $ | 19,781 | | | $ | 22,920 | | | Percentage of commissions accrued as a result of creation and redemption activity | | | 4.49 | % | | | 3.77 | % |
Portfolio Expenses. USCI’s expenses consist of investment management fees, brokerage fees and commissions, certain offering costs, licensing fees, registration fees, the fees and expenses of the independent directors of USCF and expenses relating to tax accounting and reporting requirements. The management fee that USCI pays to USCF is calculated as a percentage of the total net assets of USCI. The fee is accrued daily and paid monthly. Average interest rates earned on short-term investments held by USCI, including cash, cash equivalents and Treasuries, were higher during the ninethree months ended September 30, 2017,March 31, 2023, compared to the ninethree months ended September 30, 2016.March 31, 2022. As a result, the amount of income earned by USCI as a percentage of average daily total net assets was higher during the ninethree months ended September 30, 2017,March 31, 2023, compared to the ninethree months ended September 30, 2016.March 31, 2022. To the degree that the aggregate yield is higher, the net expense ratio, inclusive of income, will be lower. USCI’sThe increase in total fees and other expenses excluding management fees for the ninethree months ended September 30, 2017,March 31, 2023, compared to the ninethree months ended September 30, 2016, decreased as a result of a decreaseMarch 31, 2022, was due primarily to an increase in certain operating expenses.reporting fees.
USCI’sThe increase in total commissions accrued to brokers for the ninethree months ended September 30, 2017,March 31, 2023, compared to the ninethree months ended September 30, 2016, decreasedMarch 31, 2022, was due primarily due to a decrease in thehigher number of contracts traded duringFutures Contracts being held and traded.
For the rebalancing periods.Three Months Ended March 31, 2023 Compared to the Three Months Ended March 31, 2022 CPER | | | | | | | | | | Three months ended | | Three months ended | | | | March 31, 2023 | | March 31, 2022 | | Average daily total net assets | | $ | 159,749,672 | | $ | 230,955,494 | | Dividend and interest income earned on Treasuries, cash and/or cash equivalents | | $ | 1,761,097 | | $ | 30,111 | | Annualized yield based on average daily total net assets | | | 4.47 | % | | 0.05 | % | Management fee | | $ | 256,037 | | $ | 370,162 | | Total fees and other expenses excluding management fees | | $ | 139,589 | | $ | 118,560 | | Fees and expenses related to the registration or offering of additional shares | | $ | — | | $ | 24,092 | | Total commissions accrued to brokers | | $ | 16,912 | | $ | 11,366 | | Total commissions as annualized percentage of average total net assets | | | 0.04 | % | | 0.02 | % |
CPER
| | | For the nine
months ended
September 30,
2017 | | | For the nine
months ended
September 30,
2016 | | | Average daily total net assets | | $ | 10,908,068 | | | $ | 2,618,894 | | | Dividend and interest income earned on Treasuries, cash and/or cash equivalents | | $ | 57,244 | | | $ | 5,809 | | | Annualized yield based on average daily total net assets | | | 0.70 | % | | | 0.30 | % | | Management fee | | $ | 53,031 | | | $ | 12,744 | | | Total fees and other expenses excluding management fees | | $ | 47,819 | | | $ | 59,025 | | | Fees and expenses related to the registration or offering of additional shares | | $ | — | | | $ | — | | | Total amount of Expense Waiver | | $ | 35,579 | | | $ | 56,084 | | | Expenses before the allowance for the expense waiver | | $ | 100,850 | | | $ | 71,769 | | | Expenses after allowance for the expense waiver | | $ | 65,271 | | | $ | 15,685 | | | Total commissions accrued to brokers | | $ | 4,144 | | | $ | 1,242 | | | Total commissions as annualized percentage of average total net assets | | | 0.05 | % | | | 0.06 | % | | Commissions accrued as a result of rebalancing | | $ | 3,214 | | | $ | 1,146 | | | Percentage of commissions accrued as a result of rebalancing | | | 77.56 | % | | | 92.27 | % | | Commissions accrued as a result of creation and redemption activity | | $ | 930 | | | $ | 96 | | | Percentage of commissions accrued as a result of creation and redemption activity | | | 22.44 | % | | | 7.73 | % |
Portfolio Expenses. CPER’s expenses consist of investment management fees, brokerage fees and commissions, certain offering costs, licensing fees, registration fees, the fees and expenses of the independent directors of USCF and expenses relating to tax accounting and reporting requirements. The management fee that CPER pays to USCF is calculated as a percentage of the total net assets of CPER. The fee is accrued daily and paid monthly. Average interest rates earned on short-term investments held by CPER, including cash, cash equivalents and Treasuries, were higher during the nine months ended September 30, 2017, compared to the nine months ended September 30, 2016. As a result, the amount of income earned by CPER as a percentage of average daily total net assets was higher during the nine months ended September 30, 2017, compared to the nine months ended September 30, 2016.
CPER’s total fees and expenses excluding management fees for the nine months ended September 30, 2017, compared to the nine months ended September 30, 2016, decreased as a result of lower other expense.
CPER’s total commissions accrued to brokers for the nine months ended September 30, 2017, compared to the nine months ended September 30, 2016, increased due to the increased creation and redemption activity during the period.
USAG
| | | For the nine
months ended
September 30,
2017 | | | For the nine
months ended
September 30,
2016 | | | Average daily total net assets | | $ | 1,879,142 | | | $ | 1,999,753 | | | Dividend and interest income earned on Treasuries, cash and/or cash equivalents | | $ | 9,123 | | | $ | 4,491 | | | Annualized yield based on average daily total net assets | | | 0.65 | % | | | 0.30 | % | | Management fee | | $ | 9,136 | | | $ | 9,731 | | | Total fees and other expenses excluding management fees | | $ | 38,985 | | | $ | 55,310 | | | Fees and expenses related to the registration or offering of additional shares | | $ | — | | | $ | — | | | Total amount of Expense Waiver | | $ | 36,825 | | | $ | 53,011 | | | Expenses before the allowance for the expense waiver | | $ | 48,121 | | | $ | 65,041 | | | Expenses after allowance for the expense waiver | | $ | 11,296 | | | $ | 12,030 | | | Total commissions accrued to brokers | | $ | 1,513 | | | $ | 1,788 | | | Total commissions as annualized percentage of average total net assets | | | 0.11 | % | | | 0.12 | % | | Commissions accrued as a result of rebalancing | | $ | 1,513 | | | $ | 1,788 | | | Percentage of commissions accrued as a result of rebalancing | | | 100.00 | % | | | 100.00 | % | | Commissions accrued as a result of creation and redemption activity | | $ | — | | | $ | — | | | Percentage of commissions accrued as a result of creation and redemption activity | | | — | % | | | — | % |
Portfolio Expenses. USAG’s expenses consist of investment management fees, brokerage fees and commissions, certain offering costs, licensing fees, the fees and expenses of the independent directors of USCF and expenses relating to tax accounting and reporting requirements. The management fee that USAG pays to USCF is calculated as a percentage of the total net assets of USAG. The fee is accrued daily and paid monthly.
Average interest rates earned on short-term investments held by USAG, including cash, cash equivalents and Treasuries, were higher during the nine months ended September 30, 2017, compared to the nine months ended September 30, 2016. As a result, the amount of income earned by USAG as a percentage of average daily total net assets was higher during the nine months ended September 30, 2017, compared to the nine months ended September 30, 2016.
USAG’s total fees and expenses excluding management fees for the nine months ended September 30, 2017, compared to the nine months ended September 30, 2016, decreased as a result of a decrease in certain operating expenses.
USAG’s total commissions accrued to brokers for the nine months ended September 30, 2017, compared to the nine months ended September 30, 2016, decreased due to the number of contracts traded during the rebalancing periods.
For the Three Months Ended September 30, 2017 Compared to the Three Months Ended September 30, 2016
USCI
| | | For the three
months ended
September 30,
2017 | | | For the three
months ended
September 30,
2016 | | | Average daily total net assets | | $ | 485,319,714 | | | $ | 682,906,241 | | | Dividend and interest income earned on Treasuries, cash and/or cash equivalents | | $ | 1,123,783 | | | $ | 575,836 | | | Annualized yield based on average daily total net assets | | | 0.92 | % | | | 0.34 | % | | Management fee | | $ | 978,618 | | | $ | 1,373,276 | | | Total fees and other expenses excluding management fees | | $ | 207,498 | | | $ | 401,376 | | | Fees and expenses related to the registration or offering of additional shares | | $ | — | | | $ | — | | | Total commissions accrued to brokers | | $ | 89,000 | | | $ | 247,791 | | | Total commissions as annualized percentage of average total net assets | | | 0.07 | % | | | 0.14 | % | | Commissions accrued as a result of rebalancing | | $ | 87,196 | | | $ | 238,251 | | | Percentage of commissions accrued as a result of rebalancing | | | 97.97 | % | | | 96.15 | % | | Commissions accrued as a result of creation and redemption activity | | $ | 1,804 | | | $ | 9,540 | | | Percentage of commissions accrued as a result of creation and redemption activity | | | 2.03 | % | | | 3.85 | % |
Portfolio Expenses. USCI’s expenses consist of investment management fees, brokerage fees and commissions, certain offering costs, licensing fees, the fees and expenses of the independent directors of USCF and expenses relating to tax accounting and reporting requirements. The management fee that USCI pays to USCF is calculated as a percentage of the total net assets of USCI. The fee is accrued daily and paid monthly.
Average interest rates earned on short-term investments held by USCI, including cash, cash equivalents and Treasuries, were higher during the three months ended September 30, 2017, compared to the three months ended September 30, 2016. As a result, the amount of income earned by USCI as a percentage of average daily total net assets was higher during the three months ended September 30, 2017, compared to the three months ended September 30, 2016.
USCI’s total fees and expenses excluding management fees for the three months ended September 30, 2017, compared to the three months ended September 30, 2016, decreased as a result of a decrease in certain operating expenses.
USCI’s total commissions accrued to brokers for the three months ended September 30, 2017, compared to the three months ended September 30, 2016, decreased primarily due to a decrease in the number of contracts traded during the rebalancing periods.
CPER
| | | For the three
months ended
September 30,
2017 | | | For the three
months ended
September 30,
2016 | | | Average daily total net assets | | $ | 9,597,094 | | | $ | 2,854,788 | | | Dividend and interest income earned on Treasuries, cash and/or cash equivalents | | $ | 21,584 | | | $ | 2,343 | | | Annualized yield based on average daily total net assets | | | 0.89 | % | | | 0.33 | % | | Management fee | | $ | 15,723 | | | $ | 4,664 | | | Total fees and other expenses excluding management fees | | $ | 14,122 | | | $ | 23,128 | | | Fees and expenses related to the registration or offering of additional shares | | $ | — | | | $ | — | | | Total amount of Expense Waiver | | $ | 10,493 | | | $ | 22,051 | | | Expenses before the allowance for the expense waiver | | $ | 29,845 | | | $ | 27,792 | | | Expenses after allowance for the expense waiver | | $ | 19,352 | | | $ | 5,741 | | | Total commissions accrued to brokers | | $ | 564 | | | $ | 346 | | | Total commissions as annualized percentage of average total net assets | | | 0.02 | % | | | 0.05 | % | | Commissions accrued as a result of rebalancing | | $ | 314 | | | $ | 346 | | | Percentage of commissions accrued as a result of rebalancing | | | 55.67 | % | | | 100.00 | % | | Commissions accrued as a result of creation and redemption activity | | $ | 250 | | | $ | — | | | Percentage of commissions accrued as a result of creation and redemption activity | | | 44.33 | % | | | — | % |
Portfolio Expenses. CPER’s expenses consist of investment management fees, brokerage fees and commissions, certain offering costs, licensing fees, the fees and expenses of the independent directors of USCF and expenses relating to tax accounting and reporting requirements. The management fee that CPER pays to USCF is calculated as a percentage of the total net assets of CPER. The fee is accrued daily and paid monthly.
Average interest rates earned on short-term investments held by CPER, including cash, cash equivalents and Treasuries, were higher during the three months ended September 30, 2017,March 31, 2023, compared to the three months ended September 30, 2016.March 31, 2022. As a result, the amount of income earned by CPER as a percentage of average daily total net assets was higher during the three months ended September 30, 2017,March 31, 2023, compared to the three months ended September 30, 2016.March 31, 2022. To the degree that the aggregate yield is higher, the net expense ratio, inclusive of income, will be lower. CPER’sThe increase in total fees and other expenses excluding management fees for the three months ended September 30, 2017,March 31, 2023, compared to the three months ended September 30, 2016, decreased as a result of lower other expenses.March 31, 2022, was due primarily to an increase in professional and reporting fees.
CPER’sThe increase in total commissions accrued to brokers for the three months ended September 30, 2017,March 31, 2023, compared to the three months ended September 30, 2016, increasedMarch 31, 2022, was due primarily to the increased creation and redemption activity during the period.
USAG
| | | For the three
months ended
September 30,
2017 | | | For the three
months ended
September 30,
2016 | | | Average daily total net assets | | $ | 1,821,366 | | | $ | 2,000,170 | | | Dividend and interest income earned on Treasuries, cash and/or cash equivalents | | $ | 4,060 | | | $ | 1,646 | | | Annualized yield based on average daily total net assets | | | 0.88 | % | | | 0.33 | % | | Management fee | | $ | 2,984 | | | $ | 3,268 | | | Total fees and other expenses excluding management fees | | $ | 14,997 | | | $ | 22,242 | | | Fees and expenses related to the registration or offering of additional shares | | $ | — | | | $ | — | | | Total amount of Expense Waiver | | $ | 14,271 | | | $ | 21,453 | | | Expenses before the allowance for the expense waiver | | $ | 17,981 | | | $ | 25,510 | | | Expenses after allowance for the expense waiver | | $ | 3,710 | | | $ | 4,057 | | | Total commissions accrued to brokers | | $ | 575 | | | $ | 772 | | | Total commissions as annualized percentage of average total net assets | | | 0.13 | % | | | 0.15 | % | | Commissions accrued as a result of rebalancing | | $ | 575 | | | $ | 772 | | | Percentage of commissions accrued as a result of rebalancing | | | 100.00 | % | | | 100.00 | % | | Commissions accrued as a result of creation and redemption activity | | $ | — | | | $ | — | | | Percentage of commissions accrued as a result of creation and redemption activity | | | — | % | | | — | % |
Portfolio Expenses. USAG’s expenses consist of investment management fees, brokerage fees and commissions, certain offering costs, licensing fees, the fees and expenses of the independent directors of USCF and expenses relating to tax accounting and reporting requirements. The management fee that USAG pays to USCF is calculated as a percentage of the total net assets of USAG. The fee is accrued daily and paid monthly.
Average interest rates earned on short-term investments held by USAG, including cash, cash equivalents and Treasuries, were higher during the three months ended September 30, 2017, compared to the three months ended September 30, 2016. As a result, the amount of income earned by USAG as a percentage of average daily total net assets was higher during the three months ended September 30, 2017, compared to the three months ended September 30, 2016.
USAG’s total fees and expenses excluding management fees for the three months ended September 30, 2017, compared to the three months ended September 30, 2016, decreased as a result of a decrease in certain operating expenses.
USAG’s total commissions accrued to brokers for the three months ended September 30, 2017, compared to the three months ended September 30, 2016, decreased due to the number of contracts traded during the rebalancing periods.Futures Contracts being held and traded.
Tracking Each Trust Series’ Benchmark USCF seeks to manage each Trust Series’ portfolio such that changes in its average daily per share NAV, on a percentage basis, closely track the daily changes in the average price of the Applicable Index, also on a percentage basis. Specifically, USCF seeks to manage the portfolio such that over any rolling period of 30-valuation days, the average daily change in a Trust Series’ per share NAV is within a range of 90% to 110% (0.9 to 1.1) of the average daily change in the price of the Applicable Index. As an example, if the average daily movement of the price of the Applicable Index for a particular 30-valuation day timedaytime period was 0.50% per day, USCF would attempt to manage the portfolio such that the average daily movement of the per share NAV during that same time period fell between 0.45% and 0.55% (i.e.(i.e., between 0.9 and 1.1 of the Applicable Index’s results). Each Trust Series’ portfolio management goals do not include trying to make the nominal price of its per share NAV equal to the nominal price of the Applicable Index, the nominal price of any particular commodity Futures Contract or the spot price for any particular commodity. USCF believes that it is not practical to manage the portfolio to achieve such an investment goal when investing in listed Futures Contracts and Other-Related Investments. USCI For the 30-valuation days ended September 30, 2017,March 31, 2023, the simple average daily change in the SDCI was 0.0643%0.005%, while the simple average daily change in the per share NAV of USCI over the same time period was 0.0621%0.001%. The average daily difference was (0.002)(0.004)% (or (0.2)(0.4) basis points, where 1 basis point equals 1/100 of 1%). As a percentage of the daily movement of the SDCI, the average error in daily tracking by the per share NAV was (4.22)(0.331)%, meaning that over this time period USCI’s tracking error was within the plus or minus 10% range established as its benchmark tracking goal. This measurement is based on the relative movement in the benchmark. On a daily basis, USCI is tracking very close to its benchmark. Since the commencement of the offering of USCI’s shares to the public on August 10, 2010 to September 30,2017,through March 31, 2023, the simple average daily change in the SDCI was (0.003)%0.012%, while the simple average daily change in the per share NAV of USCI over the same time period was (0.009)%0.006%. The average daily difference was (0.006)% (or (0.6) basis points, where 1 basis point equals 1/100 of 1%). As a percentage of the daily movement of the SDCI, the average error in daily tracking by the per share NAV was (8.59)(6.689)%, meaning that over this time period USCI’s tracking error was within the plus or minus 10% range established as its benchmark tracking goal. The following two charts demonstrate the correlation between the changes in SDCI’s NAV and the changes in the SDCI. The first chart below shows the daily movement of USCI’s per share NAV versus the daily movement of the SDCI for the 30-valuation day period ended September 30, 2017.March 31, 2023, the last trading day in March. The second chart below shows the monthly total returns of USCI as compared to the monthly value of the SDCI for the five years ended September 30, 2017.March 31, 2023. *PAST PERFORMANCE IS NOT NECESSARILY INDICATIVE OF FUTURE RESULTS 
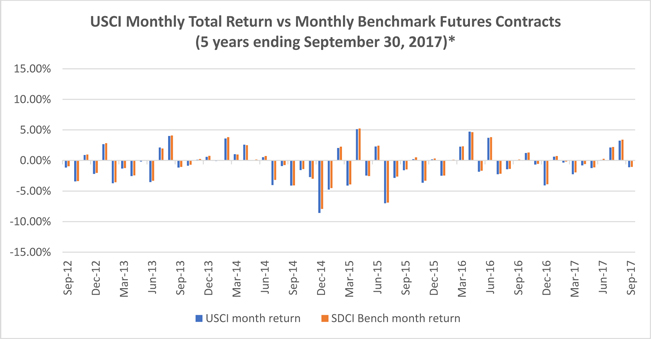
*PAST PERFORMANCE IS NOT NECESSARILY INDICATIVE OF FUTURE RESULTS 
An alternative tracking measurement of the return performance of USCI versus the return of theits SDCI can be calculated by comparing the actual return of USCI, measured by changes in its per share NAV, versus theexpected changes in its per share NAV under the assumption that USCI’s returns had been exactly the same as the daily changes in the price of theits SDCI. For the ninethree months ended September 30, 2017,March 31, 2023, the actual total return of USCI as measured by changes in its per share NAV was 0.15%(3.47)%. This is based on an initial per share NAV of $40.02 on$56.23 as of December 31, 20162022 and an ending per share NAV as of September 30, 2017March 31, 2023 of $40.08.$54.28. During this time period, USCI made no distributions to its shareholders. However, if USCI’s daily changes in its per share NAV had instead exactly tracked the changes in the daily total return of the SDCI, USCI would have had an estimated per share NAV of $54.47 as of March 31, 2023, for a total return over the relevant time period of (3.13)%. The difference between the actual per share NAV total return of USCI of (3.47)% and the expected total return based on the SDCI of (3.13)% was a difference over the time period of (0.34)%, which is to say that USCI’s actual total return underperformed its benchmark by that percentage. USCI incurs expenses primarily composed of the management fee, brokerage commissions for the buying and selling of futures contracts, and other expenses. The impact of these expenses, offset by interest and dividend income, and net of positive or negative execution, tends to cause daily changes in the per share NAV of USCI to track slightly lower or higher than daily changes in the price of the SDCI. By comparison, for the three months ended March 31, 2022, the actual total return of USCI as measured by changes in its per share NAV was 27.08%. This is based on an initial per share NAV of $43.43 as of December 31, 2021 and an ending per share NAV as of March 31, 2022 of $55.19. During this time period, USCI made no distributions to its shareholders. However, if USCI’s daily changes in its per share NAV had instead exactly tracked the changes in the daily total return of the SDCI, USCI would have had an estimated per share NAV of $40.65$55.44 as of September 30, 2017,March 31, 2022, for a total return over the relevant time period of 1.57%27.65%. The difference between the actual per share NAV total return of USCI of 0.15%27.08% and the expected total return based on the SDCI of 1.57%27.65% was an errora difference over the time period of (1.42)(0.57)%, which is to say that USCI’s actual total return underperformed the SDCI resultits benchmark by that percentage. USCI incurs expenses primarily composed of the management fee, brokerage commissions for the buying and selling of futures contracts, and other expenses. The impact of these expenses, offset by interest and dividend income, and net of positive or negative execution, tends to cause daily changes in the per share NAV of USCI to track slightly lower than daily changes in the price of the SDCI.
By comparison, for the nine months ended September 30, 2016, the actual total return of USCI as measured by changes in its per share NAV was 2.42%. This was based on an initial per share NAV of $40.52 on December 31, 2015 and an ending per share NAV as of September 30, 2016 of $41.50. During this time period, USCI made no distributions to its shareholders. However, if USCI’s daily changes in its per share NAV had instead exactly tracked the changes in the daily return of the SDCI, USCI would have had an estimated per share NAV of $41.76 as of September 30, 2016, for a total return over the relevant time period of 3.06%. The difference between the actual per share NAV total return of USCI of 2.42% and the expected total return based on the SDCI of 3.06% was an error over the time period of (0.64)%, which is to say that USCI’s actual total return underperformed the SDCI result by that percentage. USCI incurred expenses primarily composed of the management fee, brokerage commissions for the buying and selling of futures contracts, and other expenses. The impact of these expenses tended to cause daily changes in the per share NAV of USCI to track slightly loweror higher than daily changes in the price of the SDCI.
CPER For the 30-valuation days ended September 30, 2017,March 31, 2023, the simple average daily change in the SCI was 0.0091%0.010%, while the simple average daily change in the per share NAV of CPER over the same time period was (0.0001)%0.006%. The average daily difference was (0.009)% (or (0.09) basis points, where 1 basis point equals 1/100 of 1%). As a percentage of the daily movement of the SCI, the average error in daily tracking by the per share NAV was 31.73%, meaning that over this time period CPER’s tracking error was not within the plus or minus 10% range established as its benchmark tracking goal. Large tracking variances can occur when there is a tiny movement in the benchmark resulting in magnification of small differences. Since the commencement of the offering of CPER’s shares to the public on November 15, 2011 to September 30, 2017, the simple average daily change in the SCI was (0.0066)%, while the simple average daily change in the per share NAV of CPER over the same time period was (0.0107)%. The average daily difference was (0.0041)(0.004)% (or (0.4) basis points, where 1 basis point equals 1/100 of 1%). As a percentage of the daily movement of the SCI, the average error in daily tracking by the per share NAV was (3.57)(1.669)%, meaning that over this time period CPER’s tracking error was within the plus or minus 10% range established as its benchmark tracking goal.
Since the commencement of the offering of CPER’s shares to the public on November 15, 2011 through March 31, 2023, the simple average daily change in the SCI was 0.013%, while the simple average daily change in the per share NAV of CPER over the same time period was 0.009%. The average daily difference was (0.004)% (or (0.4) basis points, where 1 basis point equals 1/100 of 1)%. As a percentage of the daily movement of the SCI, the average error in daily tracking by the per share NAV was (3.080)%, meaning that over this time period CPER’s tracking error was within the plus or minus 10% range established as its benchmark tracking goal. The following two charts demonstrate the correlation between the changes in CPER’s NAV and the changes in the SCI. The first chart below shows the daily movement of CPER’s per share NAV versus the daily movement of the SCI for the 30-valuation day period September 30, 2017.ended March 31, 2023, the last trading day in March. The second chart below shows the monthly total returns of CPER as compared to the monthly value of the SCI for the five years ended September 30, 2017.March 31, 2023. 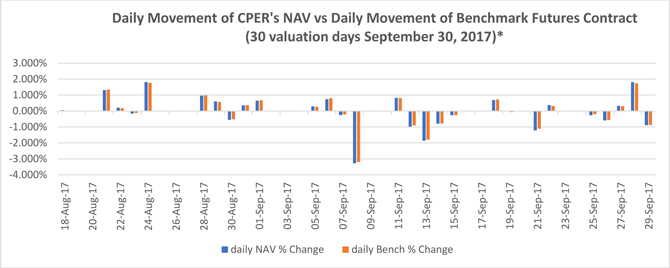
*PAST PERFORMANCE IS NOT NECESSARILY INDICATIVE OF FUTURE RESULTS

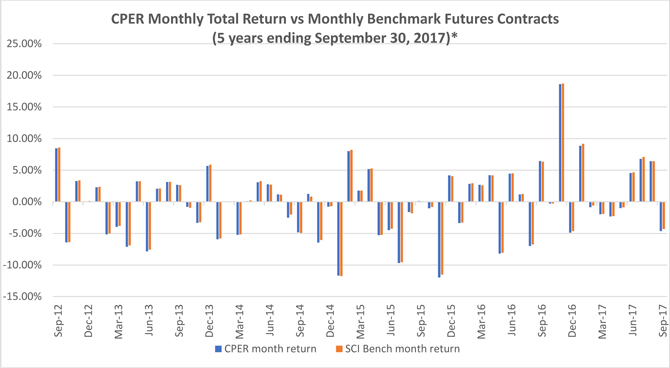
*PAST PERFORMANCE IS NOT NECESSARILY INDICATIVE OF FUTURE RESULTS 
An alternative tracking measurement of the return performance of CPER versus the return of theits SCI can be calculated by comparing the actual return of CPER, measured by changes in its per share NAV, versus theexpected changes in its per share NAV under the assumption that CPER’s returns had been exactly the same as the daily changes in the price of theits SCI. For the ninethree months ended September 30, 2017,March 31, 2023, the actual total return of CPER as measured by changes in its per share NAV was 15.95%8.54%. This is based on an initial per share NAV of $16.36$23.07 as of December 31, 20162022 and an ending per share NAV as of September 30, 2017March 31, 2023 of $18.97.$25.04. During this time period, CPER made no distributions to its shareholders. However, if CPER’s daily changes in its per share NAV had instead exactly tracked the changes in the daily total return of the SCI, CPER would have had an estimated per share NAV of $19.25$25.13 as of September 30, 2017,March 31, 2023, for a total return over the relevant time period of 17.67%8.93%. The difference between the actual per share NAV total return of CPER of 15.95%8.54% and the expected total return based on the SCI of 17.67%8.93% was an error over the time period of (1.72)(0.39)%, which is to say that CPER’s actual total return underperformed the SCI resultits benchmark by that percentage. CPER incurs expenses primarily composed of the management fee, brokerage commissions for the buying and selling of futures contracts, and other expenses. The impact of these expenses, offset by interest and dividend income, and net of positive or negative execution, tends to cause daily changes in the per share NAV of CPER to track slightly lower or higher than daily changes in the price of the SCI. By comparison, for the ninethree months ended September 30, 2016,March 31, 2022, the actual total return of CPER as measured by changes in its per share NAV was 2.11%6.09%. This wasis based on an initial per share NAV of $14.24$27.24 as of December 31, 20152021 and an ending per share NAV as of September 30, 2016March 31, 2022 of $14.54.$28.90. During this time period, CPER made no distributions to its shareholders. However, if CPER’s daily changes in its per share NAV had instead exactly tracked the changes in the daily total return of the SCI, CPER would have had an estimated per share NAV of $14.61$28.99 as of September 30, 2016,March 31, 2022, for a total return over the relevant time period of 2.60%6.42%. The difference between the actual per share NAV total return of CPER of 2.11%6.09% and the expected total return based on the SCI of 2.60%6.42% was an error over the time period of (0.49)(0.33)%, which is to say that CPER’s actual total return underperformed the SCI resultits benchmark by that percentage. CPER incurred expenses primarily composed of the management fee, brokerage commissions for the buying and selling of futures contracts, and other expenses. The impact of these expenses tended to cause daily changes in the per share NAV of CPER to track slightly lower than daily changes in the price of the SCI. USAG
For the 30-valuation days ended September 30, 2017, the simple average daily change in the SDAI was (0.0065)%, while the simple average daily change in the per share NAV of USAG over the same time period was (0.0153)%. The average daily difference was (0.009)% (or (0.9) basis points, where 1 basis point equals 1/100 of 1%). As a percentage of the daily movement of the SDAI, the average error in daily tracking by the per share NAV was 3.47%, meaning that over this time period USAG’s tracking error was within the plus or minus 10% range established as its benchmark tracking goal. This measurement is based on the relative movement in the benchmark. When the benchmark movement is small, small differences are magnified. On a daily basis, USAG is tracking very close to its benchmark.
Since the commencement of the offering of USAG’s shares to the public on April 13, 2012 to September 30,2017, the simple average daily change in the SDAI was (0.0209)%, while the simple average daily change in the per share NAV of USAG over the same time period was (0.0232)%. The average daily difference was (0.002)% (or (0.2) basis points, where 1 basis point equals 1/100 of 1%). As a percentage of the daily movement of the SDAI, the average error in daily tracking by the per share NAV was 5.53% , meaning that over this time period USAG’s tracking error was within the plus or minus 10% range established as its benchmark tracking goal. The first chart below shows the daily movement of USAG’s per share NAV versus the daily movement of the SDAI for the 30-valuation day period ended September 30, 2017. The second chart below shows the monthly total returns of USAG as compared to the monthly value of the SDAI for the five years ended September 30, 2017.
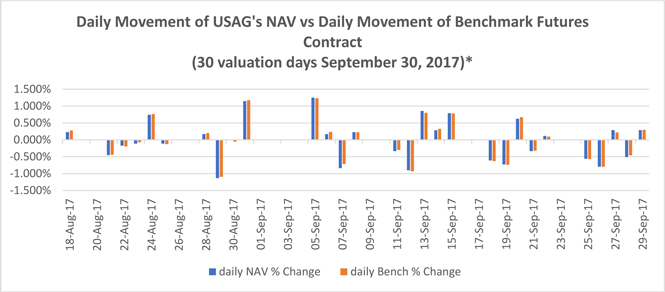
*PAST PERFORMANCE IS NOT NECESSARILY INDICATIVE OF FUTURE RESULTS
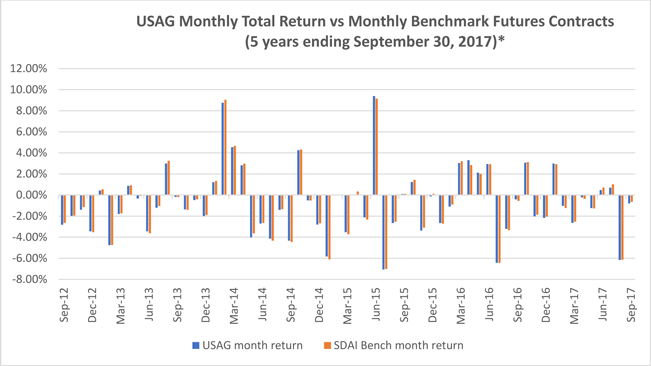
*PAST PERFORMANCE IS NOT NECESSARILY INDICATIVE OF FUTURE RESULTS
An alternative tracking measurement of the return performance of USAG versus the return of the SDAI can be calculated by comparing the actual return of USAG, measured by changes in its per share NAV, versus theexpected changes in its per share NAV under the assumption that USAG’s returns had been exactly the same as the daily changes in the price of the SDAI.
For the nine months ended September 30, 2017, the actual total return of USAG as measured by changes in its per share NAV was (7.84)%. This is based on an initial per share NAV of $19.01 as of December 31, 2016 and an ending per share NAV as of September 30, 2017, of $17.52. During this time period, USAG made no distributions to its shareholders. However, if USAG’s daily changes in its per share NAV had instead exactly tracked the changes in the daily total return of the SDAI, USAG would have had an estimated per share NAV of $17.59 as of September 30, 2017, for a total return over the relevant time period of (7.47)%. The difference between the actual per share NAV total return of USAG of (7.84)% and the expected total return based on the SDAI of (7.47)% was an error over the time period of (0.37)%, which is to say that USAG’s actual total return underperformed the SDAI result by that percentage. USAG incurs expenses primarily composed of the management fee, brokerage commissions for the buying and selling of futures contracts, and other expenses. The impact of these expenses, usuallyoffset by interest and dividend income, and net of positive or negative execution, tends to cause daily changes in the per share NAV of USAGCPER to track slightly lower or higher than daily changes in the price of the SDAI. In this case the NAV for USAG outperformed its benchmark.
By comparison, For the nine months ended September 30, 2016, the actual total return of USAG as measured by changes in its per share NAV was (2.83)%. This is based on an initial per share NAV of $19.80 as of December 31, 2015 and an ending per share NAV as of September 30, 2016, of $19.24. During this time period, USAG made no distributions to its shareholders. However, if USAG’s daily changes in its per share NAV had instead exactly tracked the changes in the daily total return of the SDAI, USAG would have had an estimated per share NAV of $19.14 as of September 30, 2016, for a total return over the relevant time period of (3.36)%. The difference between the actual per share NAV total return of USAG of (2.83)% and the expected total return based on the SDAI of (3.36)% was an error over the time period of 0.53%, which is to say that USAG’s actual total return outperformed the SDAI result by that percentage. USAG incurs expenses primarily composed of the management fee, brokerage commissions for the buying and selling of futures contracts, and other expenses. The impact of these expenses usually cause daily changes in the per share NAV of USAG to track slightly lower than daily changes in the price of the SDAI. In this case the NAV for USAG outperformed its benchmark.SCI.
Factors That Can Impact Ability to Track the Applicable Index There are currently five factors that have impacted or are most likely to impact a Trust Series’ ability to accurately track its Applicable Index. First, a Trust Series may buy or sell its holdings in the then current Applicable Benchmark Component Futures Contracts at a price other than the closing settlement price of that contract on the day during which such Trust Series executes the trade. In that case, a Trust Series may pay a price that is higher, or lower, than that of the Applicable Benchmark Component Futures Contracts, which could cause the changes in the daily per share NAV of a Trust Series to either be too high or too low relative to the daily changes in the price of the Applicable Index. During the nine months ended September 30, 2017, USCF attemptedattempts to minimize the effect of these transactions by seeking to execute its purchase or sale of the Applicable IndexBenchmark Component Futures Contracts at, or as close as possible to, the end of the day settlement price. However, it may not always be possible for a Trust Series to obtain the closing settlement price and there is no assurance that failure to obtain the closing settlement price in the future will not adversely impact a Trust Series’ attempt to track the Applicable Index over time. Index. Second, each Trust Series incurs expenses primarily composed of the management fees,fee, brokerage commissions for the buying and selling of futures contracts, and other expenses. The impact of these expenses tends to cause daily changes in the per share NAV of such Trust Series to track slightly lower than daily changes in the price of the Applicable Index. At the same time, each Trust Series earns dividend and interest income on its cash, cash equivalents and Treasuries. A Trust Series is not required to distribute any portion of its income to its shareholders and none of the Trust Series madedid not make any distributions to shareholders during the ninethree months ended September 30, 2017.March 31, 2023. Interest payments, and any other income, were retained within the portfolio and added to each Trust Series’ NAV. AtWhen this income exceeds the same time, eachlevel of a Trust Series incurredSeries’ expenses for its management fee, brokerage commissions and other expenses (including ongoing registration fees). The calculationfees, licensing fees and the fees and expenses of each Applicable Index includes an interest portion, calculated daily using the 90-Day U.S. Treasury Bill’s total return, but does not include an expense component. When a Trust Series’ income exceeds the sumindependent directors of its expenses by the yield on the 90-Day U.S. Treasury Bill,USCF), such Trust Series realizes a net yield that tendswill tend to cause daily changes in the per share NAV of such Trust Series to track slightly higher than daily changes in the price of the Applicable Index. If this net yield is lower than the yield on the 90-Day U.S. Treasury Bill, that tends to cause daily changes in the per share NAV of such Trust Series to track slightly lower than daily changes in the price of the Applicable Index. If short-term interest rates rise above the currentthese levels, the level of deviation created by the yield would decrease.increase. Conversely, if short-term interest rates were to decline, the amount of error created by the yield would increase.decrease. When short-term yields drop to a level lower than the combined expenses of the management fee and the brokerage commissions, then the tracking error becomes a negative number and would tend to cause the daily returns of the per share NAV to underperform the daily returns of the Applicable Index. USCF anticipates that interest rates willmay continue to remain atincrease over the near future from historical lows and, therefore, itlows. It is anticipated that fees and expenses paid by each Trust Series willmay continue to be higherlower than interest earned by each Trust Series. As such, USCF anticipates that each Trust Series will continue to underperform tracking the Applicable Index until such a time whencould possibly outperform its benchmark so long as interest earns at least equals or exceedsearned is higher than the fees and expenses paid by each Trust Series. Third, a Trust Series may hold Futures Contracts in a particular commodity other than the one specified as the Applicable Benchmark Component Futures Contract, or may hold Other Related Investments in its portfolio that may fail to closely track the Applicable Index’Index’s total return movements. Taking USCI as an example, assume for a given month one of the Applicable Benchmark Component Futures Contracts is the NYMEX WTI physically settled Futures Contract, trading under the symbol “CL,” for the contract month of November 2016.2020. It is possible that USCI could hold a NYMEX WTI financially settled Futures Contract, trading under the symbol “WS,” for the contract month of November 2016.2020. Alternatively, and using the same example, USCI could hold the ICE WTI financially settled Futures Contract, also for the contract month of November 2016.2020. As a third example, USCI could hold the NYMEX WTI physically settled Futures Contract, trading under the symbol “CL,” but for a contract month other than November 2016. 2020. During the three months ended March 31, 2023, no Trust Series held any Other Related Investments. Fourth, a Trust Series could hold Other RelatedOther-Related Investments. In any of these cases,that case, the error in tracking the Applicable Index could result in daily changes in the per share NAV of a Trust Series that are either too high, or too low, relative to the daily changes in the price of the Applicable Index. During the ninethree months ended September 30, 2017,March 31, 2023, none of the Trust Series held any Other RelatedOther-Related Investments, but did, at times, temporarily hold Futures Contracts that were in months other than the months specified as the Applicable Benchmark Component Futures Contract. If any Trust Series increases in size, and due to its obligations to comply with regulatory limits, or due to other market pricing or liquidity factors, such Trust Series may invest in Futures Contract months other than the designated month specified as the Applicable Benchmark Component Futures Contract, or in Other RelatedOther-Related Investments, which may have the effect of increasing transaction related expenses and may result in increased tracking error.
Finally, a Trust Series could hold the same Futures contracts as its benchmark but at a different weight. This is due to the fact that the benchmark can theoretically own a fractional percentage of a Futures contract but a Trust Series must own a full contract. For a Trust Series with smaller asset base, this percentage difference can have a material impact. The SDCI
The SDCI was developed based upon academic research by Yale University professors Gary B. Gortonis a commodity sector index designed to broadly represent major commodities while overweighting the components that are assessed to be in a low inventory state and K. Geert Rouwenhorst, and Hitotsubashi University professor Fumio Hayashi.underweighting the components assessed to be in a high inventory state. The SDCI is designed to reflect the performance of a fully margined or collateralized portfolio of 14 Eligible Commodity Futures Contractseligible commodity futures contracts with equal weights, selected each month from a universe of the 27 Eligible Commodity Futures Contracts.eligible commodity futures contracts. The SDCI is rules-based and rebalanced monthly based on observable price signals. In this context, the term “rules-based” is meant to indicate that the composition of the SDCI in any given month will be determined by quantitative formulas relating to the prices of the futures contracts that relate to the commodities that are eligible to be included in the SDCI. Such formulas are not subject to adjustment based on other factors. The overall return on the SDCI is generated by two components: (i) uncollateralized returns from the Applicable Benchmark Component Futures Contracts comprising the SDCI and (ii) a daily fixed income return reflecting the interest earned on a hypothetical 3-month U.S. Treasury Bill collateral portfolio, calculated using the weekly auction rate for the 3-Month U.S. Treasury Bills published by the U.SU.S. Department of the Treasury. SHIM is the owner of the SDCI. The Currently, the SDCI is composed of physical non-financial commodity futures contracts with active and liquid markets traded upon futures exchanges in major industrialized countries. The futures contracts are denominated in U.S. dollars and weighted equally by notional amount. The SDCI currently reflects commodities in sixfive commodity sectors: energy (e.g.petroleum (e.g., crude oil, natural gas, diesel-heatingheating oil, etc.), precious metals (e.g.(e.g., gold, silver platinum), industrial metals (e.g.(e.g., zinc, nickel, aluminum, copper, etc.), grains (e.g.(e.g., wheat, corn, soybeans, etc.), softs (e.g.and non-primary sector (e.g., sugar, cotton, coffee, cocoa), and livestock (e.g.,cocoa, natural gas, live cattle, lean hogs, feeder cattle).
Table 1 below lists the eligible commodities, the relevant Futures Exchangesfutures exchange on which the Eligible Commodity Futures Contracts arefutures contract is listed and quotation details. Table 2 lists the Eligible Commodity Futures Contracts,eligible futures contracts, their sector designation and maximum allowable tenor. TABLE 1 Commodity | | Designated Contract | | Exchange | | Units | | Quote | Commodity |
| Designated Contract |
| Exchange |
| Units |
| Quote | Aluminum | | High Grade Primary Aluminum | | LME | | 25 metric tons | | USD/metric ton | Cocoa | | Cocoa | | ICE-US | | 10 metric tons | | USD/metric ton | Coffee | | Coffee “C” | | ICE-US | | 37,500 lbs | | U.S. cents/pound | Copper | | Copper | | COMEX | | 25,000 lbs | | U.S. cents/pound | Corn | | Corn | | CBOT | | 5,000 bushels | | U.S. cents/bushel | Cotton | | Cotton | | ICE-US | | 50,000 lbs | | U.S. cents/pound | Crude Oil (WTI) | | Light, Sweet Crude Oil | | NYMEX | | 1,000 barrels | | USD/barrel | Crude Oil (Brent) | | Crude Oil | | ICE-UK | | 1,000 barrels | | USD/barrel | Gas Oil | | Gas Oil | | ICE-UK | | 100 metric tons | | USD/metric ton | Gold | | Gold | | COMEX | | 100 troy oz. | | USD/troy oz. | Heating Oil | | Heating Oil | | NYMEX | | 42,000 gallons | | U.S. cents/gallon | Lead | | Lead | | LME | | 25 metric tons | | USD/metric ton | Lean Hogs | | Lean Hogs | | CME | | 40,000 lbs. | | U.S. cents/pound | Live Cattle | | Live Cattle | | CME | | 40,000 lbs. | | U.S. cents/pound | Feeder Cattle | | Feeder Cattle | | CME | | 50,000 lbs. | | U.S. cents/pound | Natural Gas | | Henry Hub Natural Gas | | NYMEX | | 10,000 mmbtu | | USD/mmbtu | Nickel | | Primary Nickel | | LME | | 6 metric tons | | USD/metric ton | Platinum | | Platinum | | NYMEX | | 50 troy oz. | | USD/troy oz. | Silver | | Silver | | COMEX | | 5,000 troy oz. | | U.S. cents/troy oz. | Soybeans | | Soybeans | | CBOT | | 5,000 bushels | | U.S. cents/bushel | Soybean Meal | | Soybean Meal | | CBOT | | 100 tons | | USD/ton | Soybean Oil | | Soybean Oil | | CBOT | | 60,000 lbs. | | U.S. cents/pound | Sugar | | World Sugar No. 11 | | ICE-US | | 112,000 lbs. | | U.S. cents/pound | Tin | | Tin | | LME | | 5 metric tons | | USD/metric ton | Unleaded Gasoline | | Reformulated Blendstock for Oxygen Blending | | NYMEX | | 42,000 gallons | | U.S. cents/gallon | Wheat | | Wheat | | CBOT | | 5,000 bushels | | U.S. cents/bushel | Zinc | | Special High Grade Zinc | | LME | | 25 metric tons | | USD/metric ton |
TABLE 2 Commodity
Symbol | | Commodity Name | | Sector | | Allowed Contracts | | Max. Tenor | Commodity | | Commodity | | | | | | Max. | COSymbol |
| Name |
| Sector |
| Allowed Contracts |
| tenor | CO | | Brent Crude | | EnergyPetroleum | | All 12 Calendar Months | | 129 | CL | | Crude Oil | | EnergyPetroleum | | All 12 Calendar Months | | 129 | QS | | Gas Oil | | EnergyPetroleum | | All 12 Calendar Months | | 124 | HO | | Diesel-HeatingHeating Oil | | EnergyPetroleum | | All 12 Calendar Months | | 124 | NGXB | | Natural GasRBOB | | EnergyPetroleum | | All 12 Calendar Months | | 124 | XBBO | | RBOBSoybean Oil | | EnergyGrains | | Jan, Mar, May, Jul, Aug, Sep, Oct, Dec | | 1 | C | | Corn | | Grains | | Mar, May, Jul, Sep, Dec | | 4 | S | | Soybeans | | Grains | | Jan, Mar, May, Jul, Aug, Nov | | 4 | SM | | Soymeal | | Grains | | Jan, Mar, May, Jul, Aug, Sep, Oct, Dec | | 3 | W | | Wheat (Soft Red Winter) | | Grains | | Mar, May, Jul, Sep, Dec | | 4 | LA | | Aluminum | | Industrial Metals | | All 12 Calendar months | | 4 | HG | | Copper | | Industrial Metals | | Mar, May, Jul, Sep, Dec | | 1 | LL | | Lead | | Industrial Metals | | All 12 Calendar Months | | 124 | FCLN | | Nickel | | Industrial Metals | | All 12 Calendar Months | | 4 | LT | | Tin | | Industrial Metals | | All 12 Calendar Months | | 1 | LX | | Zinc | | Industrial Metals | | All 12 Calendar Months | | 4 | GC | | Gold | | Precious Metals | | Feb, Apr, Jun, Aug, Oct, Dec | | 1 | PL | | Platinum | | Precious Metals | | Jan, Apr, Jul, Oct | | 1 | SI | | Silver | | Precious Metals | | Mar, May, Jul, Sep, Dec | | 1 | NG | | Natural Gas | | Non-Primary Sector | | All 12 Calendar Months | | 6 | FC | | Feeder Cattle | | LivestockNon-Primary Sector | | Jan, Mar, Apr, May, Aug, Sep, Oct, Nov | | 51 | LH | | Lean Hogs | | LivestockNon-Primary Sector | | Feb, Apr, Jun, Jul, Aug, Oct, Dec | | 51 | LC | | Live Cattle | | LivestockNon-Primary Sector | | Feb, Apr, Jun, Aug, Oct, Dec | | 53 | BOCC | | Soybean OilCocoa | | GrainsNon-Primary Sector | | Jan, Mar, May, Jul, Aug, Sep, Oct, Dec | | 7 | C | | Corn | | Grains | | Mar, May, Jul, Sep, Dec | | 121 | SKC | | SoybeansCoffee | | GrainsNon-Primary Sector | | Jan, Mar, May, Jul, Aug, Sep, Nov | | 12 | SM | | Soymeal | | Grains | | Jan, Mar, May, Jul, Aug, Sep, Oct, Dec | | 7 | W | | Wheat (Soft Red Winter) | | Grains | | Mar, May, Jul, Sep, Dec | | 71 | LACT | | AluminumCotton | | Industrial MetalsNon-Primary Sector | | All 12 Calendar months | | 12 | HG | | Copper | | Industrial Metals | | All 12 Calendar Months | | 12 | LL | | Lead | | Industrial Metals | | All 12 Calendar Months | | 7 | LN | | Nickel | | Industrial Metals | | All 12 Calendar Months | | 7 | LT | | Tin | | Industrial Metals | | All 12 Calendar Months | | 7 | LX | | Zinc | | Industrial Metals | | All 12 Calendar Months | | 7 | GC | | Gold | | Precious Metals | | Feb, Apr, Jun, Aug, Oct, Dec | | 12 | PL | | Platinum | | Precious Metals | | Jan, Apr, Jul, Oct | | 5 | SI | | Silver | | Precious Metals | | Mar, May, Jul, Sep, Dec | | 5 | CC | | Cocoa | | Softs | | Mar, May, Jul, Sep, Dec | | 7 | KC | | Coffee | | Softs | | Mar, May, Jul, Sep, Dec | | 7 | CT | | Cotton | | Softs | | Mar, May, Jul, Dec | | 71 | SB | | Sugar | | SoftsNon-Primary Sector | | Mar, May, Jul, Oct | | 73 |
Prior to the end of each month, SHIM determines the composition of the SDCI and provides such information to Bloomberg, L.P. (“Bloomberg”).Bloomberg. Values of the SDCI are computed by Bloomberg and disseminated approximately every fifteen (15) seconds from 8:00 a.m. to 5:00 p.m., New York City time, which also publishes a daily SDCI value at approximately 5:30 p.m., New York City time, under the index ticker symbol “SDCITR:IND.” Only settlement and last-sale prices are used in the SDCI’s calculation, bids and offers are not recognized — including limit-bid and limit-offer price quotes. Where no last-sale price exists, typically in the more deferred contract months, the previous days’ settlement price is used. This means that the underlying SDCI may lag its theoretical value. This tendency to lag is evident at the end of the day when the SDCI value is based on the settlement prices of the Applicable Benchmark Component Futures Contracts, and explains why the underlying SDCI often closes at or near the high or low for the day. Composition of the SDCI The composition of the SDCI on any given day, as determined and published by SHIM, is determinative of the benchmark for USCI. However, it is not possible to anticipate all possible circumstances and events that may occur with respect to the SDCI and the methodology for its composition, weighting and calculation. Accordingly, a number of subjective judgments must be made in connection with the operation of the SDCI that cannot be adequately reflected in this description of the SDCI. All questions of interpretation with respect to the application of the provisions of the SDCI methodology, including any determinations that need to be made in the event of a market emergency or other extraordinary circumstances, will be resolved by SHIM. The composition of the SDCI was revised beginning with the commodity selection process that commenced on December 24, 2020. SHIM revised the composition of the SDCI to consolidate the six commodity sectors that comprised the index into five sectors. Specifically, prior to December 24, 2020, the SDCI reflected commodities in six commodity sectors: energy (e.g., crude oil, natural gas, heating oil, etc.), precious metals (e.g., gold, silver platinum), industrial metals (e.g., zinc, nickel, aluminum, copper, etc.), grains (e.g., wheat, corn, soybeans, etc.), softs (e.g., sugar, cotton, coffee, cocoa), and livestock (e.g., live cattle, lean hogs, feeder cattle). Since then, the composition of SDCI has reflected the five commodity sectors: petroleum (e.g., crude oil, heating oil, etc.), precious metals (e.g., gold, silver platinum), industrial metals (e.g., zinc, nickel, aluminum, copper, etc.), grains (e.g., wheat, corn, soybeans, etc.), and non-primary sector (e.g., sugar, cotton, coffee, cocoa, natural gas, live cattle, lean hogs, feeder cattle), discussed above and utilized the commodity selection as described below. Contract Expirations Because the SDCI is comprised of actively traded contracts with scheduled expirations, it can be calculated only by reference to the prices of contracts for specified expiration, delivery or settlement periods, referred to as contract expirations. The contract expirations included in the SDCI for each commodity during a given year are designated by SHIM, provided that each contract must be an active contract. An active contract for this purpose is a liquid, actively-tradedactively- traded contract expiration, as defined or identified by the relevant trading facility or, if no such definition or identification is provided by the relevant trading facility, as defined by standard custom and practice in the industry. If a Futures Exchange ceases trading in all contract expirations relating to a particular Futures Contract, SHIM may designate a replacement contract on the commodity. The replacement contract must satisfy the eligibility criteria for inclusion in the SDCI. To the extent practicable, the replacement will be effected during the next monthly review of the composition of the SDCI. If that timing is not practicable, SHIM will determine the date of the replacement based on a number of factors, including the differences between the existing Futures Contract and the replacement Futures Contract with respect to contractual specifications and contract expirations.
If a contract is eliminated and there is no replacement contract, the underlying commodity will necessarily be dropped from the SDCI. The designation of a replacement contract, or the elimination of a commodity from the SDCI because of the absence of a replacement contract, could affect the value of the SDCI, either positively or negatively, depending on the price of the contract that is eliminated and the prices of the remaining contracts. It is impossible, however, to predict the effect of these changes, if they occur, on the value of the SDCI. Commodity Selection Fourteen of the 27 eligible Futures Contracts are selected for inclusion in the SDCI for the next month, subject to the constraint that each of the sixfour commodity sectors (excluding non-primary sector) is represented by at least one commodity. The methodology used to select the 14 Futures Contracts is based solely on quantitative data using observable futures prices and is not subject to human bias. Monthly commodity selection is a two-step process based upon examination of the relevant futures prices for each commodity: 1) The annualized percentage price difference between the closest-to-expiration Futures Contract and the next closest- to-expiration Futures Contract is calculated for each of the 27 eligible Futures Contracts on USCI’s Selection Date. | 1) | The annualized percentage price difference between the closest-to-expiration Futures Contract and the next closest-to-expiration Futures Contract is calculated for each of the 27 eligible Futures Contracts on the Selection Date. The seven2) The 14 commodities with the highest percentage price difference are selected. When evaluating the data from the first step, all four primary commodity sectors must be represented (Petroleum, Grains, Industrial Metals and Precious Metals). If the selection of the 14 commodities with the highest percentage price difference are selected. |
| 2) | For the remaining 20 eligible commodities, the percentage price change of each commodity over the previous year is calculated, as measured by the change in the price of the closest-to-expiration Futures Contract on the Selection Date from the price of the closest-to-expiration Futures Contract a year prior to the Selection Date. The seven commodities with the highest percentage price change are selected. |
When evaluating the data from the second step, all six commodity sectors must be represented. If the selection of the seven additional commodities with the highest price change fails to meet the overall diversification requirement that all sixfour primary commodity sectors are represented in the SDCI, the commodity with the highest percentage price changedifference among the commodities of the omitted primary sector(s) would be substituted for the commodity with the lowest percentage price changedifference among the seven additionalfourteen commodities.
The 14 commodities selected are included in the SDCI for the next month on an equally-weighted basis. Due to the dynamic monthly commodity selection, the sector weights will vary from approximately 7% to 43% over time, depending on the price observations each month. The Selection Date for the SDCI is the fifth business day prior to the first business dayend of the nextthat calendar month. The following graph shows the sector weights of the commodities selected for inclusion in the SDCI as of September 30, 2017.March 31, 2023. SDCI Commodity Weights
as of September 30, 2017
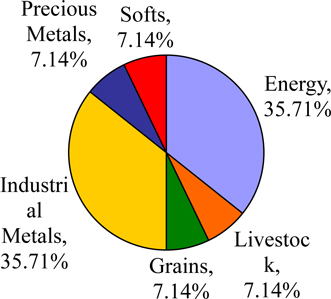
Contract Selection For each commodity selected for inclusion into the SDCI for a particular month, the SDCI selects a specific Benchmark Component Futures Contract with a tenor (i.e.(i.e., contract month) among the eligible tenors (the range of contract months) based upon the relative prices of the Applicable Benchmark Component Futures Contracts within the eligible range of contract months. The previous notwithstanding, the contract expiration is not changed for such month if a contract remains in the SDCI, as long as the contract does not expire or enter its notice period in the subsequent month. Portfolio Construction The portfolio rebalancing takes place during the last four business days of the month (the “Rebalancing Period”).Rebalancing Period. At the end of each of the days in the Rebalancing Period, one fourth of the prior month portfolio positions are replaced by an equally-weighted position in the commodity contracts determined on theUSCI’s Selection Date. At the end of the Rebalancing Period, the SDCI takes an equal-weight position of approximately 7.14% in each of the selected commodity contracts. SDCI Total Return Calculation The value of the SDCI on any business day is equal to the product of (i) the value of the SDCI on the immediately preceding business day multiplied by (ii) one plus the sum of the day’s returns for another version of the SDCI known as the SummerHaven Dynamic Commodity Index Excess Return (“SDCI ER”) (explained below) and one business day’s interest from hypothetical Treasuries. The value of the SDCI is calculated and published by Bloomberg. SDCI Base Level The SDCI was set to 100 on January 2, 1991. SDCI ER Calculation The total return of the SDCI ER reflects the percentage change of the market values of the underlying commodity futures. During the Rebalancing Period, the SDCI changes its contract holdings during a four day period. The value of the SDCI ER at the end of a business day “t” is equal to the SDCI ER value on day “t-1” multiplied by the sum of the daily percentage price changes of each commodity future factoring in each respective commodity future’s notional holding on day “t-1”. Rebalancing Period During the Rebalancing Period, existing positions are replaced by new positions based on the signals used for contract selection as outlined above. At the end of the first day of the Rebalancing Period,Selection Date, the signals are observed and on the secondfirst day following Selection Date a new portfolio is constructed that is equally weighted in terms of notional positions in the newly selected contracts. Hypothetical Performance of Each Applicable Index the SDCI The table and chart below show the hypothetical performance of the SDCI from January 1, 20072013 through September 30, 2017.March 31, 2023. The composition of the SDCI was revised effective December 24, 2020. Beginning with the commodity selection process that commenced on December 24, 2020, SHIM revised the composition of the SDCI to consolidate the six commodity sectors that comprised the index into five sectors. Specifically, prior to December 24, 2020, the SDCI reflected commodities in six commodity sectors: energy (e.g., crude oil, natural gas, heating oil, etc.), precious metals (e.g., gold, silver platinum), industrial metals (e.g., zinc, nickel, aluminum, copper, etc.), grains (e.g., wheat, corn, soybeans, etc.), softs (e.g., sugar, cotton, coffee, cocoa), and livestock (e.g., live cattle, lean hogs, feeder cattle). HYPOTHETICAL PERFORMANCE RESULTS HAVE MANY INHERENT LIMITATIONS, SOME OF WHICH ARE DESCRIBED BELOW. NO REPRESENTATION IS BEING MADE THAT USCI WILL OR IS LIKELY TO ACHIEVE PROFITS OR LOSSES SIMILAR TO THOSE SHOWN. IN FACT, THERE ARE FREQUENTLY SHARP DIFFERENCES BETWEEN HYPOTHETICAL PERFORMANCE RESULTS AND THE ACTUAL RESULTS ACHIEVED BY ANY PARTICULAR TRADING PROGRAM. ONE OF THE LIMITATIONS OF HYPOTHETICAL PERFORMANCE RESULTS IS THAT THEY ARE GENERALLY PREPARED WITH THE BENEFIT OF HINDSIGHT. IN ADDITION, HYPOTHETICAL TRADING DOES NOT INVOLVE FINANCIAL RISK, AND NO HYPOTHETICAL TRADING RECORD CAN COMPLETELY ACCOUNT FOR THE IMPACT OF FINANCIAL RISK IN ACTUAL TRADING. FOR EXAMPLE, THE ABILITY TO WITHSTAND LOSSES OR TO ADHERE TO A PARTICULAR TRADING PROGRAM IN SPITE OF TRADING LOSSES ARE MATERIAL POINTS WHICH CAN ALSO ADVERSELY AFFECT ACTUAL TRADING RESULTS. THERE ARE NUMEROUS OTHER FACTORS RELATED TO THE MARKETS IN GENERAL OR TO THE IMPLEMENTATION OF ANY SPECIFIC TRADING PROGRAM WHICH CANNOT BE FULLY ACCOUNTED FOR IN THE PREPARATION OF HYPOTHETICAL PERFORMANCE RESULTS AND ALL OF WHICH CAN ADVERSELY AFFECT ACTUAL TRADING RESULTS. USCF HAS HAD LITTLE OR NO EXPERIENCE IN TRADING ACTUAL ACCOUNTS FOR CUSTOMERS. BECAUSE THERE ARE NO ACTUAL TRADING RESULTS TO COMPARE TO THE HYPOTHETICAL PERFORMANCE RESULTS, CUSTOMERS SHOULD BE PARTICULARLY WARY OF PLACING UNDUE RELIANCE ON THESE HYPOTHETICAL PERFORMANCE RESULTS.
Since the SDCI was launched on December 18, 2009, there is only actual performance history of the SDCI from that date to the present. This data is available for periods prior to December 18, 2009. However, the components of the SDCI and the weighting of the components of the SDCI are established each month based on purely quantitative data that is not subject to revision based on other external factors. As a result, the table below reflects how the SDCI would have performed from January 1, 2007 through September 30, 2017 had it been in effect during such time period. The performance data does not reflect any reinvestment or distribution of profits, commission charges, management fees or other expenses that would have been incurred in connection with operating and managing a commodity pool designed to track the SDCI. Such fees and expenses would reduce the performance returns shown in the table below.
PAST PERFORMANCE IS NOT NECESSARILY INDICATIVE OF FUTURE RESULTS Hypothetical Performance Results* for the period from from January 1, 2007Year Ending 2013 through September 30, 2017March 31, 2023 YTD
| | | | | | Year | | Ending Level* | | Annual Return | | 2013 | | 1,678.73 | | (2.77) | % | 2014 | | 1,475.68 | | (12.10) | % | 2015 | | 1,265.58 | | (14.24) | % | 2016 | | 1,262.46 | | (0.25) | % | 2017 | | 1,364.38 | | 8.07 | % | 2018 | | 1,221.18 | | (10.50) | % | 2019 | | 1,219.05 | | (0.17) | % | 2020 | | 1,089.40 | | (10.64) | % | 2021 | | 1,468.49 | | 34.80 | % | 2022 | | 1,933.23 | | 31.65 | % | 2023 (YTD) | | 1,872.88 | | (3.12) | % |
| Year | | Ending Level* | | | Annual Return | | | 2007 | | | 1,518.71 | | | | 36.11 | % | | 2008 | | | 1,175.77 | | | | (22.58 | )% | | 2009 | | | 1,532.84 | | | | 30.37 | % | | 2010 | | | 1,852.04 | | | | 20.82 | % | | 2011 | | | 1,703.23 | | | | (8.03 | )% | | 2012 | | | 1,726.55 | | | | 1.37 | % | | 2013 | | | 1,678.73 | | | | (2.77 | )% | | 2014 | | | 1,475.68 | | | | (12.10 | )% | | 2015 | | | 1,265.58 | | | | (14.24 | )% | | 2016 | | | 1,262.46 | | | | (0.25 | )% | | 2017 (YTD) | | | 1,282.17 | | | | 1.56 | % |
*The “base level” for the SDCI was set at 100 on January 2, 1991. The “Ending Level” represents the value of the components of the SDCI on the last trading day of each year and is used to illustrate the cumulative performance of the SDCI. In addition to the actual performance of the SDCI, this chart includes the hypothetical performance of the SDCI had the changes to the composition of the SDCI, which became effective on December 24, 2020, been effective during the January 1, 2013 through December 24, 2020 period. PAST PERFORMANCE IS NOT NECESSARILY INDICATIVE OF FUTURE RESULTS
SummerHaven Dynamic Commodity Index Total ReturnSM(“SDCI”) Year-Over-Year Hypothetical Total Returns (1/1/2007-9/30/2017(Year Ending 2013 through- 3/31/23 YTD)*

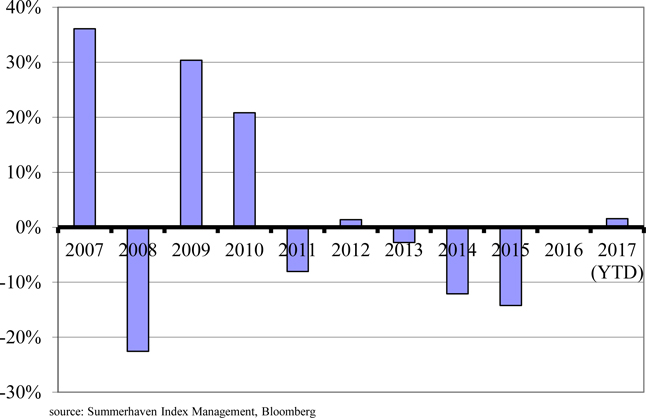
PAST PERFORMANCE IS NOT NECESSARILY INDICATIVE OF FUTURE RESULTS
* In addition to the actual performance of the SDCI, this chart includes as “SDCI Hypothetical TR” the hypothetical performance of the SDCI had the changes to the composition of the SDCI, which became effective on December 24, 2020, been effective during the January 1, 2013 through December 24, 2020 period. The following table and chart compare the hypothetical total return of the SDCI in comparison with the actual total return of three major indexes for the period from December 31, 1997 to September 30, 2017.March 31, 2023. | | | Hypothetical and Historical Results for the period from | | | | | December 31, 1997 through September 30, 2017 | | | | | BCOM TR | | | S&P GSCI TR | | | DB LCI OY TR | | | SDCI TR | | | Total return | | | 11.18 | % | | | (23.95 | )% | | | 152.50 | % | | | 469.80 | % | | Average annual return (total) | | | 2.54 | % | | | 2.52 | % | | | 7.38 | % | | | 11.10 | % | | Annualized volatility | | | 16.36 | % | | | 22.80 | % | | | 18.79 | % | | | 14.97 | % | | Annualized Sharpe ratio | | | 0.03 | | | | 0.02 | | | | 0.28 | | | | 0.59 | |
Source: SHIM, Bloomberg
*PAST PERFORMANCE IS NOT NECESSARILY INDICATIVE OF FUTURE RESULTS | | | | | | | | | | | | Hypothetical and Historical Results for the period | | | | from December 31, 1997 through March 31, 2023 | | | | | | S&P GSCI | | DB LCI OY | | SDCI TR | | | | BCOM TR | | TR | | TR | | Actual | | Total return | | 50.54 | % | 8.62 | % | 323.11 | % | 732.31 | % | Average annualized return (total) | | 2.74 | % | 3.50 | % | 7.88 | % | 10.37 | % | Annualized volatility | | 16.11 | % | 23.20 | % | 18.90 | % | 15.45 | % | Annualized Sharpe ratio | | 0.05 | | 0.06 | | 0.30 | | 0.53 | |
Source: SHIM, Bloomberg The table immediately above shows the performance of the SDCI from December 31, 1997 through September 30, 2017March 31, 2023 in comparison with three traditional commodities indices: the S&P GSCI Commodity Index (GSCI®(GSCI®) Total Return, Bloomberg Commodity Index Total ReturnSM (“BCOM TR”), and the Deutsche Bank Liquid Commodity Index-Optimum Yield Total ReturnTM(“DB LCI OYTR”). The S&P GSCI®GSCI® Commodity Index Total Return is a composite index of commodity sector returns representing an unleveraged, long-only investment in commodity futures that is broadly diversified across the spectrum of commodities. The Bloomberg Commodity Index Total ReturnSM is currently composed of futures contracts on a diversified basket of commodities traded on U.S. exchanges. The Deutsche Bank Liquid Commodity Index-Optimum Yield Total ReturnTM is designed to reflect the performance of certain wheat, corn, light sweet crude oil, heating oil, gold and aluminum futures contracts plus the returns from investing in 3-month U.S. Treasury Bills. The data for the SDCI Total Return Index is derived by using the SDCI’s calculation methodology with historical prices for the futures contracts comprising the SDCI. The information about each of the indices comes from publicly-available material about such indices but is not designed to provide a thorough overview of the methodology of each index.
None of the indices has an investment objective identical to the SDCI. As a result, there are inherent limitations in comparing the performance of such indices against the SDCI. For more information about these indices and their methodologies, please refer to the material published by the sponsors of each such index which may be found on their websites. USCI is not responsible for any information found on such websites, and such information is not part of this quarterly report on Form 10-Q. In the table above, “Total Return” refers to the return of the relevant index from December 31, 1997 to March 31, 2023; “Annualized Volatility” is a measure of the amount of variation or fluctuation in the returns of the relevant index. Annualized Volatility is calculated by taking the monthly standard deviation of the relevant index’s return and multiplying it by the square root of 12; and “Annualized Sharpe Ratio” is a measure of the total return of each relevant index adjusted by the risk-free interest rate (the 90-Day U.S. Treasury Bill yield) and the volatility of each index. Many investors consider volatility to be a measure of risk, and lower volatility of investment returns is considered a positive investment attribute as opposed to higher volatility. Annualized Sharpe Ratio is a standard measure for investors to compare two different investments or indexes that have different levels of volatility. If two indexes have the same total return, but one has lower Annualized Volatility, then its Annualized Sharpe Ratio will be higher. The higher the Annualized Sharpe Ratio, the better the risk-adjusted performance. Annualized Sharpe Ratio is calculated by taking the average monthly total return of the relevant index and subtracting the then current yield on the 90-Day U.S. Treasury Bill. The annualized return of this series is then divided by the Annualized Volatility of this series, and this result is the Annualized Sharpe Ratio for the relevant index. A higher Sharpe Ratio is not a guarantee that one investment or index will in the future produce better risk adjustment total returns, but USCF believes it is a useful tool for investors to consider when making investment decisions. The following chart compares the total return of the SDCI in comparison with the actual total return of three major indexes between March 31, 2013 and March 31, 2023, where the SDCI TR includes the initial composition of the index until December 24, 2020 when changes to the index composition became effective. PAST PERFORMANCE IS NOT NECESSARILY INDICATIVE OF FUTURE RESULTS Ten Year Comparison of Index Returns of the BCOM TR, S&P GSCI TR, DB LCI OY TR, and the SDCI TR (3/31/2013-3/31/2023) 
Source: SHIM, Bloomberg The following chart compares the total return of the SDCI in comparison with the actual total return of three major indexes over a five year period, where the SDCI TR includes the initial composition of the index until December 24, 2020 when changes to the index composition became effective. PAST PERFORMANCE IS NOT NECESSARILY INDICATIVE OF FUTURE RESULTS Five Year Comparison of Index Returns of the BCOM TR, S&P GSCI TR, DB LCI OY TR, and the SDCI TR (3/31/2018-3/31/2023) 
Source: SHIM, Bloomberg SCI The SCI is a single-commodity index designed to be an investment benchmark for copper as an asset class. The SCI is composed of copper futures contracts on the COMEX exchange. The SCI attempts to maximize backwardation and minimize contango while utilizing contracts in liquid portions of the futures curve. The SCI is rules-based and is rebalanced monthly based on observable price signals described below in the section “Contract Selection and Weighting.” In this context, the term “rules-based” is meant to indicate that the composition of the SCI in any given month will be determined by quantitative formulas relating to the prices of the futures contracts that are included in the SCI. Such formulas are not subject to adjustment based on other factors. The overall return on the SCI is generated by two components: (i) uncollateralized returns from the Benchmark Component Copper Futures Contracts comprising the SCI, and (ii) a daily fixed income return reflecting the interest earned on hypothetical 3-month Treasuries, calculated using the weekly auction rate for 3-Month Treasuries published by the U.S. Department of the Treasury. SHIM is the owner of the SCI. Table 1 below lists the Futures Exchange on which the Eligible Copper Futures Contracts are listed and quotation details. Table 2 lists the Eligible Copper Futures Contracts, their sector designation and maximum allowable tenor. TABLE 1 | | | | | | | | | Commodity |
| Designated Contract |
| Exchange |
| Units |
| Quote | Copper | | Copper | | COMEX | | 25,000 lbs | | U.S. cents/pound |
TABLE 2 | | | | | | | | | Commodity |
| |
| Max. | Commodity Name |
| Symbol |
| Allowed Contracts |
| Tenor | Copper | | HG | | All 12 calendar months | | 12 |
Prior to the end of each month, SHIM determines the composition of the SCI and provides such information to the NYSE Arca. Values of the SCI are computed by the NYSE Arca and disseminated approximately every fifteen (15) seconds from 8:00 a.m. to 5:00 p.m., New York City time, which also publishes a daily SCI value at approximately 5:30 p.m., New York City time, under the index ticker symbol “SCI.” Only settlement and last-sale prices are used in the SCI’s calculation, bids and offers are not recognized — including limit-bid and limit-offer price quotes. Where no last-sale price exists, typically in the more deferred contract months, the previous days’ settlement price is used. This means that the underlying SCI may lag its theoretical value. This tendency to lag is evident at the end of the day when the SCI value is based on the settlement prices of the Benchmark Component Copper Futures Contracts, and explains why the underlying SCI often closes at or near the high or low for the day. Composition of the SCI The composition of the SCI on any given day, as determined and published by SHIM, is determinative of the benchmark for CPER. Neither the index methodology for the SCI nor any set of procedures, however, are capable of anticipating all possible circumstances and events that may occur with respect to the SCI and the methodology for its composition, weighting and calculation. Accordingly, a number of subjective judgments must be made in connection with the operation of the SCI that cannot be adequately reflected in this description of the SCI. All questions of interpretation with respect to the application of the provisions of the index methodology for the SCI, including any determinations that need to be made in the event of a market emergency or other extraordinary circumstances, will be resolved by SHIM. Beginning with the commodity selection process that was scheduled to occur on December 31, 2020, the rebalancing period for the SCI changed from the first four business days of each month to the 11th-14th business days of each month, based on signals used for contract selection on the 10th business day of each month, rather than the last business day of each month. In addition, commencing with the first commodity selection date occurring after the change, the SCI was revised as follows: the number of Eligible Copper Futures Contracts was reduced, and the SCI itself is now comprised of one or three Eligible Copper Futures Contracts. Previously, the SCI could have been comprised of two or three Eligible Copper Futures Contracts. These revisions to the composition of the SCI are intended to ensure that the SCI components at any given time represent copper futures contracts for which there is an active and liquid trading market. Contract Expirations Because the SCI is comprised of actively traded contracts with scheduled expirations, it can be calculated only by reference to the prices of contracts for specified expiration, delivery or settlement periods, referred to as contract expirations. The contract expirations included in the SCI for each commodity during a given year are designated by SHIM, provided that each contract must be an active contract. An active contract for this purpose is a liquid, actively-traded contract expiration, as defined or identified by the relevant trading facility or, if no such definition or identification is provided by the relevant trading facility, as defined by standard custom and practice in the industry. If a futures exchange, such as the COMEX, ceases trading in all contract expirations relating to an Eligible Copper Futures Contract, SHIM may designate a replacement contract. The replacement contract must satisfy the eligibility criteria for inclusion in the SCI. To the extent practicable, the replacement will be effected during the next monthly review of the composition of the SCI. If that timing is not practicable, SHIM will determine the date of the replacement based on a number of factors, including the differences between the existing Benchmark Component Copper Futures Contract and the replacement contract with respect to contractual specifications and contract expirations. The designation of a replacement contract could affect the value of the SCI, either positively or negatively, depending on the price of the contract that is eliminated and the prices of the replacement contract. It is impossible, however, to predict the effect of these changes, if they occur, on the value of the SCI. Contract Selection and Weighting Weights for each of the Benchmark Component Copper Futures Contracts are determined for the next month. The methodology used to calculate the SCI weighting is based solely on quantitative data using observable futures prices and is not subject to human bias. The monthly weighting selection is a process based upon examination of the relevant futures prices for copper: | 1) | On CPER’s Selection Date (“CPER’s Selection Date”): |
| a) | the copper futures curve is assessed to be in either backwardation or contango (as discussed below); and |
| b) | the Three Eligible Copper Futures Contracts are identified. For each month, the Three Eligible Copper Futures Contracts are as follows |
| | | | | | | | | | | | | | | | | | | | | | | | | Month |
| January |
| February |
| March |
| April |
| May |
| June |
| July |
| August |
| September |
| October |
| November |
| December | Closest to Expiration Futures Contract | | Mar | | Mar | | May | | May | | Jul | | Jul | | Sep | | Sep | | Dec | | Dec | | Dec | | Mar | Eligible Futures Contracts | | Mar | | May | | May | | Jul | | Jul | | Sep | | Sep | | Dec | | Dec | | Dec | | Mar | | Mar | | | May | | July | | July | | Sep | | Sep | | Dec | | Dec | | Mar | | Mar | | Mar | | May | | May | | | July | | Sep | | Sep | | Dec | | Dec | | Mar | | Mar | | May | | May | | May | | Jul | | Jul |
A futures curve in backwardation occurs when the price of the closest-to-expiration Eligible Copper Futures Contract is greater than or equal to the price of the next closest-to-expiration Eligible Copper Futures Contract. These contracts will have expirations that are approximately two or three months apart. A curve not in backwardation is defined as being in contango, which occurs when the price of the closest-to-expiration contract is less than the price of the next closest-to-expiration contract. 2a) Backwardation: If the copper futures curve is in backwardation on the Selection Date, the SCI takes positions in the first Eligible Copper Futures Contract, weighted at 100%. A hypothetical example is included below, with the selected Eligible Copper Futures Contract shaded below: | | | | | |
| |
| Contract | Copper Futures Contract | | Expiration Date | | Price | Nearest-to-maturity | | December-10 | | 374.70 | Next nearest-to-maturity | | March-11 | | 365.20 |
| | | Eligible Copper Futures Contracts |
| Price | December-10 | | 374.70 |
2b) Contango: If the copper futures curve is in contango, then the SCI takes positions in first three Eligible Copper Futures Contracts, each position is weighted at 33.33%. A hypothetical example is included below, with the three selected Eligible Copper Futures Contracts indicated below: | | | | | Copper Futures Contract | | Expiration Date | | Contract Price | Nearest-to-maturity | | December-10 | | 374.00 | Next nearest-to-maturity | | March-11 | | 375.70 |
| | | Eligible Copper Futures Contracts |
| Price | December-10 | | 374.00 | March-11 | | 375.70 | May-11 | | 376.30 |
Due to the dynamic monthly weighting calculation, the individual weights will vary-over time, depending on the price observations each month. CPER’s Selection Date for the SCI is the 10th business day of the calendar month. The following graph shows the weights of the Benchmark Component Copper Futures Contracts selected for inclusion in the SCI as of March 31, 2023. 
Portfolio Construction The portfolio rebalancing takes place during the Rebalancing Period. At the end of each of the days in the Rebalancing Period one fourth of the prior month portfolio positions are replaced by the new weights for the Benchmark Component Copper Futures Contracts determined on CPER’s Selection Date. SCI Total Return Calculation The value of the SCI on any business day is equal to the product of (i) the value of the SCI on the immediately preceding business day multiplied by (ii) one plus the sum of the day’s returns for another version of the SCI known as the SummerHaven Dynamic Copper Index Excess Return (“SCI ER”) (explained below) and one business day’s interest from the hypothetical Treasury Bill portfolio. The value of the SCI will be calculated and published by the NYSE Arca. SCI Base Level The SCI was set to 100 on January 2, 1991. SCI ER Calculation The total return of the SCI ER reflects the percentage change of the market values of the underlying commodity futures. During the Rebalancing Period, the SCI changes its contract holdings and weightings during a four day period. The value of the SCI ER at the end of a business day “t” is equal to the SCI ER value on day “t-1” multiplied by the sum of the daily percentage price changes of each commodity future factoring in each respective commodity future’s notional holding on day “t-1”. Rebalancing Period The SCI is rebalanced during the 11th-14th business days of each month, based on signals used for contract selection on the 10th business day of each month, when existing positions are placed by new positions and weightings based on the signals used for contract selection on the prior calendar month as outlined above. Hypothetical Performance of the SCI The table and chart below show the hypothetical performance of the SCI from January 1, 2013 through March 31, 2023. HYPOTHETICAL PERFORMANCE RESULTS HAVE MANY INHERENT LIMITATIONS, SOME OF WHICH ARE DESCRIBED BELOW. NO REPRESENTATION IS BEING MADE THAT CPER WILL OR IS LIKELY TO ACHIEVE PROFITS OR LOSSES SIMILAR TO THOSE SHOWN. IN FACT, THERE ARE FREQUENTLY SHARP DIFFERENCES BETWEEN HYPOTHETICAL PERFORMANCE RESULTS AND THE ACTUAL RESULTS ACHIEVED BY ANY PARTICULAR TRADING PROGRAM. ONE OF THE LIMITATIONS OF HYPOTHETICAL PERFORMANCE RESULTS IS THAT THEY ARE GENERALLY PREPARED WITH THE BENEFIT OF HINDSIGHT. IN ADDITION, HYPOTHETICAL TRADING DOES NOT INVOLVE FINANCIAL RISK, AND NO HYPOTHETICAL TRADING RECORD CAN COMPLETELY ACCOUNT FOR THE IMPACT OF FINANCIAL RISK IN ACTUAL TRADING. FOR EXAMPLE, THE ABILITY TO WITHSTAND LOSSES OR TO ADHERE TO A PARTICULAR TRADING PROGRAM IN SPITE OF TRADING LOSSES ARE MATERIAL POINTS WHICH CAN ALSO ADVERSELY AFFECT ACTUAL TRADING RESULTS. THERE ARE NUMEROUS OTHER FACTORS RELATED TO THE MARKETS IN GENERAL OR TO THE IMPLEMENTATION OF ANY SPECIFIC TRADING PROGRAM WHICH CANNOT BE FULLY ACCOUNTED FOR IN THE PREPARATION OF HYPOTHETICAL PERFORMANCE RESULTS AND ALL OF WHICH CAN ADVERSELY AFFECT ACTUAL TRADING RESULTS. The performance data does not reflect any reinvestment or distribution profits, commission charges, management fees or other expenses that would have been incurred in connection with operating and managing a commodity pool designed to track the SCI. Such fees and expenses would reduce the performance returns shown in the table below. PAST PERFORMANCE IS NOT NECESSARILY INDICATIVE OF FUTURE RESULTS Performance Results* for the SCI for the period from Year Ending 2013 through March 31, 2023 YTD | | | | | | Year | | Ending Level* | | Annual Return | | 2013 | | 1,114.30 | | (8.90) | % | 2014 | | 937.33 | | (15.88) | % | 2015 | | 704.39 | | (24.85) | % | 2016 | | 815.94 | | 15.84 | % | 2017 | | 1,069.01 | | 31.02 | % | 2018 | | 842.94 | | (21.15) | % | 2019 | | 905.32 | | 7.40 | % | 2020 | | 1,124.23 | | 24.18 | % | 2021 | | 1,422.52 | | 26.53 | % | 2022 | | 1,224.00 | | (13.96) | % | 2023 (YTD) | | 1,332.24 | | 8.93 | % |
* The “base level” for the SCI was set at 100 on January 2, 1991. The “Ending Level” represents the value of the components of the SCI on the last trading day of each year and is used to illustrate the cumulative performance of the SCI. *PAST PERFORMANCE IS NOT NECESSARILY INDICATIVE OF FUTURE RESULTS SummerHaven Copper Index (“SCI”) Year-Over-Year Total Returns (Year Ending 2013 through- 3/31/2023 YTD) 
Source: SummerHaven Index Management, Bloomberg The following table compares the total return of the SCI in comparison with the total return a major index and spot copper prices (less storage cost) from December 31, 1997 through March 31, 2023. PAST PERFORMANCE IS NOT NECESSARILY INDICATIVE OF FUTURE RESULTS | | | | | | | | | | Historical Results for the period | | | | from December 31, 1997 through March 31, 2023 | | | | BCOM | | Spot Copper | | SCI TR | | | | HG TR | | (less storage) | | Actual | | Total return | | 463.68 | % | 153.17 | % | 750.73 | % | Average annualized return (total) | | 13.31 | % | 9.53 | % | 15.49 | % | Annualized volatility | | 25.57 | % | 24.71 | % | 25.07 | % | Annualized Sharpe ratio | | 0.44 | | 0.30 | | 0.53 | |
Source: SHIM, Bloomberg The table above shows the performance of the SCI from December 31, 1997 through March 31, 2023 in comparison with a traditional commodity index and spot copper prices: the Bloomberg Copper Subindex Total ReturnSM and spot copper prices less warehouse storage rents. The Bloomberg Copper Subindex Total ReturnSM includes the contract in the Bloomberg Commodity Index Total Return that relates to a single commodity, copper (currently the Copper High Grade futures contract traded on the COMEX). The data for the SCI Total Return Index is derived by using the SCI’s calculation methodology with historical prices for the futures contracts comprising the SCI. The information about the index above comes from publicly-available material about such index but is not designed to provide a thorough overview of the methodology of such index. The index noted above does not have investment objectives identical to the SCI. As a result, there are inherent limitations in comparing such performance against the SCI. For more information about the index and its methodologies, please refer to the material published by the sponsor of the Bloomberg Copper Subindex Total Return which may be found on its website. In addition to the actual performance of the SCI, this chart includes as “SCI Hypothetical TR” the hypothetical performance of the SCI had the changes to the composition of the SCI, which became effective on January 1, 2021, been effective during the period from December 31, 1997 through December 31, 2020. USCF is not responsible for any information found on such website, and such information is not part of this quarterly report on Form 10-Q. In the table above, “Total Return” refers to the return of the relevant index from December 31, 1997 to September 30, 2017;March 31, 2023; “Annualized Volatility” is a measure of the amount of variation or fluctuation in the returns of the relevant index. Annualized Volatility is calculated by taking the monthly standard deviation of the relevant index’s return and multiplying it by the square root of 12; and “Annualized Sharpe Ratio” is a measure of the total return of each relevant index adjusted by the risk-free interest rate (the 90-Day U.S. Treasury Bill yield) and the volatility of each index. Many investors consider volatility to be a measure of risk, and lower volatility of investment returns is considered a positive investment attribute as opposed to higher volatility. Annualized Sharpe Ratio is a standard measure for investors to compare two different investments or indexes that have different levels of volatility. If two indexes have the same total return, but one has lower Annualized Volatility, then its Annualized Sharpe Ratio will be higher. The higher the Annualized Sharpe Ratio, the better the risk-adjusted performance. Annualized Sharpe Ratio is calculated by taking the average monthly total return of the relevant index and subtracting the then current yield on the 90-Day U.S. Treasury Bill. The annualized return of this series is then divided by the Annualized Volatility of this series, and this result is the Annualized Sharpe Ratio for the relevant index. A higher Sharpe Ratio is not a guarantee that one investment or index will in the future produce better risk adjustment total returns, but USCF believes it is a useful tool for investors to consider when making investment decisions. The following chart compares the hypothetical total returnTable of the SDCI in comparison with the actual total return of three major indexes between September 30, 2007 and September 30, 2017.
Ten Year Comparison of Index Returns of the BCOM TR, S&P GSCI TR,
DBLCI OY TR, and the Hypothetical Returns of the SDCI TR
(9/30/2007-9/30/2017)

Source: SHIM, Bloomberg
PAST PERFORMANCE IS NOT NECESSARILY INDICATIVE OF FUTURE RESULTS
The following chart compares the hypothetical total return of the SDCI in comparison with the actual total return of three major indexes over a five year period.
Five Year Comparison of Index Returns of the BCOM TR, S&P GSCI TR,
DBLCI OY TR, and the Hypothetical Returns of the SDCI TR
(9/30/2012-9/30/2017)

Source: SHIM, Bloomberg
PAST PERFORMANCE IS NOT NECESSARILY INDICATIVE OF FUTURE RESULTS
SCI
The SCI is a single-commodity index designed to be an investment benchmark for copper as an asset class. The SCI is composed of copper futures contracts on the COMEX exchange. The SCI attempts to maximize backwardation and minimize contango while utilizing contracts in liquid portions of the futures curve.
The SCI is rules-based and is rebalanced monthly based on observable price signals described below in the section “Contract Selection and Weighting.” In this context, the term “rules-based” is meant to indicate that the composition of the SCI in any given month will be determined by quantitative formulas relating to the prices of the futures contracts that are included in the SCI. Such formulas are not subject to adjustment based on other factors.
The overall return on the SCI is generated by two components: (i) uncollateralized returns from the Benchmark Component Copper Futures Contracts comprising the SCI, and (ii) a daily fixed income return reflecting the interest earned on hypothetical 3-month Treasuries, calculated using the weekly auction rate for 3-Month Treasuries published by the U.S. Department of the Treasury. SHIM is the owner of the SCI.
Table 1 below lists the Futures Exchange on which the Eligible Copper Futures Contracts are listed and quotation details. Table 2 lists the Eligible Copper Futures Contracts, their sector designation and maximum allowable tenor.
TABLE 1
Commodity | | Designated Contract | | Exchange | | Units | | Quote | Copper | | Copper | | COMEX | | 25,000 lbs | | U.S. cents/pound |
TABLE 2
Commodity Name | | Commodity
Symbol | | Allowed Contracts | | Max. Tenor | Copper | | HG | | All 12 calendar months | | 19 |
Prior to the end of each month, SHIM determines the composition of the SCI and provides such information to the NYSE Arca. Values of the SCI are computed by the NYSE Arca and disseminated approximately every fifteen (15) seconds from 8:00 a.m. to 5:00 p.m., New York City time, which also publishes a daily SCI value at approximately 5:30 p.m., New York City time, under the index ticker symbol “SCI”. Only settlement and last-sale prices are used in the SCI’s calculation, bids and offers are not recognized – including limit-bid and limit-offer price quotes. Where no last-sale price exists, typically in the more deferred contract months, the previous days�� settlement price is used. This means that the underlying SCI may lag its theoretical value. This tendency to lag is evident at the end of the day when the SCI value is based on the settlement prices of the Benchmark Component Copper Futures Contracts, and explains why the underlying SCI often closes at or near the high or low for the day.
Composition of the SCI
The composition of the SCI on any given day, as determined and published by SHIM, is determinative of the benchmark for CPER. Neither the index methodology for the SCI nor any set of procedures, however, are capable of anticipating all possible circumstances and events that may occur with respect to the SCI and the methodology for its composition, weighting and calculation. Accordingly, a number of subjective judgments must be made in connection with the operation of the SCI that cannot be adequately reflected in this description of the SCI. All questions of interpretation with respect to the application of the provisions of the index methodology for the SCI, including any determinations that need to be made in the event of a market emergency or other extraordinary circumstances, will be resolved by SHIM.
Contract Expirations
Because the SCI is comprised of actively traded contracts with scheduled expirations, it can be calculated only by reference to the prices of contracts for specified expiration, delivery or settlement periods, referred to as contract expirations. The contract expirations included in the SCI for each commodity during a given year are designated by SHIM, provided that each contract must be an active contract. An active contract for this purpose is a liquid, actively-traded contract expiration, as defined or identified by the relevant trading facility or, if no such definition or identification is provided by the relevant trading facility, as defined by standard custom and practice in the industry.
If a futures exchange, such as the COMEX, ceases trading in all contract expirations relating to an Eligible Copper Futures Contract, SHIM may designate a replacement contract. The replacement contract must satisfy the eligibility criteria for inclusion in the SCI. To the extent practicable, the replacement will be effected during the next monthly review of the composition of the SCI. If that timing is not practicable, SHIM will determine the date of the replacement based on a number of factors, including the differences between the existing Benchmark Component Copper Futures Contract and the replacement contract with respect to contractual specifications and contract expirations.
The designation of a replacement contract could affect the value of the SCI, either positively or negatively, depending on the price of the contract that is eliminated and the prices of the replacement contract. It is impossible, however, to predict the effect of these changes, if they occur, on the value of the SCI.
Contract Selection and Weighting
Weights for each of the Benchmark Component Copper Futures Contracts are determined for the next month. The methodology used to calculate the SCI weighting is based solely on quantitative data using observable futures prices and is not subject to human bias.
The monthly weighting selection is a process based upon examination of the relevant futures prices for copper:
1) On the Selection Date:
| a) | the copper futures curve is assessed to be in either backwardation or contango (as discussed below); and |
| b) | the annualized percentage price difference between the Closest-to-Expiration Eligible Copper Futures Contract and each of the Next Four Eligible Copper Futures Contracts is calculated. For each month, the Closest-to-Expiration Eligible Copper Futures Contract and the Next Four Eligible Copper Futures Contracts are as follows: |
Month | | January | | February | | March | | April | | May | | June | | July | | August | | September | | October | | November | | December | Closest-to-Expiration | | | | | | | | | | | | | | | | | | | | | | | | | | | | | | | | | | | | | | | | | | | | | | | | | | Eligible | | | | | | | | | | | | | | | | | | | | | | | | | | | | | | | | | | | | | | | | | | | | | | | | | | Futures | | | | | | | | | | | | | | | | | | | | | | | | | | | | | | | | | | | | | | | | | | | | | | | | | | Contract | | February | | March | | April | | May | | June | | July | | August | | September | | October | | November | | December | | January | | | | | | | | | | | | | | | | | | | | | | | | | | Next Four | | April | | May | | June | | July | | August | | September | | October | | November | | December | | January | | February | | March | | | | | | | | | | | | | | | | | | | | | | | | | | Eligible | | May | | June | | July | | August | | September | | October | | November | | December | | January | | February | | March | | April | | | | | | | | | | | | | | | | | | | | | | | | | | Futures | | June | | July | | August | | September | | October | | November | | December | | January | | February | | March | | April | | May | | | | | | | | | | | | | | | | | | | | | | | | | | Contracts | | July | | August | | September | | October | | November | | December | | January | | February | | March | | April | | May | | June |
A futures curve in backwardation occurs when the price of the closest-to-expiration contract is greater than or equal to the price of the third closest-to-expiration contract. These contracts will have expirations that are approximately two months apart. A curve not in backwardation is defined as being in contango, which occurs when the price of the closest-to-expiration contract is less than the price of the third closest-to-expiration contract.
2a) Backwardation: If the copper futures curve is in backwardation on the Selection Date, the SCI takes positions in the two Eligible Copper Futures Contracts with the highest annualized percentage price difference, each weighted at 50%.
A hypothetical example is included below, with the two selected Eligible Copper Futures Contracts shaded below (the selected commodities are ranked 1 and 2):
Copper Futures Contract | | Expiration Date | | Contract Price | | Nearest-to-maturity | | November - 10 | | | 374.00 | | Third nearest-to-maturity | | January - 11 | | | 365.20 | |
| Eligible Copper Futures Contracts | | Price | | | Annualized
Percentage
Price
Difference | | | Ranking | | | January-11 | | | 365.20 | | | | 10.47 | % | | | 1 | | | February-11 | | | 363.00 | | | | 10.15 | % | | | 4 | | | March-11 | | | 359.70 | | | | 10.36 | % | | | 3 | | | April-11 | | | 356.70 | | | | 10.41 | % | | | 2 | |
2b) Contango: If the copper futures curve is in contango, then the SCI takes positions in three Eligible Copper Futures Contracts, as follows: first, the SCI takes positions in the two Eligible Copper Futures Contracts with the highest annualized percentage price difference, each weighted at 25%; then, the SCI also takes a position in the closest-to-expiration December Eligible Future Contract that has expiration more distant than the fourth of the Next Four Eligible Copper Futures Contracts for the applicable month, which position is weighted at 50%.
A hypothetical example is included below, with the next two selected Eligible Copper Futures Contracts shaded below (the selected commodities are ranked 1 – 2):
Copper Futures Contract | | Expiration
Date | | Contract Price | | Nearest-to-maturity | | November - 10 | | | 374.00 | | Third nearest-to-maturity | | January - 11 | | | 375.70 | |
| Eligible Copper Futures Contracts | | Price | | | Annualized
Percentage
Price
Difference | | | Ranking | | | January-11 | | | 375.70 | | | | -1.97 | % | | | 4 | | | February-11 | | | 376.00 | | | | -1.78 | % | | | 3 | | | March-11 | | | 376.30 | | | | -1.59 | % | | | 2 | | | April-11 | | | 376.40 | | | | -1.37 | % | | | 1 | |
Due to the dynamic monthly weighting calculation, the individual weights will vary-over time, depending on the price observations each month. The Selection Date for the SCI is the last business day of the calendar month.
The following graph shows the weights of the Benchmark Component Copper Futures Contracts selected for inclusion in the SCI as of September 30, 2017.
SCI Contract Weights
as of September 30, 2017
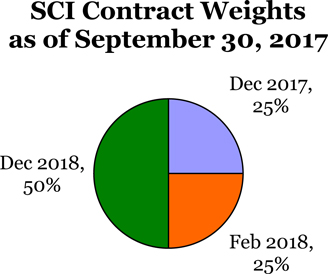
Portfolio Construction
The portfolio rebalancing takes place during the Rebalancing Period. At the end of each of the days in the Rebalancing Period one fourth of the prior month portfolio positions are replaced by the new weights for the Benchmark Component Copper Futures Contracts determined on the Selection Date.
SCI Total Return Calculation
The value of the SCI on any business day is equal to the product of (i) the value of the SCI on the immediately preceding business day multiplied by (ii) one plus the sum of the day’s returns for another version of the SCI known as the SummerHaven Dynamic Copper Index Excess Return (“SCI ER”) (explained below) and one business day’s interest from the hypothetical Treasury Bill portfolio. The value of the SCI will be calculated and published by the NYSE Arca.
SCI Base Level
The SCI was set to 100 on January 2, 1991.
SCI ER Calculation
The total return of the SCI ER reflects the percentage change of the market values of the underlying commodity futures. During the Rebalancing Period, the SCI changes its contract holdings and weightings during a four day period. The value of the SCI ER at the end of a business day “t” is equal to the SCI ER value on day “t -1” multiplied by the sum of the daily percentage price changes of each commodity future factoring in each respective commodity future’s notional holding on day “t -1”.
Rebalancing Period
The SCI is rebalanced during the first 4 business days of each calendar month, when existing positions are placed by new positions and weightings based on the signals used for contract selection on the last business day of the prior calendar month as outlined above.
Hypothetical Performance of the SCI
The table and chart below show the hypothetical performance of the SCI from January 1, 2007 through September 30, 2017.
HYPOTHETICAL PERFORMANCE RESULTS HAVE MANY INHERENT LIMITATIONS, SOME OF WHICH ARE DESCRIBED BELOW. NO REPRESENTATION IS BEING MADE THAT CPER WILL OR IS LIKELY TO ACHIEVE PROFITS OR LOSSES SIMILAR TO THOSE SHOWN. IN FACT, THERE ARE FREQUENTLY SHARP DIFFERENCES BETWEEN HYPOTHETICAL PERFORMANCE RESULTS AND THE ACTUAL RESULTS ACHIEVED BY ANY PARTICULAR TRADING PROGRAM.
ONE OF THE LIMITATIONS OF HYPOTHETICAL PERFORMANCE RESULTS IS THAT THEY ARE GENERALLY PREPARED WITH THE BENEFIT OF HINDSIGHT. IN ADDITION, HYPOTHETICAL TRADING DOES NOT INVOLVE FINANCIAL RISK, AND NO HYPOTHETICAL TRADING RECORD CAN COMPLETELY ACCOUNT FOR THE IMPACT OF FINANCIAL RISK IN ACTUAL TRADING. FOR EXAMPLE, THE ABILITY TO WITHSTAND LOSSES OR TO ADHERE TO A PARTICULAR TRADING PROGRAM IN SPITE OF TRADING LOSSES ARE MATERIAL POINTS WHICH CAN ALSO ADVERSELY AFFECT ACTUAL TRADING RESULTS. THERE ARE NUMEROUS OTHER FACTORS RELATED TO THE MARKETS IN GENERAL OR TO THE IMPLEMENTATION OF ANY SPECIFIC TRADING PROGRAM WHICH CANNOT BE FULLY ACCOUNTED FOR IN THE PREPARATION OF HYPOTHETICAL PERFORMANCE RESULTS AND ALL OF WHICH CAN ADVERSELY AFFECT ACTUAL TRADING RESULTS.
Since the SCI was launched on November 4, 2010, there is no actual performance history of the SCI to present. However, the components of the SCI and the weighting of the components of the SCI are established each month based on purely quantitative data that is not subject to revisions based on other external factors. This data is available for periods prior to November 4, 2010. As a result, the table below reflects how the SCI would have performed from January 1, 2007 through September 30, 2017 had it been in effect during such time period. The performance data does not reflect any reinvestment or distribution profits, commission charges, management fees or other expenses that would have been incurred in connection with operating and managing a commodity pool designed to track the SCI. Such fees and expenses would reduce the performance returns shown in the table below.
Hypothetical Performance Results for the SCI for the period
from January 1, 2007 through September 30, 2017
| Year | | Ending Level* | | | Annual Return | | | 2007 | | | 1,059.17 | | | | 16.25 | % | | 2008 | | | 497.18 | | | | (53.06 | )% | | 2009 | | | 1,153.12 | | | | 131.93 | % | | 2010 | | | 1,491.95 | | | | 29.38 | % | | 2011 | | | 1,164.51 | | | | (21.95 | )% | | 2012 | | | 1,223.15 | | | | 5.04 | % | | 2013 | | | 1,114.30 | | | | (8.90 | )% | | 2014 | | | 937.33 | | | | (15.88 | )% | | 2015 | | | 704.39 | | | | (24.85 | )% | | 2016 | | | 815.94 | | | | 5.84 | % | | 2017 (YTD) | | | 959.85 | | | | 17.64 | % |
| * | The “base level” for the SCI was set at 100 on January 2, 1991. The “Ending Level” represents the value of the components of the SCI on the last trading day of each year and is used to illustrate the cumulative performance of the SCI. |
PAST PERFORMANCE IS NOT NECESSARILY INDICATIVE OF FUTURE RESULTS
SummerHaven Copper Index Year-Over-Year
Hypothetical Total Returns (1/1/2007-9/30/2017 YTD)
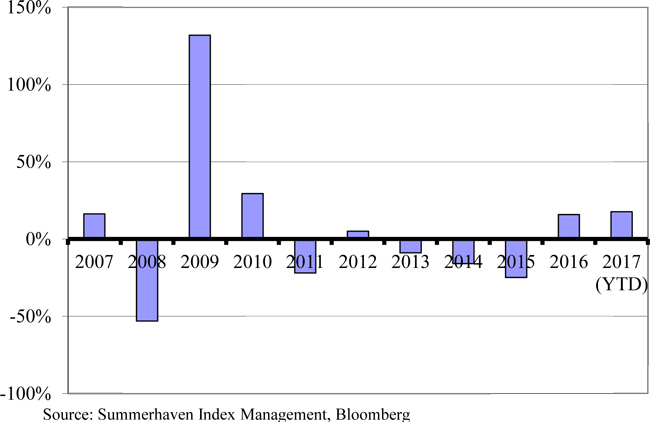
PAST PERFORMANCE IS NOT NECESSARILY INDICATIVE OF FUTURE RESULTS
The following table compares the hypothetical total return of the SCI in comparison with the actual total return of a major index from December 31, 1997 through September 30, 2017.
| | | Hypothetical and Historical Results for the period from | | | | | December 31, 1997 through September 30,2017 | | | | | BCOMHGTR | | | Spot Copper
(less storage) | | | SCI TR | | | Total return | | | 308.51 | % | | | 112.25 | % | | | 512.93 | % | | Average Annual return (total) | | | 13.88 | % | | | 10.03 | % | | | 16.58 | % | | Annualized volatility | | | 26.78 | % | | | 25.86 | % | | | 26.21 | % | | Annualized Sharpe ratio | | | 0.44 | | | | 0.31 | | | | 0.55 | |
Source: SHIM, Bloomberg
PAST PERFORMANCE IS NOT NECESSARILY INDICATIVE OF FUTURE RESULTS
The table above shows the performance of the SCI from December 31, 1997 through September 30, 2017 in comparison with a traditional commodity index and spot copper prices: the Bloomberg Copper Subindex Total ReturnSM (BCOMHGTR), (formerly known as Bloomberg Copper Subindex Total Return as of July 1, 2014) and spot copper prices less warehouse storage rents. The Bloomberg Copper Subindex Total ReturnSM includes the contract in the Bloomberg Commodity Index Total Return that relates to a single commodity, copper (currently the Copper High Grade futures contract traded on the COMEX). The data for the SCI Total Return Index is derived by using the SCI’s calculation methodology with historical prices for the futures contracts comprising the SCI. The information about the index above comes from publicly-available material about such index but is not designed to provide a thorough overview of the methodology of such index. The index noted above does not have investment objectives identical to the SCI. As a result, there are inherent limitations in comparing such performance against the SCI. For more information about the index and its methodologies, please refer to the material published by the sponsor of the Bloomberg Copper Subindex Total Return which may be found on its website. USCF is not responsible for any information found on such website, and such information is not part of this quarterly report on Form 10-Q.
In the table above, “Total Return” refers to the return of the relevant index from December 31, 1997 to September 30, 2017; “Annualized Volatility” is a measure of the amount of variation or fluctuation in the returns of the relevant index. Annualized Volatility is calculated by taking the monthly standard deviation of the relevant index’s return and multiplying it by the square root of 12; and “Annualized Sharpe Ratio” is a measure of the total return of each relevant index adjusted by the risk-free interest rate (the 90-Day U.S. Treasury Bill yield) and the volatility of each index. Many investors consider volatility to be a measure of risk, and lower volatility of investment returns is considered a positive investment attribute as opposed to higher volatility. Annualized Sharpe Ratio is a standard measure for investors to compare two different investments or indexes that have different levels of volatility. If two indexes have the same total return, but one has lower Annualized Volatility, then its Annualized Sharpe Ratio will be higher. The higher the Annualized Sharpe Ratio, the better the risk-adjusted performance. Annualized Sharpe Ratio is calculated by taking the average monthly total return of the relevant index and subtracting the then current yield on the 90-Day U.S. Treasury Bill. The annualized return of this series is then divided by the Annualized Volatility of this series, and this result is the Annualized Sharpe Ratio for the relevant index. A higher Sharpe Ratio is not a guarantee that one investment or index will in the future produce better risk adjustment total returns, but USCF believes it is a useful tool for investors to consider when making investment decisions.
The following chart compares the hypothetical total return of the SCI in comparison with the actual total return of athree major indexindexes between March 31, 2013 and spot copper prices (less storage cost) between September 30, 2007 and September 30, 2017. Ten Year Comparison of Index Returns of
BCOMHGTR, Spot Copper price, Spot Copper Price less Storage
Cost, andMarch 31, 2023, where the Hypothetical ReturnsSCI includes the original composition of the SCI TR (9/30/2007-9/30/2017)index until the changes described above and became effective on January 1, 2021, from which point then the revised composition of the index is included.
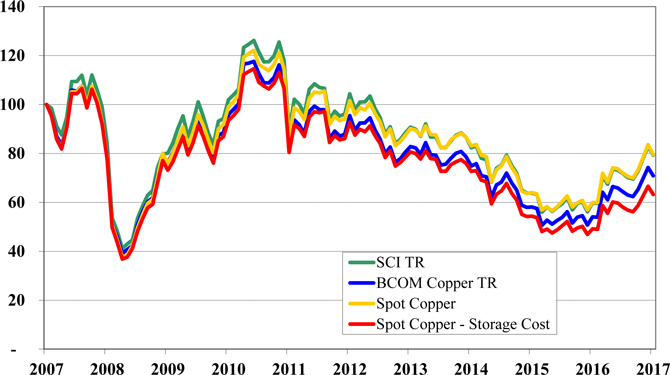
Source: SHIM, Bloomberg, LME
PAST PERFORMANCE IS NOT NECESSARILY INDICATIVE OF FUTURE RESULTS Ten Year Comparison of Index Returns of BCOM Copper TR, Spot Copper Price, Spot Copper Price less Storage Cost, and the SCI TR (3/31/2013-3/31/2023) 
Source: SHIM, Bloomberg, LME The following chart compares the hypothetical total return of the SCI in comparison with the actual total return of two major indices and spot copper prices (less storage cost) over a 5five year period. Five Year Comparison of Index Returns of
BCOMHGTR, Spot Copper price, Spot Copper Price
less Storage Cost, andperiod, where the Hypothetical ReturnsSCI includes the original composition of the SCI TR (9/30/12-9/30/17)index until the changes described above and became effective on January 1, 2021, from which point then the revised composition of the index is included.

Source: SHIM, Bloomberg, LME
PAST PERFORMANCE IS NOT NECESSARILY INDICATIVE OF FUTURE RESULTS SDAI
The SDAI is an agricultural sector index designed to broadly represent major agricultural commodities while overweighting the components that are assessed to be in a low inventory state and underweighting the components assessed to be in a high inventory state.
The SDAI consists of fourteen agricultural markets: soybeans, corn, soft red winter wheat, hard red winter wheat, soybean oil, soybean meal, canola, sugar, cocoa, coffee, cotton, live cattle, feeder cattle and lean hogs. Each agricultural commodity is assigned a base weight based on an assessment of market liquidity and the commodity’s overall economic importance. Each commodity is U.S. dollar based, with the exception of canola, which is quoted in Canadian dollars and converted to U.S. dollars for the purpose of the SDAI calculation.
Academic research by Professors Gorton, Rouwenhorst and Hayashi has shown that commodities in relatively low inventory states tend to have higher returns than commodities in relatively high inventory states. Furthermore, relative inventory comparisons can be estimated by the price-based signals momentum and basis. Momentum is the percentage price change in a commodity over the previous year. Basis is the annualized percentage difference between the nearest-to-maturity contract and the second nearest-to-maturity contract. Using these price-based signals, agricultural commodities determined to be in low inventory state will be weighted more heavily, and agricultural commodities in high inventory state will be weighted less heavily during any given month.
The SDAI is rules-based and rebalanced monthly based on observable price signals described above. In this context, the term “rules-based” is meant to indicate that the composition of the SDAI in any given month will be determined by quantitative formulas relating to the prices of the futures contracts that relate to the commodities that are included in the SDAI. Such formulas are not subject to adjustment based on other factors.
The overall return on the SDAI is generated by two components: (i) uncollateralized returns from the Benchmark Component Agriculture Futures Contracts comprising the SDAI and (ii) a daily fixed income return reflecting the interest earned on a hypothetical 3-month U.S. Treasury Bill collateral portfolio, calculated using the weekly auction rate for the 3-Month U.S. Treasury Bills published by the U.S Department of the Treasury. SHIM is the owner of the SDAI.
Table 1 below lists the eligible agricultural commodities, the relevant Futures Exchange on which each Benchmark Component Agriculture Futures Contract is listed and quotation details. Table 2 lists the Benchmark Component Agriculture Futures Contracts, their sector designation and maximum allowable tenor.
TABLE 1
Commodity | | Designated Contract | | Exchange | | Units | | Quote | Soybeans | | Soybeans | | CBOT | | 5,000 bushels | | U.S. cents/bushel | | | | | | | | | | Corn | | Corn | | CBOT | | 5,000 bushels | | U.S. cents/bushel | | | | | | | | | | Soft Red Winter Wheat | | Soft Red Winter Wheat | | CBOT | | 5,000 bushels | | U.S. cents/bushel | | | | | | | | | | Hard Red Winter Wheat | | Hard Red Winter Wheat | | KCBT | | 5,000 bushels | | U.S. cents/bushel | | | | | | | | | | Bean Oil | | Bean Oil | | CBOT | | 60,000 lbs. | | U.S. cents/pound | | | | | | | | | | Soybean Meal | | Soybean Meal | | CBOT | | 100 tons | | USD/ton | | | | | | | | | | Coffee | | Coffee “C” | | ICE-US | | 37,500 lbs. | | U.S. cents/pound | | | | | | | | | | Cocoa | | Cocoa | | ICE-US | | 10 metric tons | | USD/metric ton | | | | | | | | | | Sugar | | World Sugar No. 11 | | ICE-US | | 112,000 lbs. | | U.S. cents/pound | | | | | | | | | | Canola | | Canola | | ICE- CANADA | | 20 metric tonnes | | $CAD/tonne | | | | | | | | | | Cotton | | Cotton | | ICE-US | | 50,000 lbs. | | U.S. cents/pound | | | | | | | | | | Feeder Cattle | | Feeder Cattle | | CME | | 50,000 lbs. | | U.S. cents/pound | | | | | | | | | | Live Cattle | | Live Cattle | | CME | | 40,000 lbs. | | U.S. cents/pound | | | | | | | | | | Lean Hogs | | Lean Hogs | | CME | | 40,000 lbs. | | U.S. cents/pound |
TABLE 2
Commodity Name | | Commodity
Symbol | | Allowed Contracts | | Max. Tenor | | Soybeans | | S | | Jan, Mar, May, July, Aug, Sep, Nov | | | 12 | | | | | | | | | | | Corn | | C | | Mar, May, July, Sep, Dec | | | 12 | | | | | | | | | | | Soft Red Winter Wheat | | W | | Mar, May, July, Sep, Dec | | | 7 | | | | | | | | | | | Hard Red Winter Wheat | | KW | | Mar, May, July, Sep, Dec | | | 5 | | | | | | | | | | | Bean Oil | | BO | | Jan, Mar, May, July, Aug, Sep, Oct, Dec | | | 7 | | | | | | | | | | | Soybean Meal | | SM | | Jan, Mar, May, July, Aug, Sep, Oct, Dec | | | 7 | | | | | | | | | | | Coffee | | KC | | Mar, May, July, Sep, Dec | | | 7 | | | | | | | | | | | Cocoa | | CC | | Mar, May, July, Sep, Dec | | | 7 | | | | | | | | | | | Sugar | | SB | | Mar, May, July, Oct, | | | 7 | | | | | | | | | | | Canola | | RS | | Jan, Mar, May, July, Nov | | | 5 | | | | | | | | | | | Cotton | | CT | | Mar, May, July, Dec | | | 7 | | | | | | | | | | | Feeder Cattle | | FC | | Jan, Mar, April, May, Aug, Sep, Oct, Nov | | | 5 | | | | | | | | | | | Live Cattle | | LC | | Feb, April, June, Aug, Oct, Dec | | | 5 | | | | | | | | | | | Lean Hogs | | LH | | Feb, April, June, July, Aug, Oct, Dec | | | 5 | |
Prior to the end of each month, SHIM determines the composition of the SDAI and provides such information to the NYSE Arca. Values of the SDAI are computed by the NYSE Arca and disseminated approximately every fifteen (15) seconds from 8:00 a.m. to 5:00 p.m., New York City time, which also publishes a daily SDAI value at approximately 5:30 p.m., New York City time, under the index ticker symbol “SDAITR”. Only settlement and last-sale prices are used in the SDAI’s calculation, bids and offers are not recognized; including limit-bid and limit-offer price quotes. Where no last-sale price exists, typically in the more deferred contract months, the previous days’ settlement price is used. This means that the underlying SDAI may lag its theoretical value. This tendency to lag is evident at the end of the day when the SDAI value is based on the settlement prices of the Benchmark Component Agriculture Futures Contracts, and explains why the underlying SDAI often closes at or near the high or low for the day.
Currency Conversion
Canola seed futures trade on the ICE Futures Canada and are denominated in Canadian dollars. Canola futures prices are divided by the USD/CAD foreign exchange spot price for purposes of index calculation and commodity weighting calculations. The USD/CAD price used for canola futures for the daily SDAI value is the 3:00 p.m. EST USD/CAD price quoted by Bloomberg under currency ticker “USDCAD F150”.
Composition of the SDAI
The composition of the SDAI on any given day, as determined and published by SHIM, is determinative of the benchmark for USAG. Neither the SDAI methodology nor any set of procedures, however, are capable of anticipating all possible circumstances and events that may occur with respect to the SDAI and the methodology for its composition, weighting and calculation. Accordingly, a number of subjective judgments must be made in connection with the operation of the SDAI that cannot be adequately reflected in this description of the SDAI. All questions of interpretation with respect to the application of the provisions of the SDAI methodology, including any determinations that need to be made in the event of a market emergency or other extraordinary circumstances, will be resolved by SHIM.
Contract Expirations
Because the SDAI is comprised of actively traded contracts with scheduled expirations, it can be calculated only by reference to the prices of contracts for specified expiration, delivery or settlement periods, referred to as contract expirations. The contract expirations included in the SDAI for each commodity during a given year are designated by SHIM, provided that each contract must be an active contract. An active contract for this purpose is a liquid, actively-traded contract expiration, as defined or identified by the relevant trading facility or, if no such definition or identification is provided by the relevant trading facility, as defined by standard custom and practice in the industry.
If a Futures Exchange ceases trading in all contract expirations relating to a particular Benchmark Component Agriculture Futures Contract, SHIM may designate a replacement contract on the particular agricultural commodity. The replacement contract must satisfy the eligibility criteria for inclusion in the SDAI. To the extent practicable, the replacement will be effected during the next monthly review of the composition of the SDAI. If that timing is not practicable, SHIM will determine the date of the replacement based on a number of factors, including the differences between the existing Benchmark Component Agriculture Futures Contract and the replacement contract with respect to contractual specifications and contract expirations.
If a Benchmark Component Agriculture Futures Contract is eliminated and there is no replacement contract, the underlying agricultural commodity will necessarily drop out of the SDAI. The designation of a replacement contract, or the elimination of an agricultural commodity from the SDAI because of the absence of a replacement contract, could affect the value of the SDAI, either positively or negatively, depending on the price of the contract that is eliminated and the prices of the remaining contracts. It is impossible, however, to predict the effect of these changes, if they occur, on the value of the SDAI.
Commodity Weighting
Each of the Benchmark Component Agriculture Futures Contracts will remain in the SDAI from month to month. Weights for each of the Benchmark Component Agriculture Futures Contracts in the SDAI are determined for the next month. The methodology used to calculate the SDAI weighting is based solely on quantitative data using observable futures prices and is not subject to human bias.
The monthly weighting selection is a three-step process based upon examination of the relevant futures prices for each agricultural commodity:
| 1) | The annualized percentage price difference between the closest-to-expiration Benchmark Component Agriculture Futures Contract and the next closest-to-expiration Benchmark Component Agriculture Futures Contract is calculated for each of the 14 eligible agricultural commodities on the fifth business day prior to the first business day of the next calendar month (the “Selection Date”). The four agricultural commodities with the highest percentage price difference are selected. |
| 2) | For the remaining 10 eligible agricultural commodities, the percentage price change of each agricultural commodity over the previous year is calculated, as measured by the change in the price of the closest-to- expiration Benchmark Component Agriculture Futures Contract on the Selection Date from the price of the closest-to-expiration Benchmark Component Agriculture Futures Contract a year prior to the Selection Date. The three agricultural commodities with the highest percentage price change are selected. |
| 3) | For the seven commodities selected through basis (step 1) and momentum (step 2), each commodity weight is increased by 2% above its base weighting for the following month. For the remaining seven commodities not selected, each commodity weight is decreased by 2% below its base weighting for the following month. |
Due to the dynamic monthly agricultural commodity weighting calculation, the individual agricultural commodity weights will vary over time, depending on the price observations each month. The Selection Date for the SDAI is the fifth business day prior to the first business day of the next calendar month.
The following graph shows the agricultural commodity weights of the agricultural commodities selected for inclusion in the SDAI as of September 30, 2017.
SDAI Commodity Weights
as of September 30, 2017

Contract Selection
For each agricultural commodity in the SDAI, the index selects a specific Benchmark Component Agriculture Futures Contract with a tenor (i.e., contract month) among the eligible tenors (the range of contract months) based upon the relative prices of the Benchmark Component Agriculture Futures Contracts within the eligible range of contract months. The previous notwithstanding, the contract expiration is not changed for that month if a Benchmark Component Agriculture Futures Contract remains in the SDAI, as long as the contract does not enter expire or enter its notice period in the subsequent month.
Portfolio Construction
The portfolio rebalancing takes place during the Rebalancing Period. At the end of each of the days in the last four business days of each month (the “Rebalancing Period”) one fourth of the prior month portfolio positions are replaced by the new commodity weights for the commodity contracts determined on the Selection Date.
Currency Conversion
Canola futures are denominated and quoted in Canadian dollars.
SDAI Total Return Calculation
The value of the SDAI on any business day is equal to the product of (i) the value of the SDAI on the immediately preceding business day multiplied by (ii) one plus the sum of the day’s returns for another version of the SDAI known as the SummerHaven Dynamic Agriculture Index Excess Return (“SDAI ER”) (explained below) and one business day’s interest from the hypothetical Treasury Bill portfolio. The value of the Agriculture will be calculated and published by the NYSE Arca.
SDAI Base Level
The SDAI was set to 100 on January 2, 1991.
SDAI ER Calculation
The total return of the SDAI ER reflects the percentage change of the market values of the underlying Benchmark Component Agriculture Futures Contracts. During the Rebalancing Period, the SDAI changes its contract holdings and weightings during a four day period. The value of the SDAI ER at the end of a business day “t” is equal to the SDAI ER value on day “t -1” multiplied by the sum of the daily percentage price changes of each commodity future factoring in each respective commodity future’s notional holding on day “t -1”.
Rebalancing Period
During the Rebalancing Period, existing positions are replaced by new positions based on the signals used for contract selection as outlined above. At the end of the first day of the Rebalancing Period, the signals are observed and on the second day a new portfolio is constructed that is equally weighted in terms of notional positions in the newly selected contracts.
The table and chart below show the hypothetical performance of the SDAI from January 1, 2007 through September 30, 2017.
HYPOTHETICAL PERFORMANCE RESULTS HAVE MANY INHERENT LIMITATIONS, SOME OF WHICH ARE DESCRIBED BELOW. NO REPRESENTATION IS BEING MADE THAT USAG WILL OR IS LIKELY TO ACHIEVE PROFITS OR LOSSES SIMILAR TO THOSE SHOWN. IN FACT, THERE ARE FREQUENTLY SHARP DIFFERENCES BETWEEN HYPOTHETICAL PERFORMANCE RESULTS AND THE ACTUAL RESULTS ACHIEVED BY ANY PARTICULAR TRADING PROGRAM.
ONE OF THE LIMITATIONS OF HYPOTHETICAL PERFORMANCE RESULTS IS THAT THEY ARE GENERALLY PREPARED WITH THE BENEFIT OF HINDSIGHT. IN ADDITION, HYPOTHETICAL TRADING DOES NOT INVOLVE FINANCIAL RISK, AND NO HYPOTHETICAL TRADING RECORD CAN COMPLETELY ACCOUNT FOR THE IMPACT OF FINANCIAL RISK IN ACTUAL TRADING. FOR EXAMPLE, THE ABILITY TO WITHSTAND LOSSES OR TO ADHERE TO A PARTICULAR TRADING PROGRAM IN SPITE OF TRADING LOSSES ARE MATERIAL POINTS WHICH CAN ALSO ADVERSELY AFFECT ACTUAL TRADING RESULTS. THERE ARE NUMEROUS OTHER FACTORS RELATED TO THE MARKETS IN GENERAL OR TO THE IMPLEMENTATION OF ANY SPECIFIC TRADING PROGRAM WHICH CANNOT BE FULLY ACCOUNTED FOR IN THE PREPARATION OF HYPOTHETICAL PERFORMANCE RESULTS AND ALL OF WHICH CAN ADVERSELY AFFECT ACTUAL TRADING RESULTS.
USCF HAS HAD LITTLE OR NO EXPERIENCE IN TRADING ACTUAL ACCOUNTS FOR CUSTOMERS. BECAUSE THERE ARE NO ACTUAL TRADING RESULTS TO COMPARE TO THE HYPOTHETICAL PERFORMANCE RESULTS, CUSTOMERS SHOULD BE PARTICULARLY WARY OF PLACING UNDUE RELIANCE ON THESE HYPOTHETICAL PERFORMANCE RESULTS.
Since the SDAI was launched on September 23, 2010, there is only actual performance history of the SDAI from that date to the present. However, the components of the SDAI and the weighting of the components of the SDAI are established each month based on purely quantitative data that is not subject to revisions based on other external factors. This data is available for periods prior to September 23, 2010. As a result, the table below reflects how the SDAI would have performed from January 1, 2007 through September 30, 2017 had it been in effect during such time period. The performance data does not reflect any reinvestment or distribution of profits, commission charges, management fees or other expenses that would have been incurred in connection with operating and managing a commodity pool designed to track the SDAI. Such fees and expenses would reduce the performance returns shown in the table below.
Hypothetical Performance Results for the period
from January 1, 2007 through September 30, 2017
| Year | | Ending
Level* | | | Annual Return | | | 2007 | | | 315.85 | | | | 21.59 | % | | 2008 | | | 261.02 | | | | (17.36 | )% | | 2009 | | | 282.24 | | | | 8.13 | % | | 2010 | | | 377.90 | | | | 33.89 | % | | 2011 | | | 348.78 | | | | (7.71 | )% | | 2012 | | | 360.61 | | | | 3.39 | % | | 2013 | | | 324.11 | | | | (10.12 | )% | | 2014 | | | 329.88 | | | | 1.78 | % | | 2015 | | | 285.01 | | | | (13.60 | )% | | 2016 | | | 273.11 | | | | (4.18 | )% | | 2017 (YTD) | | | 252.64 | | | | (7.50 | )% |
| * | The “base level” for the SDAI was set at 100 on January 2, 1991. The “Ending Level” represents the value of the components of the Index on the last trading day of each year and is used to illustrate the cumulative performance of the Index. |
PAST PERFORMANCE IS NOT NECESSARILY INDICATIVE OF FUTURE RESULTS
SummerHaven Dynamic Agriculture Index Year-Over-Year
Hypothetical Total Returns (1/1/2007-9/30/2017 YTD)

PAST PERFORMANCE IS NOT NECESSARILY INDICATIVE OF FUTURE RESULTS
The following table compares the hypothetical total return of the SDAI in comparison with the actual total return of three major indexes from December 31, 1997 through September 30, 2017.
| | | Hypothetical and Historical Results for the period from | | | | | December 31, 1997 through September 30, 2017 | | | | | BCOM Ag TR | | | S&P GSCI Ag
TR | | | DB LCI OY Ag
TR | | | SDAI TR | | | Total return | | | (44.05 | )% | | | (69.40 | )% | | | (27.65 | )% | | | 17.23 | % | | Average annual return (total) | | | (1.50 | )% | | | (4.47 | )% | | | (0.48 | )% | | | 1.62 | % | | Annualized volatility | | | 19.94 | % | | | 20.71 | % | | | 19.19 | % | | | 14.95 | % | | Annualized Sharpe ratio | | | (0.17 | ) | | | (0.31 | ) | | | (0.13 | ) | | | (0.02 | ) |
The table above shows the performance of the SDAI from December 31, 1997 through September 30, 2017 in comparison with three traditional agricultural commodities indices: the S&P GSCI® Agriculture Index Total Return, Bloomberg Subindex Total ReturnSM, and the Deutsche Bank Liquid Commodity Index-Optimum Yield Agriculture Total ReturnTM. The S&P GSCI® Agriculture Index Total Return comprises the commodities: Wheat (Chicago and Kansas), Corn, Soybeans, Cotton, Sugar, Coffee, and Cocoa, and is part of a series of sub-indices representing components of the S&P GSCI. The Bloomberg Agriculture Subindex Total ReturnSMis currently composed of seven futures contracts on agricultural commodities traded on U.S. exchanges. The Deutsche Bank Liquid Commodity Index-Optimum Yield Agriculture Total ReturnTM is designed to reflect the performance of certain corn, wheat, soybean and sugar futures contracts plus the returns from investing in 3 month U.S. Treasury Bills. The data for the SDAI is derived by using the SDAI’s calculation methodology with historical prices for the futures contracts comprising the SDAI. The information about each of the indices comes from publicly-available material about such indices but is not designed to provide a thorough overview of the methodology of each index. None of the indices have investment objectives identical to the SDAI. As a result, there are inherent limitations in comparing the performance of such indices against the SDAI. For more information about these indices and their methodologies, please refer to the material published by the sponsors of each such index which may be found on their websites. USAG is not responsible for any information found on such website, and such information is not part of this quarterly report on Form 10-Q.
In the table above, “Total Return” refers to the return of the relevant index from December 31, 1997 through September 30, 2017; “Annualized Volatility” is a measure of the amount of variation or fluctuation in the returns of the relevant index. Annualized Volatility is calculated by taking the monthly standard deviation of the relevant index’s return and multiplying it by the square root of 12; and “Annualized Sharpe Ratio” is a measure of the total return of each relevant index adjusted by the risk-free interest rate (the 90 Day U.S. Treasury Bill yield) and the volatility of each index. Many investors consider volatility to be a measure of risk, and lower volatility of investment returns is considered a positive investment attribute as opposed to higher volatility. Annualized Sharpe Ratio is a standard measure for investors to compare two different investments or indexes that have different levels of volatility. If two indexes have the same total return, but one has lower Annualized Volatility, then its Annualized Sharpe Ratio will be higher. The higher the Annualized Sharpe Ratio, the better the risk-adjusted performance. Annualized Sharpe Ratio is calculated by taking the average monthly total return of the relevant index and subtracting the then current yield on the 90 Day U.S. Treasury Bill. The annualized return of this series is then divided by the Annualized Volatility of this series, and this result is the Annualized Sharpe Ratio for the relevant index. A higher Sharpe Ratio is not a guarantee that one investment or index will in the future produce better risk adjustment total returns, but USCF believes it is a useful tool for investors to consider when making investment decisions.
The following chart compares the hypothetical total return of the SDAI in comparison with the actual total return of three major indexes between September 30, 2007 and September 30, 2017.
Ten Year Comparison of Index Returns of the BCOM Ag TR, S&P GSCI Ag TR,
DB LCI OY Ag TR, and the Hypothetical Returns of the SDAI TR
(9/30/07-9/30/17)
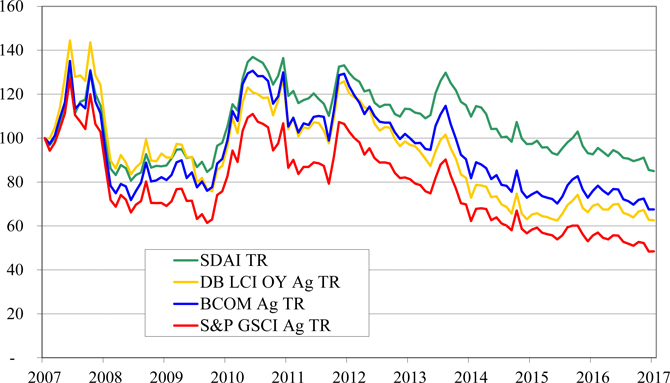
Source: SHIM, Bloomberg
PAST PERFORMANCE IS NOT NECESSARILY INDICATIVE OF FUTURE RESULTS
The following chart compares the hypothetical total return of the SDAI in comparison with the actual total return of three major indexes over a 5 year period.
Five Year Comparison of Index Returns of the DJ-UBS Ag BCOM Copper TR, S&P GSCI Ag TR,Spot Copper Price, Spot Copper Price less Storage DB LCI OY Ag TR,Cost, and the Hypothetical Returns of the SDAISCI TR (3/31/2018-3/31/2023)
(9/30/12-9/30/17)
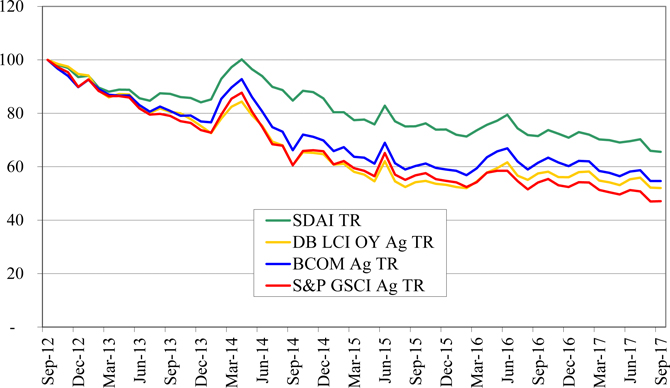

Source: SHIM, Bloomberg, LME PAST PERFORMANCE IS NOT NECESSARILY INDICATIVE OF FUTURE RESULTS
Critical Accounting Policies Preparation of the condensed financial statements and related disclosures in compliance with accounting principles generally accepted in the United States of America requires the application of appropriate accounting rules and guidance, as well as the use of estimates. The Trust’s application of these policies involves judgments and actual results may differ from the estimates used. USCF has evaluated the nature and types of estimates that it makes in preparing the Trust’s condensed financial statements and related disclosures and has determined that the valuation of Applicable Interests, which are not traded on a United States or internationally recognized futures exchange (such as forward contracts and OTC swaps) involves a critical accounting policy. The values which are used by each Trust Series for its Futures Contracts are provided by its commodity broker who uses market prices when available, while OTC swaps are valued based on the present value of estimated future cash flows that would be received from or paid to a third party in settlement of these derivative contracts prior to their delivery date and valued on a daily basis. In addition, each Trust Series estimates interest income on a daily basis using prevailing rates earned on its cash and cash equivalents. These estimates are adjusted to the actual amount received on a monthly basis and the difference, if any, is not considered material. Liquidity and Capital Resources None of the Trust Series has made, and does not anticipate making, use of borrowings or other lines of credit to meet its obligations. Each Trust Series has met, and it is anticipated that each Trust Series will continue to meet, its liquidity needs in the normal course of business from the proceeds of the sale of its investments, or from the Treasuries, cash and/or cash equivalents that it intends to hold at all times. Each Trust Series’ liquidity needs include: redeeming shares, providing margin deposits for its existing Futures Contracts or the purchase of additional Futures Contracts and posting collateral for its OTC swaps, if applicable, and payment of its expenses, summarized below under “Contractual ObligationsObligations.” .”
Each Trust Series currently generates cash primarily from: (i) the sale of baskets consisting of 50,000 shares (“Creation Baskets”)Baskets and (ii) income earned on Treasuries, cash and/or cash equivalents. Each Trust Series has allocated substantially all of its net assets to trading in Applicable Interests. Each Trust Series invests in Applicable Interests to the fullest extent possible without being leveraged or unable to satisfy its current or potential margin or collateral obligations with respect to its investments in Applicable Interests. A significant portion of each Trust Series’ NAV is held in Treasuries, cash and cash equivalents that are used as margin and as collateral for its trading in Applicable Interests. The balance of the assets is held in each Trust Series’ account at the Custodian and in Treasuries at the FCM.one or more FCMs. Income received from any investments in money market funds and Treasuries by a Trust Series will be paid to such Trust Series. During the ninethree months ended September 30, 2017,March 31, 2023, each Trust Series’ expenses exceeded the income it earned and the cash earned from the sale of Creation Baskets and the redemption of Redemption Baskets. Baskets exceeded the expenses. Each Trust Series’ investments in Applicable Interests may be subject to periods of illiquidity because of market conditions, regulatory considerations and other reasons. For example, most commodity exchanges limit the fluctuations in futures contractcontracts prices during a single day by regulations referred to as “daily limits.” During a single day, no trades may be executed at prices beyond the daily limit. Once the price of a futures contract has increased or decreased by an amount equal to the daily limit, positions in the contracts can neither be taken nor liquidated unless the traders are willing to effect trades at or within the specified daily limit. Such market conditions could prevent a Trust Series from promptly liquidating its positions in Futures Contracts. During the ninethree months ended September 30, 2017,March 31, 2023, none of the Trust Series purchased or liquidated any of its positions while daily limits were in effect; however, no Trust Series can predict whether such an event may occur in the future. Prior to the initial offering of each Trust Series, all payments with respect to each Trust Series’ expenses are paid by USCF. None of the Trust Series has an obligation or intention to refund such payments made by USCF. USCF is under no obligation to pay any Trust Series’ future expenses. Since the initial offering of shares, each Trust Series has been responsible for expenses relating to: (i) management fees, (ii) brokerage fees and commissions, (iii) ongoing registration expenses in connection with offers and sales of its shares subsequent to the initial offering, (iv) other expenses, including tax reporting costs, (v) the fees of the Trustee in connection with its services as Delaware trustee of the Trust, (vi) fees and expenses of the independent directors of USCF and (vii) other extraordinary expenses not in the ordinary course of business, while USCF has been responsible for expenses relating to the fees of the Trust Series’ Marketing Agent, Administrator and Custodian, the trading advisory and licensing fees of SummerHaven and offering expenses relating to the initial offering of shares of each Trust Series. If USCF and each Trust Series are unsuccessful in raising sufficient funds to cover these respective expenses or in locating any other source of funding, one or more of the Trust Series could terminate and investors may lose all or part of their investment. Market Risk Trading in Applicable Interests, such as Futures Contracts, involves each Trust Series entering into contractual commitments to purchase or sell specified amounts of commodities at a specified date in the future. The aggregate market value of the contracts will significantly exceed each Trust Series’ future cash requirements since each Trust Series intends to close out its open positions prior to settlement. As a result, each Trust Series is generally only subject to the risk of loss arising from the change in value of the contracts. Each Trust Series considers the “fair value” of its derivative instruments to be the unrealized gain or loss on the contracts. The market risk associated with each Trust Series’ commitments to purchase a specific commodity will be limited to the aggregate market value of the contracts held. Each Trust Series’ exposure to market risk depends on a number of factors, including the markets for commodities, the volatility of interest rates and foreign exchange rates, the liquidity of the Applicable Interest markets and the relationships among the contracts held by each such Trust Series. The limited experience that each Trust Series has had in utilizing its model to trade in Applicable Interests in a manner intended to track the changes in the Applicable Index, as well as drastic market occurrences, could ultimately lead to the loss of all or substantially all of an investor’s capital. Credit Risk When a Trust Series enters into Futures Contracts and Other Related Investments, it is exposed to the credit risk that the counterparty will not be able to meet its obligations. The counterparty for the Futures Contracts traded on the Futures Exchanges is the clearinghouse associated with the particular exchange. In general, in addition to margin required to be posted by the clearinghouse in connection with cleared trades, clearinghouses are backed by their members who may be required to share in the financial burden resulting from the nonperformance of one of their members and, therefore, this additional member support should significantly reduce credit risk. The Trust Series are not currently a member of any clearinghouse. Some foreign exchanges are not backed by their clearinghouse members but may be backed by a consortium of banks or other financial institutions. Unlike in the case of exchange-traded Futures Contracts, the counterparty to an OTC transaction is generally a single bank or other financial institution. As a result, there will be greater counterparty credit risk in OTC transactions. There can be no assurance that any counterparty, clearinghouse, or their members or their financial backers will satisfy their obligations to a Trust Series in such circumstances.
USCF attempts to manage the credit risk of each Trust Series by following various trading limitations and policies. In particular, each Trust Series generally posts margin and/or holds liquid assets that are approximately equal to the market value of its obligations to counterparties under the Futures Contracts and Other Related Investments it holds. USCF has implemented procedures that include, but are not limited to, executing and clearing trades and entering into OTC transactions only with creditworthy parties and/or requiring the posting of collateral or margin by such parties for the benefit of each Trust Series to limit its credit exposure. Each Trust Series’ commodity broker, or any other broker that may be retained by a Trust Series in the future, when acting as the Trust Series’ FCM in accepting orders to purchase or sell Futures Contracts on United States exchanges, is required by CFTC regulations to separately account for and segregate as belonging to a Trust Series, all assets of a Trust Series relating to domestic Futures Contracts trading. These FCMs are not allowed to commingle a Trust Series’ assets with their other assets. In addition, the CFTC requires commodity brokersFCMs to hold in a secure account a Trust Series’ assets related to foreign Futures Contracts trading. During the ninethree months ended September 30, 2017, the only foreign exchanges on whichMarch 31, 2023, USCI made investments were the ICE Futures, which is a London based futures exchange, and the LME, which is a London based metal commodities exchange. Such Futures Contracts are denominated in U.S. dollars. During the nine months ended September 30, 2017, CPER did not make investments on any foreign exchanges. During the ninethree months ended September 30, 2017, the onlyMarch 31, 2023, CPER did not make investments on any foreign exchange on which USAG made investments was the ICE Futures. Such Futures Contracts are denominated in U.S. dollars except Canola, which is denominated in Canadian dollars. exchanges. In the future, a Trust Series may purchase OTC swaps, see“Item 3. Quantitative and Qualitative Disclosures About Market Risk” in this quarterly report on Form 10-Q for a discussion of OTC swaps. As of September 30, 2017,March 31, 2023, each of USCI CPER and USAGCPER held cash deposits and investments in Treasuries and money market funds in the amount of $473,627,315, $7,503,743$201,058,969 and $1,804,501$151,023,543, respectively, with the custodian and FCM.FCMs. Some or all of these amounts held by a custodian or an FCM, as applicable, may be subject to loss should the Trust Series’ custodian or FCM,FCMs, as applicable, cease operations. Off Balance Sheet Financing As of September 30, 2017,March 31, 2023, neither the Trust nor any Trust Series had any loan guarantee, credit support or other off-balance sheet arrangementarrangements of any kind other than agreements entered into in the normal course of business, which may include indemnification provisions relating to certain risks that service providers undertake in performing services which are in the best interests of any Trust Series. While each Trust Series’ exposure under these indemnification provisions cannot be estimated, they are not expected to have a material impact on any Trust Series’ financial position. European Sovereign Debt
None of the Trust Series had direct exposure to European sovereign debt as of September 30, 2017 or had direct exposure to European sovereign debt as of the filing of this quarterly report on Form 10-Q.
Redemption Basket Obligation In order to meet its investment objective and pay its contractual obligations described below, each Trust Series requires liquidity to redeem shares, which redemptions must be in blocks of 50,000 shares called “Redemption Baskets.” Each Trust Series has to date satisfied this obligation by paying from the cash or cash equivalents it holds or through the sale of its Treasuries in an amount proportionate to the number of shares being redeemed. Authorized Participants paid USCI $350 for each order placed to create one or more Creation Baskets or to redeem one or more Redemption Baskets; prior to July 1, 2011, Authorized Participants paid USCI $1,000 for each order placed to create one or more Creation Baskets or to redeem one or more Redemption Baskets. Authorized Participants paid to CPER and USAG $350 for each order placed to create one or more Creation Baskets or to redeem one or more Redemption Baskets. Prior to May 1, 2012, Authorized Participants paid $1,000 for each order placed to create one or more Creation Baskets or to redeem one or more Redemption Baskets. Contractual Obligations The Trust’s (and each series thereunder) primary contractual obligations are with USCF and certain other service providers. USCF, inIn return for its services, USCF is entitled to a management fee calculated as a fixed percentage of a Trust Series’ NAV. Effective January 1, 2016, USCF permanently lowered theThe management fee payable to USCF is 0.80% (80 basis points) per annum of average daily total net assets for USCI and 0.65% (65 basis points) per annum of average daily total net assets for both CPER and USAG, respectively.CPER. Ongoing fees, costs and expenses of its operation for which a Trust Series is responsible include: | ·● | brokerage and other fees and commissions incurred in connection with the trading activities of each Trust Series; |
| ·● | expenses incurred in connection with registering additional shares of each Trust Series or offering shares of each Trust Series after the time any shares of each Trust Series have begun trading on the NYSE Arca; |
| ·● | the routine expenses associated with distribution, including printing and mailing, of any monthly, annual and other reports to shareholders required by applicable U.S. federal and state regulatory authorities; |
| ·● | payment for routine services of the Trustee, legal counsel and independent accountants; |
| ·● | payment for fees associated with tax accounting and reporting, routine accounting, bookkeeping, whether performed by an outside service provider or by affiliates of USCF; |
| ·● | postage and insurance, including directors’ and officers’ liability insurance; |
| ● | costs and expenses associated with investor relations and services; |
| ·● | the payment of any distributions related to redemption of shares; |
| ·● | payment of all federal, state, local or foreign taxes payable on the income, assets or operations of each Trust Series and the preparation of all tax returns related thereto; and |
| ·● | fees and expenses of the independent directors of USCF; and |
| · | extraordinary expenses (including, but not limited to, indemnification of any person against liabilities and obligations to the extent permitted by law and required under the Trust Agreement and the bringing and defending of actions at law or in equity and otherwise engaging in the conduct of litigation and the incurring of legal expense and the settlement of claims and litigation). |
While USCF has agreed to pay registration fees to the SEC, FINRA, NYSE Arca or any other regulatory agency or exchange in connection with the initial offer and sale of the shares and the legal, printing, accounting and other expenses associated with such registration, each Trust Series is responsible for any registration fees and related expenses incurred in connection with any subsequent offer and sale of its shares after the initial offering of shares. In addition, any Trust Series, in its Registration Statement, may provide for different allocation of expenses among the Sponsor and such Trust Series, in each case solely with respect to such Trust Series. Each Trust Series pays its own brokerage and other transaction costs. Each Trust Series pays fees to the FCMFCMs in connection with its transactions in Futures Contracts. For the ninethree months ended September 30, 2017,March 31, 2023, FCM fees were approximately0.11% 0.10% of average daily total net assets for USCI, and approximately0.05% 0.04% of average daily total net assets for CPER, and approximately0.11% of average daily total net assets for USAG.CPER. In general, transaction costs on OTC Applicable Interests and on Treasuries and other short-term securities are embedded in the purchase or sale price of the instrument being purchased or sold, and may not readily be estimated. USCF had voluntarily agreed to pay certain expenses normally borne by USCI to the extent that such expenses exceeded 0.15% (15 basis points) of USCI’s NAV, on an annualized basis, through March 31, 2011. As of March 31,June 30, 2011 thewhen such expense waiver was no longer in effect for USCI.terminated. USCF has voluntarily agreed to pay certain expenses typically borne by each CPER and USAG to the extent that such expenses exceed 0.15% (15 basis points) of each of CPER’s or USAG’s NAV, on an annualized basis. USCF can terminate this agreement at any time in its sole discretion. If this agreement were terminated such expense waiver as of April 30, 2021. As a result, the Annual Fund Operating Expenses could increase,increased, which would negatively impact your total return from an investment in CPER or USAG. CPER. This voluntary expense waiver iswas in addition to those amounts USCF is contractually obligated to pay as described inNote 5 – Contractsto the condensed financial statements of the Trust and Agreements.terminated on April 30, 2021. The parties cannot anticipate the amount of payments that will be required under these arrangements for future periods, as each Trust Series’ NAVs and trading levels to meet its investment objective will not be known until a future date. These agreements are effective for a specific term agreed upon by the parties with an option to renew, or, in some cases, are in effect for the duration of a Trust Series’ existence. Either party may terminate these agreements earlier for certain reasons described in the agreements. As of September 30, 2017,March 31, 2023, USCI’s portfolio consisted of 10,3894,653 Futures Contracts traded on the Futures Exchanges and CPER’s portfolio consisted of 1031,500 Futures Contracts traded on the COMEX and USAG’s portfolio consisted of 73 Futures Contracts traded on the Futures Exchanges.COMEX. For a list of each of USCI’s CPER’s and USAG’sCPER’s current holdings, please see www.uscfinvestments.com. See “Holdings” for a complete list of Futures Contracts held by each of USCI, CPER and USAG during the nine months ended September 30, 2017. Item 3. Quantitative and Qualitative Disclosures About Market Risk.
Commodity Price Risk.
USCI USAG, and CPER are exposed to commodity price risk. In particular, each Trust Series is exposed to commodity risk of the commodities that comprise the Applicable Index for such Trust Series through its holdings of Futures Contracts together with any other derivatives in which it may invest, which are discussed below. As a result, fluctuations in the value of the Futures Contracts that each Trust Series holds in its portfolio, as described in“Contractual Obligations”under “Item 2. Management’s Discussion and Analysis of Financial Condition and Results of OperationsOperations” ,”above, are expected to directly affect the value of the shares of the Trust Series.
OTC Contract Risk Currently, OTC transactions are subject to changing regulation.
USCI USAG, and CPER may purchase OTC Commodity-Related Interests, Agriculture-Related Interests and Copper-Related Interests, such as forward contracts or swap or spot contracts, respectively.contracts. Unlike most exchange-traded futures contracts or exchange-traded options on such futures, each party to an OTC swap bears the credit risk that the other party may not be able to perform its obligations under its contract. The Trust, on behalf of each Trust Series, may enter into certain transactions where an OTC component is exchanged for a corresponding futures contract (“Exchange for Related Position” or “EFRP” transactions). In the most common type of EFRP transaction entered into by the Trust, the OTC component is the purchase or sale of one or more baskets of a Trust Series shares. These EFRP transactions may expose a Trust Series to counterparty risk during the interim period between the executionsexecution of the OTC component and the exchange for a corresponding futures contract. Generally, the counterparty risk from the EFRP transaction will exist only on the day of execution.
Swap transactions, like other financial transactions, involvesinvolve a variety of significant risks. The specific risks presented by a particular swap transaction necessarily depend upon the terms and circumstances of the transaction. In general, however, all swap transactions involve some combination of market risk, credit risk, counterparty credit risk, funding risk, liquidity risk and operational risk. Highly customized swap transactions in particular may increase liquidity risk, which may result in a suspension of redemptions. Highly leveraged transactions may experience substantial gains or losses in value as a result of relatively small changes in the value or level of an underlying or related market factor. In evaluating the risks and contractual obligations associated with a particular swap transaction, it is important to consider that a swap transaction may be modified or terminated only by mutual consent of the original parties and subject to agreement on individually negotiated terms. Therefore, it may not be possible for USCF to modify, terminate or offset a Trust Series’ obligations or its exposure to the risks associated with a transaction prior to its scheduled termination date. To reduce the credit risk that arises in connection with such contracts, a Trust Series will generally enter into an agreement with each counterparty based on the Master Agreement published by ISDAthe International Swaps and Derivatives Association that provides for the netting of its overall exposure to its counterparty, if the counterparty is unable to meet its obligations to the Trust Series due to the occurrence of a specified event, such as the insolvency of the counterparty. A Trust Series assesses or reviews, as appropriate, the creditworthiness of each potential or existing counterparty to an OTC contract pursuant to guidelines approved by USCF’s Board.board of directors (the “Board”). Furthermore, USCF on behalf of a Trust Series only enters into OTC contractsswaps with counterparties who are, or are affiliates of, (a) banks regulated by a United States federal bank regulator, (b) broker-dealers regulated by the SEC, (c) insurance companies domiciled in the United States, or (d) producers, users or traders of energy, whether or not regulated by the CFTC. Any entity acting as a counterparty shall be regulated in either the United States or the United Kingdom unless otherwise approved by the Board after consultation with its legal counsel. Existing counterparties are also reviewed periodically by USCF. A Trust Series will also require that the counterparty be highly rated and/or provide collateral or other credit support. Even if collateral is used to reduce counterparty credit risk, sudden changes in the value of OTC transactions may leave a party open to financial risk due to a counterparty default since the collateral held may not cover a party’s exposure on the transaction in such situations. In general, valuing OTC derivatives is less certain than valuing actively traded financial instruments such as exchange-traded futures contracts and securities or cleared swaps because the price and terms on which such OTC derivatives are entered into or can be terminated are individually negotiated, and those prices and terms may not reflect the best price or terms available from other sources. In addition, while market makers and dealers generally quote indicative prices or terms for entering into or terminating OTC swaps, they typically are not contractually obligated to do so, particularly if they are not a party to the transaction. As a result, it may be difficult to obtain an independent value for an outstanding OTC derivatives transaction. During the nine monththree-month reporting period ended September 30, 2017, each of theMarch 31, 2023, no Trust series limited itsSeries had any OTC activities to EFRP transactions. activities. Each Trust Series anticipates that the use of Other Related Investments together with its investments in Futures Contracts will produce price and total return results that closely track the investment goals of such Trust Series. However, there can be no assurance of this. OTC swaps may result in higher transaction-related expenses than the brokerage commissions paid in connection with the purchase of Futures Contracts, which may impact a Trust Series’ ability to successfully track its Applicable Index. Item 4. Controls and Procedures. Disclosure Controls and Procedures The Trust and each Trust Series maintain disclosure controls and procedures that are designed to ensure that information required to be disclosed in the Trust’s periodic reports filed or submitted under the Securities Exchange Act of 1934, as amended, is recorded, processed, summarized and reported within the time period specified in the SEC’sSecurities and Exchange Commission’s (“SEC”) rules and forms. The duly appointed officers of USCF, including its chief executive officer and chief financial officer, who perform functions equivalent to those of a principal executive officer and principal financial officer of the Trust if the Trust had any officers, have evaluated the effectiveness of the Trust’s and each Trust Series’ disclosure controls and procedures and have concluded that the disclosure controls and procedures of the Trust and each Trust Series have been effective as of the end of the period covered by this quarterly report on Form 10-Q. Change in Internal Control Over Financial Reporting There were no changes in the Trust’s or any Trust Series’ internal control over financial reporting during the last fiscal quarter that have materially affected, or are reasonably likely to materially affect, the Trust’s or any Trust Series’ internal control over financial reporting. Certifications 78The certifications by the Principal Executive Officer and Principal Financial Officer of the Trust required by Section 302 and Section 906 of the Sarbanes-Oxley Act of 2002, which are filed or furnished as exhibits to this Quarterly Report on Form 10-Q, apply both to the Trust taken as a whole and each Trust Series, and the Principal Executive Officer and Principal Financial Officer of the Trust are certifying both as to the Trust taken as a whole and each Trust Series.
Part II. OTHER INFORMATION Item 1. Legal Proceedings. From time to time, a Trust Series may be involved in legal proceedings arising primarily from the ordinary course of its business. None of the Trust Series is currently party to any material legal proceedings. In addition, USCF, as sponsor of the Trust and general partner of the Related Public Funds may, from time to time, be involved in litigation arising out of its operations in the ordinary course of its business. Except as described herein, USCF is not currently party to any material legal proceedings. Not applicable.Optimum Strategies Action
On April 6, 2022, USO and USCF were named as defendants in an action filed by Optimum Strategies Fund I, LP, a purported investor in call option contracts on USO (the “Optimum Strategies Action”). The action is pending in the U.S. District Court for the District of Connecticut at Civil Action No. 3:22-cv-00511. The Optimum Strategies Action asserts claims under the Securities Exchange Act of 1934, as amended (the “1934 Act”), Rule 10b-5 thereunder, and the Connecticut Uniform Securities Act (“CUSA”). It purports to challenge statements in registration statements that became effective in February 2020, March 2020, and on April 20, 2020, as well as public statements between February 2020 and May 2020, in connection with certain extraordinary market conditions and the attendant risks that caused the demand for oil to fall precipitously, including the COVID-19 global pandemic and the Saudi Arabia-Russia oil price war. The complaint seeks damages, interest, costs, attorney’s fees, and equitable relief. USCF and USO intend to vigorously contest such claims and moved for their dismissal. On March 15, 2023, the Court issued a decision granting defendants' motion to dismiss, with prejudice as to the 1934 Act claims and without prejudice as to the CUSA claim. Settlement of SEC and CFTC Investigations On November 8, 2021, USCF and USO announced a resolution with each of the SEC and the CFTC relating to matters set forth in certain Wells Notices issued by the staffs of each of the SEC and CFTC as more fully described below. On August 17, 2020, USCF, USO, and John Love received a “Wells Notice” from the staff of the SEC (the “SEC Wells Notice”). The SEC Wells Notice stated that the SEC staff made a preliminary determination to recommend that the SEC file an enforcement action against USCF, USO, and Mr. Love alleging violations of Sections 17(a)(1) and 17(a)(3) of the Securities Act of 1933, as amended (the “1933 Act”), and Section 10(b) of the Securities Exchange Act of 1934, as amended (the “1934 Act”), and Rule 10b-5 thereunder. Subsequently, on August 19, 2020, USCF, USO, and Mr. Love received a Wells Notice from the staff of the CFTC (the “CFTC Wells Notice”). The CFTC Wells Notice stated that the CFTC staff made a preliminary determination to recommend that the CFTC file an enforcement action against USCF, USO, and Mr. Love alleging violations of Sections 4o(1)(A) and (B) and 6(c)(1) of the Commodity Exchange Act of 1936, as amended (the “CEA”), 7 U.S.C. §§ 6o(1)(A) and (B) and 9(1) (2018), and CFTC Regulations 4.26, 4.41, and 180.1(a), 17 C.F.R. §§ 4.26, 4.41, 180.1(a) (2019). On November 8, 2021, acting pursuant to an offer of settlement submitted by USCF and USO, the SEC issued an order instituting cease-and-desist proceedings, making findings, and imposing a cease-and-desist order pursuant to Section 8A of the 1933 Act, directing USCF and USO to cease and desist from committing or causing any violations of Section 17(a)(3) of the 1933 Act, 15 U.S.C. § 77q(a)(3) (the “SEC Order”). In the SEC Order, the SEC made findings that, from April 24, 2020 to May 21, 2020, USCF and USO violated Section 17(a)(3) of 1933 Act, which provides that it is “unlawful for any person in the offer or sale of any securities to engage in any transaction, practice, or course of business which operates or would operate as a fraud or deceit upon the purchaser.” USCF and USO consented to entry of the SEC Order without admitting or denying the findings contained therein, except as to jurisdiction. Separately, on November 8, 2021, acting pursuant to an offer of settlement submitted by USCF, the CFTC issued an order instituting cease-and-desist proceedings, making findings, and imposing a cease-and-desist order pursuant to Section 6(c) and (d) of the CEA, directing USCF to cease and desist from committing or causing any violations of Section 4o(1)(B) of the CEA, 7 U.S.C. § 6o(1) (B), and CFTC Regulation 4.41(a)(2), 17 C.F.R. § 4.41(a)(2) (the “CFTC Order”). In the CFTC Order, the CFTC made findings that, from on or about April 22, 2020 to June 12, 2020, USCF violated Section 4o(1)(B) of the CEA and CFTC Regulation 4.41(a)(2), which make it unlawful for any commodity pool operator (“CPO”) to engage in “any transaction, practice, or course of business which operates as a fraud or deceit upon any client or participant or prospective client or participant” and prohibit a CPO from advertising in a manner which “operates as a fraud or deceit upon any client or participant or prospective client or participant,” respectively. USCF consented to entry of the CFTC Order without admitting or denying the findings contained therein, except as to jurisdiction. Pursuant to the SEC Order and the CFTC Order, in addition to the command to cease and desist from committing or causing any violations of Section 17(a)(3) of the 1933 Act, Section 4o(1)(B) of the CEA, and CFTC Regulation 4.14(a)(2), civil monetary penalties totaling two million five hundred thousand dollars ($2,500,000) in the aggregate were required to be paid to the SEC and CFTC, of which one million two hundred fifty thousand dollars ($1,250,000) was paid by USCF to each of the SEC and the CFTC, respectively, pursuant to the offsets permitted under the orders. In re: United States Oil Fund, LP Securities Litigation On June 19, 2020, USCF, USO, John P. Love, and Stuart P. Crumbaugh were named as defendants in a putative class action filed by purported shareholder Robert Lucas (the “Lucas Class Action”). The Court thereafter consolidated the Lucas Class Action with two related putative class actions filed on July 31, 2020 and August 13, 2020, and appointed a lead plaintiff. The consolidated class action is pending in the U.S. District Court for the Southern District of New York under the caption In re: United States Oil Fund, LP SecuritiesLitigation, Civil Action No. 1:20-cv-04740. On November 30, 2020, the lead plaintiff filed an amended complaint (the “Amended Lucas Class Complaint”). The Amended Lucas Class Complaint asserts claims under the 1933 Act, the 1934 Act, and Rule 10b-5. The Amended Lucas Class Complaint challenges statements in registration statements that became effective on February 25, 2020 and March 23, 2020 as well as subsequent public statements through April 2020 concerning certain extraordinary market conditions and the attendant risks that caused the demand for oil to fall precipitously, including the COVID-19 global pandemic and the Saudi Arabia-Russia oil price war. The Amended Lucas Class Complaint purports to have been brought by an investor in USO on behalf of a class of similarly-situated shareholders who purchased USO securities between February 25, 2020 and April 28, 2020 and pursuant to the challenged registration statements. The Amended Lucas Class Complaint seeks to certify a class and to award the class compensatory damages at an amount to be determined at trial as well as costs and attorney’s fees. The Amended Lucas Class Complaint named as defendants USCF, USO, John P. Love, Stuart P. Crumbaugh, Nicholas D. Gerber, Andrew F Ngim, Robert L. Nguyen, Peter M. Robinson, Gordon L. Ellis, and Malcolm R. Fobes III, as well as the marketing agent, ALPS Distributors, Inc., and the Authorized Participants: ABN Amro, BNP Paribas Securities Corporation, Citadel Securities LLC, Citigroup Global Markets, Inc., Credit Suisse Securities USA LLC, Deutsche Bank Securities Inc., Goldman Sachs & Company, J.P. Morgan Securities Inc., Merrill Lynch Professional Clearing Corporation, Morgan Stanley & Company Inc., Nomura Securities International Inc., RBC Capital Markets LLC, SG Americas Securities LLC, UBS Securities LLC, and Virtu Financial BD LLC. The lead plaintiff has filed a notice of voluntary dismissal of its claims against BNP Paribas Securities Corporation, Citadel Securities LLC, Citigroup Global Markets Inc., Credit Suisse Securities USA LLC, Deutsche Bank Securities Inc., Morgan Stanley & Company, Inc., Nomura Securities International, Inc., RBC Capital Markets, LLC, SG Americas Securities LLC, and UBS Securities LLC. USCF, USO, and the individual defendants in In re: United States Oil Fund, LP Securities Litigation intend to vigorously contest such claims and have moved for their dismissal. Wang Class Action On July 10, 2020, purported shareholder Momo Wang filed a putative class action complaint, individually and on behalf of others similarly situated, against defendants USO, USCF, John P. Love, Stuart P. Crumbaugh, Nicholas D. Gerber, Andrew F Ngim, Robert L. Nguyen, Peter M. Robinson, Gordon L. Ellis, Malcolm R. Fobes, III, ABN Amro, BNP Paribas Securities Corp., Citadel Securities LLC, Citigroup Global Markets Inc., Credit Suisse Securities USA LLC, Deutsche Bank Securities Inc., Goldman Sachs & Company, JP Morgan Securities Inc., Merrill Lynch Professional Clearing Corp., Morgan Stanley & Company Inc., Nomura Securities International Inc., RBC Capital Markets LLC, SG Americas Securities LLC, UBS Securities LLC, and Virtu Financial BD LLC, in the U.S. District Court for the Northern District of California as Civil Action No. 3:20-cv-4596 (the “Wang Class Action”). The Wang Class Action asserted federal securities claims under the 1933 Act, challenging disclosures in a March 19, 2020 registration statement. It alleged that the defendants failed to disclose to investors in USO certain extraordinary market conditions and the attendant risks that caused the demand for oil to fall precipitously, including the COVID-19 global pandemic and the Saudi Arabia-Russia oil price war. The Wang Class Action was voluntarily dismissed on August 4, 2020. Mehan Action On August 10, 2020, purported shareholder Darshan Mehan filed a derivative action on behalf of nominal defendant USO, against defendants USCF, John P. Love, Stuart P. Crumbaugh, Nicholas D. Gerber, Andrew F Ngim, Robert L. Nguyen, Peter M. Robinson, Gordon L. Ellis, and Malcolm R. Fobes, III (the “Mehan Action”). The action is pending in the Superior Court of the State of California for the County of Alameda as Case No. RG20070732. The Mehan Action alleges that the defendants breached their fiduciary duties to USO and failed to act in good faith in connection with a March 19, 2020 registration statement and offering and disclosures regarding certain extraordinary market conditions that caused demand for oil to fall precipitously, including the COVID-19 global pandemic and the Saudi Arabia-Russia oil price war. The complaint seeks, on behalf of USO, compensatory damages, restitution, equitable relief, attorney’s fees, and costs. All proceedings in the Mehan Action are stayed pending disposition of the motion(s) to dismiss in In re: United States Oil Fund, LP Securities Litigation. USCF, USO, and the other defendants intend to vigorously contest such claims. In re United States Oil Fund, LP Derivative Litigation On August 27, 2020, purported shareholders Michael Cantrell and AML Pharm. Inc. DBA Golden International filed two separate derivative actions on behalf of nominal defendant USO, against defendants USCF, John P. Love, Stuart P. Crumbaugh, Andrew F Ngim, Gordon L. Ellis, Malcolm R. Fobes, III, Nicholas D. Gerber, Robert L. Nguyen, and Peter M. Robinson in the U.S. District Court for the Southern District of New York at Civil Action No. 1:20-cv-06974 (the “Cantrell Action”) and Civil Action No. 1:20-cv-06981 (the “AML Action”), respectively. The complaints in the Cantrell and AML Actions are nearly identical. They each allege violations of Sections 10(b), 20(a) and 21D of the 1934 Act, Rule 10b-5 thereunder, and common law claims of breach of fiduciary duties, unjust enrichment, abuse of control, gross mismanagement, and waste of corporate assets. These allegations stem from USO’s disclosures and defendants’ alleged actions in light of the extraordinary market conditions in 2020 that caused demand for oil to fall precipitously, including the COVID-19 global pandemic and the Saudi Arabia-Russia oil price war. The complaints seek, on behalf of USO, compensatory damages, restitution, equitable relief, attorney’s fees, and costs. The plaintiffs in the Cantrell and AML Actions have marked their actions as related to the Lucas Class Action. The Court consolidated the Cantrell and AML Actions under the caption In re United States Oil Fund, LP Derivative Litigation, Civil Action No. 1:20-cv-06974 and appointed co-lead counsel. All proceedings in In re United States Oil Fund, LP Derivative Litigation are stayed pending disposition of the motion(s) to dismiss in In re: United States Oil Fund, LP Securities Litigation. USCF, USO, and the other defendants intend to vigorously contest the claims in In re United States Oil Fund, LP Derivative Litigation. Item 1A. Risk Factors. There have been no material changes to the risk factors previously disclosed in the Trust’s Annual Report on Form 10-K for the fiscal year ended December 31, 2016,2022, filed on March 10, 2017.February 27, 2023 (the “Form 10-K”). Item 2. Unregistered Sales of Equity Securities and Use of Proceeds. | (c) | USCI does not purchase shares directly from its shareholders. In connection with its redemption of baskets held by Authorized Participants, USCI redeemed 1219 baskets (comprising 600,000950,000 shares) during the thirdfirst quarter of the year endedending December 31, 2017.2023. The following table summarizes the redemptions by Authorized Participants during the three months ended September 30, 2017:March 31, 2023: |
Issuer Purchases of Equity Securities | | | | | | | | Total | | | | | | Number of | | | | | | Shares | | Average Price Per | Period | | Redeemed | | Share | 1/1/23 to 1/31/23 | | 300,000 | | $ | 55.44 | 2/1/23 to 2/28/23 | | 400,000 | | $ | 54.23 | 3/1/23 to 3/31/23 | | 250,000 | | $ | 52.72 | Total | | 950,000 | | | |
| Period | | Total
Number of
Shares
Redeemed | | | Average
Price
Per Share | | | 7/1/17 to 7/31/17 | | | 150,000 | | | $ | 38.82 | | | 8/1/17 to 8/31/17 | | | 200,000 | | | $ | 39.48 | | | 9/1/17 to 9/30/17 | | | 250,000 | | | $ | 40.65 | | | Total | | | 600,000 | | | | | |
| (d) | CPER does not purchase shares directly from its shareholders. In connection with its redemption of baskets held by Authorized Participants, CPER redeemed 750 baskets (comprising 350,0002,500,000 shares) during the thirdfirst quarter of the year endedending December 31, 2017.2023. The following table summarizes the redemptions by Authorized Participants during the three months ended September 30, 2017:March 31, 2023: |
Issuer Purchases of Equity Securities | | | | | | | | Total | | | | | | Number of | | | | | | Shares | | Average Price Per | Period | | Redeemed | | Share | 1/1/23 to 1/31/23 | | 1,750,000 | | $ | 24.91 | 2/1/23 to 2/28/23 | | 450,000 | | $ | 25.06 | 3/1/23 to 3/31/23 | | 300,000 | | $ | 24.38 | Total | | 2,500,000 | | | |
| Period | | Total
Number of
Shares
Redeemed | | | Average
Price
Per Share | | | 7/1/17 to 7/31/17 | | | 200,000 | | | $ | 17.69 | | | 8/1/17 to 8/31/17 | | | 100,000 | | | $ | 18.77 | | | 9/1/17 to 9/30/17 | | | 50,000 | | | $ | 18.74 | | | Total | | | 350,000 | | | | | |
| (e) | USAG does not purchase shares directly from its shareholders. In connection with its redemption of baskets held by Authorized Participants, USAG did not redeem any baskets during the third quarter of the year ended December 31, 2017. The following table summarizes the redemptions by Authorized Participants during the three months ended September 30, 2017: |
Issuer Purchases of Equity Securities
Period | | Total
Number of
Shares
Redeemed | | | Average
Price
Per Share | | 7/1/17 to 7/31/17 | | | — | | | | NA | | 8/1/17 to 8/31/17 | | | — | | | | NA | | 9/1/17 to 9/30/17 | | | — | | | | NA | | Total | | | — | | | | | |
Item 3. Defaults Upon Senior Securities. Not applicable.
Item 4. Mine Safety Disclosures. Not applicable. Item 5. Other Information. Monthly Account Statements Not applicable.Pursuant to the requirement under Rule 4.22 under the Commodity Exchange Act, each month the Trust and each Trust Series publish account statements for the Trust Series’ shareholders, which include Statements of Income (Loss) and Statements of Changes in Net Asset Value. The account statements are furnished to the SEC on a current report on Form 8-K pursuant to Section 13 or 15(d) of the Exchange Act and posted each month on each Trust Series’ website at www.uscfinvestments.com.
Item 6. Exhibits. Listed below are the exhibits, which are filed as part of this quarterly report on Form 10-Q (according to the number assigned to them in Item 601 of Regulation S-K): Exhibit
Number | SIGNATURES SIGNATURES
Pursuant to the requirements of theSecurities Exchange Act of 1934, the registrant has duly caused this report to be signed on its behalf by the undersigned thereunto duly authorized. United States Commodity Index Funds Trust (Registrant) By: United States Commodity Funds LLC, its Sponsor By: | /s/ /s/ John P. Love | | | John P. Love | | | President and Chief Executive Officer | | | (Principal (Principal executive officer) | |
Date: May 8, 2023 By: | | Date: November 6, 2017 | | | | By: | /s/ /s/ Stuart P. Crumbaugh | | | Stuart P. Crumbaugh | | | Chief Financial Officer | | | (Principal (Principal financial and accounting officer) | | | | Date: November 6, 2017 | |
Date: May 8, 2023 |
|
