CAUTIONARY STATEMENT REGARDING FORWARD-LOOKING INFORMATION
This report contains forward-looking statements. These statements involve known and unknown risks, uncertainties and other factors which may cause our actual results, performance or achievements to be materially different from any future results, performance or achievement expressed or implied by the forward-looking statements. These risks and uncertainties include, but are not limited to, the factors described under Part 1 Item 2 “Management’s Discussion and Analysis of Financial Condition and Results of Operations.” In some cases, you can identify forward-looking statements by terms such as “anticipates,” “believes,” “could,” “estimates,” “expects,” “intends,” “may,” “plans,” “potential,” “predicts,” “projects,” “should,” “would” and similar expressions intended to identify forward-looking statements. Forward-looking statements reflect our current views with respect to future events and are based on assumptions and subject to risks and uncertainties. Given these uncertainties, you should not place undue reliance on these forward-looking statements.
Forward-looking statements represent our estimates and assumptions only as of the date of this report. You should read this report and the documents that we reference in this report, or that we filed as exhibits to this report completely and with the understanding that our actual future results may be materially different from what we expect.
Except as required by law, we assume no obligation to update any forward-looking statements publicly, or to update the reasons actual results could differ materially from those anticipated in any forward-looking statements, even if new information becomes available in the future.
3
OTHER PERTINENT INFORMATION
References in this quarterly report to “we,” “us,” “our,” the “Registrant”“our” and the “Company” and words of like import refer to China United Insurance Service, Inc., its subsidiaries and consolidated affiliated entities (“CAE”) unless otherwise indicated by the context.
variable interest entities.
References to China or the PRC refer to the People’s Republic of China (excluding Hong Kong, Macao and Taiwan). References to Taiwan refer to Taiwan, Republic of China.
Unless context indicates otherwise, reference to the “Company” in this quarterly report refers to China United Insurance Service, Inc. and its subsidiaries. Reference to “AHFL” refers to the combined operations of Action Holdings Financial Limited and its Taiwan Subsidiaries (as defined below). Reference to “Anhou” refers to the combined operations of Law Anhou Insurance Agency Co., Ltd. and its subsidiaries.
Our business is conducted in Taiwan Hong Kong and China using New Taiwanese Dollars (“NT$” or “NTD”), the currency of Taiwan, Hong Kong Dollars (“NTD”HK$” or “HKD”), the currency of Hong Kong, (“HKD”), and RMB, the currency of China, (“RMB”), respectively, and our financial statements are presented in United States dollars (“USD”, “US$” or “$”). In this quarterly report, we refer to assets, obligations, commitments and liabilities in our financial statements in USD.U.S. dollars. These dollar references are based on the exchange rate of NTD, HKDNT$, HK$ and RMB to USD, determined as of a specific date. Changes in the exchange rate will affect the amount of our obligations and the value of our assets in terms of USDU.S. dollars which may result in an increase or decrease in the amount of our obligations (expressed in USD) and the value of our assets, including accounts receivable (expressed in USD).
4
PART I. FINANCIAL INFORMATION
ITEM 1. CONDENSED CONSOLIDATED FINANCIAL STATEMENTS (UNAUDITED)
CHINA UNITED INSURANCE SERVICE, INC. AND SUBSIDIARIES
CONDENSED CONSOLIDATED BALANCE SHEETS
| | | | | | |
|
| September 30, 2020 |
| December 31, 2019 | ||
(Amount in USD) | | (Unaudited) | | | | |
ASSETS | | | | | | |
Current assets | | | | | | |
Cash and cash equivalents | | $ | 13,571,935 | | $ | 12,615,008 |
Time deposits | |
| 46,890,005 | |
| 38,731,658 |
Accounts receivable | |
| 15,309,244 | |
| 22,541,558 |
Contract assets | | | 3,593,536 | | | — |
Marketable securities | | | 1,214,712 | | | 290,153 |
Other current assets | |
| 1,751,824 | |
| 1,810,962 |
Total current assets | |
| 82,331,256 | |
| 75,989,339 |
| | | | | | |
Property and equipment, net | |
| 2,176,044 | |
| 1,402,866 |
Right-of-use assets under operating leases | | | 5,791,689 | | | 5,522,665 |
Intangible assets, net | |
| 387,986 | |
| 518,264 |
Long-term investments | |
| 2,784,188 | |
| 2,693,082 |
Restricted cash – noncurrent | |
| 63,779 | |
| 43,492 |
Deferred tax assets | | | 1,016,388 | | | 441,364 |
Other assets | |
| 3,776,728 | |
| 2,631,350 |
TOTAL ASSETS | | $ | 98,328,058 | | $ | 89,242,422 |
| | | | | | |
LIABILITIES AND STOCKHOLDERS' EQUITY | |
|
| |
|
|
Current liabilities | |
|
| |
|
|
Short-term loans | | $ | 13,466,184 | | $ | 8,100,000 |
Commissions payable to sales professionals | | | 10,466,205 | | | 12,545,730 |
Contract liabilities - current | | | 1,609,155 | | | 1,781,975 |
Income tax payable - current | |
| 2,583,652 | |
| 2,389,304 |
Operating lease liabilities - current | | | 2,740,054 | | | 2,242,034 |
Due to related parties | |
| 190,933 | |
| 462,859 |
Other current liabilities | |
| 7,306,157 | |
| 9,875,209 |
Total current liabilities | |
| 38,362,340 | |
| 37,397,111 |
| | | | | | |
Contract liabilities - noncurrent | | | 271,375 | | | 1,049,258 |
Income tax payable - noncurrent | |
| 719,515 | |
| 815,451 |
Operating lease liabilities - noncurrent | | | 3,008,155 | | | 3,048,632 |
Other liabilities | |
| 1,365,689 | |
| 1,180,478 |
TOTAL LIABILITIES | |
| 43,727,074 | |
| 43,490,930 |
| | | | | | |
COMMITMENTS AND CONTINGENCIES | |
| | |
| |
| | | | | | |
STOCKHOLDERS’ EQUITY | |
| | |
| |
Preferred stock, par value $0.00001, 10,000,000 authorized, 1,000,000 issued and outstanding | |
| 10 | |
| 10 |
Common stock, par value $0.00001, 100,000,000 authorized, 29,421,736 issued and outstanding | |
| 294 | |
| 294 |
Additional paid-in capital | |
| 8,190,449 | |
| 8,190,449 |
Statutory reserves | |
| 8,228,904 | |
| 8,228,904 |
Retained earnings | |
| 12,191,120 | |
| 9,402,294 |
Accumulated other comprehensive income | |
| 1,715,678 | |
| 417,015 |
Total stockholders' equity attribute to the Company's shareholders | |
| 30,326,455 | |
| 26,238,966 |
Noncontrolling interests | |
| 24,274,529 | |
| 19,512,526 |
TOTAL STOCKHOLDERS' EQUITY | |
| 54,600,984 | |
| 45,751,492 |
TOTAL LIABILITIES AND STOCKHOLDERS' EQUITY | | $ | 98,328,058 | | $ | 89,242,422 |
| September 30, 2017 | December 31, 2016 | |||||||
| (UNAUDITED) | ||||||||
| ASSETS | ||||||||
| Current assets | ||||||||
| Cash and cash equivalents | $ | 11,663,265 | $ | 20,169,455 | ||||
| Time deposits | 21,475,432 | 5,352,347 | ||||||
| Marketable securities | 32,867 | 2,426,870 | ||||||
| Structured deposit | 1,205,162 | - | ||||||
| Accounts receivable, net | 7,217,051 | 15,774,159 | ||||||
| Other current assets | 2,274,353 | 1,890,551 | ||||||
| Total current assets | 43,868,130 | 45,613,382 | ||||||
| Property, plant and equipment, net | 927,062 | 926,905 | ||||||
| Intangible assets | 747,610 | 784,219 | ||||||
| Goodwill | 2,071,491 | 2,071,491 | ||||||
| Long-term investments | 1,368,950 | 1,285,064 | ||||||
| Other assets | 2,149,619 | 726,482 | ||||||
| TOTAL ASSETS | $ | 51,132,862 | $ | 51,407,543 | ||||
| LIABILITIES AND STOCKHOLDERS’ EQUITY | ||||||||
| Current liabilities | ||||||||
| Tax payable | $ | 2,356,626 | $ | 2,249,869 | ||||
| Convertible bonds | 200,000 | - | ||||||
| Due to related parties | 646,862 | 400,001 | ||||||
| Other current liabilities | 10,420,828 | 18,639,909 | ||||||
| Total current liabilities | 13,624,316 | 21,289,779 | ||||||
| Convertible bonds - noncurrent | - | 200,000 | ||||||
| Long-term loans | 265,985 | 254,907 | ||||||
| Long-term liabilities | 4,898,335 | 5,315,327 | ||||||
| TOTAL LIABILITIES | 18,788,636 | 27,060,013 | ||||||
| COMMITMENTS AND CONTINGENCIES | ||||||||
| STOCKHOLDERS’ EQUITY | ||||||||
| Preferred stock, par value $0.00001, 10,000,000 authorized, 1,000,000 issued and outstanding | 10 | 10 | ||||||
| Common stock, par value $0.00001, 100,000,000 authorized, 29,452,669 issued and outstanding | 295 | 295 | ||||||
| Additional paid-in capital | 8,190,449 | 8,157,512 | ||||||
| Statutory reserves | 5,054,720 | 3,799,585 | ||||||
| Retained earnings | 6,663,807 | 3,286,562 | ||||||
| Accumulated other comprehensive gain/(loss) | 168,008 | (667,976 | ) | |||||
| Stockholders’ equity attribute to parent’s shareholders | 20,077,289 | 14,575,988 | ||||||
| Noncontrolling interests | 12,266,937 | 9,771,542 | ||||||
| TOTAL STOCKHOLDERS’ EQUITY | 32,344,226 | 24,347,530 | ||||||
| TOTAL LIABILITIES AND STOCKHOLDERS’ EQUITY | $ | 51,132,862 | $ | 51,407,543 | ||||
The accompanying notes are an integral part of these condensed consolidated financial statements.
5
CHINA UNITED INSURANCE SERVICE, INC. AND SUBSIDIARIES
UNAUDITED CONDENSED CONSOLIDATED STATEMENTS OF OPERATIONS AND OTHER COMPREHENSIVE INCOME / (LOSS)
(UNAUDITED)
| Three Months Ended September 30, | Nine Months Ended September 30, | |||||||||||||||
| 2017 | 2016 | 2017 | 2016 | |||||||||||||
| Revenue | $ | 16,210,334 | $ | 14,951,345 | $ | 50,084,684 | $ | 43,289,113 | ||||||||
| Cost of revenue | 9,071,624 | 9,335,735 | 29,746,059 | 27,986,021 | ||||||||||||
| Gross profit | 7,138,710 | 5,615,610 | 20,338,625 | 15,303,092 | ||||||||||||
| Operating expenses: | ||||||||||||||||
| Selling | 783,120 | 630,255 | 1,481,423 | 2,094,965 | ||||||||||||
| General and administrative | 3,708,037 | 3,359,674 | 10,714,341 | 9,336,015 | ||||||||||||
| Total operating expenses | 4,491,157 | 3,989,929 | 12,195,764 | 11,430,980 | ||||||||||||
| Income from operations | 2,647,553 | 1,625,681 | 8,142,861 | 3,872,112 | ||||||||||||
| Other income (expenses): | ||||||||||||||||
| Interest income | 79,299 | 31,113 | 246,559 | 137,222 | ||||||||||||
| Interest expenses | (8,293 | ) | (1,601 | ) | (24,562 | ) | (11,165 | ) | ||||||||
| Dividend income | 1,391 | 3,633 | 331,140 | 272,522 | ||||||||||||
| Other - net | 89,065 | 21,248 | 136,113 | (46,104 | ) | |||||||||||
| Total other income (expenses) | 161,462 | 54,393 | 689,250 | 352,475 | ||||||||||||
| Income before income tax | 2,809,015 | 1,680,074 | 8,832,111 | 4,224,587 | ||||||||||||
| Income tax expense | 831,878 | 456,828 | 2,345,147 | 1,335,331 | ||||||||||||
| Net income | 1,977,137 | 1,223,246 | 6,486,964 | 2,889,256 | ||||||||||||
| Net income attributable to the noncontrolling interests | 669,490 | 465,501 | 1,854,584 | 1,301,226 | ||||||||||||
| Net income attributable to parent’s shareholders | 1,307,647 | 757,745 | 4,632,380 | 1,588,030 | ||||||||||||
| Other comprehensive items | ||||||||||||||||
| Foreign currency translation gain | 48,149 | 260,981 | 793,090 | 378,217 | ||||||||||||
| Other | 175 | - | 42,894 | (1,593 | ) | |||||||||||
| Other comprehensive income attributable to parent’s shareholders | 48,324 | 260,981 | 835,984 | 376,624 | ||||||||||||
| Other comprehensive items attributable to noncontrolling interests | 23,405 | 249,160 | 640,811 | 408,827 | ||||||||||||
| Comprehensive income attributable to parent’s shareholders | $ | 1,355,971 | $ | 1,018,726 | $ | 5,468,364 | $ | 1,964,654 | ||||||||
| Comprehensive income attributable to noncontrolling interests | $ | 692,895 | $ | 714,661 | $ | 2,495,395 | $ | 1,710,053 | ||||||||
| Weighted average shares outstanding: | ||||||||||||||||
| Basic | 29,452,669 | 29,452,669 | 29,452,669 | 29,452,669 | ||||||||||||
| Diluted | 30,521,407 | 30,478,667 | 30,521,407 | 30,462,097 | ||||||||||||
| Net income per share attributable to parent’s shareholder: | ||||||||||||||||
| Basic | $ | 0.044 | $ | 0.026 | $ | 0.157 | $ | 0.054 | ||||||||
| Diluted | $ | 0.043 | $ | 0.025 | $ | 0.152 | $ | 0.052 | ||||||||
| | | | | | | | | | | | |
| | Three Months Ended September 30, | | Nine Months Ended September 30, | ||||||||
|
| 2020 |
| 2019 |
| 2020 |
| 2019 | ||||
(Amount in USD) | | | | | | |
| | | | | |
Revenue | | $ | 33,235,952 | | $ | 23,266,852 | | $ | 91,200,916 | | $ | 64,449,994 |
Cost of revenue | |
| 21,269,044 | |
| 14,374,811 | |
| 63,261,959 | |
| 41,805,241 |
| | | | | | | | | | | | |
Gross profit | |
| 11,966,908 | |
| 8,892,041 | |
| 27,938,957 | |
| 22,644,753 |
| | | | | | | | | | | | |
Operating expenses: | |
| | |
| | |
| | |
| |
Selling | |
| 926,004 | |
| 744,429 | |
| 1,783,692 | |
| 1,741,372 |
General and administrative | |
| 5,705,115 | |
| 4,706,802 | |
| 18,614,446 | |
| 12,934,838 |
Total operating expense | |
| 6,631,119 | |
| 5,451,231 | |
| 20,398,138 | |
| 14,676,210 |
| | | | | | | | | | | | |
Income from operations | |
| 5,335,789 | |
| 3,440,810 | |
| 7,540,819 | |
| 7,968,543 |
| | | | | | | | | | | | |
Other income (expenses): | |
| | |
| | |
| | |
| |
Interest income | |
| 100,266 | |
| 138,408 | |
| 325,168 | |
| 356,896 |
Interest expenses | |
| (33,443) | |
| (64,372) | |
| (153,703) | |
| (144,515) |
Dividend income | |
| 2,368 | |
| (720) | |
| 321,603 | |
| 309,903 |
Other - net | |
| 23,648 | |
| (180,560) | |
| 94,796 | |
| 134,122 |
Total other income (expense), net | |
| 92,839 | |
| (107,244) | |
| 587,864 | |
| 656,406 |
| | | | | | | | | | | | |
Income before income taxes | |
| 5,428,628 | |
| 3,333,566 | |
| 8,128,683 | |
| 8,624,949 |
Income tax expense | |
| (1,364,725) | |
| (933,985) | |
| (2,893,297) | |
| (2,254,086) |
| | | | | | | | | | | | |
Net income | |
| 4,063,903 | |
| 2,399,581 | |
| 5,235,386 | |
| 6,370,863 |
Less: net income attributable to noncontrolling interests | |
| (1,277,587) | |
| (1,071,427) | |
| (2,446,560) | |
| (2,557,603) |
Net income attributable to the Company's shareholders | |
| 2,786,316 | |
| 1,328,154 | |
| 2,788,826 | |
| 3,813,260 |
| | | | | | | | | | | | |
Other comprehensive income (loss) items: | |
| | |
| | |
| | |
| |
Foreign currency translation gain (loss) | |
| 1,106,349 | |
| (186,331) | |
| 2,066,175 | |
| (782,667) |
Other | |
| (201) | |
| 0 | |
| (317) | |
| 0 |
Total other comprehensive income (loss) | | | 1,106,148 | | | (186,331) | | | 2,065,858 | | | (782,667) |
| | | | | | | | | | | | |
Comprehensive income | | | 5,170,051 | | | 2,213,250 | | | 7,301,244 | | | 5,588,196 |
Less: comprehensive income attributable to noncontrolling interests | | | (1,709,453) | | | (1,044,640) | | | (3,213,755) | | | (2,311,894) |
| | | | | | | | | | | | |
Comprehensive income attributable to the Company's shareholders | | $ | 3,460,598 | | $ | 1,168,610 | | $ | 4,087,489 | | $ | 3,276,302 |
| | | | | | | | | | | | |
Weighted average shares outstanding | |
| | |
| | |
| | |
| |
Basic and diluted | | | 29,421,736 | | | 29,421,736 | | | 29,421,736 | | | 29,432,047 |
| | | | | | | | | | | | |
Earnings per share attributable to the Company's shareholders | |
| | |
|
| |
| | |
| |
Basic and diluted | | $ | 0.092 | | $ | 0.044 | | $ | 0.092 | | $ | 0.125 |
The accompanying notes are an integral part of these condensed consolidated financial statements.
6
CHINA UNITED INSURANCE SERVICE, INC. AND SUBSIDIARIES
UNAUDITED CONDENSED CONSOLIDATED STATEMENTS OF CASH FLOWSCHANGES IN STOCKHOLDERS' EQUITY
(UNAUDITED)
| Nine Months Ended September 30, | ||||||||
| 2017 | 2016 | |||||||
| Cash flows from operating activities: | ||||||||
| Net income | $ | 6,486,964 | $ | 2,889,256 | ||||
| Adjustments to reconcile net income to net cash provided by operating activities | ||||||||
| Depreciation and amortization | 410,593 | 455,383 | ||||||
| Amortization of bond premium | 193 | - | ||||||
| Gain on settlement of debt | - | (83,425 | ) | |||||
| Gain on valuation of financial assets | 1,372,468 | (10,868 | ) | |||||
| Loss on disposals of property, plant and equipment | 75,121 | 25,568 | ||||||
| Deferred income tax | (20,030 | ) | (65,235 | ) | ||||
| Changes in operating assets and liabilities: | ||||||||
| Accounts receivable | 9,541,161 | 4,085,141 | ||||||
| Other current assets | (268,864 | ) | 450,406 | |||||
| Other assets | (1,331,414 | ) | 66,823 | |||||
| Tax payable | (35,858 | ) | (112,098 | ) | ||||
| Other current liabilities | (9,339,583 | ) | (3,943,730 | ) | ||||
| Long-term liabilities | (753,022 | ) | 623,579 | |||||
| Net cash provided by operating activities | 6,137,729 | 4,380,800 | ||||||
| Cash flows from investing activities: | ||||||||
| Repayments to pervious shareholders | - | (150,959 | ) | |||||
| Purchases of structured deposit | (1,292,441 | ) | - | |||||
| Purchases of time deposits | (24,572,262 | ) | (7,095,147 | ) | ||||
| Proceeds from maturities of time deposits | 8,888,669 | 8,025,394 | ||||||
| Purchase of marketable securities | (6,231,364 | ) | - | |||||
| Proceeds from disposals of marketable securities | 7,488,976 | - | ||||||
| Purchase of property, plant and equipment | (257,944 | ) | (371,913 | ) | ||||
| Purchase of intangible assets | (88,745 | ) | (437,294 | ) | ||||
| Net cash used in investing activities | (16,065,111 | ) | (29,919 | ) | ||||
| Cash flows from financing activities: | ||||||||
| Proceeds from related party borrowings | 261,589 | 68,431 | ||||||
| Repayment to related parties | (281 | ) | (623,507 | ) | ||||
| Payment to noncontrolling interest as reduction of cash capital | - | (77,043 | ) | |||||
| Proceeds from third party borrowings | - | 469,028 | ||||||
| Repayment to loans | - | (224,447 | ) | |||||
| Net cash provided by (used in) financing activities | 261,308 | (387,538 | ) | |||||
| Foreign currency translation | 1,159,884 | 596,891 | ||||||
| Net increase (decrease) in cash and cash equivalents | (8,506,190 | ) | 4,560,234 | |||||
| Cash and cash equivalents, beginning balance | 20,169,455 | 13,083,357 | ||||||
| Cash and cash equivalents, ending balance | $ | 11,663,265 | $ | 17,643,591 | ||||
| SUPPLEMENTARY DISCLOSURE: | ||||||||
| Interest paid | $ | 29,806 | $ | 2,324 | ||||
| Income tax paid | $ | 2,298,197 | $ | 1,549,580 | ||||
| SUPPLEMENTAL DISCLOSURES OF CASH FLOW FOR NON-CASH TRANSACTION: | ||||||||
| Debt forgiveness - related parties | $ | 32,937 | $ | - | ||||
| | | | | | | | | | | | | | | | | | | | | | | | | | | | | | | | |
| | | | | | | | | | | | | | | | | | | Accumulated | | | | | | | | | | | | | |
| | | | | | | | | | | | | Additional | | | | | Other | | | | | | | | | | | | | ||
| | Common | | | | | Preferred | | | | | Paid-in | | Statutory | | Comprehensive | | Retained | | | | | Noncontrolling | | Total | |||||||
|
| Stock |
| Amount |
| Stock |
| Amount |
| Capital |
| Reserves |
| Income |
| Earnings |
| Total |
| Interests |
| Equity | ||||||||||
(Amount in USD) | | | | | | | | | | | | | | | | | | | | | | | | | | | | | | | | |
Balance June 30, 2020 |
| 29,421,736 | | $ | 294 | | | 1,000,000 | | $ | 10 | | $ | 8,190,449 | | $ | 8,228,904 | | $ | 1,041,396 | | $ | 9,404,804 | | $ | 26,865,857 | | $ | 22,565,076 | | $ | 49,430,933 |
| | | | | | | | | | | | | | | | | | | | | | | | | | | | | | | | |
Foreign currency translation gain |
| — | |
| — | |
| — | |
| — | |
| — | |
| — | |
| 674,414 | |
| — | |
| 674,414 | |
| 431,935 | |
| 1,106,349 |
Other comprehensive loss |
| — | |
| — | |
| — | |
| — | |
| — | |
| — | |
| (132) | |
| — | |
| (132) | |
| (69) | |
| (201) |
Net income |
| — | |
| — | |
| — | |
| — | |
| — | |
| — | |
| — | |
| 2,786,316 | |
| 2,786,316 | |
| 1,277,587 | |
| 4,063,903 |
| | | | | | | | | | | | | | | | | | | | | | | | | | | | | | | | |
Balance September 30, 2020 |
| 29,421,736 | | $ | 294 | | | 1,000,000 | | $ | 10 | | $ | 8,190,449 | | $ | 8,228,904 | | $ | 1,715,678 | | $ | 12,191,120 | | $ | 30,326,455 | | $ | 24,274,529 | | $ | 54,600,984 |
| | | | | | | | | | | | | | | | | | | | | | | | | | | | | | | | |
| | | | | | | | | | | | | | | | | | | Accumulated | | | | | | | | | | | | | |
| | | | | | | | | | | | | Additional | | | | | Other | | | | | | | | | | | | | ||
| | Common | | | | | Preferred | | | | | Paid-in | | Statutory | | Comprehensive | | Retained | | | | | Noncontrolling | | Total | |||||||
|
| Stock |
| Amount |
| Stock |
| Amount |
| Capital |
| Reserves |
| Income |
| Earnings |
| Total |
| Interests |
| Equity | ||||||||||
(Amount in USD) | | | | | | | | | | | | | | | | | | | | | | | | | | | | | | | | |
Balance December 31, 2019 |
| 29,421,736 | | $ | 294 | | | 1,000,000 | | $ | 10 | | $ | 8,190,449 | | $ | 8,228,904 | | $ | 417,015 | | $ | 9,402,294 | | $ | 26,238,966 | | $ | 19,512,526 | | $ | 45,751,492 |
| | | | | | | | | | | | | | | | | | | | | | | | | | | | | | | | |
Compensation cost in connection with issuance of preferred stock on the Company’s subsidiary, Uniwill, to nonemployees | | — | | | — | | | — | | | — | | | — | | | — | | | — | | | — | | | — | | | 1,547,229 | | | 1,547,229 |
Business acquisition |
| — | |
| — | |
| — | |
| — | |
| — | |
| — | |
| — | |
| — | |
| — | |
| 1,019 | |
| 1,019 |
Foreign currency translation gain |
| — | |
| — | |
| — | |
| — | |
| — | |
| — | |
| 1,298,872 | |
| — | |
| 1,298,872 | |
| 767,303 | |
| 2,066,175 |
Other comprehensive loss |
| — | |
| — | |
| — | |
| — | |
| — | |
| — | |
| (209) | |
| — | |
| (209) | |
| (108) | |
| (317) |
Net income |
| — | |
| — | |
| — | |
| — | |
| — | |
| — | |
| — | |
| 2,788,826 | |
| 2,788,826 | |
| 2,446,560 | |
| 5,235,386 |
| | | | | | | | | | | | | | | | | | | | | | | | | | | | | | | | |
Balance September 30, 2020 |
| 29,421,736 | | $ | 294 | | | 1,000,000 | | $ | 10 | | $ | 8,190,449 | | $ | 8,228,904 | | $ | 1,715,678 | | $ | 12,191,120 | | $ | 30,326,455 | | $ | 24,274,529 | | $ | 54,600,984 |
7
| | | | | | | | | | | | | | | | | | | | | | | | | | | | | | | | |
| | | | | | | | | | | | | | | | | | | Accumulated | | | | | | | | | | | | | |
| | | | | | | | | | | | | Additional | | | | | Other | | | | | | | | | | | | | ||
| | Common | | | | | Preferred | | | | | Paid-in | | Statutory | | Comprehensive | | Retained | | | | | Noncontrolling | | Total | |||||||
|
| Stock |
| Amount |
| Stock |
| Amount |
| Capital |
| Reserves |
| Loss |
| Earnings |
| Total |
| Interests |
| Equity | ||||||||||
(Amount in USD) | | | | | | | | | | | | | | | | | | | | | | | | | | | | | | | | |
Balance June 30, 2019 |
| 29,421,736 | | $ | 294 | | | 1,000,000 | | $ | 10 | | $ | 8,190,449 | | $ | 8,058,094 | | $ | (548,732) | | $ | 8,999,362 | | $ | 24,699,477 | | $ | 17,648,448 | | $ | 42,347,925 |
| | | | | | | | | | | | | | | | | | | | | | | | | | | | | | | | |
Appropriation of reserves | | — | | | — | | | — | | | — | | | — | | | (1,760) | | | — | | | 1,760 | | | — | | | — | | | — |
Acquisition of noncontrolling interest |
| — | |
| — | |
| — | |
| — | |
| — | |
| — | |
| — | |
| — | |
| — | |
| (30,150) | |
| (30,150) |
Foreign currency translation loss |
| — | |
| — | |
| — | |
| — | |
| — | |
| — | |
| (159,544) | |
| — | |
| (159,544) | |
| (26,787) | |
| (186,331) |
Net income |
| — | |
| — | |
| — | |
| — | |
| — | |
| — | |
| — | |
| 1,328,154 | |
| 1,328,154 | |
| 1,071,427 | |
| 2,399,581 |
| | | | | | | | | | | | | | | | | | | | | | | | | | | | | | | | |
Balance September 30, 2019 |
| 29,421,736 | | $ | 294 | | | 1,000,000 | | $ | 10 | | $ | 8,190,449 | | $ | 8,056,334 | | $ | (708,276) | | $ | 10,329,276 | | $ | 25,868,087 | | $ | 18,662,938 | | $ | 44,531,025 |
| | | | | | | | | | | | | | | | | | | | | | | | | | | | | | | | |
| | | | | | | | | | | | | | | | | | | Accumulated | | | | | | | | | | | | | |
| | | | | | | | | | | | | Additional | | | | | Other | | | | | | | | | | | | | ||
| | Common | | | | | Preferred | | | | | Paid-in | | Statutory | | Comprehensive | | Retained | | | | | Noncontrolling | | Total | |||||||
|
| Stock |
| Amount |
| Stock |
| Amount |
| Capital |
| Reserves |
| Loss |
| Earnings |
| Total |
| Interests |
| Equity | ||||||||||
(Amount in USD) | | | | | | | | | | | | | | | | | | | | | | | | | | | | | | | | |
Balance December 31, 2018 |
| 29,452,669 | | $ | 295 | | | 1,000,000 | | $ | 10 | | $ | 8,190,449 | | $ | 7,299,123 | | $ | (171,318) | | $ | 7,273,227 | | $ | 22,591,786 | | $ | 16,351,044 | | $ | 38,942,830 |
| | | | | | | | | | | | | | | | | | | | | | | | | | | | | | | | |
Appropriation of reserves | | — | |
| — | |
| — | |
| — | |
| — | |
| 757,211 | | | — | | | (757,211) | | | — | | | — | | | — |
Foreign currency translation loss |
| — | |
| — | |
| — | |
| — | |
| — | |
| — | |
| (536,958) | |
| — | |
| (536,958) | |
| (245,709) | |
| (782,667) |
Retirement of common stock | | (30,933) | | | (1) | | | — | | | — | | | — | | | — | | | — | | | — | | | (1) | | | — | | | (1) |
Net income |
| — | |
| — | |
| — | |
| — | |
| — | |
| — | |
| — | |
| 3,813,260 | |
| 3,813,260 | |
| 2,557,603 | |
| 6,370,863 |
| | | | | | | | | | | | | | | | | | | | | | | | | | | | | | | | |
Balance September 30, 2019 |
| 29,421,736 | | $ | 294 | | | 1,000,000 | | $ | 10 | | $ | 8,190,449 | | $ | 8,056,334 | | $ | (708,276) | | $ | 10,329,276 | | $ | 25,868,087 | | $ | 18,662,938 | | $ | 44,531,025 |
The accompanying notes are an integral part of these condensed consolidated financial statements.
8
CHINA UNITED INSURANCE SERVICE, INC. AND SUBSIDIARIES
CONDENSED CONSOLIDATED STATEMENTS OF CASH FLOWS
(UNAUDITED)
| | | | | | |
| | Nine Months Ended | ||||
| | September 30, | ||||
(Amount in USD) |
| 2020 |
| 2019 | ||
Cash flows from operating activities: | | | | | | |
Net income | | $ | 5,235,386 | | $ | 6,370,863 |
Adjustments to reconcile net income to net cash provided by operating activities: | |
| | |
| |
Compensation cost in connection with issuance of preferred stock on the Company’s subsidiary, Uniwill, to nonemployees | | | 1,547,229 | | | 0 |
Depreciation and amortization | |
| 694,862 | |
| 498,178 |
Amortization of bond premium | |
| 202 | |
| 0 |
Gain on sales of marketable securities | | | (104,208) | | | (18,970) |
Gain on valuation of financial assets | | | (48,904) | | | (24,296) |
Loss on disposal of equipment | | | 45,306 | | | 20,733 |
Loss on disposal of a subsidiary | | | 5,645 | | | 0 |
Deferred income tax | |
| (98,596) | |
| (66,746) |
Changes in operating assets and liabilities: | |
| | |
| |
Accounts receivable | |
| 7,775,347 | |
| 4,473,238 |
Contract assets | | | (3,494,823) | | | (3,304,938) |
Other current assets | |
| 234,614 | |
| (265,401) |
Other assets | |
| (1,512,399) | |
| (3,126,292) |
Commissions payable to sales professionals | |
| (2,439,637) | |
| (735,625) |
Contract liabilities | | | (1,019,695) | | | (335,879) |
Income tax payable | |
| 33,874 | |
| 169,161 |
Other current liabilities | |
| (2,565,675) | |
| 22,573 |
Other liabilities | |
| 140,468 | |
| 80,562 |
Net cash provided by operating activities | |
| 4,428,996 | |
| 3,757,161 |
| | | | | | |
Cash flows from investing activities: | |
| | |
|
|
Cash received from issuance of preferred stock on the Company’s subsidiary, Uniwill, to nonemployees | | | 371 | | | 0 |
Purchases of time deposits | |
| (53,753,884) | |
| (41,901,757) |
Proceeds from maturities of time deposits | |
| 47,141,011 | |
| 31,802,019 |
Purchases of marketable securities | |
| (950,791) | |
| (315,442) |
Proceeds from sales of marketable securities | |
| 215,832 | |
| 364,748 |
Purchase of equipment | | | (1,250,361) | | | (454,612) |
Proceeds from disposal of equipment | | | 3,008 | | | 22,557 |
Purchase of intangible assets | |
| (51,797) | |
| (71,568) |
Net cash used in investing activities | |
| (8,646,611) | |
| (10,554,055) |
| | | | | | |
Cash flows from financing activities: | |
|
| |
|
|
Proceeds from short-term loans | |
| 38,774,384 | |
| 21,539,897 |
Repayment of short-term loans | |
| (33,560,000) | |
| (19,542,276) |
Proceeds from related party borrowing | |
| (275,573) | |
| 116,581 |
Net cash provided by financing activities | | | 4,938,811 | |
| 2,114,202 |
| |
| | | | |
Foreign currency translation | |
| 256,018 | |
| (366,421) |
Net decrease in cash, cash equivalents and restricted cash | |
| 977,214 | |
| (5,049,113) |
| | | | | | |
Cash, cash equivalents and restricted cash, beginning balance | |
| 12,658,500 | |
| 20,639,771 |
Cash, cash equivalents and restricted cash, ending balance | | $ | 13,635,714 | | $ | 15,590,658 |
| | | | | | |
SUPPLEMENTARY DISCLOSURE: | | | | | | |
Interest paid | | $ | 160,978 | | $ | 151,011 |
Income tax paid | | $ | 3,298,391 | | $ | 2,023,938 |
The accompanying notes are an integral part of these condensed consolidated financial statements.
9
CHINA UNITED INSURANCE SERVICE, INC. AND SUBSIDIARIES
NOTES TO CONDENSED CONSOLIDATED FINANCIAL STATEMENTS
(UNAUDITED)
(Unaudited)
(Amount in USD)
NOTE 1 – ORGANIZATION AND PRINCIPAL ACTIVITIES
China United Insurance Service, Inc. (“China United,” “CUIS”United”, “CUII”, or the “Company”) is a Delaware corporation, organized on June 4, 2010 by Yi HsiaoYi-Hsiao Mao, a TaiwaneseTaiwan citizen, as a listing vehicle for both ZLI Holdings Limited (“ZLI Holdings”CU Hong Kong”) and Action Holdings Financial Limited (“AHFL”), which isAHFL,” a company incorporated in the British Virgin Islands). The Company primarily engages in brokerage and insurance agency services by providing two broad categories of insurance products, life insurance products and property and casualty insurance products, and manages its business through aggregating them into three geographic operating segments, Taiwan, PRC, and Hong Kong. The Company’s common stock currently quotedtrades over the counter under the ticker symbol “CUII” on the United States OverOTC Pink market.
In May 2019, AHFL entered into an agreement to make capital contributions of $485,909 (NTD15,000,000) to AIlife International Investment Co., Limited (“AIlife”, formerly known as “Ilife”). After the Counter Bulletin Board.transaction, the Company owned 93.75% of AIlife. In July 2019, AHFL acquired the remaining 6.25% shares of AIlife, which became the Company's wholly owned subsidiary. The business objective of AIlife is to obtain a non-exclusive license covering certain information technology systems from Law Broker and generate revenues from marketing and making the technologies available to insurance intermediary companies.
O June 4, 2019, AIlife entered into an acquisition agreement with the selling shareholder of Uniwill Insurance Broker Co., Ltd (“Uniwill”). Pursuant to the acquisition agreement, AIlife agreed to pay $14,535 (NTD 450,000) in exchange for the insurance brokerage licenses issued to Uniwill by the Taiwanese government, along with right to the Uniwill company name and $6,455 (NTD 200,000) of legal deposits. The Company has no intention of operating the Uniwill existing brokerage business nor retaining any of its sales personnel. Therefore, the acquisition is accounted as an assets purchase.
On November 15, 2019, AIlife, Cyun-Jhan Enterprise Co., Ltd. (“Cyun-Jhan”), and Jian-Zao International Industrial Co., Ltd. (“Jian-Zao” and, collectively with AIlife and Cyun-Jhan, the “Parties”) entered into a Joint Venture Agreement (the “JV Agreement”). Under the terms of the JV Agreement, the Parties agreed to invest funds, labor and technology into Uniwill. Under the terms of the JV Agreement, the paid-in capital of Uniwill should increase to an aggregate amount of $13.3 million (NTD 400 million) by AIlife, provided that the other two parties achieve performance goals no later than December 31, 2021. On August 15, 2019, AIlife increased and completed the capital injections in Uniwill to the amount of $3.3 million.
Uniwill issued a total of 9,608 preferred shares to Cyun-Jhan and Jian-Zao for cash and recognized compensation cost of $1,547,229 after the performance goals of the first stage were achieved on February 10, 2020 (the "Grant Date"). The holders of 9,608 shares of preferred stocks participate in daily operating and entitle to have the rights of share 50% of earnings of Uniwill. Each share of the preferred stock issued has 1,000 voting rights in shareholder's meeting. In addition, the holders of the preferred stocks are eligible to convert the preferred stocks to common stocks of Uniwill at a ratio of 1 preferred share to 1,000 common shares upon the achievement of the performance goals of stage two set forth in the JV Agreement. As of September 30, 2020, the performance goals of the second stage was not fulfilled.
On May 27, 2020, the Company completed the acquisition of Rays Technology Corporation ("Rays") for its 90% equity interest. The consideration to acquire 27,000 shares of Ray was US$9,177 (NTD 270,000). The acquisition is accounted as a business purchase. The Company did not recognize any goodwill or gain on bargain purchase as a result of the net asset value acquired approximating to the consideration paid.
On July 2, 2020, the Company had liquidated a subsidiary in the PRC, Prime Management Consulting (Nanjing) Co., Limited and recognized a loss on disposal of a subsidiary of $5,645 for the three and nine months ended September 30, 2020.
10
In January 2020, the World Health Organization declared an outbreak of the coronavirus (COVID-19) to be a Public Health Emergency of International Concern, subsequently declared COVID-19 a global pandemic, and recommended containment and mitigation measures worldwide on March 11, 2020. We had experienced some adverse impacts on our business in the PRC Segment, such as limited access to our staff in the PRC in the beginning of the outbreak and restrictions on business travel within the PRC and between Taiwan and the PRC. Even though the operations in the PRC segment fully resumed in the second quarter of 2020, the pandemic has created global economic uncertainties and led to negative impact on the financial markets. The extent of the COVID-19 impact to the Company will depend on numerous factors and developments related to COVID-19. Consequently, any potential impacts of COVID-19 remain highly uncertain and cannot be predicted with confidence.
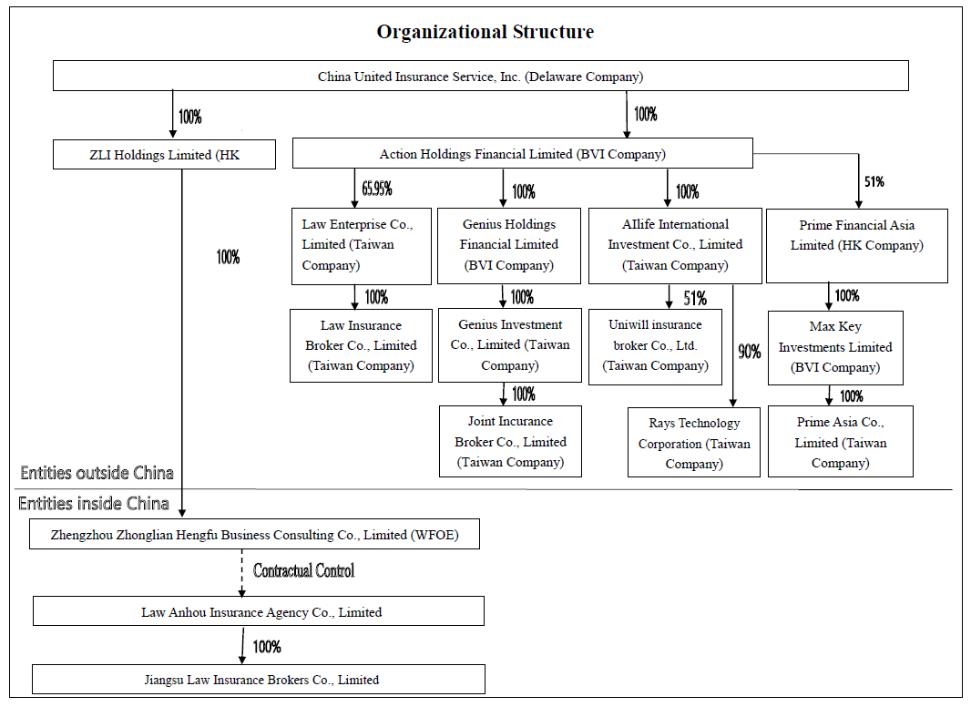
The corporate structure as of September 30, 2017 was2020 is as follows:

NOTE 2 – SUMMARY OF SIGNIFICANT ACCOUNTING POLICIES
Principles of Consolidation
The unaudited accompanying condensed consolidated financial statements include the accounts of China United, and its subsidiaries and variable interest entities as shown in the organizationcorporate structure in Note 1. All significant intercompany transactions and balances have been eliminated in consolidation. Certain reclassifications have been made to the consolidated financial statements for prior year to the current year’s presentation. Such reclassifications have no effect on net income as previously reported.
11
Basis of Presentation
The unaudited condensed consolidated financial statements presented herein have been prepared in accordance with accounting principles generally accepted in the United States (“GAAP”) for interim financial information and in accordance with the instructions to Form 10-Q and Regulation S-X. Accordingly, the financial statements do not include all of the information and notes required by GAAP for complete financial statements. In the opinion of management, all adjustments, including normal recurring adjustments, considered necessary for a fair presentationstatement of the financial statements have been included. Operating results for the three and nine months ended September 30, 20172020 are not necessarily indicative of the results that may be expected for the year endedending December 31, 2017.
2020.
These unaudited condensed consolidated financial statements and notes thereto should be read in conjunction with the Company’s audited consolidated financial statements and notes thereto for the year ended December 31, 2016,2019, which were included in the Company’s 20162019 Annual Report on Form 10-K.10-K (“2019 Form 10-K”). The accompanying condensed consolidated balance sheet as of December 31, 2016,2019, has been derived from the Company’s audited consolidated financial statements as of that date.
Use of Estimates
Reclassifications
Certain reclassifications have been madeThe preparation of the Company’s condensed consolidated financial statements in conformity with GAAP requires management to make estimates, judgments and assumptions that affect the prior periods’amounts reported in the consolidated financial statements and notesfootnotes thereto. Actual results may differ from those estimates and assumptions.
Accounts Receivable and Allowance for Doubtful Accounts
Accounts receivable includes commission receivables stated at net realizable values. The Company reviews its accounts receivable regularly to conformdetermine if a bad debt allowance is necessary at each quarter-end. Management reviews the composition of accounts receivable and analyzes the age of receivables outstanding, customer concentrations, customer credit worthiness, current economic trends and changes in customer payment patterns to evaluate the current period’s presentation. Such reclassifications have no effect on net incomenecessity of making such allowance. No allowance was deemed necessary as previously reported. Please see Note 23, Reclassifications.of September 30, 2020 and December 31, 2019.
Foreign Currency Translations
Transactions
The Company’s financial statements are presented in U.S. dollars ($), which is the Company’s reporting and functional currency. The functional currencies of the Company’s subsidiaries are NTD, RMB and HKD. The resulting translation adjustments are reported under other comprehensive income in accordance with Financial Accounting Standards Board (“FASB”) Accounting Standards Codification (“ASC”) Topic 220 (“ASC 220”), “Reporting Comprehensive Income”. Gains and losses resulting from the translation of foreign currency transactions are reflected in the consolidated statements of operations and other comprehensive income (loss). Monetary assets and liabilities denominated in foreign currency are translated at the functional currency using the rate of exchange prevailing at the balance sheet date. Any differences are taken to profit or loss as a gain or loss on foreign currency translation in the consolidated statements of operations. operations and other comprehensive income (loss).
In accordance with ASC 830, Foreign Currency Matters, theThe Company translates the assets and liabilities into U.S. dollars using the rate of exchange prevailing at the balance sheet date and the statements of operations and cash flows are translated at an average rate during the reporting period. Adjustments resulting from the translation from NTD, RMB and HKD into U.S. dollars are recorded in stockholders’ equity as part of accumulated other comprehensive income. The exchange rates used for interimcondensed consolidated financial statements are as follows:
| Average Exchange Rate for the Nine Months Ended September 30, | |||||||||||||||
| 2017 | 2016 | ||||||||||||||
| | | | | | | | ||||||||
| | Average Rate for the Nine Months Ended | | ||||||||||||
| | September 30, | | ||||||||||||
|
| 2020 |
| 2019 | | ||||||||||
| New Taiwan dollar (NTD) | NTD | 30.505166 | NTD | 32.736000 | | NTD | 29.770854 |
| NTD | 31.032055 | | ||||
| China yuan (RMB) | RMB | 6.805734 | RMB | 6.579240 | | RMB | 6.994085 |
| RMB | 6.861782 | | ||||
| Hong Kong dollar (HKD) | HKD | 7.787013 | HKD | 7.763280 | | HKD | 7.757236 |
| HKD | 7.837965 | | ||||
| United States dollar ($) | $ | 1.000000 | $ | 1.000000 | | $ | 1.000000 |
| $ | 1.000000 | | ||||
| Exchange Rate at | ||||||||
| September 30, 2017 | December 31, 2016 | |||||||
| New Taiwan dollar (NTD) | NTD | 30.324000 | NTD | 32.283100 | ||||
| China yuan (RMB) | RMB | 6.654500 | RMB | 6.943700 | ||||
| Hong Kong dollar (HKD) | HKD | 7.811000 | HKD | 7.754340 | ||||
| United States dollar ($) | $ | 1.000000 | $ | 1.000000 | ||||
12
| | | | | | | |
| | Exchange Rate at | | ||||
|
| September 30, 2020 |
| December 31, 2019 | | ||
New Taiwan dollar (NTD) | | NTD | 28.953074 |
| NTD | 29.953143 | |
China yuan (RMB) | | RMB | 6.801266 |
| RMB | 6.966764 | |
Hong Kong dollar (HKD) | | HKD | 7.749884 |
| HKD | 7.787223 | |
United States dollar ($) | | $ | 1.000000 | | $ | 1.000000 | |
Earnings Per Share
Basic earnings per common share (“EPS”) is computed by dividing net income attributable to the common shareholders of the Company by the weighted-average number of common shares outstanding. Diluted EPS is computed in the same manner as basic EPS, except the number of shares includes additional common shares that would have been outstanding if potential common shares with a dilutive effect had been issued.
As the holders of preferred stock of the Company are entitled to share equally with the holders of common stock, on a per share basis, in such dividends and other distributions of cash, property or shares of stock of the Company as may be declared by the board of directors, the preferred stock is treated as a participating security. When calculating the basic earnings per common share, the two-class method is used to allocate earnings to common stock and participating security as required by FASB ASC Topic 260, “Earnings Per Share”. As of September 30, 2020 and 2019, the Company did not have any potentially dilutive instrument.
Fair ValuesValue of Financial Instruments
Accounting Standards Codification (ASC) 820, Fair Value Measurement, definesvalue accounting establishes a framework for measuring fair value and expands disclosure about fair value measurements. Fair value, which is defined as the price at whichthat would be received to sell an asset could be exchanged or paid to transfer a liability transferred in an orderly transaction between knowledgeable, willing parties inmarket participants at the principal or most advantageous market for the asset or liability. Where available,measurement date. This framework provides a fair value is basedhierarchy that prioritizes the inputs to valuation techniques used to measure fair value into three levels as follows:
| ● | Level 1 inputs to the valuation methodology are quoted prices (unadjusted) for identical assets or liabilities in active markets. |
| ● | Level 2 inputs to the valuation methodology include quoted prices for similar assets and liabilities in active markets, and inputs that are observable for the assets or liabilities, either directly or indirectly, for substantially the full term of the financial instruments. |
| ● | Level 3 inputs to the valuation methodology are unobservable and significant to the fair value. |
13
The following fair value hierarchy tables present information about the Company's assets and liabilities measured at fair value on observable market prices or derived from such prices. Where observable prices or inputs are not available, valuation models are applied which may involve some level of management estimation and judgment, the degree of which is dependent on the price transparency for the instruments or market and the instruments’ complexity. See Note 24, Fair Value Measurement.
Concentration of Risk
Financial instruments that potentially subject the Company to significant concentrations of credit risk consist principally of cash and cash equivalents and accounts receivable. Asa recurring basis as of September 30, 2017, approximately $1,467,000 of the Company’s cash and cash equivalents, time deposits, registered capital deposit and restricted cash held by financial institutions was insured, and the remaining balance of approximately $32,808,000 was not insured.
Three major insurance companies accounted for more than 10% of the Company’s total revenue for the three months ended of September 30, 2017 and 2016. Revenue from these insurance companies were set out as below:
| Three months ended September 30, | ||||||||||||||||
| 2017 | 2016 | |||||||||||||||
| Amount | % of Total Revenue | Amount | % of Total Revenue | |||||||||||||
| Farglory Life Insurance Co., Ltd. | $ | 4,275,654 | 26 | % | $ | 5,291,779 | 35 | % | ||||||||
| Taiwan Life Insurance Co., Ltd. (*) | 1,911,978 | 12 | % | 1,493,069 | 10 | % | ||||||||||
| TransGlobe Life Insurance Inc. | 1,882,461 | 12 | % | (** | ) | (** | ) | |||||||||
For the nine months ended of September 30, 2017 and 2016, the Company’s revenue received from the following companies were set out as below:
| Nine months ended September 30, | ||||||||||||||||
| 2017 | 2016 | |||||||||||||||
| Amount | % of Total Revenue | Amount | % of Total Revenue | |||||||||||||
| Farglory Life Insurance Co., Ltd. | $ | 13,019,656 | 26 | % | $ | 13,969,672 | 32 | % | ||||||||
| Taiwan Life Insurance Co., Ltd. (*) | 5,881,228 | 12 | % | 4,813,813 | 11 | % | ||||||||||
| TransGlobe Life Insurance Inc. | 5,127,561 | 10 | % | (** | ) | (** | ) | |||||||||
| Fubon Life Insurance Co., Ltd. | (*** | ) | (*** | ) | 4,342,377 | 10 | % | |||||||||
As of September 30, 20172020 and December 31, 2016, the Company’s accounts receivable from the following companies were set out as below:2019:
| September 30, 2017 | December 31, 2016 | |||||||||||||||
| Amount | % of Total Accounts Receivable | Amount | % of Total Accounts Receivable | |||||||||||||
| Farglory Life Insurance Co., Ltd. | $ | 2,450,793 | 34 | % | $ | 6,503,843 | 41 | % | ||||||||
| Taiwan Life Insurance Co., Ltd (*) | (** | ) | (** | ) | 1,973,410 | 13 | % | |||||||||
| TransGlobe Life Insurance Inc. | 801,832 | 11 | % | (** | ) | (** | ) | |||||||||
| Fubon Life Insurance Co., Ltd | (** | ) | (** | ) | 1,660,685 | 11 | % | |||||||||
| | | | | | | | | | | | |
| | September 30, 2020 | ||||||||||
| | Fair Value | | Carrying | ||||||||
|
| Level 1 |
| Level 2 |
| Level 3 |
| Value | ||||
Assets | | | | | | | | | ||||
Total time deposits |
| $ | 46,890,005 | | $ | — | | $ | — | | $ | 46,890,005 |
Marketable securities : | | | | | | | | | | | | |
Mutual funds | |
| 1,214,712 | |
| — | |
| — | |
| 1,214,712 |
Long-term investments: | |
| | |
| | |
| | |
| |
Government bonds held for available-for-sale | |
| — | |
| 104,165 | |
| — | |
| 104,165 |
REITs | | | 1,352,533 | | | — | | | — | | | 1,352,533 |
Total assets measured at fair value | | $ | 49,457,250 | | $ | 104,165 | | $ | — | | $ | 49,561,415 |
| | | | | | | | | | | | |
| | December 31, 2019 | ||||||||||
| | Fair Value | | Carrying | ||||||||
|
| Level 1 |
| Level 2 |
| Level 3 |
| Value | ||||
Assets | | | | | | | | | ||||
Total cash equivalents and time deposits |
| $ | 40,194,850 | | $ | — | | $ | — | | $ | 40,194,850 |
Marketable securities : | | | | | | | | | | | | |
Mutual funds | |
| 290,153 | |
| — | |
| — | |
| 290,153 |
Long-term investments: | |
| | |
| | |
| | |
| |
Government bonds held for available -for -sale | |
| — | |
| 101,203 | |
| — | |
| 101,203 |
REITs | | | 1,308,711 | | | — | | | — | | | 1,308,711 |
Total assets measured at fair value | | $ | 41,793,714 | | $ | 101,203 | | $ | — | | $ | 41,894,917 |
With respect to accounts receivable, the Company generally does not have any collateral and does not have any allowance for doubtful accounts.
The Company’s operations are in the PRC, Taiwan and Hong Kong. Accordingly, the Company’s business,carrying amounts of current financial condition and results of operations may be influenced by the political, economic, and legal environments in the PRC, Taiwan and Hong Kong, the foreign currency exchange and the state of each regions. The Company’s results may be adversely affected by changes in the political and social conditions in the PRC, Taiwan and Hong Kong, and by changes in governmental policies with respect to laws and regulations, anti-inflationary measures, and rates and methods of taxation, among other things.
Recent Accounting Pronouncements
In January 2016, the Financial Accounting Standards Board (“FASB”) issued Accounting Standards Update (“ASU”) 2016-01, “Financial Instruments-Overall (Subtopic 825-10): Recognition and Measurement of Financial Assets and Financial Liabilities,” which amends the guidance in U.S. GAAP on the classification and measurement of financial instruments. Changes to the current guidance primarily affect the accounting for equity investments, financial liabilities under the fair value option, and the presentation and disclosure requirements for financial instruments. In addition, the ASU clarifies guidance related to the valuation allowance assessment when recognizing deferred tax assets resulting from unrealized losses on available-for-sale debt securities. The new standard is effective for fiscal years and interim periods beginning after December 15, 2017, and upon adoption, an entity should apply the amendments by means of a cumulative-effect adjustment to the balance sheet at the beginning of the first reporting period in which the guidance is effective. Early adoption is not permitted except for the provision to record fair value changes for financial liabilities under the fair value option resulting from instrument-specific credit risk in other comprehensive income. The Company is currently evaluating the impact of adopting this guidance.
In February 2016, the FASB issued ASU 2016-02, Leases (Topic 842). The guidance in ASU No. 2016-02 supersedes the lease recognition requirements in ASC Topic 840, Leases (Statement of Financial Accounting Standards No. 13). ASU 2016-02 requires an entity to recognize assets and liabilities arising from a lease for both financing and operating leases, along with additional qualitative and quantitative disclosures. ASU No. 2016-02 is effective for fiscal years beginning after December 15, 2018, with early adoption permitted. The Company is currently evaluating the effect this standard will have on its consolidated financial statements.
In March 2016, the FASB issued ASU 2016-07, “Investments - Equity Method and Joint Ventures (Topic 323): Simplifying the Transition to the Equity Method of Accounting.” ASU 2016-07 eliminates the requirement for an investment that qualifies for the use of the equity method of accounting as a result of an increase in the level of ownership or degree of influence to adjust the investment, results of operations and retained earnings retrospectively. ASU 2016-07 will be effective prospectively for the Company for increases in the level of ownership interest or degree of influence that result in the adoption of the equity method that occur during or after the quarter ending December 31, 2017, with early adoption permitted. The impact of this guidance for the Company is dependent on any future increases in the level of ownership interest or degree of influence that result in the adoption of the equity method.
In March 2016, the FASB issued ASU 2016-08, “Revenue from Contracts with Customers (Topic 606): Principal versus Agent Considerations (Reporting Revenue Gross versus Net).” ‘The amendments in this ASU are intended to improve the operability and understandability of the implementation guidance on principal versus agent considerations by amending certain existing illustrative examples and adding additional illustrative examples to assist in the application of the guidance. The effective date and transition of these amendments is the same as the effective date and transition of ASU No. 2014-09, “Revenue from Contracts with Customers (Topic 606).” Public entities should apply the amendments in ASU No. 2014-09 for annual reporting periods beginning after December 15, 2017, including interim reporting periods therein. The Company is currently in the process of evaluating the impact of the adoption of this accounting standards update on its consolidated financial statements.
In August 2016, the FASB issued ASU 2016-15, “Classification of Certain Cash Receipts and Cash Payments (Topic 230) to Statement of Cash Flows.” ASU No. 2016-15 clarifies guidance on the classification of certain cash receipts and payments in the statement of cash flows to reduce diversity in practice with respect to (i) debt prepayment or debt extinguishment costs, (ii) settlement of zero-coupon debt instruments or other debt instruments with coupon interest rates that are insignificant in relation to the effective interest rate of the borrowing, (iii) contingent consideration payments made after a business combination, (iv) proceeds from the settlement of insurance claims, (v) proceeds from the settlement of corporate-owned life insurance policies, including bank-owned life insurance policies, (vi) distributions received from equity method investees, (vii) beneficial interests in securitization transactions, and (viii) separately identifiable cash flows and application of the predominance principle. ASU No. 2016-15 is effective for interim and annual reporting periods in fiscal years beginning after December 15, 2017, with early adoption permitted. The adoption of this update is not expected to have a significant impact on the Company’s consolidated financial statements.
In November 2016, the FASB issued ASU 2016-18, “Statement of Cash Flows (Topic 230): Restricted Cash” (“ASU No. 2016-18”), which amends the current accounting guidance.” The amendments in this update require the amounts generally described as restricted cash and restricted cash equivalents should be included with cash and cash equivalents when reconciling the beginning-of-period and end-of-period total amounts shown on the statement of cash flows. ASU No. 2016-18 is effective for annual periods beginning after December 15, 2017, and interim periods within those annual periods. The adoption of ASU No. 2016-18 is not expected to have a material impact on the Company’s consolidated financial statements.
In January 2017, the FASB issued ASU No. 2017-04 “Intangibles – Goodwill and Other (Topic 350): Simplifying the Test for Goodwill Impairment,” which eliminates Step 2 from the goodwill impairment test. Instead, an entity should perform its annual or interim goodwill impairment test by comparing the fair value of a reporting unit with its carrying amount and recognize an impairment charge for the amount by which the carrying amount exceeds the reporting unit’s fair value, not to exceed the total amount of goodwill allocated to the reporting unit. ASU No. 2017-04 is effective for annual or any interim goodwill tests in fiscal years beginning after December 15, 2019. The adoption is not expected to have a material impact on the Company’s consolidated financial statements of the Company.
In July 2017, the FASB issued ASU No. 2017-11, “Earnings Per Share (Topic 260) Distinguishing Liabilities from Equity (Topic 480) Derivatives and Hedging (Topic 815),” which addresses the complexity of accounting for certain financial instruments with down round features. Down round features are features of certain equity-linked instruments (or embedded features) that result in the strike price being reduced on the basis of the pricing of future equity offerings. Current accounting guidance creates cost and complexity for entities that issue financial instruments (such as warrants and convertible instruments) with down round features that require fair value measurement of the entire instrument or conversion option. For public business entities, the amendments in Part I of this Update are effective for fiscal years, and interim periods within those fiscal years, beginning after December 15, 2018. For all other entities, the amendments in Part I of this Update are effective for fiscal years beginning after December 15, 2019, and interim periods within fiscal years beginning after December 15, 2020. The Company is currently evaluating the impact of adopting this guidance on its consolidated financial statements.
In August 2017, the FASB issued ASU 2017-12, “Derivatives and Hedging (Topic 815) Targeted Improvements to Accounting for Hedging Activities.” ASU 2017-12 refines and expands hedge accounting for both financial and commodity risks. This ASU creates more transparency around how economic results are presented, both on the face of the financial statements and in the footnotes. In addition, this ASU makes certain targeted improvements to simplify the application of hedge accounting guidance. The Company is currently evaluating the impact of adopting this guidance on its consolidated financial statements.
In September 2017, the FASB issued ASU 2017-13, “Revenue Recognition (Topic 605), Revenue from Contracts with Customers (Topic 606), Leases (Topic 840), and Leases (Topic 842),” which provides additional implementation guidance on the previously issued ASU 2016-02 Leases (Topic 842). The revenue standard is effective for annual periods beginning after December 15, 2017. ASU 2016-02 requires a lessee to recognize assets and liabilities on the balance sheet for leases with lease terms greater than 12 months. ASU 2016-02 is effective for fiscal years, and interim periods within those years, beginning after December 15, 2018, and early adoption is permitted. Based on a preliminary assessment, the Company expects the adoption of this guidance to have a material impact on its assets and liabilities due to the recognition of right-of-use assets and lease liabilities on its consolidated balance sheet at the beginning of the earliest period presented. The Company is continuing its assessment, which may identify additional impacts this guidance will have on its consolidated financial statements and disclosures.
There were other updates recently issued. The management does not believe that other than disclosed above, the recently issued, but not yet adopted, accounting pronouncements will have a material impact on its financial position results of operations or cash flows.
Going Concern Assessment
The Company has assessed its ability to continue as a going concernsheets for a period of one year from the date of the issuance of these financial statements. Substantial doubt about an entity’s ability to continue as a going concern exists when relevant conditions and events, considered in the aggregate, indicate that it is probable that the entity will be unable to meet its obligations as they become due within one year from the financial statement issuance date. The Company determined that there are no conditions or events that raise substantial doubt about its ability to continue as a going concern as of the date of the issuance of these financial statements.
NOTE 3 – CASH AND CASH EQUIVALENTS AND TIME DEPOSITS
Cash and cash equivalents and time deposits consistedapproximate fair value due to the short-term duration of the following as of September 30, 2017 and December 31, 2016:those instruments.
| September 30, 2017 | December 31, 2016 | |||||||
| Cash and cash equivalents: | ||||||||
| Cash in bank and on hand | $ | 11,663,265 | $ | 17,713,744 | ||||
| Bank time deposits (*) | - | 2,455,711 | ||||||
| 11,663,265 | 20,169,455 | |||||||
| Bank time deposits (**) | 21,475,432 | 5,352,347 | ||||||
| Total cash and cash equivalents and time deposits | $ | 33,138,697 | $ | 25,521,802 | ||||
The Company considers cash on hand, cash in bank, and bank time deposits with maturities of three months or less to be cash and cash equivalents.
NOTE 4 – MARKETABLE SECURITIES
Marketable securities represent investment in equity securities of listed stocks and funds, which are classified as follows:
| September 30, 2017 | ||||||||||||
| Cost | Gross Unrealized Losses | Total Fair Value | ||||||||||
| Trading: | ||||||||||||
| Funds | $ | 33,117 | $ | (250 | ) | $ | 32,867 | |||||
| $ | 33,117 | $ | (250 | ) | $ | 32,867 | ||||||
| December 31, 2016 | ||||||||||||
| Fair Value at | Gross | |||||||||||
| December 31, | Unrealized | Total | ||||||||||
| 2015 | Gains | Fair Value | ||||||||||
| Trading: | ||||||||||||
| Stocks | $ | 28,863 | $ | 9,900 | $ | 38,763 | ||||||
| Funds | 2,340,219 | 47,888 | 2,388,107 | |||||||||
| $ | 2,369,082 | $ | 57,788 | $ | 2,426,870 | |||||||
NOTE 5 – STRUCTURED DEPOSIT
On July 7, 2017, the Company entered into an agreement with Cathy United Bank to purchase a 185-days structured deposit in effective on July 7, 2017 and mature on January 8, 2018. Principal of the structured deposit is RMB 8,000,000 and the structured deposit with an embedded foreign exchange option linked to US Dollar to China Yuan offshore exchange rate (“USDCNH”). Strike price of the structured deposit is set as 7.3 USDCNH and the fixing date is on January 4, 2018. Yield rate will be at 4.1% per annum when the USDCNH is above or equal strike price on the fixing date, or at 3.9% per annum when blow.
| September 30, 2017 | ||||||||||||
| Cost | Gross Unrealized Losses | Total Fair Value | ||||||||||
| Structured deposit | $ | 1,278,551 | $ | (73,389 | ) | $ | 1,205,162 | |||||
| $ | 1,278,551 | $ | (73,389 | ) | $ | 1,205,162 | ||||||
NOTE 6 – OTHER CURRENT ASSETS
Other current assets consisted of the following as of September 30, 2017 and December 31, 2016:
| September 30, 2017 | December 31, 2016 | |||||||
| Loan receivable | $ | 1,477,060 | $ | 1,486,846 | ||||
| Prepaid expenses | 228,193 | 64,678 | ||||||
| Prepaid rent and rent deposits | 186,745 | 199,022 | ||||||
| Other receivable | 176,386 | 50,683 | ||||||
| Refundable business tax | 117,848 | 17,441 | ||||||
| Deferred tax assets-current | 58,041 | 59,233 | ||||||
| Interest receivable | 30,080 | 12,648 | ||||||
| Total other current assets | $ | 2,274,353 | $ | 1,890,551 | ||||
On October 24, 2016, the Company entered into a loan agreement with third party, Rich Fountain Limited (“RFL”), which was incorporated under the laws of Samoa. The Company provided a short-term loan amount of NTD 48,000,000 ($1,486,846) to RFL. The short-term loan bears an interest rate of 4.5% per annum and the principal and interest are due on April 23, 2017. On April 21, 2017, the Company and RFL entered a supplemental agreement to extend the loan to October 23, 2017. As of September 30, 2017, the outstanding balance of the loan receivable is NTD44,790,360 ($1,477,060). On November 1 and November 2, 2017, the Company received the interest payment of this loan amount of NTD 300,000 (approximately $9,800) and $23,832, respectively. The management has evaluated RFL's business operation and ability to repay the loan in the future and determine that RFL will be able to repay the loan per newly negotiated terms and assessed that there is no impairment loss on the loan. Therefore, the Company is willing to extend the payment period of RFL loan.
NOTE 7 – PROPERTY, PLANT AND EQUIPMENT, NET
Property, plant and equipment consisted of the following as of September 30, 2017 and December 31, 2016:
| September 30, 2017 | December 31, 2016 | |||||||
| Office equipment | $ | 1,234,505 | $ | 1,070,061 | ||||
| Office furniture | 101,123 | 168,658 | ||||||
| Leasehold improvements | 733,225 | 581,964 | ||||||
| Transportation equipment | 139,226 | 132,344 | ||||||
| Other equipment | 89,868 | 87,302 | ||||||
| Total | 2,297,947 | 2,040,329 | ||||||
| Less: accumulated depreciation | (1,370,885 | ) | (1,113,424 | ) | ||||
| Total property, plant and equipment, net | $ | 927,062 | $ | 926,905 | ||||
Depreciation expense was $78,972 and $81,267 for the three months ended September 30, 2017 and 2016, respectively. Depreciation expense was $235,093 and $231,414 forDuring the nine months ended September 30, 2017 and 2016, respectively.
NOTE 8 – INTANGIBLE ASSETS
As of September 30, 2017 and December 31, 2016, the Company’s intangible2020, there were 0 assets consistedor liabilities that were transferred between any of the following:levels.
| September 30, 2017 | December 31, 2016 | |||||||
| Software | $ | 1,686,544 | $ | 1,500,339 | ||||
| Less: accumulated amortization | (938,934 | ) | (716,120 | ) | ||||
| Total intangible assets | $ | 747,610 | $ | 784,219 | ||||
Estimated future intangible amortization as of September 30, 2017 is as follows:
| Periods ending September 30, | Amount | |||
| 2018 | $ | 238,905 | ||
| 2019 | 214,913 | |||
| 2020 | 184,439 | |||
| 2021 | 90,116 | |||
| 2022 | 18,140 | |||
| Thereafter | 1,097 | |||
| Total | $ | 747,610 | ||
Amortization expense was $59,533Marketable securities and $71,328 for the three months ended September 30, 2017 and 2016, respectively. Amortization expense was $175,500 and $223,969 for the nine months ended September 30, 2017 and 2016, respectively.
NOTE 9 – LONG-TERM INVESTMENTS
As of September 30, 2017 and December 31, 2016, the Company’s long-term investments consistedin REITs – The fair values of mutual funds and REITs were valued based on quoted market prices in active markets.
Government bonds – The fair value of government bonds is valued based on theoretical bond price in the following:
| September 30, 2017 | December 31, 2016 | |||||||
| Equity investment | $ | 1,267,475 | $ | 1,190,558 | ||||
| Government bonds | 101,475 | 94,506 | ||||||
| Total | $ | 1,368,950 | $ | 1,285,064 | ||||
As of September 30, 2017 and December 31, 2016, the Company had the following equity investment:
| Type | Investee | Ownership | September 30, 2017 | December 31, 2016 | ||||||||||
| Cost Method | Genius Insurance Broker Co., Ltd. | 15.64 | % | $ | 1,267,475 | $ | 1,190,558 | |||||||
Taipei Exchange.
According to Taiwan Regulations Governing Deposit of Bond and Acquirement of Insurance by Insurance Agents, Insurance Brokers and Insurance Surveyors (“RGDBAI”) Article 3 requirement,and 4, Law Insurance Broker Co., Ltd. (“Law Broker”) is required to maintain a minimum of NTD3,000,000NTD 3,000,000 ($98,932103,616 and $92,928$100,156 as of September 30, 20172020 and December 31, 2016,2019, respectively) restricted balance in a separate account. RGDBAI Article 4 is required to deposited a minimum amount in the form of cashaccount or book entry to government bondbonds issued by the central government. Therefore, Law Broker used such amountsgovernment in order to purchasemaintain its insurance license. The government bonds will mature on March 17, 2021 and the amortized cost of the bonds is $103,742 (NTD 3,003,650) and $100,479 (NTD 3,009,674) as of September 30, 2020 and December 31, 2019, respectively. The Company will purchase a similar investment after the maturity of the bonds to maintain the insurance license.
Concentration of Risk
The Company maintains cash with banks in the USA, People’s Republic of China (“PRC" or "China”), Hong Kong, and Taiwan. Should any bank holding cash become insolvent, or if the Company is otherwise unable to withdraw funds, the Company would lose the cash with that bank; however, the Company has not experienced any losses in such accounts and believes it is not exposed to any significant risks on its cash in bank accounts. In Taiwan, a depositor has up to NTD3,000,000 insured by Central Deposit Insurance Corporation (“CDIC”). In China, a depositor has up to RMB500,000 insured by the rightPeople’s Bank of China Financial Stability Bureau (“FSD”). In Hong Kong, a depositor has up to trade such bonds with other debt or equity instruments.HKD500,000 insured by Hong Kong Deposit Protection Board (“DPB”). In the United States, the standard insurance amount is $250,000 per depositor in a bank insured by the Federal Deposit Insurance Corporation (“FDIC”).
| September 30, 2017 | ||||||||||||
| Fair Value at | Gross | Fair Value at | ||||||||||
| December 31, | Unrealized | September 30, | ||||||||||
| 2016 | Gains | 2017 | ||||||||||
| Available-for-sale: | ||||||||||||
| Government bonds | 94,506 | 6,969 | 101,475 | |||||||||
| $ | 94,506 | $ | 6,969 | $ | 101,475 | |||||||
| December 31, 2016 | ||||||||||||
| Fair Value at | Gross | Fair Value at | ||||||||||
| December 31, | Unrealized | December 31, | ||||||||||
| 2015 | Gains | 2016 | ||||||||||
| Available-for-sale: | ||||||||||||
| Government bonds | 94,381 | 125 | 94,506 | |||||||||
| $ | 94,381 | $ | 125 | $ | 94,506 | |||||||
14
Financial instruments that potentially subject the Company to significant concentrations of credit risk consist principally of cash and cash equivalents, time deposits, restricted cash, register capital deposits and accounts receivable. As of September 30, 2020 and December 31, 2019, approximately $2,483,000 and $2,293,000 of the Company’s cash and cash equivalents, time deposits, restricted cash equivalents and register capital deposits held by financial institutions, was insured, and the remaining balance of approximately $60,540,000 and $50,108,000, was not insured. With respect to accounts receivable, the Company generally does not require collateral and does not have an allowance for doubtful accounts.
NOTE 10 – OTHER ASSETSFor the three months ended September 30, 2020 and 2019, the Company’s revenues from sale of insurance policies underwritten by these companies were:
| | | | | | | | | | | |
| | Three Months Ended September 30, | | ||||||||
| | 2020 | | 2019 |
| ||||||
| | | | | % of Total | | | | | % of Total |
|
|
| Amount |
| Revenue |
| Amount |
| Revenue |
| ||
Taiwan Life Insurance Co., Ltd. | | $ | 8,435,924 |
| 25 | % | $ | 6,048,897 | | 26 | % |
TransGlobe Life Insurance Inc. | | | 8,160,190 |
| 25 | % | | 2,952,262 | | 13 | % |
Farglory Life Insurance Co., Ltd. | |
| 4,157,250 |
| 13 | % |
| 3,662,473 | | 16 | % |
For the nine months ended September 30, 2020 and 2019, the Company’s revenues from sale of insurance policies underwritten by these companies were:
| | | | | | | | | | | |
| | Nine Months Ended September 30, | | ||||||||
| | 2020 | | 2019 | | ||||||
| | | | | % of Total | | | | | % of Total |
|
|
| Amount |
| Revenue |
| Amount |
| Revenue |
| ||
TransGlobe Life Insurance Inc. | | $ | 20,012,602 |
| 22 | % | $ | 7,927,576 | | 12 | % |
Taiwan Life Insurance Co., Ltd. | |
| 19,656,521 |
| 22 | % |
| 13,589,908 | | 21 | % |
Farglory Life Insurance Co., Ltd. | |
| 11,120,320 |
| 12 | % |
| 12,347,817 | | 19 | % |
As of September 30, 2020 and December 31, 2019, the Company’s accounts receivable from these companies were:
| | | | | | | | | | | |
| | September 30, 2020 | | December 31, 2019 |
| ||||||
| | | | | % of Total | | | | | % of Total |
|
| | | | | Accounts | | | | | Accounts |
|
|
| Amount |
| Receivable |
| Amount |
| Receivable | | ||
TransGlobe Life Insurance Inc. | | $ | 3,668,147 |
| 24 | % | $ | 4,239,621 |
| 19 | % |
Taiwan Life Insurance Co., Ltd | |
| 2,938,229 |
| 19 | % |
| 4,012,914 |
| 18 | % |
Farglory Life Insurance Co., Ltd. | |
| 2,111,619 |
| 14 | % |
| 2,664,140 |
| 12 | % |
AIA International Limited Taiwan Branch | | | 1,472,303 | | 10 | % | | 2,447,051 | | 11 | % |
Shin Kong Life Insurance Co., Ltd. | |
| 743,251 |
| 5 | % |
| 3,586,795 |
| 16 | % |
The Company’s operations are in the PRC, Hong Kong and Taiwan. Accordingly, the Company’s business, financial condition and results of operations may be influenced by the political, economic, foreign currency exchange and legal environments in the PRC, Hong Kong and Taiwan, and by the state of each economy. The Company’s results may be adversely affected by changes in the political and social conditions in the PRC, Hong Kong and Taiwan, and by changes in governmental policies with respect to laws and regulations, anti-inflationary measures, and rates and methods of taxation, among other things.
15
Stock-Based Compensation
The Company accounts for equity-based compensation cost in accordance with ASC 718, Compensation-Stock Compensation after adoption of ASC 2018-07, which requires the measurement and recognition of compensation expense related to the fair value of equity-based compensation awards that are ultimately expected to vest. Stock-based compensation expense recognized includes the compensation cost for all share-based compensation payments granted to employees and nonemployees, net of estimated forfeitures, over the employees requisite service period or the non-employee performance period based on the grant date fair value estimated in accordance with the provisions of ASC 718. ASC 718 is also applied to awards modified, repurchased, or cancelled during the periods reported.
Income Taxes
The Company records income tax expense using the asset-and-liability method of accounting for deferred income taxes. Under this method, deferred taxes are recognized for the tax consequences in future years of differences between the tax bases of assets and liabilities and their financial reporting amounts at each year-end based on enacted tax laws and statutory tax rates applicable to the periods in which the differences are expected to affect taxable income. Deferred tax assets are reduced by a valuation allowance if, based on available evidence, it is more likely than not that the deferred tax assets will not be realized.
When tax returns are filed, it is likely some positions taken would be sustained upon examination by the taxing authorities, while others are subject to uncertainty about the merits of the position taken or the amount of the position that would be ultimately sustained. The benefit of a tax position is recognized in the financial statements in the period during which, based on all available evidence, management believes it is more likely than not that the position will be sustained upon examination, including the resolution of appeals or litigation processes, if any. Tax positions taken are not offset or aggregated with other positions. Tax positions that meet the more-likely-than-not recognition threshold are measured as the largest amount of tax benefit that is more than 50% likely of being realized upon settlement with the applicable taxing authority. The portion of the benefits associated with tax positions taken that exceeds the amount measured as described above is reflected as a liability for unrecognized tax benefits in the accompanying balance sheets along with any associated interest and penalties that would be payable to the taxing authorities upon examination. Interest associated with unrecognized tax benefits are classified as interest expense and penalties are classified in selling, general and administrative expenses in the statements of operations and other comprehensive income (loss).
New Accounting Pronouncements and Other Guidance
Credit Losses
In June 2016, the FASB issued ASU No. 2016-13, (FASB ASC Topic 326), Financial Instruments – Credit Losses: Measurement of Credit Losses on Financial Instruments which amends the current accounting guidance and requires the use of the new forward-looking “expected loss” model, rather than the “incurred loss” model, which requires all expected losses to be determined based on historical experience, current conditions and reasonable and supportable forecasts. This guidance amends the accounting for credit losses for most financial assets and certain other instruments including trade and other receivables, held-to-maturity debt securities, loans and other instruments.
In November 2019, the FASB issued ASU No. 2019-10 to postpone the effective date of ASU No. 2016-13 for public business entities eligible to be smaller reporting companies defined by the SEC to fiscal years beginning after December 15, 2022, including interim periods within those fiscal years. The Company believes the adoption of ASU No. 2016-13 will not have a material impact on its financial position and results of operations.
Income Tax
In December 2019, the FASB issued ASU 2019-12, Income Taxes (Topic 740): Simplifying the Accounting for Income Taxes which is intended to simplify various aspects related to accounting for income taxes. The standard is effective for fiscal years, and interim periods within those years, beginning after December 15, 2020, with early adoption permitted. The standard will be adopted upon the effective date for us beginning January 1, 2021. We are currently evaluating the effects of the standard on our consolidated financial statements and related disclosures.
16
Reference Rate Reform
In March 2020, the FASB issued ASU 2020-04, Reference Rate Reform (Topic 848): Facilitation of the Effects of Reference Rate Reform on Financial Reporting. The standard provides optional expedients and exceptions for applying GAAP to contracts, hedging relationships, and other transactions in which the reference LIBOR or another reference rate are expected to be discontinued as a result of the Reference Rate Reform. The standard is effective for all entities. The standard may be adopted as of any date from the beginning of an interim period that includes or is subsequent to March 12, 2020 through December 31, 2022. We are currently evaluating the effects of the standard on our consolidated financial statements and related disclosures.
The management does not believe that other than disclosed above, accounting pronouncements the recently issued but not yet adopted will have a material impact on its financial position, results of operations or cash flows.
NOTE 3 – CASH, CASH EQUIVALENTS AND RESTRICTED CASH EQUIVALENTS
Cash, cash equivalents and restricted cash equivalents consisted of the following as of September 30, 20172020 and December 31, 2016:2019:
| September 30, 2017 | December 31, 2016 | |||||||
| Registered capital deposit | $ | 1,065,176 | $ | - | ||||
| Rental deposits | 480,589 | 445,283 | ||||||
| Restricted cash | 488,822 | 248,803 | ||||||
| Prepayments | 61,206 | 5,576 | ||||||
| Deferred tax assets | 52,171 | 25,364 | ||||||
| Others | 1,655 | 1,456 | ||||||
| Total other assets | $ | 2,149,619 | $ | 726,482 | ||||
| | | | | | |
|
| September 30, 2020 |
| December 31, 2019 | ||
Cash and cash equivalents: | | | | | | |
Cash on hand and in banks | | $ | 13,571,935 | | $ | 11,151,816 |
Time deposits - with original maturities less than three months (see Note 4) | |
| 0 | |
| 1,463,192 |
| |
| 13,571,935 | |
| 12,615,008 |
Restricted cash – noncurrent | |
| 63,779 | |
| 43,492 |
Total cash, cash equivalents and restricted cash shown in the statements of cash flows | | $ | 13,635,714 | | $ | 12,658,500 |
According to China Insurance Regulatory Commission No. 82, issued on September 29, 2016, the Company should deposit all of its registered capital inNoncurrent restricted cash includes a custodian account and subject to limited usage, among which, no less than 10% of the registered capital should be invested in significant deposit by agreement or term deposit. The Company should deposit this amount after six months of the issuance date.
Restricted cash is amandatory deposit in the bank by the Company in conformity with Provisions of the Supervision and Administration of Specialized Insurance Agencies in PRC, which is not allowed to be withdrawn without the permission of the regulatory commission, and thea trust account held for Law Broker’s general manager’sBroker's officer’s bonus plans.plan.
NOTE 114 – TAX PAYABLETIME DEPOSITS
| | | | | | | |
|
| September 30, 2020 |
| December 31, 2019 | | ||
| | | | | | | |
Total time deposits | | $ | 46,890,005 | | $ | 40,194,850 | |
Less: Time deposits – with original maturities less than three months (see Note 3) | |
| 0 | |
| (1,463,192) | |
Time deposits – original maturities over three months but less than one year | | $ | 46,890,005 | | $ | 38,731,658 | |
Time Deposits Pledged as Collateral
The Company had a total of $14,786,148 and $11,920,632 restricted time deposits, respectively, as of September 30, 2020 and December 31, 2019. A total of time deposits $34,539 (NTD 1 million) was pledged as collateral for the Company’s credit card as of September 30, 2020. In addition, the Company had time deposits of $14,751,609 and $11,920,632 pledged as collateral for short-term loans, respectively, as of September 30, 2020 and December 31, 2019. See Note 5.
17
NOTE 5 – SHORT-TERM LOANS
The Company’s tax payableshort-term loans consisted of the following as of September 30, 20172020 and December 31, 2016:2019:
| September 30, 2017 | December 31, 2016 | |||||||
| PRC Tax | $ | 287,138 | $ | 163,461 | ||||
| Hong Kong Tax | 9,091 | 14,233 | ||||||
| Taiwan Tax | 2,060,397 | 2,072,175 | ||||||
| Total tax payable | $ | 2,356,626 | $ | 2,249,869 | ||||
| | | | | | | |
|
| September 30, 2020 |
| December 31, 2019 | | ||
Credit facility, O-Bank | | $ | 4,000,000 | | $ | 2,600,000 | |
Credit facility, CUB | | | 5,526,184 | | | — | |
Credit facility, KGI | | | 2,100,000 | | | 1,500,000 | |
Credit facility, E. Sun | |
| 1,000,000 | |
| — | |
Credit facility, FEIB | |
| 840,000 | |
| 2,500,000 | |
Credit facility, CTBC | |
| — | |
| 1,500,000 | |
Total short-term loans | | $ | 13,466,184 | | $ | 8,100,000 | |
PRC tax represents income tax and other taxes accrued according to PRC tax law by the Company’s subsidiaries and Consolidated Affiliated Entities (“CAE”) in the PRC. Taiwan tax represents income tax accrued according to Taiwan tax law by the Company’s subsidiaries and branches in Taiwan. Hong Kong tax represents income tax accrued according to Hong Kong tax law by the Company’s subsidiaries in Hong Kong.
NOTE 12 – CONVERTIBLE BONDS
The Company intended to issueentered into the convertible bonds during the period commencing on June 23, 2016 and ended on September 30, 2016 with an aggregate principalfollowing credit agreements:
O-Bank Co., Ltd. (“O-Bank”)
CUII has a revolving credit facility in amount of up to $10,000,000. The convertible bonds were to be sold in units,$4,000,000 with each unit being $100,000 in principal amount. The Company had not made any offers or sales ofO-Bank, which matures on October 22, 2020. Borrowings under the convertible bonds to U.S. persons and there were no direct selling efforts in the United States. The bonds would not be convertible until two years from the issuance date and with an annualrevolving credit facility bear interest rate of 6% payable on a quarterly basis. The bond holder might cause the Company to redeem the convertible bonds before the end of the term, subject to certain penalties depending on the holding period of the convertible bonds when redeemed. Upon the expiration of the term of the convertible bonds, the bond holder may, in its sole discretion, choose to collect the payment of full principal amount of the convertible bonds together with any interest accrued or convert the convertible bonds into common shares of the Company at the conversion price. The conversion price shall be 80%TAIFX3 rate plus a margin of the average closing trading price for the ten (10) business days immediately prior to the conversion date.
On June 23, 2016, the Company issued two units of its convertible bonds with an aggregate principal amount of $200,000 to a non-US person and the value of the embedded derivatives liabilities is trivial.0.5%. As of September 30, 20172020 and December 31, 2016,2019, the outstanding balance of the revolving credit facility were $4,000,000 with an interest rate of 1.18% and $2,600,000 with a weighted average interest rate of 2.83%, respectively. As of September 30, 2020 and December 31, 2019, the borrowings are secured by a total amount of $4,766,333 (NTD 138 million) and $3,038,079 (NTD 91 million) of time deposits.
Law Broker entered into a credit agreement with O-Bank, which matures on October 22, 2020, and the agreement provides for a $3.3 million (NTD 100 million) revolving credit facility. Borrowings under this agreement bear interest at the TAIFX3 rate plus a margin of 0.75%. As of September 30, 2020 and December 31, 2019, the outstanding balance under this credit agreement was NaN.
Cathay United Bank Company Ltd. ("CUB")
In April 2020, AHFL Taiwan Branch entered into a line of credit agreement in the amount of approximately $8,5 million (NTD 250 million) with Cathay United Bank Company Limited ("CUB"), which matures on April 14, 2021, and borrowings under the revolving credit facility bear interest at the higher of CUB's adjustable rates for loans plus a margin of 0.41% or the 1 month TAIBOR rate plus a margin of 0.8%. As of September 30, 2020, the outstanding balance of the revolving credit facility was $5,526,184 with an interest rate of 1.20% and secured by a total amount of $5,526,184 (NTD 160 million) of time deposits.
KGI Commercial Bank Co., Ltd. ("KGI")
CUII was approved for a line of credit agreement with KGI, which matures on October 2, 2020, pursuant to which CUII has a revolving credit facility of $1,600,000. Borrowings under the agreement bear interest at the LIBOR rate plus a margin of 0.9%. As of September 30, 2020 and December 31, 2019, the Company had the outstanding borrowing of $2,100,000 with an interest rate of 1.58% and $1,500,000 with a weighted interest rate of 3.06%, respectively. The borrowings are secured by a total amount of $2,357,415 (RMB 7.6 million and NTD 36 million) and $2,295,061 (RMB 7.6 million and NTD 36 million) of time deposits.
Law Broker entered into another credit agreement with KGI providing for a $1.6 million (NTD 50 million), and the agreement matured on October 2, 2020. The borrowing is secured by a total amount of $1,786,660 (RMB 12 million) of time deposits as of December 31, 2019. As of September 30, 2020 and December 31, 2019, there was no outstanding loan under this credit agreement.
18
E. Sun Bank ("E. Sun")
On June 3, 2020, CUII was approved for a line of credit agreement in the amount of $1,000,000 with E. Sun, pursuant to which CUII has a revolving credit facility of $1,000,000. Borrowings under the agreement bear interest at the LIBOR rate plus a margin of 1.14%. As of September 30, 2020, the Company had the outstanding borrowing of $1,000,000 with an interest rate of 1.16%. The borrowing is secured by a total amount of $1,003,348 of time deposits.
Far Eastern International Bank (“FEIB”)
CUII entered into a line of credit agreement with FEIB, which shall mature on January 8, 2021, and borrowings under the revolving credit facility bear interest at the higher of LIBOR or TAIFX3 rate plus a margin of 0.85%. The outstanding principal balance of $200,000the revolving credit facility were $840,000 and $2,500,000 as of convertible bonds. September 30, 2020 and December 31, 2019. The interest rate for the outstanding balance as of September 30, 2020 and December 31, 2019 were 1.83% and 3.05%, respectively. As of September 30, 2020 and December 31, 2019, the borrowing is secured by a total amount of $1,098,329 (NTD 31.8 million) and $3,064,787 (NTD 91.8 million) of time deposits.
Law Broker entered into a credit agreement with FEIB providing for a $2.6 million (NTD 80 million) revolving credit facility, which shall mature January 8, 2021. As of September 30, 2020 and December 31, 2019, there was no outstanding loan under this credit agreement.
CTBC Bank Co., Ltd. (“CTBC”)
CUII has a revolving credit facility in an amount of $1,500,000 with CTBC, which matures on August 31, 2020, and borrowings under the revolving credit facility bear interest at the CTBC’s cost of funds plus a margin of 1%. The outstanding balance of the revolving credit facility was NaN and $1,500,000 with an interest rate of 3.20% as of September 30, 2020 and December 31, 2019, respectively. As of December 31, 2019, the borrowing was secured by the total amount of $1,736,045 (NTD 52 million) of time deposits. Law Broker is the guarantor of the credit facility.
Law Broker entered into a credit agreement with CTBC providing for a $3.3 million (NTD 100 million) revolving credit facility, which matured on August 31, 2020. As of September 30, 2020 and December 31, 2019, the outstanding loan under this credit agreement was NaN.
Total interest expense was $3,000expenses for short-term loans incurred were $33,443 and $9,000$64,273, respectively, for the three months ended September 30, 2020 and 2019, and were $153,703 and $144,416 for the nine months ended September 30, 2020 and 2019.
NOTE 6 – COMMISSIONS PAYABLE TO SALES PROFESSIONALS
Commissions payable to sales professionals consisted of the following as of September 30, 2020 and December 31, 2019:
| | | | | | | |
|
| September 30, 2020 |
| December 31, 2019 | | ||
Taiwan | | $ | 10,130,726 | | $ | 12,123,149 | |
PRC | |
| 335,479 | |
| 422,581 | |
Hong Kong | |
| 0 | |
| 0 | |
Total commissions payable to sales professionals | | $ | 10,466,205 | | $ | 12,545,730 | |
Commissions payable to sales professionals are usually settled within twelve months.
19
NOTE 7 – OTHER CURRENT LIABILITIES
Other current liabilities consisted of the following as of September 30, 2020 and December 31, 2019:
| | | | | | | |
|
| September 30, 2020 |
| December 31, 2019 | | ||
Accrued bonus | | $ | 3,602,880 | | $ | 4,961,323 | |
Accrued business tax and tax withholdings | | | 1,452,087 | | | 1,262,570 | |
Payroll payable and other benefits | |
| 880,457 | |
| 1,317,367 | |
Accrued tax penalties | | | 185,318 | | | 0 | |
Other accrued liabilities | |
| 1,185,415 | |
| 2,333,949 | |
Total other current liabilities | | $ | 7,306,157 | | $ | 9,875,209 | |
Accrued Bonus
The Company’s foreign subsidiaries have various bonus plans, which provide cash awards to employees based upon their performance, and had accrued bonus of $2,406,183 and $4,057,515, respectively, related to cash awards to employees as of September 30, 2020 and December 31, 2019. The Company has other compensation plans solely provided by Law Broker to its officers. The compensation plans eligible to Law Broker’s officers include a surplus bonus based on a percentage of income after tax and other performance bonuses such as retention and non-competition. The bonus expenses incurred by Law Broker’s officers under the compensation plans were $157,267 and $437,519, respectively, for the three and nine months ended September 30, 2017.
NOTE 13 – OTHER CURRENT LIABILITIES
Other current liabilities are as follows, as of September 30, 20172020, and December 31, 2016:
| September 30, 2017 | December 31, 2016 | |||||||
| Commissions payable to sales professionals | $ | 5,821,393 | $ | 11,869,181 | ||||
| Unearned revenue (AIATW and Farglory) | 1,340,884 | 2,090,718 | ||||||
| Due to previous shareholders of AHFL | - | 480,559 | ||||||
| Accrued business tax | 188,516 | 469,259 | ||||||
| Deferred tax liabilities | 125,059 | - | ||||||
| Withholding employee personal tax | 240,717 | 362,954 | ||||||
| Accrued tax penalties | 370,000 | 370,000 | ||||||
| Accrued bonus | 1,040,291 | 1,935,091 | ||||||
| Salary payable to administrative staff | 464,106 | 183,066 | ||||||
| Accrued labor, health insurance and employee retirement plan | 105,015 | 92,085 | ||||||
| Accrued advertisement fee | - | 32,525 | ||||||
| Other accrued liabilities | 724,847 | 754,471 | ||||||
| Total other current liabilities | $ | 10,420,828 | $ | 18,639,909 | ||||
Commissions payable to sales professionals, accrued bonus, salaries payable to administrative staff,$302,598 and accrued advertisement expense are usually settled within 12 months. Unearned revenue is described in Note 15. Due to previous shareholders of Action Holdings Financial Limited (“AHFL”) is the remaining balance payable of the acquisition cost. Accrued business tax, withholding employee personal tax, accrued labor, health insurance and employee retirement plan will be paid to the related government departments within one month. Accrued tax penalties are estimated potential penalty in the event of a tax audit. Other accrued liabilities mainly consist of accrued interest, accrued logo promotion product expense and operating expenses payable for training and travelling.
NOTE 14 – LONG-TERM LOANS
| September 30, 2017 | December 31, 2016 | |||||||
| Loan B, interest at 8%, maturity date May 15, 2019 | $ | 150,274 | $ | 144,015 | ||||
| Loan C, interest at 8%, maturity date July 20, 2019 | 115,711 | 110,892 | ||||||
| Total long-term loans | $ | 265,985 | $ | 254,907 | ||||
On May 15, 2016, the Company’s contractually controlled affiliate in PRC, Law Anhou Insurance Agency Co., Ltd (“Anhou” or “Law Anhou”), entered into a loan agreement (“Loan B”) with a third party. The long-term Loan Agreement provided for a $150,274 loan to the Company. Loan B bears an interest rate of 8% per annum and interest is payable annually. The principal and the interest will be due on May 15, 2019.
On July 20, 2016, Anhou entered into a loan agreement (“Loan C”) with a third party. The long-term Loan Agreement provided for a $115,711 loan to the Company. Loan C bears an interest rate of 8% per annum and interest is payable annually. The principal and the interest will be due on July 20, 2019.
The total interest expense for both Loan B and Loan C was $5,293 and $15,562$501,672 for the three and nine months ended September 30, 2017.
NOTE 15 – LONG-TERM LIABILITIES
2019.
As of September 30, 20172020 and December 31, 2016, long-term2019, the Company had accrued bonus of $1,196,697 and $903,808 payable within next 12 months, and noncurrent accrued bonus of $576,191 and $471,466, respectively, related to the compensation plans for Law Broker’s officers. See Note 14 for additional information of appointment and engagement agreements with Law Broker’s officers.
Other Accrued Liabilities
As of September 30, 2020, and December 31, 2019, the Company had other accrued liabilities are as follows:of $1,185,415 and $2,333,949, respectively. Other accrued liabilities consisted of accrued operating expenses for professional fees, utilities, software maintenance, and recruitment.
NOTE 8 – OTHER LIABILITIES
| September 30, 2017 | December 31, 2016 | |||||||
| Unearned revenue – AIATW | $ | 4,242,585 | $ | 4,742,272 | ||||
| Unearned revenue – Farglory | - | 495,615 | ||||||
| Due to pervious shareholders of AHFL | 480,559 | - | ||||||
| Other long-term liabilities | 175,191 | 77,440 | ||||||
| Long-term liabilities | $ | 4,898,335 | $ | 5,315,327 | ||||
The Company’s other liabilities consisted of the following as of September 30, 2020 and December 31, 2019:
| | | | | | | | |
|
| September 30, 2020 |
| December 31, 2019 | | | ||
Accrued bonus - noncurrent (Note 7) | | $ | 576,191 | | $ | 471,466 | | |
Due to previous shareholders of AHFL | |
| 518,080 | |
| 500,782 | | |
Net defined benefit liability | |
| 271,418 | |
| 208,230 | | |
Total other liabilities | | $ | 1,365,689 | | $ | 1,180,478 | | |
Due to Previous Shareholders of AHFL
Due to previous shareholders of AHFL is the entire remaining balance payable of the 2012 acquisition cost. On March 27, 2019, the Company and the selling shareholders of AHFL entered into a sixth amendment to the acquisition agreement, pursuant to which, the Company will make the cash payment in the amount of NTD15 million on or prior to March 31, 2021. The Company is in negotiation with the previous shareholders of AHFL to extend the repayment date. As of September 30, 2020 and December 31, 2019, the amount due to previous shareholders of AHFL were $518,080 and $500,782, respectively. The change in amounts was due to foreign currency translation.
20
NOTE 9 – REVENUE
UnearnedThe Company’s revenue is derived from insurance agency and brokerage services. The Company, through its subsidiaries and variable interest entities, sells insurance products provided by insurance companies to individuals, and is compensated in the form of commissions from the respective insurance companies, according to the terms of each service agreement made by and between the Company and the insurance companies. The sale of an insurance product by the Company is considered complete when initial insurance premium is paid by an individual and the insurance policy is approved by the respective insurance company. When a policy is effective, the insurance company is obligated to pay the agreed-upon commission to the Company under the terms of its service agreement with the Company and such commission is recognized as revenue.
The Company considers the contracts with insurance companies contain one performance obligation and consideration should be recorded when performance obligation is satisfied at point in time. The amount of revenue to be recognized when the insurance policy is effective includes first year commission and other contingent commission that a significant reversal of revenue would not occur in the subsequent periods. When other contingent commission that could not be determined if a significant reversal of revenue would occur, the Company recognizes the commission after receiving insurance companies’ notice.
For the three months ended September 30, 2020 and 2019, the Company recorded revenue of $33,235,952 and $23,266,852, respectively. For the nine months ended September 30, 2020 and 2019, the Company recorded revenue of $91,200,916 and $64,449,994, respectively. Disaggregation information of revenue is disclosed in Note 15.
Contract Balance
Contract assets are the Company’s conditional rights to consideration for completed performance obligation and are in relation to the performance bonus to be rewarded based on the annual performance. The Company recognizes the contingent commission as a contract asset when the performance obligation is fulfilled, and the Company has not had the unconditional rights to the payment. Contract liabilities include payments received in advance of performance under the contract and are realized when the associated performance obligation is satisfied.
| | | | | | |
|
| September 30, 2020 |
| December 31, 2019 | ||
Accounts receivable | | $ | 15,309,244 | | $ | 22,541,558 |
Contract assets – current | | | 3,593,536 | | | 0 |
Contract liabilities – current | | | 1,609,155 | | | 1,781,975 |
Contract liabilities – noncurrent | | | 271,375 | | | 1,049,258 |
Contract Liabilities – AIATW
On June 10, 2013, AHFL entered into a Strategic Alliance Agreement (the “Alliance Agreement”) with AIA International Limited Taiwan Branch (“AIATW”). The, the purpose of the Alliance Agreementwhich is to promote life insurance products provided by AIATW within Taiwan by insurance agencies or brokerage companies affiliated with AHFL or CUIS. The original term of the Alliance Agreement iswas from April 15,June 1, 2013 to AugustMay 31, 2018. Pursuant to the terms of the Alliance Agreement, AIATW paid AHFL an execution fee of approximately $8,326,700 (NTD250,000,000, including the tax of NTD11,904,762, the “Execution Fee”), which is to be recorded as revenue upon fulfilling sales targets and the 13-month persistency ratio, as defined, over the next five years. The Execution Fee may be required to be recalculated if certain performance targets are not met by AHFL.
On September 30, 2014, AHFL entered into a Strategic Alliance Supplemental Agreement (the “Supplemental“First Amendment to the Alliance Agreement”) with AIATW. In the SupplementalFirst Amendment to the Alliance Agreement, the performance targets and the provision about refunding the Execution Fee on a pro rata basis when the performance targets are not met were revised.
21
On January 6, 2016, AHFL entered into an Amendment No. 2 to Strategicthe Alliance Agreement (the “Amendment No. 2”“Second Amendment to the Alliance Agreement”) with AIATW to further revise certain provisions in the Strategic Alliance Agreement and the previous amendment entered into by and between AHFL and AIATW. The purpose of the Strategic Alliance Agreement is to promote life insurance products provided by AIATW within the territory of Taiwan through insurance agency companies or insurance brokerage companies. To the extent permitted by applicable laws and regulations, AHFL shall assist and encourage any insurance agency company or insurance brokerage company duly approved by the competent government authorities of Taiwan (the “Appointed Broker/Agent”), to cooperate with AIATW for the promotion of life insurance products of AIATW. Pursuant to the Second Amendment No. 2,to the Alliance Agreement, the expiration date of the Strategic Alliance Agreement has beenwas extended from May 31, 2018 to December 31, 2021, and the effect of the Strategic Alliance Agreement during the period from October 1, 2014 to December 31, 2015 has beenwas suspended. In addition, both AHFL and AIATW agreed to adjust certain terms and conditions set forth in the Strategic Alliance Agreement, among which:some of which are as follows: (i) expandexpanding the scope of services to be provided by AHFL to AIATW to include, without limitation, assessment and advice on suitability of cooperative partners, advice on product strategies suitable for promotion channel development, advice on promotion/sales channel improvement, advice on promotion channel marketing and strategic planning, and promotion channel talent training; and (ii) removeremoving certain provisions related to performance milestones and refund of Execution Fees. On March 15, 2016, AHFL issued a promise letter (the “2016 Letter”) to AIATW that AHFL is required to (i) fulfill sales targets and (ii) the 13-month persistency ratio.
On June 14, 2017, with AIATW’s consent, the 2016 Letter has beenwas revoked in order to conform with the latest terms and conditions regarding the cooperation between AHFL and AIATW as set forth in a third amendment (Amendmentan Amendment No. 3)3 to the Alliance Agreement (the “Third Amendment to the Alliance Agreement”). Pursuant to the Third Amendment No. 3,to the Alliance Agreement, both AHFL and AIATW agreed to adjust certain terms and conditions set forth this amendment, amongsome of which included (i) except the first contract year (April 15th, 2013 to September 30th, 2014), the sales target of the alliance between the parties shall be changed to (a) value of new business (“VONB”) and (b) the 13-month persistency ratio; and (ii) AIATW will calculate and recognize the VONB and 13-month persistency ratio each contract year and inform the Company the result; and (iii) the Company agreesagreed to return the basic business promotion fees to AIATW within thirty (30) days of receipt of the notice sent by AIATW if the Company fails to meet the targets set forth in the Third Amendment No. 3,to the Alliance Agreement, AIATW reservesreserved the right to offset such amount against the amount payable by it to the Company; and (iv) upon the termination of the Alliance Agreement and its amendments pursuant to the Section 8.2 of the Alliance Agreement, both parties agreeagreed to calculate the amount to be returned or repaid, as applicable, based on the past and current contract years. The Company shall return the basic business promotionexecution fees at NTD 330,000,000NTD50 million for the first contract year, NTD35 million for the second contract year, and NTD33 million for each contract yearsyear thereafter within one month after the termination.
The Company recognizes AIATW’s revenue when the life insurance products provided by AIATW are met: (i) persuasive evidence of an agreement between the insurance company and insured exists, (ii) insurance brokerage services have been provided, (iii) the fee to be paid by the related insurer to the Company for such services is fixed or determinable, and (iv) the collectability of the fee is reasonably assured. The purpose of refund is primarily due to the portion of performance sales targets are not met in that contract year. The following table presents the amounts recognized as revenue and the refundedrefund for each contract year:
| | | | | | | | | | | | | | | | | |
Contract | | | | | | | Revenue | | Revenue VAT | | Refund | | Refund VAT | ||||
Year |
| Period |
| Execution Fees |
| Amount |
| Amount |
| Amount |
| Amount | |||||
First | | 04/15/2013 - 09/30/2014 | | NTD | 50,000,000 | | NTD | 27,137,958 | (1) | NTD | 1,356,898 | | NTD | 20,481,090 | (1) | NTD | 1,024,054 |
Second | | 01/01/2016 - 12/31/2016 | | NTD | 35,000,000 | | NTD | 12,855,000 | (2) | NTD | 642,750 | | NTD | 20,478,333 | (2) | NTD | 1,023,917 |
Third | | 01/01/2017 - 12/31/2017 | | NTD | 33,000,000 | | NTD | 12,628,201 | (3) | NTD | 631,410 | | NTD | 18,800,370 | (3) | NTD | 940,019 |
Fourth | | 01/01/2018 - 12/31/2018 | | NTD | 33,000,000 | | NTD | 11,228,600 | (4) | NTD | 561,429 | | NTD | 20,199,971 | (4) | NTD | 1,010,000 |
Fifth | | 01/01/2019 - 12/31/2019 | | NTD | 33,000,000 | | NTD | 9,481,371 | (5) | NTD | 474,069 | | NTD | 21,947,200 | (5) | NTD | 1,097,360 |
Sixth | | 01/01/2020 - 12/31/2020 | | NTD | 33,000,000 | | NTD | 11,213,344 | (6) | NTD | 560,667 | | NTD | 20,215,227 | (6) | NTD | 1,010,762 |
Seventh | | 01/01/2021 - 12/31/2021 | | NTD | 33,000,000 | | NTD | 0 | | NTD | 0 | | NTD | 0 | | NTD | 0 |
TOTAL | |
| | NTD | 250,000,000 | | NTD | 84,544,474 | | NTD | 4,227,223 | | NTD | 122,122,191 | | NTD | 6,106,112 |
1)The revenue recognition for the first contract year is based on the annual first year premium (“AFYP”) set in Alliance Agreement, which is different from other contract years. From the second contract year to the seventh contract year, the revenue calculation is based on VONB. The Company recognized the first contract year’s revenue amount of $892,742 (NTD 27,137,958), net of Value-Added Tax (“VAT ") in 2017 due to uncertainty resolved after Amendment 3 went effective. Besides, on December 3, 2015 and February 23, 2016, the Company refunded the amounts of $160,573 (NTD4,761,905), net of VAT, and $530,056 (NTD15,719,185), net of VAT, to AIATW, respectively, due to the portion of performance sales targets not met during the first contract year based on original agreement and earlier amendments.
22
| Contract Year | Period | Execution Fees | Revenue Amount | Refund Amount | ||||||||||
| First | 4/15/2013 ~ 9/30/2014 | NTD | 50,000,000 | NTD | 28,494,856 | (1) | NTD | 21,505,144 | (1) | |||||
| Second | 1/1/2016 ~ 12/31/2016 | NTD | 35,000,000 | NTD | 13,497,750 | (2) | NTD | 21,502,250 | (2) | |||||
| Third | 1/1/2017 ~ 12/31/2017 | NTD | 33,000,000 | NTD | 9,254,296 | (3) | NTD | - | ||||||
| Fourth | 1/1/2018 ~ 12/31/2018 | NTD | 33,000,000 | NTD | - | NTD | - | |||||||
| Fifth | 1/1/2019 ~ 12/31/2019 | NTD | 33,000,000 | NTD | - | NTD | - | |||||||
| Sixth | 1/1/2020 ~ 12/31/2020 | NTD | 33,000,000 | NTD | - | NTD | - | |||||||
| Seventh | 1/1/2021 ~ 12/31/2021 | NTD | 33,000,000 | NTD | - | NTD | - | |||||||
| TOTAL | NTD | 250,000,000 | NTD | 51,246,902 | NTD | 43,007,394 | ||||||||
2)For the year ended December 31, 2016, the Company recognized the second contract year’s revenue amount of $422,883 (NTD 12,855,000), net of VAT, and refunded the amount of $690,537 (NTD 20,478,333), net of VAT, due to uncertainty resolved after Amendment 3 went effective.
3)For the year ended December 31, 2017, the Company recognized the third contract year’s revenue amount of $415,423 (NTD12,628,201), net of VAT, and refund amount of $633,955 (NTD18,800,370), net of VAT, for the same contract period based on the calculation of VONB and 13-month persistency.
| ||
4)For the year ended December 31, 2018, the Company recognized the fourth contract year’s revenue amount of $372,650 (NTD11,228,600), net of VAT, and refund amount of $670,389 (NTD 20,199,971), net of VAT, for the same contract period based on the calculation of VONB and 13-month persistency.
5)For the year ended December 31, 2019, the Company recognized the fifth contract year's revenue amount of $314,953 (NTD9,481,371), net of VAT, and refund the amount of $729,045 (NTD 21,947,200), net of VAT, for the same contract period based on the calculation of VONB and 13-month persistency.
6)The Company estimated VONB and 13-month persistency ratio for the year ending December 31, 2020 and calculated the revenue amount to be $395,488 (NTD 11,774,011) for the year. The amount will be reassessed every quarter until receiving AIATW’s notice.
The Company recognized revenue of $1,679,942 (NTD51,246,902)$94,493 (NTD 2,813,139), net of VAT, and nil$73,691(NTD 2,281,470), net of VAT for the three months ended September 30, 2020 and 2019, and $282,491 (NTD 8,410,008) and $234,852 (NTD 7,271,032) , net of VAT, for the nine months ended September 30, 20172020 and 2016 related to this agreement. 2019, respectively.
As of September 30, 20172020 and December 31, 2016,2019, the Company had non-current portion of unearned revenuecontract liabilities of $4,242,585$271,375 and $4,742,272,$1,049,258, respectively, and current portioncontract liabilities of $681,340$1,609,155 and $1,966,814,$1,781,975, respectively, related to the Alliance Agreement.
Unearned revenue – Farglory
NOTE 10 –LEASE
On April 20, 2016,The Company adopted ASC 842 as of January 1, 2019 using a modified retrospective transition with no adjustment to its comparative periods in the year of transition. The Company elected the practical expedients, which allow the Company entered into a service agreement (“Service Agreement”)not to reassess prior conclusions with Farglory Life Insurance Co., Ltd. (“Farglory”).respect to lease identification, lease classification and initial direct costs under ASC 842. The Company did not elect the hindsight practical expedient to determine the lease term or in assessing the likelihood that a lease purchase option will be exercised. The adoption of ASC 842 resulted in the recognition of operating lease right-of-use assets of $4.0 million and corresponding operating lease liabilities of $3.7 million as of January 1, 2019 on the consolidated balance sheet.
The Company has operating leases for its offices with lease terms ranging from one to six years. We determine if an arrangement is a lease at inception of the contract and whether a contract is or contains a lease by determining whether it conveys the right to provide consulting servicescontrol the use of the identified asset for a period of time. If the contract provides us the right to Farglory for NTD4,000,000 per yearsubstantially all of the economic benefits from the use of the identified asset and the aggregate consulting services feeright to direct the use of the identified asset, we consider it to be, or contain, a lease. We record a right-of-use asset and a corresponding lease liability based on the present value of the minimum lease payments. The lease term used in the calculation of right-of-use assets and lease liabilities renewal and termination options that are reasonably certain to be exercised. Leases with an initial term of twelve months or less are not recorded on the consolidated balance sheet and the related lease expense is NTD20,000,000recognized on a straight-line basis over the lease term. Our leases do not provide an implicit borrowing rate, and we estimate the Company’s incremental borrowing rate to discount the lease payments based on information available at lease commencement.
The Company recorded operating lease cost of $910,073 and $2,562,384 for the three and nine months ended September 30, 2020, and $701,341 and $2,076,084 for the three and nine months ended September 30, 2019, respectively.
23
Operating lease right-of-use assets represent the Company’s right to use an underlying asset for the lease term and lease liabilities represent the Company’s obligation to make lease payments arising from May 1, 2016 to April 30, 2021. However, both parties are renegotiating the Service Agreement and plan to amend the cooperation method.lease. As of September 30, 20172020, operating lease right-of-use assets and December 31, 2016, the Company had long-termlease liabilities amount of nilwere as follows:
| | | | | | |
|
| September 30, 2020 |
| December 31, 2019 | ||
Right-of-use assets under operating leases | | $ | 5,791,689 | | $ | 5,522,665 |
Operating lease liabilities – current | |
| 2,740,054 | |
| 2,242,034 |
Operating lease liabilities – noncurrent | |
| 3,008,155 | |
| 3,048,632 |
Lease Term and $495,615, respectively, and current liabilities amounts of $659,544 and $123,904, respectively, relatedDiscount Rate
| | | | | |
| | | | | |
|
| September 30, 2020 |
| December 31, 2019 | |
Weighted average remaining lease term |
|
|
|
|
|
Operating lease |
| 2.64 | years | 2.91 | years |
Weighted average discount rate |
|
|
|
|
|
Operating lease |
| 3.04 | % | 2.85 | % |
Supplemental Cash Flow Information Related to this Service Agreement.Leases
| | | | | | |
|
| September 30, 2020 |
| December 31, 2019 | ||
Cash paid for amounts included in the measurement of lease liabilities |
| |
| | |
|
Operating cash flows related to operating leases | | $ | 2,497,196 | | $ | 2,655,644 |
Due to previous shareholders of AHFL
Due to previous shareholders of AHFL is the remaining balance payable of the acquisition cost. On March 12, 2017, the Company and the selling shareholders of AHFL entered into a fifth amendment to the acquisition agreement (the “Fifth Amendment”), pursuant to which, the Company agreed to distribute the cash payment in the amount of $480,559 (NTD15 million) on or prior to March 31, 2019.
Other long-term liabilities
On May 10, 2016, Law Broker entered into an engagement agreement (the “Engagement Agreement”) with Hui-Hsien Chao (“Ms. Chao”), pursuant to which she acts as the general manager of Law Broker for a term from December 29, 2015 to December 28, 2018. Ms. Chao’s primary responsibilities are to assist Law Broker in operating and managing insurance agency business. According to the Engagement Agreement, Ms. Chao’s bonus plans include: 1) execution, 2) long-term service fees, 3) pension and 4) non-competition, and the payment of such bonuses will only occur upon satisfaction of certain condition and subject to the terms therein, among which, Ms. Chao acts as the general manager or equivalent position of Law Broker for at least 3 years.
On May 14, 2016, Law Broker and Ms. Chao entered into a supplementary agreement (“Supplementary Agreement”) to postpone her pension vesting date to December 29, 2016. Law Broker expects that none of the above-mentioned bonuses are to be paid prior to May 2019, and therefore it has recorded as long-term liabilities representing the corresponding portion of such bonuses accrued. On March 13, 2017, Law Broker and Ms. Chao entered into an engagement agreement, which is the amendment to Engagement Agreement dated May 10, 2016 to specify 1) Ms. Chao’s pension calculation assumption and start date, and 2) the non-competition provision start date. As of September 30, 2017 and December 31, 2016, the balance of such accrued long-term liabilities was $175,191 and $77,440, respectively.
NOTE 16 – PREFERRED STOCK
The Company is authorized to issue 10,000,000 shares of preferred stock, $.00001 par value and currently has 1,000,000 shares of Series A Preferred Stock (“Series A Stock”) outstandingminimum future lease payments as of September 30, 2017. The Series A Stock has the following rights and preferences:2020 are as follows:
| | | |
|
| Amount | |
2020 (reminder of year) | | $ | 792,888 |
2021 | |
| 2,642,057 |
2022 | |
| 1,387,905 |
2023 | |
| 677,494 |
2024 | |
| 442,299 |
Thereafter | |
| 47,115 |
Total minimum lease payments | | | 5,989,758 |
Less: Interest | |
| (241,549) |
Present value of future minimum lease payments | | $ | 5,748,209 |
Voting Rights. Except as otherwise provided by law, the Series A Stock and the common stock vote together on all matters submitted to a vote of the Company’s shareholders. Each holder of Series A Stock is entitled to ten votes for each share of Series A Stock held of record by such holder as of the applicable record date on any matter that is submitted to a vote of the stockholders of the Company.
24
Series A Board Designee and Board Restriction. In addition to the voting rights disclosed above, the holdersTable of the Series A Stock shall be entitled to appoint one director (the “Series A Director”). No Board resolution regarding certain material Company actions can be made without the affirmative vote of the Series A Director.Contents
Dividends. The holders of Series A Stock are entitled to share equally with the holders of common stock, on a per share basis, in such dividends and other distributions of cash, property or shares of stock of the Company as may be declared by the Board.
Liquidation. In the event of a voluntary or involuntary liquidation, dissolution, distribution of assets or winding up of the Company, the holders of common stock and the holders of Series A Stock shall be entitled to share equally on a per share basis, in all assets of the Company of whatever kind available for distribution.
Conversion Rights. The holders of the Series A Stock have the right to convert their shares thereof at any time into shares of the Company’s common stock. Each share of Series A Stock is convertible into one share of common stock.
If the Company in any manner subdivides or combines the outstanding shares of common stock, the outstanding shares of the Series A Stock will be subdivided or combined in the same manner.
Business Combinations. In any merger, consolidation, reorganization or other business combination, the consideration received per share by the holders the common stock and the holders of the Series A Stock in such merger, consolidation, reorganization or other business combination shall be identical; provided however, that if such consideration consists, in whole or in part, of certain equity interests, the rights and limitations of such equity interests may differ to the extent that the rights and limitations of the common stock and the Series A Stock differ.
Fully Paid and Nonassessable. All of the Company’s outstanding shares of preferred stock are fully paid and nonassessable.
The fair value of the 1,000,000 preferred shares was $225,000 at the time of the preferred share issuance. The fair value of the common shares was $200,000 at the time of the preferred share issuance based on its market price at the date of the transaction. Therefore, the incremental value of the preferred shares was $25,000. This amount may be deemed compensation.
From the qualitative aspect, the Company notes the following regarding this deemed compensation:
Does not violate any debt or other contract covenants;
Does not change any earnings or EPS trends;
Does not affect any previous earnings or EPS guidance;
Does not affect any segment or class of revenue;
Does not affect any regulatory compliance matters;
Does not affect cash compensation of management;
Does not involve concealment of an unlawful act.
Additional preferred stock may be authorized and issued in the future in connection with acquisitions, financings, or other matters, as the Board of Directors (the “BOD”) deems appropriate. In the event that the Company issues any shares of preferred stock, a certificate of designation containing the rights, privileges and limitations of this series of preferred stock will be filed with the Secretary of State of the State of Delaware. The effect of this preferred stock designation power is that its BOD alone, subject to Federal securities laws, applicable blue-sky laws, and Delaware law, may be able to authorize the issuance of preferred stock which could have the effect of delaying, deferring, or preventing a change in control without further action by its stockholders, and may adversely affect the voting and other rights of the holders of its common stock.
NOTE 17 – STATUTORY RESERVES
According to Taiwan accounting rules and corporation regulations, the Company’s subsidiaries in Taiwan must appropriate 10% of net income to statutory reserves until the accumulated reserve hits registered capital. The reserve can be converted into share capital by issuing new shares to existing shareholders in proportion to their shareholding or by increasing the par value of the shares currently held by them, with a limitation that the reserve left is not less than 25% of the registered capital after converting to share capital.
Pursuant to the PRC regulations, CAE are required to transfer 10% of their net profit, as determined under the PRC accounting regulations, to a Statutory Common Reserve Fund (“Reserve Fund”). Appropriation to the Reserve Fund may cease when the fund equals 50% of a company’s registered capital or when a company has accumulated losses. The transfer to this reserve must be made before distribution of dividends to shareholders. The Company’s CAE did not appropriate such reserve as they have accumulated losses.
NOTE 1811 – NON-CONTROLLING INTERESTS
Non-controlling interests consisted of the following:following as of September 30, 2020 and December 31, 2019:
| | | | | | | | | | | | | | | | | |
| | % of Non- | | | | | | | | | | | Other | | | | |
| | controlling | | December 31, | | Contribution | | Net Income | | Comprehensive | | September 30, | |||||
Name of Entity |
| Interest |
| 2019 |
| /Acquisition |
| (Loss) |
| Income |
| 2020 | |||||
Law Enterprise |
| 34.05 | % | $ | (204,964) | | $ | 0 | | $ | (232,274) | | $ | 16,642 | | $ | (420,596) |
Law Broker |
| 34.05 | % |
| 19,536,104 | |
| 0 | |
| 3,610,495 | |
| 748,243 | |
| 23,894,842 |
Uniwill | | 50.00 | % | | 0 | | | 1,547,229 | | | (993,938) | | | 20 | | | 553,311 |
Rays | | 10.00 | % | | 0 | | | 1,019 | | | (3,328) | | | 0 | | | (2,309) |
PFAL |
| 49.00 | % |
| 351,278 | |
| 0 | |
| 59,244 | |
| 881 | |
| 411,403 |
MKI |
| 49.00 | % |
| 283 | |
| 0 | |
| (1,016) | |
| 0 | |
| (733) |
PA Taiwan |
| 49.00 | % |
| (167,531) | |
| 0 | |
| 5,931 | |
| 211 | |
| (161,389) |
PTC Nanjing |
| 49.00 | % |
| (2,644) | |
| 0 | |
| 1,446 | |
| 1,198 | |
| 0 |
Total | | | | $ | 19,512,526 | | $ | 1,548,248 | | $ | 2,446,560 | | $ | 767,195 | | $ | 24,274,529 |
| | | | | | | | | | | | | | | | | |
| | % of Non- | | | | | | | | Other | | | | | | | |
| | Controlling | | December 31, | | Net Income | | Comprehensive | | | | | December 31, | ||||
Name of Entity |
| Interests |
| 2018 |
| (Loss) |
| Income (Loss) |
| Dividends |
| 2019 | |||||
Law Enterprise |
| 34.05 | % | $ | (72,557) | | $ | (147,948) | | $ | 15,541 | | $ | 0 | | $ | (204,964) |
Law Broker |
| 34.05 | % |
| 16,149,662 | |
| 2,985,723 | | | 400,719 | | | 0 | |
| 19,536,104 |
PFAL |
| 49.00 | % |
| 436,742 | |
| 7,086 | | | 1,265 | | | (93,815) | |
| 351,278 |
MKI |
| 49.00 | % |
| (2,630) | |
| 2,913 | | | 0 | | | 0 | |
| 283 |
PA Taiwan |
| 49.00 | % |
| (157,762) | |
| (9,694) | | | (75) | | | 0 | |
| (167,531) |
PTC Nanjing |
| 49.00 | % |
| (2,411) | |
| (139) | | | (94) | | | 0 | |
| (2,644) |
Total | | | | $ | 16,351,044 | | $ | 2,837,941 | | $ | 417,356 | | $ | (93,815) | | $ | 19,512,526 |
| Name of Affiliate | % of Non-controlling Interests | As of December 31, 2016 | Net Income and Other Comprehensive Gain/(Loss) of Non-controlling Interests | As of September 30, 2017 | ||||||||||||
| Law Enterprise Co., Ltd. (“Law Enterprise”) | 34.05 | % | $ | 17,386 | $ | 446,585 | $ | 463,971 | ||||||||
| Law Broker | 34.05 | % | 9,621,159 | 2,148,249 | 11,769,408 | |||||||||||
| Prime Financial Asia Ltd. (“PFAL”) | 49.00 | % | 232,414 | (34,973 | ) | 197,441 | ||||||||||
| Max Key Investments Ltd. (“MKI”) | 49.00 | % | (1,569 | ) | (548 | ) | (2,117 | ) | ||||||||
| Prime Asia Corporation Limited. (“PA Taiwan”) | 49.00 | % | (95,448 | ) | (64,179 | ) | (159,627 | ) | ||||||||
| Prime Management Consulting (Nanjing) Co., Ltd. (“PTC Nanjing”) | 49.00 | % | (2,400 | ) | 261 | (2,139 | ) | |||||||||
| Total | $ | 9,771,542 | $ | 2,495,395 | $ | 12,266,937 | ||||||||||
Uniwill issued a total of 9,608 preferred shares to Cyun-Jhan and Jian-Zao for cash pursuant to the JV Agreement entered on November 15, 2019 after the performance goals of first stage were achieved on February 10, 2020 (the “Grant Date”). The preferred stocks issued have voting rights at 1 share to 1,000 voting rights in shareholder’s meeting, and rights of participating in the daily operating of Uniwill and to receive 50% of earnings of the operating subsidiary. In addition, the holders of the preferred stocks are eligible to convert the preferred stock to common stock of Uniwill at a ratio of 1 preferred share to 1,000 common shares upon the achievement of the performance goals of stage two set forth in the JV Agreement.
| Name of Affiliate | % of Non-controlling Interests | As of December 31, 2015 | Net Income and Other Comprehensive Gain/(Loss) of Non-controlling Interests | As of December 31, 2016 | ||||||||||||
| Law Enterprise | 34.05 | % | $ | 199,699 | $ | (182,313 | ) | $ | 17,386 | |||||||
| Law Broker | 34.05 | % | 7,197,128 | 2,424,031 | 9,621,159 | |||||||||||
| PFAL | 49.00 | % | 206,098 | 26,316 | 232,414 | |||||||||||
| MKI | 49.00 | % | (1,065 | ) | (504 | ) | (1,569 | ) | ||||||||
| PA Taiwan | 49.00 | % | (26,292 | ) | (69,156 | ) | (95,448 | ) | ||||||||
| PTC Nanjing | 49.00 | % | (837 | ) | (1,563 | ) | (2,400 | ) | ||||||||
| Total | $ | 7,574,731 | $ | 2,196,811 | $ | 9,771,542 | ||||||||||
NOTE 19 – INCOME TAX
Provision (benefit) for income taxBased on ASC 718, the Company determined that the fair market value of 9,608 shares of convertible preferred stock was $1,547,229 on the Grant Date valuated by an independent third-party valuation firm using the probability-based recognition approach. NaN and $1,547,229 compensation cost was recognized after cash surrendered for the three months ended September 30, 2017 consisted of:
Three months ended September 30, 2017 | Federal | State | Foreign | Total | ||||||||||||
| Current | $ | - | $ | - | $ | 828,532 | $ | 828,532 | ||||||||
| Deferred | - | - | 3,346 | 3,346 | ||||||||||||
| Total | $ | - | $ | - | $ | 831,878 | $ | 831,878 | ||||||||
Provision (benefit) for income tax for the three months ended September 30, 2016 consisted of:
Three months ended September 30, 2016 | Federal | State | Foreign | Total | ||||||||||||
| Current | $ | - | $ | - | $ | 500,787 | $ | 500,787 | ||||||||
| Deferred | - | - | (43,959 | ) | (43,959 | ) | ||||||||||
| Total | $ | - | $ | - | $ | 456,828 | $ | 456,828 | ||||||||
Provision (benefit) for income tax for theand nine months ended September 30, 2017 consisted of:2020 as a result.
Nine months ended September 30, 2017 | Federal | State | Foreign | Total | ||||||||||||
| Current | $ | - | $ | - | $ | 2,365,177 | $ | 2,365,177 | ||||||||
| Deferred | - | - | (20,030 | ) | (20,030 | ) | ||||||||||
| Total | $ | - | $ | - | $ | 2,345,147 | $ | 2,345,147 | ||||||||
Provision (benefit) for income
25
NOTE 12 – INCOME TAX
The following table reconciles the Company’s statutory tax rates to effective tax rates for the three and nine months ended September 30, 2016 consisted of:2020 and 2019:
Nine months ended September 30, 2016 | Federal | State | Foreign | Total | ||||||||||||
| Current | $ | - | $ | - | $ | 1,400,566 | $ | 1,400,566 | ||||||||
| Deferred | - | - | (65,235 | ) | (65,235 | ) | ||||||||||
| Total | $ | - | $ | - | $ | 1,335,331 | $ | 1,335,331 | ||||||||
| | | | | |
| | Three Months Ended September 30, | | ||
| | 2020 | | 2019 | |
US statutory rate |
| 21 | % | 21 | % |
Tax rate difference |
| (1) | % | (1) | % |
Income tax on undistributed earnings |
| 5 | % | 4 | % |
Change in valuation allowance |
| 0 | % | 5 | % |
Utilization of deferred tax assets not previously recognized | | 0 | % | (3) | % |
Withholding taxes |
| 5 | % | 0 | % |
Provision for uncertain tax position |
| (5) | % | 0 | % |
True up of prior year income tax |
| (1) | % | 2 | % |
Other |
| 1 | % | 0 | % |
Effective tax rate |
| 25 | % | 28 | % |
| | | | | | |
| | Nine Months Ended September 30, | | | ||
| | 2020 | | 2019 | | |
US statutory rate |
| 21 | % | 21 | % | |
Tax rate difference |
| (1) | % | (1) | % | |
Income tax on undistributed earnings |
| 6 | % | 4 | % | |
Change in valuation allowance |
| 5 | % | 3 | % | |
Non-deductible and non-taxable items |
| 4 | % | 0 | % | |
Utilization of deferred tax not recognized in prior year |
| 0 | % | (1) | % | |
Withholding taxes |
| 3 | % | 0 | % | |
True up of prior year income tax |
| (3) | % | 0 | % | |
Other | | 1 | % | 0 | % | |
Effective tax rate |
| 36 | % | 26 | % | |
Significant componentsThe Company’s income tax expense is mainly generated by its subsidiaries in Taiwan. The Company’s subsidiaries in Taiwan are subject to the statutory tax rate on income reported in the statutory financial statements after appropriate adjustments at 20% and 5% of the deferred tax assets and liabilities for income tax ason any undistributed earnings according to the Income Tax Law of Taiwan. As of September 30, 20172020 and December 31, 2016 consisted2019, the Company had current tax payable of the following:$2,484,895 and $2,230,793 for Taiwan income tax, respectively.
| As of | ||||||||
| September 30, 2017 | December 31, 2016 | |||||||
| Deferred tax assets | ||||||||
| Net operating loss carry-forward | $ | 1,101,734 | $ | 993,050 | ||||
| Others | 110,212 | 84,597 | ||||||
| Total | $ | 1,211,946 | $ | 1,077,647 | ||||
| Valuation allowance | (1,101,734 | ) | (993,050 | ) | ||||
| Net deferred tax assets | $ | 110,212 | $ | 84,597 | ||||
| Deferred tax assets - current | $ | 58,041 | $ | 59,233 | ||||
| Deferred tax assets - noncurrent | $ | 52,171 | $ | 25,364 | ||||
| Deferred tax liabilities - current | $ | 125,059 | $ | - | ||||
A 100% valuation allowance was provided for the deferredThe Company had previously estimated and recorded an uncertain tax assetsposition related to withholding tax matters. During the PRC segmentthird quarter of 2020, the Company received an assessment letter from National Taxation Bureau of Taiwan, which requires the Company to remit a supplementary tax payment of $281,605 for such matters, and the Company as ofamount was fully paid in September 30, 20172020. For the three and December 31, 2016. Net deferred tax assets of $110,212 and $84,597, respectively, related to the Taiwan segment were included in other current assets and other assets on the consolidated balance sheets as of September 30, 2017 and December 31, 2016. Deferred tax liabilities were the timing differences of revenue and cost of sales recognized in the periodnine months ended September 30, 2017. Deferred tax liabilities2020, the Company recognized interest and penalties of $125,059NaN and nil, respectively, related to the PRC segment wereapproximately $178,000, in other current liabilities on the consolidated balance sheets as of September 30, 2017general and December 31, 2016.administrative expenses.
Zhengzhou Zhonglian Hengfu Business Consulting Co., Ltd. (“CU WFOE”)WFOE and the CAECompany’s Consolidated Affiliated Entities (“CAE”) in the PRC are governed by the Income Tax Law of the PRC concerning the privateprivate-run enterprises, which are generally subject to tax at 25% on income reported in the statutory financial statements after appropriated adjustments, except for Jiangsu. Forappropriate adjustments. One of our CAE in Jiangsu province was levied at 10% of total revenue instead of net income according to the requirement of local tax authorities the tax basisprior to May 2019 and currently is deemed as 10% of total revenue, instead of net income.
The Company’s subsidiaries in Taiwan are governed by the Income Tax Law of Taiwan, and are generally subject to tax at 17%25% on income reported in the statutory financial statements after appropriate adjustments. Inadjustment. WFOE and CAE had no income tax expenses for the meanwhile, Income Tax Law of Taiwan provides that a company is taxed at additional 10% on any undistributed earningsthree and nine months ended September 30, 2020 and 2019 due to its shareholders.
the net operating losses generated in the previous years.
The Company’s subsidiaries in Hong Kong are governed by the Inland Revenue Ordinance Tax Law of Hong Kong and are generally subject to a profitsprofit tax at the rate of 16.5%8.25% on the estimated assessable profits. As of September 30, 2020 and December 31, 2019, the Company had current tax payable of NaN and $56,993 for Hong Kong income tax, respectively.
26
The following table reconciles the US statutory ratesCompany is subject to the Company’s effectivestatutory rate of 21% in the U.S. federal jurisdiction. The Company had no income tax rateexpense for the three months ended September 30, 2017 and 2016:
| Three Months Ended September 30, | ||||||||
| 2017 | 2016 | |||||||
| US statutory rate | 34 | % | 34 | % | ||||
| Tax rate difference | (18 | )% | (18 | )% | ||||
| Tax base difference | - | % | - | % | ||||
| Loss in subsidiaries | 7 | % | 2 | % | ||||
| Un-deductible and non-taxable items | 7 | % | 9 | % | ||||
| Tax per financial statements | 30 | % | 27 | % | ||||
The following table reconciles the US statutory rates to the Company’s effective tax rate for the nine months ended September 30, 20172020 and 2016:
| Nine Months Ended September 30, | ||||||||
| 2017 | 2016 | |||||||
| US statutory rate | 34 | % | 34 | % | ||||
| Tax rate difference | (18 | )% | (20 | )% | ||||
| Tax base difference | - | % | 1 | % | ||||
| Loss in subsidiaries | 5 | % | 7 | % | ||||
| Un-deductible and non-taxable items | 6 | % | 10 | % | ||||
| Tax per financial statements | 27 | % | 32 | % | ||||
Un-deductible and non-taxable items mainly represent un-deductible expenses according to local tax laws and the non-taxable tax income or expenses.
NOTE 20 – RELATED PARTY TRANSACTIONS
Due to related parties
The related parties listed below loaned money2019 due to the Company for working capital. Due to related parties consisted of the following as of September 30, 2017 and December 31, 2016:
| September 30, 2017 | December 31, 2016 | |||||||
| Due to Mr. Mao (CEO of the Company) | $ | 401,775 | $ | 361,379 | ||||
| Due to Ms. Lu (Shareholder of Law Anhou) | 225,411 | - | ||||||
| Due to Xude Investment (Owned by Mr. ChwanHau Li) | - | 32,374 | ||||||
| Due to Mr. Zhu (Legal Representative of Jiangsu) | 2,081 | 1,994 | ||||||
| Due to Yuli Broker (Owned by Ms. Lee) | 141 | 265 | ||||||
| Due to Yuli Investment (Owned by Ms. Lee) | 141 | 265 | ||||||
| Due to I Health Management Corp* | 17,313 | 3,724 | ||||||
| Total | $ | 646,862 | $ | 400,001 | ||||
*25% of I Health Management Corp’s shares are owned by Multiple Capital Enterprise. 24% of Multiple Capital Enterprise’s shares are owned by the Company’s management level
The loan due to related parties were non-interest bearing and were payable on demand.
Debt Forgiveness – Related Parties
In 2015, Xude Investment assisted the Company to set up Genius Holdings Financial Limited (BVI Company) and Genius Investment Consultant Co., Ltd. (Taiwan Company) and paid set up fee on behalf of the Company with the amount of $23,544 and NTD285,083 ($9,393). Xude Investment was owned by Mr. ChwanHau Li, who is one of the Directors of the Company. In March 2017, Xude Investment agreed to forgive the Company’s debt above in whole. As of September 30, 2017, the Company has debt forgiveness from related parties amount of $32,937.
Lease Agreements
On July 1, 2016, the Company entered into a lease agreement with Yuli Broker to lease its Nan-King East Road office space in Taipei City. The lease term was for one year commencing on July 1, 2016 and ending on June 30, 2017, with an annual base rent approximately of $590 (NTD18,000). On June 30, 2017, this lease agreement was extended automatically to June 30, 2018.loss positions. For the three and nine months ended September 30, 2017, rent2020 and 2019, the Company did not recognize any GILTI tax as no GILTI tax obligation existed. The Company recognized a one-time transition tax of $1,199,195 in the year of 2018 based on the Company’s total post-1986 earnings and profits (“E&P”) that it previously deferred from U.S. income were $141tax. As of September 30, 2020, and $421, respectively.
December 31, 2019, the Company had current tax payable of $98,757 and $101,518 and noncurrent tax payable of $719,515 and $815,451 associated with the one-time transition tax.
On July 1, 2016,March 27, 2020, the Coronavirus Aid, Relief, and Economic Security Act ("CARES Act"), P.L. 116-136, was passed into law, amending portions of certain relevant US tax laws. The CARES Act includes a number of federal income tax law changes, including, but not limited to: 1) permitting net operating loss carrybacks to offset 100% of taxable income for taxable years beginning before 2021, 2) accelerating alternative minimum tax credit refunds, 3) temporarily increasing the allowable business interest deduction from 30% to 50% of adjusted taxable income, and 4) providing a technical correction for depreciation related to qualified improvement property. The Company does not believe that the CARES Act will have a material impact on the Company's consolidated financial statements.
NOTE 13 – RELATED PARTY TRANSACTIONS
Due to Related Parties
The following summarizes the Company’s loans payable to related parties as of September 30, 2020 and December 31, 2019:
| | | | | | |
| | September 30, 2020 | | December 31, 2019 | ||
Due to Mr. Mao (CEO and Principal shareholder of the Company) | | $ | 102,922 | | $ | 373,183 |
Due to Ms. Lu (A shareholder of Anhou) | |
| 75,381 | |
| 85,074 |
Others | |
| 12,630 | |
| 4,602 |
Total | | $ | 190,933 | | $ | 462,859 |
Due to Mr. Mao
Amounts due to Mr. Mao were associated with funding provided by Mr. Mao for the formation of our subsidiaries in China in 2011. As of September 30, 2020 and December 31, 2019, due to Mr. Mao in the respective amounts of $102,922 and $373,183 was non-interesting bearing and payable on demand.
Due to Ms. Lu
Due to Ms. Lu were borrowings from Ms. Lu to support Anhou’s business operation. As of September 30, 2020 and December 31, 2019, due to Ms. Lu in the respective amounts of $75,381 and $85,074 was non-interesting bearing and payable on demand.
NOTE 14– COMMITMENTS AND CONTINGENCIES
Operating Leases
See future minimum annual lease payments in Note 10.
Time Deposits Pledged as Collateral
See time deposits pledged as collateral in Note 4 and 5.
27
Legal Proceedings
On December 20, 2018, the Company and one of the Company’s former employees, agreed to settle fraud charges brought by the SEC relating to a scheme to manipulate the Company’s trading volume for the purpose of obtaining a listing on Nasdaq. Neither the Company nor the former employee realized financial gain from the scheme. Both the Company and the former employee agreed to the entry of a final judgment entered on January 18, 2019 that enjoins them from violating the charged provisions of the federal securities laws, orders the Company to comply with its undertaking to retain an independent compliance monitor for a period of not less than one year. The SEC did not seek a monetary penalty against the Company and there is no financial impact to the Company.
On April 10, 2020, the Company submitted a written certification (the “Certification”) to the SEC of its compliance with the undertaking indicated by the Final Judgment entered into on January 18, 2019 in front of the United States District Court for the Southern District of New York (SEC v. China United Ins. Serv., Inc., No. 18 Civ. 12055, Consent of Defendant China United Insurance Service, Inc. (ECF No. 3-1) (S.D.N.Y Dec. 20, 2018)) requiring the Company to retain an independent compliance monitor (“Independent Monitor”) for a leaseperiod of not less than one year. The Independent Monitor was mandated to review and evaluate the Company’s commitment to and implementation of a revised compliance program and to submit a final report to the SEC with respect to these matters. The Company reviewed the Independent Monitor’s final report submitted to the SEC on December 23, 2019 and confirmed in its Certification that, to the best knowledge of the Company, the factual content of the final report was true and accurate as of the date of such report.
Appointment Agreement
On December 21, 2018, Law Broker entered into an appointment agreement with Yuli InvestmentShu-Fen, Lee (“Ms. Lee”), pursuant to lease its Nan-King East Road office space in Taipei City. The lease term waswhich, she serves as the president of Law Broker from December 21, 2018 to December 20, 2021. Ms. Lee’s primary responsibilities include 1) overall business planning, 2) implementation of resolution of the shareholders’ meeting or the board of directors, 3) the appointment and dismissal of the Law Broker’s employees and sales professionals, except for one year commencinginternal auditors, 4) financial management and application, 5) being the representative of Law Broker, 6) other matters assigned by the board of directors. According to the agreement, Ms. Lee’s compensation plan include: 1) base salary, 2) managerial allowance, 3) surplus bonus based on July 1, 20161.25% of Law Broker’s income after tax, and ending on June 30, 2017, with an4) annual base rent approximately of $590 (NTD18,000). On June 30, 2017, this lease agreement was extended automatically to June 30, 2018.year-end bonus. For the three and nine months ended September 30, 2017, rent income were $141 and $421, respectively.
Advisory Agreements
On May 2, 2016,2020, the Company entered into an advisoryhas recorded the compensation expense of $86,240 and $164,095 under the appointment agreement, with I Health. Pursuant to the Advisory Agreement, I Health provided 10,000 Taiwan citizen’s health information to the Company for its new insurance product during May 2, 2016 to May 1, 2017. The total advisory fee was approximately $42,000 (NTD1,275,000).respectively. For the nine months ended September 30, 2017, The Company had cost of revenue related to I Health amount of $13,269.
On December 7, 2016, the Company entered into an advisory agreement with Fuchang Li (“Mr. Li,” the Director of the Company). Pursuant to this Advisory Agreement, Mr. Li provided investment consulting to the Company from December 7, 2016 to December 6, 2017. The total advisory fee was approximately $58,000 (NTD1,800,000). The Company had general and administrative expense related to this advisory agreement amount of $13,619and $42,998, respectively, for the three and nine months ended September 30, 2017.
Consulting Agreement
On November 1, 2016,2019, the Company entered into a consultinghas recorded the compensation expense of $89,408 and $125,954 under the appointment agreement, with Apex Biz Solution Limited. (“Apex,” was formerly known as Prime Technology Corp.), which has one of the same directors as Prime Financial Asia Ltd. Pursuant to this consulting agreement, the Company provided administrative operation consulting service to Apex from November 1, 2016 to December 31, 2021. As of and for the nine months ended September 30, 2017, the Company had account receivable and revenue amount of $17,274 and $33,874, respectively.
NOTE 21 – COMMITMENTS
Operating Leases
The Company has operating leases for its offices. Rental expenses for the three months ended September 30, 2017 and 2016 were $595,277 and $526,390, respectively. Rental expenses for the nine months ended September 30, 2017 and 2016 were $1,832,335 and $1,557,725, respectively. As of September 30, 2017, total future minimum annual lease payments under operating leases were as follows, by years:
| Twelve months ending September 30, 2018 | $ | 2,049,071 | ||
| Twelve months ending September 30, 2019 | 1,166,015 | |||
| Twelve months ending September 30, 2020 | 245,873 | |||
| Twelve months ending September 30, 2021 | 55,088 | |||
| Twelve months ending September 30, 2022 | 17,687 | |||
| Thereafter | - | |||
| Total | $ | 3,533,734 |
Engagement Agreement with Ms. Chao
On May 10, 2016, Law Broker entered into an engagement agreement with Hui-Hsien Chao ("Ms. Chao"), pursuant to which, she serves as the Engagement Agreementgeneral manager of Law Broker from December 29, 2015 to December 28, 2018. The engagement agreement with Ms. Chao. Please referChao was renewed in 2019 and her service period has extended to Note 15 Other Long-term Liabilities.
NOTE 22 – FINANCIAL RISK MANAGEMENT AND FAIR VALUE
December 20, 2021. Ms. Chao's primary responsibilities are to assist Law Broker in operating and managing insurance agency business. According to the engagement agreement, Ms. Chao's Bonus plans include: 1) execution, 2) long-term service fees, 3) pension and 4) non-competition. The payment of such bonuses will only occur upon satisfaction of certain condition and subject to the terms in the engagement agreement. Ms. Chao acts as the general manager or equivalent position of Law Broker for a term of at least three years. For the three and nine months ended September 30, 2020, the Company has exposure to credit, liquidityrecorded the compensation expense of $189,333 and market risks which arise in$273,424 under the normal course of its business. This note presents information aboutengagement agreement, respectively. For the Company’s exposure to each of these risks, the Company’s objectives, policiesthree and processes for measuring and managing risk, and the Company’s management of capital. Further quantitative disclosures are included throughout these consolidated financial statements.
The BOD has overall responsibility for the establishment and oversight of the Company’s risk management framework. The Company’s risk management policies are established to identify and analyze the risks faced bynine months ended September 30, 2019, the Company to set appropriate risk limitshas recorded the compensation expense of $213,190 and controls, and to monitor risks and adherence to limits. Risk management policies and systems are reviewed regularly to reflect changes in market conditions and$375,718 under the Company’s activities. The Company, through its training and management standards and procedures, aims to develop a disciplined and constructive control environment in which all employees understand their roles and obligations.engagement agreement, respectively.
The Company’s BOD oversees how management monitors compliance with the Company’s risk management policies and procedures and reviews the adequacy of the risk management framework in relation to the risks faced by the Company.
The Company’s credit risk arises principally from accounts receivables, loan and other receivables, pledged deposits and cash and equivalents. Management has a credit policy in place and monitors exposures to these credit risk on an ongoing basis. The carrying amounts of account receivables, loan and other receivables, pledged deposits and cash and cash equivalents represent the Company’s maximum exposure to credit risk. Accounts receivable are due within thirty (30) days from the date of billing.
The BOD of the Company is responsible for the overall cash management and raising borrowings to cover expected cash demands. The Company regularly monitors its liquidity requirements, to ensure it maintains sufficient reserves of cash and readily realizable marketable securities and adequate committed lines of funding from major financial institutions to meet its liquidity requirements in the short and longer term.
The functional currency for the Company’s subsidiaries in Taiwan is NTD and the functional currency for the Company’s subsidiaries and CAE in PRC is RMB. The financial statements of the Company are in USD. The fluctuation of NTD and RMB exchange rates will affect the Company’s operating results expressed in USD. The Company reviews its foreign currency exposures, and the management does not consider its present foreign exchange risk to be significant.
28
NOTE 2315 – RECLASSIFICATIONS
The effects of the reclassifications for the prior year is reflected below.
| Consolidated Balance Sheet | December 31, 2016 | |||
| Original: | ||||
| Cash and cash equivalents | $ | 25,521,802 | ||
| Revised: | ||||
| Cash and cash equivalents | $ | 20,169,455 | ||
| Time deposits | 5,352,347 | |||
Unaudited Condensed Consolidated Statements of Cash Flow | Nine Months Ended September 30, 2016 | |||
| Original: | ||||
| Net cash used in investing activities | $ | (960,166 | ) | |
| Foreign currency translation | 942,171 | |||
| Net increase (decrease) in cash and cash equivalents | 3,975,267 | |||
| Cash and cash equivalents, beginning balance | 20,831,824 | |||
| Cash and cash equivalents, ending balance | 24,807,091 | |||
| Revised: | ||||
| Cash flows from investing activities: | ||||
| Purchases of time deposits | $ | (7,095,147 | ) | |
| Proceeds from maturities of time deposits | 8,025,394 | |||
| Net cash used in investing activities | (29,919 | ) | ||
| Foreign currency translation | 596,891 | |||
| Net increase (decrease) in cash and cash equivalents | 4,560,234 | |||
| Cash and cash equivalents, beginning balance | 13,083,357 | |||
| Cash and cash equivalents, ending balance | 17,643,591 | |||
NOTE 24 – FAIR VALUE MEASUREMENT
FASB ASC 820, “Fair Value Measurements and Disclosures,” defines Fair Value (“FV”), establishes a three-level valuation hierarchy for disclosures of FV measurement and enhances disclosure requirements for FV measures. The carrying amounts reported in the balance sheets for receivables and current liabilities each qualify as financial instruments and are reasonable estimates of FV because of the short period of time between the origination of such instruments and their expected realization and their current market rate of interest. The three levels are defined as follows:
• Level 1 inputs to the valuation methodology are quoted prices (unadjusted) for identical assets or liabilities in active markets.
• Level 2 inputs to the valuation methodology include quoted prices for similar assets and liabilities in active markets, and inputs that are observable for the assets or liabilities, either directly or indirectly, for substantially the full term of the financial instruments.
• Level 3 inputs to the valuation methodology are unobservable and significant to the FV.
The following table presents the fair value and carrying value of the Company’s financial assets and liabilities as of September 30, 2017:
| Fair Value | Carrying | |||||||||||||||
| Level 1 | Level 2 | Level 3 | Value | |||||||||||||
| Assets | ||||||||||||||||
| Bank time deposits | $ | - | $ | 21,475,432 | $ | - | $ | 21,475,432 | ||||||||
| Marketable securities: | ||||||||||||||||
| Funds | 32,867 | - | - | 32,867 | ||||||||||||
| Structured deposit | - | 1,205,162 | - | 1,205,162 | ||||||||||||
| Loan receivable (Other current assets in Notes 6) | - | - | 1,477,060 | 1,477,060 | ||||||||||||
| Long-term investment: | ||||||||||||||||
| Equity investment | - | - | 1,288,279 | 1,267,475 | ||||||||||||
| Government bonds | - | 101,475 | - | 101,475 | ||||||||||||
| Liabilities | ||||||||||||||||
| Due to related parties | $ | - | $ | - | $ | 646,862 | $ | 646,862 | ||||||||
| Convertible bonds | - | - | 200,000 | 200,000 | ||||||||||||
| Long-term loans | - | - | 265,985 | 265,985 | ||||||||||||
The following table presents the fair value and carrying value of the Company’s financial assets and liabilities as of December 31, 2016:
| Fair Value | Carrying | |||||||||||||||
| Level 1 | Level 2 | Level 3 | Value | |||||||||||||
| Assets | ||||||||||||||||
| Bank time deposits | $ | - | $ | 7,808,058 | $ | - | $ | 7,808,058 | ||||||||
| Marketable securities: | ||||||||||||||||
| Stocks | 38,763 | - | - | 38,763 | ||||||||||||
| Funds | 2,388,107 | - | - | 2,388,107 | ||||||||||||
| Loan receivable (Other current assets in Notes 6) | - | - | 1,486,846 | 1,486,846 | ||||||||||||
| Long-term investment: | ||||||||||||||||
| Equity investment | - | - | 1,288,279 | 1,190,558 | ||||||||||||
| Government bonds | - | 94,506 | - | 94,506 | ||||||||||||
| Liabilities | ||||||||||||||||
| Due to related parties | $ | - | $ | - | $ | 400,001 | $ | 400,001 | ||||||||
| Convertible bonds | - | - | 200,000 | 200,000 | ||||||||||||
| Long-term loans | - | - | 254,907 | 254,907 | ||||||||||||
Bank time deposits – The carrying amount approximates its fair value due to short-term in nature of the bank time deposits.
Marketable securities – The fair value of stocks and funds is generally valued based on quoted market prices in active markets.
Structured deposit – The fair value of the structured deposit is determined based on present value of the structured deposit, using annum yield of 3.9% or 4.1%, depending on the strike price. The strike price is at 7.3 USDCNH.
Loan receivable – The Company’s loan receivable is determined based on 4.5% per annum interest rate on the recent lending to Rich Fountain Limited.
Equity investment – The fair value of the Company’s equity investment was arrived at using the “Income Approach.” The calculation assumptions were: (i) 2% for long-term stable growth rate, (ii) 14.79%~15% for cash discount rate (rate for weighted average cost of capital), and (iii) 25% for liquidity discount rate. The Company evaluated overall economic condition and unnoted any significant change. The related equity investment does not have any negative news. Therefore, the fair value of the Company’s equity investment as of September 30, 2017 is same as December 31, 2016.
Government bonds – The fair value of government bonds is valued based on theoretical bond price in Taipei Exchange (formerly the Gre Tai Securities Market).
Due to related parties – The Company’s due to related parties bears no interest and payable on demand.
Convertible bonds – The Company determined the fair value of the convertible bonds is 80% of the average closing trading price for the ten (10) business days immediately prior to the conversion date.
Long-term loans - The fair value of the Company’s long-term loans were determined by discounted cash flows.
NOTE 25 – GEOGRAPHICAL DATA
SEGMENT REPORTING
The geographical distributiondistributions of the Company’sCompany's financial information for the three months ended September 30, 20172020 and 20162019 were as follows:
| | | | | | |
| | Three Months Ended September 30, | ||||
Geographical Areas |
| 2020 |
| 2019 | ||
Revenue | | | | | | |
Taiwan | | $ | 31,677,340 | | $ | 21,053,131 |
PRC | |
| 1,801,064 | |
| 1,965,552 |
Hong Kong | |
| 124,879 | |
| 248,152 |
Elimination adjustment | |
| (367,331) | |
| 17 |
Total revenue | | $ | 33,235,952 | | $ | 23,266,852 |
| | | | | | |
Income from operations | |
| | |
| |
Taiwan | | $ | 3,983,680 | | $ | 3,181,981 |
PRC | |
| 156,417 | |
| 45,213 |
Hong Kong | |
| 72,425 | |
| 179,428 |
Elimination adjustment | |
| 1,123,267 | |
| 34,188 |
Total income from operations | | $ | 5,335,789 | | $ | 3,440,810 |
| | | | | | |
Net income | |
| | |
| |
Taiwan | | $ | 3,743,338 | | $ | 2,180,558 |
PRC | |
| 191,636 | |
| 62,290 |
Hong Kong | |
| 87,896 | |
| 151,941 |
Elimination adjustment | |
| 41,033 | |
| 4,792 |
Total net income | | $ | 4,063,903 | | $ | 2,399,581 |
| For three months ended September 30, | ||||||||
| Geographical Areas | 2017 | 2016 | ||||||
| Revenue | ||||||||
| Taiwan | $ | 13,290,282 | $ | 12,714,857 | ||||
| PRC | 2,885,940 | 2,182,967 | ||||||
| Hong Kong | 33,633 | 71,079 | ||||||
| Elimination adjustment | 479 | (17,558 | ) | |||||
| Total revenue | $ | 16,210,334 | $ | 14,951,345 | ||||
| Income (loss) from operations | ||||||||
| Taiwan | $ | 2,348,757 | $ | 1,661,872 | ||||
| PRC | 284,662 | (75,861 | ) | |||||
| Hong Kong | (21,353 | ) | 1,822 | |||||
| Elimination adjustment | 35,487 | 37,848 | ||||||
| Total income (loss) from operations | $ | 2,647,553 | $ | 1,625,681 | ||||
| Depreciation and amortization expenses | ||||||||
| Taiwan | $ | 117,019 | $ | 130,343 | ||||
| PRC | 21,415 | 22,180 | ||||||
| Hong Kong | 71 | 72 | ||||||
| Elimination adjustment | - | - | ||||||
| Total depreciation and amortization expenses | $ | 138,505 | $ | 152,595 | ||||
| Interest income | ||||||||
| Taiwan | $ | 101,919 | $ | 38,959 | ||||
| PRC | 45 | (2,254 | ) | |||||
| Hong Kong | - | (1 | ) | |||||
| Elimination adjustment | (22,665 | ) | (5,591 | ) | ||||
| Total interest income | $ | 79,299 | $ | 31,113 | ||||
| Interest expenses | ||||||||
| Taiwan | $ | 25,665 | $ | 8,965 | ||||
| PRC | 5,293 | (1,773 | ) | |||||
| Hong Kong | - | - | ||||||
| Elimination adjustment | (22,665 | ) | (5,591 | ) | ||||
| Total interest expenses | $ | 8,293 | $ | 1,601 | ||||
| Income tax expense | ||||||||
| Taiwan | $ | 707,676 | $ | 456,849 | ||||
| PRC | 129,257 | (21 | ) | |||||
| Hong Kong | (5,055 | ) | - | |||||
| Elimination adjustment | - | - | ||||||
| Total income tax expense | $ | 831,878 | $ | 456,828 | ||||
| Net income (loss) | ||||||||
| Taiwan | $ | 1,877,187 | $ | 1,298,707 | ||||
| PRC | 115,800 | (88,813 | ) | |||||
| Hong Kong | (17,621 | ) | 10,781 | |||||
| Elimination adjustment | 1,771 | 2,571 | ||||||
| Total net income (loss) | $ | 1,977,137 | $ | 1,223,246 | ||||
The geographical distributiondistributions of the Company’s financial information for the nine months ended September 30, 20172020 and 20162019 were as follows:
| | | | | | |
| | Nine Months Ended September 30, | ||||
Geographical Areas |
| 2020 |
| 2019 | ||
Revenue | | | | | | |
Taiwan | | $ | 87,096,588 | | $ | 57,036,548 |
PRC | |
| 4,978,500 | |
| 6,749,851 |
Hong Kong | |
| 244,065 | |
| 671,061 |
Elimination adjustment | |
| (1,118,237) | |
| (7,466) |
Total revenue | | $ | 91,200,916 | | $ | 64,449,994 |
| | | | | | |
Income from operations | |
| | |
| |
Taiwan | | $ | 6,051,545 | | $ | 7,112,388 |
PRC | |
| 126,864 | |
| 325,018 |
Hong Kong | |
| 104,817 | |
| 426,774 |
Elimination adjustment | |
| 1,257,593 | |
| 104,363 |
Total income from operations | | $ | 7,540,819 | | | 7,968,543 |
| | | | | | |
Net income | |
| | |
| |
Taiwan | | $ | 4,874,683 | | $ | 5,666,549 |
PRC | |
| 155,885 | |
| 329,141 |
Hong Kong | |
| 120,907 | |
| 364,074 |
Elimination adjustment | |
| 83,911 | |
| 11,099 |
Total net income | | $ | 5,235,386 | | $ | 6,370,863 |
| For nine months ended September 30, | ||||||||
| Geographical Areas | 2017 | 2016 | ||||||
| Revenue | ||||||||
| Taiwan | $ | 41,667,540 | $ | 37,093,407 | ||||
| PRC | 8,321,471 | 6,086,426 | ||||||
| Hong Kong | 106,147 | 148,664 | ||||||
| Elimination adjustment | (10,474 | ) | (39,384 | ) | ||||
| Total revenue | $ | 50,084,684 | $ | 43,289,113 | ||||
| Income (loss) from operations | ||||||||
| Taiwan | $ | 7,652,886 | $ | 4,549,826 | ||||
| PRC | 447,690 | (765,421 | ) | |||||
| Hong Kong | (59,649 | ) | (12,491 | ) | ||||
| Elimination adjustment | 101,934 | 100,198 | ||||||
| Total income (loss) from operations | $ | 8,142,861 | $ | 3,872,112 | ||||
| Depreciation and amortization expenses | ||||||||
| Taiwan | $ | 343,413 | $ | 392,943 | ||||
| PRC | 66,965 | 62,224 | ||||||
| Hong Kong | 215 | 216 | ||||||
| Elimination adjustment | - | - | ||||||
| Total depreciation and amortization expenses | $ | 410,593 | $ | 455,383 | ||||
| Interest income | ||||||||
| Taiwan | $ | 302,630 | $ | 150,772 | ||||
| PRC | 2,314 | 1,408 | ||||||
| Hong Kong | - | - | ||||||
| Elimination adjustment | (58,385 | ) | (14,958 | ) | ||||
| Total interest income | $ | 246,559 | $ | 137,222 | ||||
| Interest expenses | ||||||||
| Taiwan | $ | 67,385 | $ | 19,920 | ||||
| PRC | 15,562 | 6,203 | ||||||
| Hong Kong | - | - | ||||||
| Elimination adjustment | (58,385 | ) | (14,958 | ) | ||||
| Total interest expenses | $ | 24,562 | $ | 11,165 | ||||
| Income tax expense | ||||||||
| Taiwan | $ | 2,133,024 | $ | 1,332,238 | ||||
| PRC | 217,178 | 3,093 | ||||||
| Hong Kong | (5,055 | ) | - | |||||
| Elimination adjustment | - | - | ||||||
| Total income tax expense | $ | 2,345,147 | $ | 1,335,331 | ||||
| Net income (loss) | ||||||||
| Taiwan | $ | 6,382,356 | $ | 3,678,408 | ||||
| PRC | 170,408 | (781,726 | ) | |||||
| Hong Kong | (70,562 | ) | (13,882 | ) | ||||
| Elimination adjustment | 4,762 | 6,456 | ||||||
| Total net income (loss) | $ | 6,486,964 | $ | 2,889,256 | ||||
29
The geographical distribution of the Company’s financial information as of September 30, 20172020 and December 31, 20162019 were as follows:
| As of | ||||||||||||||
| | | | | | | ||||||||
| Geographical Areas | September 30, 2017 | December 31, 2016 |
| September 30, 2020 |
| December 31, 2019 | ||||||||
| Capital expenditures | ||||||||||||||
| Taiwan | $ | (317,455 | ) | $ | (835,564 | ) | ||||||||
| PRC | (29,234 | ) | (148,936 | ) | ||||||||||
| Hong Kong | - | - | ||||||||||||
| Total capital expenditures | $ | (346,689 | ) | $ | (984,500 | ) | ||||||||
| Long-lived assets | | | | | | | ||||||||
| Taiwan | $ | 1,508,431 | $ | 1,453,772 | | $ | 2,076,095 | | $ | 1,280,728 | ||||
| PRC | 165,811 | 256,704 | |
| 101,162 | |
| 124,443 | ||||||
| Hong Kong | 430 | 648 | |
| 1,794 | |
| 602 | ||||||
| Elimination adjustment | 3,746,163 | 2,071,491 | |
| (3,007) | |
| (2,907) | ||||||
| Total long-lived assets | $ | 3,746,163 | $ | 3,782,615 | | $ | 2,176,044 | | $ | 1,402,866 | ||||
| | | | | | | ||||||||
| Reportable assets | |
| | |
| | ||||||||
| Taiwan | $ | 89,208,044 | $ | 90,388,991 | | $ | 161,018,794 | | $ | 144,663,045 | ||||
| PRC | 11,748,446 | 13,325,433 | |
| 12,863,362 | |
| 12,349,634 | ||||||
| Hong Kong | 434,808 | 561,708 | |
| 892,496 | |
| 800,746 | ||||||
| Elimination adjustment | (50,258,436 | ) | (52,868,589 | ) | |
| (76,446,594) | |
| (68,571,003) | ||||
| Total reportable assets | $ | 51,132,862 | $ | 51,407,543 | | $ | 98,328,058 | | $ | 89,242,422 | ||||
| | | | | | | ||||||||
Capital investment | |
| | |
| | ||||||||
Taiwan | | $ | 1,239,610 | | $ | 602,442 | ||||||||
PRC | |
| 9,175 | |
| 57,569 | ||||||||
Hong Kong | |
| 1,576 | |
| — | ||||||||
Total capital investments | | $ | 1,250,361 | | $ | 660,011 | ||||||||
NOTE 26 – LOAN TO SHAREHOLDERS
Anhou Registered Capital Increase
On April 27, 2013, China Insurance Regulatory Commission mandated any insurance agency have a minimum registered capital requirement of RMB50 million (approximately $ 8 million). At the time, Anhou, a professional insurance agency with a PRC nationwide license, had a registered capital of RMB10 million (approximately $ 1.6 million). To better implement its expansion strategies, Anhou intends to increase its registered capital to RMB50 million so that it can set up new branches in any province beyond its current operations in the PRC.
Due to certain restriction on direct foreign investment in insurance agency business under current PRC legal requirements, Anhou sought investments from certain Investor Borrowers, as defined below in Item 2 of this part, who in turn needed funds through individual loans.
On June 9, 2013, AHFL entered into a loan agreement with ZLI Holdings, whereby AHFL agreed to provide a loan to ZLI Holdings of RMB40 million ($6,389,925). The term for such loan is 10 years which may be extended upon the agreement of the parties. The loan was remitted to ZLI Holdings on August 30, 2013. In August 2013, ZLI Holdings entered into three loan agreements (“Investor Loan Agreements”) with the following independent third parties, collectively, the Investor Borrowers:
The term for the above loans is 10 years which may be extended upon the agreement of the parties. Pursuant to the Investor Loan Agreements, each of the Investor Borrowers entered into a binding variable interest entity (“VIE”) agreement with Anhou, CU WFOE and certain existing shareholders of Anhou. The proceeds received from the said loans by the Investor Borrowers were solely used to increase the registered capital of Anhou. On October 20, 2013, the Investor Borrowers increased Anhou’s registered capital by RMB 40 million ($6,389,925).
NOTE 2716 – SUBSEQUENT EVENTS
The Company does not receive the full remaining principle repayment of loan receivable from RFL. On November 1 and November 2, 2017, the Company received the interest payment of this loan amount of NTD 300,000 (approximately $9,800) and $23,832, respectively. The management has evaluated RFL's business operation and ability to repay the loan in the future and determine that RFL will be able to repay the loan per newly negotiated terms and assessed that there is no impairment loss on the loan. Therefore, the Company is willing to extend the payment period of RFL loan.
The Company has evaluated all other subsequent events through the date these condensed consolidated financial statements were issued and determineddetermine that there were no subsequent events or transactions that require recognition or disclosures in the condensed consolidated financial statements.
30
ITEM 2. MANAGEMENT’S DISCUSSION AND ANALYSIS OF FINANCIAL CONDITIONS AND RESULTS OF OPERATIONS.
The following discussion of the results of operations and financial condition should be read in conjunction with our condensed consolidated financial statements and notes thereto included in Item 1 of this part.report. This report, including the information incorporated by reference, contains forward-looking statements as defined in the Private Securities Litigation Reform Act of 1995. The use of any of the words “believe,” “expect,” “anticipate,” “plan,” “estimate,” and similar expressions are intended to identify such statements. Forward-looking statements include statements concerning our possible or assumed future results. The actual results that we achieve may differ materially from those discussed in such forward-looking statements due to the risks and uncertainties described in the Risk Factors section of this report, in Management’s Discussion and Analysis of Financial Condition and Results of Operations, and in other sections of this report, as well as in our annual report on Form 10-K. We undertake no obligation to update any forward-looking statements.
Overview
The Company primarily provides two broad categories of insurance products, life insurance products and property and casualty insurance products, in Taiwan and PRC.People’s Republic of China (“PRC”). The Company also provides reinsurance brokerage services and insurance consulting services in Hong Kong and Taiwan. The revenue from ourpercentage of reinsurance brokerage services and insurance consulting services accounts foris less than 1% of our total revenue. The insurance products that the Company’s subsidiaries sell isare underwritten by some of the leading insurance companies in Taiwan and PRC, respectively.
(1) | Life Insurance Products |
Total net revenue from Taiwan life insurance products accounted for 74.01%89.9% and 80.25%84.8% of total net revenue for the three months ended September 30, 2020 and 2019, respectively. Total net revenue from PRC life insurance products accounted for 4.5% and 7.5% of total net revenue for the three months ended September 30, 2020 and 2019, respectively.
Total net revenue from Taiwan life insurance products accounted for 89.7% and 82.3% of total net revenue for the nine months ended September 30, 20172020 and 2016,2019, respectively. Total net revenue from PRC life insurance products were 15.67%accounted for 4.9% and 12.43%9.7% of total net revenue for the nine months ended September 30, 20172020 and 2016,2019, respectively.
In addition to the periodic premium payment schedules, most of the individual life insurance products we distribute also allow the insured to choose to make a single, lump-sum premium payment at the beginning of the policy term. If the insured adopts a periodic payment schedule, is adopted by the insured, a life insurance policy can generate periodic paymentpayments of fixed premiums to the insurance company for a specified period of time. This means that once the Company sells a life insurance policy with a periodic premium payment schedule, theyit will be able to derivegenerate commission and fee incomeincomes from that policy for an extended period of time, sometimes up to twenty-five (25)25 years. Because of this feature and the expected sustained growth of life insurance sales in ChinaPRC and Taiwan, we have focused significant resources ever since the incorporation of Anhou and Law Broker on developing our capability to distribute individual life insurance products with periodic payment schedules.schedules ever since the incorporation of Anhou and Law Broker. We expect that sales of life insurance products will continuously be our primary source of revenue in the next several years.
(2) | Property and Casualty Insurance Products |
Taiwan subsidiaries commenced sale of automobile insurance, casualty insurance and liability insurance business in August 2003. Total net revenue from Taiwan property and casualty insurance products were 5.66%accounted for 4.3% and 5.34%5.4% of total net revenue for the three months ended September 30, 2020 and 2019, respectively. Total net revenue from Taiwan property and casualty insurance products accounted for 4.6% and 5.8% of total net revenue for the nine months ended September 30, 20172020 and 2016,2019, respectively. Our CAE in PRC commenced its sales
31
In January 2020, the World Health Organization declared an outbreak of the coronavirus (COVID-19) to be a Public Health Emergency of International Concern, subsequently declared COVID-19 a global pandemic, and developed its automobile insurancerecommended containment and mitigation measures worldwide on March 11, 2020. We had experienced some adverse impacts on our business in 2010. Total revenue fromthe PRC propertySegment, such as limited access to our staff in the PRC in the beginning of the outbreak and casualty insurance products were 0.93%restrictions on business travel within the PRC and 1.63%between Taiwan and the PRC. Even though the operations in the PRC segment fully resumed in the second quarter of total revenue for2020, the nine months ended September 30, 2017pandemic has created global economic uncertainties and 2016, respectively.led to negative impact on the financial markets. The extent of the COVID-19 impact to the Company will depend on numerous factors and developments related to COVID-19. Consequently, any potential impacts of COVID-19 remain highly uncertain and cannot be predicted with confidence.
Critical Accounting Policies and Estimates
A critical accounting policy is one that is both important to the portrayal of our financial condition and results of operation and requires our management’s most difficult, subjective or complex judgments, often as a result of the need to make estimates about the effect of matters that are inherently uncertain. Our significant accounting policies are described in Note 2 of “Summary of Significant Accounting Policies” to the Financial Statements for the Nine Months Ended September 30, 2020, included within our 2016 AnnualPeriodic Report on Form 10-K filed with the Securities and Exchange Commission.10-Q. Following is a discussion of the accounting policies that we believe involve the most difficult, subjective or complex judgments and estimates.
Accrued Expenses
Commissions Payable to Sales Professionals
As part of the process of preparing our financial statements, we are required to estimate accrued expenses.commissions payable to sales professionals. The estimation basis of the majority of the accrued expensescommissions payable is dependent on our sales force’s achievement of the sales targets identified by our clients. Examples of estimated accrued expensescommissions payable include brokerage commission bonus, such as bonus payable to our sales professionals,agents, and incentive program rewards, such as the estimated expenditures to fund the reward programs. We develop estimates of liabilities using our judgment based upon the facts and circumstances known at the time.
Long-term investments
Revenue Recognition
The Company’s revenue is derived from insurance agency and brokerage services. The Company, classifiesthrough its investmentssubsidiaries and variable interest entities, sells insurance products provided by insurance companies to individuals, and is compensated in the form of commissions from the respective insurance companies, according to the terms of each service agreement made by and between the Company and the insurance companies.
We recognize revenue when control over services provided by the Company is transferred to the respective insurance company, whereby the transfer of control is considered complete when a policy becomes effective. When a policy is effective, the insurance company is obligated to pay the agreed-upon commission to the Company under the terms of its service agreement with the Company and such commission is recognized as available-for-salerevenue. Variable or contingent consideration is recognized when we conclude that is it probable that a significant reversal of revenue will not probably occur in accordancesubsequent periods.
Leases
We adopted the new lease standard as of January 1, 2019 using a modified retrospective transition with ASC 320 “Debtno adjustment to its comparative periods in the year of transition. The Company has operating leases for its offices. We determine if an arrangement is a lease at inception of the contract and Equity Securities,”whether a contract is or contains a lease by determining whether it conveys the right to control the use of the identified asset for a period of time. If the contract provides us the right to substantially all of the economic benefits from the use of the identified asset and Investments – Debtthe right to direct the use of the identified asset, we consider it to be, or contain, a lease. For leases with an initial term terms greater than 12 months, we record a right-of-use asset and Equity Securitiesa corresponding lease liability based on the present value of the minimum lease payments. The lease term used in the calculation of right-of-use assets and lease liabilities renewal and termination options that are reportedreasonably certain to be exercised. Our leases do not provide an implicit borrowing rate, and we estimate the Company’s incremental borrowing rate to discount the lease payments based on information available at fair value. Unrealized gains and losses as a resultlease commencement.
32
Stock-Based Compensation
We estimate the fair value of share-based awards to nonemployees on the available-for-sale investmentsdate of grant using the Black-Scholes options pricing model, which requires a number of assumptions, of which the most significant are recorded as a separate component within accumulated other comprehensive income inexpected volatility and the accompanying consolidated balance sheets.expected option term. Compensation costs for awards granted to non-employees were nil and $1.6 million for the three and nine months ended September 30, 2020 and nil for the three and nine months ended September 30, 2019.
The Company uses the cost method of accounting for investments in companies that do not have a readily determinable fair value in which it holds an interest of less than 20% and over which it does not have the ability to exercise significant influence. Investments are considered to be impaired when a decline in fair value is judged to be other-than-temporary. Once a decline in fair value is determined to be other-than-temporary, an impairment charge is recorded and a new cost basis in the investment is established.
Recent Accounting Pronouncements
Refer to Note 2, Summary of Significant Accounting Policies, of our condensed consolidated financial statements for a discussion of recent accounting pronouncements and their effect, if any.
Overview of the three months ended September 30, 20172020 and 2016
2019
The following table shows the results of operations for the three months ended September 30, 20172020 and 2016:2019:
| | | | | | | | | | | | | |
| | | | | | | | | | | |
| |
| | Three Months Ended September 30, | | | | | | | | ||||
| | 2020 | | 2019 | | | | | | | | ||
(Amount in USD) |
| | (Unaudited) |
| | (Unaudited) |
| Change |
| Percent |
| | |
Revenue | | $ | 33,235,952 | | $ | 23,266,852 | | $ | 9,969,100 |
| 42.8 | % | |
Cost of revenue | |
| 21,269,044 | |
| 14,374,811 | |
| 6,894,233 |
| 48.0 | % | |
Gross profit | |
| 11,966,908 | |
| 8,892,041 | |
| 3,074,867 |
| 34.6 | % | |
Gross profit margin | |
| 36.0 | % |
| 38.2 | % |
| (2.2) | % | (5.8) | % | |
| | | | | | | | | | | | | |
Operating expenses: | |
| | |
| | |
| |
| | | |
Selling | |
| 926,004 | |
| 744,429 | |
| 181,575 |
| 24.4 | % | |
General and administrative | |
| 5,705,115 | |
| 4,706,802 | |
| 998,313 |
| 21.2 | % | |
Total operating expenses | |
| 6,631,119 | |
| 5,451,231 | |
| 1,179,888 |
| 21.6 | % | |
| | | | | | | | | | | | | |
Income from operations | |
| 5,335,789 | |
| 3,440,810 | |
| 1,894,979 |
| 55.1 | % | |
| | | | | | | | | | | | | |
Other income (expenses): | |
| | |
| | |
| |
| | | |
Interest income | |
| 100,266 | |
| 138,408 | |
| (38,142) |
| (27.6) | % | |
Interest expenses | |
| (33,443) | |
| (64,372) | |
| 30,929 |
| (48.0) | % | |
Dividend income | |
| 2,368 | |
| (720) | |
| 3,088 |
| (428.9) | % | |
Other – net | |
| 23,648 | |
| (180,560) | |
| 204,208 |
| (113.1) | % | |
Total other income (expenses), net | |
| 92,839 | |
| (107,244) | |
| 200,083 |
| (186.6) | % | |
| | | | | | | | | | | | | |
Income before income taxes | |
| 5,428,628 | |
| 3,333,566 | |
| 2,095,062 |
| 62.8 | % | |
Income tax expense | |
| (1,364,725) | |
| (933,985) | |
| (430,740) |
| 46.1 | % | |
| | | | | | | | | | | | | |
Net income | |
| 4,063,903 | |
| 2,399,581 | |
| 1,664,322 |
| 69.4 | % | |
Less: net income attributable to the noncontrolling interests | |
| (1,277,587) | |
| (1,071,427) | |
| (206,160) |
| 19.2 | % | |
Net income attributable to the Company’s shareholders | | $ | 2,786,316 | | $ | 1,328,154 | | $ | 1,458,162 |
| 109.8 | % | |
| Three Months Ended September 30, | ||||||||||||||||
| 2017 | 2016 | |||||||||||||||
| (Unaudited) | (Unaudited) | Change | Percent | |||||||||||||
| Revenue | $ | 16,210,334 | $ | 14,951,345 | $ | 1,258,989 | 8 | % | ||||||||
| Cost of revenue | 9,071,624 | 9,335,735 | (264,111 | ) | -3 | % | ||||||||||
| Gross profit | 7,138,710 | 5,615,610 | 1,523,100 | 30 | % | |||||||||||
| Gross profit margin | 44 | % | 38 | % | 6 | % | 16 | % | ||||||||
| Operating expenses: | ||||||||||||||||
| Selling | 783,120 | 630,225 | 152,865 | 24 | % | |||||||||||
| General and administrative | 3,708,037 | 3,359,674 | 348,363 | 10 | % | |||||||||||
| Total operating expenses | 4,491,157 | 3,989,929 | 501,228 | 13 | % | |||||||||||
| Income from operations | 2,647,553 | 1,625,681 | 1,021,872 | 63 | % | |||||||||||
| Other income (expenses): | ||||||||||||||||
| Interest income | 79,299 | 31,113 | 48,186 | 155 | % | |||||||||||
| Interest expenses | (8,293 | ) | (1,601 | ) | (6,692 | ) | 418 | % | ||||||||
| Dividend income | 1,391 | 3,633 | (2,242 | ) | -62 | % | ||||||||||
| Other - net | 89,065 | 21,248 | 67,817 | 319 | % | |||||||||||
| Total other income (expenses) | 161,462 | 54,393 | 107,069 | 197 | % | |||||||||||
| Income before income tax | 2,809,015 | 1,680,074 | 1,128,941 | 67 | % | |||||||||||
| Income tax expense | 831,878 | 456,828 | 375,050 | 82 | % | |||||||||||
| Net income | 1,977,137 | 1,223,246 | 753,891 | 62 | % | |||||||||||
| Net income attributable to the noncontrolling interests | 669,490 | 465,501 | 203,989 | 44 | % | |||||||||||
| Net income attributable to parent’s shareholders | 1,307,647 | 757,745 | 549,902 | 73 | % | |||||||||||
33
Revenue
As a distributor of insurance products, we derive our revenue primarily from commissions and fees paid by insurance and reinsurance companies, typically calculated as a percentage of premiums paid by our customers to the insurance and reinsurance companies in among Taiwan, PRC and Hong Kong. We generate revenue primarily through our sales force, which consists of individual sales professionalsagents in our distribution and service network. For the three months ended September 30, 20172020 and 2016,2019, the revenue generated respectively from Taiwan, PRC and Hong Kong is as follows:
| | | | | | | | | | | | |
| | | | |||||||||
| | Three Months Ended September 30, | | |||||||||
Geographic Areas |
| 2020 |
| 2019 |
| Change |
| Percent |
| |||
Revenue |
| |
|
| |
|
| |
|
|
| |
Taiwan segment | | $ | 31,310,008 | | $ | 21,053,148 | | $ | 10,256,860 |
| 48.7 | % |
Percentage of revenue | |
| 94.2 | % |
| 90.5 | % |
| |
| | |
PRC segment | |
| 1,801,065 | |
| 1,965,552 | |
| (164,487) |
| (8.4) | % |
Percentage of revenue | |
| 5.4 | % |
| 8.4 | % |
| |
| | |
Hong Kong segment | |
| 124,879 | |
| 248,152 | |
| (123,273) |
| (49.7) | % |
Percentage of revenue | |
| 0.4 | % |
| 1.1 | % |
| |
| | |
Total revenue | | $ | 33,235,952 | | $ | 23,266,852 | | $ | 9,969,100 |
| 42.8 | % |
| Three months ended September 30, | ||||||||
| Geographical Areas | 2017 | 2016 | ||||||
| Revenue | ||||||||
| Taiwan | $ | 13,290,282 | $ | 12,714,857 | ||||
| PRC | 2,885,940 | 2,182,967 | ||||||
| Hong Kong | 33,633 | 71,079 | ||||||
| Elimination adjustment | 479 | (17,558 | ) | |||||
| Total Revenue | $ | 16,210,334 | $ | 14,951,345 | ||||
DuringOverall revenue from our Taiwan segment increased by $10.3 million from $21.1 million (or 48.7%) for the three months ended September 30, 2017, 82.0%, 17.8% and 0.2% of our revenue in our unaudited consolidated financial statements were derived from Taiwan, PRC and Hong Kong, respectively. During2019 to $31.3 million for the three months ended September 30, 2016, 85.0%, 14.6%2020.
Our revenue growth in Taiwan Segment continues to be affected by our acquisition of Uniwill and 0.4%a reduction of the interest rate of insurance liability reserves. The positioning of Uniwill is to target those high-net-worth individual customers with strategies to sell investment-type insurance policies. As a result, Uniwill was able to contribute $6.4 million of the increased revenue during the three months ended September 30, 2020. The reduction in the interest rate of insurance liability reserves, effective from July 1, 2020, had boosted sales in insurance policies since we estimated that insurance premiums would increase about 10% to 30% after the rate reduction, and individual customers would lock in the policies before the fee increases. We continue to benefit from the reduction of the interest rate because a number of insurance policies previously locked in became effective during the three months ended September 30, 2020.
Overall revenue from our PRC segment decreased by $0.2 million (or 8.4%) to $1.8 million for the three months ended September 30, 2020 from $2.0 million for the three months ended September 30, 2019. The decrease was due to falling demand in insurance products as a result of a slow recovery in the PRC after being affected by COVID-19 in the PRC.
The revenue in our unaudited consolidated financial statements werethe Hong Kong Segment primarily derived from reinsurance commission on sales of insurance products from other insurers to Taiwan PRC andLife Insurance Co., Ltd. (“Taiwan Life”) for risk management. Overall revenue from our Hong Kong respectively.segment decreased by $0.1 million (or 49.7%) from $0.2 million for the three months ended September 30, 2019 to $0.1 million for the three ended September 30, 2020. The percentagedecrease was because some of geographicalthe insurance policies reinsured by our subsidiary in Hong Kong had expired and there was no new insurance products under reinsurance arrangements for the three months ended September 30, 2020.
Cost of revenue and gross profit
The cost of revenue mainly consists of commissions paid to our sales professionals. The cost of revenue for the three months ended September 30, 2017 and 2016 were relatively consistent.
Total revenue2020 increased by $1,258,989, or 8%$6.9 million (or 48.0%), from $14,951,345to $21.2 million compared to $14.4 million for the three months ended September 30, 20162019. This increase was primarily due to $16,210,334our increasing revenues from the first-year commissions and our commission policy, which provides more incentives to our sales professionals in order to improve the achievement rate for the first-year commissions. The growth in the revenue resulted in increases in our commission costs due to the high achievement rates of the sales targets.
Consequently, the cost of revenue increased more than the proportional increase of revenue, causing a decline in the gross profit margin from 38.2% for the three months ended September 30, 2017, was mainly due2019 to the increase of the revenue from Strategic Alliance Agreement with AIATW in Taiwan and annuity insurance in PRC. Increase of revenue in PRC is mainly due to public awareness of financial planning and investment for retirement as average life span and individual economy has significantly increased over the recent years. Moreover, in anticipation of the possible adjustment on the max premium payment and the proposed change to the annuity insurance regulation in the PRC, the consumers are willing to invest their money in insurance products during the three months ended September 30 of this year compared to the same period of last year.
Cost of revenue and gross profit
The cost of revenue decreased by $264,111, or 3%, from $9,335,73536.0% for the three months ended September 30, 2016 to $9,071,624 for the three months ended September 30, 2017. The increase in gross profit was primarily due a decrease in direct cost, such as the bonuses and awards to sales professionals.2020.
The gross profit for the three months ended September 30, 2017 increased by $1,523,100 or 30%, to $7,138,710 compared to $5,615,610 for the three months ended September 30, 2016. The gross profit ratio increased to 44% for the three months ended September 30, 2017 from 38% for the three months ended September 30, 2016. The increase in gross profit was primary due to the increase in business promotion revenue from AIATW and decrease in indirect cost.
34
Selling expenses
Selling expenses were mainly occurred inincurred by Law Broker, representing the expense forin connection with online marketing promotion and selling related expenses.advertising. The selling expense for the three months ended September 30, 20172020 increased by $152,865 or 24%$0.2 million (or 24.4%), to $783,120$0.9 million, compared to $630,255$0.7 million for the three months ended September 30, 2016.2019. The increase was mainly duerelated to increasedcertain business conferences held to motivate our sales conference fee.
professionals during this quarter. In addition, with the acquisition of Uniwill, the Company incurred more expenses for the Uniwill’s branding for the three months ended September 30, 2020, leading to an increase in our selling expenses compared to the same period of 2019.
General and administrative expenses
The general and administrative (“G&A”) expenses principally comprise of salaries and benefits for our administrative staff, office rental expenses, travel expenses, depreciation and amortization, entertainment expenses, and professional service fees to the auditor and attorney.
our attorneys.
For the three months ended September 30, 2017,2020, G&A expenses were $3,708,037, increased by $348,363, or 10%$5.7 million, an increase of $1.0 million (or 21.2%), compared with $3,359,674$4.7 million for the three months ended September 30, 2016, which was mainly due2019. Increases in G&A expense were attributed to the increased numberincreases in performance bonus to certain employees and officers. In addition, we had incurred more general expenses as a result of branches, personnel costs in Chinathe acquisition and the increased personnel costs in Taiwan.
expansion of Uniwill’s operations.
Other income (expenses)
Other income (expense) mainly consisted of interest income, interest expenses, gain or loss on valuation of financial assets and on foreign exchange. Net other income for the three months ended September 30, 2017 and 2016 were $161,462 and $54,393, respectively. Other income (expense) mainly consists2020 was $0.1 million, an increase of interest income, interest expenses,$0.2 million, compared with the net other income, dividend income and loss on disposalexpense of property, plant and equipment. Compared with0.1 million for the three months ended September 30, 2016,2019. The increases in net other income increasedfor the three months ended September 30, 2020 was due to more unrealized gains on the fluctuationvaluation of exchange ratemarketable securities recognized and less interest income.
expense incurred during this quarter.
Income tax expense
For the three months ended September 30, 2017,2020, income tax expense was $1.4 million, reflecting an increase of 0.4 million (or 46.1%), compared with the income tax expense was $831,878, increased by $375,050, or 82%, compared with $456,828$0.9 million for the three months ended September 30, 2016.2019. The increase was mainly due to the increasedmore income before income tax fortaxes and taxes on undistributed earning accrued because of more revenues generated in the Taiwan Segment during the three months ended September 30, 2017 compared to that for the three months ended September 30, 2016.2020.
35
The Company’s subsidiaries in Taiwan are governed by the Income Tax LawTable of Taiwan, and are generally subject to tax at 17% on income reported in the statutory financial statements after appropriate adjustments. In addition, the Income Tax Law of Taiwan provides that a company is taxed an additional 10% on any undistributed earnings to its shareholders.Contents
CU WFOE and the CAE in the PRC are governed by the Income Tax Law of the PRC concerning the private enterprises, which are generally subject to tax at 25% on income reported in the statutory financial statements after appropriated adjustments, except for Jiangsu. For Jiangsu, according to the requirement of local tax authorities, the tax basis is deemed as 10% of total revenue, instead of net income.
The Company’s subsidiaries in Hong Kong are governed by the Inland Revenue Ordinance Tax Law of Hong Kong, and are generally subject to a profits tax at the rate of 16.5% on the estimated assessable profits.
Overview of the nine months ended September 30, 20172020 and 2016
2019
The following table shows the results of operations for the nine months ended September 30, 20172020 and 2016:2019:
| | | | | | | | | | | | |
| | Nine Months Ended September 30, | | | | | | | ||||
| | 2020 | | 2019 | | | | | | | ||
(Amount in USD) |
| | (Unaudited) |
| | (Unaudited) |
| Change |
| Percent |
| |
Revenue | | $ | 91,200,916 | | $ | 64,449,994 | | $ | 26,750,922 |
| 41.5 | % |
Cost of revenue | |
| 63,261,959 | |
| 41,805,241 | |
| 21,456,718 |
| 51.3 | % |
Gross profit | |
| 27,938,957 | |
| 22,644,753 | |
| 5,294,204 |
| 23.4 | % |
Gross profit margin | |
| 30.6 | % |
| 35.1 | % |
| (4.5) | % | (12.8) | % |
| | | | | | | | | | | | |
Operating expenses: | |
| | |
| | |
| |
| | |
Selling | |
| 1,783,692 | |
| 1,741,372 | |
| 42,320 |
| 2.4 | % |
General and administrative | |
| 18,614,446 | |
| 12,934,838 | |
| 5,679,608 |
| 43.9 | % |
Total operating expenses | |
| 20,398,138 | |
| 14,676,210 | |
| 5,721,928 |
| 39.0 | % |
| | | | | | | | | | | | |
Income from operations | |
| 7,540,819 | |
| 7,968,543 | |
| (427,724) |
| (5.4) | % |
| | | | | | | | | | | | |
Other income (expenses): | |
| | |
| | |
| |
| | |
Interest income | |
| 325,168 | |
| 356,896 | |
| (31,728) |
| (8.9) | % |
Interest expenses | |
| (153,703) | |
| (144,515) | |
| (9,188) |
| 6.4 | % |
Dividend income | |
| 321,603 | |
| 309,903 | |
| 11,700 |
| 3.8 | % |
Other – net | |
| 94,796 | |
| 134,122 | |
| (39,326) |
| (29.3) | % |
Total other income, net | |
| 587,864 | |
| 656,406 | |
| (68,542) |
| (10.4) | % |
| | | | | | | | | | | | |
Income before income taxes | |
| 8,128,683 | |
| 8,624,949 | |
| (496,266) |
| (5.8) | % |
Income tax expense | |
| (2,893,297) | |
| (2,254,086) | |
| (639,211) |
| 28.4 | % |
| | | | | | | | | | | | |
Net income | |
| 5,235,386 | |
| 6,370,863 | |
| (1,135,477) |
| (17.8) | % |
Less: net income attributable to the noncontrolling interests | |
| (2,446,560) | |
| (2,557,603) | |
| 111,043 |
| (4.3) | % |
Net income attributable to the Company’s shareholders | | $ | 2,788,826 | | $ | 3,813,260 | | $ | (1,024,434) |
| (26.9) | % |
| Nine Months Ended September 30, | ||||||||||||||||
| 2017 | 2016 | |||||||||||||||
| (Unaudited) | (Unaudited) | Change | Percent | |||||||||||||
| Revenue | $ | 50,084,684 | $ | 43,289,113 | $ | 6,795,571 | 16 | % | ||||||||
| Cost of revenue | 29,746,059 | 27,986,021 | 1,760,038 | 6 | % | |||||||||||
| Gross profit | 20,338,625 | 15,303,092 | 5,035,533 | 33 | % | |||||||||||
| Gross profit margin | 41 | % | 35 | % | 6 | % | 17 | % | ||||||||
| Operating expenses: | ||||||||||||||||
| Selling | 1,481,423 | 2,094,965 | (613,542 | ) | -29 | % | ||||||||||
| General and administrative | 10,714,341 | 9,336,015 | 1,378,326 | 15 | % | |||||||||||
| Total operating expenses | 12,195,764 | 11,430,980 | 764,784 | 7 | % | |||||||||||
| Income from operations | 8,142,861 | 3,872,112 | 4,270,749 | 110 | % | |||||||||||
| Other income (expenses): | ||||||||||||||||
| Interest income | 246,559 | 137,222 | 109,337 | 80 | % | |||||||||||
| Interest expenses | (24,562 | ) | (11,165 | ) | (13,397 | ) | 120 | % | ||||||||
| Dividend income | 331,140 | 272,522 | 58,618 | 22 | % | |||||||||||
| Other - net | 136,113 | (46,104 | ) | 182,217 | -395 | % | ||||||||||
| Total other income (expenses) | 689,250 | 352,475 | 336,775 | 96 | % | |||||||||||
| Income before income tax | 8,832,111 | 4,224,587 | 4,607,524 | 109 | % | |||||||||||
| Income tax expense | 2,345,147 | 1,335,331 | 1,009,816 | 76 | % | |||||||||||
| Net income | 6,486,964 | 2,889,256 | 3,597,708 | 125 | % | |||||||||||
| Net income attributable to the noncontrolling interests | 1,854,584 | 1,301,226 | 553,358 | 43 | % | |||||||||||
| Net income attributable to parent’s shareholders | 4,632,380 | 1,588,030 | 3,044,350 | 192 | % | |||||||||||
Revenue
As a distributor of insurance products, we derive our revenue primarily from commissions and fees paid by insurance and reinsurance companies, typically calculated as a percentage of premiums paid by our customers to the insurance and reinsurance companies in Taiwan, PRC and Hong Kong. We generate revenue primarily through our sales force, which consists of individual sales professionals in our distribution and service network. For the nine months ended September 30, 20172020 and 2016,2019, the revenuerevenues generated respectively from Taiwan, PRC and Hong Kong isare as follows:
| | | | | | | | | | | | |
| | Nine Months Ended September 30, | | |||||||||
Geographic Areas |
| 2020 |
| 2019 |
| Change |
| Percent |
| |||
Revenue |
| |
|
| |
|
| |
|
|
| |
Taiwan segment | | $ | 85,978,351 | | $ | 57,029,082 | | $ | 28,949,269 |
| 50.8 | % |
Percentage of revenue | |
| 94.3 | % |
| 88.5 | % |
| |
| | |
PRC segment | |
| 4,978,500 | |
| 6,749,851 | |
| (1,771,351) |
| (26.2) | % |
Percentage of revenue | |
| 5.4 | % |
| 10.5 | % |
| |
| | |
Hong Kong segment | |
| 244,065 | |
| 671,061 | |
| (426,996) |
| (63.6) | % |
Percentage of revenue | |
| 0.3 | % |
| 1.0 | % |
| |
| | |
Total revenue | | $ | 91,200,916 | | $ | 64,449,994 | | $ | 26,750,922 |
| 41.5 | % |
| Nine months ended September 30, | ||||||||
| Geographical Areas | 2017 | 2016 | ||||||
| Revenue | ||||||||
| Taiwan | $ | 41,667,540 | $ | 37,093,407 | ||||
| PRC | 8,321,471 | 6,086,426 | ||||||
| Hong Kong | 106,147 | 148,664 | ||||||
| Elimination adjustment | (10,474 | ) | (39,384 | ) | ||||
| Total Revenue | $ | 50,084,684 | $ | 43,289,113 | ||||
36
During the nine months ended September 30, 2017, 83.2%, 16.6% and 0.2%Table of Contents
Overall revenue from our revenue in our unaudited consolidated financial statements were derivedTaiwan segment increased by $28.9 million from Taiwan, PRC and Hong Kong, respectively. During the nine months ended September 30, 2016, 85.7%, 14.1% and 0.3% of our revenue in our unaudited consolidated financial statements were derived from Taiwan, PRC and Hong Kong, respectively. The percentage of geographical revenue$57.0 million (or 50.8%) for the nine months ended September 30, 2017 and 2016 were relatively consistent.
Total revenue increased by $6,795,571, or 16%, from $43,289,1132019 to $86.0 million for the nine months ended September 30, 20162020. The increase was due to $50,084,684the combined effect of the acquisition of Uniwill and an interest rate reduction in insurance liability reserves of life and saving insurances. The positioning of Uniwill is to target those high-net-worth individual customers with strategies to sell investment-type insurance policies. As a result, Uniwill was able to contribute a significant portion of the increased revenue during the nine months ended September 30, 2020. An announcement made by Financial Supervisory Commission Taiwan in November 2019 reducing the interest rate of life and saving insurance liability reserves had continued boosting the customers’ demand in insurance policies. From July 1, 2020, the interest rate of insurance liability reserves was further reduced by 0.25%, which led to an increase in sales because we estimated that insurance premiums would increase about 10% to 30% after the rate reduction.
Overall revenue from our PRC segment decreased by $1.8 million (or 26.2%) to $5.0 million for the nine months ended September 30, 2017, which2020 from $6.7 million for the nine months ended September 30, 2019. Decrease in revenue for the PRC segment was mainly due to the increaseadverse impact on the outbreak of COVID-19 in the PRC that restricted to a significant extent our sales agents’ in-person selling activities. In addition, a slow economic recovery after being affected by COVID-19 led to falling demand in insurance products.
The revenue in the Hong Kong Segment primarily derived from reinsurance commission on sales of insurance products from other insurers to Taiwan Life Insurance Co., Ltd. (“Taiwan Life”) for risk management. Overall revenue from our Hong Kong segment decreased by $0.4 million (or 63.6%) from $0.7 million for the nine months ended September 30, 2019 to $0.2 million for the nine months ended September 30, 2020 as a result of the declining demand in travel insurance products, which led to decreases in our revenue earned from reinsurance arrangements. In addition, certain insurance policies reinsured by our subsidiary in TaiwanHong Kong had expired, and PRCthere was no new insurance products under reinsurance arrangements for the following reasons:
|
nine months ended September 30, 2020.
Cost of revenue and gross profit
The cost of revenue mainly consists of commissions paid to our sales professionals. The cost of revenue for the nine months ended September 30, 20172020 increased by $1,760,038 or 6%$21.5 million (or 51.3%), to $29,746,059$63.3 million compared to $27,986,021$41.8 million for the nine months ended September 30, 2016.2019. This increase was primarily due to our increasing revenues from the first-year commissions and our commission policy, which provides more incentives to our sales professionals to improve the achievement rate for the first-year commissions. The growth in the revenue resulted in the increase in commission costs due to the high achievement rates of the sales targets. In addition, higher costs were incurred due to more sales on investment-type insurance policies, which provide higher commission to sales professionals.
Consequently, the cost of revenue increased was mainly due tomore than the proportional increase of direct commission cost.
Therevenue, causing a decline in the gross profit margin from 35.1% for the nine months ended September 30, 2017 increased by $5,035,533 or 33%,2019 to $20,338,625 compared to $15,303,09230.6% for the nine months ended September 30, 2016. The gross profit ratio increased to 41% for the nine months ended September 30, 2017 from 35% for the nine months ended September 30, 2016. The increase in gross profit was primarily due to an increase in business promotion revenue from AIATW, and the cost of revenue increased accordingly.
2020.
Selling expenses
Selling expenses were mainly occurred inincurred by Law Broker, representing the expense forin connection with online marketing promotion and selling related expense.advertising. The selling expense for the nine months ended September 30, 2017 decreased by $613,542 or 29%2020 was $1.8 million, a slightly increase of 2.4%, to $1,481,423 compared to $2,094,965with the selling expense of $1.7 million for the nine months ended September 30, 2016. The decrease was mainly due to decreased advertising expense. The2019. With the acquisition of Uniwill, the Company is already well known by the public in both Taiwan and China. In that case, we decided to reduce our advertisingincurred more expenses for market promotion.
Uniwill’s branding for the nine months ended September 30, 2020, which led to an increase in our selling expense compared to the same period of 2019.
General and administrative expenses
The G&A expenses are principally comprisecomprised of salaries and benefits for our administrative staff, office rental expenses, travel expenses, depreciation and amortization, entertainment expenses, and professional service fees to the auditor and attorney.
fees.
For the nine months ended September 30, 2017,2020, G&A expenses were $10,714,341, increased by $1,378,326, or 15%$18.6 million, reflecting an increase of $5.7 million (or 43.9%), compared with $9,336,015$12.9 million for the nine months ended September 30, 2016, which was mainly2019. During the nine months ended September 30, 2020, the Company recognized compensation costs of $1.6 million as result of preferred shares granted and issued by Uniwill under the Joint Venture Agreement.
37
In addition, our revenue growth led to increases in performance bonus to employees and offices and the sales taxes. Compared with the same period of 2019, we incurred more professional service fees to outside counsel and SEC-appointed monitor for the Company’s governance and compliance for the nine months ended September 30, 2020. We also incurred more general expenses due to business expansions of Uniwill and accrued penalty and interest expenses related to a tax matter in the increased numberTaiwan Segment during the nine months ended September 30, 2020, whereas the Company did not have such expenses in the same period of branches, personnel costs China and the increased personnel costs, rent and pension in Taiwan.
2019.
Other income (expenses)
Other income (expense) mainly consisted of interest income, interest expenses, gain or loss on valuation of financial assets and on foreign exchange. Net other income for the nine months ended September 30, 20172020 was $689,250 and$0.6 million, reflecting a decrease of $0.1 million (or 10.4%), compared with $0.7 million for the nine months ended September 30, 2019. The decreases in net other income for the nine months ended September 30, 20162020 was $352,475. Other income (expense) mainly consists of interest income, interest expenses, other income, dividend income and loss on disposal of property, plant and equipment. Compared with the nine months ended September 30, 2016, net other income increased due to the fluctuationincrease in interest expense from additional bank borrowings and losses on disposals of the exchange rate and interest income.
equipment.
Income tax expense
For the nine months ended September 30, 2017,2020, income tax expense was $2.9 million, reflecting an increase of $0.6 million (or 28.4%), compared with the income tax expense was $2,345,147, increased by $1,009,816, or 76%, compared with $1,335,331of $2.3 million for the nine months ended September 30, 2016.2019. The increase was mainly due to a supplementary tax payment of $0.3 million related to withholding tax matters and more income taxes and taxes on undistributed earning accrued because of more revenues generated in the increased income before income tax forTaiwan Segment during the nine months ended September 30, 2017 compared to that for the nine months ended September 30, 2016.2020.
The Company’s subsidiaries in Taiwan are governed by the Income Tax Law of Taiwan, and are generally subject to tax at 17% on income reported in the statutory financial statements after appropriate adjustments. In addition, the Income Tax Law of Taiwan provides that a company is taxed an additional 10% on any undistributed earnings to its shareholders.
CU WFOE and the CAE in the PRC are governed by the Income Tax Law of the PRC concerning the private enterprises, which are generally subject to tax at 25% on income reported in the statutory financial statements after appropriated adjustments, except for Jiangsu. For Jiangsu, according to the requirement of local tax authorities, the tax basis is deemed as 10% of total revenue, instead of net income.
The Company’s subsidiaries in Hong Kong are governed by the Inland Revenue Ordinance Tax Law of Hong Kong, and are generally subject to a profits tax at the rate of 16.5% on the estimated assessable profits.
Liquidity and Capital Resources
The following table representspresents a comparison of the net cash provided by operating activities, net cash used in investing activities, and net cash provided by (used in) financing activities for the nine months ended September 30, 20172020 and 2016:2019:
| | | | | | | | | | | | |
|
| Nine Months Ended September 30, |
| |||||||||
|
| 2020 |
| 2019 |
| Change |
| Percent |
| |||
Net cash provided by operating activities | | $ | 4,428,996 | | | 3,757,161 | | | 671,835 |
| 17.9 | % |
Net cash used in investing activities | |
| (8,646,611) | |
| (10,554,055) | |
| 1,907,444 |
| (18.1) | % |
Net cash provided by financing activities | |
| 4,938,811 | |
| 2,114,202 | |
| 2,824,609 |
| 133.6 | % |
| Nine Months Ended September 30, | ||||||||||||||||
| 2017 | 2016 | Change | Percent | |||||||||||||
| Net cash provided by operating activities | $ | 6,137,729 | $ | 4,380,800 | 1,756,929 | 40 | % | |||||||||
| Net cash used in investing activities | (16,065,111 | ) | (29,919 | ) | (16,035,192 | ) | 53595 | % | ||||||||
| Net cash provided by (used in) financing activities | 261,308 | (387,538 | ) | 648,846 | -167 | % | ||||||||||
Operating activities
Net cash provided by operating activities during the nine months ended September 30, 20172020 was $6,137,729, significantly increased$4.4 million in comparison with $4,380,800 net cash of $3.8 million provided by operating activities during the nine months ended September 30, 2016. The increase was mainly due to2019. With continuous growth in business performance for the increase in net income.
nine months ended September 30, 2020, we had more cash inflows from the operating activities.
Investing activities
Net cash used in investing activities was $16,065,111$8.7 million during the nine months ended September 30, 2017, which is mainly due to2020 in comparison with net cash outflows from purchase of structured deposit, time deposits and marketable securities during the period. The net cash$10.6 million used in investing activities was $29,919 for the nine months ended September 30, 2016, which is mainly due2019. Consistent with prior periods, the Company continued investing its excess cash in time deposits, leading to the net cash outflows from purchaseinvesting activities. In addition, we incurred more capital expenditures for business expansions of time deposits, property, plant and equipment and intangible assetsUniwill during the period, which outweighed the maturities of time deposits.
nine months ended September 30, 2020.
Financing activities
Net cash provided by financing activities was $261,308$4.9 million during the nine months ended September 30, 2017, which is the result of proceeds from the Company’s related party borrowings. The2020 in comparison with net cash used inof $2.1 million provided by financing activities during the same period of 2019. The cash inflows from the financing activities was $387,538 formainly due to additional borrowings from commercial banks during the nine months ended September 30, 2016, which is the result2020.
38
Contractual Obligations
There have been no significant changes to the Company’s related parties and third parties.
Related Party Loan and Loans to Unrelated Third Parties
Anhou Registered Capital Increase
On April 27, 2013, the China Insurance Regulatory Commission (“CIRC”) issued the Decision on Revising the Provisions of the Supervision and Administration of Specialized Insurance Agencies (the “Decision on Revising the Agency Provisions”), pursuant to which, CIRC mandated any insurance agency established subsequent to the Decision on Revising the Agency Provisions to meet a minimum registered capital requirement of RMB50 million (approximately $8 million). On May 16, 2013, CIRC issued Notice for Further Clarification on Related Issues of Access to Professional Insurance Intermediary Market (the “Notice”), pursuant to which, professional insurance agencies established prior to the issuance of the Decision on Revising the Agency Provisions, with registered capital less than RMB50 million (approximately $8 million) can continue to operate its existing business within the provinces where they have a registered office or branch office, but shall not set up any new branches in any provinces where it has no registered office or a branch office.
Prior to the capital increase, Anhou, a professional insurance agency with a PRC nationwide license, used to have a registered capital of RMB10 million (approximately $1.6 million). The branch offices of Anhou currently were all in Henan province. To better implement its expansion strategies, Anhou intended to increase its registered capital to RMB50 million (approximately $8 million) to meet the requirement of CIRC so that it can set up new branches in any province beyond its current operationscontractual obligations as disclosed in the PRC.Company’s 2019 Annual Report filed on Form 10-K.
Off Balance Sheet Arrangements
On June 9, 2013, AHFL entered into a Loan Agreement (the “Company Loan Agreement”) with ZLI Holdings, its wholly-owned Hong Kong subsidiary.
Under the Company Loan Agreement, AHFL agreed to provide a loan to ZLI Holdings with the principal amount equal to the US Dollar equivalent of RMB40,000,000 ($6,389,925). The term for such was ten years which could be extended upon the agreement of the parties. The amount of such loan was remitted to the account of ZLI Holdings on August 30, 2013.
In August 2013, ZLI Holdings entered into the Investor Loan Agreements with the following unrelated parties: Able Capital Holding Co., Ltd., a limited liability company established and registered in Hong Kong, Mr. Chen Li and Ms. Yue Jing, both PRC citizens (collectively, the “Investor Borrowers”).
Due to certain restrictions on direct foreign investment in insurance agency business under current PRC legal regime, Anhou had sought certain investments made by the Investor Borrowers and they may need funds through individual loans. Upon the completion of the contemplated increase of registered capital of Anhou, each Investor Borrower shall, or cause their designated persons to, enter into the Variable Interest Entities Agreement with CU WFOE, Anhou and other parties so as to consolidate any additional VIE interest generated from the said registered capital increase into the Company.
On November 17, 2016, Li Chen transferred his interests in Anhou to Chunyan Lu for an aggregate consideration of RMB3 million.
Under the Investor Loan Agreements, the Investor Borrowers loaned cash from ZLI Holdings for their investment in Anhou and ZLI Holdings agreed to provide certain loans to each of the Investor Borrowers with an aggregate principal amount equal to the US Dollar equivalent of RMB40,000,000 ($6,389,925). The term for such loans was ten years which could be extended upon the agreement of the parties. Pursuant to the Investor Loan Agreements, each of the Investor Borrowers covenants to enter into certain Variable Interest Entities Agreements with Anhou, CU WFOE and certain existing shareholders of Anhou. The proceeds received from the said loans by the Investor Borrowers shall be solely used to increase the registered capital of Anhou, and ZLI Holdings may determine the repayment methods including transferring of the Investor Borrowers’ corresponding registered capital in Anhou or through other manner as full payment of the loans subject to terms and conditions therein in the event that the Investor Borrowers fail to repay the loan in currency to ZLI Holdings.
The specific amounts loaned to the Investor Borrowers were as follows:
Able Capital Holding Co., Ltd.: RMB29,500,000 ($4,712,570)
Ms. Lu: RMB3,000,000 ($479,244)
Ms. Yue: RMB7,500,000 ($1,198,111)
On October 20, 2013, the Investor Borrowers, through certain nominees, increased Anhou’s registered capital by RMB 40 million ($6,389,925).
Loan Receivable
On October 24, 2016, our Company entered into a loan agreement with a third party, RFL, which was incorporated under the laws of Samoa. We provided a short-term loan amount of NTD 48,000,000 ($1,486,846) to RFL. The short-term loan bears an interest rate of 4.5% per annum and the principal and interest are due on April 23, 2017. On April 21, 2017, the Company and RFL entered a supplemental agreement to extend the loan to October 23, 2017. As of September 30, 2017, the outstandinghad no off balance of the loan receivable is NTD44,790,360($1,477,060).On November 1 and November 2, 2017, the Company received the interest payment of this loan amount of NTD 300,000 (approximately $9,800) and $23,832, respectively. The management has evaluated RFL's business operation and ability to repay the loan in the future and determine that RFL will be able to repay the loan per newly negotiated terms and assessed that there is no impairment loss on the loan. Therefore, the Company is willing to extend the payment period of RFL loan.
Due to related parties
The related parties listed below loaned money to the Company for working capital. Due to related parties consisted of the followingsheet arrangements as of September 30, 2017 and December 31, 2016:2020.
| September 30, 2017 | December 31, 2016 | |||||||
| Due to Mr. Mao (CEO of the Company) | $ | 401,775 | $ | 361,379 | ||||
| Due to Ms. Lu (Shareholder of Law Anhou) | 225,411 | - | ||||||
| Due to Xude Investment (Owned by Mr. ChwanHau Li) | - | 32,374 | ||||||
| Due to Mr. Zhu (Legal Representative of Jiangsu) | 2,081 | 1,994 | ||||||
| Due to Yuli Broker (Owned by Ms. Lee) | 141 | 265 | ||||||
| Due to Yuli Investment (Owned by Ms. Lee) | 141 | 265 | ||||||
| Due to I Health Management Corp* | 17,313 | 3,724 | ||||||
| Total | $ | 646,862 | $ | 400,001 | ||||
*25% of I Health Management Corp’s shares are owned by Multiple Capital Enterprise. 24% of Multiple Capital Enterprise’s shares are owned by the Company’s management level
The loan due to related parties bore no interest and were payable on demand.
Convertible bonds
On June 23, 2016, the Company has issued two units of its convertible bonds with an aggregate principal amount of $200,000 to a non-US person and the value of the embedded derivatives liabilities is trivial. As of September 30, 2017 and December 31, 2016, the Company has an outstanding principal balance of $200,000 of convertible bonds. Total interest expense was $3,000 and $9,000 for the three and nine months ended September 30, 2017.
Long-term loan
| September 30, 2017 | December 31, 2016 | |||||||
| Loan B, interest at 8%, maturity date May 15, 2019 | $ | 150,274 | $ | 144,015 | ||||
| Loan C, interest at 8%, maturity date July 20, 2019 | 115,711 | 110,892 | ||||||
| Total long-term loans | $ | 265,985 | $ | 254,907 | ||||
On May 15, 2016, the Company’s contractually controlled affiliate in PRC, Law Anhou Insurance Agency Co., Ltd (“Anhou” or “Law Anhou”), entered into a loan agreement (“Loan B”) with a third party. The long-term Loan Agreement provided for a $150,274 loan to the Company. Loan B bears an interest rate of 8% per annum and interest is payable annually. The principal and the interest will be due on May 15, 2019.
On July 20, 2016, Anhou entered into a loan agreement (“Loan C”) with a third party. The long-term Loan Agreement provided for a $115,711 loan to the Company. Loan C bears an interest rate of 8% per annum and interest is payable annually. The principal and the interest will be due on July 20, 2019.
The total interest expense for both Loan B and Loan C was $5,293 and $15,562 for the three and nine months ended September 30, 2017.
Contractual Obligations
Operating Leases
The Company has operating leases for its offices. Rental expenses for the three months ended September 30, 2017 and 2016 were $595,277 and $526,390, respectively. Rental expenses for the nine months ended September 30, 2017 and 2016 were $1,832,335 and $1,557,725, respectively. As of September 30, 2017, total future minimum annual lease payments under operating leases were as follows, by years:
| Twelve months ending September 30, 2018 | $ | 2,049,071 | ||
| Twelve months ending September 30, 2019 | 1,166,015 | |||
| Twelve months ending September 30, 2020 | 245,873 | |||
| Twelve months ending September 30, 2021 | 55,088 | |||
| Twelve months ending September 30, 2022 | 17,687 | |||
| Thereafter | - | |||
| Total | $ | 3,553,734 |
AHFL Acquisition Agreement
The Company conducts all of its Taiwanese operations indirectly through its subsidiary AHFL and the revenue from such Taiwanese operations represented approximately 90% of our total revenue in our consolidated financial statements for the year ended December 31, 2015 and the quarter ended June 30, 2016, and such operations were also the source of all of our profits in 2015. On February 17, 2016, the Company and the selling shareholders of AHFL entered into a third Amendment to the AHFL Acquisition Agreement (the “Third Amendment”), pursuant to which, on or prior to June 30, 2016, (i) the Company is committed to complete the listing of the Company’s shares in a major capital market, where the net proceeds raised through such public offering financing shall be at least US$10,000,000; (ii) the Company is committed to distribute the cash payment in the amount of NTD22.5 million (US$312,617), on a pro rata basis, to the selling shareholders of AHFL and issue 5 million common shares to its selected employees pursuant to its employee stock/option plan, or any alternative plan mutually accepted by the Company and such selling shareholders; and (iii) failure to timely complete either of the above-mentioned criteria shall be deemed as a material breach of the Company under Article 8 of the Acquisition Agreement, whereby the non-breaching party shall be entitled to terminate the Acquisition Agreement and unwind the Acquisition of AHFL by CUIS and restore the status quo of the Company and the selling shareholders (the “Selling Shareholders”) as if the said acquisition had never happened.
On August 8, 2016, the Company and the selling shareholders of AHFL entered into a fourth Amendment to the Acquisition Agreement (the “Fourth Amendment”), pursuant to which: (A) the Third Amendment is terminated with immediate effect on August 8, 2016, and (B) Sections 2.2(iii) and (iv) of the Acquisition Agreement are amended and restated so that the Company is now obligated to: (iii) pay NTD15 million (USD475,406) to the Selling Shareholders in the amounts set forth opposite each Selling Shareholder’s name on Schedule I on or prior to March 31, 2017 or at any other time or in any other manner otherwise agreed upon by and among the parties; and (iv) pay NTD4,830,514 (USD153,097) to the Selling Shareholders in the amounts set forth opposite each Selling Shareholder’s name on Schedule I on July 21, 2016. Unless amended by the Fourth Amendment, any other provision of the Acquisition Agreement shall remain unchanged. On July 21, 2016, the Company arranged for the payment of NTD4,830,514 (USD153,097) to the Selling Shareholders. As a result, the former shareholders of AHFL no longer have the right to unwind the acquisition of AHFL by the Company. On March 12, 2017, the Company and the selling shareholders of AHFL entered into a fifth Amendment to the Acquisition Agreement (the “Fifth Amendment”), pursuant to which, on or prior to March 31, 2019, the Company agreed to distribute the cash payment in the amount of NTD15 million.
Engagement Agreement with Ms. Chao
On May 10, 2016, Law Broker entered into the Engagement Agreement with Ms. Chao, pursuant to which she acts as the general manager of Law Broker for a term from December 29, 2015 to December 28, 2018. Ms. Chao’s primary responsibilities are to assist Law Broker in operating and managing insurance agency business. According to the Engagement Agreement, Ms. Chao’s bonus plans include: 1) execution, 2) long-term service fees, 3) pension and 4) non-competition, and the payment of such bonuses will only occur upon satisfaction of certain condition and subject to the terms therein, among which, Ms. Chao acts as the general manager or equivalent position of Law Broker for at least 3 years.
On May 14, 2016, Law Broker and Ms. Chao entered into a supplementary agreement (“Supplementary Agreement”) to postpone her pension vesting date to December 29, 2016. Though Law Broker expects that none of the above-mentioned bonuses need to be paid prior to May 2019, it has recorded long-term liabilities representing the corresponding portion of such bonuses accrued. On March 13, 2017, Law Broker and Ms. Chao entered into an engagement agreement, which is the amendment to Engagement Agreement dated May 10, 2016 to specify 1) Ms. Chao’s pension calculation assumption and start date, and 2) the non-competition provision start date. As of September 30, 2017 and December 31, 2016, the balance of such accrued long-term liabilities was $175,191 and $77,440, respectively.
Lease Agreements
On July 1, 2016, the Company entered into a lease agreement with Yuli Broker to lease its Nan-King East Road office space in Taipei City. The lease term was for one year commencing on July 1, 2016 and ending on June 30, 2017, with an annual base rent approximately of $590 (NTD18,000). On June 30, 2017, this lease agreement was extended automatically to June 30, 2018. For the three and nine months ended September 30, 2017, rent income were $141 and $421, respectively.
On July 1, 2016, the Company entered into a lease agreement with Yuli Investment to lease its Nan-King East Road office space in Taipei City. The lease term was for one year commencing on July 1, 2016 and ending on June 30, 2017, with an annual base rent approximately of $590 (NTD18,000). On June 30, 2017, this lease agreement was extended automatically to June 30, 2018. For the three and nine months ended September 30, 2017, rent income were $141 and $421, respectively.
Advisory Agreements
On May 2, 2016, the Company entered into an advisory agreement with I Health. Pursuant to the Advisory Agreement, I Health provided 10,000 Taiwan citizen’s health information to the Company for its new insurance product during May 2, 2016 to May 1, 2017. The total advisory fee was approximately $42,000 (NTD1,275,000). For the nine months ended September 30, 2017, The Company had cost of revenue related to I Health amount of $13,269.
On December 7, 2016, the Company entered into an advisory agreement with Fuchang Li (“Mr. Li,” the Director of the Company). Pursuant to this Advisory Agreement, Mr. Li provided investment consulting to the Company from December 7, 2016 to December 6, 2017. The total advisory fee was approximately $58,000 (NTD1,800,000). The Company had general and administrative expense related to this advisory agreement amount of $13,619 and $42,998, respectively, for the three and nine months ended September 30, 2017.
Consulting Agreement
On November 1, 2016, the Company entered into a consulting agreement with Apex Biz Solution Limited. (“Apex,” was formerly known as Prime Technology Corp.), which has one of the same directors as Prime Financial Asia Ltd. Pursuant to this consulting agreement, the Company provided administrative operation consulting service to Apex from November 1, 2016 to December 31, 2021. As of and for the nine months ended September 30, 2017, the Company had account receivable and revenue amount of $17,274 and $33,874, respectively.
Off Balance Sheet Arrangements
We have not participated in any transactions with unconsolidated entities, such as special purpose entities, which would have been established for the purpose of facilitating off-balance sheet arrangements.
ITEM 3. QUANTITATIVE AND QUALITATIVE DISCLOSURE ABOUT MARKET RISK
We are exposed to market risk in the ordinary course of our business. Market risk represents the risk of loss that may impact our financial position due to adverse changes in financial market prices and rates. Our market risk exposure is primarilyAs a result of fluctuations in interest rates and foreign currency exchange rates.
Interest Rate Sensitivity
As of September 30, 2017, we had cash of USD approximately $10,000, cash of RMB8,227,876 (equivalent to approximately $1,236,000), cash of HKD417,620(equivalent to approximately $53,000), and cash of NTD314,260,180 (equivalent to approximately $10,363,000). We hold our cash for working capital purposes. Declines in interest rates would reduce future interest income. For the nine months ended September 30, 2017, the effect of a hypothetical 10% increase or decrease in overall interest rates would not have had a material impact on our interest income.
Foreign Currency Risk
The functional currency for the subsidiaries in Taiwan is NTD, the functional currency for the subsidiaries in Hong Kong is HKD and the functional currency for the subsidiaries and CAE in PRC is RMB. The financial statementssmaller reporting company as defined by Rule 12b-2 of the CompanyExchange Act, we are in USD. The fluctuation of NTD and RMB will affect our operating results expressed in USD. The Company reviews its foreign currency exposures. To date, we have not entered into any hedging arrangements with respectrequired to foreign currency risk or other derivative financial instruments. The management does not consider its present foreign exchange risk to be significant.provide the information under this item.
ITEM 4. CONTROLS AND PROCEDURES
Evaluation of Disclosure Controls and Procedures
As required by SECWe maintain disclosure controls and procedures, as such term is defined under Rule 13a-15(b)13a-15(e) promulgated under the Securities Exchange ActAct. In designing and evaluating the disclosure controls and procedures, management recognizes that any disclosure controls and procedures, no matter how well designed and operated, can provide only reasonable assurance of 1934, as amended (the “Exchange Act”),achieving the Company carried out an evaluation, underdesired control objectives, and management necessarily is required to apply its judgment in evaluating the cost-benefit of possible controls and procedures.
Under the supervision and with the participation of the Company’s management, including the Company’s Chief Executive Officerour principal executive officer and Chief Financial Officer,principal financial officer, we conducted an evaluation of the effectiveness of the design and operation of the Company’sour disclosure controls and procedures (as defined in Rule 13a-15(e) under the Exchange Act) as of September 30, 2017.the end of the period covered by this report. Based on thatthis evaluation, our management, including the Chief Executive Officerprincipal executive officer and Chief Financial Officer,principal financial officer have concluded that as of September 30, 2017, our disclosure controls and procedures were not effective to ensureat the information required to be disclosed by an issuerreasonable assurance level as of September 30, 2020. This conclusion was based on the material weaknesses in the reports it files or submits under the Exchange Act, is recorded, processed, summarizedour internal control over financial reporting described in Part II, Item 9A, “Controls and reported within the time periods specified in the Securities and Exchange Commission’s rules and forms relating to us, and was accumulated and communicated toProcedures” of our management, including our Chief Executive Officer and Chief Financial Officer, or persons performing similar functions,2019 Form 10-K. The material weaknesses have not been remediated as appropriate, to allow timely decisionsof September 30, 2020. However, we have made improvements regarding required disclosure. There are inherent limitations to the effectiveness of any system of disclosure controls and procedures, includingsuch as employing additional resources with the possibility of human errorappropriate expertise to assume assigned responsibility for initiating and monitoring entity-level controls at group level in compliance with Internal Control-Integrated Framework (2013) and to design, implement and assess the circumvention or overridingstructures, authorities and responsibilities to establish accountability for internal controls of the controls and procedures. Accordingly, even effective disclosure controls and procedures can only provide reasonable assuranceCompany.
A material weakness is a deficiency, or combination of achieving their control objectives.
Changesdeficiencies, in internal control over financial reporting such that there is a reasonable possibility that a material misstatement of the Company’s annual or interim consolidated financial statements will not be prevented or detected on a timely basis. If not remediated, the material weaknesses in our internal control over financial reporting described in the 2019 Form 10-K could result in a material misstatement of our annual or interim consolidated financial statements that would not be prevented or detected on a timely basis.
Changes in Internal Control over Financial Reporting
During the nine monthsfiscal quarter ended September 30, 2017,2020, there were no changes in our internal control over financial reporting identified in connection with the evaluation performed during the fiscal quarter covered by this report that hashave materially affected, or isare reasonably likely to materially affect, our internal control over financial reporting.
Inherent Limitations on Effectiveness of Controls
Our management, including our principal executive officer and principal financial officer, does not expect that our disclosure controls and procedures or our internal control over financial reporting will prevent or detect all errors and all fraud. A control system, no matter how well-designed and operated, can provide only reasonable, not absolute, assurance that the control system’s objectives will be met. The design of a control system must reflect the fact that there are resource constraints, and the benefits of controls must be considered relative to their costs. Further, because of the inherent limitations in all control systems, no evaluation of controls can provide absolute assurance that misstatements due to error or fraud will not occur or that all control issues and instances of fraud, if any, have been detected. The design of any system
39
of controls is based in part on certain assumptions about the likelihood of future events, and there can be no assurance that any design will succeed in achieving its stated goals under all potential future conditions. Projections of any evaluation of the effectiveness of controls to future periods are subject to risks. Over time, controls may become inadequate because of changes in conditions or deterioration in the degree of compliance with policies or procedures.
From time to time, we may become involved in various lawsuits and legal proceedings, which arise, in the ordinary course of business. However, litigation is subject to inherent uncertainties, and an adverse result in these or other matters may arise from time to time that may harm our business. We are currently not aware of any such legal proceedings or claims that we believe will have a material adverse effect on our business, financial condition or operating results. From time to time, we may become involved in various lawsuits and legal proceedings, which arise, in the ordinary course of business. Litigation is subject to inherent uncertainties, and an adverse result in these or other matters may arise from time to time that may harm our business.
As a smaller reporting company, we are not required to make disclosure under this item.
There have been no material changes from the risk factors disclosed in our annual report on Form 10-K for the fiscal year period ended December 31, 2016.
ITEM 2. UNREGISTERED SALES OF EQUITY SECURITIES AND USE OF PROCEEDS.
None during this reporting period.
None.
ITEM 3. DEFAULTS UPON SENIOR SECURITIES.
None during this reporting period.
None.
ITEM 4. MINE SAFETY DISCLOSURES
Not applicable.
ITEM 5. OTHER INFORMATION.INFORMATION
None.
Resignation of Officers
On August 30, October 2 and November 3, 2017, Mr. Te Yun Chiang, Mr. Wen Yuan Hsu and Mr. Tung-Chi Hsieh resigned as Chief Technology Officer, Chief Marketing Officer and Chief Operating Officer of the Company, respectively.
Though Mr. Chiang, Mr. Hsu and Mr. Hsieh held the titles of Chief Operating Officer, Chief Marketing Officer and Chief Technology Officer of the Company, respectively, before their resignations, they had not performed executive functions in the Company’s overall operations that may have been indicated by their respective titles. Their resignations will avoid ambiguity with respect to their duties and roles in the Company’s overall operations. There is no disagreement between the Company on the one hand, and Mr. Chiang, Mr. Hsieh and Mr. Hsu on the other hand, relating to the Company’s operations, policies and practices.
Subsequent to the resignations, Mr. Chiang will continue serving as the Manager of Jiangsu Law Insurance Brokers Co., Ltd. (“Jiangsu Law”), Mr. Hsieh will continue serving as the Division Chief of Management of Jiangsu Law, and Mr. Hsu will continue serving as the General Manager of Sichuan Kangzhuang Insurance Agency Co., Ltd., all of which are the Company’s CAEs in the PRC. In view of the continuous expansion of these CAEs, Mr. Chiang, Mr. Hsieh and Mr. Hsu and the Company have agreed they should dedicate substantially all of their time and efforts to serve their managerial functions in such CAEs.
40
Exhibit | ||
Number | Description of Exhibit | |
31.1 | ||
31.2 | ||
32.1* | ||
32.2* |
101.INS | XBRL Instance Document | |
101.SCH | XBRL Taxonomy Extension Schema Document | |
101.CAL | XBRL Taxonomy Extension Calculation Linkbase Document | |
101.DEF | XBRL Taxonomy Extension Definition Linkbase Document | |
101.LAB | XBRL Taxonomy Extension Label Linkbase Document | |
101.PRE | XBRL Taxonomy Extension Presentation Linkbase Document | |
104 | | Cover Page Interactive Data File (formatted as Inline XBRL and contained in Exhibit 101) |
*The certifications attached as Exhibits 32.1 and 32.2 accompany this quarterly report on Form 10-Q pursuant to 18 U.S.C. Section 1350, as adopted pursuant to Section 906 of the Sarbanes-Oxley Act of 2002, and shall not be deemed “filed” by the Registrant for purposes of Section 18 of the Securities Exchange Act of 1934, as amended.
41
Pursuant to the requirements of the Securities Exchange Act of 1934, the Registrant has duly caused this report to be signed on its behalf by the undersigned thereunto duly authorized.
| | | |
| China United Insurance Service, Inc. | ||
| | | |
Date: November 9, | | By: | /s/ Yi Hsiao Mao |
| | Name: | Yi Hsiao Mao |
| | Its: | Chief Executive Officer |
| | | (Principal Executive Officer) |
| | | |
Date: November 9, | | By: | /s/ |
| | Name: | Mei-Kuan Yeh |
| | Its: | Chief Financial Officer |
| | | (Principal Financial and Accounting Officer) |
42