UNITED STATES
SECURITIES AND EXCHANGE COMMISSION
Washington,WASHINGTON, D.C. 20549
FORM 10-Q
(Mark One)☒ QUARTERLY REPORT PURSUANT TO SECTION 13 OR 15(d) OF THE SECURITIES EXCHANGE ACT OF 1934
x | QUARTERLY REPORT PURSUANT TO SECTION 13 OR 15(d) OF THE SECURITIES EXCHANGE ACT OF 1934 |
For the quarterly period ended September 30, 2017March 31, 2022
or☐ TRANSITION REPORT PURSUANT TO SECTION 13 OR 15(d) OF THE SECURITIES EXCHANGE ACT OF 1934
¨ | TRANSITION REPORT PURSUANT TO SECTION 13 OR 15(d) OF THE SECURITIES EXCHANGE ACT OF 1934 |
For the transition period from _________________________ to_____________________________________ to ____________
Commission File Number:file number: 001-38036
TAKUNG ART CO., LTD
(Exact name of registrant as specified in its charter)
Delaware | | 26-4731758 |
(State or other jurisdiction of
incorporation or organization)organization | | (I.R.S. Employer
Identification No.) |
| 1325 Avenue of the Americas, Room 2740, 27th New York, | | NY 10019 |
| (Address of principal executive offices) | | (Zip Code) |
Flat/RM 03-04 20/F Hutchison House 10 Harcourt Road, Central, Hong Kong
(Address of principal executive offices) (Zip Code)
+852 3158 0977
(Registrant’s telephone number, including area code)code +1 (332) 250-4207
(Former name, former address and former fiscal year, if changed since last report)Securities registered pursuant to Section 12(b) of the Act:
| Title of each class | | Trading Symbol(s) | | Name of each exchange on which
registered |
| Common Stock | | TKAT | | NYSE American |
Indicate by check markcheckmark whether the registrant (1) has filed all reports required to be filed by Section 13 or 15(d)15 (d) of the Securities Exchange Act of 1934 during the preceding 12 months (or for such shorter period that the registrant was required to file such reports), and (2) has been subject to such filing requirements for the past 90 days.xYes¨ ☒ No ☐
Indicate by check mark whether the registrant has submitted electronically and posted on its corporate Web site, if any, every interactiveInteractive Data File required to be submitted and posted pursuant to Rule 405 of Regulation S-T (§232.405 of this chapter) during the preceding 12 months (or for such shorter period that the registrant was required to submit and post such files). xYes¨ ☒ No ☐
Indicate by check mark whether the registrant is a large accelerated filer, an accelerated filer, a non-accelerated filer, a smaller reporting company, or an emerging growth company. See the definitions of “large accelerated filer,” “accelerated filer,” “smaller reporting company,” and “emerging growth company” in Rule 12b-2 of the Exchange Act.
Large accelerated filer¨ | ☐ | Accelerated filer¨ | ☐ |
Non-accelerated filer (Do not check if a smaller reporting company)¨ | ☒ | Smaller reporting companyx | ☒ |
| | Emerging growth company¨ | ☐ |
If an emerging growth company, indicate by check mark if the registrant has elected not to use the extended transition period for complying with any new or revised financial accounting standards provided pursuant to Section 13(a) of the Exchange Act.¨ ☐
Indicate by check mark whether the registrant is a shell company (as defined in Rule 12b-2 of the Exchange Act).¨Yesx ☐ No ☒
APPLICABLE ONLY TO ISSUERS INVOLVED IN BANKRUPTCY
PROCEEDINGS DURING THE PRECEDING FIVE YEARS:
Indicate by check mark whether the registrant has filed all documents and reports required to be filed by Sections 12,As of May 13, or 15(d)2022, 24,611,263 shares of the Securities Exchange Act of 1934 subsequent to the distribution of securities under a plan confirmed by a court. ¨Yes¨No
APPLICABLE ONLY TO CORPORATE ISSUERS:
Indicate the number of shares outstanding of each of the issuer’s classes ofCompany’s common stock, as of the latest practicable date.
The number of shares of common stock$0.001 par value, were issued and outstanding as of November 14, 2017 is 11,188,882.outstanding.
FORM 10-Q
TAKUNG ART CO,CO., LTD
FORM 10-Q
INDEX
PART I –FINANCIAL INFORMATION
Item 1. Interim Condensed Consolidated Financial Statements (Unaudited)
TAKUNG ART CO., LTD AND SUBSIDIARIES
INTERIM CONDENSED CONSOLIDATED BALANCE SHEETS
(Stated in U.S. Dollars except Number of Shares)
| | | As of
March 31, | | | As of
December 31, | |
| | | 2022 | | | 2021 | |
| | | (Unaudited) | | | | |
| ASSETS | | | | | | |
| Current assets | | | | | | |
| Cash and cash equivalents | | $ | 1,533,468 | | | $ | 1,503,153 | |
| Restricted Cash | | | 2,028,416 | | | | - | |
| Account receivables, net | | | 119,496 | | | | 120,000 | |
| Prepayment and other current assets, net | | | 103,248 | | | | 169,908 | |
| Current assets – discontinued operations | | | 143,070 | | | | 373,479 | |
| Total current assets | | | 3,927,698 | | | | 2,166,540 | |
| | | | | | | | | |
| Non-current assets | | | | | | | | |
| Property and equipment, net | | | 6,506 | | | | 6,883 | |
| Intangible assets | | | 140 | | | | 140 | |
| Non-marketable investment, net | | | 9,296,614 | | | | 9,296,614 | |
| Non-current assets – discontinued operations | | | 151,085 | | | | 183,559 | |
| Total non-current assets | | | 9,454,345 | | | | 9,487,196 | |
| Total assets | | $ | 13,382,043 | | | $ | 11,653,736 | |
| | | | | | | | | |
| LIABILITIES AND STOCKHOLDERS’ EQUITY | | | | | | | | |
| | | | | | | | | |
| LIABILITIES | | | | | | | | |
| Current liabilities | | | | | | | | |
| Accrued expenses and other payables | | $ | 375,244 | | | $ | 143,429 | |
| Advance from customers | | | 2,028,416 | | | | - | |
| Short-term borrowing from a third party | | | 300,000 | | | | - | |
| Current liabilities – discontinued operations | | | 8,671,980 | | | | 8,733,624 | |
| Total current liabilities | | | 11,375,640 | | | | 8,877,053 | |
| | | | | | | | | |
| Total liabilities | | | 11,375,640 | | | | 8,877,053 | |
| | | | | | | | | |
| STOCKHOLDERS’ EQUITY | | | | | | | | |
| Common stock (1,000,000,000 shares authorized; $0.001 par value; 14,372,353 shares issued and outstanding as of March 31, 2022; 14,372,353 shares issued and outstanding as of December 31, 2021) | | | 14,372 | | | | 14,372 | |
| Additional paid-in capital | | | 32,547,585 | | | | 32,547,585 | |
| Accumulated deficits | | | (30,235,524 | ) | | | (29,444,185 | ) |
| Accumulated other comprehensive loss | | | (320,030 | ) | | | (341,089 | ) |
| Total stockholders’ equity | | | 2,006,403 | | | | 2,776,683 | |
| Total liabilities and stockholders’ equity | | $ | 13,382,043 | | | $ | 11,653,736 | |
The accompanying notes are an integral part of these interim condensed consolidated financial statements
1
| | | September 30, | | | December 31, | |
| | | 2017 | | | 2016 | |
| | | (Unaudited) | | | | |
| ASSETS | | | | | | | | |
| Current assets | | | | | | | | |
| Cash and cash equivalents | | $ | 14,887,890 | | | $ | 13,395,337 | |
| Restricted cash | | | 19,057,733 | | | | 21,743,360 | |
| Account receivables, net | | | 3,732,569 | | | | 3,058,568 | |
| Prepayment and other current assets | | | 870,231 | | | | 968,446 | |
| Loan receivables | | | 6,806,623 | | | | 6,374,046 | |
| Total current assets | | | 45,355,046 | | | | 45,539,757 | |
| | | | | | | | | |
| Non-current assets | | | | | | | | |
| Property and equipment, net | | | 2,104,107 | | | | 2,065,182 | |
| Intangible assets | | | 20,394 | | | | 20,546 | |
| Deferred tax assets | | | 294,676 | | | | 243,772 | |
| Other non-current assets | | | 535,420 | | | | 428,764 | |
| Total non-current assets | | | 2,954,597 | | | | 2,758,264 | |
| Total assets | | $ | 48,309,643 | | | $ | 48,298,021 | |
| | | | | | | | | |
| LIABILITIES AND STOCKHOLDERS’ EQUITY | | | | | | | | |
| | | | | | | | | |
| LIABILITIES | | | | | | | | |
| Current liabilities | | | | | | | | |
| Accrued expenses and other payables | | $ | 780,800 | | | $ | 608,883 | |
| Customer deposits | | | 19,057,733 | | | | 21,743,360 | |
| Advance from customers | | | - | | | | 360,248 | |
| Short-term borrowings from third parties | | | 6,371,900 | | | | 6,308,513 | |
| Amount due to related party | | | 1,085,480 | | | | 1,031,805 | |
| Taxes payable | | | 1,094,885 | | | | 549,897 | |
| Total current liabilities | | | 28,390,798 | | | | 30,602,706 | |
| Deferred tax liabilities | | | 45,301 | | | | 62,618 | |
| Total non-current liabilities | | | 45,301 | | | | 62,618 | |
| Total liabilities | | | 28,436,099 | | | | 30,665,324 | |
| | | | | | | | | |
| COMMITMENTS AND CONTINGENCIES | | | | | | | | |
| | | | | | | | | |
| STOCKHOLDERS’ EQUITY | | | | | | | | |
Common stock (1,000,000,000 shares authorized; $0.001 par value;
11,188,882 shares issued and outstanding as of September 30, 2017;
11,169,276 shares issued and outstanding as of December 31, 2016) | | | 11,189 | | | | 11,169 | |
| Additional paid-in capital | | | 5,928,455 | | | | 5,532,426 | |
| Retained earnings | | | 14, 229,809 | | | | 13,172,671 | |
| Accumulated other comprehensive loss | | | (295,909 | ) | | | (1,083,569 | ) |
| Total stockholders’ equity | | | 19,873,544 | | | | 17,632,697 | |
| Total liabilities and stockholders’ equity | | $ | 48,309,643 | | | $ | 48,298,021 | |
TAKUNG ART CO., LTD AND SUBSIDIARIES
INTERIM CONDENSED CONSOLIDATED STATEMENTS OF OPERATIONS AND COMPREHENSIVE LOSS
(Stated in U.S. Dollars except Number of Shares)
(UNAUDITED)
| | | Three Months Ended | |
| | | March 31, | | | March 31 | |
| | | 2022 | | | 2021 | |
| | | | | | | |
| Revenue | | $ | - | | | $ | - | |
| Total revenue | | | - | | | | - | |
| | | | | | | | | |
| Cost of revenue | | | - | | | | - | |
| Gross profit | | | - | | | | - | |
| | | | | | | | | |
| Operating expenses | | | | | | | | |
| General and administrative expenses | | | (611,475 | ) | | | (359,990 | ) |
| Total operating expenses | | | (611,475 | ) | | | (359,990 | ) |
| | | | | | | | | |
| Loss from operations | | | (611,475 | ) | | | (359,990 | ) |
| | | | | | | | | |
| Other income and expenses: | | | | | | | | |
| Other expenses | | | (99 | ) | | | (52 | ) |
| Total other expenses | | | (99 | ) | | | (52 | ) |
| | | | | | | | | |
| Loss before income taxes | | | (611,574 | ) | | | (360,042 | ) |
| | | | | | | | | |
| Income tax expense | | | - | | | | - | |
| | | | | | | | | |
| Net loss from continuing operations | | | (611,574 | ) | | | (360,042 | ) |
| | | | | | | | | |
| Loss from discontinued operations, net of income taxes: | | | | | | | | |
| Loss from discontinued operations | | | (179,765 | ) | | | (217,319 | ) |
| Income tax expense | | | - | | | | (20,208 | ) |
| Deferred tax benefit | | | - | | | | 24,981 | |
| Net loss from discontinued operations | | | (179,765 | ) | | | (212,546 | ) |
| | | | | | | | | |
| Net loss | | | (791,339 | ) | | | (572,588 | ) |
| | | | | | | | | |
| Foreign currency translation adjustment | | | 21,059 | | | | (37,763 | ) |
| | | | | | | | | |
| Comprehensive Loss | | $ | (770,280 | ) | | $ | (610,351 | ) |
| | | | | | | | | |
| Loss from continuing operations per share of common stock – basic | | $ | (0.043 | ) | | $ | (0.032 | ) |
| Loss from continuing operations per share of common stock – diluted | | $ | (0.043 | ) | | $ | (0.032 | ) |
| Loss from discontinued operations per share of common stock – basic | | $ | (0.013 | ) | | $ | (0.019 | ) |
| Loss from discontinued operations per share of common stock – diluted | | $ | (0.013 | ) | | $ | (0.019 | ) |
| | | | | | | | | |
| Weighted average number of common stock outstanding – basic | | | 14,372,353 | | | | 11,271,379 | |
| Weighted average number of common stock outstanding – diluted | | | 14,372,353 | | | | 11,271,379 | |
The accompanying notes are an integral part of these interim condensed consolidated financial statement
TAKUNG ART CO., LTD AND SUBSIDIARIES
INTERIM CONDENSED CONSOLIDATED STATEMENTS OF CHANGES IN EQUITY
(Stated in U.S. Dollars except Number of Shares)
(UNAUDITED)
| | | Number | | | Common | | | Additional
Paid-in | | | Accumulated | | | Accumulated
other
comprehensive | | | | |
| | | of shares | | | stock | | | capital | | | deficit | | | loss | | | Total | |
| Balance, December 31, 2021 | | | 14,372,353 | | | $ | 14,372 | | | $ | 32,547,585 | | | $ | (29,444,185 | ) | | $ | (341,089 | ) | | $ | 2,776,683 | |
| Net loss from continuing operations | | | - | | | | - | | | | - | | | | (611,574 | ) | | | - | | | | (611,574 | ) |
| Net loss from discontinued operations | | | - | | | | - | | | | - | | | | (179,765 | ) | | | - | | | | (179,765 | ) |
| Foreign currency translation adjustment | | | - | | | | - | | | | - | | | | - | | | | 21,059 | | | | 21,059 | |
| Balance, March 31, 2022 | | | 14,372,353 | | | $ | 14,372 | | | $ | 32,547,585 | | | $ | (30,235,524 | ) | | $ | (320,030 | ) | | $ | 2,006,403 | |
| | | Number | | | Common | | | Additional
Paid-in | | | Accumulated | | | Accumulated
other
comprehensive | | | | |
| | | of shares | | | Stock | | | capital | | | deficit | | | loss | | | Total | |
| Balance, December 31, 2020 | | | 11,271,379 | | | $ | 11,271 | | | $ | 6,358,115 | | | $ | (226,311 | ) | | $ | (328,030 | ) | | $ | 5,815,045 | |
| Shared-based compensation | | | - | | | | - | | | | 3,717 | | | | - | | | | - | | | | 3,717 | |
| Net loss from continuing operations | | | - | | | | - | | | | - | | | | (360,042 | ) | | | - | | | | (360,042 | ) |
| Net loss from discontinued operations | | | | | | | | | | | | | | | (212,546 | ) | | | | | | | (212,546 | ) |
| Foreign currency translation adjustment | | | - | | | | - | | | | - | | | | - | | | | (37,763 | ) | | | (37,763 | ) |
| Balance, March 31, 2021 | | | 11,271,379 | | | $ | 11,271 | | | $ | 6,361,832 | | | $ | (798,899 | ) | | $ | (365,793 | ) | | $ | 5,208,411 | |
The accompanying notes are an integral part of these interim condensed consolidated financial statements.
TAKUNG ART CO., LTD AND SUBSIDIARIES
INTERIM CONDENSED CONSOLIDATED STATEMENTS OF INCOMECASH FLOWS
AND COMPREHENSIVE INCOME
(Stated in U.S. Dollars except Number of Shares)Dollars)
(UNAUDITED)
| | | Three Months Ended | |
| | | March 31, | | | March 31 | |
| | | 2022 | | | 2021 | |
| Cash flows from operating activities: | | | | | | |
| Net loss from continuing operations | | $ | (611,574 | ) | | $ | (360,042 | ) |
| Net loss from discontinued operations | | | (179,765 | ) | | | (212,546 | ) |
| | | | | | | | | |
| Adjustments to reconcile net loss to net cash provided by operating activities: | | | | | | | | |
| Depreciation | | | 350 | | | | - | |
| Changes in exchange rate | | | 531 | | | | - | |
| Share-based compensation | | | - | | | | 3,717 | |
| Changes in operating assets and liabilities (decrease) increase in: | | | | | | | | |
| Prepayment and other current assets | | | 66,660 | | | | 36,125 | |
| Customer deposits | | | 2,028,416 | | | | - | |
| Accrued expenses and other payables | | | 231,814 | | | | 319,257 | |
| Net cash provided by (used in) operating activities-continuing operations | | | 1,716,197 | | | | (943 | ) |
| Net cash (used in) provided by operating activities-discontinued operations | | | (156,101 | ) | | | 1,652,638 | |
| Net cash provided by operating activities | | | 1,560,096 | | | | 1,651,695 | |
| | | | | | | | | |
| Cash flows from investing activities: | | | | | | | | |
| Net cash used in investing activities-continuing operations | | | - | | | | - | |
| Net cash used in investing activities-discontinued operations | | | (1,153 | ) | | | 389,171 | |
| Net cash used in investing activities | | | (1,153 | ) | | | 389,171 | |
| | | | | | | | | |
| Cash flows from financing activities: | | | | | | | | |
| Proceeds from a short-term borrowing from a third party | | | 300,000 | | | | - | |
| Net cash provided by financing activities-continuing operations | | | 300,000 | | | | - | |
| Net cash provided by financing activities-discontinued operations | | | - | | | | - | |
| Net cash provided by financing activities | | | 300,000 | | | | - | |
| | | | | | | | | |
| Effect of exchange rate change on cash and cash equivalents, and restricted cash from continuing operations | | | 42,534 | | | | - | |
| Effect of exchange rate change on cash and cash equivalents, and restricted cash from discontinued operations | | | (56,203 | ) | | | (21,443 | ) |
| | | | (13,669 | ) | | | (21,443 | ) |
| | | | | | | | | |
| Net change in cash and cash equivalents, and restricted cash from continuing operations | | | 2,058,731 | | | | (943 | ) |
| Net change in cash and cash equivalents, and restricted cash from discontinued operations | | | (213,457 | ) | | | 2,020,366 | |
| | | | 1,845,274 | | | | 2,019,423 | |
| | | | | | | | | |
| Cash and cash equivalents, and restricted cash beginning balance from continuing operations | | | 1,503,153 | | | | 31,188 | |
| Cash and cash equivalents, and restricted cash beginning balance from discontinued operations | | | 338,542 | | | | 13,811,557 | |
| Cash and cash equivalents, and restricted cash beginning balance | | | 1,841,695 | | | | 13,842,745 | |
| | | | | | | | | |
| Cash and cash equivalents, and restricted cash ending balance from continuing operations | | | 3,561,884 | | | | 30,245 | |
| Cash and cash equivalents, and restricted cash ending balance from discontinued operations | | | 125,085 | | | | 15,831,923 | |
| Cash and cash equivalents, and restricted cash ending balance | | $ | 3,686,969 | | | $ | 15,862,168 | |
| | | | | | | | | |
| Reconciliation of cash, cash equivalents, and restricted cash to the consolidated balance sheets | | | | | | | | |
| Cash and cash equivalents-continuing operations | | $ | 1,533,468 | | | $ | 30,245 | |
| Restricted cash-continuing operations | | | 2,028,416 | | | | - | |
| Total cash, cash equivalents and restricted cash -continuing operations | | $ | 3,561,884 | | | $ | 30,245 | |
| | | | | | | | | |
| Cash and cash equivalents-discontinued operations | | $ | 125,085 | | | $ | 4,353,403 | |
| Restricted cash – discontinued operations | | | - | | | | 11,478,520 | |
| Total cash, cash equivalents and restricted cash – discontinued operations | | $ | 125,085 | | | $ | 15,831,923 | |
| | | | | | | | | |
| Total cash, cash equivalents, and restricted cash | | $ | 3,686,969 | | | $ | 15,862,168 | |
| | | | | | | | | |
| Supplemental cash flows information: | | | | | | | | |
| Cash paid for interest-continuing operations | | $ | - | | | $ | - | |
| Cash paid for interest-discontinued operations | | $ | - | | | $ | - | |
| Cash paid for income taxes-continuing operations | | $ | - | | | $ | - | |
| Cash paid for income taxes-discontinued operations | | $ | - | | | $ | - | |
| | | For the Three Months Ended
September 30, | | | For the Nine Months Ended
September 30, | |
| | | 2017 | | | 2016 | | | 2017 | | | 2016 | |
| | | (Unaudited) | | | (Unaudited) | | | (Unaudited) | | | (Unaudited) | |
| Revenue | | | | | | | | | | | | | | | | |
| Listing fee revenue | | $ | 1,455,498 | | | $ | 2,968,534 | | | $ | 4,606,649 | | | $ | 8,166,072 | |
| Commission revenue | | | 1,496,826 | | | | 1,669,698 | | | | 4,970,651 | | | | 3,739,958 | |
| Gross management fee revenue | | | 402,547 | | | | 781,219 | | | | 967,518 | | | | 1,341,294 | |
| Annual fee revenue | | | 140 | | | | 440 | | | | 859 | | | | 869 | |
| Authorized agent subscription revenue | | | - | | | | 322,318 | | | | - | | | | 966,059 | |
| Total revenue | | | 3,355,011 | | | | 5,742,209 | | | | 10,545,677 | | | | 14,214,252 | |
| | | | | | | | | | | | | | | | | |
| Cost of revenue | | | (292,168 | ) | | | (285,252 | ) | | | (822,335 | ) | | | (822,735 | ) |
| | | | | | | | | | | | | | | | | |
| Gross profit | | | 3,062,843 | | | | 5,456,957 | | | | 9,723,342 | | | | 13,391,517 | |
| | | | | | | | | | | | | | | | | |
| Operating expenses: | | | | | | | | | | | | | | | | |
| General and administrative expenses | | | (2,498,848 | ) | | | (1,744,965 | ) | | | (7,311,128 | ) | | | (5,076,689 | ) |
| Selling expenses | | | (624,151 | ) | | | (652,207 | ) | | | (1,272,010 | ) | | | (1,993,782 | ) |
| | | | | | | | | | | | | | | | | |
| Income(loss)from operations | | | (60,156 | ) | | | 3,059,785 | | | | 1, 140,204 | | | | 6,321,046 | |
| | | | | | | | | | | | | | | | | |
| Other income and expenses: | | | | | | | | | | | | | | | | |
| Other income | | | 186,259 | | | | 163,738 | | | | 440,470 | | | | 314,268 | |
| Loan interest expense | | | (152,059 | ) | | | (62,670 | ) | | | (455,762 | ) | | | (62,670 | ) |
| Exchange gain (loss) | | | 177,652 | | | | (112,384 | ) | | | 526,603 | | | | (530,934 | ) |
| Total other income (loss) | | | 211,852 | | | | (11,316 | ) | | | 511,311 | | | | (279,336 | ) |
| | | | | | | | | | | | | | | | | |
| Income before income taxes | | | 151,696 | | | | 3,048,469 | | | | 1,651,515 | | | | 6,041,710 | |
| | | | | | | | | | | | | | | | | |
| Income tax (expense) benefit | | | (124,662 | ) | | | (596,732 | ) | | | (594,377 | ) | | | (1,377,078 | ) |
| | | | | | | | | | | | | | | | | |
| Net income | | $ | 27,034 | | | $ | 2,451,737 | | | $ | 1,057,138 | | | $ | 4,664,632 | |
| | | | | | | | | | | | | | | | | |
| Foreign currency translation adjustment | | | 311,485 | | | | 10,172 | | | | 787,660 | | | | 18,322 | |
| | | | | | | | | | | | | | | | | |
| Comprehensive income | | $ | 338,519 | | | $ | 2,461,909 | | | $ | 1,844,798 | | | $ | 4,682,954 | |
| | | | | | | | | | | | | | | | | |
| Earnings per common share– basic | | $ | 0.00 | | | $ | 0.23 | | | $ | 0.10 | | | $ | 0.44 | |
| Earnings per common share– diluted | | | 0.00 | | | | 0.22 | | | | 0.09 | | | | 0.41 | |
| Weighted average number of common shares outstanding-basic | | | 11,188,882 | | | | 10,632,276 | | | | 11,039,880 | | | | 10,632,276 | |
| Weighted average number of common shares outstanding-diluted | | | 11,248,688 | | | | 11,365,597 | | | | 11,398,082 | | | | 11,277,845 | |
The accompanying notes are an integral part of these interim condensed consolidated financial statements.
TAKUNG ART CO., LTD AND SUBSIDIARIES
INTERIM CONDENSED CONSOLIDATED STATEMENT OF CASH FLOWS
(Stated in U.S. Dollars)
(UNAUDITED)
| | | For the Nine Months | | | For the Nine Months | |
| | | Ended | | | Ended | |
| | | September 30, | | | September 30, | |
| | | 2017 | | | 2016 | |
| Cash flows from operating activities: | | | | | | | | |
| Net cash provided by operating activities | | | 1,028,524 | | | | 5,635,391 | |
| | | | | | | | | |
| Cash flows from investing activities: | | | | | | | | |
| Purchase of property and equipment | | | (455,255 | ) | | | (976,460 | ) |
| Purchase of held-to-maturity investments | | | - | | | | (14,995,876 | ) |
| Purchase of available-for-sales investment | | | (53,501,874 | ) | | | (299,918 | ) |
| Maturity and redemption of available-for-sales investment | | | 53,501,874 | | | | - | |
| Maturity and redemption of held-to-maturity investments | | | - | | | | 14,995,876 | |
| Loan to third parties | | | (3,518,325 | ) | | | - | |
| Repayment from loan to third parties | | | 3,412,070 | | | | - | |
| Net cash used in investing activities | | | (561,510 | ) | | | (1,276,378 | ) |
| | | | | | | | | |
| Cash Flows from financing activities: | | | | | | | | |
| Proceeds from short-term borrowings | | | - | | | | 3,519,580 | |
| Proceeds from related party loans | | | - | | | | 2,340,895 | |
| Loan to third parties | | | - | | | | (3,513,534 | ) |
| Net cash provided by financing activities | | | - | | | | 2,346,941 | |
| | | | | | | | | |
| Effect of exchange rate change on cash and cash equivalents | | | 1,025,539 | | | | (644,375 | ) |
| | | | | | | | | |
| Net increase in cash and cash equivalents | | | 1,492,553 | | | | 6,061,579 | |
| | | | | | | | | |
| Cash and cash equivalents, beginning balance | | | 13,395,337 | | | | 10,769,456 | |
| | | | | | | | | |
| Cash and cash equivalents, ending balance | | $ | 14,887,890 | | | $ | 16,831,035 | |
| | | | | | | | | |
| Supplemental cash flows information: | | | | | | | | |
| Cash paid for interest | | $ | 212,954 | | | $ | - | |
| Cash paid for income tax | | $ | 136,453 | | | $ | 562,994 | |
The accompanying notes are an integral part of these interim condensed consolidated financial statements.
TAKUNG ART CO., LTD AND SUBSIDIARIES
NOTES TO INTERIM CONDENSED CONSOLIDATED FINANCIAL STATEMENTS
(Stated in U.S. Dollars except Number of Shares)
(UNAUDITED)
1. ORGANIZATION AND DESCRIPTION OF BUSINESS
Takung Art Co., Ltd and Subsidiaries (“Takung”, the “Company”, “we”, “us” and “our”), a Delaware corporation (formerly Cardigant Medical Inc.) through Hong Kong Takung Art Company Limited (formerly Hong Kong Takung Assets and Equity of Artworks Exchange Co., Ltd.) (“Hong Kong Takung”), a Hong Kong company and ourits wholly owned subsidiary, operates an electronic online platform located at www.takungae.com for artists, art dealers and art investors to offer and trade in valuable artwork.
Hong Kong Takung was incorporated in Hong Kong on September 17, 2012 and operates an electronic online platform for offering and trading artwork. For the period from September 17, 2012 (inception) to December 31, 2012, there was no operation except the issuance of shares for subscription receivable. We generateThe Company generates revenue from ourits services in connection with the offering and trading of artwork on ourits system, primarily consisting of listing fees, trading commissions, and management fees. We conduct ourThe Company conducts business primarily in Hong Kong, People’s Republic of China.
Takung (Shanghai) Co., Ltd (“Shanghai Takung”) is a limited liability company, with a registered capital of $1 million, located in the Shanghai Pilot Free Trade Zone. Shanghai Takung was incorporated on July 28, 2015. It is engaged in providing services to its parent company Hong Kong Takung by receiving deposits from and making payments to online artwork traders of Takung for and on behalf of Takung. Shanghai Takung was deregistered on May 8, 2020 and the Company merged the operations of Shanghai Takung with Takung Cultural Development (Tianjin) Co., Ltd.
Shanghai Takung set up a new office in Hangzhou, PRC on November 20, 2016 for technology development. Takung Cultural Development (Tianjin) Co., Ltd (“Tianjin Takung”) is a limited liability company, with a registered capital of $1 million located in Pilot Free Trade Zone. Tianjin Takung was incorporated on January 27, 2016.
Tianjin Takung provides technology supportdevelopment services to Hong Kong Takung and Shanghai Takung and also carries out marketing and promotion activities in mainland China. It is engaged in providing services to its parent company Hong Kong Takung by receiving deposits from and making payments to online artwork traders of Takung for and on behalf of Takung when Shanghai Takung was deregistered. On November 8, 2021, the Management became aware of the suspension of the operation of Tianjin Takung by the local authority.
Hong Kong Takung Art Holdings Company Limited (“Takung Art Holdings”) was formed in Hong Kong on July 20, 2018 and operates as a holding company to control an online platform for offering, selling and trading whole piece of artwork. Takung Art Holdings was deregistered on April 29, 2020 due to deregistration of its wholly-owned subsidiary, Art Era Internet Technology (Tianjin) Co., Ltd., on June 18, 2019.
Hong Kong MQ Group Limited (“Hong Kong MQ”) was formed in Hong Kong on November 27, 2018, and is engaged in blockchain and non-fungible tokens (“NFT”) businesses, including consultancy service for NFT launch projects, developing its own NFT marketplace to facilitate users to buy and sell NFTs, as well as development of block chain-based online games. On June 19, 2019, as a result of a private transaction, 1 (1) share of common stock of Hong Kong MQ was transferred from Ms. Hiu Ngai Ma to the Company. The net asset of Hong Kong MQ was $nil as of the acquisition date. The consideration paid for the ownership transfer, which represent 100% of the issued and outstanding share capital of Hong Kong MQ, was $0.13 (HK$1). Hong Kong MQ became a direct wholly-owned subsidiary of the Company.
MQ (Tianjin) Enterprise Management Consulting Co., Ltd. (“Tianjin MQ”) was incorporated in Tianjin, PRC on July 9, 2019 and is a directly wholly owned subsidiary of Hong Kong MQ. It was established as a limited liability company with a registered capital of $100,000 located in the Pilot Free Trade Zone in Tianjin. Tianjin MQ focused on exploring business opportunities and promoting its artwork trading business. Tianjin MQ was deregistered on August 10, 2020 due to the Company streamlining its operation.
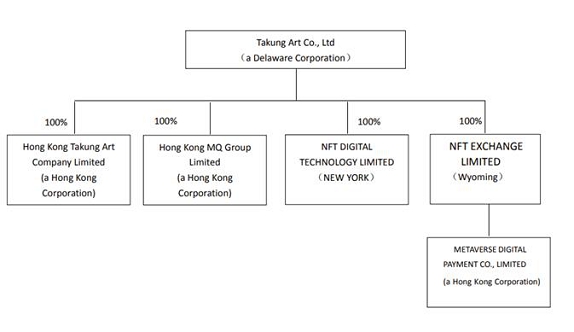
NFT Digital Technology Limited (“NFT Digital”) was incorporated in Albany, New York on December 13, 2021 and is a wholly-owned subsidiary of Takung. This entity primarily provides administrative and technical supports for the development of NFT projects.
NFT Exchange Limited (“NFT Exchange”) was incorporated in Wyoming on January 7, 2022 and is wholly owned by Takung. This entity facilitates the business and operation of the new NFT exchange market.
Metaverse Digital Payment Co., Limited (“Metaverse”) was formed in Hong Kong on January 27, 2022, and is wholly owned by NFT Exchange. This entity is engaged in digital payment service.
Cultural Objects Provenance Holdings Limited
Cultural Objects Provenance Holdings Limited is an investment holding company. Its wholly-owned subsidiary is headquartered in Hong Kong, with global outposts in China (Shenzhen), Europe (Germany), and USA (NY/LA). It is an artwork authentication platform powered by blockchain. According to company home page, the subsidiary is the official technology partner for NANZUKA Gallery in Tokyo, Japan. It authenticated some sought-after editions and limited edition works from some of the world’s most prolific artists, including Hajime Sorayama, Javier Calleja, Daniel Arsham, James Jarvis, and more.
On May 28, 2021, Takung entered into a Securities Purchase Agreement (the “SPA”) with Cultural Objects Provenance Holdings Limited (“Cultural Objects”), a British Virgin Islands company with a wholly-owned subsidiary in Hong Kong engaging in an operation of an artwork authentication platform powered by blockchain with global presence in China, Germany and the United States. Takung shall invest in Cultural Objects through paying certain purchase that consists of cash consideration, $500,000 and issuance of 282,000 shares of common stock of Takung in exchange for 54,100 shares of common stock of Cultural Objects and 290,000 unvested restricted shares of common stock of Takung to Cultural Objects in exchange for 32,460 unvested shares of common stock of Cultural Objects.
On August 21, 2021, Takung and Cultural Objects entered to an amendment to the SPA. The amendment provides that the original purchase price was amended to be $500,000 in cash and the issuance of 771,040 restricted shares of common stock of Takung to Cultural Objects in exchange for 54,100 shares of common stock of Cultural Objects, and, subject to the satisfaction of the conditions stipulated in the SPA, the issuance of 787,440 unvested restricted shares of common stock of Takung to Cultural Objects in exchange for 32,460 unvested shares of common stock of Cultural Objects. The cash consideration of $500,000 was paid to Cultural Objects by the end of August 2021. On September 9, 2021, an aggregate amount of 1,558,480 restricted shares of common stock of Takung issued to Cultural Objects in an exchange for an aggregate 86,560 shares of common stock of Cultural Objects. Together with the cash consideration paid $500,000 and the total value of the restricted shares issued to Cultural Objects, $10,130,120, the total value of the investment in Cultural Objects was $10,630,120. As of December 31, 2021, the initial cost of this investment was adjusted to $9,296,614 after an impairment charge, $1,333,506 was recorded (see Note 4).
2. SUMMARY OF SIGNIFICANT ACCOUNTING POLICIES
Basis of Presentationpresentation
The accompanying condensed consolidated balance sheet as of December 31, 2016, which has been derived from audited financial statements, and the unaudited interim condensed consolidated financial statements as of September 30, 2017 and for the three months ended and nine months ended September 30, 2017 and 2016 have been prepared pursuant to the rules and regulations of the Securities and Exchange Commission (the “SEC”). Certain information and disclosures, which are normally included in financial statements prepared in accordance with U.S. GAAP, have been omitted pursuant to such rules and regulations, although the management believes that the disclosures made are adequate to provide for fair presentation. The interim financial information should be read in conjunction with the Financial Statements and the notes thereto includedgenerally accepted accounting principles in the Company’s Annual Report on Form 10-K for the fiscal year ended December 31, 2016, previously filed with the SEC.United States (“U.S. GAAP”).
This basis of accounting involves the application of accrual accounting and consequently, revenues and gains are recognized when earned, and expenses and losses are recognized when incurred. The Company’s financial statements are expressed in U.S. dollars.
Use of estimates
In the opinion
The preparation of management, all adjustments (which include normal recurring adjustments) necessary to present a fair statement of the Company’s unaudited interim condensed consolidated financial positionstatements in conformity with U.S. GAAP requires management to make estimates and assumptions that affect the reported amounts of assets and liabilities and disclosure of contingent assets and liabilities at the date of the interim condensed consolidated financial statements and the amount of revenues and expenses during the reporting periods. Actual results could differ materially from those results.
Basis of consolidation
The interim condensed consolidated financial statements include the financial statements of the Company, and its subsidiaries, NFT Exchange, NFT Digital, Hong Kong Takung, Tianjin Takung and Hong Kong MQ. All intercompany transactions and balances have been eliminated on consolidation.
Discontinued operations
The Company has adopted ASC Topic 205 “Presentation of Financial Statements” Subtopic 20-45, in determining whether any of its business component(s) classified as held for sale, disposed of by sale or other than by sale is required to be reported in discontinued operations. In accordance with ASC Topic 205-20-45-1, a discontinued operation may include a component of an entity or a group of components of an entity, or a business or non-profit activity. A disposal of a component of an entity or a group of components of an entity is required to be reported in discontinued operations if the disposal represents a strategic shift that has (or will have) a major effect on an entity’s operations and financial results when any of the following occurs: (1) the component of an entity or group of components of an entity meets the criteria to be classified as held for sale; (2) the component of an entity or group of components of an entity is disposed of by sale; (3) the component of an entity or group of components of an entity is disposed of other than by sale (for example, by abandonment or in a distribution to owners in a spinoff).
For the component disposed of other than by sale in accordance with paragraph 360-10-45-15, the Company adopted ASC Topic 205-20-45-3 and reported the results of operations of the discontinued operations, less applicable income tax expenses or benefits as a separate component in in the statement where net income (loss) is reported for current and all prior periods presented.
Due to the suspension of the operation of Tianjin Takung by the local authority in the fourth quarter of 2021, Hong Kong Takung lost its control over Tianjin Takung. The Company plans to dispose Hong Kong Takung, and is actively seeking buyers for Hong Kong Takung and related operations in order to focus on its blockchain and NFT business operation. As of March 31, 2022 and December 31, 2021, the operation of Hong Kong Takung was classified as a discontinued operation and as of September 30, 2017,December 31, 2021, the operation Tianjin Takung was deconsolidated. For the three months ended March 31, 2022, the operation of Hong Kong Takung was presented in discontinued operations. For the three months ended March 31, 2021, the operations of Hong Kong Takung and Tianjin Takung were reclassified as discontinued operations.
Deconsolidation
Under the ASC Subtopic 810-10-40, “Consolidation-Overall-Derecognition”, a reporting entity will deconsolidate a subsidiary in the period when the loss of control over such subsidiary incurred as a result of one or more of the following events: (i) a parent sells all or part of its ownership interest in its subsidiary; (ii) the expiration of a contractual agreement that gave control of the subsidiary to the parent; (iii) the subsidiary issues shares which reduces the parent’s ownership interest in the subsidiary to an extent that the parent no longer has a controlling financial interest in such subsidiary; (iv) the subsidiary becomes subject to the control of a government, court, administrator, or regulator. Upon deconsolidation, the reporting entity would no longer include the subsidiary’s assets, liabilities and results of operations in its consolidated resultsfinancial statements. Due to the suspension of the operation of Tianjin Takung by the local authority. The financial information of Tianjin Takung was deconsolidated as of December 31, 2021.
Reclassification
Certain prior period amounts have been reclassified to conform to current period presentation in order to reflect the discontinued operations of Tianjin Takung and Hong Kong Takung. None of these reclassifications had an impact on reported financial position or cash flows for any of the periods presented.
Fair value measurements
The Company applies the provisions of ASC Subtopic 820-10, “Fair Value Measurements”, for fair value measurements of financial assets and financial liabilities and for fair value measurements of non-financial items that are recognized or disclosed at fair value in the financial statements. ASC 820 also establishes a framework for measuring fair value and expands disclosures about fair value measurements.
Fair value is defined as the price that would be received to sell an asset or paid to transfer a liability in an orderly transaction between market participants at the measurement date. When determining the fair value measurements for assets and liabilities required or permitted to be recorded at fair value, the Company considers the principal or most advantageous market in which it would transact and it considers assumptions that market participants would use when pricing the asset or liability.
ASC 820 establishes a fair value hierarchy that requires an entity to maximize the use of observable inputs and minimize the use of unobservable inputs when measuring fair value. ASC 820 establishes three levels of inputs that may be used to measure fair value. The hierarchy gives the highest priority to unadjusted quoted prices in active markets for identical assets or liabilities (Level 1 measurements) and the lowest priority to measurements involving significant unobservable inputs (Level 3 measurements). The three levels of the fair value hierarchy are as follows:
| ● | Level 1 inputs to the valuation methodology are quoted prices (unadjusted) for identical assets or liabilities in active markets. |
| ● | Level 2 inputs to the valuation methodology include quoted prices for similar assets and liabilities in active markets, and inputs that are observable for the assets or liability, either directly or indirectly, for substantially the full term of the financial instruments. |
| | |
| ● | Level 3 inputs to the valuation methodology are unobservable and significant to the fair value. |
There were no assets or liabilities measured at fair value on a recurring basis subject to the disclosure requirements of ASC 820 as of March 31, 2022 and December 31, 2021.
Comprehensive loss
The Company follows the provisions of the Financial Accounting Standards Board (the “FASB”) Accounting Standards Codification (“ASC”) 220 “Reporting Comprehensive Income” and establishes standards for the reporting and display of comprehensive income, its components and accumulated balances in a full set of general purpose financial statements. For the three months ended March 31, 2022 and 2021, the Company’s comprehensive loss includes net loss and foreign currency translation adjustment.
Foreign currency translation and transaction
The functional currency of Hong Kong Takung, Hong Kong MQ and Tianjin Takung are the Hong Kong Dollar (“HKD”).
The reporting currency of the Company is the United States Dollar (“USD”).
Transactions in currencies other than the entity’s functional currency are recorded at the rates of exchange prevailing on the date of the transaction. At the end of each reporting period, monetary items denominated in foreign currencies are translated at the rates prevailing at the end of the reporting periods. Exchange differences arising on the settlement of monetary items and on re-translation of monetary items at period-end are included in income statement of the period.
For the purpose of presenting these financial statements, the Company’s assets and liabilities with functional currency of HKD are expressed in USD at the exchange rate on the balance sheet’s dates, which is 7.8325 and 7.7996 as of March 31, 2022 and December 31, 2021, respectively; stockholder’s equity accounts are translated at historical rates, and income and expense items are translated at the weighted average exchange rates during the year, which is 7.8056 and 7.7577 for the three months ended March 31, 2022 and 2021, respectively. For Renminbi currency, the Company’s assets and liabilities are expressed in USD at the exchange rate on the balance sheet date, which is 6.3393 and 6.373 as of March 31, 2022 and December 31, 2021 respectively. Stockholder’s equity accounts are translated at historical rates, and income and expense items are translated at the weighted average exchange rates during the year, which is 6.3478 and 6.4817 for the three months ended March 31, 2022 and 2021.
The resulting translation adjustments are reported under accumulated other comprehensive loss in the stockholders’ equity section of the balance sheets.
Cash and cash equivalents
Cash and cash equivalents consist of cash on hand, cash in bank with no restrictions, as well as highly liquid investments which are unrestricted as to withdrawal or use, and which have original maturities of three months or less when initially purchased.
Restricted cash
Restricted cash represents the cash deposited by the NFT traders into a specific bank account under Takung (“the broker’s account”) in order to facilitate the trading of NFT in our online NFT platform. After the user’s registration is successful, the customer deposits must be transferred to the designated account of the platform through the bank account added by the user before the transaction starts, and a transfer application is submitted on the platform, which can enter the buyer’s platform account after financial review. Except for instructing the bank to deduct the commission, Takung has no right to use any funds in the broker’s account. Our restricted cash is denominated in USD. As of March 31, 2022, the ending balance of our restricted cash was $2,028,416.
Accounts receivable and allowance for doubtful accounts
Accounts receivable are recorded and carried at the original invoiced amount less an allowance for any potential uncollectible amounts. The Company makes estimates for the allowance for doubtful accounts based upon the assessment of various factors, including historical, experience, the age of the accounts receivable balances, credit quality of the customers, current economic conditions, and other factors that may affect customers’ ability to pay.
Loan receivable
Loan to third parties is presented under current asset of the balance sheets based on the nature and loan period of time.
Prepayment and other current assets, net
Prepayment and other current assets mainly consist of the prepayment for income taxes, maintenance of online trading system, advertising and promotional services, insurances, financial advisory, professional services, rental deposits, as well as other current assets.
Other non-current assets
A portion of the deposits, are presented under the non-current section of the balance sheets based on the expected collection date.
Property and equipment, net
Property and equipment are stated at cost less accumulated depreciation and impairment losses. Gains or losses on dispositions of property and equipment are included in operating income or expense. Major additions, renewals and betterments are capitalized, while maintenance and repairs are expensed as incurred. Depreciation and amortization are provided over the estimated useful lives of the assets using the straight-line method from the time the assets are placed in service.
The Company developed systems and solutions for solely internal use. Certain costs incurred in connection with developing or obtaining internal use software are capitalized. Unamortized capitalized costs are included in computer trading and clearing system, within property and equipment, net in the Consolidated Balance Sheets. Capitalized software costs are amortized on a straight-line basis over the estimated useful lives of the software of 5 years. Amortization of these costs is included in depreciation and amortization expense in the Consolidated Statements of Operations.
Estimated useful lives are as follows, taking into account the assets’ estimated residual value:
| Classification | | Estimated
useful life |
| Furniture, fixtures and equipment | | 5 years |
| Leasehold improvements | | Shorter of the remaining lease
terms and the estimated 3 years |
| Computer trading and clearing system | | 5 years |
Long-lived assets
The Company evaluates its long-lived assets for impairment whenever events or changes in circumstances indicate that the carrying amount of the assets may not be recoverable. When these events occur, the Company assesses the recoverability of these long-lived assets by comparing the carrying amount of the assets to the future undiscounted cash flows expected to result from the use of the assets and their eventual disposition. If the future undiscounted cash flow is less than the carrying amount of the assets, the Company recognizes an impairment equal to the difference between the carrying amount and fair value of these assets.
During 2021, we recorded $16.3 million in asset impairments due to the deconsolidation of Tianjin Takung as a result of the loss of control in this entity. Please refer to Note 5 for details. In addition, we determined that the future undiscounted cash flow was less than the carrying cost of our non-marketable investment and recognized an impairment charge, $1,333,506, against our non-marketable investment. Please refer to Note 4 for details.
Intangible assets
Intangible assets represent the licensing cost for the trademark registration. For intangible assets with indefinite lives, the Company evaluates intangible assets for impairment at least annually and more often whenever events or changes in circumstances indicate that the carrying value may not be recoverable. Whenever any such impairment exists, an impairment loss will be recognized for the amount by which the carrying value exceeds the fair value. For intangible assets with definite lives, they are amortized over estimated useful lives, and are reviewed annually for impairment. The Company has not recorded impairment of intangible assets as of March 31, 2022 and December 31, 2021
Advance from customers
Advance from customers represent the cash deposited by the traders into a specific bank account under Takung (“the broker’s account”) in order to facilitate the trading ownership units of the NFT. The traders are required to have their funds transferred to the broker’s account before the trading take place.
Revenue Recognition
Under ASC 606, an entity recognizes revenue as the Company satisfies a performance obligation when its customer obtains control of promised goods or services, in an amount that reflects the consideration that the entity expects to receive in exchange for those goods or services. To determine revenue recognition for arrangements that an entity determines are within the scope of ASC 606, the Company performs the following five steps: (i) identify the contract(s) with a customer; (ii) identify the performance obligations in the contract; (iii) determine the transaction price, including variable consideration, if any; (iv) allocate the transaction price to the performance obligations in the contract; and (v) recognize revenue when (or as) the entity satisfies a performance obligation. The Company only applies the five-step model to contracts when it is probable that the Company will collect the consideration to which it is entitled in exchange for the goods or services it transfers to the customer.
The Company recognizes revenue when control of the promised services is transferred to the traders. Revenue is measured at the transaction price, which is based on the amount of consideration that the Company expects to receive in exchange for transferring the promised services to the traders.
Our discontinued operations generated revenue from its services in connection with the offering and trading of artworks on the Company’s legacy online trading system primarily consisted of listing fee, commission fee and management fee.
Listing fee
The Company recognizes the listing fee revenue at a point in time when the ownership units of the artwork are listed and available for trading on the Company’s system, at an amount of an agreed percentage of the total offering price. The amount is collected from the money raised from the issuance of such units.
Commission
The Company generates commission fee from non-VIP traders and selected traders.
For non-VIP traders, the commission is calculated based on a percentage of transaction value of artworks when there is purchase and sale of the ownership shares of the artworks. The commission revenue is recognized at a point in time when each purchase and sale transaction is completed.
For selected traders, starting from April 1, 2016, the Company charged a predetermined monthly commission fee which allows the selected traders to conduct unlimited trades for specific artworks. The commission revenue is recognized on a monthly basis as the Company continuously satisfied its performance obligation.
Management fee
The Company provides custody and insurance service for artworks listed and traded on the Company’s platform. Management fee is calculated at a rate of $0.0013 (HK$0.01) per 100 artwork units per day. The management fee is recognized and is deducted from proceeds from the sale of artwork ownership shares when there is a purchase and sale transaction. A discount program is offered to waive the management fee during certain promotion periods. Such discounts are recognized as a reduction of the revenue.
For the three months ended March 31, 2021, we reclassified and included our listing fee, commission fee and management fee in net loss from discontinued operations. For the three months ended March 31, 2022, due to the suspension of the operation of Tianjin Takung, we did not earn or recognize any revenue from the online legacy trading platform.
Beginning in the fourth quarter 2021, we introduced consultancy service and setup NFT business through our subsidiaries, NFT Exchange and NFT Digital. In early May 2022, we launched a NFT trading platform at www.nftoeo.com. Through the new NFT platform, we introduced three main revenue categories: (i) membership fee, (ii) commission, and (iii) advertising fee. For the three months ended March 31, 2022, we haven’t generated any revenue from our NFT platform.
Revenue by customer type
The following table presents the revenue by customer type from our discontinued operations for the years ended March 31, 2022 and 2021:
| | | For three months ended
March 31, | |
| | | 2022 | | | 2021 | |
| Artwork owners | | $ | - | | | $ | 273,792 | |
| Non - VIP traders | | | - | | | | 312,640 | |
| VIP traders | | | - | | | | 192,676 | |
| Subtotal | | | - | | | | 779,108 | |
| Less: Revenue- discontinued operations | | | - | | | | (779,108 | ) |
| Total | | $ | - | | | $ | - | |
Cost of revenue
The Company’s cost of revenue primarily consists of expenses associated with the delivery of its service of our discontinued operations. These include expenses related to the operation of the data centers, such as facility and lease of the server equipment, development and maintenance of the platform system, as well as the cost of insurance, storage and transportation of the artworks. Cost of revenue also includes commission paid to service agent.
| | | For three months ended
March 31, | |
| | | 2022 | | | 2021 | |
| Commission paid to service agents | | $ | - | | | $ | 135,174 | |
| Depreciation | | | - | | | | 69,062 | |
| Internet service charge | | | - | | | | 19,169 | |
| Artwork insurance | | | - | | | | 12,744 | |
| Artwork storage | | | - | | | | 16,088 | |
| Subtotal | | | - | | | | 252,237 | |
| Less: Cost of revenue – discontinued operations | | | - | | | | (252,237 | ) |
| Total | | $ | - | | | $ | - | |
The Company has elected to apply the practical expedient in ASC 606-10 and does not disclose information about remaining performance obligations that have original expected durations of one year or less.
For the three months ended March 31, 2021, the Company does not have amounts of contract assets that it has right to consideration in exchange for services that the Company has transferred to customers when that right is conditioned on something other than the passage of time. The contract liabilities are the Company’s obligation to transfer services to traders for which the Company has received consideration from the traders. All contract liabilities are expected to be recognized as revenue within one month and are presented in Advance from Customers in the Interim Condensed Consolidated Balance Sheet. The cost of revenue for the three months ended March 31, 2021 was included in the discontinued operations.
For the three months ended March 31, 2022, the cost of revenue incurred by our continuing operations was nil as no revenue was generated in this period as explained aforementioned.
Leases
In February 2016, the FASB issued ASU 2016-12, Leases (ASC Topic 842), which amends the leases requirements in ASC Topic 840, Leases. Under the new lease accounting standard, a lessee will be required to recognize a right-of-use asset and lease liability for most leases on the balance sheet. The new standard also modifies the classification criteria and accounting for sales-type and direct financing leases, and enhances the disclosure requirements. Leases will continue to be classified as either finance or operating leases.
The Company determines if an arrangement is a lease at inception. The lease payments under the lease arrangements are fixed. Non-lease components include payments for building management, utilities and property tax. It separates the non-lease components from the lease components to which they relate.
Lease assets and liabilities are recognized at the present value of the future lease payments at the lease commencement date. The interest rate used to determine the present value of the future lease payments is the Company’s incremental borrowing rate, because the interest rate implicit in the leases is not readily determinable. The incremental borrowing rate is estimated to approximate the interest rate on a collateralized basis with similar terms and payments, and in economic environments where the leased asset is located. The lease terms include periods under options to extend or terminate the lease when it is reasonably certain that the Company will exercise that option. The Company generally uses the base, non-cancellable, lease term when determining the lease assets and liabilities.
Income taxes
The Company accounts for income taxes using an asset and liability approach which allows for the recognition and measurement of deferred tax assets based upon the likelihood of realization of tax benefits in future years. Under the asset and liability approach, deferred taxes are provided for the net tax effects of temporary differences between the carrying amounts of assets and liabilities for financial reporting purposes and the amounts used for income tax purposes. A valuation allowance is provided for deferred tax assets if it is more likely than not that these items will either expire before the Company is able to realize their benefits, or that future deductibility is uncertain.
Under ASC 740, a tax position is recognized as a benefit only if it is “more likely than not” that the tax position would be sustained in a tax examination, with a tax examination being presumed to occur. The evaluation of a tax position is a two-step process. The first step is to determine whether it is more-likely-than-not that a tax position will be sustained upon examination, including the resolution of any related appeals or litigations based on the technical merits of that position. The second step is to measure a tax position that meets the more-likely-than-not threshold to determine the amount of benefit to be recognized in the financial statements. A tax position is measured at the largest amount of benefit that is greater than 50 percent likely of being realized upon ultimate settlement. Tax positions that previously failed to meet the more-likely-than-not recognition threshold should be recognized in the first subsequent period in which the threshold is met. Previously recognized tax positions that no longer meet the more-likely-than-not criteria should be de-recognized in the first subsequent financial reporting period in which the threshold is no longer met. Penalties and interest incurred related to underpayment of income tax are classified as income tax expense in the year incurred. GAAP also provides guidance on de-recognition, classification, interest and penalties, accounting in interim periods, disclosures and transition.
The Company accounts for an unrecognized tax benefit from an uncertain tax position only if it is more likely than not that the tax position will be sustained upon examination by the tax authorities. The Company considers and estimates interest and penalties related to the gross unrecognized tax benefits and includes as part of its income tax provision based on the applicable income tax regulations.
The Company did not accrue any liability, interest or penalties related to uncertain tax positions in the provision for income taxes line of the interim condensed consolidated statements of operations for the three months ended March 31, 2022 and as of December 31, 2021.
Earnings (loss) per share
Basic net income (loss) per share (EPS) is computed by dividing net income (loss) by the weighted-average number of shares of common stock outstanding during the year. Diluted income (loss) per share is computed by dividing net income (loss) available to common stockholders by the weighted-average number of shares of common stock outstanding during the period adjusted to include the effect of potentially dilutive securities. Potentially dilutive securities are excluded from the computation of dilutive EPS in periods in which the effect would be antidilutive (Note 18).
Concentration of risks
Concentration of credit risk
Financial instruments that potentially expose the Company to concentrations of credit risk consist primarily of cash and cash equivalents, restricted cash, account receivables. The carrying values of the financial instruments approximate their fair values due to their short-term maturities. The Company places its cash and cash equivalents and restricted cash with financial institutions with high-credit ratings and quality. Account receivables primarily comprise of amounts receivable from the trader customers. With respect to the prepayment to service suppliers, the Company performs on-going credit evaluations of the financial condition of these suppliers. The Company establishes an allowance for doubtful accounts based upon estimates, factors surrounding the credit risk of specific service providers and other information.
Concentration of customers
There were no revenues from customers that individually represent greater than 10% of the total revenues during the three months ended March 31, 2022 and 2021.
Concentration of customer deposits
As of March 31, 2022 and December 31, 2021, there were no traders that individually accounted for greater than 10% of the Company’s total customer deposits.
Accounting standards adopted on January 1, 2021
Income Taxes: On December 18, 2019, the FASB issued ASU No. 2019-12, Income taxes (Topic 740), Simplifying the Accounting for Income Taxes. This guidance amends ASC Topic 740 and addresses several aspects including 1) evaluation of step-up tax basis of goodwill when there is not a business combination, 2) policy election to not allocate consolidated taxes on a separate entity basis to entities not subject to income tax, 3) accounting for tax law changes or rates during interim periods, 4) ownership changes from equity method investment to subsidiary or vice versa, 5) elimination of exception to intraperiod allocation when there is gain in discontinued operations and a loss from continuing operations, 6) treatment of franchise taxes that are partially based on income. The Company adopted ASU2019-12 effective January 1, 2021.
Accounting pronouncements issued but not yet adopted
Financial Instruments - Credit Losses: In June 2016, the FASB issued ASU 2016-13, Financial Instruments - Credit Losses (Topic 326): The amendments in this Update require a financial asset (or a group of financial assets) measured at amortized cost basis to be presented at the net amount expected to be collected. The amendments broaden the information that an entity must consider in developing its expected credit loss estimate for assets measured either collectively or individually. The use of forecasted information incorporates more timely information in the estimate of expected credit loss, which will be more decision useful to users of the financial statements. In November 2019, FASB issued ASU 2019-10, “Financial Instruments – Credit Losses (Topic 326), Derivatives and Hedging (Topic 815), and Leases (Topic 842).” This ASU defers the effective date of ASU 2016-13 for public companies that are considered smaller reporting companies as defined by the SEC to fiscal years beginning after December 15, 2022, including interim periods within those fiscal years. The Company is planning to adopt this standard in the first quarter of fiscal 2023.The Company is currently evaluating the potential effects of adopting the provisions of ASU No. 2016-13 on its consolidated financial statements, particularly its recognition of allowances for accounts receivable.
The Company does not believe other recently issued but not yet effective accounting standards, if currently adopted, would have a material effect on the consolidated financial position, statements of operations and cash flowsflows.
3. GOING CONCERN
Since the suspension of the operation of Tianjin Takung in the fourth quarter 2021 and Hong Kong Takung lost the control over Tianjin Takung, the Company plans to dispose Hong Kong Takung and is actively seeking a purchaser. Accordingly, we reclassified the operation of Hong Kong Takung as a discontinued operation and deconsolidated the operation of Tianjin Takung. In May 2022, the online NFT trading platform was placed in services and we focused on developing our blockchain NFT business.
Management has assessed the Company’s ability to continue as a going concern in accordance with the requirements of ASC 205-40 and, based on the above factors, the management has concluded that there is substantial doubt about its ability to continue as a going concern within one year from the issuance date of the Company’s consolidated financial statements. Management’s plan to alleviate the going concern risk includes, but not limited to, (1) equity or debt financing, (2) increasing cash generated from new business model operations, and (3) financing from domestic banks and other financial institutions. The management of the Company has made the following plans to mitigate these adverse conditions and to increase the liquidity of the Company.
Management’s Plan
Private Investment in Public Equity (“PIPE”) Transaction
The Company entered into certain securities purchase agreement on February 23, 2022 (the “SPA”) with certain non-affiliated and accredited “non-U.S. Persons”, (the “Purchasers”) as defined in Regulation S of the Securities Act of 1933, as amended (the “Securities Act”), pursuant to which the Company agreed to sell 11,952,190 units, each consisting of one share of Common Stock (the “Shares”) and a warrant (the “Warrant”) to purchase three Shares.
On March 9, 2022, the Company and the Purchasers agreed to amend and restate the SPA (the “A&R SPA”) to amend the number of units sold, per unit purchase price, and the terms of the warrants underlying the units. Pursuant to the terms of the A&R SPA, the Company agreed to sell 10,238,910 units (the “Units”), each Unit consisting of one Share and a Warrant to purchase three Shares with a purchase price per Unit of $2.93.
On April 14, 2022, the transaction contemplated by the A&R SPA was completed and closed. The gross proceeds to the Company from this offering was approximately $30 million which was received in April 2022.
New Business Model Operations
The Company plans to further develop its operations of blockchain and NFT related businesses, including consultancy services, development of NFT marketplace and “Play-to-Earn” style blockchain-based online games. “Play to Earn” is essentially a business model powered by blockchain technology, where players can acquire in-game assets or token ownership by recharging and playing games. In May 2022, our NFT trading platform at www.nftoeo.com was launched and we anticipate the NFT business will generate revenue from member fee, trading commission and advertising fee.
Meanwhile, the Company is actively seeking other strategic partners with resources that can expand its blockchain and NFT businesses.
The Company has recruited a global management team and technology research and development team to develop new products and new business directions that combine education and technology to provide online service in Metaverse. In order to diversify the political risks and legal scrutiny arising from the PRC regulations imposed with regards to digital assets, the Company has also decided to expand its business outside China, such as United States and Canada.
The Company has set up the new corporate structure for its new business stream as follows:
4. INVESTMENTS
We adopted ASU 2016-01 on January 1, 2018. This guidance requires us to measure all equity investments that are not accounted for under the equity method or result in consolidation at fair value and recognize any changes in net income. For equity investments with readily determinable and observable fair values, we use quoted market prices to determine the fair value of equity securities. For equity investments without readily determinable fair values, we have elected the measurement alternative under which we measure these investments at cost minus impairment, if any, plus or minus changes resulting from observable price changes in orderly transactions for the nine-month periodsidentical or a similar investment of the same issuer.
Equity investments with readily determinable fair values that are not accounted for under the equity method classified as trading are not assessed for impairment, since they are carried at fair value with the change in fair value included in net income. Similarly, prior to the adoption of ASU 2016-01, equity investment classified as trading was not tested for impairment.
Equity investments without readily determinable fair values are reviewed each reporting period to determine whether a significant event or change in circumstances has occurred that may have an adverse effect on the fair value of each investment. When such events or changes occur, we assess the fair value compared to our cost basis in the investment. We also perform this assessment every reporting period for each investment for which our cost basis has exceeded the fair value.
For investments in privately-held companies, management’s assessment of fair value is based on valuation methodologies such as discounted cash flows, estimates of revenue and appraisals, as applicable. We consider and apply the assumptions that we believe market participants would use in evaluating estimated future cash flows when utilizing the discounted cash flow or estimates of revenue valuation methodologies. In the event the fair value of an investment declines below our cost basis, management determines if the decline in fair value is other than temporary and records an impairment accordingly.
As of December 31, 2021, our investment merely includes a non-marketable investment in a privately held company incorporated in British Virgin Islands without readily determinable market values. We elected the measurement alternative under which we measured the investment at cost minus impairment with an adjustment to the changes from observable price changes in orderly transactions for the similar investments of the same issuer.
Management considered market conditions as the result of the global pandemic and other global macroeconomic conditions and the potential impact on the value of the Company’s investment; accordingly, management conducted a review of each of its investments. After its review management determined that the future undiscounted cash flows were less than the carrying cost of our non-marketable investment and recognized an impairment charge, $1,333,506, against our non-marketable investment. Management estimated future revenues and costs, and the related cash flows regarding this investment, as well as applying assumptions regarding the proper inputs into the weighted average cost of capital which included the consideration of comparable market participants and the Company’s own capital structure in developing a discounted flow model to determine an update carrying value for the private-held investment.
The carrying value is measured as the total initial cost minus impairment. The carrying value for our non-marketable investment is summarized below:
| | | March 31, | | | December 31, | |
| | | 2022 | | | 2021 | |
| | | | | | | |
| Total initial cost | | $ | 10,630,120 | | | $ | 10,630,120 | |
| Cumulative net gain (loss) | | | — | | | | — | |
| Provision for impairment | | | (1,333,506 | ) | | | (1,333,506 | |
| Total carrying value | | $ | 9,296,614 | | | $ | 9,296,614 | |
For the three months ended September 30, 2017March 31, 2022, we did not incur any unrealized gain or loss in connection with the non-marketable investment. Since the investment was acquired in August 2021, there was no unrealized gain or loss incurred for the three months ended March 31, 2021.
5. ASSET IMPAIRMENTS
Our subsidiary, Hong Kong Takung, recorded an asset impairment charge of $16,538,781, as a result of the deconsolidation of Tianjin Takung due to the loss of control of Tianjin Takung in the fourth quarter of 2021. Hong Kong Takung considered the receivables from Tianjin Takung to be uncollectible and 2016, as applicable,wrote off its investment in Tianjin Takung. These charges have been made. The interim results ofincluded in the net loss from discontinued operations are not necessarily indicativefor the year ended December 31, 2021. As of the operating results for the full fiscal year or any future periods. March 31, 2022, we did not incur additional receivable balances nor impairments.
The following represents the detail of the asset impairments as of March 31, 2022 and December 31, 2021.
| | | March 31, | | | December 31, | |
| | | 2022 | | | 2021 | |
| | | | | | | |
| Receivables from Tianjin Takung | | $ | - | | | $ | 16,388,254 | |
| Investment in Tianjin Takung | | | - | | | | 150,527 | |
| Subtotal | | | - | | | | 16,538,781 | |
| Less: asset impairments – discontinued operations | | $ | - | | | $ | (16,538,781 | |
| Total | | | - | | | | - | |
3.
6. PREPAYMENT AND OTHER CURRENT ASSETS, NET
Prepayment and other current assets mainly consist of the prepaid tax, the prepaid services for development, maintenance of online trading system, the advertising and promotional services, prepaid financial advisory and banking services, as well as other current assets.
| | | September 30,
2017 | | | December 31,
2016 | |
| | | (Unaudited) | | | | |
| Advertising and promotional services | | | 438,741 | | | | 296,163 | |
| Prepaid professional fee | | | 144,706 | | | | - | |
| Prepaid rental expense | | | 82,793 | | | | 60,822 | |
| Prepaid insurance | | | 54,875 | | | | 31,082 | |
| Prepaid maintenance of trading system | | | 78,784 | | | | 17,514 | |
| Staff advance | | | 11,263 | | | | 28,806 | |
| Prepaid financial advisory and banking services | | | 39,153 | | | | 201,808 | |
| Short-term borrowings to third party | | | - | | | | 259,254 | |
| Other current assets | | | 19,916 | | | | 72,997 | |
| Prepayment and other current assets | | $ | 870,231 | | | $ | 968,446 | |
| | | March 31,
2022 | | | December 31,
2021 | |
| | | (Unaudited) | | | | |
| Prepaid service fees | | $ | - | | | $ | 196,497 | |
| Deposit | | | 5,557 | | | | 5,557 | |
| Other current assets | | | 115,676 | | | | 2,791 | |
| Less: allowance for doubtful accounts | | | - | | | | - | |
| Subtotal | | | 121,233 | | | | 204,845 | |
| Less: Prepayment and other current assets, net – discontinued operations | | | (17,985 | ) | | | (34,937 | ) |
| Prepayment and other current assets, net | | $ | 103,248 | | | $ | 169,908 | |
4.For the three months ended March 31, 2022 and 2021, the Company did not incur provision for doubtful accounts.
7. ACCOUNT RECEIVABLES, NET
Account receivables consisted of the following:
| | | September 30,
2017 | | | December 31,
2016 | |
| | | (Unaudited) | | | | |
| Listing fee | | $ | 1,562,924 | | | $ | 1,403,255 | |
| Authorized agent subscription revenue | | | 924,100 | | | | 995,453 | |
| Monthly commission fee | | | 1,422,750 | | | | 605,677 | |
| Others | | | 63,323 | | | | 54,183 | |
| Less: allowance for doubtful accounts | | | (240,528 | ) | | | - | |
| Account receivables, net | | $ | 3,732,569 | | | $ | 3,058,568 | |
| | | March 31,
2022 | | | December 31,
2021 | |
| | | (Unaudited) | | | | |
| Listing fee | | $ | - | | | $ | 154,771 | |
| Consultancy service | | | 119,496 | | | | 120,000 | |
| Less: allowance for doubtful accounts | | | - | | | | (154,771 | ) |
| Account receivables, net | | $ | 119,496 | | | $ | 120,000 | |
For the three months ended March 31, 2022 and 2021, we did not incur provision for doubtful accounts.
8. PROPERTY AND EQUIPMENT, NET
Management reviewed the collectability
Property and equipment consisted of the receivables periodically,following:
| | | March 31,
2022 | | | December 31,
2021 | |
| | | (Unaudited) | | | | |
| Furniture, fixtures and equipment | | $ | 63,126 | | | $ | 63,392 | |
| Leasehold improvements | | | 22,981 | | | | 23,078 | |
| Computer trading and clearing system | | | 2,420,826 | | | | 2,429,883 | |
| Sub-total | | | 2,506,933 | | | | 2,516,353 | |
| Less: accumulated depreciation | | | (2,436,109 | ) | | | (2,428,936 | ) |
| Subtotal | | | 70,842 | | | | 87,417 | |
| Less: Property and equipment, net – discontinued operations | | | (64,318 | ) | | | (80,534 | ) |
| Property and equipment, net | | $ | 6,506 | | | $ | 6,883 | |
Depreciation expense for the continuing operations was $350 and identified certain inactive traders during this quarter. Management considered the receivables due from these traders are uncertain and provided bad debt provision of $240,528$nil for the three and nine months ended September 30, 2017.March 31, 2022 and 2021, respectively.
5. LOAN RECEIVABLES
The following table sets forth a summary ofDepreciation expense for the loan agreements in loan receivables balance:discontinued operations was $17,086 and $96,613 for the three months ended March 31, 2022 and 2021, respectively
| Date | | Borrower | | Lender | | Original
Amount
(RMB) | | | September 30,
2017 (USD) | | | December 31,
2016 (USD) | | | Annual
Interest
Rate | | | Repayment
Due Date |
| | | | | | | | | | (Unaudited) | | | | | | | | | |
| 7/15/2016 | | Xiaohui Wang | | Shanghai Takung | | | 10,080,000 | | | $ | - | | | $ | 1,451,822 | | | | 0 | % | | 3/31/2017 |
| 8/24/2016 | | Xiaohui Wang | | Shanghai Takung | | | 13,350,000 | | | $ | - | | | $ | 1,922,800 | | | | 0 | % | | 3/31/2017 |
| 11/14/2016 | | Xiaohui Wang | | Shanghai Takung | | | 10,275,000 | | | $ | 1,544,346 | | | $ | 1,479,908 | | | | 0 | % | | 10/31/2017 |
| 12/9/2016 | | Xiaohui Wang | | Tianjin Takung | | | 10,550,000 | | | $ | 1,585,680 | | | $ | 1,519,516 | | | | 0 | % | | 11/30/2017 |
| 1/4/2017 | | Xiaohui Wang | | Tianjin Takung | | | 24,461,505 | | | $ | 3,676,597 | | | $ | - | | | | 0 | % | | 12/31/2017 |
| | | | | | | | Total | | | $ | 6,806,623 | | | $ | 6,374,046 | | | | | | | |
All the transactions were aimed to meet the Company’s working capital needs in US Dollar, which is freely convertible to Hong Kong Dollar.9. INTANGIBLE ASSETS
| | | March 31,
2022 | | | December 31,
2021 | |
| | | (Unaudited) | | | | |
| Intangible assets | | $ | 22,279 | | | $ | 22,372 | |
| Less: accumulated amortization | | | - | | | | - | |
| Subtotal | | | 22,279 | | | | 22,372 | |
| Less: Intangible assets – discontinued operations | | | (22,139 | ) | | | (22,232 | ) |
| Total Intangible assets | | $ | 140 | | | $ | 140 | |
10. OTHER NON-CURRENT ASSETS
Other non-current assets as of March 31, 2022 and December 31, 2021 consisted of:
| | | March 31,
2022 | | | December 31,
2021 | |
| | | (Unaudited) | | | | |
| Deposit – non-current | | $ | 18,319 | | | $ | 18,396 | |
| Prepayment – non-current | | | - | | | | - | |
| Subtotal | | | 18,319 | | | | 18,396 | |
| Less: Other non-current assets – discontinued operations | | | (18,319 | ) | | | (18,396 | ) |
| Total other non-current assets | | $ | - | | | $ | - | |
11. ACCRUED EXPENSES AND OTHER PAYABLES
Accrued expenses and other payables as of March 31, 2022 and December 31, 2021 consisted of:
| | | March 31, | | | December 31, | |
| | | 2021 | | | 2021 | |
| | | (Unaudited) | | | | |
| Accruals for consulting fees | | $ | 264,726 | | | $ | 266,304 | |
| Accruals for professional fees | | | 246,620 | | | | 90,642 | |
| Payroll payables | | | 135,380 | | | | 55,964 | |
| Trading and clearing system | | | - | | | | 2,364 | |
| Other payables | | | 13,388 | | | | 1,546 | |
| Subtotal | | | 660,114 | | | | 416,820 | |
| Less: Accrued expenses and other payables- discontinued operations | | | (284,870 | ) | | | (273,391 | ) |
| Total accrued expenses and other payables | | $ | 375,244 | | | $ | 143,429 | |
12. SHORT-TERM BORROWINGS FROM A THIRD PARTY
On February 16, 2022, our subsidiary, NFT Exchange Limited, entered into a loan agreement with a third-party individual to finance the daily operation of NFT Exchange Limited. The interest-free loans (the “RMB Loans”) that Shanghai Takungloan bears an interest rate of 5% per annum and Tianjin Takung entered were guaranteed by Chongqing Wintus (New Star) Enterprises Group (“Chongqing”). Xiaohui Wang (“Ms. Wang”)a maturity date of February 15, 2023. The loan amount is USD 300,000. The lender shall have the option to charge a nationallate fee of 12% of the People’s Republic of China. Ms. Wangprincipal amount in the event that the loan is a shareholder andnot fully repaid by the legal representative of Chongqing. Both Chongqing and Ms. Wang are the non-related parties to the Company.
In the meantime,July 2019, our discontinued operation, Hong Kong Takung, entered into loan agreements (the “US Dollar Loans”)HKD Loans with Merit Crown Limited, a Hong Kong company (“Merit Crown)Friend Sourcing with interest accruing at a rate of 8% per annum (See Note 8). Merit Crown is a non-related party to the Company.
Through an understanding between Ms. Wang and Merit Crown, the US Dollar Loans are “secured” by the RMB Loans. It is the understanding between the parties that when the US Dollar Loans are repaid, the RMB Loans will be repaid at the same time.
6. PROPERTY AND EQUIPMENT, NET
Property and equipment consisted of the following:
| | | September 30,
2017 | | | December 31,
2016 | |
| | | (Unaudited) | | | | |
| Furniture, fixtures and equipment | | $ | 157,736 | | | $ | 100,386 | |
| Leasehold improvements | | | 402,597 | | | | 298,965 | |
| Computer trading and clearing system | | | 3,220,318 | | | | 2,802,430 | |
| Sub-total | | | 3,780,651 | | | | 3,201,781 | |
| Less: accumulated depreciation | | | (1,676,544 | ) | | | (1,136,599 | ) |
| Property and equipment, net | | $ | 2,104,107 | | | $ | 2,065,182 | |
Depreciation expense amounted to $190,626 and $133,608 for the three months ended September 30, 2017 and 2016, respectively, and $538,532 and $373,308 for the nine months ended September 30, 2017 and 2016, respectively.
7.ACCRUED EXPENSES AND OTHER PAYABLES
Accrued expenses and other payables as of September 30, 2017 and December 31, 2016 consisted of:
| | | September 30, | | | December 31, | |
| | | 2017 | | | 2016 | |
| | | (Unaudited) | | | | |
| Trading and clearing system | | $ | 54,688 | | | $ | 61,735 | |
| Accruals for professional fees | | | 19,972 | | | | 49,952 | |
| Accruals for consulting fees | | | 297,461 | | | | 290,773 | |
| Payroll payables | | | 295,722 | | | | 141,022 | |
| Accruals for business trip expense | | | 23,722 | | | | - | |
| Other payables | | | 89,235 | | | | 65,401 | |
| Total accrued expenses and other payables | | $ | 780,800 | | | $ | 608,883 | |
8. SHORT-TERM BORROWINGS FROM THIRD PARTIES
annum. The following table sets forth a summary of the loan agreements in loan receivables balance:
| Date | | Borrower | | Lender | | Original Amount
(HKD) | | | September 30,
2017
(USD) | | | December 31,
2016
(USD) | | | Annual
Interest Rate | | | Repayment
Due Date |
| | | | | | | | | | (Unaudited) | | | | | | | | | |
| 7/15/2016 | | Hong Kong Takung | | Merit Crown Limited | | | 11,700,000 | | | $ | 1,497,888 | | | $ | 1,509,015 | | | | 8 | % | | 12/31/2017 |
| 8/24/2016 | | Hong Kong Takung | | Merit Crown Limited | | | 15,596,100 | | | $ | 1,996,684 | | | $ | 2,011,518 | | | | 8 | % | | 12/31/2017 |
| 11/18/2016 | | Hong Kong Takung | | Merit Crown Limited | | | 11,479,102 | | | $ | 1,469,607 | | | $ | 1,480,525 | | | | 8 | % | | 10/31/2017 |
| 12/9/2016 | | Hong Kong Takung | | Merit Crown Limited | | | 11,787,600 | | | $ | 1,509,103 | | | $ | 1,520,314 | | | | 8 | % | | 11/30/2017 |
| | | | | | | | | | | | | | | | | | | | | | | |
| | | Less: Discount loan payable | | | | | | | | $ | 101,382 | | | $ | 212,859 | | | | | | | |
| | | | | | | | | | | | | | | | | | | | | | | |
| | | | | | | | Total | | | $ | 6,371,900 | | | $ | 6,308,513 | | | | | | | |
The US DollarHKD Loans are to provide Hong Kong Takung with sufficient US Dollar-denominatedHKD currency to meet its working capital requirements. ItFriend Sourcing is “secured” bya non-related party to the aforementioned RMB Loans (See Note 5) of equivalent amount by its subsidiary to an individual and guarantor affiliated withCompany. On April 1, 2021, Hong Kong Takung extended the lenderdue date of the US Dollar Loans. ItHKD Loans with Friend Sourcing to July 30, 2021. On August 1, 2021, Hong Kong Takung further extended the financing with Friend Souring to April 1, 2022. With the extension, an interest payment, $86,795, was made on October 22, 2021. We are currently negotiating the terms with Friend Sourcing. The total loan amount is the understanding between the parties that when the US Dollar Loans are repaid, the RMB Loans will similarly be repaid.USD 1,957,142.
The weighted average interest rate of outstanding short-term borrowings was 6.94% and 8% per annum as of September 30, 2017March 31, 2022 and December 31, 2016.2021. The fair valuesvalue of the short-term borrowings approximateapproximates their carrying amounts. The weighted average short-term borrowing was $6,419,099borrowings were $2,103,810 and $1,678,803 for the nine months period ended September 30, 2017$1,971,718 as of March 31, 2022 and year ended December 31, 2016,2021, respectively. TheWe did not incur any interest expensesexpense for the short-term borrowings were $133,174 and $62,670 for the three months ended September 30, 2017March 31, 2022 and 2016, respectively and $394,295 and $62,670 for the nine months ended September 30, 2017 and 2016, respectively.2021.
13. RELATED PARTY BALANCE AND TRANSACTION
On October 30, 2017,May 29, 2021, our discontinued operation, Hong Kong Takung, entered into agreementsan interest-free loan agreement (the “HK Dollar Working Capital Loan”) with both Merit Crown Limited and Ms. Wang to extend the US Dollar Loan and RMB Loan (see Note 5) with the original maturity date on October 31, 2017, to October 31, 2018.
9. RELATED PARTY BALANCES AND TRANSACTIONS
The following is a list of related parties to which the Company has transactions with:
(a) Jianping MaoSze Chan (“Mao”Chan”), the wife of the Vice General ManagerPresident of Hong Kong Takung.
Amount dueTakung, for the loan of $6,383,658 (HK$50,000,000) to related party
Amount due to related party consistedHong Kong Takung. The purpose of the following as of the periods indicated:
| | | September 30,
2017 | | | December 31,
2016 | |
| | | (Unaudited) | | | | |
| Mao (a) | | $ | 1,085,480 | | | $ | 1,031,805 | |
| Total | | | 1,085,480 | | | | 1,031,805 | |
The interest rate of the outstanding short-term loan from Mao was 8% per annum as of September 30, 2017 and December 31, 2016. The interest expense was $61,283 and $19,941 for the nine months ended September 30, 2017 and 2016, respectively, and $20,652 and $19,941 for the three months ended September 30, 2017 and 2016, respectively.
On October 26, 2017,is to provide Hong Kong Takung entered into a supplementary agreement with Mao that, as of 30 September 2017, the outstanding principal amount of the Loan (as defined in the Loan Agreement) to be repaid bysufficient Hong Kong TakungDollar-denominated currency to Mao is HK$8,000,000 (Hong Kong Dollars Eight Million) (“Outstanding Principal Loan Amount”), and the accrued interest of the Outstanding Principal Loan Amount is HK$478,685 (“Accrued Interest”). Mao hereby agreed to extendmeet its working capital requirements with the maturity date of the Outstanding Principal Loan Amountloan as May 15, 2022.
The ending balance of the amount due to a related party as of the years indicated:
| | | March 31, | | | December 31, | |
| | | 2022 | | | 2021 | |
| | | | | | | |
| Chan | | $ | 6,383,658 | | | $ | 6,410,585 | |
| Subtotal | | | 6,383,658 | | | | 6,410,585 | |
| Less: amount due to related party – discontinued operations | | | (6,383,658 | ) | | | (6,410,585 | ) |
| Total | | $ | — | | | $ | — | |
14. INCOME TAXES
Takung, NFT Exchange and NFT Digital were incorporated in the interest thereof byState of Delaware, Wyoming and New York, respectively; therefore, are subject to United States income tax. Hong Kong Takung as below: (i) HK$4,500,000 and Hong Kong MQ were incorporated in Hong Kong S.A.R. and are subject to Hong Kong profits tax. Tianjin Takung was incorporated in the interest thereof, together withPRC and is subject to the Accrued Interest to be due and payable by November 30, 2017; and (ii) HK$3,500,000 together with the interest thereof to be due and payable by December 31, 2017.
10. INCOME TAXESEnterprise Tax.
United States of America
Takung, NFT Exchange and NFT Digital are subject to the U.S. federal and state corporate income taxes. The federal corporate income tax rate is 21%. Corporate entities are required to file state income taxes in accordance with the applicable state corporate income regulations.
As of September 30, 2017March 31, 2022 and December 31, 2016,2021, the Company in the United States had $4,008,459$12,363,881 and $2,212,890$11,935,256 in net operating loss carried forwardcarry forwards available to offset future taxable income, respectively. FederalFor net operating losses can generally be carried forward twenty years. The federal corporate net operating loss carryover is expiredarising after December 31, 2017, the Tax Cuts and Jobs Act (TCJA) which was passed in 202017 limits the Company’s ability to utilize NOL carryforwards to 80% of taxable years followingincome and carryforward the taxable year of the loss.
The Company believes that it is more likely than not that these net accumulated operating lossesNOL indefinitely. NOLs generated prior to January 1, 2018 will not be utilizedsubject to the taxable income limitation and will begin to expire in the future. Therefore, the Company has provided a full valuation allowance for the deferred tax assets arising from the losses at the U.S. during the nine months ended September 30, 2017 and year ended December 31, 2016 amounting to $1,414,445 and $962,012, respectively. Accordingly, the Company has no net deferred tax assets under the US entity.2033 if not utilized.
Hong Kong
Two-tier Profits Tax Rates
The two-tier profits tax rates system was introduced under the Inland Revenue (Amendment)(No.3) Ordinance 2018 (“the Ordinance”) of Hong Kong became effective for the assessment year 2018/2019. Under the two-tier profit tax rates regime, the profits tax rate for the first HKD 2 million (approximately $257,311) of assessable profits of a corporation will be subject to the lowered tax rate, 8.25% while the remaining assessable profits will be subject to the legacy tax rate, 16.5%. The Ordinance only allows one entity within a group of “connected entities” is eligible for the two-tier tax rate benefit. An entity is a connected entity of another entity if (1) one of them has control over the other; (2) both of them are under the control (more than 50% of the issued share capital) of the same entity; (3) in the case of the first entity being a natural person carrying on a sole proprietorship business-the other entity is the same person carrying on another sole proprietorship business. Since Hong Kong Takung, Takung Art Holdings and Hong Kong MQ are wholly owned and under the control of Takung U.S, these entities are connected entities. Under the Ordinance, it is an entity’s election to nominate the entity that will be subject to the two-tier profits tax rates on its profits tax return. The election is irrevocable. The Company elected Hong Kong Takung to be subject to the two-tier profits tax rates.
The provision for current income and deferred taxes of the subsidiary operating in Hong Kong Takung has been calculated by applying the currentnew tax rate of taxation8.25%. Hong Kong MQ still apply the original tax rate of 16.5% for its provision for current income and deferred taxes.
As of March 31, 2021 and December 31, 2021, the nine months ended September 30, 2017Company’s subsidiaries in Hong Kong had $6,519,809 and 2016, if applicable.$6,194,177 in net operating loss carry forwards available to offset future taxable income, respectively. These net operating losses will be carryforward indefinitely under Hong Kong Profits Tax regulation.
PRC
In accordance with the relevant tax laws and regulations of the PRC, a company registered in the PRC is subject to income taxes within the PRC at the applicable tax rate on taxable income. All the PRC subsidiaries that are not entitled to any tax holiday were subject to income tax at a rate of 25%.
The income tax provision consists of the following components:
| | | For the Three Months Ended
September 30, | | | For the Nine Months Ended
September 30, | |
| | | 2017 | | | 2016 | | | 2017 | | | 2016 | |
| | | (Unaudited) | | | (Unaudited) | | | (Unaudited) | | | (Unaudited) | |
| Current | | $ | 159,281 | | | $ | 684,801 | | | $ | 662,598 | | | $ | 1,561,728 | |
| Deferred | | | (34,619 | ) | | | (88,069 | ) | | | (68,221 | ) | | | (184,650 | ) |
| | | | | | | | | | | | | | | | | |
| Total provision for income taxes | | $ | 124,662 | | | $ | 596,732 | | | $ | 594,377 | | | $ | 1,377,078 | |
| | | For three months
ended
March 31,
2022 | | | For three months
ended
March 31,
2021 | |
| Current: | | | | | | |
| Federal | | $ | - | | | $ | - | |
| State | | | - | | | | - | |
| Foreign | | | - | | | | - | |
| Total current income tax expense, continuing operations | | | - | | | | - | |
| Current income tax expense, discontinued operations | | | - | | | | 20,208 | |
| Total current | | $ | - | | | $ | 20,208 | |
| | | | - | | | | | |
| Deferred: | | | - | | | | | |
| Federal | | $ | - | | | $ | - | |
| State | | | - | | | | - | |
| Foreign | | | - | | | | - | |
| Total deferred income tax benefit, continuing operations | | | - | | | | - | |
| Deferred income tax benefit, discontinued operations | | | - | | | | (24,981 | ) |
| Total deferred | | $ | - | | | $ | (24,981 | ) |
| Total income tax benefit | | $ | - | | | $ | (4,773 | ) |
A reconciliation between the Company’s actual provision for income taxes and the provision at the statutory rate is as follow:
| | | For the Three Months Ended
September 30, | | | For the Nine Months Ended
September 30, | |
| | | 2017 | | | 2016 | | | 2017 | | | 2016 | |
| | | (Unaudited) | | | (Unaudited) | | | (Unaudited) | | | (Unaudited) | |
| Income before income tax expense | | $ | 151,697 | | | $ | 3,048,469 | | | $ | 1,651,515 | | | $ | 6,041,710 | |
| | | | | | | | | | | | | | | | | |
| Computed tax expense with statutory tax rate | | | 25,030 | | | | 502,998 | | | | 271,806 | | | | 994,688 | |
| Impact of different tax rates in other jurisdictions | | | (73,258 | ) | | | (24,505 | ) | | | (230,651 | ) | | | (254,199 | ) |
| | | | | | | | | | | | | | | | | |
| Non-deductible items: | | | | | | | | | | | | | | | | |
| Tax effect of non-deductible expenses | | | 25,896 | | | | 11,117 | | | | 100,789 | | | | 32,742 | |
| Changes in valuation allowance | | | 146,994 | | | | 107,122 | | | | 452,433 | | | | 603,847 | |
| | | | | | | | | | | | | | | | | |
| Actual income tax expense | | $ | 124,662 | | | $ | 596,732 | | | $ | 594,377 | | | $ | 1,377,078 | |
Continuing operations
The Company's effective tax rate for the continuing operations was 82.2% and 19.6%0% for the three months ended September 30, 2017March 31, 2022 and 2016, respectively, and 36.0% and 22.8%2021, respectively.
| | | For three months
ended
March 31,
2022 | | | For three months
ended
March 31,
2021 | |
| Loss before income tax expense | | $ | (611,574 | ) | | $ | (360,042 | ) |
| Computed tax benefit with statutory tax rate | | | (128,430 | ) | | | (75,608 | ) |
| Impact of different tax rates in other jurisdictions | | | 8,233 | | | | - | |
| Tax effect of non-deductible expenses | | | - | | | | 781 | |
| Changes in valuation allowance | | | 120,197 | | | | 74,827 | |
| Total income tax expense | | $ | - | | | $ | - | |
Discontinued operations
The effective tax rate for the nine months ended September 30, 2017discontinued operations was 0% and 2016, respectively.
11. COMMITMENTS AND CONTINGENCIES
Operation Commitments
The total future minimum lease payments under the non-cancellable operating lease with respect to the office and the dormitory as of September 30, 2017 are payable as follows:
| Three months ending December 31, 2017 | | $ | 244,960 | |
| | | | | |
| Year ending December 31, 2018 | | | 761,175 | |
| | | | | |
| Year ending December 31, 2019 | | | 223,026 | |
| | | | | |
| Year ending December 31, 2020 | | | 39,999 | |
| | | | | |
| Year ending December 31, 2021 | | | 15,030 | |
| | | | | |
| Year ending December 31, 2022 and thereafter | | | 53,232 | |
| | | | | |
| Total | | $ | 1,337,422 | |
Rental expense of the Company was $293,338 and $199,5142.2% for the three months ended September 30, 2017March 31, 2022 and 2016, respectively, and $721,492 and $428,440 for the nine months ended September 30, 2017 and 2016,2021, respectively.
| | | For three months
ended
March 31,
2022 | | | For three months
ended
March 31,
2021 | |
| Loss before income tax expense | | $ | (179,765 | ) | | $ | (217,319 | ) |
| Computed tax benefit with statutory tax rate | | | (37,751 | ) | | | (45,637 | ) |
| Impact of different tax rates in other jurisdictions | | | 22,920 | | | | 3,719 | |
| Effect of preferred tax rate | | | - | | | | 46,150 | |
| Tax effect of non-deductible expenses | | | - | | | | (7,859 | ) |
| Changes in valuation allowance | | | 14,831 | | | | - | |
| Others | | | - | | | | (1,146 | ) |
| Total income tax expense | | $ | - | | | $ | (4,773 | ) |
The approximate tax effects of temporary differences, which give rise to the deferred tax assets and liabilities are as follows:
Continuing operations
| | | As of
March 31, | | | As of
December 31, | |
| | | 2022 | | | 2021 | |
| Deferred tax assets | | | | | | |
| Tax loss carried forward | | $ | 2,626,756 | | | $ | 2,506,404 | |
| Provision for impairment loss | | | 280,036 | | | | 280,036 | |
| Unvested restricted shares | | | 444,465 | | | | 444,465 | |
| Total deferred tax assets | | | 3,351,257 | | | | 3,230,905 | |
| Less: valuation allowance | | | (3,351,257 | ) | | | (3,230,905 | ) |
| Total Deferred tax assets, net of valuation allowance | | | - | | | | - | |
| | | | | | | | | |
| Deferred tax liabilities | | | | | | | | |
| Total Deferred tax liabilities | | $ | - | | | $ | - | |
| Deferred tax assets, net of valuation allowance and deferred tax liabilities | | $ | - | | | $ | - | |
Discontinued operations
| | | As of
March 31, | | | As of
December 31, | |
| | | 2022 | | | 2021 | |
| Deferred tax assets | | | | | | |
| Tax loss carried forward | | $ | 522,714 | | | $ | 510,890 | |
| Provision for doubtful accounts | | | 153,208 | | | | 153,854 | |
| PPE, due to difference in depreciation | | | 3,286 | | | | 2,010 | |
| Total deferred tax assets | | | 679,208 | | | | 666,754 | |
| Less: valuation allowance | | | (679,208 | ) | | | (666,754 | ) |
| Total Deferred tax assets, net of valuation allowance | | | - | | | | - | |
| | | | | | | | | |
| Deferred tax liabilities | | | | | | | | |
| Total Deferred tax liabilities | | $ | - | | | $ | - | |
| Deferred tax assets, net of valuation allowance and deferred tax liabilities | | $ | - | | | $ | - | |
Uncertain tax positions
12.
The reconciliation of the beginning and ending amount of liabilities associated with uncertain tax positions is as follows:
| | | March 31,
2022 | | | December 31,
2021 | |
| Uncertain tax liabilities, beginning of period, discontinued operations | | $ | - | | | $ | 101,789 | |
| Settlements with tax authority during current year | | | - | | | | (101,789 | ) |
| Uncertain tax liabilities, end of period, discontinued operations | | $ | - | | | $ | - | |
The Company files tax returns as prescribed by the tax laws of the jurisdictions in which it operates. In the normal course of business, the Company is subject to examination by the respective jurisdictions, where applicable. The statute of limitations for the tax returns varies by jurisdictions.
The amounts of uncertain tax liabilities listed above are based on the recognition and measurement criteria of ASC Topic 740, and the balance is presented as current liability in the consolidated financial statements as of March 31, 2022 and December 31, 2021. The Company anticipated that the settlements with the taxing authority are remitted within one year.
Our policy is to include interest and penalty charges related to uncertain tax liabilities as necessary in the provision for income taxes. The Company has a liability for accrued interest of $nil as of March 31, 2022 and December 31, 2021, respectively.
Our discontinued operation, Hong Kong Takung, was selected for routine examination for its tax years ended December 31, 2016 through 2018 by Hong Kong Inland Revenue Department (“IRD”) during the fiscal year ended 2020. The examination had been concluded in May 2021 and the ultimate resolution of the tax examination concurred with the uncertain tax liabilities previously accrued. Hong Kong Takung settled the entire tax liabilities in June 2021. The Company does not expect the position of uncertain tax liabilities will significantly fluctuate within the next twelve months.
The statute of limitations for the Internal Revenue Services to assess the income tax returns on a taxpayer expires three years from the due date of the profits tax return or the date on which it was filed, whichever is later.
In accordance with the Hong Kong profits tax regulations, a tax assessment by the IRD may be initiated within six years after the relevant year of assessment, but extendable to 10 years in the case of potential willful underpayment or evasion.
In accordance with PRC Tax Administration Law on the Levying and Collection of Taxes, the PRC tax authorities generally have up to five years to assess underpaid tax plus penalties and interest for PRC entities’ tax filings. In the case of tax evasion, which is not clearly defined in the law, there is no limitation on the tax years open for investigation. Accordingly, the PRC entities remain subject to examination by the tax authorities based on the above.
15. LEASES
The Company has operating leases for its office facilities and artwork storages. The Company’s leases have remaining terms of less than one year to approximately nine years. Leases with an initial term of 12 months or less are not recorded on the balance sheet; the Company recognizes lease expense for these leases on a straight-line basis over the lease term.
The following table provides a summary of leases as of March 31, 2022 and December 31, 2021:
| Assets/liabilities | | Classification | | As of
March 31,
2022 | | | As of
December 31,
2021 | |
| Assets | | | | | | | | |
| Operating lease right-of-use assets, continuing operations | | Operating lease assets | | $ | - | | | $ | - | |
| Operating lease right-of-use assets, discontinued operations | | Operating lease assets | | | 46,310 | | | | 62,397 | |
| Total operating lease right-of-use assets | | | | $ | 46,310 | | | $ | 62,397 | |
| | | | | | | | | | | |
| Liabilities | | | | | | | | | | |
| Current | | | | | | | | | | |
| Operating lease liability – current, continuing operations | | Current operating lease liabilities | | $ | - | | | $ | - | |
| Operating lease liability – current, discontinued operations | | Current operating lease liabilities | | | 46,310 | | | | 62,397 | |
| Total operating lease liability – current | | | | $ | 46,310 | | | $ | 62,397 | |
| | | | | | | | | | | |
| Long-term | | | | | | | | | | |
| Operating lease liability – non-current, continuing operations | | Long-term operating lease liabilities | | $ | - | | | $ | - | |
| Operating lease liability – non-current, discontinued operations | | Long-term operating lease liabilities | | | - | | | | - | |
| Total operating lease liability – non-current | | | | $ | - | | | $ | - | |
| | | | | | | | | | | |
| Total lease liabilities – continuing operations | | | | $ | - | | | $ | - | |
| Total lease liabilities – discontinued operations | | | | $ | 46,310 | | | $ | 62,397 | |
The operating lease expense for the three months ended March 31, 2022 and 2021 was as follows:
| | | | Three Months Ended |
| Lease Cost | | Classification | | March 31,
2022 | | | March 31,
2021 | |
| Operating lease cost | | Cost of revenue, general and administrative expenses | | $ | 62,205 | | | $ | 57,275 | |
| | | | | | | | | | | |
| Total lease cost | | | | $ | 62,205 | | | $ | 57,275 | |
| Operating lease cost-discontinued operations | | Cost of revenue, general and administrative expenses | | | (62,205 | ) | | | (57,275 | ) |
| Total lease cost | | | | $ | - | | | $ | - | |
Maturities of operating lease liabilities as of March 31, 2022 were as follow:
| Maturity of Lease Liabilities | | Operating Leases | |
| Remaining 2022 | | $ | 47,786 | |
| 2023 | | | - | |
| 2024 | | | - | |
| 2025 | | | - | |
| 2026 | | | - | |
| Thereafter | | | - | |
| Total undiscounted lease payments | | $ | 47,786 | |
| Less: interest | | | (1,476 | ) |
| Present value of lease payments | | $ | 46,310 | |
Supplemental information related to operating leases was as follows:
| | | Three Months Ended | |
| | | March 31,
2022 | | �� | March 31,
2021 | |
| Cash paid for amounts included in the measurement of lease liabilities – continuing operations | | $ | - | | | $ | - | |
| Cash paid for amounts included in the measurement of lease liabilities – discontinued operations | | $ | 17,291 | | | $ | 17,126 | |
| New operating lease assets obtained in exchange for operating lease liabilities – continuing operations | | $ | - | | | $ | - | |
| New operating lease assets obtained in exchange for operating lease liabilities – discontinued operations | | $ | - | | | $ | - | |
| | | | | | | | | |
| Weighted average remaining lease term – continuing operations | | | - | | | | - | |
| Weighted average remaining lease term – discontinued operations | | | 0.75 year | | | | 2.57 years | |
| Weighted average discount rate – continuing operations | | | - | | | | - | |
| Weighted average discount rate – discontinued operations | | | 8 | % | | | 8 | % |
16. COMMITMENTS AND CONTINGENCIES
Capital Commitments
As of March 31, 2022 and December 31, 2021, the Company had no capital commitments.
Contingencies
Due to the deconsolidation of Tianjin Takung, the ending balance of our restricted cash totaling $52,215,458 as of December 31, 2021, was not included in our consolidated financial statements. The Company could be exposed to claims made by the PRC customers for the return of their deposits at the Tianjin Takung’s restricted cash accounts. Any claims against Hong Kong Takung, though it is a limited company, that are ultimately successful, could have a material adverse effect on the Company’s financial position, operating results and cash holdings unless Hong Kong Takung is disposed or wound down. As of March 31, 2022, Hong Kong Takung and Tianjin Takung have not received any claims for the return of the deposits from the PRC customers.
17. NET (LOSS) EARNINGS PER SHARE
Basic earningsThe computation of the Company’s basic and diluted net loss per share is computed by dividing net income by the weighted-average number of common shares outstanding during the period. Diluted earnings per share is computed by dividing net income by the weighted-average number of common shares and dilutive potential common shares outstanding during the period.as follows:
| | | For the Three Months Ended
September 30, | | | For the Nine Months Ended
September 30, | |
| | | 2017 | | | 2016 | | | 2017 | | | 2016 | |
| | | (Unaudited) | | | (Unaudited) | | | (Unaudited) | | | (Unaudited) | |
| Numerator: | | | | | | | | | | | | | | | | |
| Net income | | $ | 27,034 | | | | 2,451,737 | | | $ | 1,057,138 | | | | 4,664,632 | |
| | | | | | | | | | | | | | | | | |
| Denominator: | | | | | | | | | | | | | | | | |
| Weighted-average shares outstanding | | | | | | | | | | | | | | | | |
| Weighted-average shares outstanding - Basic | | | 11,188,882 | | | | 10,632,276 | | | | 11,039,880 | | | | 10,632,276 | |
| Stock options and restricted shares | | | 59,806 | | | | 733,321 | | | | 358,202 | | | | 645,569 | |
| Weighted-average shares outstanding - Diluted | | | 11,248,688 | | | | 11,365,597 | | | | 11,398,082 | | | | 11,277,845 | |
| | | | | | | | | | | | | | | | | |
| Earnings per share | | | | | | | | | | | | | | | | |
| -Basic | | | 0.00 | | | | 0.23 | | | | 0.10 | | | | 0.44 | |
| -Diluted | | | 0.00 | | | | 0.22 | | | | 0.09 | | | | 0.41 | |
| | | Three Months Ended | |
| | | March 31,
2022 | | | March 31,
2021 | |
| Numerator: | | | | | | |
| Net loss - continuing operations | | $ | (611,574 | ) | | $ | (360,042 | ) |
| Net loss - discontinued operations | | | (179,765 | ) | | | (212,546 | ) |
| Total net loss | | | (791,339 | ) | | | (572,588 | ) |
| | | | | | | | | |
| Denominator: | | | | | | | | |
| Weighted-average shares outstanding-Basic | | | 14,372,353 | | | | 11,271,379 | |
| Stock options and restricted shares | | | - | | | | - | |
| Weighted-average shares outstanding-Diluted | | | 14,372,353 | | | | 11,271,379 | |
| Loss per share-continuing operations | | | | | | | | |
| -Basic | | $ | (0.043 | ) | | $ | (0.032 | ) |
| -Diluted | | $ | (0.043 | ) | | $ | (0.032 | ) |
| | | | | | | | | |
| Loss per share-discontinued operations | | | | | | | | |
| -Basic | | $ | (0.013 | ) | | $ | (0.019 | ) |
| -Diluted | | $ | (0.013 | ) | | $ | (0.019 | ) |
Diluted earnings per share takes into account the potential dilution that could occur if securities or other contracts to issue common stock were exercised and converted into common stock.
ForAs of March 31, 2022 and December 31, 2021, there were no outstanding stock options and no other securities that would potentially be converted to additional shares of common stock that would have been outstanding if the three months ended September 30, 2017,dilutive potential shares of common stock had been issued were excluded from the calculation of diluted earningsnet loss per share calculation did not include optionsshare.
18. SUBSEQUENT EVENTS
On April 14, 2022, the transaction contemplated by the A&R SPA was completed and closed. The gross proceeds to the Company from this offering was approximately $30 million which was received in April 2022.
On May 5, 2022, the Company commenced its blockchain NFT business by launching its NFT trading platform, www.nftoeo.com. Subsequent to the launch, traders can commence to purchase up to 109,160 shares ofand sell the Company's common stock, because they were out of money. It has no such impact for three months ended September 30, 2016, nine months ended September 30, 2017 and 2016 respectively.digital collections via the trading platform.
There were dilutive effects of 487,000 shares for the nine months period ended September 30, 2017 and 2016. The 487,000 restricted shares of Common Stock (the “Compensation Shares”) related to the Consulting Agreement with Regeneration Capital Group, LLC (“Regeneration”) were placed in an escrow account and were subject to Regeneration’s performance condition. The shares were released from escrow account and transferred to Regeneration since the Company successfully listed on NYSE on March 22, 2017.
13. SUBSEQUENT EVENT
Other than the newly signed extension agreements as disclosed in Note 8, and the supplementary agreement with related party as disclosed in Note 9 above,events aforementioned, the Company does not identify anyhas evaluated subsequent events through the date of issuance of the consolidated financial statements, there were no other subsequent events with material financial impact onoccurred that would require recognition or disclosure in the unaudited condensed consolidated financial statements.
Item 2. Management’s Discussion and Analysis of Financial Condition and Results of Operations.
The following discussion and analysis should be read in conjunction with our financial statements and related notes thereto.
CAUTIONARY STATEMENT REGARDING FORWARD-LOOKING STATEMENTS
This Quarterly Report on Form 10-Q and other reports filed by us from time to time with the Securities and Exchange Commission (collectively the “Filings”) containcontains or may contain forward-looking statements and information that are based upon beliefs of, and information currently available to, our management as well as estimates and assumptions made by our management. When used in the filingsreport the words “anticipate”, “believe”, “estimate”, “expect”, “future”, “intend”, “plan” or the negative of these terms and similar expressions as they relate to us or our management identify forward-looking statements. Such statements reflect the current view of our management with respect to future events and are subject to risks, uncertainties, assumptions and other factors as they relate to our industry, our operations and results of operations, and any businesses that we may acquire. Should one or more of the events described in these risk factors materialize, or should our underlying assumptions prove incorrect, actual results may differ significantly from those anticipated, believed, estimated, expected, intended or planned.
Although we believe that the expectations reflected in the forward lookingforward-looking statements are reasonable, we cannot guarantee future results, levels of activity, performance or achievements. Except as required by applicable law, including the U.S. federal securities laws, we do not intend to update any of the forward-looking statements to conform them to actual results.results unless required by applicable securities regulations or rules. The following discussion should be read in conjunction with our pro forma financial statements and the related notes that will be filed herein.
Overview
We, were incorporated in Delaware under the name Cardigant Medical Inc. on April 17, 2009. Our initial business plan was to focus on the development of novel biologic and peptide based compounds and enhanced methods for local delivery for the treatment of vascular disease including peripheral artery disease and ischemic stroke.
Hong Kong Takung is a limited liability company incorporated on September 17, 2012 under the laws of Hong Kong, Special Administrative Region, China. Although Takung was incorporated in 2012, it did not commence business operations until late 2013.
As a result of the transfer of the excluded assets pursuant to the Contribution Agreement and the acquisition of all the issued and outstanding shares of Hong Kong Takung, we are no longer conducting the Cardigant Business and have now assumed Hong Kong Takung’s business operations as it nowthrough our only operating wholly-owned subsidiary.
Hong Kong Takung operateswholly owned subsidiary, NFT Exchange, operate an electronic online platform located at http:https://eng.takungae.com www.nftoeo.com/for artists, art dealers and art investors to offer and trade in valuable artwork.
Through Hong Kong Takung, we We offer on-lineonline listing and trading services that allow artists/artists, art dealers/dealers and owners to access a much bigger art trading market where they can engage with a wide range of investors that they might not encounter without our platform. Our
In July 2021, Takung appointed Mr. Kwok Leung Li as the CEO to lead the new direction with three initiatives to develop our blockchain and NFT related businesses.
In May 2022, we launched our blockchain NFT online platform also makes investment in high-end and expensive artwork more accessible to ordinary people without substantial financial resources.at www.nftoeo.com.
The company’s NFT business outlook can be described in several aspects below.
NFT Market Insights
Digital artwork based on NFT technology is becoming a hot asset. The earliest NFT projects can be traced back to the 2017 bull market CryptoKitties (the encrypted cats), which had the properties of scarcity and value anchoring of ownership. At its peak, a virtual cat could sell for more than $100,000. In terms of NFT artwork, in March 2021, artist Beeple’s NFT work “Every Day: The First 5,000 Days” sold for $69.346 million, making it the third-highest price for a living artist. According to a report by Invezz, the NFT market was worth $338 million in 2020, and it has grown to reach $490 million in 2021. With the help of the bull market wave, NFT has grown rapidly., As of the first quarter of 2021, the total transaction volume of the NFT market has exceeded 1.5 billion US dollars, an increase of more than 2627% from the previous quarter. In April 2021, the total market value of NFTs exceeded $30 billion for the first time, setting a new all-time high. Currently, NFTs can be used in the fields including games, artworks, domain names, insurance, collectibles, virtual assets, real assets, identities, etc. With the vigorous development of the digital world, many businesses will appear in the form of digital original ecology, and the huge application space and technological imagination of NFT are expected to become more and more attractive in the new digital economy world.
New business model
TKAT’s business model revolves around the theme of “free circulation of value and creation of a unique digital work exchange platform”, allowing each user to create, buy and sell various irreplaceable digital works to realize the value of works.
New business types
| A. | Providing consulting services such as artwork valuation/appreciation potential |
Away from poor offline communication and incomplete information, there is no misunderstanding of the pain points, and to tap the needs of users to provide comprehensive consulting services such as labor cost, artist influence, artistic value of works, and channels for obtaining works, which not only serves customers but also creates value for the company.
TKAT has built a fully functional NFT trading platform, which is in the stage of testing to be launched. The platform can meet the categories of digital works including: artwork, music videos, collectibles, game props, sports, metaverse, virtual world, social tokens, and meet the needs of various users as much as possible. And it can realize the whole business process of user registration-certification-work uploading-work casting-work trading. The platform was launched and placed in service in May 2022. In the transaction process, it not only meets the needs of customers for uploading and purchasing digital works, but the company extracts a portion of the handling fee (including token minting, first sale, and second sale) to create value.
After the TKAT platform has a certain user base, it can provide advertising and publicity services for users or the company itself. The business model is not limited to categories and industries, such as investment promotion, work promotion, and industry promotion.
New Strategic Direction
TKAT is committed to creating a digital original ecological platform that integrates games, artworks, domain names, insurance, collectibles, virtual assets, real assets, identity and other fields, and changes the market status of traditional industries through its own efforts. Strategic goals: basic platform building-targeted population entry-providing services (consulting services, transaction services, advertising services)-optimizing the platform and expanding the scope of services-full service.
Competitor analysis
Opensea is an NFT market exchange. It has more than 20,000 users. Compared with projects in the popular decentralized finance (“DeFi”) field, it is second only to Uniswap, kyber and Compound, and higher than maker, 0x, etc. As a trading platform with a relatively high status in the NFT field, OpenSea has a complete range of collections, equivalent to Taobao in the NFT world. At present, the trading market of OpenSea has nearly 40,000 users, and the monthly transaction volume exceeds 5 million US dollars. Coinbase’s new NFT platform hits 1.4 million signups. The Coinbase platform has an active population of 50,000 users. The service rates for each service are as follows: 1. Rarible’s minting fees are borne by the creators themselves, and the royalties are also set by the creators themselves, with default amounts of 10%, 20% and 30%. 2. VIV3’s NFT minting costs and profits come from the 12.5% service fee it collects on the first and second sales. 3. OpenSea does not need gas fee to mint NFT. 4. Rarible charges a 2.5% service fee on the first sale. On the SuperRare platform, a 15% commission is charged on the first sale and a 3% fee (paid by the buyer) is charged on the second sale.
Competitive Advantages
The advantages of Takung in the NFT transaction and blockchain market are as follows:
Innate industry advantages
In recent years, digital artworks of NFT technology based on blockchain technology are becoming popular assets. The NFT online platform the Company built can effectively solve the current situation such as unclear ownership of property, difficulty in distinguishing authenticity and low efficiency of artwork circulation. Convert business development from offline to online operation, so that the value of digital works can be freely circulated online.
Advantages of the core management team
The core team members of Takung have experience in blockchain technology development and NFT trading platform operation, which can ensure a smoother development and business operation in the later stage.
Takung’s platform advantages
The currently developed and launched NFT online trading platform supports multi-category product uploads, including: Digital art, Digital oil painting, Produced by Gallery, Personal products, Artist signature, Oil on canvas, Print, Paper ink, Device, Comprehensive media, Derivative, and It will be continuously enriched and improved according to customer interests. The NFT trading platform has stable performance, high security and easy to maintain. At the front end of the system, the Company will continuously improve the operability and user experience of the system focusing on improving the user experience.
Technical advantages
The Takung’s digital works exchange platform that has been launched is built by a professional technical team. Each technician has rich industry experience, can work under a short development cycle or high pressure, and has a number of relevant industry benchmarking projects experience. The capability of the technical team ensures the strong technical support in the later system optimization and iterative update.
Marketing advantages
The Company has a professional marketing team. After the platform goes online, it can be promoted online and offline simultaneously, so as to quickly increase the popularity of the platform, and use professional marketing solutions to attract more creators and demanders to join in the platform.
We expect that we will generate revenue from our services in connection with the offering and trading of artworkNFT on ourthe Company’s system, primarily consisting of listing fees,member fee, trading commissions, management feescommission, and authorized agent subscription.advertising fee.
On July 28, 2015, Hong Kong Takung incorporated a wholly owned subsidiary, Takung (Shanghai) Co., Ltd. (“Shanghai Takung”), in Shanghai Free-Trade Zone (SFTZ) in Shanghai, China, with a registered capital of $1 million. Shanghai Takung is engaged in providing services to its parent company Hong Kong Takung by receiving deposits from and making payments to online artwork traders for and on behalf of Hong Kong Takung.
On January 27, 2016, Hong Kong Takung incorporated another subsidiary, Takung Cultural Development (Tianjin) Co., Ltd (“Tianjin Takung”), a limited liability company, with a registered capital of $1 million in Tianjin Pilot Free Trade Zone in Tianjin, People’s Republic of China. Tianjin Takung provides technology development services to Hong Kong Takung and Shanghai Takung, and also carries out marketing and promotion activities in mainland China.
Recently Shanghai Takung set up an office in Hangzhou to carry out technology development.
Since July 28, 2016, we have expanded access to our trading platform to residents of Russia, Mongolia, Australia and New Zealand – our first major expansion of operations outside of China. To further stimulate trading interest, we have added selected portfolios from these countries to our platform, which now numbers 199 artworks including three Russian painting portfolios and fifteen Mongolian paintings.
Our headquarters are located in Hong Kong, Special Administrative Region, People’s Republic of China and we conduct our business primarily in Hong Kong, Shanghai and Tianjin. Recently, we set up a new office in Hangzhou to conduct technology development. Our principal executive offices are located at Flat/RM 03-04, 20/F, Hutchison House, 10 Harcourt Road, Central Hong Kong.
Our common stock began trading on the NYSE American under the symbol “TKAT” on March 22, 2017.
Results of Operation of Takung
The following discussion should be read in conjunction with the unaudited condensed consolidated Financial Statements of the Company for the three-month and nine-month period ended September 30, 2017 and 2016 and related notes thereto.
THREE-MONTH PERIODTHREE MONTHS ENDED SEPTEMBER 30, 2017MARCH 31, 2022 COMPARED TO THREE-MONTH PERIODTHREE MONTHS ENDED SEPTEMBER 30, 2016MARCH 31, 2021
Revenue
The following tables set forth our condensed consolidated statements of income data:
| | | Three Months Ended
September 30, | |
| | | 2017 | | | 2016 | |
| | | (Unaudited) | | | (Unaudited) | |
| Revenue | | $ | 3,355,011 | | | $ | 5,742,209 | |
| Cost of revenue | | | (292,168 | ) | | | (285,252 | ) |
| Selling expense | | | (624,151 | ) | | | (652,207 | ) |
| General and administrative expenses | | | (2,498,848 | ) | | | (1,744,965 | ) |
| Total costs and expenses | | | (3,415,167 | ) | | | (2,682,424 | ) |
| Income from operations | | | (60,156 | ) | | | 3,059,785 | |
| Interest and other income (loss), net | | | 211,852 | | | | (11,316 | ) |
| Income before income taxes | | | 151,696 | | | | 3,048,469 | |
| Income tax benefit (expense) | | | (124,662 | ) | | | (596,732 | ) |
| Net income | | $ | 27,034 | | | $ | 2,451,737 | |
The following tables set forth our interim condensed consolidated statements of income data (as a percentagedata:
| | | Three months ended March 31, | |
| | | 2022 | | | % of
Revenue | | | 2021 | | | % of
Revenue | |
| | | (Unaudited) | | | | | | (Unaudited) | | | | |
| Revenue | | $ | - | | | | - | | | $ | - | | | | - | |
| Cost of revenue | | | - | | | | - | | | | - | | | | - | |
| Selling expense | | | - | | | | - | | | | - | | | | - | |
| General and administrative expenses | | | (611,475 | ) | | | - | | | | (359,990 | ) | | | - | |
| Total costs and expenses | | | (611,475 | ) | | | - | | | | (359,990 | ) | | | - | |
| Loss from operations | | | (611,475 | ) | | | - | | | | (359,990 | ) | | | - | |
| Interest and other income (expenses), net | | | (99 | ) | | | - | | | | (52 | ) | | | - | |
| Loss before income tax expense | | | (611,574 | ) | | | - | | | | (360,042 | ) | | | - | |
| Loas from discontinued operations | | | (179,765 | ) | | | - | | | | (217,319 | ) | | | - | |
| Income tax benefit (expense) | | | - | | | | - | | | | 4,773 | | | | - | |
| Net loss | | $ | (791,339 | ) | | | - | | | $ | (572,588 | ) | | | - | |
Revenue
For the three months ended March 31, 2022 and 2021, our continuing operations did not generate any revenue as our online NFT trading platform was launched in May 2022. For the three months ended March 31, 2022 and 2021, our discontinued operations generated revenues in an amount of revenue):nil and $779,108, respectively.
| | | Three Months Ended
September 30, | |
| | | 2017 | | | 2016 | |
| | | (Unaudited) | | | (Unaudited) | |
| Revenue | | | 100 | % | | | 100 | % |
| Cost of revenue – Direct revenue | | | (9 | ) | | | (5 | ) |
| Selling expense | | | (18 | ) | | | (11 | ) |
| General and administrative expenses | | | (74 | ) | | | (30 | ) |
| Total costs and expenses | | | (101 | ) | | | (46 | ) |
| Income from operations | | | (1 | ) | | | 54 | |
| Interest and other income (loss), net | | | 6 | | | | - | |
| Income before income taxes | | | 5 | | | | 54 | |
| Income tax expense | | | (4 | ) | | | (10 | ) |
| Net income | | | 1 | % | | | 44 | % |
ListingThe listing fee revenue, was $1,455,498commission fee revenue and $2,968,534; commission revenue was $1,496,826 and $1,669,698, gross management fee revenue was $402,547which were generated by Hong Kong Takung were reclassified to and $781,219, annual fee revenue was $140 and $440 , authorized agent subscription revenue was $nil and $322,318included in the discontinued operations for the three months ended September 30, 2017March 31, 2021. Due to the suspension of the legacy online trading platform since the fourth quarter of 2021, Hong Kong Takung did not earn and 2016, respectively.recognize any listing fee revenue, commission fee revenue and management fee revenue for the three months ended March 31, 2022. We expect that the NFT trading platform, which has been placed in service in May 2022, will generate three kinds of revenue in later periods, which are membership fee, commission and advertising fee.
Revenue by category
The following table presents our revenue of our discontinued operations:
| | | Three months ended March 31, | |
| | | 2022 | | | 2021 | |
| | | (Unaudited) | | | (Unaudited) | |
| Listing fee revenue | | $ | - | | | $ | 273,792 | |
| Commission revenue | | | - | | | | 358,086 | |
| Management fee revenue | | | - | | | | 147,230 | |
| Subtotal | | | - | | | | 779,108 | |
| Less: Cost of revenue – discontinued operations | | | - | | | | (779,108 | ) |
| Total | | $ | - | | | $ | - | |
Revenue by customer type
The following table presents our revenue by customer type of our discontinued operations:
| | | Three months ended
March 31, | |
| | | 2022 | | | 2021 | |
| Artwork owners | | $ | - | | | $ | 273,792 | |
| Non - VIP traders | | | - | | | | 312,640 | |
| VIP traders | | | - | | | | 192,676 | |
| Subtotal | | | - | | | | 779,108 | |
| Less: Revenue- discontinued operations | | | - | | | | (779,108 | ) |
| Total | | $ | - | | | $ | - | |
Listing fee revenue is calculated based on a percentage of the listing value and transaction value of artworks.
Listing value is the total offering price of an artwork when the ownership units are initially listed on our trading platform. We utilize an appraised value as a basis to determine the appropriate listing value for each artwork, or portfolio of artworks.
Takung Unit+ is a new unit trading platform for collectibles. It allows investors to buy and trade shared ownership units of portfolios of collectibles, however, unlike the Company's standard Unit trading platform, each Takung Unit+ portfolio will contain multiple numbers of the same item, and traders will have the option of direct ownership with physical delivery by trading the units they own for one or more of the items in the portfolio. Takung will collect listing fees on the initial listing values of new portfolios, commissions on trades made by investors using the platform, and management fees for the storage, transportation, and insurance of the items in the portfolio.
During the three months ended September 30, 2017, thereMarch 31, 2022, we did not have any new artworks listed on our legacy platform. Therefore, no listing revenue was recognized.
As of March 31, 2021, a total of 298 sets of artwork were 6listed for trade on our platform —comprising 73 sets of paintings and calligraphies 9from famous Chinese, Russian and Mongolian artists, with a total listing value of $30,627,634 (HK$237,600,000); 35 pieces of jewelry with a total listing value of $9,366,178 (HK$72,660,000); 134 pieces of precious stones 1with a total listing value of $17,020,509 (HK$132,040,000); 29 pieces of jewelry and 1 set of Unit+ product listed on our platform. Theiramber with a total listing values were $2,118,726value of $12,245,898 (HK$16,500,000) for the95,000,000); 4 pieces of antique mammoth ivory carvings with a total listing value of $670,302 (HK$5,200,000); 2 pieces of porcelain pastel paintings with a total listing value of $335,151 (HK$2,600,000); 7 pieces of porcelain with a total listing value of $1,095,686 (HK$8,500,000); 6 sets of paintingsUnit+ products with a total listing value of $1,329,518 (HK$10,314,000); 1 piece of Yixing collectable with a listing value of $128,904 (HK$1,000,000); and calligraphies, $1,132,5557 pieces of Sports memorabilia with a listing value of $1,096,897 (HK$ 8,820,000) for8,509,400), of which 22.5%-48% (for 73 sets of paintings), 24%-48.5% (for the 9134 pieces of precious stones, $46,227 (HK$360,000) forstones), 29%-48% (for the 135 pieces of jewelry and $152,578 (HK$1,188,000) forjewelry), 47%-48.5% (for 4 piece of antique mammoth ivory carvings), 32%-48% (for the 1 set29 pieces of Unit+ product,amber), 45%-46% (for the 2 pieces of which 41.5%-47%porcelain pastel paintings), 25%-48% (for the 7 pieces of porcelain), 30.25%-45% (for the 6 sets of paintingsUnit+ products), 45% (1 piece of Yixing collectable) and calligraphies), 26%-46%45% (for the 97 pieces of precious stones), 43% (for the 1 pieces of jewelry) and 30.3% (for the 1 set of Unit+ product)Sports memorabilia) of the listed values were charged as listing fees, respectively.
Compared toDuring the corresponding periodthree months ended September 30, 2016,March 31, 2021, there were 73 sets of paintings and calligraphies, 7 pieces of amber, 14 pieces of precious stones, 5 pieces of jewelry successfully listed on our system. Theplatform. Their total listing values were $1,802,475$1,095,686 (HK$14,000,000)8,500,000) for the 7 sets of paintings, and calligraphies, $2,974,083 (HK$23,100,000) for the 7 pieces of amber, $1,042,860 (HK$8,100,000) for the 14 pieces of precious stones, $746,739 (HK$5,800,000) for 5 pieces of jewelry, of which 47.75%-48%24.9%-25% (for the 7 sets of paintings and calligraphies) ,46% (for the 7 pieces of amber), 32%-48.5% (for the 14 pieces of precious stones), 29%-48% (for the 5 pieces of jewelry)paintings) of the listed values were charged as listing fees, respectively.
The decrease in number of pieces listed,fees. Our listing values and corresponding listing fees charged duringrevenue for the three months ended September 30, 2017 compared to the same period ended September 30, 2016 resultedMarch 31, 2021 was included in a decrease in listing fee revenue in the current period. The decrease in number of pieces listed was due to a new listing category (“A-tier”) implemented on July 3, 2017. A-tier is aim to meet an elevated set of standards including higher levels of liquidity, market value, number of owners and number of VIP traders. Therefore, the listing schedule of some artworks were deferred to a later time.discontinued operations.
| (ii) | Commission fee revenue |
For the three months ended March 31, 2021, our legacy online artwork trading system generated commission revenue as follows:
For non-VIP Traders, the commission revenue was calculated based on a percentage of transaction value of artworks, which we charge trading commissions for the purchase and sale of the ownership shares of the artworks. The commission is typically 0.3% of the total amount of each transaction, but as an initial promotion, we currently charge a reduced fee of 0.2% (resulting in an aggregate of 0.4% for both buy and sell transactions) of the total transaction amount with the minimum charge of $0.13 (HK$1). The commission is accounted for as revenue and immediately deducted from the proceeds from the sales of artwork units when a transaction is completed. On November 7, 2018 we lowered the minimum charge to $0.0013 (HK$0.01).
For selected VIP Traders, we ran a discount program for them starting from April 1, 2015, when their trading volumes of the certain artworks reached an agreed level in each month, a contractually determined flat rate of trading commission was applied to the transactions of these certain artworks. Any trading commission charges incurred by the VIP Traders over the flat rate would be waived. The discounted rate varied between selected artworks. This discount program ended on March
For selected Traders, starting from April 1, 2016, we charged a predetermined monthly fee (unlimited trades for specific artworks) for specific artworks. These Traderstraders are selected by authorized agents and reviewed by us. After review, we negotiate individually with each one of them to determine a fixed monthly fee. Different Traders may have different rates but once negotiated and agreed to, the monthly fee is fixed. Using the output method, we recognize the monthly commission revenue when the selected Traders receive access to our trading platform to make unlimited trades for specific artwork.
Commission rebate programs areWe defined a selected Trader as “inactive trader” who meets the following criteria;
| ● | The Trader has been defaulted in making monthly commission payments over three months; |
| | |
| ● | The Trader did not incur any transactions in the month of reassessment; |
| | |
| ● | The service agent confirmed with the relevant Trader that he/she has been inactive. |
Once an inactive Trader has been assessed and identified, his/her contract will be reassessed pursuant to ASC 606-10-25-5 because there has been a significant change in fact and circumstances and pursuant to ASC 606-10-25-1)e), his/her contract will not be deemed to exist and revenue will not be recognized until consideration is received in accordance with ASC 606-10-25-7(a) as we would have already performed our obligations ahead of receiving consideration.
We charge a non-transactional transfer commission on the transfer of the ownership of an artwork. The commission amount is calculated based on 0.3% of the close value of the artwork and each artwork unit. For the large volume of transfer or under certain special circumstances, we charge at an agreed-upon percentage of artworks units.
The Company offered commission to Traders and service agents. We would rebate 5% of the commission earned from the transactions of new Traders referred by the existing Traders. The rebate rate was adjusted from 15% to 5%, starting from January 1, 2017. For service agents, we rebateoffer a total of 40% to 60%75% of the commission earned from transactions with new Traderstraders to the service agents when they bring in an agreed number of Traders to the trading platform. For service agents who have individual referrers referring Traders to us, we will, after rebating such individual referrers 15% of the
The commission earned from the transactions of new Traders they referred, deduct such 15% of the commission from the rebates payablepaid to the service agents to which such individual referrers belong. The commission rebate is recognized as reduction of the commission revenue. The rebates and discounts are recognized as a reductioncost of revenue in the same period the related revenue is recognized.
In spite of this, total commissionCommission revenue decreased by $172,872 or 10% for the three months ended September 30, 2017 to $1,496,826 compared to $1,669,698 forMarch 31, 2021 was $358,086. We included this amount in the discontinued operations. For the three months ended September 30, 2016 primarily because of the change inMarch 31, 2022, we did not earn commission revenue from our commission fee policy and the decrease of transaction volume of non VIP traders and non-selected traders. From April 1, 2016 onwards, selected Traders pay a predetermined monthly fixed fee for their trades in specific artworks while our other non-VIP Traders continue to pay a commission calculated based on a percentage of transaction value of artworks.legacy online artwork trading system.
| (iii) | Management fee revenue |
We chargeOur legacy online trading platform charges Traders a management fee to cover the costs of insurance, storage, and transportation for an artwork and trading management of artwork units, which areis calculated at $0.0013 (HK$0.01) per 100 artwork units per day. The management fee is recognized when the artwork is sold and is deducted from proceeds from the sale of artwork units.ownership shares when there is a purchase and sale transaction.
During the three-monththree months period ended September 30, 2017,March 31, 2021, management fee revenue decreased by $378,672,was $147,230 and was included in the discontinued operations. Our discontinued operations did not generate management fee revenue from $781,219our legacy trading platform for the three months ended September 30, 2016 to $402,547. From September 1, 2016, we waived management fees for certain VIP Traders. We recognized these promotions as a reduction of revenue, which was recognized upon the completion of the transactions. Although the listed artworks increased, the management fee decreased by the promotions.March 31, 2022.
During the three-month period ended September 30, 2017, annual fee revenue decreased by $300, from $440 for the three-month period ended September 30, 2016 to $140.
(v) Authorized agent subscription revenue
Authorized agent subscription revenue was nil for the three-month period ended September 30, 2017 compared to $322,318 for the three-month period ended September 30, 2016. We have ceased charging new authorized agent with subscription revenue in order to encourage high quality authorized agent to sign up with our platform.
Cost of Revenue
Cost of revenue of our discontinued operations primarily includes the following: commission paid to service agents, depreciation, internet service charges, artwork insurance and artwork storage costs.
| | | For three months ended
March 31, | |
| | | 2022 | | | 2021 | |
| Commission paid to service agents | | $ | - | | | $ | 135,174 | |
| Depreciation | | | - | | | | 69,062 | |
| Internet service charge | | | - | | | | 19,169 | |
| Artwork insurance | | | - | | | | 12,744 | |
| Artwork storage | | | - | | | | 16,088 | |
| Subtotal | | | - | | | | 252,237 | |
| Less: Cost of revenue – discontinued operations | | | - | | | | (252,237 | ) |
| Total | | $ | - | | | $ | - | |
Cost of revenue of our discontinued operations for the three months ended March 31, 2022 and 2021 were $nil and $252,237 respectively. The cost of revenue for the three months ended September 30, 2017March 31, 2021 was incurred related to the revenue generated by our legacy online trading system and 2016 was $292,168reclassified to and $285,252, respectively. Ourincluded in the net loss from discontinued operations. Since the legacy online trading system was suspended in the fourth quarter in 2021 and our NFT online trading platform was not launched until May 2022, our discontinued and continuing operations did not generate any revenues and cost of revenue primarily includes internet service fee, depreciation and amortization of hardware and software for our trading platform.during the three months ended March 31, 2022.
Gross Profit
Gross profit for our continuing operations was $3,062,843nil for three months ended March 31, 2022 and 2021. Due to the suspension of Tianjin’s operation, we reclassified listing revenue, commission revenue and management revenue as well as the corresponding cost of revenue to net loss from discontinued operations for the three months ended September 30, 2017, compared to $5,456,957March 31, 2021. As our online NFT trading platform was not placed in service until May 2022, no revenue and cost of revenue was generated for the three months ended September 30, 2016. The decrease was due to the less artworks listed onMarch 31, 2022.
Operating Expenses
General and administrative expenses for our platform, the change in our commission fee policycontinuing operations were $611,475 and the decrease of transaction volume of non VIP traders and non-selected traders.
Listing fees contributed 43.4% of the total revenue$359,990 for the three months ended September 30, 2017 compared to 51.7% in the corresponding period in 2016, while commission revenue contributed 44.6%March 31, 2022 and 2021, respectively. Our general and administrative expenses for continuing operations for the three months ended September 30, 2017 compared to 29% in the corresponding period in 2016. While thereMarch 31, 2022 was a decrease in commission revenue in the current period, the negative factors were catalyzed by a decrease in listing fees due to less artworks listing on the platform during the current period. Consequently, we posted a comparable gross profit margin of 91% for the three months ended September 30, 2017 compared to 95%$251,485 higher than that for the same period in 2016.
Operating Expenses
Selling expenses were $624,151, or 20% of net sales, for the three months ended September 30, 2017 compared to $652,207, or 12% of net sales, for the comparable period in 2016, a decrease by $28,056. Selling expenses consist primarily of marketing expenses.
General and administrative expenses for the three months ended September 30, 2017 were $2,498,848 compared to $1,744,965 for the three months ended September 30, 2016. The substantial increase was2021 primarily due to an increase in salariesconsultancy fee by $258,469 because of an increase$126,834, a rise in employee headcount, accrual of doubtful accountsalary and welfare by $241,248, office, insurance and rental expense by $141,281$75,052 and an increase in travellingother expenses by $116,220 which$60,011, offset by a decrease in legal and professional fees by $25,096. During the three months ended March 31, 2022, our continuing operations recruited consultants and employees to assist in setup of the online NFT platform. Additionally, we incurred higher service fees paid to NYSE, LLC for the private placement and the acquisition of an investment in Cultural Objects Provenance Holdings Limited. Our legal and professional fees were incurredreduced in the three months ended March 31, 2022 as we paid additional audit fees to attendour predecessor auditor.
General and administrative expenses for our discontinued operations were $185,334 and $653,168 for the three months ended March 31, 2022 and 2021, respectively. Our general and administrative expenses for our discontinued operations for the three months ended March 31, 2022 were significantly reduced by $467,834 compared to the listingsame period in 2021. Such decline was mainly driven by the deconsolidation of Tianjin Takung in the fourth quarter of 2021 and the result of the operations of Tianjin Takung was no longer included in our common stock ondiscontinued operations for the NYSE American.three months ended March 31, 2022.
The following table sets forth the main components of the Company’sour general and administrative expenses of our continuing operations and for discontinued operations for the three months ended September 30, 2017March 31, 2022 and 2016.2021.
| | | Three months ended
September 30, 2017 | | | Three months ended
September 30, 2016 | |
| | | (Unaudited) | | | (Unaudited) | |
| | | Amount($) | | | % of Total | | | Amount($) | | | % of Total | |
| Consultancy fee | | $ | 46,059 | | | | 2 | % | | $ | 92,809 | | | | 5 | % |
| Legal and professional fees | | | 218,066 | | | | 9 | % | | | 247,278 | | | | 14 | % |
| Salary and welfare | | | 1,008,736 | | | | 40 | % | | | 750,267 | | | | 43 | % |
| Office, insurance and rental expenses | | | 430,047 | | | | 17 | % | | | 288,766 | | | | 17 | % |
| Non-deductible input VAT expenses | | | 6,924 | | | | 0 | % | | | - | | | | - | % |
| Traveling and accommodation fees | | | 187,780 | | | | 8 | % | | | 71,560 | | | | 4 | % |
| Share-based compensation | | | 138,161 | | | | 6 | % | | | 186,928 | | | | 11 | % |
| Bad debt expenses | | | 241,248 | | | | 10 | % | | | - | | | | - | % |
| Others | | | 221,827 | | | | 8 | % | | | 107,357 | | | | 6 | % |
| Total general and administrative expenses | | $ | 2,498,848 | | | | 100.0 | % | | $ | 1,744,965 | | | | 100.0 | % |
| | | For three months ended
March 31, 2022 (Unaudited) | | | For three months ended
March 31, 2021 (Unaudited) | |
| | | Amount($) | | | % of Total | | | Amount($) | | | % of Total | |
| Salary and welfare | | | 90,052 | | | | 11.3 | % | | | 15,000 | | | | 1.5 | % |
| Office, insurance and rental expenses | | | 89,206 | | | | 11.2 | % | | | 71,125 | | | | 7.0 | % |
| Legal and professional fees | | | 186,781 | | | | 23.4 | % | | | 211,877 | | | | 20.9 | % |
| Consultancy fee | | | 126,834 | | | | 15.9 | % | | | - | | | | - | % |
| Depreciation expenses | | | 350 | | | | 0.0 | % | | | - | | | | - | % |
| Traveling and accommodation expenses | | | - | | | | 0.0 | % | | | 30 | | | | 0.0 | % |
| Share-based compensation | | | - | | | | 0.0 | % | | | 3,717 | | | | 0.4 | % |
| Others | | | 118,252 | | | | 14.8 | % | | | 58,241 | | | | 5.7 | % |
| Total general & administrative expenses-continuing operations | | | 611,475 | | | | 76.7 | % | | | 359,990 | | | | 35.5 | % |
| Total general & administrative expenses-discontinued operations | | | 185,334 | | | | 23.3 | % | | | 653,168 | | | | 64.5 | % |
| Total | | $ | 796,809 | | | | 100.0 | % | | $ | 1,013,158 | | | | 100.0 | % |
Net IncomeOur continuing operations did not incur any selling expense for the three months ended March 31, 2022 and 2021. The selling expense of our discontinued operation was nil and $104,911 for the three months ended March 31, 2022 and 2021, respectively. The selling expense was related to an advertising and promotion expense incurred by Tianjin Takung during the three months ended March 31, 2021. The operation of Tianjin Takung was suspended since the fourth quarter of 2021.
We had a net
Other (expenses) income
Other expenses for the continuing operations for the three months ended March 31, 2022 and 2021 were $99 and $52, respectively. Other expenses were related to bank charges.
Other (expenses) income for the discontinued operations for the three months ended March 31, 2022 and 2021 were $(167) and $39,018. During the three months ended March 31, 2022, the operation of Tianjin Takung was deconsolidated and other expenses, mainly related to bank charges, were incurred by Hong Kong Takung. Other income for the three months ended September 30, 2017 of $27,034 comparedMarch 31, 2021 was mainly related to netforeign currency transaction gain incurred by Hong Kong Takung.
Loss (income) before income of $2,451,737taxes
Our continuing operations incurred loss before income taxes $611,574 and $360,042 for the three months ended September 30, 2016.March 31, 2022 and 2021, respectively. Loss before income taxes of our continuing operations was significantly higher for the three months ended March 31, 2022 compare to the same period in 2021 as we incurred a higher consultancy fee, salary expense and service fees in 2022 as discussed above.
Our discontinued operations incurred loss before income taxes, $179,765 and $217,319 for the three months ended March 31, 2022 and 2021, respectively. The loss before income taxes of our discontinued operations was comparatively lower for the three months ended March 31, 2022. Due to the loss of control in and deconsolidation of Tianjin Takung in November 2021, the operation of Tianjin Takung was not included in our interim condensed consolidated financial statements for the three months ended March 31, 2022.
Income tax expense
For the three months ended March 31, 2022 and 2021, our continuing operations did not incur income tax expense as Takung, NFT Exchange and Hong Kong MQ incurred book loss and tax loss as a full valuation allowance was recognized against the net operating loss carryforwards. It is more likely than not that these two entities will not generate sufficient taxable income to utilize the net operating loss carryforward in the near future.
The decreaseincome tax benefit from the discontinued operations for the three months ended March 31, 2022 and 2021 were $nil and $4,773, respectively. Since the fiscal year 2021, we derecognized the deferred tax assets incurred by Hong Kong Takung as the Company expected that the net operating loss or deferred tax assets may not be utilized or reversed in net income by $2,424,703 during this current period was primarilya near future due to a decreasethe shift of revenue by $2,387,198 as discussed in the previous paragraphs.
its operations from its legacy artwork trading to NFT business.
NINE-MONTH PERIOD ENDED SEPTEMBER 30, 2017 COMPARED TO NINE-MONTH PERIOD ENDED SEPTEMBER 30, 2016Net Loss
RevenueAs a result of our operations aforementioned, our net losses after income taxes for continuing operations for the three months ended March 31, 2022 and 2021 were $611,574 and $360,042, respectively. Our discontinued operations generated net loss after income tax $179,765 and $212,546 for the three months ended March 31, 2022 and 2021, respectively.
Foreign currency translation gain (loss)
We had a foreign currency translation gain (loss) for the three months ended March 31, 2022 and 2021 of $21,059 and $(37,763), respectively.
Comprehensive loss
As a result of the above, we posted a comprehensive loss of $770,280 and $610,351 for the three months ended March 31, 2022 and 2021, respectively.
Liquidity and Capital Resources
The following tables set forth our condensed consolidated statements of income data:
| | | Nine Months Ended
September 30, | |
| | | 2017 | | | 2016 | |
| | | (Unaudited) | | | (Unaudited) | |
| Revenue | | $ | 10,545,677 | | | $ | 14,214,252 | |
| Cost of revenue | | | (822,335 | ) | | | (822,735 | ) |
| Selling expense | | | (1,272,010 | ) | | | (1,993,782 | ) |
| General and administrative expenses | | | (7,311,128 | ) | | | (5,076,689 | ) |
| Total costs and expenses | | | (9,405,473 | ) | | | (7,893,206 | ) |
| Income from operations | | | 1,140,204 | | | | 6,321,046 | |
| Interest and other income (loss), net | | | 511,311 | | | | (279,336 | ) |
| Income before income taxes | | | 1,651,515 | | | | 6,041,710 | |
| Income tax expense | | | (594,377 | ) | | | (1,377,078 | ) |
| Net income | | $ | 1,057,138 | | | $ | 4,664,632 | |
The following tables set forth our condensed consolidated statements of income data (as a percentage of revenue):
| | | Nine Months Ended
September 30, | |
| | | 2017 | | | 2016 | |
| | | (Unaudited) | | | (Unaudited) | |
| Revenue | | | 100 | % | | | 100 | % |
| Cost of revenue – Direct revenue | | | (8 | ) | | | (6 | ) |
| Selling expense | | | (12 | ) | | | (14 | ) |
| General and administrative expenses | | | (69 | ) | | | (36 | ) |
| Total costs and expenses | | | (89 | ) | | | (56 | ) |
| Income from operations | | | 11 | | | | 44 | |
| Interest and other income (loss), net | | | 5 | | | | (2 | ) |
| Income before income taxes | | | 16 | | | | 42 | |
| Income tax expense | | | (6 | ) | | | (10 | ) |
| Net income | | | 10 | % | | | 32 | % |
Listing fee revenue was $4,606,649 and $8,166,072; commission revenue was $4,970,651 and $3,739,958, gross management fee revenue was $967,518 and $1,341,294, annual fee revenue was $859 and $869, authorized agent subscription revenue was $nil and $966,059, for the nine months ended September 30, 2017 and 2016, respectively.
During the nine months ended September 30, 2017, there were 49 sets of artwork listed for trade on our platform —comprising 8 sets of paintings and calligraphies, with a total listing value of $2,632,356 (HK$20,500,000), 16 pieces of jewelry with a total listing value of $5,567,754 (HK$43,360,000), 23 pieces of precious stones with a total listing value of $3,212,759 (HK$25,020,000), 1 piece of porcelains with a total listing value of $38,522 (HK$300,000) and 1 set of Unit+ product which was listed in Unit+ trading platform, with a total listing value of $152,548 (HK$1,188,000), of which 41.5%-47% (for 8 sets of paintings and calligraphies), 33.5%-48% (for the 16 pieces of jewelry), 26%-47% (for the 23 pieces of precious stones), 46% (for the 1 pieces of porcelains) and 43% (for the 1 set of Unit+ product) of the listed values were charged as listing fees, respectively.
Compared to the corresponding period ended September 30, 2016, there were 15 pieces of painting, 59 pieces of precious stones, 11 pieces of jewelry, 3 pieces of ivory, 18 pieces of amber and 2 pieces of porcelain pastel paintings successfully listed on our system. The total listing values were $3,349,005 (HK$26,000,000) for the 15 pieces of painting, $5,744,832 (HK$44,600,000) for the 59 pieces of precious stones, $1,816,191 (HK$14,100,000) for the 11 pieces of jewelry, $515,232 (HK$4,000,000) for the 3 pieces of ivory, $7,239,003 (HK$56,200,000) for the 18 pieces of amber, and $334,900 (HK$2,600,000) for the 2 pieces of porcelain pastel paintings, of which 47.75%-48% (for the 15 pieces of painting), 29%-48.5% (for the 59 pieces of precious stones), 29%-48% (for the 11 pieces of jewelry), 47% (for the 3 pieces of ivory), 45%-48% (for the 18 pieces of amber), and 45%-46% (for 2 pieces of porcelain pastel paintings ) of the relevant listed values were charged as listing fees, respectively.
The decrease in number of pieces listed, listing values and corresponding listing fees charged during the nine months ended September 30, 2017 compared to the same period ended September 30, 2016 resulted in a decrease in listing fee revenue in the current period. The decrease in number of pieces listed was due to a new listing category (“A-tier”) implemented on July 3, 2017. A-tier is aim to meet an elevated set of standards including higher levels of liquidity, market value, number of owners and number of VIP traders. Therefore, the rigorous listing requirements of A-tier led some artworks listing deferred.
| (ii) | Commission fee revenue |
Our trading volume and transaction value amounts increased significantly from 2015 when we commenced operations in Shanghai and consequently added a significant number of Traders from mainland China as they could now settle their trades in Renminbi. This trend continued into 2017. Trading volume increased by 193% and trading amount increased by 178% for the nine months ended September 30, 2017 compared to corresponding period in 2016.
In spite of this, total commission revenue increased by $1,230,693 or 33% for the nine months ended September 30, 2017 to $4,970,651 compared to $3,739,958 for the nine months ended September 30, 2016 primarily because of the change in our commission fee policy and the decrease of transaction volume of non VIP traders and non-selected traders . From April 1, 2016 onwards, selected Traders pay a predetermined monthly fixed fee for their trades in specific artworks while our other non-VIP Traders continue to pay a commission calculated based on a percentage of transaction value of artworks.
| (iii) | Management fee revenue |
During the nine month period ended September 30, 2017, management fee revenue decreased by $373,776, from $1,341,294 for the nine months ended September 30, 2016 to $967,518. From September 1, 2016, we waived management fees for certain VIP Traders. We recognized these promotions as a reduction of revenue, which was recognized upon the completion of the transactions.
During the nine-month period ended September 30, 2017, annual fee revenue increased by $10, from $869 for the nine-month period ended September 30, 2016 to $859.
(v) Authorized agent subscription revenue
Authorized agent subscription revenue for the nine-month period ended September 30, 2017 was nil compared to $966,059 for the nine-month period ended September 30, 2016. We have ceased charging new authorized agent with subscription revenue in order to encourage high quality authorized agent to sign up with our platform.
Cost of Revenue
Cost of revenue for the nine months ended September 30, 2017 and 2016 was $822,335 and $822,735, respectively. Our cost of revenue primarily includes internet service fee, depreciation and amortization of hardware and software for our trading platform.
In the third quarter of 2014, we entered into an agreement with a third party service provider, Shenzhen Qianrong Cultural Investment Development Co., Ltd (“Qianrong”), to provide software development services with a total contract amount of $902,592 (HK$6,995,000). The services contracted for are divided into different modules, according to different upgrades and new functionalities. As of September 30, 2017 and 2016, nine out of the ten modules have been completed and are operational. We capitalized (with a total cost of $1,069,853 (HK$8,295,000)) and amortized these costs once the modules were completed.
Gross Profit
Gross profit was $9,723,342 for the nine months ended September 30, 2017, compared to $13,391,517 for the nine months ended September 30, 2016. The decrease was due to the less artworks listed on our platform, the change in our commission fee policy and the decrease of transaction volume of non VIP traders and non-selected traders.
Operating Expenses
Selling expenses were $1,272,010, or 13% of net sales, for the nine months ended September 30, 2017 compared to $1,993,782 or 15% of net sales, for the comparable period in 2016, a decrease by 36%. Selling expenses consist primarily of marketing expenses.
General and administrative expenses for the nine months ended September 30, 2017 were $7,311,128 compared to $5,076,689 for the nine months ended September 30, 2016. The substantial increase by $2,234,439 or 44% was chiefly due to an increase in salaries by $1,314,324 because of an increase in employee headcount, accrual of doubtful accounts, by $241,248, office, insurance and rental expenses by $400,067 and an increase in travelling expenses by $495,715 which were incurred to attend to the listing of our common stock on the NYSE American.
The following table sets forth the main components of the Company’s general and administrative expenses for the nine months ended September 30, 2017 and 2016.
| | | Nine months ended
September 30, 2017 | | | Nine months ended
September 30, 2016 | |
| | | (Unaudited) | | | (Unaudited) | |
| | | Amount($) | | | % of Total | | | Amount($) | | | % of Total | |
| Consultancy fee | | $ | 187,230 | | | | 3 | % | | $ | 361,610 | | | | 7 | % |
| Legal and professional fees | | | 733,466 | | | | 10 | % | | | 728,856 | | | | 14 | % |
| Salary and welfare | | | 3,166,679 | | | | 43 | % | | | 1,852,355 | | | | 36 | % |
| Office, insurance and rental expenses | | | 1,252,561 | | | | 17 | % | | | 852,494 | | | | 17 | % |
| Non-deductible input VAT expense | | | 16,369 | | | | - | % | | | - | | | | - | % |
| Traveling and accommodation fees | | | 679,950 | | | | 9 | % | | | 184,235 | | | | 4 | % |
| Share-based compensation | | | 562,184 | | | | 8 | % | | | 846,703 | | | | 17 | % |
| Bad debt expenses | | | 241,248 | | | | 4 | % | | | - | | | | - | % |
| Others | | | 471,441 | | | | 6 | % | | | 250,436 | | | | 5 | % |
| Total general and administrative expenses | | $ | 7,311,128 | | | | 100.0 | % | | $ | 5,076,689 | | | | 100.0 | % |
Net Income
We had a net income for the nine months ended September 30, 2017 of $1,057,138 compared to net income of $4,664,632 for the nine months ended September 30, 2016.
The decrease in net income by $3,607,494 during this current period was due to a fall of revenue by $3,668,575, and the increase of general and administrative expenses by $2,234,439 as discussed in the previous paragraphs.
Liquidity and Capital Resources
The following tables set forth ourinterim condensed consolidated statements of cash flow:
| | | For three months ended
March 31 | |
| | | 2022 | | | 2021 | |
| Net cash provided by (used in) operating activities-continuing operations | | $ | 1,716,197 | | | $ | (943 | ) |
| Net cash provided by (used in) operating activities- discontinued operations | | | (156,101 | ) | | | 1,652,638 | |
| | | | 1,560,096 | | | | 1,651,695 | |
| | | | | | | | | |
| Net cash used in investing activities- continuing operations | | | - | | | | - | |
| Net cash used in investing activities- discontinued operations | | | (1,153 | ) | | | 389,171 | |
| | | | (1,153 | ) | | | 389,171 | |
| | | | | | | | | |
| Net cash provided by financing activities-continuing operations | | | 300,000 | | | | - | |
| Net cash provided by financing activities-discontinued operations | | | - | | | | - | |
| | | | 300,000 | | | | - | |
| | | | | | | | | |
| Effect of exchange rate change on cash and cash equivalents, and restricted cash from continuing operations | | | 42,534 | | | | - | |
| Effect of exchange rate change on cash and cash equivalents, and restricted cash from discontinued operations | | | (56,203 | ) | | | (21,443 | ) |
| | | | (13,669 | ) | | | (21,443 | ) |
| | | | | | | | | |
| Net increase (decrease) in cash and cash equivalents - continuing operations | | | 2,058,731 | | | | (943 | ) |
| Net (decrease) increase in cash and cash equivalents and restricted cash- discontinued operations | | | (213,457 | ) | | | 2,020,366 | |
| | | | 1,845,274 | | | | 2,019,423 | |
| | | | | | | | | |
| Cash and cash equivalents, beginning balance- continuing operations | | | 1,503,153 | | | | 31,188 | |
| Cash and cash equivalents and restricted cash, beginning balance- discontinued operations | | | 338,542 | | | | 13,811,557 | |
| | | | 1,841,695 | | | | 13,842,745 | |
| | | | | | | | | |
| Cash and cash equivalents and restricted cash, ending balance- continuing operations | | $ | 3,561,884 | | | $ | 30,245 | |
| Cash and cash equivalents and restricted cash, ending balance- discontinued operations | | | 125,085 | | | | 15,831,923 | |
| | | $ | 3,686,969 | | | $ | 15,862,168 | |
| | | Nine months ended September 30 | |
| | | 2017 | | | 2016 | |
| | | (Unaudited) | | | (Unaudited) | |
| Net cash provided by operating activities | | $ | 1, 028,524 | | | $ | 5,635,391 | |
| Net cash used in investing activities | | | (561,510 | ) | | | (1,276,378 | ) |
| Net cash provided by financing activities | | | - | | | | 2,346,941 | |
| Effect of exchange rate change on cash and cash equivalents | | | 1,025,539 | | | | (644,375 | ) |
| Net increase in cash and cash equivalents | | | 1,492,553 | | | | 6,061,579 | |
| Cash and cash equivalents, beginning balance | | | 13,395,337 | | | | 10,769,456 | |
| Cash and cash equivalents, ending balance | | $ | 14,887,890 | | | $ | 16,831,035 | |
Sources of Liquidity
The cash and cash equivalent and the restricted cash balances from the continuing operations as of March 31, 2022 were $1,533,468 and $2,028,416, respectively. Out of the total cash and cash equivalent and restricted cash amount, $3,561,884, we had $2,337,990 denominated in U.S. dollars deposited in the financial institutions in the United States or other countries, $1,223,894, denominated in HK$ in Hong Kong financial institutions.
DuringThe cash and cash equivalent balance from the ninediscontinued operations as of March 31, 2022 was $125,085. Out of this amount, we had $8,457 denominated in U.S. dollars deposited in the financial institutions in Hong Kong, $116,627, denominated in HK$ in Hong Kong financial institutions.
For the three months ended September 30, 2017,March 31, 2022, net cash generated fromprovided by operating activities totaled $1,028,524.from continuing operation was $1,716,197 which was predominantly driven by the receipt of customer deposits, $2,028,416 and an increase in accrued expenses and other payables, $231,814, offset by the net loss of $611,574. While there was no cash inflow or outflow from investing activities from our continuing operations during the three months ended March 31, 2022, our continuing operations incur net cash provided by financing activities, $300,000, as NFT Exchange obtained a short-term borrowing from a third party.
For the three months ended March 31, 2022, net cash used in operating activities by our discontinued operations was $156,101, which was a result of net loss from discontinued operations, $179,765, offset by non-cash item: depreciation expense, $17,086 and an increase in accrued expenses and other payable, $11,480. Net cash used in investing activities totaled $561,510. Noby our discontinued operations was $1,153, which was related to a purchase of a computer equipment by Hong Kong Takung. Our discontinued operations did not incur cash was generatedinflow or outflow from financing activities.
The cash and cash equivalent balance from the continuing operations as of December 31, 2021 was $1,503,153. Out of this amount, we had $273,151 denominated in U.S. dollars deposited in the financial institutions in the United States, $1,230,002, denominated in HK$ in Hong Kong financial institutions.
The cash and cash equivalent balance from the discontinued operations as of December 31, 2021 was $338,542. Out of this amount, we had $112,397 denominated in U.S. dollars deposited in the financial institutions in Hong Kong, $226,145, denominated in HK$ in Hong Kong financial institutions.
For the three months ended March 31, 2021, net cash used in operating activities duringby our continuing operations was $943, which was driven by the period. The resulting change in cash for the period wasnet loss from continuing operations, $360,042, offset by an increase of $1,492,553. Thein accrued expenses and other payables, $319,257, a decrease in prepayments, $36,125 and a non-cash item: share-based compensation expense, $3,717. There were no cash balance atinflows or outflows from investing activities or financing activities from our continuing operations.
For the beginning of the period was $13,395,337. The cash balance on September 30, 2017 was $14,887,890.
During the ninethree months ended September 30, 2016,March 31, 2021, net cash provided by operating activities totaled $5,635,391. Net cash usedfrom our discontinued operations was $1,652,638 which was mainly resulted from an increase in customers’ deposits, $2,333,910, offset by net loss from discontinued operations, $212,546, prepayments remitted to vendors, $348,953, payments to vendors, $20,157 and payments to lessors, $15,466. Cash inflows from investing activities totaled $1,276,378. Netfrom our discontinued operations was $389,171 as our third-party lender paid off the loan receivable in January 2021. There was no cash provided byinflow or outflow from financing activities totaled $2,346,941. The resulting change in cash for the period was an increase of $6,061,579. The cash balance at the beginning of the period was $10,769,456. The cash balance on September 30, 2016 was $16,831,035.from our discontinued operations.
As of September 30, 2017,March 31, 2022, the Company had $28,390,798 in total current liabilities from the continuing operations were $2,703,660, which comprised of $780,800 inincluded accrued expense and other payables $19,057,733of US Takung and Hong Kong MQ, $375,244, customer deposits of NFT Exchange, $2,028,416 and short-term borrowing from a third party, $300,000. Total current liabilities from our discontinued operations, Hong Kong Takung, $8,671,980, included accrued expenses and other payables, $284,870, amount due to a related party, $6,383,658, a loan payable, $1,957,142 and operating lease obligation-current portion, $46,310.
As of March 31, 2022, the continuing operations of the Company had cash, restricted cash and cash equivalents of $3,561,884, a working capital in customers’ deposits, $6,371,900an amount of $1,808,968 and the net assets of $10,384,228. The Company’s discontinued operations, which primarily consisted of Hong Kong Takung, as of March 31, 2022, had cash and cash equivalent of $125,085, a working deficit of $8,528,910, and net liabilities of $8,377,825. In order to continue to maintain the liquidity requirements, we commenced our online NFT trading platform in short-term borrowingsMay 2022 with approximately 60 NFT products listed and 107 new registered users. We continue to promote the NFT trading platform to increase more new registered users. We will negotiate with the third party and the related party lenders for extending the financing arrangements. In April 2022, we had also raised approximately $30 million in connection with the securities purchase agreement closed in February 2022. Management believed that these measures provided sufficient liquidity and adequate capital to fund the operations and reasonably meet the anticipated liquidity requirements for at least the next twelve months.
As of December 31, 2021, total current liabilities from third parties, $1,085,480the continuing operations were $143,429 which was related to accrued expenses and other payables of US Takung and Hong Kong MQ. Total current liabilities from our discontinued operation, Hong Kong Takung, totaled $8,733,624 which consisted of $273,390 in accrued expenses and other payables, $6,410,585 in amount due to related parties, $21,854 in advance from customers, $1,965,398 in short-term borrowings from a third party and $1,094,885$62,397 in tax payables. lease liabilities.
As of December 31, 2016,2021, the Company’s continuing operation had cash and cash equivalents of $1,503,153, a working capital of $1,649,632 and the net assets amounted to $10,953,269. The Company’s discontinued operations, which primarily related to Hong Kong Takung, had cash and cash equivalents of $338,542, a working deficit of $8,360,145 and net liabilities of $8,176,586. In order to continue to maintain the liquidity requirements, the Company had $30,602,706introduced NFT business in total current liabilities, which included $608,883 in accrued expensethe fourth quarter of 2021 and other accruals, $21,743,360 in customers’ deposits, $360,248 in advance from customers, $6,308,513 in short-term borrowings from third parties, $1,031,805 in amount duedeveloped consultancy service fee on NFT projects. The Company also seeks to negotiate and extend financing arrangements with the related party and $549,897 in tax payables.
Thethe third party. In February 2022, the Company had deferred tax liabilities as long-term liability of $45,301 as of September 30, 2017,entered into certain securities purchase agreement with certain “non-U.S. persons” and $62,618 as of December 31, 2016, respectively. The Company’s total liabilities as of September 30, 2017expected to raise approximately $30 million from this offering. Management believed that these measures provided sufficient liquidity and December 31, 2016 amountedadequate capital to $28,436,099fund the operations and $30,665,324, respectively.reasonably meet the anticipated liquidity requirements for at least the next twelve months.
The Company is aware of events or uncertainties which may affect its future liquidity because of capital controls in the PRC. The RenminbiRMB is only currently convertible under the “current account”,account,” which includes dividends, trade and service-related foreign exchange transactions, but not under the “capital account”,account,” which includes foreign direct investment and loans, including loans we may secure from our onshore subsidiaries or variable interest entities. Currently, our PRC subsidiaries, which are wholly-foreign owned enterprises, may purchase foreign currency for settlement of “current account transactions”,transactions,” including payment of dividends to us, without the approval of the State Administration of Foreign Exchange (“SAFE”) by complying with certain procedural requirements. However, the relevant PRC governmental authorities may limit or eliminate our ability to purchase foreign currencies in the future for current account transactions. The existing and future restrictions on currency exchange may limit our ability to utilize revenue generated in Renminbi to fund our business activities outside of the PRC or pay dividends in foreign currencies to our stockholders,shareholders, including holders of our shares of common stock. Foreign exchange transactions under the capital account remain subject to limitations and require approvals from, or registration with, SAFE and other relevant PRC governmental authorities. This could affect our ability to obtain foreign currency through debt or equity financing for our PRC subsidiaries.
Applicable PRC law permits payment of dividends to us by our operating subsidiaries in China only out of their net income, if any, determined in accordance with PRC accounting standards and regulations. Our operating subsidiaries in China are also required to set aside a portion of their net income, if any, each year to fund general reserves for appropriations until such reserves have reached 50% of the subsidiary'ssubsidiary’s registered capital. These reserves are not distributable as cash dividends. In addition, registered share capital and capital reserve accounts are also restricted from withdrawal in the PRC, up to the amount of net assets held in each operating subsidiary. In contrast, there is no foreign exchange control or restrictions on capital flows into and out of Hong Kong. Hence, our Hong Kong operating subsidiary is able to transfer cash without any limitation to the U.S. under normal circumstances.
If our operating subsidiaries were to incur additional debt on their own behalf in the future, the instruments governing the debt may restrict the ability of our operating subsidiaries to transfer cash to our U.S. investors.
Off-Balance Sheet Arrangements
We have no off-balance sheet arrangements, including arrangements that would affect our liquidity, capital resources, market risk support, and credit risk support or other benefits.
Future Financings
We have always been generating sufficient cash frommay sell our operationcommon stock in order to fund our business organically. However, we may conduct equity sales of our common shares in order to fund further expansion and growth of our business.growth. Issuances of additional shares will result in dilution to existing stockholders.shareholders. There is no assurance that we will achieve any sales of the equity securities or arrange for debt or other financing to fund expansion and other activities,our growth in case it is necessary, or if we are able to do so, there is no guarantee that existing shareholders will not be substantially diluted. In essence, we do not need to rely on equity sales to fund our business operations.
Critical Accounting Policies
We regularly evaluate the accounting policies and estimates that we use to make budgetary and financial statement assumptions. A complete summary of these policies is included in the notes to our financial statements. In general, management'smanagement’s estimates are based on historical experience, on information from third party professionals, and on various other assumptions that are believed to be reasonable under the facts and circumstances. Actual results could differ from those estimates made by management.
See The discussion of our critical accounting policies contained in Note 2 to theour consolidated financial statements, included herewith and“Summary of Significant Accounting Policies”, is incorporated herein by reference.
Recent Accounting Pronouncements
The discussion of the recent accounting pronouncements contained in Note 2 to theour consolidated financial statements, on Form 10-K for the fiscal year ended December 31, 2016, previously filed with the SEC.“Summary of Significant Accounting Policies”, is incorporated herein by reference.
Recent Accounting Pronouncements
See Note 2 to the financial statements included herewith and Note 2 to the financial statements on Form 10-K for the fiscal year ended December 31, 2016, previously filed with the SEC.
Item 3. Quantitative and Qualitative Disclosures About Market Risk.
Not applicable.
Item 4. Controls and Procedures.
Conclusion Regarding the Effectiveness of Disclosure Controls and Procedures
We conducted an evaluation of the effectiveness of the design and operation of our disclosure controls and procedures, as such term is defined under Rule 13a-15(e) promulgated under the Securities Exchange Act of 1934, as amended (Exchange Act), under the supervision of and with the participation of our management, which presently comprises our Chief Executive Officer, Mr. Di XiaoKwok Leung Li, Co-Chief Executive Officer, Mr. Kuangtao Wang and our Chief Financial Officer, Mr. Chun Hin Leslie Chow.Jianguang Qian. Based upon that evaluation, the Company’s Chief Executive Officer and Chief Financial Officer concluded that the Company’s disclosure controls and procedures as of September 30, 2017March 31, 2022 were effective to ensure that information required to be disclosed by the Company in the reports that the Company files or submits under the Exchange Act, is recorded, processed, summarized and reported, within the time periods specified in the SEC’s rules and forms, and that such information is accumulated and communicated to the Company’s management, including the Company’s Chief Executive Officer and Chief Financial Officer, as appropriate, to allow timely decisions regarding required disclosure.
Changes in Internal Controls over Financial Reporting
There were no changes in our internal control over financial reporting that occurred during our fiscal quarter ended September 30, 2017March 31, 2022 that materially affected, or are reasonably likely to materially affect our internal control over financial reporting.
27
PART II -II. OTHER INFORMATION
ITEM 1. LEGAL PROCEEDINGS
Item 1. Legal Proceedings.On or around July 2020, a third claim was filed in the Shanghai Pudong People’s Court, China against Hong Kong Takung on the basis of alleged breaches of contract. The claim amount has yet to be determined. A court hearing will be held on July 20, 2021. On June 9, 2021, the court of final appeal unanimously agreed with the previous court ’s judgment, which is in favor Hong Kong Takung. Accordingly, the legal case has been settled and closed.
None.Due to the increased regulatory scrutiny by PRC government on digital asset related businesses, the artwork unit trading platform operated by the PRC subsidiary, Tianjin Takung, was suspended by the local authority. The management became aware of the suspension on or around November 8, 2021. The local authority indicated that the suspension was to facilitate certain investigation although it did not announce the purpose of the investigation. The Company intended to fully cooperate with the local authority’s investigation. As of the date of this report, there has been no development in regard with this investigation.
ITEM 1A. RISK FACTORS
Item 1A. Risk FactorsAs of the date of this report and except as set forth below, there have been no material changes to the risk factors disclosed in our annual report on Form 10-K filed with the SEC on April 15, 2022.
Not applicable.
ITEM 2. UNREGISTERED SALES OF EQUITY SECURITIES AND USE OF PROCEEDS
Item 2. Unregistered Sales of Equity Securities and Use of Proceeds.None.
None.
ITEM 3. DEFAULTS UPON SENIOR SECURITIES
Item 3. Defaults Upon Senior Securities.None.
None.
ITEM 4. MINE SAFETY DISCLOSURES
Item 4. Mine Safety Disclosures.
Not applicable.
ITEM 5. OTHER INFORMATION
Item 5. Other Information.
Not applicable.
ITEM 6. EXHIBITS
Item 6. Exhibits.The following exhibits are filed herewith:
Copies of the following documents are included as exhibits to this report pursuant to Item 601 of Regulation S-K.
| (1) | Incorporated herein by reference to the exhibitexhibits to our registration statement on Form S-1 filed with the SEC on August 16, 2011. |
| (2) | Incorporated herein by reference to the exhibit to our current report on Form 8-K filed with the SEC on March 7, 2013. |
| (3) | Incorporated by reference to the exhibit to our current report on Form 8-K filed with the SEC on October 22, 2014. |
| (4) | Incorporatedherein by reference to the exhibit to our current report on Form 8-K filed with the SEC on November 6, 2014. |
*Filed herewith.
**Furnished herewith.
SIGNATURES
| (4) | Incorporated herein by reference to Exhibit 3.1 to our current report on Form 8-K filed with the SEC on August 12, 2015. |
| (5) | Incorporated herein by reference to exhibits to our current report on Form 8-K filed with the SEC on February 23, 2022. |
| (6) | Incorporated herein by reference to exhibits to our current report on Form 8-K filed with the SEC on March 25, 2022. |
| (7) | Incorporated herein by reference to exhibits to our current report on Form 8-K filed with the SEC on January 7, 2022. |
| * | Portions of this exhibit have been redacted in compliance with Regulation S-K Item 601(b)(10)(iv). |
SIGNATURES
Pursuant to the requirements of the Securities Exchange Act of 1934, the registrant caused this report to be signed on its behalf by the undersigned thereunto duly authorized.
| May 16, 2022 | TAKUNG ART CO., LTD |
| |
| By: | /s/ Kuangtao Wang |
| | Kuangtao Wang |
| | Co-Chief Executive Officer |
| | (Principal Executive Officer) |
| | | |
Date: November 14, 2017 | By: | /s/ Di XiaoJianguang Qian |
| | | Di XiaoJianguang Qian |
| | | Chief ExecutiveFinancial Officer |
| | | (Principal Executive Officer) and Director |
| | |
Date: November 14, 2017 | By: | /s/ Chun Hin Leslie Chow |
| | Chun Hin Leslie Chow |
| | Chief Financial Officer |
| | (Principal Financial Officer and Principal Accounting Officer) |
40
iso4217:USD xbrli:shares