UNITED STATES
SECURITIES AND EXCHANGE COMMISSION
Washington, D.C. 20549
FORM 10-Q
(Mark One)
| x | QUARTERLY REPORT PURSUANT TO SECTION 13 OR 15(d) OF THE SECURITIES EXCHANGE ACT OF 1934 |
For the quarterly period ended: December 31, 2017September 30, 2019
| ¨ | TRANSITION REPORT PURSUANT TO SECTION 13 OR 15(d) OF THE SECURITIES EXCHANGE ACT OF 1934 |
For the transition period from _____________ to _____________
Commission File No. 000-53501
RESEARCH SOLUTIONS, INC.
(Exact name of registrant as specified in its charter)
| Nevada | 11-3797644 | |
| (State or other jurisdiction of incorporation or organization) | (I.R.S. Employer Identification No.) | |
| 91436 | ||
| (Address of principal executive offices) | (Zip Code) |
(310) 477-0354
(Registrant’s telephone number, including area code)
15821 Ventura Blvd., Suite 165, Encino, California
(Former name, former address and former fiscal year, if changed since last report)
Securities registered pursuant to Section 12(b) of the Act: None
Indicate by check mark whether the registrant (1) has filed all reports required to be filed by Section 13 or 15(d) of the Securities Exchange Act of 1934 during the preceding 12 months (or for such shorter period that the registrant was required to file such reports), and (2) has been subject to such filing requirements for the past 90 days. YesþNo¨
Indicate by check mark whether the registrant has submitted electronically and posted on its corporate Web site, if any, every Interactive Data File required to be submitted and posted pursuant to Rule 405 of Regulation S-T (§232.405 of this chapter) during the preceding 12 months (or for such shorter period that the registrant was required to submit and post such files). YesþNo¨
Indicate by check mark whether the registrant is a large accelerated filer, an accelerated filer, a non-accelerated filer, a smaller reporting company or an emerging growth company. See the definitions of “large accelerated filer,” “accelerated filer,” “smaller reporting company” and “emerging growth company” in Rule 12b-2 of the Exchange Act.
| Large accelerated filer¨ | Accelerated filer¨ |
| Non-accelerated filer | Smaller reporting companyþ |
| Emerging growth company¨ |
If an emerging growth company, indicate by check mark if the registrant has elected not to use the extended transition period for complying with any new or revised financial accounting standards provided pursuant to Section 13(a) of the Exchange Act.¨
Indicate by check mark whether the registrant is a shell company (as defined in Rule 12b-2 of the Exchange Act). Yes¨Noþ
Indicate the number of shares outstanding of each of the issuer’s classes of common stock as of the latest practicable date.
| Title of Class | Number of Shares Outstanding on | |
| Common Stock, $0.001 par value | 24,488,035 |
TABLE OF CONTENTS
PART 1 — FINANCIAL INFORMATION
Item 1. Condensed Consolidated Financial Statements
Research Solutions, Inc. and Subsidiaries
Condensed Consolidated Balance Sheets
| December 31, | June 30, | September 30, | ||||||||||||||
| 2017 | 2017 | 2019 | June 30, | |||||||||||||
| (unaudited) | (unaudited) | 2019 | ||||||||||||||
| Assets | ||||||||||||||||
| Current assets: | ||||||||||||||||
| Cash and cash equivalents | $ | 4,924,620 | $ | 5,773,950 | $ | 5,587,833 | $ | 5,353,090 | ||||||||
| Accounts receivable, net of allowance of $119,462 and $119,536, respectively | 3,739,099 | 5,465,299 | ||||||||||||||
| Accounts receivable, net of allowance of $100,110 and $100,175, respectively | 4,376,807 | 4,493,169 | ||||||||||||||
| Prepaid expenses and other current assets | 315,906 | 196,820 | 259,880 | 323,591 | ||||||||||||
| Prepaid royalties | 736,145 | 566,282 | 69,699 | - | ||||||||||||
| Total current assets | 9,715,770 | 12,002,351 | 10,294,219 | 10,169,850 | ||||||||||||
| Other assets: | ||||||||||||||||
| Property and equipment, net of accumulated depreciation of $728,271 and $699,421, respectively | 81,340 | 85,737 | ||||||||||||||
| Intangible assets, net of accumulated amortization of $679,836 and $623,714, respectively | - | 41,870 | ||||||||||||||
| Property and equipment, net of accumulated depreciation of $796,199 and $789,788, respectively | 28,840 | 36,828 | ||||||||||||||
| Deposits and other assets | 14,383 | 14,466 | 14,382 | 14,406 | ||||||||||||
| Right of use asset, net of accumulated amortization of $99,864 and $45,105, respectively | 363,158 | 417,917 | ||||||||||||||
| Right of use asset, net of accumulated amortization of $300,290 and $270,777, respectively | 162,732 | 192,245 | ||||||||||||||
| Total assets | $ | 10,174,651 | $ | 12,562,341 | $ | 10,500,173 | $ | 10,413,329 | ||||||||
| Liabilities and Stockholders’ Equity | ||||||||||||||||
| Current liabilities: | ||||||||||||||||
| Accounts payable and accrued expenses | $ | 5,053,770 | $ | 6,443,056 | $ | 4,886,724 | $ | 4,862,895 | ||||||||
| Deferred revenue | 1,306,429 | 1,335,475 | 2,418,795 | 2,310,206 | ||||||||||||
| Lease liability, current portion | 115,263 | 110,888 | 131,617 | 129,187 | ||||||||||||
| Total current liabilities | 6,475,462 | 7,889,419 | 7,437,136 | 7,302,288 | ||||||||||||
| Long-term liabilities: | ||||||||||||||||
| Lease liability, long-term portion | 269,924 | 328,299 | 45,550 | 79,326 | ||||||||||||
| Total liabilities | 6,745,386 | 8,217,718 | 7,482,686 | 7,381,614 | ||||||||||||
| Commitments and contingencies | ||||||||||||||||
| Stockholders’ equity: | ||||||||||||||||
| Preferred stock; $0.001 par value; 20,000,000 shares authorized; no shares issued and outstanding | - | - | - | - | ||||||||||||
| Common stock; $0.001 par value; 100,000,000 shares authorized; 24,147,582 and 23,883,145 shares issued and outstanding, respectively | 24,148 | 23,883 | ||||||||||||||
| Common stock; $0.001 par value; 100,000,000 shares authorized; 24,441,505 and 24,375,948 shares issued and outstanding, respectively | 24,442 | 24,376 | ||||||||||||||
| Additional paid-in capital | 22,764,915 | 22,267,327 | 23,702,212 | 23,631,481 | ||||||||||||
| Accumulated deficit | (19,273,403 | ) | (17,875,858 | ) | (20,596,014 | ) | (20,514,557 | ) | ||||||||
| Accumulated other comprehensive loss | (86,395 | ) | (70,729 | ) | (113,153 | ) | (109,585 | ) | ||||||||
| Total stockholders’ equity | 3,429,265 | 4,344,623 | 3,017,487 | 3,031,715 | ||||||||||||
| Total liabilities and stockholders’ equity | $ | 10,174,651 | $ | 12,562,341 | $ | 10,500,173 | $ | 10,413,329 | ||||||||
See notes to condensed consolidated financial statements
Research Solutions, Inc. and Subsidiaries
Condensed Consolidated Statements of Operations and Other Comprehensive Loss
(Unaudited)
| Three Months Ended | Six Months Ended | |||||||||||||||||||||||
| December 31, | December 31, | Three Months Ended | ||||||||||||||||||||||
| 2017 | 2016 | 2017 | 2016 | September 30, | ||||||||||||||||||||
| 2019 | 2018 | |||||||||||||||||||||||
| Revenue: | ||||||||||||||||||||||||
| Platforms | $ | 413,404 | $ | 219,137 | $ | 801,349 | $ | 391,209 | $ | 856,445 | $ | 589,013 | ||||||||||||
| Transactions | 6,409,816 | 5,866,562 | 12,769,711 | 11,872,961 | 6,738,668 | 6,363,508 | ||||||||||||||||||
| Total revenue | 6,823,220 | 6,085,699 | 13,571,060 | 12,264,170 | 7,595,113 | 6,952,521 | ||||||||||||||||||
| Cost of revenue: | ||||||||||||||||||||||||
| Platforms | 90,362 | 45,623 | 174,349 | 75,587 | 150,470 | 108,259 | ||||||||||||||||||
| Transactions | 4,996,988 | 4,664,690 | 9,911,402 | 9,379,689 | 5,128,108 | 4,896,307 | ||||||||||||||||||
| Total cost of revenue | 5,087,350 | 4,710,313 | 10,085,751 | 9,455,276 | 5,278,578 | 5,004,566 | ||||||||||||||||||
| Gross profit | 1,735,870 | 1,375,386 | 3,485,309 | 2,808,894 | 2,316,535 | 1,947,955 | ||||||||||||||||||
| Operating expenses: | ||||||||||||||||||||||||
| Selling, general and administrative | 2,391,969 | 2,401,633 | 4,929,005 | 4,299,332 | 2,435,680 | 2,170,712 | ||||||||||||||||||
| Depreciation and amortization | 46,330 | 32,426 | 86,898 | 62,895 | 7,558 | 11,115 | ||||||||||||||||||
| Total operating expenses | 2,438,299 | 2,434,059 | 5,015,903 | 4,362,227 | 2,443,238 | 2,181,827 | ||||||||||||||||||
| Loss from operations | (702,429 | ) | (1,058,673 | ) | (1,530,594 | ) | (1,553,333 | ) | (126,703 | ) | (233,872 | ) | ||||||||||||
| Other income (expenses): | ||||||||||||||||||||||||
| Interest expense | (3,000 | ) | (3,000 | ) | (6,000 | ) | (6,000 | ) | ||||||||||||||||
| Other income | 11,312 | 5,424 | 24,114 | 10,134 | 25,549 | 23,485 | ||||||||||||||||||
| Total other income | 8,312 | 2,424 | 18,114 | 4,134 | 25,549 | 23,485 | ||||||||||||||||||
| Loss from operations before provision for income taxes | (694,117 | ) | (1,056,249 | ) | (1,512,480 | ) | (1,549,199 | ) | (101,154 | ) | (210,387 | ) | ||||||||||||
| Provision for income taxes | (9,816 | ) | (9,337 | ) | (21,567 | ) | (22,942 | ) | (6,494 | ) | (9,221 | ) | ||||||||||||
| Loss from continuing operations | (703,933 | ) | (1,065,586 | ) | (1,534,047 | ) | (1,572,141 | ) | (107,648 | ) | (219,608 | ) | ||||||||||||
| Discontinued operations: | ||||||||||||||||||||||||
| Income from discontinued operations | - | 222,626 | - | 318,515 | ||||||||||||||||||||
| Gain from sale of discontinued operations | 79,353 | - | 136,502 | - | 26,191 | 41,720 | ||||||||||||||||||
| Income from discontinued operations | 79,353 | 222,626 | 136,502 | 318,515 | ||||||||||||||||||||
| Net loss | (624,580 | ) | (842,960 | ) | (1,397,545 | ) | (1,253,626 | ) | (81,457 | ) | (177,888 | ) | ||||||||||||
| Other comprehensive income (loss): | ||||||||||||||||||||||||
| Other comprehensive loss: | ||||||||||||||||||||||||
| Foreign currency translation | (6,715 | ) | 5,195 | (15,666 | ) | 1.912 | (3,568 | ) | (4,370 | ) | ||||||||||||||
| Comprehensive loss | $ | (631,295 | ) | $ | (837,765 | ) | $ | (1,413,211 | ) | $ | (1,251,714 | ) | $ | (85,025 | ) | $ | (182,258 | ) | ||||||
| Loss per common share: | ||||||||||||||||||||||||
| Loss per share from continuing operations, basic and diluted | $ | (0.03 | ) | $ | (0.05 | ) | $ | (0.07 | ) | $ | (0.06 | ) | $ | - | $ | (0.01 | ) | |||||||
| Income per share from discontinued operations, basic and diluted | $ | - | $ | 0.01 | $ | 0.01 | $ | 0.01 | $ | - | $ | - | ||||||||||||
| Net loss per share, basic and diluted | $ | (0.03 | ) | $ | (0.04 | ) | $ | (0.06 | ) | $ | (0.05 | ) | $ | - | $ | (0.01 | ) | |||||||
| Weighted average common shares outstanding, basic and diluted | 23,455,654 | 23,200,975 | 23,418,046 | 23,166,272 | 24,095,266 | 23,644,787 | ||||||||||||||||||
See notes to condensed consolidated financial statements
Research Solutions, Inc. and Subsidiaries
Condensed Consolidated Statement of Stockholders' Equity
For the Three Months Ended September 30, 2019
(Unaudited)
| Common Stock | Additional Paid-in | Accumulated | Other Comprehensive | Total Stockholders' | ||||||||||||||||||||
| Shares | Amount | Capital | Deficit | Loss | Equity | |||||||||||||||||||
| Balance, July 1, 2019 | 24,375,948 | $ | 24,376 | $ | 23,631,481 | $ | (20,514,557 | ) | $ | (109,585 | ) | $ | 3,031,715 | |||||||||||
| Fair value of vested stock options | - | - | 58,198 | - | - | 58,198 | ||||||||||||||||||
| Fair value of vested restricted common stock | 70,000 | 70 | 84,404 | - | - | 84,474 | ||||||||||||||||||
| Repurchase of common stock | (28,750 | ) | (28 | ) | (71,847 | ) | - | - | (71,875 | ) | ||||||||||||||
| Common stock issued upon exercise of stock options | 24,307 | 24 | (24 | ) | - | - | - | |||||||||||||||||
| Net loss for the period | - | - | - | (81,457 | ) | - | (81,457 | ) | ||||||||||||||||
| Foreign currency translation | - | - | - | - | (3,568 | ) | (3,568 | ) | ||||||||||||||||
| Balance, September 30, 2019 | 24,441,505 | $ | 24,442 | $ | 23,702,212 | $ | (20,596,014 | ) | $ | (113,153 | ) | $ | 3,017,487 | |||||||||||
See notes to condensed consolidated financial statements
Research Solutions, Inc. and Subsidiaries
Condensed Consolidated Statement of Stockholders' Equity
For the SixThree Months Ended December 31, 2017September 30, 2018
(Unaudited)
| Common Stock | Additional Paid-in | Accumulated | Other Comprehensive | Total Stockholders' | ||||||||||||||||||||
| Shares | Amount | Capital | Deficit | Loss | Equity | |||||||||||||||||||
| Balance, July 1, 2017 | 23,883,145 | $ | 23,883 | $ | 22,267,327 | $ | (17,875,858 | ) | $ | (70,729 | ) | $ | 4,344,623 | |||||||||||
| Fair value of vested stock options | - | - | 389,236 | - | - | 389,236 | ||||||||||||||||||
| Fair value of vested restricted common stock | 338,302 | 339 | 205,000 | - | - | 205,339 | ||||||||||||||||||
| Repurchase of common stock | (87,100 | ) | (87 | ) | (102,868 | ) | - | - | (102,955 | ) | ||||||||||||||
| Modification cost of stock options | - | - | 6,233 | - | - | 6,233 | ||||||||||||||||||
| Common stock issued upon exercise of stock options | 13,235 | 13 | (13 | ) | - | - | - | |||||||||||||||||
| Net loss for the period | - | - | - | (1,397,545 | ) | - | (1,397,545 | ) | ||||||||||||||||
| Foreign currency translation | - | - | - | - | (15,666 | ) | (15,666 | ) | ||||||||||||||||
| Balance, December 31, 2017 | 24,147,582 | $ | 24,148 | $ | 22,764,915 | $ | (19,273,403 | ) | $ | (86,395 | ) | $ | 3,429,265 | |||||||||||
| Common Stock | Additional Paid-in | Accumulated | Other Comprehensive | Total Stockholders' | ||||||||||||||||||||
| Shares | Amount | Capital | Deficit | Loss | Equity | |||||||||||||||||||
| Balance, July 1, 2018 | 24,016,999 | $ | 24,017 | $ | 22,904,691 | $ | (19,554,599 | ) | $ | (94,707 | ) | $ | 3,279,402 | |||||||||||
| Fair value of vested stock options | - | - | 39,648 | - | - | 39,648 | ||||||||||||||||||
| Fair value of vested restricted common stock | 130,127 | 130 | 76,131 | - | - | 76,261 | ||||||||||||||||||
| Repurchase of common stock | (34,200 | ) | (34 | ) | (75,166 | ) | - | - | (75,200 | ) | ||||||||||||||
| Common stock issued upon exercise of stock options | 3,750 | 4 | (4 | ) | - | - | - | |||||||||||||||||
| Common stock issued upon exercise of warrants | 39,000 | 39 | (39 | ) | - | - | - | |||||||||||||||||
| Net loss for the period | - | - | - | (177,888 | ) | - | (177,888 | ) | ||||||||||||||||
| Foreign currency translation | - | - | - | - | (4,370 | ) | (4,370 | ) | ||||||||||||||||
| Balance, September 30, 2018 | 24,155,676 | $ | 24,156 | $ | 22,945,261 | $ | (19,732,487 | ) | $ | (99,077 | ) | $ | 3,137,853 | |||||||||||
See notes to condensed consolidated financial statements
Research Solutions, Inc. and Subsidiaries
Condensed Consolidated Statements of Cash Flows
(Unaudited)
| Six Months Ended | ||||||||
| December 31, | ||||||||
| 2017 | 2016 | |||||||
| Cash flow from operating activities: | ||||||||
| Net loss | $ | (1,397,545 | ) | $ | (1,253,626 | ) | ||
| Adjustment to reconcile net loss to net cash provided by (used in) operating activities of operations: | ||||||||
| Gain from sale of discontinued operations | (136,502 | ) | - | |||||
| Depreciation and amortization | 86,898 | 62,895 | ||||||
| Amortization of lease right | 54,759 | - | ||||||
| Fair value of vested stock options | 389,236 | 228,491 | ||||||
| Fair value of vested restricted common stock | 205,339 | 177,194 | ||||||
| Modification cost of stock options | 6,233 | - | ||||||
| Changes in operating assets and liabilities: | ||||||||
| Accounts receivable | 1,726,200 | 696,302 | ||||||
| Prepaid expenses and other current assets | 17,416 | (56,140 | ) | |||||
| Prepaid royalties | (169,863 | ) | (1,044,250 | ) | ||||
| Deposits and other assets | - | (11,374 | ) | |||||
| Accounts payable and accrued expenses | (1,389,286 | ) | 1,449,375 | |||||
| Deferred revenue | (29,046 | ) | 527,695 | |||||
| Lease liability | (54,000 | ) | - | |||||
| Net cash provided by (used in) operating activities | (690,161 | ) | 776,562 | |||||
| Cash flow from investing activities: | ||||||||
| Purchase of property and equipment | (29,284 | ) | (16,091 | ) | ||||
| Purchase of intangible assets | (14,252 | ) | (9,751 | ) | ||||
| Net cash used in investing activities | (43,536 | ) | (25,842 | ) | ||||
| Cash flow from financing activities: | ||||||||
| Common stock repurchase and retirement | (102,955 | ) | (82,354 | ) | ||||
| Net cash used in financing activities | (102,955 | ) | (82,354 | ) | ||||
| Effect of exchange rate changes | (12,678 | ) | 3,386 | |||||
| Net increase (decrease) in cash and cash equivalents | (849,330 | ) | 671,752 | |||||
| Cash and cash equivalents, beginning of period | 5,773,950 | 6,076,875 | ||||||
| Cash and cash equivalents, end of period | $ | 4,924,620 | $ | 6,748,627 | ||||
| Supplemental disclosures of cash flow information: | ||||||||
| Cash paid for income taxes | $ | 21,567 | $ | 22,942 | ||||
| Cash paid for interest | $ | 6,000 | $ | 6,000 | ||||
| Three Months Ended | ||||||||
| September 30, | ||||||||
| 2019 | 2018 | |||||||
| Cash flow from operating activities: | ||||||||
| Net loss | $ | (81,457 | ) | $ | (177,888 | ) | ||
| Adjustment to reconcile net loss to net cash provided by (used in) operating activities: | ||||||||
| Gain from sale of discontinued operations | (26,191 | ) | (41,720 | ) | ||||
| Depreciation and amortization | 7,558 | 11,115 | ||||||
| Amortization of lease right | 29,513 | 28,338 | ||||||
| Fair value of vested stock options | 58,198 | 39,648 | ||||||
| Fair value of vested restricted common stock | 84,474 | 76,261 | ||||||
| Changes in operating assets and liabilities: | ||||||||
| Accounts receivable | 116,362 | 200,015 | ||||||
| Prepaid expenses and other current assets | 89,902 | 105,843 | ||||||
| Prepaid royalties | (69,699 | ) | (162,067 | ) | ||||
| Accounts payable and accrued expenses | 23,829 | (320,404 | ) | |||||
| Deferred revenue | 108,589 | (30,219 | ) | |||||
| Lease liability | (31,346 | ) | (29,045 | ) | ||||
| Net cash provided by (used in) operating activities | 309,732 | (300,123 | ) | |||||
| Cash flow from investing activities: | ||||||||
| Purchase of property and equipment | - | - | ||||||
| Net cash used in investing activities | - | - | ||||||
| Cash flow from financing activities: | ||||||||
| Common stock repurchase and retirement | (71,875 | ) | (75,200 | ) | ||||
| Net cash used in financing activities | (71,875 | ) | (75,200 | ) | ||||
| Effect of exchange rate changes | (3,114 | ) | (5,830 | ) | ||||
| Net increase (decrease) in cash and cash equivalents | 234,743 | (381,153 | ) | |||||
| Cash and cash equivalents, beginning of period | 5,353,090 | 4,908,180 | ||||||
| Cash and cash equivalents, end of period | $ | 5,587,833 | $ | 4,527,027 | ||||
| Supplemental disclosures of cash flow information: | ||||||||
| Cash paid for income taxes | $ | 6,494 | $ | 9,221 | ||||
See notes to condensed consolidated financial statements
RESEARCH SOLUTIONS, INC. AND SUBSIDIARIES
NOTES TO CONDENSED CONSOLIDATED FINANCIAL STATEMENTS
SixThree Months Ended December 31, 2017September 30, 2019 and 20162018 (Unaudited)
Note 1. Organization, Nature of Business and Basis of Presentation
Organization
Research Solutions, Inc. (the “Company,” “Research Solutions,” “we,” “us” or “our”) was incorporated in the State of Nevada on November 2, 2006, and is a publicly traded holding company with two wholly owned subsidiaries: Reprints Desk, Inc., a Delaware corporation and Reprints Desk Latin America S. de R.L. de C.V, an entity organized under the laws of Mexico.
Nature of Business
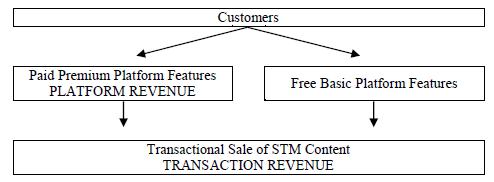
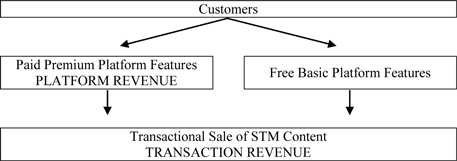
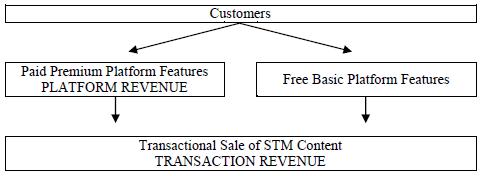
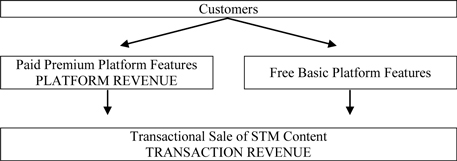
We provide two service offerings to our customers: annual licenses that allow customers to access and utilize certain premium features of our cloud based software-as-a-service (“SaaS”) research intelligence platform (“Platforms”) and the transactional sale of published scientific, technical, and medical (“STM”) content managed, sourced and delivered through the Platform (“Transactions”). Platforms and Transactions are packaged as a single solution that enable life science and other research-intensiveresearch intensive organizations to speed up research and development activities with faster, single sourced access and management of content and data used throughout the intellectual property development lifecycle.
Platforms
Our cloud-based SaaS research intelligence platform consists of proprietary software and Internet-based interfaces.interfaces sold to customers for an annual subscription fee. Legacy functionality allows customers to initiate orders, route orders for the lowest cost acquisition, manage transactions, obtain spend and usage reporting, automate authentication, and connect seamlessly to in-house and third-party software systems. Customers can also enhance the information resources they already own or license and collaborate around bibliographic information.
Additional functionality has recently been added to our Platform in the form of interactive app-like gadgets. An alternative to manual data filtering, identification and extraction, gadgets are designed to gather, augment, and extract data across a variety of formats, including bibliographic citations, tables of contents, RSS feeds, PDF files, XML feeds, and web content. We are rapidly developing new gadgets in order to build an ecosystem of gadgets. Together, these gadgets will provide researchers with an “all in one” toolkit, delivering efficiencies in core research workflows and knowledge creation processes.
Our Platform is deployed as a single, multi-tenant system across our entire customer base. Customers securely access the Platform through online web interfaces and via web service APIs that enable customers to leverage Platform features and functionality from within in-house and third-party software systems. The Platform can also be configured to satisfy a customer’s individual preferences. We leverage our Platform’s efficiencies in scalability, stability and development costs to fuel rapid innovation and competitive advantage.
Transactions
Researchers and knowledge workers in life science and other research-intensive organizations generally require single copies of published STM journal articles for use in their research activities. These individuals are our primary users. Our Platform provides our customers with a single source to the universe of published STM content that includes over 70 million existing STM articles and over one million newly published STM articles each year. STM content is sold to our customers on a transaction basis. Researchers and knowledge workers in life science and other research-intensive organizations generally require single copies of published STM journal articles for use in their research activities. These individuals are our primary users.
Our Platform allows customers to find and download digital versions of STM articles that are critical to their research. Customers submit orders for the articles they need which we source and electronically deliver to them generally in under an hour. This service is generally known in the industry as single article delivery or document delivery. We also obtain the necessary permission licenses from the content publisher or other rights holder so that our customer’s use complies with applicable copyright laws. We have arrangements with hundreds of content publishers that allow us to distribute their content. The majority of these publishers provide us with electronic access to their content, which allows us to electronically deliver single articles to our customers often in a matter of minutes.
Principles of Consolidation
The accompanying financial statements are consolidated and include the accounts of the Company and its wholly-owned subsidiaries. Intercompany balances and transactions have been eliminated in consolidation.
8
Basis of Presentation
The accompanying condensed consolidated financial statements are unaudited. These unaudited interim condensed consolidated financial statements have been prepared in accordance with accounting principles generally accepted in the United States (“GAAP”) and applicable rules and regulations of the Securities and Exchange Commission (“SEC”) regarding interim financial reporting. Certain information and note disclosures normally included in the financial statements prepared in accordance with GAAP have been condensed or omitted pursuant to such rules and regulations. Accordingly, these interim condensed consolidated financial statements should be read in conjunction with the consolidated financial statements and notes thereto contained in the Company’s Annual Report on Form 10-K for the fiscal year ended June 30, 20172019 filed with the SEC. The condensed consolidated balance sheet as of June 30, 20172019 included herein was derived from the audited consolidated financial statements as of that date, but does not include all disclosures, including notes, required by GAAP.
In the opinion of management, the accompanying unaudited condensed consolidated financial statements contain all adjustments necessary to fairly present the Company's financial position and results of operations for the interim periods reflected. Except as noted, all adjustments contained herein are of a normal recurring nature. Results of operations for the fiscal periods presented herein are not necessarily indicative of fiscal year-end results.
Note 2. Summary of Significant Accounting Policies
Use of Estimates
The preparation of financial statements in conformity with GAAPGenerally Accepted Accounting Principles (“GAAP”) requires management to make estimates and assumptions that affect the reported amounts of assets and liabilities and disclosures of contingent assets and liabilities at the date of the financial statements and the reported amounts of revenue and expenses during the reporting periods. Actual results could differ from these estimates.
These estimates and assumptions include estimates for reserves of uncollectible accounts, analysis of impairments of recorded intangibles, accruals for potential liabilities, assumptions made in valuing equity instruments issued for services or acquisitions, and realization of deferred tax assets.
Concentration of Credit Risk
Financial instruments, which potentially subject the Company to concentrations of credit risk, consist of cash and cash equivalents and accounts receivable. The Company places its cash with high quality financial institutions and at times may exceed the FDIC $250,000 insurance limit. The Company does not anticipate incurring any losses related to these credit risks. The Company extends credit based on an evaluation of the customer's financial condition, generally without collateral. Exposure to losses on receivables is principally dependent on each customer's financial condition. The Company monitors its exposure for credit losses and intends to maintain allowances for anticipated losses, as required.
Cash denominated in Euros with a US Dollar equivalent of $63,669$109,105 and $93,359$63,933 at December 31, 2017September 30, 2019 and June 30, 2017,2019, respectively, was held by Reprints Desk in accounts at financial institutions located in Europe.
The Company has no customers that represent 10% of revenue or more for the three and six months ended December 31, 2017September 30, 2019 and 2016.2018.
The Company has no customers that accounted for greaterfollowing table summarizes accounts receivable concentrations:
| As of | ||||||||
| September 30, | June 30, | |||||||
| 2019 | 2019 | |||||||
| Customer A | 13 | % | * | |||||
* Less than 10% of accounts receivable at December 31, 2017 and June 30, 2017.
The following table summarizes vendor concentrations:
| Three Months Ended December 31, | Six Months Ended December 31, | Three Months Ended September 30, | ||||||||||||||||||||||
| 2017 | 2016 | 2017 | 2016 | 2019 | 2018 | |||||||||||||||||||
| Vendor A | 15 | % | 18 | % | 15 | % | 18 | % | 20 | % | 18 | % | ||||||||||||
| Vendor B | 12 | % | * | 12 | % | * | 12 | % | 11 | % | ||||||||||||||
| Vendor C | 12 | % | * | 12 | % | * | * | 11 | % | |||||||||||||||
* Less than 10%
Revenue Recognition
In May 2014, the Financial Accounting Standards Board (“FASB”) issued ASU 2014-09, Revenue from Contracts with Customers (Topic 606), ("ASC 606"). The Company’s policyunderlying principle of ASC 606 is to recognize revenue to depict the transfer of goods or services to customers at the amount expected to be collected. The Company adopted the guidance of ASC 606 on July 1, 2018. The implementation of ASC 606 had no impact on the condensed consolidated financial statements and no cumulative effect adjustment was recognized.
Revenues are recognized when control of the promised goods or services have been performed, risk of loss and titleare transferred to a customer, in an amount that reflects the product transfersconsideration that the Company expects to the customer, the selling price is fixedreceive in exchange for those goods or determinable, and collectability is reasonably assured. We generate revenue by providingservices. The Company derives its revenues from two service offerings to our customers:sources: annual licenses that allow customers to access and utilize certain premium features of our cloud based SaaS research intelligence platform (Platforms)(“Platforms”) and the transactiontransactional sale of STM content managed, sourced and delivered through the Platform (Transactions)(“Transactions”).
| identify the contract with a customer; | ||
| • | identify the performance obligations in the contract; | |
| • | determine the transaction price; | |
| • | allocate the transaction price to performance obligations in the contract; and | |
| • | recognize revenue as the performance obligation is satisfied. |
Platforms
We charge a subscription fee that allows customers to access and utilize certain premium features of our Platform. Revenue is recognized ratably over the term of the subscription agreement, which is typically one year, provided all other revenue recognition criteria have been met. Billings or payments received in advance of revenue recognition are recorded as deferred revenue.
Transactions
We charge a transactional service fee for the electronic delivery of single articles, and a corresponding copyright fee for the permitted use of the content. We recognize revenue from single article delivery services upon delivery to the customer only when the selling price is fixed or determinable, and collectability is reasonably assured.provided all other revenue recognition criteria have been met.
Deferred Revenue
Customer deposits and billings or payments received in advance of revenue recognition are recorded as deferred revenue.
Cost of Revenue
Platforms
Cost of Platform revenue consists primarily of personnel costs of our operations team, and to a lesser extent managed hosting providers and other third-party service and data providers.
Transactions
Cost of Transaction revenue consists primarily of the respective copyright fee for the permitted use of the content, less a discount in most cases, and to a much lesser extent, personnel costs of our operations team and third-party service providers.
10
Stock-Based Compensation
The Company periodically issues stock options, warrants and restricted stock to employees and non-employees for services, in capital raising transactions, and for financing costs. The Company accounts for share-based payments under the guidance as set forth in the Share-Based Payment Topic 718 of the Financial Accounting Standards Board (FASB)FASB Accounting Standards Codification, which requires the measurement and recognition of compensation expense for all share-based payment awards made to employees, officers, directors, and consultants, including employee stock options, based on estimated fair values. The Company estimates the fair value of stock option and warrant awards to employees and directors on the date of grant using an option-pricing model, and the value of the portion of the award that is ultimately expected to vest is recognized as expense over the required service period in the Company's Statements of Operations. The Company estimates the fair value of restricted stock awards to employees and directors using the market price of the Company’s common stock on the date of grant, and the value of the portion of the award that is ultimately expected to vest is recognized as expense over the required service period in the Company's Statements of Operations. The Company accounts for share-based payments to non-employees in accordance with Topic 505 of the FASB Accounting Standards Codification, whereby the value of the stock compensation is based upon the measurement date as determined at either a) the date at which a performance commitment is reached, or b) the date at which the necessary performance to earn the equity instruments is complete. Stock-based compensation is based on awards ultimately expected to vest and is reduced for estimated forfeitures. Forfeitures are estimated at the time of grant and revised, as necessary, in subsequent periods if actual forfeitures differ from those estimates.
Foreign Currency
The accompanying consolidated financial statements are presented in United States dollars, the functional currency of the Company. Capital accounts of foreign subsidiaries are translated into US Dollars from foreign currency at their historical exchange rates when the capital transactions occurred. Assets and liabilities are translated at the exchange rate as of the balance sheet date. Income and expenditures are translated at the average exchange rate of the period. Although the majority of our revenue and costs are in US dollars, the costs of Reprints Desk Latin America are in Mexican Pesos. As a result, currency exchange fluctuations may impact our revenue and the costs of our operations. We currently do not engage in any currency hedging activities.
Gains and losses from foreign currency transactions, which result from a change in exchange rates between the functional currency and the currency in which a foreign currency transaction is denominated, are included in selling, general and administrative expenses and amounted to a gainloss of $485$12,123 and $12,872,$4,980, for the three and six months ended December 31, 2017, respectivelySeptember 30, 2019 and a loss of $17,631 and 20,955, for the three and six months ended December 31, 2016,2018, respectively. Cash denominated in Euros with a US Dollar equivalent of $63,669$109,105 and $93,359$63,933 at December 31, 2017September 30, 2019 and June 30, 2017,2019, respectively, was held in accounts at financial institutions located in Europe.
The following table summarizes the exchange rates used:
| Six Months Ended December 31, | Year Ended June 30, | Three Months Ended September 30, | Year Ended June 30, | |||||||||||||||||||||||||||||
| 2017 | 2016 | 2017 | 2016 | 2019 | 2018 | 2019 | 2018 | |||||||||||||||||||||||||
| Period end Euro : US Dollar exchange rate | 1.20 | 1.09 | 1.09 | 1.11 | 1.09 | 1.16 | 1.14 | 1.17 | ||||||||||||||||||||||||
| Average period Euro : US Dollar exchange rate | 1.17 | 1.11 | 1.09 | 1.11 | 1.12 | 1.16 | 1.14 | 1.19 | ||||||||||||||||||||||||
| Period end Mexican Peso : US Dollar exchange rate | 0.05 | 0.05 | 0.05 | 0.05 | 0.05 | 0.05 | 0.05 | 0.05 | ||||||||||||||||||||||||
| Average period Mexican Peso : US Dollar exchange rate | 0.05 | 0.05 | 0.05 | 0.06 | 0.05 | 0.05 | 0.05 | 0.05 | ||||||||||||||||||||||||
Net Income (Loss) Per Share
Basic net income (loss) per share is computed by dividing net income (loss) by the weighted average number of common shares outstanding for the period, excluding shares of unvested restricted common stock. Shares of restricted stock are included in the basic weighted average number of common shares outstanding from the time they vest. Diluted earnings per share is computed by dividing the net income applicable to common stock holders by the weighted average number of common shares outstanding plus the number of additional common shares that would have been outstanding if all dilutive potential common shares had been issued, using the treasury stock method. Shares of restricted stock are included in the diluted weighted average number of common shares outstanding from the date they are granted. Potential common shares are excluded from the computation when their effect is antidilutive. At December 31, 2017September 30, 2019 potentially dilutive securities include options to acquire 3,185,4353,297,335 shares of common stock, warrants to acquire 1,885,000 shares of common stock and warrants to acquire 1,985,000 sharesunvested restricted common stock of common stock.292,283. At December 31, 2016September 30, 2018 potentially dilutive securities include options to acquire 3,122,2773,271,835 shares of common stock, warrants to acquire 1,885,000 shares of common stock and warrants to acquire 1,985,000 sharesunvested restricted common stock of common stock.434,781. The dilutive effect of potentially dilutive securities is reflected in diluted net income per share if the exercise prices were lower than the average fair market value of common shares during the reporting period.
Basic and diluted net loss per common share is the same for the three and six months ended December 31, 2017September 30, 2019 and 20162018 because all stock options, warrants, and unvested restricted common stock are anti-dilutive.
Recently Issued Accounting Pronouncements
In May 2014,August 2018, the FASB issued Accounting Standards Update (ASU) No. 2014-09,Revenue from Contracts with Customers. ASU 2014-09 will eliminate transaction-2018-13, “Fair Value Measurement (Topic 820): Disclosure Framework – Changes to the Disclosure Requirements for Fair Value Measurement.” ASU 2018-13 amends certain disclosure requirements pertaining to fair value measurement, and industry-specific revenue recognition guidance under current U.S. GAAP and replace it with a principle based approach for determining revenue recognition. ASU 2014-09 will require that companies recognize revenue based on the value of transferred goods or services as they occur in the contract. The ASU also will require additional disclosure about the nature, amount, timing and uncertainty of revenue and cash flows arising from customer contracts, including significant judgments and changes in judgments and assets recognized from costs incurred to obtain or fulfill a contract. ASU 2014-09 is effective for interim and annual periodsfiscal years beginning after December 15, 2017. Early adoption is permitted only in annual reporting periods beginning after December 15, 2016, including2019, and interim periods therein. Entities can transition to the standard either retrospectively or as a cumulative-effect adjustment as of the date of adoption. Management is currently assessing the impact thewithin those fiscal years. The adoption of ASU 2014-092018-13 is not expected to have a material impact on the Company’s financial position, results of operations, and has not determined the effect of the standard on our ongoing financial reporting.cash flows.
Other recent accounting pronouncements issued by the FASB, including its Emerging Issues Task Force, the American Institute of Certified Public Accountants, and the Securities and Exchange Commission did not or are not believed by management to have a material impact on the Company's present or future consolidated financial statements.
Note 3. Line of Credit
The Company entered into a Loan and Security Agreement with Silicon Valley Bank (“SVB”) on July 23, 2010, which, as amended, provides for a revolving line of credit for the lesser of $2,500,000, or 80% of eligible accounts receivable. The line of credit matures on December 31, 2019, and is subject to certain financial and performance covenants with which we were in compliance as of December 31, 2017.September 30, 2019. Financial covenants include maintaining an adjusted quick ratio of unrestricted cash and net accounts receivable, divided by current liabilities plus debt less deferred revenue of at least 1.15 to 1.0, and maintaining tangible net worth of $1,500,000, plus 50% of net income for the fiscal quarter ended from and after December 31, 2017, plus 50% of the dollar value of equity issuances after October 1, 2017 and the principal amount of subordinated debt. The line of credit bears interest at the prime rate plus 2.25% for periods in which we maintain an adjusted quick ratio of 1.3 to 1.0 (the “Streamline Period”), and at the prime rate plus 5.25% when a Streamline Period is not in effect. The interest rate on the line of credit was 6.75% as of December 31, 2017.September 30, 2019. The line of credit is secured by the Company’s consolidated assets.
There were no outstanding borrowings under the line as of December 31, 2017September 30, 2019 and June 30, 2017,2019, respectively. As of December 31, 2017,September 30, 2019, there was approximately $2,490,000$2,153,000 of available credit.
Note 4. Lease Obligations
During the period ended March 31, 2017,On December 30, 2016, the Company entered into a 48 month non-cancellable lease for its office facilities that will require monthly payments ranging from $10,350 to $11,475 through January 2021. In accounting for the lease, the Company adopted ASU 2016-02, Leases which requires a lessee to record a right-of-use asset and a corresponding lease liability at the inception of the lease initially measured at the present value of the lease payments. The Company classified the lease as an operating lease and determined that the fair value of the lease assets and liability at the inception of the lease was $463,000 using a discount rate of 3.75%. During the sixthree months ended December 31, 2017,September 30, 2019, the Company made payments of $54,000$31,346 towards the lease liability. As of December 31, 2017September 30, 2019 and June 30, 2017,2019, lease liability amounted to $385,187$177,167 and $439,187,$208,513, respectively.
ASU 2016-02 requires recognition in the statement of operations of a single lease cost, calculated so that the cost of the lease is allocated over the lease term, generally on a straight-line basis. Rent expense, including real estate taxes, for the sixthree months ended December 31, 2017September 30, 2019 and 20162018 was $62,881$37,122 and $32,564,$36,212, respectively. The right of use asset at June 30, 2019 was $192,245. During the sixthree months ended December 31, 2017,September 30, 2019, the Company reflected amortization of right of use asset of $54,759$29,513 related to this lease.lease, resulting in a net asset balance of $162,732 as of September 30, 2019.
Note 5. Stockholders’ Equity
Stock Options
In December 2007, we established the 2007 Equity Compensation Plan (the “2007 Plan”) and in November 2017 we established the 2017 Omnibus Incentive Plan (the “2017 Plan”), collectively (the “Plans”). The Plans were approved by our board of directors and stockholders. The purpose of the Plans is to grant stock and options to purchase our common stock, and other incentive awards, to our employees, directors and key consultants. On November 10, 2016, the maximum number of shares of common stock that may be issued pursuant to awards granted under the 2007 Plan increased from 5,000,000 to 7,000,000. On November 21, 2017, the Company’s stockholders approved the adoption of the 2017 Plan (previously adopted by our board of directors on September 14, 2017), which authorized a maximum of 1,874,513 shares of common stock that may be issued pursuant to awards granted under the 2017 Plan. Upon adoption of the 2017 Plan we ceased granting incentive awards under the 2007 Plan and commenced granting incentive awards under the 2017 Plan. The shares of our common stock underlying cancelled and forfeited awards issued under the 2017 Plan may again become available for grant under the 2017 Plan. Cancelled and forfeited awards issued under the 2007 Plan that were cancelled or forfeited prior to November 21, 2017 became available for grant under the 2007 Plan. As of December 31, 2017,September 30, 2019, there were 1,592,130417,246 shares available for grant under the 2017 Plan, and no shares were available for grant under the 2007 Plan. All incentive stock award grants prior to the adoption of the 2017 Plan on November 21, 2017 were made under the 2007 Plan, and all incentive stock award grants after the adoption of the 2017 Plan on November 21, 2017 were made under the 2017 Plan.
The majority of awards issued under the PlansPlan vest immediately or over three years, with a one year cliff vesting period, and have a term of ten years. Stock-based compensation cost is measured at the grant date, based on the fair value of the awards that are ultimately expected to vest, and recognized on a straight-line basis over the requisite service period, which is generally the vesting period.
The following table summarizes vested and unvested stock option activity:
| All Options | Vested Options | Unvested Options | All Options | Vested Options | Unvested Options | |||||||||||||||||||||||||||||||||||||||||||
| Shares | Weighted Average Exercise Price | Shares | Weighted Average Exercise Price | Shares | Weighted Average Exercise Price | Shares | Weighted Average Exercise Price | Shares | Weighted Average Exercise Price | Shares | Weighted Average Exercise Price | |||||||||||||||||||||||||||||||||||||
| Outstanding at June 30, 2017 | 3,130,310 | 1.15 | 2,994,851 | 1.15 | 135,459 | 1.07 | ||||||||||||||||||||||||||||||||||||||||||
| Outstanding at June 30, 2019 | 3,287,335 | $ | 1.38 | 2,827,251 | $ | 1.27 | 460,084 | $ | 2.09 | |||||||||||||||||||||||||||||||||||||||
| Granted | 707,000 | 1.31 | 685,000 | 1.31 | 22,000 | 1.20 | 50,000 | 2.49 | - | - | 50,000 | 2.49 | ||||||||||||||||||||||||||||||||||||
| Options vesting | - | - | 48,250 | 1.06 | (48,250 | ) | 1.06 | - | - | 99,083 | 1.90 | (99,083 | ) | 1.90 | ||||||||||||||||||||||||||||||||||
| Exercised | (175,000 | ) | 1.10 | (175,000 | ) | 1.10 | - | - | (40,000 | ) | 1.02 | (40,000 | ) | 1.02 | - | - | ||||||||||||||||||||||||||||||||
| Forfeited/Cancelled | (476,875 | ) | 1.31 | (471,042 | ) | 1.32 | (5,833 | ) | 1.09 | - | - | - | - | - | - | |||||||||||||||||||||||||||||||||
| Outstanding at December 31, 2017 | 3,185,435 | $ | 1.16 | 3,082,059 | $ | 1.16 | 103,376 | $ | 1.07 | |||||||||||||||||||||||||||||||||||||||
| Outstanding at September 30, 2019 | 3,297,335 | $ | 1.41 | 2,886,334 | $ | 1.30 | 411,001 | $ | 2.18 | |||||||||||||||||||||||||||||||||||||||
The weighted average remaining contractual life of all options outstanding as of September 30, 2019 was 5.98 years. The remaining contractual life for options vested and exercisable at September 30, 2019 was 5.54 years. Furthermore, the aggregate intrinsic value of options outstanding as of September 30, 2019 was $3,447,191, and the aggregate intrinsic value of options vested and exercisable at September 30, 2019 was $3,333,292, in each case based on the fair value of the Company’s common stock on September 30, 2019.
During the three months ended September 30, 2019, the Company granted 50,000 options to employees with a fair value of $65,500. The total fair value of options that vested during the three months ended September 30, 2019 was $58,198 and is included in selling, general and administrative expenses in the accompanying statement of operations. As of September 30, 2019, the amount of unvested compensation related to stock options was $433,203 which will be recorded as an expense in future periods as the options vest. During the three months ended September 30, 2019, the Company issued 24,307 shares of common stock upon the exercise of 40,000 options on a cashless basis.
The following table presents the assumptions used to estimate the fair values based upon a Black-Scholes option pricing model of the stock options granted during the sixthree months ended December 31, 2017September 30, 2019 and 2016.2018.
| Six Months Ended December 31, | Three Months Ended September 30, | |||||||||||||||
| 2017 | 2016 | 2019 | 2018 | |||||||||||||
| Expected dividend yield | 0 | % | 0 | % | 0 | % | 0 | % | ||||||||
| Risk-free interest rate | 1.45% - 2.23 | % | 1.27% - 1.76 | % | 1.61 | % | 2.82 | % | ||||||||
| Expected life (in years) | 2.60 - 6.0 | 5 - 6 | 6 | 6 | ||||||||||||
| Expected volatility | 75% - 76 | % | 79.2% - 81.4 | % | 64 | % | 68 | % | ||||||||
The weighted average remaining contractual life of all options outstanding as of December 31, 2017 was 6.04 years. The remaining contractual life for options vested and exercisable at December 31, 2017 was 5.98 years. Furthermore, the aggregate intrinsic value of options outstanding as of December 31, 2017 was $434,042, and the aggregate intrinsic value of options vested and exercisable at December 31, 2017 was $421,343, in each case based on the fair value of the Company’s common stock on December 31, 2017.
During the six months ended December 31, 2017, the Company granted 707,000 options to employees with a fair value of $383,890. The total fair value of options that vested during the six months ended December 31, 2017 was $389,236 and is included in selling, general and administrative expenses in the accompanying statement of operations. During the six months ended December 31, 2017, the Company granted 13,235 shares of common stock upon the exercise of 175,000 options on a cashless basis. In addition, on September 30, 2017, options originally issued to an employee to purchase an aggregate of 17,600 shares of the Company’s common stock were modified to extend the exercise period from three months to approximately five years. Stock-based compensation cost of $6,233 was recorded during the six months ended December 31, 2017 as a result of the modification.
As of December 31, 2017, the amount of unvested compensation related to stock options was $68,175 which will be recorded as an expense in future periods as the options vest.
Additional information regarding stock options outstanding and exercisable as of December 31, 2017September 30, 2019 is as follows:
| Option Exercise Price | Option Exercise Price | Options Outstanding | Remaining Contractual Life (in years) | Options Exercisable | Option Exercise Price | Options Outstanding | Remaining Contractual Life (in years) | Options Exercisable | ||||||||||||||||||||
| $ | 0.59 | 8,150 | 4.50 | 8,150 | 0.59 | 8,150 | 2.75 | 8,150 | ||||||||||||||||||||
| 0.60 | 5,000 | 4.50 | 5,000 | 0.60 | 5,000 | 2.75 | 5,000 | |||||||||||||||||||||
| 0.65 | 6,150 | 4.50 | 6,150 | 0.65 | 6,150 | 2.75 | 6,150 | |||||||||||||||||||||
| 0.70 | 225,000 | 7.93 | 225,000 | 0.70 | 225,000 | 6.18 | 225,000 | |||||||||||||||||||||
| 0.77 | 59,500 | 5.76 | 59,500 | 0.77 | 59,500 | 4.01 | 59,500 | |||||||||||||||||||||
| 0.80 | 16,000 | 7.64 | 16,000 | 0.80 | 16,000 | 5.89 | 16,000 | |||||||||||||||||||||
| 0.90 | 25,667 | 6.31 | 25,667 | 0.90 | 25,667 | 4.56 | 25,667 | |||||||||||||||||||||
| 0.97 | 6,000 | 4.50 | 6,000 | 0.97 | 6,000 | 2.75 | 6,000 | |||||||||||||||||||||
| 1.00 | 300,249 | 2.60 | 300,247 | 1.00 | 28,249 | 4.18 | 28,249 | |||||||||||||||||||||
| 1.02 | 247,000 | 2.90 | 247,000 | 1.02 | 187,000 | 0.85 | 187,000 | |||||||||||||||||||||
| 1.05 | 457,529 | 8.63 | 415,530 | 1.05 | 422,529 | 6.86 | 422,529 | |||||||||||||||||||||
| 1.07 | 53,898 | 4.79 | 53,898 | 1.07 | 53,898 | 3.04 | 53,898 | |||||||||||||||||||||
| 1.09 | 156,165 | 7.95 | 116,790 | 1.09 | 151,165 | 6.19 | 151,165 | |||||||||||||||||||||
| 1.10 | 105,000 | 7.50 | 105,000 | 1.10 | 105,000 | 5.75 | 105,000 | |||||||||||||||||||||
| 1.14 | 3,674 | 4.50 | 3,674 | 1.14 | 3,674 | 2.75 | 3,674 | |||||||||||||||||||||
| 1.15 | 293,000 | 3.07 | 293,000 | 1.15 | 209,400 | 4.86 | 209,400 | |||||||||||||||||||||
| 1.20 | 353,414 | 9.57 | 331,414 | 1.20 | 352,414 | 7.83 | 345,080 | |||||||||||||||||||||
| 1.25 | 32,000 | 5.12 | 32,000 | 1.25 | 32,000 | 3.38 | 32,000 | |||||||||||||||||||||
| 1.30 | 263,000 | 4.18 | 263,000 | 1.30 | 243,000 | 2.43 | 243,000 | |||||||||||||||||||||
| 1.50 | 380,000 | 1.00 | 380,000 | 1.50 | 195,000 | 3.13 | 195,000 | |||||||||||||||||||||
| 1.75 | 1,067 | 4.50 | 1,067 | 1.59 | 35,000 | 8.62 | 17,500 | |||||||||||||||||||||
| 1.80 | 162,550 | 5.45 | 162,550 | 1.75 | 1,067 | 2.75 | 1,067 | |||||||||||||||||||||
| 1.85 | 24,000 | 5.09 | 24,000 | 1.80 | 134,050 | 3.64 | 134,050 | |||||||||||||||||||||
| 1.97 | 1,422 | 4.50 | 1,422 | 1.85 | 24,000 | 3.34 | 24,000 | |||||||||||||||||||||
| Total | 3,185,435 | 3,082,059 | 1.95 | 295,000 | 8.76 | 130,833 | ||||||||||||||||||||||
| 1.97 | 1,422 | 2.75 | 1,422 | |||||||||||||||||||||||||
| 2.40 | 402,000 | 9.13 | 250,000 | |||||||||||||||||||||||||
| 2.49 | 50,000 | 10.00 | - | |||||||||||||||||||||||||
| 2.50 | 20,000 | 9.64 | - | |||||||||||||||||||||||||
| Total | 3,297,335 | 2,886,334 | ||||||||||||||||||||||||||
Warrants
The following table summarizes warrant activity:
| Number of Warrants | Weighted Average Exercise Price | |||||||
| Outstanding, June 30, 2017 | 1,985,000 | 1.25 | ||||||
| Granted | - | - | ||||||
| Exercised | - | - | ||||||
| Expired/Cancelled | - | - | ||||||
| Outstanding, December 31, 2017 | 1,985,000 | $ | 1.25 | |||||
| Exercisable, June 30, 2017 | 1,985,000 | $ | 1.25 | |||||
| Exercisable, December 31, 2017 | 1,985,000 | $ | 1.25 | |||||
Number of Warrants | Weighted Average Exercise Price | |||||||
| Outstanding, June 30, 2019 | 1,885,000 | $ | 1.25 | |||||
| Granted | - | - | ||||||
| Exercised | - | - | ||||||
| Expired/Cancelled | - | - | ||||||
| Outstanding, September 30, 2019 | 1,885,000 | $ | 1.25 | |||||
| Exercisable, June 30, 2019 | 1,885,000 | $ | 1.25 | |||||
| Exercisable, September 30, 2019 | 1,885,000 | $ | 1.25 | |||||
There was noThe intrinsic value for all warrants outstanding as of December 31, 2017,September 30, 2019 was $2,265,500, based on the fair value of the Company’s common stock on December 31, 2017.September 30, 2019.
Additional information regarding warrants outstanding and exercisable as of December 31, 2017September 30, 2019 is as follows:
| Warrant Exercise Price | Warrant Exercise Price | Warrants Outstanding | Remaining Contractual Life (in years) | Warrants Exercisable | Warrant Exercise Price | Warrants Outstanding | Remaining Contractual Life (in years) | Warrants Exercisable | ||||||||||||||||||||
| $ | 1.19 | 100,000 | 3.98 | 100,000 | 1.19 | 50,000 | 2.23 | 50,000 | ||||||||||||||||||||
| 1.25 | 1,885,000 | 3.45 | 1,885,000 | 1.25 | 1,835,000 | 1.71 | 1,835,000 | |||||||||||||||||||||
| Total | 1,985,000 | 1,985,000 | Total | 1,885,000 | 1,885,000 | |||||||||||||||||||||||
Restricted Common Stock
Prior to July 1, 2017,2019, the Company issued 1,573,1972,166,549 shares of restricted common stock to employees valued at $1,563,074,$2,386,443, of which $1,150,136 had1,640,690 shares have vested, 214,324 shares with fair value of $188,203 have been forfeited, and $1,785,857 has been recognized as an expense. The balance of the non-vested restricted common stock was 311,535 at June 30, 2019.
During the sixthree months ended December 31, 2017,September 30, 2019, the Company issued an additional 338,30270,000 shares of restricted stock to employees. These shares vest over a three year period, with a one year cliff vesting period, and remain subject to forfeiture if vesting conditions are not met. The aggregate fair value of the stock awards was $354,366$192,500 based on the market price of our common stock ranging from $1.02 to $1.20price of $2.75 per share on the date of grant, which will be amortized over the three-year vesting period. Restricted common stock grants have been made under the 2007 and 2017 Equity Compensation Plans.
The total fair value of restricted common stock vesting during the sixnine months ended December 31, 2017September 30, 2019 was $205,339$84,473 and is included in selling, general and administrative expenses in the accompanying statements of operations. As of December 31, 2017,September 30, 2019, the amount of unvested compensation related to issuances of restricted common stock was $561,965,$520,410, which will be recognized as an expense in future periods as the shares vest. When calculating basic net income (loss) per share, these shares are included in weighted average common shares outstanding from the time they vest. When calculating diluted net income per share, these shares are included in weighted average common shares outstanding as of their grant date.
The following table summarizes restricted common stock activity:
| Number of Shares | Fair Value | Weighted Average Grant Date Fair Value | Number of Shares | Fair Value | Weighted Average Grant Date Fair Value | |||||||||||||||||||
| Non-vested, June 30, 2017 | 513,194 | 412,938 | 0.92 | |||||||||||||||||||||
| Non-vested, June 30, 2019 | 311,535 | $ | 412,383 | $ | 1.66 | |||||||||||||||||||
| Granted | 338,302 | 354,366 | 1.05 | 70,000 | 192,500 | 2.75 | ||||||||||||||||||
| Vested | (193,336 | ) | (205,339 | ) | 0.90 | (89,252 | ) | (84,473 | ) | 1.64 | ||||||||||||||
| Forfeited | - | - | - | - | - | - | ||||||||||||||||||
| Non-vested, December 31, 2017 | 658,160 | $ | 561,965 | $ | 0.99 | |||||||||||||||||||
| Non-vested, September 30, 2019 | 292,283 | $ | 520,410 | $ | 1.93 | |||||||||||||||||||
Common Stock Repurchase and Retirement
Effective as of November 13, 2018, the Compensation Committee of our Board of Directors authorized the repurchase, during calendar year 2019 on the last day of each trading window and otherwise in accordance with our insider trading policies, of up to $300,000 of outstanding common stock (at prices no greater than $3.00 per share) from our employees to satisfy their tax obligations in connection with the vesting of stock incentive awards. The actual number of shares repurchased will be determined by applicable employees in their discretion, and will depend on their evaluation of market conditions and other factors.
During the sixthree months ended December 31, 2017,September 30, 2019, the Company repurchased 87,10028,750 shares of our common stock from employees at an average market price of approximately $1.18$2.50 per share for an aggregate amount of $102,955.$71,875.
As of September 30, 2019, $141,380 remains available under the 2019 plan to repurchase common stock from its employees. The shares of common stock were surrendered by employees to cover tax withholding obligations with respect to the vesting of restricted stock. Shares repurchased are retired and deducted from common stock for par value and from additional paid in capital for the excess over par value.
Note 6. Gain from Sale of Discontinued Operations (Reprints and ePrints business line)
On June 30, 2017, we sold the intangible assets of our Reprints and ePrints business pursuant to an Asset Purchase Agreement dated June 20, 2017. The aggregate net consideration for the sale included earn-out payments of 45% of gross margin over the 30-month period subsequent to the closing date. We have made a policy election to record the contingent consideration when the consideration is determined to be realizable (each 6-month period ending subsequent to the closing date). ContingentRealizable contingent consideration determined to be realizable amounted to $136,502$26,191 for the sixthree months ended December 31, 2017September 30, 2019 and the corresponding receivable is included in prepaid expenses and other current assets andrecorded as a gain from the sale of discontinued operations.
Note 7. Subsequent Events
On October 8, 2019, the Company entered into an agreement to sublease its office facilities from November 1, 2019 through January 31, 2021, the end of the lease term, for $8,094 per month with one month of abated rent.
On October 24, 2019, the Company issued 8,701 net shares of common stock upon the exercise of stock options underlying 31,422 shares of common stock for 22,721 shares of common stock.
On November 5, 2019, the Company issued 37,829 shares of common stock upon the exercise of stock options underlying 60,00 shares of common stock on a cashless basis.
On November 12, 2019, the Company’s stockholders approved an increase in the maximum number of shares of common stock that may be issued pursuant to awards granted under the 2017 Omnibus Incentive Plan from 1,874,513 to 2,874,513.
Item 2. Management’s Discussion and Analysis of Financial Condition and Results of Operations
Cautionary Notice Regarding Forward-Looking Statements
The following discussion and analysis of our financial condition and results of operations for the three months ended September 30, 20172019 and 20162018 should be read in conjunction with our consolidated financial statements and related notes to those financial statements that are included elsewhere in this report. Our discussion includes forward-looking statements based upon current expectations that involve risks and uncertainties, such as our plans, objectives, expectations and intentions. Actual results and the timing of events could differ materially from those anticipated in these forward-looking statements as a result of a number of factors, including those set forth under “Risk Factors” in our Annual Report on Form 10-K for the fiscal year ended June 30, 2017.2019.
We use words such as “anticipate,” “estimate,” “plan,” “project,” “continuing,” “ongoing,” “expect,” “believe,” “intend,” “may,” “will,” “should,” “could,” and similar expressions to identify forward-looking statements. All forward-looking statements included in this report are based on information available to us on the date hereof and, except as required by law, we assume no obligation to update any such forward-looking statements.
Overview
Research Solutions was incorporated in the State of Nevada on November 2, 2006, and is a publicly traded holding company with two wholly owned subsidiaries:subsidiaries at June 30, 2019: Reprints Desk, Inc., a Delaware corporation and Reprints Desk Latin America S. de R.L. de C.V, an entity organized under the laws of Mexico.
We provide two service offerings to our customers: annual licenses that allow customers to access and utilize certain premium features of our cloud based software-as-a-service (“SaaS”) research intelligence platform (“Platforms”) and the transactional sale of published scientific, technical, and medical (“STM”) content managed, sourced and delivered through the Platform (“Transactions”). Platforms and Transactions are packaged as a single solution that enable life science and other research-intensiveresearch intensive organizations to speed up research and development activities with faster, single sourced access and management of content and data used throughout the intellectual property development lifecycle.
Platforms
Our cloud-based SaaS research intelligence platform consists of proprietary software and Internet-based interfaces.interfaces sold to customers for an annual subscription fee. Legacy functionality allows customers to initiate orders, route orders for the lowest cost acquisition, manage transactions, obtain spend and usage reporting, automate authentication, and connect seamlessly to in-house and third-party software systems. Customers can also enhance the information resources they already own or license and collaborate around bibliographic information.
Additional functionality has recently been added to our Platform in the form of interactive app-like gadgets. An alternative to manual data filtering, identification and extraction, gadgets are designed to gather, augment, and extract data across a variety of formats, including bibliographic citations, tables of contents, RSS feeds, PDF files, XML feeds, and web content. We are rapidly developing new gadgets in order to build an ecosystem of gadgets. Together, these gadgets will provide researchers with an “all in one” toolkit, delivering efficiencies in core research workflows and knowledge creation processes.
Our Platform is deployed as a single, multi-tenant system across our entire customer base. Customers securely access the Platform through online web interfaces and via web service APIs that enable customers to leverage Platform features and functionality from within in-house and third-party software systems. The Platform can also be configured to satisfy a customer’s individual preferences. We leverage our Platform’s efficiencies in scalability, stability and development costs to fuel rapid innovation and competitive advantage.
Transactions
Researchers and knowledge workers in life science and other research-intensive organizations generally require single copies of published STM journal articles for use in their research activities. These individuals are our primary users. Our Platform provides our customers with a single source to the universe of published STM content that includes over 70 million existing STM articles and over one million newly published STM articles each year. STM content is sold to our customers on a transaction basis. Researchers and knowledge workers in life science and other research-intensive organizations generally require single copies of published STM journal articles for use in their research activities. These individuals are our primary users.
Our Platform allows customers to find and download digital versions of STM articles that are critical to their research. Customers submit orders for the articles they need which we source and electronically deliver to them generally in under an hour. This service is generally known in the industry as single article delivery or document delivery. We also obtain the necessary permission licenses from the content publisher or other rights holder so that our customer’s use complies with applicable copyright laws. We have arrangements with hundreds of content publishers that allow us to distribute their content. The majority of these publishers provide us with electronic access to their content, which allows us to electronically deliver single articles to our customers often in a matter of minutes.
16
Critical Accounting Policies and Estimates
The preparation of our consolidated financial statements in conformity with accounting principles generally accepted in the United States, or GAAP, requires us to make estimates and assumptions that affect the reported amounts of assets, liabilities, revenue and expenses, and related disclosure of contingent assets and liabilities. When making these estimates and assumptions, we consider our historical experience, our knowledge of economic and market factors and various other factors that we believe to be reasonable under the circumstances. Actual results may differ under different estimates and assumptions.
The accounting estimates and assumptions discussed in this section are those that we consider to be the most critical to an understanding of our financial statements because they inherently involve significant judgments and uncertainties.
Revenue Recognition
Our policy
In May 2014, the Financial Accounting Standards Board (“FASB”) issued ASU 2014-09, Revenue from Contracts with Customers (Topic 606), ("ASC 606"). The underlying principle of ASC 606 is to recognize revenue to depict the transfer of goods or services to customers at the amount expected to be collected. We adopted the guidance of ASC 606 on July 1, 2018. The implementation of ASC 606 had no impact on the condensed consolidated financial statements and no cumulative effect adjustment was recognized.
Revenues are recognized when control of the promised goods or services have been performed, risk of loss and titleare transferred to a customer, in an amount that reflects the product transfersconsideration that we expect to the customer, the selling price is fixedreceive in exchange for those goods or determinable, and collectability is reasonably assured.services. We generate revenue by providingderive our revenues from two service offerings to our customers:sources: annual licenses that allow customers to access and utilize certain premium features of our cloud based SaaS research intelligence platform (Platforms)(“Platforms”) and the transactiontransactional sale of STM content managed, sourced and delivered through the Platform (Transactions)(“Transactions”).
| • | identify the contract with a customer; | |
| • | identify the performance obligations in the contract; | |
| • | determine the transaction price; | |
| • | allocate the transaction price to performance obligations in the contract; and | |
| • | recognize revenue as the performance obligation is satisfied. |
Platforms
We charge a subscription fee that allows customers to access and utilize certain premium features of our Platform. Revenue is recognized ratably over the term of the subscription agreement, which is typically one year, provided all other revenue recognition criteria have been met. Billings or payments received in advance of revenue recognition are recorded as deferred revenue.
Transactions
We charge a transactional service fee for the electronic delivery of single articles, and a corresponding copyright fee for the permitted use of the content. We recognize revenue from single article delivery services upon delivery to the customer only when the selling price is fixed or determinable, and collectability is reasonably assured.provided all other revenue recognition criteria have been met.
Stock-Based Compensation
We periodically issue stock options, warrants and restricted stock to employees and non-employees for services, in capital raising transactions, and for financing costs. We account for share-based payments under the guidance as set forth in the Share-Based Payment Topic 718 of the FASB Accounting Standards Codification, which requires the measurement and recognition of compensation expense for all share-based payment awards made to employees, officers, directors, and consultants, including employee stock options, based on estimated fair values. We estimate the fair value of stock option and warrant awards to employees and directors on the date of grant using an option-pricing model, and the value of the portion of the award that is ultimately expected to vest is recognized as expense over the required service period in our Statements of Operations. We estimate the fair value of restricted stock awards to employees and directors using the market price of our common stock on the date of grant, and the value of the portion of the award that is ultimately expected to vest is recognized as expense over the required service period in our Statements of Operations. We account for share-based payments to non-employees in accordance with Topic 505 of the FASB Accounting Standards Codification, whereby the value of the stock compensation is based upon the measurement date as determined at either a) the date at which a performance commitment is reached, or b) the date at which the necessary performance to earn the equity instruments is complete. Stock-based compensation is based on awards ultimately expected to vest and is reduced for estimated forfeitures. Forfeitures are estimated at the time of grant and revised, as necessary, in subsequent periods if actual forfeitures differ from those estimates.
Recent Accounting Pronouncements
Please refer to footnote 2 to the condensed consolidated financial statements contained elsewhere in this Form 10-Q for a discussion of Recent Accounting Pronouncements.
Quarterly Information (Unaudited)
The following table sets forth unaudited and quarterly financial data for the most recent eight quarters:
| Dec. 31, | Sept. 30, | June 30, | Mar. 31, | Dec. 31, | Sept. 30, | June 30, | Mar. 31, | |||||||||||||||||||||||||
| 2017 | 2017 | 2017 | 2017 | 2016 | 2016 | 2016 | 2016 | |||||||||||||||||||||||||
| Revenue: | ||||||||||||||||||||||||||||||||
| Platforms | $ | 413,404 | $ | 387,945 | $ | 318,194 | $ | 270,920 | $ | 219,137 | $ | 172,072 | $ | 129,963 | $ | 121,034 | ||||||||||||||||
| Transactions | 6,409,816 | 6,359,895 | 6,521,313 | 6,372,679 | 5,866,562 | 6,006,399 | 6,025,972 | 6,394,127 | ||||||||||||||||||||||||
| Total revenue | 6,823,220 | 6,747,840 | 6,839,507 | 6,643,599 | 6,085,699 | 6,178,471 | 6,155,935 | 6,515,161 | ||||||||||||||||||||||||
| Cost of revenue: | ||||||||||||||||||||||||||||||||
| Platforms | 90,362 | 83,987 | 71,097 | 58,367 | 45,623 | 29,964 | 23,426 | 21,557 | ||||||||||||||||||||||||
| Transactions | 4,996,988 | 4,914,414 | 5,060,500 | 4,997,842 | 4,664,690 | 4,714,999 | 4,702,892 | 4,918,679 | ||||||||||||||||||||||||
| Total cost of revenue | 5,087,350 | 4,998,401 | 5,131,597 | 5,056,209 | 4,710,313 | 4,744,963 | 4,726,318 | 4,940,236 | ||||||||||||||||||||||||
| Gross profit: | ||||||||||||||||||||||||||||||||
| Platforms | 323,042 | 303,958 | 247,097 | 212,553 | 173,514 | 142,108 | 106,537 | 99,477 | ||||||||||||||||||||||||
| Transactions | 1,412,828 | 1,445,481 | 1,460,813 | 1,374,837 | 1,201,872 | 1,291,400 | 1,323,080 | 1,475,448 | ||||||||||||||||||||||||
| Total gross profit | 1,735,870 | 1,749,439 | 1,707,910 | 1,587,390 | 1,375,386 | 1,433,508 | 1,429,617 | 1,574,925 | ||||||||||||||||||||||||
| Operating expenses: | ||||||||||||||||||||||||||||||||
| Sales and marketing | 769,406 | 899,695 | 988,962 | 963,784 | 854,724 | 580,778 | 520,402 | 525,681 | ||||||||||||||||||||||||
| General and administrative | 1,308,483 | 1,363,486 | 1,326,798 | 1,251,807 | 1,226,181 | 1,211,008 | 902,667 | 1,011,670 | ||||||||||||||||||||||||
| Depreciation and amortization | 46,330 | 40,568 | 36,893 | 33,906 | 32,426 | 30,469 | 29,702 | 30,310 | ||||||||||||||||||||||||
| Stock-based compensation expense | 314,565 | 286,242 | 112,151 | 112,326 | 303,097 | 102,589 | 162,192 | 130,568 | ||||||||||||||||||||||||
| Foreign currency transaction loss (gain) | (485 | ) | (12,387 | ) | (6,362 | ) | 6,272 | 17,631 | 3,324 | 994 | (2,829 | ) | ||||||||||||||||||||
| Total operating expenses | 2,438,299 | 2,577,604 | 2,458,442 | 2,368,095 | 2,434,059 | 1,928,168 | 1,615,957 | 1,695,400 | ||||||||||||||||||||||||
| Other income (expenses and income taxes) | (1,504 | ) | (1,949 | ) | (6,425 | ) | 1,599 | (6,913 | ) | (11,895 | ) | (22,034 | ) | (37,238 | ) | |||||||||||||||||
| Loss from continuing operations | (703,933 | ) | (830,114 | ) | (756,957 | ) | (779,106 | ) | (1,065,586 | ) | (506,555 | ) | (208,374 | ) | (157,713 | ) | ||||||||||||||||
| Income from discontinued operations | - | - | 113,314 | 141,616 | 222,626 | 95,889 | 155,385 | 190,089 | ||||||||||||||||||||||||
| Gain on sale of discontinued operations | 79,353 | 57,149 | 241,196 | - | - | - | - | - | ||||||||||||||||||||||||
| Net income (loss) | (624,580 | ) | (772,965 | ) | (402,447 | ) | (637,490 | ) | (842,960 | ) | (410,666 | ) | (52,989 | ) | 32,376 | |||||||||||||||||
| Dec. 31, | Sept. 30, | June 30, | Mar. 31, | Dec. 31, | Sept. 30, | June 30, | Mar. 31, | Sept. 30, | June 30, | Mar. 31, | Dec. 31, | Sept. 30, | June 30, | Mar. 31, | Dec. 31, | |||||||||||||||||||||||||||||||||||||||||||||||||
| 2017 | 2017 | 2017 | 2017 | 2016 | 2016 | 2016 | 2016 | 2019 | 2019 | 2019 | 2018 | 2018 | 2018 | 2018 | 2017 | |||||||||||||||||||||||||||||||||||||||||||||||||
| Net income (loss): | ||||||||||||||||||||||||||||||||||||||||||||||||||||||||||||||||
| Revenue: | ||||||||||||||||||||||||||||||||||||||||||||||||||||||||||||||||
| Platforms | $ | 856,445 | $ | 803,917 | $ | 748,726 | $ | 667,545 | $ | 589,013 | $ | 528,581 | $ | 489,219 | $ | 413,404 | ||||||||||||||||||||||||||||||||||||||||||||||||
| Transactions | 6,738,668 | 6,670,685 | 6,629,231 | 6,321,297 | 6,363,508 | 6,637,292 | 6,792,289 | 6,409,816 | ||||||||||||||||||||||||||||||||||||||||||||||||||||||||
| Total revenue | 7,595,113 | 7,474,602 | 7,377,957 | 6,988,842 | 6,952,521 | 7,165,873 | 7,281,508 | 6,823,220 | ||||||||||||||||||||||||||||||||||||||||||||||||||||||||
| Cost of revenue: | ||||||||||||||||||||||||||||||||||||||||||||||||||||||||||||||||
| Platforms | 150,470 | 142,368 | 134,672 | 122,077 | 108,259 | 101,370 | 103,185 | 90,362 | ||||||||||||||||||||||||||||||||||||||||||||||||||||||||
| Transactions | 5,128,108 | 5,104,629 | 5,063,624 | 4,878,526 | 4,896,307 | 5,118,851 | 5,259,959 | 4,996,988 | ||||||||||||||||||||||||||||||||||||||||||||||||||||||||
| Total cost of revenue | 5,278,578 | 5,246,997 | 5,198,296 | 5,000,603 | 5,004,566 | 5,220,221 | 5,363,144 | 5,087,350 | ||||||||||||||||||||||||||||||||||||||||||||||||||||||||
| Gross profit: | ||||||||||||||||||||||||||||||||||||||||||||||||||||||||||||||||
| Platforms | 705,975 | 661,549 | 614,054 | 545,468 | 480,754 | 427,211 | 386,034 | 323,042 | ||||||||||||||||||||||||||||||||||||||||||||||||||||||||
| Transactions | 1,610,560 | 1,566,056 | 1,565,607 | 1,442,771 | 1,467,201 | 1,518,441 | 1,532,330 | 1,412,828 | ||||||||||||||||||||||||||||||||||||||||||||||||||||||||
| Total gross profit | 2,316,535 | 2,227,605 | 2,179,661 | 1,988,239 | 1,947,955 | 1,945,652 | 1,918,364 | 1,735,870 | ||||||||||||||||||||||||||||||||||||||||||||||||||||||||
| Operating expenses: | ||||||||||||||||||||||||||||||||||||||||||||||||||||||||||||||||
| Sales and marketing | 550,349 | 659,108 | 542,641 | 445,879 | 431,417 | 455,250 | 522,894 | 524,587 | ||||||||||||||||||||||||||||||||||||||||||||||||||||||||
| Technology and product dev. | 499,191 | 549,198 | 537,685 | 553,272 | 499,795 | 454,053 | 436,672 | 454,507 | ||||||||||||||||||||||||||||||||||||||||||||||||||||||||
| General and administrative | 1,231,345 | 1,060,269 | 1,129,461 | 1,180,599 | 1,118,611 | 1,062,981 | 1,091,928 | 1,098,795 | ||||||||||||||||||||||||||||||||||||||||||||||||||||||||
| Depreciation and amortization | 7,558 | 8,351 | 9,617 | 9,733 | 11,115 | 32,731 | 32,768 | 46,330 | ||||||||||||||||||||||||||||||||||||||||||||||||||||||||
| Stock-based comp. expense | 142,672 | 126,903 | 131,072 | 453,288 | 115,909 | 75,089 | 114,340 | 314,565 | ||||||||||||||||||||||||||||||||||||||||||||||||||||||||
| Foreign currency transaction loss (gain) | 12,123 | 7,193 | 2,302 | 10,025 | 4,980 | 14,589 | (9,737 | ) | (485 | ) | ||||||||||||||||||||||||||||||||||||||||||||||||||||||
| Total operating expenses | 2,443,238 | 2,411,022 | 2,352,778 | 2,652,796 | 2,181,827 | 2,094,693 | 2,188,865 | 2,438,299 | ||||||||||||||||||||||||||||||||||||||||||||||||||||||||
| Other income (expenses and income taxes) | 19,055 | 27,289 | 22,393 | 16,322 | 14,264 | 12,615 | 5,238 | (1,504 | ) | |||||||||||||||||||||||||||||||||||||||||||||||||||||||
| Loss from continuing operations | $ | (703,933 | ) | $ | (830,114 | ) | $ | (756,957 | ) | $ | (779,106 | ) | $ | (1,065,586 | ) | $ | (506,555 | ) | $ | (208,374 | ) | $ | (157,713 | ) | (107,648 | ) | (156,128 | ) | (150,724 | ) | (648,235 | ) | (219,608 | ) | (136,426 | ) | (265,263 | ) | (703,933 | ) | ||||||||||||||||||||||||
| Income from discontinued operations | 79,353 | 57,149 | 354,510 | 141,616 | 222,626 | 95,889 | 155,385 | 190,089 | ||||||||||||||||||||||||||||||||||||||||||||||||||||||||
| Gain on sale of discontinued operations | 26,191 | 84,275 | 33,044 | 55,698 | 41,720 | 51,216 | 69,277 | 79,353 | ||||||||||||||||||||||||||||||||||||||||||||||||||||||||
| Net income (loss) | $ | (624,580 | ) | $ | (772,965 | ) | $ | (402,447 | ) | $ | (637,490 | ) | $ | (842,960 | ) | $ | (410,666 | ) | $ | (52,989 | ) | $ | 32,376 | (81,457 | ) | (71,853 | ) | (117,680 | ) | (592,537 | ) | (177,888 | ) | (85,210 | ) | (195,986 | ) | (624,580 | ) | |||||||||||||||||||||||||
| Basic income (loss) per common share: | ||||||||||||||||||||||||||||||||||||||||||||||||||||||||||||||||
| Loss per share from continuing operations | $ | (0.03 | ) | $ | (0.04 | ) | $ | (0.03 | ) | $ | (0.03 | ) | $ | (0.05 | ) | $ | (0.02 | ) | $ | (0.01 | ) | $ | - | $ | - | $ | - | $ | - | $ | (0.03 | ) | $ | (0.01 | ) | $ | (0.01 | ) | $ | (0.01 | ) | $ | (0.03 | ) | ||||||||||||||||||||
| Income per share from discontinued operations | $ | - | $ | - | $ | 0.01 | $ | - | $ | 0.01 | $ | - | $ | - | $ | - | $ | - | $ | - | $ | - | $ | - | $ | - | $ | - | $ | - | $ | - | ||||||||||||||||||||||||||||||||
| Net income (loss) per share | $ | (0.03 | ) | $ | (0.04 | ) | $ | (0.02 | ) | $ | (0.03 | ) | $ | (0.04 | ) | $ | (0.02 | ) | $ | (0.01 | ) | $ | - | $ | - | $ | - | $ | - | $ | (0.03 | ) | $ | (0.01 | ) | $ | (0.01 | ) | $ | (0.01 | ) | $ | (0.03 | ) | ||||||||||||||||||||
| Basic weighted average common shares outstanding | 23,455,654 | 23,380,437 | 23,369,727 | 23,265,939 | 23,200,975 | 23,131,570 | 18,154,762 | 17,707,900 | 24,095,266 | 23,987,137 | 23,845,798 | 23,787,836 | 23,644,787 | 23,560,781 | 23,498,796 | 23,455,654 | ||||||||||||||||||||||||||||||||||||||||||||||||
| Diluted income (loss) per common share: | ||||||||||||||||||||||||||||||||||||||||||||||||||||||||||||||||
| Loss per share from continuing operations | $ | (0.03 | ) | $ | (0.04 | ) | $ | (0.03 | ) | $ | (0.03 | ) | $ | (0.05 | ) | $ | (0.02 | ) | $ | (0.01 | ) | $ | - | $ | - | $ | - | $ | - | $ | (0.03 | ) | $ | (0.01 | ) | $ | (0.01 | ) | $ | (0.01 | ) | $ | (0.03 | ) | ||||||||||||||||||||
| Income per share from discontinued operations | $ | - | $ | - | $ | 0.01 | $ | - | $ | 0.01 | $ | - | $ | - | $ | - | $ | - | $ | - | $ | - | $ | - | $ | - | $ | - | $ | - | $ | - | ||||||||||||||||||||||||||||||||
| Net income (loss) per share | $ | (0.03 | ) | $ | (0.04 | ) | $ | (0.02 | ) | $ | (0.03 | ) | $ | (0.04 | ) | $ | (0.02 | ) | $ | (0.01 | ) | $ | - | $ | - | $ | - | $ | - | $ | (0.03 | ) | $ | (0.01 | ) | $ | (0.01 | ) | $ | (0.01 | ) | $ | (0.03 | ) | ||||||||||||||||||||
| Diluted weighted average common shares outstanding | 23,455,654 | 23,380,437 | 23,369,727 | 23,265,939 | 23,200,975 | 23,131,570 | 18,154,762 | 18,464,000 | 24,095,266 | 23,987,137 | 23,845,798 | 23,787,836 | 23,644,787 | 23,560,781 | 23,498,796 | 23,455,654 | ||||||||||||||||||||||||||||||||||||||||||||||||
Comparison of the Three and Six Months Ended December 31, 2017September 30, 2019 and 20162018
Results of Operations
| Three Months Ended December 31, | ||||||||||||||||
| 2017 | 2016 | 2017-2016 $ Change | 2017-2016 % Change | |||||||||||||
| Revenue: | ||||||||||||||||
| Platforms | $ | 413,404 | $ | 219,137 | $ | 194,267 | 88.7 | % | ||||||||
| Transactions | 6,409,816 | 5,866,562 | 543,254 | 9.3 | % | |||||||||||
| Total revenue | 6,823,220 | 6,085,699 | 737,521 | 12.1 | % | |||||||||||
| Cost of revenue: | ||||||||||||||||
| Platforms | 90,362 | 45,623 | 44,739 | 98.1 | % | |||||||||||
| Transactions | 4,996,988 | 4,664,690 | 332,298 | 7.1 | % | |||||||||||
| Total cost of revenue | 5,087,350 | 4,710,313 | 377,037 | 8.0 | % | |||||||||||
| Gross profit | 1,735,870 | 1,375,386 | 360,484 | 26.2 | % | |||||||||||
| Operating expenses: | ||||||||||||||||
| Sales and marketing | 769,406 | 854,724 | (85,318 | ) | (10.0 | )% | ||||||||||
| General and administrative | 1,308,483 | 1,226,181 | 82,302 | 6.7 | % | |||||||||||
| Depreciation and amortization | 46,330 | 32,426 | 13,904 | 42.9 | % | |||||||||||
| Stock-based compensation expense | 314,565 | 303,097 | 11,468 | 3.8 | % | |||||||||||
| Foreign currency transaction loss (gain) | (485 | ) | 17,631 | (18,116 | ) | (102.8 | )% | |||||||||
| Total operating expenses | 2,438,299 | 2,434,059 | 4,240 | 0.2 | % | |||||||||||
| Loss from operations | (702,429 | ) | (1,058,673 | ) | (356,244 | ) | (33.7 | )% | ||||||||
| Other income (expenses): | ||||||||||||||||
| Interest expense | (3,000 | ) | (3,000 | ) | - | - | % | |||||||||
| Other income | 11,312 | 5,424 | 5,888 | 108.6 | % | |||||||||||
| Total other income | 8,312 | 2,424 | 5,888 | 242.9 | % | |||||||||||
| Loss from operations before provision for income taxes | (694,117 | ) | (1,056,249 | ) | 362,132 | 34.3 | % | |||||||||
| Provision for income taxes | (9,816 | ) | (9,337 | ) | (479 | ) | (5.1 | )% | ||||||||
| Loss from continuing operations | (703,933 | ) | (1,065,586 | ) | 361,653 | 33.9 | % | |||||||||
| Discontinued operations: | ||||||||||||||||
| Income from discontinued operations | - | 222,626 | (222,626 | ) | (100.0 | )% | ||||||||||
| Gain from sale of discontinued operations | 79,353 | - | 79,353 | - | % | |||||||||||
| Income from discontinued operations | 79,353 | 222,626 | (143,273 | ) | (64.4 | )% | ||||||||||
| Net loss | $ | (624,580 | ) | $ | (842,960 | ) | $ | 218,380 | 25.9 | % | ||||||
| Six Months Ended December 31, | ||||||||||||||||||||||||||||||||
| 2017 | 2016 | 2017-2016 $ Change | 2017-2016 % Change | Three Months Ended September 30, | ||||||||||||||||||||||||||||
| 2019 | 2018 | 2019-2018 $ Change | 2019-2018 % Change | |||||||||||||||||||||||||||||
| Revenue: | ||||||||||||||||||||||||||||||||
| Platforms | $ | 801,349 | $ | 391,209 | $ | 410,140 | 104.8 | % | $ | 856,445 | $ | 589,013 | $ | 267,432 | 45.4 | % | ||||||||||||||||
| Transactions | 12,769,711 | 11,872,961 | 896,750 | 7.6 | % | 6,738,668 | 6,363,508 | 375,160 | 5.9 | % | ||||||||||||||||||||||
| Total revenue | 13,571,060 | 12,264,170 | 1,306,890 | 10.7 | % | 7,595,113 | 6,952,521 | 642,592 | 9.2 | % | ||||||||||||||||||||||
| Cost of revenue: | ||||||||||||||||||||||||||||||||
| Platforms | 174,349 | 75,587 | 98,762 | 130.7 | % | 150,470 | 108,259 | 42,211 | 39.0 | % | ||||||||||||||||||||||
| Transactions | 9,911,402 | 9,379,689 | 531,713 | 5.7 | % | 5,128,108 | 4,896,307 | 231,801 | 4.7 | % | ||||||||||||||||||||||
| Total cost of revenue | 10,085,751 | 9,455,276 | 630,475 | 6.7 | % | 5,278,578 | 5,004,566 | 274,012 | 5.5 | % | ||||||||||||||||||||||
| Gross profit | 3,485,309 | 2,808,894 | 676,415 | 24.1 | % | |||||||||||||||||||||||||||
| Gross profit: | ||||||||||||||||||||||||||||||||
| Platforms | 705,975 | 480,754 | 225,221 | 46.8 | % | |||||||||||||||||||||||||||
| Transactions | 1,610,560 | 1,467,201 | 143,359 | 9.8 | % | |||||||||||||||||||||||||||
| Total gross profit | 2,316,535 | 1,947,955 | 368,580 | 18.9 | % | |||||||||||||||||||||||||||
| Operating expenses: | ||||||||||||||||||||||||||||||||
| Sales and marketing | 1,669,101 | 1,435,502 | 233,599 | 16.3 | % | 550,349 | 431,417 | 118,932 | 27.6 | % | ||||||||||||||||||||||
| Technology and product development | 499,191 | 499,795 | (604 | ) | (0.1 | )% | ||||||||||||||||||||||||||
| General and administrative | 2,671,969 | 2,437,189 | 234,780 | 9.6 | % | 1,231,345 | 1,118,611 | 112,734 | 10.1 | % | ||||||||||||||||||||||
| Depreciation and amortization | 86,898 | 62,895 | 24,003 | 38.2 | % | 7,558 | 11,115 | (3,557 | ) | (32.0 | )% | |||||||||||||||||||||
| Stock-based compensation expense | 600,807 | 405,686 | 195,121 | 48.1 | % | 142,672 | 115,909 | 26,763 | 23.1 | % | ||||||||||||||||||||||
| Foreign currency transaction loss (gain) | (12,872 | ) | 20,955 | (33,827 | ) | (161.4 | )% | 12,123 | 4,980 | 7,143 | 143.4 | % | ||||||||||||||||||||
| Total operating expenses | 5,015,903 | 4,362,227 | 653,676 | 15.0 | % | 2,443,238 | 2,181,827 | 261,411 | 12.0 | % | ||||||||||||||||||||||
| Loss from operations | (1,530,594 | ) | (1,553,333 | ) | 22,739 | 1.5 | % | (126,703 | ) | (233,872 | ) | 107,169 | 45.8 | % | ||||||||||||||||||
| Other income (expenses): | ||||||||||||||||||||||||||||||||
| Interest expense | (6,000 | ) | (6,000 | ) | - | - | % | |||||||||||||||||||||||||
| Other income | 24,114 | 10,134 | 13,980 | 138.0 | % | 25,549 | 23,485 | 2,064 | 8.8 | % | ||||||||||||||||||||||
| Total other income | 18,114 | 4,134 | 13,980 | 338.2 | % | 25,549 | 23,485 | 2,064 | 8.8 | % | ||||||||||||||||||||||
| Loss from operations before provision for income taxes | (1,512,480 | ) | (1,549,199 | ) | 36,719 | 2.4 | % | (101,154 | ) | (210,387 | ) | 109,233 | 51.9 | % | ||||||||||||||||||
| Provision for income taxes | (21,567 | ) | (22,942 | ) | 1,375 | 6.0 | % | (6,494 | ) | (9,221 | ) | 2,727 | 29.6 | % | ||||||||||||||||||
| Loss from continuing operations | (1,534,047 | ) | (1,572,141 | ) | 38,094 | 2.4 | % | (107,648 | ) | (219,608 | ) | 111,960 | 51.0 | % | ||||||||||||||||||
| Discontinued operations: | ||||||||||||||||||||||||||||||||
| Income from discontinued operations | - | 318,515 | (318,515 | ) | (100.0 | )% | ||||||||||||||||||||||||||
| Gain from sale of discontinued operations | 136,502 | - | 136,502 | - | % | 26,191 | 41,720 | (15,529 | ) | (37.2 | )% | |||||||||||||||||||||
| Income from discontinued operations | 136,502 | 318,515 | (182,013 | ) | (57.1 | )% | ||||||||||||||||||||||||||
| Net loss | $ | (1,397,545 | ) | $ | (1,253,626 | ) | $ | (143,919 | ) | (11.5 | )% | $ | (81,457 | ) | $ | (177,888 | ) | $ | 96,431 | 54.2 | % | |||||||||||
Revenue
| Three Months Ended December 31, | Three Months Ended September 30, | |||||||||||||||||||||||||||||||
| 2017 | 2016 | 2017-2016 $ Change | 2017-2016 % Change | 2019 | 2018 | 2019-2018 $ Change | 2019-2018 % Change | |||||||||||||||||||||||||
| Revenue: | ||||||||||||||||||||||||||||||||
| Platforms | $ | 413,404 | $ | 219,137 | $ | 194,267 | 88.7 | % | $ | 856,445 | $ | 589,013 | $ | 267,432 | 45.4 | % | ||||||||||||||||
| Transactions | 6,409,816 | 5,866,562 | 543,254 | 9.3 | % | 6,738,668 | 6,363,508 | 375,160 | 5.9 | % | ||||||||||||||||||||||
| Total revenue | $ | 6,823,220 | $ | 6,085,699 | $ | 737,521 | 12.1 | % | $ | 7,595,113 | $ | 6,952,521 | $ | 642,592 | 9.2 | % | ||||||||||||||||
Total revenue increased $737,521,$642,592, or 12.1%1.3%, for the three months ended December 31, 2017September 30, 2019 compared to the prior year, due to the following:
| Category | Impact | Key Drivers | ||||
| Platforms |  | $ | 194,267 | Increased due to additional deployments to new and existing customers. Revenue is recognized ratably over the term of the subscription agreement, which is typically one year, provided all other revenue recognition criteria have been met. Billings or payments received in advance of revenue recognition are recorded as deferred revenue. | ||
| Transactions | | $ | 543,254 | Increased primarily due to orders from new customers. | ||
| Six Months Ended December 31, | ||||||||||||||||
| 2017 | 2016 | 2017-2016 $ Change | 2017-2016 % Change | |||||||||||||
| Revenue: | ||||||||||||||||
| Platforms | $ | 801,349 | $ | 391,209 | $ | 410,140 | 104.8 | % | ||||||||
| Transactions | 12,769,711 | 11,872,961 | 896,750 | 7.6 | % | |||||||||||
| Total revenue | $ | 13,571,060 | $ | 12,264,170 | $ | 1,306,890 | 10.7 | % | ||||||||
Total revenue increased $1,306,890, or 10.7%, for the six months ended December 31, 2017 compared to the prior year, due to the following:
| Category | Impact | Key Drivers | Impact | Key Drivers | ||||||||
| Platforms | | $ | 410,140 | Increased due to additional deployments to new and existing customers. Revenue is recognized ratably over the term of the subscription agreement, which is typically one year, provided all other revenue recognition criteria have been met. Billings or payments received in advance of revenue recognition are recorded as deferred revenue. | ↑ | $ | 267,432 | Increased due to additional deployments to new and existing customers, and expansion from existing customers. Revenue is recognized ratably over the term of the subscription agreement, which is typically one year, provided all other revenue recognition criteria have been met. Billings or payments received in advance of revenue recognition are recorded as deferred revenue. | ||||
| Transactions | | $ | 896,750 | Increased primarily due to orders from new customers. | ↑ | $ | 375,160 | Increased primarily due to orders from new customers. | ||||
Cost of Revenue
| Three Months Ended December 31, | Three Months Ended September 30, | |||||||||||||||||||||||||||||||
| 2017 | 2016 | 2017-2016 $ Change | 2017-2016 % Change | 2019 | 2018 | 2019-2018 $ Change | 2019-2018 % Change | |||||||||||||||||||||||||
| Cost of Revenue: | ||||||||||||||||||||||||||||||||
| Platforms | $ | 90,362 | $ | 45,623 | $ | 44,739 | 98.1 | % | $ | 150,470 | $ | 108,259 | $ | 42,211 | 39.0 | % | ||||||||||||||||
| Transactions | 4,996,988 | 4,664,690 | 332,298 | 7.1 | % | 5,128,108 | 4,896,307 | 231,801 | 4.7 | % | ||||||||||||||||||||||
| Total cost of revenue | $ | 5,087,350 | $ | 4,710,313 | $ | 377,037 | 8.0 | % | $ | 5,278,578 | $ | 5,004,566 | $ | 274,012 | 5.5 | % | ||||||||||||||||
| Three Months Ended December 31, | Three Months Ended September 30, | |||||||||||||||||||||||
| 2017 | 2016 | 2017-2016 Change * | 2019 | 2018 | 2019-2018 Change * | |||||||||||||||||||
| As a percentage of revenue: | ||||||||||||||||||||||||
| Platforms | 21.9 | % | 20.8 | % | 1.1 | % | 17.6 | % | 18.4 | % | (0.8 | )% | ||||||||||||
| Transactions | 78.0 | % | 79.5 | % | (1.5 | )% | 76.1 | % | 76.9 | % | (0.8 | )% | ||||||||||||
| Total | 74.6 | % | 77.4 | % | (2.8 | )% | 69.5 | % | 72.0 | % | (2.5 | )% | ||||||||||||
* The difference between current and prior period cost of revenue as a percentage of revenue
Total cost of revenue as a percentage of revenue decreased 2.8%2.5%, from 77.4%72% for the previous year to 74.6%69.5%, for the three months ended December 31, 2017.September 30, 2019.
| Category | Impact as percentage of revenue | Key Drivers | |||||
| Platforms | | 0.8 % | |||||
| Transactions |  | 0.8 % | Decreased primarily due to | ||||
| Six Months Ended December 31, | ||||||||||||||||
| 2017 | 2016 | 2017-2016 $ Change | 2017-2016 % Change | |||||||||||||
| Cost of Revenue: | ||||||||||||||||
| Platforms | $ | 174,349 | $ | 75,587 | $ | 98,762 | 130.7 | % | ||||||||
| Transactions | 9,911,402 | 9,379,689 | 531,713 | 5.7 | % | |||||||||||
| Total cost of revenue | $ | 10,085,751 | $ | 9,455,276 | $ | 630,475 | 6.7 | % | ||||||||
| Six Months Ended December 31, | ||||||||||||
| 2017 | 2016 | 2017-2016 Change * | ||||||||||
| As a percentage of revenue: | ||||||||||||
| Platforms | 21.8 | % | 19.3 | % | 2.5 | % | ||||||
| Transactions | 77.6 | % | 79.0 | % | (1.4 | )% | ||||||
| Total | 74.3 | % | 77.1 | % | (2.8 | )% | ||||||
* The difference between current and prior period cost of revenue as a percentage of revenue
Total cost of revenue as a percentage of revenue decreased 2.8%, from 77.1% for the previous year to 74.3%, for the six months ended December 31, 2017.
| |||||||
| |||||||
Gross Profit
| Three Months Ended December 31, | Three Months Ended September 30, | |||||||||||||||||||||||||||||||
| 2017 | 2016 | 2017-2016 $ Change | 2017-2016 % Change | 2019 | 2018 | 2019-2018 $ Change | 2019-2018 % Change | |||||||||||||||||||||||||
| Gross Profit: | ||||||||||||||||||||||||||||||||
| Platforms | $ | 323,042 | $ | 173,514 | $ | 149,528 | 86.2 | % | $ | 705,975 | $ | 480,754 | $ | 225,221 | 46.8 | % | ||||||||||||||||
| Transactions | 1,412,828 | 1,201,872 | 210,956 | 17.6 | % | 1,610,560 | 1,467,201 | 143,359 | 9.8 | % | ||||||||||||||||||||||
| Total gross profit | $ | 1,735,870 | $ | 1,375,386 | $ | 360,484 | 26.2 | % | $ | 2,316,535 | $ | 1,947,955 | $ | 368,580 | 18.9 | % | ||||||||||||||||
| Three Months Ended December 31, | Three Months Ended September 30, | |||||||||||||||||||||||
| 2017 | 2016 | 2017-2016 Change * | 2019 | 2018 | 2019-2018 Change * | |||||||||||||||||||
| As a percentage of revenue: | ||||||||||||||||||||||||
| Platforms | 78.1 | % | 79.2 | % | (1.1 | )% | 82.4 | % | 81.6 | % | 0.8 | % | ||||||||||||
| Transactions | 22.0 | % | 20.5 | % | 1.5 | % | 23.9 | % | 23.1 | % | 0.8 | % | ||||||||||||
| Total | 25.4 | % | 22.6 | % | 2.8 | % | 30.5 | % | 28.0 | % | 2.5 | % | ||||||||||||
* The difference between current and prior period gross profit as a percentage of revenue
| Six Months Ended December 31, | ||||||||||||||||
| 2017 | 2016 | 2017-2016 $ Change | 2017-2016 % Change | |||||||||||||
| Gross Profit: | ||||||||||||||||
| Platforms | $ | 627,000 | $ | 315,622 | $ | 311,378 | 98.7 | % | ||||||||
| Transactions | 2,858,309 | 2,493,272 | 365,037 | 14.6 | % | |||||||||||
| Total gross profit | $ | 3,485,309 | $ | 2,808,894 | $ | 676,415 | 24.1 | % | ||||||||
20
| Six Months Ended December 31, | ||||||||||||
| 2017 | 2016 | 2017-2016 Change * | ||||||||||
| As a percentage of revenue: | ||||||||||||
| Platforms | 78.2 | % | 80.7 | % | (2.5 | )% | ||||||
| Transactions | 22.4 | % | 21.0 | % | 1.4 | % | ||||||
| Total | 25.7 | % | 22.9 | % | 2.8 | % | ||||||
* The difference between current and prior period gross profit as a percentage of revenue
Operating Expenses
| Three Months Ended December 31, | Three Months Ended September 30, | |||||||||||||||||||||||||||||||
| 2017 | 2016 | 2017-2016 $ Change | 2017-2016 % Change | 2019 | 2018 | 2019-2018 $ Change | 2019-2018 % Change | |||||||||||||||||||||||||
| Operating Expenses: | ||||||||||||||||||||||||||||||||
| Sales and marketing | $ | 769,406 | $ | 854,724 | $ | (85,318 | ) | (10.0 | )% | $ | 550,349 | $ | 431,417 | $ | 118,932 | 27.6 | % | |||||||||||||||
| Technology and product development | 499,191 | 499,795 | (604 | ) | (0.1 | )% | ||||||||||||||||||||||||||
| General and administrative | 1,308,483 | 1,226,181 | 82,302 | 6.7 | % | 1,231,345 | 1,118,611 | 112,734 | 10.1 | % | ||||||||||||||||||||||
| Depreciation and amortization | 46,330 | 32,426 | 13,904 | 42.9 | % | 7,558 | 11,115 | (3,557 | ) | (32.0 | )% | |||||||||||||||||||||
| Stock-based compensation expense | 314,565 | 303,097 | 11,468 | 3.8 | % | 142,672 | 115,909 | 26,763 | 23.1 | % | ||||||||||||||||||||||
| Foreign currency transaction loss (gain) | (485 | ) | 17,631 | (18,116 | ) | (102.8 | )% | 12,123 | 4,980 | 7,143 | 143.4 | % | ||||||||||||||||||||
| Total operating expenses | $ | 2,438,299 | $ | 2,434,059 | $ | 4,240 | 0.2 | % | $ | 2,443,238 | $ | 2,181,827 | $ | 261,411 | 12.0 | % | ||||||||||||||||
| Category | Key Drivers | |||
| Sales and marketing | ↑ | $ | 118,932 | Increased primarily due to greater advertising media spend. |
| General and administrative | ↑ | $ | 112,734 | Increased primarily due to greater professional service fees. |
| Category | Impact | Key Drivers | ||||
| Sales and marketing | | $ | 85,318 | Decreased primarily due to lower sales commissions. | ||
| General and administrative | | $ | 82,302 | Increased primarily due to greater personnel and consulting cost. | ||
| Depreciation and amortization | | $ | 13,904 | Increased due to greater amortization of customer list. | ||
| Six Months Ended December 31, | ||||||||||||||||
| 2017 | 2016 | 2017-2016 $ Change | 2017-2016 % Change | |||||||||||||
| Operating Expenses: | ||||||||||||||||
| Sales and marketing | $ | 1,669,101 | $ | 1,435,502 | $ | 233,599 | 16.3 | % | ||||||||
| General and administrative | 2,671,969 | 2,437,189 | 234,780 | 9.6 | % | |||||||||||
| Depreciation and amortization | 86,898 | 62,895 | 24,003 | 38.2 | % | |||||||||||
| Stock-based compensation expense | 600,807 | 405,686 | 195,121 | 48.1 | % | |||||||||||
| Foreign currency transaction loss (gain) | (12,872 | ) | 20,955 | (33,827 | ) | (161.4 | )% | |||||||||
| Total operating expenses | $ | 5,015,903 | $ | 4,362,227 | $ | 653,676 | 15.0 | % | ||||||||
| Category | Impact | Key Drivers | ||||
| Sales and marketing | | $ | 233,599 | Increased primarily due to greater personnel and consulting cost. | ||
| General and administrative | | $ | 234,780 | Increased primarily due to greater personnel and consulting cost. | ||
| Depreciation and amortization | | $ | 24,003 | Increased due to greater amortization of customer list. | ||
Net Income (Loss)
| Three Months Ended December 31, | Three Months Ended September 30, | |||||||||||||||||||||||||||||||
| 2017 | 2016 | 2017-2016 $ Change | 2017-2016 % Change | 2019 | 2018 | 2019-2018 $ Change | 2019-2018 % Change | |||||||||||||||||||||||||
| Net Income (Loss): | ||||||||||||||||||||||||||||||||
| Loss from continuing operations | $ | (703,933 | ) | $ | (1,065,586 | ) | $ | 361,653 | 33.9 | % | $ | (107,648 | ) | $ | (219,608 | ) | $ | 111,960 | 51.0 | % | ||||||||||||
| Income from discontinued operations | 79,353 | 222,626 | (143,273 | ) | (64.4 | )% | 26,191 | 41,720 | (15,529 | ) | (37.2 | )% | ||||||||||||||||||||
| Total net loss | $ | (624,580 | ) | $ | (842,960 | ) | $ | 218,380 | 25.9 | % | $ | (81,457 | ) | $ | (177,888 | ) | $ | 96,431 | 54.2 | % | ||||||||||||
Loss from continuing operations decreased $361,653$111,960 or 33.9%51%, for the three months ended December 31, 2017 compared to the prior year, primarily due to increased gross profit, partially offset by increased operating expenses as described above.
| Six Months Ended December 31, | ||||||||||||||||
| 2017 | 2016 | 2017-2016 $ Change | 2017-2016 % Change | |||||||||||||
| Net Income (Loss): | ||||||||||||||||
| Loss from continuing operations | $ | (1,534,047 | ) | $ | (1,572,141 | ) | $ | 38,094 | 2.4 | % | ||||||
| Income from discontinued operations | 136,502 | 318,515 | (182,013 | ) | (57.1 | )% | ||||||||||
| Total net loss | $ | (1,397,545 | ) | $ | (1,253,626 | ) | $ | (143,919 | ) | (11.5 | )% | |||||
Loss from continuing operations decreased $38,094 or 2.4%, for the six months ended December 31, 2017September 30, 2019 compared to the prior year, primarily due to increased gross profit, partially offset by increased operating expenses as described above.
Liquidity and Capital Resources
| Six Months Ended December 31, | ||||||||
| Consolidated Statements of Cash Flow Data: | 2017 | 2016 | ||||||
| Net cash provided by (used in) operating activities | $ | (690,161 | ) | $ | 776,562 | |||
| Net cash used in investing activities | (43,536 | ) | (25,842 | ) | ||||
| Net cash used in financing activities | (102,955 | ) | (82,354 | ) | ||||
| Effect of exchange rate changes | (12,678 | ) | 3,386 | |||||
| Net increase in cash and cash equivalents | (849,330 | ) | 671,752 | |||||
| Cash and cash equivalents, beginning of period | 5,773,950 | 6,076,875 | ||||||
| Cash and cash equivalents, end of period | $ | 4,924,620 | $ | 6,748,627 | ||||
| Three Months Ended September 30, | ||||||||
| Consolidated Statements of Cash Flow Data: | 2019 | 2018 | ||||||
| Net cash provided by (used in) operating activities | $ | 309,732 | $ | (300,123 | ) | |||
| Net cash used in financing activities | (71,875 | ) | (75,200 | ) | ||||
| Effect of exchange rate changes | (3,114 | ) | (5,830 | ) | ||||
| Net increase (decrease) in cash and cash equivalents | 234,743 | (381,153 | ) | |||||
| Cash and cash equivalents, beginning of period | 5,353,090 | 4,908,180 | ||||||
| Cash and cash equivalents, end of period | $ | 5,587,833 | $ | 4,527,027 | ||||
Liquidity
Since our inception, we have funded our operations primarily through private sales of equity securities and the exercise of warrants, which have provided aggregate net cash proceeds to date of approximately $15,972,000. As of December 31, 2017,September 30, 2019, we had working capital of $3,240,308$2,857,083 and stockholders’ equity of $3,429,265.$3,017,487. For the sixthree months ended December 31, 2017,September 30, 2019, we recorded a net loss of $1,397,545,$81,457, and cash used inprovided by operating activities was $690,161.$309,732. We may incur losses for an indeterminate period and may never sustain profitability. We may be unable to achieve and maintain profitability on a quarterly or annual basis. An extended period of losses and negative cash flow may prevent us from successfully operating and expanding our business.
As of December 31, 2017,September 30, 2019, we had cash and cash equivalents of $4,924,620,$5,587,833, compared to $5,773,950$5,353,090 as of December 31, 2016, a decreaseJune 30, 2019, an increase of $849,330.$234,743. This decreaseincrease was primarily due to cash used inprovided by operating activities.
Operating Activities
Net cash provided by operating activities was $309,732 for the three months ended September 30, 2019 and resulted primarily from a decrease in accounts receivable of $116,362 and an increase in deferred revenue of $108,589, partially offset by an increase in prepaid royalties of $69,699.
Net cash used in operating activities was $690,161$300,123 for the sixthree months ended December 31, 2017September 30, 2018 and resulted primarily from a net loss of $1,397,545 and a decrease in accounts payable and accrued expenses of $1,389,286,$320,404 and an increase in prepaid royalties of $162,067, partially offset by a decrease in accounts receivable of $1,726,200.
Net cash provided by operating activities was $776,562 for the six months ended December 31, 2016 and resulted primarily from an increase in accounts payable of $1,449,375 and a decrease in accounts receivable of $696,302, partially offset by a net loss of $1,253,626 and an increase in prepaid royalties of $1,044,250.$200,015.
Investing Activities
NetNo cash was used in or provided by investing activities was $43,536 for the sixthree months ended December 31, 2017September 30, 2019 and resulted from the purchase of intangible assets and property and equipment.
Net cash used in investing activities was $25,842 for the six months ended December 31, 2016 and resulted from the purchase of intangible assets and property and equipment.2018.
Financing Activities
Net cash used in financing activities was $102,955$71,875 for the sixthree months ended December 31, 2017September 30, 2019 and resulted from the repurchase of common stock.
Net cash used in financing activities was $82,354$75,200 for the sixthree months ended December 31, 2016September 30, 2018 and resulted from the repurchase of common stock.
We entered into a Loan and Security Agreement with Silicon Valley Bank (“SVB”) on July 23, 2010, which, as amended, provides for a revolving line of credit for the lesser of $2,500,000, or 80% of eligible accounts receivable. The line of credit matures on December 31, 2019, and is subject to certain financial and performance covenants with which we were in compliance as of December 31, 2017.September 30, 2019. Financial covenants include maintaining an adjusted quick ratio of unrestricted cash and net accounts receivable, divided by current liabilities plus debt less deferred revenue of at least 1.15 to 1.0, and maintaining tangible net worth of $1,500,000, plus 50% of net income for the fiscal quarter ended from and after December 31, 2017, plus 50% of the dollar value of equity issuances after October 1, 2017 and the principal amount of subordinated debt. The line of credit bears interest at the prime rate plus 2.25% for periods in which we maintain an adjusted quick ratio of 1.3 to 1.0 (the “Streamline Period”), and at the prime rate plus 5.25% when a Streamline Period is not in effect. The interest rate on the line of credit was 6.75% as of December 31, 2017.September 30, 2019. The line of credit was secured by our consolidated assets.
There were no outstanding borrowings under the line as of December 31, 2017September 30, 2019 and June 30, 2017,2019, respectively. As of December 31, 2017,September 30, 2019, there was approximately $2,490,000$2,153,000 of available credit.
Non-GAAP Measure – Adjusted EBITDA
In addition to our GAAP results, we present Adjusted EBITDA as a supplemental measure of our performance. However, Adjusted EBITDA is not a recognized measurement under GAAP and should not be considered as an alternative to net income, income from operations or any other performance measure derived in accordance with GAAP or as an alternative to cash flow from operating activities as a measure of liquidity. We define Adjusted EBITDA as net income (loss), plus interest expense, other income (expense), foreign currency transaction loss, provision for income taxes, depreciation and amortization, stock-based compensation, income from discontinued operations and gain on sale of discontinued operations. Management considers our core operating performance to be that which our managers can affect in any particular period through their management of the resources that affect our underlying revenue and profit generating operations that period. Non-GAAP adjustments to our results prepared in accordance with GAAP are itemized below. You are encouraged to evaluate these adjustments and the reasons we consider them appropriate for supplemental analysis. In evaluating Adjusted EBITDA, you should be aware that in the future we may incur expenses that are the same as or similar to some of the adjustments in this presentation. Our presentation of Adjusted EBITDA should not be construed as an inference that our future results will be unaffected by unusual or non-recurring items.
Set forth below is a reconciliation of Adjusted EBITDA to net income (loss) for the three and six months ended December 31, 2017September 30, 2019 and 2016:2018:
| Three Months Ended December 31, | Three Months Ended September 30, | |||||||||||||||||||||||
| 2017 | 2016 | 2017-2016 $ Change | 2019 | 2018 | 2019-2018 $ Change | |||||||||||||||||||
| Net loss | $ | (624,580 | ) | $ | (842,960 | ) | $ | 218,380 | $ | (81,457 | ) | $ | (177,888 | ) | $ | 96,431 | ||||||||
| Add (deduct): | ||||||||||||||||||||||||
| Interest expense | 3,000 | 3,000 | - | |||||||||||||||||||||
| Other (income) expense | (11,312 | ) | (5,424 | ) | (5,888 | ) | (25,549 | ) | (23,485 | ) | (2,064 | ) | ||||||||||||
| Foreign currency transaction loss (gain) | (485 | ) | 17,631 | (18,116 | ) | 12,123 | 4,980 | 7,143 | ||||||||||||||||
| Provision for income taxes | 9,816 | 9,337 | 479 | 6,494 | 9,221 | (2,727 | ) | |||||||||||||||||
| Depreciation and amortization | 46,330 | 32,426 | 13,904 | 7,558 | 11,115 | (3,557 | ) | |||||||||||||||||
| Stock-based compensation | 314,565 | 303,097 | 11,468 | 142,672 | 115,909 | 26,763 | ||||||||||||||||||
| Income from discontinued operations | - | (222,626 | ) | 222,626 | ||||||||||||||||||||
| Gain on sale of discontinued operations | (79,353 | ) | - | (79,353 | ) | (26,191 | ) | (41,720 | ) | 15,529 | ||||||||||||||
| Adjusted EBITDA | $ | (342,019 | ) | $ | (705,519 | ) | $ | 363,500 | $ | 35,650 | $ | (101,868 | ) | $ | 137,518 | |||||||||
| Six Months Ended December 31, | ||||||||||||
| 2017 | 2016 | 2017-2016 $ Change | ||||||||||
| Net loss | $ | (1,397,545 | ) | $ | (1,253,626 | ) | $ | (143,919 | ) | |||
| Add (deduct): | ||||||||||||
| Interest expense | 6,000 | 6,000 | - | |||||||||
| Other (income) expense | (24,114 | ) | (10,134 | ) | (13,980 | ) | ||||||
| Foreign currency transaction loss (gain) | (12,872 | ) | 20,955 | (33,827 | ) | |||||||
| Provision for income taxes | 21,567 | 22,942 | (1,375 | ) | ||||||||
| Depreciation and amortization | 86,898 | 62,895 | 24,003 | |||||||||
| Stock-based compensation | 600,807 | 405,686 | 195,121 | |||||||||
| Income from discontinued operations | - | (318,515 | ) | 318,515 | ||||||||
| Gain on sale of discontinued operations | (136,502 | ) | - | (136,502 | ) | |||||||
| Adjusted EBITDA | $ | (855,761 | ) | $ | (1,063,797 | ) | $ | 208,036 | ||||
We present Adjusted EBITDA because we believe it assists investors and analysts in comparing our performance across reporting periods on a consistent basis by excluding items that we do not believe are indicative of our core operating performance. In addition, we use Adjusted EBITDA in developing our internal budgets, forecasts and strategic plan; in analyzing the effectiveness of our business strategies in evaluating potential acquisitions; and in making compensation decisions and in communications with our board of directors concerning our financial performance. Adjusted EBITDA has limitations as an analytical tool, which includes, among others, the following:
| · | Adjusted EBITDA does not reflect our cash expenditures, or future requirements, for capital expenditures or contractual commitments; |
| · | Adjusted EBITDA does not reflect changes in, or cash requirements for, our working capital needs; |
| · | Adjusted EBITDA does not reflect interest expense, or the cash requirements necessary to service interest or principal payments, on our debts; and |
| · | although depreciation and amortization are non-cash charges, the assets being depreciated and amortized will often have to be replaced in the future, and Adjusted EBITDA does not reflect any cash requirements for such replacements. |
Off-Balance Sheet Arrangements
We do not have any off-balance sheet arrangements.
Item 3. Quantitative and Qualitative Disclosures About Market Risk
Not required.
Item 4. Controls and Procedures
Evaluation of Disclosure Controls and Procedures
Our management, with the participation of our Chief Executive Officer and Chief Financial Officer, evaluated the effectiveness of our disclosure controls and procedures as of the end of the period covered by this Quarterly Report on Form 10-Q. For purposes of this section, the termdisclosure controls and procedures means controls and other procedures of an issuer that are designed to ensure that information required to be disclosed by the issuer in the reports that it files or submits under the Securities Exchange Act of 1934, as amended (the “Exchange Act”), is recorded, processed, summarized and reported within the time periods specified in the SEC’s rules and forms. Disclosure controls and procedures include, without limitation, controls and procedures designed to ensure that information required to be disclosed by an issuer in the reports that it files or submits under the Exchange Act is accumulated and communicated to the issuer's management, including its principal executive and principal financial officers, or persons performing similar functions, as appropriate to allow timely decisions regarding required disclosure.
Based upon that evaluation, our Chief Executive Officer and Chief Financial Officer have concluded that, as of December 31, 2017,September 30, 2019, the end of the period covered by this report, our disclosure controls and procedures were effective at a reasonable assurance level.
Inherent Limitations on the Effectiveness of Controls
Management does not expect that our disclosure controls and procedures or our internal control over financial reporting will prevent or detect all errors and all fraud. A control system, no matter how well conceived and operated, can provide only reasonable, not absolute, assurance that the objectives of the control systems are met. Further, the design of a control system must reflect the fact that there are resource constraints, and the benefits of controls must be considered relative to their costs. Because of the inherent limitations in a cost-effective control system, no evaluation of internal control over financial reporting can provide absolute assurance that misstatements due to error or fraud will not occur or that all control issues and instances of fraud, if any, have been or will be detected.
These inherent limitations include the realities that judgments in decision-making can be faulty and that breakdowns can occur because of a simple error or mistake. Controls can also be circumvented by the individual acts of some persons, by collusion of two or more people, or by management override of the controls. The design of any system of controls is based in part on certain assumptions about the likelihood of future events, and there can be no assurance that any design will succeed in achieving its stated goals under all potential future conditions. Projections of any evaluation of controls effectiveness to future periods are subject to risks. Over time, controls may become inadequate because of changes in conditions or deterioration in the degree of compliance with policies or procedures.
Changes in Internal Control Over Financial Reporting
In addition, our management with the participation of our principal executive officer and principal financial officer have determined that no change in our internal control over financial reporting (as that term is defined in Rules 13(a)-15(f) and 15(d)-15(f) of the Exchange Act) occurred during the quarter ended December 31, 2017September 30, 2019 that has materially affected, or is reasonably likely to materially affect, our internal control over financial reporting.
Item 2. Unregistered Sales of Equity Securities and Use of Proceeds
On February 16, 2017,Effective as of November 13, 2018, the Compensation Committee of our Board of Directors authorized the repurchase, over a 12-month periodduring calendar year 2019 on the last day of each trading window and otherwise in accordance with our insider trading policies, of up to $300,000 of outstanding common stock (at prices no greater than $2.00$3.00 per share) from our employees to satisfy their tax obligations in connection with the vesting of stock incentive awards. The actual number of shares repurchased will be determined by applicable employees in their discretion, and will depend on their evaluation of market conditions and other factors.
During the three months ended December 31, 2017,September 30, 2019, we repurchased 52,30028,750 shares of our common stock under the repurchase planfrom employees at an average market price of approximately $1.21$2.50 per share for an aggregate amount of $63,283. $71,875.
As of December 31, 2017, $80,070September 30, 2019, $141,380 remains available under the current authorization2019 plan to repurchase our outstanding common stock from our employees.
The shares of common stock were surrendered by employees to cover tax withholding obligations with respect to the vesting of restricted stock. Shares repurchased are retired and deducted from common stock for par value and from additional paid in capital for the excess over par value. Direct costs incurred to acquire the shares are included in the total cost of the shares.
The following table summarizes repurchases of our common stock on a monthly basis:
| Period | Total Number of Shares Purchased1 | Average Price Paid per Share | Total Number of Shares Purchased as Part of Publicly Announced Plans or Programs | Approximate Dollar Value of Shares that May Yet Be Purchased Under the Plans or Programs | ||||||||||||
| October 1 - October 31, 2017 | - | - | - | $ | 143,353 | |||||||||||
| November 1 - November 30, 2017 | - | - | - | $ | 143,353 | |||||||||||
| December 1 - December 31, 2017 | 52,300 | $ | 1.21 | - | $ | 80,070 | ||||||||||
| Total | 52,300 | $ | 1.21 | - | - | |||||||||||
| Period | Total Number of Shares Purchased1 | Average Price Paid per Share | Total Number of Shares Purchased as Part of Publicly Announced Plans or Programs | Approximate Dollar Value of Shares that May Yet Be Purchased Under the Plans or Programs | ||||||||||||
| July 2019 | - | - | - | $ | 213,255 | |||||||||||
| August 2019 | - | - | - | $ | 213,255 | |||||||||||
| September 2019 | 28,750 | $ | 2.50 | - | $ | 141,380 | ||||||||||
| Total | 28,750 | $ | 2.50 | - | - | |||||||||||
1 Consists of shares of common stock purchased from an employee to satisfy tax obligations in connection with the vesting of stock incentive awards.
See “Exhibit Index” on the page immediately following the signature page hereto for a list of exhibits filed as part of this report, which is incorporated herein by reference.
Pursuant to the requirements of the Securities Exchange Act of 1934, the registrant has duly caused this report to be signed on its behalf by the undersigned thereunto duly authorized.
| RESEARCH SOLUTIONS, INC. | ||
| By: | /s/ Peter Victor Derycz | |
| Peter Victor Derycz | ||
| Date: | Chief Executive Officer (Principal Executive Officer) | |
| By: | /s/ Alan Louis Urban | |
| Alan Louis Urban | ||
| Date: | Chief Financial Officer (Principal Financial and Accounting Officer) | |
EXHIBIT INDEX
Exhibit Number | Description | |||
| 10.1 | ||||
| 31.1 | Rule 13a-14(a)/15d-14(a) Certification of Chief Executive Officer | |||
| 31.2 | Rule 13a-14(a)/15d-14(a) Certification of Chief Financial Officer | |||
| 32.1 | Section 1350 Certification of Chief Executive Officer * | |||
| 32.2 | Section 1350 Certification of Chief Financial Officer * | |||
| 101.INS | XBRL Instance Document | |||
| 101.SCH | XBRL Taxonomy Extension Schema | |||
| 101.CAL | XBRL Taxonomy Extension Calculation Linkbase | |||
| 101.DEF | XBRL Taxonomy Extension Definition Linkbase | |||
| 101.LAB | XBRL Taxonomy Extension Label Linkbase | |||
| 101.PRE | XBRL Taxonomy Extension Presentation Linkbase | |||
| * | Furnished herewith | |||
| ++ | Indicates management contract or compensatory plan | |||