UNITED STATES
SECURITIES AND EXCHANGE COMMISSION
Washington, DC 20549
FORM 10-Q
(Mark One)(Mark one)
QUARTERLY REPORT PURSUANT TO SECTION 13 OR 15(d) OF THE SECURITIES EXCHANGE ACT OF 1934 |
For the quarterly period ended September 30, 2018
or
| For the quarterly period ended September 30, 2019 | |
| or | |
| [ ] | TRANSITION REPORT PURSUANT TO SECTION 13 OR 15(d) OF THE SECURITIES EXCHANGE ACT OF 1934 |
For the transition period from to
Commission file number001-15771
ABEONA THERAPEUTICS INC.
(Exact name of registrant as specified in its charter)
| Delaware | 83-0221517 | |
| (State or other jurisdiction of | (I.R.S. Employer I.D. No.) | |
| incorporation or organization) |
1330 Avenue of the Americas, 33rd Floor, New York, NY 10019
(Address of principal executive offices, zip code)
(646) 813-4712813-4701
(Registrant’s telephone number, including area code)
N/ASecurities registered pursuant to Section 12(b) of the Securities Exchange Act of 1934:
(Former name, former address and former fiscal year, if changed since last report)
| Title of each class | Trading Symbol(s) | Name of each exchange on which registered | ||
| Common Stock, $0.01 par value | ABEO | Nasdaq Capital Markets |
Indicate by check mark whether the registrant: (1) has filed all reports required to be filed by Section 13 or 15(d) of the Securities Exchange Act of 1934 during the preceding 12 months (or for such shorter period that the registrant was required to file such reports), and (2) has been subject to such filing requirements for the past 90 days.
Yes þ[X] Noo [ ]
Indicate by check mark whether the registrant has submitted electronically every Interactive Data File required to be submitted pursuant to Rule 405 of Regulation S-T (§232.405 of this chapter) during the preceding 12 months (or for such shorter period that the registrant was required to submit such files). Yes þ[X] No o[ ]
Indicate by check mark whether the registrant is a large accelerated filer, an accelerated filer, a non-accelerated filer, or a smaller reporting company, or an emerging growth company. See the definitions of “large accelerated filer”filer,” “accelerated filer”filer,” “smaller reporting company,” and “smaller reporting“emerging growth company” in Rule 12b-2 of the Exchange Act.
| Large accelerated filer | Accelerated filer | |
| Non-accelerated filer [ ] | Smaller reporting company [X] | |
| Emerging growth company | [ ] |
Indicate by check mark whether the registrant is an emerging growth company as defined in Rule 405 of the Securities Act of 1933 (17 CFR §230.405) or Rule 12b-2 of the Securities Exchange Act of 1934 (17 CFR §240.12b-2).
Emerging Growth Company¨
If an emerging growth company, indicate by check mark if the registrant has elected not to use the extended transition period for complying with any new or revised financial standards provided pursuant to Section 13(a) of the Exchange Act.¨ [ ]
Indicate by check mark whether the registrant is a shell company (as defined in Rule 12b-2 of the Act).
Yes ¨[ ] No þ
Indicate the number of shares outstanding of each of the issuer’s classes of common stock, as of the latest practicable date.[X]
The number of shares outstanding of the registrant’s common stock as of November 9, 20187, 2019 was 47,944,48651,154,395 shares.
ABEONA THERAPEUTICS INC.
INDEX
CAUTIONARY STATEMENT RELATED TO FORWARD-LOOKING STATEMENTS
This Quarterly Report on Form 10-Q (including information incorporated by reference) contains statements that express management’s opinions, expectations, beliefs, plans, objectives, assumptions or projections regarding future events or future results and therefore are, or may be deemed to be, “forward-looking statements” within the meaning of Section 27A of the Securities Act of 1933, as amended, and Section 21E of the Securities Exchange Act of 1934, as amended,amended. Words such as “expects,” “anticipates,” “intends,” “plans,” “believes,” “could,” “would,” “seeks,” “estimates,” and that involve risksvariations of such words and uncertainties. These statements include, without limitation, statements relating to uncertainties associated with research and development activities; clinical trials; our ability to raise capital; future cash flows; our ability to fund our operating expenses and capital expenditure requirements for at least the next 12 months with our existing cash and cash equivalents; the future success of our marketed products and products in development; our sales projectionssimilar expressions, and the sales projectionsnegatives thereof, are intended to identify such forward-looking statements. We caution readers not to place undue reliance on any such “forward-looking statements,” which speak only as of our licensing partners; anticipated product launchesthe date made, and our commercialization strategies; the termsadvise readers that these forward-looking statements are not guarantees of future licensing arrangements; our abilityperformance and involve certain risks, uncertainties, estimates, and assumptions by management that are difficult to secure additional financing for our operations; our abilitypredict. Various factors, some of which are beyond the Company’s control, could cause actual results to establish new relationshipsdiffer materially from those expressed in, or implied by, such forward-looking statements. All such forward-looking statements, whether written or oral, and maintain current relationships; our expectation that we will continue to incur losses; our belief that we will expend substantial funds to conduct research and development programs, preclinical studies and clinical trials of potential products; our belief that we have a rich pipeline of products and product candidates; our expectation that we will add clinical sites for our Phase 1/2 clinical trial for patients with MPS IIIA; our ability to achieve profitability at allwhether made by us or on a sustained basis; our expected cash burn rate;behalf, are expressly qualified by these cautionary statements and any other cautionary statements that may accompany the dilutive effect that raising additional funds by selling additional equity securities would have on the relative equity ownership of our existing investors; our belief that emerging insights in genetics and advances in biotechnology, as well as new approaches and collaboration between researchers, industry, regulators and patient groups, provide significant opportunitiesforward-looking statements. In addition, we disclaim any obligation to develop breakthrough treatments for rare diseases; our expectation to perform preclinical development and clinical trials of a gene therapy treatment for EB based upon in-licensed technology; our belief that AAV treatment could potentially benefit patients with MPS III A and B; and our belief that the data from the expansion cohort of our Phase 1/2 clinical trial in ABO-102 (AAV-SGSH) for MPS IIIA, together with the data generated in the program to date, will allow us to submit a BLA. These statements relate to management’s current expectations of future events based on certain assumptions and includeupdate any statement that does not directly relate to any historical or current fact. In some cases, you can identify forward-looking statements to reflect events or circumstances after the date of this report, except as may otherwise be required by such words as “may,” “should,” “expects,” “plans,” “could,” “anticipates,” “believes,” “estimates,” “predicts,” “potential” or “continue” or the negative of such terms or other comparable terminology.federal securities laws.
Forward-looking statements necessarily involve risks and uncertainties, and our actual results could differ materially from those anticipated in the forward-looking statements due to a number of factors. These statements include statements about the timing for Chemistry, Manufacturing and Controls (“CMC”) clearance for the phase III clinical trial for patients with recessive dystrophic epidermolysis bullosa (“RDEB”) and the Company’s beliefs relating thereto; the Company’s ability to provide additional transport stability data points in response to the Food and Drug Administration (“FDA”) clinical hold letter for our RDEB phase III clinical trial and the timing thereof; the Company’s belief that completion of its CMC work and the durable safety and efficacy data will ultimately be critical to support a future Biologics License Application; and the Company’s plans to consider exploring a broad range of strategic alternatives, including, but not limited to, the partnering of its various clinical and pre-clinical programs, or a sale or merger of the Company. Important factors that could affect performance and cause results to differ materially from management’s expectations are described in the sections entitled “Risk Factors” and “Management’s Discussion and Analysis of Financial Condition and Results of Operations” in the Company’s Annual Report on Form 10-K for the fiscal year ended December 31, 2017,2018, as updated from time to time in the Company’s Securities and Exchange Commission filings, including this Quarterly Report on Form 10-Q.
The forward-looking statements contained in this Quarterly Report on Form 10-Q represent These factors include: our judgment only as of the date of this report. We caution readers not to place undue reliance on such statements. Except as required by law, we undertake no obligation to update publicly any forward-looking statementsestimates regarding expenses, future revenues, capital requirements, and needs for any reason, even if new information becomes available or other events occur in the future.
The response to this Item is submitted as a separate section of this report. See page 16.
ITEM 2. MANAGEMENT'S DISCUSSION AND ANALYSIS OF FINANCIAL CONDITION AND RESULTS OF OPERATIONS
OVERVIEW
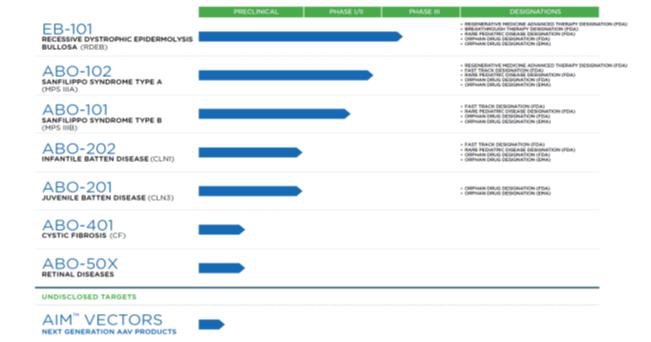
Abeona Therapeutics Inc. (together withadditional financing; our subsidiaries, “we,” “our,” “Abeona” or the “Company”) is a Delaware corporation. We are a clinical-stage biopharmaceutical company developing cell and gene therapies for life-threatening rare genetic diseases. Our lead programs include EB-101 (gene-corrected skin grafts) for recessive dystrophic epidermolysis bullosa (“RDEB”), ABO-102 (AAV-SGSH), an adeno-associated virus (“AAV”) based gene therapy for Sanfilippo syndrome type A (MPS IIIA) and ABO-101 (AAV NAGLU), an AAV based gene therapy for Sanfilippo syndrome type B (“MPS IIIB”). We are also developing ABO-201 (AAV-CLN3) gene therapy for juvenile Batten disease (JNCL), ABO-202 (AAV-CLN1) for treatment of infantile Batten disease (INCL), EB-201 for epidermolysis bullosa (EB), ABO-301 (AAV-FANCC) for Fanconi anemia (FA) disorder and ABO-302 using a novel CRISPR/Cas9-based gene editing approach to gene therapy for rare blood diseases. In addition, we are developing a proprietary vector platform, AIM™, for next generation product candidates. Our principal executive office is located at 1330 Avenue of the Americas, 33rd Floor, New York, New York 10019. Our website address iswww.abeonatherapeutics.com.
Recent Developments
On November 5, 2018 we announced a license agreement with REGENXBIO Inc. Under the terms of the agreement, REGENXBIO has granted Abeona an exclusive worldwide license (subject to certain non-exclusive rights previously granted for MPS IIIA), with rights to sublicense, to REGENXBIO’s NAV AAV9 vector for the development and commercialization of gene therapies for the treatment of MPS IIIA, MPS IIIB, CLN1 Disease and CLN3 Disease. In return for these rights, REGENXBIO will receive a guaranteed $20 million upfront payment, $10 million of which will be paid upon signing and $10 million of which will be paid within 12 months of the effective date. In addition, REGENXBIO will receive a total of $100 million in annual fees, payable upon the second through sixth anniversaries of the agreement, $20 million of which is guaranteed. REGENXBIO is also eligible to receive potential commercial milestone payments of up to $60 million. REGENXBIO will also receive low double-digit royalties on net sales of products incorporating the licensed intellectual property.
On October 18, 2018, we announced the appointment of João Siffert, M.D. as Head of Research and Development and Chief Medical Officer. As a result, former Chief Medical Officer Juan Ruiz, M.D., Ph.D. has assumed the role of Head of European Medical Affairs. Dr. Siffert has 30 years of combined experience in the biopharmaceutical industry, medicine, and academia and has successfully led multiple drug development programs from pre-clinical to regulatory approvals in the U.S. and Europe. Dr. Siffert most recently served as Chief Scientific and Medical Officer for Nestle Health Science and on the Board of Directors of gene therapy developer Avexis. Additionally, we announced the appointment of Neena Patil, J.D. as General Counsel and Corporate Secretary. Ms. Patil brings nearly 20 years of global biopharmaceutical experience to Abeona. She most recently served as Associate General Counsel and Vice President of Legal Affairs at Novo Nordisk.
On September 12, 2018, we announced the authorization to move forward with a Phase 1/2 clinical trial in Spain for the Company’s gene therapy product ABO-101 (AAV-NAGLU) for patients with MPS IIIB (Sanfilippo syndrome type B). The clinical study was approved by the Agencia Espanola de Medicamentos y Productos Sanitarios and is being conducted at Hospital Clinico Universitario of Santiago de Compostela, Spain. This will be our second clinical trial conducted in Europe, alongside the ongoing Phase 1/2 clinical trial for patients with MPS IIIA (Sanfilippo syndrome type A). We first initiated this trial in the United States and are planning to add clinical sites for the trial in other European countries, including France, Germany and the United Kingdom.
Product Development Strategy
Abeona is focused on developing and delivering gene therapy products for severe and life-threatening rare diseases. A rare disease is one that affects fewer than 200,000 people in the U.S. There are nearly 7,000 rare diseases, which may involve chronic illness, disability, and often, premature death. More than 25 million Americans and 30 million Europeans have a severe, life-threating disease. Approximately 80% of rare diseases are genetic in origin and can present at any stage of life. While rare diseases can affect any age group, about 50% of people affected are children (15 million) and rare diseases account for 35% of deaths in the first year of life. These rare diseases are often poorly diagnosed, very complex, and either have no treatment or not very effective treatment. Over 95% of rare diseases do not have a single FDA or EMA approved drug treatment, however, most rare diseases are often caused by changes in genes. We believe emerging insights in genetics and advances in biotechnology, as well as new approaches and collaboration between researchers, industry, regulators and patient groups, provide significant opportunities to develop breakthrough treatments for rare diseases.
Developing Next Generation Gene Therapy
Gene therapy is the use of DNA as a potential therapy to treat a disease. In many disorders, particularly genetic diseases caused by a single genetic defect, gene therapy aims to treat a disease by delivering the correct copy of DNA into a patient’s cells. The healthy, functional copy of the therapeutic gene then helps the cell function correctly. In gene therapy, DNA that encodes a therapeutic protein is packaged within a ‘‘vector,’’ often a ‘‘naked’’ virus, which is used to transfer the DNA to the inside of cells within the body. Gene therapy can be delivered by a direct injection, either intravenously or directly into a specific tissue in the body, where it is taken up by individual cells. Once inside cells, the correct DNA is expressed by the cell machinery, resulting in the production of missing or defective protein, which in turn is used to treat the patient’s underlying disease and can provide long-term benefit.
Abeona is developing next-generation AAV gene therapies. Viruses such as AAV are utilized because they have evolved a way of encapsulating and delivering one or more genes of the size needed for clinical application, and can be purified in large quantities at high concentration. Unlike AAV vectors found in nature, the AAV vectors used by Abeona have been genetically-modified such that they do not replicate. Although the preclinical studies in animal models of disease demonstrate the promising impact of AAV-mediated gene expression to affected tissues such as the heart, liver and muscle, our programs use a specific virus that is capable of delivering therapeutic DNA across the blood brain barrier and into the central nervous system (“CNS”) and the somatic system (body), making them attractive for addressing lysosomal storage diseases, which have severe CNS manifestations of the disease.
Lysosomal storage diseases (“LSDs”) are a group of rare inborn errors of metabolism resulting from deficiency in normal lysosomal function. These diseases are characterized by progressive accumulation of storage material within the lysosomes of affected cells, ultimately leading to cellular dysfunction. Multiple tissues ranging from musculoskeletal and visceral to tissues of the CNS are typically involved in disease pathology. Since the advent of enzyme replacement therapy to manage some LSDs, general clinical outcomes have significantly improved; however, treatment with infused protein is lifelong and continued disease progression is still evident in patients. Thus, AAV-based gene therapy may provide a viable alternative or adjunctive therapy to current management strategies for LSDs.
Our initial programs are focused on LSDs such as Mucopolysaccharidosis (“MPS”) III A and IIIB. MPSIII, also known as Sanfilippo syndromes type A and type B, is a progressive neuromuscular disease with profound CNS involvement. Our lead product candidates, ABO-101 and ABO-102, have been developed to replace the damaged, malfunctioning enzymes within target cells with the functional version. ABO-201 is a similar product, using an AAV to deliver the correct lysosomal gene that is defective in juvenile neuronal ceroid lipofuscinosis. Delivered via a single infusion, these drugs are only given once to a patient.
EB-101 for the Treatment of Recessive Dystrophic Epidermolysis Bullosa and EB-201 for the Correction of Gene Mutations in Skin Cells (Keratinocytes)
EB-101 is an ex vivo gene corrected cell therapy for the treatment of RDEB. EB-201 (AAVDJ-Col7A1) is a pre-clinical candidate targeting a novel, AAV-mediated gene editing and delivery approach to correct gene mutations in skin cells for patients with RDEB. On August 3, 2016, we entered into an agreement (the ‘‘EB Agreement’’) with EB Research Partnership (‘‘EBRP’’) and Epidermolysis Bullosa Medical Research Foundation (‘‘EBMRF’’) to collaborate on cell therapy treatments for EB.
We entered into a license with The Board of Trustees of Leland Stanford Junior University (“Stanford”), effective August 3, 2016, for the EB-101 technology, and we have performed certain preclinical development work and, as of September 30, 2018, were performing clinical trials of a cell therapy treatment for EB based upon such in-licensed technology.
We also entered into a license with Stanford, effective August 3, 2016, for the EB-201 (AAV DJ COL7A1) technology, and we plan to perform preclinical development and clinical trials of a gene therapy for EB based upon such in-licensed technology.
ABO-101 for MPS III B and ABO-102 for MPS III A (Sanfilippo syndrome)
MPS III (Sanfilippo syndrome) is a group of four inherited genetic diseases, described as type A, B, C or D, which are characterized by enzyme deficiencies that result in the abnormal accumulation of glycosaminoglycans (sugars) in body tissues. MPS III is a lysosomal storage disease, a group of rare inborn errors of metabolism resulting from deficiency in normal lysosomal function. At September 30, 2018, the incidence of MPS III (all four types combined) was estimated to be 1 in 70,000 births.
Mucopolysaccharides are long chains of sugar molecules used in the building of connective tissues in the body. There is a continuous process in the body of replacing used materials and breaking them down for disposal. Children with MPS III are missing an enzyme which is essential in breaking down used mucopolysaccharides. The partially broken down mucopolysaccharides remain stored in cells in the body causing progressive damage. Babies may show little sign of the disease, but as more and more cells become damaged, symptoms start to appear.
In MPS III, the predominant symptoms occur due to accumulation within the CNS, including the brain and spinal cord, resulting in cognitive decline, motor dysfunction, and eventual death. At September 30, 2018, there was no cure for MPS III and treatments were largely supportive.
Abeona is developing next-generation AAV-based gene therapies for MPS III, which involve a one-time delivery of a functional copy of the defective gene to cells of the CNS with the aim of reversing the effects of the genetic errors that cause the disease.
After a single dose in MPS III preclinical models, ABO-101 and ABO-102 induced cells in the CNS and peripheral organs to produce the missing enzymes which helped repair the damage caused to the cells. Preclinicalin vivoefficacy studies in MPS III have demonstrated functional benefits that remain for months after treatment. A single dose of ABO-101 or ABO-102 significantly restored normal cell and organ function, corrected cognitive defects that remained months after drug administration, increased neuromuscular control and increased the lifespan of animals with MPS III over 100% one year after treatment compared to untreated control animals. These results are consistent with studies from several laboratories suggesting AAV treatment could potentially benefit patients with MPS III A and B. In addition, safety studies conducted in animal models of MPS III have demonstrated that delivery of ABO-101 or ABO-102 were well tolerated with minimal side effects.
ABO-201 for juvenile Batten disease (or Juvenile Neuronal Ceroid Lipofuscinoses) (JNCL) and ABO-202 (AAV-CLN1) gene therapy for treatment of infantile Batten disease (or Infantile Neuronal Ceroid Lipofuscinoses) (INCL)
ABO-201 (AAV CLN3) is an AAV-based gene therapy that has shown promising preclinical efficacy in delivery of a functional copy of the defective CLN3 gene to cells of the CNS with the aim of reversing the effects of the genetic errors that cause JNCL. JNCL is a rare, fatal, autosomal recessive (inherited) disorder of the nervous system that typically begins in children between 4 and 8 years of age. Often the first noticeable sign of JNCL is vision impairment, which tends to progress rapidly and eventually result in blindness. As the disease progresses, children experience loss of previously acquired skills (developmental regression). This regression usually begins with the loss of the ability to speak in complete sentences. Children then lose motor skills, such as theraise capital; our ability to walk or sit. They also develop movement abnormalities that include rigidity or stiffness, slow or diminished movements (hypokinesia), and stooped posture. Beginning in mid- to late childhood, affected children may have recurrent seizures (epilepsy), heart problems, behavioral problems, and difficulty sleeping. Life expectancy is greatly reduced. Most patients with juvenile Batten disease die within their twenties or thirties. At September 30, 2018, no specific treatment is known that can halt or reverse the symptoms of JNCL.
JNCL is the most common form of a group of disorders known as neuronal ceroid lipofuscinoses (NCLs). Collectively, all forms of NCL affect an estimated 2 to 4 in 100,000 live births in the United States. NCLs are more common in Finland, where approximately 1 in 12,500 individuals were affected at September 30, 2018, as well as Sweden, other parts of northern Europe, and Newfoundland, Canada.
Most cases of JNCL are caused by mutations in the CLN3 gene, which is the focus of our AAV-based gene therapy approach. These mutations disrupt the function of cellular structures called lysosomes. Lysosomes are compartments in the cell that normally digest and recycle different types of molecules. Lysosome malfunction leads to a buildup of fatty substances called lipopigments and proteins within these cell structures. These accumulations occur in cells throughout the body, but neurons in the brain seem to be particularly vulnerable to damage. The progressive death of cells, especially in the brain, leads to vision loss, seizures, and intellectual decline in children with JNCL.
ABO-202 (AAV9 CLN1) is an AAV-based gene therapy that has shown promising preclinical efficacy in delivery of a functional copy of the defective CLN1 gene to cells of the central nervous system with the aim of reversing the effects of the genetic errors that cause an infantile form of Batten disease (also known as infantile neuronal ceroid lipofuscinosis).
ABO-301 for Fanconi Anemia (FA) and ABO-302 for rare blood diseases using a novel CRISPR/Cas9-based gene editing approach to gene therapy for rare blood diseases
ABO-301 (AAV-FANCC) is an AAV-based gene therapy, which has shown promising preclinical efficacy in delivery of a normal copy of the defective gene to cells of the hematopoietic or blood system with the aim of reversing the effects of the genetic errors that cause FA. FA is a rare (1 in 160,000) pediatric, autosomal recessive (inherited) disease characterized by multiple physical abnormalities, organ defects, bone marrow failure, and a higher than normal risk of cancer. The average lifespan for people with FA is 20 to 30 years.
The major function of bone marrow is to produce new blood cells. In FA, a DNA mutation renders the FANCC gene nonfunctional. Loss of FANCC causes skeletal abnormalities and leads to bone marrow failure. FA patients also have much higher rates of hematological diseases, such as acute myeloid leukemia or tumors of the head, neck, skin, gastrointestinal system, or genital tract. The likelihood of developing one of these cancers in people with FA is between 10% and 30%. Aside from bone marrow transplantation, there are no specific treatments known that can halt or reverse the symptoms of FA. Repairing fibroblast cells in FA patients with a functional FANCC gene is the focus of our AAV-based gene therapy approach.
Using a novel CRISPR (clustered, regularly interspaced short palindromic repeats)-Cas9 (CRISPR associated protein 9) system, researchers used a protein-RNA complex composed of an enzyme known as Cas9 bound to a guide RNA molecule that has been designed to recognize a particular DNA sequence. The RNA molecules guide the Cas9 complex to the location in the genome that requires repair. CRISPR-Cas9 uniquely enables surgically efficient knock-out, knock-down or selective editing of defective genes in the context of their natural promoters, unlocking the potential to treat both recessive and dominant forms of genetic diseases. Most importantly, this approach has the potential to allow for more precise gene modification.
LIQUIDITY AND CAPITAL RESOURCES
We have historically funded our operations primarily through public and private sales of common stock, preferred stock, convertible notes and through licensing agreements. Our principal source of liquidity is cash and cash equivalents. Foundation grants and royalty revenues provided limited funding for operations during the period ended September 30, 2018. As of September 30, 2018, our cash and cash equivalents and marketable securities were $112,224,000, as compared to $137,750,000 as of December 31, 2017. The decrease in cash and cash equivalents was primarily attributable to the decrease in working capital discussed below.
As of September 30, 2018, our working capital was $104,220,000. Our working capital as of September 30, 2018 represented a decrease of $30,765,000 as compared to our working capital of $134,985,000 as of December 31, 2017. The decrease in working capital as of September 30, 2018 reflects nine months of net operating costs and changes in current assets and liabilities and capital expenditures, which were primarily due to the completion of a manufacturing facility, partially offset by proceeds from the exercise of stock options and warrants.
On October 16, 2017, we announced a collaborative agreement between nine Sanfilippo foundations to provide up to approximately $13.85 million of grants to Abeona in installments for the advancement of the Company’s clinical stage gene therapies for Sanfilippo Syndrome Type A (MPS IIIA) and Sanfilippo Syndrome Type B (MPS IIIB), subject to the achievement of certain milestones. As of September 30, 2018, we received $5.0 million of these grants ($2.6 million in the quarter ended December 31, 2017 and $2.4 million in the nine months ended September 30, 2018) and recorded them first as deferred revenue. $2.6 million of the $3.4 million in grants were recorded as revenue in the quarter ended March 31, 2018 and $0.8 million were recorded as revenue in the quarter ended June 30, 2018 and $1.6 million were recorded as revenue in the quarter ended September 30, 2018.
On August 17, 2018, we entered into an Open Market Sale Agreement (the “Agreement”) with Jefferies LLC (the “Agent”). Pursuant to the terms of the Agreement, we may sell from time to time through the Agent shares of our common stock for an aggregate sales price of up to $150 million. Any sales of shares pursuant to the Agreement will be made under our effective “shelf” registration statement on Form S-3 (File No. 333-224867), which is on file and has been declared effective by the SEC Staff.
If we raise additional funds by selling additional equity securities, the relative equity ownership of our existing investors will be diluted and the new investors could obtain terms more favorable than previous investors.
We have incurred negative cash flows from operations since inception, and have expended, and expect to continue to expend in the future, substantial funds and resources to our research and development programs. Since inception our expenses have significantly exceed our limited revenues, resulting in an accumulated deficit as of September 30, 2018 of $392,711,000. We expect to incur losses for the next several years as we continue to invest in product research and development, preclinical studies, clinical trials and regulatory compliance. We cannot provide assurance that we will ever be able to generate sufficient product sales or royalty revenue to achieve profitability on a sustained basis, or at all.
THIRD QUARTER 2018 COMPARED TO THIRD QUARTER 2017
Our licensing revenue for the third quarter of 2018 was $0 as compared to $151,000 for the same period in 2017. In 2017, we recognized licensing revenue over the period of the performance obligation under our licensing agreements under the Financial Accounting Standards Board’s Accounting Standards Codification (“ASC”) 605,Revenue Recognition (Topic 605). Effective January 1, 2018, we adopted Accounting Standards Update (“ASU”) 2014-09,Revenue from Contracts with Customers (Topic 606), as amended (commonly referred to as ASC 606) using the modified retrospective transition method. The cumulative effect of applying the standard was an increase of $3.7 million to stockholders’ equity as of January 1, 2018. There was no licensing revenue for the third quarter of 2018 due to ASC 606.
We recorded revenue for Sanfilippo Foundation Grants of $1,687,000 for the third quarter of 2018 and no revenues for the same period of 2017, an increase of $1,687,000. We recorded revenue to match expenses for the advancement of the Company’s clinical stage gene therapies for Sanfilippo Syndrome Type A (“MPS IIIA”) and Sanfilippo Syndrome Type B (“MPS IIIB”).
We recorded royalty revenue for MuGard of $22,000 for the third quarter of 2018 and $68,000 for the same period of 2017, a decrease of $46,000. We licensed MuGard to AMAG Pharmaceuticals, Inc. (“AMAG”) and Norgine B.V. (“Norgine”) and received quarterly reports under our agreements.
Total research and development spending for the third quarter of 2018 was $13,150,000, as compared to $3,277,000 for the same period of 2017, an increase of $9,873,000. The increase in expenses was primarily due to:
Total general and administrative expenses were $4,970,000 for the third quarter of 2018, as compared to $2,166,000 for the same period of 2017, an increase of $2,804,000. The increase in expenses was primarily due to:
Depreciation and amortization was $505,000 for the third quarter of 2018, as compared to $138,000 for the same period in 2017, an increase of $367,000. We are amortizing the licenses for ABO-101 and ABO-201, and EB-102 over the life of the patents. The increase was primarily due to an increase in depreciation ($368,000) partially offset by lower amortization of licensed technology ($1,000).
Total operating expenses for the third quarter of 2018 were $18,625,000, as compared to total operating expenses of $5,581,000 for the same period of 2017, an increase of $13,044,000 due to the reasons listed above.
Interest and miscellaneous income was $500,000 for the third quarter of 2018 as compared to $21,000 for the same period of 2017, an increase of $479,000. Most of the increase was due to increased interest income resulting from higher cash balances and marketable securities ($474,000) and miscellaneous income ($5,000).
Interest and other expense was $3,000 for the third quarter of 2018, as compared to $2,000 in the same period of 2017.
Net loss for the third quarter of 2018 was $16,419,000, or a $0.34 basic and diluted loss per common share as compared to a net loss of $5,343,000, or a $0.13 basic and diluted loss per common share, for the same period in 2017, an increased loss of $11,076,000.
NINE MONTHS ENDED SEPTEMBER 30, 2018 COMPARED TO NINE MONTHS ENDED SEPTEMBER 30, 2017
Our licensing revenue for the first nine months of 2018 was $0 as compared to $452,000 for the same period in 2017. In 2017, we recognized licensing revenue over the period of the performance obligation under our licensing agreements under ASC 605. Effective January 1, 2018, we adopted ASC 606 using the modified retrospective transition method. The cumulative effect of applying the standard was an increase of $3.7 million to stockholders’ equity as of January 1, 2018. There was no licensing revenue for the first nine months of 2018 due to ASC 606.
We recorded revenue for Foundation Grants of $5,037,000 for the first nine months of 2018 and no revenues for the same period of 2017, an increase of $5,037,000. We recorded revenue to match expenses for the advancement of the Company’s clinical stage gene therapies for Sanfilippo Syndrome Type A (MPS IIIA) and Sanfilippo Syndrome Type B (MPS IIIB).
We recorded royalty revenue for MuGard of $89,000 for the first nine months of 2018 and $170,000 for the same period of 2017, a decrease of $81,000. We licensed MuGard to AMAG and Norgine and received quarterly reports under our agreements.
Total research and development spending for the first nine months of 2018 was $29,228,000, as compared to $11,283,000 for the same period of 2017, an increase of $17,945,000. The increase in expenses was primarily due to:
Total general and administrative expenses were $12,475,000 for the first nine months of 2018, as compared to $7,830,000 for the same period of 2017, an increase of $4,645,000. The increase in expenses was primarily due to:
Depreciation and amortization was $969,000 for the first nine months of 2018, as compared to $595,000 for the same period in 2017, an increase of $374,000. We amortize the licenses for ABO-101 and ABO-201, and EB-102 over the life of the patents. The increase was primarily due to an increase in depreciation ($562,000) due to newly acquired assets partially offset by lower amortization of licensed technology ($188,000). SDF Alpha was amortized through May 26, 2017. The license was returned to the licensor, Plasma Technologies, LLC in 2017.
Total operating expenses for the first nine months of 2018 were $42,672,000, as compared to total operating expenses of $19,708,000 for the same period of 2017, an increase of $22,964,000 for the reasons listed above.
Interest and miscellaneous income was $973,000 for the first nine months of 2018, as compared to $224,000 for the same period of 2017, an increase of $749,000. Most of the increase was due to increased interest income resulting from higher cash balances ($865,000), partially offset by decreased miscellaneous income ($116,000).
Interest and other expense was $9,000 for the nine months of 2018, as compared to $7,000 in the same period of 2017.
Net loss for the nine months of 2018 was $36,582,000, or a $0.77 basic and diluted loss per common share as compared to a net loss of $18,869,000, or a $0.47 basic and diluted loss per common share, for the same period in 2017, an increased loss of $17,713,000.
OFF-BALANCE SHEET ARRANGEMENTS
None.
ITEM 3. QUANTITATIVE AND QUALITATIVE DISCLOSURES ABOUT MARKET RISK
We are exposed to a variety of financial risks in the normal course of our business, including market risk (including currency and price risk), credit risk and liquidity risk. Our overall risk management program focuses on preservation of capital and the unpredictability of financial markets and has sought to minimize potential adverse effects on our financial performance and position.
Market Risk
Currency risk
We are exposed to foreign exchange risk arising from various currencies, primarily with respect to the U.S. dollar and to a lesser extent to the EU euro, Australian dollar and British pound. As our U.S. operating entity primarily conducts its operations in U.S. dollars, its exposure to changes in foreign currency is insignificant.
Price risk
The market prices for the provision of preclinical and clinical materials and services, as well as external contracted research, may vary over time.
The commercial prices of any of our products or product candidates are currently uncertain.
We are not exposed to commodity price risk.
We do hold investments classified as available-for-sale or at fair value through profit or loss; therefore, we are exposed to equity securities price risk.
Credit Risk
Credit risk is managed on a consolidated basis. Credit risk arises from cash and cash equivalents and deposits with banks and financial institutions, outstanding receivables and committed transactions with collaboration partners and security deposits paid to landlords. We currently have no wholesale debtors.
We deposited funds as security to our landlords related to our facility in Cleveland, Ohio and our facility in Dallas, Texas.
Our cash and cash equivalents include bank balances, demand deposits and other short-term highly liquid investments (with maturities of less than three months at the time of purchase) that are readily convertible into a known amount of cash and are subject to an insignificant risk of fluctuation in value. Restricted cash includes deposits made in relation to facility leases. Cash, cash equivalents and restricted cash were placed at Comerica Bank.
Liquidity Risk
We believe that our existing cash and cash equivalents will enable us to fund our operating expenses and capital expenditure requirements for at least the next 12 months. We manage liquidity throughmonths with our existing cash and cash equivalents; our plans to consider exploring a rolling forecastbroad range of strategic alternatives, including, but not limited to, the partnering of its various clinical and pre-clinical programs, or a sale or merger of the Company; the Company’s ability to obtain additional equity funding from current or new stockholders, out-licensing technology and/or other assets, deferring and/or eliminating planned expenditures, restructuring operations and/or reducing headcount, and sales of assets; our expectation that we will continue to incur losses; our belief that we will expend substantial funds to conduct research and development programs; our future ability to achieve profitability at all or on a sustained basis; our cash burn rate; the dilutive effect that raising additional funds by selling additional equity securities would have on the relative equity ownership of our liquidity reserve onexisting investors; our belief that we have a rich pipeline of products and product candidates; our ability to continue to develop our novel adeno-associated virus (“AAV”)-based gene therapy platform technology to treat neurologic disorders, cystic fibrosis and eye disorders in human subjects; our belief that EB-101 could potentially benefit patients with RDEB; the basisoutcome of expected cash flow and raise cash if and when needed through the issuance of shares.
ITEM 4. CONTROLS AND PROCEDURES
Evaluation of Disclosure Controls and Procedures
Under the supervision andany interactions with the participationFDA or other regulatory agencies relating to any of our managementproducts or product candidates; whether or when the FDA will lift the clinical hold relating to the Company’s planned phase III clinical trial for patients with RDEB; our ability to initiate a phase III clinical trial for patients with RDEB in the fourth quarter of 2019; our ability to complete enrollment of patients into clinical trials to secure sufficient data to assess efficacy and consultants, includingsafety; our belief that AAV treatment could potentially benefit patients with Sanfilippo syndrome type A (“MPS IIIA”) and Sanfilippo syndrome type B (“MPS IIIB”); our ability to add clinical sites and identify additional patients for our phase I/II clinical trial for patients with MPS IIIA and MPS IIIB; our ability to continue to secure and maintain regulatory designations for our product candidates; our ability to develop manufacturing capability compliant with current good manufacturing practices for our product candidates; our ability to manufacture gene and cell therapy products and produce an adequate product supply to support clinical trials and potentially future commercialization; our ability to secure timely regulatory review related to our clinical programs; our belief in the Executive Chairman (our principal executive officer) and Senior Vice President Finance and Administration, Chief Accounting Officer (our principal accounting officer), we have conducted an evaluationadequacy of the effectivenessdata from clinical trials in EB-101 and expansion cohort of our phase I/II clinical trial in ABO-102 (AAV-SGSH) for MPS IIIA, together with the data generated in the program to date, to support regulatory approvals; our intellectual property position and our ability to obtain, maintain and enforce intellectual property protection and exclusivity for our proprietary assets; the rate and degree of market acceptance of our product candidates for any indication once approved; our estimates regarding the size of the design and operationpotential markets for our product candidates, the strength of our disclosure controlscommercialization strategies and procedures (“Disclosure Controlsour ability to serve and Procedures”), assupply those markets; our ability to meet our obligations contained in license agreements to which we are party; and the terms of September 30, 2018, as such term is defined in Exchange Act Rules 13a-15(e) and 15d-15(e) of the Securities Exchange Act of 1934, as amended (the “Exchange Act”).future licensing arrangements or collaborations.
Conclusion of Evaluation— Based on this Disclosure Controls and Procedures evaluation, the Executive Chairman and Chief Accounting Officer concluded that our Disclosure Controls and Procedures as of September 30, 2018 were effective.
Changes In Internal Control Over Financial Reporting – There were no changes in our internal control over financial reporting that occurred during the quarter ended September 30, 2018 that have materially affected, or are reasonable likely to materially affect, our internal control over financial reporting.
We are not currently subject to any material legal proceedings.
As of the date of this filing, there have been no material changes to the risk factors included in our Annual Report on Form 10-K for the year ended December 31, 2017, as filed with the SEC on March 16, 2018.
See Exhibit Index below, which is incorporated by reference herein.
SIGNATURESPART I – FINANCIAL INFORMATION
Pursuant to the requirements of the Securities Exchange Act of 1934, the registrant has duly caused this report to be signed on its behalf by the undersigned, thereunto duly authorized.ITEM 1. FINANCIAL STATEMENTS
ABEONA THERAPEUTICS INC.
Abeona Therapeutics Inc. and Subsidiaries
Condensed Consolidated Balance Sheets
| September 30, 2018 | December 31, 2017 | September 30, 2019 | December 31, 2018 | |||||||||||||
| (unaudited) | (Unaudited) | |||||||||||||||
| ASSETS | ||||||||||||||||
| Current assets | ||||||||||||||||
| Current assets: | ||||||||||||||||
| Cash and cash equivalents | $ | 33,599,000 | $ | 137,750,000 | $ | 47,923,000 | $ | 18,750,000 | ||||||||
| Marketable securities | 78,625,000 | - | ||||||||||||||
| Short-term investments | - | 66,218,000 | ||||||||||||||
| Receivables | 352,000 | 107,000 | 15,000 | 81,000 | ||||||||||||
| Prepaid expenses and other current assets | 1,975,000 | 2,735,000 | 1,654,000 | 3,802,000 | ||||||||||||
| Total current assets | 114,551,000 | 140,592,000 | 49,592,000 | 88,851,000 | ||||||||||||
| Property and equipment, net | 9,245,000 | 1,374,000 | 13,814,000 | 9,443,000 | ||||||||||||
| Right-of-use lease assets | 8,286,000 | - | ||||||||||||||
| Licensed technology, net | 3,717,000 | 3,977,000 | 37,471,000 | 43,042,000 | ||||||||||||
| Goodwill | 32,466,000 | 32,466,000 | 32,466,000 | 32,466,000 | ||||||||||||
| Other assets and restricted cash | 597,000 | 357,000 | 1,143,000 | 597,000 | ||||||||||||
| Total assets | $ | 160,576,000 | $ | 178,766,000 | $ | 142,772,000 | $ | 174,399,000 | ||||||||
| LIABILITIES AND STOCKHOLDERS’ EQUITY | ||||||||||||||||
| Current liabilities | ||||||||||||||||
| Current liabilities: | ||||||||||||||||
| Accounts payable | $ | 10,331,000 | $ | 2,393,000 | $ | 2,714,000 | $ | 6,122,000 | ||||||||
| Current portion of deferred revenue | - | 3,214,000 | ||||||||||||||
| Accrued expenses | 5,532,000 | 3,936,000 | ||||||||||||||
| Current portion of lease liability | 1,696,000 | - | ||||||||||||||
| Current portion of payable to licensor | 10,000,000 | 10,000,000 | ||||||||||||||
| Deferred revenue | 296,000 | 296,000 | ||||||||||||||
| Total current liabilities | 10,331,000 | 5,607,000 | 20,238,000 | 20,354,000 | ||||||||||||
| Deferred revenue, net of current portion | - | 3,061,000 | ||||||||||||||
| Long-term lease liabilities | 6,482,000 | - | ||||||||||||||
| Payable to licensor, net of current portion | 20,000,000 | 20,000,000 | ||||||||||||||
| Total liabilities | 10,331,000 | 8,668,000 | 46,720,000 | 40,354,000 | ||||||||||||
| Commitments and contingencies | ||||||||||||||||
| Stockholders’ equity | ||||||||||||||||
| Common stock - $.01 par value; authorized 200,000,000 shares; issued, 47,944,486 at September 30, 2018 and 46,888,108 at December 31, 2017 | 480,000 | 469,000 | ||||||||||||||
| Stockholders’ equity: | ||||||||||||||||
| Common stock - $0.01 par value; authorized 200,000,000 shares; issued and outstanding 51,054,395 at September 30, 2019; issued and outstanding 47,944,486 at December 31, 2018 | 511,000 | 479,000 | ||||||||||||||
| Additional paid-in capital | 542,476,000 | 529,421,000 | 565,580,000 | 543,754,000 | ||||||||||||
| Accumulated deficit | (392,711,000 | ) | (359,792,000 | ) | (470,039,000 | ) | (410,188,000 | ) | ||||||||
| Total stockholders’ equity | 150,245,000 | 170,098,000 | 96,052,000 | 134,045,000 | ||||||||||||
| Total liabilities and stockholders’ equity | $ | 160,576,000 | $ | 178,766,000 | $ | 142,772,000 | $ | 174,399,000 | ||||||||
The accompanying notes are an integral part of these condensed consolidated statements.
Abeona Therapeutics Inc. and Subsidiaries
Condensed Consolidated Statements of Operations
(Unaudited)
| For the three months ended September 30, | For the nine months ended September 30, | |||||||||||||||
| 2019 | 2018 | 2019 | 2018 | |||||||||||||
| Revenues: | ||||||||||||||||
| Foundation revenues | $ | - | $ | 1,687,000 | $ | - | $ | 2,427,000 | ||||||||
| Royalties | - | 22,000 | - | 89,000 | ||||||||||||
| Total revenues | - | 1,709,000 | - | 2,516,000 | ||||||||||||
| Expenses: | ||||||||||||||||
| Research and development | 10,917,000 | 13,150,000 | 38,961,000 | 29,228,000 | ||||||||||||
| General and administrative | 4,700,000 | 4,970,000 | 15,971,000 | 12,475,000 | ||||||||||||
| Depreciation and amortization | 2,032,000 | 505,000 | 5,747,000 | 969,000 | ||||||||||||
| Total expenses | 17,649,000 | 18,625,000 | 60,679,000 | 42,672,000 | ||||||||||||
| Loss from operations | (17,649,000 | ) | (16,916,000 | ) | (60,679,000 | ) | (40,156,000 | ) | ||||||||
| Interest and miscellaneous income | 277,000 | 500,000 | 828,000 | 973,000 | ||||||||||||
| Interest and other expense | - | (3,000 | ) | - | (9,000 | ) | ||||||||||
| Net loss | $ | (17,372,000 | ) | $ | (16,419,000 | ) | $ | (59,851,000 | ) | $ | (39,192,000 | ) | ||||
| Basic and diluted loss per common share | $ | (0.35 | ) | $ | (0.34 | ) | $ | (1.22 | ) | $ | (0.83 | ) | ||||
| Weighted average number of common shares outstanding – basic and diluted | 49,721,753 | 47,794,394 | 48,883,883 | 47,388,833 | ||||||||||||
The accompanying notes are an integral part of these condensed consolidated statements.
Abeona Therapeutics Inc. and Subsidiaries
Condensed Consolidated Statements of Operations
(unaudited)
Three months ended | Nine months ended | |||||||||||||||
| September 30, | September 30, | |||||||||||||||
| 2018 | 2017 | 2018 | 2017 | |||||||||||||
| Revenues | ||||||||||||||||
| Foundation grants | $ | 1,687,000 | $ | - | $ | 5,037,000 | $ | - | ||||||||
| Royalties | 22,000 | 68,000 | 89,000 | 170,000 | ||||||||||||
| License revenues | - | 151,000 | - | 452,000 | ||||||||||||
| Total revenues | 1,709,000 | 219,000 | 5,126,000 | 622,000 | ||||||||||||
| Expenses | ||||||||||||||||
| Research and development | 13,150,000 | 3,277,000 | 29,228,000 | 11,283,000 | ||||||||||||
| General and administrative | 4,970,000 | 2,166,000 | 12,475,000 | 7,830,000 | ||||||||||||
| Depreciation and amortization | 505,000 | 138,000 | 969,000 | 595,000 | ||||||||||||
| Total expenses | 18,625,000 | 5,581,000 | 42,672,000 | 19,708,000 | ||||||||||||
| Loss from operations | (16,916,000 | ) | (5,362,000 | ) | (37,546,000 | ) | (19,086,000 | ) | ||||||||
| Interest and miscellaneous income | 500,000 | 21,000 | 973,000 | 224,000 | ||||||||||||
| Interest and other expense | (3,000 | ) | (2,000 | ) | (9,000 | ) | (7,000 | ) | ||||||||
| 497,000 | 19,000 | 964,000 | 217,000 | |||||||||||||
| Net loss | �� | $ | (16,419,000 | ) | $ | (5,343,000 | ) | $ | (36,582,000 | ) | $ | (18,869,000 | ) | |||
| Basic and diluted loss per common share | $ | (0.34 | ) | $ | (0.13 | ) | $ | (0.77 | ) | $ | (0.47 | ) | ||||
| Weighted average number of common shares outstanding | 47,794,394 | 40,377,890 | 47,388,833 | 40,301,601 | ||||||||||||
The accompanying notes are an integral part of these condensed consolidated statements.
Abeona Therapeutics Inc. and Subsidiaries
Condensed Consolidated Statements of Stockholders’ Equity
(unaudited)(Unaudited)
| Common Stock | ||||||||||||||||||||
| Shares | Amount | Additional paid-in capital | Accumulated deficit | Total stockholders’ equity | ||||||||||||||||
| Balance, December 31, 2017 – as reported | 46,888,108 | $ | 469,000 | $ | 529,421,000 | $ | (359,792,000 | ) | $ | 170,098,000 | ||||||||||
| Cumulative effect adjustment of ASC 606 on January 1, 2018 | - | - | - | 3,663,000 | 3,663,000 | |||||||||||||||
| Stock based compensation expense | - | - | 1,900,000 | - | 1,900,000 | |||||||||||||||
| Vesting of restricted common stock issued to employees | - | - | 172,000 | - | 172,000 | |||||||||||||||
| Common stock issued for | ||||||||||||||||||||
| -cash exercise of options | 267,196 | 3,000 | 1,682,000 | - | 1,685,000 | |||||||||||||||
| -exercise of $5.00 warrants | 28,874 | - | 144,000 | - | 144,000 | |||||||||||||||
| -cashless warrant exercises | 48,762 | - | - | - | - | |||||||||||||||
| Net loss | - | - | - | (8,463,000 | ) | (8,463,000 | ) | |||||||||||||
| Balance, March 31, 2018 | 47,232,940 | 472,000 | 533,319,000 | (364,592,000 | ) | 169,199,000 | ||||||||||||||
| Stock based compensation expense | - | - | 2,673,000 | - | 2,673,000 | |||||||||||||||
| Vesting of restricted common stock issued to employees | - | - | 172,000 | - | 172,000 | |||||||||||||||
| Common stock issued for | ||||||||||||||||||||
| -cash exercise of options | 76,956 | 1,000 | 480,000 | - | 481,000 | |||||||||||||||
| -exercise of $5.00 warrants | 17,889 | - | 89,000 | - | 89,000 | |||||||||||||||
| Net loss | - | - | - | (11,700,000 | ) | (11,700,000 | ) | |||||||||||||
| Balance, June 30, 2018 | 47,327,785 | 473,000 | 536,733,000 | (376,292,000 | ) | 160,914,000 | ||||||||||||||
| Stock based compensation expense | - | - | 2,499,000 | - | 2,499,000 | |||||||||||||||
| Vesting of restricted common stock issued to employees | - | - | 172,000 | - | 172,000 | |||||||||||||||
| Common stock issued for | ||||||||||||||||||||
| -cash exercise of options | 16,701 | 1,000 | 78,000 | - | 79,000 | |||||||||||||||
| -exercise of $5.00 warrants | 600,000 | 6,000 | 2,994,000 | - | 3,000,000 | |||||||||||||||
| Net loss | - | - | - | (16,419,000 | ) | (16,419,000 | ) | |||||||||||||
| Balance, September 30, 2018 | 47,944,486 | $ | 480,000 | $ | 542,476,000 | $ | (392,711,000 | ) | $ | 150,245,000 | ||||||||||
| Additional | Total | |||||||||||||||||||
| Common Stock | Paid-in | Accumulated | Stockholders’ | |||||||||||||||||
| Shares | Amount | Capital | Deficit | Equity | ||||||||||||||||
| Balance, December 31, 2017 - as reported | 46,888,108 | $ | 469,000 | $ | 529,421,000 | $ | (359,792,000 | ) | $ | 170,098,000 | ||||||||||
| Cumulative effect adjustment of ASC 606 on January 1, 2018 | - | - | - | 6,275,000 | 6,275,000 | |||||||||||||||
| Stock option-based compensation expense | - | - | 1,900,000 | - | 1,900,000 | |||||||||||||||
| Restricted stock-based compensation expense | - | - | 172,000 | - | 172,000 | |||||||||||||||
| Common stock issued for: | ||||||||||||||||||||
| - cash exercise of options | 267,196 | 3,000 | 1,682,000 | - | 1,685,000 | |||||||||||||||
| - exercise of $5.00 warrants | 28,874 | - | 144,000 | - | 144,000 | |||||||||||||||
| - cashless warrant exercises | 48,762 | - | - | - | - | |||||||||||||||
| Net loss | - | - | - | (10,530,000 | ) | (10,530,000 | ) | |||||||||||||
| Balance, March 31, 2018 | 47,232,940 | $ | 472,000 | $ | 533,319,000 | $ | (364,047,000 | ) | $ | 169,744,000 | ||||||||||
| Stock option-based compensation expense | - | - | 2,673,000 | - | 2,673,000 | |||||||||||||||
| Restricted stock-based compensation expense | - | - | 172,000 | - | 172,000 | |||||||||||||||
| Common stock issued for: | ||||||||||||||||||||
| - cash exercise of options | 76,956 | 1,000 | 480,000 | - | 481,000 | |||||||||||||||
| - exercise of $5.00 warrants | 17,889 | - | 89,000 | - | 89,000 | |||||||||||||||
| Net loss | - | - | - | (12,243,000 | ) | (12,243,000 | ) | |||||||||||||
| Balance, June 30, 2018 | 47,327,785 | $ | 473,000 | $ | 536,733,000 | $ | (376,290,000 | ) | $ | 160,916,000 | ||||||||||
| Stock option-based compensation expense | - | - | 2,499,000 | - | 2,499,000 | |||||||||||||||
| Restricted stock-based compensation expense | - | - | 172,000 | - | 172,000 | |||||||||||||||
| Common stock issued for: | ||||||||||||||||||||
| - cash exercise of options | 16,701 | 1,000 | 78,000 | - | 79,000 | |||||||||||||||
| - exercise of $5.00 warrants | 600,000 | 6,000 | 2,994,000 | - | 3,000,000 | |||||||||||||||
| Net loss | - | - | - | (16,419,000 | ) | (16,419,000 | ) | |||||||||||||
| Balance, September 30, 2018 | 47,944,486 | $ | 480,000 | $ | 542,476,000 | $ | (392,709,000 | ) | $ | 150,247,000 | ||||||||||
| Balance, December 31, 2018 | 47,944,486 | $ | 479,000 | $ | 543,754,000 | $ | (410,188,000 | ) | $ | 134,045,000 | ||||||||||
| Stock option-based compensation expense | - | - | 2,103,000 | - | 2,103,000 | |||||||||||||||
| Restricted stock-based compensation expense | - | - | 172,000 | - | 172,000 | |||||||||||||||
| Common stock issued for cash exercise of options | 5,208 | - | 28,000 | - | 28,000 | |||||||||||||||
| Net loss | - | - | - | (18,555,000 | ) | (18,555,000 | ) | |||||||||||||
| Balance, March 31, 2019 | 47,949,694 | $ | 479,000 | $ | 546,057,000 | $ | (428,743,000 | ) | $ | 117,793,000 | ||||||||||
| Stock option-based compensation expense | - | - | 1,678,000 | - | 1,678,000 | |||||||||||||||
| Restricted stock-based compensation expense | - | - | 78,000 | - | 78,000 | |||||||||||||||
| Common stock issued for cash exercise of options | 91,126 | 1,000 | 384,000 | - | 385,000 | |||||||||||||||
| Common stock issued for cash under open market sale agreement | 1,658,677 | 17,000 | 12,605,000 | - | 12,622,000 | |||||||||||||||
| Shares returned in connection with arbitration ruling on licensing agreement | (450,000 | ) | (5,000 | ) | (1,467,000 | ) | - | (1,472,000 | ) | |||||||||||
| Net loss | - | - | - | (23,924,000 | ) | (23,924,000 | ) | |||||||||||||
| Balance, June 30, 2019 | 49,249,497 | $ | 492,000 | $ | 559,335,000 | $ | (452,667,000 | ) | $ | 107,160,000 | ||||||||||
| Stock option-based compensation expense | - | - | 1,826,000 | - | 1,826,000 | |||||||||||||||
| Restricted stock-based compensation expense | - | - | 98,000 | - | 98,000 | |||||||||||||||
| Common stock issued for restricted share awards | 376,625 | 4,000 | (4,000 | ) | - | - | ||||||||||||||
| Common stock issued for cash under open market sale agreement | 1,428,273 | 15,000 | 4,325,000 | - | 4,340,000 | |||||||||||||||
| Net loss | - | - | - | (17,372,000 | ) | (17,372,000 | ) | |||||||||||||
| Balance, September 30, 2019 | 51,054,395 | $ | 511,000 | $ | 565,580,000 | $ | (470,039,000 | ) | $ | 96,052,000 | ||||||||||
The accompanying notes are an integral part of these condensed consolidated statements.
Abeona Therapeutics Inc. and Subsidiaries
Condensed Consolidated Statements of Cash Flows
(unaudited)(Unaudited)
| Nine Months ended September 30, | For the nine months ended September 30, | |||||||||||||||
| 2018 | 2017 | 2019 | 2018 | |||||||||||||
| Cash flows from operating activities: | ||||||||||||||||
| Net loss | $ | (36,582,000 | ) | $ | (18,869,000 | ) | $ | (59,851,000 | ) | $ | (39,192,000 | ) | ||||
| Adjustments to reconcile net loss to cash used in operating activities: | ||||||||||||||||
| Depreciation and amortization | 969,000 | 595,000 | 5,747,000 | 969,000 | ||||||||||||
| Stock option compensation expense | 7,072,000 | 3,527,000 | ||||||||||||||
| Restricted common stock expense issued to directors and employees | 516,000 | 979,000 | ||||||||||||||
| Net gain on write off of licensed technology | - | (127,000 | ) | |||||||||||||
| Stock option-based compensation expense | 5,607,000 | 7,072,000 | ||||||||||||||
| Restricted stock-based compensation expense | 348,000 | 516,000 | ||||||||||||||
| Accretion and interest on short-term investments | (1,090,000 | ) | - | |||||||||||||
| Non-cash loss on arbitration ruling on licensing agreement | 367,000 | - | ||||||||||||||
| Change in operating assets and liabilities: | ||||||||||||||||
| Receivables | (245,000 | ) | 13,000 | 66,000 | (245,000 | ) | ||||||||||
| Prepaid expenses and other current assets | 760,000 | (1,607,000 | ) | 2,148,000 | 760,000 | |||||||||||
| Other assets | 40,000 | (11,000 | ) | |||||||||||||
| Accounts payable | 7,938,000 | (1,657,000 | ) | |||||||||||||
| Deferred revenue | (2,612,000 | ) | (452,000 | ) | ||||||||||||
| Right-of-use lease assets and other assets | 623,000 | 40,000 | ||||||||||||||
| Accounts payable, accrued expenses and lease liabilities | (2,539,000 | ) | 7,936,000 | |||||||||||||
| Net cash used in operating activities | (22,144,000 | ) | (17,609,000 | ) | (48,574,000 | ) | (22,144,000 | ) | ||||||||
| Cash flows from investing activities: | ||||||||||||||||
| Capital expenditures | (8,580,000 | ) | (156,000 | ) | (6,187,000 | ) | (8,580,000 | ) | ||||||||
| Purchases of marketable securities | (94,991,000 | ) | - | |||||||||||||
| Purchases from maturities of marketable securities | 16,366,000 | - | ||||||||||||||
| Net cash used in investing activities | (87,205,000 | ) | (156,000 | ) | ||||||||||||
| Acquisition of licensed technology | (199,000 | ) | - | |||||||||||||
| Purchases of short-term investents | - | (94,991,000 | ) | |||||||||||||
| Proceeds from maturities of short-term investments | 67,308,000 | 16,366,000 | ||||||||||||||
| Net cash provided by (used in) investing activities | 60,922,000 | (87,205,000 | ) | |||||||||||||
| Cash flows from financing activities: | ||||||||||||||||
| Proceeds from exercise of $8.00 warrants | - | 5,000,000 | ||||||||||||||
| Proceeds from open market sales of common stock | 16,962,000 | - | ||||||||||||||
| Proceeds from exercise of $5.00 warrants | 3,233,000 | 52,000 | - | 3,233,000 | ||||||||||||
| Proceeds from exercise of stock options | 2,245,000 | 93,000 | 413,000 | 2,245,000 | ||||||||||||
| Net cash provided by financing activities | 5,478,000 | 5,145,000 | 17,375,000 | 5,478,000 | ||||||||||||
| Net decrease in cash, cash equivalents and restricted cash | (103,871,000 | ) | (12,620,000 | ) | ||||||||||||
| Net increase (decrease) in cash, cash equivalents and restricted cash | 29,723,000 | (103,871,000 | ) | |||||||||||||
| Cash, cash equivalents and restricted cash at beginning of period | 138,030,000 | 69,142,000 | 19,310,000 | 138,030,000 | ||||||||||||
| Cash, cash equivalents and restricted cash at end of period | $ | 34,159,000 | $ | 56,522,000 | $ | 49,033,000 | $ | 34,159,000 | ||||||||
| Supplemental disclosures: | ||||||||||||||||
| Supplemental cash flow information: | ||||||||||||||||
| Cash and cash equivalents | $ | 33,599,000 | $ | 56,522,000 | $ | 47,923,000 | $ | 33,599,000 | ||||||||
| Restricted cash | 560,000 | - | 1,110,000 | 560,000 | ||||||||||||
| Total cash, cash equivalents and restricted cash | $ | 34,159,000 | $ | 56,522,000 | $ | 49,033,000 | $ | 34,159,000 | ||||||||
| Write off of licensed asset and corresponding liability | $ | - | $ | 4,000,000 | ||||||||||||
| Shares returned in connection with arbitration ruling on licensing agreement | $ | 1,472,000 | $ | - | ||||||||||||
| Cash paid for interest | $ | 9,000 | $ | 7,000 | $ | - | $ | 9,000 | ||||||||
The accompanying notes are an integral part of these condensed consolidated statements.
Abeona Therapeutics Inc. and SubsidiariesABEONA THERAPEUTICS INC. AND SUBSIDIARIES
Notes to Condensed Consolidated Financial Statements
Three and Nine Months Ended September 30, 2018 and 2017
(unaudited)(Unaudited)
NOTE 1 – NATURE OF OPERATIONS AND SIGNIFICANT ACCOUNTING POLICIES
Background
Abeona Therapeutics Inc., a Delaware corporation (together with our subsidiaries, “we,” “our,” “Abeona” or the “Company”), is a clinical-stage biopharmaceutical company developing cellgene and genecell therapies for life-threatening rare genetic diseases. Our lead programs include EB-101, (gene-corrected skin grafts)an autologous, gene-corrected cell therapy for RDEB,recessive dystrophic epidermolysis bullosa (“RDEB”); ABO-102, (AAV-SGSH), an AAV basedadeno-associated virus (“AAV”)-based gene therapy for Sanfilippo syndrome type A (MPS IIIA)(“MPS IIIA”); and ABO-101, (AAV NAGLU), an AAV basedAAV-based gene therapy for Sanfilippo syndrome type B (“MPS IIIB.IIIB”). We also are also developing ABO-202 and ABO-201, (AAV-CLN3)which are AAV-based gene therapytherapies for juvenilethe CLN1 and CLN3 forms of Batten disease (JNCL), ABO-202 (AAV-CLN1)Disease, respectively, ABO-401 for the treatment of infantile Batten disease (INCL), EB-201cystic fibrosis, and ABO-5OX for epidermolysis bullosa (“EB”), ABO-301 (AAV-FANCC) for Fanconi anemia (“FA”) disorder and ABO-302 using a novel CRISPR/Cas9-based gene editing approach to gene therapy for rare bloodthe treatment of retinal diseases. In addition, we are developing a proprietarynext-generation AAV-based gene therapy though our novel AIM™ capsid platform and internal AAV vector platform, AIM™, for next generation product candidates.research programs. Our efforts since inception have been principally devoted to research and development, resulting in significant losses.
Basis of Presentation
The condensed consolidated balance sheet as of September 30, 2018,2019, the condensed consolidated statements of operations for the three and nine months ended September 30, 2018 and 2017, the condensed consolidated statements of stockholders’ equity for the three and nine months ended September 30, 2019 and 2018 and the condensed consolidated statements of cash flows for the nine months ended September 30, 20182019 and 2017,2018, were prepared by management without audit. In the opinion of management, all adjustments, consisting only of normal recurring adjustments, except as otherwise disclosed, necessary for the fair presentation of the financial position, results of operations, and changes in financial position for such periods, have been made.
Certain information and footnote disclosures normally included in financial statements prepared in accordance with accounting principles generally accepted in the United States of America (“U.S. GAAP”) have been condensed or omitted. It is suggested that theseThese interim financial statements should be read in conjunction with the consolidated financial statements and notes thereto included in our Annual Report on Form 10-K for the year ended December 31, 2017.2018. The results of operations for the periodperiods ended September 30, 20182019 are not necessarily indicative of the operating results that may be expected for a full year. The condensed consolidated balance sheet as of December 31, 20172018 contains financial information taken from the audited Abeona consolidated financial statements as of that date.
As of September 30, 2018,2019, we had 5,999,5446,697,980 options and 2,220,6871,820,686 warrants that were not included in the EPS calculation as their effect would be antidilutive. As of September 30, 2018, we had 5,999,544 options and 2,220,687 warrants that were not included in the earnings per share calculation as their effect would be antidilutive.
Revenue Recognition
Effective January 1, 2018, we adopted ASC 606 usingAccounting Standards Update (“ASU”) 2014-09,Revenue from Contracts with Customers, as amended (ASC 606). At year-end 2018, we determined that we should adjust the modified retrospective transition method. Theamounts originally reported for the quarters ended March 31, 2018 and June 30, 2018 to correct for an error in the determination of the cumulative effect related to the adoption of applying the standard was an increase of $3.7 million to stockholders’ equityASC 606 as of January 1, 2018. Our statementThe adjusted amounts for March 31, 2018 reflect a $2,067,000 reduction in foundation revenues and corresponding increases in the loss from operations and net loss of operations$2,067,000 and an increase in the diluted loss per share of $0.04, as compared to the originally reported amounts. The adjusted amounts for the quarterly period ended SeptemberJune 30, 2018 reflect a $543,000 reduction in foundation revenues and our balance sheet as of September 30, 2018 are presented under ASC 606, while our statement of operations forcorresponding increases in the third quarter and nine months ended September 30, 2017 and our balance sheet as of December 31, 2017 are presented under ASC 605. See below for disclosure of the impact of the adoption of ASC 606 on our statement ofloss from operations and balance sheet fornet loss of $543,000 and an increase in the quarterly period ended September 30, 2018,diluted loss per share of $0.01, as compared to the originally reported amounts.
Uses and the effectSources of changes made to our consolidated balance sheet as of January 1, 2018.Liquidity
The table below presentsfinancial statements have been prepared on a going concern basis, which assumes the cumulative effectCompany will have sufficient cash to pay its operating expenses, as and when they become payable, for a period of at least 12 months from the changes madedate the financial report was issued. Therefore, we believe it is appropriate to prepare the consolidated January 1, 2018 balance sheet due to the adoption of ASC 606.
Balance Sheet (in thousands) | December 31, 2017, As Reported Under ASC 605 | Adjustments Due to ASC 606 | January 1, 2018 As Adjusted Under ASC 606 | |||||||||
| Liabilities | ||||||||||||
| Current liabilities | ||||||||||||
| Current portion of deferred revenue | $ | 3,214 | $ | (602 | ) | $ | 2,612 | |||||
| Total current liabilities | 3,214 | (602 | ) | 2,612 | ||||||||
| Deferred revenue, net of current portion | 3,061 | (3,061 | ) | - | ||||||||
| Total liabilities | 8,668 | (3,663 | ) | 5,005 | ||||||||
| Stockholders’ Equity | ||||||||||||
| Accumulated deficit | (359,792 | ) | 3,663 | (356,129 | ) | |||||||
| Total equity | $ | 170,098 | $ | 3,663 | $ | 173,761 | ||||||
The table below presents the impact of the adoption of ASC 606financial statements on our statement of operations.a going concern basis.
| Third Quarter Ended September 30, 2018 | ||||||||||||
STATEMENT OF OPERATIONS (in thousands except per share amounts) | Under ASC 605 | Effect of ASC 606 | As Reported Under ASC 606 | |||||||||
| Revenues | ||||||||||||
| License revenues | $ | 151 | $ | (151 | ) | $ | - | |||||
| Total revenues | 1,860 | (151 | ) | 1,709 | ||||||||
| Loss from operations | $ | (16,765 | ) | $ | (151 | ) | $ | (16,916 | ) | |||
| Net loss | $ | (16,268 | ) | $ | (151 | ) | $ | (16,419 | ) | |||
| Basic and diluted loss per common share | $ | (0.34 | ) | $ | 0.00 | $ | (0.34 | ) | ||||
| Nine Months Ended September 30, 2018 | ||||||||||||
STATEMENT OF OPERATIONS (in thousands except per share amounts) | Under ASC 605 | Effect of ASC 606 | As Reported Under ASC 606 | |||||||||
| Revenues | ||||||||||||
| License revenues | $ | 452 | $ | (452 | ) | $ | - | |||||
| Total revenues | 5,578 | (452 | ) | 5,126 | ||||||||
| Loss from operations | $ | (37,094 | ) | $ | (452 | ) | $ | (37,546 | ) | |||
| Net loss | $ | (36,130 | ) | $ | (452 | ) | $ | (36,582 | ) | |||
| Basic and diluted loss per common share | $ | (0.77 | ) | $ | (0.01 | ) | $ | (0.77 | ) | |||
The table below presents the impact of the adoption of ASC 606 on our balance sheet.
| September 30, 2018 | ||||||||||||
Balance Sheet (in thousands) | Under ASC 605 | Effect of ASC 606 | As Reported Under ASC 606 | |||||||||
| Liabilities and Stockholders’ Equity | ||||||||||||
| Current liabilities | ||||||||||||
| Current portion of deferred revenue | $ | 602 | $ | (602 | ) | $ | - | |||||
| Total current liabilities | 10,933 | (602 | ) | 10,331 | ||||||||
| Deferred revenue, net of current portion | 2,609 | (2,609 | ) | - | ||||||||
| Total liabilities | 13,542 | (3,211 | ) | 10,331 | ||||||||
| Stockholders’ Equity | ||||||||||||
| Accumulated deficit | (395,922 | ) | 3,211 | (392,711 | ) | |||||||
| Total stockholders’ equity | $ | 147,034 | $ | 3,211 | $ | 150,245 | ||||||
We received upfront cash payments for licenses of our technology in years 2008-2014. The revenue was recognized straight-line over the life of the patent. Our obligation was performed at the time the license was granted. Following the revenue recognition policies in accordance with ASC 606, we decreased the accumulated deficit by $3,663,000 as of January 1, 2018 and decreased deferred revenue by the same amount.
Royalty revenues will continue to be recognized in the period of sales. Royalty revenues recognized in the third quarter of 2018 were $22,000 and for the first nine months of 2018 were $89,000.
On October 16, 2017, we announced a collaborative agreement between nine Sanfilippo foundations to provide up to approximately $13.85 million of grants to Abeona in installments for the advancement of the Company’s clinical stage gene therapies for MPS IIIA and MPS IIIB, subject to the achievement of certain milestones. As of September 30, 2018,2019, we received $5.0 million of these grants ($2.6 million in the fourth quarter 2017 and $2.4 million in the nine months of 2018) and recorded them first as deferred revenue. We recorded $2.6 million of the $3.4 million in grants as revenue in the quarter ended March 31, 2018, we recorded $0.8 million in grants as revenue in the quarter ending June 30, 2018 and we recorded $1.6 million in grants revenue in the quarter ending September 30, 2018.
We recorded revenue for Foundation Grants of $1,687,000 in the third quarter of 2018 and no revenues for the same period of 2017, an increase of $1,687,000. We recorded revenue for Foundation Grants of $5,037,000 in the first nine months of 2018 and no revenues for the same period of 2017, an increase of $5,037,000. We record revenue to match expenses for the advancement of the Company’s clinical stage gene therapies for MPS IIIA and MPS IIIB.
Restricted cash disclosure
In November 2016, the FASB issued ASU 2016-18,Statement of Cash Flows (Topic 230): Restricted Cash, requiring restricted cash and restricted cash equivalents to be included with cash and cash equivalents on the statement of cash flows when reconciling the beginning-of-period and end-of-period total amounts shown on the statement of cash flows. The guidance is effective for interim and annual periods beginning after December 15, 2017, with early adoption permitted. We adopted this standard during the first quarter of 2018. Restricted cash is now included as a component ofhad cash, cash equivalents and restricted cash on our unaudited condensed consolidated statementsshort-term investments of cash flows. Restricted cash is recorded within other non-current$47.9 million and net assets in the accompanying unaudited condensed consolidated balance sheets. The inclusion of restricted cash increased beginning balances of the unaudited condensed consolidated statements of cash flows by $560,000 and $0, respectively, and the ending balances by $560,000 and $0, respectively, for$96.1 million. For the nine months ended September 30, 20182019, we had cash outflows from operations of $48.6 million.
In early 2019, the Company implemented a multi-faceted program to seek sufficient liquidity through at least the end of 2020. This program considered the possibility of accessing additional equity funding from current or new stockholders, out-licensing technology and/or other assets, deferring and/or eliminating planned expenditures, restructuring operations and/or reducing headcount and 2017.sales of assets. In September 2019, the Company announced that it has retained Jefferies LLC as its financial advisor to assist with the review of strategic options focused on advancing the Company’s mission and maximizing stockholder value. In an effort to unlock potential additional value, the Company initiated this more formal process to explore a broad range of strategic alternatives including but not limited to the partnering of its various clinical and pre-clinical programs, or a sale or merger of the Company.
NOTE 2 – NEW ACCOUNTING STANDARD IMPLEMENTED
In February 2016, the Financial Accounting Standards Board (“FASB”) issued ASU 2016-02,Leases, as amended (“ASC 842”), which requires the recognition of lease assets and lease liabilities by lessees for those leases classified as operating leases under previous guidance. We adopted the provisions of ASC 842 effective January 1, 2019 using the cumulative-effect adjustment transition method, which applies the provisions of the standard as of the effective date without adjusting the comparative periods presented. As a result of the adoption, we recorded operating lease right-of-use assets of $8.9 million and operating lease liabilities of $8.9 million. The adoption had an immaterial impact on our net assets as of January 1, 2019. In addition, we elected the package of practical expedients permitted under the transition guidance within the new standard, which allowed us to carry forward the historical lease classification.
Additional information and disclosures required by this new standard are contained in Note 8.
NOTE 3 – SHORT-TERM INVESTMENTS
The following table summarizes the available-for-sale investments held as of September 30, 2018. There were no available-for-sale investments in prior periods.held:
| Description | Fair Value | |||
| September 30, 2018 | ||||
| U.S. government agency securities and treasuries | $ | 78,625,000 | ||
| Description | September 30, 2019 | December 31, 2018 | ||||||
| U.S. government and agency securities and treasuries | $ | - | $ | 66,218,000 | ||||
The amortized cost of the available-for-sale investments is adjusted for amortization of premiums and accretion of discounts to maturity. There were no material realized gains or losses recognized on the sale or maturity of available-for-sale investments during the three orand nine months ended September 30, 2019 and 2018.
NOTE 4 – LICENSED TECHNOLOGY
On November 4, 2018, we entered into a license agreement with REGENXBIO to obtain rights to an exclusive worldwide license (subject to certain non-exclusive rights previously granted for MPS IIIA), with rights to sublicense, to REGENXBIO’s NAV AAV9 vector for the development and commercialization of gene therapies for the treatment of MPS IIIA, MPS IIIB, CLN1 Disease and CLN3 Disease. In return for these rights, REGENXBIO received a guaranteed $20 million upfront payment, $10 million of which was paid on signing of the agreement on November 4, 2018 and $10 million of which was originally required under the agreement to be paid by November 4, 2019. In addition, REGENXBIO will receive a total of $100 million in annual fees, payable upon the second through sixth anniversaries of the agreement, $20 million of which is guaranteed and payable on November 4, 2020. REGENXBIO is also eligible to receive potential commercial milestone payments of up to $60 million as well as royalties payable in the low double digits to low teens on net sales of products incorporating the licensed intellectual property. The license is amortized over the life of the patent of eight years.
On November 1, 2019, we entered into an amendment of the original license agreement. The amended agreement replaced the $10 million payment due on November 4, 2019 with a $3 million payment due on November 4, 2019 and an additional $8 million payment due on April 1, 2020.
On August 3, 2016, we announced that we entered into an agreement (the “EB Agreement”) with EB Research Partnership (“EBRP”) and Epidermolysis Bullosa Medical Research Foundation (“EBMRF”) to collaborate on gene therapy treatments for EB. The EB Agreement became effective August 3, 2016 on the execution of two licensing agreements with The Board of Trustees of Leland Stanford Junior University (“Stanford”). On August 3, 2016, we recorded the issuance of 375,000 of our common shares to each of EBRP and EBMRF and recorded licensed technology of $2.45 million, which was being amortized over 20 years. In connection with an arbitration proceeding relating to the EB Agreement, on May 15, 2019, the arbitrator issued a decision in favor of the Company requiring the Company to cancel any and all shares of its common stock issued to EBRP and EBMRF that were still in their possession. As a result, we have recorded the return of 450,000 shares of our common stock and the reversal of the licensed technology from our financial statements. The net of these transactions resulted in a non-cash charge to expense of $367,000 recorded during the nine months ended September 30, 2019.
On May 15, 2015, we acquired Abeona Therapeutics LLC.LLC, which had an exclusive license through Nationwide Children’s Hospital to the AB-101 and AB-102 patent portfolios for developing treatments for patients with Sanfilippo Syndrome Type A and Type B. The license is amortized over the life of the license of 20 years.
On August 3, 2016, we announced we entered into the EB Agreement with EBRP and EBMRF to collaborate on gene therapy treatments for EB.
We also entered into a license with Stanford for the AAV-based gene therapy EB-201 (AAV DJ COL7A1) technology, and we intend to perform preclinical development and perform clinical trials of a gene therapy treatment for EB based upon such in-licensed technology. EB-201 (AAV DJ COL7A1) is a pre-clinical candidate targeting a novel, AAV-mediated gene editing and delivery approach (known as homologous recombination) to correct gene mutations in skin cells (keratinocytes) for patients with RDEB. The licenses are amortized over the life of the license of 20 years.
Licensed technology consists of the following (in thousands):following:
| September 30, 2018 | December 31, 2017 | |||||||||||||||
| Gross carrying value | Accumulated amortization | Gross carrying value | Accumulated Amortization | |||||||||||||
| Amortizable intangible assets Licensed technology | $ | 4,608 | $ | 891 | $ | 4,608 | $ | 631 | ||||||||
September 30, 2019 | December 31, 2018 | |||||||
| Licensed technology | $ | 42,606,000 | $ | 44,859,000 | ||||
| Less accumulated amortization | 5,135,000 | 1,817,000 | ||||||
| Licensed technology, net | $ | 37,471,000 | $ | 43,042,000 | ||||
The aggregate estimated amortization expense for intangible assets remaining as of September 30, 2019 is as follows:
| 2019, remainder | $ | 1,293,000 | ||
| 2020 | 5,167,000 | |||
| 2021 | 5,167,000 | |||
| 2022 | 5,167,000 | |||
| 2023 | 5,167,000 | |||
| Thereafter | 15,510,000 | |||
| Total | $ | 37,471,000 |
Amortization expense related to intangible assets totaledon licensed technology was $1,293,000 and $3,931,000 for the three and nine months ended September 30, 2019, respectively, and $87,000 and $260,000 for the three and nine months ended September 30, 2018, respectively, and totaled $87,000 and $448,000 for the three and nine months ended September 30, 2017, respectively. The aggregate estimated amortization expense for intangible assets remaining as of September 30, 2018 is as follows (in thousands):
| 2018 | $ | 86 | |||
| 2019 | 346 | ||||
| 2020 | 346 | ||||
| 2021 | 346 | ||||
| 2022 | 346 | ||||
| over 5 years | 2,247 | ||||
| Total | $ | 3,717 |
NOTE 5 – RESTRICTED CASH
Restricted cash, which is reported within other assets and restricted cash on the condensed consolidated balance sheets, consists of cash and cash equivalents held as collateral for a corporate credit card and office space in New York. As such, the cash and cash equivalents are restricted in use.
NOTE 6 – FAIR VALUE MEASUREMENTS
We calculate the fair value of our assets and liabilities that qualify as financial instruments and include additional information in the notes to the consolidated financial statements when the fair value is different than the carrying value of these financial instruments. The estimated fair value of receivables, prepaidsprepaid expenses, other assets, accounts payable, accrued expenses, payable to licensor and other and accounts payabledeferred revenue approximate their carrying amounts due to the relatively short maturity of these instruments.
U.S. GAAP defines fair value as the exchange price that would be received for an asset or paid to transfer a liability (an exit price) in the principal or most advantageous market for the asset or liability in an orderly transaction between market participants at the measurement date. This guidance establishes a three-level fair value hierarchy that prioritizes the inputs used to measure fair value. The hierarchy requires entities to maximize the use of observable inputs and minimize the use of unobservable inputs. The three levels of inputs used to measure fair value are:are as follows:
| Level 1 – Quoted prices in active markets for identical assets or liabilities. |
| Level 2 – Observable inputs other than quoted prices included in Level 1, such as quoted prices for similar assets and liabilities in active markets; quoted prices for identical or similar assets and liabilities in markets that are not active; or other inputs that are observable or can be corroborated by observable market data. |
| Level 3 – Unobservable inputs that are supported by little or no market activity and that are significant to the fair value of the assets and liabilities. This includes certain pricing models, discounted cash flow methodologies and similar valuation techniques that use significant unobservable inputs. |
The guidance requires an entity to maximize the use of observable inputs and minimize the use of unobservable inputs when measuring fair value.
We have segregated all financial assets and liabilities that are measured at fair value on a recurring basis (at least annually) into the most appropriate level within the fair value hierarchy based on the inputs used to determine the fair value at the measurement date in the table below.
Financial assets and liabilities measured at fair value on a non-recurringrecurring and recurringnon-recurring basis as of September 30, 20182019 and December 31, 20172018 are summarized below:
| (in thousands) | ||||||||||||||||||||||||||||||||||||||||
| Description | As of September 30, 2018 | Level 1 | Level 2 | Level 3 | Total Gains (Losses) | September 30, 2019 | Level 1 | Level 2 | Level 3 | Total Gains/(Losses) | ||||||||||||||||||||||||||||||
| Non-recurring | ||||||||||||||||||||||||||||||||||||||||
| Assets: | ||||||||||||||||||||||||||||||||||||||||
| Licensed technology (net) | $ | 3,717 | $ | - | $ | - | $ | 3,717 | $ | 260 | ||||||||||||||||||||||||||||||
| Licensed technology, net | $ | 37,471,000 | $ | - | $ | - | $ | 37,471,000 | $ | (367,000 | ) | |||||||||||||||||||||||||||||
| Goodwill | 32,466 | - | - | 32,466 | - | 32,466,000 | - | - | 32,466,000 | - | ||||||||||||||||||||||||||||||
| Recurring | - | |||||||||||||||||||||||||||||||||||||||
| Marketable securities | - | - | 49,530 | - | ||||||||||||||||||||||||||||||||||||
| (in thousands) | ||||||||||||||||||||
| Description | As of December 31, 2017 | Level 1 | Level 2 | Level 3 | Total Gains (Losses) | |||||||||||||||
| Non-recurring | ||||||||||||||||||||
| Assets: | ||||||||||||||||||||
| Licensed technology (net) | $ | 3,977 | $ | - | $ | - | $ | 3,977 | $ | 127 | ||||||||||
| Goodwill | 32,466 | - | - | 32,466 | - | |||||||||||||||
| Recurring | ||||||||||||||||||||
| Liabilities: | ||||||||||||||||||||
| Contingent consideration | $ | - | $ | - | $ | - | $ | - | $ | 1,391 | ||||||||||
| Description | December 31, 2018 | Level 1 | Level 2 | Level 3 | Total Gains/(Losses) | |||||||||||||||
| Recurring | ||||||||||||||||||||
| Assets: | ||||||||||||||||||||
| Short-term investments | $ | 66,218,000 | $ | - | $ | 66,218,000 | $ | - | $ | - | ||||||||||
| Non-recurring | ||||||||||||||||||||
| Assets: | ||||||||||||||||||||
| Licensed technology, net | $ | 43,042,000 | $ | - | $ | - | $ | 43,042,000 | $ | - | ||||||||||
| Goodwill | 32,466,000 | - | - | 32,466,000 | - | |||||||||||||||
For the three and nine months ended September 30, 2018, we recognized stock-based option compensation expense of $2,499,000 and $7,072,000, respectively. For the three and nine months ended September 30, 2017, we recognized stock-based option compensation expense of $792,000 and $3,527,000, respectively.
NOTE 7 – STOCK-BASED COMPENSATION
The following table summarizes stock-based option compensation for the three and nine months ended September 30, 2018 and 2017:
Three months ended | Nine months ended | |||||||||||||||
| September 30, | September 30, | |||||||||||||||
| 2018 | 2017 | 2018 | 2017 | |||||||||||||
| Research and development | $ | 1,012,000 | $ | 394,000 | $ | 2,756,000 | $ | 1,118,000 | ||||||||
| General and administrative | 1,487,000 | 398,000 | 4,316,000 | 2,409,000 | ||||||||||||
| Stock-based option compensation expense included in operating expense | $ | 2,499,000 | $ | 792,000 | $ | 7,072,000 | $ | 3,527,000 | ||||||||
For the three and nine months ended September 30, 2018, we granted 157,000 and 1,026,800 stock options, respectively, and for the three and nine months ended September 30, 2017, we granted 0 and 185,000 stock options, respectively.
For the three months ended September 30, 2018, the fair value of options was estimated at the date of grant using the Black-Scholes option pricing model with the following weighted average assumptions: dividend yield of 0%; volatility of 109%; risk-free interest rate of 2.78%; and expected lives of 5.0 years. The weighted average fair value of options granted was $11.44 per share. The weighted average grant date fair value is $11.44 and the weighted average exercise price is $14.45.
For the nine months ended September 30, 2018, the fair value of options was estimated at the date of grant using the Black-Scholes option pricing model with the following weighted average assumptions: dividend yield of 0%; volatility of 109%; risk-free interest rate of 2.54%; and expected lives of 5.0 years. The weighted average fair value of options granted was $11.36 per share. The weighted average grant date fair value is $11.36 and the weighted average exercise price is $14.38.
For the three and nine months ended September 30, 2018, we recognized restricted common stock compensation expense of $172,000 and $516,000, respectively. For the three and nine months ended September 30, 2017, we recognized restricted stock compensation expense of $293,000 and $979,000, respectively.
The following table summarizes restricted common stockoption-based compensation expense for the three and nine months ended September 30, 20182019 and 2017:2018:
| Three months ended | Nine months ended | For the three months ended September 30, | For the nine months ended September 30, | |||||||||||||||||||||||||||||
| September 30, | September 30, | 2019 | 2018 | 2019 | 2018 | |||||||||||||||||||||||||||
| Research and development | $ | 972,000 | $ | 1,012,000 | $ | 3,013,000 | $ | 2,756,000 | ||||||||||||||||||||||||
| General and administrative | 854,000 | 1,487,000 | 2,594,000 | 4,316,000 | ||||||||||||||||||||||||||||
| Stock-based compensation expense included in operating expense | 1,826,000 | 2,499,000 | 5,607,000 | 7,072,000 | ||||||||||||||||||||||||||||
| 2018 | 2017 | 2018 | 2017 | |||||||||||||||||||||||||||||
| General and administrative | $ | 172,000 | $ | 293,000 | $ | 516,000 | $ | 979,000 | ||||||||||||||||||||||||
| Restricted stock compensation expense included in operating expense | $ | 172,000 | $ | 293,000 | $ | 516,000 | $ | 979,000 | ||||||||||||||||||||||||
| Total stock-based compensation expense | 1,826,000 | 2,499,000 | 5,607,000 | 7,072,000 | ||||||||||||||||||||||||||||
| Tax benefit | - | - | - | - | ||||||||||||||||||||||||||||
| Stock-based compensation expense, net of tax | $ | 1,826,000 | $ | 2,499,000 | $ | 5,607,000 | $ | 7,072,000 | ||||||||||||||||||||||||
We estimate the fair value of each option award on the date of grant using the Black-Scholes option valuation model. We then recognize the grant date fair value of each option as compensation expense ratably using the straight-line attribution method over the service period (generally the vesting period). The Black-Scholes model incorporates the following assumptions:
| Expected volatility – we estimate the volatility of our share price at the date of grant using a “look-back” period which coincides with the expected term, defined below. We believe using a “look-back” period which coincides with the expected term is the most appropriate measure for determining expected volatility. | ||
| ● | Expected term – we estimate the expected term using the “simplified” method, as outlined in Staff Accounting Bulletin No. 107, “Share-Based Payment.” | |
| ● | Risk-free interest rate – we estimate the risk-free interest rate using the U.S. Treasury yield curve for periods equal to the expected term of the options in effect at the time of grant. | |
| ● | Dividends – we use an expected dividend yield of zero because we have not declared or paid a cash dividend, nor do we have any plans to declare a dividend. |
We used the following weighted-average assumptions to estimate the fair value of the options granted for the periods indicated:
| For the three months ended September 30, | For the nine months ended September 30, | |||||||||||||||
| 2019 | 2018 | 2019 | 2018 | |||||||||||||
| Expected volatility | 103 | % | 109 | % | 108 | % | 109 | % | ||||||||
| Expected term | 6.25 years | 5.00 years | 5.09 years | 5.00 years | ||||||||||||
| Risk-free interest rate | 1.83 | % | 2.78 | % | 2.21 | % | 2.54 | % | ||||||||
| Expected dividend yield | 0 | % | 0 | % | 0 | % | 0 | % | ||||||||
The following table summarizes the options granted for the periods indicated:
| For the three months ended September 30, | For the nine months ended September 30, | |||||||||||||||
| 2019 | 2018 | 2019 | 2018 | |||||||||||||
| Options granted | 105,600 | 157,000 | 1,490,490 | 1,026,800 | ||||||||||||
| Weighted-average: | ||||||||||||||||
| Exercise price | $ | 2.58 | $ | 14.45 | $ | 6.53 | $ | 14.38 | ||||||||
| Grant date fair value | $ | 2.09 | $ | 11.44 | $ | 5.14 | $ | 11.36 | ||||||||
The following table summarizes restricted common stock-based compensation expense for the three and nine months ended September 30, 2019 and 2018:
| For the three months ended September 30, | For the nine months ended September 30, | |||||||||||||||
| 2019 | 2018 | 2019 | 2018 | |||||||||||||
| Research and development | $ | 66,000 | $ | - | $ | 66,000 | $ | - | ||||||||
| General and administrative | 32,000 | 172,000 | 282,000 | 516,000 | ||||||||||||
| Stock-based compensation expense included in operating expense | 98,000 | 172,000 | 348,000 | 516,000 | ||||||||||||
| Total stock-based compensation expense | 98,000 | 172,000 | 348,000 | 516,000 | ||||||||||||
| Tax benefit | - | - | - | - | ||||||||||||
| Stock-based compensation expense, net of tax | $ | 98,000 | $ | 172,000 | $ | 348,000 | $ | 516,000 | ||||||||
We did not grant anygranted 376,625 shares of restricted common stock to directors or employees during the three and nine months ended September 30, 20182019. We did not grant any restricted common stock to employees during the three and nine months ended September 30, 2018.
NOTE 8 – OPERATING LEASES
We lease space under non-cancelable operating leases for manufacturing and laboratory facilities and administrative offices in Cleveland as well as administrative offices in New York. The leases do not have significant rent escalation, holidays, concessions, material residual value guarantees, material restrictive covenants or contingent rent provisions. Our leases include both lease (e.g., fixed payments including rent, taxes, and insurance costs) and non-lease components (e.g., common-area or other maintenance costs) which are accounted for as a single lease component as we have elected the practical expedient to group lease and non-lease components for all leases. We also lease office space in Madrid, Spain as well as certain office equipment under operating leases, which have a non-cancelable lease term of less than one year and therefore, we have elected the practical expedient to exclude these short-term leases from our right-of-use assets and lease liabilities.
Most leases include one or more options to renew. The exercise of lease renewal options is typically at our sole discretion; therefore, the majority of renewals to extend the lease terms are not included in our right-of-use assets and lease liabilities as they are not reasonably certain of exercise. We regularly evaluate the renewal options and when they are reasonably certain of exercise, we include the renewal period in our lease term.
As our leases do not provide an implicit rate, we use our incremental borrowing rate based on the information available at the lease commencement date in determining the present value of the lease payments.
Components of lease cost are as follows:
Three months ended September 30, 2019 | Nine months ended September 30, 2019 | |||||||
| Operating lease cost | $ | 434,000 | $ | 1,157,000 | ||||
| Variable lease cost | $ | 82,000 | $ | 241,000 | ||||
| Short-term lease cost | $ | 32,000 | $ | 113,000 | ||||
The following table presents information about the amount and timing of cash flows arising from operating leases as of September 30, 2019:
| Maturity of lease liabilities: | ||||
| 2019, remainder | $ | 422,000 | ||
| 2020 | 1,699,000 | |||
| 2021 | 1,713,000 | |||
| 2022 | 1,727,000 | |||
| 2023 | 1,741,000 | |||
| Thereafter | 3,667,000 | |||
| Total undiscounted operating lease payments | 10,969,000 | |||
| Less: imputed interest | 2,791,000 | |||
| Present value of operating lease liabilities | $ | 8,178,000 | ||
| Balance sheet classification: | ||||
| Current portion of lease liability | $ | 1,696,000 | ||
| Long-term lease liability | 6,482,000 | |||
| Total operating lease liabilities | $ | 8,178,000 | ||
| Other information: | ||||
| Weighted-average remaining lease term for operating leases | 76 months | |||
| Weighted-average discount rate for operating leases | 9.6 | % | ||
NOTE 9 – COMMITMENTS AND CONTINGENCIES
On January 18, 2018, William Mahon, a Company stockholder, served a demand upon the Company’s board of directors (the “Board”) pursuant to Section 220 of the Delaware General Corporation Law (the “Demand”) seeking to inspect certain of the Company’s books and records. Generally, the Demand’s stated purpose was to investigate allegedly excessive compensation awarded to non-employee Board members for the fiscal years 2015–2017. The Board denied the allegations in the Demand, and agreed to provide limited books and records to Mahon. On September 17, 2018, another Company stockholder, Francisco Dos Ramos, filed a stockholder derivative complaint in the Delaware Chancery Court (the “Dos Ramos Action”) against Steven Rouhandeh, Frank Carsten Thiel, Mark Alvino, Stefano Buono, Stephen Howell, Richard Van Duyne, and Todd Wider as defendants, and the Company as nominal defendant (the “Dos Ramos Defendants”). Dos Ramos generally alleged that the Board breached its fiduciary duties, were unjustly enriched, and committed corporate waste by approving allegedly excessive compensation to non-employee Board members for the fiscal years 2015–2017. Dos Ramos generally sought disgorgement of the allegedly improper payments to the Board, money damages, an order requiring corporate governance reforms, costs and attorneys’ fees. On November 28, 2018, Mahon filed a stockholder derivative complaint (the “Mahon Action”) in the United States District Court for the District of Delaware (the “District Court”) against Mark Ahn, Mark Alvino, Jeffrey Davis, Stephen Howell, Todd Wider, and Steven Rouhandeh, as defendants, and the Company as a nominal defendant (“Mahon Defendants”). The allegations in the Mahon Action were substantially similar to those set forth in his Demand, as well as those in the Dos Ramos Action. Mahon generally sought the disgorgement of the allegedly improper payments to the Board, a constructive trust, money damages, costs and attorneys’ fees. On December 6, 2018, Mahon and the Mahon Defendants filed a joint motion for preliminary approval of settlement, along with a stipulation of settlement (the “Stipulation”) intending to settle all claims asserted in the Mahon Action.
On January 8, 2019, the District Court approved the parties’ notice of settlement, enjoining all Company stockholders from commencing or further prosecuting any claims asserted in the Mahon Action, and scheduled a settlement approval hearing for May 1, 2019. On January 25, 2019, the Chancery Court entered an order staying the Dos Ramos Action until May 8, 2019—one week after the May 1, 2019 settlement hearing in the Mahon Action. On May 2, 2019 the District Court entered an Order and Final Judgment approving the Stipulation. On August 6, 2019, the plaintiff in the Dos Ramos Action filed a voluntary notice of dismissal. On August 7, 2019, the Chancery Court entered an order of dismissal.
On October 22, 2018, EB Research Partnership, Inc. (“EBRP”) served upon the Company a Request for Arbitration (the “Request”), alleging that the Company was in breach of an Agreement executed in July 2016 (the “Agreement”) between and among the Company, EBRP, and Epidermolysis Bullosa Medical Research Foundation (“EBMRF” and together with EBRP, “Claimants”). EBRP alleged that Abeona had refused to lift trading restrictions on certain shares of Abeona common stock issued to EBRP, purportedly in breach of the Agreement. On November 21, 2018, the Company filed an action in the United States District Court for the Southern District of New York seeking a declaration that it was not required to arbitrate its dispute with EBRP on the basis that the Agreement was void for lack of consideration. On February 4, 2019, the court granted Claimants’ motion to compel arbitration. EBMRF was subsequently joined as a party to the arbitration. The parties submitted briefs to the arbitrator on March 18 and April 18, 2019. On May 15, 2019, the arbitrator issued a decision in favor of the Company (the “Final Award”). Specifically, the Final Award provides that the Agreement is void for lack of consideration; that Claimants fraudulently induced Abeona to enter into the Agreement; that Claimants cannot enforce the Agreement; that Claimants are not entitled to any relief under the Agreement; that, in view of their status as charitable organizations, Claimants would not be required to repay to Abeona the value of Abeona common stock they already sold; that the Company shall cancel any and all shares of Abeona common stock issued to Claimants that were still in Claimants’ possession; and that, as the losing parties, Claimants must bear the costs and expenses of the arbitration and Abeona’s costs and expenses.
| 14 |
| ITEM 2. |
OVERVIEW
Abeona Therapeutics Inc., a Delaware corporation (together with our subsidiaries, “we,” “our,” “Abeona” or the “Company”), is a clinical-stage biopharmaceutical company developing gene and cell therapies for life-threatening rare genetic diseases. Our lead programs include EB-101, an autologous, gene-corrected cell therapy for recessive dystrophic epidermolysis bullosa (“RDEB”); ABO-102, an adeno-associated virus (“AAV”)-based gene therapy for Sanfilippo syndrome type A (“MPS IIIA”); and ABO-101, an AAV-based gene therapy for Sanfilippo syndrome type B (“MPS IIIB”). We also are developing ABO-202 and ABO-201, which are AAV-based gene therapies for the CLN1 and CLN3 forms of Batten Disease, respectively, ABO-401 for the treatment of cystic fibrosis, and ABO-5OX for the treatment of retinal diseases. In addition, we are developing next-generation AAV-based gene therapies though our novel AIM™ capsid platform and internal AAV vector research programs. We believe our product candidates are eligible for orphan drug designation, breakthrough therapy designation, or other expedited review processes in the U.S., Europe or Japan. Our pipeline includes five product candidates for which we hold several U.S. and EU regulatory designations:
Our robust and diverse pipeline features early-stage and late-stage candidates with the potential to transform the treatment of devastating genetic diseases, and we are conducting clinical trials in the U.S. and abroad.
Our Mission and Strategy
Abeona is at the forefront of gene and cell therapy research and development. We are a fully-integrated company featuring therapies in clinical development, in-house manufacturing facilities, a robust pipeline, and scientific, clinical, and commercial leadership. We see our mission as working to create, develop, manufacture and deliver gene and cell therapies for people impacted by serious diseases. We partner with leading academic researchers, patient advocacy organizations and caregivers to develop therapies that address the underlying cause of a broad spectrum of rare genetic diseases for which no effective treatment options exist today.
Since our last fiscal year, we made progress toward fulfilling our goal of harnessing the promise of genetic medicine to transform the lives of people impacted by serious diseases and redefining the standard of care through gene and cell therapies. Our strategy to achieve this goal consists of:
Advancing our Clinical Gene and Cell Therapy Programs and Research and Development with a Focus on Rare and Orphan Diseases.
We have four programs in clinical development—EB-101, ABO-101, ABO-102 and ABO-202—and a pipeline of additional earlier stage programs. Through our gene and cell therapy expertise in research and development, we are positioned to introduce meaningful therapeutics to transform the standard of care in devastating diseases and establish our leadership position in the field.
Applying Novel Next-Generation AIM™ Capsid Technology to Develop New In-Vivo Gene Therapies.
We are not currentlyresearching and developing a next-generation of AAV-based gene therapy using our novel capsids developed from the AIM™ Capsid Technology Platform and additional Company invented AAV capsids. We aim to continue to develop chimeric AAV capsids capable of improved tissue targeting for various indications and potentially evading immunity to wildtype AAV vectors.
Establishing Leadership Position in Commercial-Scale Gene and Cell Therapy Manufacturing.
We established current Good Manufacturing Practice (“cGMP”), clinical-scale manufacturing capabilities for gene-corrected cell therapy and AAV-based gene therapies in our state-of-the-art Cleveland, OH facility. We believe that our platform provides us with distinct advantages, including flexibility, scale, reliability, and the potential for reduced development risk, cost, and faster times to market. We have focused on establishing internal Chemistry, Manufacturing and Controls (“CMC”) capabilities that drive value for our organization through process development, assay development and manufacturing. We have also deployed robust quality systems governing all aspects of product lifecycle from preclinical through commercial stage.
Establishing Additional Gene and Cell Therapy Franchises and Adjacencies through In-Licensing and Strategic Partnerships.
We seek to be the partner of choice in rare disease and have closely collaborated with leading academic institutions, key opinion leaders, patient foundations and industry partners to generate novel intellectual property, accelerate research and development, and understand the needs of patients and their families.
Maintaining and Growing IP Portfolio.
We strive to have a leading intellectual property portfolio. To that end, we seek patent rights for various aspects of our programs, including vector engineering and construct design, our production process, and all features of our clinical products including composition of matter and method of administration and delivery. We expect to continue to expand our intellectual property portfolio by aggressively seeking patent rights for promising aspects of our product engine and product candidates.
| 16 |
RESULTS OF OPERATIONS FOR THREE MONTHS ENDED SEPTEMBER 30, 2019 COMPARED TO THREE MONTHS ENDED SEPTEMBER 30, 2018
Foundation revenues relate to a collaborative agreement between nine Sanfilippo foundations and us to provide up to approximately $13.9 million of grants to us in installments for the advancement of our clinical stage gene therapies for MPS IIIA and MPS IIIB, subject to any material pending legal proceedings.the achievement of certain milestones. We have received $5.7 million of such grants cumulatively as of September 30, 2019. The cash received upfront from the foundations is deferred on the condensed consolidated balance sheet until the costs of the activities as outlined in the manufacturing and clinical work plan are incurred by installment as outlined in the agreement with the foundations. As a result, we record foundation revenues to match the costs of the activities by installment performed under the collaborative agreement. Our foundation revenue was $0 in the third quarter of 2019 and $1.7 million in the third quarter of 2018. We did not record foundation revenue in the third quarter of 2019 since we have previously recognized revenue up to the amount of cash received to date by installment performed.
We recorded royalty revenue for MuGard of $0 in the third quarter of 2019 and $0.1 million in the third quarter of 2018. We licensed MuGard to AMAG Pharmaceuticals, Inc. (“AMAG”) and Norgine B.V. (“Norgine”).
Total research and development spending for the third quarter of 2019 was $10.9 million, as compared to $13.2 million for the same period of 2018, a decrease of $2.3 million. The decrease in expenses was primarily due to decreased clinical and development work ($3.0 million) as we carefully reviewed third-party services contracts and delayed activities for certain clinical programs, partially offset by increased salary and related costs ($0.8 million) from the hiring of additional scientific staff.
Total general and administrative expenses were $4.7 million for the third quarter of 2019, as compared to $5.0 million for the same period of 2018, a decrease of $0.3 million. The decrease in expenses was primarily due to:
| ● | decreased recruiting costs ($0.4 million); and | |
| ● | decreased professional fees ($0.2 million); partially offset by | |
| ● | increased office rent costs ($0.4 million); and | |
| ● | increased net other general and administrative expenses ($0.5 million). |
Depreciation and amortization were $2.0 million for the third quarter of 2019, as compared to $0.5 million for the same period in 2018, an increase of $1.5 million. The increase was driven by increased amortization expense of $1.2 million resulting primarily from the amortization of the cost of the REGENXBIO license, which we entered into in November 2018, and increased depreciation expense of $0.3 million resulting primarily from the build-out of our production facility in Cleveland, Ohio and, to a much lesser extent, the build-out of our corporate offices in New York, New York.
Net loss for the third quarter of 2019 was $17.4 million, or a $0.35 basic and diluted loss per common share as compared to a net loss of $16.4 million, or a $0.34 basic and diluted loss per common share, for the same period in 2018.
RESULTS OF OPERATIONS FOR NINE MONTHS ENDED SEPTEMBER 30, 2019 COMPARED TO NINE MONTHS ENDED SEPTEMBER 30, 2018
Our foundation revenue was $0 for the first nine months of 2019 and $2.4 million for the same period of 2018.
We recorded royalty revenue for MuGard of $0 for the first nine months of 2019 and $0.1 million for the same period of 2018. We licensed MuGard to AMAG and Norgine.
Total research and development spending for the first nine months of 2019 was $39.0 million, as compared to $29.2 million for the same period of 2018, an increase of $9.8 million. The increase in expenses was primarily due to:
| ● | increased clinical and development work for other gene therapy products ($6.1 million); and | |
| ● | increased salary and related costs ($4.1 million) from the hiring of additional clinical, regulatory, manufacturing and quality staff; partially offset by | |
| ● | decreases in other research and development costs ($0.4 million). |
Total general and administrative expenses were $16.0 million for the first nine months of 2019, as compared to $12.5 million for the same period of 2018, an increase of $3.5 million. The increase in expenses was primarily due to:
| ● | increased professional fees ($1.4 million); | |
| ● | increased office rent costs ($1.3 million); and | |
| ● | increased net other general and administrative expenses ($0.8 million). |
Depreciation and amortization were $5.7 million for the first nine months of 2019, as compared to $1.0 million for the same period in 2018, an increase of $4.7 million. The increase was driven by increased amortization expense of $3.6 million resulting primarily from the amortization of the cost of the REGENXBIO license, which we entered into in November 2018, and increased depreciation expense of $1.1 million resulting primarily from the build-out of our production facility in Cleveland, Ohio and, to a much lesser extent, the build-out of our corporate offices in New York, New York.
Net loss for the first nine months of 2019 was $59.9 million, or a $1.22 basic and diluted loss per common share as compared to a net loss of $39.2 million, or a $0.83 basic and diluted loss per common share, for the same period in 2018.
LIQUIDITY AND CAPITAL RESOURCES
We have historically funded our operations primarily through sales of equity securities and, to a significantly lesser extent, foundation grants and licensing agreements. Our principal sources of liquidity are cash, cash equivalents and short-term investments. The Company believes that it has access to sufficient resources to fund business operations for the next 12 months.
As of September 30, 2019 and December 31, 2018, our cash, cash equivalents and short-term investments were $47.9 million and $85.0 million, respectively. As of September 30, 2019 and December 31, 2018, our working capital was $29.4 million and $68.5 million, respectively. The decrease in working capital during the nine months ended September 30, 2019 resulted primarily from $48.6 million of cash used for operating activities and $6.2 million for capital expenditures, partially offset by $17.0 million of proceeds from open market sales of common stock.
In early 2019, the Company implemented a multi-faceted program to seek sufficient liquidity through at least the end of 2020. This program includes the possibility of accessing additional equity funding from current or new stockholders, out-licensing technology and/or other assets, deferring and/or eliminating planned expenditures, restructuring operations and/or reducing headcount, and sales of assets. In September 2019, the Company announced that it has retained Jefferies LLC as its financial advisor to assist with the review of strategic options focused on advancing the Company’s mission and maximizing stakeholder value. The Company initiated this more formal process to explore a broad range of strategic alternatives, including, but not limited to, the partnering of its various clinical and pre-clinical programs, or a sale or merger of the Company, in an effort to unlock the potential of those assets.
On November 5,4, 2018, we announcedentered into a license agreement with REGENXBIO Inc. Under the terms of the agreement, REGENXBIO has granted Abeonato obtain rights to an exclusive worldwide license (subject to certain non-exclusive rights previously granted for MPS IIIA), with rights to sublicense, to REGENXBIO’s NAV AAV9 vector for the development and commercialization of gene therapies for the treatment of MPS IIIA, MPS IIIB, CLN1 Disease and CLN3 Disease. In return for these rights, REGENXBIO will receivereceived a guaranteed $20 million upfront payment, $10 million of which will bewas paid uponon signing of the agreement on November 4, 2018 and $10 million of which willwas originally required under the agreement to be paid within 12 months of the effective date.by November 4, 2019. In addition, REGENXBIO will receive a total of $100 million in annual fees, payable upon the second through sixth anniversaries of the agreement, $20 million of which is guaranteed.guaranteed and payable on November 4, 2020. REGENXBIO is also eligible to receive potential commercial milestone payments of up to $60 million. REGENXBIO will also receivemillion as well as royalties payable in the low double-digit royaltiesdouble digits to low teens on net sales of products incorporating the licensed intellectual property.
On November 1, 2019, we entered into an amendment of the original license agreement. The amended agreement replaced the $10 million payment due on November 4, 2019 with a $3 million payment due on November 4, 2019 and an additional $8 million payment due on April 1, 2020.
On August 17, 2018, we entered into an open market sale agreement with Jefferies LLC. Pursuant to the terms of this agreement, we may sell from time to time, through Jefferies LLC, shares of our common stock for an aggregate sales price of up to $150 million. Any sales of shares pursuant to this agreement will be made under our effective “shelf” registration statement on Form S-3 that is on file with and has been declared effective by the SEC. We sold 3,086,950 shares of our common stock under this agreement and received $17.0 million of proceeds during the nine months ended September 30, 2019.
Since our inception, we have incurred negative cash flows from operations and have expended, and expect to continue to expend, substantial funds to complete our planned product development efforts. Since inception, our expenses have significantly exceeded revenues, resulting in an accumulated deficit of $470.0 million as of September 30, 2019. We have not been profitable since inception and to date have received limited revenues from the sale of products. We expect to incur losses for the next several years as we continue to invest in product research and development, preclinical studies, clinical trials and regulatory compliance and cannot provide assurance that we will ever be able to generate sufficient product sales or royalty revenue to achieve profitability on a sustained basis, or at all.
If we raise additional funds by selling additional equity securities, the relative equity ownership of our existing investors will be diluted and the new investors could obtain terms more favorable than previous investors. If we raise additional funds through collaborations, strategic alliances or licensing arrangements with third parties, we may have to relinquish valuable rights to our technologies, future revenue streams, research programs, or product candidates or grant licenses on terms that may not be favorable to us. If we are unable to raise additional funds through equity or debt financing when needed, we may be required to delay, limit or terminate our product development programs or any future commercialization efforts or grant rights to develop and market product candidates to third parties that we would otherwise prefer to develop and market ourselves.
We plan to expend substantial funds to conduct research and development programs, expand our manufacturing capabilities and conduct preclinical studies and clinical trials of potential products, including research and development with respect to our acquired and developed technology. Our future capital requirements and adequacy of available funds will depend on many factors, including:
| ● | the successful development and commercialization of our gene and cell therapy and other product candidates; | |
| ● | the ability to establish and maintain collaborative arrangements with corporate partners for the research, development and commercialization of products; | |
| ● | continued scientific progress in our research and development programs; | |
| ● | the magnitude, scope and results of preclinical testing and clinical trials; | |
| ● | the costs involved in filing, prosecuting and enforcing patent claims; | |
| ● | the costs involved in conducting clinical trials; | |
| ● | competing technological developments; | |
| ● | the cost of manufacturing and scale-up; | |
| ● | the ability to establish and maintain effective commercialization arrangements and activities; and | |
| ● | successful regulatory filings. |
Due to uncertainties and certain risks described in our most recent Form 10-K, including those relating to our ability to successfully commercialize our product candidates, our ability to obtain necessary additional capital to fund operations in the future, our ability to successfully manufacture our products and our product candidates in clinical quantities or for commercial purposes, government regulation to which we are subject, the uncertainty associated with preclinical and clinical testing, intense competition that we face, market acceptance of our products, the potential necessity of licensing technology from third parties and protection of our intellectual property, it is not possible to reliably predict future spending or time to completion by project or product category or the period in which material net cash inflows from significant projects are expected to commence. If we are unable to timely complete a particular project, our research and development efforts could be delayed or reduced, our business could suffer depending on the significance of the project and we might need to raise additional capital to fund operations, as discussed in the risk factors in our most recent Form 10-K, including those relating to the uncertainty of the success of our research and development activities and our ability to obtain necessary additional capital to fund operations in the future. As discussed in such risk factors, delays in our research and development efforts and any inability to raise additional funds could cause us to eliminate one or more of our research and development programs.
In September 2019, we received a clinical hold letter from the FDA clarifying that the FDA will not provide approval for us to begin our planned phase III clinical trial for EB-101 until we submit to the FDA additional data points on transport stability of EB-101 to clinical sites. We have worked closely with the FDA to address and narrow open CMC items including this one item identified in the FDA clinical hold letter. However, we cannot predict whether or when the FDA will lift the clinical hold with respect to the Company’s planned phase III clinical trial for patients with RDEB.
We plan to continue our policy of investing any available funds in certificates of deposit, money market funds, government securities and/or investment-grade, interest-bearing securities. We do not invest in derivative financial instruments.
OFF-BALANCE SHEET ARRANGEMENTS
We did not have, during the periods presented, and we do not currently have, any off-balance sheet arrangements, as defined under applicable SEC rules.
| ITEM 3. | QUANTITATIVE AND QUALITATIVE DISCLOSURES ABOUT MARKET RISK |
Our business and financial results are not materially affected by fluctuations in currency exchange rates or interest rates. We do not use derivative financial instruments for trading or speculative purposes.
Interest Rate Risk
Our exposure to market risk for changes in interest rates relates to our investment portfolio. Our investment strategy is focused on preserving capital and supporting our liquidity requirements, while earning a reasonable market return. We invest only in U.S. government, U.S. agency and U.S. treasury securities. The market value of our investments would not materially decline if current market interest rates rise given the short duration of our investments.
Concentrations of Risk
We invest excess cash in short-term, fixed-rate debt securities, and diversify the investments between financial institutions.
Foreign Currency Fluctuation Risk
We are not currently exposed to significant market risk related to changes in foreign currency exchange rates; however, we have contracted with and may continue to contract with foreign vendors that are located in Europe and Australia.
Inflation Fluctuation Risk
Inflation can affect us by increasing our cost of labor and clinical trial costs. We do not believe that inflation had a material effect on our business, financial condition or results of operations during the three and nine months ended September 30, 2019 and 2018.
| ITEM 4. | CONTROLS AND PROCEDURES |
Evaluation of Disclosure Controls and Procedures
Under the supervision and with the participation of our management and consultants, including the Executive Chairman (our principal executive officer) and Chief Financial Officer (our principal financial officer), we have conducted an evaluation of the effectiveness of the design and operation of our disclosure controls and procedures (“Disclosure Controls and Procedures”), as of September 30, 2019, as such term is defined in Exchange Act Rules 13a-15(e) and 15d-15(e) of the Securities Exchange Act of 1934, as amended (the “Exchange Act”).
Conclusion of Evaluation— Based on this Disclosure Controls and Procedures evaluation, the Executive Chairman and Chief Financial Officer concluded that our Disclosure Controls and Procedures were effective as of September 30, 2019.
Changes in Internal Control Over Financial Reporting – There were no changes in our internal control over financial reporting that occurred during the quarter ended September 30, 2019 that have materially affected, or are reasonable likely to materially affect, our internal control over financial reporting.
| ITEM 1. | LEGAL PROCEEDINGS. |
On November 1, 2019, Sudipta Majumdar filed a putative securities class action lawsuit against the Company and certain of its current and former executive officers, in the U.S. District Court for the Southern District of New York, purportedly on behalf of purchasers of the Company’s securities between May 31, 2018 and September 23, 2019. The complaint alleges, among other things, that the defendants made materially false and misleading statements regarding the Company’s business, and operational and compliance policies, in violation of Sections 10(b) and 20(a) of the Exchange Act. The complaint seeks unspecified damages, fees, interest, and costs. The Company intends to defend this suit vigorously.
On January 18, 2018, William Mahon, a Company stockholder, served a demand upon the Company’s board of directors (the “Board”) pursuant to Section 220 of the Delaware General Corporation Law (the “Demand”) seeking to inspect certain of the Company’s books and records. Generally, the Demand’s stated purpose was to investigate allegedly excessive compensation awarded to non-employee Board members for the fiscal years 2015–2017. The Board denied the allegations in the Demand, and agreed to provide limited books and records to Mahon. On September 17, 2018, another Company stockholder, Francisco Dos Ramos, filed a stockholder derivative complaint in the Delaware Chancery Court (the “Dos Ramos Action”) against Steven Rouhandeh, Frank Carsten Thiel, Mark Alvino, Stefano Buono, Stephen Howell, Richard Van Duyne, and Todd Wider as defendants, and the Company as nominal defendant (the “Dos Ramos Defendants”). Dos Ramos generally alleged that the Board breached its fiduciary duties, were unjustly enriched, and committed corporate waste by approving allegedly excessive compensation to non-employee Board members for the fiscal years 2015–2017. Dos Ramos generally sought disgorgement of the allegedly improper payments to the Board, money damages, an order requiring corporate governance reforms, costs and attorneys’ fees. On November 28, 2018, Mahon filed a stockholder derivative complaint (the “Mahon Action”) in the United States District Court for the District of Delaware (the “District Court”) against Mark Ahn, Mark Alvino, Jeffrey Davis, Stephen Howell, Todd Wider, and Steven Rouhandeh, as defendants, and the Company as a nominal defendant (“Mahon Defendants”). The allegations in the Mahon Action were substantially similar to those set forth in his Demand, as well as those in the Dos Ramos Action. Mahon generally sought the disgorgement of the allegedly improper payments to the Board, a constructive trust, money damages, costs and attorneys’ fees. On December 6, 2018, Mahon and the Mahon Defendants filed a joint motion for preliminary approval of settlement, along with a stipulation of settlement (the “Stipulation”) intending to settle all claims asserted in the Mahon Action.
On January 8, 2019, the District Court approved the parties’ notice of settlement, enjoining all Company stockholders from commencing or further prosecuting any claims asserted in the Mahon Action, and scheduled a settlement approval hearing for May 1, 2019. On January 25, 2019, the Chancery Court entered an order staying the Dos Ramos Action until May 8, 2019—one week after the May 1, 2019 settlement hearing in the Mahon Action. On May 2, 2019 the District Court entered an Order and Final Judgment approving the Stipulation. On August 6, 2019, the plaintiff in the Dos Ramos Action filed a voluntary notice of dismissal. On August 7, 2019, the Chancery Court entered an order of dismissal.
On October 22, 2018, EB Research Partnership, Inc. (“EBRP”) served upon the Company a Request for Arbitration (the “Request”), alleging that the Company was in breach of an Agreement executed in July 2016 (the “Agreement”) between and among the Company, EBRP, and Epidermolysis Bullosa Medical Research Foundation (“EBMRF” and together with EBRP, “Claimants”). EBRP alleged that Abeona had refused to lift trading restrictions on certain shares of Abeona common stock issued to EBRP, purportedly in breach of the Agreement. On November 21, 2018, the Company filed an action in the United States District Court for the Southern District of New York seeking a declaration that it was not required to arbitrate its dispute with EBRP on the basis that the Agreement was void for lack of consideration. On February 4, 2019, the court granted Claimants’ motion to compel arbitration. EBMRF was subsequently joined as a party to the arbitration. The parties submitted briefs to the arbitrator on March 18 and April 18, 2019. On May 15, 2019, the arbitrator issued a decision in favor of the Company (the “Final Award”). Specifically, the Final Award provides that the Agreement is void for lack of consideration; that Claimants fraudulently induced Abeona to enter into the Agreement; that Claimants cannot enforce the Agreement; that Claimants are not entitled to any relief under the Agreement; that, in view of their status as charitable organizations, Claimants would not be required to repay to Abeona the value of Abeona common stock they already sold; that the Company shall cancel any and all shares of Abeona common stock issued to Claimants that were still in Claimants’ possession; and that, as the losing parties, Claimants must bear the costs and expenses of the arbitration and Abeona’s costs and expenses.
| RISK FACTORS. |
Our business and financial results are subject to numerous risks and uncertainties. As a result, the risks and uncertainties discussed in Part I, Item 1A. Risk Factors in our Annual Report on Form 10-K for the year ended December 31, 2018 should be carefully considered. Other than the risk factor provided below, there have been no material changes to the risk factors from those set forth in our Annual Report on Form 10-K for the year ended December 31, 2018.
We may encounter substantial delays in our clinical studies, such as clinical holds, or we may fail to demonstrate safety and efficacy to the satisfaction of applicable regulatory authorities.
Before obtaining marketing approval from regulatory authorities for the sale of our product candidates, we must conduct extensive clinical studies to demonstrate the safety, purity and potency, and efficacy, of the product candidates in humans. Clinical testing is expensive, time-consuming and uncertain as to outcome. We cannot guarantee that any clinical studies will be conducted as planned or completed on schedule, if at all. A failure of one or more clinical studies can occur at any stage of testing. Events that may prevent successful or timely completion of clinical development include:
| ● | delays in reaching a consensus with regulatory agencies on study design; |
| ● | delays in obtaining required IRB or Institutional Ethics Committee approval at each clinical study site; and |
| ● | delays in recruiting suitable patients to participate in our clinical studies. |
As previously reported, the Company received a clinical hold letter from the FDA in September 2019 clarifying that the FDA will not provide approval for the Company to begin its planned phase III clinical trial for EB-101 until it submits to the FDA additional data points on transport stability of EB-101 to clinical sites. Delays in launching clinical trials, such as our planned phase III clinical trial for EB-101, resulting from FDA or other regulatory actions, such as a clinical hold letter, would delay the commercialization of our product candidates and our ability to generate revenue, which would have an adverse effect on our business.
| ITEM 6. | EXHIBITS. |
See Exhibit Index below, which is incorporated by reference herein.
Exhibit Index
* Pursuant to Item 601(b)(32)(ii) of Regulation S-K, this exhibit shall not be deemed “filed” for purposes of Section 18 of the Securities Exchange Act of 1934 or otherwise subject to the liabilities of that Section, nor shall it be deemed incorporated by reference in any filings under the Securities Act of 1933 or the Securities Exchange Act of 1934, whether made before or after the date hereof and irrespective of any general incorporation language in any filing.
| 22 |
Pursuant to the requirements of the Securities Exchange Act of 1934, the registrant has duly caused this report to be signed on its behalf by the undersigned, thereunto duly authorized.
| ABEONA THERAPEUTICS INC. | |||
| Date: | November 12, 2019 | By: | /s/ Steven H. Rouhandeh |
| Steven H. Rouhandeh | |||
| Executive Chairman | |||
| (Principal Executive Officer) | |||
| Date: | November 12, 2019 | By: | /s/ Christine Silverstein |
| Christine Silverstein | |||
| Chief Financial Officer | |||
| (Principal Financial Officer) | |||