Maryland | Maryland | | 47-5201540 | (State or other jurisdiction of incorporation) | | (IRS Employer Identification No.) |
11 S. 12th Street, Suite 401P. O. Box 8436
Richmond Virginia 23219, VA23226 (Address of principal executive offices) (Zip Code) Registrant’s telephone number, including area code: (804) 344-4435(804) 338-7708 Securities registered pursuant to section 12(b) of the Act: | | | | | Title of Each Class | | | Trading
Symbol(s) | Name of each Exchange
on Which Registered | | Trading
Symbol(s) | Common Stock, $0.01 par value per share | | | MDRR | The Nasdaq Capital Market | 8.0% Series A Cumulative Redeemable Preferred Stock, $0.01 par value per share | | MDRR | MDRRP | The Nasdaq Capital Market |
Indicate by check mark whether the registrant: (1) has filed all reports required to be filed by Section 13 or 15(d) of the Securities Exchange Act of 1934 during the preceding 12 months (or for such shorter period that the registrant was required to file such reports), and (2) has been subject to such filing requirements for the past 90 days. Yes x¨⌧◻ No Indicate by check mark whether the registrant has submitted electronically every Interactive Data File required to be submitted pursuant to Rule 405 of Regulation S-T (§232.405 of this chapter) during the preceding 12 months (or for such shorter period that the registrant was required to submit such files). x⌧ Yes No ¨ ◻ Indicate by check mark whether the registrant is a large accelerated filer, an accelerated filer, a non-accelerated filer, smaller reporting company, or an emerging growth company. See the definitions of “large accelerated filer,” “accelerated filer,” “smaller reporting company,” and “emerging growth company” in Rule 12b-2 of the Exchange Act. | | | | Large accelerated filer | ¨◻ | Accelerated filer | ¨◻ | | | | | Non-accelerated filer | ¨☒ | Smaller reporting company | x☒ | | | | |
|
| Emerging growth company | x☐ |
If an emerging growth company, indicate by check mark if the registrant has elected not to use the extended transition period for complying with any new or revised financial accounting standards provided pursuant to Section 13(a) of the Exchange Act ¨☐ Indicate by check mark whether the registrant is a shell company (as defined in Rule 12b-2 of the Exchange Act). Yes ¨x☐☒ No The number of shares of Common Stock, $0.01 par value per share, of the registrant outstanding at May 13, 20199, 2024 was 3,988,249.2,236,631. Medalist Diversified REIT, Inc. Quarterly Report on Form 10-Q For the Quarter Ended March 31, 20192024 Table of Contents Table of Contents | PART I.FINANCIAL INFORMATION PART I. | FINANCIAL INFORMATION |
Item 1. | Financial Statements |
Item 1. Financial Statements Medalist Diversified REIT, Inc. and Subsidiaries Condensed Consolidated Balance Sheets | | | | | | | | | | | March 31, 2024 | | | December 31, 2023 | | | | (Unaudited) | | | | ASSETS | | | | | | | | Investment properties, net | | $ | 66,305,628 | | $ | 64,577,376 | | Cash | | | 3,637,400 | | | 2,234,603 | | Restricted cash | | | 1,499,034 | | | 1,575,002 | | Rent and other receivables, net of allowance of $23,694 and $13,413, as of March 31, 2024 and December 31, 2023, respectively | | | 233,330 | | | 292,618 | | Assets held for sale | | | — | | | 9,707,154 | | Unbilled rent | | | 1,017,128 | | | 1,109,782 | | Intangible assets, net | | | 2,774,934 | | | 2,716,546 | | Other assets | | | 513,570 | | | 532,935 | | Total Assets | | $ | 75,981,024 | | $ | 82,746,016 | | | | | | | | | | LIABILITIES | | | | | | | | Accounts payable and accrued liabilities | | $ | 1,031,282 | | $ | 1,095,049 | | Intangible liabilities, net | | | 1,885,210 | | | 1,865,310 | | Line of credit, short term, net | | | — | | | 1,000,000 | | Mortgages payable, net | | | 50,595,020 | | | 50,772,773 | | Mortgages payable, net, associated with assets held for sale | | | — | | | 9,588,888 | | Mandatorily redeemable preferred stock, net | | | 4,757,701 | | | 4,693,575 | | Total Liabilities | | $ | 58,269,213 | | $ | 69,015,595 | | | | | | | | | | EQUITY | | | | | | | | Common stock, 2,236,631 and 2,218,810 shares issued and outstanding at March 31, 2024 and December 31, 2023, respectively | | $ | 22,366 | | $ | 22,188 | | Additional paid-in capital | | | 51,601,531 | | | 51,514,209 | | Offering costs | | | (3,350,946) | | | (3,350,946) | | Accumulated deficit | | | (34,529,636) | | | (35,864,693) | | Total Stockholders' Equity | | | 13,743,315 | | | 12,320,758 | | Noncontrolling interests - Hanover Square Property | | | 39,996 | | | 119,140 | | Noncontrolling interests - Parkway Property | | | 451,665 | | | 453,203 | | Noncontrolling interests - Operating Partnership | | | 3,476,835 | | | 837,320 | | Total Equity | | $ | 17,711,811 | | $ | 13,730,421 | | Total Liabilities and Equity | | $ | 75,981,024 | | $ | 82,746,016 | |
See notes to condensed consolidated financial statements Medalist Diversified REIT, Inc. and Subsidiaries Condensed Consolidated Statements of Operations (Unaudited) | | | | | | | | | Three Months Ended | | | March 31, | | | 2024 | | 2023 | REVENUE | | | | | | | Retail center property revenues | | $ | 1,849,617 | | $ | 1,835,373 | Flex center property revenues | | | 664,067 | | | 569,297 | Single tenant net lease property revenues | | | 57,955 | | | 56,306 | Total Revenue | | $ | 2,571,639 | | $ | 2,460,976 | | | | | | | | OPERATING EXPENSES | | | | | | | Retail center property operating expenses | | $ | 428,259 | | $ | 512,887 | Flex center property operating expenses | | | 144,673 | | | 176,737 | Single tenant net lease property operating expenses | | | 7,708 | | | 7,728 | Bad debt expense | | | 14,056 | | | 27,122 | Share based compensation expenses | | | 277,500 | | | — | Legal, accounting and other professional fees | | | 393,078 | | | 525,628 | Corporate general and administrative expenses | | | 296,794 | | | 117,049 | Management restructuring expenses | | | — | | | 241,450 | Loss on impairment | | | — | | | 36,743 | Depreciation and amortization | | | 1,012,476 | | | 1,156,348 | Total Operating Expenses | | | 2,574,544 | | | 2,801,692 | Gain on disposal of investment property | | | 2,819,502 | | | — | Loss on extinguishment of debt | | | (51,837) | | | — | Operating Income (Loss) | | | 2,764,760 | | | (340,716) | Interest expense | | | 876,748 | | | 864,052 | Net Income (Loss) from Operations | | | 1,888,012 | | | (1,204,768) | Other income | | | 44,889 | | | 10,830 | Other expense | | | — | | | 39,868 | Net Income (Loss) | | | 1,932,901 | | | (1,233,806) | Less: Net income (loss) attributable to Hanover Square Property noncontrolling interests | | | 457,184 | | | (1,241) | Less: Net income (loss) attributable to Parkway Property noncontrolling interests | | | 6,562 | | | (8,367) | Less: Net income (loss) attributable to Operating Partnership noncontrolling interests | | | 111,757 | | | (2,903) | Net Income (Loss) Attributable to Medalist Common Shareholders | | $ | 1,357,398 | | $ | (1,221,295) | | | | | | | | Earnings per common share - basic | | $ | 0.61 | | $ | — | Weighted-average number of shares - basic | | | 2,233,182 | | | — | | | | | | | | Earnings per common share - diluted | | $ | 0.60 | | $ | — | Weighted-average number of shares - diluted | | | 2,248,142 | | | — | | | | | | | | Loss per common share - basic and diluted | | $ | — | | $ | (0.55) | Weighted-average number of shares - basic and diluted | | | — | | | 2,219,803 | | | | | | | | Dividends paid per common share | | $ | 0.01 | | $ | 0.08 |
See notes to condensed consolidated financial statements Medalist Diversified REIT, Inc. and Subsidiaries Condensed Consolidated Statements of Stockholders’ Equity For the three months ended March 31, 2024 and 2023 (Unaudited) | | | | | | | | | | | | | | | | | | | | | | | | | | | | | | | | For the three months ended March 31, 2024 | | | Common Stock | | | | | | | | | | | | | | Noncontrolling Interests | | | | | | | | | | | Additional | | | Offering | | Accumulated | | | Shareholders’ | | | Hanover Square | | | Parkway | | | Operating | | | | | | Shares | | Par Value | | Paid in Capital | | | Costs | | Deficit | | | Equity | | | Property | | | Property | | | Partnership | | | Total Equity | Balance, January 1, 2024 | | 2,218,810 | | $ | 22,188 | | $ | 51,514,209 | | $ | (3,350,946) | | $ | (35,864,693) | | $ | 12,320,758 | | $ | 119,140 | | $ | 453,203 | | $ | 837,320 | | $ | 13,730,421 | | | | | | | | | | | | | | | | | | | | | | | | | | | | | | | Share based compensation | | 17,821 | | $ | 178 | | $ | 87,322 | | $ | — | | $ | — | | $ | 87,500 | | $ | — | | $ | — | | $ | 190,000 | | $ | 277,500 | Redemption of operating partnership units | | — | | | — | | | — | | | — | | | — | | | — | | | — | | | — | | | (61,589) | | | (61,589) | Net income | | — | | | — | | | — | | | — | | | 1,357,398 | | | 1,357,398 | | | 457,184 | | | 6,562 | | | 111,757 | | | 1,932,901 | Dividends and distributions | | — | | | — | | | — | | | — | | | (22,341) | | | (22,341) | | | (479,856) | | | (8,100) | | | (653) | | | (510,950) | Noncontrolling Interests | | — | | | — | | | — | | | — | | | — | | | — | | | (56,472) | | | — | | | 2,400,000 | | | 2,343,528 | | | | | | | | | | | | | | | | | | | | | | | | | | | | | | | Balance, March 31, 2024 | | 2,236,631 | | $ | 22,366 | | $ | 51,601,531 | | $ | (3,350,946) | | $ | (34,529,636) | | $ | 13,743,315 | | $ | 39,996 | | $ | 451,665 | | $ | 3,476,835 | | $ | 17,711,811 |
| | | | | | | | | | | | | | | | | | | | | | | | | | | | | | | | For the three months ended March 31, 2023 | | | Common Stock | | | | | | | | | | | | | | Noncontrolling Interests | | | | | | | | | | | Additional | | | Offering | | Accumulated | | | Shareholders’ | | | Hanover Square | | | Parkway | | | Operating | | | | | | Shares | | Par Value | | Paid in Capital | | | Costs | | Deficit | | | Equity | | | Property | | | Property | | | Partnership | | | Total Equity | Balance, January 1, 2023 | | 2,219,803 | | $ | 22,198 | | $ | 51,519,198 | | $ | (3,350,946) | | $ | (30,939,020) | | $ | 17,251,430 | | $ | 127,426 | | $ | 470,685 | | $ | 842,898 | | $ | 18,692,439 | | | | | | | | | | | | | | | | | | | | | | | | | | | | | | | Net loss | | — | | $ | — | | $ | — | | $ | — | | $ | (1,221,295) | | $ | (1,221,295) | | $ | (1,241) | | $ | (8,367) | | $ | (2,903) | | $ | (1,233,806) | Dividends and distributions | | — | | | — | | | — | | | — | | | (176,810) | | | (176,810) | | | — | | | — | | | (2,135) | | | (178,945) | | | | | | | | | | | | | | | | | | | | | | | | | | | | | | | Balance, March 31, 2023 | | 2,219,803 | | $ | 22,198 | | $ | 51,519,198 | | $ | (3,350,946) | | $ | (32,337,125) | | $ | 15,853,325 | | $ | 126,185 | | $ | 462,318 | | $ | 837,860 | | $ | 17,279,688 |
See notes to condensed consolidated financial statements Medalist Diversified REIT, Inc. and Subsidiaries Condensed Consolidated Statements of Cash Flows (Unaudited) | | | | | | | | | Three months ended March 31, | | | 2024 | | 2023 | CASH FLOWS FROM OPERATING ACTIVITIES | | | | | | | | | | | | | | Net Income (Loss) | | $ | 1,932,901 | | $ | (1,233,806) | | | | | | | | Adjustments to reconcile consolidated net loss to net cash flows from operating activities | | | | | | | Depreciation | | | 840,461 | | | 911,481 | Amortization | | | 172,015 | | | 244,867 | Loan cost amortization | | | 23,767 | | | 26,990 | Mandatorily redeemable preferred stock issuance cost and discount amortization | | | 64,126 | | | 58,804 | Amortization of lease incentives | | | 741 | | | — | Above (below) market lease amortization, net | | | (64,422) | | | (73,018) | Bad debt expense | | | 14,056 | | | 27,122 | Share-based compensation | | | 277,500 | | | — | Loss on impairment | | | — | | | 36,743 | Loss on extinguishment of debt | | | 51,837 | | | — | Gain on disposal of investment property | | | (2,819,502) | | | — | | | | | | | | Changes in assets and liabilities | | | | | | | Rent and other receivables, net | | | 45,232 | | | 84,476 | Unbilled rent | | | (1,869) | | | (48,899) | Other assets | | | 19,365 | | | 66,796 | Accounts payable and accrued liabilities | | | (63,767) | | | 349,168 | Net cash flows from operating activities | | | 492,441 | | | 450,724 | | | | | | | | CASH FLOWS FROM INVESTING ACTIVITIES | | | | | | | | | | | | | | Investment property acquisitions | | | (145,345) | | | — | Capital expenditures | | | (226,662) | | | (647,690) | Cash received from disposal of investment properties, net | | | 3,110,149 | | | — | Net cash flows from investing activities | | | 2,738,142 | | | (647,690) | | | | | | | | CASH FLOWS FROM FINANCING ACTIVITIES | | | | | | | | | | | | | | Dividends and distributions paid | | | (510,950) | | | (178,945) | Repayment of line of credit, short term | | | (1,000,000) | | | — | Operating partnership unit redemption | | | (61,589) | | | — | Repayment of mortgages payable | | | (331,215) | | | (301,577) | Net cash flows from financing activities | | | (1,903,754) | | | (480,522) | | | | | | | | DECREASE IN CASH, CASH EQUIVALENTS AND RESTRICTED CASH | | | 1,326,829 | | | (677,488) | CASH, CASH EQUIVALENTS AND RESTRICTED CASH, beginning of period | | | 3,809,605 | | | 5,662,853 | CASH, CASH EQUIVALENTS AND RESTRICTED CASH, end of period | | $ | 5,136,434 | | $ | 4,985,365 | | | | | | | | CASH AND CASH EQUIVALENTS, end of period, shown in condensed consolidated balance sheets | | | 3,637,400 | | | 3,048,100 | RESTRICTED CASH including assets restricted for capital and operating reserves and tenant deposits, end of period, shown in condensed consolidated balance sheets | | | 1,499,034 | | | 1,937,265 | CASH, CASH EQUIVALENTS AND RESTRICTED CASH, end of period shown in the condensed consolidated statements of cash flows | | $ | 5,136,434 | | $ | 4,985,365 | | | | | | | | Supplemental Disclosures and Non-Cash Activities: | | | | | | | | | | | | | | Other cash transactions: | | | | | | | Interest paid | | $ | 865,664 | | $ | 796,268 | | | | | | | | Non-cash transactions: | | | | | | | Issuance of operating partnership units for Citibank Acquisition | | $ | 2,400,000 | | $ | — |
See notes to condensed consolidated financial statements Medalist Diversified REIT, Inc. and Subsidiaries Condensed Consolidated Balance Sheets
| | | March 31, 2019 | | | December 31, 2018 | | | | | (Unaudited) | | | | | | ASSETS | | | | | | | | | | Investment properties, net | | $ | 45,837,106 | | | $ | 45,323,497 | | | Cash | | | 1,269,765 | | | | 1,327,424 | | | Restricted cash | | | 1,970,018 | | | | 2,793,372 | | | Rent and other receivables, net of allowance of $4,191 and $15,194, as of March 31, 2019 and December 31, 2018, respectively | | | 96,604 | | | | 108,478 | | | Unbilled rent | | | 344,542 | | | | 259,216 | | | Advance deposits | | | 281,148 | | | | 423,747 | | | Intangible assets, net | | | 2,368,067 | | | | 2,585,834 | | | Interest rate cap, at fair value | | | 76,394 | | | | 126,797 | | | Prepaid expenses | | | 153,595 | | | | 158,687 | | | Total Assets | | $ | 52,397,239 | | | $ | 53,107,052 | | | | | | | | | | | | | LIABILITIES | | | | | | | | | | Accounts payable and accrued liabilities | | $ | 1,125,045 | | | $ | 826,336 | | | Intangible liabilities, net | | | 416,214 | | | | 439,726 | | | Mortgages payable, net | | | 33,246,700 | | | | 33,236,397 | | | Total Liabilities | | $ | 34,787,959 | | | $ | 34,502,459 | | | | | | | | | | | | | EQUITY | | | | | | | | | | Preferred stock, $.01 par value, 250,000,000 shares authorized, none issued and outstanding | | $ | - | | | $ | - | | | Common stock, $.01 par value, 750,000,000 shares authorized, 2,321,582 shares issued and outstanding at Common stock March 31, 2019 and December 31, 2018 | | | 23,216 | | | | 23,216 | | | Additional paid-in capital | | | 22,077,827 | | | | 22,077,827 | | | Offering costs | | | (1,974,118 | ) | | | (1,835,291 | ) | | Accumulated deficit | | | (5,916,399 | ) | | | (5,229,760 | ) | | Total Shareholders' Equity | | | 14,210,526 | | | | 15,035,992 | | | Noncontrolling interests - Hampton Inn Property | | | 1,876,152 | | | | 2,009,031 | | | Noncontrolling interests - Hanover Square Property | | | 588,238 | | | | 608,943 | | | Noncontrolling interests - Operating Partnership | | | 934,364 | | | | 950,627 | | | Total Equity | | $ | 17,609,280 | | | $ | 18,604,593 | | | Total Liabilities and Equity | | $ | 52,397,239 | | | $ | 53,107,052 | |
See notesNotes to consolidated financial statements.
Medalist Diversified REIT, Inc. and Subsidiaries
Unaudited Condensed Consolidated Statements of Operations (Unaudited)
| | | Three Months Ended | | | | | March 31, | | | | | 2019 | | | 2018 | | | | | | | | | | | REVENUE | | | | | | | | | | Retail center property revenues | | $ | 750,820 | | | $ | 384,502 | | | Retail center property tenant reimbursements | | | 143,174 | | | | 72,369 | | | Hotel property room revenues | | | 630,035 | | | | 733,566 | | | Hotel property other revenues | | | 14,453 | | | | 12,413 | | | Total Revenue | | $ | 1,538,482 | | | $ | 1,202,850 | | | | | | | | | | | | | OPERATING EXPENSES | | | | | | | | | | Retail center property operating expenses | | $ | 269,275 | | | $ | 192,681 | | | Hotel property operating expenses | | | 581,975 | | | | 563,054 | | | Legal, accounting and other professional fees | | | 353,747 | | | | 212,179 | | | Corporate general and administrative expenses | | | 55,705 | | | | 2,305 | | | Depreciation and amortization | | | 566,163 | | | | 393,964 | | | Total Operating Expenses | | | 1,826,865 | | | | 1,364,183 | | | Operating Loss | | | (288,383 | ) | | | (161,333 | ) | | Interest expense | | | 506,074 | | | | 424,281 | | | Net Loss from Operations | | | (794,457 | ) | | | (585,614 | ) | | Other income | | | 4,374 | | | | - | | | Decrease (increase) in fair value - interest rate cap | | | 50,403 | | | | (74,289 | ) | | Net Loss | | | (840,486 | ) | | | (511,325 | ) | | Less: Net loss attributable to Hampton Inn Property noncontrolling interests | | | (132,879 | ) | | | (40,767 | ) | | Less: Net loss attributable to Hanover Square Property noncontrolling interests | | | (4,705 | ) | | | - | | | Less: Net loss attributable to Operating Partnership noncontrolling interests | | | (16,263 | ) | | | (19,683 | ) | | Net Loss Attributable to Medalist Common Shareholders | | $ | (686,639 | ) | | $ | (450,875 | ) | | | | | | | | | | | | Loss per share from operations - basic and diluted | | $ | (0.30 | ) | | $ | (0.27 | ) | | | | | | | | | | | | Weighted-average number of shares - basic and diluted | | | 2,321,582 | | | | 1,687,516 | | | | | | | | | | | | | Dividends declared per common share | | $ | - | | | $ | - | |
See notes to consolidated financial statements
MEDALISTDIVERSIFIEDREIT,INC. ANDSUBSIDIARIES
CondensedCONSOLIDATEDSTATEMENTs OFEQUITY
(Unaudited)
| | | Common Stock | | | | | | | | | | | | | | | Noncontrolling Interests | | | | | | | | Shares | | | Par Value | | | Additional
Paid in
Capital | | | Offering
Costs | | | Accumulated
Deficit | | | Total
Shareholders'
Equity | | | Hampton Inn
Property | | | Hanover
Square
Property | | | Operating
Partnership | | | Total Equity | | | | | | | | | | | | | | | | | | | | | | | | | | | | | | | | | | | Balance, January 1, 2018 | | | 1,148,002 | | | $ | 11,480 | | | $ | 11,086,897 | | | $ | (912,060 | ) | | $ | (1,398,222 | ) | | $ | 8,788,095 | | | $ | 2,211,345 | | | $ | - | | | $ | 1,082,591 | | | $ | 12,082,031 | | | | | | | | | | | | | | | | | | | | | | | | | | | | | | | | | | | | | | | | | | | | | Common stock issuances | | | 839,080 | | | $ | 8,391 | | | $ | 7,885,045 | | | $ | - | | | $ | - | | | $ | 7,893,436 | | | $ | - | | | $ | - | | | $ | - | | | $ | 7,893,436 | | | Offering costs | | | - | | | | - | | | | - | | | | (265,612 | ) | | | - | | | | (265,612 | ) | | | - | | | | - | | | | - | | | | (265,612 | ) | | Net loss | | | - | | | | - | | | | - | | | | - | | | | (450,875 | ) | | | (450,875 | ) | | | (40,767 | ) | | | - | | | | (19,683 | ) | | | (511,325 | ) | | | | | | | | | | | | | | | | | | | | | | | | | | | | | | | | | | | | | | | | | | | | Balance, March 31, 2018 | | | 1,987,082 | | | $ | 19,871 | | | $ | 18,971,942 | | | $ | (1,177,672 | ) | | $ | (1,849,097 | ) | | $ | 15,965,044 | | | $ | 2,170,578 | | | $ | - | | | $ | 1,062,908 | | | $ | 19,198,530 | |
| | | Common Stock | | | | | | | | | | | | | | | Noncontrolling Interests | | | | | | | | Shares | | | Par Value | | | Additional
Paid in
Capital | | | Offering
Costs | | | Accumulated
Deficit | | | Total
Shareholders'
Equity | | | Hampton Inn
Property | | | Hanover
Square
Property | | | Operating
Partnership | | | Total Equity | | | | | | | | | | | | | | | | | | | | | | | | | | | | | | | | | | | Balance, January 1, 2019 | | | 2,321,582 | | | $ | 23,216 | | | $ | 22,077,827 | | | $ | (1,835,291 | ) | | $ | (5,229,760 | ) | | $ | 15,035,992 | | | $ | 2,009,031 | | | $ | 608,943 | | | $ | 950,627 | | | $ | 18,604,593 | | | | | | | | | | | | | | | | | | | | | | | | | | | | | | | | | | | | | | | | | | | | | Offering costs | | | - | | | $ | - | | | $ | - | | | $ | (138,827 | ) | | $ | - | | | $ | (138,827 | ) | | $ | - | | | $ | - | | | $ | - | | | $ | (138,827 | ) | | Net loss | | | - | | | | - | | | | - | | | | - | | | | (686,639 | ) | | | (686,639 | ) | | | (132,879 | ) | | | (4,705 | ) | | | (16,263 | ) | | | (840,486 | ) | | Dividends and distributions | | | - | | | | - | | | | - | | | | - | | | | - | | | | - | | | | - | | | | (16,000 | ) | | | - | | | | (16,000 | ) | | | | | | | | | | | | | | | | | | | | | | | | | | | | | | | | | | | | | | | | | | | | Balance, March 31, 2019 | | | 2,321,582 | | | $ | 23,216 | | | $ | 22,077,827 | | | $ | (1,974,118 | ) | | $ | (5,916,399 | ) | | $ | 14,210,526 | | | $ | 1,876,152 | | | $ | 588,238 | | | $ | 934,364 | | | $ | 17,609,280 | |
See notes to consolidated financial statements
Medalist Diversified REIT, Inc. and Subsidiaries
Condensed Consolidated Statements of Cash Flows
(Unaudited)
| | | For the Three Months Ended | | | | | March 31, | | | | | 2019 | | | 2018 | | | CASH FLOWS FROM OPERATING ACTIVITIES | | | | | | | | | | | | | | | | | | | | Net Loss | | $ | (840,486 | ) | | $ | (511,325 | ) | | | | | | | | | | | | Adjustments to reconcile consolidated net loss to net cash provided by (used in) operating activities | | | | | | | | | | Depreciation | | | 403,330 | | | | 302,304 | | | Amortization | | | 162,833 | | | | 91,660 | | | Loan cost amortization | | | 42,711 | | | | 39,528 | | | Amortization of tenant inducements | | | 4,260 | | | | - | | | Decrease (increase) in fair value - interest rate cap | | | 50,403 | | | | (74,289 | ) | | Above (below) market lease amortization, net | | | 31,422 | | | | 36,386 | | | | | | | | | | | | | Changes in assets and liabilities | | | | | | | | | | Rent and other receivables, net | | | 11,874 | | | | 13,775 | | | Unbilled rent | | | (85,326 | ) | | | (18,575 | ) | | Prepaid expenses | | | 5,092 | | | | 20,748 | | | Other assets | | | - | | | | (50,000 | ) | | Accounts payable and accrued liabilities | | | 298,709 | | | | (73,143 | ) | | Net cash provided by (used in) operating activities | | | 84,822 | | | | (222,931 | ) | | | | | | | | | | | | CASH FLOWS FROM INVESTING ACTIVITIES | | | | | | | | | | | | | | | | | | | | Capital expenditures | | | (405,769 | ) | | | (46,568 | ) | | Advance deposits | | | (372,831 | ) | | | - | | | Net cash used in investing activities | | | (778,600 | ) | | | (46,568 | ) | | | | | | | | | | | | CASH FLOWS FROM FINANCING ACTIVITIES | | | | | | | | | | | | | | | | | | | | Dividends and distributions paid | | | (16,000 | ) | | | - | | | Repayment of notes payable and related party notes payable | | | - | | | | (2,177,538 | ) | | Repayment of mortgages payable | | | (32,408 | ) | | | - | | | Proceeds from sales of common stock, net of offering costs | | | (138,827 | ) | | | 7,590,356 | | | Net cash (used in) provided by investing activities | | | (187,235 | ) | | | 5,412,818 | | | | | | | | | | | | | (DECREASE) INCREASE IN CASH, CASH EQUIVALENTS AND RESTRICTED CASH | | | (881,013 | ) | | | 5,143,319 | | | CASH, CASH EQUIVALENTS AND RESTRICTED CASH, beginning of period | | | 4,120,796 | | | | 3,294,847 | | | CASH, CASH EQUIVALENTS AND RESTRICTED CASH, end of period | | $ | 3,239,783 | | | $ | 8,438,166 | | | | | | - | | | | - | | | CASH AND CASH EQUIVALENTS, end of period shown in consolidated balance sheets | | | 1,269,765 | | | | 5,290,371 | | | RESTRICTED CASH including assets restricted for capital and operating reserves and tenant deposits | | | 1,970,018 | | | | 3,147,795 | | | CASH, CASH EQUIVALENTS AND RESTRICTED CASH, end of period shown in the statement of cash flows | | $ | 3,239,783 | | | $ | 8,438,166 | | | | | | | | | | | | | Supplemental Disclosures and Non-Cash Activities: | | | | | | | | | | | | | | | | | | | | Interest paid, net of interest rate cap offsetting receipts | | | 427,674 | | | | 409,702 | | | Transfer advance deposits to investment properties | | | 515,430 | | | | - | | | Short term receivable in lieu of proceeds from sale of common stock | | | - | | | | 37,468 | |
See notes to consolidated financial statements
Medalist Diversified REIT, Inc. and Subsidiaries
Notes to Consolidated Financial Statements
(Unaudited)
| 1. | 1. Organization and Basis of Presentation and Consolidation |
Medalist Diversified Real Estate Investment Trust, Inc. (the “REIT”) is a Maryland corporation formed on September 28, 2015. Beginning with the taxable year ended December 31, 2017, the REIT has elected to be taxed as a real estate investment trust for federal income tax purposes. The REIT serves as the general partner of Medalist Diversified Holdings, LP (the “Operating Partnership”) which was formed as a Delaware limited partnership on September 29, 2015. As of March 31, 2019,2024, the REIT, through the Operating Partnership, owned and operated 10 developed properties consisting of four retail center properties, three flex center properties, the Shops at Franklin Square, a 134,239 square foot retail property located in Gastonia, North Carolina (the “Franklin Square Property”), the Greensboro Airport Hampton Inn, a hotel with 125 rooms on 2.162 acres in Greensboro, North Carolina (the “Hampton Inn Property”), and the Shops at Hanover Square North (the “Hanover Square Property”), a 73,440 square foot retail property located in Mechanicsville, Virginia. The Company owns 64 percent of the Hampton Inn Property as athree single tenant in common with a noncontrolling owner which owns the remaining 36 percent interest. The Company owns 84 percent of the Hanover Square Property as a tenant in common with a noncontrolling owner which owns the remaining 16 percent interest. net lease (“STNL”) properties, and three undeveloped parcels. The use of the word “Company” refers to the REIT and its consolidated subsidiaries, except where the context otherwise requires. The Company includes the REIT, the Operating Partnership wholly ownedand wholly-owned limited liability corporationscompanies which own or operate the properties. 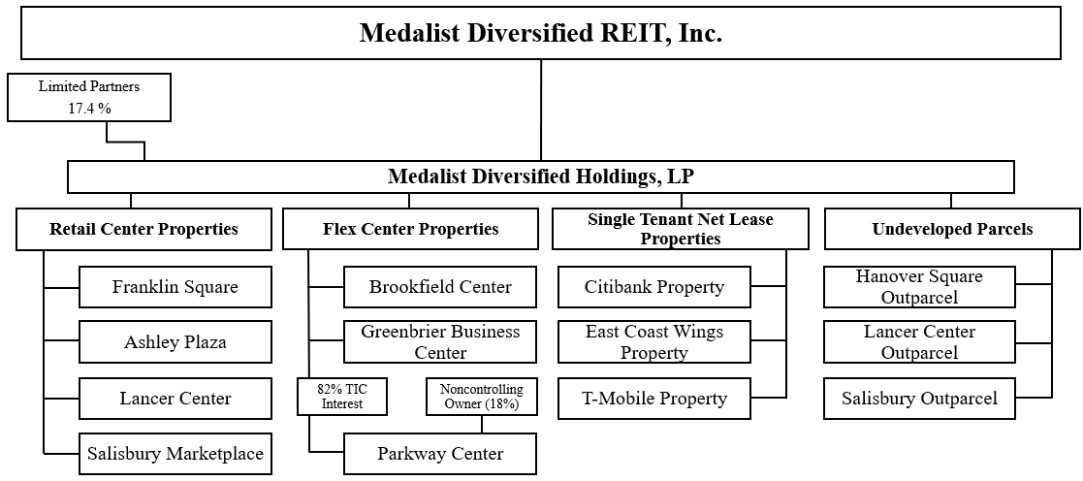
The Company owns four retail center properties consisting of (i) the Shops at Franklin Square, a 134,239 square foot retail property located in Gastonia, North Carolina (the “Franklin Square Property”), (ii) the Ashley Plaza Shopping Center, a 156,012 square foot retail property located in Goldsboro, North Carolina (the “Ashley Plaza Property”), (iii) the Lancer Center, a 181,590 square foot retail property located in Lancaster, South Carolina (the “Lancer Center Property”), and (iv) the Salisbury Marketplace Shopping Center, a 79,732 square foot retail property located in Salisbury, North Carolina (the “Salisbury Marketplace Property”). On March 13, 2024, the Company, and its tenant in common partner, sold the Shops at Hanover Square North, a 73,440 square foot retail property located in Mechanicsville, Virginia (the “Hanover Square Shopping Center Property”). The Company and its tenant in common partner retained ownership of the 0.864 acre outparcel (the “Hanover Square Outparcel” and together with the Hanover Square Shopping Century Property, the “Hanover Square Property”). The Company owned 84% of the Hanover Square Shopping Center Property and the taxable REIT subsidiaryHanover Square Outparcel as a tenant in common with a noncontrolling owner which operatesowned the Hampton Inn Property. As a REIT, certain tax laws limit the amount of “non-qualifying” income that Company can earn, including income derived directly from the operation of hotels. As a result,remaining 16% interest. On March 25, 2024, the Company purchased its tenant in common partner’s 16% interest in the Hanover Square Outparcel (see Note 3, below). Collectively, the sale of the Hanover Square Shopping Center and the acquisition of the tenant in common (“TIC”partner’s 16% interest in the Hanover Square Outparcel are referenced herein as the “Hanover Square Transactions”. The Company owns three flex center properties consisting of (i) Brookfield Center, a 64,880 square foot mixed-use industrial/office property located in Greenville, South Carolina (the “Brookfield Center Property”), (ii) the Greenbrier Business Center, an 89,280 square foot mixed-use industrial/office property located in Chesapeake, Virginia (the “Greenbrier Business Center Property”), and (iii) the Parkway Property, a 64,109 square foot mixed-use industrial office property located in Virginia Beach, Virginia (the "Parkway Property”), in which the Company owns an 82% tenant in common interest with a noncontrolling owner lease its consolidated hotel property towhich owns the remaining 18% interest. The Company owns three STNL properties consisting of (i) the Citibank Property, a taxable REIT subsidiary (“TRS”4,350 square foot single tenant building on 0.45 acres located in Chicago, Illinois, (ii) the East Coast Wings building, a 5,000 square foot single tenant building on approximately 0.89 acres located in Goldsboro, North Carolina (the “East Coast Wings Property”) for federal income tax purposes., and (iii) the T-Mobile building, a 3,000 square foot single tenant building on approximately 0.78 acres located in Goldsboro, North Carolina (the “T-Mobile Property”). The TRS is subject to income taxEast Coast Wings Property and is not limited asthe T-Mobile Property are both located on outparcels adjacent to the amount of nonqualifying income it can generate, but it is limited in terms of its valueAshley Plaza Property. Prior to January 1, 2024, the Company included the East Coast Wings Property and the T-Mobile Property as a percentagepart of the total valueAshley Plaza Property. The Company also owns three undeveloped parcels which are currently being marketed for use as STNL properties including (i) an outparcel at its Lancer Center Property consisting of approximately 1.80 acres (the “Lancer Outparcel”), (ii) an outparcel at its Salisbury Marketplace Property consisting of approximately 1.20 acres (the “Salisbury Outparcel”) (the exact size of the Company’s assets. The TRS enters into an agreement withLancer Outparcel and Salisbury Outparcel will not be determined until a third partyuser is identified), and (iii) the Hanover Square Outparcel consisting of approximately 0.86 acres located adjacent to manage the operations ofHanover Square Shopping Center Property, which the hotel. Company sold on March 13, 2024. The Company prepared the accompanying condensed consolidated financial statements in accordance with accounting principles generally accepted in the United States of America (“GAAP”). References to the condensed consolidated financial statements and references to individual financial statements included herein, reference the condensed consolidated financial statements or the respective individual financial statement. All material balances and transactions between the consolidated entities of the Company have been eliminated. 
The Company was formed to acquire, reposition, renovate, lease and manage income-producing properties, with a primary focus, as of March 31, 2024, on (i) commercial properties, including flex-industrial, limited service hotels, and retail properties and (ii) multi-family residentialflex-industrial properties in secondary and tertiary markets in the southeastern part of the United States, with an expected concentration in Virginia, North Carolina, South Carolina, Georgia, Florida and Alabama.Alabama, and STNL assets with an expected national focus. The Company may also pursue, in an opportunistic manner, other real estate-related investments, including, among other things, equity or other ownership interests in entities that are the direct or indirect owners of real property, indirect investments in real property, such as those that may be obtained in a joint venture. While these types of investments are not intended to be a primary focus, the Company may make such investments in its Manager’s discretion.at the discretion of the Company’s Board of Directors (the “Board”). TheFor all periods prior to July 18, 2023, the Company iswas externally managed by Medalist Fund Manager, Inc. (the ‘‘Manager’’“Manager”). TheOn July 18, 2023, the Company and the Manager makesentered into an agreement (the “Termination Agreement”) terminating that certain Management Agreement, dated as of March 15, 2016, among the Company, the Operating Partnership and the Manager, as amended (the “Management Agreement”). Until the termination of the Management Agreement, the Manager made all investment decisions for the Company. TheCompany, which were approved by the Board’s Acquisition Committee. In addition, until the termination of the Management Agreement, the Manager and its affiliated companies specialize in acquiring, developing, owning and managing value-added commercial real estate in the Mid-Atlantic and Southeast regions. The Manager overseesoversaw the Company’s overall business and affairs and hashad broad discretion to make operating decisions on behalf of the Company. Since the termination of the Management Agreement, the Company and to make investment decisions.has been managed internally as directed by the Board. The Company’s stockholders are not involved in its day-todayday-to-day affairs.
| 2. | 2. Summary of Significant Accounting Policies |
Investment Properties As of January 1, 2017, theThe Company has adopted Accounting Standards Update (“ASU”) 2017-01,Business Combinations (Topic 805), which clarifies the framework for determining whether an integrated set of assets and activities meets the definition of a business. The revised framework establishes a screen for determining whether an integrated set of assets and activities is a business and narrows the definition of a business, which is expected to result in fewer transactions being accounted for as business combinations. Acquisitions of integrated sets of assets and activities that do not meet the definition of a business are accounted for as asset acquisitions. As a result, all of the Company’s acquisitions that occurred in 2017 and 2018to date qualified as asset acquisitions and most of the Company’sCompany expects future acquisitions of operating properties willto qualify as asset acquisitions. Accordingly, third-party transaction costs associated with these acquisitions have been and will be
capitalized, while internal acquisition costs will continue to be expensed. Accounting Standards Codification (“ASC”) 805 mandates that “an acquiring entity shall allocate the cost of an acquired entity to the assets acquired and liabilities assumed based on their estimated fair values at date of acquisition.” ASC 805 results in an allocation of acquisition costs to both the tangible and intangible assets associated with income producing real estate. Tangible assets include land, buildings, site improvements, tenant improvements and furniture, fixtures and fixtures,equipment, while intangible assets include the value of in-place leases, lease origination costs (leasing commissions and tenant improvements), legal and marketing costs and leasehold assets and liabilities (above or below market)market leases), among others. The Company uses independent, third partythird-party consultants to assist management with its ASC 805 evaluations. The Company determines fair value based on accepted valuation methodologies including the cost, market, and income capitalization approaches. The purchase price is allocated to the tangible and intangible assets identified in the evaluation. The Company records depreciation on buildings and improvements utilizing the straight-line method over the estimated useful life of the asset, generally 54 to 4042 years. The Company reviews depreciable lives of investment properties periodically and makes adjustments to reflect a shorter economic life, when necessary. Tenant allowances, tenant inducementsCapitalized leasing commissions and tenant improvements incurred and paid by the Company subsequent to the acquisition of the investment property are amortized utilizing the straight-line method over the term of the related lease. Amounts allocated to buildings are depreciated over the estimated remaining life of the acquired building or related improvements. Acquisition and closing costs are capitalized as part of each tangible asset on a pro rata basis. Improvements and major repairs and maintenance are capitalized when the repair and maintenance substantially extend the useful life, increases capacity or improves the efficiency of the asset. All other repair and maintenance costs are expensed as incurred. Assets Held for Sale The Company reviews investment properties for impairment on a property-by-property basis whenever events or changes in circumstances indicate that the carrying value of investment properties may not be recoverable, but at least annually. These circumstances include, but are not limited to, declines in the property’s cash flows, occupancy and fair market value. The Company measures any impairment of investment property when the estimated undiscounted cash flows plus its residual value, is less than the carrying value of the property. To the extent impairment has occurred, the Company charges to income the excess of the carrying value of the property over its estimated fair value. The Company estimates fair value using unobservable data such as operating income, estimated capitalization rates, or multiples, leasing prospects and local market information. The Company may decide to sell properties that are held as investment properties. The accounting treatment for usethe disposal of long-lived assets is covered by ASC 360. Under this guidance, the Company records the assets associated with these properties, and any associated mortgages payable, as held for sale when management has committed to a plan to sell the assets, actively seeks a buyer for the assets, and the consummation of the sale pricesis considered probable and is expected within one year. Delays in the time required to complete a sale do not preclude a long-lived asset from continuing to be classified as held for sale beyond the initial one-year period if the delay is caused by events or circumstances beyond an entity’s control and there is sufficient evidence that the entity remains committed to a qualifying plan to sell the long-lived asset.
Properties classified as held for sale are reported at the lower of these properties may differ from their carrying values.value or their fair value, less estimated costs to sell. When the carrying value exceeds the fair value, less estimated costs to sell, an impairment charge is recognized. The Company determines fair value based on the three-level valuation hierarchy for fair value measurement. Level 1 inputs are quoted prices in active markets for identical assets or liabilities. Level 2 inputs are quoted prices for similar assets or liabilities in active markets; quoted prices for identical or similar assets in markets that are not active; and inputs other than quoted prices. Level 3 inputs are unobservable inputs that are supported by little or no market activity and that are significant to the fair value of the assets or liabilities. During November 2023, the Company committed to a plan to sell an asset group associated with the Hanover Square Shopping Center Property that included the land, site improvements, building, building improvements and tenant improvements. As a result, as of December 1, 2023, the Company reclassified these assets, and the related mortgage payable, net, for the Hanover Square Shopping Center Property as assets held for sale and liabilities associated with assets held for sale, respectively. Under ASC 360, depreciation of assets held for sale is discontinued, so no further depreciation or amortization was recorded subsequent to December 1, 2023. The Company believed that the fair value, less estimated costs to sell, exceeded the Company’s carrying cost, so the Company did not record any impairment adjustmentsof assets held for sale related to its properties duringthe Hanover Square Shopping Center Property for any periods, including the three months ended March 31, 2019 or2024 and the year ended December 31, 2023, the periods during which the Hanover Square Shopping Center Property was classified as assets held for sale. The Company sold the Hanover Square Shopping Center on March 31, 2018.13, 2024. Intangible Assets and Liabilities, net
The Company determines, through the ASC 805 evaluation, the above and below market lease intangibles upon acquiring a property. Intangible assets (or liabilities) such as above or below-market leases and in-place lease value are recorded at fair value and are amortized as an adjustment to rental revenue or amortization expense, as appropriate, over the remaining terms of the underlying leases. The Company amortizes amounts allocated to tenant improvements, in-place lease assets and other lease-related intangibles over the remaining life of the underlying leases. The analysis is conducted on a lease-by-lease basis. The Company reviews its intangible assets for impairment whenever events or changes in circumstances indicate that the carrying value of its intangible assets may not be recoverable, but at least annually. During the three months ended March 31, 2019 and 2018, respectively, the Company did not record any impairment adjustments to its intangible assets.
Details of thesethe deferred costs, net of amortization, arising from the Company’s purchases of the Franklin Square Propertyits retail center properties, flex center properties and Hanover Square PropertySTNL properties are as follows: | | | March 31, 2019 | | | December 31, 2018 | | | | | (unaudited) | | | | | | Intangible Assets | | | | | | | | | | Leasing commissions | | $ | 282,409 | | | $ | 305,646 | | | Legal and marketing costs | | | 87,440 | | | | 95,950 | | | Above market leases | | | 593,475 | | | | 648,409 | | | Leases in place | | | 1,404,743 | | | | 1,535,829 | | | | | $ | 2,368,067 | | | $ | 2,585,834 | | | | | | | | | | | | | Intangible Liabilities | | | | | | | | | | Below market leases, net | | $ | (416,214 | ) | | $ | (439,726 | ) |
| | | | | | | | | | | March 31, 2024 | | | | | | | (unaudited) | | December 31, 2023 | | Intangible Assets, net | | | | | | | | Leasing commissions | | $ | 932,217 | | $ | 912,040 | | Legal and marketing costs | | | 97,889 | | | 104,791 | | Above market leases | | | 91,472 | | | 106,907 | | Net leasehold asset | | | 1,653,356 | | | 1,592,808 | | | | $ | 2,774,934 | | $ | 2,716,546 | | | | | | | | | | Intangible Liabilities, net | | | | | | | | Below market leases | | $ | (1,885,210) | | $ | (1,865,310) | |
Capitalized above-market lease values are amortized as a reduction of rental income over the remaining terms of the respective leases. Capitalized below-market lease values are amortized as an increase to rental income over the remaining terms of the respective leases. Adjustments to rental revenue related to the above and below market leases during the three months ended March 31, 20192024 and 2018,2023, respectively, were as follows: | | | Three months ended March 31, | | | | | 2019 | | | 2018 | | | | | (unaudited) | | | (unaudited) | | | Amortization of above market leases | | $ | 54,934 | | | $ | 47,898 | | | Amortization of below market leases | | | (23,512 | ) | | | (11,512 | ) | | | | $ | 31,422 | | | $ | 36,386 | |
| | | | | | | | | | For the three months ended | | | | March 31, | | | | | 2024 | | | 2023 | | | | (unaudited) | | (unaudited) | | Amortization of above market leases | | $ | (15,434) | | $ | (27,343) | | Amortization of below market leases | | | 79,856 | | | 100,361 | | | | $ | 64,422 | | $ | 73,018 | |
Amortization of lease origination costs, leases in place and legal and marketing costs represent a component of depreciation and amortization expense. Amortization related to these intangible assets during the three months ended March 31, 20192024 and 2018,2023, respectively, were as follows: | | | Three months ended March 31, | | | | | | 2019 | | | 2018 | | | | | | (unaudited) | | (unaudited) | | | | | | | | | | | | | | | For the three months ended | | | | | March 31, | | | | | | 2024 | | | 2023 | | | | | (unaudited) | | (unaudited) | | | Leasing commissions | | $ | (23,237 | ) | | $ | (15,602 | ) | | $ | (46,507) | | $ | (56,618) | | | Legal and marketing costs | | | (8,510 | ) | | | (7,031 | ) | | | (11,846) | | | (16,205) | | | Leases in place | | | (131,086 | ) | | | (69,027 | ) | | | | | $ | (162,833 | ) | | $ | (91,660 | ) | | Net leasehold asset | | | | (113,662) | | | (172,044) | | | | | $ | (172,015) | | $ | (244,867) | |
As of March 31, 20192024 and December 31, 2018,2023, the Company’s accumulated amortization of lease origination costs, leases in place and legal and marketing costs totaled $983,847$2,254,058 and $821,014,$2,204,404, respectively. During the three months ended March 31, 2024 and 2023, the Company wrote off $122,360 and $273,252, respectively, in accumulated amortization related to fully amortized intangible assets, and $0 and $21,407, respectively, in accumulated amortization related to the write off of intangible assets related to the early terminated leases, discussed above. Future amortization of above and below market leases, lease origination costs, leases in place, legal and marketing costs and tenant relationships is as follows: | | | For the
remaining
nine months
ending
December 31,
2019 | | | 2020 | | | 2021 | | | 2022 | | | 2023 | | | 2024-
2027 | | | Total | | | | | | | | | | | | | | | | | | | | | | | | | | | | | | | | | | | | | | | | | | | | | | | | For the | | | | | | | | | | | | | | | | | | | | | | | remaining nine | | | | | | | | | | | | | | | | | | | | | | | months ending | | | | | | | | | | | | | | | | | | | | | | | December 31, | | | | | | | | | | | | | | | | | | | | | | 2024 | | 2025 | | 2026 | | 2027 | | 2028 | | 2029-2041 | | Total | | Intangible Assets | | | | | | | | | | | | | | | | | | | | | | | | | | | | | | | | | | | | | | | | | | | | | | | | | | | Leasing commissions | | $ | 65,094 | | | $ | 75,332 | | | $ | 67,721 | | | $ | 36,661 | | | $ | 17,855 | | | $ | 19,746 | | | $ | 282,409 | | | $ | 129,836 | | $ | 154,496 | | $ | 116,510 | | $ | 97,592 | | $ | 76,167 | | $ | 357,616 | | $ | 932,217 | | Legal and marketing costs | | | 21,544 | | | | 20,736 | | | | 16,127 | | | | 11,739 | | | | 8,126 | | | | 9,168 | | | | 87,440 | | | | 25,593 | | | 24,456 | | | 13,842 | | | 8,599 | | | 5,886 | | | 19,513 | | | 97,889 | | Above market leases, net | | | 157,930 | | | | 180,650 | | | | 173,712 | | | | 81,183 | | | | - | | | | - | | | | 593,745 | | | | Leases in place | | | 359,098 | | | | 404,455 | | | | 365,252 | | | | 157,418 | | | | 54,354 | | | | 64,166 | | | | 1,404,743 | | | | | | $ | 603,666 | | | $ | 681,173 | | | $ | 622,812 | | | $ | 287,001 | | | $ | 80,335 | | | $ | 93,080 | | | $ | 2,368,067 | | | | | | | | | | | | | | | | | | | | | | | | | | | | | | | | | | Above market leases | | | | 25,416 | | | 21,292 | | | 15,629 | | | 14,543 | | | 10,114 | | | 4,478 | | | 91,472 | Net leasehold asset | | | | 288,837 | | | 318,667 | | | 223,495 | | | 177,171 | | | 128,963 | | | 516,223 | | | 1,653,356 | | | | $ | 469,682 | | $ | 518,911 | | $ | 369,476 | | $ | 297,905 | | $ | 221,130 | | $ | 897,830 | | $ | 2,774,934 | | | | | | | | | | | | | | | | | | | | | | | | | Intangible Liabilities | | | | | | | | | | | | | | | | | | | | | | | | | | | | | | | | | | | | | | | | | | | | | | | | | | | Below market leases, net | | $ | (70,533 | ) | | $ | (88,558 | ) | | $ | (85,321 | ) | | $ | (63,749 | ) | | $ | (48,840 | ) | | $ | (59,213 | ) | | $ | (416,214 | ) | | $ | (216,355) | | $ | (227,108) | | $ | (192,535) | | $ | (175,625) | | $ | (153,615) | | $ | (919,972) | | $ | (1,885,210) |
Impairment During the three months ended March 31, 2024 and 2023, the Company recorded a loss on impairment of $0 and $36,743, respectively, resulting from the events described below. Investment Properties The Company reviews its investment properties for impairment on a property-by-property basis whenever events or changes in circumstances indicate that the carrying value of investment properties may not be recoverable, but at least annually. These circumstances include, but are not limited to, declines in the property’s cash flows, occupancy and fair market value. The Company measures any impairment of an investment property when the estimated undiscounted cash flows plus its residual value is less than the carrying value of the property. To the extent impairment has occurred, the Company charges to income the excess of the carrying value of the property over its estimated fair value. The Company estimates fair value using unobservable data such as projected future operating income, estimated capitalization rates, or multiples, leasing prospects and local market information. The Company may decide to sell properties that are held for use and the sale prices of these properties may differ from their carrying values. The Company did not record any impairment adjustments to its investment properties resulting from events or changes in circumstances during the three months ended March 31, 2024 and 2023, that would result in the projected value of the Company’s investment properties being below their carrying value. However, during the three months ended March 31, 2023, one tenant defaulted on its lease. The Company determined that the carrying value of capitalized tenant improvements associated with this lease which were recorded as a component of investment properties on the Company’s condensed consolidated balance sheets should be written off, and the Company recorded a loss on impairment of $8,655 for the three months ended March 31, 2023. This amount is included in the loss on impairment reported on the Company’s condensed consolidated statement of operations for the three months ended March 31, 2023. No such loss on impairment was recorded for the three months ended March 31, 2024. Intangible Assets The Company also reviews its intangible assets for impairment whenever events or changes in circumstances indicate that the carrying value of its intangible assets may not be recoverable, but at least annually. During the three months ended March 31, 2023, the Company determined that the carrying value of certain intangible assets associated with the lease on which the tenant defaulted should be written off and recorded a loss on impairment of $26,896. This amount is included in the loss on impairment reported on the Company’s condensed consolidated statement of operations for the three months ended March 31, 2023. No such amounts were recorded during the three months ended March 31, 2024. Unbilled Rent The Company also reviews the unbilled rent asset recorded on the Company’s condensed consolidated balance sheets for impairment to determine if any amounts may not be recoverable. During the three months ended March 31, 2023, the Company recorded a loss on impairment of $1,192 related to previously recognized straight-line rent related to the defaulting tenant. This amount is included in the loss on impairment reported on the Company’s condensed consolidated statement of operations for the three months ended March 31, 2023. No such amounts were recorded during the three months ended March 31, 2024. Conditional Asset Retirement Obligation A conditional asset retirement obligation represents a legal obligation to perform an asset retirement activity in which the timing and/or method of settlement depends on a future event that may or may not be withwithin the Company’s control. Currently, the Company does not have any conditional asset retirement obligations. However, any such obligations identified in the future would result in the Company recording a liability if the fair value of the obligation can be reasonably estimated. Environmental studies conducted at the time the Company acquired its properties did not reveal any material environmental liabilities, and the Company is unaware of any subsequent environmental matters that would have created a material liability. The Company believes that its properties are currently in material compliance with applicable environmental, as well as non-environmental, statutory and regulatory requirements. The Company did not record any conditional asset retirement obligation liabilities during the three months ended March 31, 20192024 and 2018,2023, respectively.
Cash and Cash Equivalents and Restricted Cash The Company considers all highly liquid investments purchased with an original maturity of 90 days or less to be cash and cash equivalents. Cash equivalents are carried at cost, which approximates fair value. Cash equivalents consist primarily of bank operating accounts and money markets. Financial instruments that potentially subject the Company to concentrations of credit risk include its cash and cash equivalents and its trade accounts receivable. Restricted cash represents (i) amounts held by the Company for tenant security deposits, (ii) escrow deposits held by lenders for real estate tax, insurance, and operating reserves and (iii) capital reserves held by lenders for investment property capital improvements.
The Company places its cash and cash equivalents and any restricted cash held by the Company on deposit with financial institutions in the United States which are insured by the Federal Deposit Insurance Company ("FDIC"(“FDIC”) up to $250,000. The Company'sCompany’s credit loss in the event of failure of these financial institutions is represented by the difference between the FDIC limit and the total amounts on deposit. Management monitors the financial institutionsinstitutions’ credit worthiness in conjunction with balances on deposit to minimize risk. As of March 31, 2019,2024, the Company held two cash accounts at a cash accountsingle financial institution with a balancecombined balances that exceeded the FDIC limit by $255,042.$2,592,582. As of December 31, 2018,2023, the Company held two cash accounts at a cash accountsingle financial institution with a balancecombined balances that exceeded the FDIC limit by $650,699.$1,366,872. Restricted cash represents (i) amounts held by the Company for tenant security deposits, (ii) escrow deposits held by lenders for real estate tax, insurance, and operating reserves, (iii) an escrow for the first year of dividends on the Company’s mandatorily redeemable preferred stock, and (iv) capital reserves held by lenders for investment property capital improvements. Tenant security deposits are restricted cash balances held by the Company to offset potential damages, unpaid rent or other unmet conditions of its tenant leases. As of March 31, 20192024 and December 31, 2018,2023, the Company reported $77,351$247,983 and $71,022,$260,898, respectively, in security deposits. deposits held as restricted cash. Escrow deposits are restricted cash balances held by lenders for real estate taxes and insurance and other operating reserves.premiums. As of March 31, 20192024 and December 31, 2018,2023, the Company reported $456,663$217,000 and $719,588,$191,139, respectively, in escrow deposits. Capital reserves are restricted cash balances held by lenders for capital improvements, leasing commissions and tenant improvements. As of March 31, 20192024 and December 31, 2018,2023, the Company reported $1,436,004$1,034,051 and $2,002,762,$1,122,965, respectively, in capital property reserves. These funds are being held in reserve | | | | | | | | | | March 31, 2024 | | December 31, | | Property and Purpose of Reserve | | (unaudited) | | 2023 | | Ashley Plaza Property - maintenance and leasing cost reserve | | | 459,914 | | | 439,404 | | Brookfield Center Property – maintenance and leasing cost reserve | | | 102,573 | | | 91,491 | | Franklin Square Property – leasing costs | | | 471,564 | | | 441,360 | | Hanover Square Property – operating reserve | | | — | | | 150,710 | | Total | | $ | 1,034,051 | | $ | 1,122,965 | |
Share Retirement ASC 505-30-30-8 provides guidance on accounting for improvements to the Hampton Inn Property ($1,034,626share retirement and $1,601,809 as of March 31, 2019 and December 31, 2018 respectively) and tenant improvements and leasing commissionsestablishes two alternative methods for accounting for the Franklin Square Property ($401,378 and $400,953 asrepurchase price paid in excess of March 31, 2019 and December 31, 2018 respectively). Revenue Recognition
par value. The Company adoptedASU No. 2014-09,Revenuefrom Contracts with Customers (Topic 606) effective on January 1, 2019 (see Recent Accounting Pronouncements, below). This adoption did not have a material impacthas elected the method by which the excess between par value and the repurchase price, including costs and fees, is recorded to additional paid in capital on the Company’s recognition of revenues from either its retail propertiescondensed consolidated balance sheets. The Company did not engage in any share repurchases or its hotel property.retirements during the three months ended March 31, 2024 and 2023. Revenue Recognition Retail, Flex Center and STNL Property Revenues The Company recognizes minimum rents from its retail center properties, (the Franklin Squareflex center properties and Hanover Square properties)STNL properties on a straight-line basis over the terms of the respective leases which results in an unbilled rent asset or deferred rent liability being recorded on the condensed consolidated balance sheet. sheets. As of March 31, 2024 and December 31, 2023, the Company reported $1,017,128 and $1,109,782, respectively, in unbilled rent. The Company’s leases generally require the tenant to reimburse the Company for a substantial portion of its expenses incurred in operating, maintaining, repairing, insuring and managing the shopping center and common areas (collectively defined as Common Area Maintenance or “CAM” expenses). The Company includes these reimbursements, along with other revenue derived from late fees and seasonal events, underon the condensed consolidated statements of operations captionunder the captions "Retail center property revenues”, “Flex center property revenues”, and “Single tenant reimbursements."net lease asset revenues”. (See Recent Accounting Pronouncements, below.) This significantly reduces the Company’s exposure to increases in costs and operating expenses resulting from inflation or other outside factors. The Company accrues reimbursements from tenants for recoverable portions of all these expenses as revenue in the period the applicable expenditures are incurred. The Company calculates the tenant’s share of operating costs by multiplying the total amount of the operating costs by a fraction, the numerator of which is the total number of square feet being leased by the tenant, and the denominator of which is the average total square footage of all leasable buildings at the property. The Company also receives escrow payments for these reimbursements from substantially all its tenants on a monthly basis throughout the year. The Company recognizes differences between previously estimated recoveries and the final billed amounts in the year in which the amounts become final. Since these differences are determined annually under the leases and accrued as of December 31 in the impact onyear earned, no such revenues were recognized forduring the three months ended March 31, 2019 is not known.2024 and 2023. The Company recognizes lease termination fees in the period that the lease is terminated and collection of the fees is reasonably assured. Upon early lease termination, the Company provides for losses related toany unrecovered intangibles and other assets. Duringassets are written off as a loss on impairment. (See Impairment, above.) The Company did not receive any lease termination fees during the three months ended March 31, 20192024 and 2018, respectively, no2023. Management Restructuring Expenses On July 18, 2023, the Company and the Operating Partnership entered into the Termination Agreement with the Manager, William R. Elliott and Thomas E. Messier, which provided for the immediate termination of the Management Agreement and, among other things, aggregate payments of $1,602,717 in settlement of all amounts payable under the Management Agreement (consisting of a $1,250,000 termination fee and the $352,717 Deferred Acquisition Fee, as defined in Note 9, below). For the year ended December 31, 2023, the Company recorded the termination fee and other expenses associated with the Special Committee’s exploration of strategic alternatives as management restructuring expenses on its consolidated statement of operations in accordance with ASC 420-10-S99. Specifically, for the three months ended March 31, 2023, the Company recorded $241,450 in legal fees associated with the work of the Special Committee as management restructuring expenses. No such termination costsexpenses were recognized.recorded for the three months ended March 31, 2024. Rent and other receivables Hotel Property Revenues
Hotel revenues (from the Hampton Inn Property) are recognized as earned, which is generally defined as the date upon which a guest occupies a room or utilizes the hotel’s services.
Tenant receivablesRent and unbilled rent
Tenantother receivables include tenant receivables related to base rents and tenant reimbursementsreimbursements. Rent and other receivables do not include receivables attributable to recording rents on a straight-line basis.basis, which are included in unbilled rent, discussed above. The Company determines an allowance for the uncollectible portion of accrued rents and accounts receivable based upon customer credit-worthinesscredit worthiness (including expected recovery of a claim with respect to any tenants in bankruptcy), historical bad debt levels, and current economic trends. The Company considers a receivable past due once it becomes delinquent per the terms of the lease. A past due receivable triggers certain events such as notices, fees and other allowable and required actions per the lease. TheAs of March 31, 2024 and December 31, 2023, the Company’s allowance for uncollectible accountsrent totaled $23,694 and $13,413, respectively, which are comprised of amounts specifically identified based on management’s review of individual tenants’ outstanding receivables. Management determined that no additional general reserve is considered necessary as of March 31, 2024 and December 31, 2023, respectively.
Income Taxes Beginning with the Company’s taxable year ended December 31, 2017, the REIT has elected to be taxed as a real estate investment trust for federal income tax purposes under Sections 856 through 860 of the Internal Revenue Code and applicable Treasury regulations relating to REIT qualification. In order to maintain this REIT status, the regulations require the Company to distribute at least 90% of its taxable income to shareholders and meet certain other asset and income tests, as well as other requirements. If the Company fails to qualify as a REIT, it will be subject to tax at regular corporate rates for the years in which it fails to qualify. If the Company loses its REIT status it could not elect to be taxed as a REIT for five years unless the Company’s failure to qualify was due to reasonable cause and certain other conditions were satisfied. Management has evaluated the effect of the guidance provided by GAAP on Accounting for Uncertainty of Income Taxes and has determined that the Company had no uncertain income tax positions. During the three months ended March 31, 2019 and 2018, respectively, the Company’s Hampton Inn TRS entity generated a tax loss, so no income tax expense was recorded.
Use of Estimates The Company has made estimates and assumptions that affect the reported amounts of assets and liabilities, disclosure of contingent assets and liabilities at the date of the condensed consolidated financial statements, and revenues and expenses during the reported period. The Company’s actual results could differ from these estimates. Noncontrolling Interests The ownership interests not held by the REIT are considered noncontrolling interests. There are three elements of noncontrolling interests in the capital structure of the Company. The ownership interests not held by the REIT are considered noncontrolling interests. Accordingly,These noncontrolling interests have been reported in equity on the condensed consolidated balance sheets but separate from the Company’s equity. On the condensed consolidated statements of operations, the subsidiaries are reported at the consolidated amount, including both the amount attributable to the Company and noncontrolling interests. ConsolidatedThe Company’s condensed consolidated statements of changes in stockholders’ equity includeincludes beginning balances, activity for the period and ending balances for shareholders’ equity, noncontrolling interests and total equity. The first noncontrolling interest is in the Hampton InnHanover Square Property (consisting of both the Hanover Square Shopping Center and the Hanover Square Outparcel) in which the Company owns a 64 percentowned an 84% tenancy in common interest through its subsidiariessubsidiary and an outside party ownsowned a 36 percent16% tenancy in common interest. In 2017,interest, prior to the noncontrolling owner ofHanover Square Transactions. Prior to the Hampton Inn Property provided $2.3 million as part ofHanover Square Transactions, the acquisition of the Hampton Inn Property. The Hampton InnHanover Square Property’s net lossincome (loss) is allocated to the noncontrolling ownership interest based on its 36 percent16% ownership. During the three months ended March 31, 2019, 36 percent2024, 16% of the Hampton Inn’sHanover Square Property’s net lossincome of $369,109,$2,857,400 or $132,879 $457,184 was allocated to the noncontrolling partnershipownership interest. During the three months ended March 31, 2018, 36 percent2023, 16% of the Hampton Inn’sHanover Square Property’s net loss of $113,241, $7,755 or $40,767, $1,241 was allocated to the noncontrolling ownership interest. The second noncontrolling interest is in the Hanover SquareParkway Property, in which the Company owns an 84 percent82% tenancy in common interest through its subsidiary and an outside party owns a 16 percentan 18% tenancy in common interest. The Hanover Square Property’sParkway Property's net lossincome (loss) is allocated to the noncontrolling ownership interest based on its 16 percent18% ownership. During the three months ended March 31, 2019, 16 percent2024, 18% of the Hanover Square Property’sParkway Property's net lossincome of $29,409,$36,453 or $4,705,$6,562 was allocated to the noncontrolling ownership interest. The Company did not own the Hanover Square Property duringDuring the three months ended March 31, 2018.2023, 18% of the Parkway Property’s net loss of $46,482 or $8,367, was allocated to the noncontrolling ownership interest. The third noncontrolling ownership interest areconsists of the common units inof the Operating Partnership (the “Operating Partnership Units”) that are not held by the REIT. In 2017, 125,00015,625 Operating Partnership unitsUnits were issued to members of the selling LLC which owned the Hampton Inn Property who elected to participate in a 721 exchange, which allows the exchange of interests in real property for sharesunits in the operating partnership of a real estate investment trust. TheseThe members of thea selling LLClimited liability company invested $1,175,000 in the Operating Partnership in exchange for 125,00015,625 Operating Partnership units. Units. Additionally, effective on January 1, 2020, 11,731 Operating Partnership Units were issued in exchange for approximately 3.45% of the noncontrolling owner’s tenant in common interest in the Hampton Inn Property, a property that was formerly owned by the Company. On August 31, 2020, a holder of Operating Partnership Units converted 665 Operating Partnership Units into shares of the Company’s common stock, $0.01 par value per share (“Common Shares”). On January 18, 2024, the Company issued 38,697 Operating Partnership Units to Francis P. Kavanaugh, representing a portion of his 2024 compensation. On February 16, 2024, the Company redeemed for cash the 11,731 Operating Partnership Units that were issued to the Hampton Inn Property noncontrolling owner. On March 27, 2024, the Company issued 417,391 Operating Partnership Units as consideration for the purchase of the Citibank Property. As of March 31, 2024 and December 31, 2023, there were 471,048 and 26,691 Operating Partnership Units outstanding, respectively, not held by the REIT. As of March 31, 2024 and December 31, 2023, respectively, 14,960 and 26,691 of the Operating Partnership Units not held by the REIT were convertible to Common Shares. Outstanding Operating Partnership Units have been adjusted for the Reverse Stock Split (as defined below). (See Note 7, below). The Operating Partnership unitsUnits not held by the REIT represent 5.11 percent17.40% and 1.19% of the outstanding Operating Partnership unitsUnits as of the three months ended March 31, 20192024 and December 31, 2018.2023, respectively. The noncontrolling interest percentage is calculated at any point in time by dividing the number of unitsOperating Partnership Units not owned by the Company by the total number of unitsOperating Partnership Units outstanding. The noncontrolling interest ownership percentage will change as additional common or preferred shares are issued by the REIT, or additional Operating Partnerships unitsUnits are issued or as unitsOperating Partnership Units are exchanged for the Company’s $0.01 par value per share Common Stock.Shares. During periods when the Operating Partnership’s noncontrolling interest changes, the noncontrolling ownership interest is calculated based on the weighted average Operating Partnership noncontrolling ownership interest during that period. The Operating Partnership’s net loss is allocated to the noncontrolling unitOperating Partnership Unit holders based on their ownership interest. During the three months ended March 31, 2019,2024, a weighted average of 5.11 percent4.40% of the Operating Partnership’s net lossincome of $318,258, $2,538,177, or $16,263,$111,757, was allocated to the noncontrolling unitOperating Partnership Unit holders. During the three months ended March 31, 2018,2023, a weighted average of 7.25 percent1.19% of the Operating Partnership’s net loss of $271,478, $243,989, or $19,683, $2,903, was allocated to the noncontrolling unitOperating Partnership Unit holders. Reclassifications Operating Segments Recent Accounting Pronouncements
For each of the accounting pronouncements that affectEffective January 1, 2024, the Company established STNL assets as a third operating segment. The Ashley Plaza Property consists of three separate parcels including a parcel with the main shopping center building, the East Coast Wings Parcel and the T-Mobile Parcel. Effective for the periods after January 1, 2024, the Company reports revenues from the East Coast Wings Parcel and the T-Mobile Parcel as STNL property revenues, and expenses associated with these two parcels as STNL property expenses. For the periods prior to January 1, 2024, the Company has electedreclassified the revenues and expenses associated with these two parcels that were previously recorded as retail center property revenues and retail center property expenses as STNL property revenues and STNL property expenses, respectively. Specifically, for the three months ended March 31, 2023, the Company reclassified $56,306 that was previously recorded as retail center property revenues to single tenant net lease revenues, and $7,728 that was previously recorded as retail center property expenses to single tenant net lease expenses. These reclassifications had no impact on total revenues, total expenses or plansnet income (loss).
Outstanding Shares All per share amounts, Common Shares outstanding, Operating Partnership Units outstanding, and stock-based compensation amounts for all periods presented reflect our one-for-eight reverse stock split (the “Reverse Stock Split”), which was effective May 3, 2023. (See Completion of 1-for-8 Reverse Stock Split under Note 7, below.) Recent Accounting Pronouncements Upcoming Accounting Pronouncements Improvements to elect to followReportable Segment Disclosures In November 2023, the rule that allows companies engaging in an initial public offering as an Emerging Growth Company to follow the private company implementation dates. Revenue Recognition
In May 2014, the Financial Accounting Standards Board (FASB)FASB issued ASU 2014-09,2023-07, Revenue from Contracts with CustomersSegment Reporting (Topic 606)280): Improvements to Reportable Segment Disclosures, which supersedes. The objective of ASU 2023-07 is to improve reportable segment disclosures by public companies, primarily by requiring enhanced disclosures about significant segment expenses. Under the revenue recognition requirementsupdates in this guidance, companies are required to disclose, on an annual and interim basis, significant segment expenses that are regularly provided to the chief operating decision maker and included within each reported measure of Accounting Standards Codification (“ASC”) Topic 605,Revenue Recognitionsegment profit or loss. Additionally, a total for all other expenses that are not determined to be significant segment expenses must be separately presented for each reported measure of segment profit or loss for the corresponding reporting periods, and most industry-specific guidance on revenue recognition throughout the ASC. The new standard is principles based and provides a five step model to determine when and how revenue is recognized. The core principledescription of the new standard isexpenses included in that revenue shouldtotal must be recognized when a company transfers promised goods or services to customersprovided in an amount that reflects the consideration to which the company expects to be entitled in exchange for those goods or services.disclosure. The new standardupdated guidance also requires disclosure of qualitativethe title and quantitative information surrounding the amount, nature, timing and uncertainty of revenues and cash flows arising from contracts with customers. In March 2016, the FASB issued ASU No. 2016-08,Revenue from Contracts with Customers (Topic 606): Principal versus Agent Considerations (Reporting Revenue Gross versus Net), which clarifies the implementation guidance on principal versus agent considerations. In June 2016, the FASB issued ASU 2016-12,Revenue from Contracts with Customers (Topic 606): Narrow-Scope Improvements and Practical Expedients, which relates to assessing collectability, presentation of sales taxes, noncash consideration and completed contracts and contract modifications in transition. In December 2016, the FASB issued 2016-20,Technical Corrections and Improvements to Topic 606, Revenue from Contracts with Customers, which clarifies or corrects unintended applicationposition of the standard. Companieschief operating decision maker and an explanation of how the company’s reported measure(s) of segment profit or loss are permittedused in assessing segment performance and deciding how to adoptallocate the ASUs as early as fiscal years beginning after December 15, 2016, but the adoptioncompany’s resources. ASU 2023-07 is required for private companieseffective for fiscal years beginning after December 15, 2018. In September 2017, the FASB issued ASU 2017-13,Revenue Recognition (Topic 605)," "Revenue from Contracts with Customers (Topic 606),Leases (Topic 840),"2023, andLeases (Topic 842). These amendments provide additional clarification and implementation guidance on the previously issued ASU 2014-09,Revenue from Contracts with Customers (Topic 606). The Company adopted Topic 606 effective on January 1, 2019.
A majority of the Company’s tenant-related revenue from its Franklin Square Property and Hanover Square Property is recognized pursuant to lease agreements and will be governed by the leasing guidance discussed below. The Company has evaluated its hotel revenues and concluded that the adoption of this standard did not impact the amount or timing of revenue recognition in its consolidated financial statements. The Company completed its assessment of ASU No. 2014-09 and has concluded that the guidance does not have a material impact on the Company’s method of revenue recognition or on the consolidated financial statements.
Accounting for Leases
In February 2016, the FASB issued ASU No. 2016-02, Leases (Topic 842). The amendments in this update govern a number of areas including, but not limited to, accounting for leases, replacing the existing guidance in ASC No. 840, Leases. Under this standard, among other changes in practice, a lessee’s rights and obligations under most leases, including existing and new arrangements, would be recognized as assets and liabilities, respectively, on the balance sheet. Other significant provisions of this standard include (i) defining the “lease term” to include the non-cancelable period together with interim periods for which there is a significant economic incentive for the lessee to extend or not terminate the lease; (ii) defining the initial lease liability to be recorded on the balance sheet to contemplate only those variable lease payments that depend on an index or that are in substance “fixed,” (iii) a dual approach for determining whether lease expense is recognized on a straight-line or accelerated basis, depending on whether the lessee is expected to consume more than an insignificant portion of the leased asset’s economic benefits and (iv) a requirement to bifurcate certain lease and non-lease components. The lease standard is effective for public companies forwithin fiscal years beginning after December 15, 2018 (including interim periods within those fiscal years) and for private companies, fiscal years beginning after December 15, 2019, with early adoption permitted. The2024, which means that the Company plans to adopt the standard effective on January 1, 2020. Management does not believe the adoption will have a material impact on the Company’s consolidated financial statements.
In June 2016, the FASB issued ASU 2016-13,Financial Instruments - Credit Losses (Topic 326): Measurement of Credit Losses on Financial Instruments. This update enhances the methodology of measuring expected credit lossesbe required to include the use of forward-looking information to better calculate credit loss estimates.enhanced disclosures beginning with its condensed consolidated financial statements for the year ending December 31, 2024. The guidance will apply to most financial assets measured at amortized cost and certain other instruments, such as accounts receivable and loans. The guidance will require that the Company estimate the lifetime expected credit loss with respect to these receivables and record allowances that, when deducted from the balance of the receivables, represent the net amounts expected tomust be collected. The Company will also be required to disclose information about how it developed the allowances, including changes in the factors that influenced the Company’s estimate of expected credit losses and the reasons for those changes. For public companies, the guidance will be effective for interim and annual reporting periods beginning after December 15, 2019 and for private companies, periods after December 15, 2020. The Company is currently in the process of evaluating the impact the adoption of the guidance will have on its consolidated financial statements.
Cash Flows
In November 2016, the FASB issued ASU 2016-18,Statement of Cash Flows (Topic 230): Restricted Cash (a consensus of the FASB Emerging Issues Task Force). The ASU provides guidance on the presentation of restricted cash or restricted cash equivalents in the statement of cash flows in an effort to reduce diversity in practice. The standard requires a reconciliation of total cash, cash equivalents and restricted cash, such as escrows and operating property reserves and property capital reserves, in the cash flow statement or in the notes to the financial statements. This ASU is effective for annual and interim reporting periods beginning after December 15, 2017applied retrospectively, and early adoption is permitted. As discussed in Note 10 below, the Company has reportable segments for retail center properties, flex center properties and STNL properties, and it previously had a reportable segment for hotel properties. The Company is currently evaluating the new standarddisclosure requirements in ASU 2023-07 to determine the impact on its condensed consolidated financial statements.
Evaluation of the Company’s Ability to Continue as a Going Concern Under the accounting guidance related to the presentation of financial statements, the Company is required to evaluate, on a quarterly basis, whether or not the entity’s current financial condition, including its sources of liquidity at the date that the condensed consolidated financial statements are issued, will enable the entity to meet its obligations as they come due arising within one year of the date of the issuance of the Company’s condensed consolidated financial statements and to make a determination as to whether or not it is probable, under the application of this accounting guidance, that the entity will be able to continue as a going concern. The Company’s condensed consolidated financial statements have been presented on a going concern basis, which contemplates the realization of assets and the satisfaction of liabilities in the normal course of business. The redemption date of the Company’s mandatorily redeemable preferred stock is February 19, 2025 (the “Redemption Date”). The Company will require additional liquidity to fund the redemption. The Company expects to be applied retrospectivelyable to generate this liquidity from a number of sources, including cash on hand, forecasted future cash flows for allthe periods presented.prior to the Redemption Date, and careful management of the Company’s capital expenditures during the periods prior to the Redemption Date. In applying applicable accounting guidance, management considered the Company’s current financial condition and liquidity sources, including current funds available, forecasted future cash flows, the Company’s obligations due over the next twelve months as well as the Company’s recurring business operating expenses. The Company adoptedconcludes that it is probable that the standard asCompany will be able to meet its obligations arising within one year of January 1, 2019 and applied retrospectively. For the three months ended March 31, 2018,date of issuance of these consolidated financial statements within the adoption resultedparameters set forth in a reductionthe accounting guidance. | 3. | 3. Investment Properties |
Investment properties consist of the following: | | | March 31, 2019
(unaudited) | | | December 31, 2018 | | | | | | | | | | | | | | | | March 31, 2024 | | | December 31, | | | | | | (unaudited) | | | 2023 | | | Land | | $ | 7,462,946 | | | $ | 7,462,946 | | | $ | 14,733,611 | | $ | 13,720,502 | | | Site improvements | | | 2,341,547 | | | | 2,341,547 | | | | 3,335,269 | | | 3,797,755 | | | Buildings and improvements (a) | | | 36,330,755 | | | | 35,753,467 | | | | Furniture and fixtures (b) | | | 2,077,184 | | | | 1.733,273 | | | | Investment properties at cost (c) | | | 48,212,432 | | | | 47,291,233 | | | Buildings and improvements (1) | | | | 59,459,305 | | | 58,183,070 | | Investment properties at cost (2) | | | | 77,528,185 | | | 75,701,327 | | | Less accumulated depreciation | | | 2,375,326 | | | | 1,967,736 | | | | 11,222,557 | | | 11,123,951 | | | Investment properties, net | | $ | 45,837,106 | | | $ | 45,323,497 | | | $ | 66,305,628 | | $ | 64,577,376 | |
| (1) | (a) | Includes tenant improvements (both those acquired atas part of the acquisition of the properties and those constructed after the acquisition)acquisition of the properties), tenant inducements,incentives, capitalized leasing commissions and other capital costs incurred post-acquisition. |
| (2) | (b) | As of March 31, 2019 and December 31, 2018, excludes $281,148 and $423,747, respectively, in pre-payments recorded as advance deposits for furniture and fixtures not yet received as part of the renovations of the Hampton Inn Property. The Company reclassifies the amounts recorded as advance deposits to a furniture and fixtures account when the assets are placed in service. |
| (c) | Excludes intangible assets and liabilities (see note, below)Note 2, above, for a discussion of the Company’s accounting treatment of intangible assets), escrow deposits and property reserves. |
The Company’s depreciation expense on investment properties was $403,330 $840,461 and $302,304$911,481 for the three months ended March 31, 2024 and 2023, respectively. Capitalized Tenant Improvements The Company carries three categories of capitalized tenant improvements on its condensed consolidated balance sheets, all of which are recorded under investment properties, net, on the Company’s condensed consolidated balance sheets. The first category is the allocation of acquisition costs to tenant improvements that is recorded on the Company’s condensed consolidated balance sheets as of the date of the Company’s acquisition of the investment property. The second category is tenant improvement costs incurred and paid by the Company subsequent to the acquisition of the investment property. Both categories are recorded as a component of investment properties on the Company’s condensed consolidated balance sheets. Depreciation expense on both categories is recorded on a straight-line basis as a component of depreciation expense on the Company’s condensed consolidated statement of operations. The third category is tenant improvement costs incurred and paid by the Company subsequent to the acquisition of the investment property that are considered to be lease incentives under ASC 842. Depreciation expense for lease incentives is recorded as a reduction of rental income on a straight-line basis over the term of the respective lease. Details of these deferred costs, net of depreciation are as follows: | | | | | | | | | | March 31, | | | | | | | 2024 | | December 31, | | | | (unaudited) | | 2023 | | Capitalized tenant improvements – acquisition cost allocation, net | | $ | 2,416,009 | | $ | 2,504,953 | | Capitalized tenant improvements incurred subsequent to acquisition, net | | | 945,426 | | | 898,873 | |
Depreciation of capitalized tenant improvements arising from the acquisition cost allocation was $136,155 and $172,888 for the three months ended March 31, 20192024 and 2018,2023, respectively. During the three months ended March 31, 2024, the Company recorded $47,211 in tenant improvements arising from the acquisition of the Citibank Property. No such additions were recorded during the three months ended March 31, 2023. During the three months ended March 31, 2023, the Company wrote off capitalized tenant improvements of $8,656 associated with the tenant that abandoned its premises. No such write offs were recorded during the three months ended March 31, 2024. During the three months ended March 31, 2024 and 2023, the Company recorded $110,630 and $377,265, respectively, in capitalized tenant improvements. Depreciation of capitalized tenant improvements incurred subsequent to acquisition was $64,077 and $32,265 for the three months ended March 31, 2024 and 2023, respectively. Depreciation of tenant improvements considered to be lease incentives and recorded as a reduction of rental income was $741 and $0 for the three months ended March 31, 2024 and 2023, respectively. Capitalized Leasing Commissions The Company carries two categories of capitalized leasing commissions on its condensed consolidated balance sheets. The first category is the allocation of acquisition costs to leasing commissions that is recorded as an intangible asset (see Note 2, above, for a discussion of the Company’s accounting treatment for intangible assets) on the Company’s condensed consolidated balance sheet as of the date of the Company’s acquisition of the investment property. The second category is leasing commissions incurred and paid by the Company subsequent to the acquisition of the investment property. These costs are carried on the Company’s condensed consolidated balance sheets under investment properties. The Company generally records depreciation of capitalized tenant improvements and amortization of capitalized leasing commissions on a straight-line basis over the terms of the related leases. Details of these deferred costs, net of depreciation and amortization as of March 31, 2019 and December 31, 2018, respectively, are as follows: | | | March 31, 2019
(unaudited) | | | December 31, 2018 | | | | Capitalized tenant improvements, net | | $ | 197,370 | | | $ | 175,580 | | | | | | | | | | | | | | | March 31, 2024 | | December 31, | | | | | (unaudited) | | 2023 | | | Capitalized leasing commissions, net | | | 314,529 | | | | 322,861 | | | $ | 768,801 | | $ | 759,677 | |
During the three months ended March 31, 2024 and 2023, the Company recorded $54,963 and $90,637, respectively, in capitalized leasing commissions. Depreciation on capitalized tenant improvementsleasing commissions was $9,494$45,839 and $3,851$31,930 for the three months ended March 31, 20192024 and 2018,2023, respectively. Amortization Assets Held for Sale The Company records properties as assets held for sale, and any associated mortgages payable, net, as mortgages payable, net, associated with assets held for sale, on the Company’s condensed consolidated balance sheets when management has committed to a plan to sell the assets, actively seeks a buyer for the assets, and the consummation of capitalized leasing commissionsthe sale is considered probable and is expected within one year. During November 2023, the Company committed to a plan to sell an asset group associated with the Hanover Square Shopping Center Property that includes the land associated with the Hanover Square Shopping Center (excluding the land associated with the Hanover Square Outparcel), site improvements, building, building improvements and tenant improvements. As a result, as of December 1, 2023, the Company reclassified these assets, and the related mortgage payable, net, for the Hanover Square Shopping Center Property as assets held for sale and liabilities associated with assets held for sale, respectively. Under ASC 360, depreciation of assets held for sale is discontinued, so no further depreciation or amortization was $9,678recorded subsequent to December 1, 2023. The Company believed that the fair value, less estimated costs to sell, exceeded the Company’s carrying cost, so the Company has not recorded any impairment of assets held for sale related to the Hanover Square Shopping Center Property for any period subsequent to December 1, 2023. As of March 31, 2024 and $1,711December 31, 2023, assets held for sale and liabilities associated with assets held for sale consisted of the following: | | | | | | | | | | | March 31, 2024 | | | December 31, | | | | (unaudited) | | 2023 | | Investment properties, net | | $ | — | | $ | 9,707,154 | | Total assets held for sale | | $ | — | | $ | 9,707,154 | |
| | | | | | | | | | March 31, 2024 | | December 31, | | | | (unaudited) | | 2023 | | Mortgages payable, net | | $ | — | | $ | 9,588,888 | | Total liabilities associated with assets held for sale | | $ | — | | $ | 9,588,888 | |
Sale of Investment Property On March 13, 2024, the Company sold the Hanover Square Shopping Center Property to an unrelated third party for a sale price of $13.0 million, less credits for repairs of $85,000, resulting in a gain on disposal of investment properties of $2,819,502 reported on the Company’s condensed consolidated statement of operations for the three months ended March 31, 2019 and 2018, respectively. In May 2018,2024. The Company did not report any gain or loss on the Company paid $125,000 to induce a tenant in the Franklin Square Property to release a restriction in its lease that prohibited the Company from leasing space to a similar user. Capitalized tenant inducements are amortized as a reductiondisposal of rental income over the term of the respective lease. Details of these deferred costs, net of depreciation and amortization as of March 31, 2019 and December 31, 2018, respectively, are as follows:
| | | March 31, 2019
(unaudited) | | | December 31, 2018 | | | Capitalized tenant inducements, net | | $ | 109,380 | | | $ | 113,640 | |
Amortization of the tenant inducement was $4,260 and $0investment properties for the three months ended March 31, 2019 and 2018, respectively.2023.
A significant portionThe Company reports properties that are either previously disposed of or currently held for sale in continuing operations in the Company’s condensed consolidated statements of operations if the disposition, or anticipated disposition, of the assets does not represent a shift in the Company’s land, buildings and improvements serve as collateral for its mortgage loans payable portfolio. Accordingly, restrictions exist as to each property’s transferability, use and other common rights typically associated with property ownership.
Property Acquisitions
2018 Acquisition
investment strategy. The Company’s sale of the Hanover Square Shopping Center Property does not constitute a change in the Company’s investment strategy, which continues to include retail center properties as a targeted asset class. Operating results of the Hanover Square Shopping Center Property, which are included in continuing operations, are as follows: | | | | | | | | | | For the three months ended | | | | March 31, | | | | | 2024 | | | 2023 | | | | (unaudited) | | (unaudited) | | Revenue | | | | | | | | Retail center property revenues | | $ | 307,325 | | $ | 331,437 | | Total Revenue | | | 307,325 | | | 331,437 | | | | | | | | | | Operating Expenses | | | | | | | | Retail center property operating expenses | | | 88,342 | | | 89,153 | | Depreciation and amortization | | | — | | | 76,176 | | Total Operating Expenses | | | 88,342 | | | 165,329 | | Gain on disposal of investment properties | | | 2,819,502 | | | — | | Loss on extinguishment of debt | | | 51,837 | | | — | | Operating Income | | | 2,986,648 | | | 166,108 | | Interest expense | | | 129,248 | | | 173,863 | | Net Income (Loss) | | | 2,857,400 | | | (7,755) | | Less: Net income (loss) attributable to Hanover Square Property noncontrolling interests | | | 457,184 | | | (1,241) | | Less: Net income (loss) attributable to Operating Partnership noncontrolling interests | | | 105,610 | | | (78) | | Net Income (Loss) Attributable to Medalist Common Shareholders | | $ | 2,294,606 | | $ | (6,436) | |
2024 Property Acquisitions Acquisition of 16% noncontrolling interest in the Hanover Square Outparcel On May 8, 2018,March 25, 2024, the Company completed the acquisition of its tenant in common partner’s 16% ownership interest in the Hanover Square Outparcel through a wholly-owned subsidiary. The purchase price for the 16% interest in the Hanover Square Outparcel was $98,411 paid in cash. The Company’s total investment was $100,891. The Company incurred $2,480 of closing costs which were capitalized and added to the tangible assets acquired. Citibank Property On March 28, 2024, the Company completed its acquisition of an 84 percent interestthe Citibank Property, a 4,350 square foot single tenant building on 0.45 acres located in the Hanover Square PropertyChicago, Illinois, through a whollywholly-owned subsidiary, from RMP 3535 N. Central Ave., LLC. The sole manager and member of RMP 3535 N. Central Ave., LLC is CWS BET Seattle, LP, a Delaware limited partnership, a company controlled and owned subsidiary.by Frank Kavanaugh, the Company’s Chief Executive Officer and a member of the Company’s Board of Directors. The Citibank Property, built in 1954 and subsequently renovated, was 100% leased to Citibank, NA. The purchase price for the Hanover SquareCitibank Property was $12,173,000$2,400,000 paid through the issuance of 417,391 operating partnership units at a combinationprice of cash provided by the Company, assumed secured debt which amount was increased by additional debt and cash provided by the 16 percent noncontrolling investor.$5.75 per operating partnership unit. The Company’s total investment including acquisition andwas $2,444,454. The Company incurred $44,454 of closing costs escrowswhich were capitalized and lease reserves was $12,961,557, including $122,033added to the tangible assets acquired. | | | | | | | | | | | | | | | | NCI Interest in | | | | | | | | | | | | | Hanover Square | | | | Citibank | | | | | | | | | Outparcel | | | | Property | | | | Total | | Fair value of assets acquired: | | | | | | | | | | | | | Investment property | | $ | 100,891 | (a) | | $ | 2,298,373 | (a) | | $ | 2,399,264 | | Lease intangibles | | | — | | | | 245,837 | (b) | | | 245,837 | | Below market leases | | | — | | | | (99,756) | (b) | | | (99,756) | | Fair value of net assets acquired | | $ | 100,891 | (b) | | $ | 2,444,454 | (c) | | $ | 2,545,345 | | | | | | | | | | | | | | | Purchase consideration: | | | | | | | | | | | | | Consideration paid with cash | | $ | 100,891 | (c) | | $ | 44,454 | (d) | | $ | 145,345 | | Consideration paid with operating partnership units | | | — | | | | 2,400,000 | (e) | | | 2,400,000 | | Total consideration | | $ | 100,891 | (d) | | $ | 2,444,454 | (f) | | $ | 2,545,345 | |
NCI Interest in cash provided by a non-controlling investor. The Hanover Square Property, built in 2007, was 97 percent leased as of March 31, 2019 and is anchored by Marshalls and an Old Navy store. The following summarizes the consideration paid and the fair values of assets acquired and liabilities assumed in conjunction with the acquisition described above, along with a description of the methods used to determine fair value. Asset values presented include allocated acquisition and closing costs.
| | | Hanover Square | | | Fair value of assets acquired | | | | | | Investment property (a) | | $ | 11,493,360 | | | Lease intangibles and other assets (b) | | | 1,093,057 | | | Escrows and property reserves created or acquired (c) | | | 300,000 | | | Above market leases (b) | | | 170,154 | | | Below market leases (b) | | | (217,047 | ) | | Fair value of net assets acquired (d) | | $ | 12,839,524 | | | | | | | | | Purchase consideration | | | | | | Consideration paid with cash (e) | | $ | 3,291,404 | | | Consideration paid with assumed mortgage debt (f) | | | 8,527,315 | | | Consideration paid with new mortgage debt (g) | | | 372,685 | | | Consideration paid by noncontrolling interest (h) | | | 648,120 | | | Total consideration (i) | | $ | 12,839,524 | |
Outparcel | a. | Represents the acquisition cost of the land acquired. Closing costs were allocated and added to the fair value of the tangible assets acquired. |
| b. | Represents the total acquisition cost of the land acquired at closing. |
| c. | Represents cash paid for closing costs. |
| d. | Represents the consideration paid for the acquisition cost of the assets acquired. |
Citibank Property | a. | Represents the fair value of the investment property acquired which includes land, buildings, site improvements and tenant improvements and furniture and fixtures.improvements. The fair value was determined using the market approach, the cost approach, the income approach or a combination thereof. Closing and acquisition costs were allocated and added to the fair value of the tangible assets acquired. |
| b. | Represents the fair value of lease intangibles and other assets.intangibles. Lease intangibles include leasing commissions, leases in place, above market leases, below market leases and legal and marketing costs associated with replacing existing leases. |
| c. | Escrow deposits are restricted cash balances held by lenders for real estate taxes, insurance and reserves for capital improvements. These are generally created at closing. For the Hanover Square Property, $200,000 in existing reserves were purchased at closing from the Seller as part of the loan assumption (see (f) below) and the Company funded $100,000 in additional escrows at closing. |
| d. | Represents the total fair value of assets and liabilities acquired at closing. |
| d. | e. | Represents cash paid at closing and cash paid for acquisition (including intangible assets), escrows and closing costs paid outside ofat closing or directly by the Company.Company outside of closing. |
| e. | Represents issuance of 417,391 Operating Partnership Units at $5.75 per Operating Partnership Unit. See Note 7, below. |
| f. | Assumption of mortgage debt related to the purchase of the Hanover Square Property. |
| g. | Issuance of new mortgage debt (an increase in the amount of the assumed mortgage) to fund the purchase of the Hanover Square Property. See mortgages payable. |
| h. | Represents investment of noncontrolling interest paid at closing for the Hanover Square Property. |
| i. | Represents the consideration paid for the fair value of the assets and liabilities acquired. |
2017 Acquisitions4.Mandatorily Redeemable Preferred Stock
On February 19, 2020, the Company issued and sold 200,000 shares of 8.0% Series A cumulative redeemable preferred stock at $23.00 per share, resulting in gross proceeds of $4,600,000. Net proceeds from the issuance were $3,860,882, which includes the impact of the underwriter’s discounts, selling commissions and legal, accounting and other professional fees, and is presented on the Company’s condensed consolidated balance sheets as mandatorily redeemable preferred stock. If outstanding on February 19, 2025, the mandatorily redeemable preferred stock must be redeemed by the Company, out of funds legally available therefor, on that date, the fifth anniversary of the date of issuance. Beginning on February 19, 2022, the second anniversary of the issuance, the Company may redeem the outstanding mandatorily redeemable preferred stock for an amount equal to its aggregate liquidation preference, plus any accrued but unpaid dividends. The holders of the mandatorily redeemable preferred stock may also require the Company to redeem the stock upon a change of control of the Company for an amount equal to its aggregate liquidation preference plus any accrued and unpaid dividends thereon. The Franklin Square Property On April 28, 2017,Company believes that it has a range of options available to fund the Company completed its acquisitionredemption of the Franklin Square Property through a wholly owned subsidiary. The purchase price for the Franklin Square Property was $20,500,000 paid throughmandatorily redeemable preferred stock including using a combination of cash on hand and assumed, secured debt. The Company’s total investment, including acquisition and closing costs, escrows and lease reserves was $22,054,071. The Franklin Square Property, built in 2006 and 2007, was 68 percent leased ascash generated from operations for the remaining nine months ended December 31, 2024. In addition to these funding sources, the Company believes that it could generate cash to redeem the mandatorily redeemable preferred stock by issuing a new series of preferred stock or issuing other debt or equity instruments. There is no assurance that the Company will be able to generate sufficient funding to fund the redemption of the acquisition datemandatorily redeemable preferred stock.
The Company has classified the mandatorily redeemable preferred stock as a liability in accordance with ASC Topic No. 480, “Distinguishing Liabilities from Equity,” which states that mandatorily redeemable financial instruments should be classified as liabilities and is anchored by Ashley Furniture. therefore the related dividend payments are treated as a component of interest expense in the accompanying condensed consolidated statements of operations (see Note 5, below, for a discussion of interest expense associated with the mandatorily redeemable preferred stock). For the following periods during which the mandatorily redeemable preferred stock has been outstanding, the Company has paid a cash dividend on the stock equal to 8% per annum, paid quarterly, as follows: | | | | | | | | | | | | Amount | | | Payment Date | | Record Date | | per share | | For the period | April 27, 2020 | | April 24, 2020 | | $ | 0.37 | | February 19, 2020 - April 27, 2020 | July 24, 2020 | | July 22, 2020 | | | 0.50 | | April 28, 2020 - July 24, 2020 | October 26, 2020 | | October 23, 2020 | | | 0.50 | | July 25, 2020 - October 26, 2020 | February 1, 2021 | | January 29, 2021 | | | 0.50 | | October 27, 2020 - February 1, 2021 | April 30, 2021 | | April 26, 2021 | | | 0.50 | | February 2, 2021 – April 30, 2021 | July 26, 2021 | | July 12, 2021 | | | 0.50 | | May 1, 2021 - July 26, 2021 | October 27, 2021 | | October 25, 2021 | | | 0.50 | | July 27, 2021 – October 26, 2021 | January 20, 2022 | | January 13, 2022 | | | 0.50 | | October 27, 2021 – January 19, 2022 | April 21, 2022 | | April 18, 2022 | | | 0.50 | | January 20, 2022 - April 20, 2022 | July 21, 2022 | | July 18, 2022 | | | 0.50 | | April 21, 2022 - July 20, 2022 | October 20, 2022 | | October 17, 2022 | | | 0.50 | | July 21, 2022 - October 19, 2022 | January 27, 2023 | | January 24, 2023 | | | 0.50 | | October 20, 2022 - January 19, 2023 | April 28, 2023 | | April 25, 2023 | | | 0.50 | | January 20, 2023 - April 20, 2023 | November 1, 2023 | | October 30, 2023 | | | 0.50 | | April 21, 2023 - July 20, 2023 | November 1, 2023 | | October 30, 2023 | | | 0.50 | | July 21, 2023 - October 20, 2023 | February 6, 2024 | | February 2, 2024 | | | 0.50 | | October 21, 2023 - January 20, 2024 | April 25, 2024 | | April 22, 2024 | | | 0.50 | | January 21, 2024 - April 21, 2024 |
As of March 31, 2019,2024 and December 31, 2023, the Franklin Square Property was 92.4 percent occupied. Company recorded $70,004 and $70,004, respectively, in accrued but unpaid dividends on the mandatorily redeemable preferred stock. This amount is reported in accounts payable and accrued liabilities on the Company’s condensed consolidated balance sheets. The Hampton Inn Property On November 3, 2017mandatorily redeemable preferred stock was issued at $23.00 per share, a $2.00 per share discount. The total discount of $400,000 is being amortized over the five-year life of the shares using the effective interest method. Additionally, the Company completed its acquisitionincurred $739,118 in legal, accounting, other professional fees and underwriting discounts related to this offering. These costs were recorded as deferred financing costs on the accompanying condensed consolidated balance sheets as a direct deduction from the carrying amount of a 64 percentthe mandatorily redeemable preferred stock liability and are being amortized using the effective interest method over the term of the agreement.
Amortization of the discount and deferred financing costs related to the mandatorily redeemable preferred stock totaling $64,126 and $58,804 was included in interest expense for the three months ended March 31, 2024 and 2023, respectively, in the Hampton Inn Property through a wholly owned subsidiary. The total purchase price foraccompanying condensed consolidated statements of operations. Accumulated amortization of the Hampton Inn Propertydiscount and deferred financing costs was $15.1 million paid through a combination$896,819 and $832,693 as of cash provided by the Company, operating partnership units (“OP Units”), the incurrenceMarch 31, 2024 and December 31, 2023, respectively. 5. Loans Payable Mortgages Payable The Company’s mortgages payables, were $33,246,700 and $33,236,397 asnet consists of March 31, 2019 and December 31, 2018, respectively.the following: | | | | | | | | | | | | | | | | | | | | | | | | | March 31, | | | | | | | Monthly | | Interest | | | | | 2024 | | | December 31, | | Property | | Payment | | Rate | | Maturity | | (unaudited) | | 2023 | | Franklin Square (a) | | | Interest only | | 3.808 | % | December 2031 | | $ | 13,250,000 | | $ | 13,250,000 | | Ashley Plaza (b) | | $ | 52,795 | | 3.75 | % | September 2029 | | | 10,651,510 | | | 10,708,557 | | Brookfield Center (c) | | $ | 22,876 | | 3.90 | % | November 2029 | | | 4,547,770 | | | 4,571,410 | | Parkway Center (d) | | $ | 28,161 | | Variable | | November 2031 | | | 4,856,285 | | | 4,870,403 | | Wells Fargo Mortgage Facility (e) | | $ | 103,438 | | 4.50 | % | June 2027 | | | 17,832,561 | | | 17,939,276 | | Unamortized issuance costs, net | | | | | | | | | | (543,106) | | | (566,873) | | Total mortgages payable, net | | | | | | | | | $ | 50,595,020 | | $ | 50,772,773 | |
| | | | | | | | | | Balance | | | | | | | | | | | | December 31, | | | Property | | Monthly
Payment | | Interest
Rate | | | Maturity | | March 31, 2019
(unaudited) | | | December 31, 2018 | | | | | | | | | | | | | | | | | | Franklin Square | | Interest only | | | 4.7 | % | | October 2021 | | $ | 14,275,000 | | | $ | 14,275,000 | | | Hampton Inn (a) | | Interest only | | | Variable | (b) | | November 2020 | | | 10,600,000 | | | | 10,600,000 | | | Hanover Square (c) | | $ | 51,993 | | | 4.9 | % | | December 2027 | | | 8,740,154 | | | | 8,772,562 | | | | | | | | | | | | | | | | | | | | | Unamortized issuance costs, net | | | | | | | | | | | (368,454 | ) | | | (411,165 | ) | | Total mortgages payable, net | | | | | | | | | | $ | 33,246,700 | | | $ | 33,236,397 | |
| (a) | CertainThe mortgage loan for the Franklin Square Property bears interest at a fixed rate of 3.808% and is interest only until January 6, 2025, at which time the monthly payment will become $61,800, which includes interest and principal based on a thirty-year amortization schedule. The mortgage loan includes covenants for the Company to maintain a net worth of $13,250,000, excluding the assets and liabilities associated with the Franklin Square Property and for the Company to maintain liquid assets of no less than $1,000,000. As of March 31, 2024 and December 31, 2023, the Company believes that it is compliant with these covenants. The Company has guaranteed the payment and performance of the Company’s obligationobligations of the mortgage loan. |
| (b) | The mortgage loan for the Ashley Plaza Property bears interest at a fixed rate of 3.75% and was interest only for the first twelve months of its term. Beginning on October 1, 2020, the monthly payment became $52,795 for the remaining term of the loan, which includes interest at the fixed rate, and principal, based on a thirty-year amortization schedule. Effective on December 26, 2023, the Company assumed certain guaranty obligations under the Ashley Plaza Property mortgage loan related to the Guaranty Substitution (see below). These obligations include covenants for the Company to maintain a net worth of $11,400,000, excluding the liabilities associated with the mortgage loan for the Hampton InnAshley Plaza Property, and for the Company to complete a property improvement plan (PIP) are guaranteed by individual membersmaintain liquid assets of no less than $1,140,000. As of March 31, 2024 and December 31, 2023, the Manager and by an individual member of the noncontrolling owner. This guaranteeCompany believes that it is irrevocable and unconditional and requires the PIP work to be completed on schedule and free of all liens.compliant with these covenants. |
| (c) | (b) | The mortgage loan for the Hampton InnBrookfield Center Property bears interest at a variablefixed rate of 3.90% and was interest only for the first twelve months of the term. Beginning on November 1, 2020, the monthly payment became $22,876 for the remaining term of the loan, which includes interest at the fixed rate, and principal, based on a thirty-year amortization schedule. Effective on December 26, 2023, the Company assumed certain guaranty obligations under the Brookfield Center Property mortgage loan related to the Guaranty Substitution (see below). These obligations include covenants for the Company to maintain a net worth of $4,850,000, excluding the liabilities associated with the mortgage loan for the Brookfield Center Property, and for the Company to maintain liquid assets of no less than $485,000. As of March 31, 2024 and December 31, 2023, the Company believes that it is compliant with these covenants. |
| (d) | The interest rate for the mortgage loan for the Parkway Property was originally based on ICE LIBOR plus 225 basis points, with a minimum rate of 6.1 percent. The2.25%. After the discontinuation of LIBOR on June 30, 2023, the ICE LIBOR index was replaced by Term SOFR, with an adjusted margin of 236.44 basis points. Under the terms of the mortgage, the interest rate payable is the USD LIBOR one-month rate plus 5 percent.each month shall not change by greater than 1% during any six-month period and 2% during any 12-month period. As of March 31, 20192024 and December 31, 2018,2023 the rate in effect for the Hampton InnParkway Property mortgage was 7.50 percent. 7.05%. The monthly payment, which varies based on the interest rate in effect each month, includes interest at the variable rate, and principal based on a thirty-year amortization schedule. The mortgage loan for the Parkway Property includes a covenant to maintain a debt service coverage ratio of not less than 1.30 to 1.00 on an annual basis. As of March 31, 2024 and December 31, 2023, the Company believes that it is compliant with this covenant. |
| (e) | On June 13, 2022, the Company entered into a mortgage loan facility with Wells Fargo Bank (the “Wells Fargo Mortgage Facility”) in the principal amount of $18,609,500. The proceeds of this mortgage were used to finance the acquisition of the Salisbury Marketplace Property and to refinance the mortgages payable on the Lancer Center Property and the Greenbrier Business Center Property. The Wells Fargo Mortgage Facility bears interest at a fixed rate of 4.50% for a five-year term. The |
| | monthly payment, which includes interest at the fixed rate, and principal, based on a twenty-five-year amortization schedule, is $103,438. The Company has provided an unconditional guaranty of the payment of and performance under the terms of the Wells Fargo Mortgage Facility. The Wells Fargo Mortgage Facility credit agreement includes covenants to maintain a debt service coverage ratio of not less than 1.50 to 1.00 on an annual basis, a combined minimum debt yield of 9.5% on the Salisbury Marketplace Property, the Lancer Center Property and the Greenbrier Business Center Property, and the maintenance of liquid assets of not less than $1,500,000. As of March 31, 2024 and December 31, 2023, the Company believes that it is compliant with these covenants. |
Guaranty Substitution Pursuant to the terms of the Termination Agreement, during December 2023, the Company entered into consent agreements with lenders for the Ashley Plaza Property, Brookfield Property, Franklin Square Property and Parkway Property mortgages under which the Company replaced certain guaranty obligations of Messrs. Messier and Elliott. Under these agreements, the Company assumed guaranties related to environmental waste and acts of fraud, among others, and consented to certain covenants (discussed above) to maintain minimum net worth and liquidity levels. For the Franklin Square Property mortgage loan, the termination of the Management Agreement was considered an event of default. Under the consent agreement for the Franklin Square Property mortgage loan, the lender agreed to waive the event of default in exchange for the payment of a $132,500 consent fee, and the Company’s agreement to fully guaranty the Franklin Square Property mortgage loan. The $132,500 consent fee was recorded as part of the management restructuring fee on the condensed consolidated statement of operations for the year ended December 31, 2023. No such expenses were recorded for the three months ended March 31, 2024 and 2023. Mortgages payable, net, associated with assets held for sale The Company’s mortgages payables, net, associated with assets held for sale, consists of the following: | | | | | | | | | | | | | | | | | | | | | | Balance | | | | | | | | | | | March 31, | | | | | | | Monthly | | Interest | | | | | 2024 | | | December 31, | | Property | | Payment | | Rate | | Maturity | | (unaudited) | | 2023 | | Hanover Square (a) | $ | 78,098 | | 6.94 | % | December 2027 | | | — | | | 9,640,725 | | Unamortized issuance costs, net | | | | | | | | | — | | | (51,837) | | Total mortgages payable, net, associated with assets held for sale | | | | | | | | $ | — | | $ | 9,588,888 | |
| (a) | (c) | The mortgage loan for the Hanover Square property bearsProperty bore interest at a fixed rate of 4.9%4.25% until January 1, 2023, when the interest rate adjustsadjusted to a new fixed rate of 6.94%, which will bewas determined by adding 3.10 percentage points3.00% to the daily average yield on United States Treasury securities adjusted to a constant maturity of five years, as made available by the Federal Reserve Board, with a minimum of 4.9%4.25%. TheAs a result of the interest rate change, as of February 1, 2023, the fixed monthly payment includesof $56,882 increased to $78,098 which included interest at the fixed rate, and principal, based on a twenty-five-year amortization schedule. On March 13, 2024, the Company sold the Hanover Square Shopping Center Property and interest. Therepaid the mortgage loan agreement for the Hanover Square property includes covenants to (i) maintain a Debt Service Coverage Ratio (“DSCR”) in excess of 1.35 to 1.00 and (ii) maintain a loan-to-value of real estate ratio of 75%. As of March 31, 2019, the Company believes that it is complaint with these covenants.Property. |
For the FranklinLoss on Extinguishment of Debt – Hanover Square Property Mortgage Payable
On March 13, 2024, the Company sold the Hanover Square Shopping Center Property and repaid the mortgage loan for the Hanover Square Property. The Company accounted for the repayment of the mortgage payable interest expense was $167,731 and $167,731 forunder debt extinguishment accounting in accordance with ASC 470. During the three months ended March 31, 2019 and 2018, respectively. Amortization2024, the Company recorded a loss on extinguishment of capitalizeddebt of $51,837 consisting of unamortized loan issuance costscosts. No such loss was $4,638 and $4,638 forrecorded during the three months ended March 31, 2019 and 2018, respectively. Interest accrued as of March 31, 2019 and December 31, 2018 was $57,774 and $57,774, respectively. As of March 31, 2019 and December 31, 2018, accumulated amortization of capitalized issuance costs was $35,559 and $30,921, respectively.2023. For the Hampton Inn Property mortgage payable, interest expense was $199,891 and $177,844 for the three months ended March 31, 2019 and 2018, respectively. Payments received from the interest rate protection transaction (see note below) were recorded as a reduction of interest expense and were $14,391 and $0 for the three months ended March 31, 2019 and 2018, respectively. Amortization of capitalized issuance costs was $34,890 and $34,890 for the three months ended March 31, 2019 and 2018, respectively. Interest accrued as of March 31, 2019 and December 31, 2018 was $0 and $0, respectively. As of March 31, 2019 and December 31, 2018 accumulated amortization of capitalized issuance costs was $197,711 and $162,821, respectively.
For the Hanover Square Property mortgage payable, interest expense was $107,265 and $0 for the three months ended March 31, 2019 and 2018, respectively. Amortization of capitalized issuance costs was $3,183 and $0 for the three months ended March 31, 2019 and 2018, respectively. Interest accrued as of March 31, 2019 and December 31, 2018 was $35,689 and $0, respectively. As of March 31, 2019 and December 31, 2018 accumulated amortization of capitalized issuance costs was $11,671 and $8,488, respectively.
For the three months ended March 31, 2019 and 2018, respectively, other interest expense was $2,867 and $2,493.
Interest rate protection transaction On November 3, 2017,October 28, 2021, the Company entered into an Interest Rate Protection Transactioninterest rate protection transaction to limit the Company’sits exposure to increases in interest rates on the variable rate mortgage loan on the Hampton Inn Property.Parkway Property (the “Interest Rate Protection Transaction”). Under this agreement, the Company’s interest rate exposure is capped at 7 percent5.25% if USD 1-Month ICE LIBOR BBA exceeds 2 percent. USD 1-Month LIBOR3%. Effective on July 1, 2023, the interest rate index under the Interest Rate Protection Transaction automatically converted to SOFR. SOFR was 2.4945 percent5.33% and 2.51988 percent 5.35% as of March 31, 20192024 and December 31, 2018,2023, respectively. In accordance with the guidance on derivatives and hedging, the Company records all derivatives on the balance sheet at fair value. As of March 31, 2019value under other assets. The Company determines fair value based on the three-level valuation hierarchy for fair value measurement. Level 1 inputs are quoted prices in active markets for identical assets or liabilities. Level 2 inputs are quoted prices for similar assets or liabilities in active markets; quoted prices for identical or similar assets in markets that are not active; and December 31, 2018, respectively,inputs other than quoted prices. Level 3 inputs are unobservable inputs that are supported by little or no market activity and that are significant to the fair value of the interestassets or liabilities. The fair value of the Interest Rate Protection Transaction is valued by an independent, third-party consultant which uses observable inputs such as yield curves, volatilities and other current market data, all of which are considered Level 2 inputs. As of March 31, 2024 and December 31, 2023, the fair value of the Interest Rate Protection Transaction was $76,394$209,053 and $126,797.$173,715, respectively, and is recorded under other assets on the Company’s balance sheets. The Company reports changes in the fair value of the derivative as a decrease (increase) in fair value-interest rate capother income on its condensed consolidated statements of operations. Beginning in July 2018,For the USD 1-Monthperiod from September 1, 2022 through June 30, 2023, LIBOR, BBA rate exceeded two percent and remained in excess of two percent on each subsequent monthly valuation datefor the period from July 20181, 2023 through March 31, 2019. For2024, SOFR exceeded the 3% cap, and payments from the Interest Rate Protection Transaction reduced the Company’s net interest expense. Payments to the Company from the Interest Rate Protection Transaction are recorded as an offset to interest expense on the Company’s condensed consolidated statements of operations for the three months ended March 31, 20192024 and 2018,2023.
Wells Fargo Line of Credit On June 13, 2022, the Company, received $14,391through its wholly-owned subsidiaries, entered into a loan agreement with Wells Fargo Bank for a $1,500,000 line of credit (the “Wells Fargo Line of Credit”). On May 2, 2023, the Company and $0 in payments underWells Fargo Bank entered into the Interest Rate Protection Transaction, allFirst Amendment to Revolving Line of Credit Note which were recorded as a reductionextended the maturity date of the Wells Fargo Line of Credit to interest expense.
Notes payable, short term and related party notes payable, short term
June 9, 2024. As of March 31, 20192024 and 2018,December 31, 2023 the Wells Fargo Line of Credit had an outstanding balance of $0 and $1,000,000, respectively. Outstanding balances on the Wells Fargo Line of Credit will bear interest at a floating rate of 2.25% above daily SOFR. As of March 31, 2024 and December 31, 2023, SOFR was 5.33% and 5.35%, respectively. The Wells Fargo Line of Credit is secured by the Lancer Center Property, the Greenbrier Business Center Property and the Salisbury Marketplace Property, has a one-year term, is unconditionally guaranteed by the Company, hadand any outstanding balances are due on the June 9, 2024 maturity date. The Company is currently in discussions with Wells Fargo to extend the maturity date of Wells Fargo Line of Credit, but there can be no notes payable, short term or related party notes payable, short term outstanding. Duringassurance that it will be successful. Interest expense Interest expense, including amortization of capitalized issuance costs consists of the three months ended March 31, 2018,following: | | | | | | | | | | | | | | | | | | For the three months ended March 31, 2024 | | | (unaudited) | | | | | | Amortization | | Interest rate | | | | | | | | | Mortgage | | of discounts and | | protection | | Other | | | | | | Interest | | capitalized | | transaction | | interest | | | | | | Expense | | issuance costs | | payments | | expense | | Total | Franklin Square | | $ | 127,541 | | $ | 7,093 | | $ | — | | $ | — | | $ | 134,634 | Hanover Square | | | 129,248 | | | — | | | — | | | — | | | 129,248 | Ashley Plaza | | | 101,156 | | | 4,358 | | | — | | | — | | | 105,514 | Brookfield Center | | | 44,988 | | | 2,837 | | | — | | | — | | | 47,825 | Parkway Center | | | 85,675 | | | 2,757 | | | (20,787) | | | — | | | 67,645 | Wells Fargo Mortgage Facility | | | 203,598 | | | 6,722 | | | — | | | — | | | 210,320 | Wells Fargo Line of Credit | | | — | | | — | | | — | | | 15,144 | | | 15,144 | Amortization and preferred stock dividends on mandatorily redeemable preferred stock | | | — | | | 64,126 | | | — | | | 100,000 | | | 164,126 | Other interest | | | — | | | — | | | — | | | 2,292 | | | 2,292 | Total interest expense | | $ | 692,206 | | $ | 87,893 | | $ | (20,787) | | $ | 117,436 | | $ | 876,748 |
| | | | | | | | | | | | | | | | | | For the three months ended March 31, 2023 | | | (unaudited) | | | | | | Amortization | | Interest rate | | | | | | | | | Mortgage | | of discounts and | | protection | | Other | | | | | | Interest | | capitalized | | transaction | | interest | | | | | | Expense | | issuance costs | | payments | | expense | | Total | Franklin Square | | $ | 126,140 | | | 7,093 | | $ | — | | | — | | $ | 133,233 | Hanover Square | | | 170,640 | | | 3,223 | | | — | | | — | | | 173,863 | Ashley Plaza | | | 102,133 | | | 4,357 | | | — | | | — | | | 106,490 | Brookfield Center | | | 45,391 | | | 2,838 | | | — | | | — | | | 48,229 | Parkway Center | | | 47,257 | | | 2,757 | | | (19,342) | | | — | | | 30,672 | Wells Fargo Mortgage Facility | | | 206,039 | | | 6,722 | | | — | | | — | | | 212,761 | Amortization and preferred stock dividends on mandatorily redeemable preferred stock | | | — | | | 58,804 | | | — | | | 100,000 | | | 158,804 | Total interest expense | | $ | 697,600 | | $ | 85,794 | | $ | (19,342) | | $ | 100,000 | | $ | 864,052 |
Interest accrued and accumulated amortization of capitalized issuance costs consist of the Company repaid a short term note payable in the principal amount of $1,500,000. In addition, during the three months ended March 31, 2018, the Company repaid related party notes payable, short term, to five related parties totaling $677,538.following: | | | | | | | | | | | | | | | As of March 31, 2024 | | | | | | | | | (unaudited) | | As of December 31, 2023 | | | | | | Accumulated | | | | | Accumulated | | | | | | amortization of | | | | | amortization | | | Accrued | | capitalized | | Accrued | | of capitalized | | | interest | | issuance costs | | interest | | issuance costs | Franklin Square | | $ | 43,448 | | $ | 66,201 | | $ | 43,448 | | $ | 59,108 | Hanover Square | | | — | | | — | | | 55,755 | | | 71,696 | Ashley Plaza | | | 34,396 | | | 79,897 | | | 34,580 | | | 75,539 | Brookfield Center | | | — | | | 51,081 | | | — | | | 48,244 | Parkway Center | | | 28,531 | | | 26,647 | | | 28,614 | | | 23,890 | Wells Fargo Mortgage Facility | | | — | | | 47,053 | | | — | | | 40,331 | Amortization and accrued preferred stock dividends on mandatorily redeemable preferred stock | | | 70,004 | (1) | | 896,819 | | | 70,004 | (1) | | 832,693 | Total | | $ | 176,379 | | $ | 1,167,698 | | $ | 232,401 | | $ | 1,151,501 |
| (1) | Recorded as accrued interest under accounts payable and accrued liabilities on the Company’s condensed consolidated balance sheets as of March 31, 2024 and December 31, 2023, respectively. |
Debt Maturity The Company’s scheduled principal repayments on indebtedness as of March 31, 20192024 are as follows: | For the remaining nine months ending December 31, 2019 | | $ | 153,937 | | | 2020 | | | 10,814,895 | | | 2021 | | | 14,501,658 | | | 2022 | | | 237,791 | | | 2023 | | | 249,471 | | | Thereafter | | | 7,657,402 | | | Total Maturities | | $ | 33,615,154 | | | Less unamortized issuance costs | | | (368,454 | ) | | Mortgages payable, net | | $ | 33,246,700 | |
| | | | | | | Mortgages Payable | For the remaining nine months ending December 31, 2024 | | $ | 612,808 | 2025 | | | 1,091,730 | 2026 | | | 1,139,886 | 2027 | | | 17,280,528 | 2028 | | | 721,207 | Thereafter | | | 30,291,967 | Total principal payments and debt maturities | | | 51,138,126 | Less unamortized issuance costs | | | (543,106) | Net principal payments and debt maturities | | $ | 50,595,020 |
| 5. | Rentals under Operating Leases |
6. Rentals under Operating Leases Future minimum rentalsrents (based on recognizing future rents on the straight-line basis) to be received under noncancelable tenant operating leases for each of the next five years and thereafter, excluding Common Area Maintenancecommon area maintenance and other expense pass-throughs, as of March 31, 20192024 are as follows: | For the remaining nine months ending December 31, 2019 | | $ | 2,279,803 | | | 2020 | | | 2,736,315 | | | 2021 | | | 2,529,467 | | | 2022 | | | 1,566,444 | | | 2023 | | | 909,842 | | | Thereafter | | | 2,275,291 | | | Total minimum rents | | $ | 12,297,162 | |
| | | | For the remaining nine months ending December 31, 2024 | | $ | 5,424,102 | 2025 | | | 6,656,905 | 2026 | | | 4,913,650 | 2027 | | | 3,981,719 | 2028 | | | 3,238,444 | Thereafter | | | 7,136,356 | Total minimum rents | | $ | 31,351,176 |
The Company has authority to issue 1,000,000,000 shares consisting of 750,000,000 shares of common stock, $0.01 par value per share ("Common Shares"),Shares, and 250,000,000 shares of preferred stock, $0.01 par value per share ("Preferred Shares"). Substantially all of the Company’s business is conducted through its Operating Partnership. The REIT is the sole general partner of the Operating Partnership and owned a 94.89%an 82.60% and 98.81% interest in the Operating Partnership as of March 31, 20192024 and December 31, 2018.2023, respectively. Limited partners in the Operating Partnership who have held their unitsOperating Partnership Units for one year or longer have the right to redeem their common unitsOperating Partnership Units for cash or, at the REIT’s option, Common Shares at a ratio of one common unitOperating Partnership Unit for one common share. Under the Agreement of Limited Partnership, distributions to unitOperating Partnership Unit holders are made at the discretion of the REIT. The REIT intends to make distributions in a manner that will result in limited partners of the Operating Partnership receiving distributions at the same rate per unitOperating Partnership Unit as dividends per share are paid to the REIT’s holders of Common Shares. Completion of 1-for-8 Reverse Stock Split In January 2018,
On May 3, 2023, the Company issued and sold 775,460completed a reverse stock split of its Common Shares, and in February, 2018a corresponding adjustment to the Company issued and sold 63,620outstanding common Operating Partnership Units of the Operating Partnership, at a ratio of 1-for-8 (the “Reverse Stock Split”). The Reverse Stock Split automatically converted every eight Common Shares at an offering price of $10.00 per share. Net proceeds from the issuances totaled $7,684,167, which includes the impact of discounts and offering costs, including the underwriters' selling commissions and legal, accounting and other professional fees.then outstanding into one Common Share. Shelf Registration On June 6, 201821, 2021, the Company issuedfiled a shelf registration statement on Form S-3 with the SEC. The Company incurred $84,926 in legal costs, filing fees and sold 8,500 other costs associated with this shelf registration statement which are recorded as offering costs as part of stockholders' equity on the Company’s condensed consolidated balance sheets as of March 31, 2024 and December 31, 2023, respectively. Common Shares at an offering price of $10.00 per share. Net proceeds from the issuance totaled $65,825, which includes the impact of discounts and offering costs, including the underwriter’s selling commissions and legal, accounting and other professional fees. On November 30, 2018, the Company issued and sold 240,000 Common Shares at an offering price of $10.00 per share. Net proceeds from the issuance totaled $1,838,727, which includes the impact of discounts and offering costs, including the underwriter’s selling commissions and legal, accounting and other professional fees. The Company also incurred $299,624 in other issuance costs during the year ended December 31, 2018.
Operating Partnership Units Outstanding As of March 31, 20192024 and December 31, 20182023, there were 2,446,582 common units of the2,707,679 and 2,245,501 Operating Partnership Units outstanding, respectively, with the REIT owning 2,321,5822,236,631 and 2,218,810 of these common units.Operating Partnership Units, respectively. As of March 31, 20192024 and December 31, 2018,2023, the remaining 471,048 and 26,691 Operating Partnership Units, respectively, are held by noncontrolling, limited partners. As of March 31, 2024 and December 31, 2023, respectively, there were 2,321,5822,236,631 and 2,218,810 Common Shares of the REIT outstanding.outstanding, respectively. As of March 31, 20192024 and December 31, 2018,2023, there were 125,000 common units of the14,960 Operating Partnership Units and 26,691 Operating Partnership Units, respectively, held by noncontrolling, limited partners that were eligible for conversion to the Company’s Common Shares. On October 4, 2018, the Company issued a warrant to Moloney Securities Co. Inc. (the “Holder), the lead underwriter of the issuances of the Company’s Common Shares in 2017 and the first six months of 2018, which grants the Holder the right to purchase 49,890 shares of the Company’s Common Shares, in whole or in part, at an exercise price of $12.50 per share, subject to certain conditions. The warrant was valued at $49,890 in the consolidated financial statements, its fair value as of the date of issuance using the Black-Scholes Model.
2018 Equity Incentive Plan The Company’s 2018 Equity Incentive Plan (the “Plan”“Equity Incentive Plan”) was adopted by the Company’s Board of Directors on July 27, 2018 and approved by the Company’s shareholders on August 23, 2018. The Equity Incentive Plan permits the grant of stock options, stock appreciation rights, stock awards, performance units, incentive awards and other equity-based awards (including LTIP units of the Company’s Operating Partnership) to its employees or an affiliate (as defined in the Equity Incentive Plan) of the Company and for up to the greater of (i) 240,000 shares of common stock30,000 Common Shares and (ii) eight percent (8%)(8)% of the number of fully diluted shares of the Company’s Common Shares (taking into account interests in the Operating Partnership that may become convertible into Common Shares). On August 31, 2018,January 18, 2024, the Company’s Board of DirectorsCompensation Committee approved a grant of 80,000 shares of15,275 Common Shares to two employeesthe Company’s five independent directors, a grant of the Manager who also serve as directors2,546 Common Shares to a consultant of the Company and a grant of 6,000 Common Shares38,697 Operating Partnership Units to the Company’s three independent directors.President and CEO, under the Equity Incentive Plan. The effective date of the grants was December 4, 2018, the date on which the registration of the Plan shares was effective.January 18, 2024. The Common Shares granted vestvested immediately and are unrestricted. The Operating Partnership Units granted vested immediately but will be restricted for six months by a lock-up agreement associated with the Company’s sale of itsare not convertible to Common Shares on November 27, 2018. In addition,until January 18, 2025. However, the Equity Incentive Plan includes other restrictions on the sale of shares issued under the Equity Incentive Plan. Because the Common Shares vestand Operating Partnership Units vested immediately, the fair value of the grants, or $790,340,$277,500, was recorded to share based compensation expense on the Company’s condensed consolidated statements of operations on the effective date of the grant. The fair value of the grants was determined by the market price of the Company’s Common Shares on the effective date of the grant. AsOn each January 1 during the term of Marchthe Equity Incentive Plan, the maximum number of Common Shares that may be issued under the Equity Incentive Plan will increase by eight percent (8%) of any additional Common Shares or interests in the Operating Partnership issued (i) after the completion date the Company’s initial registered public offering of Common Shares, in the case of the January 1, 2019 adjustment, or (ii) in the preceding calendar year, in the case of any adjustment subsequent to January 1, 2020. During the year ended December 31, 2019, there are 154,0002023, no shares were issued under the Equity Incentive Plan so no adjustment was made as of January 1, 2024, and the shares available for issuance under the Equity Incentive Plan remained at 61,413 shares. As of March 31, 2024, there are 4,895 shares available for issuance under the Equity Incentive Plan.
Earnings per share Per Share Basic earnings per share for the Company’s Common Shares is calculated by dividing income (loss) from continuing operations, excluding the net lossincome (loss) attributable to noncontrolling interests, by the Company’s weighted-average number of Common Shares outstanding during the period. Diluted earnings per share is computed by dividing the net income attributable to common shareholders, excluding the net loss attributable to noncontrolling interests, by the weighted average number of Common Shares, including any dilutive shares. As of March 31, 20192024 and December 31, 2018, all of the2023, respectively, 14,960 and 26,691 Operating Partnership’s 125,000 common units outstandingPartnership Units held by noncontrolling, limited partners were eligible to be converted, on a one-to-one basis, into Common Shares. TheFor the three months ended March 31, 2023, the Operating Partnership’s common unitsPartnership Units and the equivalent Common Shares attributable to the conversion of the Operating Partnership Units have been excluded from the Company’s diluted earnings per share calculation because their inclusion would be antidilutive. However, for the three months ended March 31, 2024, the Operating Partnership Units and the equivalent Common Shares attributable to the conversion of the Operating Partnership Units have been included in the diluted earnings per share calculation. The Company's earnings (loss) per common share areis determined as follows: | | | Three months ended March 31, | | | | | | 2019 | | | 2018 | | | | | | (unaudited) | | (unaudited) | | | | | | | | | | | | | | Three months ended March 31, | | | | 2024 | | 2023 | | | | (unaudited) | | (unaudited) | | Basic and diluted shares outstanding | | | | | | | | | | | | | | | | Weighted average Common Shares – basic | | | 2,321,582 | | | | 1,687,516 | | | | 2,233,182 | | | 2,219,803 | | Effect of conversion of operating partnership units | | | 125,000 | | | | - | | | | Weighted average common shares – diluted | | | 2,446,582 | | | | 1,687,516 | | | | | | | | | | | | | | Effect of conversion of Operating Partnership Units | | | | 14,960 | | | 26,691 | Weighted average Common Shares – diluted | | | | 2,248,142 | | | 2,246,494 | | | | | | | | | | Calculation of earnings per share – basic and diluted | | | | | | | | | | | | | | | | Net loss attributable to common shareholders | | $ | (686,639 | ) | | $ | (450,875 | ) | | | | | $ | (1,221,295) | | Weighted average Common Shares – basic and diluted | | | 2,321,582 | | | | 1,687,516 | | | | | | | 2,219,803 | | Earnings per share – basic and diluted | | $ | (0.30 | ) | | $ | (0.27 | ) | | Loss per share – basic and diluted | | | | | | $ | (0.55) | | | | | | | | | Calculation of earnings per share – basic | | | | | | | | Net income attributable to common shareholders | | | $ | 1,357,398 | | | | Weighted average Common Shares – basic | | | | 2,233,182 | | | | Earnings per share – basic | | | $ | 0.61 | | | | | | | | | | | | Calculation of earnings per share – diluted | | | | | | | | Net income attributable to common shareholders | | | $ | 1,357,398 | | | | Weighted average Common Shares – diluted | | | | 2,248,142 | | | | Earnings per share – diluted | | | $ | 0.60 | | | |
Dividends and Distributions During the three months ended March 31, 2019, no2024, dividends in the amount of $0.01 per share were declared or paid.paid on February 6, 2024, to stockholders of record on February 2, 2024. During the yearthree months ended DecemberMarch 31, 2018,2023, dividends in the amount of $0.08 per share were declaredpaid on March 28, 2018 payableJanuary 27, 2023, to common shareholders of record on April 2, 2018, July 12, 2018 payable to common shareholders of record on July 12, 2018, and November 30, 2018 payable to common shareholders of record on December 12, 2018. DividendsJanuary 24, 2023. Total dividends and distributions to noncontrolling interests paid during the three months ended March 31, 20192024 and 2018,2023, respectively, are as follows: | | | Three months ended March 31, | | | | | 2019 | | | 2018 | | | | | (unaudited) | | | (unaudited) | | | Common shareholders (dividends) | | $ | - | | | $ | - | | | Hampton Inn Property noncontrolling interest (distribution) | | | - | | | | - | | | Hanover Square Property noncontrolling interest (distribution) | | | 16,000 | | | | - | | | Operating Partnership unit holders (distributions) | | | - | | | | - | | | Total dividends and distributions | | $ | 16,000 | | | $ | - | |
| | | | | | | | | | Three months ended March 31, | | | | 2024 | | 2023 | | | | (unaudited) | | (unaudited) | | Common shareholders (dividends) | | $ | 22,341 | | $ | 176,810 | | Hanover Square Property noncontrolling interest (distributions) | | | 479,856 | | | — | | Parkway Property noncontrolling interest (distributions) | | | 8,100 | | | — | | Operating Partnership Unit holders (distributions) | | | 653 | | | 2,135 | | Total dividends and distributions | | $ | 510,950 | | $ | 178,945 | |
| 7. | Commitments and Contingencies |
Hampton Inn Property – Property Improvement Plan
8. Commitments and Contingencies The Company is obligated under the mortgage loan for the Hampton Inn Property to complete a property improvement plan which includes exterior and interior renovations and replacement of furniture and fixtures. This obligation is irrevocably and unconditionally guaranteed by individual members of the Manager and by an individual member of the noncontrolling owner. The Company has entered into a series of contracts for this work with a total estimated cost of $2,648,548 and work commenced in July, 2018. These costs will be partially funded by $2,206,099 of funds held in escrow by the mortgage holder (see “Cash and Cash Equivalents and Restricted Cash”, above), with the remainder being funded by the Company and the noncontrolling owner.
During the three months ended March 31, 2019, the Company incurred and paid $735,350 in costs associated with the property improvement plan. Escrows held by the mortgage holder funded $567,183 of these costs and the remainder was funded by the Company. During the year ended December 31, 2018, the Company incurred and paid $1,009,452 in costs associated with the property improvement plan. Escrows held by the mortgage holder funded $604,290 of these costs and the remainder was funded by the Company. As of March 31, 2019, the Company estimates that the remaining costs to be incurred associated with this work is $903,746, all of which will be funded by the escrow balance of $1,034,626 as of March 31, 2019.
Insurance The Company carries comprehensive liability, fire, extended coverage, business interruption and rental loss insurance covering all of the properties in its portfolio, in addition to other coverages that may be appropriate for certain of its properties. Additionally, the Company carries a directors and officers liability insurance policy that covers such claims made against the Company and its directors and officers. The Company believes the policy specifications and insured limits are appropriate and adequate for its properties given the relative risk of loss, the cost of the coverage and industry practice; however, its insurance coverage may not be sufficient to fully cover its losses. Concentration of Credit Risk
The Company is subject to risks incidental to the ownership and operation of commercial real estate. These risks include, among others, the risks normally associated with changes in the general economic climate, trends in the retail industry, creditworthiness of tenants, competition for tenants and customers, changes in tax laws, interest rates, the availability of financing and potential liability under environmental and other laws. The Company’s portfolio of properties is dependent upon regional and local economic conditions and is geographically concentrated in the Mid-Atlantic, specifically in South Carolina, North Carolina and Virginia, which represented 100 percentapproximately 99% of the total annualized base revenues of the properties in its portfolio as of March 31, 2019.2024. The Company’s geographic concentration may cause it to be more susceptible to adverse developments in those markets than if it owned a more geographically diverse portfolio. Additionally, the Company’s retail shopping center property dependsproperties depend on anchor stores or major tenants to attract shoppers and could be adversely affected by the loss of, or a store closure by, one or more of these tenants. Interest Rate Risk The value of the Company’s real estate is subject to fluctuations based on changes in interest rates which may affect the Company’s ability to refinance property-level mortgage debt when balloon payments are scheduled. Interest rates are highly sensitive to many factors, including governmental monetary and tax policies, domestic and international economic and political conditions, and other factors beyond our control. An increase in interest rates would likely cause the value of the Company’s assets to decrease. Increases in interest rates may also have an impact on the credit profile of certain tenants. The Company is exposed to the impact of interest rate changes primarily through its borrowing activities. To limit this exposure, the Company attempts to obtain mortgage financing on a long-term, fixed-rate basis. However, from time to time, the Company may obtain variable-rate mortgage loans and, as a result, may enter into interest rate cap agreements that limit the effective borrowing rate of variable-rate debt obligations while allowing participants to share in downward shifts in interest rates. These interest rate caps are derivative instruments designated as cash flow hedges on the forecasted interest payments on the debt obligation. Our objective in using interest rate caps is to limit our exposure to interest rate movements. As of March 31, 2024 and December 31, 2023, all of the Company’s long-term debt either bore interest at fixed rates or was capped to a fixed rate. The Company’s debt obligations are more fully described in Note 5, Loans Payable, above. Regulatory and Environmental As the owner of the buildings on its properties, the Company could face liability for the presence of hazardous materials (e.g., asbestos or lead) or other adverse conditions (e.g., poor indoor air quality) in its buildings. Environmental laws govern the presence, maintenance, and removal of hazardous materials in buildings, and if the Company does not comply with such laws, it could face fines for such noncompliance. Also, the Company could be liable to third parties (e.g., occupants of the buildings) for damages related to exposure to hazardous materials or adverse conditions in its buildings, and the Company could incur material expenses with respect to abatement or remediation of hazardous materials or other adverse conditions in its buildings. In addition, some of the Company’s tenants routinely handle and use hazardous or regulated substances and wastes as part of their operations at the Company’s properties, which are subject to regulation. Such environmental and health and safety laws and regulations could subject the Company or its tenants to liability resulting from these activities. Environmental liabilities could affect a tenant’s ability to make rental payments to the Company, and changes in laws could increase the potential liability for noncompliance. This may result in significant unanticipated expenditures or may otherwise materially and adversely affect the Company’s operations. The Company is not aware of any material contingent liabilities, regulatory matters or environmental matters that may exist. Seasonality
The hotel industry historically has been seasonal in nature. Seasonal variations in occupancy at the Company’s hotels may cause quarterly fluctuations in its revenues. Occupancy rates and hotel revenues for the Company’s Hampton Inn Property are highest in October, due to a local event that generates significant demand, and generally greater in the second and third quarters than in the first quarter and in November and December. To the extent that cash flow from operations is insufficient during any quarter, due to temporary or seasonal fluctuations in revenue, the Company expects to utilize cash on hand or available financing sources to meet cash requirements.
Litigation The Company is not currently involved in any litigation or legal proceedings. | 8. | 9. Related Party Transactions |
Medalist Fund Manager, Inc. (the “Manager”)Citibank Property Acquisition
On March 28, 2024, the Company acquired the Citibank Property (see Note 3, above) from RMP 3535 N. Central Ave., LLC. The sole manager and member of RMP 3535 N. Central Ave., LLC is CWS BET Seattle, LP, a Delaware limited partnership, a company controlled and owned by Frank Kavanaugh, the Company’s Chief Executive Officer and a member of the Company’s Board of Directors. Pursuant to the Company’s Related Person Transaction Policy, the terms of the acquisition were determined to be those that would normally be agreed upon in an arms-length transaction. Staffing Agreement The Company is externally managed byhas entered into the Manager, which makes all investment decisions forStaffing Agreement with the Company. The Manager oversees the Company’s overall business and affairs and has broad discretionConsultant to make operating decisionsemploy staff on behalf of the Company and to make investment decisions. Company. The Company paysConsultant’s sole member is C. Brent Winn, Jr., our Chief Financial Officer. Under the Manager a monthly asset management fee equal to 0.125% of stockholders’ equity, payable in arrears in cash. For purposes of calculating the asset management fee, the Company’s stockholders’ equity means: (a) the sum of (1) the net proceeds from (or equity value assigned to) all issuances of the Company’s equity and equity equivalent securities (including common stock, common stock equivalents, preferred stock and OP Units issued by the Company’s operating partnership) since inception (allocated on a pro rata daily basis for such issuances during the fiscal quarter of any such issuance), plus (2) the Company’s retained earnings at the end of the most recently completed calendar quarter (without taking into account any non-cash equity compensation expense incurred in current or prior periods), less (b) any amount thatStaffing Agreement, the Company has paid to repurchase its common stock issued in this orreimburses the Consultant for any subsequent offering. Stockholders’ equity also excludes (1) any unrealized gainsapproved employee’s salary, payroll taxes and lossesbenefits, including health insurance and other non-cash items (including depreciationretirement benefits, and amortization) that have impacted stockholders’ equity as reported in the Company’s consolidated financial statements prepared in accordance with GAAP,related expenses. All expenses are reimbursed at cost and (2) one-time events pursuant to changes in GAAP, and certain non-cash items not otherwise described above, in each case after discussions between the Company’s Manager and its independent director(s) and approval by a majority of its independent directors.without markup. For the three months ended March 31, 2019 and 2018, respectively, the Company incurred $93,925 and $67,174 in asset management fees. Asset management fees are recorded on the Company’s consolidated statements of operations as either (i) retail center property operating expenses, (ii) hotel property operating expenses or (iii) legal, accounting and other professional fees, depending on the basis on which the asset management fee is determined.
The Manager also receives an acquisition fee of 2.0% of the purchase price plus transaction costs, for each property acquired or investment made on the Company’s behalf at the closing of the acquisition of such property or investment, in consideration for the Manager’s assistance in effectuating such acquisition. Acquisition fees are allocated and added to the fair value of the tangible assets acquired. Repayment of funds advanced are recorded as a reduction in outstanding accounts payable and accrued liabilities. No acquisition fees were earned or paid during the three months ended March 31, 2019 or 2018.
The Manager will be entitled to an incentive fee, payable quarterly, equal to an amount, not less than zero, equal to the difference between (1) the product of (x) 20% and (y) the difference between (i) Adjusted Funds from Operations (AFFO) (as further defined below) for the previous 12-month period, and (ii) the product of (A) the weighted average of the issue price of equity securities issued in this offering and in future offerings and transactions, multiplied by the weighted average number of all shares of common stock outstanding on a fully-diluted basis (including any restricted stock units, any restricted shares of common stock and OP Units) in the previous 12-month period, exclusive of equity securities issued prior to this offering, and (B) 7%, and (2) the sum of any incentive fee paid to the Manager with respect to the first three calendar quarters of such previous 12-month period. For purposes of calculating the incentive fee during the first years after completion of this offering, adjusted funds from operations (“AFFO”) will be determined by annualizing the applicable period following completion of this offering. AFFO is calculated by removing the effect of items that do not reflect ongoing property operations. The Company further adjusts funds from operations (“FFO”) for certain items that are not added to net income in the National Association of Real Estate Investment Trusts’ (NAREIT) definition of FFO, such as acquisition expenses, equity based compensation expenses, and any other non-recurring or non-cash expenses, which are costs that do not relate to the operating performance of the Company’s properties, and subtract recurring capital expenditures (and, when calculating the incentive fee only, we further adjust FFO to include any realized gains or losses on real estate investments). No incentive fees were earned or paid during the three months ended March 31, 2019 or 2018.
In addition to the asset management fees paid to the Manager, during the three months ended March 31, 2019 and 2018, respectively, the Company repaid the Manager $0 and $196,483 for funds advanced by the Manager on behalf of the Company.
Hampton Inn Property10. Segment Information
The tenants in common owners of the Hampton Inn Property have entered into lease with the Hampton Inn TRS for the Hampton Inn Property. Under the lease, the TRS, under a hotel management agreement with Marshall Properties, operates the property and pays rent to the tenants in common owners. Base rent and percentage rent are payable under the lease, as follows:
| | | Period | | Annual Rent | | | Percentage Rent | | Years 1 – 3 | | November, 2017 – October, 2020 | | $ | 866,834 | | | 6% of Gross Revenue | | Years 4 – 5 | | November, 2020 – October, 2022 | | $ | 946,834 | | | 10% of Gross Revenue |
During the three months ending March 31, 2019 and the TRS incurred $281,157 and $261,467 in rent to the tenants in common owners. As of March 31, 2019 and March 31, 2018, accrued but unpaid rent was $120,289 and $33,257, respectively. All material balances and transactions between the two entities have been eliminated in the consolidated financial statements.
Other related parties
The Company pays Shockoe Properties, LLC, a subsidiary of Dodson Properties, an entity in which one of the owners of the Manager holds a 6.32 percent interest, an annual property management fee of up to 3 percent of the monthly gross revenues of the Franklin Square Property and the Hanover Square Properties. These fees are paid in arrears on a monthly basis. During the three months ended March 31, 2019 and 2018, the company paid Shockoe Properties, LLC property management fees of $27,134 and $13,459, respectively.
The Company establishes operating segments at the property level and aggregates individual properties into reportable segments based on product types in which the Company has investments. As ofFor the three months ended March 31, 2019, The2024 and 2023, respectively, the Company had the following reportable segments: retail center properties, flex center properties and hotelSTNL properties. During the periods presented, there have been no material intersegment transactions. Although the Company’s flex center properties have tenants that are similar to tenants in its retail center properties, the Company considers its flex center properties as a separate reportable segment. Flex properties are considered by the real estate industry as a distinct subset of the industrial market segment. Flex properties contain a mix of industrial/warehouse and office spaces. Warehouse space that is not air conditioned can be used flexibly by building office or showroom space that is air conditioned, depending on tenants’ needs. Further, although the Company’s STNL properties have tenants that are similar to tenants in its retail center properties, the Company considers its STNL properties as a separate reportable segment. STNL properties are also considered by the real estate industry as a separate asset class. Net operating income ("NOI"(“NOI”) is a non-GAAP financial measure and is not considered a measure of operating results or cash flows from operations under GAAP. NOI is the primary performance measure reviewed by management to assess operating performance of properties and is calculated by deducting operating expenses from operating revenues. Operating revenues include rental income, tenant reimbursements, hotel income, and other property income; and operating expenses include retail center property and hotel operating costs.expenses. The NOI performance metric consists of only revenues and expenses directly related to real estate rental operations. NOI reflects property acquisitions and dispositions, occupancy levels, rental rate increases or decreases, and the recoverability of operating expenses. NOI, as the Company calculates it, may not be directly comparable to similarly titled, but differently calculated, measures for other REITs. Asset information and capital expenditures by segment are not reported because the Company does not use these measures to assess performance. Depreciation and amortization expense, along with other expense and income items, are not allocated among segments. The following table presents property operating revenues, expenses and NOI by product type: | | | Hotel property (unaudited) | | | Retail center properties (unaudited) | | | Total (unaudited) | | | | | | Three months ending, | | | Three months ending, | | | Three months ending, | | | | | | March 31,
2019 | | | March 31,
2018 | | | March 31,
2019 | | | March 31, 2018 | | | March 31, 2019 | | | March 31, 2018 | | | The following table presents property operating revenues, expenses and NOI by product type: | | | | | | | | | | | | | | | | | | | | | | | | | | | | | For the three months ended March 31, | | | | Retail center properties | | Flex center properties | | | STNL properties | | Total | | | | 2024 | | 2023 | | 2024 | | 2023 | | 2024 | | 2023 | | 2024 | | 2023 | | Revenues | | $ | 644,488 | | | $ | 745,979 | | | $ | 893,994 | | | $ | 456,871 | | | $ | 1,538,482 | | | $ | 1,202,850 | | | $ | 1,849,617 | | $ | 1,835,373 | | $ | 664,067 | | $ | 569,297 | | $ | 57,955 | | $ | 56,306 | | $ | 2,571,639 | | $ | 2,460,976 | | Operating expenses | | | 581,975 | | | | 563,054 | | | | 269,275 | | | | 192,681 | | | | 851,250 | | | | 755,735 | | | | 428,259 | | | 512,887 | | | 144,673 | | | 176,737 | | | 7,708 | | | 7,728 | | | 580,640 | | | 697,352 | Bad debt expense | | | | — | | | 125 | | | 14,056 | | | 26,997 | | | — | | | — | | | 14,056 | | | 27,122 | | Net operating income | | $ | 62,513 | | | $ | 182,295 | | | $ | 624,719 | | | $ | 264,190 | | | $ | 687,232 | | | $ | 447,115 | | | $ | 1,421,358 | | $ | 1,322,361 | | $ | 505,338 | | $ | 365,563 | | $ | 50,247 | | $ | 48,578 | | $ | 1,976,943 | | $ | 1,736,502 |
As of May 15, 2019,9, 2024, the following events have occurred subsequent to the March 31, 20192024 effective date of the condensed consolidated financial statements: Common Stock Dividend On May 13, 2019,April 25, 2024, a dividend in the Company issuedamount of $0.02 per share was paid to common stockholders and sold 1,666,667 Common Shares at an offering priceOperating Partnership Unit holders of $4.80 per share. Net proceeds from the issuance are estimated to be $6,755,000, which includes the impact of discounts and offering costs, including the underwriter’s selling commissions and legal, accounting and other professional fees. As part of this offering, the Company granted the underwriters a 45-day option to purchase up to 250,000 additional Common Shares at the public offering price, less the underwriting discount and commissions, to cover over-allotments, if any.record on April 22, 2024. Mandatorily Redeemable Preferred Stock Dividend On May 14, 2019,April 25, 2024, a dividend in the Company declared its first quarter dividendamount of $0.175$0.50 per share was paid to mandatorily redeemable preferred stockholders of common stock payablerecord on or about May 28, 2019 to holders ofApril 22, 2024 for the Company’s common stock on May 24, 2019.period from January 21, 2024 through April 21, 2024. | Item 2. | Management’s Discussion and Analysis of Financial Condition and Results of Operations |
ITEM 2. MANAGEMENT’S DISCUSSION AND ANALYSIS OF FINANCIAL CONDITION AND RESULTS OF OPERATIONS The following discussion and analysis is based on, and should be read in conjunction with, the condensed consolidated financial statements and the related notes thereto of Medalist Diversified REIT, Inc. contained in this Quarterly Report on Form 10-Q.Report.
As used in this section, unless the context otherwise requires, references to “we,” “our,” “us,”This following discussion and “our company” refer to Medalist Diversified REIT, Inc., a Maryland corporation, together with our consolidated subsidiaries, including Medalist Diversified Holdings, LP, a Delaware limited partnershipanalysis of which we are the sole general partner, except where it is clear from the contextfinancial condition and results of operations contains forward-looking statements that the term only means Medalist Diversified REIT, Inc..
Cautionaryinvolve risks, uncertainties and assumptions. See “Cautionary Statement Regarding Forward-Looking StatementsStatements” for a discussion of the risks, uncertainties and assumptions associated with those statements. Our actual results may differ materially from those expressed or implied in the forward-looking statements as a result of various factors.
CAUTIONARY STATEMENT REGARDING FORWARD-LOOKING STATEMENTS The U.S. Private Securities Litigation Reform Act of 1995 (the “1995 Act”) provides a “safe harbor” for forward-looking statements. This Quarterly Report on Form 10-Q contains “forward-looking statements” within the meaning of the Private Securities Litigation Reform Act of 1995 and other federal securities laws. These forward-looking statements are included throughout this Quarterly Report on Form 10-Q. We have used the words “approximately,” “anticipate,” “assume,” “believe,” “budget,” “contemplate,” “continue,” “could,” “estimate,” “expect,” “future,” “intend,” “may,” “outlook,” “plan,” “potential,” “predict,” “project,” “seek,” “should,” “target,” “will” and similar terms and phrases to identify forward-looking statements in this Quarterly Report on Form 10-Q.Report. The forward-looking statements included herein are based upon our current expectations, plans, estimates, assumptions and beliefs that involve numerous risks and uncertainties. Assumptions relating to the foregoing involve judgments with respect to, among other things, future economic, competitive and market conditions and future business decisions, all of which are difficult or impossible to predict accurately and many of which are beyond our control. Although we believe that the expectations reflected in such forward-looking statements are based on reasonable assumptions, our actual results and performance could differ materially from those set forth in the forward-looking statements. Factors which could have a material adverse effect on our operations and future prospects include, but are not limited to: | ● | · | the competitive environment in which we operate; |
| ● | · | local, regional, national international, regional and localinternational economic conditions; |
| ● | · | the availability, terms and deployment of capital; |
| ● | the general level of interest rates; |
| ● | · | changes in our business or strategy; |
| ● | · | fluctuations in interest rates and increased operating costs; |
| ● | ·our incurrence of impairment charges; |
| ● | our limited operating history; |
| ● | · | the degree and nature of our competition; |
| ● | · | our dependence upon our Manager and key personnel; |
| ● | · | defaults on or non-renewal of leases by tenants; |
| ● | · | decreased rental rates or increased vacancy rates; |
| ● | · | our ability to make distributions on shares of our common stock; |
| ● | · | difficulties in identifying properties to acquire and completing acquisitions; |
| ● | · | our ability to operate as a public company; |
| ● | · | potential natural disasters such as hurricanes; |
| ● | ·the impact of epidemics, pandemics, or other outbreaks of illness, disease or virus (such as COVID-19 and its variants); |
| ● | our ability to maintain our qualification as a REIT for U.S. federal income tax purposes; |
| ● | ·our ability to maintain an active trading market for our common stock on The Nasdaq Capital Market (“Nasdaq”) and maintain continued listing on Nasdaq and the likelihood that a delisting of our common stock from Nasdaq could result in significantly lower trading volumes and reduced liquidity for investors seeking to buy or sell our common stock; |
| ● | potential changes in the law or governmental regulations that affect us and interpretations of those laws and regulations, including changes in real estate and zoning or tax laws, and potential increases in real property tax rates; |
| ● | potential disruption to or compromise of our information technology networks or data, or those of third parties upon which we rely; and |
| ● | · | related industry developments, including trends affecting our business, financial condition and results of operations. |
The forward-looking statements contained in this Quarterly Report on Form 10-Q are based on historical performance and management’s current plans, estimates and expectations in light of information currently available to us and are subject to uncertainty and changes in circumstances. There can be no assurance that future developments affecting us will be those that we have anticipated. Actual results may differ materially from these expectations due to the factors, risks and uncertainties described above, changes in global, regional or local political, economic, business, competitive, market, regulatory and other factors, many of which are beyond our control. Should one or more of these risks or uncertainties materialize, or should any of our assumptions prove to be incorrect, our actual results may vary in material respects from what we may have expressed or implied by these forward-looking statements. We caution that you should not place undue reliance on any of our forward-looking statements. Any forward-looking statement made by us in this Quarterly Report on Form 10-Q speaks only as of the date of this Quarterly Report on Form 10-Q.Report. Factors or events that could cause our actual results to differ may emerge from time to time, and it is not possible for us to predict all of them. We undertake no obligation to publicly update any forward-looking statement, whether as a result of new information, future developments or otherwise, except as may be required by applicable securities laws. Company Overview Medalist Diversified REIT Inc. is a Maryland corporation formed on September 28, 2015. Beginning with our taxable year ended December 31, 2017, we believe that we have operated in a manner qualifying us as a REIT,real estate investment trust (“REIT”), and we have elected to be taxed as a REIT for federal income tax purposes. Our company serves as the general partner of Medalist Diversified Holdings, LP which was formed as a Delaware limited partnership on September 29, 2015. Our company was formed to acquire, reposition, renovate, lease and manage income-producing properties, with aproperties. Our primary focus is on (i) commercial properties, including flex-industrial, limited service hotels, and retail properties and (ii) multi-family residentialflex-industrial properties in secondary and tertiary markets in the southeastern part of the United States, with an expected concentration in Virginia, North Carolina, South Carolina, Georgia, Florida and Alabama.Alabama, and STNL assets with an expected national focus. We may also pursue, in an opportunistic manner, other real estate-related investments, including, among other things, equity or other ownership interests in entities that are the direct or indirect owners of real property, and indirect investments in real property, such as those that may be obtained in a joint venture. While these types of investments are not intended to be a primary focus, we may make such investments in our Manager’s discretion. Our company is externally managed by Medalist Fund Manager, Inc. (the “Manager”). The Manager makes all investment decisions for our company. The Manager and its affiliated companies specialize in acquiring, developing, owning and managing value-added commercial real estate in the Mid-Atlantic and Southeast regions. The Manager oversees our company’s overall business and affairs and has broad discretion to make operating decisions on behalf of our company and to make investment decisions. Our company’s stockholders are not involved in its day-to-day affairs.
As of March 31, 2019,2024, our company owned and operated three investmentowns four retail center properties consisting of (i) the Shops at Franklin Square, (the “Franklin Square Property”), a 134,239 square foot retail property located in Gastonia, North Carolina (the “Franklin Square Property”), (ii) the Greensboro Hampton Inn (the “Hampton Inn Property”)Ashley Plaza Shopping Center, a hotel with 125 rooms on 2.162 acres156,012 square foot retail property located in Greensboro,Goldsboro, North Carolina (the “Ashley Plaza Property”), (iii) the Lancer Center, a 181,590 square foot retail property located in Lancaster, South Carolina (the “Lancer Center Property”), and (iv) the Hanover NorthSalisbury Marketplace Shopping Center, a 79,732 square foot retail property located in Salisbury, North Carolina (the “Hanover“Salisbury Marketplace Property”). On March 13, 2024, our company, and its tenant in common partner, sold the Shops at Hanover Square Property”),North, a 73,440 square foot retail property located in Mechanicsville, Virginia. As of March 31, 2019, we owned 64% of the Hampton Inn Property as a tenant in common with a noncontrolling owner which owned the remaining 36% interest. The tenants in common lease the Hampton Inn Property to a taxable REIT subsidiary that is also owned 64% by us and 36% by the noncontrolling owner. As of March 31, 2019, weVirginia (the “Hanover Square Shopping Center Property”). Our company owned 84% of the Hanover Square Shopping Center Property as a tenant in common with a noncontrolling owner which owned the remaining 16% interest. Our company and its tenant in common partner retained ownership of the 0.864 acre outparcel (the “Hanover Square Outparcel”). On March 25, 2024, our company purchased its tenant in common partner’s 16% interest in the Hanover Square Outparcel (see Note 3 of the accompanying notes to the condensed consolidated financial statements). Our company owns three flex warehouse properties consisting of (i) Brookfield Center, a 64,880 square foot mixed-use industrial/office property located in Greenville, South Carolina (the “Brookfield Center Property”), (ii) the Greenbrier Business Center, an 89,280 square foot mixed-use industrial/office property located in Chesapeake, Virginia (the “Greenbrier Business Center Property”), and (iii) the Parkway Property, a 64,109 square foot mixed-use industrial office property located in Virginia Beach, Virginia (the “Parkway Property”), in which our company owns an 82% tenant in common interest with a noncontrolling owner which owns the remaining 18% interest. Our company owns three STNL properties consisting of (i) the Citibank Property, a 4,350 square foot single tenant building on 0.45 acres located in Chicago, Illinois, (ii) the East Coast Wings building, a 5,000 square foot single tenant building on approximately 0.89 acres located in Goldsboro, North Carolina (the “East Coast Wings Property”), and (iii) the T-Mobile building, a 3,000 square foot single tenant building on approximately 0.78 acres located in Goldsboro, North Carolina (the “T-Mobile Property”). The East Coast Wings Property and the T-Mobile Property are both located on outparcels adjacent to our company’s Ashley Plaza Property. Prior to January 1, 2024, our company included the East Coast Wings Property and the T-Mobile Property as part of the Ashley Plaza Property. Our company also owns three undeveloped parcels which are currently being marketed for use as STNL properties including (i) an outparcel at its Lancer Center Property consisting of approximately 1.8 acres (the “Lancer Outparcel”), (ii) an outparcel at its Salisbury Marketplace Property consisting of approximately 1.2 acres (the “Salisbury Outparcel”) (the exact size of the Lancer Outparcel and Salisbury Outparcel will not be determined until a user is identified), and (iii) the Hanover Square Outparcel consisting of 0.864 acres located adjacent to the Hanover Square Shopping Center. Reporting Segments We establish operating segments at the property level and aggregate individual properties into reportable segments based on product types in which we have investments. As of March 31, 2024 our reportable segments were retail center properties, flex center properties and STNL properties. Recent Trends and Activities There have been several significant events during 2018 and the first quarter of 2019 that have impacted our company. These events are summarized below.
Equity Issuances
Between January and June 2018, our company issued and sold 847,580 shares of common stock at an offering price of $10.00 per share. Net proceeds from the issuances totaled $7,749,992, which includes the impact of discounts and offering costs, including the underwriters' selling commissions and legal, accounting and other professional fees. The net funds after issuance costs were used to (i) retire the short-term notes payable used to finance the purchase of the Hampton Inn Property and (ii) fund our company’s acquisitionSale of the Hanover Square Shopping Center Property which closed on May 8, 2018.
On November 30, 2018, we completedMarch 13, 2024, our initial registered public offering, or our IPO, pursuantcompany sold the Hanover Square Shopping Center Property to which we issued an aggregate of 240,000 shares of our common stock at an offeringunrelated third party for a sale price of $10.00 per share and received approximately $1,838,727$13.0 million, less credits for repairs of $85,000, resulting in net proceeds.a gain on disposal of investment properties of $2,819,502 reported on our Company’s condensed consolidated statement of operations for the three months ended March 31, 2024. Our company did not report any gain or loss on the disposal of investment properties for the three months ended March 31, 2023. Acquisition of the 16% Noncontrolling Interest in the Hanover Square Outparcel On AugustMarch 25, 2024, our company completed the acquisition of its tenant in common partner’s 16% ownership interest in the Hanover Square Outparcel through a wholly-owned subsidiary. The purchase price for the 16% interest in the Hanover Square Outparcel was $98,411 paid in cash. Our company’s total investment was $100,891. Our company incurred $2,480 of closing costs which were capitalized and added to the tangible assets acquired. Acquisition of the Citibank Property On March 28, 2024, our company completed its acquisition of the Citibank Property, a 4,350 square foot single tenant building on 0.45 acres located in Chicago, Illinois, through a wholly-owned subsidiary. The Citibank Property, built in 1954 and subsequently renovated, was 100% leased to Citibank, NA. The purchase price for the Citibank Property was $2,400,000 paid through the issuance of 417,391 Operating Partnership Units at a price of $5.75 per Operating Partnership Unit. Our company’s total investment was $2,444,454. Our company incurred $44,454 of closing costs which were capitalized and added to the tangible assets acquired. Wells Fargo Line of Credit On June 13, 2022, our company, through its wholly-owned subsidiaries, entered into a loan agreement with Wells Fargo Bank for a $1,500,000 line of credit (the “Wells Fargo Line of Credit”). As of March 31, 2024 and 2023, the Wells Fargo Line of Credit had an outstanding balance of $1,000,000 and $0, respectively. Outstanding balances on the Wells Fargo Line of Credit will bear interest at a floating rate of 2.25% above daily SOFR. As of March 31, 2024 and 2023, SOFR was 5.35% and 4.3%, respectively. The Wells Fargo Line of Credit has a one-year, renewable term, is unconditionally guaranteed by our company, and any outstanding balances are secured by the Lancer Center Property, the Greenbrier Business Center Property and the Salisbury Marketplace Property. On May 2, 2023, our company and Wells Fargo Bank entered into the First Amendment to Revolving Line of Credit Note which extended the maturity date of the Wells Fargo Line of Credit to June 9, 2024. Our company is currently in discussions with Wells Fargo to extend the maturity date of the Wells Fargo Line of Credit, but there can be no assurance that we will be successful. We plan to continue to use the Wells Fargo Line of Credit for general working capital needs and to help fund future acquisitions. Common stock grants under the 2018 our company’s Board of DirectorsEquity Incentive Plan On January 18, 2024, the Compensation Committee approved a grant of 80,000 shares of15,275 Common Shares to two employeesour company’s five independent directors, a grant of the Manager who also serve as directors2,546 Common Shares to a consultant of our company and a grant of 6,000 Common Shares38,697 Operating Partnership Units to our company’s three independent directors.President and CEO, under the Equity Incentive Plan. The effective date of the grants was December 4, 2018, the date on which the registration of the Plan shares was effective.January 18, 2024. The Common Shares granted vested immediately and are unrestricted. The Operating Partnership Units granted vest immediately but will be restricted for six months by a lock-up agreement associated with our company’s sale of itsare not convertible to Common Shares on November 27, 2018. In addition,until January 18, 2025. However, the Equity Incentive Plan includes other restrictions on the sale of shares issued under the Equity Incentive Plan. Because the Common Shares vestand Operating Partnership Units vested immediately, the fair value of the grants, or $790,340,$277,500, was recorded to share based compensation expense on our company’s condensed consolidated statements of operations on the effective date of the grant. The fair value of the grants was determined by the market price of our company’s Common Shares on the effective date of the grant.
2017 Acquisitions
The Shops at Franklin Square
On April 28, 2017, we completed our acquisitionTable of the Franklin Square Property through a wholly owned subsidiary. The purchase price for the Franklin Square Property was $20,500,000 paid through a combination of cash and assumed, secured debt. Our total investment, including acquisition and closing costs, escrows and lease reserves was approximately $22,054,071. The Franklin Square Property, built in 2006 and 2007, was 68 percent leased as of the acquisition date, was anchored by Ashley Furniture and Monkey Joe’s as of the acquisition date, and is located in Gastonia, North Carolina.Contents
On May 10, 2018, we entered into a lease with Altitude Trampoline Park, or Altitude, a national tenant, for 30,000 square feet of rentable space. Altitude’s occupancy commenced in November 2018 and rent will commence on August 1, 2019. On October 18, 2018, we entered into a lease with Allen Tate, Inc. for 4,156 square feet. Allen Tate’s occupancy commenced on December 1, 2018, and rent commenced on March 1, 2019. Allen Tate’s and Altitude’s occupancy brought the Franklin Square Property’s occupancy rate to 92.4 percent as of March 31, 2019.
Greensboro Airport Hampton Inn
On November 3, 2017 we completed our acquisition of an undivided 64 percent tenant-in-common interest in the Hampton Inn Property through a wholly owned subsidiary. The total purchase price for the Hampton Inn Property was $15,100,000, paid through a combination of cash provided by our company, the issuance of 125,000 OP Units, the incurrence of new mortgage debt in the original principal amount of $10,600,000 and approximately $2,300,000 in cash provided by the unaffiliated, tenant-in-common noncontrolling owner. The total investment, including acquisition, closing costs, escrow deposits and an escrow for property improvements required under the Hampton Inn Property’s franchise agreement, was $18,004,621. The hotel has 125 rooms and was built in 1996.
Our company is obligated under the mortgage loan for the Hampton Inn Property to complete a property improvement plan (the “Property Improvement Plan”) which includes exterior and interior renovations and replacement of furniture and fixtures. Our company has entered into a series of contracts for this work with a total estimated cost of $2,648,548 and work commenced in July, 2018. These costs have been and will be partially funded by $2,206,099 of funds held in escrow by the mortgage holder, with the remainder being funded by our company and the noncontrolling owner.
2018 Acquisition
Hanover North Shopping Center
On May 8, 2018 we completed our acquisition of an undivided 84 percent tenant-in-common interest in the Hanover Square Property through a wholly owned subsidiary. The contract purchase price for the Hanover Square Property was $12,173,000. We acquired the Hanover Square Property with $3,291,404 in cash, $648,120 in cash from an unaffiliated tenant-in-common noncontrolling owner, and the assumption of a secured loan of approximately $8,527,315 from Langley Federal Credit Union, which amount was increased by an additional $372,685 (the “Hanover Square Property Loan”). The Hanover Square Property is located in Mechanicsville, Virginia and consists of approximately 73,440 square feet of improvements located on an 8.766 acre parcel of land (the “Developed Parcel”) and a contiguous, undeveloped parcel of land totaling 0.864 acres. As of March 31, 2019, the Hanover Square Property was approximately 96.7% occupied.
Financing Activities Mortgages payable Our company financed its acquisitions of the threeits investment properties through mortgages, as follows: | | | | | | | | | | | | | | | | | | | | | | | | Balance | | | | | | | | | | March 31, | | | | | | | Monthly | | Interest | | | | 2024 | | | December 31, | | Property | | Payment | | Rate | | Maturity | | (unaudited) | | 2023 | | Franklin Square (a) | | | Interest only | | | 3.808 | % | December 2031 | | $ | 13,250,000 | | $ | 13,250,000 | | Ashley Plaza (b) | | $ | 52,795 | | | 3.75 | % | September 2029 | | | 10,651,510 | | | 10,708,557 | | Brookfield Center (c) | | $ | 22,876 | | | 3.90 | % | November 2029 | | | 4,547,770 | | | 4,571,410 | | Parkway Center (d) | | $ | 28,161 | | | Variable | | November 2031 | | | 4,856,285 | | | 4,870,403 | | Wells Fargo Mortgage Facility (e) | | $ | 103,438 | | | 4.50 | % | June 2027 | | | 17,832,561 | | | 17,939,276 | | Total mortgages payable | | | | | | | | | | $ | 51,138,126 | | $ | 51,339,646 | |
| | | | | | | | | | Balance | | | | | Monthly | | Interest | | | | | Balance - March 31, | | | Property | | Payment | | Rate | | | Maturity | | 2019 | | | 2018 | | | Franklin Square | | Interest only | | | 4.7 | % | | October 2021 | | $ | 14,275,000 | | | $ | 14,275,000 | | | Hampton Inn (a) | | Interest only | | | Variable | | | November 2020 | | | 10,600,000 | | | | 10,600,000 | | | Hanover Square (b) | | $ | 51,993 | | | 4.9 | % | | December 2027 | | | 8,740,154 | | | | - | |
Amounts presented do not reflect unamortized loan issuance costs. | (a) | The mortgage loan for the Hampton InnFranklin Square Property in the principal amount of $13,250,000 has a ten-year term and matures on December 6, 2031. The mortgage loan bears interest at a fixed rate of 3.808% and is interest only until January 6, 2025, at which time the monthly payment will become $61,800, which includes interest and principal based on a thirty-year amortization schedule. The mortgage includes covenants for our company to maintain a net worth of $13,250,000, excluding the assets and liabilities associated with the Franklin Square Property and to maintain liquid assets of no less than $1,000,000. As of March 31, 2024 and December 31, 2023, respectively, our company believes that we are compliant with these covenants. Our company has guaranteed the payment and performance of the obligations of the mortgage loan. |
| (b) | The mortgage loan for the Ashley Plaza Property bears interest at a variablefixed rate of 3.75% and was interest only for the first twelve months. Beginning on October 1, 2020, the monthly payment became $52,795 for the remaining term of the loan, which includes interest at the fixed rate, and principal, based on a thirty-year amortization schedule. Effective on December 26, 2023, our company assumed certain guaranty obligations under the Ashley Plaza Property mortgage loan related to the Guaranty Substitution (see below). These obligations include covenants for our company to maintain a net worth of $11,400,000, excluding the liabilities associated with the mortgage loan for the Ashley Plaza Property and for our company to maintain liquid assets of no less than $1,100,000. As of March 31, 2024 and December 31, 2023, respectively, our company believes that we are compliant with these covenants. |
| (c) | The mortgage loan for the Brookfield Center Property bears interest at a fixed rate of 3.90% and is interest only for the first twelve months. Beginning on November 1, 2020, the monthly payment became $22,876 for the remaining term of the loan, which includes interest at the fixed rate, and principal, based on a thirty-year amortization schedule. Effective on December 26, 2023, our company assumed certain guaranty obligations under the Brookfield Center Property mortgage loan related to the Guaranty Substitution (see below). These obligations include covenants for our company to maintain a net worth of $4,850,000, excluding the liabilities associated with the mortgage loan for the Brookfield Center Property and for our company to maintain liquid assets of no less than $485,000. As of March 31, 2024 and December 31, 2023, respectively, our company believes that we are compliant with these covenants. |
| (d) | The interest rate for the mortgage loan for the Parkway Property was originally based on ICE LIBOR plus 225 basis points, with a minimum rate of 6.1%2.25%. TheAfter the discontinuation of LIBOR on June 30, 2023, the ICE LIBOR index was replaced by Term SOFR, with an adjusted margin of 236.44 basis points. Under the terms of the mortgage, the interest rate payable is the USD LIBOR one-month rate plus 5%.each month may not change by greater than 1% during any six-month period and 2% during any 12-month period. As of March 31, 20192024 and 2018, respectively,December 31, 2023 the ratesrate in effect for the Hampton InnParkway Property mortgage loan were 7.5 percent and 6.875 percent. |
| (b) | As part of its acquisition of the Hanover Square Property, our company assumed a secured loan of $8,527,315 from Langley Federal Credit Union and incurred additional mortgage debt of $372,685, also from Langley Federal Credit Union (the “Hanover Square Property Loan”)was 7.05%. The Hanover Square Property Loan maturesmonthly payment, which varies based on December 1, 2027 and requires monthly payments of principal, on a 25-year amortization schedule, and interest during the term. The Hanover Square Property Loan will bear interest at 4.90% through January 1, 2023, at which time the interest rate will be adjustedin effect each month, includes interest at the variable rate, and principal based on a thirty-year amortization schedule. The mortgage loan for the Parkway Property includes a covenant to the daily average yieldmaintain a debt service coverage ratio of not less than 1.30 to 1.00 on US Treasury securities adjusted to a constant maturityan annual basis. As of five years, plus 3.10%March 31, 2024 and December 31, 2023, respectively, our company believes that we are compliant with an interest rate floor of 4.90%. The fixed monthly payment includes principal and interest. The Hanover Square Property Loan is secured by the Developed Parcel of the Hanover Square Property. |
this covenant. On November 3, 2017,October 28, 2021, our company entered into anthe Interest Rate Protection Transaction to limit our company’s exposure to increases in interest rates on the variable rate mortgage loan on the Hampton InnParkway Property. Under this agreement, our company’s interest rate exposure is capped at 7 percent5.25% if USD 1-Month ICE LIBOR BBA exceeds 2 percent. As of March 31, 2019 and 2018, USD 1-Month LIBOR was 2.4945 percent and 1.88313 percent, respectively. In accordance with3%. Effective on July 1, 2023, the guidance on derivatives and hedging, our company records all derivatives on the balance sheet at fair value. Our company reports the changes in the fair value of the derivative in other income. Beginning in July 2018, the USD 1-Month LIBOR BBAinterest rate exceeded two percent and remained in excess of two percent on each subsequent monthly valuation date from July 2018 through March 31, 2019. For the three months ended March 31, 2019 and 2018, our company received $14,391 and $0 in paymentsindex under the Interest Rate Protection Transaction allautomatically converted to SOFR. For the period from September 1, 2022 through March 31, 2024, the applicable index (LIBOR or SOFR), exceeded the 3% cap, and payments from the Interest Rate Protection Transaction reduced our company’s net interest expense. Payments to our company from the Interest Rate Protection Transaction are recorded as an offset to interest expense on our company’s condensed consolidated statements of operations for the years ended three months ended March 31, 2024 and 2023, respectively.
| (e) | On June 13, 2022, our company entered into a mortgage loan facility with Wells Fargo Bank (the “Wells Fargo Mortgage Facility”) in the principal amount of $18,609,500. The proceeds of this mortgage were used to finance the acquisition of the Salisbury Marketplace Property and to refinance the mortgages payable on the Lancer Center Property and the Greenbrier Business Center Property. The Wells Fargo Mortgage Facility bears interest at a fixed rate of 4.50% for a five-year term. The monthly payment, which includes interest at the fixed rate, and principal, based on a twenty-five -year amortization schedule, is $103,438. Our company has provided an unconditional guaranty of the payment of and performance under the terms of the Wells Fargo Mortgage Facility. The Wells Fargo Mortgage Facility credit agreement includes covenants to maintain a debt service coverage ratio of not less than 1.50 to 1.00 on an annual basis and a minimum debt yield of 9.5% on the Salisbury Marketplace Property, the Lancer Center Property and the Greenbrier Business Center Property, and to maintain liquid assets of not less than $1,500,000. As of March 31, 2024 and December 31, 2023, respectively, our company believes that we are compliant with these covenants. |
Our company financed its acquisitions of its assets held for sale through mortgages, which as of December 31, 2023 were recorded as a reduction to interest expense.mortgages payable, net, associated with assets held for sale, on our condensed consolidated balance sheets. Our company sold the Hanover Square Shopping Center Property on March 13, 2024 and repaid the mortgage payable. | | | | | | | | | | | | | | | Monthly | | Interest | | | | March 31, 2024 | | December 31, | Property | | Payment | | Rate | | Maturity | | (unaudited) | | 2023 | Hanover Square (a) | $ | 78,098 | | 6.94 | % | December 2027 | | $ | — | | $ | 9,640,725 | Total mortgages payable associated with assets held for sale | | | | | | | | $ | — | | $ | 9,640,725 |
Amounts presented do not reflect unamortized loan issuance costs. | (a) | The mortgage loan for the Hanover Square Property bore interest at a fixed rate of 4.25% until January 1, 2023, when the interest rate adjusted to a fixed rate of 6.94%, which was determined by adding 3.00% to the daily average yield on United States Treasury securities adjusted to a constant maturity of five years, as made available by the Federal Reserve Board, with a minimum of 4.25%. As a result of the interest rate change, as of February 1, 2023, the fixed monthly payment of $56,882 increased to $78,098 which includes interest at the fixed rate, and principal, based on a twenty-five -year amortization schedule. On March 13, 2024, our company sold the Hanover Square Shopping Center Property and repaid the mortgage loan for the Hanover Square Property. |
Off-Balance Sheet Arrangements As of March 31, 20192024 and 2018, our company had no notes payable, short term or related party notes payable, short term outstanding. During the three months ended MarchDecember 31, 2018, our company repaid a short term note payable in the principal amount of $1,500,000. In addition, during the three months ended March 31, 2018, our company repaid related party notes payable, short term, to five related parties totaling $677,538. These short term notes were issued on November 3, 2017 to finance the purchase of the Hampton Inn Property. Off-Balance Sheet Arrangements
As of March 31, 2019,2023, we have no off-balance sheet arrangements.
Summary of Critical Accounting Policies The preparation of condensed consolidated financial statements in conformity with GAAPaccounting principles generally accepted in the United States of America (“GAAP”) requires management to use judgment in the application of accounting policies, including making estimates and assumptions. If our judgment or interpretation of the facts and circumstances relating to various transactions had been different, or different assumptions were made, it is possible that different accounting policies would have been applied, resulting in different financial results or a different presentation of our financial statements. Below is a discussion of the accounting policies that we consider critical to an understanding of our financial condition and operating results that may require complex or significant judgment in their application or require estimates about matters which are inherently uncertain. A discussion of our significant accounting policies, including further discussion of the accounting policies described below, can be found in Note 2, “Summary of Significant Accounting Policies,” of our Consolidated Financial Statements. We believe that the application of these policies on a consistent basis enables us to provide useful and reliable financial information about our operating results and financial condition. Revenue Recognition Principal components of our total revenues for our retail center properties, flex center properties and STNL revenues include base rents and tenant reimbursements. We accrue minimum (base) rent on a straight-line basis over the terms of the respective leases which results in an unbilled rent asset or deferred rent liability being recorded on the balance sheet. Certain lease agreements contain provisions that grant additional rents based on tenants’ sales volumes (contingent or percentage rent) which we recognize when the tenants achieve the specified targets as defined in their lease agreements. We periodically review the valuation of the asset/liability resulting from the straight-line accounting treatment of our leases in light of any changes in lease terms, financial condition or other factors concerning our tenants. Rents and Other Tenant Receivables For our retail center properties, flex center properties and STNL properties, we record a tenant receivable for amounts due from tenants such as base rents, tenant reimbursements and other charges allowed under the lease terms. We periodically review tenant receivables for collectability and determine the need for an allowance for the uncollectible portion of accrued rents and other accounts receivable based upon customer creditworthiness (including expected recovery of a claim with respect to any tenants in bankruptcy), historical bad debt levels and current economic trends. We consider a receivable past due once it becomes delinquent per the terms of the lease. A past due receivable triggers certain events such as notices, fees and other actions per the lease. Accounting for Leases For our hotel property, revenues are recognized as earned, which is generally defined as the date upon which a guest occupies a room or utilizes the hotel’s services.
The CompanyOur company adopted ASU No. 2014-09,Accounting Standards Update (“ASU”) 2016-02, Revenue from Contracts with CustomersLeases (Topic 606)842) effective on January 1, 2019 (see Recent Accounting Pronouncements2022 using the modified retrospective approach within ASU 2018-11, which allows for the application date to be the beginning of the reporting period in Note 2, “Summary of Significant Accounting Polices,” of our Consolidated Financial Statements). This adoptionwhich the entity first applies the new standard. Our company historically has not been and is not currently a “lessee” under any lease agreements, and thus did not have a material impact onany arrangements requiring the Company’s recognition of lease assets or liabilities on its balance sheet. As a “lessor”, our company has active lease agreements with over 130 tenants across our portfolio of investment properties.
Upon the adoption of ASC No. 842, our company has elected the practical expedient permitting lessors to elect by class of underlying asset to not separate non-lease components (for example, maintenance services, including common area maintenance) from associated lease components (the “non-separation practical expedient”) if both of the following criteria are met: (1) the timing and pattern of transfer of the lease and non-lease component(s) are the same and (2) the lease component would be classified as an operating lease if it were accounted for separately. If both criteria are met, the combined component is accounted for in accordance with ASC No. 842 if the lease component is the predominant component of the combined component; otherwise, the combined component is accounted for in accordance with the revenue recognition standard. Our company assessed the criteria above with respect to our operating leases and determined that they qualify for the non-separation practical expedient. As a result, we have accounted for and presented the revenues from either its retail properties or its hotel property. these leases, including tenant reimbursements, as a single line item on our condensed consolidated statements of operations for the three months ended March 31, 2024 and 2023. Acquisition of Investments in Real Estate The adoption of ASU 2017-01, as discussed in Note 2, “Summary of Significant Accounting Policies” of the Consolidated Financial Statementscondensed consolidated financial statements included in this report, has impacted our accounting framework for the acquisition of investment properties. Upon acquisition of investment properties, our company estimates the fair value of acquired tangible assets (consisting of land, buildings and improvements, and furniture, fixtures and equipment) and identified intangible assets and liabilities, including in-place leases, above- and below-market leases, tenant relationships and assumed debt based on evaluation of information and estimates available at that date. Fair values for these assets are not directly observable and estimates are based on comparable market data and other information which is subjective in nature, including estimated cash flow projections that utilize appropriate discount and capitalization rates and available market information.
Impairment of Long-Lived Assets We periodically review investment properties for impairment on a property-by-property basis to identify any events or changes in circumstances that indicate that the carrying value of investment properties may not be recoverable. These circumstances include, but are not limited to, declines in the property’s cash flows, occupancy and fair market value. If any such events or changes in circumstances are identified, we perform a formal impairment analysis. We measure any impairment of investment property when the estimated undiscounted operating income before depreciation and amortization, is less than the carrying value of the property. To the extent impairment has occurred, we charge to income the excess of carrying value of the property over its estimated fair value. We estimate fair value using data such as operating income, estimated capitalization rates or multiples, leasing prospects and local market information. Our company also reviews its intangible assets for impairment whenever events or changes in circumstances indicate that the carrying value of its intangible assets may not be recoverable, but at least annually. REIT Status We are a Maryland corporation that has elected to be treated, for U.S. federal income tax purposes, as a REIT. We elected to be taxed as a REIT under the Code for the year ended December 31, 2017 and have not revoked such election. A REIT is a corporate entity which holds real estate interests and must meet a number of organizational and operational requirements, including a requirement that it currently distribute at least 90% of its adjusted taxable income to stockholders. As a REIT, we generally will not be subject to corporate level federal income tax on our taxable income if we annually distribute 100% of our taxable income to our stockholders. If we fail to qualify as a REIT in any taxable year, we will be subject to regular federal and state corporate income taxes and may not be able to elect to qualify as a REIT for four subsequent taxable years. Our qualification as a REIT requires management to exercise significant judgment and consideration with respect to operational matters and accounting treatment. Therefore, we believe our REIT status is a critical accounting estimate. Evaluation of Our Company’s Ability to Continue as a Going Concern Under the accounting guidance related to the presentation of financial statements, our company is required to evaluate, on a quarterly basis, whether or not the entity’s current financial condition, including its sources of liquidity at the date that the condensed consolidated financial statements are issued, will enable the entity to meet its obligations as they come due arising within one year of the date of the issuance of our company’s condensed consolidated financial statements and to make a determination as to whether or not it is probable, under the application of this accounting guidance, that the entity will be able to continue as a going concern. Our company’s condensed consolidated financial statements have been presented on a going concern basis, which contemplates the realization of assets and the satisfaction of liabilities in the normal course of business. In applying applicable accounting guidance, management considered our company’s current financial condition and liquidity sources, including current funds available, forecasted future cash flows and our company’s obligations due over the next twelve months, as well as our company’s recurring business operating expenses. The redemption date of our company’s mandatorily redeemable preferred stock is February 19, 2025 (the “Redemption Date”). Our company will require additional liquidity to fund the redemption. Our company expects to be able to generate this liquidity from a number of sources, including cash on hand, forecasted future cash flows for the periods prior to the Redemption Date, and careful management of our company’s capital expenditures during the periods prior to the Redemption Date. We have concluded that it is probable that we will be able to meet our obligations arising within one year of the date of issuance of these condensed consolidated financial statements within the parameters set forth in the accounting guidance. For additional information regarding our company’s liquidity, see Note 5 – Loans Payable and Note 8 – Commitments and Contingencies in the notes to our company’s condensed consolidated financial statements. Liquidity and Capital Resources Our business model is intended to drive growth through acquisitions. Access to the capital markets is an important factor for our continued growth and success. We expect to continue to issue equity in our company through our offering with proceeds being used to acquire additional target properties. Our primary liquidity needs are primarily to fund (i)funding for (1) operations, including operating expenses, corporate and cash dividends; (ii) property acquisitions; (iii) depositsadministrative costs, payment of principal of, and feesinterest on, outstanding indebtedness, and escrow and reserve payments associated with long-term debt financing for our properties; (iv)(2) investing needs, including property acquisitions and recurring capital expenditures; (v)and (3) financing needs, including cash dividends and debt repayments; (vi) paymentrepayments. Internal liquidity willto fund operating needs are expected to be provided solelyprimarily by the rental receipts from our realretail and flex center properties. The only external liquidity source we have currently identified is our ongoing efforts to raise capital by the issuance of shares of common stock. On May 13, 2019, we issued and sold 1,666,667 Common Shares at an offering price of $4.80 per share. Net proceeds from the issuance are estimated to be $6,755,000, which includes the impact of discounts and offering costs, including the underwriter’s selling commissions and legal, accounting and other professional fees. As part of this offering, we granted the underwriters a 45-day option to purchase up to 250,000 additional Common Shares at the public offering price, less the underwriting discount and commissions, to cover over-allotments, if any.
Cash Flows
At March 31, 2019,2024, our consolidated cash and restricted cash on hand totaled $1,269,765$5,136,434 compared to consolidated cash on hand of $5,290,371$3,809,605 at MarchDecember 31, 2018.2023. Cash flows from operating activities, investing activities and financing activities for the three months ended March 31, 2019 and 20182024 are as follows: Operating Activities During the three months ended March 31, 2018,2024, our company owned and operatedcash provided by operating activities was $492,441 compared to cash provided by operating activities of $450,724 for the three months ended March 31, 2023, an increase in cash provided by operating activities of $41,717. Cash flows from operating activities has two properties, the Franklin Square Property and the Hampton Inn Property.components. The first component consists of net operating loss adjusted for non-cash operating activities. During the three months ended March 31, 2019,2024, operating activities adjusted for non-cash items resulted in net cash provided by operating activities of $493,480. During the three months ended March 31, 2023, operating activities adjusted for non-cash items resulted in net cash used in operating activities of $817. The increase of $494,297 in cash flows from operating activities for the three months ended March 31, 2024 was a result of improved net operating income from our financialinvestment properties and reduced management restructuring expenses of $241,450. The second component consists of changes in assets and liabilities. Increases in assets and decreases in liabilities result in cash used in operations. Decreases in assets and increases in liabilities result in cash provided by operations. During the three months ended March 31, 2024, net changes in asset and liability accounts resulted in $1,039 in cash used by operations. During the three months ended March 31, 2023, net changes in asset and liability accounts resulted in $451,541 in cash provided by operations. This increase of $452,580 in cash used in operations resulting from changes in assets and liabilities is a result of decreased changes in accounts payable and accrued liabilities of $412,935, decreased changes in other assets of $47,431, and decreased changes in rent and other receivables, net, of $39,244, offset by decreased changes in unbilled rent of $47,030. The net of (i) the $493,480 increase in cash provided by operations from the first category and (ii) the $1,039 cash used by operations from the second category results also include our third property,in a total increase of cash provided in operations of $492,441 for the Hanover Square Property, which was acquired in May 2018.three months ended March 31, 2024. Investing Activities During the three months ended March 31, 2019,2024, our cash flows provided by operatinginvesting activities were $84,822was $2,738,142, compared to cash flows used in operatinginvesting activities of $222,931$647,690 during the three months ended March 31, 2023, an increase in cash provided by investing activities of $3,385,832. During the three months ended March 31, 2024, cash provided by investing activities consisted of $3,110,149 in cash received from the disposal of investment properties, offset by $145,345 in investment property acquisitions, including $100,891 in cash paid for the acquisition of the noncontrolling owner’s 16% interest in the Hanover Square Outparcel and $44,454 paid in cash for closing costs related to the Citibank Property acquisition, and $226,662 in capitalized expenditures, including $29,124 in building improvements, $2,300 in site improvements, $54,963 in leasing commissions and $140,275 in tenant improvements. During the three months ended March 31, 2023, cash used in investing activities consisted of $647,690 in capitalized expenditures, including $168,464 in building improvements, $11,323 in site improvements, $90,638 in capitalized leasing commissions, and $377,265 in capitalized tenant improvements. The non-cash investing activity for the three months ended March 31, 2018, an increase2024 that did not affect our cash provided by investing activities, was the issuance of $307,753. This increase was largely driven by an increase$2,400,000 in accounts payable and accrued liabilitiesOperating Partnership Units for the acquisition of $298,709 which reduced our use of cash. While our net loss increased from $511,325the Citibank Property. There were no non-cash investing activities for the three months ended March 31, 2018 to $840,486 for the three months ended March 31, 2019, this was a result2023. Table of increases in non-cash expenses, including depreciation and amortization and the decrease in the fair value of the interest rate cap.Contents Financing Activities Investing Activities
During the three months ended March 31, 2019,2024, our cash flows used in investingby financing activities were $778,600was $1,903,754 compared to cash flows used in investingby financing activities of $46,568$480,522 during the three months ended March 31, 2018.2023, an increase in cash used by financing activities of $1,423,232. During the three months ended March 31, 2019,2024, our cash used by financing activities consisted of $1,000,000 to repay the line of credit, short term, $331,215 in investing activities included $372,831principal payments for our company’s mortgages, $510,950 in advance deposits for furnituredividends and fixtures related to the Property Improvement Plandistributions and $61,589 for the Hampton Inn Property and $405,769 in capital expenditures consisting $362,519 in interior and exterior construction costs for the Property Improvement Plan for the Hampton Inn Property, $32,630 in tenant improvements and leasing commissions for Franklin Square and $10,620 in equipment for the Hampton Inn Property. Operating Partnership Unit redemption. During the three months ended March 31, 2018, investing activities were related to the payment of leasing commissions for the Franklin Square Property and initial expenditures for the Hampton Inn Property’s Property Improvement Plan. Financing Activities
During the three months ended March 31, 2019, our2023, cash flows used in financing activities were $187,325 compared to cash flows provided by financing activitiesconsisted of $5,412,818 during the three months ended March 31, 2018. During the three months ended March 31, 2019, our company made $32,408 in$301,577 for mortgage debt principal payments on the Hanover Square North mortgage payable and $16,000 in distributions to noncontrolling owner of the Hanover Square Property. Additionally, during the three months ended March 31, 2019, our company paid $138,827 in offering costs associated with our public offering of Common Shares which closed on May 13, 2019.$178,945 for dividends and distributions.
During the three months ended March 31, 2018, our company generated net proceeds, after offering costs, from our common stock issuances of $7,590,356 and repaid notes payables and related party payables of $2,177,538.
Non-cash financing activities that did not materially affect our cash flows provided by financing activities and were $0 for the three months ending March 31, 2019 and $37,468, representing a short-term receivable in lieu of proceeds from the sale of common stock, for the three months ended March 31, 2018.
Future Liquidity Needs Liquidity for general operating needs and our company’s investment properties is generally provided solely by the rental receipts from those properties. Liquidityour retail properties and flex center properties, and revenues from our hotel properties, if any. We expect to provide any liquidity for growth (acquisition of new investment properties) will be provided by raising additional equity issuances, netinvestment capital. In addition, our company continually reviews and evaluates its outstanding mortgages payable for refinancing opportunities. While some of issuance costs.our mortgages payable are not pre-payable, some mortgages payable may present opportunities for refinancing. The primary, non-operating liquidity needs of our company are $5,000,000 to redeem our mandatorily redeemable preferred stock in February, 2025, $54,154 to pay the dividends and distributions to our common stockholders and Operating Partnership Unit holders, $100,000 to pay the dividends to holders of our mandatorily redeemable preferred stock that were declared on April 8, 2024 and payable on April 25, 2024 to holders of record on April 22, 2024, and $612,808 in principal payments due on our mortgages payable during the remaining nine months ending December 31, 2024. In addition to the fundingliquidity required to fund these dividends and principal payments, we may also incur some level of capital expenditures for our ongoing operations,existing properties that cannot be passed on to our primarytenants. Our company plans to pay these obligations through a combination of cash on hand, potential dispositions and operating cash. To meet these future liquidity needs, atour company has the following resources: | · | $3,637,400 in unrestricted cash as of March 31, 2024; |
| ● | $1,499,034 held in lender reserves for the purposes of tenant improvements, leasing commissions, real estate taxes and insurance premiums; |
| · | Our company’s $1,500,000 line of credit with Wells Fargo Bank, which has an available balance of $1,500,000 as of March 31, 2024, and which matures on June 9, 2024; and |
| · | Cash generated from operations during the remaining nine months ending December 31, 2024, if any. |
Results of Operations Three months ended March 31, 2019 were to provide funding for the ongoing costs associated with our company’s continuing efforts to raise capital through the issuance of additional shares of common stock. We anticipate that these costs will be funded by proceeds from the future issuances of common stock.2024 Results of Operations
Total Revenue
Revenues Total revenue was $1,538,482$2,571,639 for the three months ended March 31, 2019,2024, consisting of $567,561$1,849,617 in revenues from the Franklin Square Property, $326,433 in revenuesretail center properties, $664,067 from the Hanover Square Propertyflex center properties and $644,488 in revenues$57,955 from the Hampton Inn Property.Total revenue was $1,202,850 for the three months ended March 31, 2018, consisting of $456,871 in revenues from the Franklin Square Property and $745,979 in revenues from the Hampton Inn Property. STNL properties. Total revenues for the three months ended March 31, 20192024 increased by $335,632$110,663 over the three months ended March 31, 2018. While2023, resulting from new leasing activity in our retail center and flex center properties, and the acquisition of the Citibank Property. | | | | | | | | | | | | | For the three months ended | | | | | | | March 31, | | Increase / | | | | 2024 | | 2023 | | (Decrease) | | Revenues | | | | | | | | | | | Retail center properties | | $ | 1,849,617 | | $ | 1,835,373 | | $ | 14,244 | | Flex center properties | | | 664,067 | | | 569,297 | | | 94,770 | | Single tenant net lease properties | | | 57,955 | | | 56,306 | | | 1,649 | | Total Revenues | | $ | 2,571,639 | | $ | 2,460,976 | | $ | 110,663 | |
Revenues from retail center properties were $1,849,617 for the three months ended March 31, 2024, an increase of $14,244 over retail center property revenues for the three months ended March 31, 2023. Increased revenues of $33,262 from the Hampton InnFranklin Square Property declinedand $22,385 from the Lancer Center Property due to new leasing activity, were offset by $101,491reduced revenues of $3,950 from the Ashley Plaza Property, and $13,341 from the Salisbury Marketplace Property, due to reduced occupancy, and reduced revenues of $24,112 due to the ongoing construction related to the Property Improvement Plan and increased competition, the overall increase is a resultsale of $326,433 in new revenues from the Hanover Square Property and $110,690 inon March 13, 2024. | | | | | | | | | | | | For the three months ended | | | | | | March 31, | | Increase / | | | 2024 | | 2023 | | (Decrease) | Retail Center Properties | | | | | | | | | | Franklin Square Property | | $ | 617,136 | | $ | 583,874 | | $ | 33,262 | Hanover Square Property | | | 307,325 | | | 331,437 | | | (24,112) | Ashley Plaza Property | | | 371,593 | | | 375,543 | | | (3,950) | Lancer Center Property | | | 327,170 | | | 304,785 | | | 22,385 | Salisbury Property | | | 226,393 | | | 239,734 | | | (13,341) | | | $ | 1,849,617 | | $ | 1,835,373 | | $ | 14,244 |
Revenues from the flex center properties were $664,067 for the three months ended March 31, 2024, an increase of $94,770 over revenues from flex center properties for the three months ended March 31, 2023 due increased revenues from Franklin Square resultingthe Parkway Property of $17,423 and the Greenbrier Business Center Property of $70,080, both due to new leasing activity, and the Brookfield Center Property of $7,267. | | | | | | | | | | | | For the three months ended | | | | | | March 31, | | Increase / | | | 2024 | | 2023 | | (Decrease) | Flex Center Properties | | | | | | | | | | Brookfield Center Property | | $ | 214,378 | | $ | 207,111 | | $ | 7,267 | Greenbrier Business Center Property | | | 250,326 | | | 180,246 | | | 70,080 | Parkway Center Property | | | 199,363 | | | 181,940 | | | 17,423 | | | $ | 664,067 | | $ | 569,297 | | $ | 94,770 |
Revenues from new leasesSTNL properties were $57,955 for the three months ended March 31, 2024, an increase of $1,649 from revenues from STNL properties for the three months ended March 31, 2023, due to a lease escalation for the T-Mobile Property and contractual increases in existing leases.the acquisition of the Citibank Property. | | | | | | | | | | | | For the three months ended | | | | | | March 31, | | Increase / | | | 2024 | | 2023 | | (Decrease) | Single Tenant Net Lease Properties | | | | | | | | | | East Cost Wings Property (Ashley Plaza) | | $ | 26,628 | | $ | 26,628 | | $ | — | T-Mobile Property (Ashley Plaza) | | | 29,853 | | | 29,678 | | | 175 | Citibank Property | | | 1,474 | | | — | | | 1,474 | | | $ | 57,955 | | $ | 56,306 | | $ | 1,649 |
Operating Expenses Total operating expenses were $2,574,544 for the three months ended March 31, 2024, consisting of $428,259 in expenses from retail center properties, $158,729 in expenses from the flex center properties, $7,708 in expenses from the STNL properties, $277,500 in share based compensation expenses, $393,078 in legal, accounting and other professional fees, $296,794 in corporate general and administrative expenses, and $1,012,476 in depreciation and amortization. | | | | | | | | | | | | For the three months ended | | | | | | March 31, | | Increase / | | | 2024 | | 2023 | | (Decrease) | Operating Expenses | | | | | | | | | | Retail center properties (1) | | $ | 428,259 | | $ | 513,012 | | $ | (84,753) | Flex center properties (2) | | | 158,729 | | | 203,734 | | | (45,005) | Single tenant net lease properties | | | 7,708 | | | 7,728 | | | (20) | Total Investment Property Operating Expenses | | | 594,696 | | | 724,474 | | | (129,778) | Share based compensation expenses | | | 277,500 | | | — | | | 277,500 | Legal, accounting and other professional fees (3) | | | 393,078 | | | 525,628 | | | (132,550) | Corporate general and administrative expenses | | | 296,794 | | | 117,049 | | | 179,745 | Management restructuring expenses | | | — | | | 241,450 | | | (241,450) | Loss on impairment | | | — | | | 36,743 | | | (36,743) | Depreciation and amortization | | | 1,012,476 | | | 1,156,348 | | | (143,872) | Total Operating Expenses | | $ | 2,574,544 | | $ | 2,801,692 | | $ | (227,148) |
| (1) | Includes bad debt expense of $0 and $125 for the three months ended March 31, 2024 and 2023, respectively. |
| (2) | Includes bad debt expense of $14,056 and $26,997 for the three months ended March 31, 2024 and 2023, respectively. |
| (3) | Includes $176,891 and $144,734 in expenses paid to the Consultant pursuant to the initial Consulting Agreement and subsequent Staffing Agreement for the three months ended March 31, 2024 and 2023, respectively. |
Operating Expenses Totalexpenses for retail center properties were $428,259 for the three months ended March 31, 2024, a decrease of $84,753 from retail center property operating expenses for the three months ended March 31, 2019 were $1,826,865, consisting2023. Decreased operating expenses in all of $183,214 in expenses forthe Company’s properties, including $22,300 from the Salisbury Property, $811 from the Hanover Square Property, $21,851 from the Franklin Square Property, $86,061$21,327 from the Ashley Plaza Property, and $18,464 from the Lancer Center Property, primarily from the elimination of the asset management fees paid by the properties to our company’s former Manager.
| | | | | | | | | | | | For the three months ended | | | | | | March 31, | | Increase / | | | 2024 | | 2023 | | (Decrease) | Retail Center Properties | | | | | | | | | | Franklin Square Property | | $ | 156,641 | | $ | 178,492 | | $ | (21,851) | Hanover Square Property | | | 88,342 | | | 89,153 | | | (811) | Ashley Plaza Property | | | 58,883 | | | 80,210 | | | (21,327) | Lancer Center Property (1) | | | 85,800 | | | 104,264 | | | (18,464) | Salisbury Property | | | 38,593 | | | 60,893 | | | (22,300) | | | $ | 428,259 | | $ | 513,012 | | $ | (84,753) |
(1)Includes bad debt expense of $0 and $125 for the Hanover Square Property, $581,975three months ended March 31, 2024 and 2023, respectively. Operating expenses from the flex center properties were $158,729 for the Hampton Inn Property, $353,747three months ended March 31, 2024, a decrease of legal, accounting and other professional fees, $55,705 in corporate general and administrative expenses and $566,163 in depreciation and amortization expenses. Total$45,005 over flex center property operating expenses for the three months ended March 31, 2018 were $1,364,183, consisting2023 due to decreased operating expenses from the Greenbrier Business Center Property of $192,681 in$23,324, from the Parkway Property of $13,254, and from the Brookfield Center Property of $8,427.
| | | | | | | | | | | | For the three months ended | | | | | | March 31, | | Increase / | | | 2024 | | 2023 | | (Decrease) | Flex Center Properties | | | | | | | | | | Brookfield Center Property | | $ | 52,424 | | $ | 60,851 | | $ | (8,427) | Greenbrier Business Center Property (1) | | | 61,868 | | | 85,192 | | | (23,324) | Parkway Center Property (2) | | | 44,437 | | | 57,691 | | | (13,254) | | | $ | 158,729 | | $ | 203,734 | | $ | (45,005) |
| (1) | Includes bad debt expense of $14,056 and $24,463 for the three months ended March 31, 2024 and 2023, respectively. |
| (2) | Includes bad debt expense of $0 and $2,534 for the three months ended March 31, 2024 and 2023, respectively. |
Operating expenses for the Franklin Square Property, $563,054 for the Hampton Inn Property, $212,179 of legal, accounting and other professional fees, $2,305 of corporate general and administrative expenses, and $393,964 in depreciation and amortization expenses. Total operating expensesSTNL properties were $7,708 for the three months ended March 31, 2019 increased by $462,682 over the three months ended March 31, 2018.This increase was2024, a resultdecrease of owning the Hanover Square Property$20 from operating expenses from hotel properties for the three months ended March 31, 2019, and an increase in legal, accounting and other professional fees resulting2023, due to decreased operating expenses from the compliance requirements for a public company. During the three months ended March 31, 2019,T-Mobile Property offset by increased operating expenses of $94 for the Hampton Inn Property were $18,921 less thanEast Coast Wings Property.
| | | | | | | | | | | | For the three months ended | | | | | | March 31, | | Increase / | | | 2024 | | 2023 | | (Decrease) | Single Tenant Net Lease Properties | | | | | | | | | | East Cost Wings Property (Ashley Plaza) | | $ | 3,719 | | $ | 3,625 | | $ | 94 | T-Mobile Property (Ashley Plaza) | | | 3,989 | | | 4,103 | | | (114) | Citibank Property | | | — | | | — | | | — | | | $ | 7,708 | | $ | 7,728 | | $ | (20) |
Operating Income (Loss) Operating income for the three months ended March 31, 2018 due to lower variable costs resulting2024 was $2,764,760, an increase of $3,105,476 from lower occupancy. Interest Expense
Interest expensethe operating loss of $340,716 for the three months ended March 31, 20192023. This increase was $506,074. This consisteda result of (i) $167,731 in mortgage interestincreased investment property operating income of $240,441, decreased legal, accounting and $4,638 inother professional fees of $132,550, decreased management restructuring expenses of $241,450, decreased loss on impairment of $36,743, and decreased depreciation and amortization expenses of loan issuance costs for the Franklin Square Property, (ii) $199,891 in mortgage interest, $34,890 in amortization$143,872, offset by increased share based compensation expenses of loan issuance costs$277,500, and $14,391 in payments (recorded as a reduction in interest expense) from the interest rate cap transaction for the Hampton Inn Property, (iii) $107,265 in mortgage interestincreased corporate general and $3,183 in amortizationadministrative expenses of loan issuance costs for the Hanover Square Property and (iv) other interest of $2,867.$179,745.
Interest Expense Interest expense was $876,748 and $864,052 for the three months ended March 31, 2018 was $424,281. This consisted of (i) $167,731 in mortgage interest2024 and $4,638 in amortization of loan issuance costs for the Franklin Square Property (ii) $177,844 in mortgage interest and $34,890 in amortization of loan issuance costs for the Hampton Inn Property, (iii) $36,685 in interest and fees on a short-term note payable that was repaid during the three months ended March 31, 2018, and (iv) other interest of $2,493.2023, respectively, as follows: | | | | | | | | | | | | For the three months ended | | | | | | March 31, | | Increase / | | | 2024 | | 2023 | | (Decrease) | Franklin Square | | $ | 134,634 | | $ | 133,233 | | $ | 1,401 | Hanover Square | | | 129,248 | | | 173,863 | | | (44,615) | Ashley Plaza | | | 105,514 | | | 106,490 | | | (976) | Brookfield Center | | | 47,825 | | | 48,229 | | | (404) | Parkway Center | | | 67,645 | | | 30,672 | | | 36,973 | Wells Fargo Mortgage Facility | | | 210,320 | | | 212,761 | | | (2,441) | Wells Fargo Line of Credit | | | 15,144 | | | — | | | 15,144 | Amortization and preferred stock dividends on mandatorily redeemable preferred stock | | | 164,126 | | | 158,804 | | | 5,322 | Other interest | | | 2,292 | | | — | | | 2,292 | Total interest expense | | $ | 876,748 | | $ | 864,052 | | $ | 12,696 |
Total interest expense for the three months ended March 31, 20192024 increased by $81,793$12,696 over the three months ended March 31, 2018.2023. This increase was a result of owningincreased interest of $1,401 from the Franklin Square Mortgage, $36,973 from the Parkway Mortgage, $15,144 from the Wells Fargo Line of Credit, $5,322 of amortization and preferred dividends on the Company’s mandatorily redeemable preferred stock, and $2,292 of other interest, offset by decreased interest expense from the Ashley Plaza mortgage of $976, the Brookfield mortgage of $404, $44,615 from the sale of the Hanover Square Shopping Center Property, and $2,441 from the Wells Fargo Mortgage Facility. Interest expense above includes non-cash amortization of discounts and capitalized issuance costs related to the mandatorily redeemable preferred stock. See Note 5 of the accompanying notes to the condensed consolidated financial statements. Other Income During the three months ended March 31, 2024, other income was $44,889, an increase of $34,059 from other income of $10,830 for the three months ended March 31, 2019. 2023. Other Income and Expense On November 3, 2017, our company entered into an Interest Rate Protection Transaction to limit our company’s exposure to increases in interest rates on the variable rate mortgage loan on the Hampton Inn Property. Under this agreement, our company’s interest rate exposure is capped at 7 percent if USD 1-Month LIBOR BBA exceeds 2%. As of March 31, 2019 and December 31, 2018, USD 1-Month LIBOR was 2.4945 percent and 2.51988 percent, respectively. In accordance with the guidance on derivatives and hedging, our company records all derivatives on the balance sheet at fair value. As of March 31, 2019, the fair value of the Interest Rate Protection Transaction was $76,394, a decrease of $50,403 over the December 31, 2018 fair value. This decrease in fair value was recorded as a “decrease (increase) in fair value-interest rate cap” during the three months ended March 31, 2019. As of March 31, 2018, the fair value of the Interest Rate Protection Transaction was $157,725, an increase decrease of $74,289 over the December 31, 2017 fair value. This increase in fair value was recorded as a “decrease (increase) in fair value-interest rate cap” during the three months ended March 31, 2018.
Beginning in July 2018, the USD 1-Month LIBOR BBA rate exceeded two percent and remained in excess of two percent on each subsequent monthly valuation date from July 2018 through March 31, 2019. For the three months ended March 31, 2019 and 2018, our company received $14,391 and $0 in payments under the Interest Rate Protection Transaction, all of which were recorded as a reduction to interest expense.
Our company also recognized $4,374 and $0 in interest income on cash balances held in a money market account for the three months ended March 31, 20192024 consisted of $35,338 in income related to the fair value change of the interest rate cap, and 2018, respectively.
Net Loss
Total net loss was $840,486interest income of $9,551. Other income for the three months ended March 31, 2019,2023 consisted of interest income of $10,830.
Other Expense During the three months ended March 31, 2024, other expense was $0, a decrease of $39,868 from other expense of $39,868 for three months ended March 31, 2023. Other expense for the three months ended March 31, 2023 consisted of $39,868 in expense related to the fair value change of the interest rate cap. Net Income (Loss) Net income was $1,932,901 for the three months ended March 31, 2024, before adjustments for net income (loss) attributable to noncontrolling interests. After adjusting for noncontrolling interests, the net income attributable to our common shareholders was $1,357,398. Net loss was $1,233,806 for the three months ended March 31, 2023, before adjustments for net income (loss) attributable to noncontrolling interests. After adjusting for noncontrolling interests, the net loss attributable to Medalist common shareholders was $1,221,295, for the three months ended March 31, 2023. Net income for the three months ended March 31, 2024 increased by $3,166,707 over the net loss from the three months ended March 31, 2023, before adjustments for net loss attributable to noncontrolling interests. After adjusting for noncontrolling interests, the net lossincome attributable to ourMedalist common shareholders was $686,639.Total net loss was $511,325 for the three months ended March 31, 2018, before adjustments for net loss attributable to noncontrolling interests. After adjusting for noncontrolling interests,2024 increased by $2,578,693 over the net loss attributable to our common shareholders was $450,875. Total net loss forfrom the three months ended March 31, 2019 increased by $329,161 over the three months ended March 31, 2018, before adjustments for net loss attributable to noncontrolling interests. After adjusting for noncontrolling interests, total net loss for the three months ended March 31, 2019 increased by $235,764 over the three months ended March 31, 2018.This increase was a result of lower revenues from the Hampton Inn Property, increased legal, accounting and other professional fees and the impact of the ownership of the Hanover Square Property for the three months ended March 31, 2019.2023.
Funds from Operations We use Fundsfunds from operations (“FFO”), a non-GAAP measure, as an alternative measure of our operating performance, specifically as it relates to results of operations and liquidity. We compute FFO in accordance with standards established by the Board of Governors of the National Association of Real Estate Investment Trusts (“NAREIT”) in its March 1995 White Paper (as amended in November 1999, April 2002 and December 2018). As defined by NAREIT, FFO represents net income (computed in accordance with GAAP), excluding gains (or losses) from sales of property, plus real estate related depreciation and amortization (excluding amortization of loan origination costs and above and below market leases) and after adjustments for unconsolidated partnerships and joint ventures. Most industry analysts and equity REITs, including us, consider FFO to be an appropriate supplemental measure of operating performance because, by excluding gains or losses on dispositions and excluding depreciation, FFO is a helpful tool that can assist in the comparison of the operating performance of a company’s real estate between periods, or as compared to different companies. Management uses FFO as a supplemental measure to conduct and evaluate our business because there are certain limitations associated with using GAAP net income alone as the primary measure of our operating performance. Historical cost accounting for real estate assets in accordance with GAAP implicitly assumes that the value of real estate assets diminishes predictably over time, while historically real estate values have risen or fallen with market conditions. Accordingly, we believe FFO provides a valuable alternative measurement tool to GAAP when presenting our operating results. NAREIT’s December 2018 White Paper states, “FFO of a REIT includes the FFO of all consolidated properties, including consolidated, partially owned affiliates”. Additionally, since the adjustments to GAAP net income, such as depreciation and amortization, used in the reconciliation of net income (loss) to determine FFO are not allocated between shareholders and noncontrolling interests (i.e. 100% of depreciation and amortization are “added back” without reduction to reflect the noncontrolling owners’ interest in such items), our company believes that the appropriate starting point for the calculation is the net income (loss) before allocation to noncontrolling interests. This allows our company to use FFO as a tool to measure the overall performance of its investment properties, as a whole, not just the portion of the investment properties controlled by Companyour company’s shareholders. Below is our company’s FFO, which is a non-GAAP measurement, for the three months ended March 31, 2019:2024 and 2023: | Net income (loss) | | $ | (840,486 | ) | | Depreciation of tangible real property assets (1) | | | 333,590 | | | Depreciation of tenant improvements (2) | | | 60,062 | | | Amortization of leasing commissions (3) | | | 9,678 | | | Amortization of tenant inducements (4) | | | 4,260 | | | Amortization of intangible assets (5) | | | 162,833 | | | Funds from operations | | $ | (270,063 | ) |
| | | | | | | | | For the three months ended | | | March 31, | | | 2024 | | 2023 | Net income (loss) | | $ | 1,932,901 | | | (1,233,806) | Depreciation of tangible real property assets (1) | | | 594,391 | | | 674,398 | Depreciation of tenant improvements (2) | | | 200,231 | | | 205,153 | Amortization of tenant improvement lease incentives (3) | | | 741 | | | — | Amortization of leasing commissions (4) | | | 45,839 | | | 31,930 | Amortization of intangible assets (5) | | | 172,015 | | | 244,867 | Gain on disposal of investment property (6) | | | (2,819,502) | | | — | Loss on impairment (6) | | | — | | | 36,743 | Loss on extinguishment of debt (7) | | | 51,837 | | | — | Funds from operations | | $ | 178,453 | | $ | (40,715) |
| (1) | (1) | Depreciation expense for buildings, site improvements and furniture and fixtures. |
| (2) | (2) | Depreciation of tenant improvements, including those (i) acquired as part of the purchase of the Franklin Square Propertyretail center and flex center properties and (ii) constructed by our company for the Hanover Square Propertyretail center properties and those constructed during the three months ended March 31, 2019. flex center property subsequent to their acquisition. |
| (3) | (3)Amortization of tenant lease incentives paid subsequent to the acquisition of the properties. |
| (4) | Amortization of leasing commissions paid forsubsequent to the Franklin Square Property andacquisition of the Hanover Square Property during the three months ended March 31, 2019. properties. |
| (5) | (4) | Amortization of tenant inducements paid for the Franklin Square Property during the three months ended March 31, 2019. |
| (5) | Amortization of intangible assets acquired as part of the purchase of the Franklin Square Propertyretail center properties and the Hanover Square Property,flex center property, including leasing commissions, leases in place and legal and marketing costs. |
| (6) | NAREIT’s December 2018 White Paper provides guidance for the treatment of impairment write-downs. Specifically, “To the extent there is an impairment write-down of depreciable real estate … related to a REIT’s main business, the write-down is excluded from FFO (i.e., adjusted from net income in calculating FFO).” Additionally, NAREIT’s December 2018 White Paper provides guidance on gains or losses on the sale of assets, stating “the REIT has the option to include or exclude such gains and losses in the calculation of FFO.” |
| (7) | Consistent with the treatment of impairment write-downs, our company includes an adjustment for its loss on extinguishment of debt. |
NAREIT’s December 2018 White Paper encourages companies reporting FFO to “make supplemental disclosure of all material non-cash revenues and expenses affecting their results for each period.” We believe that the computation of FFO in accordance with NAREIT’s definition includes certain items that are not indicative of the results provided by our operating portfolio and affect the comparability of our period-over-period performance. These items include non-cash items such as amortization of loans and above and below market leases, unbilled rent arising from applying straight line rent revenue recognition and share-based compensation expenses. Additionally, the impact of capital expenditures, including tenant improvement and leasing commissions, net of reimbursements of such expenditures by property escrow funds, is included in our calculation of AFFO. Therefore, in addition to FFO, management uses Adjusted FFO (“AFFO”), which we define to exclude such items. Management believes that these adjustments are appropriate in determining AFFO as their exclusion is not indicative of the operating performance of our assets. In addition, we believe that AFFO is a useful supplemental measure for the investing community to use in comparing us to other REITs as many REITs provide some form of adjusted or modified FFO. However, there can be no assurance that AFFO presented by us is comparable to the adjusted or modified FFO of other REITs. Total AFFO for the three months ended March 31, 20192024 and 2023 was as follows: | Funds from operations | | $ | (270,063 | ) | | Amortization of above market leases (1) | | | 54,934 | | | Amortization of below market leases (2) | | | (23,512 | ) | | Straight line rent (3) | | | (85,326 | ) | | Capital expenditures, net of escrow reimbursements (4) | | | (211,417 | ) | | Increase in fair value of interest rate cap (5) | | | 50,403 | | | Amortization of loan issuance costs (6) | | | 42,711 | | | Adjusted funds from operations (AFFO) | | $ | (442,270 | ) |
| | | | | | | | | For the three months ended | | | March 31, | | | 2024 | | 2023 | Funds from operations | | $ | 178,453 | | $ | (40,715) | Amortization of above market leases (1) | | | 15,434 | | | 27,343 | Amortization of below market leases (2) | | | (79,856) | | | (100,361) | Straight line rent (3) | | | (1,869) | | | (48,899) | Capital expenditures (4) | | | (226,662) | | | (647,690) | Decrease (increase) in fair value of interest rate cap (5) | | | (35,338) | | | 39,868 | Amortization of loan issuance costs (6) | | | 23,767 | | | 26,990 | Amortization of preferred stock discount and offering costs (7) | | | 64,126 | | | 58,804 | Share-based compensation (8) | | | 277,500 | | | — | Bad debt expense (9) | | | 14,056 | | | 27,122 | Adjusted funds from operations (AFFO) | | $ | 229,611 | | $ | (657,538) |
(1) | (1) | Adjustment to FFO resulting from non-cash amortization of intangible assets recorded as part of the purchase of the Franklin Square Property and the Hanover Square Property.assets. |
| (2) | (2) | Adjustment to FFO resulting from non-cash amortization of intangible liabilities recorded as part of the purchase of the Franklin Square Property and the Hanover Square Property.liabilities. |
| (3) | (3) | Adjustment to FFO resulting from non-cash revenues recognized as a result of applying straight line revenue recognition for the Franklin Square Propertyretail center properties and the Hanover Square Property.flex center properties. |
| (4) | (4) | Adjustment to FFO for capital expenditures, made during the three months ended March 31, 2019 for the Franklin Square Property, the Hanover Square Propertyincluding capitalized leasing commissions, tenant improvements, building and Hampton Inn Propertysite improvements and purchases of furniture, fixtures and equipment that willhave not bebeen reimbursed by property escrow accounts. During the three months ended March 31, 2019, our company paid $778,600 in costsSee Investing Activities, above, for leasing commissions, tenant inducements and tenant improvements at the Franklin Square Property and the Hanover Square Property and interior and exterior renovations and advance deposits for furniture and fixtures at the Hampton Inn Property. During the three months ended March 31, 2019, our company received $567,183 in funds from propertydetail of capital reserves held by the Hampton Inn Property mortgage holder. expenditures. |
| (5) | (5) | Adjustment to FFO resulting from non-cash revenuesexpenses recognized as a result of increasedecreases in the fair value of the interest rate cap.caps for the Parkway Property and Clemson Best Western Property. |
| (6) | (6) | Adjustment to FFO for amortization of non-cash expenses recognized as a result of amortizing loan issuance costs over the terms of the respective mortgages. |
| (7) | Adjustment to FFO for amortization of non-cash expenses recognized as a result of amortizing the preferred stock discount over its five-year term. |
| (8) | Adjustment to FFO for amortization of non-cash expenses recognized as a result of amortizing the preferred stock offering costs over its five-year term. |
| (9) | NAREIT’s December 2018 White Paper provides guidance on non-cash revenues and expenses, stating, “To provide an opportunity for consistent analysis of operating results among REITs, NAREIT encourages those reporting FFO to make supplemental disclosure of all material non-cash revenues and expenses affecting their results for each period. Our company has elected to include non-cash expenses (bad debt expense) in its calculation of AFFO. |
| Item 3. | Quantitative and Qualitative Disclosures about Market Risk |
ITEM 3. QUANTITATIVE AND QUALITATIVE DISCLOSURES ABOUT MARKET RISK We have omitted a discussion of quantitative and qualitative disclosures about market risk because, as a smaller reporting company, we are not required to provide such information. | Item 4. | Controls and Procedures |
ITEM 4. CONTROLS AND PROCEDURES Evaluation of Disclosure Controls and Procedures We maintain disclosure controls and procedures (as such term is defined in Rule 13a-15(e) and 15d-15(e) under the Exchange Act of 1934, as amended (the “Exchange Act”)), that are designed to ensure that information required to be disclosed in our reports under the Exchange Act is processed, recorded, summarized and reported within the time periods specified in the rules and regulations of the SEC and that such information is accumulated and communicated to management, including our Chief Executive Officer, as appropriate, to allow for timely decisions regarding required disclosure. In designing and evaluating the disclosure controls and procedures, management recognizes that any controls and procedures, no matter how well designed and operated, can provide only reasonable assurance of achieving the desired control objectives, and management is required to apply its judgment in evaluating the cost-benefit relationship of possible controls and procedures. Based onWe have carried out an evaluation, under the most recent evaluation,supervision and with the Company’sparticipation of management, including our principal executive officer and principal financial officer, has determined thatregarding the Company’seffectiveness of our disclosure controls and procedures (as defined in Rules 13a-15(e) and 15d-15(e) under the Securities and Exchange Act of 1934, as amended) were effective as of March 31, 2019.2024, the end of the period covered by this Quarterly Report. Based on the foregoing, our principal executive officer and principal financial officer have concluded, as of March 31, 2024, that our disclosure controls and procedures were effective in ensuring that information required to be disclosed by us in reports filed or submitted under the Exchange Act (i) is processed, recorded, summarized and reported within the time periods specified in the SEC’s rules and forms and (ii) is accumulated and communicated to our management, including our Chief Executive Officer, as appropriate to allow for timely decisions regarding required disclosure.
Management’s Report on Internal Control Over Financial Reporting Management is responsible for establishing and maintaining adequate internal control over financial reporting (as defined in Exchange Act Rules 13a-15(f) and 15d-15(f)). Our management, including our principal executive officer and principal financial officer, evaluated, as of March 31, 2024, the effectiveness of our internal control over financial reporting based on the framework in Internal Control — Integrated Framework issued by the Committee of Sponsoring Organizations of the Treadway Commission (2013). Based on that evaluation, our principal executive officer and principal financial officer concluded that our internal control over financial reporting, as of March 31, 2024, were effective. This Quarterly Report does not include an attestation report of the Company’s registered public accounting firm regarding internal control over financial reporting. Management’s report was not subject to attestation by the Company’s registered public accounting firm pursuant to rules of the SEC that permit the Company to provide only management’s report in this Quarterly Report. Changes in Internal Control over Financial Reporting There have beenwas no changes tochange in our internal control over financial reporting that occurred during the period covered by this reportour most recent fiscal quarter that havehas materially affected, or areis reasonably likely to materially affect, our internal control over financial reporting.
PART II. OTHER INFORMATION ITEM 1. LEGAL PROCEEDINGS We and our subsidiaries are, from time to time, parties to litigation arising from the ordinary course of their business. Our management doesWe are not believe thatpresently subject to any suchmaterial litigation will materially affectnor, to our knowledge, is any other litigation threatened against us, other than routine actions for negligence or other claims and administrative proceedings arising in the ordinary course of business, some of which are expected to be covered by liability insurance and all of which collectively are not expected to have a material adverse effect on our liquidity, results of operations or business or financial position or operations.condition. ITEM 1A.RISK FACTORS ThereWe have been no material changes from theomitted a discussion of risk factors disclosed in the section entitled “Risk Factors” of our Annual Report on Form 10-K for the year ended December 31, 2018.because, as a smaller reporting company, we are not required to provide such information.
ITEM 2. UNREGISTERED SALES OF EQUITY SECURITIES AND USE OF PROCEEDS Issuer Repurchases of Equity Securities On December 21, 2021, the Board authorized a share repurchase program whereby we may repurchase up to 62,500 Common Shares for a maximum price of $38.40 per Common Share. As of December 31, 2022, the Company had repurchased 33,509 Common Shares at a total cost of $278,277 and an average price of $8.304 per Common Share. On October 18, 2023, the Board approved the repurchase of an additional 200,000 Common Shares for a maximum price of $6.00 per share under the share repurchase program. Following the approval of the increase, the Company may purchase up to 228,991 Common Shares in total under the program. During the three months ended March 31, 2024, the Company did not make any share repurchases. Item 2. | Unregistered Sales of Equity Securities and Use of Proceeds |
None.
Item 3. | Defaults Upon Senior Securities |
ITEM 3. DEFAULTS UPON SENIOR SECURITIES None. Item 4. | Mine Safety Disclosures |
ITEM 4. MINE SAFETY DISCLOSURES Not applicable.Applicable. ITEM 5. OTHER INFORMATION None.During the three months ended March 31, 2024, none of our directors or officers (as defined in Rule 16a-1(f) of the Securities Exchange Act of 1934) adopted, terminated or modified a Rule 10b5-1 trading arrangement or non-Rule 10b5-1 trading arrangement (as such terms are defined in Item 408 of Regulation S-K of the Securities Act of 1933). During the three months ended March 31, 2024, the Company adopted a Rule 10b5-1 trading arrangement. No shares were purchased under this plan during the three months ended March 31, 2024.
EXHIBIT INDEX Exhibit
Number | Description | | Exhibit
Number | | Description | 3.1 | | Articles of Incorporation of Medalist Diversified REIT, Inc.* | 3.2 | | Articles Supplementary to the Articles of Incorporation of Medalist Diversified REIT, Inc. *designating the Company’s Series A Cumulative Redeemable Preferred Stock, $0.01 par value per share (incorporated by reference to Exhibit 3.2 to the Company’s Registration Statement on Form 8-A filed on February 13, 2020). | 3.3 | | First Articles of Amendment to the Articles of Incorporation of Medalist Diversified REIT, Inc. (incorporated by reference to Exhibit 3.1 to the Company’s Current Report on Form 8-K filed May 3, 2023). | 3.23.4 | | Second Articles of Amendment to the Articles of Incorporation of Medalist Diversified REIT, Inc. (incorporated by reference to Exhibit 3.2 to the Company’s Current Report on Form 8-K filed May 3, 2023). | 3.5 | | Articles Supplementary to the Articles of Incorporations of Medalist Diversified REIT, Inc. electing to become subject to Section 3-803 of the Maryland General Corporation Law (incorporated by reference to Exhibit 3.1 to the Company’s Current Report on Form 8-K filed December 29, 2023). | 3.6 | | Bylaws of Medalist Diversified REIT, Inc. * | 4.1 | | 4.1 | Form of Certificate of Common Stock * | 4.2 | | Form of Certificate of Series A Cumulative Redeemable Preferred Stock (incorporated by reference to Exhibit 4.1 to the Company’s Registration Statement on Form 8-A filed on February 13, 2020). |
† | Filed herewith. | * | Previously filed with the Amendment to the Registrant’s Registration Statement on Form S-11 filed by the Registrant with the Securities and Exchange Commission on October 5, 2018. | ** | To be filed by amendment. Attached as Exhibit 101 are the following documents formatted in XBRL (eXtensible Business Reporting Language): (i) Consolidated Balance Sheets; (ii) Consolidated Statements of Income; (iii) Consolidated Statements of Equity; (iv) Consolidated Statements of Cash Flows; and (v) Notes to Consolidated Financial Statements. |
†Filed herewith. * Previously filed with the Amendment to the Registrant’s Registration Statement on Form S-11 filed by the Registrant with the Securities and Exchange Commission on October 5, 2018. Attached as Exhibit 101 to this report are the following documents formatted in iXBRL (Inline eXtensible Business Reporting Language): (i) Consolidated Balance Sheets; (ii) Consolidated Statements of Operations; (iii) Consolidated Statements of Equity; (iv) Consolidated Statements of Cash Flows; and (v) Notes to Consolidated Financial Statements. SIGNATURES Pursuant to the requirements of Section 13 or 15(d) of the Securities Exchange Act of 1934, the registrant has duly caused this report to be signed on its behalf by the undersigned, thereunto duly authorized. MEDALIST DIVERSIFIED REIT, INC.INC Date: May 15, 2019
| | | Date: May 9, 2024 | | | | | | | By: | /s/ Thomas E. MessierFrancis P. Kavanaugh | | | Thomas E. MessierFrancis P. Kavanaugh | | | | | | Chief Executive Officer and Chairman of the BoardPresident | | | (principal executive officer, officer) | | | | | By: | /s/ C. Brent Winn | | | C. Brent Winn | | | Chief Financial Officer | | | (principal accounting officer and principal financial officer) |
| |