We granted stock options with a two-year vesting period and a seven-year term in the first and third quarters of 2006 (none were granted in the second quarter of 2006). The assumptions used to determine the estimated fair value of options granted under the Black-Scholes options pricing model, the number of stock options granted, and the estimated fair value of options granted are as follows:
| | |
| Assumptions Used in Determining Compensation Expense for Stock Options Granted in 2006 & Other Data | |
| Dividend yield | | | 1.1 | % | | Stock options granted (number of shares): | | | | |
| Expected volatility percentage | | | 37.3%-39.1 | % | | Officers | | | 97,500 | |
| Weighted-average volatility | | | 38.4 | % | | Management | | | 330,800 | |
| Weighted average risk-free interest rate | | | 4.7 | % | | Other employees | | | - | |
| Expected holding period (years): | | | | | | Total | | | 428,300 | |
| Officers | | | 6.0 | | | | | | | |
| Management | | | 5.0 | | | Estimated weighted average fair value of | | | | |
| Other employees | | | n/a | | | options per share at date of grant: | | | | |
| Estimated weighted-average annual forfeiture rate | | | | | | Officers | | $ | 6.22 | |
| at date of grant: | | | | | | Management | | | 5.64 | |
| Officers | | | 2.0 | % | | Other employees | | | - | |
| Management | | | 5.0 | % | | | | | | |
| Weighted average exercise prices at date of grant: | | | | | | | | | | |
| Officers | | $ | 15.11 | | | Total estimated fair value of stock | | | | |
| Management | | $ | 15.18 | | | options granted (in thousands) | | $ | 2,472 | |
The dividend yield is the dividend yield on our common stock at the date of grant, which we believe is a reasonable estimate of the expected yield during the holding period. We calculate expected volatility based on the historical volatility of our common stock using a sequential period of historical data equal to the expected holding period of the option. We have no reason to believe that future volatility is likely to differ from the past. The assumed risk-free interest rate is based on observed interest rates (zero coupon U.S. Treasury debt securities) appropriate for the expected holding period. The expected holding period and forfeiture assumptions are based on historical experience. Estimated forfeiture assumptions are reviewed through the vesting period. Adjustments are made if actual forfeitures differ from previous estimates. The cumulative effect of a change in estimated forfeitures is recognized in the period of the change.
A summary of our stock options outstanding at September 30, 2006 and December 31, 2005 and changes during the nine months and year ended, respectively, is presented below:
| | | | | | |
| | | | | Option Exercise Price/Share | |
| | | Number of Options | | Range | | Wgted. Ave. | |
| Outstanding at 12/31/04 | | | 2,661,990 | | $ | 4.17 | | | to | | $ | 46.63 | | $ | 22.01 | |
| Granted | | | - | | | n/a | | | to | | | n/a | | | n/a | |
| Forfeited and Expired | | | (274,575 | ) | | 13.95 | | | to | | | 46.63 | | | 21.90 | |
| Exercised | | | (137,075 | ) | | 4.17 | | | to | | | 16.55 | | | 7.51 | |
| Outstanding at 12/31/05 | | | 2,250,340 | | | 7.38 | | | to | | | 46.63 | | | 22.90 | |
| Granted | | | 428,300 | | | 15.11 | | | to | | | 16.48 | | | 15.16 | |
| Forfeited and Expired | | | (765,975 | ) | | 7.38 | | | to | | | 46.63 | | | 31.47 | |
| Exercised | | | (107,510 | ) | | 7.38 | | | to | | | 14.56 | | | 11.01 | |
| Outstanding at 9/30/06 | | | 1,805,155 | | $ | 13.95 | | | to | | $ | 29.94 | | $ | 18.14 | |
The following table summarizes additional information about stock options outstanding and exercisable and non-vested restricted stock outstanding at September 30, 2006:
| | | | | | |
| | | Options Outstanding at | | Options Exercisable at | |
| | | September 30, 2006 | | September 30, 2006 | |
| | | | | | | | | Weighted Average | | Aggregate | | | | | | Aggregate | |
| | | | | | | | | Remaining | | | | Intrinsic | | | | Weighted | | Intrinsic | |
| | | | | | | | | Contract- | | | | Value | | | | Average | | Value | |
| Range of | | | | ual Life | | Exercise | | (In | | | | Exercise | | (In | |
| Exercise Prices | | Shares | | (Years) | | Price | | Thousands) | | Shares | | Price | | Thousands) | |
$ 13.95 | | | to | | $ | 17.88 | | | 840,550 | | | 4.3 | | $ | 15.18 | | $ | 1,317 | | | 461,750 | | $ | 15.20 | | $ | 718 | |
17.89 | | | to | | | 19.75 | | | 667,650 | | | 1.5 | | | 19.22 | | | - | | | 667,650 | | | 19.22 | | | - | |
| 19.76 | | | to | | | 25.65 | | | 216,300 | | | 0.4 | | | 21.95 | | | - | | | 216,300 | | | 21.95 | | | - | |
| 25.66 | | | to | | | 29.94 | | | 80,655 | | | 1.7 | | | 29.85 | | | - | | | 80,655 | | | 29.85 | | | - | |
$ 13.95 | | | to | | $ | 29.94 | | | 1,805,155 | | | 2.7 | | $ | 18.14 | | $ | 1,317 | | | 1,426,355 | | $ | 18.93 | | $ | 718 | |
| | | | | | |
| Non-vested Restricted Stock | | Number of Shares | | Wgtd. Ave. Grant Date Fair Value/Sh. | |
| Outstanding at 12/31/05 | | | 109,000 | | $ | 13.88 | |
| Granted | | | - | | | - | |
| Vested | | | (17,333 | ) | | 13.95 | |
| Forfeited | | | (24,167 | ) | | 13.80 | |
| Outstanding at 9/30/06 | | | 67,500 | | $ | 13.90 | |
The total intrinsic value of stock options exercised during the three and nine months ended September 30, 2006 was $62,000 and $471,000, respectively. The grant-date fair value of stock option-based awards vested during the nine months ended September 30, 2006 was $1.3 million (no awards vested during the third quarter). As of September 30, 2006, there was $1.5 million and $366,000 of unrecognized compensation cost related to stock option-based awards and non-vested restricted stock, respectively. This cost is expected to be recognized over the remaining weighted average period of 1.45 years for stock option-based awards and 2.54 years for non-vested restricted stock. Compensation costs for non-vested restricted stock is subject to accelerated vesting based on meeting certain financial targets.
| 7. | The components of net periodic benefit income (cost) for our pension and other post-retirement benefit programs are shown below: |
| |
| |
|
|---|
| | | Pension
Benefits for 3 Months
Ended June 30 | | Other Post-Retirement
Benefits for 3 Months
Ended June 30 | |
|---|
| | |
| |
|
|---|
| | (In Thousands) | 2006 | | 2005 | | 2006 | | 2005 | |
|---|
| |
|
|---|
| | Service cost | $ | (1,491 | ) | $ | (1,524 | ) | $ | (22 | ) | $ | (29 | ) |
| | Interest cost | | (3,411 | ) | | (3,145 | ) | | (135 | ) | | (145 | ) |
| | Employee contributions | | — | | | — | | | — | | | — | |
| | Other | | (36 | ) | | (29 | ) | | — | | | — | |
| | Expected return on plan assets | | 5,430 | | | 5,512 | | | — | | | — | |
| | Amortization of prior service costs, gains or
losses and net transition asset | | (1,194 | ) | | (146 | ) | | 4 | | | — | |
| |
|
|---|
| | Net periodic benefit (cost) income | $ | (702 | ) | $ | 668 | | $ | (153 | ) | $ | (174 | ) |
| |
|
|---|
| |
|---|
| |
|
|---|
| | | Pension
Benefits for 6 Months
Ended June 30 | | Other Post-Retirement
Benefits for 6 Months
Ended June 30 | |
|---|
| | |
| |
|
|---|
| | (In Thousands) | 2006 | | 2005 | | 2006 | | 2005 | |
|---|
| |
|
|---|
| | Service cost | $ | (2,888 | ) | $ | (3,048 | ) | $ | (44 | ) | $ | (58 | ) |
| | Interest cost | | (6,667 | ) | | (6,291 | ) | | (271 | ) | | (292 | ) |
| | Employee contributions | | — | | | — | | | — | | | — | |
| | Other | | (57 | ) | | 68 | | | — | | | — | |
| | Expected return on plan assets | | 10,668 | | | 11,024 | | | — | | | — | |
| | Amortization of prior service costs, gains or
losses and net transition asset | | (2,433 | ) | | (292 | ) | | 9 | | | — | |
| |
|
|---|
| | Net periodic benefit (cost) income | $ | (1,377 | ) | $ | 1,461 | | $ | (306 | ) | $ | (350 | ) |
| |
|
|---|
| |
| We expect required contributions to our pension plans to be about $800,000 for the year ending December 31, 2006. We fund our other post-retirement benefits (life insurance and health benefits) on a claims-made basis, which were $645,000 and $525,000 for the years ended December 31, 2005 and 2004, respectively. |
| | | | | | |
| | | Pension Benefits for 3 Months Ended Sept. 30 | | Other Post-Retirement Benefits for 3 Months Ended Sept. 30 | |
| (In Thousands) | | 2006 | | 2005 | | 2006 | | 2005 | |
| Service cost | | $ | (1,425 | ) | $ | (1,616 | ) | $ | (22 | ) | $ | (23 | ) |
| Interest cost | | | (3,384 | ) | | (3,172 | ) | | (135 | ) | | (116 | ) |
| Employee contributions | | | - | | | 113 | | | - | | | - | |
| Other | | | (36 | ) | | (29 | ) | | - | | | - | |
| Expected return on plan assets | | | 5,434 | | | 5,526 | | | - | | | - | |
| Amortization of prior service costs, gains or losses and net transition asset | | | (1,111 | ) | | (185 | ) | | 4 | | | 1 | |
| Net periodic benefit (cost) income | | $ | (522 | ) | $ | 637 | | $ | (153 | ) | $ | (138 | ) |
| | | | | | |
| | | Pension Benefits for 9 Months Ended Sept. 30 | | Other Post-Retirement Benefits for 9 Months Ended Sept. 30 | |
| (In Thousands) | | 2006 | | 2005 | | 2006 | | 2005 | |
| Service cost | | $ | (4,313 | ) | $ | (4,892 | ) | $ | (66 | ) | $ | (80 | ) |
| Interest cost | | | (10,051 | ) | | (9,463 | ) | | (406 | ) | | (407 | ) |
| Employee contributions | | | - | | | 340 | | | - | | | - | |
| Other | | | (93 | ) | | 40 | | | - | | | - | |
| Expected return on plan assets | | | 16,102 | | | 16,550 | | | - | | | - | |
| Amortization of prior service costs, gains or losses and net transition asset | | | (3,544 | ) | | (476 | ) | | 13 | | | (1 | ) |
| Net periodic benefit (cost) income | | $ | (1,899 | ) | $ | 2,099 | | $ | (459 | ) | $ | (488 | ) |
We expect required contributions to our pension plans to be about $800,000 for the year ending December 31, 2006. We fund our other post-retirement benefits (life insurance and health benefits) on a claims-made basis, which were $645,000 and $525,000 for the years ended December 31, 2005 and 2004, respectively.
On October 26, 2006, we announced changes to our U.S. defined benefit (pension) and savings plans covering salaried and certain other employees. The changes will have no impact on our net income or earnings per share in 2006. We expect that the changes relating to the pension plan will reduce our projected benefit obligation by approximately $10 million as of December 31, 2006. In 2007, the changes to the pension plan are expected to reduce our service cost, interest cost and amortization of prior service cost components of pension expense by approximately $600,000, $600,000 and $1.5 million, respectively, and the savings plan changes are expected to increase charges for company matching contributions by approximately $700,000.
| 8. | Information by business segment is reported below. There are no accounting transactions between segments and no allocations to segments. There have been no significant changes to identifiable assets by segment. Net sales (sales less freight) and operating profit from ongoing operations are the measures of sales and operating profit used by the chief operating decision maker of each segment for purposes of assessing performance. |
| |
| Tredegar Corporation
Net Sales and Operating Profit by Segment
(In Thousands)
(Unaudited) |
| |
| | | Three Months
Ended June 30 | | Six Months
Ended June 30 | |
|---|
| | |
| |
| |
|---|
| | | 2006 | | 2005 | | 2006 | | 2005 | |
|---|
| | |
| |
| |
| |
| |
|---|
| | Net Sales | | | | | | | | | | | | | |
| | Film Products | | $ | 121,405 | | $ | 111,244 | | $ | 247,736 | | $ | 227,955 | |
| | Aluminum Extrusions | | | 153,836 | | | 125,963 | | | 288,995 | | | 235,929 | |
| | AFBS (formerly Therics) | | | — | | | 115 | | | — | | | 252 | |
| | |
| |
| |
| |
| |
|---|
| | Total net sales | | | 275,241 | | | 237,322 | | | 536,731 | | | 464,136 | |
| | Add back freight | | | 7,250 | | | 6,402 | | | 13,724 | | | 12,345 | |
| | |
| |
| |
| |
| |
|---|
| | Sales as shown in the Consolidated Statements of Income | | $ | 282,491 | | $ | 243,724 | | $ | 550,455 | | $ | 476,481 | |
| | |
| |
| |
| |
| |
|---|
| | | | | | | | | | | | | | | |
| | Operating Profit | | | | | | | | | | | | | |
| | Film Products: | | | | | | | | | | | | | |
| | Ongoing operations | | $ | 13,264 | | $ | 11,396 | | $ | 28,841 | | $ | 22,974 | |
| | Plant shutdowns, asset impairments and restructurings,
net of gain on sale of assets and related income from
LIFO inventory liquidations | | | 768 | | | 44 | | | (815 | ) | | 413 | |
| | | | | | | | | | | | | | | |
| | Aluminum Extrusions: | | | | | | | | | | | | | |
| | Ongoing operations | | | 5,674 | | | 7,221 | | | 10,540 | | | 10,218 | |
| | Plant shutdowns, asset impairments and restructurings | | | (405 | ) | | (202 | ) | | (514 | ) | | (840 | ) |
| | | | | | | | | | | | | | | |
| | AFBS (formerly Therics): | | | | | | | | | | | | | |
| | Ongoing operations | | | — | | | (1,644 | ) | | — | | | (3,467 | ) |
| | Loss on investment in Therics, LLC | | | — | | | — | | | (25 | ) | | — | |
| | Restructurings | | | — | | | (10,049 | ) | | — | | | (10,049 | ) |
| | |
| |
| |
| |
| |
|---|
| | | | | | | | | | | | | | | |
| | Total | | | 19,301 | | | 6,766 | | | 38,027 | | | 19,249 | |
| | Interest income | | | 285 | | | 142 | | | 507 | | | 240 | |
| | Interest expense | | | 1,468 | | | 1,093 | | | 2,900 | | | 2,056 | |
| | Gain on sale of corporate assets | | | — | | | 61 | | | 56 | | | 61 | |
| | Stock option-based compensation costs | | | 282 | | | — | | | 493 | | | | |
| | Corporate expenses, net | | | 3,002 | | | 2,339 | | | 6,761 | | | 4,735 | |
| | |
| |
| |
| |
| |
|---|
| | Income before income taxes | | | 14,834 | | | 3,537 | | | 28,436 | | | 12,759 | |
| | Income taxes | | | 5,584 | | | 1,405 | | | 10,971 | | | 5,077 | |
| | |
| |
| |
| |
| |
|---|
| | Net income | | $ | 9,250 | | $ | 2,132 | | $ | 17,465 | | $ | 7,682 | |
| | |
| |
| |
| |
| |
|---|
Net Sales and Operating Profit by Segment
(In Thousands)
(Unaudited)
| | | Three Months Ended Sept. 30 | | Nine Months Ended Sept. 30 | |
| | | 2006 | | 2005 | | 2006 | | 2005 | |
Net Sales | | | | | | | | | |
| Film Products | | $ | 134,961 | | $ | 116,350 | | $ | 382,697 | | $ | 344,305 | |
| Aluminum Extrusions | | | 154,030 | | | 118,085 | | | 443,025 | | | 354,014 | |
| AFBS (formerly Therics) | | | - | | | - | | | - | | | 252 | |
| Total net sales | | | 288,991 | | | 234,435 | | | 825,722 | | | 698,571 | |
| Add back freight | | | 7,265 | | | 6,281 | | | 20,989 | | | 18,626 | |
| Sales as shown in the Consolidated Statements of Income | | $ | 296,256 | | $ | 240,716 | | $ | 846,711 | | $ | 717,197 | |
| | | | | | | | | | | | | | |
Operating Profit | | | | | | | | | | | | | |
| Film Products: | | | | | | | | | | | | | |
| Ongoing operations | | $ | 13,770 | | $ | 13,822 | | $ | 42,611 | | $ | 36,796 | |
| Plant shutdowns, asset impairments and restructurings, net of gain on sale of assets and related income from LIFO inventory liquidations | | | 1,022 | | | (1,225 | ) | | 207 | | | (812 | ) |
| | | | | | | | | | | | | | |
| Aluminum Extrusions: | | | | | | | | | | | | | |
| Ongoing operations | | | 5,407 | | | 4,362 | | | 15,947 | | | 14,580 | |
| Plant shutdowns, asset impairments and restructurings | | | (920 | ) | | (406 | ) | | (1,434 | ) | | (1,246 | ) |
| | | | | | | | | | | | | | |
| AFBS (formerly Therics): | | | | | | | | | | | | | |
| Ongoing operations | | | - | | | - | | | - | | | (3,467 | ) |
| Loss on investment in Therics, LLC | | | - | | | (91 | ) | | (25 | ) | | (91 | ) |
| Plant shutdowns, asset impairments and restructurings | | | (494 | ) | | - | | | (494 | ) | | (10,049 | ) |
| | | | | | | | | | | | | | |
| Total | | | 18,785 | | | 16,462 | | | 56,812 | | | 35,711 | |
| Interest income | | | 315 | | | 146 | | | 822 | | | 386 | |
| Interest expense | | | 1,331 | | | 1,196 | | | 4,231 | | | 3,252 | |
| Gain on sale of corporate assets | | | - | | | - | | | 56 | | | 61 | |
| Stock option-based compensation costs | | | 215 | | | - | | | 708 | | | - | |
| Corporate expenses, net | | | 3,148 | | | 3,290 | | | 9,909 | | | 8,025 | |
| Income before income taxes | | | 14,406 | | | 12,122 | | | 42,842 | | | 24,881 | |
| Income taxes | | | 4,716 | | | 4,465 | | | 15,687 | | | 9,542 | |
| Net income | | $ | 9,690 | | $ | 7,657 | | $ | 27,155 | | $ | 15,339 | |
| 9. | In JulySeptember 2006, the Financial Accounting Standards Board (FASB) affirmed its previous decision to make the recognition provisionsissued Statement of its proposed standard,Employers’Financial Accounting Standards No. 158, Employers' Accounting for Defined Benefit Pension and Other Postretirement Plans, an amendment of FASB Statements No 87, 88, 106 and 132(R),effective forpublic companies for fiscal years ending after December 15, 2006. Accordingly, we will be required to recognize the funded status of our pension plans in our December 31, 2006 financial statements. The funded status of our pension plans at December 31, 2005 was plan assets at fair value in excess of benefit obligations of $18.6 million.million ($28.6 million on a pro forma basis including the pension plan changes discussed in Note 7). On a pro forma basis at December 31, 2005 (including the pension plan changes discussed in Note 7), we estimate that the new standard would have resulted in a decrease in prepaid pension cost of $67$57 million (included in “Other assets and deferred charges” in the consolidated balance sheet), a decrease in non-current deferred income tax liabilities of $24$20 million and a decrease in shareholders’ equity of $43$37 million. Adjustments from the new standard are not expected to impact our debt covenant computations since our credit agreement allows us to elect to use generally accepted accounting principles in effect when the agreement was signed. |
| |
| In July 2006, the FASB issued FASB Interpretation No. 48,Accounting for Uncertainty in Income Taxes, clarifying the accounting for uncertain tax positions. The interpretation prescribes a recognition threshold and measurement attribute for the financial statement recognition and measurement of a tax position taken or expected to be taken in a tax return. This interpretation is effective for fiscal years beginning after December 15, 2006 with earlier application encouraged. We are evaluating the interpretation and have not determined whether or not it will have a material effect on our financial position or results of operations. |
In September 2006, the FASB issued FASB Staff Position ("FSP") No. AUG AIR-1, Accounting for Planned Major Maintenance Activities. The FSP is effective for the first fiscal year beginning after December 31, 2006. The FSP eliminates the accrual method of accounting for major maintenance activities, but continues to permit the use of the direct expensing, built-in overhaul and deferral methods. The FSP also continues to require accruals or deferrals for interim periods of annual costs that clearly benefit two or more interim periods. We are evaluating the FSP and have not determined whether or not it will have a material effect on our financial position or results of operations.
In July 2006, the FASB issued FASB Interpretation No. 48, Accounting for Uncertainty in Income Taxes, clarifying the accounting for uncertain tax positions. The interpretation prescribes a recognition threshold and measurement attribute for the financial statement recognition and measurement of a tax position taken or expected to be taken in a tax return. This interpretation is effective for fiscal years beginning after December 15, 2006 with earlier application encouraged. We are evaluating the interpretation and have not determined whether or not it will have a material effect on our financial position or results of operations.
Item 2. | Management’s Discussion and Analysis of Financial Condition and Results of Operations.Forward-looking and Cautionary Statements
Some of the information contained in this quarterly report on Form 10-Q may constitute “forward-looking statements” within the meaning of the “safe-harbor” provisions of the Private Securities Litigation Reform Act of 1995. When we use words such as “believe,” “hope,” “expect,” “are likely,” “project” and similar expressions, we do so to identify forward-looking statements. Such statements are based on our then current expectations and are subject to a number of risks and uncertainties that could cause actual results to differ materially from those addressed in the forward-looking statements. Risk factors that may cause such a difference are summarized on pages 31-33 and are incorporated herein.
Executive Summary
Second-quarter 2006 net income was $9.3 million (24 cents per share) compared with $2.1 million (5 cents per share) in the second quarter of 2005. Net income was $17.5 million (45 cents per share) for the first six months of 2006 compared with $7.7 million (20 cents per share) for the first six months of 2005. Gains on the sale of assets and other items and losses related to plant shutdowns, assets impairments and restructurings are described in Note 2 on page 6. The business segment review is provided below and beginning on page 22.
Second-quarter net sales in Film Products were $121.4 million, up 9.2% from $111.2 million in the second quarter of 2005 while operating profit from ongoing operations rose 16.7% to $13.3 million from $11.4 million. The increase in sales and operating profit over last year’s second quarter was primarily due to continued growth in the sale of higher value surface protection films, elastic materials and new apertured topsheets. Profits also benefited from the lag in the pass-through of lower average resin costs (estimated impact of $500,000). Customer inventory adjustments did not have as significant an impact on profits as initially expected. Volume was 61.9 million pounds compared with 64.3 million pounds in the second quarter of 2005. Volume declines were mainly due to lower sales of certain barrier films that are being discontinued in conjunction with the shutdown of the plant in LaGrange, Georgia.
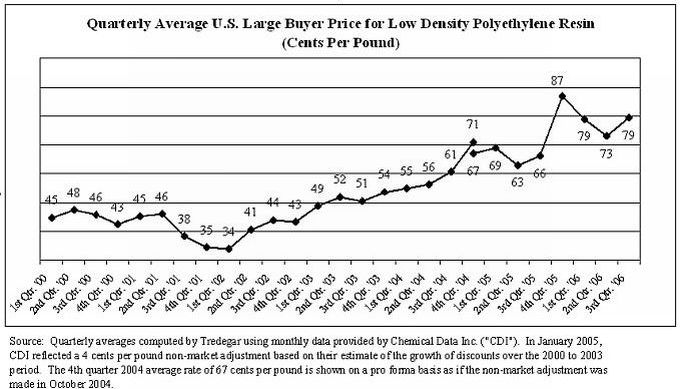
Film Products has index-based pass-through raw material agreements for the majority of its business. However, under certain agreements, changes in resin prices are not passed through for an average period of 90 days. Average quarterly prices of low-density polyethylene resin (“LDPE”) in the U.S. decreased 8 and 6 cents per pound in the first and second quarters of 2006, respectively, after increasing 21 cents per pound or 32% in the fourth quarter of 2005. LDPE prices in the U.S. increased in June 2006 by 6 cents per pound (the price of LDPE in the U.S. declined by 4 cents per pound in each month from December 2005 to April 2006 and was flat in May 2006). Average LDPE prices in Europe and Asia increased 2 to 4 cents per pound in the second quarter of 2006. Since 2002, U.S. LDPE prices have more than doubled. Resin prices in Europe, Asia and South America have also increased significantly during this time.
We estimate that the lag in the pass-through to customers of changes in resin prices had a positive impact on first- and second- quarter 2006 results of $2 million and $500,000, respectively, compared with a negative impact on fourth-quarter 2005 results of $5.5 million (net of the favorable effect of a decline in inventories accounted for under the last-in first-out method). There was no significant resin pass-through lag in the first quarter of 2005. In the second quarter of 2005, lower average resin prices resulted in a positive pass-through lag impact of approximately $1.5 million.
Net sales were $247.7 million in the first six months of 2006, up 8.6% versus $228.0 million in 2005. Operating profit from ongoing operations was $28.8 million in the first six months of 2006, up 25.2% compared to $23.0 million in 2005. Year-to-date volume decreased to 126.4 million pounds from
|
Forward-looking and Cautionary Statements
Some of the information contained in this quarterly report on Form 10-Q may constitute “forward-looking statements” within the meaning of the “safe-harbor” provisions of the Private Securities Litigation Reform Act of 1995. When we use words such as “believe,” “hope,” “expect,” “are likely,” “project” and similar expressions, we do so to identify forward-looking statements. Such statements are based on our then current expectations and are subject to a number of risks and uncertainties that could cause actual results to differ materially from those addressed in the forward-looking statements. Risk factors that may cause such a difference are summarized on pages 32-34 and are incorporated herein.
Executive Summary
General. Third-quarter 2006 net income was $9.7 million (25 cents per share) compared with $7.6 million (20 cents per share) in the third quarter of 2005. Net income was $27.2 million (70 cents per share) for the first nine months of 2006 compared with $15.3 million (40 cents per share) for the first nine months of 2005. Gains on the sale of assets and other items and losses related to plant shutdowns, assets impairments and restructurings are described in Note 2 on page 6. The business segment review is provided below and beginning on page 22.
Film Products. Third-quarter net sales in Film Products were $135.0 million, up 16.0% from $116.4 million in the third quarter of 2005 while operating profit from ongoing operations was flat at $13.8 million. Profits were adversely affected by the lag in the pass-through of higher average resin costs (estimated negative impact of $1.5 million in the third quarter of 2006 versus none in the third quarter of 2005). The increase in sales and operating profit excluding the resin pass-through lag over last year’s third quarter was primarily due to continued growth in the sale of higher value surface protection films, elastic materials and new apertured topsheets. Volume was 64.4 million pounds compared with 66.1 million pounds in the third quarter of 2005. Volume declines were mainly due to lower sales of certain barrier films that are being discontinued in conjunction with the shutdown of the plant in LaGrange, Georgia. Net sales, operating profit and volume in the second quarter of 2006 were $121.4 million, $13.3 million ($12.8 million excluding the estimated positive resin pass-through lag of $500,000) and 61.9 million pounds, respectively.
Film Products has index-based pass-through raw material cost agreements for the majority of its business. However, under certain agreements, changes in resin prices are not passed through for an average period of 90 days. Average quarterly prices of low-density polyethylene resin (“LDPE”) in the U.S. increased 6-7 cents per pound in the third quarter of 2006 after decreasing 8 and 6 cents per pound in the first and second quarters of 2006, respectively. LDPE prices in the U.S. decreased in September 2006 by 2-3 cents per pound. Average LDPE prices in Europe and Asia also increased in the third quarter of 2006. Since 2002, U.S. LDPE prices have more than doubled. Resin prices in Europe, Asia and South America have also increased significantly during this time.
Net sales were $382.7 million in the first nine months of 2006, up 11.2% versus $344.3 million in 2005. Operating profit from ongoing operations was $42.6 million in the first nine months of 2006, up 15.8% compared to $36.8 million in 2005. Year-to-date volume decreased to 190.8 million pounds from 197.8 million pounds in 2005. Net sales, operating profit and volume changes for the first nine months of 2006 compared with 2005 were primarily due to the factors noted above in the third quarter analysis.
Film Products continues to expand capacity to support growth in new products. Capital expenditures were $26.1 million in the first nine months of 2006 and are expected to be approximately $40 million for the year versus $50 million last year. Approximately half of the forecasted capital expenditures relates to expanding the production capacity for surface protection films. Other planned capital expenditures include capacity additions for elastic materials and a new information system, which is currently being rolled out in U.S. locations. Depreciation expense was $23.5 million in the first nine months of 2006 compared with $19.2 million in the first half of last year, and is projected to increase by approximately $5 million to $32 million for the year.
Aluminum Extrusions. Third-quarter net sales in Aluminum Extrusions were $154.0 million, up 30.4% from $118.1 million in the third quarter of 2005 primarily due to improved volume and higher selling prices. Operating profit from ongoing operations increased to $5.4 million, up 23% from $4.4 million in the third quarter of 2005. The increase in operating profit was mainly due to higher volume (up 7.1%). Lower energy costs of approximately $1 million and higher selling prices partially offset the adverse impact of appreciation of the Canadian Dollar (approximately $1 million), charges for possible uncollectible accounts ($800,000) and sales mix changes. Volume increased to 68.4 million pounds versus 63.9 million pounds in the third quarter of 2005. Growth in shipments continued to be driven by demand for extrusions used in commercial construction and hurricane protection products. However, we are concerned about near-term performance based on a recent slow down in orders in most markets that appears to be more significant than normal seasonal factors.
Net sales were $443.0 million in the first nine months of 2006, up 25.1% versus $354.0 million in 2005. Operating profit from ongoing operations was $15.9 million in the first nine months of 2006, up 8.9% compared to $14.6 million in 2005. Year-to-date volume increased to 201.5 million pounds, up 8.5% compared to 185.7 million pounds in 2005. Year-to-date net sales improved due to higher volume and higher selling prices. The increase in operating profit during the first nine months was primarily due to higher volume and selling prices, partially offset by appreciation of the Canadian Dollar ($2.7 million), charges for possible uncollectible accounts ($1.2 million), margin compression caused by rapidly increasing aluminum costs (adverse impact estimated of $1.1 million) and higher energy costs ($1 million). We believe margin compression from rapid movements in aluminum costs should be mitigated for extruded products in the future since pricing on normal customer orders has changed from the order date to the shipment date.
Capital expenditures in Aluminum Extrusions in the first nine months of 2006 were $5.6 million and are expected to be approximately $8 million for the year.
Other Developments. Consolidated net pension expense was $1.9 million in the first nine months of 2006, an increase of $4.0 million (7 cents per share after taxes) from the net pension income of $2.1 million recognized in the first nine months of 2005. We expect net pension expense of $2.5 million in 2006, an unfavorable change of $5.2 million (9 cents per share after taxes) versus 2005. Most of this change relates to a pension plan that is reflected in “Corporate expenses, net” in the segment operating profit table on page 22. We expect required contributions to our pension plans to be about $800,000 in 2006.
On October 26, 2006, we announced changes to our U.S. defined benefit (pension) and savings plans covering salaried and certain other employees. The changes will have no impact on our net income or earnings per share in 2006. We expect that the changes relating to the pension plan will reduce our projected benefit obligation by approximately $10 million as of December 31, 2006. In 2007, the changes to the pension plan are expected to reduce our service cost, interest cost and amortization of prior service cost components of pension expense by approximately $600,000, $600,000 and $1.5 million, respectively, and the savings plan changes are expected to increase charges for company matching contributions by approximately $700,000.
During the first quarter of 2006, we adopted Statement of Financial Accounting Standards No. 123(R), Share-Based Payment (“SFAS 123(R)”), which requires all stock-based compensation to be expensed and accounted for using a fair value-based method. The adoption of SFAS 123(R) and the granting of stock options in 2006 resulted in first-, second- and third- quarter pretax charges for stock option-based compensation of $211,000, $282,000 and $215,000, respectively. We expect to recognize stock option-based compensation costs under the new standard of approximately $1 million in 2006 (2 cents per share after taxes).
Consolidated net capitalization and other credit measures are provided in the liquidity and capital resources section beginning on page 23.
Critical Accounting Policies
In the ordinary course of business, we make a number of estimates and assumptions relating to the reporting of results of operations and financial position in the preparation of financial statements in conformity with generally accepted accounting principles. We believe the estimates, assumptions and judgments described in the section “Management’s Discussion and Analysis of Financial Condition and Results of Operations - Critical Accounting Policies” of our Annual Report on Form 10-K for the year ended December 31, 2005, have the greatest potential impact on our financial statements, so we consider these to be our critical accounting policies. These policies include our accounting for impairment of long-lived assets and goodwill, pension benefits and income taxes. These policies require management to exercise judgments that are often difficult, subjective and complex due to the necessity of estimating the effect of matters that are inherently uncertain. Actual results could differ materially from those estimates under different assumptions and conditions. We believe the consistent application of these policies enables us to provide readers of our financial statements with useful and reliable information about our operating results and financial condition. There has been no significant change in these policies except for the accounting for stock-based compensation discussed in the executive summary. See Note 2 on page 6 for losses related to plant shutdowns, assets impairments and restructurings occurring during 2006 and the comparable period in 2005.
Recently Issued Accounting Standards
In September 2006, the Financial Accounting Standards Board (FASB) issued Statement of Financial Accounting Standards No. 158, Employers' Accounting for Defined Benefit Pension and Other Postretirement Plans, an amendment of FASB Statements No 87, 88, 106 and 132(R), effective forpublic companies for fiscal years ending after December 15, 2006. Accordingly, we will be required to recognize the funded status of our pension plans in our financial statements for the fiscal year ending December 31, 2006. The funded status of our pension plans at December 31, 2005 was plan assets at fair value in excess of benefit obligations of $18.6 million ($28.6 million on a pro forma basis including the pension plan changes discussed in the executive summary). On a pro forma basis at December 31, 2005 (including the pension plan changes discussed in the executive summary), we estimate that the new standard would have resulted in a decrease in prepaid pension cost of $57 million (included in “Other assets and deferred charges” in the consolidated balance sheet), a decrease in non-current deferred income tax liabilities of $20 million and a decrease in shareholders’ equity of $37 million. Adjustments from the new standard are not expected to impact our debt covenant computations since our credit agreement allows us to elect to use generally accepted accounting principles in effect when the agreement was signed.
In September 2006, the FASB issued FASB Staff Position ("FSP") No. AUG AIR-1, Accounting for Planned Major Maintenance Activities. The FSP is effective for the first fiscal year beginning after December 31, 2006. The FSP eliminates the accrual method of accounting for major maintenance activities, but continues to permit the use of the direct expensing, built-in overhaul and deferral methods. The FSP also continues to require accruals or deferrals for interim periods of annual costs that clearly benefit two or more interim periods. We are evaluating the FSP and have not determined whether or not it will have a material effect on our financial position or results of operations.
In July 2006, the FASB issued FASB Interpretation No. 48, Accounting for Uncertainty in Income Taxes, clarifying the accounting for uncertain tax positions. The interpretation prescribes a recognition threshold and measurement attribute for the financial statement recognition and measurement of a tax position taken or expected to be taken in a tax return. This interpretation is effective for fiscal years beginning after December 15, 2006 with earlier application encouraged. We are evaluating the interpretation and have not determined whether or not it will have a material effect on our financial position or results of operations.
Results of Operations
Third Quarter 2006 Compared with Third Quarter 2005
Overall, sales in the third quarter of 2006 increased by 23.1% compared with 2005. Net sales (sales less freight) increased 16.0% in Film Products primarily due to growth in higher value-added products, including surface protection, elastic and apertured materials. Net sales in Film Products also increased from higher selling prices, which were driven by higher raw material costs. Net sales increased 30.4% in Aluminum Extrusions due to higher volume (up 7.1%) and selling prices. For more information on net sales and volume, see the executive summary beginning on page 15.
Consolidated gross profit (sales minus cost of goods sold and freight) as a percentage of sales decreased to 12.2% in the third quarter of 2006 from 13.5% in 2005 due to a decline in the gross profit margin in Film Products. The gross profit margin in Film Products declined as a result of higher average selling prices to cover higher average resin costs over the last 12 months and the lag in the pass-through of higher average resin costs in the third quarter compared with the second quarter of 2006, partially offset by a gain of $1.2 million for LIFO inventory liquidations (included in "Cost of goods sold" in the consolidated statements of income) related to the shutdown of the facility in LaGrange, Georgia. The estimated resin pass-through lag was negative $1.5 million in the third quarter of 2006 versus none in the third quarter of 2005.
As a percentage of sales, selling, general and administrative (“SG&A”) expenses decreased to 6.1% in the third quarter of 2006 compared with 6.5% in 2005 due primarily to higher sales.
R&D expenses increased to $2.0 million in the third quarter of 2006 from $1.9 million in 2005 and relate entirely to Film Products.
Plant shutdowns, asset impairments and restructurings and related items in the third quarter of 2006 shown in the segment operating profit table on page 22 include:
131.7 million pounds in 2005. Net sales, operating profit and volume changes for the first six months of 2006 compared with 2005 were primarily due to the factors noted above in the second quarter analysis.
Film Products continues to expand capacity to support growth in new products. Capital expenditures were $21.7 million in the first six months of 2006 and are expected to be $45 million for the year. Approximately half of the forecasted capital expenditures relates to expanding the production capacity for surface protection films. Other planned capital expenditures include capacity additions for elastic materials and a new information system, which is currently being rolled out in U.S. locations. Depreciation expense was $15.7 million in the first six months of 2006 compared with $12.4 million in the first half of last year, and is projected to increase by approximately $5 million to $32 million for the year.
Second-quarter net sales in Aluminum Extrusions were $153.9 million, up 22.1% from $126.0 million in the second quarter of 2005 primarily due to improved volume and higher selling prices. Operating profit from ongoing operations decreased to $5.7 million, down 20.8% from $7.2 million in the second quarter of 2005. The decrease in operating profit was mainly due to appreciation of the Canadian Dollar (adverse impact estimated of $1.3 million), margin compression caused by rapidly increasing aluminum costs (adverse impact estimated of $650,000) and a charge for a possible uncollectible account ($375,000). We believe margin compression from rapid movements in aluminum costs should be mitigated for extruded products in the future since pricing on normal customer orders has changed from the order date to the shipment date. Volume was up 9.5% to 69.4 million pounds versus 63.4 million pounds in the second quarter of 2005. Growth in shipments continued to be driven by demand for extrusions used in commercial construction and hurricane protection products.
Net sales were $289.0 million in the first six months of 2006, up 22.5% versus $235.9 million in 2005. Operating profit from ongoing operations was $10.5 million in the first six months of 2006, up 2.9% compared to $10.2 million in 2005. Year-to-date volume increased to 133.0 million pounds, up 9.2% compared to 121.8 million pounds in 2005. Year-to-date net sales improved due to higher volume and higher selling prices. The increase in operating profit during the first six months was primarily due to higher volume and selling prices, partially offset by appreciation of the Canadian Dollar ($1.6 million), higher energy costs ($2 million), margin compression caused by rapidly increasing aluminum costs (adverse impact estimated of $1.3 million) and a charge for a possible uncollectible account ($375,000).
Capital expenditures in Aluminum Extrusions in the first six months of 2006 were $3.2 million and are expected to be approximately $10 million for the year.
Consolidated net pension expense was $1.4 million in the first six months of 2006, an increase of $2.9 million (5 cents per share after taxes) from the net pension income of $1.5 million recognized in the first six months of 2005. We expect net pension expense of $2.8 million in 2006, an unfavorable change of $5.4 million (9 cents per share after taxes) versus 2005. Most of this change relates to a pension plan that is reflected in “Corporate expenses, net” in the operating profit by segment table on page 22. We expect required contributions to our pension plans to be about $800,000 in 2006.
During the first quarter of 2006, we adopted Statement of Financial Accounting Standards (“SFAS”) No. 123R,Share-Based Payment, which requires all stock-based compensation to be expensed and accounted for using a fair value-based method. The adoption of SFAS No. 123R and the granting of stock options on March 7, 2006 resulted in first- and second- quarter pretax charges for stock option-based compensation of $211,000 and $282,000, respectively. We expect to recognize stock option-based compensation costs under the new standard of approximately $1.1 million in 2006 (2 cents per share after taxes).
Consolidated net capitalization and other credit measures are provided in the liquidity and capital resources section beginning on page 23.
|
Critical Accounting Policies
In the ordinary course of business, we make a number of estimates and assumptions relating to the reporting of results of operations and financial position in the preparation of financial statements in conformity with generally accepted accounting principles. We believe the estimates, assumptions and judgments described in the section “Management’s Discussion and Analysis of Financial Condition and Results of Operations – Critical Accounting Policies” of our Annual Report on Form 10-K for the year ended December 31, 2005, have the greatest potential impact on our financial statements, so we consider these to be our critical accounting policies. These policies include our accounting for impairment of long-lived assets and goodwill, pension benefits and income taxes. These policies require management to exercise judgments that are often difficult, subjective and complex due to the necessity of estimating the effect of matters that are inherently uncertain. Actual results could differ significantly from those estimates under different assumptions and conditions. We believe the consistent application of these policies enables us to provide readers of our financial statements with useful and reliable information about our operating results and financial condition. There has been no significant change in these policies. See Note 2 on page 6 for losses related to plant shutdowns, assets impairments and restructurings occurring during 2006 and the comparable period in 2005.
Recently Issued Accounting Standards
In July 2006, the Financial Accounting Standards Board (FASB) affirmed its previous decision to make the recognition provisions of its proposed standard,Employers’ Accounting for Defined Benefit Pension and Other Postretirement Plans, an amendment of FASB Statements No 87, 88, 106 and 132(R),effective for public companies for fiscal years ending after December 15, 2006. Accordingly, we will be required to recognize the funded status of our pension plans in our December 31, 2006 financial statements. The funded status of our pension plans at December 31, 2005 was plan assets at fair value in excess of benefit obligations of $18.6 million. On a pro forma basis at December 31, 2005, we estimate that the new standard would have resulted in a decrease in prepaid pension cost of $67 million (included in “Other assets and deferred charges” in the consolidated balance sheet), a decrease in non-current deferred income tax liabilities of $24 million and a decrease in shareholders’ equity of $43 million. Adjustments from the new standard are not expected to impact our debt covenant computations since our credit agreement allows us to elect to use generally accepted accounting principles in effect when the agreement was signed.
In July 2006, the FASB issued FASB Interpretation No. 48,Accounting for Uncertainty in Income Taxes, clarifying the accounting for uncertain tax positions. The interpretation prescribes a recognition threshold and measurement attribute for the financial statement recognition and measurement of a tax position taken or expected to be taken in a tax return. This interpretation is effective for fiscal years beginning after December 15, 2006 with earlier application encouraged. We are evaluating the interpretation and have not determined whether or not it will have a material effect on our financial position or results of operations.
Results of Operations
Second Quarter 2006 Compared with Second Quarter 2005
Overall, sales in the second quarter of 2006 increased by 15.9% compared with 2005. Net sales (sales less freight) increased 9.2% in Film Products primarily due to growth in higher value-added products, including surface protection, elastic and apertured materials. Net sales in Film Products also increased from higher selling prices, which were driven by higher raw material costs. Net sales increased 22.1% in Aluminum Extrusions due to higher volume (up 9.5%) and selling prices. For more information on net sales and volume, see the executive summary beginning on page 15.
|
Consolidated gross profit (sales minus cost of goods sold and freight) as a percentage of sales decreased to 12.6% in the second quarter of 2006 from 13.6% in 2005 due to a decline in the gross profit margin in Aluminum Extrusions. At Film Products, a higher gross profit margin was driven primarily by growth in higher value-added products, including surface protection, elastic and apertured materials and a gain of $1.4 million for LIFO inventory liquidation (included in “Cost of goods sold” in the consolidated statements of income) related to the shutdown of the facility in LaGrange, Georgia. At Aluminum Extrusions, the decline in gross margin was primarily due to margin compression caused by rapidly increasing aluminum costs and higher selling prices to cover higher aluminum costs.
As a percentage of sales, selling, general and administrative (“SG&A”) expenses decreased to 5.7% in the second quarter of 2006 compared with 6.7% in 2005 due primarily to higher sales and the divestiture of substantially all of our interest in AFBS, Inc. (formerly known as Therics, Inc.) at the end of the second quarter of 2005.
R&D expenses declined to $2.2 million in the second quarter of 2006 from $2.6 million in 2005 primarily due to the divestiture of substantially all of our interest in AFBS.
Plant shutdowns, asset impairments and restructurings and related items in the second quarter of 2006 shown in the segment operating profit table on page 22 include:
|
| |
| •· | A net pretax gain of $822,000$1 million associated with the shutdown of the films manufacturing facility in LaGrange, Georgia, including a gain of $1.4$1.2 million for related LIFO inventory liquidations (included in “Cost"Cost of goods sold”sold" in the consolidated statements of income), partially offset by severance and other shutdown-related costs of $567,000;$198,000; |
| · | A pretax charge of $920,000 related to expected future environmental costs at the aluminum extrusions facility in Newnan, Georgia (included in "Cost of goods sold" in the consolidated statements of income); and |
| | | · | A pretax charge of $494,000 related to the estimated loss on the sub-lease of a portion of the AFBS (formerly Therics) facility in Princeton, New Jersey. |
Plant shutdowns, asset impairments and restructurings and related items in the third quarter of 2005 shown in the segment operating profit table on page 22 include:
| •· | Pretax charges of $459,000$906,000 for severance and other employee-related costs in connection with restructurings in Film Products ($514,000), Aluminum Extrusions ($405,000)207,000), and Film Productsat corporate headquarters ($54,000). |
|
Plant shutdowns, asset impairments and restructurings and related items185,000; included in the second quarter of 2005 shown"Corporate expenses, net" in the segment operating profit table on page 22 include:
|
| table); |
| | • | A pretax charge of $10 million related to the sale or assignment of substantially all of Therics’ assets, including asset impairment charges of $5.6 million, lease-related losses of $3 million and severance and other transaction-related costs of $1.4 million; |
| | |
| • | A pretax gain of $653,000 related to the shutdown of the films manufacturing facility in Carbondale, Pennsylvania, including a $630,000 gain on the sale of the facility (included in “Other income (expense), net” in the consolidated statements of income), and the reversal to income of certain shutdown-related accruals of $23,000; |
| | |
| • | Pretax charges of $500,000 related to severance and other employee-related costs associated with restructurings in Film Products ($227,000) and Aluminum Extrusions ($273,000); |
| | |
| • | A pretax gain of $71,000 related to the shutdown of the aluminum extrusions facility in Aurora, Ontario, including the reversal to income of certain severance and employee-related accruals of $474,000, partially offset by other shutdown-related costs of $403,000; |
| | |
| •· | A net pretax charge of $250,000$595,000 related to severance and other employee-related costs associated with the restructuring of the research and development operations in Film Products (of this amount, $346,000$657,000 in pretax charges for employee relocation and recruitment is included in “Selling, R&D"Selling, general and general expenses”administrative expenses" in the consolidated statements of income); |
| | |
| | •· | A pretax charge of $198,000 related to the shutdown of the aluminum extrusions facility in Aurora, Ontario; and |
| · | Pretax charges of $105,000$117,000 for accelerated depreciation related to restructurings in Film Products; andProducts. |
| | |
Interest income, which is included in “Other income (expense), net” in the consolidated statements of income, was $315,000 in the third quarter of 2006 and $146,000 in 2005. Interest expense increased to $1.3 million in the third quarter of 2006 compared with $1.2 million in 2005. Average debt outstanding and interest rates were as follows:
| | | | |
| | | Three Months Ended Sept. 30 | |
| (In Millions) | | 2006 | | 2005 | |
| Floating-rate debt with interest charged on a rollover basis at one-month LIBOR: | | | | | |
| Average outstanding debt balance | | $ | 83.8 | | $ | 112.0 | |
| Average interest rate | | | 6.2 | % | | 4.8 | % |
| Fixed-rate and other debt: | | | | | | | |
| Average outstanding debt balance | | $ | 3.8 | | $ | 5.8 | |
| Average interest rate | | | 4.0 | % | | 5.8 | % |
| Total debt: | | | | | | | |
| Average outstanding debt balance | | $ | 87.6 | | $ | 117.8 | |
| Average interest rate | | | 6.1 | % | | 4.8 | % |
The effective tax rate declined to 32.7% in the third quarter of 2006 compared with 36.8% in 2005 primarily due to favorable adjustments aggregating $658,000 (4.6% of income before income taxes for the third quarter of 2006) for income tax rate changes relating to deferred income tax assets and liabilities, an investment tax credit refund claim in Canada and accrual-to-return adjustments.
First Nine Months of 2006 Compared with First Nine Months of 2005
Overall, sales in the first nine months of 2006 increased by 18.1% compared with 2005. Net sales (sales less freight) increased 11.2% in Film Products primarily due to growth in higher value-added products, including surface protection, elastic and apertured materials, and higher selling prices, which were driven by higher raw material costs. Net sales increased 25.1% in Aluminum Extrusions due to higher volume (up 8.5%) and selling prices. For more information on net sales and volume, see the executive summary beginning on page 15.
Consolidated gross profit (sales minus cost of goods sold and freight) as a percentage of sales decreased to 12.6% in the first nine months of 2006 from 13.1% in 2005. At Film Products, an overall higher gross profit margin was driven primarily by growth in higher value-added products, including surface protection, elastic and apertured materials. Margins also benefited from a favorable lag in the pass-through to customers of changes in resin costs (about $1 million in the first nine months of 2006 compared with $1.5 million in 2005) and a gain of $2.6 million for LIFO inventory liquidations (included in "Cost of goods sold" in the consolidated statements of income) related to the shutdown of the facility in LaGrange, Georgia. At Aluminum Extrusions, gross profit increased but the gross profit margin percentage declined primarily due to higher selling prices to cover higher aluminum costs and margin compression caused by rapidly increasing aluminum costs.
As a percentage of sales, selling, general and administrative (“SG&A”) expenses decreased to 6.0% in the first nine months of 2006 compared with 6.9% in 2005 due primarily to higher sales and the divestiture of substantially all of our interest in AFBS, Inc. (formerly known as Therics, Inc.) at the end of the second quarter of 2005.
R&D expenses declined to $6.1 million in the first nine months of 2006 from $7.2 million in 2005 primarily due to the divestiture of substantially all of our interest in AFBS.
Plant shutdowns, asset impairments and restructurings and related items in the first nine months of 2006 shown in the segment operating profit table on page 22 include:
| | • | A pretax charge of $27,000 related to severance and other employee-related costs associated with the shutdown of the films manufacturing facility in New Bern, North Carolina. |
|
In the three months ended June 30, 2005, a pretax gain on the sale of corporate real estate of $61,000 (proceeds of $151,000) is included in “Other income (expense), net” in the consolidated
|
statements of income and “Gain on the sale of corporate assets” in the operating profit by segment table on page 22.
Interest income, which is included in “Other income (expense), net” in the consolidated statements of income, was $285,000 in the second quarter of 2006 and $142,000 in 2005. Interest expense increased to $1.5 million in the second quarter of 2006 compared with $1.1 million in 2005. Average debt outstanding and interest rates were as follows:
|
|
| |
| |
|---|
| | | Three Months
Ended June 30 | | |
|---|
| | |
| |
|---|
| | (In Millions) | 2006 | | 2005 | | |
|---|
|
| |
|---|
| | Floating-rate debt with interest charged on a
rollover basis at one-month LIBOR: | | | | | | | |
| | Average outstanding debt balance | $ | 101.5 | | $ | 112.9 | | |
| | Average interest rate | | 5.9 | % | | 4.3 | % | |
| | Fixed-rate and other debt: | | | | | | | |
| | Average outstanding debt balance | $ | 5.3 | | $ | 5.6 | | |
| | Average interest rate | | 6.3 | % | | 5.2 | % | |
| |
| |
|---|
| | Total debt: | | | | | | | |
| | Average outstanding debt balance | $ | 106.8 | | $ | 118.5 | | |
| | Average interest rate | | 5.9 | % | | 4.3 | % | |
| |
| |
|---|
|
The effective tax rate declined to 37.6% in the second quarter of 2006 compared with 39.7% in 2005 primarily due to the absence of state income tax benefits accrued or expected on losses associated with AFBS, Inc. (formerly known as Therics, Inc.) in 2005.
First Six Months of 2006 Compared with First Six Months of 2005
Overall, sales in the first six months of 2006 increased by 15.5% compared with 2005. Net sales (sales less freight) increased 8.6% in Film Products primarily due to growth in higher value-added products, including surface protection, elastic and apertured materials, and higher selling prices, which were driven by higher raw material costs. Net sales increased 22.5% in Aluminum Extrusions due to higher volume (up 9.2%) and selling prices. For more information on net sales and volume, see the executive summary beginning on page 15.
Consolidated gross profit (sales minus cost of goods sold and freight) as a percentage of sales decreased to 12.8% in the first six months of 2006 from 13.0% in 2005. At Film Products, an overall higher gross profit margin was driven primarily by growth in higher value-added products, including surface protection, elastic and apertured materials. Margins also benefited from a favorable lag in the pass-through to customers of changes in resin costs (about $2.5 million in the first six months of 2006 compared with $1.5 million in 2005) and a gain of $1.4 million for LIFO inventory liquidations (included in “Cost of goods sold” in the consolidated statements of income). At Aluminum Extrusions, gross profit increased but the gross profit margin percentage declined primarily due to higher selling prices to cover higher aluminum costs and margin compression caused by rapidly increasing aluminum costs.
As a percentage of sales, selling, general and administrative (“SG&A”) expenses decreased to 5.9% in the first six months of 2006 compared with 7.0% in 2005 due primarily to higher sales and the divestiture of substantially all of our interest in AFBS, Inc. (formerly known as Therics, Inc.) at the end of the second quarter of 2005.
R&D expenses declined to $4.1 million in the first six months of 2006 from $5.4 million in 2005 primarily due to the divestiture of substantially all of our interest in AFBS.
|
Plant shutdowns, asset impairments and restructurings and related items in the first six months of 2006 shown in the segment operating profit table on page 22 include: |
|
| • · | A net pretax gain of $418,000$1.4 million associated with the shutdown of the films manufacturing facility in LaGrange, Georgia, including a gain of $1.4$2.6 million for related LIFO inventory liquidations (included in “Cost"Cost of goods sold”sold" in the consolidated statements of income), partially offset by severance and other costs of $841,000$1 million and asset impairment charges of $130,000; |
| | | |
| • · | Pretax charges of $1 million for asset impairments in Film Products; and |
| | · | A pretax charge of $920,000 related to expected future environmental costs at the aluminum extrusions facility in Newnan, Georgia (included in "Cost of goods sold" in the consolidated statements of income); |
| | • · | Pretax charges of $727,000 for severance and other employee-related costs in connection with restructurings in Film Products ($213,000) and Aluminum Extrusions ($514,000).; and |
Plant shutdowns, asset impairments and restructurings and related items in the first six months of 2005 shown in the segment operating profit table on page 22 include:
|
| | · | A pretax charge of $494,000 related to the estimated loss on the sub-lease of a portion of the AFBS (formerly Therics) facility in Princeton, New Jersey. |
Plant shutdowns, asset impairments and restructurings and related items in the first nine months of 2005 shown in the segment operating profit table on page 22 include:
| •· | A pretax charge of $10 million related to the sale or assignment of substantially all of Therics’Therics' assets, including asset impairment charges of $5.6 million, lease-related losses of $3 million and severance and other transaction-related costs of $1.4 million; |
| | | · | Pretax charges of $1.8 million related to severance and other employee-related costs associated with restructurings in Film Products ($991,000), Aluminum Extrusions ($648,000) and at corporate headquarters ($185,000; included in “Corporate expenses, net” in the segment operating profit table); |
| •· | A pretax gain of $1.6 million related to the shutdown of the films manufacturing facility in New Bern, North Carolina, including a $1.8 million gain on the sale of the facility (included in “Other"Other income (expense), net”net" in the consolidated statements of income), partially offset by shutdown-related expenses of $225,000; |
| | |
| •· | A pretax charge of $1 million for process reengineering costs associated with the implementation of a new information system in Film Products (included in “Costs"Costs of goods sold”sold" in the consolidated statements of income); |
| | |
| · | • | Pretax chargesA net pretax charge of $918,000$725,000 related to severance and other employee-related costs associated with restructuringsthe restructuring of the research and development operations in Film Products ($477,000)(of this amount, $1.2 million in pretax charges for employee relocation and Aluminum Extrusions ($441,000)recruitment is included in "Selling, general and administrative expenses" in the consolidated statements of income); |
| | |
| • | A pretax charge of $399,000 related to the shutdown of the aluminum extrusions facility in Aurora, Ontario, including $873,000 of shutdown-related costs, partially offset by the reversal to income of certain severance and employee-related accruals of $474,000; |
| | |
| •· | A pretax gain of $653,000 related to the shutdown of the films manufacturing facility in Carbondale, Pennsylvania, including a $630,000 gain on the sale of the facility (included in “Other"Other income (expense), net”net" in the consolidated statements of income), and the reversal to income of certain shutdown-related accruals of $23,000; |
| | |
| •· | A pretax gain of $508,000 for interest receivable on tax refund claims (included in “Corporate expenses, net” in the net sales and operating profit by segment table and “Other income (expense), net” in the consolidated statements of income); |
| | |
| • | A net pretax charge of $130,000$597,000 related to the shutdown of the aluminum extrusions facility in Aurora, Ontario, including $1.1 million of shutdown-related costs, partially offset by the reversal to income of certain severance and other employee-related costs associated with the restructuringaccruals of the research and development operations in Film Products (of this amount, $545,000 in pretax charges for employee relocation and recruitment is included in “Selling, R&D and general expenses” in the consolidated statements of income);$474,000; and |
| | |
| •· | Pretax charges of $205,000$322,000 for accelerated depreciation related to restructurings in Film Products. |
|
In the six months ended June 30, 2006, a pretax gain on the sale of public equity securities of $56,000 (proceeds also of $56,000) is included in “Other income (expense), net” in the consolidated statements of income and “Gain on the sale of corporate assets” in the operating profit by segment table on page 22. In the six months ended June 30, 2005, a pretax gain on the sale of corporate real estate of $61,000 (proceeds of $151,000) is included in “Other income (expense), net” in the consolidated statements of income and “Gain on the sale of corporate assets” in the operating profit by segment table on page 22. In the six months ended June 30, 2005, a pretax gain for interest receivable on tax refund claims
|
of $508,000 is included in “Other income (expense), net” in the consolidated statements of income and “Corporate expenses, net” in the operating profit by segment table on page 22.
Interest income, which is included in “Other income (expense), net” in the consolidated statements of income, was $507,000 in the first six months of 2006 and $240,000 in 2005. Interest expense increased to $2.9 million in the first six months of 2006 compared with $2.1 million in 2005. Average debt outstanding and interest rates were as follows:
|
|
|
| |
|---|
| | Six Months
Ended June 30 | | |
|---|
| |
| |
|---|
| (In Millions) | 2006 | | 2005 | | |
|---|
|
| |
|---|
| | Floating-rate debt with interest charged on a
rollover basis at one-month LIBOR: | | | | | | | |
| | Average outstanding debt balance | $ | 105.5 | | $ | 109.7 | | |
| | Average interest rate | | 5.6 | % | | 4.1 | % | |
| | Fixed-rate and other debt: | | | | | | | |
| | Average outstanding debt balance | $ | 5.5 | | $ | 5.7 | | |
| | Average interest rate | | 6.5 | % | | 5.2 | % | |
|
| |
|---|
| | Total debt: | | | | | | | |
| | Average outstanding debt balance | $ | 111.0 | | $ | 115.4 | | |
| | Average interest rate | | 5.6 | % | | 4.2 | % | |
|
| |
|---|
|
The effective tax rate declined to 38.6% in the first six months of 2006 compared with 39.8% in 2005 primarily due to the absence of state income tax benefits accrued or expected on losses associated with AFBS, Inc. (formerly known as Therics, Inc.) in 2005.
|
In the nine months ended September 30, 2006, a pretax gain on the sale of public equity securities of $56,000 (proceeds also of $56,000) is included in “Other income (expense), net” in the consolidated statements of income and “Gain on the sale of corporate assets” in the segment operating profit table on page 22. In the nine months ended September 30, 2005, a pretax gain on the sale of corporate real estate of $61,000 (proceeds of $151,000) is included in “Other income (expense), net” in the consolidated statements of income and “Gain on the sale of corporate assets” in the segment operating profit table on page 22. In the nine months ended September 30, 2005, a pretax gain for interest receivable on tax refund claims of $508,000 is included in "Other income (expense), net" in the consolidated statements of income and "Corporate expenses, net" in the segment operating profit table on page 22.
Interest income, which is included in “Other income (expense), net” in the consolidated statements of income, was $822,000 in the first nine months of 2006 and $386,000 in 2005. Interest expense increased to $4.2 million in the first nine months of 2006 compared with $3.3 million in 2005. Average debt outstanding and interest rates were as follows:
| | | | |
| | | Nine Months Ended Sept. 30 | |
| (In Millions) | | 2006 | | 2005 | |
| Floating-rate debt with interest charged on a rollover basis at one-month LIBOR: | | | | | |
| Average outstanding debt balance | | $ | 98.2 | | $ | 110.5 | |
| Average interest rate | | | 5.8 | % | | 4.3 | % |
| Fixed-rate and other debt: | | | | | | | |
| Average outstanding debt balance | | $ | 4.9 | | $ | 5.9 | |
| Average interest rate | | | 5.9 | % | | 5.3 | % |
| Total debt: | | | | | | | |
| Average outstanding debt balance | | $ | 103.1 | | $ | 116.4 | |
| Average interest rate | | | 5.8 | % | | 4.4 | % |
Business Segment Review
The following tables present Tredegar’s net sales and operating profit by segment for the three and six months ended June 30, 2006 and 2005:
|
|
Tredegar Corporation
Net Sales and Operating Profit by Segment
(In Thousands)
(Unaudited) |
| | | | | | |
|---|
| | Three Months
Ended June 30 | | Six Months
Ended June 30 | |
|---|
| |
| |
| |
|---|
| | 2006 | | 2005 | | 2006 | | 2005 | |
|---|
| |
| |
| |
| |
| |
|---|
| Net Sales | | | | | | | | | | | | | |
| Film Products | | $ | 121,405 | | $ | 111,244 | | $ | 247,736 | | $ | 227,955 | |
| Aluminum Extrusions | | | 153,836 | | | 125,963 | | | 288,995 | | | 235,929 | |
| AFBS (formerly Therics) | | | — | | | 115 | | | — | | | 252 | |
| |
| |
| |
| |
| |
|---|
| Total net sales | | | 275,241 | | | 237,322 | | | 536,731 | | | 464,136 | |
| Add back freight | | | 7,250 | | | 6,402 | | | 13,724 | | | 12,345 | |
| |
| |
| |
| |
| |
|---|
Sales as shown in the Consolidated
Statements of Income | | $ | 282,491 | | $ | 243,724 | | $ | 550,455 | | $ | 476,481 | |
| |
| |
| |
| |
| |
|---|
| | | | | | | | | | | | | | |
| Operating Profit | | | | | | | | | | | | | |
| Film Products: | | | | | | | | | | | | | |
| Ongoing operations | | $ | 13,264 | | $ | 11,396 | | $ | 28,841 | | $ | 22,974 | |
Plant shutdowns, asset impairments and
restructurings, net of gain on sale of
assets and related income from LIFO
inventory liquidations | | | 768 | | | 44 | | | (815 | ) | | 413 | |
| | | | | | | | | | | | | | |
| Aluminum Extrusions: | | | | | | | | | | | | | |
| Ongoing operations | | | 5,674 | | | 7,221 | | | 10,540 | | | 10,218 | |
Plant shutdowns, asset impairments and
restructurings | | | (405 | ) | | (202 | ) | | (514 | ) | | (840 | ) |
| | | | | | | | | | | | | | |
| AFBS (formerly Therics): | | | | | | | | | | | | | |
| Ongoing operations | | | — | | | (1,644 | ) | | — | | | (3,467 | ) |
| Loss on investment in Therics, LLC | | | — | | | — | | | (25 | ) | | — | |
| Restructurings | | | — | | | (10,049 | ) | | — | | | (10,049 | ) |
| |
| |
| |
| |
| |
|---|
| | | | | | | | | | | | | | |
| Total | | | 19,301 | | | 6,766 | | | 38,027 | | | 19,249 | |
| Interest income | | | 285 | | | 142 | | | 507 | | | 240 | |
| Interest expense | | | 1,468 | | | 1,093 | | | 2,900 | | | 2,056 | |
| Gain on sale of corporate assets | | | — | | | 61 | | | 56 | | | 61 | |
| Stock option-based compensation costs | | | 282 | | | — | | | 493 | | | | |
| Corporate expenses, net | | | 3,002 | | | 2,339 | | | 6,761 | | | 4,735 | |
| |
| |
| |
| |
| |
|---|
| Income before income taxes | | | 14,834 | | | 3,537 | | | 28,436 | | | 12,759 | |
| Income taxes | | | 5,584 | | | 1,405 | | | 10,971 | | | 5,077 | |
| |
| |
| |
| |
| |
|---|
| Net income | | $ | 9,250 | | $ | 2,132 | | $ | 17,465 | | $ | 7,682 | |
| |
| |
| |
| |
| |
|---|
The effective tax rate declined to 36.6% in the first nine months of 2006 compared with 38.4% in 2005 primarily due to favorable adjustments aggregating $658,000 (1.5% of income before income taxes for the first nine months of 2006) for income tax rate changes relating to deferred income tax assets and liabilities, an investment tax credit refund claim in Canada and accrual-to-return adjustments.
Net sales (sales less freight) and operating profit from ongoing operations are the measures of sales and operating profit used by the chief operating decision maker of each segment for purposes of assessing performance.
Film Products
See the executive summary beginning on page 15 for discussion of operating results and planned capital expenditures for Film Products.
Aluminum Extrusions
See the executive summary beginning on page 15 for discussion of operating results and planned capital expenditures for Aluminum Extrusions.
AFBS
On June 30, 2005, substantially all of the assets of AFBS, Inc., a wholly-owned subsidiary of Tredegar (formerly known as Therics, Inc.), were sold or assigned to a newly-created limited liability company, Therics, LLC, controlled and managed by an individual not affiliated with Tredegar. AFBS received a 17.5% equity interest in Therics, LLC, valued at $170,000 and a 3.5% interest in Theken Spine, LLC, valued at $800,000, along with potential future payments based on the sale of certain products by Therics, LLC. AFBS retained substantially all of its liabilities in the transaction, which included customary indemnification provisions for pre-transaction liabilities. Tredegar has no obligation or intent to fund any future losses that may occur at Therics, LLC or Theken Spine, LLC. The ownership interest in Therics, LLC is accounted for under the equity method of accounting with losses limited to its initial carrying value of $170,000. The ownership interest in Theken Spine, LLC is accounted for under the cost method, with an impairment loss recognized and a new cost basis established for any write-down to estimated fair value, if necessary. The potential future payments due from Therics, LLC based on the sale of certain products will be recognized as income when earned.
Liquidity and Capital Resources
Changes in operating assets and liabilities from December 31, 2005 to June 30, 2006 are summarized below:
|
|
Business Segment Review
The following tables present Tredegar’s net sales and operating profit by segment for the three and nine months ended September 30, 2006 and 2005:
| | | Three Months Ended Sept. 30 | | Nine Months Ended Sept. 30 | |
| | | 2006 | | 2005 | | 2006 | | 2005 | |
Net Sales | | | | | | | | | |
| Film Products | | $ | 134,961 | | $ | 116,350 | | $ | 382,697 | | $ | 344,305 | |
| Aluminum Extrusions | | | 154,030 | | | 118,085 | | | 443,025 | | | 354,014 | |
| AFBS (formerly Therics) | | | - | | | - | | | - | | | 252 | |
| Total net sales | | | 288,991 | | | 234,435 | | | 825,722 | | | 698,571 | |
| Add back freight | | | 7,265 | | | 6,281 | | | 20,989 | | | 18,626 | |
| Sales as shown in the Consolidated Statements of Income | | $ | 296,256 | | $ | 240,716 | | $ | 846,711 | | $ | 717,197 | |
| | | | | | | | | | | | | | |
Operating Profit | | | | | | | | | | | | | |
| Film Products: | | | | | | | | | | | | | |
| Ongoing operations | | $ | 13,770 | | $ | 13,822 | | $ | 42,611 | | $ | 36,796 | |
| Plant shutdowns, asset impairments and restructurings, net of gain on sale of assets and related income from LIFO inventory liquidations | | | 1,022 | | | (1,225 | ) | | 207 | | | (812 | ) |
| | | | | | | | | | | | | | |
| Aluminum Extrusions: | | | | | | | | | | | | | |
| Ongoing operations | | | 5,407 | | | 4,362 | | | 15,947 | | | 14,580 | |
| Plant shutdowns, asset impairments and restructurings | | | (920 | ) | | (406 | ) | | (1,434 | ) | | (1,246 | ) |
| | | | | | | | | | | | | | |
| AFBS (formerly Therics): | | | | | | | | | | | | | |
| Ongoing operations | | | - | | | - | | | - | | | (3,467 | ) |
| Loss on investment in Therics, LLC | | | - | | | (91 | ) | | (25 | ) | | (91 | ) |
| Plant shutdowns, asset impairments and restructurings | | | (494 | ) | | - | | | (494 | ) | | (10,049 | ) |
| | | | | | | | | | | | | | |
| Total | | | 18,785 | | | 16,462 | | | 56,812 | | | 35,711 | |
| Interest income | | | 315 | | | 146 | | | 822 | | | 386 | |
| Interest expense | | | 1,331 | | | 1,196 | | | 4,231 | | | 3,252 | |
| Gain on sale of corporate assets | | | - | | | - | | | 56 | | | 61 | |
| Stock option-based compensation costs | | | 215 | | | - | | | 708 | | | - | |
| Corporate expenses, net | | | 3,148 | | | 3,290 | | | 9,909 | | | 8,025 | |
| Income before income taxes | | | 14,406 | | | 12,122 | | | 42,842 | | | 24,881 | |
| Income taxes | | | 4,716 | | | 4,465 | | | 15,687 | | | 9,542 | |
| Net income | | $ | 9,690 | | $ | 7,657 | | $ | 27,155 | | $ | 15,339 | |
Net sales (sales less freight) and operating profit from ongoing operations are the measures of sales and operating profit used by the chief operating decision maker of each segment for purposes of assessing performance.
Film Products
See the executive summary beginning on page 15 for discussion of operating results and planned capital expenditures for Film Products.
Aluminum Extrusions
See the executive summary beginning on page 15 for discussion of operating results and planned capital expenditures for Aluminum Extrusions.
AFBS
On June 30, 2005, substantially all of the assets of AFBS, Inc., a wholly-owned subsidiary of Tredegar (formerly known as Therics, Inc.), were sold or assigned to a newly-created limited liability company, Therics, LLC, controlled and managed by an individual not affiliated with Tredegar. AFBS received a 17.5% equity interest in Therics, LLC, valued at $170,000 and a 3.5% interest in Theken Spine, LLC, valued at $800,000, along with potential future payments based on the sale of certain products by Therics, LLC. AFBS retained substantially all of its liabilities in the transaction, which included customary indemnification provisions for pre-transaction liabilities. Tredegar has no obligation or intent to fund any future losses that may occur at Therics, LLC or Theken Spine, LLC. The ownership interest in Therics, LLC is accounted for under the equity method of accounting with losses limited to its initial carrying value of $170,000. The ownership interest in Theken Spine, LLC is accounted for under the cost method, with an impairment loss recognized and a new cost basis established for any write-down to estimated fair value, if necessary. The potential future payments due from Therics, LLC based on the sale of certain products will be recognized as income when earned.
Liquidity and Capital Resources
Changes in operating assets and liabilities from December 31, 2005 to September 30, 2006 are summarized below:
| | •· | Accounts receivable increased significantly by $37.7$39.9 million (32%(33%). |
| | | |
| –- | Accounts receivable in Film Products increased by $13.8$17.0 million due to higher sales and an increase in dayssales. Days sales outstanding (“DSO”). DSO was 5351 at JuneSeptember 30, 2006 compared with an average of 50 over the last four quarters. The primary increase in DSO is related to higher export sales from U.S., Europe and China locations, which generally have payment terms of 15 to 30 days more than domestic terms. |
| | | |
| –- | Accounts receivable in Aluminum Extrusions increased by $25.8$24.4 million due to higher sales. DSO was about 45, consistent with the average over the last four quarters. |
| | | |
| •· | Inventories decreased by $1.1$3.7 million (1.7%(5.9%). |
| | | |
| | –- | Inventory days were 4538 in Film Products, consistent withwhich was about 6 days below the average over the last four quarters.quarters and indicative of the success achieved by our inventory management program initiated at the beginning of the year. |
| | | | |
| | –- | Inventory days were 24 in Aluminum Extrusions consistent with the level at March 31,June 30, 2006, and about 32 days below the average over the last four quarters. |
| | | | |
| •· | Net property, plant and equipment was up $6.9$3.9 million (2.1%(1.2%) due primarily to appreciation of foreign currencies relative to the U.S. Dollar ($5.16.6 million), capital expenditures of $24.9$31.7 million compared with depreciation of $21.8$32.6 million, and asset impairments in Film Products of $1.2 million. |
| | | |
| •· | Accounts payable increased significantly by $31.4$26.6 million (51%(43%). |
| –- | Accounts payable days were 3430 in Film Products, about 4 days1 day above the average over the last four quarters, primarily due to higher accounts payable at foreign locations with payment terms in excess of the typical 30 days in the U.S.quarters. |
| | | |
| –- | Accounts payable days were 3633 in Aluminum Extrusions, about 5 days aboveeven with the average over the last four quarters. This increase was mainly |
| · | Accrued expenses increased by $9.8 million (27.1%) primarily due to incentive compensation accruals ($2.5 million), revenue received in advance of shipment ($2.1 million), timing of payments.payroll and related tax disbursements ($1.9 million), higher estimated liabilities for healthcare, workers compensation, property and casualty loss claims ($1.1 million) and the accrual for expected future environmental costs at the aluminum extrusions facility in Newnan, Georgia ($920,000). |
Cash providedDeferred income tax liabilities increased by operating activities was $48.3$12.1 million (16.3%) primarily due to utilization of income tax credit carry-forwards ($7.6 million) and an increase in the first six months of 2006 compared with $24.0 millionforeign currency translation adjustment included in 2005. The increase is due primarily to improved operating results, higher deferred income taxes and lower incremental working capital investment. |
|
Cash used in investing activities was $25.3 million in the first six months of 2006 compared with $31.2 million in 2005 due primarily to lower capital expenditures.shareholders’ equity ($3.3 million). |
Cash provided by operating activities was $76.3 million in the first nine months of 2006 compared with $35.4 million in 2005. The increase is due primarily to improved operating results, higher deferred income taxes and lower incremental working capital investment.
Cash used in investing activities was $32.0 million in the first nine months of 2006 compared with $44.9 million in 2005 due primarily to lower capital expenditures.
Capital expenditures in the first nine months of 2006 in Film Products primarily included the continued expansion of capacity for surface protection films and elastic materials, a new information system and normal replacement of machinery and equipment. Capital expenditures for all of 2006 are expected to be approximately $40 million in Film Products and about $8 million in Aluminum Extrusions.
Net capitalization and indebtedness as defined under our revolving credit agreement as of September 30, 2006 are as follows:
| | |
| Net Capitalization and Indebtedness as of Sept. 30, 2006 | |
| (In Thousands) | |
| Net capitalization: | | | |
| Cash and cash equivalents | | $ | 29,842 | |
| Debt: | | | | |
| $300 million revolving credit agreement maturing December 15, 2010 | | | 75,000 | |
| Other debt | | | 3,094 | |
| Total debt | | | 78,094 | |
| Debt net of cash and cash equivalents | | | 48,252 | |
| Shareholders' equity | | | 514,897 | |
| Net capitalization | | $ | 563,149 | |
| | | | | |
| Indebtedness as defined in revolving credit agreement: | | | | |
| Total debt | | $ | 78,094 | |
| Face value of letters of credit | | | 5,907 | |
| Liabilities relating to derivative financial instruments | | | 401 | |
| Indebtedness | | $ | 84,402 | |
Under the revolving credit agreement, borrowings are permitted up to $300 million, and $224 million was available to borrow at September 30, 2006. The credit spread and commitment fees charged on the unused amount under the revolving credit agreement at various indebtedness-to-adjusted EBITDA levels are as follows:
| | |
| Pricing Under Revolving Credit Agreement (Basis Points) | |
| Indebtedness-to-Adjusted | | Credit Spread | | Commitment | |
| EBITDA Ratio | | Over LIBOR | | Fee | |
| > 2.50x but <= 3x | | | 125 | | | 25 | |
| > 1.75x but <= 2.50x | | | 100 | | | 20 | |
| > 1x but <=1.75x | | | 87.5 | | | 17.5 | |
| <= 1x | | | 75 | | | 15 | |
At September 30, 2006, the interest rate on debt under the revolving credit agreement was priced at one-month LIBOR plus the applicable credit spread of 87.5 basis points.
The computations of adjusted EBITDA, adjusted EBIT, the leverage ratio and interest coverage ratio as defined in the revolving credit agreement are presented below along with the related most restrictive covenants. Adjusted EBITDA and adjusted EBIT as defined in the revolving credit agreement are not intended to represent cash flow from operations as defined by GAAP and should not be considered as either an alternative to net income or to cash flow.
| | |
| Computations of Adjusted EBITDA, Adjusted EBIT, Leverage Ratio and | |
| Interest Coverage Ratio as Defined in Revolving Credit Agreement Along with Related Most | |
| Restrictive Covenants | |
| As of September 30, 2006 (In Thousands) | |
| Computations of adjusted EBITDA and adjusted EBIT as defined in revolving credit agreement for the twelve months ended September 30, 2006: | | | |
| Net income | | $ | 28,045 | |
| Plus: | | | | |
| After-tax losses related to discontinued operations | | | - | |
| Total income tax expense for continuing operations | | | 16,118 | |
| Interest expense | | | 5,552 | |
| Charges related to stock option grants and awards accounted for under the fair value-based method | | | 708 | |
| Losses related to the application of the equity method of accounting | | | 79 | |
| Depreciation and amortization expense for continuing operations | | | 43,055 | |
| All non-cash losses and expenses, plus cash losses and expenses not to exceed $10,000, for continuing operations that are classified as unusual, extraordinary or which are related to plant shutdowns, asset impairments and/or restructurings (cash-related of $4,236) | | | 13,311 | |
| Minus: | | | | |
| After-tax income related to discontinued operations | | | - | |
| Total income tax benefits for continuing operations | | | - | |
| Interest income | | | (1,022 | ) |
| All non-cash gains and income, plus cash gains and income not to exceed $10,000, for continuing operations that are classified as unusual, extraordinary or which are related to plant shutdowns, asset impairments and/or restructurings (cash-related of $1,723) | | | (4,332 | ) |
| Plus or minus, as applicable, pro forma EBITDA adjustments associated with acquisitions and asset dispositions | | | - | |
| Adjusted EBITDA as defined in revolving credit agreement | | | 101,514 | |
| Less: Depreciation and amortization expense for continuing operations (including pro forma for acquisitions and asset dispositions) | | | (43,055 | ) |
| Adjusted EBIT as defined in revolving credit agreement | | $ | 58,459 | |
| Shareholders' equity at September 30, 2006 | | $ | 514,897 | |
| Computations of leverage and interest coverage ratios as defined in revolving credit agreement: | | | | |
| Leverage ratio (indebtedness-to-adjusted EBITDA) | | | 0.83x | |
| Interest coverage ratio (adjusted EBIT-to-interest expense) | | | 10.53x | |
| Most restrictive covenants as defined in revolving credit agreement: | | | | |
| Maximum permitted aggregate amount of dividends that can be paid by Tredegar during the term of the revolving credit agreement ($100,000 plus 50% of net income generated after October 1, 2005) | | $ | 114,023 | |
| Minimum adjusted shareholders' equity permitted ($351,918 plus 50% of net income generated after October 1, 2005) | | $ | 365,941 | |
| Maximum leverage ratio permitted: | | | | |
| Ongoing | | | 3.00x | |
| Pro forma for acquisitions | | | 2.50x | |
| Minimum interest coverage ratio permitted | | | 2.50x | |
We believe that as of September 30, 2006, we were, and currently we are, in compliance with all of our debt covenants. Noncompliance with any one or more of the debt covenants may have an adverse effect on financial condition or liquidity in the event such noncompliance cannot be cured or should we be unable to obtain a waiver from the lenders. Renegotiation of the covenant through an amendment to the revolving credit agreement may effectively cure the noncompliance, but may have an effect on financial condition or liquidity depending upon how the covenant is renegotiated.
We believe that the borrowing availability under our revolving credit agreement, our current cash balances and our cash flow from operations will be sufficient to satisfy our working capital, capital expenditure and dividend requirements for the foreseeable future.
|
Capital expenditures in the first six months of 2006 in Film Products primarily included the continued expansion of capacity for surface protection films and elastic materials, a new information system and normal replacement of machinery and equipment. Capital expenditures for all of 2006 are expected to be approximately $45 million in Film Products and about $10 million in Aluminum Extrusions.Net capitalization and indebtedness as defined under our revolving credit agreement as of June 30, 2006 are as follows:
|
|
| |
| | |
|---|
| | Net Capitalization and Indebtedness as of June 30, 2006
(In Thousands) | | |
|---|
| |
| | |
|---|
| | Net capitalization: | | | | |
| | Cash and cash equivalents | $ | 25,425 | | |
| | Debt: | | | | |
| | $300 million revolving credit agreement maturing | | | | |
| | December 15, 2010 | | 89,000 | | |
| | Other debt | | 5,161 | | |
| |
| | |
| | Total debt | | 94,161 | | |
| |
| | |
| | Debt net of cash and cash equivalents | | 68,736 | | |
| | Shareholders’ equity | | 503,894 | | |
| |
| | |
| | Net capitalization | $ | 572,630 | | |
| |
| | |
| | Indebtedness as defined in revolving credit agreement: | | | | |
| | Total debt | $ | 94,161 | | |
| | Face value of letters of credit | | 5,907 | | |
| | Liabilities relating to derivative financial instruments | | 1,626 | | |
| |
| | |
| | Indebtedness | $ | 101,694 | | |
| |
| | |
|
Under the revolving credit agreement, borrowings are permitted up to $300 million, and $197 million was available to borrow at June 30, 2006. The credit spread and commitment fees charged on the unused amount under the revolving credit agreement at various indebtedness-to-adjusted EBITDA levels are as follows: |
|
| |
| |
|---|
| | Pricing Under Revolving Credit Agreement (Basis Points) | |
|---|
| |
| |
|---|
| | Indebtedness-to-Adjusted
EBITDA Ratio | Credit Spread
Over LIBOR | | Commitment
Fee | |
|---|
| |
| |
|---|
| | > 2.50x but <= 3x | 125 | | 25 | |
| | > 1.75x but <= 2.50x | 100 | | 20 | |
| | > 1x but <=1.75x | 87.5 | | 17.5 | |
| | <= 1x | 75 | | 15 | |
| |
| |
At June 30, 2006, the interest rate on debt under the revolving credit agreement was priced at one-month LIBOR plus the applicable credit spread of 87.5 basis points.
The computations of adjusted EBITDA, adjusted EBIT, the leverage ratio and interest coverage ratio as defined in the revolving credit agreement are presented below along with the related most restrictive covenants. Adjusted EBITDA and adjusted EBIT as defined in the revolving credit agreement are not intended to represent cash flow from operations as defined by GAAP and should not be considered as either an alternative to net income or to cash flow.
|
|
|
|---|
Computations of Adjusted EBITDA, Adjusted EBIT, Leverage Ratio and
Interest Coverage Ratio as Defined in Revolving Credit Agreement Along with Related Most
Restrictive Covenants
As of June 30, 2006 (In Thousands) |
|---|
|
|---|
| Computations of adjusted EBITDA and adjusted EBIT as defined in revolving credit | | | | |
| agreement for the twelve months ended June 30, 2006: | | | | |
| Net income | | $ | 26,012 | |
| Plus: | | | | |
| After-tax losses related to discontinued operations | | | — | |
| Total income tax expense for continuing operations | | | 15,867 | |
| Interest expense | | | 5,417 | |
| Charges related to stock option grants and awards accounted for | | | | |
| under the fair value-based method | | | 493 | |
| Losses related to the application of the equity method of accounting | | | 170 | |
| Depreciation and amortization expense for continuing operations | | | 41,956 | |
| All non-cash losses and expenses, plus cash losses and expenses not | | | | |
| to exceed $10,000, for continuing operations that are classified as | | | | |
| unusual, extraordinary or which are related to plant shutdowns, | | | | |
| asset impairments and/or restructurings (cash-related of $4,323) | | | 13,515 | |
| Minus: | | | | |
| After-tax income related to discontinued operations | | | — | |
| Total income tax benefits for continuing operations | | | — | |
| Interest income | | | (853 | ) |
| All non-cash gains and income, plus cash gains and income not to | | | | |
| exceed $10,000, for continuing operations that are classified as | | | | |
| unusual, extraordinary or which are related to plant shutdowns, | | | | |
| asset impairments and/or restructurings (cash-related of $1,723) | | | (3,112 | ) |
| Plus or minus, as applicable, pro forma EBITDA adjustments associated | | | | |
| with acquisitions and asset dispositions | | | — | |
|
| |
| Adjusted EBITDA as defined in revolving credit agreement | | | 99,465 | |
| Less: Depreciation and amortization expense for continuing operations | | | | |
| (including pro forma for acquisitions and asset dispositions) | | | (41,956 | ) |
|
| |
| Adjusted EBIT as defined in revolving credit agreement | | $ | 57,509 | |
|
| |
| Shareholders’ equity at June 30, 2006 | | $ | 503,894 | |
| Computations of leverage and interest coverage ratios as defined in | | | | |
| revolving credit agreement: | | | | |
| Leverage ratio (indebtedness-to-adjusted EBITDA) | | | 1.02x | |
| Interest coverage ratio (adjusted EBIT-to-interest expense) | | | 10.62x | |
| Most restrictive covenants as defined in revolving credit agreement: | | | | |
| Maximum permitted aggregate amount of dividends that can be paid | | | | |
| by Tredegar during the term of the revolving credit agreement | | | | |
| ($100,000 plus 50% of net income generated after October 1, 2005) | | $ | 109,178 | |
| Minimum adjusted shareholders’ equity permitted ($351,918 plus | | | | |
| 50% of net income generated after October 1, 2005) | | $ | 361,096 | |
| Maximum leverage ratio permitted: | | | | |
| Ongoing | | | 3.00x | |
| Pro forma for acquisitions | | | 2.50x | |
| Minimum interest coverage ratio permitted | | | 2.50x | |
|
|
We believe that as of June 30, 2006, we were, and currently we are, in compliance with all of our debt covenants. Noncompliance with any one or more of the debt covenants may have an adverse effect on financial condition or liquidity in the event such noncompliance cannot be cured or should we be unable to obtain a waiver from the lenders. Renegotiation of the covenant through an amendment to the revolving credit agreement may effectively cure the noncompliance, but may have an effect on financial condition or liquidity depending upon how the covenant is renegotiated.
We believe that the borrowing availability under our revolving credit agreement, our current cash balances and our cash flow from operations will be sufficient to satisfy our working capital, capital expenditure and dividend requirements for the foreseeable future.
Item 3. | Quantitative and Qualitative Disclosures About Market Risk. Tredegar has exposure to the volatility of interest rates, polyethylene and polypropylene resin prices, aluminum ingot and scrap prices, energy prices, foreign currencies and emerging markets. See the section on liquidity and capital resources beginning on page 23 regarding the revolving credit agreement and interest rate exposures.
Changes in resin prices, and the timing of those changes, could have a significant impact on profit margins in Film Products. Profit margins in Aluminum Extrusions are sensitive to fluctuations in aluminum ingot and scrap prices as well as energy costs. There is no assurance of our ability to pass through higher raw material and energy costs to our customers.
Average quarterly prices of low density polyethylene resin (a primary raw material for Film Products) are shown in the chart below.
|
| | |
| | Quarterly Average U.S. Large Buyer Price for Low Density Polyethylene Resin
(Cents Per Pound) | | |
| 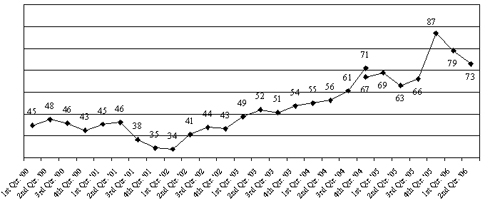 | |
| | |
| | |
| | Source: Quarterly averages computed by Tredegar using monthly data provided by Chemical Data Inc. (“CDI”). In January 2005, CDI reflected a 4 cents per pound non-market adjustment based on their estimate of the growth of discounts over the 2000 to 2003 period. The 4th quarter 2004 average rate of 67 cents per pound is shown on a pro forma basis as if the non-market adjustment was made in October 2004. | | |
|
Resin prices in Europe, Asia and South America have exhibited similar trends, except average resin prices were up 2-4 cents per pound in Europe and Asia while average prices in the U.S. were down 6 cents per pound in the second quarter of 2006 compared with the first quarter of 2006. The price of resin is driven by several factors including supply and demand and the prices of oil, ethylene and natural gas. To address fluctuating resin prices, we have indexed pass-through or cost-sharing agreements covering a majority of our sales, but many have a 90-day lag. Most new customer contracts contain resin pass-through arrangements.
|
|
In the normal course of business, we enter into fixed-price forward sales contracts with certain customers for the sale of fixed quantities of aluminum extrusions at scheduled intervals. In order to hedge our exposure to aluminum price volatility (see the chart below) under these fixed-price arrangements, which generally have a duration of not more than 12 months, we enter into a combination of forward purchase commitments and futures contracts to acquire or hedge aluminum, based on the scheduled deliveries. |
| | |
| | Quarterly Average Price of Aluminum
(U.S. Midwest Spot Price – Cents Per Pound) | | |
|  | |
| | |
| | |
| | Source: Quarterly averages computed by Tredegar using daily closing data provided by Bloomberg. | | |
|
In Aluminum Extrusions, we hedge from time-to-time a portion of our exposure to natural gas price volatility (see the chart below) by entering into fixed-price forward purchase contracts with our natural gas suppliers. As of June 30, 2006, we had fixed prices through natural gas suppliers for a portion of our expected usage through the first quarter of 2007. We estimate that, in an unhedged situation, every $1 per mmBtu per month change in the market price of natural gas has a $150,000 impact on the monthly operating profit of Aluminum Extrusions.
|
| | |
| | Quarterly Average Price of Natural Gas
(NYMEX Settlement Prices – $ Per mmBtu) | | |
| 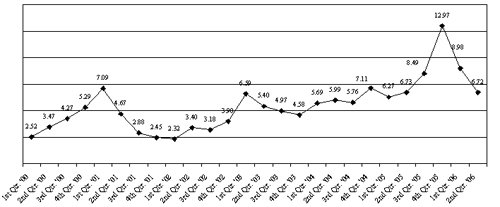 | |
| | |
| | |
| | Source: Quarterly averages computed by Tredegar using monthly NYMEX settlement prices. | | |
Tredegar has exposure to the volatility of interest rates, polyethylene and polypropylene resin prices, aluminum ingot and scrap prices, energy prices, foreign currencies and emerging markets. See the section on liquidity and capital resources beginning on page 23 regarding the revolving credit agreement and interest rate exposures.
|
Changes in resin prices, and the timing of those changes, could have a significant impact on profit margins in Film Products. Profit margins in Aluminum Extrusions are sensitive to fluctuations in aluminum ingot and scrap prices as well as energy costs. There is no assurance of our ability to pass through higher raw material and energy costs to our customers. Average quarterly prices of low density polyethylene resin (a primary raw material for Film Products) are shown in the chart below. Resin prices in Europe, Asia and South America have exhibited similar trends, except average resin prices were up 2-4 cents per pound in Europe and Asia while average prices in the U.S. were down 6 cents per pound in the second quarter of 2006 compared with the first quarter of 2006. The price of resin is driven by several factors including supply and demand and the prices of oil, ethylene and natural gas. To address fluctuating resin prices, we have indexed pass-through or cost-sharing agreements covering a majority of our sales, but many have a 90-day lag. Most new customer contracts contain resin pass-through arrangements.
In the normal course of business, we enter into fixed-price forward sales contracts with certain customers for the sale of fixed quantities of aluminum extrusions at scheduled intervals. In order to hedge our exposure to aluminum price volatility (see the chart below) under these fixed-price arrangements, which generally have a duration of not more than 12 months, we enter into a combination of forward purchase commitments and futures contracts to acquire or hedge aluminum, based on the scheduled deliveries. 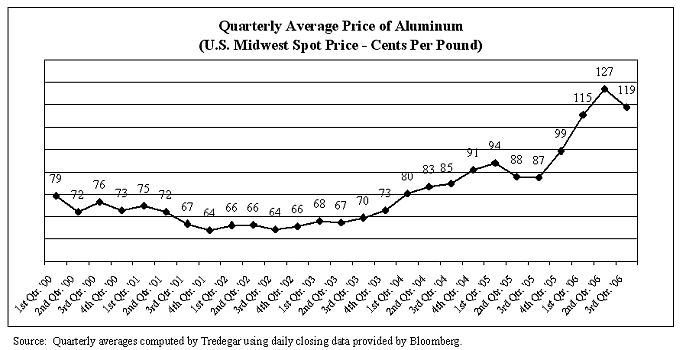 In Aluminum Extrusions, we hedge from time-to-time a portion of our exposure to natural gas price volatility (see the chart below) by entering into fixed-price forward purchase contracts with our natural gas suppliers. As of September 30, 2006, we had fixed prices through natural gas suppliers for a portion of our expected usage through the first quarter of 2007. We estimate that, in an unhedged situation, every $1 per mmBtu per month change in the market price of natural gas has a $150,000 impact on the monthly operating profit of Aluminum Extrusions.
We sell to customers in foreign markets through our foreign operations and through exports from our U.S. plants. The percentage of sales from manufacturing operations related to foreign markets for the first nine months of 2006 and 2005 are as follows: | | | | Percentage of Net Sales from Manufacturing | | | Operations Related to Foreign Markets* | | | | | Nine Months Ended Sept. 30 | | | | | 2006 | | 2005 | | | | | Exports | | Foreign | | Exports | | Foreign | | | | | From U.S. | | Operations | | From U.S. | | Operations | | | Canada | | | 4 | % | | 16 | % | | 5 | % | | 15 | % | | Europe | | | 1 | | | 12 | | | 1 | | | 14 | | | Latin America | | | - | | | 2 | | | 1 | | | 2 | | | Asia | | | 5 | | | 4 | | | 4 | | | 4 | | | Total | | | 10 | % | | 34 | % | | 11 | % | | 35 | % |
| * | Based on consolidated net sales from manufacturing operations related to foreign markets for the first six months of 2006 and 2005 are as follows: | | (excludes AFBS). |
| |
| | | | | Percentage of Net Sales from Manufacturing
Operations Related to Foreign Markets*
| | | | |
| | | | | | Six Months Ended June 30 | | | | | |
| | | | | | 2006 | | 2005 | | | | | |
| |
| | | | | | Exports
From U.S. | | Foreign
Operations
| | Exports
From U.S. | | Foreign
Operations
| | | | | |
| |
| |
| |
| | | | | Canada | | 4 | % | | 16 | % | | 5 | % | | 15 | % | | | | Europe | | 1 | | | 12 | | | 1 | | | 14 | | | | | Latin America | | 1 | | | 2 | | | 1 | | | 2 | | | | | Asia | | 4 | | | 3 | | | 5 | | | 4 | | | | |
| | | | | Total | | 10 | % | | 33 | % | | 12 | % | | 35 | % | | | |
| | | | | * Based on consolidated net sales from manufacturing operations (excludes AFBS). | |
| We attempt to match the pricing and cost of our products in the same currency (except in Canada where about 80% of our sales of aluminum extrusions are U.S. Dollar-based) and generally view the volatility of foreign currencies (see trends for the Euro, Canadian Dollar and Hungarian Forint in the chart below) and emerging markets, and the corresponding impact on earnings and cash flow, as part of the overall risk of operating in a global environment. Exports from the U.S. are generally denominated in U.S. Dollars. Our foreign currency exposure on income from foreign operations relates to the Canadian Dollar, the Euro, the Hungarian Forint, the Chinese Yuan and the Brazilian Real.
The relatively high percentage of U.S. Dollar-priced sales in Canada is partly due to the shifting of a large portion of the customers previously served by the aluminum extrusions plant in El Campo, Texas, in 2001. The resulting mismatch between the currency denomination of sales and costs causes lower U.S. Dollar translated profits when the Canadian Dollar appreciates since our costs are higher in U.S. Dollar equivalent terms while sales are mostly unaffected (the opposite effect occurs when the Canadian Dollar depreciates in value relative to the U.S. Dollar). We estimate that the appreciation of the Canadian Dollar relative to the U.S. Dollar had an adverse impact on operating profit of about $1.3 million and $1.6 million in the three and six months ended June 30, 2006, respectively, compared with 2005. In Film Products, where we have been able to better match the currency of our sales and costs, we estimate that the change in value of foreign currencies (primarily the Euro and Hungarian Forint and to a lesser extent the Chinese Yuan and Brazilian Real) relative to the U.S. Dollar had a slight positive impact on operating profit in the second quarter of 2006 compared with 2005, and a negative impact on operating profit of about $150,000 in the first six months of 2006 compared with 2005.
We continue to review the loading of our aluminum extrusions plants in North America to optimize production mix and minimize cost in light of the increase in the U.S. Dollar equivalent cost structure of our plants in Canada. In addition, in May 2006 we purchased average rate call options and sold average rate put options through a large financial institution on the Canadian Dollar/U.S. Dollar to partially hedge our exposure in the second and third quarters of 2006 to U.S. Dollar-denominated sales of extrusions manufactured at our facilities in Canada. The hedge notional amount ($2.5 million for the second half of the second quarter and $5 million for the third quarter) represents about 35 – 45% of our economic exposure. The call premium paid less put premium received was zero (“zero-cost collar”). The strike prices on the puts and calls were a Canadian Dollar equal to 88.5 cents and 95 cents, respectively, in the second quarter of 2006 and 87.49 cents and 95 cents, respectively, in the third quarter of 2006. The second-quarter puts and calls expired worthless as the average value for the period of the Canadian Dollar was 89.95 cents. The estimated fair value of the third quarter puts and calls at June 30, 2006 was
|
We attempt to match the pricing and cost of our products in the same currency (except in Canada where about 80% of our sales of aluminum extrusions are U.S. Dollar-based) and generally view the volatility of foreign currencies (see trends for the Euro, Canadian Dollar and Hungarian Forint in the chart below) and emerging markets, and the corresponding impact on earnings and cash flow, as part of the overall risk of operating in a global environment. Exports from the U.S. are generally denominated in U.S. Dollars. Our foreign currency exposure on income from foreign operations relates to the Canadian Dollar, the Euro, the Hungarian Forint, the Chinese Yuan and the Brazilian Real. | immaterial (an unrealized loss of $15,134). The pay-off grid for the third-quarter hedge for a Canadian Dollar average value of $0.80 to $1.05 is shown below:
| |
| |
| | | | CAD Per
USD
| | CAD USD
Equiv.
| | | Amount
Tredegar
Receives
(Pays)
Counter-Party | | | | |
| | | | 1.25000 | | 0.8000 | | $ | (428,000 | ) | | | | 1.21212 | | 0.8250 | | | (285,125 | ) | | | | 1.17647 | | 0.8500 | | | (142,250 | ) | | | | 1.14286 | | 0.8750 | | | — | | | | | 1.11111 | | 0.9000 | | | — | | | | | 1.08108 | | 0.9250 | | | — | | | | | 1.05263 | | 0.9500 | | | — | | | | | 1.02564 | | 0.9750 | | | 131,425 | | | | | 1.00000 | | 1.0000 | | | 263,000 | | | | | 0.97561 | | 1.0250 | | | 394,575 | | | | | 0.95238 | | 1.0500 | | | 526,150 | | | | |
| |
| Trends for the Euro, Canadian Dollar and Hungarian Forint are shown in the chart below: |
The relatively high percentage of U.S. Dollar-priced sales in Canada is partly due to the shifting of a large portion of the customers previously served by the aluminum extrusions plant in El Campo, Texas, in 2001. The resulting mismatch between the currency denomination of sales and costs causes lower U.S. Dollar translated profits when the Canadian Dollar appreciates since our costs are higher in U.S. Dollar equivalent terms while sales are mostly unaffected (the opposite effect occurs when the Canadian Dollar depreciates in value relative to the U.S. Dollar). We estimate that the appreciation of the Canadian Dollar relative to the U.S. Dollar had an adverse impact on operating profit of about $1 million and $2.7 million in the three and nine months ended September 30, 2006, respectively, compared with 2005. In Film Products, where we have been able to better match the currency of our sales and costs, we estimate that the change in value of foreign currencies (primarily the Euro and Hungarian Forint and to a lesser extent the Chinese Yuan and Brazilian Real) relative to the U.S. Dollar had a positive impact on operating profit in the third quarter of 2006 of about $250,000 compared with 2005, and a slight positive impact on operating profit in the first nine months of 2006 compared with 2005.
We continue to review the loading of our aluminum extrusions plants in North America to optimize production mix and minimize cost in light of the increase in the U.S. Dollar equivalent cost structure of our plants in Canada. In addition, in May and August of 2006 we purchased average rate call options and sold average rate put options through a large financial institution on the Canadian Dollar/U.S. Dollar to partially hedge our exposure in the second, third and fourth quarters of 2006 to U.S. Dollar-denominated sales of extrusions manufactured at our facilities in Canada. The hedge notional amount ($2.5 million for the second half of the second quarter, $5 million for the third quarter and $6.5 million for the fourth quarter) represents about 35 - 55% of our economic exposure. The call premium paid less put premium received was zero (“zero-cost collar”). The strike prices on the puts and calls were a Canadian Dollar equal to 88.5 cents and 95 cents, respectively, in the second quarter of 2006, 87.49 cents and 95 cents, respectively, in the third quarter of 2006 and 86.5 cents and 93.24 cents, respectively, in the fourth quarter of 2006. The second- and third- quarter puts and calls expired worthless as the average value for the period of the Canadian Dollar was 89.95 and 89.19 cents, respectively. The estimated fair value of the third quarter puts and calls at September 30, 2006 was immaterial (an unrealized loss of $1,023). The pay-off grid for the third-quarter hedge for a Canadian Dollar average value of $.815 to $1.065 is shown below:
| | | | | | | | CAD Per USD | | CAD USD Equiv. | | Amount Tredegar Receives (Pays) Counter-Party | | | 1.2270 | | | 0.8150 | | $ | (375,719 | ) | | 1.1905 | | | 0.8400 | | | (187,858 | ) | | 1.1561 | | | 0.8650 | | | - | | | 1.1236 | | | 0.8900 | | | - | | | 1.0929 | | | 0.9150 | | | - | | | 1.0638 | | | 0.9400 | | | 52,982 | | | 1.0363 | | | 0.9650 | | | 227,263 | | | 1.0101 | | | 0.9900 | | | 401,544 | | | 0.9852 | | | 1.0150 | | | 575,826 | | | 0.9615 | | | 1.0400 | | | 750,107 | | | 0.9390 | | | 1.0650 | | | 924,389 | |
Trends for the Euro, Canadian Dollar and Hungarian Forint are shown in the chart below: 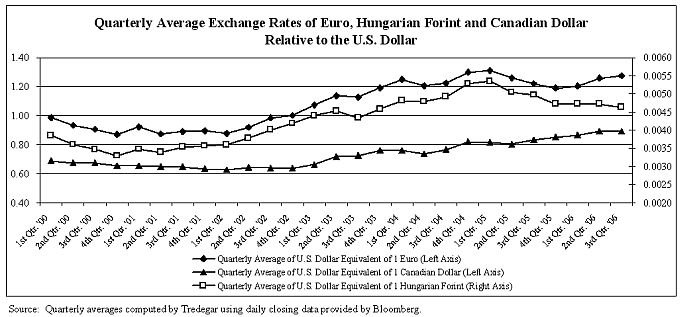
| | | | | | Quarterly Average Exchange Rates of Euro, Hungarian Forint and Canadian
Dollar Relative to the U.S. Dollar
| | | |  | | | | | | | | | | Source: Quarterly averages computed by Tredegar using daily closing data provided by Bloomberg. | | |
Item 4. | Controls and Procedures. Pursuant to Rule 13a-15(b) under the Securities Exchange Act of 1934, we carried out an evaluation, with the participation of our management, including our principal executive officer and principal financial officer, of the effectiveness of our disclosure controls and procedures (as defined under Rule 13a-15(e) under the Securities Exchange Act of 1934) as of the end of the period covered by this report. Based upon that evaluation, our principal executive officer and principal financial officer concluded that our disclosure controls and procedures are effective to ensure that information required to be disclosed by us in the reports that we file or submit under the Exchange Act, is recorded, processed, summarized and reported, within the time periods specified in the SEC’s rules and forms, and that such information is accumulated and communicated to our management, including our principal executive officer and principal financial officer, as appropriate, to allow timely decisions regarding required disclosure.
During the first six months of 2006, we installed a new information system in Film Products at several U.S. locations and expect to complete installation at Film Products’ remaining U.S. locations by the end of 2006. This was the only change in our internal control over financial reporting during the quarter ended June 30, 2006, that has materially affected, or is reasonably likely to materially affect, our internal control over financial reporting.
|
Pursuant to Rule 13a-15(b) under the Securities Exchange Act of 1934, we carried out an evaluation, with the participation of our management, including ourprincipal executive officer and principal financial officer, of the effectiveness of our disclosure controls and procedures (as defined under Rule 13a-15(e) under the Securities Exchange Act of 1934) as of the end of the period covered by this report. Based upon that evaluation, ourprincipal executive officer and principal financial officer concluded that our disclosure controls and procedures are effective to ensure that information required to be disclosed by us in the reports that we file or submit under the Exchange Act, is recorded, processed, summarized and reported, within the time periods specified in the SEC's rules and forms, and that such information is accumulated and communicated to our management, including our principal executive officer and principal financial officer, as appropriate, to allow timely decisions regarding required disclosure.
During the first nine months of 2006, we installed a new information system in Film Products at several U.S. locations and expect to complete installation at Film Products’ remaining U.S. locations by the end of 2006. This was the only change in our internal control over financial reporting during the quarter ended September 30, 2006, that has materially affected, or is reasonably likely to materially affect, our internal control over financial reporting.
PART II - OTHER INFORMATION
30
Item 1. | Legal Proceedings. |
On June 23, 2005, the United States Environmental Protection Agency, Region 4 (“EPA”), issued an Administrative Order (Docket No. CAA-04-2005-1838, the “Order”) under the Clean Air Act (as amended from time to time, the “Act”) alleging certain violations by Aluminum Extrusions’ Carthage, Tennessee facility of the refrigerant management regulations promulgated pursuant to the Act. The Order alleged that the violations occurred primarily in 2002 and 2003.
The Order required Aluminum Extrusions to either replace the cooling system at issue or retrofit it with an EPA approved non-ozone depleting substance. The Order further required Aluminum Extrusions to comply with certain applicable provisions of the Act and to provide certified documentation verifying compliance with the Order. Aluminum Extrusions was required to comply with all terms of the Order within 180 days from issuance.
Aluminum Extrusions fulfilled all obligations imposed by the Order during 2005, and reported that fact in a letter to the EPA dated October 25, 2005. Although Aluminum Extrusions has not admitted any violations to the EPA pursuant to the Order, Aluminum Extrusions elected to replace the affected cooling system and incurred related replacement costs of approximately $110,000.
Pursuant to a Consent Agreement and Final Order (“CAFO”) that became effective May 9, 2006, Aluminum Extrusions (i) paid a civil penalty of $30,422 and (ii) undertook a supplemental environmental project ("SEP") in an amount of at least $208,170 ("Minimum SEP Expenditure"). The CAFO requires that the SEP be fully implemented within one year of the CAFO's effective date. On July 6, 2006, Aluminum Extrusions completed the SEP at a cost of $296,432. Management believes that the SEP was completed in a satisfactory and timely manner and expects to send a report to the EPA in the fourth quarter of 2006. If, however, the EPA rules that the SEP was not completed satisfactorily or failed to spend at least the Minimum SEP Expenditure, Aluminum Extrusions could be responsible under the CAFO for additional penalties of up to $91,000.
PART II – OTHER INFORMATIONItem 1. Legal Proceedings.
On June 23, 2005, the United States Environmental Protection Agency, Region 4 (“EPA”), issued an Administrative Order (Docket No. CAA-04-2005-1838, the “Order”) under the Clean Air Act (as amended from time to time, the “Act”) alleging certain violations by Aluminum Extrusions’ Carthage, Tennessee facility of the refrigerant management regulations promulgated pursuant to the Act. The Order alleged that the violations occurred primarily in 2002 and 2003.
The Order required Aluminum Extrusions to either replace the cooling system at issue or retrofit it with an EPA approved non-ozone depleting substance. The Order further required Aluminum Extrusions to comply with certain applicable provisions of the Act and to provide certified documentation verifying compliance with the Order. Aluminum Extrusions was required to comply with all terms of the Order within 180 days from issuance.
Aluminum Extrusions fulfilled all obligations imposed by the Order during 2005, and reported that fact in a letter to the EPA dated October 25, 2005. Although Aluminum Extrusions has not admitted any violations to the EPA pursuant to the Order, Aluminum Extrusions elected to replace the affected cooling system and incurred related replacement costs of approximately $110,000.
Pursuant to a Consent Agreement and Final Order (“CAFO”) that became effective May 9, 2006, Aluminum Extrusions (i) paid a civil penalty of $30,422 and (ii) is undertaking a supplemental environmental project (“SEP”) in an amount of at least $208,170 (“Minimum SEP Expenditure”). The CAFO requires that the SEP be fully implemented within one year of the CAFO’s effective date. Management believes that the SEP will be completed in a satisfactory and timely manner and that actual SEP expenditures will exceed the Minimum SEP Expenditure. If, however, Aluminum Extrusions fails to complete the SEP satisfactorily or fails to spend at least the Minimum SEP Expenditure, Aluminum Extrusions could be responsible under the CAFO for additional penalties of up to $91,000.
Item 1A. | Risk Factors. There are a number of risks and uncertainties that can have a material effect on the operating results of our businesses and our financial condition. These risk factors include, but are not limited to, the following:
General
| |
There are a number of risks and uncertainties that can have a material effect on the operating results of our businesses and our financial condition. These risk factors include, but are not limited to, the following:
General
•· | Our future performance is influenced by costs incurred by our operating companies including, for example, the cost of energy and raw materials.These costs include, without limitation, the cost of resin (the raw material on which Film Products primarily depends), aluminum (the raw material on which Aluminum Extrusions primarily depends) natural gas (the principal fuel necessary for Aluminum Extrusions’ plants to operate), electricity and diesel fuel. Resin, aluminum and natural gas prices have risen significantly, and may continue to do so in the future. Tredegar attempts to mitigate the effects of increased costs through price increases and contractual pass-through provisions, but there are no assurances that higher prices can effectively be passed through to our customers or that we will be able to offset fully or on a timely basis the effects of higher raw material costs through price increases or pass-through arrangements. Further, there is no assurance that cost control efforts will be sufficient to offset any additional future declines in revenue or increases in energy, raw material or other costs. |
| · | | • | Our substantial international operations subject us to risks of doing business in foreign countries, which could adversely affect our business, financial condition and results of operations. Risks |
| inherent in international operations include the following, by way of example: changes in general economic conditions, potential difficulty enforcing agreements and intellectual property rights, restrictions on foreign trade or investment, restrictions on the repatriation of income, fluctuations in exchange rates, imposition of additional taxes on our foreign income, nationalization of private enterprises and unexpected adverse changes in foreign laws and regulatory requirements. |
Film Products
•· | Film Products is highly dependent on sales associated with one customer, The Procter & Gamble Company (“P&G”). P&G comprised approximately 25% of Tredegar’s net sales in 2005, 27% in 2004 and 29% in 2003. The loss or significant reduction of sales associated with P&G would have a material adverse effect on our business. Other P&G-related factors that could adversely affect our business include, by way of example, (i) failure by P&G to achieve success or maintain share in markets in which P&G sells products containing our materials, (ii) operational decisions by P&G that result in component substitution, inventory reductions and similar changes and (iii) delays in P&G rolling out products utilizing new technologies developed by Tredegar. While we have undertaken efforts to expand our customer base, there can be no assurance that such efforts will be successful, or that they will offset any delay or loss of sales and profits associated with P&G. |
| · | | • | Growth of Film Products depends on our ability to develop and deliver new products at competitive prices, especially in the personal care market. Personal care products are now being made with a variety of new materials and the overall cycle for changing materials has accelerated. While we have substantial technical resources, there can be no assurance that our new products can be brought to market successfully, or if brought to market successfully, at the same level of profitability and market share of replaced films. A shift in customer preferences away from our technologies, our inability to develop and deliver new profitable products, or delayed acceptance of our new products in domestic or foreign markets, could have a material adverse effect on our business. In the long term, growth will depend on our ability to provide innovative materials at a cost that meets our customers’ needs. |
| · | | • | Continued growth in Film Products’Products' sale of high value protective film products is not assured.A shift in our customers’customers' preference to new or different products could have a material adverse effect on our sale of protective films. Similarly, a decline in consumer demand for notebook computers or liquid crystal display (LCD) monitors or a decline in the rate of growth in purchases of LCD televisions could have a significant negative impact on protective film sales. |
| · | | • | Our inability to protect our intellectual property rights or our infringement of the intellectual property rights of others could have a significant adverse impact on Film Products.Film Products operates in a field where our significant customers and competitors have substantial intellectual property portfolios.portfolios. The continued success of this business depends on our ability not only to protect our own technologies and trade secrets, but also to develop and sell new products that do not infringe upon existing patents or threaten existing customer relationships. An unfavorable outcome in any intellectual property litigation or similar proceeding could have a significant adverse impact on Film Products. |
| · | | • | As Film Products expands its personal care business, we have greater credit risk that is inherent in broadening our customer base. |
Aluminum Extrusions
•· | Sales volume and profitability of Aluminum Extrusions is cyclical and highly dependent on economic conditions of end-use markets in the United States and Canada, particularly in the construction, distribution and transportation industries. Our market segments are also subject to seasonal slowdowns during the winter months. Because of the high degree of operating leverage inherent in our operations (generally constant fixed costs until full capacity utilization is achieved), the percentage drop in operating profits in a cyclical downturn will likely exceed the percentage drop in |
| volume. Any benefits associated with cost reductions and productivity improvements may not be sufficient to offset the adverse effects on profitability from pricing and margin pressure and higher bad debts that usually accompany a downturn. In addition, higher energy costs and the appreciation of the U.S. Dollar equivalent value of the Canadian Dollar can further reduce profits unless offset by price increases or cost reductions and productivity improvements. |
In 2004, operating profit from ongoing operations in Aluminum Extrusions increased to $22.6 million from $15.1 million in 2003. The $7.5 million or 50% increase in operating profit on 6.7% volume growth during this period was primarily due to operating leverage and pricing improvements. In 2005, operating profit from ongoing operations in Aluminum Extrusions decreased to $19.3 million (down $3.3 million from 2004 or 14.7%) despite higher selling prices and 1.2% volume growth due to higher energy costs (adverse impact estimated of approximately $7 million) and appreciation of the Canadian Dollar (adverse impact estimated of about $3.5 million).
| · | | | In 2004, operating profit from ongoing operations in Aluminum Extrusions increased to $22.6 million from $15.1 million in 2003. The $7.5 million or 50% increase in operating profit on 6.7% volume growth during this period was primarily due to operating leverage and pricing improvements. In 2005, operating profit from ongoing operations in Aluminum Extrusions decreased to $19.3 million (down $3.3 million from 2004 or 14.7%) despite higher selling prices and 1.2% volume growth due to higher energy costs (adverse impact estimated of approximately $7 million) and appreciation of the Canadian Dollar (adverse impact estimated of about $3.5 million). | | | • | The markets for our products are highly competitive with product quality, service, delivery performance and price being the principal competitive factors. Aluminum Extrusions has around 1,800 customers in a variety of end-use markets within the broad categories of building and construction, distribution, transportation, machinery and equipment, electrical and consumer durables. No single customer exceeds 4% of Aluminum Extrusion’s net sales. Due to the diverse customer mix across many end-use markets, we believe the industry generally tracks the real growth of the overall economy (historical cross-cycle volume growth has been in the 3% range). | | | | During improving economic conditions, excess industry capacity is absorbed and pricing pressure becomes less of a factor in many of our end-use markets. Conversely, during an economic slowdown, excess industry capacity often drives increased pricing pressure in many end-use markets as competitors protect their position with key customers.Because the business is susceptible to these changing economic conditions,Aluminum Extrusions targets complex, customized, service-intensive business with more challenging requirements which is competitively more defensible compared to higher volume, standard extrusion applications. | | | | Foreign imports, primarily from China, represent a growing portion of the North American aluminum extrusion market. Foreign competition to date has been primarily large volume, standard extrusion profiles that impact some of our less strategic end-use markets. Market share erosion in other end-use markets remains possible. | | | | There can be no assurance that we will be able to maintain current margins and profitability. Our continued success and prospects depend on our ability to retain existing customers and participate in overall industry cross-cycle growth. |
During improving economic conditions, excess industry capacity is absorbed and pricing pressure becomes less of a factor in many of our end-use markets. Conversely, during an economic slowdown, excess industry capacity often drives increased pricing pressure in many end-use markets as competitors protect their position with key customers. Because the business is susceptible to these changing economic conditions, Aluminum Extrusions targets complex, customized, service-intensive business with more challenging requirements which is competitively more defensible compared to higher volume, standard extrusion applications.
Foreign imports, primarily from China, represent a growing portion of the North American aluminum extrusion market. Foreign competition to date has been primarily large volume, standard extrusion profiles that impact some of our less strategic end-use markets. Market share erosion in other end-use markets remains possible.
There can be no assurance that we will be able to maintain current margins and profitability. Our continued success and prospects depend on our ability to retain existing customers and participate in overall industry cross-cycle growth.
33
Item 5. | Other Information. |
Effective as of October 1, 2006, the Board of Directors elected, and the Company hired, McAlister C. Marshall, II, as Vice President, General Counsel and Corporate Secretary, with an annual base salary of $250,000. In connection with his hiring, Mr. Marshall received options to purchase 10,000 shares of the Company's common stock, which will become exercisable on October 2, 2008, at an exercise price of $16.31 per share and will expire on October 2, 2013; 2,000 restricted shares of the Company's common stock ($16.31 per share on the date of grant), which will vest on October 2, 2009; and a cash signing bonus of $20,000, which will be repayable to the Company by Mr. Marshall if he voluntarily terminates his employment with the Company before October 3, 2007. Mr. Marshall is not eligible to receive a payment under the Company’s 2006 Annual Incentive Plan.
Item 4.6. | Submission of Matters to a Vote of Security Holders.Exhibits.
|
Exhibit Nos.
| Tredegar’s Annual MeetingForm of Shareholders was held on May 18, 2006. The following sets forth the vote results with respect to eachNotice of the matters voted upon by shareholders at the meeting:
Stock Award and Stock Award Terms and Conditions. |
| | Nominee | Number of
Votes For | | Number of
Votes
Withheld | | Broker
Non-Votes
| | | |
|
| |
| |
| | | | Austin Brockenbrough, III | 32,249,482 | | 4,547,625 | | 80,406 | | | | William M. Gottwald | 32,145,282 | | 4,651,825 | | 80,406 | | | | Richard L. Morrill | 32,246,948 | | 4,550,159 | | 80,406 | |
| | | The term of office for the following directors continued after the annual meeting and such directors were not up for election at the annual meeting: | | | | Horst R. Adam | | Donald T. Cowles | | John D. Gottwald | | Norman A. Scher | | Thomas G. Slater, Jr. | | R. Gregory Williams | | | (b) | Ratification of Appointment of PricewaterhouseCoopers LLP: | | | | Ratification of appointment of PricewaterhouseCoopers LLP as Tredegar’s independent registered public accounting firm for the fiscal year ending December 31, 2006: | | |
| | Number of Votes
For
| | Number of Votes
Against
| | Number of
Abstentions
| | Number of
Broker Non-Votes
| | | |
| |
| |
| |
| | | | 36,005,361 | | 804,860 | | 67,292 | | None | |
| | Item 5. | Other Information.
| | | | None. | | | Item 6. | Exhibits. | | | Exhibit Nos. | | |
| SIGNATURES
Pursuant to the requirements of the Securities Exchange Act of 1934, the Registrant has duly caused this report to be signed on its behalf by the undersigned thereunto duly authorized.
| |
SIGNATURES
Pursuant to the requirements of the Securities Exchange Act of 1934, the Registrant has duly caused this report to be signed on its behalf by the undersigned thereunto duly authorized.
| | | | Tredegar Corporation | | | | | | (Registrant) | | | | | | | | | | | | | | Date: | August 4,November 8, 2006 | | /s/ D. Andrew Edwards | | |
| |
| | | | | D. Andrew Edwards | | | | | | Vice President, Chief Financial Officer and
Treasurer | | | | | | (Principal Financial and Accounting Officer) |
36
|