Washington, D.C. 20549
Commvault Systems, Inc.
Commvault Systems, Inc. and its subsidiaries (“Commvault”("Commvault," "we," "us," or the “Company”"our") is a provider of data and information management software applications and related services. The Company develops, markets and sells a suite of software applications and services, primarily in North America, Europe, Australia and Asia, that provides its customers with data protection solutions supporting all major operating systems, applications, and databases on virtual and physical servers, NAS shares, cloud-based infrastructures, and mobile devices; management through a single console; multiple protection methods including backup and archive, snapshot management, replication, and content indexing for eDiscovery; efficient storage management using deduplication for disk, tape and cloud; integration with the industry's top storage arrays; complete virtual infrastructure management supporting multiple hypervisors; security capabilities to limit access to critical data; policy based data management; and an end-user experience that allows them to protect, find and recover their own data using common tools such as web browsers, Microsoft Outlook and File Explorer. In fiscal 2018 the Company also started selling appliances that integrate the Company's software with hardware and address a wide-range of business needs and use cases, ranging from support for remote or branch offices with limited IT staff up to large corporate data centers. The Company also provides its customers with a broad range of professionalcyber resiliency platform that helps them secure, defend and customer support services.recover their most precious asset, their data. We provide these products and services for their data across the following environments: on-premises, hybrid, and multi-cloud. Our cyber resiliency offerings are delivered via self-managed software, software-as-a-service ("SaaS"), integrated appliances, or managed by partners. Customers use our technology to protect themselves from threats like ransomware and recover their data efficiently.
The preparation of financial statements and related disclosures in conformity with U.S. GAAP requires management to make judgments and estimates that affect the amounts reported in the Company’sour consolidated financial statements and the accompanying notes. The Company bases itsWe base our estimates and judgments on historical experience and on various other assumptions that it believeswe believe are reasonable under the circumstances. The amounts of assets and liabilities reported in the Company’sour balance sheets and the amounts of revenues and expenses reported for each of itsour periods presented are affected by estimates and assumptions, which are used for, but not limited to, the accounting for revenue recognition, income taxes and related reserves, stock-based compensationdeferred commissions and accounting for research and development costs.goodwill. Actual results could differ from those estimates.
|
| | | | | | | | | | | |
| | Three Months Ended December 31, 2016 |
| | Unaudited |
| | As Reported | | Adjustments | | Adjusted for Adoption of ASC 606 |
| Revenues: | | | | | |
| Software and products | $ | 77,322 |
| | $ | 1,333 |
| | $ | 78,655 |
|
| Services | 88,519 |
| | (113 | ) | | 88,406 |
|
| Total revenues | 165,841 |
| | 1,220 |
| | 167,061 |
|
| Total cost of revenues | 21,166 |
| | — |
| | 21,166 |
|
| Gross margin | 144,675 |
| | 1,220 |
| | 145,895 |
|
| Total operating expenses | 143,433 |
| | (1,380 | ) | | 142,053 |
|
| Income from operations | 1,242 |
| | 2,600 |
| | 3,842 |
|
| Interest expense | (233 | ) | | — |
| | (233 | ) |
| Interest income | 312 |
| | — |
| | 312 |
|
| Equity in loss of affiliate | (300 | ) | | — |
| | (300 | ) |
| Income before income taxes | 1,021 |
| | 2,600 |
| | 3,621 |
|
| Income tax expense | 1,063 |
| | 599 |
| | 1,662 |
|
| Net income (loss) | $ | (42 | ) | | $ | 2,001 |
| | $ | 1,959 |
|
Commvault Systems, IncInc.
Notes to Consolidated Financial Statements - Unaudited (continued)
(In thousands, except per share data)
Concentration of Credit Risk
We grant credit to customers in a wide variety of industries worldwide and generally do not require collateral. Historically, credit losses relating to these customers have been minimal. |
| | | | | | | | | | | |
| | Nine Months Ended December 31, 2016 |
| | Unaudited |
| | As Reported | | Adjustments | | Adjusted for Adoption of ASC 606 |
| Revenues: | | | | | |
| Software and products | $ | 211,716 |
| | $ | 757 |
| | $ | 212,473 |
|
| Services | 265,871 |
| | (71 | ) | | 265,800 |
|
| Total revenues | 477,587 |
| | 686 |
| | 478,273 |
|
| Total cost of revenues | 63,818 |
| | — |
| | 63,818 |
|
| Gross margin | 413,769 |
| | 686 |
| | 414,455 |
|
| Total operating expenses | 415,832 |
| | (1,933 | ) | | 413,899 |
|
| Income (loss) from operations | (2,063 | ) | | 2,619 |
| | 556 |
|
| Interest expense | (724 | ) | | — |
| | (724 | ) |
| Interest income | 843 |
| | — |
| | 843 |
|
| Equity in loss of affiliate | (544 | ) | | — |
| | (544 | ) |
| Income (loss) before income taxes | (2,488 | ) | | 2,619 |
| | 131 |
|
| Income tax expense | 160 |
| | 676 |
| | 836 |
|
| Net income (loss) | $ | (2,648 | ) | | $ | 1,943 |
| | $ | (705 | ) |
|
| | | | | | | | | | | |
| | March 31, 2017 |
| | Unaudited Balance Sheet Data |
| | As Reported | | Adjustments | | Adjusted for Adoption of ASC 606 |
| Current assets: | | | | | |
| Trade accounts receivable | $ | 132,761 |
| | $ | 7,323 |
| | $ | 140,084 |
|
| Total current assets | $ | 598,736 |
| | $ | 7,323 |
| | $ | 606,059 |
|
| Deferred tax assets, net | $ | 61,018 |
| | $ | (10,790 | ) | | $ | 50,228 |
|
| Deferred commissions | $ | — |
| | $ | 30,378 |
| | $ | 30,378 |
|
| Total assets | $ | 802,967 |
| | $ | 26,911 |
| | $ | 829,878 |
|
| Current Liabilities: | | | | | |
| Deferred revenue | $ | 206,777 |
| | $ | 2,322 |
| | $ | 209,099 |
|
| Total current liabilities | $ | 285,595 |
| | $ | 2,322 |
| | $ | 287,917 |
|
| Other liabilities | $ | 3,934 |
| | $ | 292 |
| | $ | 4,226 |
|
| Accumulated deficit | $ | (239,974 | ) | | $ | 24,297 |
| | $ | (215,677 | ) |
| Total stockholders’ equity | $ | 442,635 |
| | $ | 24,297 |
| | $ | 466,932 |
|
| Total liabilities and stockholders’ equity | $ | 802,967 |
| | $ | 26,911 |
| | $ | 829,878 |
|
Share-Based Compensation
In March 2016,Sales through our distribution agreement with Arrow Enterprise Computing Solutions, Inc. (“Arrow”) totaled 35% and 38% of total revenues for the FASB issued ASU No. 2016-09, Improvements to Employee Share-Based Payment Accounting (Topic 718), which simplifies the accountingthree months ended December 31, 2023 and 2022, respectively, and 36% and 37% for share-based payment transactions, including related accounting for income taxes, forfeitures, and classification in the statement of cash flows. The Company adopted the guidance prospectively effective April 1, 2017.
Commvault Systems, Inc
Notes to Consolidated Financial Statements - Unaudited (continued)
(In thousands, except per share data)
The guidance requires excess tax benefits and tax deficiencies to be recorded as income tax benefit or expense in the statement of income when the awards vest or are settled, and eliminates the requirement to reclassify cash flows related to excess tax benefits from operating activities to financing activities on the statement of cash flows. In the nine months ended December 31, 2017, the Company recognized $7,8842023 and 2022, respectively. Arrow accounted for approximately 31% and 34% of such excess tax benefits,total accounts receivable as of December 31, 2023 and pursuantMarch 31, 2023, respectively.
Fair Value of Financial Instruments
The carrying amounts of our cash, cash equivalents, accounts receivable and accounts payable approximate their fair values due to the adopted guidance,short-term maturity of these instruments. Our cash equivalents balance consists primarily of U.S. Treasury Bills with maturities of one month or less.
The following table summarizes the composition of our financial assets measured at fair value at December 31, 2023:
| | | | | | | | | | | | | | | | | | | | | | | |
| Level 1 | | Level 2 | | Level 3 | | Total |
| Cash equivalents | $ | 24,903 | | | — | | | — | | | $ | 24,903 | |
There were no financial assets measured at fair value on a recurring basis as of December 31, 2022.
Equity Securities Accounted for at Net Asset Value
We held equity interests in private equity funds of $7,154 as of December 31, 2023, which are accounted for under the net loss decreased by $7,884, or $0.17 per basic and diluted share. Amounts previously recorded to Additional paid-in capital related to excess tax benefits prior to April 1, 2017 remain in Stockholders' equity. Cash flows related to excess taxes prior to April 1, 2017 remain classifiedasset value practical expedient as financing cash flows. In addition, the standard allows the Company to repurchase more of an employee’s vesting shares for tax withholding purposes without triggering liability accounting, and provides an accounting policy election to account for forfeitures as they occur. The Company has elected to account for forfeitures as they occur. The cumulative impact of the election to account for forfeitures as they are incurred is included as an adjustment to accumulated deficit.
Leases
In February 2016, the FASB issued ASU 2016-02 “Leases (Topic 842)” (“ASU 2016-02”)permitted under ASC 820, Fair Value Measurement. Under ASU 2016-02, a lessee will recognize in the balance sheet a liability to make lease payments (the lease liability) and a right-to-use asset representing its right to use the underlying asset for the lease term. The amendments of this ASU are effective for the Company's fiscal 2020, with early adoption permitted. The Company is currently assessing the impact the adoption of ASU 2016-02 will have on the financial statements.
Trade and Other Receivables
Trade and other receivables are primarily comprised of trade receivables that are recorded at the invoice amount, net of an allowance for doubtful accounts, which is not material. Unbilled receivables represent amounts for which revenue has been recognized but which have not yet been invoiced to the customer. The current portion of unbilled receivables is included in Trade accounts receivable on the consolidated balance sheet. Long term unbilled receivablesThese investments are included in Other assets.
Sales Tax
other assets in the accompanying consolidated balance sheets. The Company records revenue net asset values of sales tax.
Shippingthese investments are determined using quarterly capital statements from the funds, which are based on our contributions to the funds, allocation of profit and Handling Costs
Shippingloss and handling costschanges in fair value of the underlying fund investments. Changes in fair value as reported on the capital statements are includedrecorded through the consolidated statements of operations as non-operating income or expense. These private equity funds focus on making investments in costkey technology sectors, principally by investing in companies at expansion capital and growth equity stages. We had total unfunded commitments in private equity funds of revenues for all periods presented$3,010 as of December 31, 2023.
Deferred Commissions Cost
Sales commissions, bonuses, and related payroll taxes earned by the Company'sour employees are considered incremental and recoverable costs of obtaining a contract with a customer. The Company’sOur typical contracts include performance obligations related to term-based software licenses, SaaS offerings, perpetual software licenses, software updates, and customer support and other professional services.support. In these contracts, incremental costs of obtaining a contract are allocated to the performance obligations based on the relative estimated standalone selling prices and then recognized on a systematic basis that is consistent with the transfer of the goods or services to which the asset relates. The Company doesWe do not pay commissions on annual renewals of contracts for software updates and customer support contracts for perpetual licenses. The costs allocated to software and products are expensed at the time of sale, when revenue for the functional software license or appliance is recognized. The costs allocated to software updates and customer support for perpetual licenses are amortized ratably over a period of approximately five years, the expected period of benefit of the asset capitalized. The CompanyWe currently estimatesestimate a period of five years is appropriate based on consideration of historical average customer life and the estimated useful life of the underlying software or appliance sold as part of the transaction. The commission paid on the renewal of subscription arrangements is not commensurate with the commission paid on the initial purchase. As a result, the cost of commissions allocated to SaaS offerings, software updates and customer support on the initial term-based software license transactions are amortized over a period of approximately five years, consistent with the accounting for these costs associated with perpetual licenses. The costs of commissions allocated to SaaS offerings, software updates and support for the renewal of term-based software licenses is limited to the contractual period of the arrangement, as we pay a commensurate renewal commission upon the next renewal of the subscription software license and related updates and support.
Commvault Systems, Inc.
Notes to Consolidated Financial Statements - Unaudited (continued)
(In thousands, except per share data)
The incremental costs attributable to professional services are generally amortized within one quarter following the date of the related software or appliance sale, which is typicallyover the period the related professional services are provided and revenue is recognized. Amortization expense related to these costs is included in Salessales and marketing expenses in the accompanying condensed consolidated statements of loss.operations.
Costs related to software updates and support for term-based, or subscription software licenses, are limited to the contractual period of the arrangement as the Company intends to pay a commensurate commission upon renewal of the subscription license and related updates and support.
Commvault Systems, Inc
Notes to Consolidated Financial Statements - Unaudited (continued)
(In thousands, except per share data)
Deferred Revenue
Deferred revenues represent amounts collected from, or invoiced to, customers in excess of revenues recognized. This results primarily from the billing of annual customer support agreements, and billings for other professional services fees that have not yet been performed by the Company. The value of deferred revenues will increase or decrease based on the timing of invoices and recognition of revenue.
Related Party Transactions
During the first quarter of fiscal 2018, one of our Directors, Joseph F. Eazor, was hired as the CEO of Rackspace, Inc ("Rackspace"). Prior to his appointment as CEO, the Company completed the sale of $4,212 of software and related services to Rackspace. Total recognized revenue related to Rackspace in the first nine months of fiscal 2018 was $4,950. The outstanding accounts receivable from this customer as of December 31, 2017 is $1,910.
Concentration of Credit Risk
The Company grants credit to customers in a wide variety of industries worldwide and generally does not require collateral. Credit losses relating to these customers have been minimal.
Sales through the Company’s distribution agreement with Arrow Enterprise Computing Solutions, Inc. (“Arrow”) totaled approximately 37% of total revenues for the nine months ended December 31, 2017 and 2016. Arrow accounted for approximately 40% of total accounts receivable as of both December 31, 2017 and March 31, 2017.
Fair Value of Financial Instruments
The carrying amounts of the Company’s cash and cash equivalents, accounts receivable and accounts payable approximate their fair values due to the short-term maturity of these instruments. The Company’s cash equivalents balance consists primarily of money market funds. The Company’s short-term investments balance consists of U.S. Treasury Bills with maturities of one year or less. The Company accounts for its short-term investments as held to maturity.
Fair value is defined as the exchange price that would be received for an asset or paid to transfer a liability (an exit price) in the principal or most advantageous market for such asset or liability in an orderly transaction between market participants on the measurement date. Valuation techniques used to measure fair value should maximize the use of observable inputs and minimize the use of unobservable inputs. To measure fair value, the Company uses the following fair value hierarchy based on three levels of inputs, of which the first two are considered observable and the last unobservable:
Level 1 – Quoted prices in active markets for identical assets or liabilities.
Level 2 – Inputs other than Level 1 that are observable for the asset or liability, either directly or indirectly, such as quoted prices for similar assets and liabilities in active markets; quoted prices for identical or similar assets or liabilities in markets that are not active; or other inputs that are observable or can be corroborated by observable market data by correlation or other means.
Level 3 – Unobservable inputs that are supported by little or no market activity and that are significant to the fair value of the assets or liabilities.
The following table summarizes the composition of the Company’s financial assets measured at fair value at December 31, 2017 and March 31, 2017:
|
| | | | | | | | | | | | | | |
| December 31, 2017 | | Level 1 | | Level 2 | | Level 3 | | Total |
| Cash equivalents | | $ | 41,672 |
| | — |
| | — |
| | $ | 41,672 |
|
| Short-term investments | | $ | — |
| | 131,457 |
| | — |
| | $ | 131,457 |
|
|
| | | | | | | | | | | | | | |
| March 31, 2017 | | Level 1 | | Level 2 | | Level 3 | | Total |
| Cash equivalents | | $ | 70,190 |
| | — |
| | — |
| | $ | 70,190 |
|
| Short-term investments | | $ | — |
| | 120,989 |
| | — |
| | $ | 120,989 |
|
Commvault Systems, Inc
Notes to Consolidated Financial Statements - Unaudited (continued)
(In thousands, except per share data)
Income Taxes
The Company accounts for income taxes in accordance with ASC Topic 740, “Income Taxes” (“ASC 740”). The provision for income taxes and effective tax rates are calculated by legal entity and jurisdiction and are based on a number of factors, including the level of pre-tax earnings, income tax planning strategies, differences between tax laws and accounting rules, statutory tax rates and credits, uncertain tax positions and valuation allowances. The Company uses significant judgment and estimates in evaluating tax positions. The effective tax rate in a given financial statement period may be materially impacted by changes in the mix and level of earnings by taxing jurisdiction.
Under ASC 740, deferred income taxes arise from temporary differences between the tax basis of assets and liabilities and their reported amounts. Valuation allowances are established when, in the Company's judgment, it is more likely than not that deferred tax assets will not be realized. In assessing the need for a valuation allowance, the Company weighs the available positive and negative evidence, including historical levels of pre-tax income, legislative developments, expectations and risks associated with estimates of future pre-tax income, and prudent and feasible tax planning strategies.
3. Revenue
The Company accounts for revenue in accordance with ASC Topic 606, Revenue from Contracts with Customers, which was adopted on April 1, 2017, using the full retrospective method.
The Company derivesWe derive revenues from two primary sources:various sources, including subscriptions, perpetual software licenses, customer support contracts and other services.
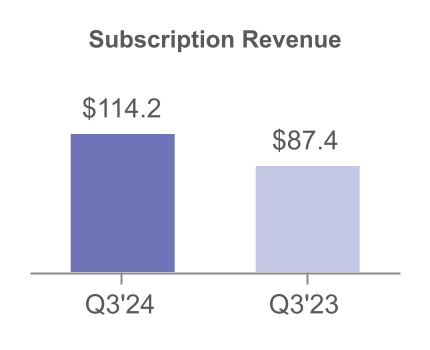
Subscription
Subscription includes the revenues derived from time-based arrangements, including the software portion of term-based licenses and SaaS offerings. The software component of term-based licenses is typically recognized when the software is delivered or made available for download. The term of our subscription arrangements is typically one to three years, but can range between one and five years. For SaaS offerings, revenue is generally recognized ratably over the contract term beginning on the date that the service is made available to the customer.
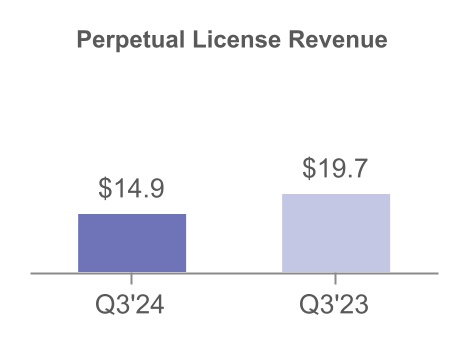
Perpetual License
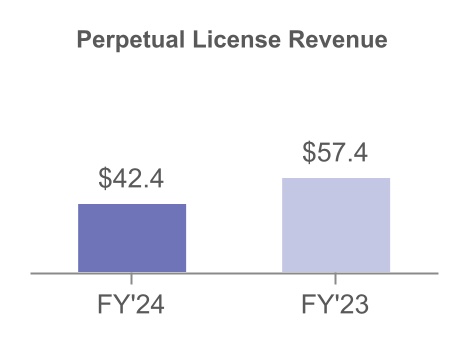
Perpetual license includes the revenues from the sale of perpetual software licenses. Perpetual software license revenue is typically recognized when the software is delivered or made available for download.
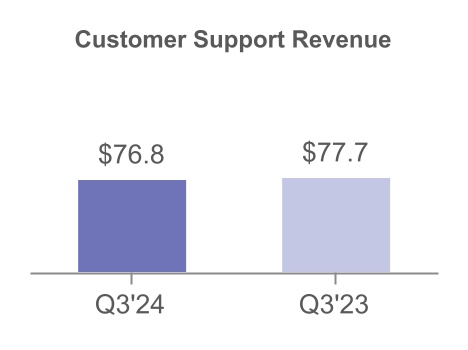
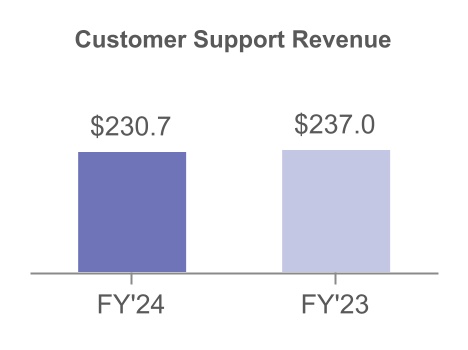
Customer Support
Customer support includes revenues associated with support contracts tied to our software products. Customer support includes software updates on a when-and-if-available basis, telephone support, integrated web-based support, and other premium support offerings, for both subscription software and products, and services. Software and products revenue includes the Company'sperpetual software and integrated appliances that combine the Company's software with hardware. Services includelicense arrangements. We sell our customer support (software updatescontracts as a percentage of net software purchases. Customer support revenue is recognized ratably over the term of the customer support agreement, which is typically one year on our perpetual licenses and technical support), consulting,over the term on our term-based licenses.
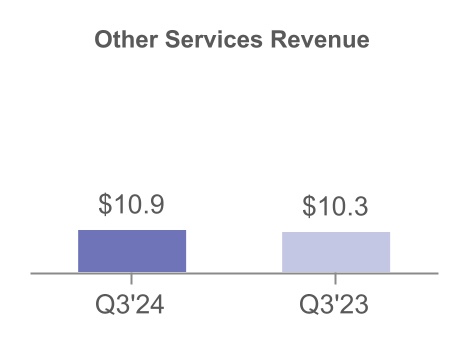
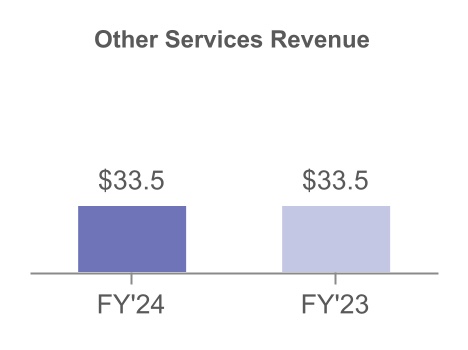
Other Services
Other services consist primarily of revenues related to professional service offerings, including consultation, assessment and design, services, installation services, and customer education. A typical contract includes both licenses and services.Revenues related to other professional services are typically recognized as the services are performed.
The Company’sWe do not customize our software licenses typically provide for a(both perpetual right to use the Company’s software. The Company also sells term-based software licenses that expire, which are referred to as subscription arrangements. The Company does not customize its softwareand term-based) and installation services are not required. The software isSoftware licenses are delivered before related services are provided and isare functional without professional services, updates and technical support. The Company hasWe have concluded that itsour software license islicenses (both perpetual and term-based) are functional intellectual property that is distinct, as the user can benefit from the software on its own. Software revenue isRevenues for both perpetual and term-based licenses are typically recognized when the software is delivered and/or made available for download as this is the point the user of the software can direct the use of, and obtain substantially all of the remaining benefits from the functional intellectual property. The Company doesWe do not recognize softwaresubscription revenue related to the renewal of that subscription software licenses earlier than the beginning of the new subscription period.
In fiscal 2018, the CompanyWe also started sellingoffer appliances that integrate the Company'sour software with hardware and address a wide-range of business needs and use cases, ranging from support for remote or branch offices with limited IT staff up to large corporate data centers. RevenueOur appliances are almost exclusively sold via a software only model in which we sell software to a third party, which assembles an integrated appliance that is sold to end user customers. As a result, the revenues and costs associated with hardware are usually not included in our financial statements.
Commvault Systems, Inc.
Notes to Consolidated Financial Statements - Unaudited (continued)
(In thousands, except per share data)
Our typical performance obligations include the following:
| | | | | | | | | | | |
| Performance Obligation | When Performance Obligation
is Typically Satisfied | When Payment is
Typically Due | How Standalone Selling Price is
Typically Estimated |
| Subscription |
| Term-based software licenses | Upon shipment or made available for download (point in time) | Within 90 days of shipment except for certain subscription licenses which are paid for over time | Residual approach |
| Software-as-a-service (SaaS) | Ratably over the course of the contract (over time) | Annually or at the beginning of the contract period | Observable in transactions without multiple performance obligations |
| Perpetual License |
| Perpetual software licenses | Upon shipment or made available for download (point in time) | Within 90 days of shipment | Residual approach |
| Customer Support |
| Software updates | Ratably over the course of the support contract (over time) | At the beginning of the contract period | Observable in renewal transactions |
| Customer support | Ratably over the course of the support contract (over time) | At the beginning of the contract period | Observable in renewal transactions |
| Other Services |
| Other professional services (except for education services) | As work is performed (over time) | Within 90 days of services being performed | Observable in transactions without multiple performance obligations |
| Education services | When the class is taught (point in time) | Within 90 days of services being performed | Observable in transactions without multiple performance obligations |
Judgments related to appliances is recognized when control of the appliances passes to the customer; typically upon delivery. Revenue to date related to appliances has not been significant.
Services revenue includes revenue from customer support and other professional services. Customer support includes software updates on a when-and-if-available basis, telephone support, integrated web-based support and bug fixes or patches. The Company sells its customer support contracts as a percentage of net software purchases the support is related to. Customer support revenue is recognized ratably over the term of the customer support agreement, which is typically one year.
The Company’s other professional services include consulting, assessment and design services, installation services and customer education. Customer education services include courses taught by the Company’s instructors or third-party contractors. Revenue related to other professional services and customer education services is typically recognized as the services are performed.
recognition
Most of the Company’sour contracts with customers contain multiple performance obligations. For these contracts, the Company accountswe evaluate and account for individual performance obligations separately if they are determined to be distinct. The transaction price is allocated to the separate performance obligations on a relative standalone selling price basis. Standalone selling prices of software licenses (both perpetual and appliancesterm-based) are typically estimated using the residual approach. Standalone selling prices offor SaaS, customer support contracts, and other services are typically estimated based on observable transactions when these services are sold on a standalone basis. We recognize revenue net of sales tax.
Disaggregation of Revenues
We disaggregate revenues from contracts with customers into geographical regions. Our Americas region includes the United States, Canada, and Latin America. Our International region primarily includes Europe, Middle East, Africa, Australia, India, Southeast Asia, and China.
| | | | | | | | | | | | | | | | | | | | | | | |
| Three Months Ended December 31, | | Nine Months Ended December 31, |
| 2023 | | 2022 | | 2023 | | 2022 |
| Americas | $ | 125,052 | | | $ | 108,107 | | | $ | 367,476 | | | $ | 346,907 | |
| International | 91,756 | | | 86,967 | | | 248,479 | | | 234,205 | |
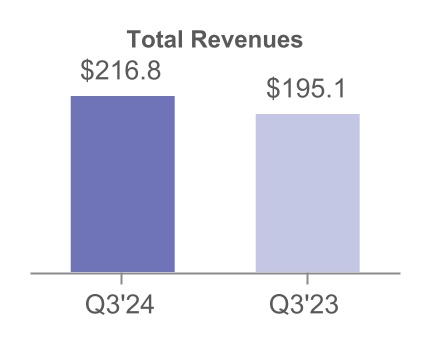
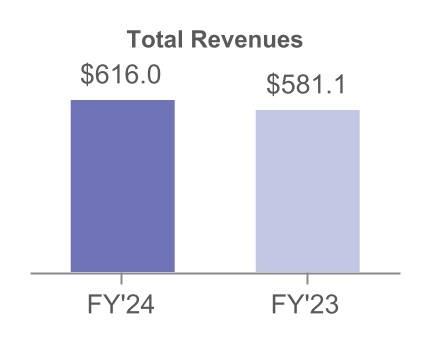
| Total revenues | $ | 216,808 | | | $ | 195,074 | | | $ | 615,955 | | | $ | 581,112 | |
Commvault Systems, IncInc.
Notes to Consolidated Financial Statements - Unaudited (continued)
(In thousands, except per share data)
Remaining Performance Obligations
Remaining performance obligations represent expected future revenues from existing contracts where performance obligations are unsatisfied or partially unsatisfied at the end of the reporting period. As of December 31, 2023, our remaining performance obligations (inclusive of deferred revenues) were $581,346 of which approximately 64% is expected to be recognized as revenue over the next 12 months and the remainder recognized thereafter. The vast majority of these revenues consist of customer support, other services and SaaS arrangements. Other services consists primarily of professional services revenue which is contingent upon a number of factors, including customers' needs and scheduling.
The Company’s typicalamount of revenue recognized in the period that was included in the opening deferred revenue balance was $70,164 and $263,529 for the three and nine months ended December 31, 2023, respectively. The amount of revenue recognized from performance obligations include the following:satisfied in prior periods was not significant.
|
| | | |
Performance Obligation | When Performance Obligation
is Typically Satisfied
| When Payment is
Typically Due
| How Standalone Selling Price is
Typically Estimated
|
Software and Products Revenue |
Software Licenses | Upon shipment or made available for download (point in time) | Within 90 days of shipment except for certain subscription licenses which are paid for over time | Residual approach |
Appliances | When control of the appliances passes to the customer; typically upon delivery | Within 90 days of delivery except for certain subscriptions which are paid for over time | Residual approach |
Customer Support Revenue |
Software Updates | Ratably over the course of the support contract (over time) | At the beginning of the contract period | Observable in renewal transactions |
Customer Support | Ratably over the course of the support contract (over time) | At the beginning of the contract period | Observable in renewal transactions |
Professional Services |
Other Professional Services (except for education services) | As work is performed (over time) | Within 90 days of services being performed | Observable in transactions without multiple performance obligations |
Education Services | When the class is taught (point in time) | Within 90 days of services being performed | Observable in transactions without multiple performance obligations |
Disaggregation of Revenue
The Company disaggregates revenue from contracts with customers into the nature of the products and services and geographical regions. The geographic regions that are tracked are the Americas (United States, Canada, Latin America), EMEA (Europe, Middle East, Africa) and APAC (Australia, New Zealand, Southeast Asia, China). The Company operates in one segment.
|
| | | | | | | | | | | | |
| | Three Months Ended December 31, 2017 |
| | Americas | EMEA | APAC | Total |
| Software and Products Revenue | $ | 40,783 |
| $ | 29,472 |
| $ | 11,188 |
| $ | 81,443 |
|
| Customer Support Revenue | 59,225 |
| 19,478 |
| 9,151 |
| 87,854 |
|
| Professional Services | 6,287 |
| 2,944 |
| 1,838 |
| 11,069 |
|
| Total Revenue | $ | 106,295 |
| $ | 51,894 |
| $ | 22,177 |
| $ | 180,366 |
|
|
| | | | | | | | | | | | |
| | Three Months Ended December 31, 2016 |
| | Americas | EMEA | APAC | Total |
| Software and Products Revenue | $ | 41,804 |
| $ | 26,228 |
| $ | 10,623 |
| $ | 78,655 |
|
| Customer Support Revenue | 54,738 |
| 16,323 |
| 8,079 |
| 79,140 |
|
| Professional Services | 5,385 |
| 2,574 |
| 1,307 |
| 9,266 |
|
| Total Revenue | $ | 101,927 |
| $ | 45,125 |
| $ | 20,009 |
| $ | 167,061 |
|
Commvault Systems, Inc
Notes to Consolidated Financial Statements - Unaudited (continued)
(In thousands, except per share data)
|
| | | | | | | | | | | | |
| | Nine Months Ended December 31, 2017 |
| | Americas | EMEA | APAC | Total |
| Software and Products Revenue | $ | 121,498 |
| $ | 74,293 |
| $ | 32,433 |
| $ | 228,224 |
|
| Customer Support Revenue | 173,619 |
| 55,214 |
| 26,688 |
| 255,521 |
|
| Professional Services | 17,113 |
| 8,248 |
| 5,372 |
| 30,733 |
|
| Total Revenue | $ | 312,230 |
| $ | 137,755 |
| $ | 64,493 |
| $ | 514,478 |
|
|
| | | | | | | | | | | | |
| | Nine Months Ended December 31, 2016 |
| | Americas | EMEA | APAC | Total |
| Software and Products Revenue | $ | 121,527 |
| $ | 61,014 |
| $ | 29,932 |
| $ | 212,473 |
|
| Customer Support Revenue | 162,223 |
| 49,385 |
| 24,237 |
| 235,845 |
|
| Professional Services | 17,770 |
| 8,143 |
| 4,042 |
| 29,955 |
|
| Total Revenue | $ | 301,520 |
| $ | 118,542 |
| $ | 58,211 |
| $ | 478,273 |
|
Information about Contract Balances
Amounts collected in advance of services being provided are accounted for as deferred revenue. Nearly all of the Company'sour deferred revenue balance is related to services revenue, primarily customer support, contracts.SaaS arrangements, and other services.
In some arrangements the Company allowswe allow customers to pay for term basedterm-based software licenses and products over the term of the software license. The Company refers to these as subscription transactions. Amounts recognized as revenue in excess of amounts billed are recorded as unbilled receivables. Unbilled receivables, which are anticipated to be invoiced in the next twelve months, are included in Accountsaccounts receivable on the consolidated balance sheet. Long termsheets. Long-term unbilled receivables are included in Otherother assets. The opening and closing balances of the Company’sour accounts receivable, unbilled receivables, and deferred revenues are as follows:
| | | | | | | | | | | | | | | | | |
| Accounts receivable | Unbilled receivable
(current) | Unbilled receivable
(long-term) | Deferred revenue (current) | Deferred revenue (long-term) |
| Opening balance as of March 31, 2023 | $ | 188,736 | | $ | 21,705 | | $ | 9,867 | | $ | 307,562 | | $ | 174,393 | |
| Increase | 8,829 | | 4,440 | | 5,026 | | 17,938 | | 9,858 | |
| Ending balance as of December 31, 2023 | $ | 197,565 | | $ | 26,145 | | $ | 14,893 | | $ | 325,500 | | $ | 184,251 | |
|
| | | | | | | | | | | | | | | |
| | Accounts Receivable | Unbilled Receivable (current) | Unbilled Receivable (long-term) | Deferred Revenue (current) | Deferred Revenue (long-term) |
| Opening Balance as of March 31, 2017 | $ | 132,711 |
| $ | 7,373 |
| $ | — |
| $ | 209,099 |
| $ | 70,803 |
|
| Increase/(decrease), net | 8,750 |
| (2,084 | ) | 1,419 |
| 18,433 |
| 9,232 |
|
| Ending Balance as of December 31, 2017 | $ | 141,461 |
| $ | 5,289 |
| $ | 1,419 |
| $ | 227,532 |
| $ | 80,035 |
|
The increase in accounts receivable (inclusive of unbilled receivables) is primarily a result of an increase in software and products revenuerevenues relative to the fourth quarter of the prior fiscal year. The increase in deferred revenue is primarily the result of an increase in deferred customer support revenueSaaS contracts which are billed upfront but recognized ratably over the contract period, partially offset by a decrease in professional service contracts.
4. Assets Held for Sale
During the fourth quarter of fiscal 2023, we entered into an exclusive agreement to sell our owned corporate headquarters in Tinton Falls, New Jersey for $40,000 in cash consideration and determined the assets and land related to softwareheadquarters met the criteria for classification as assets held for sale in accordance with ASC 360, Impairment and products revenue transactions and customer support renewals during the first nine monthsDisposal of fiscal 2018, most of which will be recognized over the courseLong-Lived Assets ("ASC 360"). The property's estimated fair value, less estimated costs to sell, is $38,680. Upon closing of the next twelve months.
The amount of revenue recognized in the period that was included in the opening deferred revenue balance was $86,756 and $248,352transaction, we will enter into a lease for the three and nine months ended December 31, 2017, respectively. The vast majority of this revenue consists of customer support arrangements. The amount of revenue recognized from performance obligations satisfied in prior periods was not material.
Remaining Performance Obligations
In addition to the amounts included in deferred revenue as of December 31, 2017, approximately $18,658 of revenue may be recognized from remaining performance obligations, of which $736 was related to software and products. The Company expects the software and products revenue to be recognized next quarter. The majoritya portion of the services revenue is related to other professional services which may be recognized over the next twelve months but is contingent upon a number of factors, including customers’ needs and schedules.premises.
Commvault Systems, IncInc.
Notes to Consolidated Financial Statements - Unaudited (continued)
(In thousands, except per share data)
Subsequent Event
4. PropertyAs of January 31, 2024, the sale of our owned corporate headquarters has not yet been finalized and Equipment
Property and equipment consistthe exclusivity of the following:
|
| | | | | | | | |
| | | December 31, | | March 31, |
| | | 2017 | | 2017 |
| Land | | $ | 9,445 |
| | $ | 9,445 |
|
| Buildings | | 103,244 |
| | 103,244 |
|
| Computers, servers and other equipment | | 38,412 |
| | 35,274 |
|
| Furniture and fixtures | | 15,656 |
| | 14,912 |
|
| Leasehold improvements | | 9,254 |
| | 7,040 |
|
| Purchased software | | 1,494 |
| | 1,335 |
|
| Construction in process | | 749 |
| | 1,147 |
|
| | | 178,254 |
| | 172,397 |
|
| Less: Accumulated depreciation and amortization | | (48,622 | ) | | (40,078 | ) |
| | | $ | 129,632 |
| | $ | 132,319 |
|
The Company recorded depreciationBoard of Directors reconfirmed their approval of the sale at the January 2024 meeting and amortization expensewe believe the sale will be completed in calendar year 2024. All of $8,257the held for sale criteria are still met, and $7,384 for the nine months ended December 31, 2017assets are properly classified as such on the consolidated balance sheets.
Additionally, we have assessed whether there are any indicators of impairment and 2016, respectively.have concluded that the current carrying amount represents the estimated fair value, less estimated costs to sell, and no additional remeasurement should be recorded.
5. Net Income (Loss) per Common Share
Basic net income (loss) per common share is computed by dividing net income (loss) by the weighted average number of common shares during the period. Diluted net income (loss) per share is computed using the weighted average number of common shares and, if dilutive, potential common shares outstanding during the period. Potential common shares consist of the incremental common shares issuable upon the exercise of stock options, vesting of restricted stock units, and shares to be purchased under the Employee Stock Purchase Plan.Plan ("ESPP"), and the exercise of stock options. The dilutive effect of such potential common shares is reflected in diluted earnings per share by application of the treasury stock method.
The following table sets forth the reconciliation of basic and diluted net income (loss) per common share:
| | | | | | | | | | | | | | | | | | | | | | | | | | |
| | Three Months Ended December 31, | | Nine Months Ended December 31, |
| | 2023 | | 2022 | | 2023 | | 2022 |
| Net income (loss) | | $ | 17,140 | | | $ | (310) | | | $ | 42,786 | | | $ | 7,719 | |
| Basic net income (loss) per common share: | | | | | | | | |
| Basic weighted average shares outstanding | | 43,862 | | | 44,712 | | | 43,956 | | | 44,738 | |
| Basic net income (loss) per common share | | $ | 0.39 | | | $ | (0.01) | | | $ | 0.97 | | | $ | 0.17 | |
| Diluted net income (loss) per common share: | | | | | | | | |
| Basic weighted average shares outstanding | | 43,862 | | | 44,712 | | | 43,956 | | | 44,738 | |
| Dilutive effect of stock options and restricted stock units | | 937 | | | — | | | 1,064 | | | 1,072 | |
| Diluted weighted average shares outstanding | | 44,799 | | | 44,712 | | | 45,020 | | | 45,810 | |
| Diluted net income (loss) per common share | | $ | 0.38 | | | $ | (0.01) | | | $ | 0.95 | | | $ | 0.17 | |
| | | | | | | | |
The diluted weighted average shares outstanding exclude outstanding stock options, restricted stock units, performance stock options, performance restricted stock units, and shares to be purchased under the employeeESPP and outstanding stock purchase planoptions totaling approximately 7,247121 and 1,8793,921 for the three months ended December 31, 20172023 and 20162022, respectively, and 7,398505 and 8,346674 for the nine months ended December 31, 20172023 and 2016,2022, respectively, because the effect would have been anti-dilutive.
6. Commitments and Contingencies
We do not believe that we are currently party to any pending legal action that could reasonably be expected to have a material adverse effect on our business or operating results.
Commvault Systems, IncInc.
Notes to Consolidated Financial Statements - Unaudited (continued)
(In thousands, except per share data)
7. Capitalization
6. CommitmentsOur stock repurchase program has been funded by our existing cash and Contingencies
In the normal course of its business, the Company may be involved in various claims, negotiations and legal actions.
On September 10, 2014, a purported class action complaint was filed in the United States District Court for the District of New Jersey against the Company, its Chief Executive Officer and its Chief Financial Officer. The case is captioned In re Commvault Systems, Inc. Securities Litigation (Master File No. 3:14-cv-05628-MAS-LHG). The suit alleges that the Company made materially false and misleading statements, or failed to disclose material facts, regarding the Company's financial results, business, operations and prospects in violation of Sections 10(b) and 20(a) of the Securities Exchange Act of 1934 and Rule 10b-5 promulgated thereunder. The suit is purportedly brought on behalf of purchasers of the Company's common stock during the period from May 7, 2013 through April 24, 2014, and seeks compensatory damages, costs and expenses,cash equivalent balances, as well as equitablecash flows provided by our operations.
On April 20, 2023, the Board of Directors (the "Board") approved an increase of the existing share repurchase program so that $250,000 was available. The Board's authorization has no expiration date. For the nine months ended December 31, 2023, we repurchased $133,655 of our common stock, or other relief. Lead plaintiff,approximately 1,932 shares. The remaining amount available under the Arkansas Teachers Retirement System,current authorization as of December 31, 2023 was appointed on January 12, 2015,$122,311.
8. Stock Plans
The following table presents the stock-based compensation expense included in cost of revenues, sales and on March 18, 2015, an amended complaint was filed bymarketing, research and development, general and administrative and restructuring expenses for the plaintiffs. Onthree and nine months ended December 17, 2015, the defendant’s motion31, 2023 and 2022. Stock-based compensation is attributable to dismiss the case was grantedrestricted stock units, performance-based awards and the case dismissed; however, the plaintiffs were permitted to re-file their claim, which they did on February 5, 2016. Defendants filed another motion to dismiss on April 5, 2016, which was denied by the court on September 30, 2016. Thereafter, discovery commenced. On October 2, 2017, the parties entered into an agreement in principle to settle the action for $12,500. The parties signed a stipulation of settlement on November 30, 2017. The settlement remains subject to court approval. The Company has not recorded an accrual for this matter as the settlement amount is to be funded solely by the Company’s insurers. There can be no assurance that the settlement will ultimately be approved or that it will become final. If the settlement does not occur and litigation against the Company continues, the Company believes that it has meritorious defenses and intends to defend the case vigorously. However, due to the inherent uncertainties of litigation, the Company cannot accurately predict the ultimate outcome of this matter if the litigation continues.ESPP.
| | | | | | | | | | | | | | | | | | | | | | | | | | |
| | | Three Months Ended December 31, | | Nine Months Ended December 31, |
| | | 2023 | | 2022 | | 2023 | | 2022 |
| Cost of revenues | | $ | 1,935 | | | $ | 1,383 | | | $ | 5,224 | | | $ | 3,852 | |
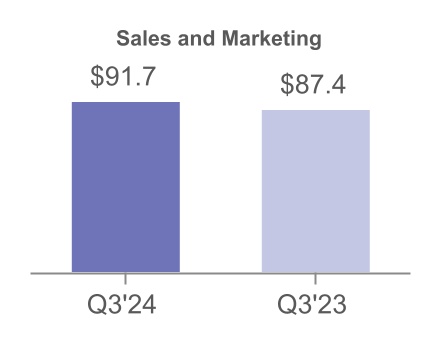
| Sales and marketing | | 10,189 | | | 10,479 | | | 29,834 | | | 32,037 | |
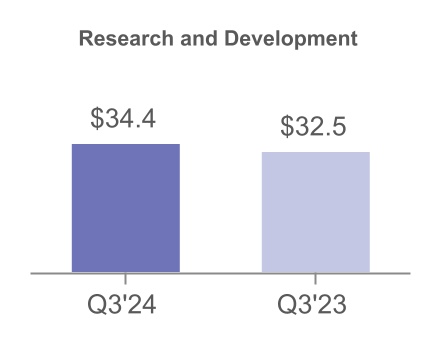
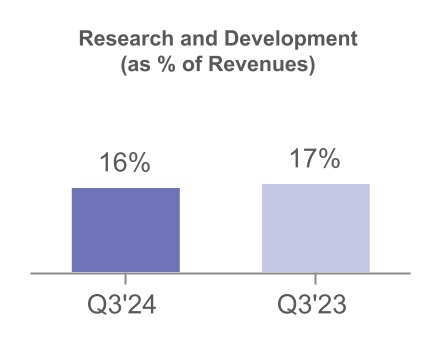
| Research and development | | 5,451 | | | 5,988 | | | 16,183 | | | 23,022 | |
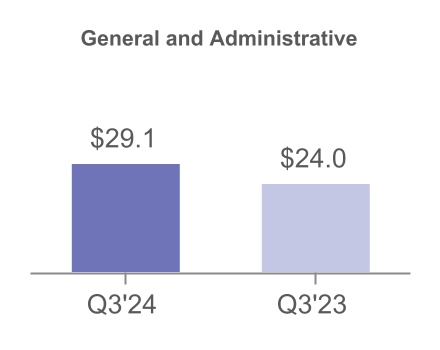
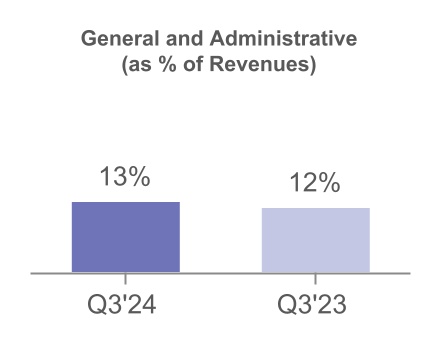
| General and administrative | | 7,027 | | | 5,776 | | | 20,700 | | | 19,850 | |
| Restructuring | | — | | | 1,019 | | | — | | | 2,306 | |
| Stock-based compensation expense | | $ | 24,602 | | | $ | 24,645 | | | $ | 71,941 | | | $ | 81,067 | |
On April 12, 2017, a shareholder derivative complaint was filed in the United States District Court for the District of New Jersey against the Company (nominally), certain of its executive officers and certain members of the board of directors. The complaint is entitled Murashko v. Hammer, et al. (Civ. No. 3:17-cv-02533-PGS-TJB). The plaintiff filed an amended complaint on July 14, 2017. The amended complaint largely repeats the allegations made in the securities litigation also pending in the United States District Court for the District of New Jersey (In re Commvault Systems, Inc. Securities Litigation (Master File No. 3:14-cv-05628-PGS-LHG), claiming that the defendant officers and directors breached their fiduciary duties to the Company by causing, or allowing, the Company to manipulate its financial results and conceal the state of its business prospects. The suit also alleges that certain executive officers engaged in unlawful insider trading in 2013 and/or 2014 based on their knowledge of the information that was supposedly concealed. The allegations asserted in the shareholder derivative action purport to cover a period from 2013 through the present. As a derivative action, the complaint does not seek damages from the Company, but rather seeks to recover from the defendant officers and directors on behalf of the Company compensatory damages, restitution, costs and expenses, as well as equitable or other relief. On August 29, 2017, all of the defendants, including the Company, filed a motion to dismiss the derivative action, and a hearing took place on December 18, 2017. On November 30, 2017, a virtually identical shareholder derivative complaint was filed in state court in New Jersey entitled Lee v. Hammer, et al., Civ. 201-17 (N.J. Super. Ct.). The Lee case has been voluntarily stayed by agreement of the parties pending a ruling on the motion to dismiss in the Murashko complaint. Due to the inherent uncertainties of litigation, the Company cannot accurately predict the ultimate outcome of these matters. The Company is unable at this time to determine whether the outcome of the litigations will have a material impact on its results of operations, financial condition or cash flows. As of December 31, 2017,2023, there was $149,391 of unrecognized stock-based compensation expense that is expected to be recognized over a weighted average period of 1.91 years. We account for forfeitures as they occur. To the Company hasextent that awards are forfeited, stock-based compensation will be different from our current estimate.
Stock option activity was not recorded an accrualsignificant for these matters.
On February 27, 2017, Realtime Data LLC d/b/a/ IXO (“Realtime”), a non-practicing entity, suedboth the Company and Spectra Logic Corporation in the Eastern District of Texas for alleged infringement of four patents: U.S. Patent Nos. 9,054,728, 7,415,530, 9,116,908, and 8,717,204. Realtime dismissed the case in Texas and refiled this case in the District of Delaware on July 10, 2017. Realtime has sued numerous other companies for infringement of these and other patents. Realtime seeks monetary damages and an injunction. The Company responded to the complaint by filing a motion to dismiss on the grounds that the patents are directed to patent-ineligible subject matter. The Court has not yet ruled on this motion. Due to the inherent uncertainties of litigation, the Company cannot accurately predict the ultimate outcome of this matter. The Company is unable at this time to determine whether the outcome of the litigation will have a material impact on its results of operations, financial condition or cash flows. The Company intends to defend itself vigorously. As ofnine months ended December 31, 2017,2023 and 2022.
Restricted Stock Units
Restricted stock unit activity for the Company has not recorded an accrual for this matter.nine months ended December 31, 2023 was as follows:
| | | | | | | | | | | |
| Non-vested Restricted Stock Units | Number of
Awards | | Weighted
Average Grant
Date Fair Value |
| Non-vested as of March 31, 2023 | 2,953 | | | $ | 62.52 | |
| Awarded | 1,436 | | | 69.83 | |
| Vested | (1,398) | | | 59.35 | |
| Forfeited | (257) | | | 64.72 | |
| Non-vested as of December 31, 2023 | 2,734 | | | $ | 67.78 | |
The weighted average fair value of restricted stock units awarded was $71.48 and $69.83 per unit during the three and nine months ended December 31, 2023, respectively, and $66.50 and $63.87 per unit during the three and nine months ended December 31, 2022, respectively. The weighted average fair value of awards includes the awards with a market condition described below.
Commvault Systems, IncInc.
Notes to Consolidated Financial Statements - Unaudited (continued)
(In thousands, except per share data)
7. Revolving Credit Facility
On June 30, 2014, the Company entered into a five-year $250,000 revolving credit facility (the “Credit Facility”). The Credit Facility is available for share repurchases, general corporate purposes, and letters of credit. The Credit Facility contains financial maintenance covenants including a leverage ratio and interest coverage ratio. The Credit Facility also contains certain customary events of default which would permit the lenders to, among other things, declare all loans then outstanding to be immediately due and payable if such default is not cured within applicable grace periods. The Credit Facility also limits the Company's ability to incur certain additional indebtedness, create or permit liens on assets, make acquisitions, make investments, loans or advances, sell or transfer assets, pay dividends or distributions, and engage in certain transactions with foreign affiliates. Outstanding borrowings under the Credit Facility accrue interest at an annual rate equal to London Interbank Offered Rate plus 1.50% subject to increases based on the Company's actual leverage. The unused balance on the Credit Facility is also subject to a 0.25% annual interest charge subject to increases based on the Company's actual leverage. As of December 31, 2017, there were no borrowings under the Credit Facility and the Company was in compliance with all covenants.
The Company has deferred the expense related to debt issuance costs, which are classified as Other assets, and will amortize the costs into Interest expense over the term of the Credit Facility. Unamortized amounts at December 31, 2017 were $379. The amortization of debt issuance costs was $63 and $189 in the three and nine months ended December 31, 2017 and 2016.
8. Capitalization
During the nine months ended December 31, 2017, the company repurchased $91,309 of common stock (1,691 shares).
Subsequent Event
On January 17, 2018, the Board of Directors extended the expiration date of the share repurchase program to March 31, 2019 and authorized a $100,000 increase to the existing share repurchase program so that $133,749 is now available.
9. Stock Plans
On August 24, 2017, the Company’s shareholders approved an amendment to the Omnibus Incentive Plan (the “2016 Incentive Plan”) to increase the maximum number of shares of common stock that may be delivered under plan to 3,550. The 2016 Incentive Plan authorizes a broad range of awards including stock options, stock appreciation rights, full value awards (including restricted stock, restricted stock units, performance shares or units and other stock-based awards) and cash-based awards.
The following table presents the stock-based compensation expense included in Cost of services revenue, Sales and marketing, Research and development and General and administrative expenses for the three and nine months ended December 31, 2017 and 2016. Stock-based compensation is attributable to stock options, restricted stock units, performance based awards and the employee stock purchase plan.
|
| | | | | | | | | | | | | | | | |
| | | Three Months Ended December 31, | | Nine Months Ended December 31, |
| | | 2017 | | 2016 | | 2017 | | 2016 |
| Cost of services revenue | | $ | 846 |
| | $ | 1,060 |
| | $ | 2,348 |
| | $ | 2,895 |
|
| Sales and marketing | | 9,464 |
| | 9,100 |
| | 27,888 |
| | 25,061 |
|
| Research and development | | 2,170 |
| | 1,924 |
| | 6,310 |
| | 5,372 |
|
| General and administrative | | 5,273 |
| | 7,026 |
| | 20,592 |
| | 21,825 |
|
| Stock-based compensation expense | | $ | 17,753 |
| | $ | 19,110 |
| | $ | 57,138 |
| | $ | 55,153 |
|
As of December 31, 2017, there was approximately $103,468 of unrecognized stock-based compensation expense related to non-vested stock option and restricted stock unit awards that is expected to be recognized over a weighted average period of 1.21 years. The Company accounts for forfeitures as they occur. To the extent that awards are forfeitured, stock-based compensation will be different from the Company’s current estimate.
Commvault Systems, Inc
Notes to Consolidated Financial Statements - Unaudited (continued)
(In thousands, except per share data)
Stock Options
Stock Option activity for the nine months ended December 31, 2017 is as follows:
|
| | | | | | | | | | | | | |
| Options | | Number of Options | | Weighted- Average Exercise Price | | Weighted- Average Remaining Contractual Term (Years) | | Aggregate Intrinsic Value |
| Outstanding as of March 31, 2017 | | 5,300 |
| | $ | 44.74 |
| |
| |
|
| Options granted | | — |
| | — |
| |
| |
|
| Options exercised | | (442 | ) | | 29.27 |
| |
| |
|
| Options forfeited | | (20 | ) | | 43.40 |
| |
| |
|
| Options expired | | (25 | ) | | 68.85 |
| |
| |
|
| Outstanding as of December 31, 2017 | | 4,813 |
| | $ | 46.04 |
| | 4.13 | | $ | 66,006 |
|
| Exercisable as of December 31, 2017 | | 4,554 |
| | $ | 46.09 |
| | 3.97 | | $ | 64,086 |
|
The total intrinsic value of options exercised was $1,194 and $12,819 for the three and nine months ended December 31, 2017 and $2,101 and $6,540 for the three and nine months ended December 31, 2016. The Company’s policy is to issue new shares upon exercise of options as the Company does not hold shares in treasury.
Restricted Stock Units
Restricted stock unit activity for the nine months ended December 31, 2017 is as follows:
|
| | | | | | |
| Non-vested Restricted Stock Units | Number of
Awards | | Weighted
Average Grant
Date Fair Value |
| Non-vested as of March 31, 2017 | 2,396 |
| | $ | 45.53 |
|
| Awarded | 1,191 |
| | 59.91 |
|
| Vested | (1,108 | ) | | 58.32 |
|
| Forfeited | (90 | ) | | 46.69 |
|
| Non-vested as of December 31, 2017 | 2,389 |
| | $ | 51.24 |
|
The weighted average fair value of restricted stock units awarded was $59.84 and $59.91 per unit during the three and nine months ended December 31, 2017, and $53.16 and $50.55 per unit during the three and nine months ended December 31, 2016. The weighted average fair value of awards includes the awards with a market condition described below.
Performance Based Awards
In the nine months ended December 31, 2017, the Company2023, we granted 107120 performance restricted stock units ("PSU"PSUs") to certain executives. Vesting of these awards is contingent upon i) the Companyus meeting certain company-wide revenue and non-GAAP performance goals (performance-based) in fiscal 20172024 and ii) the Company'sour customary service periods. The awards vest over three years and have a maximumthe potential to vest atbetween 0% and 200% (214(240 shares) based on actual fiscal 20182024 performance. The vesting quantity of these awards may vary based on actual fiscal 2024 performance. The related stock-based compensation expense is determined based on the value of the underlying shares on the date of grant and is recognized over the vesting term using the accelerated method. During the interim financial periods, management estimates the probable number of PSU’sPSUs that would vest until the ultimate achievement of the performance goals is known. The awards are included in the restricted stock unit table.
Commvault Systems, Inc
Notes to Consolidated Financial Statements - Unaudited (continued)
(In thousands, except per share data)
Awards with a Market Condition
In the nine months ended December 31, 2017, the Company2023, we granted 88120 market performance stock unitsPSUs to certain executives. The vesting of these awards is contingent upon the Companyus meeting certain total shareholder return ("TSR") levels as compared to athe Russell 3000 market index over the next three years. The awards vest in three annual tranches and have a maximumthe potential to vest atbetween 0% and 200% (176(240 shares) based on TSR performance. The related stock-based compensation expense is determined based on the estimated fair value of the underlying shares on the date of grant and is recognized using the accelerated method over the vesting term. The estimated fair value was calculated using a Monte Carlo simulation model. The fair value of the awards granted during the nine months ended December 31, 20172023 was $78.28.$87.90 per unit. The awards are included in the restricted stock unit table.
Employee Stock Purchase Plan
The Employee Stock Purchase Plan (the “Purchase Plan”)ESPP is a shareholder approved plan under which substantially all employees may purchase the Company’sour common stock through payroll deductions at a price equal to 85% of the lower of the fair market values of the stock as of the beginning or the end of the six-month offering periods. An employee’s payroll deductions under the Purchase PlanESPP are limited to 10% of the employee’s salary and employees may not purchase more than $25 of stock during any calendar year. AsEmployees purchased 96 shares in exchange for $5,164 of proceeds in the nine months ended December 31, 2017, 2,2902023, and 107 shares were reservedin exchange for future issuance under$5,418 of proceeds in the Purchase Plan.nine months ended December 31, 2022. The Purchase PlanESPP is considered compensatory and the fair value of the discount and look back provision are estimated using the Black-Scholes formula and recognized over the six monthsix-month withholding period prior to purchase. The total expense associated with the Purchase PlanESPP for the nine months ended December 31, 2023 and 2022 was $722$2,391 and $2,097 for$2,847, respectively. As of December 31, 2023, there was approximately $364 of unrecognized cost related to the current offering period of our ESPP.
9. Income Taxes
Income tax expense was $5,176 and $17,772 in the three and nine months ended December 31, 20172023, respectively, compared to expense of $5,710 and $632 and $1,966 for$14,550 in the three and nine months ended December 31, 2016.
10. Income Taxes
Income tax expense was $55,282 in the nine months ended December 31, 2017 compared to an expense of $836 in the nine months ended December 31, 2016.2022, respectively. The fiscal year-to-date increase in income tax expense was primarily the result of the combined impact of the lower U.S. corporate income tax rate on net deferred tax assets and recording a full valuation allowance against the remaining value of net deferred tax assets.
Impact of U.S. Tax Reform
The Tax Cuts and Jobs Act (the "Act") was enacted on December 22, 2017. The Act reduces the US federal corporate tax rate from 35% to 21%, requires companies to pay a one-time transition tax on earnings of certain foreign subsidiaries that were previously tax deferred and creates new taxes on certain foreign sourced earnings. As of December 31, 2017, the Company has not completed the accounting for the tax effects of enactment of the Act; however, as described below, it has made a reasonable estimate of the effects on existing deferred tax balances. These amounts are provisional and subject to change. The most significant impact of the legislation for the Company was a $24,300 reduction of the value of the Company's net deferred tax assets (which represent future tax benefits) as a result of lowering the U.S. corporate income tax rate from 35% to 21%. The Act also includes a requirement to pay a one-time transition tax on the cumulative value of earnings and profits that were previously not repatriated for U.S. income tax purposes. The Company has not made sufficient progress on the transition tax analysis to reasonably estimate the effects, and therefore, has not recorded provisional amounts. However, based on analysis to date the one-time transition tax is not expected to be material. No additional income taxes have been provided for any remaining undistributed foreign earnings not subjectcompared to the transition tax, or any additional outside basis difference inherent in these entities, as these amounts continueprior year relates primarily to be indefinitely reinvested in foreign operations.
Valuation Allowance
Net deferred tax assets arise due tocurrent federal and state taxes driven by the recognition of income and expense items for tax purposes, which differ from those used for financial statement purposes. ASC 740, Income Taxes, provides for the recognition of deferred tax assets if realization of such assets is more likely than not. In assessing the need for a valuation allowance in the third quarter of fiscal 2018, the Company considered all available objective and verifiable evidence both positive and negative, including historical levelsincrease of pre-tax income (loss) both on a consolidated basis and tax reporting entity basis, legislative developments, expectations and risks associated with estimates of future pre-tax income, and prudent and feasible tax planning strategies. The Company currently estimates that as of March 31, 2018 bothrelative to the consolidated entity and its U.S. entity will have generated a cumulative three year pre-tax loss. As a result of this analysis,same period in the Company determinedprior year. We believe that it is more likely than not that itwe will not realize the benefits of itsour gross deferred tax assets and therefore has recordedcontinue to record a valuation allowance to reduce the carrying value of these gross deferred tax assets, net of the impact of the reversal of taxable temporary differences, to zero.zero as of December 31, 2023.
Commvault Systems, IncInc.
Notes to Consolidated Financial Statements - Unaudited (continued)
(In thousands, except per share data)
10. Revolving Credit Facility
Other Tax Items
On December 13, 2021, we entered into a five-year $100,000 senior secured revolving credit facility (the “Credit Facility”) with JPMorgan Chase Bank, N.A. The Company conducts business globallyCredit Facility is available for share repurchases, general corporate purposes, and asletters of credit. The Credit Facility contains financial maintenance covenants, including a result, files income tax returnsleverage ratio and interest coverage ratio. The Credit Facility also contains certain customary events of default which would permit the lender to, among other things, declare all loans then outstanding to be immediately due and payable if such default is not cured within applicable grace periods. The Credit Facility also limits our ability to incur certain additional indebtedness, create or permit liens on assets, make acquisitions, make investments, loans or advances, sell or transfer assets, pay dividends or distributions, and engage in certain transactions with foreign affiliates. Outstanding borrowings under the United States and in various state and foreign jurisdictions. InCredit Facility accrue interest at an annual rate equal to the normal course of business, the Company isSecured Overnight Financing Rate plus 1.25% subject to examination by taxing authorities throughoutincreases based on our actual leverage. The unused balance on the world, including such major jurisdictions as the United States, Australia, Canada, Germany, Netherlands and United Kingdom. The yearsCredit Facility is also subject to income tax examination in the Company’s foreign jurisdictions cover the maximum time period with respect to these jurisdictions. Due to net operating loss ("NOL") carryforwards, in some cases the tax years continue to remaina 0.25% annual interest charge subject to examinationincreases based on our actual leverage. As of December 31, 2023, there were no borrowings under the Credit Facility and we were in compliance with respectall covenants.
We have deferred the expense related to such NOLs.debt issuance costs, which are classified as other assets, and will amortize the costs into interest expense over the term of the Credit Facility. Unamortized amounts at December 31, 2023 were $341. The amortization of debt issuance costs and interest expense incurred was $92 and $93 for the three months ended December 31, 2023 and 2022, respectively, and $277 and $278 for the nine months ended December 31, 2023 and 2022, respectively.
Item 2 - Management’s Discussion and Analysis of Financial Condition and Results of Operations
You should read the following discussion and analysis along with our consolidated financial statements and the related notes included elsewhere in this quarterly reportQuarterly Report on Form 10-Q. The statements in this discussion regarding our expectations of our future performance, liquidity and capital resources, and other non-historical statements are forward-looking statements. These forward-looking statements are subject to numerous risks and uncertainties, including, but not limited to, changes in demand as well as the risks and uncertainties described under “Risk Factors” in our Annual Report on Form 10-K for the fiscal year ended March 31, 2017.2023. Our actual results may differ materially from those contained in or implied by any forward-looking statements.
Overview
Commvault is a provider of data and information management software applications and related services. Commvault was incorporatedIncorporated in Delaware in 1996, as a Delaware corporation. The Commvault software platform is an enterprise level, integrated data and information management solution, built from the ground up on a single platform and unified code base. All software functionality share the same back-end technologies to deliver the benefits of a holistic approach to protecting, managing, and accessing data. The software addresses many aspects of data management in the enterprise, while providing scalability and control of data and information. In fiscal 2018, we also started selling appliances that integrate the our software with hardware and address a wide-range of business needs and use cases, ranging from support for remote or branch offices with limited IT staff up to large corporate data centers. We also provide ourSystems, Inc. provides its customers with a broad range of professionalcyber resiliency platform that helps them secure, defend and recover their most precious asset, their data. We provide these products and services thatfor their data across the following environments: on-premises, hybrid and multi-cloud. Our cyber resiliency offerings are delivered via self-managed software, SaaS, integrated appliances, or managed by partners. Customers use our worldwide supporttechnology to protect themselves from threats like ransomware and field operations. Asrecover their data efficiently.
Sources of December 31, 2017, we had licensed our software applications to over 26,000 registered customers.Revenues
OurWe generate revenues through subscription arrangements, perpetual software licenses, typically provide for a perpetual right to use our softwarecustomer support contracts and are sold on a per terabyte capacity basis, per-copy, as site licenses or as a solution set. Prior to fiscal 2018, an insignificant amountother services. A significant portion of our total revenues comes from subscription arrangements, which include both sales of term-based licenses and SaaS offerings. We are focused on these types of recurring revenue has beenarrangements.
We expect our subscription arrangements will continue to generate revenues from the renewals of term-based licenses and SaaS offerings sold underin prior years. Any of our pricing models (capacity, instance based, etc.) can be sold via a subscription arrangement, either through term-based licensing or term based,hosted services. In term-based license arrangements. In these arrangements, the customer has the right to use the software over a designated period of time. During fiscal 2018, we expect revenue from subscription arrangements to become a more significant portionThe capacity of our total revenue compared to historical periods.
In recent years, the majority of our softwarelicense is fixed and products have been sold on a capacity basis and we expect this to remain true in the near future. During the nine months ended December 31, 2017, approximately 67% of software and product revenue was sold on a capacity basis. This compares to approximately 69% of software and products revenue was sold on a capacity basis during fiscal 2017. Software licenses sold on a capacity basis provide the customer with unlimited licenses of specified software products based on a defined level of terabytes of data under management. As a result,has made an unconditional commitment to pay. Software revenue in these arrangements is generally recognized when we sell our platform through a capacity license, certain of the various functionalities discussed below are bundled into one capacity based price. Site licenses give the customer the additional right to deploy the software on a limited basis during a specified term.
Our solution sets are generally sold on a per unit basis such as per virtual machine for our virtual machine backup, recovery and cloud management solution set; per mailbox for our email archive solution set, and per user for our endpoint data protection solution set. These solution sets are purpose-builtis delivered. In SaaS offerings, designed to accelerate private, public and hybrid cloud adoption that seamlessly integrate with our single platform software, offering a path towards holistic data management while allowing customers to utilize functionality that addressesrevenue is recognized ratably over the point solution requirements their business dictates. We primarily sell solution sets for virtual machine backup, recovery and cloud management; endpoint data protection; and email archive.
The industry in which we currently operate continues to go through accelerating changes as the result of compounding data growth and the introduction of new technologies. We remain focused on both the data and information management trends in the marketplace and, in fact, a material portion of our existing research and development expenses are utilized toward the development of such new technologies. While we are confident in our ability to meet these changing industry demands with our Commvault suite and potential future releases, the development, release and timing of any features or functionality remain at our sole discretion and our solutions or other technologies may not be widely adopted.
Given the nature of the industry in which we operate, our software applications are subject to obsolescence. We continually develop and introduce updates to our existing software applications in order to keep pace with evolving industry technologies. In addition, we must address evolving industry standards, changing customer requirements and competitive software applications that may render our existing software applications obsolete. For each of our software applications, we provide full support for the current generally available release and one prior release. When we declare a product release obsolete, a customer notice is delivered twelve months prior to the effective date of obsolescence announcing continuation of full product support for the first six months. We provide an additional six months of extended assistance support in which we only provide existing workarounds or fixes that do not require additional development activity. We do not have existing plans to make any of our software products permanently obsolete.
Sources of Revenuescontract period.
We derive a significant portion of our total revenues from sales of licenses of our software applications and products. We do not customize our software for a specific end-user customer. We sell our software applications and products to end-user customers both directly through our sales force and indirectly through our global network of value-added reseller partners, systems integrators, corporate resellers and original equipment manufacturers. Our software and productsSubscription revenue was 44%generated through indirect distribution channels accounted for approximately 90% of our total revenues forsubscription revenue in both the nine months ended December 31, 20172023 and 2016.
In recent fiscal periods, we have2022. Subscription revenue generated through direct distribution channels accounted for approximately three-quarters10% of our software and products revenue from our existing customer base and approximately one-quarter of our software and products revenue from new customers. In addition, our total software and productssubscription revenue in any particular period is, to a certain extent, dependent upon our ability to generate revenues from large customer software and products deals, which we refer to as enterprise transactions. Enterprise transactions (transactions greater than $0.1 million) represented approximately 59% and 55% of our total software and products revenue inboth the nine months ended December 31, 20172023 and 2016, respectively.
Software and products revenue generated through indirect distribution channels was 88% of total software and products revenue in the nine months ended December 31, 2017 and in the nine months ended December 31, 2016. Software and products revenue generated through direct distribution channels was approximately 12% of total software and products revenue in the nine months ended December 31, 2017 and in the nine months ended December 31, 2016. The dollar value of software and products revenue generated through indirect distribution channels increased approximately $12.0 million, or 6%, in the nine months ended December 31, 2017 compared to the nine months ended December 31, 2016. The dollar value of software and products revenue generated through direct distribution channels increased approximately $3.7 million, or 15%, in the nine months ended December 31, 2017 compared to the nine months ended December 31, 2016.2022. Deals initiated by our direct sales force are sometimes transacted through indirect channels based on end-user customer requirements, which are not always in our control and can cause this overall percentage split to vary from period-to-period. As such, there may be fluctuations in the dollars and percentage of software and productssubscription revenue generated through our direct distribution channels from time-to-time. We believe that the growth of our software and productssubscription revenue, derived from both our indirect channel partners and direct sales force, are key attributes to our long-term growth strategy. We willintend to continue to invest in both our channel relationships and direct sales force in the future, but we continue to expect more revenue to be generated through indirect distribution channels over the long term. The failure of our indirect distribution channels or our direct sales force to effectively sell our software applicationsproducts and services could have a material adverse effect on our revenues and results of operations.
Our primary original equipment manufacturer agreement is with Hitachi Data Systems ("HDS") and allows them to market, sell and support our software applications and services onWe have a stand-alone basis and/or incorporate our software applications into their own hardware products. Our original equipment manufacturer partners, including HDS, have no obligation to recommend or offer our software applications exclusively or at all, and they have no minimum sales requirements and can terminate our relationship at any time. Sales through our original equipment manufacturer agreements, accounted for approximately 14% of our total revenues for the nine months ended December 31, 2017 and 15% of our total revenues for the nine months ended December 31, 2016.
We also have non-exclusive distribution agreements covering our North American commercial markets and our U.S. Federal Government marketagreement with Arrow Enterprise Computing Solutions, Inc. ("Arrow"), a subsidiary of Arrow Electronics, Inc., and Tech Data Corporation (formerly Avnet Technology) ("Tech Data"). Pursuantpursuant to these distribution agreements, these distributors’which Arrow's primary role is to enable a more efficient and effective distribution channel for our products and services by managing our reseller partners and leveraging their own industry experience. We generated approximately36% and 37% of our total revenues through Arrow in bothfor the nine months ended December 31, 20172023 and 2016.2022, respectively. If Arrow were to discontinue or reduce the sales of our products or if our agreement with Arrow waswere terminated, and if we were unable to take back the management of our reseller channel or find another North American distributor to replace Arrow, then itthere could havebe a material adverse effect on our future business.
Our servicescustomer support revenue was 56% of our total revenues for both the nine months ended December 31, 2017 and 2016. Our services revenue is made up of fees from the delivery of customerincludes support and other professional services, which are typically sold in connection with the sale ofcontracts tied to our software applications.products. Customer support agreements provide technical support and unspecifiedincludes software updates on a when-and-if-available basis, telephone support, integrated web-based support, and
other premium support offerings, for an annual fee based on licenses purchasedboth term-based software license and perpetual software license arrangements. We sell our customer support contracts as a percentage of net software. Customer support revenue is recognized ratably over the levelterm of the customer support agreement.
Our other services revenue consists primarily of professional service subscribed. Other professional services include consulting,offerings, including consultation, assessment and design, services, installation services, and customer education.
Most of our customer support agreements Revenues from other services can vary period over period based on the timing services are priced as a percentage of the related net software purchaseddelivered and are for a one year term. Astypically recognized as the end of the annual period approaches, we pursue the renewal of the agreement with the customer. Historically, customer support renewals have represented a significant portion of our total revenue. Because of this characteristic of our business, if our customers choose not to renew their support agreements with us on beneficial terms, or at all, our business, operating results and financial condition could be harmed.services are performed.
Foreign Currency Exchange Rates’ Impact on Results of Operations
Sales outside the United States were approximately 46%47% of our total revenuerevenues for both the nine months ended December 31, 20172023 and 43% of our total revenue for the nine months ended December 31, 2016.2022. The resultsincome statements of our non-U.S. operations are translated into U.S. dollars at the average exchange rates for each applicable month in a period. To the extent the U.S. dollar weakens against foreign currencies, the translation of these foreign currency denominated transactions generally results in increased revenue,revenues, operating expenses and income from operations for our non-U.S. operations. Similarly, our revenue,revenues, operating expenses and net income will generally decrease for our non-U.S. operations if the U.S. dollar strengthens against foreign currencies.
Using the average foreign currency exchange rates from the three months ended December 31, 20162022, our software and products revenuetotal revenues would have been lower by $3.3$2.4 million, our services revenuecost of revenues would have been lower by $2.3 million, our cost of sales would have been lower by $0.6$0.1 million and our operating expenses would have been lower by $3.0$0.9 million from non-U.S. operations for the three months ended December 31, 2017.2023. Using the average foreign currency exchange rates from the nine months ended December 31, 20162022, our software and products revenuetotal revenues would have been lower by $3.5 million, our services revenue would have been lower by $2.3$3.8 million, our cost of salesrevenues would have been lowerhigher by $0.9$0.1 million and our operating expenses would have been lower by $1.5$0.8 million from non-U.S. operations for the nine months ended December 31, 2017.2023.
In addition, we are exposed to risks of foreign currency fluctuation primarily from cash balances, accounts receivables and intercompany accounts denominated in foreign currencies and are subject to the resulting transaction gains and losses, which are recorded as a component of general and administrative expenses. We recognized a net foreign currency transaction losses of $0.2approximately $1.6 million and less than $0.1$1.8 million infor the three and nine months ended December 31, 2017,2023, respectively. We recognized a net foreign currency transaction losslosses of less thanapproximately $0.3 million and $0.1 million and gain of $0.4 million infor the three and nine months ended December 31, 2016,2022, respectively.
Critical Accounting Policies
Our condensedIn presenting our consolidated financial statements are prepared in accordanceconformity with U.S. GAAP. The preparation of these condensed consolidated financial statements requires usGAAP, we are required to make estimates and assumptionsjudgments that affect the amounts reported amountstherein. Some of assets, liabilities, revenue, coststhe estimates and expenses and related disclosures.assumptions we are required to make relate to matters that are inherently uncertain as they pertain to future events. We base ourthese estimates on historical experience and on various other assumptions that we believe to be reasonable under the circumstances. In many instances, we could have reasonably used different accounting estimates, and in other instances changes in the accounting estimates are reasonably likely to occur from period-to-period. Accordingly, actualappropriate. Actual results couldmay differ significantly from the estimates made by our management.these estimates. To the extent that there are material differences between these estimates and actual results, our future financial statement presentation, financial condition, results of operations and cash flows willmay be affected.
In many cases, the accounting treatment of a particular transaction is specifically dictated by U.S. GAAP and does not require management’s judgment in its application, while in other cases, significant judgment is required in selecting among available alternative accounting standards that allow different accounting treatment for similar transactions. We consider these policies requiring significant management judgment to be critical accounting policies. These critical accounting policies are:
•Revenue Recognition;Recognition
•Stock-Based Compensation;
•Accounting for Income Taxes
•Software Development Costs
•Deferred Commissions Costs
The discussion below includes changes to our critical accounting policies that have occurred in fiscal 2018.
Revenue Recognition
We account for revenue in accordance with ASC Topic 606, Revenue from Contracts with Customers. Our revenue recognition policies require us to make significant judgments and estimates. In applying our revenue recognition policy, we must determine which portions of our revenue are recognized currently (generally software and products revenue) and which portions must be deferred and recognized in future periods (generally services revenue). We analyze various factors including, but not limited to, the selling price of undelivered services when sold on a stand-alone basis, our pricing policies, the credit-worthiness of our customers, and contractual terms and conditions in helping us to make such judgments about revenue recognition. Changes in judgment on any of these factors could materially impact the timing and amount of revenue recognized in a given period.
We derive revenue from two primary sources: software and products, and services. Services include customer support (software updates and technical support), consulting, assessment and design services, installation services and customer education. A typical contract includes both licenses and services.
Our software licenses typically provide for a perpetual right to use our software. We also sell term-based software licenses that expire, which are referred to as subscription arrangements. We do not customize its software and installation services are not required. The software is delivered before related services are provided and is functional without professional services, updates and technical support. We have concluded that our software license is functional intellectual property that is distinct as the user can benefit from the software on its own. Software and product revenue is typically recognized when the software is delivered and/or made available for download as this is the point the user of the software can direct the use of, and obtain substantially all of the remaining benefits from the functional intellectual property. We do not recognize software revenue related to the renewal of subscription software licenses earlier than the beginning of the subscription period.
In fiscal 2018, we also started selling appliances that integrate our software with hardware and address a wide-range of business needs and use cases, ranging from support for remote or branch offices with limited IT staff up to large corporate data centers. Revenue related to appliances is recognized when control of the appliances passes to the customer; typically upon delivery. Revenue to date related to appliances has not been significant.
Services revenue includes revenue from customer support and other professional services. Customer support includes software updates on a when-and-if-available basis, telephone support, integrated web-based support and bug fixes or patches. The Company sells its customer support contracts as a percentage of net software purchases the support is related to. Customer support revenue is recognized ratably over the term of the customer support agreement, which is typically one year.
Other professional services include consulting, assessment and design services, installation services and customer education. Customer education services include courses taught by our instructors or third-party contractors. Revenue related to other professional services and customer education services is typically recognized as the services are performed.
Most of our contracts with customers contain multiple performance obligations. For these contracts, we account for individual performance obligations separately if they are distinct. The transaction price is allocated to the separate performance obligations on a relative standalone selling price basis. Standalone selling prices of software and products are typically estimated using the residual approach. Standalone selling prices of services are typically estimated based on observable transactions when these services are sold on a standalone basis.
Our typical performance obligations include the following:
|
| | | |
Performance Obligation | When Performance Obligation
is Typically Satisfied
| When Payment is
Typically Due
| How Standalone Selling Price is
Typically Estimated
|
Software and Products Revenue |
Software Licenses | Upon shipment or made available for download (point in time) | Within 90 days of shipment except for certain subscription licenses which are paid for over time | Residual approach |
Appliances | When control of the appliances passes to the customer; typically upon delivery | Within 90 days of delivery except for certain subscriptions which are paid for over time | Residual approach |
Customer Support Revenue |
Software Updates | Ratably over the course of the support contract (over time) | At the beginning of the contract period | Observable in renewal transactions |
Customer Support | Ratably over the course of the support contract (over time) | At the beginning of the contract period | Observable in renewal transactions |
Professional Services |
Other Professional Services (except for education services) | As work is performed (over time) | Within 90 days of services being performed | Observable in transactions without multiple performance obligations |
Education Services | When the class is taught (point in time) | Within 90 days of services being performed | Observable in transactions without multiple performance obligations |
Stock-Based Compensation and Accounting for Income Taxes
In March 2016, the FASB issued ASU No. 2016-09, Improvements to Employee Share-Based Payment Accounting (Topic 718), which simplifies the accounting for share-based payment transactions, including related accounting for income taxes, forfeitures, and classification in the statement of cash flows. In connection with the adoption of this guidance we elected an accounting policy to account for forfeitures as they occur. The guidance also requires excess tax benefits and tax deficiencies to be recorded as income tax benefit or expense in the statement of income when the awards vest or are settled, and eliminates the requirement to reclassify cash flows related to excess tax benefits from operating activities to financing activities on the statement of cash flows.
Deferred Commissions Cost
Sales commissions and related payroll taxes earned by our employees are considered incremental and recoverable costs of obtaining a contract with a customer. Our typical contracts include performance obligations related to software licenses, software updates, customer support and other professional services. In these contracts, incremental costs of obtaining a contract are allocated to the performance obligations based on the relative estimated standalone selling prices and then recognized on a systematic basis that is consistent with the transfer of the goods or services to which the asset relates. We do not pay commissions on annual renewals of contracts for software updates and customer support for perpetual licenses. The costs allocated to software are expensed at the time of sale, when revenue for the functional software license is recognized. The costs allocated to software updates and customer support for perpetual licenses are amortized ratably over a period of approximately five years, the expected period of benefit of the asset capitalized. We currently estimate a period of five years is appropriate based on consideration of historical average customer life and the estimated useful life of the underlying software sold as part of the transaction. The costs related to professional services are amortized within one quarter following the date of the related software sale, which is typically the period the related professional services are provided and revenue is recognized. If we were to change our estimate of the period of benefit of these deferred costs it would impact our results of operations.
Costs related to software updates and support for term-based, or subscription software licenses, are limited to the contractual period of the arrangement as we intend to pay a commensurate commission upon renewal of the subscription license and related updates and support.
Goodwill
There have been no other significant changes in our critical accounting policies during the nine months ended December 31, 20172023 as compared to the critical accounting policies and estimates disclosed in “Management’s Discussion and Analysis of Financial Condition and Results of Operations - Critical Accounting Policies” included in our Annual Report on Form 10-K for the year ended March 31, 2017. In addition, please see Note 22023.
Results of Operations
Amounts reported in millions are rounded based on the amounts in thousands. As a result, the sum of the components reported in millions may not equal the total amount reported in millions due to rounding.
Three months ended December 31, 20172023 compared to three months ended December 31, 20162022
Revenues ($ in millions)
–Total revenues increased $13.3$21.7 million, or 8%11% year over year, driven primarily by an increase in subscription revenue, partially offset by a decrease in perpetual license revenue. We remain focused on selling subscription arrangements through both term-based software licenses and SaaS offerings.
–Subscription revenue increased $26.9 million, or 31% year over year, driven primarily by a 91% increase in our SaaS revenue. Term-based license revenue increased 16%, from $167.1 milliondue to an increase in larger term-based license transactions (deals greater than $0.1 million) period over period. Subscription revenue accounted for 53% of total revenues for the three months ended December 31, 20162023 compared to $180.4 million in45% for the three months ended December 31, 2017.2022.
Software and Products Revenue. Software and products–Perpetual license revenue increased $2.8decreased $4.9 million, or 4%, from $78.7 million25% year over year. Our go to market motion is led by subscription and perpetual licenses are generally only sold in certain verticals and geographies. Perpetual license revenue accounted for 7% of total revenues for the three months ended December 31, 20162023 compared to $81.4 million in10% for the three months ended December 31, 2017. Software and products2022.
–Customer support revenue represented 45% of our total revenuesdecreased $0.9 million, or 1% year over year, driven by a $7.2 million decrease in customer support revenue attached to perpetual license support renewals, partially offset by a $6.3 million increase in support allocated to term-based license arrangements.
–Other services revenue increased $0.6 million, or 6% year over year, primarily due to an increase in professional services delivered during the period compared to the same period in the three months ended December 31, 2017 compared to 47% of total revenues in the three months ended December 31, 2016.prior year.
We track software and products revenuetotal revenues on a geographic basis. The geographic regions that are tracked areOur Americas region includes the Americas (UnitedUnited States, Canada, and Latin America), EMEA (Europe,America. Our International region primarily includes Europe, Middle East, Africa) and APAC (Australia, New Zealand,Africa, Australia, India, Southeast Asia China).and China. Americas EMEA and APACInternational represented 50%, 36%58% and 14%42% of total software and products revenue,revenues, respectively, for the three months ended December 31, 2017. The2023. Total revenues increased 16% and 6% year over year growthin the Americas and International, respectively.
▪Total revenues in the Americas was impacted by a 44% increase in subscription revenue, in EMEA and APAC was 12% and, 5%, respectively, which was partially offset by a 2% decline47% decrease in perpetual license revenue, driven by the planned shift from selling perpetual licenses to selling subscription arrangements. Customer support revenue declined 4% and other services revenue increased 10% due to an increase in the Americas.delivery of professional services for the region as compared to the same period of the prior year.
| |
▪ | Americas enterprise transaction revenue decreased by 7% as a result of a decrease in the number of transactions which was partially offset by an increase in non-enterprise revenue. |
| |
▪ | EMEA software and products revenue increased primarily due to a 35% increase in enterprise transaction revenue. The increase in enterprise transaction revenue was primarily the result of an increase in the number enterprise revenue transactions. |
Year▪The increase in International total revenues was primarily due to a 13% increase in subscription revenue, offset by a 12% decrease in perpetual license revenue. Customer support revenue increased 4% year over year software and productsother services revenue growthwas flat year over year.
Our total revenues in EMEA was positively impacted byInternational is subject to changes in foreign exchange rates as the U.S. dollar weakened against the Euro and British pound sterling. Using average foreign exchange rates from the third quarter of fiscal 2017, third quarter fiscal 2018 EMEA software and products revenue would have increased 3% compared to an actual increase of 12%.
| |
▪ | The increase in APAC software and products revenue was primarily the result of an increase in non-enterprise revenue. |
| |
▪ | Our software and products revenue in EMEA and APAC is subject to changes in foreign exchange rates as more fullyfurther discussed above in the “Foreign Currency Exchange Rates’ Impact on Results of Operations” section. |
Software and products revenue derived from enterprise transactions (transactions greater than $0.1 million) represented approximately 57% of our software and products revenue in the three months ended December 31, 2017 and approximately 56%“Foreign Currency Exchange Rates’ Impact on Results of our software and products revenue in the three months ended December 31, 2016. Enterprise transactions increased by $1.8 million, or 4%, in the three months ended December 31, 2017 compared to the three months ended December 31, 2016. This increase was driven by a 3% increase in the average dollar amount of enterprise transactions. The average dollar amount of such transactions was approximately $268,000 in the three months ended December 31, 2017 and approximately $261,000 in the three months ended December 31, 2016.Operations” section.
Services Revenue. Services revenue increased $10.5 million, or 12%, from $88.4 million in the three months ended December 31, 2016 to $98.9 million in the three months ended December 31, 2017. Services revenue represented 55% of our total revenues in the three months ended December 31, 2017 and 53% in the three months ended December 31, 2016. The increase in services revenue is due to a $8.7 million increase in revenue from customer support agreements as a result of software sales to new customers and renewal agreements with our installed software base and includes a $2.3 million increase due to the result of a weakening of the US dollar versus foreign currencies.
Cost of Revenues. and Gross Margin ($ in millions)
| | | | | | | | | | | | | | | | | | | | |
| | | Three Months Ended December 31, |
| | 2023 | | 2022 |
| | Cost of Revenues | Gross
Margin | | Cost of Revenues | Gross
Margin |
| Subscription | | $ | 15.9 | | 86 | % | | $ | 11.7 | | 87 | % |
| Perpetual license | | 0.8 | | 95 | % | | 0.6 | | 97 | % |
| Customer support | | 15.1 | | 80 | % | | 14.6 | | 81 | % |
| Other services | | 7.3 | | 33 | % | | 7.6 | | 26 | % |
| Total | | $ | 39.1 | | 82 | % | | $ | 34.5 | | 82 | % |
–Total cost of revenues increased $3.8$4.5 million, orand represented 18%, from $21.2 million in the three months ended December 31, 2016 to $25.0 million in the three months ended December 31, 2017. Total cost of revenues represented 14% of our total revenues in the three months ended December 31, 2017 and 13% in the three months ended December 31, 2016. An increase in the percentage of total revenues represented by software revenue has the impact of improving our overall gross margins. The costs of sales related to our appliances are recorded in the cost of software and products revenue.
Operating Expenses
Sales and Marketing. Sales and marketing expenses increased $8.1 million, or 8%, from $97.1 million in the three months ended December 31, 2016 to $105.1 million in the three months ended December 31, 2017. The increase is due to a $5.5 million increase in employee compensation and related expenses mainly attributable to the expansion of our sales force from the prior year, a $0.4 million increase in stock-based compensation and a $0.9 million increase in marketing expenses. Sales and marketing expenses as a percentage of total revenues was 58% infor both the three months ended December 31, 20172023 and 2016.2022.
Research and Development. Research and development expenses–Cost of subscription revenue increased $2.8$4.2 million, or 13%, from $21.2 million inrepresenting 14% of our total subscription revenue for the three months ended December 31, 20162023 compared to $24.0 million in13% for the three months ended December 31, 2017.2022. The increase is primarily due to an increase in salary and related expenses resulting from the expansion of our engineering group. Research and development expenses as a percentage of total revenues was 13% in both the three months ended December 31, 2017 and 2016. Investing in research and development has been a priority for Commvault, and we anticipate continued spending related to the development of our data and information management software applications.
General and Administrative. General and administrative expenses decreased $1.2 million, or 6%, from $21.6 million in the three months ended December 31, 2016 to $20.4 million in the three months ended December 31, 2017. The decrease is the result of a decrease in stock-based compensation. General and administrative expenses in the three months ended December 31, 2017 includes $0.2 million of net foreign currency transaction losses. General and administrative expenses as a percentage of total revenues was 11% in the three months ended December 31, 2017 and 13% in the three months ended December 31, 2016.
Depreciation and Amortization. Depreciation expense increased by $0.3 million from $2.2 million in the three months ended December 31, 2016 to $2.5 million in the three months ended December 31, 2017.
Income Tax Expense
Income tax expense was $62.6 million in the three months ended December 31, 2017 compared to an expense of $1.7 million in the three months ended December 31, 2016. The increase in income tax expense was primarily the result of the combined impact of the lower U.S. corporate income tax rate on net deferred tax assets and recording a full valuation allowance against the remaining value of net deferred tax assets.
Impact of U.S. Tax Reform
The Tax Cuts and Jobs Act (the "Act") was enacted on December 22, 2017. The Act reduces the US federal corporate tax rate from 35% to 21%, requires companies to pay a one-time transition tax on earnings of certain foreign subsidiaries that were previously tax deferred and creates new taxes on certain foreign sourced earnings. As of December 31, 2017, we have not completed the accounting for the tax effects of enactment of the Act; however, as described below, we have made a reasonable estimate of the effects on existing deferred tax balances. These amounts are provisional and subject to change. The most significant impact of the legislation for the Company was a $24.3 million reduction of the value of net deferred tax assets (which represent future tax benefits) as a result of lowering the U.S. corporate income tax rate from 35% to 21%. The Act also includes a requirement to pay a one-time transition tax on the cumulative value of earnings and profits that were previously not repatriated for U.S. income tax purposes. We have not made sufficient progress on the transition tax analysis to reasonably estimate the effects, and therefore, have not recorded provisional amounts. However, based on analysis to date the one-time transition tax is not expected to be material. No additional income taxes have been provided for any remaining undistributed
foreign earnings not subject to the transition tax, or any additional outside basis difference inherent in these entities, as these amounts continue to be indefinitely reinvested in foreign operations.
Valuation Allowance
Net deferred tax assets arise due to the recognition of income and expense items for tax purposes, which differ from those used for financial statement purposes. ASC 740, Income Taxes, provides for the recognition of deferred tax assets if realization of such assets is more likely than not. In assessing the need for a valuation allowance in the third quarter of fiscal 2018, the Company considered all available objective and verifiable evidence both positive and negative, including historical levels of pre-tax income (loss) both on a consolidated basis and tax reporting entity basis, legislative developments, expectations and risks associated with estimates of future pre-tax income, and prudent and feasible tax planning strategies. The Company currently estimates that as of March 31, 2018 both the consolidated entity and its U.S. entity will have generated a cumulative three year pre-tax loss. As a result of this analysis, the Company determined that it is more likely than not that it will not realize the benefits of its gross deferred tax assets and therefore has recorded a valuation allowance to reduce the carrying value of these gross deferred tax assets, net of the impact of the reversal of taxable temporary differences, to zero.
Nine months ended December 31, 2017 compared to nine months ended December 31, 2016
Revenues
Total revenues increased $36.2 million, or 8%, from $478.3 million in the nine months ended December 31, 2016 to $514.5 million in the nine months ended December 31, 2017.
Software and Products Revenue. Software and products revenue increased $15.8 million, or 7%, from $212.5 million in the nine months ended December 31, 2016 to $228.2 million in the nine months ended December 31, 2017. Software and products revenue represented 44% of our total revenues in both the nine months ended December 31, 2017 and 2016.
Americas, EMEA and APAC represented 53%, 33% and 14% of total software and products revenue, respectively, for the nine months ended December 31, 2017. The year-over-year change in software and products revenue in the Americas was flat, and growth in EMEA and APAC was 22% and 8%, respectively.
| |
▪ | Americas enterprise transaction revenue increased 3% due to an increase in the average dollar value of transactions but was offset by a decrease in non-enterprise transaction revenue. |
| |
▪ | EMEA software and products revenue increased as a result of a significant increase in enterprise transaction revenue. The significant increase in enterprise transaction revenue was driven by an increase in both the average dollar value and volume of such transactions. |
| |
▪ | The increase in APAC software and products revenue was the result of an increase in revenue from both enterprise and non-enterprise revenue transactions. |
| |
▪ | Our software and products revenue in EMEA and APAC is subject to changes in foreign exchange rates as more fully discussed above in the “Foreign Currency Exchange Rates’ Impact on Results of Operations” section. |
Software and products revenue derived from enterprise transactions (transactions greater than $0.1 million) represented approximately 59% of our software and products revenue in the nine months ended December 31, 2017 and approximately 55% of our software and products revenue in the nine months ended December 31, 2016. Enterprise transaction revenue increased by $18.7 million, or 16%, in the nine months ended December 31, 2017 compared to the nine months ended December 31, 2016. This increase was driven by a 20% increase in the average dollar amount of such transactions partially offset by a 3% decline in the number of transactions. The average sales price was approximately $305,000 in the nine months ended December 31, 2017 and approximately $254,000 in the nine months ended December 31, 2016. Software and products revenue derived from transactions less than $0.1 million decreased $3.0 million, or 3%, in the nine months ended December 31, 2017 compared to the nine months ended December 31, 2016.
Services Revenue. Services revenue increased $20.5 million, or 8%, from $265.8 million in the nine months ended December 31, 2016 to $286.3 million in the nine months ended December 31, 2017. Services revenue represented 56% of our total revenues in both the nine months ended December 31, 2017 and 2016. The increase in services revenue is due to a $19.7 million increase in revenue from customer support agreements as a result of software sales to new customers and renewal agreements with our installed software base.
Cost of Revenues. Total cost of revenues increased $6.1 million, or 10%, from $63.8 million in the nine months ended December 31, 2016 to $69.9 million in the nine months ended December 31, 2017. The gross margin of our services revenue
was 77% for both the nine months ended December 31, 2017 and 2016. Overall, our services revenue has lower gross margins than our software and products revenue. An increase in the percentage of total revenues represented by software revenue has the impact of improving our overall gross margins. The costs of sales related to our appliances are recorded in the cost of software and products revenue.
Operating Expenses
Sales and Marketing. Sales and marketing expenses increased $21.6 million, or 8%, from $284.0 million in the nine months ended December 31, 2016 to $305.6 million in the nine months ended December 31, 2017. The increase is primarily due to a $17.5 million increase in employee compensation and related expenses mainly attributable to the expansion of our sales force from the priorover year and a $2.8 million increase in stock-based compensation. Sales and marketing expenses as a percentage of total revenues was 59% in both the nine months ended December 31, 2017 and 2016.
Research and Development. Research and development expenses increased $8.8 million, or 14%, from $60.7 million in the nine months ended December 31, 2016 to $69.5 million in the nine months ended December 31, 2017. The increase is due to salary and related expenses resulting from the expansion of our engineering group. Research and development expenses as a percentage of total revenues was 13% in both the nine months ended December 31, 2017 and 2016. Investing in research and development has been a priority for Commvault, and we anticipate continued spending related to the development of our data and information management software applications.
General and Administrative. General and administrative expenses increased $5.0 million, or 8%, from $62.9 million in the nine months ended December 31, 2016 to $67.9 million in the nine months ended December 31, 2017. The increase is primarily the result of an increase in the cost of infrastructure related to growth in our SaaS offerings.
–Cost of perpetual license revenue increased $0.2 million and represented 5% of our total perpetual revenue for the three months ended December 31, 2023 compared to 3% for the three months ended December 31, 2022.
–Cost of customer support revenue increased $0.5 million and represented 20% of our total customer support revenue for the three months ended December 31, 2023 compared to 19% for the three months ended December 31, 2022.
–Cost of other services revenue decreased $0.3 million, representing 67% of our total other services revenue for the three months ended December 31, 2023 compared to 74% for the three months ended December 31, 2022. The decrease in cost of other services revenue was driven by timing of the delivery of certain professional services.
Operating Expenses ($ in millions)
–Sales and marketing expenses increased $4.4 million, or 5%, primarily due to increases in employee compensation and related expenses. Expensesexpenses as well as marketing spend related to Commvault's SHIFT event in New York City, partially offset by a $0.3 million decrease in stock-based compensation.
–Research and development expenses increased $1.9 million, or 6%, driven by increases in employee compensation and related expenses, partially offset by a $0.5 million decrease in stock-based compensation. Investing in research and development remains a priority for Commvault and we anticipate continued responsible spending related to the development of our software applications and hosted services.
–General and administrative expenses increased $5.1 million, or 21%, driven by $1.6 million in foreign currency transaction losses and increases in employee compensation and related expenses, including an increase of $1.3 million in stock-based compensation year over year.
–Depreciation and amortization expense decreased $1.0 million, driven by the reclassification of our owned corporate headquarters as assets held for sale in the fourth quarter of fiscal 2023.
Income Tax Expense
Income tax expense was $5.2 million in the three months ended December 31, 2023 compared to expense of $5.7 million in the three months ended December 31, 2022. The decrease in income tax expense compared to the prior year relates primarily to current federal and state taxes relative to the prior year quarter.
Nine months ended December 31, 2023 compared to nine months ended December 31, 2022
Revenues ($ in millions)
–Total revenues increased $34.8 million, or 6% year over year, driven primarily by an increase in subscription revenue, offset by decreases in perpetual license and customer support revenues. We remain focused on selling subscription arrangements through both term-based software licenses and SaaS offerings.
–Subscription revenue increased $56.0 million, or 22% year over year, driven primarily by a 92% increase in our SaaS revenue compared to the same period in the prior year. Term-based license revenue increased 7% year over year, due to an increase in the number of larger term-based license transactions (deals greater than $0.1 million) period over period and an increase in the average selling price of these transactions. Subscription revenue accounted for 50% of total revenues for the nine months ended December 31, 2017 includes less than $0.1 million of net foreign currency transaction losses2023 compared to $0.4 million of net foreign currency transaction gains in44% for the nine months ended December 31, 2016. General2022.
–Perpetual license revenue decreased $14.9 million, or 26% year over year. Our go to market motion is led by subscription and administrative expenses as a percentageperpetual licenses are generally only sold in certain verticals and geographies. Perpetual license revenue accounted for 7% of total revenues for the nine months ended December 31, 2023 compared to 10% for the nine months ended December 31, 2022.
–Customer support revenue decreased $6.2 million, or 3% year over year, driven by a $26.3 million decrease in customer support revenue attached to perpetual license support renewals, partially offset by a $20.1 million increase in support allocated to term-based license arrangements.
–Other services revenue was 13%flat compared to the same period of the prior year. Changes in other services revenue can vary period over period primarily due to the timing professional services are delivered.
We track total revenues on a geographic basis. Our Americas region includes the United States, Canada, and Latin America. Our International region primarily includes Europe, Middle East, Africa, Australia, India, Southeast Asia and China. Americas and International represented 60% and 40% of total revenues, respectively, for the nine months ended December 31, 2023. Total revenues increased 6% in both the Americas and International.
▪Total revenues in the Americas was impacted by a 24% increase in subscription revenue, offset by a 44% decrease in perpetual license revenue, driven by the shift from selling perpetual licenses to subscription arrangements. Customer support and other services revenues declined 6% and 2%, respectively.
▪The increase in International total revenues was primarily due to a 19% increase in subscription revenue, offset by a 14% decrease in perpetual license revenue. Customer support revenue increased 2% year over year. Other services revenue increased 3% year over year due to an increase in the delivery of professional services for the region as compared to the same period of the prior year.
Our total revenues in International is subject to changes in foreign exchange rates as further discussed above in the “Foreign Currency Exchange Rates’ Impact on Results of Operations” section.
Cost of Revenues and Gross Margin ($ in millions)
| | | | | | | | | | | | | | | | | | | | |
| | | Nine Months Ended December 31, |
| | 2023 | | 2022 |
| | Cost of Revenues | Gross
Margin | | Cost of Revenues | Gross
Margin |
| Subscription | | $ | 42.9 | | 86 | % | | $ | 31.6 | | 88 | % |
| Perpetual license | | 1.9 | | 96 | % | | 1.9 | | 97 | % |
| Customer support | | 44.9 | | 81 | % | | 45.1 | | 81 | % |
| Other services | | 22.7 | | 32 | % | | 22.1 | | 34 | % |
| Total | | $ | 112.5 | | 82 | % | | $ | 100.6 | | 83 | % |
–Total cost of revenues increased $11.9 million, and represented 18% and 17% of our total revenues for the nine months ended December 31, 2023 and 2022, respectively.
–Cost of subscription revenue increased $11.4 million, representing 14% of our total subscription revenue for the nine months ended December 31, 2023 compared to 12% for the nine months ended December 31, 2022. The year over year increase is primarily the result of an increase in the cost of infrastructure related to growth in our SaaS offerings.
–Cost of perpetual license revenue decreased $0.1 million and represented 4% of our total perpetual revenue for the nine months ended December 31, 2023 compared to 3% for the nine months ended December 31, 2022.
–Cost of customer support revenue decreased $0.1 million and represented 19% of our total customer support revenue for both the nine months ended December 31, 20172023 and 2016.2022.
–Cost of other services revenue increased $0.7 million, representing 68% of our total other services revenue for the nine months ended December 31, 2023 compared to 66% for the nine months ended December 31, 2022. The increase in cost of other services revenue was driven by timing of the delivery of certain professional services.
Operating Expenses ($ in millions)
–Sales and marketing expenses increased $7.0 million, or 3%, primarily due to employee compensation and sales commissions associated with increased revenues relative to the same period in the prior year as well as increases in marketing spend related to Commvault's SHIFT event in New York City. These increases were partially offset by a $2.2 million decrease in stock-based compensation.
–Research and development expenses decreased $12.6 million, or 11%, driven by decreases in employee compensation and related expenses, including a $6.8 million decrease in stock-based compensation. Investing in research and development remains a priority for Commvault and we anticipate continued responsible spending related to the development of our software applications and hosted services.
–General and administrative expenses increased $7.5 million, or 10%, driven by $1.8 million in foreign currency transaction losses and increases in employee compensation and related expenses, including an increase of $0.9 million in stock-based compensation year over year.
–Depreciation and Amortization. Depreciationamortization expense increaseddecreased $3.0 million, or 39%, driven by $0.8 million from $6.4the reclassification of our owned corporate headquarters as assets held for sale in the fourth quarter of fiscal 2023.
Income Tax Expense
Income tax expense was $17.8 million in the nine months ended December 31, 20162023 compared to $7.2expense of $14.6 million in the nine months ended December 31, 2017.
Income Tax Expense
Income tax expense was $55.3 million in the nine months ended December 31, 2017 compared to $0.8 million in the nine months ended December 31, 2016.2022. The increase in income tax expense wascompared to the prior year relates primarily to current federal and state taxes driven by the resultincrease of pre-tax income relative to the combined impactsame period in the prior year.
Liquidity and Capital Resources
As of December 31, 2017, our cash and cash equivalents balance of $314.5 million primarily consisted of cash and money market funds. In addition, as of December 31, 2017 we have short-term investments invested in U.S. Treasury Bills totaling $131.0 million. In recent fiscal years, our principal source of liquidity has been cash provided by operations.
As of December 31, 2017, the amount of2023, our cash and cash equivalents balance was $284.3 million, of which approximately $196.7 million was held outside of the United States by our foreign legal entities was approximately $184 million.entities. These balances are dispersed across manyapproximately 35 international locations around the world. We believe that such dispersion meets the current and anticipated future liquidity needs of our foreign legal entities. In the event we repatriatedneed to repatriate funds from outside of the United States, such repatriation couldwould likely be subject to restrictions by local laws and/or tax consequences, including foreign withholding taxes. As a result of recent corporate tax reform in the United States,
On December 13, 2021, we are obligated to pay a one time income tax on the cumulative total of any foreign earnings which have not been repatriated. We currently estimate this one time tax will be immaterial. Prospectively, we believe that as a result of this tax reform, we will likely be able to repatriate foreign earnings without paying U.S. income tax. However, we will remain subject to restrictions by local laws and/or tax consequences including foreign withholding taxes.
We haveentered into a five-year $250$100 million senior secured revolving credit facility (the “Credit Facility”) that expires in June 2019.with JPMorgan Chase Bank, N.A. The Credit Facility is available for share repurchases, general corporate purposes, and letters of credit. The Credit Facility contains financial maintenance covenants, including a leverage ratio and interest coverage ratio. The Credit Facility also contains certain customary events of default which would permit the lenderslender to, among other things, declare all loans then outstanding to be immediately due and payable if such default is not cured within applicable grace periods. The Credit Facility also limits our ability to incur certain additional indebtedness, create or permit liens on assets, make acquisitions, make investments, loans or advances, sell or transfer assets, pay dividends or distributions, and engage in certain transactions with foreign affiliates. Outstanding borrowings under the Credit Facility accrue interest at an annual rate equal to London Interbank Offeredthe Secured Overnight Financing Rate plus 1.50%1.25% subject to increases based on our actual leverage. The unused balance on the Credit Facility is also subject to a 0.25% annual interest charge subject to increases based on our actual leverage. As of December 31, 2017,2023, there were no borrowings under the Credit Facility and we believe we arewere in compliance with all covenants.
During the nine months ended December 31, 2017, we repurchased $91.3 million of common stock shares under our share repurchase program. Under our stock repurchase program, repurchased shares are constructively retired and returned to unissued status. Our stock repurchase program has been funded by our existing cash and cash equivalent balances as well as cash flows provided by our operations. On January 17, 2018,April 20, 2023, the Board of Directors extended the expiration dateapproved an increase of the share repurchase program to March 31, 2019 and authorized a $100.0 million increase to the existing share repurchase program so that $250.0 million was available. The Board's authorization has no expiration date. For the nine months ended December 31, 2023, we have repurchased $133.7 million is now available.
Our future stock repurchase activity is subject to the business judgment of our management and Boardcommon stock. The remaining amount available under the current authorization as of Directors, taking into consideration our historical and projected results of operations, financial condition, cash flows and other anticipated capital requirements or investment alternatives. Our stock repurchase program reduces the dilutive impact on our common shares outstanding associated with stock option exercises and our previous public and private stock offerings through the repurchase of common stock.December 31, 2023 was $122.3 million.
Our summarized cash flow information is as follows (in thousands):
| | | | | | | | | | | | | | |
| | | Nine Months Ended December 31, |
| | | 2023 | | 2022 |
| Net cash provided by operating activities | | $ | 123,813 | | | $ | 102,455 | |
| Net cash used in investing activities | | (4,289) | | | (4,147) | |
| Net cash used in financing activities | | (125,902) | | | (80,902) | |
| Effects of exchange rate - changes in cash | | 2,910 | | | (11,444) | |
| Net increase (decrease) in cash and cash equivalents | | $ | (3,468) | | | $ | 5,962 | |
|
| | | | | | | | |
| | | Nine Months Ended December 31, |
| | | 2017 | | 2016 |
| Net cash provided by operating activities | | $ | 60,828 |
| | $ | 71,054 |
|
| Net cash used in investing activities | | (15,597 | ) | | (26,160 | ) |
| Net cash used in financing activities | | (73,596 | ) | | (5,950 | ) |
| Effects of exchange rate-changes in cash | | 13,368 |
| | (10,639 | ) |
| Net increase (decrease) in cash and cash equivalents | | $ | (14,997 | ) | | $ | 28,305 |
|
–Net cash provided by operating activities was $60.8 million in the nine months ended December 31, 2017 and $71.1 million in the nine months ended December 31, 2016. In the nine months ended December 31, 2017, cash providedimpacted by operating activities was primarily due to net lossincome adjusted for the impact of non-cash charges and an increaseincreases in deferred revenue. These amounts wererevenue, partially offset by a decrease in accrued liabilities and increases in both accounts receivable and other current assets. Cash flow from operations in the nine month period ended December 31, 2017 also includes $7.9 of excess tax benefits for exercised stock options and vested restricted stock units. In prior periods excess tax benefits were classified as financing activities. In the nine months ended December 31, 2016, cash provided by operating activities was primarily due to net loss adjusted for the impact of non-cash charges, and an increase in deferred revenue and accrued expenses.commissions.
–Net cash used in investing activities was $15.6 million for the nine months ended December 31, 2017 and $26.2 million in the nine months ended December 31, 2016. In the nine months ended December 31, 2017, cash used in investing activities was related to $10.3$1.1 million in net purchasesfor the purchase of U.S. Treasury Billsequity securities and $5.3$3.2 million of capital expenditures. In the nine months ended December 31, 2016, cash used in investing activities was related to $21.7 million in net purchases of U.S. Treasury Bills and $4.5 million of capital expenditures.
–Net cash used in financing activities was $73.6 million in the nine months ended December 31, 2017 and $6.0 million in the nine months ended December 31, 2016. The cash used in financing activities in the nine months ended December 31, 2017 was the result of $91.3$133.7 million of repurchases of common shares, partially offset by $17.7$7.8 million of proceeds from employee purchases of common shares under the ESPP and the exercise of stock options and our employee stock purchase program. The cash used in financing activities in the nine months ended December 31, 2016 was due to $25.0 million of common stock repurchases, partially offset by $14.3 million of proceeds from the exercise of stock options and purchases under the employee stock purchase plan as well as $4.8 million of excess tax benefits recognized as a result of the stock option exercises and restricted stock vesting. As a result of the adoption of new accounting guidance, excess tax benefits are now included in cash from operating activities.options.
Working capital decreased $8.6$7.1 million from $318.1$140.8 million as of March 31, 20172023 to $309.5$133.7 million as of December 31, 2017.2023. The net decrease in working capital is duewas primarily to our use of cash to repurchase common sharesdriven by increases in accrued liabilities and short-term deferred revenue, partially offset by cash flow from operations and proceeds from the exercise of stock options and purchases under the employee stock purchase plan . an increase in accounts receivable.
We believe that our existing cash, cash equivalents and our cash from operations will be sufficient to meet our anticipated cash needs for working capital, income taxes, capital expenditures and potential stock repurchases for at least the next twelve months. We may seek additional funding through public or private financings or other arrangements during this period. Adequate funds may not be available when needed or may not be available on terms favorable to us, or at all. If additional funds are raised by issuing equity securities, dilution to existing stockholders will result. If we raise additional funds by obtaining loans from third parties, including borrowing under our revolving credit facility, the terms of those financing arrangements may include negative covenants or other restrictions on our business that could impair our operational flexibility, and would also require us to fund additional interest expense. If funding is insufficient at any time in the future, we may be unable to develop or enhance our products or services, take advantage of business opportunities or respond to competitive pressures, any of which could have a material adverse effect on our business, financial condition and results of operations.
Off-Balance Sheet Arrangements
As of December 31, 2017, other than our operating leases,2023, we dodid not have off-balance sheet financing arrangements, including any relationships with unconsolidated entities or financial partnerships, such as entities often referred to as structured finance or special purpose entities.
Indemnifications
Certain of our software licensing agreements contain certain provisions that indemnify our customers from any claim, suit or proceeding arising from alleged or actual intellectual property infringement. These provisions continue in perpetuity along with our software licensing agreements. We have never incurred a liability relating to one of these indemnification provisions in the past and we believe that the likelihood of any future payout relating to these provisions is remote. Therefore, we have not recorded a liability during any period related to these indemnification provisions.
Impact of Recently Issued Accounting Standards
See Note 2 of the unaudited consolidated financial statements for a discussion of the impact of recently issued accounting standard.standards.
Item 3 - Quantitative and Qualitative Disclosures about Market Risk
Interest Rate Risk
AsNone.
Foreign Currency Risk
Economic Exposure
As a global company, we face exposure to adverse movements in foreign currency exchange rates. Our international sales are generally denominated in foreign currencies and this revenuethese revenues could be materially affected by currency fluctuations. Approximately 46%47% of our salesrevenues were from outside the United States for the nine months ended December 31, 2017.2023. Our primary exposures are to fluctuations in exchange rates for the U.S. dollar versus the Euro, and to a lesser extent, the Australian dollar, British pound sterling, Canadian dollar, Chinese yuan, Indian rupee, Korean won and Singapore dollar. Changes in currency exchange rates could adversely affect our reported revenues and require us to reduce our prices to remain competitive in foreign markets, which could also have a material adverse effect on our results of operations. Historically, we have periodically reviewed and revised the pricing of our products available to our customers in foreign countries and we have not maintained excess cash balances in foreign accounts.
Transaction Exposure
Our exposure to foreign currency transaction gains and losses is primarily the result of certain net receivables due from our foreign subsidiaries and customers being denominated in currencies other than the functional currency of the subsidiary. Our foreign subsidiaries conduct their businesses in local currency and we generally do not maintain excess U.S. dollar cash balances in foreign accounts.
Foreign currency transaction gains and losses are recorded in “Generalgeneral and administrative expenses”expenses in the Consolidated Statementsconsolidated statements of Income (Loss).operations. We recognized a net foreign currency transaction losslosses of $0.2approximately $1.6 million and less than $0.1$1.8 million infor the three and nine months ended December 31, 2017.2023, respectively. We recognized net foreign currency transaction losslosses of less thanapproximately $0.3 million and $0.1 million and gain of $0.4 million infor the three and nine months ended December 31, 2016. The net foreign currency transaction gains and losses recorded in “General and administrative” expenses include settlement gains and losses on forward contracts disclosed below.2022, respectively.
To date, we have selectively hedged our exposure to foreign currency transaction gains and losses on the balance sheet through the use of forward contracts, which were not designated as hedging instruments. The duration of forward contracts utilized for hedging our balance sheet exposure is generally one to three months. Gains and losses from these contracts are recorded in general and administrative expenses. As of December 31, 2017 and March 31, 2017, we did not have any forward contracts outstanding. We recorded net realized loss of $0.2 million and gains of less than $0.1 million related to the settlement of forward exchange contracts in the three and nine months ended December 31, 2017. We recorded net realized gains and losses of less than $0.1 million related to the settlement of forward exchange contracts in the three and nine months ended December 31, 2016. In the future, we may enter into additional foreign currency based hedging contracts to reduce our exposure to significant fluctuations in currency exchange rates on the balance sheet.
PART II. OTHER INFORMATION
Item 4 - Controls and Procedures
Evaluation of Disclosure Controls and Procedures
Our management, with the participation of the Chief Executive Officer and Chief Financial Officer, has evaluated the effectiveness of the our disclosure controls and procedures, as defined in Rules 13a-15(e) and 15d-15(e) of the Securities Exchange Act of 1934, as of December 31, 2017. Based on that evaluation, the Chief Executive Officer and Chief Financial Officer concluded that our disclosure controls and procedures were effective as of December 31, 2017.
Changes in Internal Control over Financial Reporting
There was no change in our internal control over financial reporting that occurred during the third quarter of fiscal 2018 that has materially affected, or is reasonably likely to materially affect, our internal control over financial reporting.
Inherent Limitations on Internal Controls
Our management, including our Chief Executive Officer and Chief Financial Officer, do not expect that our disclosures controls and procedures or our internal controls over financial reporting will prevent or detect all error and all fraud. A control system, no matter how well designed and operated, can provide only reasonable, not absolute, assurance that the control objectives of the control system are met. Further, the design of a control system must reflect the fact that there are resource constraints, and the benefits of controls must be considered relative to their costs. Because of inherent limitations in all control systems, no evaluation of controls can provide absolute assurance that all control issues and instances of fraud, if any, within the company have been detected. These inherent limitations include the realities that judgments in decision-making can be faulty, and that breakdowns can occur because of a simple error or mistake. Additionally, controls can be circumvented by the individual acts of some persons, by collusion of two or more people, or by management override of the controls. The design of any system of controls also is based in part upon certain assumptions about the likelihood of future events, and there can be no assurance that any design will succeed in achieving its stated goals under all potential future conditions. Over time, controls may become inadequate because of changes in conditions, or the degree of compliance with the policies or procedures may deteriorate. Because of inherent limitations in a cost-effective control system, misstatements due to error or fraud may occur and not be detected.
PART II. OTHER INFORMATION
Item 1. Legal Proceedings
From time to time, we are subject to claims in legal proceedings arising in the normal course of our business. Except as discussed below, weWe do not believe that we are currently party to any pending legal action that could reasonably be expected to have a material adverse effect on our business or operating results.
On September 10, 2014, a purported class action complaint was filed Please refer to Part I, “Item 1A. Risk Factors” in the United States District Courtour Annual Report on Form 10-K for the District of New Jersey against the Company, our Chief Executive Officer and our Chief Financial Officer. The case is captioned In re Commvault Systems, Inc. Securities Litigation (Master File No. 3:14-cv-05628-MAS-LHG). The suit alleges that we made materially false and misleading statements, or failed to disclose material facts, regarding our financial results, business, operations and prospects in violation of Sections 10(b) and 20(a) of the Securities Exchange Act of 1934 and Rule 10b-5 promulgated thereunder. The suit is purportedly brought on behalf of purchasers of our common stock during the period from May 7, 2013 through April 24, 2014, and seeks compensatory damages, costs and expenses, as well as equitable or other relief. Lead plaintiff, the Arkansas Teachers Retirement System, was appointed on January 12, 2015, and onyear ended March 18, 2015, an amended complaint was filed by the plaintiffs. On December 17, 2015, the defendant’s motion to dismiss the case was granted and the case dismissed; however, the plaintiffs were permitted to re-file their claim, which they did on February 5, 2016. Defendants filed another motion to dismiss on April 5, 2016, which was denied by the court on September 30, 2016. Thereafter, discovery commenced. On October 2, 2017, the parties entered into an agreement in principle to settle the action31, 2023 for $12.5 million. The parties signed a stipulation of settlement on November 30, 2017. We have not recorded an accrual for this matter as the settlement amount is to be funded solely by our insurers. The settlement is subject to final documentation and court approval. There can be no assurance that the settlement will ultimately be approved or that it will become final. If the settlement does not occur and litigation continues, we believe that we have meritorious defenses and intend to defend the case vigorously. However, due to the inherent uncertainties of litigation, we cannot accurately predict the ultimate outcome of this matter if the litigation continues.additional information.
On April 12, 2017, a shareholder derivative complaint was filed in the United States District Court for the District of New Jersey against the Company (nominally), certain of its executive officers and certain members of the board of directors. The complaint is entitled Murashko v. Hammer, et al. (Civ. No. 3:17-cv-02533-PGS-TJB). The plaintiff filed an amended complaint on July 14, 2017. The amended complaint largely repeats the allegations made in the securities litigation also pending in the United States District Court for the District of New Jersey (In re Commvault Systems, Inc. Securities Litigation (Master File No. 3:14-cv-05628-PGS-LHG), claiming that the defendant officers and directors breached their fiduciary duties to the Company by causing, or allowing, the Company to manipulate its financial results and conceal the state of its business prospects. The suit also alleges that certain executive officers engaged in unlawful insider trading in 2013 and/or 2014 based on their knowledge of the information that was supposedly concealed. The allegations asserted in the shareholder derivative action purport to cover a period from 2013 through the present. As a derivative action, the complaint does not seek damages from the Company, but rather seeks to recover from the defendant officers and directors on behalf of the Company compensatory damages, restitution, costs and expenses, as well as equitable or other relief. On August 29, 2017, all of the defendants, including the Company, filed a motion to dismiss the derivative action, and a hearing took place on December 18, 2017. On November 30, 2017, a virtually identical shareholder derivative complaint was filed in state court in New Jersey entitled Lee v. Hammer, et al., Civ. 201-17 (N.J. Super. Ct.). The Lee case has been voluntarily stayed by agreement of the parties pending a ruling on the motion to dismiss in the Murashko complaint. Due to the inherent uncertainties of litigation, we cannot accurately predict the ultimate outcome of these matters. We are unable at this time to determine whether the outcome of the litigations will have a material impact on our results of operations, financial condition or cash flows. As of December 31, 2017, we have not recorded an accrual for these matters.
On February 27, 2017, Realtime Data LLC d/b/a/ IXO (“Realtime”), a non-practicing entity, sued us and Spectra Logic Corporation in the Eastern District of Texas for alleged infringement of four patents: U.S. Patent Nos. 9,054,728, 7,415,530, 9,116,908, and 8,717,204. Realtime dismissed the case in Texas and refiled this case in the District of Delaware on July 10, 2017. Realtime has sued numerous other companies for infringement of these and other patents. Realtime seeks monetary damages and an injunction. We responded to the complaint by filing a motion to dismiss on the grounds that the patents are directed to patent-ineligible subject matter. The Court has not yet ruled on this motion. Due to the inherent uncertainties of litigation, we cannot accurately predict the ultimate outcome of this matter. We are unable at this time to determine whether the outcome of the litigation will have a material impact on our results of operations, financial condition or cash flows. We intend to defend ourselves vigorously. As of December 31, 2017, we have not recorded an accrual for this matter.
Item 1A. Risk Factors
In addition to the other information set forth in this report, you should carefully consider the factors discussed in Part I, “Item 1A. Risk Factors” in our Annual Report on Form 10-K for the year ended March 31, 2017,2023, which are incorporated herein by reference, and could materially affect our business, financial condition or future results. Additional risks and uncertainties not currently known to us or that we currently deem to be immaterial also may materially adversely affect our business, financial condition and/or operating results. If any of the risks actually occur, our business, financial conditions or results of operations could be negatively affected. In that case, the trading price of our stock could decline, and our stockholders may lose part or all of their investment. There have been no material changes from the risk factors set forth in Part I, “Item 1A. Risk Factors” in our Annual Report on Form 10-K for the year ended March 31, 2023.
Item 2. Unregistered SaleSales of Equity Securities and Use of Proceeds
Purchases of Equity Securities by the Issuer
On April 20, 2023, the Board approved an increase of the existing share repurchase program so that $250.0 million was available. The Board's authorization has no expiration date. During the third fiscal quarter of the fiscal 2018,three months ended December 31, 2023, we repurchased $80.1$51.3 million of common stock, or 1,498,966approximately 0.7 million shares, under our share repurchase program. As of December 31, 2023, the remaining amount available under the current authorization was $122.3 million. A summary of our repurchases of common stock during the three months ended December 31, 2017 is as follows:
| | | | | | | | | | | | | | | | | | | | | | | | | | |
| Period | | Total number of shares purchased | | Average price paid per share | | Total number of shares purchased as part of publicly announced programs | | Approximate dollar value of shares that may yet be purchased under the program
(in thousands) |
| October 1-31, 2023 | | 163,248 | | | $ | 67.07 | | | 163,248 | | | $162,659 |
| November 1-30, 2023 | | 292,236 | | | $ | 70.05 | | | 292,236 | | | $142,190 |
| December 1-31, 2023 | | 255,669 | | | $ | 77.75 | | | 255,669 | | | $122,311 |
| Three months ended December 31, 2023 | | 711,153 | | | $ | 72.13 | | | 711,153 | | | |
|
| | | | | | | | | | | | | | | |
| Period | | Total number of shares purchased | | Average price paid per share | | Total number of shares purchased as part of publicly announced programs | | Approximate dollar value of shares that may yet be purchased under the program | |
| October 2017 | | 321,600 |
| | $ | 51.81 |
| | 321,600 |
| | $ | 97,090,726 |
| |
| November 2017 | | 1,177,366 |
| | $ | 53.84 |
| | 1,177,366 |
| | $ | 33,749,434 |
| |
| December 2017 | | — |
| | $ | — |
| | — |
| | $ | 33,749,434 |
| * |
| Three months ended December 31, 2017 | | 1,498,966 |
| | $ | 53.40 |
| | 1,498,966 |
| | | |
*On January 17, 2018, the Board of Directors extended the expiration date of the share repurchase program to March 31, 2019 and authorized a $100.0 million increase to the existing share repurchase program so that $133.7 million is now available.
Item 3. Defaults upon Senior Securities
NoneNone.
Item 4. Mine Safety Disclosures
Not ApplicableApplicable.
Item 5. Other Information
NoneOn December 4, 2023, Sanjay Mirchandani, Chief Executive Officer, adopted a Rule 10b5-1 trading arrangement intended to satisfy the affirmative defense of Rule 10b5-1(c) for the sale of up to approximately 86,000 shares of the Company’s common stock. The plan is in effect until December 31, 2024.
On December 4, 2023, Gary Merrill, Chief Financial Officer, adopted a Rule 10b5-1 trading arrangement intended to satisfy the affirmative defense of Rule 10b5-1(c) for the sale of up to approximately 13,000 shares of the Company’s common stock. The plan is in effect until November 29, 2024. During the three months ended December 31, 2023, no other directors or officers of the Company adopted or terminated any Rule 10b5-1 trading arrangement or “Non-Rule 10b5-1 trading arrangement” as each term is defined in Item 408 of Regulation S-K.
Item 4 - Controls and Procedures
Evaluation of Disclosure Controls and Procedures
Our management, with the participation of the Chief Executive Officer and Chief Financial Officer, has evaluated the effectiveness of our disclosure controls and procedures, as defined in Rules 13a-15(e) and 15d-15(e) of the Securities Exchange Act of 1934, as amended, as of December 31, 2023. Based on that evaluation, the Chief Executive Officer and Chief Financial Officer concluded that our disclosure controls and procedures were effective as of December 31, 2023.
Changes in Internal Control over Financial Reporting
There was no change in our internal control over financial reporting that occurred during the third quarter of fiscal 2024 that has materially affected, or is reasonably likely to materially affect, our internal control over financial reporting.
Inherent Limitations on Internal Controls
Our management, including our Chief Executive Officer and Chief Financial Officer, do not expect that our disclosure controls and procedures or our internal control over financial reporting will prevent or detect all error and fraud. A control system, no matter how well designed and operated, can provide only reasonable, not absolute, assurance that the control objectives of the control system are met. Further, the design of a control system must reflect the fact that there are resource constraints, and the benefits of controls must be considered relative to their costs. Because of inherent limitations in all control systems, no evaluation of controls can provide absolute assurance that all control issues and instances of fraud, if any, within the company have been detected. These inherent limitations include the realities that judgments in decision-making can be faulty, and that breakdowns can occur because of a simple error or mistake. Additionally, controls can be circumvented by the individual acts of some persons, by collusion of two or more people, or by management override of the controls. The design of any system of controls also is based in part upon certain assumptions about the likelihood of future events, and there can be no assurance that any design will succeed in achieving its stated goals under all potential future conditions. Over time, controls may become inadequate because of changes in conditions, or the degree of compliance with the policies or procedures may deteriorate. Because of inherent limitations in a cost-effective control system, misstatements due to error or fraud may occur and not be detected.
Item 6. Exhibits
A list of exhibits filed herewith is included on the Exhibit Index, which immediately precedes such exhibits and is incorporated herein by reference. | | | | | |
| Exhibit No. | Description |
| Certification of Chief Executive Officer Pursuant to Section 302 of the Sarbanes-Oxley Act of 2002 |
| Certification of Chief Financial Officer Pursuant to Section 302 of the Sarbanes-Oxley Act of 2002 |
| Certification of Chief Executive Officer Pursuant to Section 906 of the Sarbanes-Oxley Act of 2002 |
| Certification of Chief Financial Officer Pursuant to Section 906 of the Sarbanes-Oxley Act of 2002 |
| 101.INS | XBRL Instance Document - the instance document does not appear in the Interactive Data File because its XBRL tags are embedded within the Inline XBRL document |
| 101.SCH | XBRL Taxonomy Extension Schema Document |
| 101.CAL | XBRL Taxonomy Extension Calculation Linkbase Document |
| 101.DEF | XBRL Taxonomy Extension Definition Linkbase Document |
| 101.LAB | XBRL Taxonomy Extension Label Linkbase Document |
| 101.PRE | XBRL Taxonomy Extension Presentation Linkbase Document |
| 104 | Cover Page Interactive Data File (formatted as Inline XBRL and contained in Exhibit 101) |
| |
| * Furnished herewith |
Signatures
Pursuant to the requirements of the Securities Exchange Act of 1934, the registrant has duly caused this report to be signed on its behalf by the undersigned thereunto duly authorized.
| | | | | | | | | | | | | | |
| | | | | |
| | | Commvault Systems, Inc. |
| | | |
| Dated: | January 31, 2024 | | By: | /s/ Sanjay Mirchandani |
| Dated: | January 25, 2018 | | By: | /s/ N. Robert HammerSanjay Mirchandani |
| | | | N. Robert Hammer |
| | | Chairman,Director, President and Chief Executive Officer |
| | | | (Principal Executive Officer) |
| | | |
| Dated: | January 25, 201831, 2024 | | By: | /s/ Brian CarolanGary Merrill |
| | | | Brian CarolanGary Merrill |
| | | | Vice President and Chief Financial Officer |
EXHIBIT INDEX
|
| |
| Exhibit
No.
| Description
| Certification of Chief Executive Officer Pursuant to Section 302 of the Sarbanes-Oxley Act of 2002 |
| Certification of Chief(Principal Financial Officer Pursuant to Section 302 of the Sarbanes-Oxley Act of 2002 |
| Certification of Chief Executive Officer Pursuant to Section 906 of the Sarbanes-Oxley Act of 2002 |
| Certification of Chief Financial Officer Pursuant to Section 906 of the Sarbanes-Oxley Act of 2002 |
101.INS | XBRL Instance Document |
101.SCH | XBRL Taxonomy Extension Schema Document |
101.CAL | XBRL Taxonomy Extension Calculation Linkbase Document |
101.DEF | XBRL Taxonomy Extension Definition Linkbase Document |
101.LAB | XBRL Taxonomy Extension Label Linkbase Document |
101.PRE | XBRL Taxonomy Extension Presentation Linkbase DocumentOfficer) |