UNITED STATES
SECURITIES AND EXCHANGE COMMISSION
Washington, D.C. 20549
FORM 10-Q
☒ Quarterly Report pursuant to Section 13 or 15(d) of the Securities Exchange Act of 1934
For the quarterly period ended: September 30, 20202021
☐ Transition report pursuant to Section 13 or 15(d) of the Securities Exchange Act of 1934
Commission File Number: 1-33026
Commvault Systems, Inc.
(Exact name of registrant as specified in its charter)
| | | | | | | | |
| Delaware | | 22-3447504 |
(State or other jurisdiction of
incorporation or organization) | | (I.R.S. Employer
Identification No.) |
1 Commvault Way
Tinton Falls, New Jersey
07724
(Address of principal executive offices)offices, including zip code)
(Zip Code)
(732) 870-4000
(Registrant’s telephone number, including area code)
Securities registered pursuant to Section 12(b) of the Act:
| | | | | | | | |
| Title of each class | Trading Symbol(s) | Name of each exchange on which registered |
| Common Stock | CVLT | The NASDAQ Stock Market |
Preferred Stock Purchase Rights | | The NASDAQ Stock Market |
Indicate by check mark whether the registrant (1) has filed all reports required to be filed by the Section 13 or 15(d) of the Securities Exchange Act of 1934 during the preceding 12 months (or for such period that the Registrant was required to file such reports), and (2) has been subject to such filing requirements for the past 90 days. Yes x No ¨
Indicate by check mark whether the registrant has submitted electronically every Interactive Data File required to be submitted pursuant to Rule 405 of Regulation S-T (§232.405 of this chapter) during the preceding 12 months (or for such shorter period that registrant was required to submit such files.) Yes x No ¨
Indicate by check mark whether the registrant is a large accelerated filer, an accelerated filer, a non-accelerated filer, a smaller reporting company or an emerging growth company. See definition of “large accelerated filer”, "accelerated filer", "smaller reporting company" and "emerging growth company" in rule 12b-2 of the Exchange Act. (Check one):
| | | | | | | | | | | | | | | | | | | | | | | |
| Large accelerated filer | ☑x | Accelerated filer | ☐ | Non-accelerated filer | ☐ | Smaller reporting company | ☐ |
| Emerging growth company | ☐ | | | | | | |
| If an emerging growth company, indicate by check mark if the registrant has elected not to use the extended transition period for complying with any new or revised financial accounting standards provided pursuant to Section 13 (a) of the Exchange Act | ☐ |
Indicate by check mark whether the registrant is a shell company (as defined in Rule 12b-2 of the Exchange Act). Yes ☐ No x
As of October 27, 2020,25, 2021, there were 47,130,33145,508,675 shares of the registrant’s common stock, $0.01 par value, outstanding.
COMMVAULT SYSTEMS, INC.
FORM 10-Q
INDEX
| | | | | | | | |
| | | Page |
| Part I – FINANCIAL INFORMATION |
| Item 1. | Financial Statements and Notes | |
| | |
| | |
| | |
| | |
| | |
| | |
| Item 2. | | |
| Item 3. | | |
| Item 4. | | |
| | |
| |
| Item 1. | | |
| Item 1A. | | |
| Item 2. | | |
| Item 3. | | |
| Item 4. | | |
| Item 5. | | |
| Item 6. | | |
| | |
| |
Commvault Systems, Inc.
Consolidated Balance Sheets
(In thousands, except per share data)
(Unaudited)
| | | September 30,
2020 | | March 31,
2020 | | September 30,
2021 | | March 31,
2021 |
| ASSETS | ASSETS | | | | | ASSETS | | | | |
| Current assets: | Current assets: | | Current assets: | |
| Cash and cash equivalents | Cash and cash equivalents | | $ | 383,153 | | | $ | 288,082 | | Cash and cash equivalents | | $ | 295,807 | | | $ | 397,237 | |
| Restricted cash | | 0 | | | 8,000 | | |
| Short-term investments | | 10,845 | | | 43,645 | | |
| | Trade accounts receivable, net | Trade accounts receivable, net | | 138,957 | | | 146,990 | | Trade accounts receivable, net | | 166,272 | | | 188,126 | |
| Other current assets | Other current assets | | 26,038 | | | 26,969 | | Other current assets | | 20,651 | | | 22,237 | |
| Total current assets | Total current assets | | 558,993 | | | 513,686 | | Total current assets | | 482,730 | | | 607,600 | |
| | Property and equipment, net | Property and equipment, net | | 113,014 | | | 114,519 | | Property and equipment, net | | 109,557 | | | 112,779 | |
| Operating lease assets | Operating lease assets | | 18,691 | | | 15,009 | | Operating lease assets | | 17,925 | | | 20,778 | |
| Deferred commissions cost | Deferred commissions cost | | 32,726 | | | 31,394 | | Deferred commissions cost | | 42,351 | | | 38,444 | |
| Intangible assets, net | | 0 | | | 46,350 | | |
| | Goodwill | Goodwill | | 112,435 | | | 112,435 | | Goodwill | | 112,435 | | | 112,435 | |
| Other assets | Other assets | | 16,119 | | | 11,683 | | Other assets | | 14,756 | | | 12,137 | |
| Total assets | Total assets | | $ | 851,978 | | | $ | 845,076 | | Total assets | | $ | 779,754 | | | $ | 904,173 | |
| LIABILITIES AND STOCKHOLDERS’ EQUITY | LIABILITIES AND STOCKHOLDERS’ EQUITY | | | | | LIABILITIES AND STOCKHOLDERS’ EQUITY | | | | |
| Current liabilities: | Current liabilities: | | Current liabilities: | |
| Accounts payable | Accounts payable | | $ | 253 | | | $ | 307 | | Accounts payable | | $ | 178 | | | $ | 374 | |
| Accrued liabilities | Accrued liabilities | | 79,112 | | | 87,051 | | Accrued liabilities | | 85,604 | | | 112,148 | |
| Current portion of operating lease liabilities | Current portion of operating lease liabilities | | 7,563 | | | 7,699 | | Current portion of operating lease liabilities | | 6,455 | | | 7,469 | |
| Deferred revenue | Deferred revenue | | 227,777 | | | 233,497 | | Deferred revenue | | 247,578 | | | 253,211 | |
| Total current liabilities | Total current liabilities | | 314,705 | | | 328,554 | | Total current liabilities | | 339,815 | | | 373,202 | |
| Deferred revenue, less current portion | Deferred revenue, less current portion | | 97,506 | | | 92,723 | | Deferred revenue, less current portion | | 124,833 | | | 119,231 | |
| Deferred tax liabilities, net | Deferred tax liabilities, net | | 739 | | | 849 | | Deferred tax liabilities, net | | 762 | | | 761 | |
| Long-term operating lease liabilities | Long-term operating lease liabilities | | 12,574 | | | 8,808 | | Long-term operating lease liabilities | | 13,009 | | | 15,419 | |
| Other liabilities | Other liabilities | | 6,978 | | | 2,238 | | Other liabilities | | 1,557 | | | 1,526 | |
| Commitments and contingencies | | |
| Commitments and contingencies (Note 5) | | Commitments and contingencies (Note 5) | | 0 | | 0 |
| Stockholders’ equity: | Stockholders’ equity: | | Stockholders’ equity: | |
| Preferred stock, $0.01 par value: 50,000 shares authorized, 0 shares issued and outstanding | | 0 | | | 0 | | |
| Common stock, $0.01 par value: 250,000 shares authorized, 46,685 shares and 46,011 shares issued and outstanding at September 30, 2020 and March 31, 2020, respectively | | 464 | | | 458 | | |
| Preferred stock, $0.01 par value: 50,000 shares authorized, no shares issued and outstanding | | Preferred stock, $0.01 par value: 50,000 shares authorized, no shares issued and outstanding | | — | | | — | |
| Common stock, $0.01 par value: 250,000 shares authorized, 45,374 shares and 46,482 shares issued and outstanding at September 30, 2021 and March 31, 2021, respectively | | Common stock, $0.01 par value: 250,000 shares authorized, 45,374 shares and 46,482 shares issued and outstanding at September 30, 2021 and March 31, 2021, respectively | | 452 | | | 463 | |
| Additional paid-in capital | Additional paid-in capital | | 1,023,459 | | | 978,659 | | Additional paid-in capital | | 1,119,738 | | | 1,069,695 | |
| Accumulated deficit | Accumulated deficit | | (592,762) | | | (553,790) | | Accumulated deficit | | (808,749) | | | (665,774) | |
| Accumulated other comprehensive loss | Accumulated other comprehensive loss | | (11,685) | | | (13,423) | | Accumulated other comprehensive loss | | (11,663) | | | (10,350) | |
| Total stockholders’ equity | Total stockholders’ equity | | 419,476 | | | 411,904 | | Total stockholders’ equity | | 299,778 | | | 394,034 | |
| Total liabilities and stockholders’ equity | Total liabilities and stockholders’ equity | | $ | 851,978 | | | $ | 845,076 | | Total liabilities and stockholders’ equity | | $ | 779,754 | | | $ | 904,173 | |
See accompanying unaudited notes to consolidated financial statements
Commvault Systems, Inc.
Consolidated Statements of Operations
(In thousands, except per share data)
(Unaudited)
| | | | | Three Months Ended September 30, | | Six Months Ended September 30, | | | | Three Months Ended September 30, | | Six Months Ended September 30, |
| | | | 2020 | | 2019 | | 2020 | | 2019 | | | | 2021 | | 2020 | | 2021 | | 2020 |
| Revenues: | Revenues: | | | | | | | | | Revenues: | | | | | | | | |
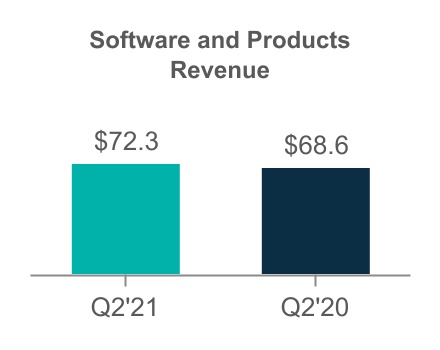
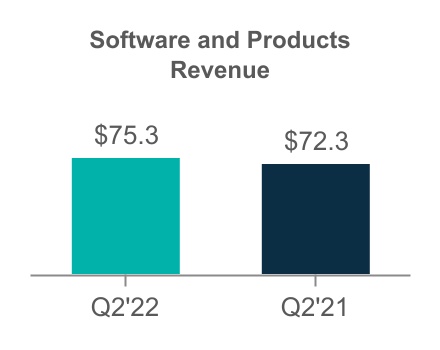
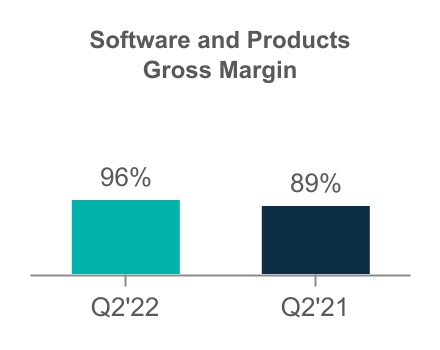
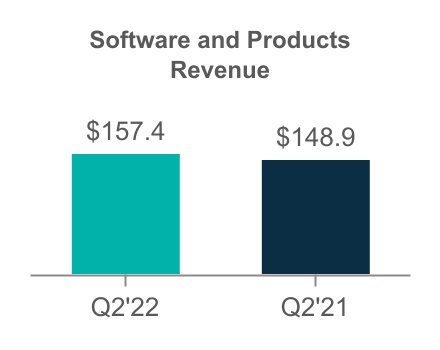
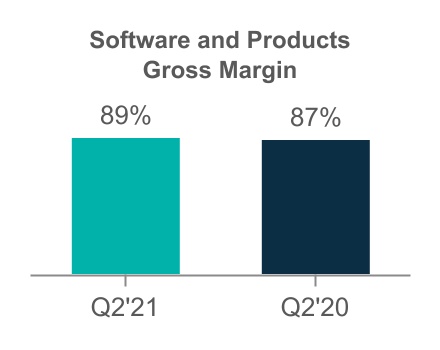
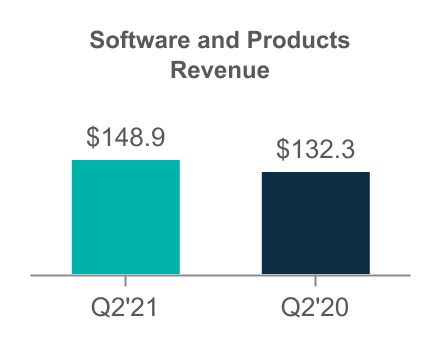
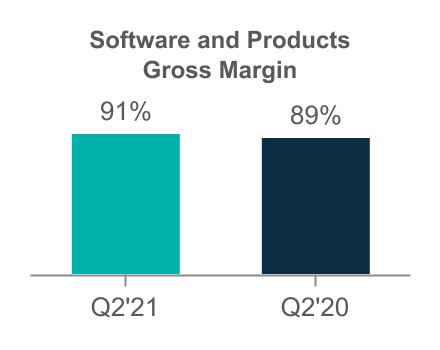
| Software and products | Software and products | | $ | 72,309 | | | $ | 68,595 | | | $ | 148,863 | | | $ | 132,269 | | | Software and products | | $ | 75,261 | | | $ | 72,309 | | | $ | 157,423 | | | $ | 148,863 | |
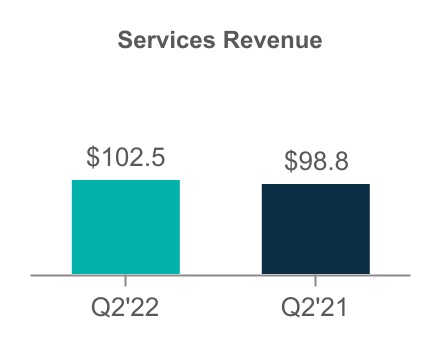
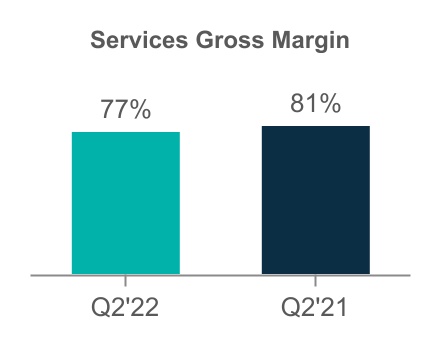
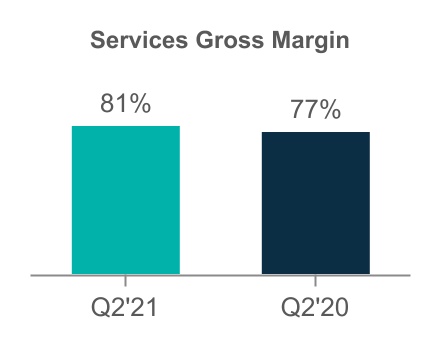
| Services | Services | | 98,830 | | | 98,987 | | | 195,276 | | | 197,516 | | | Services | | 102,579 | | | 98,830 | | | 203,838 | | | 195,276 | |
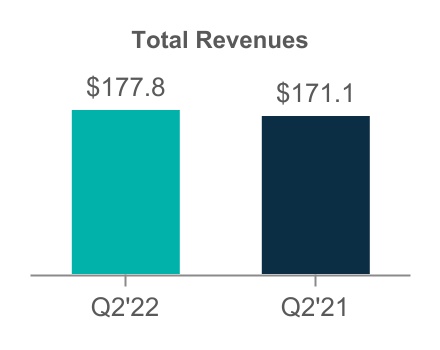
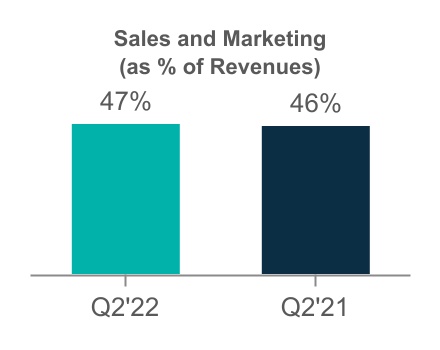
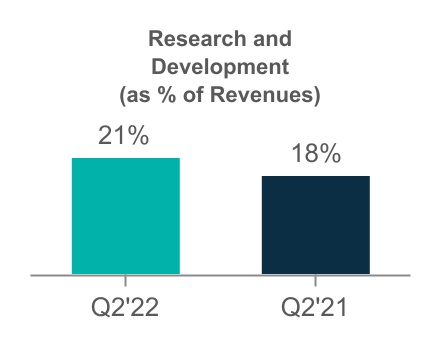
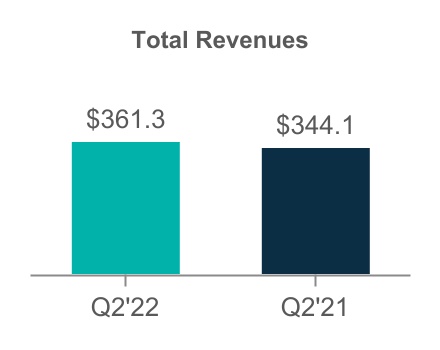
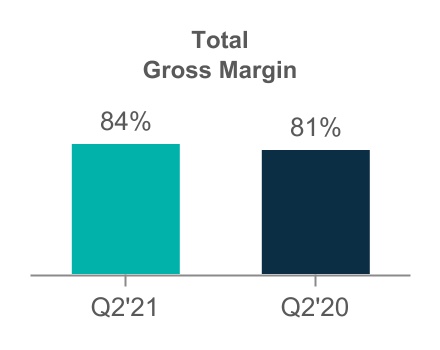
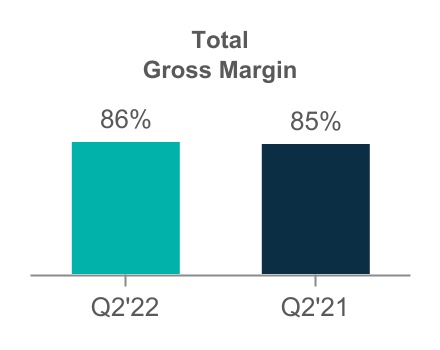
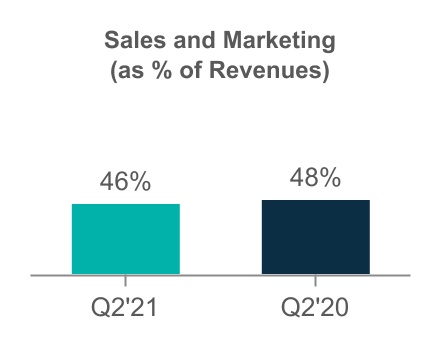
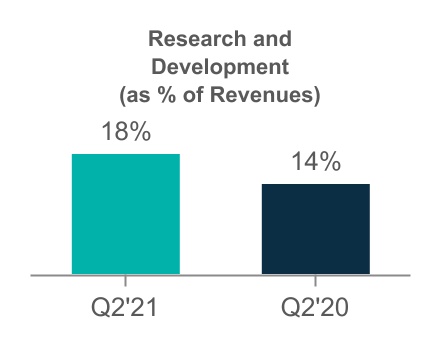
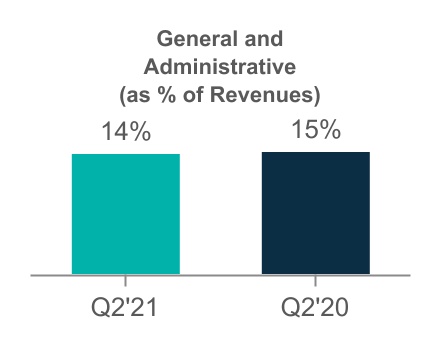
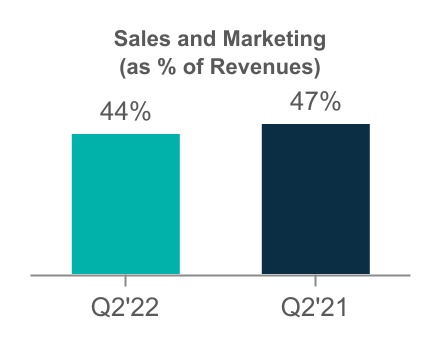
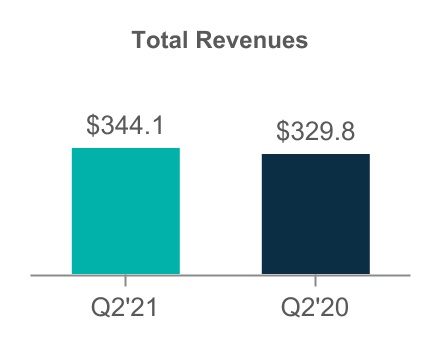
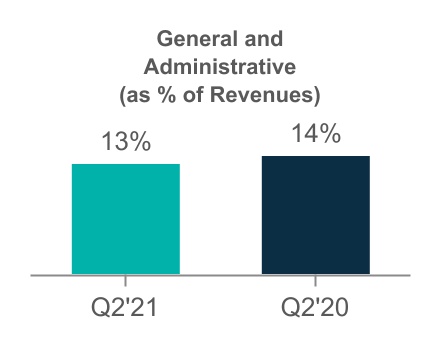
| Total revenues | Total revenues | | 171,139 | | | 167,582 | | | 344,139 | | | 329,785 | | | Total revenues | | 177,840 | | | 171,139 | | | 361,261 | | | 344,139 | |
| Cost of revenues: | Cost of revenues: | | Cost of revenues: | |
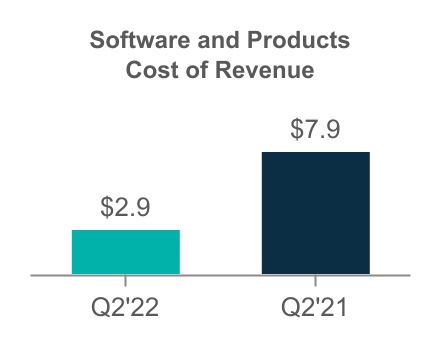
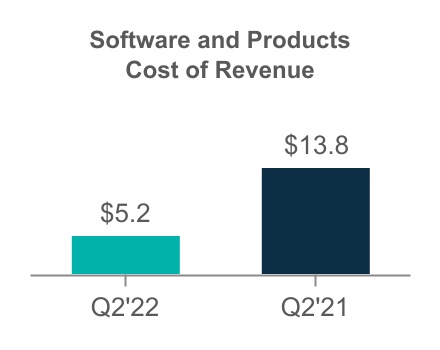
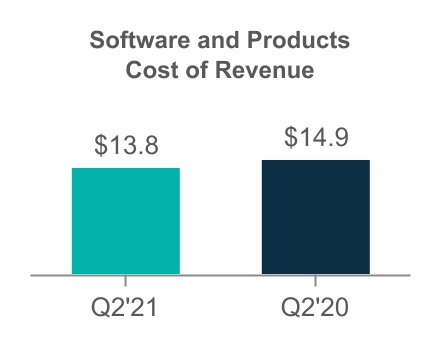
| Software and products | Software and products | | 7,903 | | | 8,831 | | | 13,750 | | | 14,861 | | | Software and products | | 2,894 | | | 7,903 | | | 5,200 | | | 13,750 | |
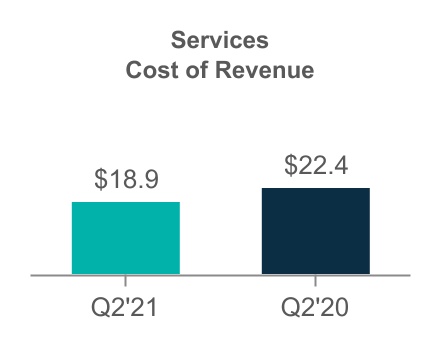
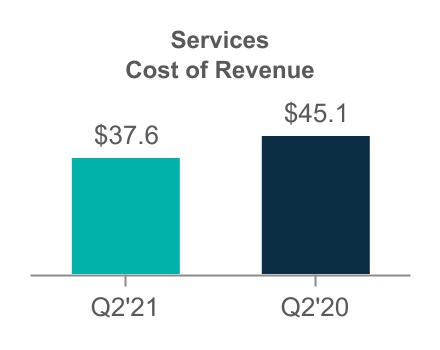
| Services | Services | | 18,896 | | | 22,410 | | | 37,600 | | | 45,100 | | | Services | | 23,680 | | | 18,896 | | | 46,649 | | | 37,600 | |
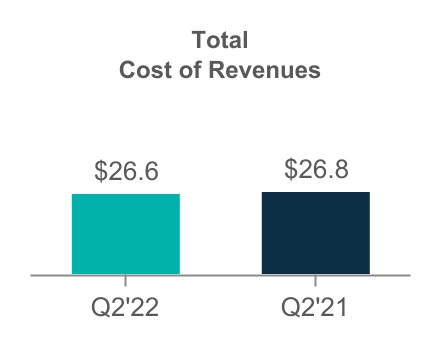
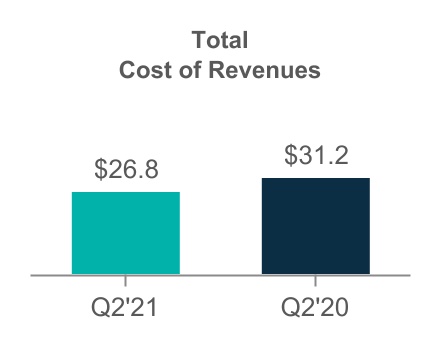
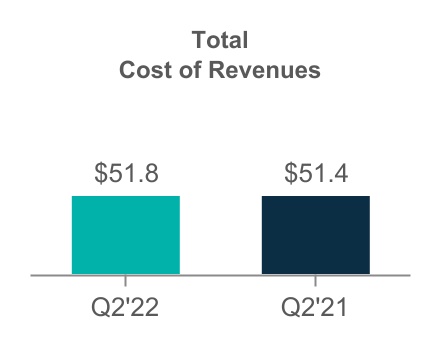
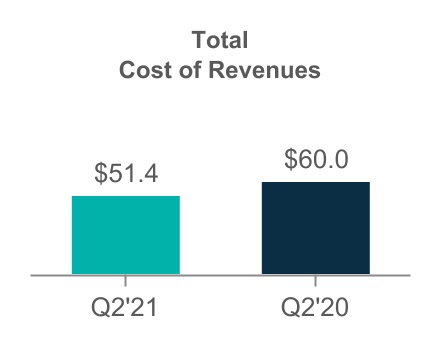
| Total cost of revenues | Total cost of revenues | | 26,799 | | | 31,241 | | | 51,350 | | | 59,961 | | | Total cost of revenues | | 26,574 | | | 26,799 | | | 51,849 | | | 51,350 | |
| Gross margin | Gross margin | | 144,340 | | | 136,341 | | | 292,789 | | | 269,824 | | | Gross margin | | 151,266 | | | 144,340 | | | 309,412 | | | 292,789 | |
| Operating expenses: | Operating expenses: | | Operating expenses: | |
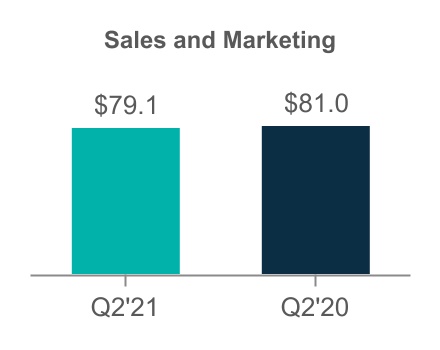
| Sales and marketing | Sales and marketing | | 79,069 | | | 80,960 | | | 160,745 | | | 168,345 | | | Sales and marketing | | 82,928 | | | 79,069 | | | 159,289 | | | 160,745 | |
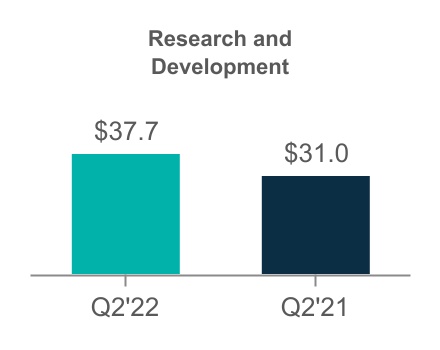
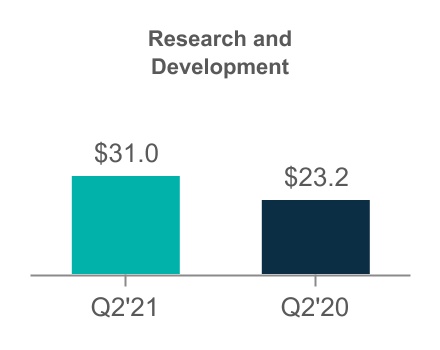
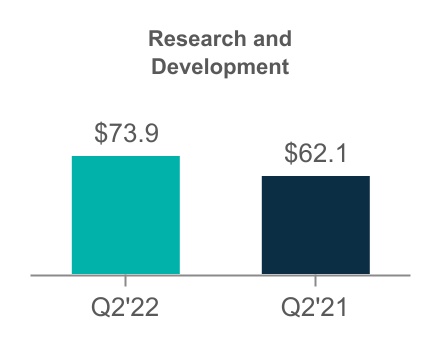
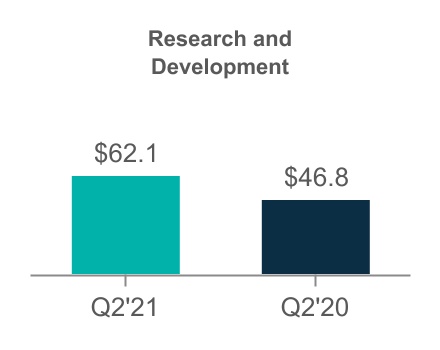
| Research and development | Research and development | | 30,955 | | | 23,227 | | | 62,097 | | | 46,807 | | | Research and development | | 37,726 | | | 30,955 | | | 73,861 | | | 62,097 | |
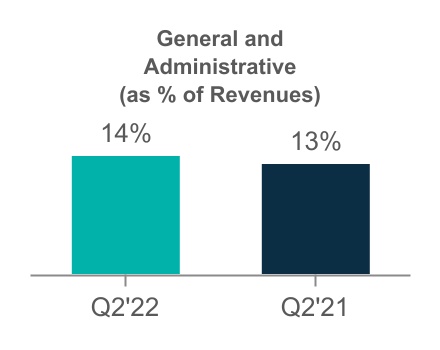
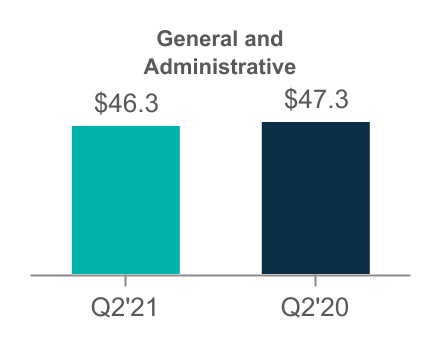
| General and administrative | General and administrative | | 24,748 | | | 24,753 | | | 46,307 | | | 47,260 | | | General and administrative | | 25,358 | | | 24,748 | | | 51,787 | | | 46,307 | |
| Restructuring | Restructuring | | 5,767 | | | 12,851 | | | 8,091 | | | 16,930 | | | Restructuring | | 636 | | | 5,767 | | | 2,082 | | | 8,091 | |
| Impairment of intangible assets | Impairment of intangible assets | | 40,700 | | | 0 | | | 40,700 | | | 0 | | | Impairment of intangible assets | | — | | | 40,700 | | | — | | | 40,700 | |
| Depreciation and amortization | Depreciation and amortization | | 5,053 | | | 2,719 | | | 10,118 | | | 5,325 | | | Depreciation and amortization | | 2,352 | | | 5,053 | | | 4,633 | | | 10,118 | |
| Total operating expenses | Total operating expenses | | 186,292 | | | 144,510 | | | 328,058 | | | 284,667 | | | Total operating expenses | | 149,000 | | | 186,292 | | | 291,652 | | | 328,058 | |
| Loss from operations | | (41,952) | | | (8,169) | | | (35,269) | | | (14,843) | | | |
| Income (loss) from operations | | Income (loss) from operations | | 2,266 | | | (41,952) | | | 17,760 | | | (35,269) | |
| Interest income | Interest income | | 249 | | | 1,561 | | | 592 | | | 3,484 | | | Interest income | | 289 | | | 249 | | | 423 | | | 592 | |
| Loss before income taxes | | (41,703) | | | (6,608) | | | (34,677) | | | (11,359) | | | |
| Income (loss) before income taxes | | Income (loss) before income taxes | | 2,555 | | | (41,703) | | | 18,183 | | | (34,677) | |
| Income tax expense (benefit) | Income tax expense (benefit) | | (532) | | | 476 | | | 4,211 | | | 2,571 | | | Income tax expense (benefit) | | 824 | | | (532) | | | 2,555 | | | 4,211 | |
| Net loss | | $ | (41,171) | | | $ | (7,084) | | | $ | (38,888) | | | $ | (13,930) | | | |
| Net loss per common share: | | | | | | | | |
| Net income (loss) | | Net income (loss) | | $ | 1,731 | | | $ | (41,171) | | | $ | 15,628 | | | $ | (38,888) | |
| Net income (loss) per common share: | | Net income (loss) per common share: | | | | | | | |
| Basic | Basic | | $ | (0.89) | | | $ | (0.16) | | | $ | (0.84) | | | $ | (0.31) | | | Basic | | $ | 0.04 | | | $ | (0.89) | | | $ | 0.34 | | | $ | (0.84) | |
| Diluted | Diluted | | $ | (0.89) | | | $ | (0.16) | | | $ | (0.84) | | | $ | (0.31) | | | Diluted | | $ | 0.04 | | | $ | (0.89) | | | $ | 0.33 | | | $ | (0.84) | |
| Weighted average common shares outstanding: | Weighted average common shares outstanding: | | | | | | | | Weighted average common shares outstanding: | | | | | | | |
| Basic | Basic | | 46,516 | | | 45,277 | | | 46,354 | | | 45,363 | | | Basic | | 45,743 | | | 46,516 | | | 45,960 | | | 46,354 | |
| Diluted | Diluted | | 46,516 | | | 45,277 | | | 46,354 | | | 45,363 | | | Diluted | | 47,599 | | | 46,516 | | | 47,936 | | | 46,354 | |
See accompanying unaudited notes to consolidated financial statements
Commvault Systems, Inc.
Consolidated Statements of Comprehensive LossIncome (Loss)
(In thousands)
(Unaudited)
| | | | | Three Months Ended September 30, | | Six Months Ended September 30, | | | Three Months Ended September 30, | | Six Months Ended September 30, |
| | | | 2020 | | 2019 | | 2020 | | 2019 | | | 2021 | | 2020 | | 2021 | | 2020 |
| Net loss | | (41,171) | | | (7,084) | | | (38,888) | | | $ | (13,930) | | |
| Net income (loss) | | Net income (loss) | | $ | 1,731 | | | $ | (41,171) | | | $ | 15,628 | | | $ | (38,888) | |
| Other comprehensive income (loss): | Other comprehensive income (loss): | | | Other comprehensive income (loss): | | |
| Foreign currency translation adjustment | Foreign currency translation adjustment | | 788 | | | (1,138) | | | 1,738 | | | $ | (1,165) | | Foreign currency translation adjustment | | (722) | | | 788 | | | (1,313) | | | 1,738 | |
| Comprehensive loss | | $ | (40,383) | | | $ | (8,222) | | | $ | (37,150) | | | $ | (15,095) | | |
| Comprehensive income (loss) | | Comprehensive income (loss) | | $ | 1,009 | | | $ | (40,383) | | | $ | 14,315 | | | $ | (37,150) | |
See accompanying unaudited notes to consolidated financial statements
Commvault Systems, Inc.
Consolidated Statements of Stockholders’ Equity
(In thousands)
(Unaudited)
| | | | | | | | | | | | | | | | | | | | | | | | | | | | | | | | | | | | | | |
| | |
Common Stock | | Additional
Paid – In
Capital | | Accumulated
Deficit | | Accumulated
Other
Comprehensive
Loss | | Total |
| | | Shares | | Amount | | | | |
| Balance as of June 30, 2020 | | 46,321 | | | $ | 461 | | | $ | 997,838 | | | $ | (551,591) | | | $ | (12,473) | | | $ | 434,235 | |
| Stock-based compensation | | | | | | 20,584 | | | | | | | 20,584 | |
| Share issuances related to stock-based compensation | | 364 | | | 3 | | | 5,037 | | | | | | | 5,040 | |
| | | | | | | | | | | | |
| | | | | | | | | | | | |
| Net loss | | | | | | | | (41,171) | | | | | (41,171) | |
| Other comprehensive income | | | | | | | | | | 788 | | | 788 | |
| Balance as of September 30, 2020 | | 46,685 | | | $ | 464 | | | $ | 1,023,459 | | | $ | (592,762) | | | $ | (11,685) | | | $ | 419,476 | |
| | | | | | | | | | | | | | | | | | | | | | | | | | | | | | | | | | | | | | |
| | |
Common Stock | | Additional
Paid – In
Capital | | Accumulated
Deficit | | Accumulated
Other
Comprehensive
Loss | | Total |
| | | Shares | | Amount | | | | |
| Balance as of June 30, 2021 | | 46,066 | | | $ | 459 | | | $ | 1,095,903 | | | $ | (730,883) | | | $ | (10,941) | | | $ | 354,538 | |
| Stock-based compensation | | | | | | 26,449 | | | | | | | 26,449 | |
| Share issuances related to stock-based compensation | | 467 | | | 5 | | | 7,821 | | | | | | | 7,826 | |
| Repurchase of common stock | | (1,159) | | | (12) | | | (10,435) | | | (79,597) | | | | | (90,044) | |
| | | | | | | | | | | | |
| Net income | | | | | | | | 1,731 | | | | | 1,731 | |
| Other comprehensive loss | | | | | | | | | | (722) | | | (722) | |
| Balance as of September 30, 2021 | | 45,374 | | | $ | 452 | | | $ | 1,119,738 | | | $ | (808,749) | | | $ | (11,663) | | | $ | 299,778 | |
| | | | | | | | | | | | | | | | | | | | | | | | | | | | | | | | | | | | | | |
| |
Common Stock | | Additional
Paid – In
Capital | | Accumulated
Deficit | | Accumulated
Other
Comprehensive
Loss | | Total |
| | Shares | | Amount | | | | |
| Balance as of March 31, 2020 | | 46,011 | | | $ | 458 | | | $ | 978,659 | | | $ | (553,790) | | | $ | (13,423) | | | $ | 411,904 | |
| Stock-based compensation | | | | | | 39,535 | | | | | | | 39,535 | |
| Share issuances related to stock-based compensation | | 674 | | | 6 | | | 5,265 | | | | | | | 5,271 | |
| | | | | | | | | | | | |
| Cumulative effect change in accounting for ASU 2016-13 | | | | | | | | (84) | | | | | (84) | |
| Net loss | | | | | | | | (38,888) | | | | | (38,888) | |
| Other comprehensive income | | | | | | | | | | 1,738 | | | 1,738 | |
| Balance as of September 30, 2020 | | 46,685 | | | $ | 464 | | | $ | 1,023,459 | | | $ | (592,762) | | | $ | (11,685) | | | $ | 419,476 | |
| | | | | | | | | | | | |
| | | | | | | | | | | | | | | | | | | | | | | | | | | | | | | | | | | | | | |
| | | | | | | | | | | | |
| |
Common Stock | | Additional
Paid – In
Capital | | Accumulated
Deficit | | Accumulated
Other
Comprehensive
Loss | | Total |
| | Shares | | Amount | | | | |
| Balance as of March 31, 2021 | | 46,482 | | | $ | 463 | | | $ | 1,069,695 | | | $ | (665,774) | | | $ | (10,350) | | | $ | 394,034 | |
| Stock-based compensation | | | | | | 48,260 | | | | | | | 48,260 | |
| Share issuances related to stock-based compensation | | 1,300 | | | 13 | | | 23,248 | | | | | | | 23,261 | |
| Repurchase of common stock | | (2,408) | | | (24) | | | (21,465) | | | (158,603) | | | | | (180,092) | |
| | | | | | | | | | | | |
| Net income | | | | | | | | 15,628 | | | | | 15,628 | |
| Other comprehensive loss | | | | | | | | | | (1,313) | | | (1,313) | |
| Balance as of September 30, 2021 | | 45,374 | | | $ | 452 | | | $ | 1,119,738 | | | $ | (808,749) | | | $ | (11,663) | | | $ | 299,778 | |
Commvault Systems, Inc.
Consolidated Statements of Stockholders’ Equity
(In thousands)
(Unaudited)
| | | | | | | | | | | | | | | | | | | | | | | | | | | | | | | | | | | | | | |
| | |
Common Stock | | Additional
Paid – In
Capital | | Accumulated
Deficit | | Accumulated
Other
Comprehensive
Loss | | Total |
| | | Shares | | Amount | | | | |
| Balance as of June 30, 2020 | | 46,321 | | | $ | 461 | | | $ | 997,838 | | | $ | (551,591) | | | $ | (12,473) | | | $ | 434,235 | |
| Stock-based compensation | | | | | | 20,584 | | | | | | | 20,584 | |
| | | | | | | | | | | | |
| Share issuances related to stock-based compensation | | 364 | | | 3 | | | 5,037 | | | | | | | 5,040 | |
| | | | | | | | | | | | |
| | | | | | | | | | | | |
| Net loss | | | | | | | | (41,171) | | | | | (41,171) | |
| Other comprehensive income | | | | | | | | | | 788 | | | 788 | |
| Balance as of September 30, 2020 | | 46,685 | | | $ | 464 | | | $ | 1,023,459 | | | $ | (592,762) | | | $ | (11,685) | | | $ | 419,476 | |
| | | | |
Common Stock | | Additional
Paid – In
Capital | | Accumulated
Deficit | | Accumulated
Other
Comprehensive
Loss | | Total | |
| | | | Shares | | Amount | | |
Common Stock | | Additional
Paid – In
Capital | | Accumulated
Deficit | | Accumulated
Other
Comprehensive
Loss | | Total |
| Balance as of June 30, 2019 | | 45,077 | | | $ | 449 | | | $ | 896,383 | | | $ | (525,420) | | | $ | (11,595) | | | $ | 359,817 | | |
| | | Shares | | Amount | | Additional
Paid – In
Capital | | Accumulated
Deficit | | Accumulated
Other
Comprehensive
Loss | | Total |
| Balance as of March 31, 2020 | | Balance as of March 31, 2020 | | 46,011 | | | $ | 458 | | |
| Stock-based compensation | Stock-based compensation | | 14,857 | | | 14,857 | | Stock-based compensation | | 39,535 | | | | | 39,535 | |
| | Share issuances related to stock-based compensation | Share issuances related to stock-based compensation | | 332 | | | 3 | | | 5,659 | | | 5,662 | | Share issuances related to stock-based compensation | | 674 | | | 6 | | | 5,265 | | | 5,271 | |
| Cumulative effect change in accounting for ASU 2016-13 | | Cumulative effect change in accounting for ASU 2016-13 | | (84) | | | (84) | |
| | Net loss | Net loss | | (7,084) | | | (7,084) | | Net loss | | (38,888) | | | (38,888) | |
| Other comprehensive loss | | (1,138) | | | (1,138) | | |
| Balance as of September 30, 2019 | | 45,409 | | | $ | 452 | | | $ | 916,899 | | | $ | (532,504) | | | $ | (12,733) | | | $ | 372,114 | | |
| Other comprehensive income | | Other comprehensive income | | 1,738 | | | 1,738 | |
| Balance as of September 30, 2020 | | Balance as of September 30, 2020 | | 46,685 | | | $ | 464 | | | $ | 1,023,459 | | | $ | (592,762) | | | $ | (11,685) | | | $ | 419,476 | |
| | | | | | | | | | | | | | | | | | | | | | | | | | | | | | | | | | | | | | |
| |
Common Stock | | Additional
Paid – In
Capital | | Accumulated
Deficit | | Accumulated
Other
Comprehensive
Loss | | Total |
| | Shares | | Amount | | | | |
| Balance as of March 31, 2019 | | 45,582 | | | $ | 454 | | | $ | 887,907 | | | $ | (485,490) | | | $ | (11,568) | | | $ | 391,303 | |
| Stock-based compensation | | | | | | 29,607 | | | | | | | 29,607 | |
| Share issuances related to stock-based compensation | | 657 | | | 6 | | | 6,319 | | | | | | | 6,325 | |
| Repurchase of common stock | | (830) | | | (8) | | | (6,934) | | | (33,084) | | | | | (40,026) | |
| Net loss | | | | | | | | (13,930) | | | | | (13,930) | |
| Other comprehensive loss | | | | | | | | | | (1,165) | | | (1,165) | |
| Balance as of September 30, 2019 | | 45,409 | | | $ | 452 | | | $ | 916,899 | | | $ | (532,504) | | | $ | (12,733) | | | $ | 372,114 | |
| | | | | | | | | | | | |
See accompanying unaudited notes to consolidated financial statements
Commvault Systems, Inc.
Consolidated Statements of Cash Flows
(In thousands)
(Unaudited)
| | | Six Months Ended September 30, | | Six Months Ended September 30, |
| | | | 2020 | | 2019 | | | 2021 | | 2020 |
| Cash flows from operating activities | Cash flows from operating activities | | | | | Cash flows from operating activities | | | | |
| Net loss | | $ | (38,888) | | | $ | (13,930) | | |
| Adjustments to reconcile net loss to net cash provided by operating activities: | | |
| Net income (loss) | | Net income (loss) | | $ | 15,628 | | | $ | (38,888) | |
| Adjustments to reconcile net income (loss) to net cash provided by operating activities: | | Adjustments to reconcile net income (loss) to net cash provided by operating activities: | |
| Depreciation and amortization | Depreciation and amortization | | 10,743 | | | 6,054 | | Depreciation and amortization | | 5,258 | | | 10,743 | |
| Noncash stock-based compensation | Noncash stock-based compensation | | 39,535 | | | 29,607 | | Noncash stock-based compensation | | 48,260 | | | 39,535 | |
| | Amortization of deferred commissions cost | Amortization of deferred commissions cost | | 9,526 | | | 8,730 | | Amortization of deferred commissions cost | | 8,650 | | | 9,526 | |
| Impairment of operating lease assets | Impairment of operating lease assets | | 692 | | | 2,050 | | Impairment of operating lease assets | | — | | | 692 | |
| Impairment of intangible asset | | 40,700 | | | 0 | | |
| Impairment of intangible assets | | Impairment of intangible assets | | — | | | 40,700 | |
| Changes in operating assets and liabilities: | Changes in operating assets and liabilities: | | Changes in operating assets and liabilities: | |
| Trade accounts receivable | Trade accounts receivable | | 3,637 | | | 45,625 | | Trade accounts receivable | | 27,519 | | | 3,637 | |
| Operating lease assets and liabilities, net | Operating lease assets and liabilities, net | | (808) | | | 42 | | Operating lease assets and liabilities, net | | (544) | | | (808) | |
| Other current assets and Other assets | Other current assets and Other assets | | 9,982 | | | (1,796) | | Other current assets and Other assets | | (4,346) | | | 9,982 | |
| Deferred commissions cost | Deferred commissions cost | | (9,965) | | | (6,962) | | Deferred commissions cost | | (12,897) | | | (9,965) | |
| Accounts payable | Accounts payable | | (67) | | | (425) | | Accounts payable | | (193) | | | (67) | |
| Accrued liabilities | Accrued liabilities | | (17,151) | | | (1,015) | | Accrued liabilities | | (25,952) | | | (17,151) | |
| Deferred revenue | Deferred revenue | | (10,222) | | | (12,079) | | Deferred revenue | | 1,831 | | | (10,222) | |
| Other liabilities | Other liabilities | | 4,528 | | | (782) | | Other liabilities | | 56 | | | 4,528 | |
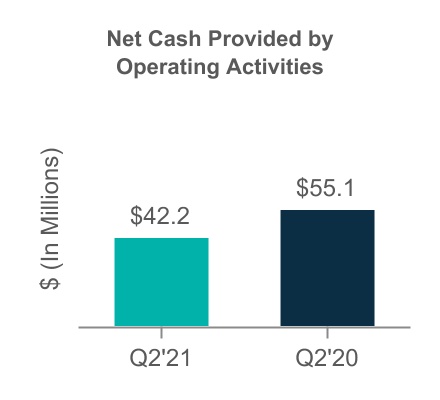
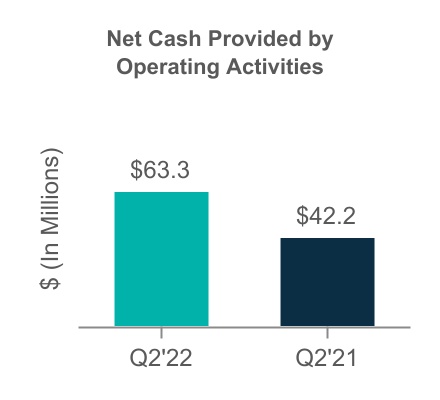
| Net cash provided by operating activities | Net cash provided by operating activities | | 42,242 | | | 55,119 | | Net cash provided by operating activities | | 63,270 | | | 42,242 | |
| Cash flows from investing activities | Cash flows from investing activities | | Cash flows from investing activities | |
| Purchase of short-term investments | | 0 | | | (32,800) | | |
| | Proceeds from maturity of short-term investments | Proceeds from maturity of short-term investments | | 32,800 | | | 65,519 | | Proceeds from maturity of short-term investments | | — | | | 32,800 | |
| | Purchases of investments | | Purchases of investments | | (2,706) | | | — | |
| Purchase of property and equipment | Purchase of property and equipment | | (3,662) | | | (1,457) | | Purchase of property and equipment | | (1,993) | | | (3,662) | |
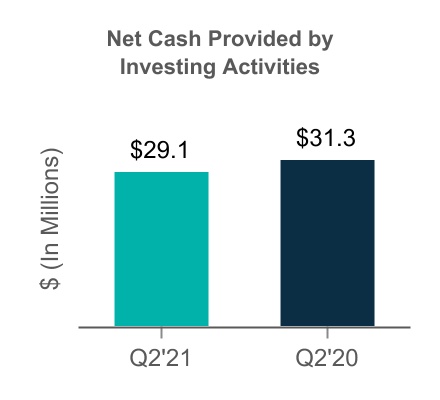
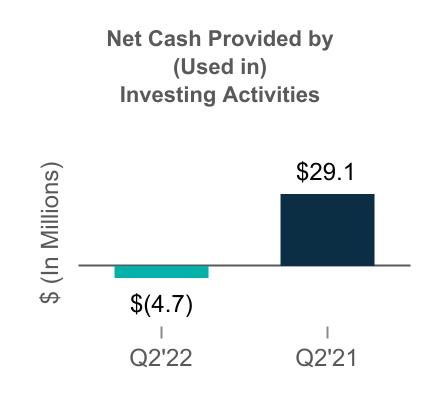
| | Net cash provided by investing activities | | 29,138 | | | 31,262 | | |
| Net cash (used in) provided by investing activities | | Net cash (used in) provided by investing activities | | (4,699) | | | 29,138 | |
| Cash flows from financing activities | Cash flows from financing activities | | Cash flows from financing activities | |
| Repurchase of common stock | Repurchase of common stock | | 0 | | | (40,026) | | Repurchase of common stock | | (180,092) | | | — | |
| Proceeds from stock-based compensation plans | Proceeds from stock-based compensation plans | | 5,271 | | | 6,325 | | Proceeds from stock-based compensation plans | | 23,261 | | | 5,271 | |
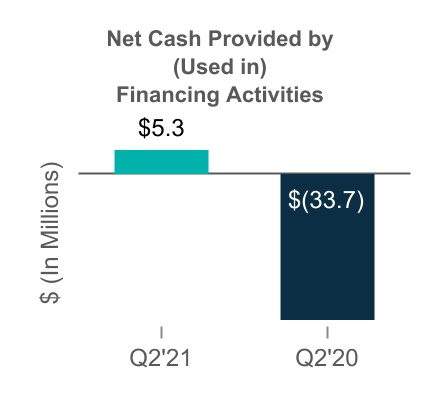
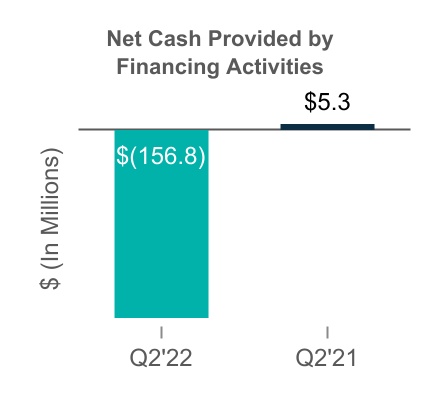
| | Net cash provided by (used in) financing activities | | 5,271 | | | (33,701) | | |
| Net cash (used in) provided by financing activities | | Net cash (used in) provided by financing activities | | (156,831) | | | 5,271 | |
| Effects of exchange rate — changes in cash | Effects of exchange rate — changes in cash | | 10,420 | | | (3,047) | | Effects of exchange rate — changes in cash | | (3,170) | | | 10,420 | |
| Net increase in cash, cash equivalents and restricted cash | | 87,071 | | | 49,633 | | |
| Cash, cash equivalents and restricted cash at beginning of period | | 296,082 | | | 327,992 | | |
| Cash, cash equivalents and restricted cash at end of period | | $ | 383,153 | | | $ | 377,625 | | |
| Net (decrease) increase in cash and cash equivalents | | Net (decrease) increase in cash and cash equivalents | | (101,430) | | | 87,071 | |
| Cash and cash equivalents at beginning of period | | Cash and cash equivalents at beginning of period | | 397,237 | | | 296,082 | |
| Cash and cash equivalents at end of period | | Cash and cash equivalents at end of period | | $ | 295,807 | | | $ | 383,153 | |
| |
See accompanying unaudited notes to consolidated financial statements
Commvault Systems, Inc
Notes to Consolidated Financial Statements - Unaudited
(In thousands, except per share data)
1. Basis of Presentation
Commvault Systems, Inc. and its subsidiaries ("Commvault," "we," "us," or "our") is a provider of data protection and information management software applications and products. We develop, market and sell a suite of software applications and services, globally, that provides our customers with data protection solutions. We also provide our customers with a broad range of professional and customer support services.
The consolidated financial statements of Commvault as of September 30, 20202021 and for the three and six months ended September 30, 20202021 and 20192020 are unaudited, and in the opinion of management, include all adjustments (consisting only of normal recurring adjustments) necessary for a fair presentation of the results for the interim periods. Accordingly, they do not include all of the information and footnotes required by U.S. generally accepted accounting principles (“U.S. GAAP”) for complete financial statements and should be read in conjunction with the financial statements and notes in our Annual Report on Form 10-K for fiscal 2020.2021. The results reported in these financial statements should not necessarily be taken as indicative of results that may be expected for the entire fiscal year.
The preparation of financial statements and related disclosures in conformity with U.S. GAAP requires management to make judgments and estimates that affect the amounts reported in our consolidated financial statements and the accompanying notes. We base our estimates and judgments on historical experience and on various other assumptions that we believe are reasonable under the circumstances. The amountsamount of assets and liabilities reported in our balance sheets and the amounts of revenues and expenses reported for each of our periods presented are affected by estimates and assumptions, which are used for, but not limited to, the accounting for revenue recognition, income taxes and related reserves and goodwill and purchased intangible assets.goodwill. Actual results could differ from those estimates.
2. Summary of Significant Accounting Policies
Recently Adopted Accounting Standards
| | | | | | | | | | | |
Standard | Description | Effective Date | Effect on the Consolidated Financial Statements (or Other Significant Matters) |
Accounting Standards Update ("ASU") No. 2016-13 (Topic 326), Financial Instruments-Credit Losses
| The standard amends guidance on the impairment of financial instruments. The ASU estimates credit losses based on expected losses and provides for a simplified accounting model for purchased financial assets with credit deterioration. The standard requires a modified retrospective basis adoption through a cumulative-effect adjustment to retained earnings as of the beginning of the period of adoption.
| We adopted this new standard as of April 1, 2020, using the modified retrospective method recognized as of the date of initial application. | The adoption of this new standard resulted in an $84 thousand cumulative effect on our unaudited consolidated financial statements related to an adjustment to our allowance for doubtful accounts.
Under the new standard, we assess credit losses on accounts receivable by taking into consideration past collection experience, credit quality of the customer, age of the receivable balance, current economic conditions, and forecasts that affect the collectability of the reported amount. |
Commvault Systems, Inc
Notes to Consolidated Financial Statements - Unaudited (continued)
(In thousands, except per share data)
Recently Issued Accounting Standards Not Yet Adopted
| | | | | | | | | | | |
| Standard | Description | Effective Date | Effect on the Consolidated Financial Statements (or Other Significant Matters) |
| ASU No. 2019-12 (Topic 740), Income Taxes | In December 2019, the Financial Accounting Standards Board ("FASB") issued a new standard to simplify the accounting for income taxes. The guidance eliminates certain exceptions related to the approach for intraperiod tax allocation, the methodology for calculating income taxes in an interim period, and the recognition of deferred tax liabilities for outside basis differences related to changes in ownership of equity method investments and foreign subsidiaries. The guidance also simplifies aspects of accounting for franchise taxes and enacted changes in tax laws or rates, and clarifies the accounting for transactions that result in a step-up in the tax basis of goodwill. | We adopted this standard as of April 1, 2021. | The standard will be effective for us beginning April 1, 2021, with early adoption permitted. | We are currently evaluating thedid not have a significant impact of this standard inon our consolidated financial statements, including accounting policies, processes, and systems.statements. |
Commvault Systems, Inc
Notes to Consolidated Financial Statements - Unaudited (continued)
(In thousands, except per share data)
Concentration of Credit Risk
We grant credit to customers in a wide variety of industries worldwide and generally do not require collateral. Credit losses relating to these customers have historically been minimal.
Sales through our distribution agreement with Arrow Enterprise Computing Solutions, Inc. (“Arrow”) totaled 34% and 36% of total revenues for the three months ended September 30, 2021 and 37%2020, respectively. Sales with Arrow totaled 35% and 36% of total revenues for the six months ended September 30, 20202021 and 2019,2020, respectively. Arrow accounted for approximately 26%25% and 31%33% of total accounts receivable as of September 30, 20202021 and March 31, 2020,2021, respectively.
TD SYNNEX (formerly Tech Data Corporation ("Tech Data")Corporation) accounted for approximately 11%13% of total accounts receivable as of September 30, 2020.2021.
Equity Securities Accounted for at Net Asset Value
We held an equity interest in a private equity fund of $2.6 million as of September 30, 2021, which is accounted for under the net asset value practical expedient as permitted under ASC 820 Fair Value Measurement. This investment is included in Other assets in the accompanying Consolidated Balance Sheets. The net asset value of Financial Instrumentsthis investment is determined using quarterly capital statements from the fund, which is based on our contributions to the fund, allocation of profit and loss and changes in fair value of the underlying fund investment. Changes in fair value as reported on the capital statements will be recorded through profit and loss as non-operating income. This private equity fund focuses on making investments in key technology sectors, principally by investing in companies at expansion capital and growth equity stages. We have total unfunded commitments in private equity funds of $8.2 million as of September 30, 2021.
Deferred Commissions Cost
Sales commissions, bonuses, and related payroll taxes earned by our employees are considered incremental and recoverable costs of obtaining a contract with a customer. Our typical contracts include performance obligations related to software licenses, software updates, customer support and other services, including software-as-a-service offerings. In these contracts, incremental costs of obtaining a contract are allocated to the performance obligations based on the relative estimated standalone selling prices and then recognized on a systematic basis that is consistent with the transfer of the goods or services to which the asset relates. We do not pay commissions on annual renewals of contracts for software updates and customer support for perpetual licenses. The costs allocated to software and products are expensed at the time of sale, when revenue for the functional software license or appliance is typically recognized. The costs allocated to software updates and customer support for perpetual licenses are amortized ratably over a period of approximately five years, the expected period of benefit of the asset capitalized. We currently estimate a period of five years is appropriate based on consideration of historical average customer life and the estimated useful life of the underlying software or appliance sold as part of the transaction.
Beginning in fiscal 2022, we modified the terms of our commission plans, and as a result, the commission paid on the renewal of a term-based, or subscription software license, was not commensurate with the commission paid on the initial purchase. As a result, the cost of commissions allocated to software updates and customer support on the initial transaction are now amortized over a period of approximately five years, consistent with the accounting for these costs associated with perpetual licenses. The costs of commissions allocated to software updates and support for the renewal of term-based software licenses, is limited to the contractual period of the arrangement as we intend to pay a commensurate renewal commission upon the next renewal of the subscription license and related updates and support. This change in commission plans also resulted in a change in the estimate of the amortization period of our existing Deferred commissions cost associated with term licenses. This change in amortization period resulted in an approximately $950 and $2,050 reduction in Sales and marketing expense, than if the change in estimate did not occur, for the three and six months ended September 30, 2021, respectively.
The carrying amountscosts related to professional services are amortized over the period the related professional services are provided and revenue is recognized. Amortization expense related to these costs is included in Sales and marketing expenses in the accompanying Consolidated Statements of our cash and cash equivalents, accounts receivable, accounts payable and accrued expenses approximate their fair values due to the short-term maturity of these instruments. Our short-term investments balance consists of U.S. Treasury Bills with maturities of one year or less. We account for our short-term investments as held to maturity.Operations.
Commvault Systems, Inc
Notes to Consolidated Financial Statements - Unaudited (continued)
(In thousands, except per share data)
The following table summarizes the composition of our financial assets and liabilities measured at fair value on a recurring basis at September 30, 2020 and March 31, 2020:
| | | | | | | | | | | | | | | | | | | | | | | | | | |
| September 30, 2020 | | Level 1 | | Level 2 | | Level 3 | | Total |
| | | | | | | | |
| Short-term investments | | $ | 0 | | | 10,996 | | | 0 | | | $ | 10,996 | |
| | | | | | | | | | | | | | | | | | | | | | | | | | |
| March 31, 2020 | | Level 1 | | Level 2 | | Level 3 | | Total |
| | | | | | | | |
| Short-term investments | | $ | 0 | | | 44,484 | | | 0 | | | $ | 44,484 | |
3. Revenue
We derive revenues from 2 primary sources: software and products, and services. Software and products revenue includes our software and integrated appliances that combine our software with hardware. Services include customer support (software updates and technical support), consulting, assessment and design services, installation services, customer education and Commvault software-as-a-service, which is branded as Metallic.
We sell both perpetual and term-based licenses of our software. We refer to our term-based software licenses as subscription arrangements. We do not customize our software and installation services are not required. The software is delivered before related services are provided and is functional without professional services, updates and technical support. We have concluded that our software licenses (both perpetual and subscription) are functional intellectual property that is distinct as the user can benefit from the software on its own. Software revenue for both perpetual and subscription licenses is typically recognized when the software is delivered and/or made available for download as this is the point the user of the software can direct the use of, and obtain substantially all of the remaining benefits from the functional intellectual property. We do not recognize software revenue related to the renewal of subscription software licenses earlier than the beginning of the new subscription period.
We also sell appliances that integrate our software with hardware and address a wide-range of business needs and use cases, ranging from support for remote or branch offices with limited IT staff up to large corporate data centers. Revenue related to appliances is recognized when control of the appliances passes to the customer; typically upon delivery. In the second half of fiscal 2021 we began transitioning to a software only model in which we sell software to a third party, which assembles an integrated appliance that is sold to end user customers. As a result, we expect the revenue and costs associated with hardware will decline from recent fiscal years.
Services revenue includes revenue from customer support and other professional services. Customer support includes software updates on a when-and-if-available basis, telephone support, integrated web-based support and bug fixes or patches. The Company sells itsWe sell our customer support contracts as a percentage of net software purchases the support is related to. Customer support revenue is recognized ratably over the term of the customer support agreement, which is typically one year.year on our perpetual licenses. The term of our subscription arrangements is typically three years.
Our other professional services include consulting, assessment and design services, installation services and customer education. Customer education services include courses taught by our instructors or third-party contractors. Revenue related to other professional services and customer education services is typically recognized as the services are performed.
In fiscal 2020 Commvault launched Metallic, which is a Commvault software-as-a-service offering. Revenue from Metallic is recognized ratably as services revenue. Revenue to date from Metallic has not been material.
Most of our contracts with customers contain multiple performance obligations. For these contracts, we account for individual performance obligations separately if they are distinct. The transaction price is allocated to the separate performance obligations on a relative standalone selling price basis. Standalone selling prices of software and appliances areis typically estimated using the residual approach. Standalone selling prices of services are typically estimated based on observable transactions when these services are sold on a standalone basis.
Commvault Systems, Inc
Notes to Consolidated Financial Statements - Unaudited (continued)
(In thousands, except per share data)
Our typical performance obligations include the following:
| | | | | | | | | | | |
| Performance Obligation | When Performance Obligation
is Typically Satisfied | When Payment is
Typically Due | How Standalone Selling Price is
Typically Estimated |
| Software and Products Revenue |
| Software Licenses | Upon shipment or made available for download (point in time) | Within 90 days of shipment except for certain subscription licenses which are paid for over time | Residual approach |
Appliances | When control of the appliances passes to the customer; typically upon delivery | Within 90 days of delivery | Residual approach |
| Customer Support Revenue |
| Software Updates | Ratably over the course of the support contract (over time) | At the beginning of the contract period | Observable in renewal transactions |
| Customer Support | Ratably over the course of the support contract (over time) | At the beginning of the contract period | Observable in renewal transactions |
| Other Services Revenue |
| Other Professional Services (except for education services) | As work is performed (over time) | Within 90 days of services being performed | Observable in transactions without multiple performance obligations |
| Education Services | When the class is taught (point in time) | Within 90 days of services being performed | Observable in transactions without multiple performance obligations |
Software-as-a-service (Metallic)
| Ratably over the course of the contract (over time) | Annual or monthly payments | Observable in transactions without multiple performance obligations |
Disaggregation of Revenue
We disaggregate revenue from contracts with customers into the nature of the products and services and geographical regions. The geographic regions that are tracked are the Americas (United States, Canada, Latin America), EMEA (Europe, Middle East, Africa) and APJ (Australia, New Zealand, Southeast Asia, China). We operate in 1 segment.
| | | Three Months Ended September 30, 2020 | | Three Months Ended September 30, 2021 |
| | Americas | EMEA | APJ | Total | | Americas | EMEA | APJ | Total |
| Software and Products Revenue | Software and Products Revenue | $ | 39,241 | | $ | 22,063 | | $ | 11,005 | | $ | 72,309 | | Software and Products Revenue | $ | 44,185 | | $ | 22,280 | | $ | 8,796 | | $ | 75,261 | |
| Customer Support Revenue | Customer Support Revenue | 54,177 | | 24,911 | | 10,359 | | 89,447 | | Customer Support Revenue | 51,207 | | 26,288 | | 9,958 | | 87,453 | |
| Other Services Revenue | Other Services Revenue | 4,794 | | 3,084 | | 1,505 | | 9,383 | | Other Services Revenue | 9,393 | | 4,114 | | 1,619 | | 15,126 | |
| Total Revenue | Total Revenue | $ | 98,212 | | $ | 50,058 | | $ | 22,869 | | $ | 171,139 | | Total Revenue | $ | 104,785 | | $ | 52,682 | | $ | 20,373 | | $ | 177,840 | |
| | | Three Months Ended September 30, 2019 | | Three Months Ended September 30, 2020 |
| | Americas | EMEA | APJ | Total | | Americas | EMEA | APJ | Total |
| Software and Products Revenue | Software and Products Revenue | $ | 35,863 | | $ | 21,440 | | $ | 11,292 | | $ | 68,595 | | Software and Products Revenue | $ | 39,241 | | $ | 22,063 | | $ | 11,005 | | $ | 72,309 | |
| Customer Support Revenue | Customer Support Revenue | 57,864 | | 21,906 | | 10,233 | | 90,003 | | Customer Support Revenue | 54,177 | | 24,911 | | 10,359 | | 89,447 | |
| Other Services Revenue | Other Services Revenue | 4,430 | | 2,680 | | 1,874 | | 8,984 | | Other Services Revenue | 4,794 | | 3,084 | | 1,505 | | 9,383 | |
| Total Revenue | Total Revenue | $ | 98,157 | | $ | 46,026 | | $ | 23,399 | | $ | 167,582 | | Total Revenue | $ | 98,212 | | $ | 50,058 | | $ | 22,869 | | $ | 171,139 | |
Commvault Systems, Inc
Notes to Consolidated Financial Statements - Unaudited (continued)
(In thousands, except per share data)
| | | | | | | | | | | | | | |
| | | | |
| Six Months Ended September 30, 2021 |
| Americas | EMEA | APJ | Total |
| Software and Products Revenue | $ | 95,972 | | $ | 43,621 | | $ | 17,830 | | $ | 157,423 | |
| Customer Support Revenue | 103,081 | | 53,062 | | 20,279 | | 176,422 | |
| Other Services Revenue | 16,703 | | 7,542 | | 3,171 | | 27,416 | |
| Total Revenue | $ | 215,756 | | $ | 104,225 | | $ | 41,280 | | $ | 361,261 | |
| | | | | | | | | | | | | | |
| | | | |
| Six Months Ended September 30, 2020 |
| Americas | EMEA | APJ | Total |
| Software and Products Revenue | $ | 89,886 | | $ | 40,858 | | $ | 18,119 | | $ | 148,863 | |
| Customer Support Revenue | 109,415 | | 48,221 | | 20,454 | | 178,090 | |
| Other Services Revenue | 8,907 | | 5,639 | | 2,640 | | 17,186 | |
| Total Revenue | $ | 208,208 | | $ | 94,718 | | $ | 41,213 | | $ | 344,139 | |
| | | | | | | | | | | | | | |
| Six Months Ended September 30, 2019 |
| Americas | EMEA | APJ | Total |
| Software and Products Revenue | $ | 67,084 | | $ | 42,815 | | $ | 22,370 | | $ | 132,269 | |
| Customer Support Revenue | 115,594 | | 43,573 | | 20,318 | | 179,485 | |
| Other Services Revenue | 9,296 | | 5,362 | | 3,373 | | 18,031 | |
| Total Revenue | $ | 191,974 | | $ | 91,750 | | $ | 46,061 | | $ | 329,785 | |
Information about Contract Balances
Amounts collected in advance of services being provided are accounted for as deferredDeferred revenue. Nearly all of our deferredDeferred revenue balance is related to services revenue, primarily customer support contracts.
In some arrangements we allow customers to pay for term-based software licenses and products over the term of the software license. Amounts recognized as revenue in excess of amounts billed are recorded as unbilledUnbilled receivables. Unbilled receivables, which are anticipated to be invoiced in the next twelve months, are included in Accounts receivable on the Consolidated Balance Sheets. Long-term unbilled receivables are included in Other assets. The opening and closing balances of our accountsAccounts receivable, unbilledUnbilled receivables, and deferredDeferred revenues are as follows:
| | | | | | | | | | | | | | | | | |
| Accounts Receivable | Unbilled Receivable
(current) | Unbilled Receivable
(long-term) | Deferred Revenue (current) | Deferred Revenue (long-term) |
| Opening Balance as of March 31, 2020 | $ | 129,856 | | $ | 17,134 | | $ | 7,857 | | $ | 233,497 | | $ | 92,723 | |
| Increase/(decrease), net | (12,135) | | 4,102 | | 3,736 | | (5,720) | | 4,783 | |
| Ending Balance as of September 30, 2020 | $ | 117,721 | | $ | 21,236 | | $ | 11,593 | | $ | 227,777 | | $ | 97,506 | |
| | | | | | | | | | | | | | | | | |
| Accounts Receivable | Unbilled Receivable
(current) | Unbilled Receivable
(long-term) | Deferred Revenue (current) | Deferred Revenue (long-term) |
| Opening Balance as of March 31, 2021 | $ | 168,985 | | $ | 19,141 | | $ | 7,463 | | $ | 253,211 | | $ | 119,231 | |
| Increase (decrease), net | (20,372) | | (1,482) | | (2,961) | | (5,633) | | 5,602 | |
| Ending Balance as of September 30, 2021 | $ | 148,613 | | $ | 17,659 | | $ | 4,502 | | $ | 247,578 | | $ | 124,833 | |
The decrease in accountsAccounts receivable (inclusive of unbilledUnbilled receivables) is a result of a concentration of customer support renewals in the second half of the prior fiscal year. The decrease in deferred revenue is primarily due to the decrease in deferred customer support revenue related to software and products revenue transactions and customer support renewals relative to the fourth quarter of the prior fiscal 2020.year. Deferred revenue remained relatively consistent primarily as the result of an increase in deferred revenue associated with Metallic contracts that are billed upfront and recognized ratably over the contract period partially offset by a seasonal decline in deferred revenue associated with customer support contracts as the renewal of our customer support contracts is concentrated in our fiscal third and fourth quarters.
The amount of revenue recognized in the period that was included in the March 31, 20202021 balance of deferred revenue was $69,025$70,117 and $155,728$160,926 for the three and six months ended September 30, 2020.2021. The vast majority of this revenue consists of customer support arrangements. The amount of software and products revenue recognized in the three and six months ended September 30, 20202021 related to performance obligations from prior periods was not significant.
Commvault Systems, Inc
Notes to Consolidated Financial Statements - Unaudited (continued)
(In thousands, except per share data)
Remaining Performance Obligations
In addition to the amounts included in deferred revenue as of September 30, 2020, $32,2382021, $37,760 of revenue may be recognized from remaining performance obligations, of which approximately $3,000$4,300 was related to software and products. We expect the majority of this software and products revenue to be recognized during the three months ended December 31, 2020.fiscal 2022. Most of this software and products revenue is associated with renewals of term licenses which have not yet expired. The vast majority of the services revenue is related to other professional services which may be recognized over the next twelve months but is contingent upon a number of factors, including customers’ needs and schedules.
Commvault Systems, Inc
Notes to Consolidated Financial Statements - Unaudited (continued)
(In thousands, except per share data)
4. Goodwill and Intangible Assets, Net
Goodwill
There were 0 additions, impairments or any other changes to the carrying amount of goodwill during the three and six months ended September 30, 2020.
Intangible assets, net
Intangible assets subject to amortization as of September 30, 2020 are as follows:
| | | | | | | | | | | | | | | | | | | | | | | | | | |
| | Gross Carrying Amount | | Accumulated Amortization | | Impairment Charge | | Net Carrying Value |
| Developed technology | | $ | 49,000 | | | $ | (9,800) | | | $ | (39,200) | | | $ | 0 | |
| Customer relationships | | 3,000 | | | (1,500) | | | (1,500) | | | 0 | |
| Total intangible assets, net | | $ | 52,000 | | | $ | (11,300) | | | $ | (40,700) | | | $ | 0 | |
Amortization expense from acquired intangible assets was $2,825 and $5,650 for the three and six months ended September 30, 2020, respectively. There were 0 intangible assets subject to amortization for the three and six months ended September 30, 2019.
Our intangible assets (developed technology and customer relationships) were acquired in connection with the Hedvig, Inc. ("Hedvig") transaction. The most material of these assets was the developed technology. The value of this asset was attributable to forecasted incremental revenues directly attributable to this technology. While we have successfully integrated this technology into our existing Hyperscale technology, we have not met our forecasts for standalone sales of this acquired technology. During the second quarter of fiscal year 2021 we identified an indicator of impairment and concluded that the carrying values of the developed technology and customer relationships acquired in connection with the Hedvig transaction were not recoverable on an undiscounted basis. As a result, we remeasured the fair value of these assets and concluded their value was de minimis. We recorded a $40,700 impairment charge in the accompanying Consolidated Statements of Operations for the three months ended September 30, 2020. These non-recurring fair value measurements were categorized as Level 3, as significant unobservable inputs were used in the valuation analysis. Key assumptions used in the valuation include forecasts of revenue and expenses over an extended period, the useful life of the asset, tax rates, and estimated costs of debt and equity capital to discount the projected cash flows. Certain of these assumptions involve significant judgment and are based on management’s estimate of current and forecasted market conditions.
5. Net Income per Common Share
| | | | | | | | | | | | | | | | | | | | | | | | | | |
| | Three Months Ended September 30, | | Six Months Ended September 30, |
| | 2021 | | 2020 | | 2021 | | 2020 |
| Net income (loss) | | $ | 1,731 | | | $ | (41,171) | | | $ | 15,628 | | | $ | (38,888) | |
| Basic net income (loss) per common share: | | | | | | | | |
| Basic weighted average shares outstanding | | 45,743 | | | 46,516 | | | 45,960 | | | 46,354 | |
| Basic net income (loss) per common share | | $ | 0.04 | | | $ | (0.89) | | | $ | 0.34 | | | $ | (0.84) | |
| Diluted net income (loss) per common share: | | | | | | | | |
| Basic weighted average shares outstanding | | 45,743 | | | 46,516 | | | 45,960 | | | 46,354 | |
| Dilutive effect of stock options and restricted stock units | | 1,856 | | | — | | | 1,976 | | | — | |
| Diluted weighted average shares outstanding | | 47,599 | | | 46,516 | | | 47,936 | | | 46,354 | |
| Diluted net income (loss) per common share | | $ | 0.04 | | | $ | (0.89) | | | $ | 0.33 | | | $ | (0.84) | |
| | | | | | | | |
The diluted weighted-average shares outstanding exclude outstanding stock options, restricted stock units, performance restricted stock units and shares to be purchased under the employee stock purchase plan totaling 5,040472 and 4,7805,040 for the three months ended September 30, 20202021 and 2019,2020, respectively, and 5,031597 and 4,8105,031 for the six months ended September 30, 20202021 and 20192020, because the effect would have been anti-dilutive.
6.5. Commitments and Contingencies
During the second quarter of fiscal 2022, we entered into a settlement agreement resulting in a $2,500 gain which resolved certain legal matters. The settlement amount is recorded in General and administrative expenses net against related legal expenses.
From time to time, we are subject to claims in legal proceedings arising in the normal course of business. We do not believe that we are currently party to any pending legal action that could reasonably be expected to have a material adverse effect on our business or operating results.
6. Capitalization
Our stock repurchase program has been funded by our existing cash and cash equivalent balances as well as cash flows provided by our operations.
Our Board has approved, and we intend to execute, a capital allocation policy that provides for the repurchase of $200,000 of our common stock for the period from February 1, 2021 through the end of our 2022 fiscal year, plus the use of approximately 75% of our fiscal 2022 free cash flow for additional repurchases during fiscal year 2022. From the period beginning February 1, 2021 through September 30, 2021 we have repurchased $242,220 of our common stock.
Commvault Systems, Inc
Notes to Consolidated Financial Statements - Unaudited (continued)
(In thousands, except per share data)
7. Capitalization
As of September 30, 2020, $162,829 remained in our current stock repurchase authorization which expires on March 31, 2021.
Subsequent Event
On October 22, 2020, the Board of Directors authorized an increase to the existing share repurchase program so that $200,000 was available. The authorization will expire on March 31, 2022.
8. Stock Plans
The following table presents the stock-based compensation expense included in Cost of services revenue, Sales and marketing, Research and development, General and administrative expenses and Restructuring expenses for the three and six months ended September 30, 20202021 and 2019.2020. Stock-based compensation is attributable to stock options, restricted stock units, performance based awards and the employee stock purchase plan.
| | | | | Three Months Ended September 30, | | Six Months Ended September 30, | | | | Three Months Ended September 30, | | Six Months Ended September 30, |
| | | | 2020 | | 2019 | | 2020 | | 2019 | | | | 2021 | | 2020 | | 2021 | | 2020 |
| Cost of services revenue | Cost of services revenue | | $ | 740 | | | $ | 698 | | | $ | 1,406 | | | $ | 1,388 | | | Cost of services revenue | | $ | 1,042 | | | $ | 740 | | | $ | 2,227 | | | $ | 1,406 | |
| Sales and marketing | Sales and marketing | | 8,988 | | | 7,359 | | | 16,192 | | | 15,005 | | | Sales and marketing | | 9,974 | | | 8,988 | | | 17,282 | | | 16,192 | |
| Research and development | Research and development | | 5,578 | | | 2,011 | | | 11,519 | | | 4,004 | | | Research and development | | 8,410 | | | 5,578 | | | 15,595 | | | 11,519 | |
| General and administrative | General and administrative | | 4,631 | | | 4,184 | | | 9,714 | | | 8,237 | | | General and administrative | | 6,773 | | | 4,631 | | | 12,784 | | | 9,714 | |
| Restructuring | Restructuring | | 647 | | | 605 | | | 704 | | | 973 | | | Restructuring | | 250 | | | 647 | | | 372 | | | 704 | |
| Stock-based compensation expense | Stock-based compensation expense | | $ | 20,584 | | | $ | 14,857 | | | $ | 39,535 | | | $ | 29,607 | | | Stock-based compensation expense | | $ | 26,449 | | | $ | 20,584 | | | $ | 48,260 | | | $ | 39,535 | |
As of September 30, 2020,2021, there was $110,911$121,951 of unrecognized stock-based compensation expense related to restricted stock unit awards that is expected to be recognized over a weighted-average period of 1.901.68 years. We account for forfeitures as they occur. To the extent that awards are forfeited, stock-based compensation will be different from our current estimate.
Commvault Systems, Inc
Notes to Consolidated Financial Statements - Unaudited (continued)
(In thousands, except per share data)
Stock Options
Stock option activity for the six months ended September 30, 2021 is as follows:
| | | | | | | | | | | | | | | | | | | | | | | | | | |
| Options | | Number of Options | | Weighted-Average Exercise Price | | Weighted-Average Remaining Contractual Term (Years) | | Aggregate Intrinsic Value |
| Outstanding as of March 31, 2021 | | 1,357 | | | $ | 62.06 | | | | | |
| Options granted | | — | | | — | | | | | |
| Options exercised | | (391) | | | 46.31 | | | | | |
| Options forfeited | | — | | | — | | | | | |
| Options expired | | (8) | | | 84.65 | | | | | |
| Outstanding as of September 30, 2021 | | 958 | | | 68.30 | | | 1.93 | | $ | 11,613 | |
| Exercisable as of September 30, 2021 | | 958 | | | 68.30 | | | 1.93 | | $ | 11,613 | |
The total intrinsic value of options exercised was not significant in$12,460 for the threesix months ended September 30, 2021 and $356 for the six months ended September 30, 2020.
Restricted Stock Units
Restricted stock unit activity for the six months ended September 30, 20202021 is as follows:
| | Non-vested Restricted Stock Units | Non-vested Restricted Stock Units | Number of
Awards | | Weighted-
Average Grant
Date Fair Value | Non-vested Restricted Stock Units | Number of
Awards | | Weighted-
Average Grant
Date Fair Value |
| Non-vested as of March 31, 2020 | 3,237 | | | $ | 50.47 | | |
| Non-vested as of March 31, 2021 | | Non-vested as of March 31, 2021 | 3,451 | | | $ | 44.90 | |
| Awarded | Awarded | 857 | | | 37.42 | | Awarded | 731 | | | 74.28 | |
| Vested | Vested | (521) | | | 55.29 | | Vested | (824) | | | 44.93 | |
| Forfeited | Forfeited | (189) | | | 52.45 | | Forfeited | (179) | | | 47.74 | |
| Non-vested as of September 30, 2020 | 3,384 | | | $ | 46.38 | | |
| Non-vested as of September 30, 2021 | | Non-vested as of September 30, 2021 | 3,179 | | | $ | 51.42 | |
The weighted-average fair value of restricted stock units awarded was $76.79 and $74.28 per unit during the three and six months ended September 30, 2021, and $42.02 and $37.42 per unit during the three and six months ended September 30, 2020, and $43.39 and $48.17 per unit during the three and six months ended September 30, 2019.2020. The weighted-average fair value of awards includes the awards with a market condition described below.
Performance Based Awards
In the six months ended September 30, 2021, we granted 117 performance restricted stock units ("PSUs") to certain executives. Vesting of these awards is contingent upon i) us meeting certain revenue and non-GAAP performance goals (performance-based) in fiscal 2022 and ii) our customary service periods. The awards vest over three years. These awards generally have potential to vest at 200% based on actual fiscal 2022 performance. The related stock-based compensation expense is determined based on the value of the underlying shares on the date of grant and is recognized over the vesting term using the accelerated method. During the interim financial periods, management estimates the probable number of PSUs that would vest until the ultimate achievement of the performance goals is known. The awards are included in the restricted stock unit table.
Commvault Systems, Inc
Notes to Consolidated Financial Statements - Unaudited (continued)
(In thousands, except per share data)
Awards with a Market Condition
In the six months ended September 30, 2020,2021, we granted 299105 market performance stock units to certain executives. The vesting of these awards is contingent upon us meeting certain total shareholder return ("TSR") levels as compared to the Russell 3000 market index over the next three years. The awards vest in 3 annual tranches and have a maximum potential to vest at 200% (598(210 shares) based on TSR performance. The related stock-based compensation expense is determined based on the estimated fair value of the underlying shares on the date of grant and is recognized using the accelerated method over the vesting term. The estimated fair value was calculated using a Monte Carlo simulation model. The fair value of the awards granted during the six months ended September 30, 20202021 was $36.76$87.74 per unit. The awards are included in the restricted stock unit table above.table.
Employee Stock Purchase Plan
The Employee Stock Purchase Plan (the "Purchase Plan"“Purchase Plan”) is a shareholder approved plan under which substantially all employees may purchase Commvault’sour common stock through payroll deductions at a price equal to 85% of the lower of the fair market values of the stock as of the beginning or the end of the six-month offering periods. An employee’s payroll deductions under the Purchase Plan are limited to 10% of the employee’s salary and employees may not purchase more than $25 of stock during any calendar year. Employees purchased 85 shares in exchange for $5,160 of proceeds in the six months ended September 30, 2021 and 129 shares in exchange for $4,652 of proceeds in the six months ended September 30, 20202020. The Purchase Plan is considered compensatory and 136 shares in exchange for $4,833 in the six months ended September 30, 2019.fair value of the discount and look back provision are estimated using the Black-Scholes formula and recognized over the six-month withholding period prior to purchase. The total expense associated with the Purchase Plan for six months ended September 30, 2021 and 2020 was $1,567 and $1,511, forrespectively. As of September 30, 2021, there was approximately $1,291 of unrecognized cost related to the current purchase period of our Purchase Plan.
8. Income Taxes
Income tax expense was $2,555 in the six months ended September 30, 2020 and $1,521 for the six months ended September 30, 2019.
9. Income Taxes
Income tax2021 compared to expense wasof $4,211 in the six months ended September 30, 2020 compared2020. Current quarter income tax expense relates primarily to expense of $2,571 in the six months ended September 30, 2019. In the fourth quarter of fiscal 2020, we recorded a current tax benefit of approximately $10,000 which represented our estimate of the net operating loss carryback resulting from the CARES Act. In the first quarter of fiscal 2021, we recorded an adjustment of $3,200 to reduce the current benefit of the net operating loss carryback benefit we will realize from the CARES Act.foreign taxes. In fiscal 2018, we determined that it was more likely than not that we will not realize the benefits of our gross deferred tax assets and therefore recorded a valuation allowance to reduce the carrying value of these gross deferred tax assets, net of the impact of the reversal of taxable temporary differences, to 0.zero. Our position remains unchanged with respect to the realizability of our deferred tax assets as of September 30, 2020.2021.
10.9. Restructuring
Our restructuring plan, initiated in the first quarter of fiscal 2019, is aimed to increase efficiency in our sales, marketing and distribution functions as well as reduce costs across all functional areas. These restructuring charges relate primarily to severance and related costs associated with headcount reductions, and lease abandonment charges.
During the three months ended September 30, 2020 and 2019, we incurred total restructuring charges of $5,767 and $12,851, respectively. These restructuring charges include $647 and $605 of stock-based compensation related to modifications of existing unvested awards granted to certain employees impacted by the restructuring plan forand lease abandonment charges.
For the three months ended September 30, 2020 and 2019, respectively.
During the six months ended September 30, 20202021 and 2019, we incurred total2020, restructuring charges were comprised of $8,091 and $16,930, respectively. These charges include $704 and $973 of stock-based compensation related to modifications of existing unvested awards granted to certain employees impacted by the restructuring plan for the six months ended September 30, 2020 and 2019, respectively.following:
| | | | | | | | | | | | | | | | | | | | | | | | | | |
| | Three Months Ended September 30, | | Six Months Ended September 30, |
| | 2021 | | 2020 | | 2021 | | 2020 |
| Employee severance and related costs | | $ | 386 | | | $ | 4,895 | | | $ | 1,710 | | | $ | 6,695 | |
Lease impairments and related costs (1) | | — | | | 225 | | | — | | | 692 | |
| Stock-based compensation | | 250 | | | 647 | | | 372 | | | 704 | |
| Total restructuring charges | | $ | 636 | | | $ | 5,767 | | | $ | 2,082 | | | $ | 8,091 | |
Commvault Systems, Inc
Notes to Consolidated Financial Statements - Unaudited (continued)
(In thousands, except per share data)
The activity in our restructuring accruals(1) Lease impairment charges for the three and six months ended September 30, 2020 and 2019 is summarized as follows:
| | | | | | | | | | | | | | |
| | Three Months Ended September 30, |
| | | 2020 | | 2019 |
| Balance as of June 30, | | $ | 3,228 | | | $ | 2,218 | |
Restructuring charges, net (1) | | 4,895 | | | 11,132 | |
| Payments | | (3,085) | | | (2,992) | |
| Balance as of September 30, | | $ | 5,038 | | | $ | 10,358 | |
| | | | | | | | | | | | | | |
| | Six Months Ended September 30, |
| | | 2020 | | 2019 |
| Balance as of March 31, | | $ | 2,531 | | | $ | 1,089 | |
Restructuring charges, net (1) | | 6,695 | | | 13,907 | |
| Payments | | (4,188) | | | (4,638) | |
| Balance as of September 30, | | $ | 5,038 | | | $ | 10,358 | |
(1) Net restructuring charges of $4,895 and $6,695 in the tables above excludes restructuring charges forrelate to 3of our leases in the amount of $225 and 5 in the amount of $692offices, respectively. There were no lease impairment charges for the three and six months ended September 30, 2020, respectively. It also excludes stock-based compensation related to modifications2021.
Restructuring accruals
The activity in our restructuring accruals for the three and six months ended September 30, 2020 of $647 and $704, respectively. Net restructuring charges of $11,132 and $13,907 in the tables above excludes restructuring charges for 1 of our leases in the amount of $1,114 and 3 in the amount of $2,050 for the three and six months ended September 30, 2019, respectively. It also excludes stock-based compensation related to modifications for the three and six months ended September 30, 2019 of $605 and $973, respectively.2021 is as follows:
As of September 30, 2020, the outstanding restructuring accruals primarily relate to future severance payments.
| | | | | | | | |
| | Total |
| Balance as of March 31, 2021 | | $ | 3,095 | |
| Employee severance and related costs | | 1,710 | |
| Payments | | (4,306) | |
| Balance as of September 30, 2021 | | $ | 499 | |
Item 2 - Management’s Discussion and Analysis of Financial Condition and Results of Operations
You should read the following discussion and analysis along with our consolidated financial statements and the related notes included elsewhere in this quarterly report on Form 10-Q. The statements in this discussion regarding our expectations of our future performance, liquidity and capital resources, and other non-historical statements are forward-looking statements. These forward-looking statements are subject to numerous risks and uncertainties, including, but not limited to, the risks and uncertainties described under “Risk Factors” in our Annual Report on Form 10-K for the fiscal year ended March 31, 2020.2021. Our actual results may differ materially from those contained in or implied by any forward-looking statements.
Overview
Commvault Systems, Inc. is a leading provider ofglobal data protection and information management software applications and related services. Commvault was incorporated in 1996 as a Delaware corporation. The Commvault software platform is ancompany offering customers enterprise level, integratedintelligent data and information management solution,solutions built from the ground up on a single platform and unified code base. Commvault was incorporated in Delaware in 1996.
At Commvault, we believe in solving hard problems for our customers. To do this, we provide capabilities which enable our customers to accelerate their digital transformation in today's ever evolving workforce using tools that are light touch and utilize artificial intelligence and machine learning to drive automation. Our product portfolio empowers our customers to reduce complexity, reign in data fragmentation, and accelerate their cloud journey. All software functionality shareshares the same back-end technologies to deliver the benefits of a holistic approach to protecting, managing, and accessing data. TheOur software addresses many aspects of storage and data management in the enterprise, while providing scalability and control of data and information. We believe our technology provides the broadest set of capabilities in the industry, which allows customers to reduce storage costs and administrative overhead. We also sell appliances that integrate the Commvault software with hardware and address a wide-range of business needs and use cases, ranging from support for remote or branch offices with limited IT staff up to large corporate data centers. Commvault also providesprovide our customers with a broad range of professional services that are delivered by our worldwide support and field operations.services.
Sources of Revenues
We derive a significant portion of our total revenues from sales of licenses of our software applications and related appliance products. We do not customize our software or products for a specific end-user customer. We sell our software applications and products to end-user customers both directly through our sales force and indirectly through our global network of value-added reseller partners, systems integrators, corporate resellers and original equipment manufacturers. Our software and products revenue was 43%44% and 40%43% of our total revenues for the six months ended September 30, 20202021 and 2019,2020, respectively.
Our total software and products revenue in any particular period is, to a certain extent, dependent upon our ability to generate revenues from large customer software and products deals. Larger deals (transactions greater than $0.1 million) represented 69%68% and 63%69% of our total software and products revenue in the six months ended September 30, 20202021 and 2019,2020, respectively.
Software and products revenue generated through indirect distribution channels was 95%accounted for approximately 90% of total software and products revenue in both the six months ended September 30, 20202021 and September 30, 2019.2020. Software and products revenue generated through direct distribution channels was 5%accounted for approximately 10% of total software and products revenue in both the six months ended September 30, 20202021 and September 30, 2019. The dollar value of software and products revenue generated through indirect distribution channels increased $15.0 million in the six months ended September 30, 2020 compared to the six months ended September 30, 2019. The dollar value of software and products revenue generated through direct distribution channels increased $1.6 million in the six months ended September 30, 2020 compared to the six months ended September 30, 2019.2020. Deals initiated by our direct sales force are sometimes transacted through indirect channels based on end-user customer requirements, which are not always in our control and can cause this overall percentage split to vary from period-to-period. As such, there may be fluctuations in the dollars and percentage of software and products revenue generated through our direct distribution channels from time-to-time. We believe that the growth of our software and products revenue, derived from both our indirect channel partners and direct sales force, are key attributes to our long-term growth strategy. We willplan to continue to invest in both our channel relationships and direct sales force in the future, but we continue to expect more revenue to be generated through indirect distribution channels over the long term. The failure of our indirect distribution channels or our direct sales force to effectively sell our software applications could have a material adverse effect on our revenues and results of operations.
We also have a non-exclusive distribution agreement covering our North American commercial markets and our U.S. Federal Government market with Arrow Enterprise Computing Solutions, Inc. ("Arrow"), a subsidiary of Arrow Electronics, Inc. Pursuant to this distribution agreement, Arrow's primary role is to enable a more efficient and effective distribution channel for our products and services by managing our reseller partners and leveraging their own industry experience. We generated 36%35% and 37%36% of our total revenues through Arrow in the six months ended September 30, 20202021 and 2019,2020, respectively. If Arrow were to discontinue or reduce the sales of our products, or if
our agreement with Arrow waswere terminated, and if we were unable to take back the management of our reseller channel or find another North American distributor to replace Arrow, then itsuch events would have a material adverse effect on our future business.
Our services revenue was 56% of our total revenues for the six months ended September 30, 2021 and 57% of our total revenues for the six months ended September 30, 2020 and 60% of our total revenues for the six months ended September 30, 2019.2020. Our services revenue is made up of fees from the delivery of customer support and other professional services, which are typically sold in connection with the sale of our software applications. Customer support agreements provide technical support and unspecified software updates on a when-and-if-available basis for an annual fee based on licenses purchased and the level of service subscribed. Other professional services include consulting, assessment and design services, implementation and post-deployment services and training, all of which to date have predominantly been sold in connection with the sale of software applications. Our newly launched software-as-a-service solution, branded Metallic, is also included in services revenue. Revenue from Metallic which has not been material to date, is recognized ratably over the contract period.
Foreign Currency Exchange Rates’ Impact on Results of Operations
Sales outside the United States were 47% of our total revenue for the six months ended September 30, 2021 and 45% of our total revenue for the six months ended September 30, 2020 and 49% of our total revenue for the six months ended September 30, 2019.2020. The resultsincome statements of our non-U.S. operations are translated into U.S. dollars at the average exchange rates for each applicable month in a period. To the extent the U.S. dollar weakens against foreign currencies, the translation of these foreign currency denominated transactions generally results in increased revenue, operating expenses and income from operations for our non-U.S. operations. Similarly, our revenue, operating expenses and net income will generally decrease for our non-U.S. operations if the U.S. dollar strengthens against foreign currencies.
Using the average foreign currency exchange rates from the three months ended September 30, 2019,2020, our software and products revenue would have been lower by $1.1$0.8 million, our services revenue would have been lower by $1.6$1.2 million, our cost of sales would have been lower by $0.4$0.2 million and our operating expenses would have been lower by $1.2 million from non-U.S. operations for the three months ended September 30, 2020.2021. Using the average foreign currency exchange rates forfrom the six months ended September 30, 2019,2020, our software and products revenue would have been lower by $0.7$3.9 million, our services revenue would have been lower by $0.4$5.7 million, our cost of sales would have been lower by $0.2$1.2 million and our operating expenses would have been higherlower by $0.2$4.7 million from non-U.S. operations for the six months ended September 30, 2020.2021.
In addition, we are exposed to risks of foreign currency fluctuation primarily from cash balances, accounts receivables and intercompany accounts denominated in foreign currencies and are subject to the resulting transaction gains and losses, which are recorded as a component of General and administrative expenses. We recognized net foreign currency transaction losses of approximately $0.1 million and $0.2 million for the three and six months ended September 30, 2021, respectively. We recognized net foreign currency transaction losses of approximately $1.2 million and $0.4 million for the three and six months ended September 30, 2020, respectively. We recognized net foreign currency transaction gain of $0.1 million in the three months ended September 30, 2019, and a loss of less than $0.1 million in the six months ended September 30, 2019
Critical Accounting Policies
Our condensed consolidated financial statements are prepared in accordance with U.S. GAAP. The preparation of these condensed consolidated financial statements requires us to make estimates and assumptions that affect the reported amounts of assets, liabilities, revenue, costs and expenses and related disclosures. We base our estimates on historical experience and on various other assumptions that we believe to be reasonable under the circumstances. In many instances, we could have reasonably used different accounting estimates, and in other instances changes in the accounting estimates are reasonably likely to occur from period-to-period. Accordingly, actual results could differ significantly from the estimates made by our management. To the extent that there are material differences between these estimates and actual results, our future financial statement presentation, financial condition, results of operations and cash flows will be affected.
In many cases, the accounting treatment of a particular transaction is specifically dictated by GAAP and does not require management’s judgment in its application, while in other cases, significant judgment is required in selecting among available alternative accounting standards that allow different accounting treatment for similar transactions. We consider these policies requiring significant management judgment to be critical accounting policies. These critical accounting policies are:
•Revenue Recognition;Recognition
•Accounting for Income Taxes
•Goodwill and Purchased Intangible Assets
There have been no significant changes in our critical accounting policies during the six months ended September 30, 20202021 as compared to the critical accounting policies and estimates disclosed in “Management’s Discussion and Analysis of Financial Condition and Results of Operations - Critical Accounting Policies” included in our Annual Report on Form 10-K for the year ended March 31, 2020.2021.
Results of Operations
Three months ended September 30, 20202021 compared to three months ended September 30, 20192020
Revenues (in millions)
–Total revenues increased $3.6$6.7 million, or 2%.4% as a result of the following:
•Software and products revenue represented 42% of our total revenue infor both the three months ended September 30, 20202021 and 41% of our total revenue in the three months ended September 30, 2019.2020.
•Larger deal revenue (deals greater than $0.1 million) represented 67% of our software and products revenue in the three months ended September 30, 2021 and 66% of our software and products revenue in the three months ended September 30, 2020 and 64% of our software and products revenue in the three months ended September 30, 2019.2020.
–Software and products revenue increased $3.7$3.0 million, or 5%4%, as a result of the following:
•An increase of $3.5$2.9 million, or 8%6%, in larger deal revenue.
•An increase of 11%$0.1 million in transactions less than $0.1 million.
•An increase of 9% in the volume of larger deal revenue transactions offset by a decrease of 3% into 163 deals for the average dollar amount of such transactions.three months ended September 30, 2021, up from 150 deals for the three months ended September 30, 2020.
•The average dollar amount of larger deal revenue transactions was approximately $319$311 thousand and $328$319 thousand for the three months ended September 30, 2021 and 2020, and 2019, respectively.respectively, representing a 3% decrease.
•An increase of $0.2 million in transactions less than $0.1On a year over year basis, pass through hardware sales decreased approximately $3.0 million. Software revenues, excluding hardware, were up 9% year over year.
–Services revenue represented 58% of our total revenue in both the three months ended September 30, 20202021 and 59% of our total revenue in the three months ended September 30, 2019.2020. Services revenue decreased $0.2increased $3.7 million primarily due to the following:
•An increase of $0.4$5.7 million of other services revenue, driven primarily by the year over year increase in training and consulting services.revenue from Metallic.
•OffsetPartially offset by a decrease of $0.6$2.0 million in revenue from customer support agreements.
We track software and products revenue on a geographic basis. The geographic regions that are tracked are the Americas (United States, Canada, Latin America), EMEA (Europe, Middle East, Africa) and APJ (Australia, New Zealand, Southeast Asia, China, Japan). Americas, EMEA and APJ represented 54%59%, 31%30% and 15%11% of total software and products revenue, respectively, for the three months ended September 30, 2020.2021. Software and products revenue increased 9% year over year by 13% in the Americas and 3%1% in EMEA; whereas APJ declined 3%20%.
▪The increase in Americas software and products revenue was primarily the result of a 9%an 11% increase in larger deal transactions revenue driven by an an increase in the volume of larger deal transactions.
▪EMEA software and products revenue increased as a result of a 4%an 18% increase in revenue on larger deal transactions partially offset by a decrease on deals under $0.1 million.
▪The decrease in APJ was the result of larger deal transactions decreasing versus the prior year period, partially offset by an increase in deals under $0.1 million.
Our software and products revenue in EMEA and APJ is subject to changes in foreign exchange rates as more fully discussed above in the “Foreign Currency Exchange Rates’ Impact on Results of Operations” section.
Cost of Revenues and Gross Margin ($ in millions)
–Total cost of revenues decreased $0.2 million, and represented 15% of our total revenues for the three months ended September 30, 2021 compared to 16% for the three months ended September 30, 2020.
–Cost of software and products revenue decreased $5.0 million, and represented 4% of our total software and products revenue for the three months ended September 30, 2021 compared to 11% for the three months ended September 30, 2020. The decrease is the result of reduced sales of hardware associated with our appliance as well as reduced software royalties associated with sales of HyperScale appliances and software. Beginning with the launch of HyperScale X in the mid fiscal 2021, we began transitioning to a software only model. HyperScale X has also reduced software royalties relative to prior versions of HyperScale.
–Cost of services revenue increased $4.8 million, representing 23% of our total services revenue for the three months ended September 30, 2021 compared to 19% decreasefor the three months ended September 30, 2020. The increase in cost of services revenue is primarily related to an increase in the cost of infrastructure related to Metallic.
Operating Expenses ($ in millions)
– Sales and marketing expenses increased $3.8 million, or 5%, primarily due to increases in employee compensation and related costs relative to the same time in the prior year due to temporary salary reductions and reduced travel.
– Research and development expenses increased $6.7 million, or 22%, as a result of an increase in employee compensation and related expenses attributable to the expansion of our engineering group.
•The increase in employee compensation included an increase in stock-based compensation of $2.8 million compared to prior year.
•Investing in research and development has been a priority for Commvault, and we anticipate continued spending related to the development of our data and information management software applications.
– General and administrative expenses increased $0.7 million, or 2%, primarily due to the following:
•Increase in employee compensation and related costs relative to the same time in the prior year due to temporary salary reductions.
•General and administrative expenses include a $2.5 million settlement gain net against related legal expenses.
–Depreciation and amortization expense decreased $2.7 million, from $5.1 million in the three months ended September 30, 2020 to $2.4 million in the three months ended September 30, 2021, driven by the elimination of amortization of intangible assets related to Hedvig due to their impairment in the second quarter of fiscal 2021.
Income Tax Expense
Income tax expense was $0.8 million in the three months ended September 30, 2021 compared to a benefit of $0.5 million in the three months ended September 30, 2020. The income tax expense for the three months ended September 30, 2021 relates primarily to current foreign taxes.
Six months ended September 30, 2021 compared to six months ended September 30, 2020
Revenues (in millions)
–Total revenues increased $17.2 million, or 5%.
•Software and products revenue represented 44% of our total revenue in the six months ended September 30, 2021 and 43% of our total revenue in the six months ended September 30, 2020.
•Larger deal revenue (deals greater than $0.1 million) represented 68% of our software and products revenue in the six months ended September 30, 2021 and 69% of our software and products revenue in the six months ended September 30, 2020.
–Software and products revenue increased $8.6 million, or 6%, as a result of the following:
•An increase of $4.8 million, or 11%, in transactions less than $0.1 million.
•An increase of $3.7 million, or 4%, in larger deal revenue. This increase was driven by an increase of 21% in the volume of larger deal revenue transactions which included 348 deals for the six months ended September 30, 2021, up from 288 deals for the six months ended September 30, 2020.
•The average dollar amount of larger deal revenue transactions was approximately $308 thousand and $359 thousand for the six months ended September 30, 2021 and 2020, respectively, representing a 14% decrease. The prior year first half included a high seven figure transaction that significantly impacted the average dollar amount per transaction.
–Services revenue represented 56% of our total revenue in the six months ended September 30, 2021 and 57% of our total revenue in the six months ended September 30, 2020. Services revenue increased $8.6 million primarily due to the following:
•An increase of $10.2 million of other services revenue, driven primarily by the year over year increase in revenue from deals under $0.1 million partiallyMetallic.
•Partially offset by a 13%decrease of $1.7 million in revenue from customer support agreements.
We track software and products revenue on a geographic basis. The geographic regions that are tracked are the Americas (United States, Canada, Latin America), EMEA (Europe, Middle East, Africa) and APJ (Australia, New Zealand, Southeast Asia, China, Japan). Americas, EMEA and APJ represented 61%, 28% and 11% of total software and products revenue, respectively, for the six months ended September 30, 2021. Software and products revenue increased year over year by 7% in both the Americas and EMEA and declined 2% in APJ.
▪The increase in Americas software and products revenue was primarily the result of a 29% increase in transactions less than $0.1 million.
▪EMEA software and products revenue increased as a result of a 14% increase in revenue on larger deal transactions.
▪The decrease in APJ was the result of a decrease in larger deal transactions.
Our software and products revenue in EMEA and APJ is subject to changes in foreign exchange rates as more fully discussed above in the “Foreign Currency Exchange Rates’ Impact on Results of Operations” section.
Cost of Revenues and Gross Margin ($ in millions)
–Total cost of revenues decreased $4.4increased $0.4 million, representing 16%and represented 14% of our total revenues for the threesix months ended September 30, 2020 compared to 19%2021 and 15% for the threesix months ended September 30, 2019. Temporary salary cuts during the second quarter of fiscal year 2021 related to COVID-19 resulted in savings in cost of revenues.2020.
–Cost of software and products revenue decreased $0.9$8.6 million, representing 11%and represented 3% of our total software and products revenue for the threesix months ended September 30, 20202021 compared to 13%9% for the threesix months ended September 30, 2019.2020. The decrease is the result of lower costreduced sales of saleshardware associated with our appliance.appliance as well as reduced software royalties associated with sales of HyperScale appliances and software. Beginning with the launch of HyperScale X in mid fiscal 2021, we began transitioning to a software only model. HyperScale X also has reduced software royalties relative to prior versions of HyperScale.
–Cost of services revenue decreased $3.5increased $9.0 million, representing 19%23% of our total services revenue for the threesix months ended September 30, 20202021 compared to 23%19% for the threesix months ended September 30, 2019.2020. The declineincrease in cost of services revenue is primarily related to an increase in the cost of infrastructure related to Metallic, as well as an increase in employee compensation and related expenses compared to the prior year due to the temporary salarypay cuts duringenacted in the second quarterfirst half of fiscal year 2021 related to COVID-19.
Operating Expenses ($ in millions)
– Sales and marketing expenses decreased $1.9$1.5 million, or 2%1%, primarily due to the following:
•Decreasesa decrease in employee compensation and related to the decline of travel expenses as a result of COVID-19.
•Temporary salary cuts during the second quarter of fiscal year 2021 related to COVID-19.costs.
– Research and development expenses increased $7.7$11.8 million, or 33%19%, as a result of an increase in employee compensation and related expenses attributable to the expansion of our engineering group.
•TheIncrease in employee compensation included an increase is the result of additional headcount related to the acquisition of Hedvig including thein stock-based compensation issued in connection with the transaction.
•Additionally, certain Hedvig shareholders will receive cash payments totaling $14.1of $4.1 million over the course of the 30 months following the date of acquisition, subjectcompared to their continued employment with the Company. While these payments are proportionate to these shareholders' ownership of Hedvig, under GAAP they are accounted for as compensation expense over the course of the 30 month service period. Research and development expenses in the three months ended September 30, 2020 includes $1.4 million of expense related to this arrangement.
•These increases were partially offset by $0.6 million in savings related to temporary pay cuts during the second quarter of fiscal year 2021.prior year.
•Investing in research and development has been a priority for Commvault, and we anticipate continued spending related to the development of our data and information management software applications.
– General and administrative expenses remained flatincreased $5.5 million, or 12%, primarily due to the following:
•Reduction of $3.6 millionIncrease in employee compensation and related expenses compared to the prior year expenses associated with a non-routine shareholder matter and Hedvig acquisition costs.due to the temporary pay cuts enacted in the first half of 2021.
•Offset by increases inGeneral and administrative expenses include a $2.5 million settlement gain net against related legal expenses for intellectual property associated with ongoing litigation and foreign currency losses dueexpenses.
•Stock-based compensation increased $3.1 million compared to the weakening of the US dollar.prior year.
– Restructuring: Our restructuring plan is intended to increase efficiency in our sales, marketing and distribution functions as well as reduce costs across all functional areas. Restructuring expenses were $5.8$2.1 million and $12.9$8.1 million in the threesix months ended September 30, 20202021 and 2019,2020, respectively. These restructuring charges relate primarily to severance and related costs associated with headcount reductions as well as lease abandonment charges related to the closure of three offices in the second quarter of fiscal year 2021.reductions. These charges include $0.6$0.4 million and $0.7 million in both the threesix months ended September 30, 20202021 and 2019,2020, respectively, of stock-based compensation related to modifications of existing awards granted to certain employees included in the restructuring. We cannot guarantee the restructuring program will achieve its intended result. Risks associated with this restructuring program also include additional unexpected costs, adverse effects on employee morale and the failure to meet operational and growth targets due to the loss of key employees, any of which may impair our ability to achieve anticipated results of operations or otherwise harm our business.
–Impairment of intangible assets: In the second quarter of fiscal year 2021, we recorded non-cash impairment charges of $40.7 million on the intangible assets (developed technology and customer relationships) acquired in connection with Hedvig, Inc. The charges were the result of a moderated view of acquisition assumptions.
–Depreciation and amortization expense increased $2.3 million, from $2.7 million in the three months ended September 30, 2019 to $5.1 million in the three months ended September 30, 2020, driven by the amortization of intangible assets acquired as a result of the Hedvig business combination in October 2019.
Income Tax Expense
Income tax benefit was $0.5 million in the three months ended September 30, 2020 compared to expense of $0.5 million in the three months ended September 30, 2019. The income tax benefit for the three months ended September 30, 2020 relates primarily to current federal and foreign benefits.
Six months ended September 30, 2020 compared to six months ended September 30, 2019
Revenues (in millions)
–Total revenues increased $14.4 million, or 4%.
•Software and products revenue represented 43% of our total revenue in the six months ended September 30, 2020 and 40% of our total revenue in the six months ended September 30, 2019.
•Larger deal revenue (deals greater than $0.1 million) represented approximately 69% of our software and products revenue in the six months ended September 30, 2020 and 63% of our software and products revenue in the six months ended September 30, 2019.
–Software and products revenue increased $16.6 million, or 13%, as a result of the following:
•An increase of $19.8 million, or 24%, in larger deal revenue.
•An increase of 8% in the number of larger deal revenue transactions and an increase of 15% in the average dollar amount of such transactions.
•The average dollar amount of larger deal revenue transactions was approximately $359 thousand and $313 thousand for the six months ended September 30, 2020 and 2019, respectively.
•These increases were partially offset by a decrease of $3.2 million in transactions less than $0.1 million.
–Services revenue represented 57% of our total revenue in the six months ended September 30, 2020 and 60% of our total revenue in the six months ended September 30, 2019. Services revenue decreased $2.2 million, or 1%, primarily due to the following:
•A decrease of $0.8 million in training and consulting services. In certain cases, the COVID-19 pandemic has impacted our ability to perform on-site professional services during the first half of the year.
•A decrease of $1.4 million in revenue from customer support agreements.
We track software and products revenue on a geographic basis. The geographic regions that are tracked are the Americas (United States, Canada, Latin America), EMEA (Europe, Middle East, Africa) and APJ (Australia, New Zealand, Southeast Asia, China, Japan). Americas, EMEA and APJ represented 61%, 27% and 12% of total software and products revenue, respectively, for the six months ended September 30, 2020. Software and products revenue increased 34% year over year in the Americas; whereas EMEA and APJ declined 5% and 19%, respectively.
▪The increase in Americas software and products revenue was primarily the result of a 46% increase in revenue from larger deal transactions compared to the first half of prior year.
▪EMEA software and products revenue decreased as a result of a 5% decrease in larger deal transactions revenue.
▪The decrease in APJ was primarily the result of a decrease in the volume of revenue from larger deal transactions.
Our software and products revenue in EMEA and APJ is subject to changes in foreign exchange rates as more fully discussed above in the “Foreign Currency Exchange Rates’ Impact on Results of Operations” section.
Cost of Revenues and Gross Margin ($ in millions)
–Total cost of revenues decreased $8.6 million, representing 15% of our total revenues for the six months ended September 30, 2020 compared to 18% for the six months ended September 30, 2019. Temporary salary cuts during fiscal year 2021 related to COVID-19 resulted in savings of $1.1 million in cost of revenues.
–Cost of software and products revenue decreased $1.1 million, representing 9% of our total software and products revenue for the six months ended September 30, 2020 compared to 11% for the six months ended September 30, 2019. The decrease is the result of lower cost of sales associated with our appliance.
–Cost of services revenue decreased $7.5 million, representing 19% of our total services revenue for the six months ended September 30, 2020 compared to 23% for the six months ended September 30, 2019. The decline in cost of services revenue is primarily related to the decrease in expenses associated with the delivery of professional services revenue as well as temporary salary cuts during fiscal year 2021 related to COVID-19.
Operating Expenses ($ in millions)
– Sales and marketing expenses decreased $7.6 million, or 5%, primarily due to the following:
•Decreases related to the decline of travel expenses as a result of COVID-19.
•Temporary salary cuts during fiscal year 2021 related to COVID-19.
– Research and development expenses increased $15.3 million, or 33%, as a result of an increase in employee compensation and related expenses attributable to the expansion of our engineering group.
•The increase is the result of additional headcount related to the acquisition of Hedvig including the stock-based compensation issued in connection with the transaction.
•Additionally, certain Hedvig shareholders will receive cash payments totaling $14.1 million over the course of the 30 months following the date of acquisition, subject to their continued employment with the Company. While these payments are proportionate to these shareholders' ownership of Hedvig, under GAAP they are accounted for as compensation expense over the course of the 30 month service period. Research and development expenses in the six months ended September 30, 2020 includes $2.8 million of expense related to this arrangement.
•These increases were partially offset by $1.7 million in savings related to temporary pay cuts in the first half of fiscal year 2021.
•Investing in research and development has been a priority for Commvault, and we anticipate continued spending related to the development of our data and information management software applications.
– General and administrative expenses decreased $1.0 million, or 2%, primarily due to the following:
•Reduction of $5.5 million related to prior year expenses associated with a non-routine shareholder matter and Hedvig acquisition costs.
•Partially offset by increases in legal expenses for intellectual property associated with ongoing litigation and foreign currency losses due to the weakening of the US dollar.
– Restructuring: Our restructuring plan is intended to increase efficiency in our sales, marketing and distribution functions as well as reduce costs across all functional areas. Restructuring expenses were $8.1 million and $16.9 million in the six months ended September 30, 2020 and 2019, respectively. These restructuring charges relate primarily to severance and related costs associated with headcount reductions as well as lease abandonment charges related to the closure of five offices in the first half of fiscal year 2021 and three offices in the first half of fiscal year 2020. These charges include $0.7 million for the six months ended September 30, 2020 and $1.0 million for the six months ended September 30, 2019 of stock-based compensation related to modifications of existing awards granted to certain employees included in the restructuring. We cannot guarantee the restructuring program will achieve its intended result. Risks associated with this restructuring program also include additional unexpected costs, adverse effects on employee morale and the failure to meet operational and growth targets due to the loss of key employees, any of which may impair our ability to achieve anticipated results of operations or otherwise harm our business.
–Impairment of intangible assets: In the second quarter of fiscal year 2021, we recorded non-cash impairment charges of $40.7 million on the intangible assets (developed technology and customer relationships) acquired in connection with Hedvig, Inc. The charges were the result of a moderated view of acquisition assumptions.
–Depreciation and amortization expense increased $4.8decreased $5.5 million, from $5.3 million in the six months ended September 30, 2019 to $10.1 million in the six months ended September 30, 2020 to $4.6 million in the six months ended September 30, 2021, driven by the elimination of amortization of intangible assets acquired as a resultrelated to Hedvig due to their impairment in the second quarter of the Hedvig business combination in October 2019.fiscal 2021.
Income Tax Expense
Income tax expense was $2.6 million in the six months ended September 30, 2021 compared to expense of $4.2 million in the six months ended September 30, 2020 compared to2020. The income tax expense of $2.6 million infor the six months ended September 30, 2019. In the fourth quarter of fiscal 2020, we recorded a2021 relates primarily to current tax benefit of approximately $10.0 million which represented our estimate of the net operating loss carryback resulting from the CARES Act. In the first quarter of fiscal 2021, we recorded an adjustment of $3.2 million to reduce the current benefit of the net operating loss carryback benefit we will realize from the CARES Act.foreign taxes.
Liquidity and Capital Resources
As of September 30, 2020,2021, our cash and cash equivalents balance of $383.2 million primarily consisted of cash. In addition, we have approximately $10.8 million of short-term investments invested in U.S. Treasury Bills.was $295.8 million. In recent fiscal years, our principal source of liquidity has been cash provided by operations.
As of September 30, 2020,2021, the amount of cash and cash equivalents held outside of the United States by our foreign legal entities was approximately $162.7$172.7 million. These balances are dispersed across many international locations around the world. We believe that such dispersion meets the current and anticipated future liquidity needs of our foreign legal entities. In the event we needed to repatriate funds from outside of the United States, such repatriation would likely be subject to restrictions by local laws and/or tax consequences including foreign withholding taxes.
We did not repurchase any shares of our common stock under our share repurchase program duringDuring the three and six months ended September 30, 2020. Under2021, we repurchased $180.1 million of our common stock (2,408 shares) under our share repurchase program, repurchased shares are constructively retired and returned to unissued status.program. Our stock repurchase program has been funded by our existing cash and cash equivalent balances as well as cash flows provided by our operations. As of October 27, 2020, $200.0 million remained in our current stock repurchase authorization which expires on March 31, 2022.
Our future stock repurchase activity is subjectBoard has approved, and we intend to the business judgment of our management and Board of Directors, taking into consideration our historical and projected results of operations, financial condition, cash flows and other anticipatedexecute, a capital requirements or investment alternatives. Our stock repurchase program reduces the dilutive impact on our common shares outstanding associated with stock option exercises and our previous public and private stock offerings throughallocation policy that provides for the repurchase of $200 million of our common stock for the period from February 1, 2021 through the end of our 2022 fiscal year, plus the use of approximately 75% of our fiscal 2022 free cash flow for additional repurchases during fiscal year 2022. Since February 1, 2021 through September 30, 2021 we have repurchased $242.2 million of common stock.
Our summarized cash flow information is as follows (in thousands):
| | | | | | | | | | | | | | |
| | | Six Months Ended September 30, |
| | | 2020 | | 2019 |
| Net cash provided by operating activities | | $ | 42,242 | | | $ | 55,119 | |
| Net cash provided by investing activities | | 29,138 | | | 31,262 | |
| Net cash provided by (used in) financing activities | | 5,271 | | | (33,701) | |
| Effects of exchange rate-changes in cash | | 10,420 | | | (3,047) | |
| Net increase in cash, cash equivalents and restricted cash | | $ | 87,071 | | | $ | 49,633 | |
| | | | | | | | | | | | | | |
| | | Six Months Ended September 30, |
| | | 2021 | | 2020 |
| Net cash provided by operating activities | | $ | 63,270 | | | $ | 42,242 | |
| Net cash (used in) provided by investing activities | | (4,699) | | | 29,138 | |
| Net cash (used in) provided by financing activities | | (156,831) | | | 5,271 | |
| Effects of exchange rate-changes in cash | | (3,170) | | | 10,420 | |
| Net (decrease) increase in cash and cash equivalents | | $ | (101,430) | | | $ | 87,071 | |
– Net cash provided by operating activities was impacted by net lossincome adjusted for the impact of non-cash charges, a decrease in accounts receivable, partially offset by a decrease in accrued expenses.liabilities.
– Net cash provided byused in investing activities was related to net proceeds from$2.7 million in the maturitypurchase of short-term investments of $32.8 million partially offset by $3.7and $2.0 million of capital expenditures.
– Net cash provided byused in financing activities was the result of $5.3$180.1 million of repurchases of common shares partially offset by $23.3 million of proceeds from the exercise of stock options and purchases of our stock under the Employee Stock Purchase Plan.options.
Working capital increased $59.2decreased $91.5 million from $185.1$234.4 million as of March 31, 20202021 to $244.3$142.9 million as of September 30, 2020.2021. The net increasedecrease in working capital is primarily the result of cash flow from operations.used for share repurchases during the quarter.
We believe that our existing cash, cash equivalents and our cash from operations will be sufficient to meet our anticipated cash needs for working capital, income taxes, capital expenditures and potential stock repurchases for at least the next twelve months. We may seek additional funding through public or private financings or other arrangements during this period. Adequate funds may not be available when needed or may not be available on terms favorable to us, or at all. If additional funds are raised by issuing equity securities, dilution to existing stockholders will result. If we raise additional funds by obtaining loans from third parties, the terms of those financing arrangements may include negative covenants or other restrictions on our business that could impair our operational flexibility, and would also require us to fund additional interest expense. If funding is insufficient at any time in the future, we may be unable to develop or enhance our products or services, take advantage of business opportunities or respond to competitive pressures, any of which could have a material adverse effect on our business, financial condition and results of operations.
Off-Balance Sheet Arrangements
As of September 30, 2020,2021, we did not have off-balance sheet financing arrangements, including any relationships with unconsolidated entities or financial partnerships, such as entities often referred to as structured finance or special purpose entities.
Indemnifications
Certain of our software licensing agreements contain certain provisions that indemnify our customers from any claim, suit or proceeding arising from alleged or actual intellectual property infringement. These provisions continue in perpetuity along with our software licensing agreements. We have never incurred a liability relating to one of these indemnification provisions in the past and we believe that the likelihood of any future payout relating to these provisions is remote. Therefore, we have not recorded a liability during any period related to these indemnification provisions.
Impact of Recently Issued Accounting Standards
See Note 2 of the unaudited consolidated financial statements for a discussion of the impact of recently issued accounting standards.
Item 3 - Quantitative and Qualitative Disclosures about Market Risk
Interest Rate Risk
As of September 30, 2020, our cash and cash equivalents and short-term investments consisted primarily of cash and U.S. Treasury Bills. Due to the short-term nature of these investments, we are not subject to any material interest rate risk on these balances.None.
Foreign Currency Risk
Economic Exposure
As a global company, we face exposure to adverse movements in foreign currency exchange rates. Our international sales are generally denominated in foreign currencies and this revenue could be materially affected by currency fluctuations. Approximately 45%47% of our sales were outside the United States for the six months ended September 30, 2020.2021. Our primary exposures are to fluctuations in exchange rates for the U.S. dollar versus the Euro, and to a lesser extent, the Australian dollar, British pound sterling, Canadian dollar, Chinese yuan, Indian rupee, Korean won and Singapore dollar. Changes in currency exchange rates could adversely affect our reported revenues and require us to reduce our prices to remain competitive in foreign markets, which could also have a material adverse effect on our results of operations. Historically, we have periodically reviewed and revised the pricing of our products available to our customers in foreign countries and we have not maintained excess cash balances in foreign accounts.
Transaction Exposure
Our exposure to foreign currency transaction gains and losses is primarily the result of certain net receivables due from our foreign subsidiaries and customers being denominated in currencies other than the functional currency of the subsidiary. Our foreign subsidiaries conduct their businesses in local currency and we generally do not maintain excess U.S. dollar cash balances in foreign accounts.
Foreign currency transaction gains and losses are recorded in General and administrative expenses in the Consolidated Statements of Operations. We recognized net foreign currency transaction losses of less than $0.1 million and $0.2 million for the three and six months ended September 30, 2021, respectively. We recognized net foreign currency transaction losses of approximately $1.2 million and $0.4 million for the three and six months ended September 30, 2020, respectively. We recognized net foreign transaction gain of $0.1 million and a loss of less than $0.1 million for the three and six months ended September 30, 2019, respectively. The net foreign currency transaction gains and losses recorded in General and administrative expenses include settlement gains and losses on forward contracts disclosed below.
Item 4 - Controls and Procedures
Evaluation of Disclosure Controls and Procedures
Our management, with the participation of the Chief Executive Officer and Chief Financial Officer, has evaluated the effectiveness of our disclosure controls and procedures, as defined in Rules 13a-15(e) and 15d-15(e) of the Securities Exchange Act of 1934, as of September 30, 2020.2021. Based on that evaluation, the Chief Executive Officer and Chief Financial Officer concluded that our disclosure controls and procedures were effective as of September 30, 2020.
Changes in Internal Control over Financial Reporting
There was no change in our internal control over financial reporting that occurred during the second quarter of fiscal 20212022 that has materially affected, or is reasonably likely to materially affect, our internal control over financial reporting.
Inherent Limitations on Internal Controls
Our management, including our Chief Executive Officer and Chief Financial Officer, do not expect that our disclosure controls and procedures or our internal controls over financial reporting will prevent or detect all error and all fraud. A control system, no matter how well designed and operated, can provide only reasonable, not absolute, assurance that the control objectives of the control system are met. Further, the design of a control system must reflect the fact that there are resource constraints, and the benefits of controls must be considered relative to their costs. Because of inherent limitations in all control systems, no evaluation of controls can provide absolute assurance that all control issues and instances of fraud, if any, within the company have been detected. These inherent limitations include the realities that judgments in decision-making can be faulty, and that breakdowns can occur because of a simple error or mistake. Additionally, controls can be circumvented by the individual acts of some persons, by collusion of two or more people, or by management override of the controls. The design of any system of controls also is based in part upon certain assumptions about the likelihood of future events, and there can be no assurance that any design will succeed in achieving its stated goals under all potential future conditions. Over time, controls may become inadequate because of changes in conditions, or the degree of compliance with the policies or procedures may deteriorate. Because of inherent limitations in a cost-effective control system, misstatements due to error or fraud may occur and not be detected.
PART II. OTHER INFORMATION
Item 1. Legal Proceedings
From time to time, we are subject to claims in legal proceedings arising in the normal course of our business. We do not believe that we are currently party to any pending legal action that could reasonably be expected to have a material adverse effect on our business or operating results. Please refer to Part I, “Item 1A. Risk Factors” in our Annual Report on Form 10-K for the year ended March 31, 2021 for additional information.
Item 1A. Risk Factors
In addition to the other information set forth in this report, you should carefully consider the factors discussed in Part I, “Item 1A. Risk Factors” in our Annual Report on Form 10-K for the year ended March 31, 2020,2021, which could materially affect our business, financial condition or future results. Additional risks and uncertainties not currently known to us or that we currently deem to be immaterial also may materially adversely affect our business, financial condition and/or operating results. If any of the risks actually occur, our business, financial conditions or results of operations could be negatively affected. In that case, the trading price of our stock could decline, and our stockholders may lose part or all of their investment.
Item 2. Unregistered Sale of Equity Securities and Use of Proceeds
Purchases of Equity Securities by the Issuer
There were no purchases of our common stock duringDuring the three months ended September 30, 2020.2021, we repurchased $90.0 million of common stock, or 1,158,900 shares, under our share repurchase program. A summary of our repurchases of common stock is as follows:
| | | | | | | | | | | | | | | | | | | | | | | | | | |
| Period | | Total number of shares purchased as part of publicly announced programs | | Average price paid per share | | Total dollar value of purchases | | Approximate dollar value of shares that may yet be purchased under the program |
| July 2021 | | 398,600 | | | $ | 78.26 | | | $ | 31,194,940 | | | * |
| August 2021 | | 425,500 | | | $ | 76.76 | | | $ | 32,661,456 | | | * |
| September 2021 | | 334,800 | | | $ | 78.22 | | | $ | 26,187,390 | | | * |
| Three months ended September 30, 2021 | | 1,158,900 | | | $ | 77.70 | | | 90,043,786 | | | |
* Our Board has approved, and we intend to execute, a capital allocation policy that provides for the repurchase of $200 million of our common stock for the period from February 1, 2021 through the end of our 2022 fiscal year, plus the use of approximately 75% of our fiscal 2022 free cash flow for additional repurchases during fiscal year 2022. Since February 1, 2021 through September 30, 2021 we have repurchased $242.2 million of common stock.
Item 3. Defaults upon Senior Securities
None.
Item 4. Mine Safety Disclosures
Not Applicable.
Item 5. Other Information
As reported in our 8-K filed on August 28, 2020, at our fiscal 2020 Annual Meeting of Stockholders held on August 27, 2020, the stockholders approved the Commvault Systems, Inc. Omnibus Incentive Plan as amended by the Fourth Amendment (the “Incentive Plan”), pursuant to which we may grant awards to its officers, employees, directors, consultants, independent contractors and agents and those of its affiliates. Awards that may be granted under the Incentive Plan include stock options, stock appreciation rights, full value awards (including restricted stock, restricted stock units, performance shares or units and other stock-based awards) and cash-based awards. The Fourth Amendment increased the number of shares available for issuance under the Incentive Plan by 1,000,000 shares for a total of 8,050,000 shares of Common Stock.
A more complete description of the Incentive Plan is contained in our proxy statement, dated July 7, 2020, as filed with the Securities and Exchange Commission (“Proxy Statement”), under the heading “Proposal 4 - Approval of Commvault Systems, Inc. Omnibus Incentive Plan, as amended by the Fourth Amendment” which is incorporated herein by reference. The descriptions of the Incentive Plan set forth herein and in the Proxy Statement are qualified in their entirety by reference to the complete text of the Commvault Systems, Inc. Omnibus Incentive Plan (as amended by the Fourth Amendment Thereof), which is incorporated by reference to Exhibit 10.1 hereof.Not Applicable.
Item 6. Exhibits
| | | | | |
| Exhibit No. | Description |
| Amended and Restated Certificate of Incorporation of Commvault Systems, Inc., as amended (incorporated by reference to Exhibit 3.1 to the Registrant's Form 8-K filed August 28, 2020) |
| Third Amended and Restated Bylaws of Commvault Systems, Inc. (incorporated by reference to Exhibit 3.2 to the Registrant's Form 8-K filed August 28, 2020) |
| Commvault Systems, Inc. Omnibus Incentive Plan (as amended by the FourthFifth Amendment Thereof) |
| Certification of Chief Executive Officer Pursuant to Section 302 of the Sarbanes-Oxley Act of 2002 |
| Certification of Chief Financial Officer Pursuant to Section 302 of the Sarbanes-Oxley Act of 2002 |
| Certification of Chief Executive Officer Pursuant to Section 906 of the Sarbanes-Oxley Act of 2002 |
| Certification of Chief Financial Officer Pursuant to Section 906 of the Sarbanes-Oxley Act of 2002 |
| 101.INS | XBRL Instance Document - the instance document does not appear in the Interactive Data File because its XBRL tags are embedded within the Inline XBRL document. |
| 101.SCH | XBRL Taxonomy Extension Schema Document |
| 101.CAL | XBRL Taxonomy Extension Calculation Linkbase Document |
| 101.DEF | XBRL Taxonomy Extension Definition Linkbase Document |
| 101.LAB | XBRL Taxonomy Extension Label Linkbase Document |
| 101.PRE | XBRL Taxonomy Extension Presentation Linkbase Document |
| 104 | Cover Page Interactive Data File (formatted as Inline XBRL and contained in Exhibit 101) |
Signatures
Pursuant to the requirements of the Securities Act of 1934, the registrant has duly caused this report to be signed on its behalf by the undersigned thereunto duly authorized.
| | | | | | | | | | | | | | |
| | | Commvault Systems, Inc. |
| | | |
| Dated: | October 28, 202027, 2021 | | By: | /s/ Sanjay Mirchandani |
| | | Sanjay Mirchandani |
| | | Director, President and Chief Executive Officer |
| | | |
| Dated: | October 28, 202027, 2021 | | By: | /s/ Brian Carolan |
| | | Brian Carolan |
| | | Vice President and Chief Financial Officer |