UNITED STATES
SECURITIES AND EXCHANGE COMMISSION
Washington, D.C. 20549
FORM 10-Q
|
| | | | |
x☒ | QUARTERLY REPORT PURSUANT TO SECTION 13 OR 15(d) OF THE SECURITIES EXCHANGE ACT OF 1934 |
For the quarterly period ended September 30, 20172022
OR
|
| | | | |
¨☐ | TRANSITION REPORT PURSUANT TO SECTION 13 OR 15(d) OF THE SECURITIES EXCHANGE ACT OF 1934 |
For the transition period from to
Commission File Number 001-35940
CHANNELADVISOR CORPORATION
(Exact name of registrant as specified in its charter)
____________________________________________________
|
| | | | | | | |
| Delaware | | 56-2257867 |
(State or Other Jurisdiction of
Incorporation or Organization)
| | (I.R.S. Employer
Identification No.)
|
| |
| 3025 Carrington Mill Boulevard, Morrisville, NC | | 27560 |
| (Address of principal executive offices) | | (Zip Code) |
(919) 228-4700
(Registrant’sRegistrant's telephone number, including area code)
N/A
(Former name, former address and former
fiscal year, if changed since last report)
____________________________________________________
Securities registered pursuant to Section 12(b) of the Exchange Act:
| | | | | | | | |
| Title of each class | Trading Symbol | Name of each exchange on which registered |
| Common Stock, $0.001 par value | ECOM | New York Stock Exchange |
Indicate by check mark whether the registrant: (1) has filed all reports required to be filed by Section 13 or 15(d) of the Securities Exchange Act of 1934 during the preceding 12 months (or for such shorter period that the registrant was required to file such reports), and (2) has been subject to such filing requirements for the past 90 days. Yes x☒ No ¨☐
Indicate by check mark whether the registrant has submitted electronically and posted on its corporate Website, if any, every Interactive Data File required to be submitted and posted pursuant to Rule 405 of Regulation S-T (§232.405 of this chapter) during the preceding 12 months (or for such shorter period that the registrant was required to submit and post such files). Yes x☒ No ¨☐
Indicate by check mark whether the registrant is a large accelerated filer, an accelerated filer, a non-accelerated filer, a smaller reporting company or an emerging growth company. See the definitions of “large"large accelerated filer,” “accelerated" "accelerated filer,” “smaller" "smaller reporting company”company" and "emerging growth company" in Rule 12b-2 of the Securities Exchange Act of 1934.
|
| | | | | | | | | | |
| Large accelerated filer | ¨☒ | Accelerated filer | x☐ |
| Non-accelerated filer | o (Do not check if a smaller reporting company)
☐ | Smaller reporting company | ¨☐ |
| | Emerging growth company | x☐ | | |
If an emerging growth company, indicate by check mark if the registrant has elected not to use the extended transition period for complying with any new or revised financial accounting standards provided pursuant to Section 13(a) of the Exchange Act. x¨
Indicate by check mark whether the registrant is a shell company (as defined in Rule 12b-2 of the Securities Exchange Act of 1934). Yes ¨☐ No x☒
The number of outstanding shares of the registrant’sregistrant's common stock, par value $0.001 per share, as of the close of business on October 19, 201731, 2022 was 26,569,655.
28,916,493.
PART I - FINANCIAL INFORMATION
ITEM 1. FINANCIAL STATEMENTS AND SUPPLEMENTARY DATA
CHANNELADVISOR CORPORATION AND SUBSIDIARIES
CONDENSED CONSOLIDATED BALANCE SHEETS
(in thousands, except share and per share data)
| |
| September 30, 2017 |
| December 31, 2016 | | September 30, 2022 | | December 31, 2021 |
| | (unaudited) |
| | | (unaudited) | | |
| Assets |
|
|
| Assets | |
| Current assets: |
|
|
| Current assets: | |
| Cash and cash equivalents | $ | 54,178 |
|
| $ | 65,420 |
| Cash and cash equivalents | $ | 88,115 | | | $ | 100,567 | |
| Accounts receivable, net of allowance of $304 and $594 as of September 30, 2017 and December 31, 2016, respectively | 21,276 |
|
| 19,445 |
| |
| Accounts receivable, net of allowance of $241 and $279 as of September 30, 2022 and December 31, 2021, respectively | | Accounts receivable, net of allowance of $241 and $279 as of September 30, 2022 and December 31, 2021, respectively | 25,675 | | | 28,886 | |
| Prepaid expenses and other current assets | 12,249 |
|
| 10,972 |
| Prepaid expenses and other current assets | 14,823 | | | 15,497 | |
| Total current assets | 87,703 |
|
| 95,837 |
| Total current assets | 128,613 | | | 144,950 | |
| Property and equipment, net | 11,797 |
|
| 13,252 |
| |
| Operating lease right of use assets | | Operating lease right of use assets | 5,172 | | | 2,856 | |
| Property and equipment, net of accumulated depreciation of $24,096 and $23,096 as of September 30, 2022 and December 31, 2021, respectively | | Property and equipment, net of accumulated depreciation of $24,096 and $23,096 as of September 30, 2022 and December 31, 2021, respectively | 9,212 | | | 7,682 | |
| Goodwill | 23,486 |
|
| 21,632 |
| Goodwill | 28,209 | | | 30,042 | |
| Intangible assets, net | 2,658 |
|
| 2,660 |
| Intangible assets, net | 2,292 | | | 3,079 | |
| Deferred contract costs, net of current portion | | Deferred contract costs, net of current portion | 18,648 | | | 17,951 | |
| Long-term deferred tax assets, net | 5,580 |
| | 5,244 |
| Long-term deferred tax assets, net | 28,368 | | | 32,616 | |
| Other assets | 813 |
|
| 533 |
| Other assets | 618 | | | 796 | |
| Total assets | $ | 132,037 |
|
| $ | 139,158 |
| Total assets | $ | 221,132 | | | $ | 239,972 | |
| Liabilities and stockholders’ equity |
|
|
| |
| Liabilities and stockholders' equity | | Liabilities and stockholders' equity | | | |
| Current liabilities: |
|
|
| Current liabilities: | |
| Accounts payable | $ | 3,533 |
|
| $ | 4,709 |
| Accounts payable | $ | 1,057 | | | $ | 1,457 | |
| Accrued expenses | 10,656 |
|
| 11,067 |
| Accrued expenses | 14,631 | | | 12,644 | |
| Deferred revenue | 26,316 |
|
| 23,474 |
| Deferred revenue | 28,727 | | | 29,942 | |
| Other current liabilities | 4,807 |
|
| 4,450 |
| Other current liabilities | 1,633 | | | 4,831 | |
| Total current liabilities | 45,312 |
|
| 43,700 |
| Total current liabilities | 46,048 | | | 48,874 | |
| Long-term capital leases, net of current portion | 898 |
|
| 1,262 |
| |
| Lease incentive obligation | 3,547 |
| | 4,206 |
| |
| Long-term operating leases, net of current portion | | Long-term operating leases, net of current portion | 4,787 | | | 1,182 | |
| Other long-term liabilities | 3,484 |
|
| 2,993 |
| Other long-term liabilities | 1,069 | | | 1,718 | |
| Total liabilities | 53,241 |
|
| 52,161 |
| Total liabilities | 51,904 | | | 51,774 | |
| Commitments and contingencies |
|
|
|
|
| Commitments and contingencies | |
| Stockholders’ equity: |
|
|
| |
| Preferred stock, $0.001 par value, 5,000,000 shares authorized, no shares issued and outstanding as of September 30, 2017 and December 31, 2016 | — |
| | — |
| |
| Common stock, $0.001 par value, 100,000,000 shares authorized, 26,481,401 and 25,955,759 shares issued and outstanding as of September 30, 2017 and December 31, 2016, respectively | 26 |
|
| 26 |
| |
| Stockholders' equity: | | Stockholders' equity: | |
| Preferred stock, $0.001 par value, 5,000,000 shares authorized, no shares issued and outstanding as of September 30, 2022 and December 31, 2021 | | Preferred stock, $0.001 par value, 5,000,000 shares authorized, no shares issued and outstanding as of September 30, 2022 and December 31, 2021 | — | | | — | |
| Common stock, $0.001 par value, 100,000,000 shares authorized, 28,915,564 and 30,188,595 shares issued and outstanding as of September 30, 2022 and December 31, 2021, respectively | | Common stock, $0.001 par value, 100,000,000 shares authorized, 28,915,564 and 30,188,595 shares issued and outstanding as of September 30, 2022 and December 31, 2021, respectively | 29 | | | 30 | |
| Additional paid-in capital | 259,334 |
|
| 252,158 |
| Additional paid-in capital | 282,716 | | | 300,875 | |
| Accumulated other comprehensive loss | (893 | ) |
| (1,612 | ) | Accumulated other comprehensive loss | (6,609) | | | (2,237) | |
| Accumulated deficit | (179,671 | ) |
| (163,575 | ) | Accumulated deficit | (106,908) | | | (110,470) | |
| Total stockholders’ equity | 78,796 |
|
| 86,997 |
| |
| Total liabilities and stockholders’ equity | $ | 132,037 |
|
| $ | 139,158 |
| |
| Total stockholders' equity | | Total stockholders' equity | 169,228 | | | 188,198 | |
| Total liabilities and stockholders' equity | | Total liabilities and stockholders' equity | $ | 221,132 | | | $ | 239,972 | |
The accompanying notes are an integral part of the unaudited condensed consolidated financial statements.
CHANNELADVISOR CORPORATION AND SUBSIDIARIES
UNAUDITED CONDENSED CONSOLIDATED STATEMENTS OF OPERATIONS
(in thousands, except share and per share data)
| | | | | | | | | | | | | | | | | | | | | | | |
| | Three Months Ended September 30, | | Nine Months Ended September 30, |
| | 2022 | | 2021 | | 2022 | | 2021 |
| Revenue | $ | 43,490 | | | $ | 41,575 | | | $ | 128,589 | | | $ | 122,284 | |
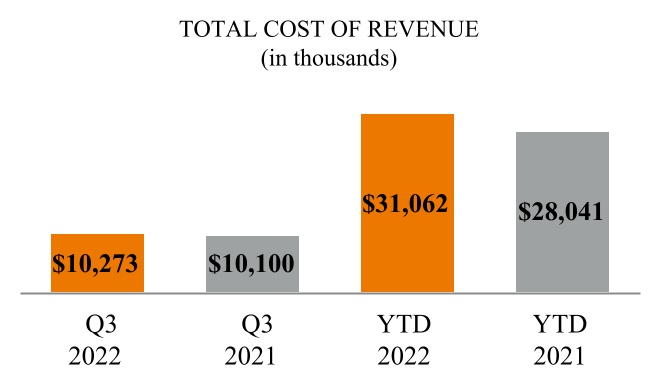
| Cost of revenue | 10,273 | | | 10,100 | | | 31,062 | | | 28,041 | |
| Gross profit | 33,217 | | | 31,475 | | | 97,527 | | | 94,243 | |
| Operating expenses: | | | | | | | |
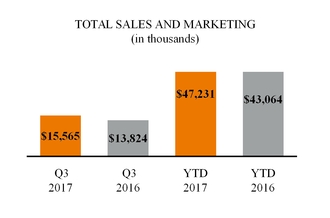
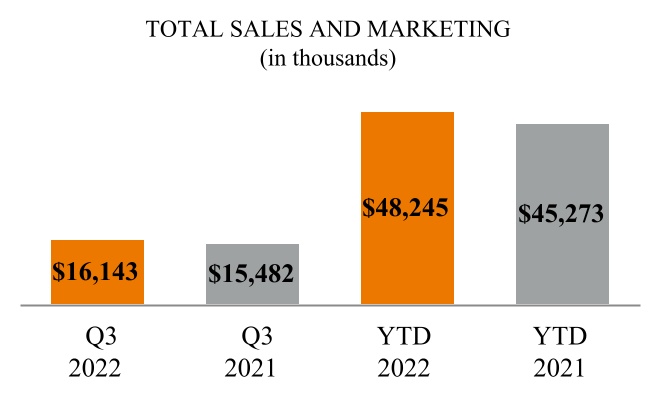
| Sales and marketing | 16,143 | | | 15,482 | | | 48,245 | | | 45,273 | |
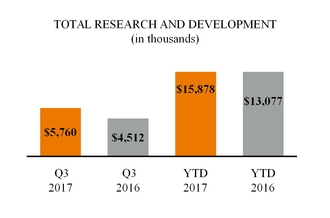
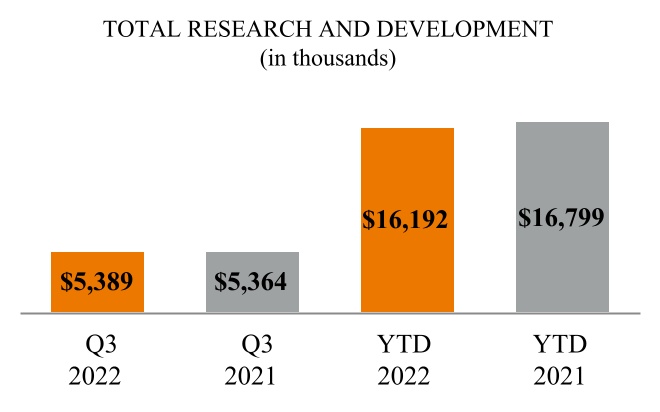
| Research and development | 5,389 | | | 5,364 | | | 16,192 | | | 16,799 | |
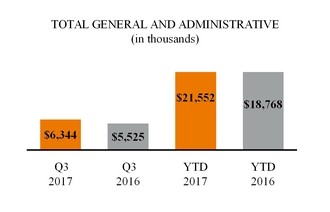
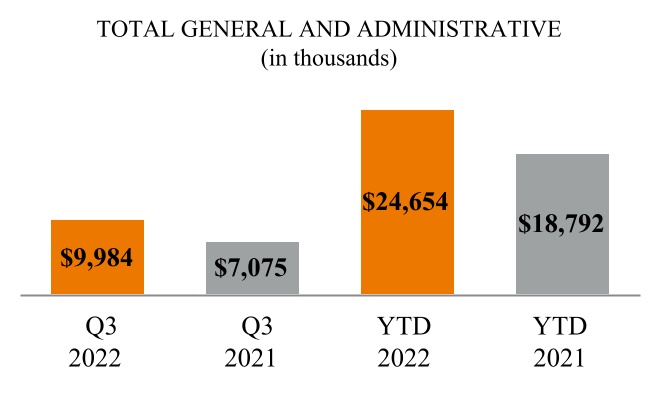
| General and administrative | 9,984 | | | 7,075 | | | 24,654 | | | 18,792 | |
| Total operating expenses | 31,516 | | | 27,921 | | | 89,091 | | | 80,864 | |
| Income from operations | 1,701 | | | 3,554 | | | 8,436 | | | 13,379 | |
| Other income (expense): | | | | | | | |
| Interest income (expense) | 234 | | | (30) | | | 251 | | | (96) | |
| Other income (expense) | 5 | | | (29) | | | 5 | | | (164) | |
| Total other income (expense) | 239 | | | (59) | | | 256 | | | (260) | |
| Income before income taxes | 1,940 | | | 3,495 | | | 8,692 | | | 13,119 | |
| Income tax expense (benefit) | 2,039 | | | (34) | | | 5,130 | | | (427) | |
| Net (loss) income | $ | (99) | | | $ | 3,529 | | | $ | 3,562 | | | $ | 13,546 | |
| Net (loss) income per share: | | | | | | | |
| Basic | $ | — | | | $ | 0.12 | | | $ | 0.12 | | | $ | 0.46 | |
| Diluted | $ | — | | | $ | 0.11 | | | $ | 0.12 | | | $ | 0.43 | |
| Weighted average common shares outstanding: | | | | | | | |
| Basic | 28,815,362 | | | 29,931,173 | | | 29,674,219 | | | 29,665,439 | |
| Diluted | 29,955,554 | | | 31,474,314 | | | 30,793,498 | | | 31,295,737 | |
|
| | | | | | | | | | | | | | | |
| | Three Months Ended September 30, | | Nine Months Ended September 30, |
| | 2017 | | 2016 | | 2017 | | 2016 |
| Revenue | $ | 30,097 |
| | $ | 27,992 |
| | $ | 88,430 |
| | $ | 81,437 |
|
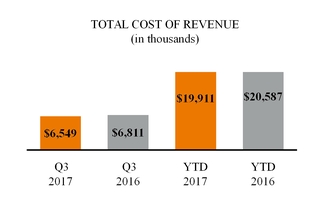
| Cost of revenue | 6,549 |
| | 6,811 |
| | 19,911 |
| | 20,587 |
|
| Gross profit | 23,548 |
| | 21,181 |
| | 68,519 |
| | 60,850 |
|
| Operating expenses: |
| | | | | | |
| Sales and marketing | 15,565 |
| | 13,824 |
| | 47,231 |
| | 43,064 |
|
| Research and development | 5,760 |
| | 4,512 |
| | 15,878 |
| | 13,077 |
|
| General and administrative | 6,344 |
| | 5,525 |
| | 21,552 |
| | 18,768 |
|
| Total operating expenses | 27,669 |
| | 23,861 |
| | 84,661 |
| | 74,909 |
|
| Loss from operations | (4,121 | ) | | (2,680 | ) | | (16,142 | ) | | (14,059 | ) |
| Other income (expense): | | | | | | | |
| Interest income (expense), net | 67 |
| | 11 |
| | 149 |
| | (11 | ) |
| Other income (expense), net | 36 |
| | 90 |
| | 106 |
| | 137 |
|
| Total other income (expense) | 103 |
| | 101 |
| | 255 |
| | 126 |
|
| Loss before income taxes | (4,018 | ) | | (2,579 | ) | | (15,887 | ) | | (13,933 | ) |
| Income tax expense (benefit) | 37 |
| | (27 | ) | | 209 |
| | (91 | ) |
| Net loss | $ | (4,055 | ) | | $ | (2,552 | ) | | $ | (16,096 | ) | | $ | (13,842 | ) |
| Net loss per share: | | | | | | | |
| Basic and diluted | $ | (0.15 | ) | | $ | (0.10 | ) | | $ | (0.61 | ) | | $ | (0.54 | ) |
| Weighted average common shares outstanding: | | | | | | | |
| Basic and diluted | 26,439,830 |
| | 25,723,749 |
| | 26,293,650 |
| | 25,513,105 |
|
The accompanying notes are an integral part of the unaudited condensed consolidated financial statements.
CHANNELADVISOR CORPORATION AND SUBSIDIARIES
UNAUDITED CONDENSED CONSOLIDATED STATEMENTS OF COMPREHENSIVE LOSS(LOSS) INCOME
(in thousands)
|
| | | | | | | | | | | | | | | |
| | Three Months Ended September 30, | | Nine Months Ended September 30, |
| | 2017 | | 2016 | | 2017 | | 2016 |
| Net loss | $ | (4,055 | ) |
| $ | (2,552 | ) |
| $ | (16,096 | ) |
| $ | (13,842 | ) |
| Other comprehensive gain (loss): | | | | | | | |
| Foreign currency translation adjustments | 184 |
| | (78 | ) | | 719 |
| | (180 | ) |
| Total comprehensive loss | $ | (3,871 | ) | | $ | (2,630 | ) | | $ | (15,377 | ) | | $ | (14,022 | ) |
| | | | | | | | | | | | | | | | | | | | | | | |
| | Three Months Ended September 30, | | Nine Months Ended September 30, |
| | 2022 | | 2021 | | 2022 | | 2021 |
| Net (loss) income | $ | (99) | | | $ | 3,529 | | | $ | 3,562 | | | $ | 13,546 | |
| Other comprehensive (loss) income: | | | | | | | |
| Foreign currency translation adjustments | (1,961) | | | (1,157) | | | (4,372) | | | (1,219) | |
| Total comprehensive (loss) income | $ | (2,060) | | | $ | 2,372 | | | $ | (810) | | | $ | 12,327 | |
The accompanying notes are an integral part of the unaudited condensed consolidated financial statements.
CHANNELADVISOR CORPORATION AND SUBSIDIARIES
UNAUDITED CONDENSED CONSOLIDATED STATEMENTS OF CASH FLOWS
(in thousands)
| | | | Nine Months Ended September 30, | | Nine Months Ended September 30, |
| | 2017 | | 2016 | | 2022 | | 2021 |
| Cash flows from operating activities | | | | Cash flows from operating activities | | | |
| Net loss | $ | (16,096 | ) | | $ | (13,842 | ) | |
| Adjustments to reconcile net loss to cash and cash equivalents (used in) provided by operating activities: | | | | |
| Net income | | Net income | $ | 3,562 | | | $ | 13,546 | |
| Adjustments to reconcile net income to cash and cash equivalents provided by operating activities: | | Adjustments to reconcile net income to cash and cash equivalents provided by operating activities: | |
| Depreciation and amortization | 5,041 |
| | 5,961 |
| Depreciation and amortization | 4,461 | | | 5,064 | |
| Bad debt expense | 271 |
| | 246 |
| |
| Bad debt expense (recovery) | | Bad debt expense (recovery) | 260 | | | (99) | |
| Stock-based compensation expense | 9,132 |
| | 10,207 |
| Stock-based compensation expense | 9,985 | | | 9,739 | |
| Deferred income taxes | | Deferred income taxes | 3,726 | | | (875) | |
| Other items, net | (499 | ) | | (769 | ) | Other items, net | (1,229) | | | (1,982) | |
| Changes in assets and liabilities, net of effects from acquisition: | | | | |
| Changes in assets and liabilities: | | Changes in assets and liabilities: | |
| Accounts receivable | (1,674 | ) | | 2,820 |
| Accounts receivable | 1,510 | | | (583) | |
| Prepaid expenses and other assets | (1,370 | ) | | 1,832 |
| Prepaid expenses and other assets | 842 | | | 79 | |
| Deferred contract costs | | Deferred contract costs | (2,345) | | | (4,884) | |
| Accounts payable and accrued expenses | (51 | ) | | (1,251 | ) | Accounts payable and accrued expenses | 1,152 | | | 86 | |
| Deferred revenue | 3,042 |
| | 4,162 |
| Deferred revenue | 47 | | | 6,388 | |
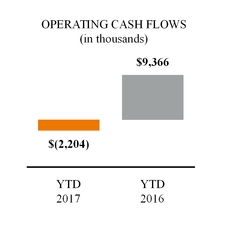
| Cash and cash equivalents (used in) provided by operating activities | (2,204 | ) | | 9,366 |
| |
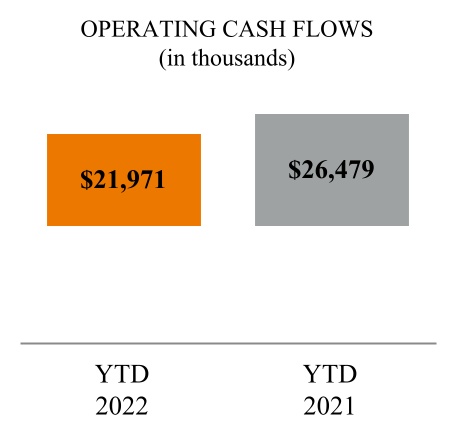
| Cash and cash equivalents provided by operating activities | | Cash and cash equivalents provided by operating activities | 21,971 | | | 26,479 | |
| Cash flows from investing activities | | | | Cash flows from investing activities | |
| Purchases of property and equipment | (2,427 | ) | | (920 | ) | Purchases of property and equipment | (2,871) | | | (1,125) | |
| Payment of internal-use software development costs | (224 | ) | | (195 | ) | |
| Acquisition, net of cash acquired | (2,177 | ) | | — |
| |
| Payment of software development costs | | Payment of software development costs | (2,890) | | | (2,577) | |
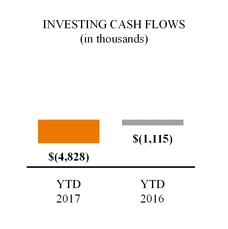
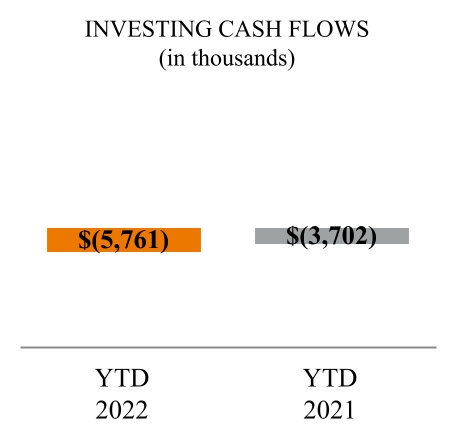
| Cash and cash equivalents used in investing activities | (4,828 | ) | | (1,115 | ) | Cash and cash equivalents used in investing activities | (5,761) | | | (3,702) | |
| Cash flows from financing activities | | | | Cash flows from financing activities | |
| Repayment of capital leases | (2,586 | ) | | (2,079 | ) | |
| Repayment of finance leases | | Repayment of finance leases | (8) | | | (12) | |
| Proceeds from exercise of stock options | 625 |
| | 821 |
| Proceeds from exercise of stock options | 700 | | | 4,237 | |
| Payment of contingent consideration | — |
| | (338 | ) | |
| Repurchase and retirement of common stock | | Repurchase and retirement of common stock | (25,000) | | | — | |
| Payment of statutory tax withholding related to net-share settlement of restricted stock units | (2,581 | ) | | (2,085 | ) | Payment of statutory tax withholding related to net-share settlement of restricted stock units | (3,392) | | | (1,363) | |
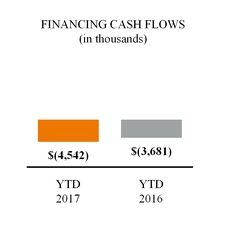
| Cash and cash equivalents used in financing activities | (4,542 | ) | | (3,681 | ) | |
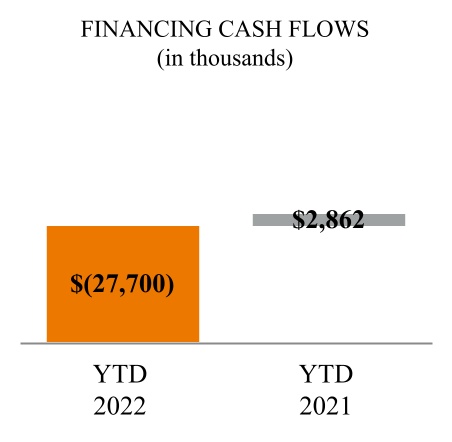
| Cash and cash equivalents (used in) provided by financing activities | | Cash and cash equivalents (used in) provided by financing activities | (27,700) | | | 2,862 | |
| Effect of currency exchange rate changes on cash and cash equivalents | 332 |
| | (313 | ) | Effect of currency exchange rate changes on cash and cash equivalents | (962) | | | (165) | |
| Net (decrease) increase in cash and cash equivalents | (11,242 | ) | | 4,257 |
| Net (decrease) increase in cash and cash equivalents | (12,452) | | | 25,474 | |
| Cash and cash equivalents, beginning of period | 65,420 |
| | 60,474 |
| Cash and cash equivalents, beginning of period | 100,567 | | | 71,545 | |
| Cash and cash equivalents, end of period | $ | 54,178 |
| | $ | 64,731 |
| Cash and cash equivalents, end of period | $ | 88,115 | | | $ | 97,019 | |
| Supplemental disclosure of cash flow information | | | | Supplemental disclosure of cash flow information | | | |
| Cash paid for interest | $ | 99 |
| | $ | 126 |
| Cash paid for interest | $ | 96 | | | $ | 69 | |
| Cash paid for income taxes, net | $ | 151 |
| | $ | 110 |
| Cash paid for income taxes, net | $ | 898 | | | $ | 456 | |
| Supplemental disclosure of noncash investing and financing activities | | | | Supplemental disclosure of noncash investing and financing activities | | | |
| Accrued statutory tax withholding related to net-share settlement of restricted stock units | | Accrued statutory tax withholding related to net-share settlement of restricted stock units | $ | 453 | | | $ | 4,204 | |
| Accrued capital expenditures | $ | 54 |
| | $ | 439 |
| Accrued capital expenditures | $ | 30 | | | $ | 45 | |
| Capital lease obligations entered into for the purchase of fixed assets | $ | 567 |
| | $ | 1,771 |
| |
The accompanying notes are an integral part of the unaudited condensed consolidated financial statements.
CHANNELADVISOR CORPORATION AND SUBSIDIARIES
NOTES TO UNAUDITED CONDENSED CONSOLIDATED FINANCIAL STATEMENTS 1. DESCRIPTION OF THE BUSINESS
ChannelAdvisor Corporation ("ChannelAdvisor" or the "Company") was incorporated in the state of Delaware and capitalized in June 2001. The Company began operations in July 2001. ChannelAdvisor is a leading provider of software-as-a-service, or SaaS,cloud-based e-commerce solutions and ourwhose mission is to connect and optimize the world's commerce. ChannelAdvisor'sFor over two decades, ChannelAdvisor has helped brands and retailers worldwide to streamline their e-commerce cloud platform helps retailersoperations, expand to new channels and branded manufacturers worldwide improvegrow sales. Thousands of customers depend on ChannelAdvisor to securely power their online performance by expanding salese-commerce operations on hundreds of channels, connecting with consumers around the world, optimizing their operations for peak performanceincluding Amazon, eBay, Facebook, Google, Shopify, Walmart and providing actionable analytics to improve competitiveness.Zalando. The Company is headquartered in Morrisville, North Carolina and has internationalmaintains sales, service, support and research and development offices in England, Ireland, Germany, Australia, Brazil, Chinavarious domestic and Spain.international locations.
Merger Agreement and Proposed Acquisition by CommerceHub On September 4, 2022, the Company entered into an Agreement and Plan of Merger (the "Merger Agreement") with CommerceHub, Inc., a Delaware corporation ("CommerceHub"), and CH Merger Sub, Inc., a Delaware corporation and a wholly owned subsidiary of CommerceHub (the "Merger Sub"), providing for the merger of Merger Sub with and into the Company (the "Merger"), with the Company surviving the Merger as a wholly owned subsidiary of CommerceHub.
Under the terms of the Merger Agreement, CommerceHub will acquire all outstanding shares of the Company's common stock in exchange for consideration of $23.10 per share in cash. The Merger Agreement contains representations and warranties customary for transactions of this type. The closing of the Merger is subject to approval of the Company's stockholders and the satisfaction or waiver of a number of customary closing conditions. The Merger Agreement provides CommerceHub and the Company with certain termination rights and, under certain circumstances, may require that CommerceHub or the Company pay a termination fee. During the three and nine months ended September 30, 2022, the Company incurred $3.2 million in costs associated with the negotiation and execution of the Merger Agreement, which are included in general and administrative expense in the accompanying condensed consolidated statements of operations.
2. SIGNIFICANT ACCOUNTING POLICIES
Principles of Consolidation
The accompanying condensed consolidated financial statements include the accounts of the Company and its wholly-ownedwholly owned subsidiaries. All intercompany accounts and transactions have been eliminated in consolidation.
Interim Condensed Consolidated Financial Information
The accompanying condensed consolidated financial statements and footnotes have been prepared in accordance with generally accepted accounting principles in the United States of America, ("U.S. GAAP")or GAAP, as contained in the Financial Accounting Standards Board, ("FASB")or FASB, Accounting Standards Codification, ("ASC")or ASC, for interim financial information. In the opinion of management, the interim financial information includes all adjustments of a normal recurring nature necessary for a fair presentation of financial position, the results of operations, comprehensive loss(loss) income and cash flows. The results of operations for the three and nine months ended September 30, 20172022 are not necessarily indicative of the results for the full year or the results for any future periods.periods, especially in light of the ongoing impacts, and potential future effects of, the COVID-19 pandemic and other macroeconomic and geopolitical factors on the Company’s business, operations and financial performance. These unaudited interim financial statements should be read in conjunction with the audited financial statements and related footnotes for the year ended December 31, 2016 ("2021, or fiscal 2016"),2021, which are included in the Company’sCompany's Annual Report on Form 10-K for fiscal 2016.2021. There have been no material changes to the Company’sCompany's significant accounting policies from those described in the footnotes to the audited financial statements contained in the Company’sCompany's Annual Report on Form 10-K for fiscal 2016.2021.
Recent Accounting Pronouncements
|
| | |
Standard | Description | Effect on the Financial Statements or Other Significant Matters |
Standards that the Company has not yet adopted |
Revenue Recognition: |
The Company has reviewed new accounting pronouncements that were issued during the nine months ended September 30, 2022 and does not believe that these pronouncements are applicable to the Company, or that they will have a material impact on its financial position or results of operations.
|
| | |
Accounting Standards Update ("ASU") 2014-09, Revenue from Contracts with Customers (Topic 606)
The Company's adoption date:
January 1, 2018
| The standard will replace existing revenue recognition standards and provides that an entity should recognize revenue to depict the transfer of promised goods or services to customers in an amount that reflects the consideration to which the entity expects to be entitled in exchange for those goods or services. ASU 2014-09 also requires improved disclosures to help users of financial statements better understand the nature, amount, timing, and uncertainty of revenue that is recognized. Entities have the option of using either a full retrospective or modified retrospective approach for the adoption of the standard. | The Company formed a project team to evaluate and direct the implementation of the new revenue recognition standard and related amendments. The project team developed an implementation plan centered around specific functional areas that may be impacted by the standard and its amendments, including accounting and reporting, information technology ("IT"), internal audit and contracts and legal, among others. This team has recently completed certain IT updates to the Company's accounting system to support recognition and disclosure under the new standard, and is continuing to make additional updates to facilitate the standard's adoption and reporting requirements. The project team completed an initial contract assessment on a sample of contracts and analyzed the Company's contract portfolio and associated contract costs. The team is finalizing the Company's remaining accounting positions under ASU 2014-09, as amended, including certain significant judgments and estimates required, and is currently assessing the potential changes to internal controls and the tax effect implications. The project team has reported the findings and progress of the implementation plan to management and to the Audit Committee on a frequent basis over the last two years and will continue to do so as the effective date of the new standard approaches.
The Company anticipates that the adoption of the new standard will impact the timing of revenue recognition of fixed fees for its contracts, as well as the accounting for costs to obtain contracts. For managed-service contracts, the Company currently defers revenue until the completion of the implementation services, at which point the Company recognizes a cumulative catch-up adjustment equal to the revenue earned during the implementation period but previously deferred. The remaining balance of these fixed fees is recognized ratably over the remaining term of the contract. Under the new standard, the Company expects revenue recognition for the managed-service subscription and implementation fees to begin on the launch date and to be recognized over time through the contract end date, with no cumulative catch-up adjustment on the launch date. Further, the Company currently expenses sales commissions and related bonuses as incurred. Under the new standard, the Company will be required to defer and amortize a portion of these contract costs.
The Company intends to adopt the new standard using the modified retrospective transition method effective January 1, 2018. The Company continues to evaluate the provisions of the new standard to identify further potential impacts to its consolidated financial statements.
|
ASU 2016-08, Principal Versus Agent Considerations (Reporting Revenue Gross Versus Net)
The Company's adoption date:
January 1, 2018
| The standard clarifies implementation guidance on principal versus agent considerations in ASU 2014-09. |
ASU 2016-10, Identifying Performance Obligations and Licensing
The Company's adoption date:
January 1, 2018
| The standard clarifies implementation guidance on the identification of performance obligations and the licensing implementation guidance in ASU 2014-09. |
ASU 2016-12, Narrow-Scope Improvements and Practical Expedients
The Company's adoption date:
January 1, 2018
| The standard clarifies the guidance on assessing collectability, presentation of sales taxes, noncash consideration and completed contracts and contract modifications at transition. |
ASU 2016-20, Technical Corrections and Improvements to Topic 606
The Company's adoption date:
January 1, 2018
| The standard clarifies certain narrow aspects of ASU 2014-09. |
Leases: |
ASU 2016-02, Leases (Topic 842)
The Company's adoption date:
January 1, 2019
| The standard requires that lessees recognize assets and liabilities for leases with lease terms greater than twelve months in the statement of financial position. The standard also requires improved disclosures to help users of financial statements better understand the amount, timing and uncertainty of cash flows arising from leases. | The Company is currently evaluating the impact the adoption of the standard will have on its consolidated financial statements.
|
|
| | |
Financial Instruments: |
ASU 2016-13, Financial Instruments - Credit Losses (Topic 326)
The Company's adoption date:
January 1, 2020
| The standard replaces the incurred loss impairment methodology in current U.S. GAAP (defined below) with a methodology that reflects expected credit losses. The update is intended to provide financial statement users with more useful information about expected credit losses. | The Company is currently evaluating the impact the adoption of the standard will have on its consolidated financial statements. |
Cash Flow: |
ASU 2016-18, Restricted Cash
The Company's adoption date:
January 1, 2018
| The standard requires that entities show the changes in the total of cash, cash equivalents and restricted cash in the statement of cash flows. Transfers between cash, cash equivalents and restricted cash should not be presented as cash flow activities on the statement of cash flows. | The Company is currently evaluating the impact the adoption of the standard will have on its consolidated financial statements. |
Standards that the Company has recently adopted |
Stock-Based Compensation: |
ASU 2016-09, Improvements to Employee Share-Based Payment Accounting (Topic 718)
The Company's adoption date:
January 1, 2017
| The standard is intended to simplify several aspects of the accounting for share-based payment transactions, including the accounting for income taxes, forfeitures, and statutory tax withholding requirements, as well as classification in the statement of cash flows. | The Company adopted this standard effective January 1, 2017. As a result of this adoption, the Company recognized $8.2 million of deferred tax assets attributable to accumulated excess tax benefits that under the previous guidance could not be recognized until the benefits were realized through a reduction in income taxes payable. This adjustment was applied using a modified retrospective method with a cumulative-effect adjustment to the accumulated deficit for the excess tax benefits not previously recognized. However, given the full valuation allowance of $8.2 million placed on the additional deferred tax assets, the recognition upon adoption had no impact on the Company's accumulated deficit as of January 1, 2017. Further, the Company has elected to continue to estimate forfeitures to determine the amount of compensation cost to be recognized in each period. |
Use of Estimates
The preparation of financial statements in conformity with U.S. GAAP requires management to make estimates and assumptions that affect the amounts reported in the condensed consolidated financial statements and accompanying notes. Actual results could differ from those estimates.
On an ongoing basis, the Company evaluates its estimates, including those related to the accounts receivable allowance, the useful lives of long-lived assets and other intangible assets, income taxes, and assumptions used for purposes of determining stock-based compensation, leases, including estimating lease terms and extensions, and revenue recognition, including standalone selling prices for contracts with multiple performance obligations and the expected period of benefit for deferred contract costs, among others. Estimates and assumptions are also required to value assets acquired and liabilities assumed as well as contingent consideration, where applicable, in conjunction with business combinations. The Company bases its estimates on historical experience and on various other assumptions that it believes to be reasonable, the results of which form the basis for making judgments about the carrying value of assets and liabilities.
3. STOCKHOLDERS' EQUITY
The following table summarizes thetables summarize quarterly stockholders' equity activity for the three and nine months ended September 30, 2022 and 2021 (in thousands, except number of shares):
| | | | | | | | | | | | | | | | | | | | | | | | | | | | | | | | | | | |
| Quarterly Activity For The Nine Months Ended September 30, 2022 |
| Common Stock | | Additional
Paid-In
Capital | | Accumulated
Other
Comprehensive
Loss | | Accumulated
Deficit | | Total
Stockholders'
Equity |
| Shares | | Amount | | |
| Balance, December 31, 2021 | 30,188,595 | | | $ | 30 | | | $ | 300,875 | | | $ | (2,237) | | | $ | (110,470) | | | $ | 188,198 | |
| Exercise of stock options and vesting of restricted stock units | 388,551 | | | — | | | 362 | | | — | | | — | | | 362 | |
| Stock-based compensation expense | — | | | — | | | 3,132 | | | — | | | — | | | 3,132 | |
| Statutory tax withholding related to net-share settlement of restricted stock units | (101,316) | | | — | | | (1,818) | | | — | | | — | | | (1,818) | |
| Net income | — | | | — | | | — | | | — | | | 1,824 | | | 1,824 | |
| Foreign currency translation adjustments | — | | | — | | | — | | | (416) | | | — | | | (416) | |
| Balance, March 31, 2022 | 30,475,830 | | | 30 | | | 302,551 | | | (2,653) | | | (108,646) | | | 191,282 | |
| Exercise of stock options and vesting of restricted stock units | 123,990 | | | — | | | 13 | | | — | | | — | | | 13 | |
| Stock-based compensation expense | — | | | — | | | 3,474 | | | — | | | — | | | 3,474 | |
| Statutory tax withholding related to net-share settlement of restricted stock units | (44,201) | | | — | | | (620) | | | — | | | — | | | (620) | |
| Repurchase and retirement of common stock | (1,828,604) | | | (1) | | | (24,999) | | | — | | | — | | | (25,000) | |
| Net income | — | | | — | | | — | | | — | | | 1,837 | | | 1,837 | |
| Foreign currency translation adjustments | — | | | — | | | — | | | (1,995) | | | — | | | (1,995) | |
| Balance, June 30, 2022 | 28,727,015 | | | 29 | | | 280,419 | | | (4,648) | | | (106,809) | | | 168,991 | |
| Exercise of stock options and vesting of restricted stock units | 272,620 | | | — | | | 325 | | | — | | | — | | | 325 | |
| Stock-based compensation expense | — | | | — | | | 3,379 | | | — | | | — | | | 3,379 | |
| Statutory tax withholding related to net-share settlement of restricted stock units | (84,071) | | | — | | | (1,407) | | | — | | | — | | | (1,407) | |
| Net loss | — | | | ��� | | | — | | | — | | | (99) | | | (99) | |
| Foreign currency translation adjustments | — | | | — | | | — | | | (1,961) | | | — | | | (1,961) | |
| Balance, September 30, 2022 | 28,915,564 | | | $ | 29 | | | $ | 282,716 | | | $ | (6,609) | | | $ | (106,908) | | | $ | 169,228 | |
| | | | | | | | | | | | | | | | | | | | | | | | | | | | | | | | | | | |
| Quarterly Activity For The Nine Months Ended September 30, 2021 |
| Common Stock | | Additional
Paid-In
Capital | | Accumulated
Other
Comprehensive
Loss | | Accumulated
Deficit | | Total
Stockholders'
Equity |
| Shares | | Amount | | |
| Balance, December 31, 2020 | 29,020,424 | | | $ | 29 | | | $ | 288,842 | | | $ | (1,095) | | | $ | (157,685) | | | $ | 130,091 | |
| Exercise of stock options and vesting of restricted stock units | 802,270 | | | 1 | | | 3,586 | | | — | | | — | | | 3,587 | |
| Stock-based compensation expense | — | | | — | | | 3,048 | | | — | | | — | | | 3,048 | |
| Statutory tax withholding related to net-share settlement of restricted stock units | (89,842) | | | — | | | (2,061) | | | — | | | — | | | (2,061) | |
| Net income | — | | | — | | | — | | | — | | | 5,457 | | | 5,457 | |
| Foreign currency translation adjustments | — | | | — | | | — | | | (150) | | | — | | | (150) | |
| Balance, March 31, 2021 | 29,732,852 | | | 30 | | | 293,415 | | | (1,245) | | | (152,228) | | | 139,972 | |
| Exercise of stock options and vesting of restricted stock units | 146,164 | | | — | | | 136 | | | — | | | — | | | 136 | |
| Stock-based compensation expense | — | | | — | | | 3,576 | | | — | | | — | | | 3,576 | |
| Statutory tax withholding related to net-share settlement of restricted stock units | (48,409) | | | — | | | (1,177) | | | — | | | — | | | (1,177) | |
| Net income | — | | | — | | | — | | | — | | | 4,560 | | | 4,560 | |
| Foreign currency translation adjustments | — | | | — | | | — | | | 88 | | | — | | | 88 | |
| Balance, June 30, 2021 | 29,830,607 | | | 30 | | | 295,950 | | | (1,157) | | | (147,668) | | | 147,155 | |
| Exercise of stock options and vesting of restricted stock units | 314,529 | | | — | | | 515 | | | — | | | — | | | 515 | |
| Stock-based compensation expense | — | | | — | | | 3,115 | | | — | | | — | | | 3,115 | |
| Statutory tax withholding related to net-share settlement of restricted stock units | (96,188) | | | — | | | (2,329) | | | — | | | — | | | (2,329) | |
| Net income | — | | | — | | | — | | | — | | | 3,529 | | | 3,529 | |
| Foreign currency translation adjustments | — | | | — | | | — | | | (1,157) | | | — | | | (1,157) | |
| Balance, September 30, 2021 | 30,048,948 | | | $ | 30 | | | $ | 297,251 | | | $ | (2,314) | | | $ | (144,139) | | | $ | 150,828 | |
Share Repurchase Program
In August 2021, the Company's Board of Directors approved a share repurchase program authorizing the repurchase of up to $25.0 million of the Company's common stock through August 10, 2022. During the nine months ended September 30,
2017 (in thousands):2022, 1,828,604 shares were repurchased and retired under the repurchase program at an average price of $13.67 per share for an aggregate total price of $25.0 million, which completed the share repurchase program authorized in August 2021. |
| | | |
| Balance as of December 31, 2016 | $ | 86,997 |
|
| Exercise of stock options and vesting of restricted stock units | 625 |
|
| Stock-based compensation expense | 9,132 |
|
| Statutory tax withholding related to net-share settlement of restricted stock units | (2,581 | ) |
| Net loss | (16,096 | ) |
| Foreign currency translation adjustments | 719 |
|
| Balance as of September 30, 2017 | $ | 78,796 |
|
4. BUSINESS COMBINATIONS, GOODWILL AND INTANGIBLE ASSETS
Business Combinations
On May 26, 2017, the Company entered into an Agreement and Plan of Merger (the “Merger Agreement”) pursuant to which the Company acquired all of the issued and outstanding shares of HubLogix Commerce Corp. ("HubLogix") (now ChannelAdvisor Fulfillment, Inc.), a fulfillment and logistics platform that automates order management by connecting online storefronts and marketplaces to distribution and fulfillment centers. The Company acquired HubLogix to further enhance its fulfillment network offering and capabilities.
Under the Merger Agreement, the Company paid an aggregate purchase price of $2.3 million for HubLogix, all of which was paid in cash, which amount is subject to adjustment as set forth in the Merger Agreement. The purchase price includes $0.4 million that has been placed into escrow to secure the indemnification obligations of HubLogix stockholders until November 26, 2018.
The acquisition has been accounted for under the acquisition method of accounting in accordance with Accounting Standards Codification Topic 805, Business Combinations ("ASC 805"). Under the acquisition method of accounting, the Company allocated the purchase price to the identifiable assets acquired and liabilities assumed based on their estimated acquisition-date fair value. The difference between the acquisition-date fair value of the consideration and the estimated fair value of the net assets acquired is recorded as goodwill. Goodwill represents the future economic benefits expected to arise from other intangible assets acquired that do not qualify for separate recognition, including acquired workforce, as well as expected future synergies.
Based on management’s provisional assessment of the acquisition-date fair value of the assets acquired and liabilities assumed, the purchase price of $2.3 million has been allocated to the Company’s assets and liabilities on a preliminary basis as follows: $1.9 million to goodwill, $0.5 million to identifiable intangible assets and $0.1 million to working capital as a net current liability. The purchase price allocation in conjunction with the acquisition of HubLogix is subject to change as additional information becomes available. Any adjustments will be made as soon as practicable, but not later than one year from the acquisition date.
The goodwill of $1.9 million arising from the acquisition of HubLogix consists largely of the acquired workforce, the expected company-specific synergies and the opportunity to expand the Company’s product offerings to customers. The goodwill recognized is not deductible for income tax purposes.
The Company incurred transaction costs in connection with the acquisition of $0.3 million, which are included in general and administrative expense in the accompanying condensed consolidated statements of operations for the nine months ended September 30, 2017.
Comparative pro forma financial information for this acquisition has not been presented because the acquisition is not material to the Company’s consolidated results of operations.
Goodwill and Intangible Assets
The following table shows the changes in the carrying amount of goodwill for the nine months ended September 30, 2017 (in thousands):
|
| | | |
| Balance as of December 31, 2016 | $ | 21,632 |
|
| Goodwill attributable to the HubLogix acquisition | 1,854 |
|
| Balance as of September 30, 2017 | $ | 23,486 |
|
There were no changes to the Company's goodwill during the year ended December 31, 2016.
The Company acquired intangible assets in connection with its business acquisitions. These assets were recorded at their estimated fair values at the acquisition date and are being amortized over their respective estimated useful lives using the straight-line method. The estimated useful lives and amortization methodology used in computing amortization are as follows:
|
| | | | | | | |
| Estimated Useful Life | Amortization Methodology |
| Customer relationships | 7 years | Straight-line |
| Acquired technology | 7 years | Straight-line |
Trade names | 3 years | Straight-line |
Amortization expense associated with the Company's intangible assets was $0.2$0.1 million and $0.1$0.3 million for the three months ended September 30, 20172022 and 2016,2021, respectively, and was $0.5$0.4 million and $0.4$0.8 million for the nine months ended September 30, 20172022 and 2016,2021, respectively.
The following table summarizes the changes in the carrying amount of goodwill during the nine months ended September 30, 2022 (in thousands): | | | | | |
| Balance, December 31, 2021 | $ | 30,042 | |
| Effects of foreign currency translation | (1,833) | |
| Balance, September 30, 2022 | $ | 28,209 | |
5. COMMITMENTSCAPITALIZED SOFTWARE DEVELOPMENT COSTS
Sales Tax
DuringCapitalized software development costs related to creating internally developed software and implementing software purchased for internal use are included in property and equipment in the first quarteraccompanying condensed consolidated balance sheets. The Company capitalized software development costs of 2017,$0.9 million for both the Company completed its analysis with regardthree months ended September 30, 2022 and 2021, and $2.8 million and $2.6 million during the nine months ended September 30, 2022 and 2021, respectively. Amortization expense related to potential unpaid sales tax obligations. Based oncapitalized internally developed software was $0.8 million and $0.7 million for the resultsthree months ended September 30, 2022 and 2021, respectively, and $2.4 million and $2.0 million for the nine months ended September 30, 2022 and 2021, respectively, and is included in cost of this analysis, the Company made the decision to enter into voluntary disclosure agreements ("VDAs") with certain jurisdictions to reduce the Company’s potential sales tax liability. VDAs generally provide for a maximum look-back period, a waiver of penalties and, at times, interest as well as payment arrangements. The Company's estimated aggregate VDA liability of $2.5 million was recorded as a one-time charge inrevenue or general and administrative expense in the accompanying condensed consolidated statements of operations, depending upon the nature of the software development project. The net book value of capitalized internally developed software was $5.2 million and $4.8 million at September 30, 2022 and December 31, 2021, respectively.
6. REVENUE FROM CONTRACTS WITH CUSTOMERS
Revenue Recognition and Disaggregation of Revenue
The Company derives the majority of its revenue from subscription fees paid for access to and usage of its software solutions for a specified contract term. A customer typically pays a recurring subscription fee based on a specified minimum amount of gross merchandise value, or GMV, or advertising spend that the customer expects to process through the Company's platform. Subscription fees may also include implementation fees such as launch assistance and training fees. The remaining portion of a customer's fee is variable and is based on a specified percentage of GMV or advertising spend processed through the Company's platform in excess of the customer's specified minimum GMV or advertising spend amount. In most cases, the specified percentage of excess GMV or advertising spend on which the variable fee is based is fixed and does not vary depending on the amount of the excess. Subscription fees are billed in advance of the subscription term and are due in accordance with contract terms, which generally provide for payment within 30 days. Variable fees are subject to the same payment terms, although they are generally billed at the end of the period in which they are incurred. The Company also generates revenue from its solutions that allow brands to direct potential consumers from their websites and digital marketing campaigns to authorized resellers. The majority of the Company's contracts have a one year term. The Company's contractual arrangements include performance, termination and cancellation provisions, but do not provide for refunds. Customers do not have the contractual right to take possession of the Company's software at any time. Sales taxes collected from customers and remitted to government authorities are excluded from revenue.
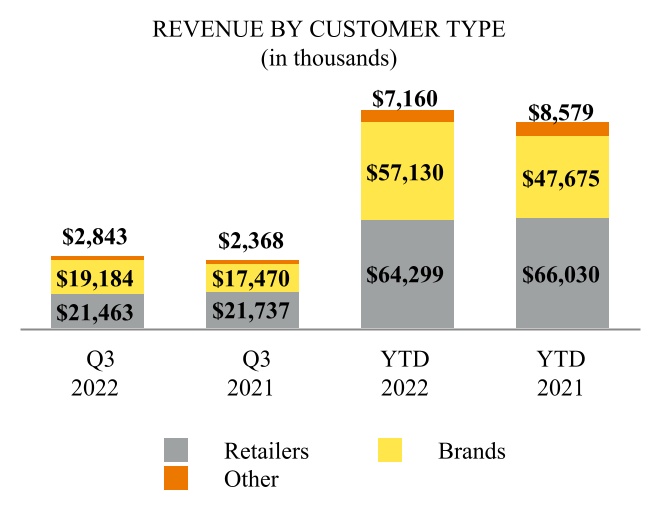
The Company's customers are categorized as follows:
Brands. The Company generally categorizes a customer as a brand if it primarily focuses on selling its own proprietary products.
Retailers. The Company generally categorizes a customer as a retailer if it primarily focuses on selling third-party products.
Other. Other is primarily comprised of strategic partnerships.
The following table summarizes revenue disaggregation by customer type for the three and nine months ended September 30, 2022 and 2021 (in thousands):
| | | | | | | | | | | | | | | | | | | | | | | | | | | | | | | | | | | | | | | | | | | | |
| | Three Months Ended September 30, | | Nine Months Ended September 30, |
| | 2022 | | Percentage of Total | | 2021 | | Percentage of Total | | 2022 | | Percentage of Total | 2021 | | Percentage of Total |
| Brands | $ | 19,184 | | | 44 | % | | $ | 17,470 | | | 42 | % | | $ | 57,130 | | | 44 | % | $ | 47,675 | | | 39 | % |
| Retailers | 21,463 | | | 49 | % | | 21,737 | | | 52 | % | | $ | 64,299 | | | 50 | % | $ | 66,030 | | | 54 | % |
| Other | 2,843 | | | 7 | % | | 2,368 | | | 6 | % | | 7,160 | | | 6 | % | 8,579 | | | 7 | % |
| $ | 43,490 | | | | | $ | 41,575 | | | | | $ | 128,589 | | | | $ | 122,284 | | | |
Contracts with Multiple Performance Obligations
Customers may elect to purchase a subscription to multiple modules, multiple modules with multiple service levels, or, for certain of the Company's solutions, multiple brands or geographies. The Company evaluates such contracts to determine whether the services to be provided are distinct and accordingly should be accounted for as separate performance obligations. If the Company determines that a contract has multiple performance obligations, the transaction price, which is the total price of the contract, is allocated to each performance obligation based on a relative standalone selling price method. The Company estimates standalone selling price based on observable prices in past transactions for which the product offering subject to the performance obligation has been sold separately. As the performance obligations are satisfied, revenue is recognized as discussed above.
Transaction Price Allocated to Future Performance Obligations
As the Company typically enters into contracts with customers for a twelve-month subscription term, a substantial majority of its performance obligations that have not yet been satisfied as of September 30, 2022 are part of a contract that has an original expected duration of one year or less. For contracts with an original expected duration of greater than one year, the aggregate transaction price allocated to the unsatisfied performance obligations was $43.1 million as of September 30, 2022, of which $23.8 million is expected to be recognized as revenue over the next twelve months.
Deferred Revenue
Deferred revenue generally represents the unearned portion of subscription fees. Deferred revenue is recorded when fees are invoiced in advance of performance. Deferred amounts are generally recognized within one year. Deferred revenue is included in the accompanying condensed consolidated balance sheets under "Total current liabilities," net of any long-term portion that is included in "Other long-term liabilities." The following table summarizes deferred revenue activity for the nine months ended September 30, 2017. This amount represents2022 (in thousands):
| | | | | | | | | | | | | | | | | | | | | | | |
| Balance, beginning of period | | Net additions | | Revenue recognized from deferred revenue | | Balance, end of period |
| Deferred revenue | $ | 30,868 | | | 106,861 | | | (108,395) | | | $ | 29,334 | |
Of the Company's estimate$128.6 million of its potential unpaidrevenue recognized in the nine months ended September 30, 2022, $28.5 million was included in deferred revenue at January 1, 2022.
Costs to Obtain Contracts
The Company capitalizes sales tax liability throughcommissions and a portion of other incentive compensation costs that are directly related to obtaining customer contracts and that would not have been incurred if the anticipated look-back periods including interest, where applicable,contract had not been obtained. These costs are included in all jurisdictionsthe accompanying condensed consolidated balance sheets and are classified as "Prepaid expenses and other current assets," net of any long-term portion that is included in "Deferred contract costs, net of current portion." As of September 30, 2022, $9.3 million was included in "Prepaid expenses and other current assets." Deferred contract costs are amortized to sales and marketing expense over the expected period of benefit, which the Company has entered into or intendsdetermined to enter into VDAs. If any ofbe five years based on the tax authorities rejectsestimated customer relationship period. The following table summarizes deferred contract cost activity for the Company's VDA applications or offers terms that are other than what the Company is anticipating, or if the VDAs do not resolve all potential unpaid sales tax obligations, then it is possible that the actual aggregate unpaid sales tax liability may be higher or lower than the Company's estimate.
Throughnine months ended September 30, 2017,2022 (in thousands):
| | | | | | | | | | | | | | | | | | | | | | | |
| Balance, beginning of period | | Additions | | Amortized costs (1) | | Balance, end of period |
| Deferred contract costs | $ | 26,959 | | | 9,979 | | | (9,051) | | | $ | 27,887 | |
(1) Includes contract costs amortized to sales and marketing expense during the Company has paid approximately $0.9 million under terms ofperiod and the VDA agreements that it has completed with certain jurisdictions. During the third quarter of 2017, a jurisdiction rejected the Company's VDA application and will be conducting a sales tax audit. The Company believes the scope of the audit will be limited and similar in principle to the VDA program offered by that jurisdiction; as a result, the Company has determined not to revise its estimate of its potential unpaid sales tax liability. The completion date of the sales tax audit has not been determined. The Company expects to complete the remaining VDAs within the next six months following the date of filing this Quarterly Report on Form 10-Q.impact from foreign currency exchange rate fluctuations.
6.7. STOCK-BASED COMPENSATION
The Company recognizes stock-based compensation expense using the accelerated attribution method, net of estimated forfeitures, in which compensation cost for each vesting tranche in an award is recognized ratably from the service inception date to the vesting date for that tranche.
Stock-based compensation expense is included in the following line items in the accompanying condensed consolidated statements of operations for the three and nine months ended September 30, 20172022 and 20162021 (in thousands): | | | | Three Months Ended September 30, | | Nine Months Ended September 30, | | Three Months Ended September 30, | | Nine Months Ended September 30, |
| | 2017 | | 2016 | | 2017 | | 2016 | | 2022 | | 2021 | | 2022 | | 2021 |
| Cost of revenue | $ | 259 |
| | $ | 330 |
| | $ | 753 |
| | $ | 941 |
| Cost of revenue | $ | 252 | | | $ | 169 | | | $ | 748 | | | $ | 665 | |
| Sales and marketing | 970 |
| | 1,161 |
| | 2,960 |
| | 3,651 |
| Sales and marketing | 1,060 | | | 928 | | | 2,707 | | | 2,744 | |
| Research and development | 588 |
| | 496 |
| | 1,659 |
| | 1,485 |
| Research and development | 591 | | | 567 | | | 1,628 | | | 1,869 | |
| General and administrative | 1,023 |
| | 878 |
| | 3,760 |
| | 4,130 |
| General and administrative | 1,476 | | | 1,451 | | | 4,902 | | | 4,461 | |
| | $ | 2,840 |
| | $ | 2,865 |
| | $ | 9,132 |
| | $ | 10,207 |
| |
| Total stock-based compensation expense | | Total stock-based compensation expense | $ | 3,379 | | | $ | 3,115 | | | $ | 9,985 | | | $ | 9,739 | |
During the nine months ended September 30, 2017,2022, the Company granted the following share-based awards:
| | | | | | | | | | | |
| Number of Shares Underlying Grant | | Weighted Average Grant Date Fair Value |
| Service-based restricted stock units | 721,062 | | | $ | 17.69 | |
| Performance-based restricted stock units | 185,154 | | | $ | 17.78 | |
| Total share-based awards | 906,216 | | | |
|
| | | | | | |
| | Number of Shares Underlying Grant | | Weighted Average Grant Date Fair Value |
| Stock options | 597,034 |
| | $ | 4.21 |
|
| Restricted stock units ("RSUs") | 1,325,172 |
| | 10.44 |
|
| Total share-based awards | 1,922,206 |
| | 8.50 |
|
7.8. NET LOSS(LOSS) INCOME PER SHARE
DilutedBasic net loss(loss) income per share is calculated by dividing net (loss) income by the same as basicweighted-average number of shares of common stock outstanding for the period. Diluted net loss(loss) income per share foris calculated giving effect to all periods presented because the effects of potentially dilutive items were anti-dilutive givenshares of common stock, including stock options and restricted stock units. The dilutive effect of outstanding awards is reflected in diluted earnings per share by application of the Company’s net loss. treasury stock method.
The following securitiestable summarizes the calculation of basic and diluted net (loss) income per share (in thousands, except share and per share data):
| | | | | | | | | | | | | | | | | | | | | | | |
| | Three Months Ended September 30, | | Nine Months Ended September 30, |
| | 2022 | | 2021 | | 2022 | | 2021 |
| Basic: | | | | | | | |
| Net (loss) income | $ | (99) | | | $ | 3,529 | | | $ | 3,562 | | | $ | 13,546 | |
| Weighted average common shares outstanding, basic | 28,815,362 | | | 29,931,173 | | | 29,674,219 | | | 29,665,439 | |
| Basic net (loss) income per share | $ | — | | | $ | 0.12 | | | $ | 0.12 | | | $ | 0.46 | |
| Diluted: | | | | | | | |
| Net (loss) income | $ | (99) | | | $ | 3,529 | | | $ | 3,562 | | | $ | 13,546 | |
| Weighted average common shares outstanding, basic | 28,815,362 | | | 29,931,173 | | | 29,674,219 | | | 29,665,439 | |
| Dilutive effect of: | | | | | | | |
| Stock options | 339,592 | | | 575,293 | | | 328,731 | | | 595,938 | |
| Unvested service-based restricted stock units | 717,659 | | | 967,848 | | | 689,401 | | | 1,034,360 | |
| Unvested performance-based restricted stock units | 82,941 | | | — | | | 101,147 | | | — | |
| Weighted average common shares outstanding, diluted | 29,955,554 | | | 31,474,314 | | | 30,793,498 | | | 31,295,737 | |
| Diluted net (loss) income per share | $ | — | | | $ | 0.11 | | | $ | 0.12 | | | $ | 0.43 | |
The following equity instruments have been excluded from the calculation of weighted average common shares outstandingdiluted net (loss) income per share because the effect is anti-dilutive for the three and nine months ended September 30, 2017 and 2016:anti-dilutive:
| | | | | | | | | | | | | | | | | | | | | | | |
| | Three Months Ended September 30, | | Nine Months Ended September 30, |
| | 2022 | | 2021 | | 2022 | | 2021 |
| Stock options | 22,448 | | | 21,632 | | | 22,655 | | | 22,235 | |
| Restricted stock units | 12,144 | | | 5,291 | | | 381,175 | | | 231,680 | |
|
| | | | | |
| | Three and Nine Months Ended September 30, |
| | 2017 | | 2016 |
| Stock options | 2,132,715 |
| | 1,657,549 |
|
| RSUs | 2,547,941 |
| | 2,342,444 |
|
8.9. INCOME TAXES
At the end of each interim reporting period, the Company estimates its effective income tax rate expected to be applicable for the full year. This estimate is used to determine the income tax provision or benefit on a year-to-date basis and may change in subsequent interim periods.
The Company’sCompany's effective tax rate was (0.9)%105.1% and 1.0%(1.0)% for the three months ended September 30, 20172022 and 2016,2021, respectively, and (1.3)%59.0% and 0.7%(3.3)% for the nine months ended September 30, 20172022 and 2016,2021, respectively. The tax (expense)expense and benefit for each of the periods was based on U.S. federal, state, local and foreign income taxes. The Company’s effective tax rate for these periods isthe three and nine months ended September 30, 2022 was higher than the U.S. federal statutory rate of 21% primarily due to the generation of foreign operating losses which are subject to a valuation allowance as the related loss carryforwards are not yet deemed realizable, nondeductible Merger expenses and the U.S. federal and state requirement to capitalize research and development expenditures, effective for years beginning after December 31, 2021, as discussed below. The Company’s effective tax rate for the three and nine months ended September 30, 2021 was lower than the U.S. federal statutory rate of 34%21% primarily due to the utilization of U.S. federal and state operating lossesloss carryforwards which arehad previously been subject to a valuation allowance. TheAs a result of uncertainties relating to the timing and sufficiency of future taxable income in certain tax jurisdictions in which the Company cannotoperates, the Company could not recognize the tax benefit of operating loss carryforwards generated in certain jurisdictions due to uncertainties relating to future taxable income in those jurisdictions in terms of both its timinguntil the operating loss carryforwards were utilized. The effective tax rate for the three and its sufficiency, which would enablenine months ended September 30, 2022 was higher than the Companyeffective tax rate for the three and nine months ended September 30, 2021 primarily due to realize the benefits of those carryforwards. The Company began recognizing tax expense during the 2017 interim periods compared to having recognized tax benefits during the 2016 interim periods. This was in part a result of releasing valuation allowances in certain foreign jurisdictions during the fourth quarter of 2016. In addition, during the interim periods in 2017, the Company no longer had sufficient deferred tax liabilities in one of its foreign subsidiaries necessary to realize the tax benefit recorded from the utilization of all of its deferred tax assets for that same foreign subsidiary. The Company recordedU.S. federal and state operating loss carryforwards which had been previously subject to a valuation allowance during the three and nine months ended September 30, 2021 and the U.S. federal and state requirement to capitalize research and development expenditures, effective for years beginning after December 31, 2021, as discussed below. The Company reversed most of the valuation allowance recorded against the deferred tax assetsits U.S. federal and state operating loss carryforwards as of that foreign subsidiary, net of deferred tax liabilities. As a result,December 31, 2021. Therefore, the Company did not record a similar tax benefit from the utilization of U.S. federal and state operating loss carryforwards during the three and nine months ended September 30, 2022.
Beginning in 2022, the Tax Cuts and Jobs Act of 2017 eliminates the option to deduct research and development expenditures currently and requires taxpayers to capitalize and amortize them over five years for research performed in the United States and 15 years for research performed outside the United States, pursuant to Section 174 of the Internal Revenue Code. This change has had a material impact on the expected utilization of the Company's U.S. federal and state operating loss carryforwards and resulted in an increase in its effective tax rate for the three and nine months ended September 30, 2022. Although Congress is considering legislation that would repeal or defer the capitalization and amortization requirement to later years, it is not currently permittedcertain that the provision will be repealed or otherwise modified. If the requirement is repealed or modified during a subsequent period, it could result in a decrease to recognize the effective tax benefitrate. The actual impact will depend on if and when this requirement is repealed or modified by Congress, including if retroactively to January 1, 2022, and the amount of that subsidiary’s losses.research and development expenditures incurred in 2022.
9.10. SEGMENT AND GEOGRAPHIC INFORMATION
Operating segments are defined as components of an enterprise for which discrete financial information is available that is evaluated regularly by the chief operating decision maker, (“CODM”)or CODM, for purposes of allocating resources and evaluating financial performance. The Company’sCompany's CODM reviews financial information presented on a consolidated basis for purposes of allocating resources and evaluating financial performance. As such, the Company’sCompany's operations constitute a single operating segment and one reportable segment.
Substantially all assets were held in the United States during the nine months ended September 30, 20172022 and the year ended December 31, 2016.2021. The Company categorizes domestic and international revenue from customers based on their billing address. The following table below summarizes revenue by geography for the three and nine months ended September 30, 20172022 and 20162021 (in thousands). The Company categorizes domestic and international revenue from customers based on their billing address.:
| | | | | | | | | | | | | | | | | | | | | | | |
| | Three Months Ended September 30, | | Nine Months Ended September 30, |
| | 2022 | | 2021 | | 2022 | | 2021 |
| Domestic | $ | 31,034 | | | $ | 29,199 | | | $ | 90,970 | | | $ | 87,181 | |
| International | 12,456 | | | 12,376 | | | 37,619 | | | 35,103 | |
| Total revenue | $ | 43,490 | | | $ | 41,575 | | | $ | 128,589 | | | $ | 122,284 | |
|
| | | | | | | | | | | | | | | |
| | Three Months Ended September 30, | | Nine Months Ended September 30, |
| | 2017 | | 2016 | | 2017 | | 2016 |
| Domestic | $ | 23,156 |
| | $ | 21,985 |
| | $ | 69,354 |
| | $ | 63,458 |
|
| International | 6,941 |
| | 6,007 |
| | 19,076 |
| | 17,979 |
|
| Total revenue | $ | 30,097 |
| | $ | 27,992 |
| | $ | 88,430 |
| | $ | 81,437 |
|
ITEM 2. MANAGEMENT’SMANAGEMENT'S DISCUSSION AND ANALYSIS OF FINANCIAL CONDITION AND RESULTS OF OPERATIONS
Certain statements contained in this Quarterly Report on Form 10-Q may constitute forward-looking statements within the meaning of Section 27A of the Securities Act of 1933, as amended, and Section 21E of the Securities Exchange Act of 1934, as amended. The words or phrases “would"would be,” “will" "will allow,” “intends" "intends to,” “will" "will likely result,” “are" "are expected to,” “will" "will continue,” “is" "is anticipated,” “estimate,” “project,”" "estimate," "project," or similar expressions, or the negative of such words or phrases, are intended to identify “forward-looking"forward-looking statements.”" We have based these forward-looking statements on our current expectations and projections about future events. Because such statements include risks and uncertainties, actual results may differ materially from those expressed or implied by such forward-looking statements.
These forward-looking statements are based upon information available to us as of the date of this Quarterly Report, and while we believe such information forms a reasonable basis for such statements, such information may be limited or incomplete, and our statements should not be read to indicate that we have conducted an exhaustive inquiry into, or review of, all potentially available relevant information. These statements are inherently uncertain and investors are cautioned not to unduly rely upon these statements.Factors that could cause or contribute to these differences include those below and elsewhere in this Quarterly Report on Form 10-Q, particularly in Part II – Item 1A, “Risk"Risk Factors,”" and our other filings with the Securities and Exchange Commission.
This Quarterly Report on Form 10-Q includes forward-looking statements about the occurrence of events, changes or other circumstances that could delay or prevent the closing of our proposed merger with CommerceHub or could give rise to the termination of the Merger Agreement. The forward-looking statements contained herein do not assume the consummation of the proposed transaction with CommerceHub unless specifically stated otherwise.
Statements made herein are as of the date of the filing of this Form 10-Q with the Securities and Exchange Commission and should not be relied upon as of any subsequent date. Unless otherwise required by applicable law, we do not undertake, and we specifically disclaim, any obligation to update any forward-looking statements to reflect occurrences, developments, unanticipated events or circumstances after the date of such statement.
The following discussion and analysis of our financial condition and results of operations should be read in conjunction with our unaudited condensed consolidated financial statements and related notes that appear in Item 1 of this Quarterly Report on Form 10-Q and with our audited consolidated financial statements and related notes for the year ended December 31, 2016,2021, which are included in our Annual Report on Form 10-K for fiscal 2016.2021.
We are a leading provider of software-as-a-service, or SaaS,cloud-based e-commerce solutions and ourwhose mission is to connect and optimize the world's commerce. For over two decades, we have helped brands and retailers worldwide to streamline their e-commerce operations, expand to new channels and grow their sales. Our multichannel commerce platform allows our customers to connect to hundreds of global channels, market to consumers on those channels, sell products, manage fulfillment processes, and analyze and optimize channel performance. Thousands of customers depend on us to securely power their e-commerce cloudoperations on channels such as Amazon, eBay, Facebook, Google, Shopify, Walmart and Zalando. Our platform helps retailersglobal brands gain a competitive advantage with actionable insights into digital shelf performance across thousands of retailer websites and branded manufacturers worldwide improve their online performance by expanding sales channels, connecting with consumers aroundmarketplaces and helps make digital campaigns shoppable. Overall, our platform provides the world, optimizing their operations for peak performancebreadth, scalability and providing actionable analyticsflexibility to improve competitiveness.facilitate billions of dollars in e-commerce transactions annually across the globe.
We serve customers across a wide range of industries and geographies. Our customers include the online businesses of traditionalbrands and retailers, online retailers and branded manufacturers (manufacturers that market the products they produce under their own name), as well as advertising agencies that use our solutions on behalf of their clients. Through
Merger Agreement and Proposed Acquisition by CommerceHub
On September 4, 2022, we entered into an Agreement and Plan of Merger, or the Merger Agreement, with CommerceHub, Inc., a Delaware corporation, or CommerceHub, CH Merger Sub, Inc., a Delaware corporation and a wholly owned subsidiary of CommerceHub, providing for the merger of CH Merger Sub, Inc. with and into the Company, with us surviving the merger as a wholly owned subsidiary of CommerceHub. We have called a special meeting of our platform,stockholders to be held on November 11, 2022 for the approval of the Merger Agreement.
Under the terms of the Merger Agreement, CommerceHub will acquire all outstanding shares of our common stock in exchange for consideration of $23.10 per share in cash. The Merger Agreement contains representations and warranties customary for transactions of this type. The closing of the merger is subject to approval of our stockholders and the satisfaction or waiver of a number of customary closing conditions. The Merger Agreement provides CommerceHub and us with certain termination rights and, under certain circumstances, may require that we enableor CommerceHub pay a termination fee.
See the section titled "Risk Factors—Risks Related to our customers to connectProposed Transaction with new and existing sourcesCommerceHub" included under Part II, Item 1A of demandthis Quarterly Report on Form 10-Q for their products, including e-commerce marketplaces, such as Amazon, eBay, Jet.com, Newegg, Sears and Walmart, search engines and comparison shopping websites, such as Google, Microsoft's Bing and Nextag, and social channels, such as Facebook, Instagram and Pinterest. Our suite of solutions, accessed through a standard web browser, provides our customersmore information regarding the risks associated with a single, integrated user interface to manage their product listings, inventory availability, pricing optimization, search terms, orders and fulfillment, as well as data analytics and other critical functions across these channels. We also offer solutions that allow branded manufacturers to send their web visitors or digital marketing audiences directly to authorized resellers and to gain insight into consumer behavior. Our proprietary cloud-based technology platform delivers significant breadth, scalability and flexibility.the proposed merger.
FINANCIAL RESULTSHIGHLIGHTS
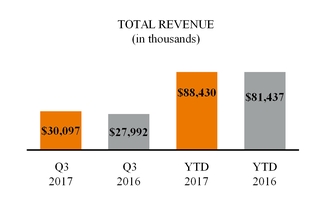
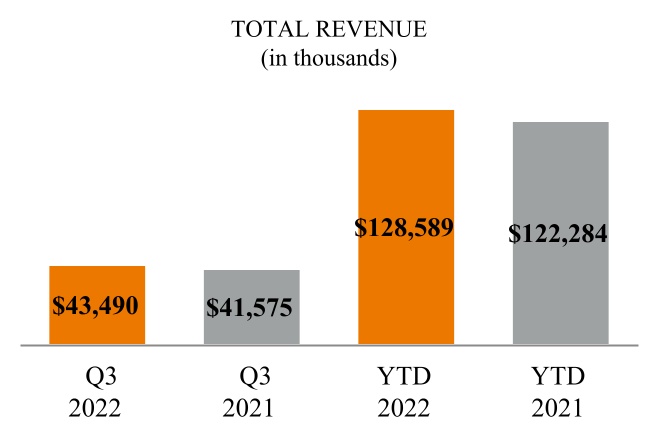
•Total revenue of $30.1$43.5 million and $88.4$128.6 million for the three and nine months ended September 30, 20172022 increased 7.5%4.6% and 8.6%5.2%, respectively, from the comparable prior year periods;
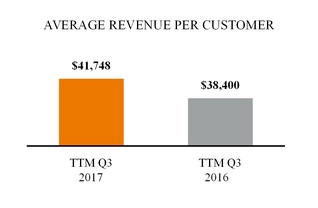
Average revenue per customer of $41,748 for the twelve months ended September 30, 2017 increased 8.7% compared with $38,400 for the twelve months ended September 30, 2016;
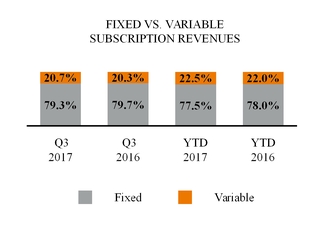
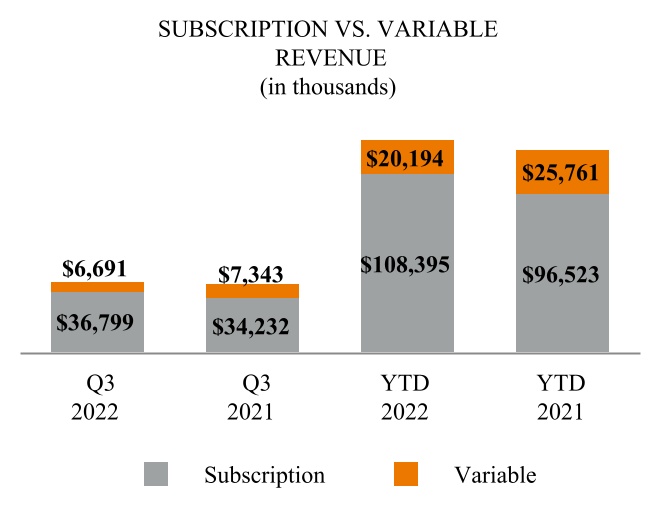
•Revenue was comprised of 79.3%84.6% subscription revenue and 20.7% fixed and15.4% variable subscription fees, respectively,revenue for the three months ended September 30, 20172022 compared with fixed82.3% subscription revenue and 17.7% variable subscription fees of 79.7% and 20.3%, respectively,revenue for the three months ended September 30, 2016. comparable prior year period;
•Revenue was comprised of 77.5%84.3% subscription revenue and 22.5% fixed and15.7% variable subscription fees, respectively,revenue for the nine months ended September 30, 2017,2022 compared with fixed78.9% subscription revenue and 21.1% variable subscription fees of 78.0% and 22.0%, respectively,revenue for the comparable prior year period;
•Revenue from our brands customers represented 44.1% and 44.4% of total revenue for the three and nine months ended September 30, 2016;2022, respectively, up from 42.0% and 39.0% of total revenue for the comparable prior year periods;
•Revenue derived from customers located outside of the United States as a percentage of total revenue was 23.1%28.6% and 21.6%29.3% for the three and nine months ended September 30, 2017,2022, respectively, compared to 21.5%with 29.8% and 22.1%28.7% for the comparable prior year periods;
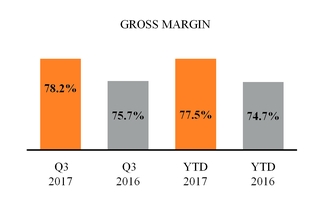
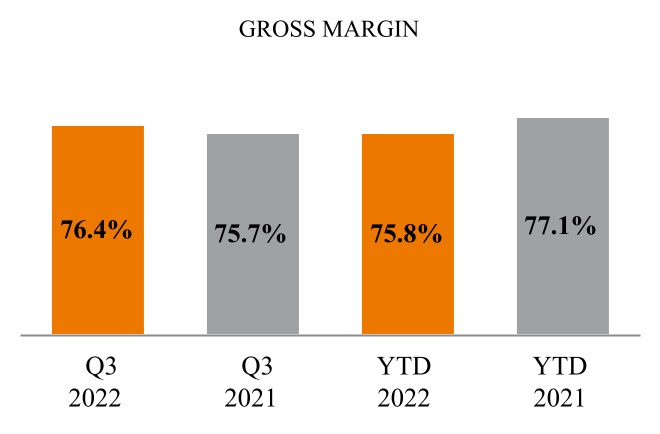
•Gross margin of 78.2%was 76.4% and 77.5%75.8% for the three and nine months ended September 30, 2017,2022, respectively, improved by 250 basis pointscompared with 75.7% and 280 basis points, respectively, from77.1% for the comparable prior year periods;
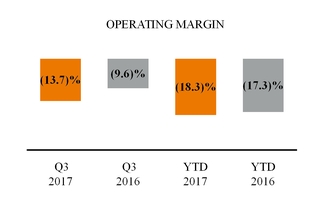
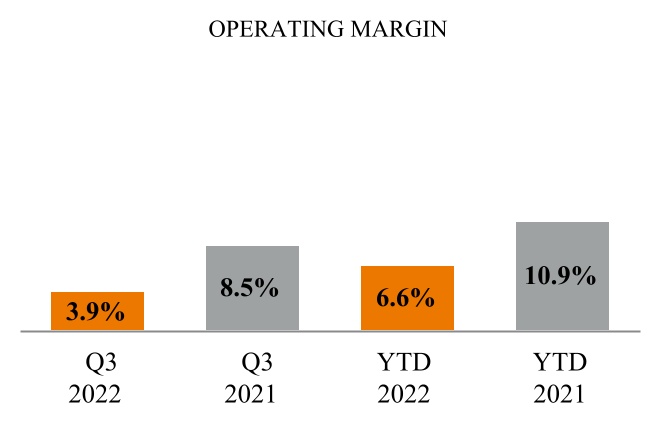
•Operating margin of (13.7)%was 3.9% and (18.3)%6.6% for the three and nine months ended September 30, 2017,2022, respectively, declined compared to operating margin of (9.6)%with 8.5% and (17.3)%10.9% for the comparable prior year periods;
•Net loss of $(4.1) million for the three months ended September 30, 2017 increased compared to net loss of $(2.6) million for the comparable prior year period, and net loss of $(16.1) million for the nine months ended September 30, 2017 increased compared to net loss of $(13.8) million for the comparable prior year period;
Adjusted EBITDA of $0.4(loss) income was $(0.1) million and $0.7$3.6 million for the three and nine months ended September 30, 2017,2022, respectively, decreased compared to adjusted EBITDA of $2.2with $3.5 million and $13.5 million for both of the comparable prior year periods;
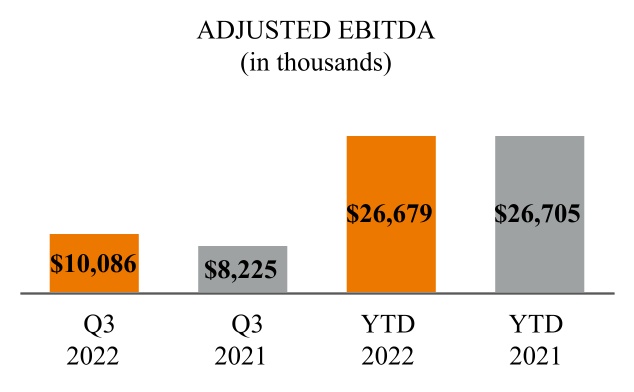
•Adjusted EBITDA, a non-GAAP measure, was $10.1 million and $26.7 million for the three and nine months ended September 30, 2022, respectively, compared with $8.2 million and $26.7 million for the comparable prior year periods;
•Cash and cash equivalents was $54.2were $88.1 million at September 30, 20172022 compared with $65.4$100.6 million at December 31, 2016; and2021;
•Operating cash flow was $(2.2)$22.0 million for the nine months ended September 30, 20172022 compared to $9.4with $26.5 million for the comparable prior year period; and
•Free cash flow, a non-GAAP measure, was $16.2 million for the nine months ended September 30, 2016.2022 compared with $22.8 million for the comparable prior year period.
TRENDS IN OUR BUSINESS
The following trends have contributed to the results of our consolidated operations, and we anticipate that they will continue to impactaffect our future results:
•Growth in Online Shopping. Consumers continue to move more of their retail spending from offline to online retail.online. The continuing shift to online shopping and overall growth has contributed to our historical growth and we expect that this online shift will continue to benefit our business. Global efforts to implement social distancing, including stay-at-home orders and similar mobility and gathering restrictions, due to the COVID-19 pandemic, have increased e-commerce as consumers have increasingly turned to online purchasing for many products they would have purchased at brick and mortar stores. However, it is unclear to what degree this recent shift in favor of e-commerce will continue once the public health impacts of the COVID-19 pandemic have begun to subside or as a result of other macroeconomic or geopolitical factors beyond our control. For example, we have begun to see moderation of gross merchandise value, or GMV, and variable revenue performance compared to the prior year resulting from factors beyond COVID and government stimulus-generated tailwinds, such as the effects of inflation on consumer shopping habits.
•Product Offering Expansion. As online shopping evolves, we continue to expand our product offerings to reflect the needs of companies seeking to attract consumers. We continue to enhance our product offerings by increasing online shopping channel integrations, including marketplace and first-party retail programs, and providing capabilities that allow brands and retailers to be more competitive. This includes support for advertising, advanced algorithmic repricing, machine learning-based demand forecasting, analytics capabilities, fulfillment features and user experience. Product expansion may resultand enhancement has been key to our strategic focus and success with brands.
•Channel Expansion. We have experienced substantial growth in GMV on our platform from large channels like Zalando, Target Plus and Shopify, as well as numerous smaller marketplaces that we refer to collectively as our long tail of marketplaces. Many of our brands customers see a significant opportunity in expanding their reach to more consumers via global channel expansion. We implemented a strategic plan at the beginning of 2021 to add at least 80 additional research and development investment.
channel connections across the globe over an 18-month period to help our customers with this opportunity. We exceeded this goal by adding over 100 new channels by the end of the first quarter of 2022. We intend to continue to add new channel connections over the remainder of 2022.•Growth in Mobile Usage. We believe the shift toward mobile commerce will increasingly favor aggregators such as Amazon, eBay, Google and Google Shopping,Walmart, all of which are focal points of our platform. These aggregatorssystems understand the identity of the buyer, helping to reduce friction in the mobile commerce process, while offering a wide selection of merchandise in a single location. TheWe believe that the growth in mobile commerce may result in increased revenue for us.
Shift to Larger Customers. We believe that the growth in online shopping increasingly favors larger enterprises. This move impacts our business both in longer sales cycles as well as increased average revenue per customer.
•Evolving Fulfillment Landscape. Consumers have been conditioned to expect fast, efficient delivery of products. We believe that determining and executing on a strategy to more expeditiously receive, process and deliver online orders, which we refer to collectively as fulfillment, strategy is critical to success for online sellers. Therefore, it will be increasingly important for us to facilitate and optimize fulfillment services on behalf of our customers, which in turn may result in additional research and development investment. We believe our acquisition of HubLogix will further enhance the Company's fulfillment offering and strategy.
•Focus on Employees. None of our success would be possible without our team. We strive to provide our employees competitive compensation and benefits programs to help driveattract and retain employees who are focused on facilitating the success of our customers. We increased headcountbelieve the human capital programs we have in place are market competitive and recognized by 4.3% from September 30, 2016our employees, as evidenced by our having been recognized by Triangle Business Journal as a member of the 2022 class of "Best Places to September 30, 2017 to help drive revenue growth and support our overall operations.
Shifts in Foreign Currency. Our operationsWork" in the United Kingdom were impacted byTriangle region of North Carolina, the 7.8% declineeighth time we have won this recognition. We have implemented a formal global flexible work policy that provides many of our employees the ability to determine whether they will continue to work from home or from the office, even as our offices around the world reopen following closures during the COVID-19 pandemic. We are not dependent on our physical office locations or travel for our business operations. Refer to "Employees and Human Capital Resources" included in the average exchange rate of the British Pound Sterling against the U.S. Dollarour Annual Report on Form 10-K for the nine monthsyear ended September 30, 2017 as compared to the comparable prior year period. The decline of the British Pound Sterling against the U.S. Dollar resulted in a $1.0 million decrease in revenueDecember 31, 2021 for the nine months ended September 30, 2017 as compared to the nine months ended September 30, 2016. Revenue for the three months ended September 30, 2017 as compared to the three months ended September 30, 2016 was not materially affected by the decline of the British Pound Sterling against the U.S. Dollar.
additional information on employees and human capital resources.•Seasonality. Our revenue fluctuates as a result of seasonal variations in our business, principally due to the peak consumer demand and related increased volume of our customers’ gross merchandise value, orcustomers' GMV during the year-end holiday season. As a result, we have historically had higher revenue in our fourth quarter than other quarters due to increased GMV processed through our platform, resulting in higher variable subscription fees.
OPPORTUNITIES AND RISKS
•Brands. We believe the digital transformation to e-commerce has changed the way brands interact with their customers, which is why we have identified that growing our brands business represents a significant strategic opportunity for us. We generally categorize a customer as a brand if it primarily focuses on selling its own proprietary products. Brands tend to have longer customer life cycles, stronger financial stability and overall better unit economics than retailers, which we consider to be companies focused primarily on selling third-party products. Brands also offer increased expansion opportunities to grow their e-commerce business through our platform; however they tend to have longer sales cycles. To help drive our future growth, we have made significant investments in our sales capacity and incentives to focus on acquiring new, and then expanding business with, brands customers. In addition, we have invested in our services organization to establish a higher level of service for our brands customers and we have prioritized our R&D resources to focus on innovations that enable the success of our brands clients. We believe these investments will improve client results, growing revenue through attracting new prospects and improved retention and expansion with existing customers.
•Dynamic E-commerce Landscape. We will need to continue to innovate in the face of a rapidly changing e-commerce landscape if we are to remain competitive,competitive.
•Strategic Partnerships. Our business development team's mission is to expand our sales and we will need to effectively manage our growth, especially related to our international expansion.
Retailers and Branded Manufacturers. As consumer preferences potentially shift away from smaller retailers, we needmarket opportunities through strategic partner relationships. We plan to continue to add large retailersinvest in initiatives to expand our strategic partnership base to further enhance our offerings for customers and branded manufacturers as profitable customers. These larger customers generally pay a lower percentageto help support our indirect sales channel efforts. The goal of GMV as feesthese strategic partnerships is to us based onfurther improve the relatively higher volumevalue of their GMV processed through our platform. To help drive our future growth, we have made significant investments in our sales force and allocated resources focused on growing our customer base of large retailers and branded manufacturers. We continue to focus our efforts on increasing valueplatform for our customers to support higher rates.
and, when possible, provide us opportunities for incremental revenue streams.•Increasing Complexity and Fragmentation of E-commerce. Although e-commerce continues to expand as retailersbrands and branded manufacturersretailers continue to increase their online sales, it is also becoming more complex and fragmented due to the hundreds of channels available to retailersbrands and branded manufacturersretailers and the rapid pace of change and innovation across those channels. In order to gain consumers’consumers' attention in a more crowded and competitive online marketplace, many retailers and an increasing number of branded manufacturersbrands and retailers sell their merchandise through multiple online channels, each with its own rules, requirements and specifications. In particular, third-party marketplaces are an increasingly important driver of growth for a number of brands and large online retailers and branded manufacturers, and asretailers. As a result, we need to continue to support multiple channels in a variety of geographies in order to support our targeted revenue growth. As of September 30, 2017,growth, and we supported approximately 80 marketplaces.
intend to continue making strategic investments focused on channel expansion.•Global Growth in E-commerce. We believe the growth in e-commerce globally presents an opportunity for retailersbrands and branded manufacturersretailers to engage in international sales. However, country-specific marketplaces are often thea market share leadersleader in their regions, as is the case for AlibabaZalando in Asia.Europe, for example. In order to help our customers capitalize on this potential market opportunity, and to address our customers’customers' needs with respect to cross-border trade, we intend to continue to invest in our international operations, specifically in the Asia Pacific region. Doingoperations. However, doing business overseas involves substantial challenges, including management attention and resources needed to adapt to multiple languages, cultures, laws and commercial infrastructure, as further described in this report under the caption "Risks Related to our International Operations."
infrastructure.Our senior management continuously focuses on these and other trends and challenges, and we believe that our culture of innovation and our history of growth and expansion will contribute to the success of our business. We cannot, however, assure you that we will be successful in addressing and managing the many challenges and risks that we face.
KEY FINANCIAL AND OPERATING METRICSRESULTS OF OPERATIONSThe average revenue generated by our customers is a primary determinant of our revenue. We calculate this metric by dividing our revenue for a particular period by the average monthly number of customers during the period, which is calculated by taking the sum of the number of customers at the end of each month in the period and dividing by the number of months in the period. We typically calculate average revenue per customer in absolute dollars on a trailing twelve-month, or TTM, basis, but we may also calculate percentage changes in average revenue per customer on a quarterly basis in order to help us evaluate our period-over-period performance. For purposes of this metric and the number of customers metric described below, we include all customers who subscribe to at least one of our solutions, excluding customers acquired from our acquisition of HubLogix and customers subscribing only to certain legacy product offerings that are no longer part of our strategic focus.
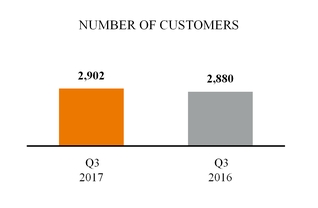
The number of customers increased slightly during the third quarter of 2017 compared to the third quarter of 2016. The graphical presentation above does not include approximately 50 net new customers acquired from our acquisition of HubLogix during the second quarter of 2017. We continue our focus on obtaining large retailer and branded manufacturer customers, which may represent a smaller number of customers, but a potentially larger source of predictable or sustaining recurring revenue.
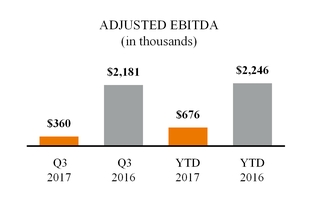
Adjusted EBITDA represents our earnings before interest expense, income tax expense (benefit) and depreciation and amortization, adjusted to eliminate stock-based compensation expense and, for the nine months ended September 30, 2017, a $2.5 million one-time charge in connection with our decision to enter into VDAs with certain jurisdictions. Refer to Note 5 to our unaudited condensed consolidated financial statements included elsewhere in this report for additional information regarding this one-time charge. We believe that adjusted EBITDA provides useful information to management and others in understanding and evaluating our operating results. However, adjusted EBITDA is not a measure calculated in accordance with U.S. GAAP and should not be considered as an alternative to any measure of financial performance calculated and presented in accordance with U.S. GAAP. In addition, adjusted EBITDA may not be comparable to similarly titled measures of other companies because other companies may not calculate adjusted EBITDA in the same manner that we do. Please refer to "Adjusted EBITDA" below for a discussion of the limitations of adjusted EBITDA and a reconciliation of adjusted EBITDA to net loss, the most comparable U.S. GAAP measurement.
Adjusted EBITDA
Our use of adjusted EBITDA has limitations as an analytical tool, and you should not consider it in isolation or as a substitute for analysis of our results as reported under U.S. GAAP. Some of these limitations are:
although depreciation and amortization are non-cash charges, the assets being depreciated and amortized may have to be replaced in the future and adjusted EBITDA does not reflect cash capital expenditure requirements for such replacements or for new capital expenditure requirements;
adjusted EBITDA does not reflect changes in, or cash requirements for, our working capital needs;
adjusted EBITDA does not reflect the potentially dilutive impact of equity-based compensation;
adjusted EBITDA does not reflect interest or tax payments that may represent a reduction in cash available to us; and
other companies, including companies in our industry, may calculate adjusted EBITDA differently, which reduces its usefulness as a comparative measure.
Because of these and other limitations, you should consider adjusted EBITDA together with U.S. GAAP-based financial performance measures, including various cash flow metrics, net income (loss) and our other U.S. GAAP results. The following table presents a reconciliation of net loss to adjusted EBITDA for each of the periods indicated (in thousands):
|
| | | | | | | | | | | | | | | |
| | Three Months Ended September 30, | | Nine Months Ended September 30, |
| | 2017 | | 2016 | | 2017 | | 2016 |
| Net loss | $ | (4,055 | ) | | $ | (2,552 | ) | | $ | (16,096 | ) | | $ | (13,842 | ) |
| Adjustments: |
| |
| |
| |
|
| Interest (income) expense, net | (67 | ) | | (11 | ) | | (149 | ) | | 11 |
|
| Income tax expense (benefit) | 37 |
| | (27 | ) | | 209 |
| | (91 | ) |
| Depreciation and amortization expense | 1,605 |
| | 1,906 |
| | 5,041 |
| | 5,961 |
|
| Total adjustments | 1,575 |
| | 1,868 |
| | 5,101 |
| | 5,881 |
|
| EBITDA | (2,480 | ) | | (684 | ) | | (10,995 | ) | | (7,961 | ) |
| Stock-based compensation expense | 2,840 |
| | 2,865 |
| | 9,132 |
| | 10,207 |
|
| One-time charge for VDAs related to sales taxes | — |
| | — |
| | 2,539 |
| | — |
|
| Adjusted EBITDA | $ | 360 |
| | $ | 2,181 |
| | $ | 676 |
| | $ | 2,246 |
|
The following tables set forth our condensed consolidated statement of operations data and such data expressed as a percentage of revenues for each of the periods indicated.
| | | | Three Months Ended September 30, | | Nine Months Ended September 30, | Period-to-Period Change | | Three Months Ended September 30, | | Nine Months Ended September 30, | | Period-to-Period Change | | Period-to-Period Change | |
| | 2017 | | 2016 | | 2017 | | 2016 | | Q3 2017 to Q3 2016 | | YTD 2017 to YTD 2016 | | 2022 | | 2021 | | 2022 | | 2021 | | Q3 2022 to Q3 2021 | | YTD 2022 to YTD 2021 | |
| (dollars in thousands) | | | | | (dollars in thousands) | | | |
| Revenue | $ | 30,097 |
| | $ | 27,992 |
| | $ | 88,430 |
| | $ | 81,437 |
| | $ | 2,105 |
| 7.5 | % | | $ | 6,993 |
| 8.6 | % | Revenue | $ | 43,490 | | | $ | 41,575 | | | $ | 128,589 | | | $ | 122,284 | | | $ | 1,915 | | 4.6 | % | | $ | 6,305 | | 5.2 | % | |
| Cost of revenue | 6,549 |
| | 6,811 |
| | 19,911 |
| | 20,587 |
| | (262 | ) | (3.8 | ) | | (676 | ) | (3.3 | ) | Cost of revenue | 10,273 | | | 10,100 | | | 31,062 | | | 28,041 | | | 173 | | 1.7 | | | 3,021 | | 10.8 | | |
| Gross profit | 23,548 |
| | 21,181 |
| | 68,519 |
| | 60,850 |
| | 2,367 |
| 11.2 |
| | 7,669 |
| 12.6 |
| Gross profit | 33,217 | | | 31,475 | | | 97,527 | | | 94,243 | | | 1,742 | | 5.5 | | | 3,284 | | 3.5 | | |
| Operating expenses: | | | | | | | | | | | | — |
| | Operating expenses: | | |
| Sales and marketing | 15,565 |
| | 13,824 |
| | 47,231 |
| | 43,064 |
| | 1,741 |
| 12.6 |
| | 4,167 |
| 9.7 |
| Sales and marketing | 16,143 | | | 15,482 | | | 48,245 | | | 45,273 | | | 661 | | 4.3 | | | 2,972 | | 6.6 | | |
| Research and development | 5,760 |
| | 4,512 |
| | 15,878 |
| | 13,077 |
| | 1,248 |
| 27.7 |
| | 2,801 |
| 21.4 |
| Research and development | 5,389 | | | 5,364 | | | 16,192 | | | 16,799 | | | 25 | | 0.5 | | | (607) | | (3.6) | | |
| General and administrative | 6,344 |
| | 5,525 |
| | 21,552 |
| | 18,768 |
| | 819 |
| 14.8 |
| | 2,784 |
| 14.8 |
| General and administrative | 9,984 | | | 7,075 | | | 24,654 | | | 18,792 | | | 2,909 | | 41.1 | | | 5,862 | | 31.2 | | |
| Total operating expenses | 27,669 |
| | 23,861 |
| | 84,661 |
| | 74,909 |
| | 3,808 |
| 16.0 |
| | 9,752 |
| 13.0 |
| Total operating expenses | 31,516 | | | 27,921 | | | 89,091 | | | 80,864 | | | 3,595 | | 12.9 | | | 8,227 | | 10.2 | | |
| Loss from operations | (4,121 | ) | | (2,680 | ) | | (16,142 | ) | | (14,059 | ) | | (1,441 | ) | 53.8 |
| | (2,083 | ) | 14.8 |
| |
| Income from operations | | Income from operations | 1,701 | | | 3,554 | | | 8,436 | | | 13,379 | | | (1,853) | | (52.1) | | | (4,943) | | (36.9) | | |
| Other income (expense): | | | | | | | | | | | |
| | Other income (expense): | | |
| Interest income (expense), net | 67 |
| | 11 |
| | 149 |
| | (11 | ) | | 56 |
| * |
| | 160 |
| * |
| |
| Other income (expense), net | 36 |
| | 90 |
| | 106 |
| | 137 |
| | (54 | ) | * |
| | (31 | ) | * |
| |
| Interest income (expense) | | Interest income (expense) | 234 | | | (30) | | | 251 | | | (96) | | | 264 | | * | | 347 | | * | |
| Other income (expense) | | Other income (expense) | 5 | | | (29) | | | 5 | | | (164) | | | 34 | | * | | 169 | | * | |
| Total other income (expense) | 103 |
| | 101 |
| | 255 |
| | 126 |
| | 2 |
| * |
| | 129 |
| * |
| Total other income (expense) | 239 | | | (59) | | | 256 | | | (260) | | | 298 | | * | | 516 | | * | |
| Loss before income taxes | (4,018 | ) | | (2,579 | ) | | (15,887 | ) | | (13,933 | ) | | (1,439 | ) | 55.8 |
| | (1,954 | ) | 14.0 |
| |
| Income before income taxes | | Income before income taxes | 1,940 | | | 3,495 | | | 8,692 | | | 13,119 | | | (1,555) | | (44.5) | | | (4,427) | | (33.7) | | |
| Income tax expense (benefit) | 37 |
| | (27 | ) | | 209 |
| | (91 | ) | | 64 |
| * |
| | 300 |
| * |
| Income tax expense (benefit) | 2,039 | | | (34) | | | 5,130 | | | (427) | | | 2,073 | | * | | 5,557 | | * | |
| Net loss | $ | (4,055 | ) | | $ | (2,552 | ) | | $ | (16,096 | ) | | $ | (13,842 | ) | | $ | (1,503 | ) | 58.9 |
| | $ | (2,254 | ) | 16.3 |
| |
| Net (loss) income | | Net (loss) income | $ | (99) | | | $ | 3,529 | | | $ | 3,562 | | | $ | 13,546 | | | $ | (3,628) | | (102.8) | % | | $ | (9,984) | | (73.7) | % | |
* Not meaningful.
meaningful
| | | | | Three Months Ended September 30, | | Nine Months Ended September 30, |
| | | | 2022 | | 2021 | | 2022 | | 2021 |
| | | (as a percentage of revenue)
| | (as a percentage of revenue)
|
| | | | | Three Months Ended September 30, | | Nine Months Ended September 30, | |
| | 2017 | | 2016 | | 2017 | | 2016 | |
| | (as a percentage of revenue)
| | (as a percentage of revenue)
| |
| Revenue | 100.0 | % | | 100.0 | % | | 100.0 | % | | 100.0 | % | Revenue | 100.0 | % | | 100.0 | % | | 100.0 | % | | 100.0 | % |
| Cost of revenue | 21.8 |
| | 24.3 |
| | 22.5 |
| | 25.3 |
| Cost of revenue | 23.6 | | | 24.3 | | | 24.2 | | | 22.9 | |
| Gross profit | 78.2 |
| | 75.7 |
| | 77.5 |
| | 74.7 |
| Gross profit | 76.4 | | | 75.7 | | | 75.8 | | | 77.1 | |
| Operating expenses: | | | | | | | | Operating expenses: | |
| Sales and marketing | 51.7 |
| | 49.4 |
| | 53.4 |
| | 52.9 |
| Sales and marketing | 37.1 | | | 37.2 | | | 37.5 | | | 37.0 | |
| Research and development | 19.1 |
| | 16.1 |
| | 18.0 |
| | 16.1 |
| Research and development | 12.4 | | | 12.9 | | | 12.6 | | | 13.7 | |
| General and administrative | 21.1 |
| | 19.7 |
| | 24.4 |
| | 23.0 |
| General and administrative | 23.0 | | | 17.0 | | | 19.2 | | | 15.4 | |
| Total operating expenses | 91.9 |
| | 85.2 |
| | 95.7 |
| | 92.0 |
| Total operating expenses | 72.5 | | | 67.2 | | | 69.3 | | | 66.1 | |
| Loss from operations | (13.7 | ) | | (9.6 | ) | | (18.3 | ) | | (17.3 | ) | |
| Income from operations | | Income from operations | 3.9 | | | 8.5 | | | 6.6 | | | 10.9 | |
| Other income (expense): | | | | | | | | Other income (expense): | |
| Interest income (expense), net | 0.2 |
| | 0.0 |
| | 0.2 |
| | 0.0 |
| |
| Other income (expense), net | 0.1 |
| | 0.3 |
| | 0.1 |
| | 0.2 |
| |
| Interest income (expense) | | Interest income (expense) | 0.5 | | | (0.1) | | | 0.2 | | | (0.1) | |
| Other income (expense) | | Other income (expense) | 0.0 | | | 0.0 | | | 0.0 | | | (0.1) | |
| Total other income (expense) | 0.3 |
| | 0.3 |
| | 0.3 |
| | 0.2 |
| Total other income (expense) | 0.5 | | | (0.1) | | | 0.2 | | | (0.2) | |
| Loss before income taxes | (13.4 | ) | | (9.2 | ) | | (18.0 | ) | | (17.1 | ) | |
| Income before income taxes | | Income before income taxes | 4.5 | | | 8.4 | | | 6.8 | | | 10.7 | |
| Income tax expense (benefit) | 0.1 |
| | (0.1 | ) | | 0.2 |
| | (0.1 | ) | Income tax expense (benefit) | 4.7 | | | (0.1) | | | 4.0 | | | (0.3) | |
| Net loss | (13.5 | )% | | (9.1 | )% | | (18.2 | )% | | (17.0 | )% | |
| Net (loss) income | | Net (loss) income | (0.2) | % | | 8.5 | % | | 2.8 | % | | 11.1 | % |
Depreciation and Amortization
Depreciation and amortization expense is included in the following line items in the accompanying unaudited condensed consolidated statements of operations for the three and nine months ended September 30, 20172022 and 20162021 (in thousands):
| | | | | | | | | | | | | | | | | | | | | | | |
| Three Months Ended September 30, | | Nine Months Ended September 30, |
| 2022 | | 2021 | | 2022 | | 2021 |
| Cost of revenue | $ | 1,186 | | | $ | 1,100 | | | $ | 3,500 | | | $ | 3,409 | |
| Sales and marketing | 76 | | | 85 | | | 221 | | | 356 | |
| Research and development | 30 | | | 32 | | | 93 | | | 139 | |
| General and administrative | 205 | | | 368 | | | 647 | | | 1,160 | |
| Total depreciation and amortization expense | $ | 1,497 | | | $ | 1,585 | | | $ | 4,461 | | | $ | 5,064 | |
|
| | | | | | | | | | | | | | | |
| | Three Months Ended September 30, | | Nine Months Ended September 30, |
| | 2017 | | 2016 | | 2017 | | 2016 |
| Cost of revenue | $ | 933 |
| | $ | 1,109 |
| | $ | 3,058 |
| | $ | 3,497 |
|
| Sales and marketing | 283 |
| | 266 |
| | 812 |
| | 853 |
|
| Research and development | 102 |
| | 111 |
| | 324 |
| | 345 |
|
| General and administrative | 287 |
| | 420 |
| | 847 |
| | 1,266 |
|
| Total depreciation and amortization expense | $ | 1,605 |
| | $ | 1,906 |
| | $ | 5,041 |
| | $ | 5,961 |
|
REVENUE
We derive the majority of our revenue from subscription fees paid to us by our customers for access to and usage of our SaaSsoftware solutions for a specified contract term, which is usuallytypically one year. A portion of thecustomer typically pays a recurring subscription fee is typically fixed and based on a specified minimum amount of GMV or advertising spend that athe customer expects to process through our platform. Subscription fees may also include implementation fees such as launch assistance and training fees. The remaining portion of the subscriptiona customer's fee is variable and is based on a specified percentage of GMV or advertising spend processed through our platform in excess of the customer’scustomer's specified minimum GMV or advertising spend amount. In most cases, the specified percentage of excess GMV or advertising spend on which the variable portion of the subscriptionfee is based is fixed and does not vary depending on the amount of the excess. We also receive implementation fees, which may include fees for providing launch assistance and training.
Because our customer contracts generally contain both fixedsubscription and variable pricing components, changes in GMV between periods do not translate directly or linearly into changes in our revenue. We use customized pricing structures for each of our customers depending upon the individual situation of the customer. For example, some customers may commit to a higher specified minimum GMV amount per month in exchange for a lower fixed percentage fee on that committed GMV. In addition, the percentage fee assessed on the variable GMV in excess of the committed minimum for each customer is typically higher than the fee on the fixed, committed portion. As a result, our overall revenue could increase or decrease even without any change in overall GMV between periods, depending on which customers generated the GMV. In addition, changes in GMV from month to month for any individual customer that are below the specified minimum amount would have no effect on our revenue from that customer, and each customer may alternate between being over the committed amount or under it from month to month. For these reasons, while GMV is an important qualitative and long-term directional indicator, we do not regard it as a useful quantitative measurement of our historic revenues or as a predictor of future revenues.
We recognize revenue derived from fixed subscription fees and implementation fees ratably over the contract period once four conditions have been satisfied:
The contract has been signed by both parties;
Thebeginning on the date the customer has access to our platformthe software. In determining the amount of revenue to be recognized, we apply the following steps:
•Identify the promised services in the contract;
•Determine whether the promised services are performance obligations, including whether they are distinct in the context of the contract;
•Determine the transaction price;
•Allocate the transaction price to the performance obligations based on estimated selling prices; and transactions can be processed;
The fees are fixed or determinable; and
Collection is reasonably assured.•Recognize revenue as we satisfy each performance obligation.
We generally invoice our customers for the fixed portion of the subscription feefees in advance, in monthly, quarterly, semi-annual or annual installments. We generally also invoice our customers for theany implementation feefees at the inception of the arrangement. Fixed subscription and implementation feesFees that have been invoiced in advance are initially recorded as deferred revenue and are generally recognized ratably over the contract term.
WeIn general, we invoice and recognize revenue from the variable portion of subscription feesrevenue in the period in which the related GMV or advertising spend is processed, assuming that the four conditions specified above have been met.processed.
Our customers are categorized as follows:
•Brands. We generally categorize a customer as a brand if it primarily focuses on selling its own proprietary products.
•Retailers. We generally categorize a customer as a retailer if it primarily focuses on selling third-party products.
•Other. Other is primarily comprised of strategic partnerships.
Comparison of Q3 20172022 to Q3 20162021
Revenue increased by 7.5%4.6%, or $2.1$1.9 million, to $30.1$43.5 million for the three months ended September 30, 2017 over2022 compared with $41.6 million for the prior year period. The change was primarily due to a $2.6 million increase in subscription revenue compared to the prior year period, primarily duedriven by positive net bookings, particularly from brands customers. Revenue from our brands customers increased 9.8%, or $1.7 million, compared to the prior year period, driven by an increase in the average revenue per customer as well as an increase in the number ofnew customers and expansions with existing customers.
On a trailing three-month basis, average revenue per customer increased 7.4%, to $10,441 for For the three months ended September 30, 2017 as2022, brands customers represented approximately 44% of our total revenue and 49% of total subscription revenue compared to $9,719approximately 42% and 47%, respectively, for the three months ended September 30, 2016. The increase inprior year period. Variable revenue decreased $0.7 million compared to the average revenue per customer was primarily driven by the growth of our marketplaces solution. This growth was largely attributableprior year period due to an overall increase in transaction volume and,customers converting their variable fees to a lesser extent, to modest overall increases in the percentagesubscription fees assessed on the fixed and variable portions of GMV under our contractual arrangements with some of our customers during the period. Because we generally enter intoupon their annual contracts with our customers, we may renegotiate either or both of the fixed and variable components of the pricing structure of a customer’s contract each year. In addition, the increase in average revenue per customer was due in part to our established customers who have increased their revenue over time on our platform. In general, as customers mature they generate a higher amount of GMV from which we derive revenue and in some cases they may subscribe to additional modules on our platform, thereby increasing our subscription revenue.renewal.
Comparison of YTD 20172022 to YTD 20162021
Revenue increased by 8.6%5.2%, or $7.0$6.3 million, to $88.4$128.6 million for the nine months ended September 30, 2017 over2022 compared with $122.3 million for the prior year period. The change was primarily due to a $11.9 million increase in subscription revenue compared to the prior year period, primarily duedriven by positive net bookings, particularly from brands customers. Revenue from our brands customers increased 19.8%, or $9.5 million, compared to the prior period, driven by an increase in the average revenue per customer as well as an increase in the number ofnew customers and expansions with existing customers.
On a trailing nine-month basis, average revenue per customer increased 8.5%, to $30,677 for For the nine months ended September 30, 2017 as2022, brands customers represented approximately 44% of our total revenue and 49% of total subscription revenue compared to $28,266approximately 39% and 44%, respectively, for the nine months ended September 30, 2016.prior year period. Variable revenue decreased $5.6 million compared to the prior year period due to customers converting their variable fees to subscription fees upon their annual renewal, as well as moderation in GMV driven by factors such as federal stimulus occurring in the prior year.
COST OF REVENUE
Cost of revenue primarily consists of:
•Salaries and personnel-related costs for employees providing services to our customers and supporting our platform infrastructure, including benefits, bonuses and stock-based compensation;
•Co-location facility costs for our data centers;
•Infrastructure maintenance costs; and
•Fees we pay to credit card vendors in connection with our customers’customers' payments to us.
Comparison of Q3 20172022 to Q3 20162021
Cost of revenue decreasedincreased by 3.8%1.7%, or $0.3$0.2 million, to $6.5$10.3 million for the three months ended September 30, 2017 over2022 compared with $10.1 million for the prior year period, with theperiod. The change beingwas comprised primarily of a decrease in compensation and employee-related costs including stock-based compensation expense.due to an increase in headcount to support the growth of our business and a higher level of service for brands.
Comparison of YTD 20172022 to YTD 20162021
Cost of revenue decreasedincreased by 3.3%10.8%, or $0.7$3.0 million, to $19.9$31.1 million for the nine months ended September 30, 2017 over2022 compared with $28.0 million for the prior year period, with theperiod. The change beingwas comprised primarily of decreases of:
•$0.32.1 million in compensation and employee-related costs including stock-based compensation expense;due to an increase in headcount to support the growth of our business and a higher level of service for brands;
•$0.6 million in contractor costs primarily to support data scraping and our client services team; and
•$0.3 million in co-locationsoftware and infrastructurewebsite maintenance costs primarily associated with closing a data center and retiring servers used to support legacy product offerings that are no longer partthe growth of our strategic focus.business.
OPERATING EXPENSES
SALES AND MARKETING EXPENSE
Sales and marketing expense consists primarily of:
•Salaries and personnel-related costs for our sales and marketing and customer support employees, including benefits, bonuses and stock-based compensationcompensation;
•Amortization of capitalized sales commissions and commissions;related incentive payments over their expected term of benefit;
•Marketing, advertising and promotional event programs; and
•Corporate communications.
Comparison of Q3 20172022 to Q3 2016
2021
Sales and marketing expense increased by 12.6%4.3%, or $1.7$0.7 million, to $15.6$16.1 million for the three months ended September 30, 2017 over2022 compared with $15.5 million for the prior year period, with theperiod. The change beingwas comprised of increasesprimarily of:
$1.0• $1.2 million in compensation and employee-related costs mainly due to additionalan increase in headcount, as we continued to invest in resources to support the growth of our sales organization; andbusiness; partially offset by
•$0.7(0.5) million in marketing and advertising expenses,driven by the timing of our promotional event programs and travel costs to support expanding marketing activities to continue to grow our business.
programs.
Comparison of YTD 20172022 to YTD 20162021
Sales and marketing expense increased by 9.7%6.6%, or $4.2$3.0 million, to $47.2$48.2 million for the nine months ended September 30, 2017 over2022 compared with $45.3 million for the prior year period, with theperiod. The change beingwas comprised of increasesprimarily of:
$2.6• $3.3 million in compensation and employee-related costs mainly due to additionalan increase in headcount, as we continued to invest in resources to support the growth of our sales organization; andbusiness; partially offset by
•$1.6(0.4) million in marketing and advertising expenses,driven by the timing of our promotional event programs and travel costs to support expanding marketing activities to continue to grow our business.programs.
RESEARCH AND DEVELOPMENT EXPENSE
Research and development expense consists primarily of:
•Salaries and personnel-related costs for our research and development employees, including benefits, bonuses and stock-based compensation;
•Costs related to the development, quality assurance and testing of new technology and enhancement of our existing platform technology; and
Consulting expenses.•Infrastructure and cloud computing expenses to support our platform.
Comparison of Q3 20172022 to Q3 20162021
Research and development expense increased by 27.7%, or $1.2was $5.4 million to $5.8 million for each of the three months ended September 30, 2017 over2022 and 2021, with no significant changes as compared to the prior year period, with the change being comprised primarily of increases of:
$1.0 million in compensation and employee-related costs, mainly due to additional headcount gained with our acquisition of HubLogix to support our growth and the enhancement of our product offerings; and
$0.1 million in software and hosting expenses to further support our growth and investment in research and development.period.
Comparison of YTD 20172022 to YTD 20162021
Research and development expense increaseddecreased by 21.4%3.6%, or $2.8$0.6 million, to $15.9$16.2 million for the nine months ended September 30, 2017 over2022 compared with $16.8 million for the prior year period, with theperiod. The change beingwas comprised primarily of increases of:
$2.3 million in compensation and employee-related costs, mainly due to additional headcount gained with our acquisition of HubLogix to support our growth and the enhancementdriven by a larger proportion of our product offerings;research and development resources being staffed in lower cost locations.
$0.2 million in software and hosting expenses.
GENERAL AND ADMINISTRATIVE EXPENSE
General and administrative expense consists primarily of:
•Salaries and personnel-related costs for administrative, finance and accounting, information systems, legal and human resource employees, including benefits, bonuses and stock-based compensation;
•Consulting and professional fees;
•Insurance;
•Bad debt expense; and
•Costs associated with SEC compliance, including with the Sarbanes-Oxley Act and other regulations governing public companies.
Comparison of Q3 20172022 to Q3 20162021
General and administrative expense increased by 14.8%41.1%, or $0.8$2.9 million, to $6.3$10.0 million for the three months ended September 30, 2017 over2022 compared with $7.1 million for the prior year period,period. The change was comprised primarily of:
•$3.2 million in general and administrative costs associated with the change being comprised primarilynegotiation and execution of increases of:the Merger Agreement with CommerceHub and the transactions contemplated by the Merger Agreement; and
•$0.30.2 million in lease abandonment costs related to right of use lease assets, driven by a reduction in our leased office space; partially offset by
•$(0.3) million in compensation and employee-relatedemployee related costs including stock-based compensation expense, mainly due to additional headcount;driven by lower variable compensation; and
•$0.3(0.2) million in professional fees including consulting and accounting and tax services primarilyamortization of intangible assets driven by certain intangible assets becoming fully amortized in connection with our implementationthe prior year.
Comparison of YTD 20172022 to YTD 20162021
General and administrative expense increased by 14.8%31.2%, or $2.8$5.9 million, to $21.6$24.7 million for the nine months ended September 30, 2017 over2022 compared with $18.8 million for the prior year period,period. The change was comprised primarily of:
•$3.2 million in general and administrative costs associated with the change being comprised primarilynegotiation and execution of increases of:the Merger Agreement with CommerceHub and the transactions contemplated by the Merger Agreement;
•$2.51.3 million one-time charge in connection with entering into VDAs with certain jurisdictions;general and administrative costs driven by the prior year benefit from the decrease in the fair value of acquisition-related contingent consideration;
•$0.10.8 million in compensation and employee-relatedemployee related costs, mainlyincluding stock-based compensation, due to additional headcount;an increase in headcount to support the growth of our business; and
•$0.10.5 million in professional feeslease abandonment costs related to right of use lease assets, driven by a reduction in our leased office space.
ADJUSTED EBITDA
Adjusted EBITDA represents our earnings before interest income (expense), income tax expense (benefit) and depreciation and amortization, adjusted to eliminate stock-based compensation expense, which is a non-cash item. For some periods, we have also adjusted for non-recurring costs, such as merger-related costs, lease abandonment and related costs, headquarters relocation costs and the change in fair value of acquisition-related contingent consideration.
We believe that adjusted EBITDA provides useful information to management and others in understanding and evaluating our operating results. However, adjusted EBITDA is not a measure calculated in accordance with GAAP and should not be considered as an alternative to any measure of financial performance calculated and presented in accordance with GAAP. In addition, adjusted EBITDA may not be comparable to similarly titled measures of other companies because other companies may not calculate adjusted EBITDA in the same manner that we do.
Our use of adjusted EBITDA has limitations as an analytical tool, and you should not consider it in isolation or as a substitute for analysis of our results as reported under GAAP. Some of these limitations are:
•although depreciation and amortization are non-cash charges, the assets being depreciated and amortized may have to be replaced in the future, and adjusted EBITDA does not reflect cash capital expenditure requirements for such replacements or for new capital expenditure requirements;
•adjusted EBITDA does not reflect changes in, or cash requirements for, our working capital needs;
•adjusted EBITDA does not reflect the potentially dilutive impact of equity-based compensation;
•adjusted EBITDA does not reflect interest or income tax payments that may represent a reduction in cash available to us; and
•other companies, including consultingcompanies in our industry, may calculate adjusted EBITDA differently, which reduces its usefulness as a comparative measure.
Because of these and accountingother limitations, you should consider adjusted EBITDA together with other GAAP-based financial performance measures, including various cash flow metrics, net (loss) income and tax services primarily in connection with our implementationother GAAP results. The following table presents a reconciliation of net (loss) income to adjusted EBITDA for each of the new revenue recognition standard and our VDA process.periods indicated (in thousands):
| | | | | | | | | | | | | | | | | | | | | | | |
| | Three Months Ended September 30, | | Nine Months Ended September 30, |
| | 2022 | | 2021 | | 2022 | | 2021 |
| Net (loss) income | $ | (99) | | | $ | 3,529 | | | $ | 3,562 | | | $ | 13,546 | |
| Adjustments: | | | | | | | |
| Interest (income) expense | (234) | | | 30 | | | (251) | | | 96 | |
| Income tax expense (benefit) | 2,039 | | | (34) | | | 5,130 | | | (427) | |
| Depreciation and amortization expense | 1,497 | | | 1,585 | | | 4,461 | | | 5,064 | |
| Total adjustments | 3,302 | | | 1,581 | | | 9,340 | | | 4,733 | |
| EBITDA | 3,203 | | | 5,110 | | | 12,902 | | | 18,279 | |
| Stock-based compensation expense | 3,379 | | | 3,115 | | | 9,985 | | | 9,739 | |
| Transaction costs in connection with CommerceHub merger | 3,249 | | | — | | | 3,249 | | | — | |
| Lease abandonment and related costs | 179 | | | — | | | 467 | | | — | |
| Headquarters relocation costs | 76 | | | — | | | 76 | | | — | |
| Contingent consideration fair value adjustment | — | | | — | | | — | | | (1,313) | |
| Adjusted EBITDA | $ | 10,086 | | | $ | 8,225 | | | $ | 26,679 | | | $ | 26,705 | |
GROSS AND OPERATING MARGINS
Comparison of Q3 20172022 to Q3 20162021
Gross marginimproved by 25070 basis points to 78.2%76.4% during the three months ended September 30, 20172022 compared towith 75.7% for the prior year period as a result of the increase in revenue and decreaseof 4.6% noted above, which exceeded the 1.7% increase in cost of revenue noted above. Our improved gross margin was a result of our continuing strategic efforts to achieve increasing scale in our business operations.revenue.
Operating margin declined by 410460 basis points to (13.7)%3.9% during the three months ended September 30, 20172022 compared towith 8.5% for the prior year period due to a 16.0% growthincreases in operating expenses primarily due to an increase in compensation and
employee-related costs driven by additional headcount as we invest in resources to support the growth of our business. These operating expenses exceeded the 7.5% increase in revenue and 3.8% decrease in cost of revenue.
Comparison of YTD 2017 to YTD 2016
Gross marginimproved by 280 basis points to 77.5% during the nine months ended September 30, 2017 compared to the prior year period12.9%, primarily as a result of costs associated with the increase in revenuenegotiation and decrease in costexecution of revenue noted above.
Operating margin declined by 100 basis points to (18.3)% during the nine months ended September 30, 2017 compared to the prior year period due to a 13.0% growth in operating expenses which includes the $2.5 million one-time charge related to the VDAs described aboveMerger Agreement with CommerceHub and an increase in compensation and employee-related costs driven by additional headcount as we invest in resources to support the growth of our business. These operating expenses exceeded
Comparison of YTD 2022 to YTD 2021
Gross margin declined by 130 basis points to 75.8% during the 8.6%nine months ended September 30, 2022 compared with 77.1% for the prior year period as a result of the increase in revenue and 3.3% decrease in cost of revenue of 10.8% noted above, which exceeded the 5.2% increase in revenue.
Operating margin declined by 430 basis points to 6.6% during the nine months ended September 30, 2022 compared with 10.9% for the prior year period due to increases in operating expenses and cost of revenue of 10.2% and 10.8%, respectively, primarily as a result of costs associated with the negotiation and execution of the Merger Agreement with CommerceHub and an increase in compensation and employee-related costs driven by additional headcount as we invest in resources to support the growth of our business.
INCOME TAX EXPENSE
At the end of each interim reporting period, we estimate our effective income tax rate expected to be applicable for the full year. This estimate is used to determine the income tax provision or benefit on a year-to-date basis and may change in subsequent interim periods.
Comparison of Q3 2022 to Q3 2021
Income tax expense was $2.0 million for the three months ended September 30, 2022 compared with income tax benefit of $(0.03) million for the prior year period. Refer to Note 9, "Income Taxes," to our condensed consolidated financial statements included in this report for additional information regarding income tax expense.
Comparison of YTD 2022 to YTD 2021
Income tax expense was $5.1 million for the nine months ended September 30, 2022 compared with income tax benefit of $(0.4) million for the prior year period. Refer to Note 9, "Income Taxes," to our condensed consolidated financial statements included in this report for additional information regarding income tax expense.
CRITICAL ACCOUNTING POLICIES AND ESTIMATES
Our management’smanagement's discussion and analysis of our financial condition and results of operations is based on our condensed consolidated financial statements, which have been prepared in accordance with U.S. GAAP. The preparation of these condensed consolidated financial statements requires us to make estimates and assumptions that affect the reported amounts of assets and liabilities, disclosure of contingent assets and liabilities at the date of the condensed consolidated financial statements and the reported amounts of revenue and expenses during the reported period. In accordance with U.S. GAAP, we base our estimates on historical experience and on various other assumptions that we believe are reasonable under the circumstances. Actual results may differ from these estimates under different assumptions or conditions, and to the extent that there are differences between our estimates and actual results, our future financial statement presentation, financial condition, results of operations and cash flows will be affected. During the nine months ended September 30, 2017, thereThere were no material changes to our critical accounting policies and use of estimates, which are disclosed in our audited consolidated financial statements for the year ended December 31, 20162021 included in our Annual Report on Form 10-K for fiscal 2016.2021.
Recent Accounting Pronouncements
Refer to Note 2, "Significant Accounting Policies," to our condensed consolidated financial statements included in this report for a full description ofinformation regarding recent accounting pronouncements.
LIQUIDITY AND CAPITAL RESOURCES
We derive our liquidity and operating capital primarily from cash flows from operations. Based on our current level of operations and anticipated growth, we believe our future cash flows from operating activities and our existing cash balances will be sufficient to meet our cash requirements for at least the next 12twelve months.
The foregoing estimate does not give effect to any potential amounts that we may draw under our credit facility, or Credit Facility, with HSBC Bank, or HSBC, that is described in more detail below.
Our principal future commitments consist of non-cancelable leases for our current and future office space and computer equipment, totaling $10.7 million as of September 30, 2022. We believe our future cash flows from operating activities and existing cash balances, together with amounts available under the Credit Facility, will be sufficient to meet these commitments.
CASH FLOWS
Free Cash Flow
We view free cash flow as an important financial metric as it demonstrates our ability to generate cash and can allow us to pursue opportunities that enhance shareholder value. Free cash flow is a non-GAAP financial measure that should be considered in addition to, not as a substitute for, measures of our financial performance prepared in accordance with GAAP. The following table presents a reconciliation of cash provided by operating activities, the most directly comparable GAAP measure, to free cash flow for each of the periods indicated (in thousands):
| | | | | | | | | | | |
| Nine Months Ended September 30, |
| 2022 | | 2021 |
| Cash and cash equivalents provided by operating activities | $ | 21,971 | | | $ | 26,479 | |
| Less: Purchases of property and equipment | (2,871) | | | (1,125) | |
| Less: Payment of capitalized software development costs | (2,890) | | | (2,577) | |
| Free cash flow | $ | 16,210 | | | $ | 22,777 | |
Free cash flow decreased by $6.6 million to $16.2 million for the nine months ended September 30, 2022 compared with $22.8 million for the prior year period. The decrease in free cash flow was primarily a result of an increase in operating expenses to support the growth of our business, costs associated with the negotiation and execution of the Merger Agreement with CommerceHub and changes in assets and liabilities, which are further described below.
Operating activities cash flows are largely driven by:
•The amount of cash we invest in personnel and infrastructure to support the anticipated growth of our business;
•The amount and timing of customer payments;
•The seasonality of our business, as noted above, which results in variations in the timing of invoicing and the receipt of payments from our customers; and
In 2017,•The costs associated with the amounts paid in connectionnegotiation and execution of the Merger Agreement with entering into VDAs related to our potential sales tax liability.CommerceHub.
Investing activities cash flows are largely driven by:
Acquisitions, net of cash acquired;
•Capitalized expenditures to create internally developed software and implement software purchased for internal use; and
•Purchases of property and equipment to support the expansion of our infrastructure and acquisitions.infrastructure.
Financing activities cash flows are largely driven by:
•Proceeds from the exercises of stock options;
Payments on capital lease obligations;
•Tax withholdings related to the net-share settlement of restricted stock units;
•Repurchases of our common stock;
•Payments on finance lease obligations; and
Acquisition-related contingent consideration.•Payment of financing costs.
YTD 20172022
Operating Activities
Our cash used inprovided by operating activities of $22.0 million consisted of a net lossincome of $16.1$3.6 million adjusted for certain non-cash items totaling $13.9$17.2 million, which consisted of stock-based compensation expense, depreciation and amortization expense, bad debt expense and other non-cash items, principally the amortizationincluding lease abandonment costs, and cash increases of a lease incentive obligation related to our corporate headquarters.$1.2 million from changes in assets and liabilities.
The net decreaseincrease in cash of $1.2 million resulting from changes in working capital of $(0.1) millionassets and liabilities primarily consisted of:
•a $1.7$1.5 million decrease in accounts receivable driven by strong cash collections during the period;
•a $1.2 million increase in accounts receivable which is a result of increased revenue and customer growth;
a $1.4 million increase in prepaidaccrued expenses and other assets, primarily related to certain customer arrangements for which we collect and remit monthly activity-based fees incurred for specific channels on behalf of our customers (we record the amounts due from customers as a result of these arrangements as other receivables); and
a $0.1 million net decrease in accounts payable and accrued expenses that is a result of a decrease in accounts payable of $1.2 million, driven by the timing of payments to our vendors during the period, partially offsetperiod; and
•a $0.8 million decrease in prepaid expenses and other assets driven by a $1.1 million increase in accrued expenses primarily attributable to the balancetiming of a one-time charge in connection with our decision to enter into VDAs relatedpayments to our potential unpaid sales tax liability.vendors during the period. These decreasesincreases in cash were partially offset by an increasedecreases in cash due toto:
•a $3.0$2.3 million increase in deferred revenue ascontract costs consisting of sales commissions and a resultportion of an increased numberother incentive compensation driven by net bookings performance. These contract costs are deferred and amortized to expense over the expected period of customers prepaying for subscription services invoiced on a semi-annual and annual basis.benefit.
Investing Activities
Our cash used in investing activities of $5.8 million consisted of:
•$2.42.9 million of capitalized software development costs; and
•$2.9 million of capital expenditures primarily related to the purchase of computer equipment;
$2.2 million for the acquisition of HubLogix, net of cash acquired; and
$0.2 million of internal-use software development costs.equipment.
Financing Activities
Our cash used in financing activities of $27.7 million consisted of:
•$2.625.0 million in cash used for the repurchase of our common stock; and
•$3.4 million used for the payment of taxes related to the net-share settlement of restricted stock units;
$2.6 million used for the repayment of capital leases; partially offset by
•$0.60.7 million in cash received upon the exercise of stock options.
YTD 20162021
Operating Activities
Our cash provided by operating activities of $26.5 million consisted of a net lossincome of $13.8$13.5 million adjusted for certain non-cash items totaling $15.6$11.8 million, which consisted of stock-based compensation expense, depreciation and amortization expense, and bad debt expense.recovery and other non-cash items, including the contingent consideration fair value adjustment, and cash increases of $1.1 million from changes in assets and liabilities.
The net increase in cash of $1.1 million resulting from changes in working capital of $7.6 millionassets and liabilities primarily consisted of:
•a $4.2$6.4 million increase in deferred revenue of as a result of an increased number of customers prepaying for subscription services invoiced on a semi-annual and annual basis;
a $2.8 million decreaseincrease in accounts receivable as a result of increased cash collectionsnet bookings during the period; and
•a $1.8$0.1 million decrease in prepaid expenses and other assets primarily related to certain customer arrangements for which we collect and remit monthly activity-based fees incurred for specific channels on behalfdriven by the timing of our customers, as well as the receipt of cash for a lease incentive relatedpayments to our corporate headquarters; thesevendors during the period; and
•a $0.1 million increase in accrued expenses and accounts payable driven by the timing of payments to our vendors during the period. These increases in cash were partially offset by a decreasedecreases in cash due toto:
•a $1.3$4.9 million decreaseincrease in deferred contract costs consisting of sales commissions and a portion of other incentive compensation that is deferred and amortized to expense over the expected period of benefit; and
•a $0.6 million increase in accounts payable and accrued expenses, primarilyreceivable driven by accrued bonuses related tostrong net bookings performance during the year ended December 31, 2015 that were paid in the first quarter of 2016.period.
Investing Activities
Our cash used in investing activities of $3.7 million consisted of:
•$0.92.6 million of capitalized software development costs; and
•$1.1 million of capital expenditures primarily related to the purchase of computer equipment; and
$0.2 million of internal-use software development costs.equipment.
Financing Activities
Our cash used inprovided by financing activities of $2.9 million consisted of:
•$2.14.2 million in cash received upon the exercise of stock options; partially offset by
•$1.4 million used for the payment of taxes related to the net-share settlement of restricted stock units;units.
$2.1SHARE REPURCHASE PROGRAM
In August 2021, our Board of Directors approved a share repurchase program authorizing the repurchase of up to $25.0 million used for the repayment of capital leases;
$0.3 million used for the payment of our acquisition-related contingent considerationcommon stock through August 10, 2022. During the nine months ended September 30, 2022, 1,828,604 shares were repurchased and retired under the repurchase program at an average price of $13.67 per share for an aggregate total price of $25.0 million, which completed the share repurchase program authorized in connection withAugust 2021. There were no repurchases during the three months ended September 30, 2022.
In June 2022, our acquisitionBoard of E-Tale Holdings Limited in 2014; partially offset by
$0.8Directors authorized an additional share repurchase program of up to $25.0 million in cash received uponof our common stock through June 30, 2023. We had not repurchased any shares under the exercise of stock options.
Off-Balance Sheet Arrangements
AsJune 2022 authorization as of September 30, 2017,2022. Repurchases may be made from time to time on the open market at prevailing prices, including pursuant to Rule 10b5-1 trading plans, or in negotiated transactions off the market. The share repurchase program does not obligate us to repurchase any particular amount of our shares. In light of our pending merger with CommerceHub, we diddo not have any off-balance sheet arrangements,current plans to effect share repurchases under the June 2022 authorization.
CREDIT FACILITY
On August 5, 2020, we established the Credit Facility with HSBC under which we may borrow up to $25 million. We may use proceeds from borrowings under the Credit Facility for working capital and general corporate purposes, including acquisitions, and up to $10 million is available for letters of credit. We may also request increases in the amount of the Credit Facility, with such increases not to exceed $10 million in the aggregate, subject to HSBC’s consent. As of the date of this report, we have not drawn on, or issued any letters of credit under, the Credit Facility. The Credit Facility matures in August 2023.
Any borrowings under the Credit Facility will bear interest at a per annum interest rate based on a base rate plus 2.25% or LIBOR plus 3.25%. The base rate will equal the highest of (a) the prime rate as definedpublicly announced by HSBC, (b) the sum of (i) the weighted average of the rates on overnight federal funds transactions with members of the Federal Reserve System plus (ii) 0.50%, and (c) the LIBOR rate plus 1.00% per annum, with a floor of 1.50%. The LIBOR rate will be based on London interbank offered rates published by ICE Benchmark Administration Limited for the applicable interest period, with a floor of 0.50%. We will pay a fee on all outstanding letters of credit at a rate of 3.25% per annum. We will pay HSBC a commitment fee on the undrawn portion of the facility at a rate per annum equal to 0.50%. We may terminate the Credit Facility, or prepay any borrowings, at any time in Item 303(a)(4)(ii)our discretion without premium or penalty.
The credit agreement for the Credit Facility, or the Credit Agreement, contains affirmative and negative covenants. For example, we may not permit the ratio of Securitiesour outstanding indebtedness to consolidated EBITDA to exceed 2.50 to 1.00 as of the last day of any fiscal quarter. We also may not permit the ratio of our consolidated EBITDA (minus maintenance-related capital expenditures paid in cash and Exchange Commission, or SEC, Regulation S-K.minus dividends, distributions and stock repurchases paid in cash) to consolidated interest expense to be less than 3.00 to 1.00 for any period of four consecutive fiscal quarters.
The Credit Agreement contains customary events of default. Upon the occurrence and during the continuance of an event of default, HSBC may terminate the commitments under the Credit Facility and declare the outstanding advances and all other obligations under the Credit Facility immediately due and payable.
ITEM 3. QUANTITATIVE AND QUALITATIVE DISCLOSURES ABOUT MARKET RISK
Market risk is the risk of loss to future earnings, values or future cash flows that may result from changes in the price of a financial instrument. The value of a financial instrument may change as a result of changes in interest rates, exchange rates, commodity prices, equity prices and other market changes. We are exposed to market risk related to changes in foreign currency exchange rates. Although we have not drawn on our Credit Facility, we may do so in the future which may subject us to risks from changing interest rates. We do not use derivative financial instruments for speculative, hedging or trading purposes, although in the future we may enter into exchange rate hedging arrangements to manage foreign currency exchange risk. During the nine months ended September 30, 2017,2022, there were no material changes to our market risks which arefrom those disclosed in our Annual Report on Form 10-K for fiscal 2016.2021.
ITEM 4.CONTROLS AND PROCEDURES
(a) Evaluation of Disclosure Controls and Procedures
The term “disclosure"disclosure controls and procedures,”" as defined in Rules 13a-15(e) and 15d-15(e) under the Securities Exchange Act of 1934, as amended (the “Exchange Act”"Exchange Act"), refers to controls and procedures that are designed to ensure that information required to be disclosed by a company in the reports that it files or submits under the Exchange Act is recorded, processed, summarized and reported, within the time periods specified in the SecuritySecurities and Exchange Commission’s rules and forms. Disclosure controls and procedures include, without limitation, controls and procedures designed to ensure that such information is accumulated and communicated to a company’scompany's management, including its principal executive and principal financial officers, as appropriate to allow timely decisions regarding required disclosure.
In designing and evaluating our disclosure controls and procedures, management recognizes that disclosure controls and procedures, no matter how well conceived and operated, can provide only reasonable, not absolute, assurance that the objectives of the disclosure controls and procedures are met. Additionally, in designing disclosure controls and procedures, our management necessarily was required to apply its judgment in evaluating the cost-benefit relationship of possible disclosure controls and procedures. The design of any system of controls also is based in part upon certain assumptions about the likelihood of future events, and there can be no assurance that any design will succeed in achieving its stated goals under all potential future conditions; over time, controls may become inadequate because of changes in conditions, or the degree of compliance with policies or procedures may deteriorate. Because of the inherent limitations in a control system, misstatements due to error or fraud may occur and not be detected.
Our management, with the participation of our Chief Executive Officer and our Chief Financial Officer, has evaluated the effectiveness of our disclosure controls and procedures as of September 30, 2017,2022, the end of the period covered by this Quarterly Report on Form 10-Q. Based upon such evaluation, our Chief Executive Officer and our Chief Financial Officer have concluded that our disclosure controls and procedures were effective as of such date at the reasonable assurance level.
(b) Changes in Internal ControlsControl Over Financial Reporting
There have not been any changes in our internal controlscontrol over financial reporting during our fiscal quarter ended September 30, 20172022 that materially affected, or are reasonably likely to materially affect, our internal control over financial reporting.
PART II
OTHER INFORMATION
ITEM 1. LEGAL PROCEEDINGS
From time to time, we are subject to litigation and claims arising in the ordinary course of business, butbusiness. Except as set forth below, we are not currently a party to any material legal proceedings and we are not aware of any pending or threatened legal proceeding against us that we believe could have a material adverse effect on our business, operating results, cash flows or financial condition.
As of November 7, 2022, five complaints were filed in federal court by purported ChannelAdvisor stockholders regarding the Merger. The first complaint was filed on September 28, 2022, in the United States District Court for the Southern District of New York and is captioned Stein v. ChannelAdvisor Corporation, Case No. 1:22-cv-08282. The second complaint was filed on September 29, 2022, in the United States District Court for the Southern District of New York and is captioned O'Dell v. ChannelAdvisor Corporation, Case No. 1:22-cv-08334. The third complaint was filed on October 25, 2022, in the United States District Court for the Southern District of New York and is captioned Weiss v. ChannelAdvisor Corporation, Case No. 1:22-cv-09129. The fourth complaint was filed on October 26, 2022, in the United States District Court for the District of Delaware and is captioned Ballard v. ChannelAdvisor Corporation, Case No. 1:22-cv-01416-UNA. The fifth complaint was filed on October 28, 2022, in the United States District Court for the Southern District of New York and is captioned Riley v. ChannelAdvisor Corporation, Case No. 1:22-cv-09257. The aforementioned five complaints are collectively referred to as the "Complaints." The Complaints name as defendants ChannelAdvisor and each member of the Board, collectively referred to as the "ChannelAdvisor Defendants." The Complaints allege violations of Section 14(a) of the Exchange Act against all ChannelAdvisor Defendants and allege violations of Section 20(a) of the Exchange Act against the members of the Board in connection with disclosures made by the ChannelAdvisor Defendants related to the Merger. The Complaints seek, among other relief, (i) injunctive relief preventing the consummation of the Merger unless the ChannelAdvisor Defendants disclose certain information requested by the plaintiffs, (ii) rescission and/or rescissory damages in the event the Merger is consummated, and (iii) an award of plaintiffs' expenses and attorneys' fees. The ChannelAdvisor Defendants believe the claims in the Complaints are without merit and intend to vigorously defend the actions. ITEM 1A. RISK FACTORS
Our business is subject to numerous risks. Yourisks and events that, if they occur, could adversely affect our financial condition and results of operations and the trading price of our securities. In addition to the other information set forth in this quarterly report on Form 10-Q, you should carefully consider the followingfactors described in Part I, Item 1A. "Risk Factors" of our Annual Report on Form 10-K for the year ended December 31, 2021, filed with the SEC on February 10, 2022, for a detailed discussion of risk factors affecting us. Except for the risks related to our proposed acquisition by CommerceHub set forth below, our risk factors as well as general economicof the date of this report have not changed materially from those disclosed in our Annual Report on Form 10-K.
Risks Related to Our Proposed Transaction with CommerceHub
Failure to complete, or delays in completing, the proposed transaction with CommerceHub announced on September 6, 2022 could materially and business risks,adversely affect our results of operations and our stock price.
On September 4, 2022, we entered into the Merger Agreement with CommerceHub and CH Merger Sub, Inc., a Delaware corporation ("Merger Sub"), pursuant to which, subject to the terms and conditions of the Merger Agreement, if all of the conditions to closing are satisfied or waived, Merger Sub will be merged with and into our company with our company surviving as a wholly owned subsidiary of CommerceHub (the "Merger"). However, the consummation of the Merger is subject to certain closing conditions, some of which are not within our control and may prevent, delay, or otherwise materially adversely affect the completion of the Merger. We cannot predict with certainty whether and when any of the required closing conditions will be satisfied or if additional uncertainties may arise and cannot assure you that we will be able to successfully consummate the proposed Merger as currently contemplated under the Merger Agreement or at all. Risks related to the failure of the proposed Merger with CommerceHub to be consummated include, but are not limited to, the following:
•under some circumstances, we may be required to pay a termination fee to CommerceHub of $23 million;
•we have incurred, and will continue to incur, significant transaction costs, including legal, accounting, financial advisory and other information containedtransaction costs in this Quarterly Report on Form 10-Q, together with any other documents we fileconnection with the SEC. AnyMerger, and many of these fees and costs are payable by us regardless of whether the Merger is consummated;
•we may experience negative reactions from financial markets or the trading price of our common stock may decline to the extent that the current market price for our stock reflects a market assumption that the Merger will be completed;
•the possibility of disruption to our business, including diversion of management time and resources that could otherwise have been devoted to other opportunities that may have been beneficial to us, regardless of whether the Merger is consummated;
•the pendency and outcome of the legal proceedings that have been or may be instituted against us, our directors, executive officers and others relating to the transactions contemplated by the Merger Agreement; and
•under the Merger Agreement, we are generally required to conduct our business in the ordinary course, which could adversely impact our business, operating results and our stock price and our perceived acquisition value, regardless of whether the Merger is completed.
The occurrence of any of these events individually or in combination could materially and adversely affect our business, results of operations, financial condition, and our stock price. There can be no assurance that these risks will not materialize and will not materially adversely affect our stock price, business, financial conditions, results of operations or cash flows and if certain events occur, such as payment of the termination fee to CommerceHub or an increase in significant transaction costs in connection with the proposed Merger, our cash balances could be materially and adversely impacted and our options for sources of financing or refinancing could be more limited than if we had not pursued the proposed Merger.
Uncertainty about the Merger or negative publicity related to the Merger may adversely affect relationships with our customers, suppliers and employees, whether or not the merger is completed.
In response to the announcement of the Merger, our existing or prospective customers, vendors, suppliers, landlords and other business partners may:
•delay, defer, or cease their agreements or arrangements with, or providing products or services to us;
•delay or defer other decisions concerning us; or
•seek alternative relationships with third parties or otherwise seek to change the terms on which they do business with us.
Potential adverse effects on our relationships with our current customers, suppliers and other business partners, or those with which we are seeking to establish business relationships, due to uncertainties about the Merger could materially harm our business.
In addition, as a result of the Merger, there may be potential adverse effects on our ability to attract, recruit, retain, and motivate current and prospective employees who may be uncertain about their future roles and relationships with us following risksthe completion of the Merger, and the possibility that our employees could lose productivity as a result of uncertainty regarding their employment following the Merger. Key employees may depart because of issues relating to such uncertainty or a desire not to remain with CommerceHub following the completion of the Merger.
The pendency of the Merger may result in negative publicity and other adverse public statements about us and the Merger. Such negative publicity or adverse public statements, may also result in investigations by regulatory authorities, legislators and law enforcement officials or in legal claims. Addressing any adverse publicity, governmental scrutiny, investigation or enforcement or other legal proceedings is time consuming and expensive and can divert the time and attention of our senior management from the day-to-day operation of our business and execution of our other strategic initiatives. Further, regardless of the factual basis for the assertions being made or the ultimate outcome of any investigation or proceeding, any negative publicity can have an adverse impact on our reputation and on the morale and performance of our employees and on our relationships with regulatory authorities. It may also have an adverse impact on our ability to take timely advantage of various business and market opportunities. The direct and indirect effects of negative publicity, and the demands of responding to and addressing it, may have a material adverse effect on our business, financial condition, and results of operations.
Losses of customers or other important strategic relationships from any of the events described above could have a material adverse effect on our business, operating results of operations, and financial condition and causecondition. Such adverse effects could also be exacerbated by a delay in the trading pricecompletion of the Merger for any reason, including delays associated with obtaining requisite regulatory approvals or the approval of our common stockstockholders.
The Merger Agreement contains provisions that could discourage or deter a potential competing acquirer that might be willing to decline.pay more to effect a business combination with us.
RISKS RELATED TO OUR BUSINESS
We have incurred significant net losses since inception, and it is possibleThe Merger Agreement contains provisions that, subject to certain exceptions, limit our operating expenses will increaseability to solicit, initiate, or knowingly facilitate, or knowingly encourage any proposal or offer that constitutes, or would reasonably be expected to lead to, an alternative transaction or engage in, the foreseeable future, which may make it more difficult for uscontinue or otherwise participate in any negotiations or discussions regarding, or furnish information in response to achieve profitability.
We incurred net losses of $16.1 million and $8.0 million during the nine months ended September 30, 2017 and the year ended December 31, 2016, respectively, and we hadinquiries with respect to, an accumulated deficit of $179.7 million as of September 30, 2017.alternative transaction. It is possible that our operating expenses will increasethese or other provisions in the foreseeable future as we investMerger Agreement might discourage a potential competing acquirer that might have an interest in increased sales and marketing and research and development efforts. To achieve profitability, we will need to either increase our revenue sufficiently to offset increasing expenses or reduce our expense levels. Our recent revenue growth may not be sustainable, and if we are forced to reduce our expenses, our growth strategy could be compromised. If we are not able to achieve and maintain profitability, the value of our company and our common stock could decline significantly.
A significant portion of our revenue is attributable to sales by our customers on the Amazon and eBay marketplaces and through advertisements on Google. Our inability to continue to integrate our solutions with these channels would make our solutions less appealing to existing and potential new customers and could significantly reduce our revenue.
A substantial majority of the GMV that our customers process through our platform is derived from merchandise sold on the Amazon and eBay marketplaces or advertised on Google, and a similar portion of our variable subscription fees is attributable to sales by our customers through these channels. These channels, and the other channels with which our solutions are integrated, have no obligation to do business with us or to allow us access to their systems, and they may decide at any time and for any reason to significantly curtail or inhibit our ability to integrate our solutions with their channels. Additionally, Amazon, eBay or Google may decide to make significant changes to their respective business models, policies, systems or plans, and those changes could impair or inhibit our customers’ ability to use our solutions to sell their products on those channels, or may adversely affect the volume of GMV that our customers can sell on those channels or reduce the desirability of selling on those channels. Further, Amazon, eBay or Google could decide to compete with us more vigorously. Any of these results could cause our customers to reevaluate the value of our products and services and potentially terminate their relationships with us and significantly reduce our revenue.
We may not be able to respond to rapid changes in channel technologies or requirements, which could cause us to lose revenue and make it more difficult to achieve profitability.
The e-commerce market is characterized by rapid technological change and frequent changes in rules, specifications and other requirements for retailers and branded manufacturers to be able to sell their merchandise on particular channels, as well as developments in technologies that can impede the display and tracking of advertisements. Our ability to retain existing customers and attract new customers depends in large part on our ability to enhance and improve our existing solutions and introduce new solutions that can adapt quickly to these technological changes. To achieve market acceptance for our solutions, we must effectively anticipate and offer solutions that meet frequently changing channel requirements in a timely manner. If our solutions fail to do so, our ability to renew our contracts with existing customers and our ability to create or increase demand for our solutions will be impaired.
If we are unable to retain our existing customers, our revenue and results of operations could be adversely affected.
We sell our solutions pursuant to contractual arrangements that generally have one-year terms. Therefore, our revenue growth depends to a significant degree upon subscription renewals. Our customers have no obligation to renew their subscriptions after the subscription term expires, and these subscriptions may not be renewed or, if renewed, may not be renewed on the same or more favorable terms for us. We may not be able to accurately predict future trends in customer renewals, and our customers’ renewal rates may decline or fluctuate because of several factors, including their satisfaction or dissatisfaction with our solutions, the cost of our solutions, the cost of solutions offered by our competitors and reductions in our customers’ spending levels. If our customers do not renew their subscriptions, renew on less favorable terms or for fewer modules, or do not purchase additional modules, our revenue may grow more slowly than expected or decline, and our ability to become profitable may be compromised.
As more of our sales efforts are targeted at larger customers, our sales cycle may become more time-consuming and expensive, and we may encounter pricing pressure, which could harm our business and operating results.
The cost and length of our sales cycle varies by customer. As we target more of our sales efforts at selling to larger customers, we may face greater costs, longer sales cycles and less predictability in completing some of our sales. These types of sales often require us to provide greater levels of education regarding our solutions. In addition, larger customers may demand more training and other professional services. As a result of these factors, these sales opportunities may require us to devote greater sales support and professional services resources to individual customers, driving up costs and time required to complete sales and diverting sales and professional services resources to a smaller number of larger transactions.
We may not be able to compete successfully against current and future competitors. If we do not compete successfully, we could experience lower sales volumes and pricing pressure, which could cause us to lose revenues, impair our ability to pursue our growth strategy and compromise our ability to achieve profitability.
We face intense competition in the market for online channel management solutions and services, and we expect competition to intensify in the future. We have competitors, including some of the channels themselves, with longer operating histories, larger customer bases and greater financial, technical, marketing and other resources than we do. Increased competition may result in reduced pricing for our solutions, longer sales cyclesacquiring all or a decrease in our market share, any of which could negatively affect our revenue and future operating results and our ability to grow our business.
A number of competitive factors could cause us to lose potential sales or to sell our solutions at lower prices or at reduced margins, including:
Potential customers may choose to continue using or to develop applications in-house, rather than pay for our solutions;
The channels themselves, which typically offer software tools, often for free, that allow retailers and branded manufacturers to connect to them, may decide to compete more vigorously with us;
Competitors may adopt more aggressive pricing policies and offer more attractive sales terms, adapt more quickly to new technologies and changes in customer requirements, and devote greater resources to the promotion and sale of their products and services than we can;
Current and potential competitors have established or may establish cooperative relationships among themselves or with third parties to enhance their products and expand their markets, and consolidation in our industry is likely to intensify. Accordingly, new competitors or alliances among competitors may emerge and rapidly acquire significant market share;
Current and potential competitors may offer software that addresses one or more online channel management functions at a lower price point or with greater depth than our solutions and may be able to devote greater resources to those solutions than we can; and
Software vendors could bundle channel management solutions with other solutions or offer such products at a lower price as part of a larger product sale.
We may not be able to compete successfully against current and future competitors, including any channels that decide to compete against us more vigorously. In addition, competition may intensify as our competitors raise additional capital and as established companies in other market segments or geographic markets expand into our market segments or geographic markets. If we cannot compete successfully against our competitors, our business and our operating and financial results could be adversely affected.
If the e-commerce industry consolidates around a limited number of online channels, or if the complexities and challenges faced by retailers and branded manufacturers seeking to sell online otherwise diminish, demand for our solutions could decline.
Our solutions enable retailers and branded manufacturers to manage their merchandise sales through hundreds of disparate online channels. One of the key attractions of our solutions to retailers and branded manufacturers is the ability to help address the complexity and fragmentation of selling online. Although the number and variety of online channels available to retailers and branded manufacturers have been increasing, at the same time the share of online sales made through a small number of larger channels, particularly Amazon, has also been increasing. If the trend toward consolidation around a few large online channels accelerates, the difficulties faced by retailers and branded manufacturers could decline, which might make our solutions less important to retailers and branded manufacturers and could cause demand for our solutions to decline.
Our growth depends in part on the success of our strategic relationships with third parties.
We anticipate that we will continue to depend on our relationships with various third parties, including marketplaces and technology and content providers, in order to grow our business. Identifying, negotiating and documenting relationships with these third parties may require significant time and resources as does integrating their content and technology with our solutions. If the third-party content or technology integrated with our solutions is not well received by our customers, our brand and reputation could be negatively affected. Our agreements with third-party business partners are typically non-exclusive and do not prohibit them from working with our competitors or from offering competing services. If and to the extent that any of these third parties compete with us, it could hurt our growth prospects.
If the e-commerce market does not grow, or grows more slowly than we expect, particularly on the channels that our solutions support, demand for our online channel management solutions could be adversely affected.
For our existing customers and potential customers to be willing to subscribe to our solutions, the internet must continue to be accepted and widely used for selling merchandise. As e-commerce continues to evolve, regulation by federal, state or foreign agencies may increase. Any regulation imposing greater fees for internet use or restricting information exchanged over the internet could result in a decline in the use of the internet, which could harm our business.
In addition, if consumer utilization of our primary e-commerce channels, such as Amazon, eBay and Google, does not grow or grows more slowly than we expect, demand for our solutions would be adversely affected, our revenue would be negatively impacted and our ability to pursue our growth strategy and become profitable would be compromised.
Software errors, defects or failures or human error could cause our solutions to oversell our customers’ inventory or misprice their offerings or could cause other errors, which would hurt our reputation and reduce customer demand.
Complex software applications such as ours may contain errors or defects, particularly when first introduced or when new versions or enhancements are released. Despite our testing and testing by our customers, our current and future products may contain defects. Our customers rely on our solutions to automate the allocation of their inventory simultaneously across multiple online channels, as well as to ensure that their sales comply with the policies of each channel and sometimes to dynamically determine product pricing at any given moment. Some customers subscribe to our solutions on a managed-service basis, in which case our personnel operate our solutions on behalf of the customer. In the event that our solutions do not function properly, or if there is human error on the part of our service staff, errors could occur, including that our customers might inadvertently sell more inventory than they actually have in stock, make sales that violate channel policies or underprice or overprice their offerings. Overselling their inventory could force our customers to cancel orders at rates that violate channel policies. Underpricing would result in lost revenue to our customers and overpricing could result in lost sales. In addition, our pricing policies with our customers are largely based upon our customers’ expectations of the levels of their GMV that will be processed through our platform over the term of their agreement with us, and errors in our software or human error could cause transactions to be incorrectly processed that would cause GMV to be in excess of our customers’ specified minimum amounts, in which case our variable subscription fee-based revenue could be overstated. Any of these results or other errors could reduce demand for our solutions and hurt our business reputation. Customers could also seek recourse against us in these cases and, while our contractual arrangements with customers typically provide that we are not liable for damages such as these, it is possible that these provisions would not be sufficient to protect us.
If the use of "cookie" tracking technologies is restricted, regulated or otherwise blocked, or if changes in our industry cause cookies to become less reliable or acceptable as a means of tracking consumer behavior, the amount or accuracy of GMV processed on our platform, and our related revenue, could decrease.
Cookies are small data files that are sent by websites and stored locally on an internet user's computer or mobile device. Our customers enable cookies on their sites and monitor internet user activity, such as viewing pages and completing transactions. We collect data via cookies that we ultimately use to report GMV, which translates to revenue. However, internet users can easily disable, delete and block cookies directly through browser settings or through other software, browser extensions or hardware platforms that physically block cookies from being created and stored.
Third-party cookies are downloaded from domains not associated with the address currently being viewed in an internet user's browser. Cookies can be specifically blocked by browser settings, and, for example, the Safari internet browser blocks third-party cookies by default. Internet users can also download free or paid “ad blocking” software that prevents third-party cookies from being stored on a user’s device. On the other hand, first-party cookies are downloaded directly from the address domain of an internet user, and are generally considered safer by privacy concerns. We currently collect data from both first-party and third-party cookie implementations. Our customers currently implementing our third-party cookie solution might be slow to migrate their sites to first-party cookie technologies, which could result in less cookie data that we can collect, and therefore less reported revenue data that we can store.
Privacy regulations might also restrict how our customers deploy our cookies on their sites, and this could potentially increase the number of internet users that choose to proactively disable cookies on their systems. In the European Union, the Directive on Privacy and Electronic Communications requires users to give their consent before cookie data can be stored on their local computer or mobile device. Users can decide to opt out of any cookie data creation, which could negatively impact the revenue we might recognize.
There have been efforts within our industry to replace cookies with alternative tracking technologies. To the extent these efforts are successful, we may have difficulty adapting to those new tracking technologies and we may become dependent on third parties for access to tracking data.
We may have to develop alternative systems to collect user revenue data if users block cookies or regulations introduce barriers to collecting cookie data. In addition, third parties may develop technology or policies to harvest user data including through next-generation web browsers or other means, which could subsequently prevent us from directly importing data to our systems. We may not be able to develop adequate alternatives to cookie data collection, which could negatively impact our ability to reliably measure GMV.
We rely on non-redundant data centers and cloud computing providers to deliver our SaaS solutions. Any disruption of service from these providers could harm our business.
We manage our platform and serve all of our customers from third-party data center facilities and cloud computing providers that are non-redundant, meaning that the data centers and providers are currently not configured as backup for each other. While we engineer and architect the actual computer and storage systems upon which our platform runs, we do not control the operation of the facilities at which they are deployed.
The owners of our data facilities have no obligation to renew their agreements with us on commercially reasonable terms, or at all. If we are unable to renew these agreements on commercially reasonable terms, we may be required to transfer to new data center facilities, and we may incur significant costs and possible service interruption in connection with doing so.
Any changes in third-party service levels at our data centers or any errors, defects, disruptions or other performance problems with our solutions could harm our reputation and damage our customers’ businesses. Interruptions in our services could reduce our revenue, require us to issue credits to customers, subject us to potential liability, cause our existing customers to not renew their agreements or adversely affect our ability to attract new customers.
Our data centers and cloud computing providers are vulnerable to damage or interruption from human error, intentional bad acts, earthquakes, hurricanes, floods, fires, war, terrorist attacks, power losses, hardware failures, systems failures, telecommunications failures, cyber-attacks and similar events. The occurrence of a natural disaster or an act of terrorism, or vandalism or other misconduct, a decision to close the facilities without adequate notice or other unanticipated problems could result in lengthy interruptions in the availability of our SaaS solutions or impair their functionality. Our business, growth prospects and operating results would also be harmed if our customers and potential customers are not confident that our solutions are reliable.
We rely in part on a pricing model under which a variable portion of the subscription fees we receive from customers is based upon the amount of GMV or advertising spend that those customers process through our platform, and any change in the attractiveness of that model or any decline in our customers’ sales could adversely affect our financial results.
We have adopted a pricing model under which a portion of the subscription fees we receive from most of our customers is variable, based on the amount of our customers’ GMV or advertising spend processed through our platform that exceeds a specified amount established by contract, which we refer to as variable subscription fees. Most of our customer contracts include this variable subscription fee component. If sales or advertising spend by our customers processed through our platform were to decline, or if more of our customers require fully fixed pricing terms that do not provide for any variability based on their GMV or advertising spend processed through our platform, our revenue and margins could decline.
Our quarterly operating results have fluctuated in the past and may do so in the future, which could cause our stock price to decline.
Our operating results have historically fluctuated due to changes in our business, and our future operating results may vary significantly from quarter to quarter due to a variety of factors, many of which are beyond our control. You should not rely on period-to-period comparisons of our operating results as an indication of our future performance. Factors that may cause fluctuations in our quarterly operating results include, but are not limited to, the following:
seasonal patterns in consumer spending;
the addition of new customers or the loss of existing customers;
changes in demand for our software;
the timing and amount of sales and marketing expenses;
changes in the prospects of the economy generally, which could alter current or prospective customers’ spending priorities, or could increase the time it takes us to close sales;
changes in our pricing policies or the pricing policies of our competitors;
costs necessary to improve and maintain our software platform; and
costs related to acquisitions of other businesses.
Our operating results may fall below the expectations of market analysts and investors in some future periods, which could cause the market price of ouroutstanding common stock to decline substantially.from considering or proposing an acquisition.
The seasonality of our business creates significant variance in our quarterly revenue, which makes it difficult to compare our financial results on a sequential quarterly basis.
Our customers are retailers and branded manufacturers that typically realize a significant portion of their online sales in the fourth quarter of each year during the holiday season. As a result of this seasonal variation, our subscription revenue fluctuates, with the variable portion of our subscription fees being higher in the fourth quarter than in other quarters and with revenue generally declining in the first quarter sequentially from the fourth quarter. Our business is therefore not necessarily comparable on a sequential quarter-over-quarter basis and you should not rely solely on quarterly comparisons to analyze our growth.
Failure to adequately manage our growth could impair our ability to deliver high-quality solutions to our customers, hurt our reputation and compromise our ability to become profitable.
WeLawsuits have experienced,been, and may continue to experience, significant growth in our business. If we do not effectively manage our growth,be, filed against us and the quality of servicemembers of our solutionsboard of directors arising out of the proposed Merger, which may suffer, which could negatively affectdelay or prevent the proposed Merger.
Putative stockholder complaints, including stockholder class action complaints, and other complaints may be filed against us, our reputationboard of directors, CommerceHub, CommerceHub's board of directors, and demandothers in connection with the transactions contemplated by the Merger Agreement. As of November 7, 2022, five complaints were filed in federal court by purported ChannelAdvisor stockholders regarding the Merger. The first complaint was filed on September 28, 2022, in the United States District Court for our solutions. Our growth has placed,the Southern District of New York and is expectedcaptioned Stein v. ChannelAdvisor Corporation, Case No. 1:22-cv-08282. The second complaint was filed on September 29, 2022, in the United States District Court for the Southern District of New York and is captioned O'Dell v. ChannelAdvisor Corporation, Case No. 1:22-cv-08334. The third complaint was filed on October 25, 2022, in the United States District Court for the Southern District of New York and is captioned Weiss v. ChannelAdvisor Corporation, Case No. 1:22-cv-09129. The fourth complaint was filed on October 26, 2022, in the United States District Court for the District of Delaware and is captioned Ballard v. ChannelAdvisor Corporation, Case No. 1:22-cv-01416-UNA. The fifth complaint was filed on October 28, 2022, in the United States District Court for the Southern District of New York and is captioned Riley v. ChannelAdvisor Corporation, Case No. 1:22-cv-09257. The aforementioned five complaints are collectively referred to continueas the "Complaints." The Complaints name as defendants ChannelAdvisor and each member of the Board, collectively referred to place, a significant strain on our managerial, operationalas the "ChannelAdvisor Defendants." The Complaints allege violations of Section 14(a) of the Exchange Act against all ChannelAdvisor Defendants and financial resources and our infrastructure. Our future success will depend,allege violations of Section 20(a) of the Exchange Act against the members of the Board in part, uponconnection with disclosures made by the ability of our senior managementChannelAdvisor Defendants related to manage growth effectively. This will require us to,the Merger. The Complaints seek, among other things:relief, (i) injunctive relief preventing the consummation of the Merger unless the ChannelAdvisor Defendants disclose certain information requested by the plaintiffs, (ii) rescission and/or rescissory damages in the event the Merger is consummated, and (iii) an award of plaintiffs' expenses and attorneys' fees. The ChannelAdvisor Defendants believe the claims in the Complaints are without merit and intend to vigorously defend the actions.
hire additional personnel, both domesticallyThe outcome of litigation is uncertain, and internationally;
implement additional management information systems;
maintain close coordination among our engineering, operations, legal, finance, sales and marketing and client service and support organizations; and
further develop our operating, administrative, legal, financial and accounting systems and controls.
Moreover, if our sales continue to increase, we may be required to concurrently deploy our hosting infrastructure at multiple additional locations or provide increased levels of customer service. Failure to accomplish any of these requirements could impair our ability to continue to deliver our solutions in a timely fashion, fulfill existing customer commitments or attract and retain new customers.
If we do not retain our senior management team and key employees, or if we fail to attract and retain additional highly skilled sales talent, we may not be able to sustain our growthsuccessful in defending against the current claims or achieve our business objectives.
Ourany such future success is substantially dependent on the continued service of our senior management team. Our future success also depends on our ability to continue to attract, retain, integrate and motivate highly skilled technical, sales and administrative employees. Competition for these employees in our industry is intense. As a result, weclaims. Lawsuits that have been or may be unable to attractfiled against us, our board of directors, CommerceHub, or retain these management and other key personnel that are critical to our success, resulting in harm to our key client relationships, lossCommerceHub’s board of key information, expertisedirectors could delay or know-how and unanticipated recruitment and training costs. The loss ofprevent the services of our senior management or other key employees could make it more difficult to successfully operate our business and pursue our business goals.
Our business and growth objectives also may be hindered if our efforts to expand our sales team do not generate a corresponding increase in revenue. In particular, if we are unable to hire, develop and retain talented sales personnel or if our new sales personnel are unable to achieve expected productivity levels in a reasonable period of time, we may not be able to significantly increase our revenue and grow our business.
Our strategy of pursuing opportunistic acquisitions or investments may be unsuccessful and mayMerger, divert our management’s attention and consume significant resources.
A part of our growth strategy is to opportunistically pursue acquisitions of, or investments in, other complementary businesses or individual technologies. Any acquisition or investment may require us to use significant amounts of cash, issue potentially dilutive equity securities or incur debt. In addition, acquisitions involve numerous risks, any of which could harm our business, including:
difficulties in integrating the operations, technologies, services and personnel of acquired businesses, especially if those businesses operate outside of our core competency of providing e-commerce software solutions;
cultural challenges associated with integrating employees from acquired businesses into our organization;
ineffectiveness or incompatibility of acquired technologies or services;
failure to successfully further develop the acquired technology in order to recoup our investment;
potential loss of key employees of acquired businesses;
inability to maintain the key business relationships and the reputations of acquired businesses;
diversion of management’s attention from other business concerns;
litigation for activities of acquired businesses, including claims from terminated employees, customers, former stockholders or other third parties;
in the case of foreign acquisitions, the need to integrate operations across different cultures and languages and to address the particular economic, currency, political and regulatory risks associated with specific countries;
costs necessary to establish and maintain effective internal controls for acquired businesses; and
increased fixed costs.
If current efforts to allow states to require online retailers to collect sales tax on their behalf are successful, e-commerce in general could decline, our solutions could become less attractive and the amount of GMV processed through our platform, and our related revenue, could decline.
Although current U.S. Supreme Court decisions restrict the imposition of obligations to collect state and local sales taxes with respect to remote sales, an increasing number of states have considered or adopted laws that attempt to require out-of-state retailers to collect sales taxes on their behalf. In addition, the U.S. Senate and the U.S. House of Representatives are currently considering a variety of legislation, most notably the Marketplace Fairness Act, which would override the Supreme Court rulings and enable states to require that online retailers collect sales tax from the states’ residents. Some larger online retailers, including Amazon, have announced their support for legislation along these lines. This is a rapidly evolving area and we cannot predict whether this or other similar legislation will ultimately be adopted or what form it might take if adopted. For example, the current Senate and House legislation includes an exception for small retailers, although there can be no assurance that any legislation ultimately adopted would include such an exception. If the states or Congress are successful in these attempts to require online retailers to collect state or local sales taxes on out-of-state purchases, buying online would lose some of its current advantage over traditional retail models and could become less attractive to consumers. This could cause e-commerce to decline, which would, in turn, hurt the business of our customers, potentially make our products less attractive and cause the amount of GMV processed through our platform, and ultimately our revenue, to decline. In addition, it is possible that one or more states or the federal government or foreign countries may seek to impose a tax collection, reporting or record-keeping obligation on companies like us that facilitate e-commerce, even though we are not an online retailer. Similar issues exist outside of the United States, where the application of value-added tax or other indirect taxes on online retailers and companies like us that facilitate e-commerce is uncertain and evolving.
We may be subject to additional obligations to collect and remit sales tax and other taxes, and we may be subject to tax liability for past sales, which could harm our business.
State, local and foreign jurisdictions have differing rules and regulations governing sales, use, value added and other taxes, and these rules and regulations are subject to varying interpretations that may change over time. In particular, the applicability of such taxes to our platform in various jurisdictions is unclear. Further, these jurisdictions’ rules regarding tax nexus are complex and vary significantly. As a result, we could face the possibility of tax assessments and audits, and our liability for these taxes and associated penalties could exceed our original estimates. As described in this report, we have entered into voluntary disclosure agreements, or VDAs, with certain jurisdictions and have recorded a $2.5 million one-time charge in general and administrative expense for the nine months ended September 30, 2017. If any of the tax authorities rejects our VDA applications or offers terms that are other than what we are anticipating, or if the VDAs do not resolve all potential unpaid sales tax obligations, then it is possible that the actual aggregate unpaid sales tax liability may be higher or lower than our estimate. Through September 30, 2017, we have paid approximately $0.9 million under the terms of the VDAs that we have completed with certain jurisdictions. During the third quarter of 2017, a jurisdiction rejected our VDA application and will be conducting a sales tax audit, which we believe will be limited in a manner similar in principle to the VDA program. Any successful assertion that we should have collected additional sales, use, value added or other taxes in those jurisdictions where we have not historically done so and do not accrue for such taxes could result in substantial tax liabilities and related penalties for past sales, discourage customers from purchasing our application or otherwise harm our business and operating results.
Evolving domestic and international data privacy regulations may restrict our ability, and that of our customers, to solicit, collect, process, disclose and use personal information or may increase the costs of doing so, which could harm our business.
Federal, state and foreign governments and supervising authorities have enacted, and may in the future enact, laws and regulations concerning the solicitation, collection, processing, disclosure or use of consumers’ personal information. Evolving regulations regarding personal data and personal information, in the European Union and elsewhere, especially relating to classification of IP addresses, machine identification, location data and other information, may limit or inhibit our ability to operate or expand our business. Such laws and regulations require or may require us or our customers to implement privacy and security policies, permit consumers to access, correct or delete personal information stored or maintained by us or our customers, inform individuals of security incidents that affect their personal information, and, in some cases, obtain consent to use personal information for specified purposes. Other proposed legislation could, if enacted, impose additional requirements and prohibit the use of specific technologies, such as those that track individuals’ activities on web pages or record when individuals click on a link contained in an email message. Such laws and regulations could restrict our customers’ ability to collect and use web browsing data and personal information, which may reduce our customers’ demand for our solutions.
Changing industry standards and industry self-regulation regarding the collection, use and disclosure of data may have similar effects. Existing and future privacy and data protection laws and increasing sensitivity of consumers to unauthorized disclosures and use of personal information may also negatively affect the public’s perception of our customers’ sales practices.
If our solutions are perceived to cause, or are otherwise unfavorably associated with, invasions of privacy, whether or not illegal, we or our customers may be subject to public criticism. Public concerns regarding data collection, privacy and security may also cause some consumers to be less likely to visit our customers’ websites or otherwise interact with our customers, which could limit the demand for our solutions and inhibit the growth of our business.
Any failure on our part to comply with applicable privacy and data protection laws, regulations, policies and standards or any inability to adequately address privacy concerns associated with our solutions, even if unfounded, could subject us to liability, damage our reputation, impair our sales and harm our business. Furthermore, the costs to our customers of compliance with, and other burdens imposed by, such laws, regulations, policies and standards may limit adoption of and demand for our solutions.
Cybersecurity incidents could harm our business and negatively impact our financial results.
Cybersecurity incidents could endanger the confidentiality, integrity and availability of our information resources and the information we collect, use, store and disclose. These incidents may be an intentional attack or an unintentional event and could involve gaining unauthorized access to our information systems for purposes of misappropriating assets, stealing confidential information, corrupting data or causing operational disruption. We believe that we take reasonable steps to protect the security, integrity and confidentiality of the information we collect, use, store, and disclose, but there is no guarantee that inadvertent or unauthorized data access will not occur despite our efforts. For example, we could be impacted by software bugs or other technical malfunctions, as well as employee error or malfeasance. Any unauthorized access or use of information, virus or similar breach or disruption to our, our customers’, or our partners’ systems and security measures could result in disrupted operations, loss of information, damage to our reputation and customer relationships, early termination of our contracts and other business losses, indemnification of our customers, misstated or unreliable financial data, liability for stolen assets or information, increased cybersecurity protection and insurance costs, financial penalties, litigation, regulatory investigations, and other significant liabilities, any of which could materially harm our business.
RISKS RELATED TO THE SOFTWARE-AS-A-SERVICE (SAAS) MODEL
If we fail to manage and increase the capacity of our hosted infrastructure, our customers may be unable to process transactions through our platform, which could harm our reputation and demand for our solutions.
We have experienced significant growth in the number of users, transactions and data that our hosting infrastructure supports. We seek to maintain sufficient excess capacity in our hosted infrastructure to be sufficiently flexible and scalable to meet the needs of all of our customers. We also seek to maintain excess capacity to facilitate the rapid provision of new customer deployments and the expansion of existing customer deployments and to handle spikes in usage. However, the provision of new hosting infrastructure requires significant lead time. If we do not accurately predict our infrastructure capacity requirements, particularly in the fourth quarter when we typically experience significant increases in the volume of customer transactions processed through our platform, our customers could experience service outages that may subject us to financial penalties or other liabilities, result in customer losses, harm our reputation and adversely affect our ability to grow our revenue.
We derive most of our revenue from annual subscription agreements, as a result of which a significant downturn in our business may not be immediately reflected in our operating results.
We derive most of our revenue from subscription agreements, which are typically one year in length. As a result, a significant portion of the revenue we report in each quarter is generated from customer agreements entered into during previous periods. Consequently, a decline in new or renewed subscriptions in any one quarter may not be reflected in our financial performance in that quarter but might negatively affect our revenue in future quarters. Accordingly, the effect of significant declines in sales and market acceptance of our solutions may not be reflected in our short-term results of operations.
Our business is substantially dependent upon the continued growth of the market for on-demand SaaS solutions. If this market does not continue to grow, demand for our solutions could decline, which in turn could cause our revenues to decline and impair our ability to become profitable.
We derive, and expect to continue to derive, substantially all of our revenue from the sale of our solutions, which are delivered under a SaaS model. As a result, widespread use and acceptance of this business model is critical to our future growth and success. Under the more traditional license model for software procurement, users of the software typically run the applications in-house on their own hardware. Because many companies are generally predisposed to maintaining control of their information technology systems and infrastructure, there may be resistance to the concept of accessing software functionality as a service provided by a third party. In addition, the market for SaaS solutions is still evolving, and existing and new market participants may introduce new types of solutions and different approaches to enable organizations to address their
needs. If the market for SaaS solutions fails to grow or grows more slowly than we currently anticipate, demand for our solutions and our revenue, gross margin and other operating results could be negatively impacted.
RISKS RELATED TO OUR INTERNATIONAL OPERATIONS
Our increasing international operations subject us to increased challenges and risks. If we do not successfully manage the risks associated with international operations, we could experience a variety of costs and liabilities and the attention of our management could be diverted.and employees from our day-to-day business, result in substantial costs to us, and otherwise adversely affect our business, results of operations and financial condition.
Since launching our international operations in 2004, we have expanded, and expect to further expand, our operations internationally by opening offices in new countries and regions worldwide. However, ourThe ability to manage our business and conduct our operations internationally requires considerable management attention and resources andcomplete the Merger is subject to the particular challengesreceipt of supporting a rapidly growing business in an environment of multiple languages, cultures, customs, taxation systems, alternative dispute systems, regulatory systemsconsents and commercial infrastructures. International expansion will require us to invest significant fundsapprovals from government entities and other resources. Expanding internationallypotential challenges, that may subject usresult in a delay, prohibition or abandonment of the Merger.
Completion of the Merger is conditioned upon, among other things, the expiration or termination of the required waiting periods (and any extension thereof) applicable to new risksthe Merger under the Hart-Scott-Rodino Antitrust Improvements Act of 1976, as amended, and the rules and regulations promulgated thereunder, or the HSR Act, and the absence of a Legal Restraint that has the effect of enjoining or prohibiting the Merger. In deciding whether to grant antitrust approvals, the United States Federal Trade Commission, or the FTC, or the Department of Justice Antitrust Division, or DOJ, and other regulatory agencies will consider the effect of the Merger on competition. The FTC, DOJ, or other regulatory agencies may condition their approval of the Merger on CommerceHub's or our agreement to various requirements, limitations, or costs, or require divestitures or place restrictions on the conduct of CommerceHub's business following the Merger. We cannot provide any assurance that we have not faced before or increase risks that we currently face, including risks associated with:
recruiting and retaining employees in foreign countries;
increased competition from local providers;
compliance with applicable foreign laws and regulations;
longer sales or collection cycles in some countries;
credit risk and higher levels of payment fraud;
compliance with anti-bribery laws, such as the Foreign Corrupt Practices Act;
currency exchange rate fluctuations;
foreign exchange controls that might prevent us from repatriating cash earned outside the United States;
economic and political instability in some countries, including terrorist attacks and civil unrest;
less protective intellectual property laws;
compliance with the laws of numerous foreign taxing jurisdictions in which we conduct business, potential double taxation of our international earnings and potentially adverse tax consequences due to changes in applicable U.S. and foreign tax laws;
increased costs to establish and maintain effective controls at foreign locations; and
overall higher costs of doing business internationally.
If our revenue from our international operations does not exceed the expense of establishing and maintaining these operations, our business and operating resultsCommerceHub will suffer.
We are subject to governmental export and import controls that could impair our ability to compete in international markets due to licensing requirements and subject us to liability if we are not in full compliance with applicable laws.
Our solutions are subject to export controls, including the Commerce Department’s Export Administration Regulations and various economic and trade sanctions regulations established by the Treasury Department’s Office of Foreign Assets Controls, and exports of our solutions must be made in compliance with these laws. If we fail to comply with these U.S. export control laws and import laws, including U.S. Customs regulations, we could be subject to substantial civil or criminal penalties, including the possible loss of export or import privileges, fines, which may be imposed on us and responsible employees or managers, and, in extreme cases, the incarceration of responsible employees or managers. Obtainingobtain the necessary authorizations, including any required license, for a particular sale mayapprovals and that no Legal Restraint will be time-consuming, is not guaranteed andimposed. In addition, these requirements, limitations, costs, divestitures, or restrictions may result in the delay or lossabandonment of sales opportunities.the Merger.
Furthermore,As previously disclosed in a Form 8-K filed October 20, 2022, at 11:59 p.m., Eastern Time, on October 19, 2022, the U.S. export control laws and economic sanctions laws prohibitwaiting period applicable to the shipment or exportMerger under the HSR Act expired. Accordingly, the portion of specified products and servicesthe conditions to U.S. embargoed or sanctioned countries, governments and persons. Even though we take precautions to prevent our solutions from being provided to U.S. sanctions targets, if our solutions and services were to be exported to those prohibited countries despite such precautions, we could be subject to government investigations, penalties, reputational harm or other negative consequences.
Any change in export or import regulations, economic sanctions or related laws, shift in the enforcement or scope of existing regulations, or change in the countries, governments, persons or technologies targeted by such regulations, could result in decreased use of our solutions, or in our decreased ability to export or sell our solutions to existing or potential customers with international operations. Additionally, changes in our solutions may be required in response to changes in export and import regulations, which could lead to delays in the introduction and sale of our solutions in international markets, prevent our customers with international operations from deploying our solutions or, in some cases, prevent the export or import of our solutions to some countries, governments or persons altogether. Any decreased use of our solutions or limitation on our ability to export our solutions or sell them in international markets would hurt our revenue and compromise our ability to pursue our growth strategy.
RISKS RELATED TO INTELLECTUAL PROPERTY
We operate in an industry with extensive intellectual property litigation. Claims of infringement against us may hurt our business.
Our success depends, in part, upon non-infringement of intellectual property rights owned by others and being able to resolve claims of intellectual property infringement without major financial expenditures or adverse consequences. The internet-related software field generally is characterized by extensive intellectual property litigation. Although our industry is rapidly evolving, many companies that own, or claim to own, intellectual property have aggressively asserted their rights. From time to time, we have been subject to legal proceedings and claimsMerger relating to the intellectual property rights of others, and we expect that third parties will continue to assert intellectual property claims against us, particularly as we expand the complexity and scope of our business. In addition, most of our subscription agreements require us to indemnify our customers against claims that our solutions infringe the intellectual property rights of third parties.
Future litigation may be necessary to defend ourselvesexpiration or our customers by determining the scope, enforceability and validity of third-party proprietary rights or to establish our proprietary rights. Some of our competitors have substantially greater resources than we do and are able to sustain the costs of complex intellectual property litigation to a greater degree and for longer periods of time than we could. In addition, patent holding companies that focus solely on extracting royalties and settlements by enforcing patent rights may target us. Regardless of whether claims that we are infringing patents or other intellectual property rights have any merit, these claims are time-consuming and costly to evaluate and defend and could:
hurt our reputation;
adversely affect our relationships with our current or future customers;
cause delays or stoppages in providing our services;
divert management’s attention and resources;
require technology changes to our software that would cause us to incur substantial cost;
subject us to significant liabilities; and
require us to cease some or all of our activities.
In addition to liability for monetary damages against us, which may be tripled and may include attorneys’ fees, or, in some circumstances, damages against our customers, we may be prohibited from developing, commercializing or continuing to provide some or all of our software solutions unless we obtain licenses from, and pay royalties to, the holderstermination of the patents or other intellectual property rights, which may not be available on commercially favorable terms, or at all.
Our failure to protect our intellectual property rights could diminish the value of our services, weaken our competitive position and reduce our revenue.
We regard the protection of our intellectual property, which includes trade secrets, copyrights, trademarks, domain names and patent applications, as critical to our success. We strive to protect our intellectual property rights by relying on federal, state and common law rights, as well as contractual restrictions. We enter into confidentiality and invention assignment agreements with our employees and contractors, and confidentiality agreements with parties with whom we conduct business in order to limit access to, and disclosure and use of, our proprietary information. However, these contractual arrangements and the other steps we have taken to protect our intellectual property may not prevent the misappropriation of our proprietary information or deter independent development of similar technologies by others.
We have received patent protection for some of our technologies and are seeking patent protection for other of our technologies but there can be no assurance that any patents will ultimately be issued. We have registered domain names, trademarks and service marks in the United States and in jurisdictions outside the United States and are also pursuing additional
registrations both in and outside the United States. Effective trade secret, copyright, trademark, domain name and patent protection is expensive to develop and maintain, both in terms of initial and ongoing registration requirements and the costs of defending our rights. We may be required to protect our intellectual property in an increasing number of jurisdictions, a process that is expensive and may not be successful or which we may not pursue in every location. We may, over time, increase our investment in protecting our intellectual property through additional patent filings that could be expensive and time-consuming.
We have licensed in the past, and expect to license in the future, some of our proprietary rights, such as trademarks or copyrighted material, to third parties. These licensees may take actions that diminish the value of our proprietary rights or harm our reputation.
Monitoring unauthorized use of our intellectual property is difficult and costly. Our efforts to protect our proprietary rights may not be adequate to prevent misappropriation of our intellectual property. Further, we may not be able to detect unauthorized use of, or take appropriate steps to enforce, our intellectual property rights. Our competitors may also independently develop similar technology. In addition, the laws of many countries, such as China and India, do not protect our proprietary rights to as great an extent as do the laws of European countries and the United States. Further, the laws in the United States and elsewhere change rapidly, and any future changes could adversely affect us and our intellectual property. Our failure to meaningfully protect our intellectual property could result in competitors offering services that incorporate our most technologically advanced features, which could seriously reduce demand for our software solutions. In addition, we may in the future need to initiate infringement claims or litigation. Litigation, whether we are a plaintiff or a defendant, can be expensive, time-consuming and may divert the efforts of our technical staff and managerial personnel, which could harm our business, whether or not such litigation results in a determination that is unfavorable to us. In addition, litigation is inherently uncertain, and thus we may not be able to stop our competitors from infringing upon our intellectual property rights.
Our use of “open source” software could negatively affect our ability to sell our solutions and subject us to possible litigation.
A portion of our technology platform and our solutions incorporates so-called “open source” software, and we may incorporate additional open source software in the future. Open source software is generally licensed by its authors or other third parties under open source licenses. If we fail to comply with these licenses, we may be subject to specified conditions, including requirements that we offer our solutions that incorporate the open source software for no cost, that we make available source code for modifications or derivative works we create based upon, incorporating or using the open source software and that we license such modifications or derivative workswaiting period under the terms of the particular open source license. If an author or other third party that distributes open source software we use were to allege that we had not complied with the conditions of one or more of these licenses, we could be required to incur significant legal expenses defending against such allegations and could be subject to significant damages, including being enjoined from the sale of our solutions that contained the open source software and required to comply with the foregoing conditions, which could disrupt the sale of the affected solutions. In addition, there have been claims challenging the ownership of open source software against companies that incorporate open source software into their products. As a result, we could be subject to suits by parties claiming ownership of what we believe to be open source software. Litigation could be costly for us to defend, have a negative effect on our operating results and financial condition and require us to devote additional research and development resources to change our products.
RISKS RELATED TO OWNERSHIP OF OUR COMMON STOCK
An active trading market for our common stock may not continue to develop or be sustained.
Although our common stock is listed on the New York Stock Exchange, or NYSE, we cannot assure you that an active trading market for our shares will continue to develop or be sustained. If an active market for our common stock does not continue to develop or is not sustained, it may be difficult for investors in our common stock to sell shares without depressing the market price for the shares or to sell the shares at all.
The trading price of the shares of our common stockHSR Act has been and is likelysatisfied. The Merger continues to continue to be volatile.
Our stock price has been volatile. The stock market in general and the market for technology companies in particular have experienced extreme volatility that has often been unrelated to the operating performance of particular companies. As a result of this volatility, investors may not be able to sell their common stock at or above the price paid for the shares. The market price for our common stock may be influenced by many factors, including:
actual or anticipated variations in our operating results;
changes in financial estimates by us or by any securities analysts who might cover our stock;
conditions or trends in our industry;
stock market price and volume fluctuations of comparable companies and, in particular, those that operate in the software industry;
announcements by us or our competitors of new product or service offerings, significant acquisitions, strategic partnerships or divestitures;
announcements of investigations or regulatory scrutiny of our operations or lawsuits filed against us;
capital commitments;
investors’ general perception of our company and our business;
recruitment or departure of key personnel; and
sales of our common stock, including sales by our directors and officers or specific stockholders.
In addition, in the past, stockholders have initiated class action lawsuits against technology companies following periods of volatility in the market prices of these companies’ stock. In 2015, two purported class action complaints were filed alleging violations of the federal securities laws against a group of defendants including us and certain of our executive officers. The consolidated case was dismissed in April 2016, and the dismissal was affirmed by the U.S. Court of Appeals for the Fourth Circuit in November 2016. New litigation, if instituted against us, could cause us to incur substantial costs and divert management’s attention and resources from our business.
If equity research analysts do not publish research or reports, or publish unfavorable research or reports, about us, our business or our market, our stock price and trading volume could decline.
The trading market for our common stock is influenced by the research and reports that equity research analysts publish about us and our business. As a newly public company, we have only limited research coverage by equity research analysts. Equity research analysts may elect not to initiate or continue to provide research coverage of our common stock, and such lack of research coverage may adversely affect the market price of our common stock. Even if we have equity research analyst coverage, we will not have any control over the analysts or the content and opinions included in their reports. The price of our stock could decline if one or more equity research analysts downgrade our stock or issue other unfavorable commentary or research. If one or more equity research analysts ceases coverage of our company or fails to publish reports on us regularly, demand for our stock could decrease, which in turn could cause our stock price or trading volume to decline.
The issuance of additional stock in connection with financings, acquisitions, investments, our stock incentive plans or otherwise will dilute all other stockholders.
Our certificate of incorporation authorizes us to issue up to 100,000,000 shares of common stock and up to 5,000,000 shares of preferred stock with such rights and preferences as may be determined by our board of directors. Subject to compliance with applicable rules and regulations, we may issue our shares of common stock or securities convertible into our common stock from time to time in connection with a financing, acquisition, investment, our stock incentive plans or otherwise. Any such issuance could result in substantial dilution to our existing stockholders and cause the trading price of our common stock to decline.
Provisions in our corporate charter documents and under Delaware law may prevent or frustrate attempts by our stockholders to change our management and hinder efforts to acquire a controlling interest in us, and the market price of our common stock may be lower as a result.
There are provisions in our certificate of incorporation and bylaws that may make it difficult for a third party to acquire, or attempt to acquire, control of our company, even if a change in control was considered favorable by some or all of our stockholders. For example, our board of directors has the authority to issue up to 5,000,000 shares of preferred stock. The board of directors can fix the price, rights, preferences, privileges and restrictions of the preferred stock without any further vote or action by our stockholders. The issuance of shares of preferred stock may delay or prevent a change in control transaction. As a result, the market price of our common stock and the voting and other rights of our stockholders may be adversely affected. An issuance of shares of preferred stock may result in the loss of voting control to other stockholders.
Our charter documents also contain other provisions that could have an anti-takeover effect, including:
only one of our three classes of directors is elected each year;
| |
• | stockholders are not entitled to remove directors other than by a 66 2/3% vote and only for cause;
|
stockholders are not permitted to take actions by written consent;
stockholders cannot call a special meeting of stockholders; and
stockholders must give advance notice to nominate directors or submit proposals for consideration at stockholder meetings.
In addition, we are subject to the anti-takeover provisions of Section 203 of the Delaware General Corporation Law, which regulates corporate acquisitions by prohibiting Delaware corporations from engaging in specified business combinations with particular stockholders of those companies. These provisions could discourage potential acquisition proposals and could delay or prevent a change in control transaction. They could also have the effect of discouraging others from making tender offers for our common stock, including transactions that may be in your best interests. These provisions may also prevent changes in our management or limit the price that investors are willing to pay for our stock.
We are an “emerging growth company” and as a result of the reduced disclosure and governance requirements applicable to emerging growth companies, our common stock may be less attractive to investors.
We are an “emerging growth company” as defined in the Jumpstart Our Business Startups Act of 2012, or the JOBS Act, and we intend to take advantage of some of the exemptions from reporting requirements that are applicable to other public companies that are not emerging growth companies, including not being required to comply with the auditor attestation requirements of Section 404 of the Sarbanes-Oxley Act of 2002, or the Sarbanes-Oxley Act, reduced disclosure obligations regarding executive compensation in our periodic reports and proxy statements, and exemptions from the requirements of holding a nonbinding advisory vote on executive compensation and stockholder approval of any golden parachute payments not previously approved. We cannot predict if investors will find our common stock less attractive because we will rely on these exemptions. If some investors find our common stock less attractive as a result, there may be a less active trading market for our common stock and our stock price may be more volatile. We may take advantage of these reporting exemptions until we are no longer an emerging growth company. We will remain an emerging growth company until the earlier of (1) December 31, 2018, (2) the last day of the fiscal year in which we have total annual gross revenue of at least $1.0 billion, (3) the last day of the fiscal year in which we are deemed to be a large accelerated filer, which means the market value of our common stock that is held by non-affiliates exceeds $700 million as of the prior June 30th, and (4) any date on which we have issued more than $1.0 billion in non-convertible debt during the prior three-year period.
Under Section 107(b) of the JOBS Act, emerging growth companies can delay adopting new or revised accounting standards until such time as those standards apply to private companies. We have irrevocably elected not to avail ourselves of this exemption from new or revised accounting standards and, therefore, we will be subject to the same newremaining conditions set forth in the Merger Agreement.
At any time before or revised accounting standards as other public companies that are not emerging growth companies.
If we fail to maintain proper and effective internal controls, our ability to produce accurate financial statements on a timely basis could be impaired.
We are subject to the reporting requirementsafter consummation of the Securities Exchange Act of 1934,Merger, notwithstanding the Sarbanes-Oxley Act of 2002, the Dodd-Frank Wall Street Reform and Consumer Protection Act of 2010, and the rules and regulationstermination or expiration of the NYSE. The Sarbanes-Oxleywaiting period under the HSR Act, requires, amongthe FTC, DOJ, or state or foreign entities could take such action under the antitrust or competition laws as it deems necessary or desirable in the public interest, including seeking to enjoin the completion of the Merger, seeking divestiture of substantial assets of one or both of the parties, requiring the parties to license or hold separate assets or terminate existing relationships and contractual rights, or requiring the parties to agree to other things, that we maintain effective disclosure controls and procedures and internal controls over financial reporting and perform system andremedies. Private parties may also seek to take legal action under the antitrust laws under certain circumstances, including by seeking to intervene in the regulatory process evaluation and testingor litigate to enjoin or overturn regulatory approvals, any of our internal control over financial reporting to allow management to report on the effectiveness of our internal control over financial reporting. This requires that we incur substantial professional fees and internal costs to expand our accounting and finance functions and that we expend significant management efforts.
We may discover weaknesses in our system of internal financial and accounting controls and procedures thatwhich actions could significantly impede or even preclude obtaining required regulatory approvals, or otherwise result in a material misstatement of our financial statements, and we may indelay or the future discover additional weaknessesMerger being prohibited. We cannot be certain that require improvement. In addition, our internal control over financial reportinga challenge to the Merger will not prevent or detect all errors and all fraud. A control system, no matter how well designed and operated, can provide only reasonable, not absolute, assurance that the control system’s objectives will be met. Because of the inherent limitations in all control systems, no evaluation of controls can provide absolute assurance that misstatements due to error or fraud will not occurmade or that, all control issues and instances of fraudif a challenge is made, we will be detected.prevail.
If we are unable to maintain proper and effective internal controls, we may not be able to produce timely and accurate financial statements. If that were to happen, the market price of our stock could decline and we could be subject to sanctions or investigations by the NYSE, the SEC or other regulatory authorities.
We do not anticipate paying any cash dividends on our common stock in the foreseeable future and our stock may not appreciate in value.
We have not declared or paid cash dividends on our common stock to date. We currently intend to retain our future earnings, if any, to fund the development and growth of our business. In addition, the terms of any existing or future debt
agreements may preclude us from paying dividends. There is no guarantee that shares of our common stock will appreciate in value or that the price at which our stockholders have purchased their shares will be able to be maintained.
We incur significant costs and demands upon management as a result of being a public company.
As a public company listed in the United States, we incur significant additional legal, accounting and other costs, which we expect to increase, particularly after we cease to be an "emerging growth company" under the JOBS Act. These additional costs could negatively affect our financial results. In addition, changing laws, regulations and standards relating to corporate governance and public disclosure, including regulations implemented by the SEC and stock exchanges, may increase legal and financial compliance costs and make some activities more time consuming. These laws, regulations and standards are subject to varying interpretations and, as a result, their application in practice may evolve over time as new guidance is provided by regulatory and governing bodies. We intend to invest resources to comply with evolving laws, regulations and standards, and this investment may result in increased general and administrative expenses and a diversion of management’s time and attention from revenue-generating activities to compliance activities. If notwithstanding our efforts to comply with new laws, regulations and standards, we fail to comply, regulatory authorities may initiate legal proceedings against us and our business may be harmed.
Failure to comply with these rules might also make it more difficult for us to obtain some types of insurance, including director and officer liability insurance, and we might be forced to accept reduced policy limits and coverage or incur substantially higher costs to obtain the same or similar coverage. The impact of these events could also make it more difficult for us to attract and retain qualified persons to serve on our board of directors, on committees of our board of directors or as members of senior management.
We may need additional capital in the future to meet our financial obligations and to pursue our business objectives. Additional capital may not be available on favorable terms, or at all, which could compromise our ability to meet our financial obligations and grow our business.
While we anticipate that our existing cash, together with our cash flow from operations, will be sufficient to fund our operations for at least the next 12 months, we may need to raise additional capital to fund operations in the future or to meet various objectives, including developing future technologies and services, increasing working capital, acquiring businesses and responding to competitive pressures. If we seek to raise additional capital, it may not be available on favorable terms or may not be available at all. Lack of sufficient capital resources could significantly limit our ability to manage our business and to take advantage of business and strategic opportunities. Any additional capital raised through the sale of equity or debt securities with an equity component would dilute our stock ownership. If adequate additional funds are not available, we may be required to delay, reduce the scope of or eliminate material parts of our business strategy, including potential additional acquisitions or development of new technologies.
ITEM 2. UNREGISTERED SALES OF EQUITY SECURITIES AND USE OF PROCEEDS
(a) Sales of Unregistered SecuritiesNot applicable.
None.
ITEM 6. EXHIBITS
3. DEFAULTS UPON SENIOR SECURITIES Not applicable.
ITEM 4. MINE SAFETY DISCLOSURES
Not applicable.
ITEM 5. OTHER INFORMATION
Not applicable.
ITEM 6. EXHIBITS
| | | | | | | | |
| Exhibit Number | | Description of Document |
| | |
| 2.1 | ^ | Agreement and Plan of Merger, dated as of September 4, 2022, by and among CommerceHub, Inc., a Delaware corporation, and CH Merger Sub, Inc., a Delaware corporation and wholly owned subsidiary of CommerceHub, Inc., and the Registrant (incorporated herein by reference to Exhibit Number | | Description2.1 of Documentthe Company's Current Report on Form 8-K (File No. 001-35940), filed with the Securities and Exchange Commission on September 6, 2022). |
| | |
| 3.1 | | |
| | |
| 3.2 | | |
| | |
| 4.1 | | |
| | |
| 31.1 | * | |
| | |
| 31.2 | * | |
| | |
| 32.1 | ** | |
| | |
| 101.INS | * | Inline XBRL Instance Document - the instance document does not appear in the Interactive Data File as its XBRL tags are embedded within the Inline XBRL document |
| | |
| 101.SCH | * | Inline XBRL Taxonomy Extension Schema Document |
| | |
| 101.CAL | * | Inline XBRL Taxonomy Extension Calculation Linkbase Document |
| | |
| 101.DEF | * | Inline XBRL Taxonomy Extension Definition Linkbase Document |
| | |
| 101.LAB | * | Inline XBRL Taxonomy Extension Label Linkbase Document |
| | |
| 101.PRE | * | Inline XBRL Taxonomy Extension Presentation Linkbase Document |
| | |
*104 | Filed herewith.* | Cover Page Interactive Data File (formatted as Inline XBRL and contained in Exhibit 101) |
^ Certain exhibits and schedules have been omitted pursuant to Item 601(b)(2) of Regulation S-K. The Company agrees to furnish supplementally to the SEC a copy of any omitted exhibits or schedules upon request.
* Filed herewith.
+ Indicates management contract or compensatory plan.
** These certifications are being furnished solely to accompany this quarterly report pursuant to 18 U.S.C. Section 1350, and are not being filed for purposes of Section 18 of the Securities Exchange Act of 1934, as amended, and are not to be incorporated by reference into any filing of the registrant, whether made before or after the date hereof, regardless of any general incorporation language in such filing.
SIGNATURES
| |
** | These certifications are being furnished solely to accompany this quarterly report pursuant to 18 U.S.C. Section 1350, and are not being filed for purposes of Section 18 of the Securities Exchange Act of 1934, as amended, and are not to be incorporated by reference into any filing of the registrant, whether made before or after the date hereof, regardless of any general incorporation language in such filing. |
SIGNATURES
Pursuant to the requirements of the Securities Exchange Act of 1934, the registrant has duly caused this report to be signed on its behalf by the undersigned thereunto duly authorized.
|
| | | | | | | | | | | | | |
| | CHANNELADVISOR CORPORATION |
| | | |
| Date: | November 2, 20177, 2022 | By: | | /s/ Mark E. CookRichard F. Cornetta |
| | | | Mark E. CookRichard F. Cornetta |
| | | | Chief Financial Officer |
| | | | (On behalf of the Registrant and as Principal Financial Officer) |