UNITED STATES
SECURITIES AND EXCHANGE COMMISSION
Washington, D.C. 20549
FORM 10-Q
| ☒ | QUARTERLY REPORT PURSUANT TO SECTION 13 OR 15(d) OF THE SECURITIES EXCHANGE ACT OF 1934 | |
| For the quarterly period ended | ||
| OR | ||
| ☐ | TRANSITION REPORT PURSUANT TO SECTION 13 OR 15(d) OF THE SECURITIES EXCHANGE ACT OF 1934 | |
For the transition period from to
| Commission file number: 000-55447 |
![]()
![]()
CORVUS GOLD INC.
(Exact Name of Registrant as Specified in its Charter)
| British Columbia, Canada | 98-0668473 |
| (State or other jurisdiction of incorporation or organization) | (I.R.S. Employer Identification No.) |
| 1750-700 West Pender Street | |
Vancouver, British Columbia, Canada, | V6C 1G8 |
| (Address of Principal Executive Offices) | (Zip code) |
Registrant’s telephone number, including area code: (604) 638-3246
Securities registered pursuant to Section 12(b) of the Act: None
Indicate by check mark whether the registrant (1) has filed all reports required to be filed by Section 13 or 15(d) of the Securities Exchange Act of 1934 during the preceding 12 months (or for such shorter period that the registrant was required to file such reports), and (2) has been subject to such filing requirements for the past 90 days.
Yes ☒ No ☐
Indicate by check mark whether the registrant has submitted electronically every Interactive Data File required to be submitted pursuant to Rule 405 of Regulation S-T (§232.405 of this chapter) during the preceding 12 months (or for such shorter period that the registrant was required to submit and post such files).
Yes ☒ No ☐
Indicate by check mark whether the registrant is a large accelerated filer, an accelerated filer, a non-accelerated filer, a smaller reporting company or an emerging growth company. See the definitions of “large accelerated filer,” “accelerated filer,” “smaller reporting company,” and “emerging growth company” in Rule 12b-2 of the Exchange Act.
| Large accelerated filer ☐ | Accelerated filer |
Non-accelerated filer ☐
| |
| Emerging growth company ☒ |
If an emerging growth company, indicate by check mark if the registrant has elected not to use the extended transition period for complying with any new or revised financial accounting standards provided pursuant to Section 13(a) of the Exchange Act. ☒
Indicate by check mark whether the registrant is a shell company (as defined in Rule 12b-2 of the Exchange Act). Yes.Yes ☐ No ☒
As of April 2, 2019,January 8, 2020, the registrant had 110,847,845123,987,845 common shares outstanding.
Table of Contents
CORVUS GOLD INC.
CONDENSED INTERIM CONSOLIDATED BALANCE SHEETS
(Unaudited)
(Expressed in Canadian dollars)
| February 28, 2019 | May 31, 2018 | |||||||
| (Unaudited) | ||||||||
| ASSETS | ||||||||
| Current assets | ||||||||
| Cash and cash equivalents | $ | 5,117,107 | $ | 2,610,541 | ||||
| Accounts receivable | 45,934 | 25,438 | ||||||
| Prepaid expenses | 391,875 | 256,772 | ||||||
| Total current assets | 5,554,916 | 2,892,751 | ||||||
| Property and equipment (note 3) | 47,787 | 56,490 | ||||||
| Capitalized acquisition costs (note 4) | 5,436,745 | 5,238,789 | ||||||
| Total assets | $ | 11,039,448 | $ | 8,188,030 | ||||
| LIABILITIES AND SHAREHOLDERS’ EQUITY | ||||||||
| Current liabilities | ||||||||
| Accounts payable and accrued liabilities (note 6) | $ | 39,987 | $ | 330,704 | ||||
| Total current liabilities | 39,987 | 330,704 | ||||||
| Asset retirement obligations (note 4) | 374,642 | 366,641 | ||||||
| Total liabilities | 414,629 | 697,345 | ||||||
| Shareholders’ equity | ||||||||
| Share capital (note 5) | 96,405,192 | 83,606,486 | ||||||
| Contributed surplus (note 5) | 11,256,524 | 13,030,715 | ||||||
| Accumulated other comprehensive income - cumulative translation differences | 1,228,951 | 1,123,410 | ||||||
| Deficit accumulated during the exploration stage | (98,265,848 | ) | (90,269,926 | ) | ||||
| Total shareholders’ equity | 10,624,819 | 7,490,685 | ||||||
| Total liabilities and shareholders’ equity | $ | 11,039,448 | $ | 8,188,030 | ||||
November 30, 2019 | May 31, 2019 | |||||||
| (Unaudited) | ||||||||
| ASSETS | ||||||||
| Current assets | ||||||||
| Cash and cash equivalents | $ | 22,585,039 | $ | 4,145,085 | ||||
| Accounts receivable | 102,383 | 49,658 | ||||||
| Prepaid expenses | 163,610 | 354,971 | ||||||
| Total current assets | 22,851,032 | 4,549,714 | ||||||
| Property and equipment | 38,690 | 45,016 | ||||||
| Right-of-use assets (note 3) | 105,740 | – | ||||||
| Capitalized acquisition costs (note 4) | 5,621,268 | 5,619,005 | ||||||
| Total assets | $ | 28,616,730 | $ | 10,213,735 | ||||
| LIABILITIES AND SHAREHOLDERS’ EQUITY | ||||||||
| Current liabilities | ||||||||
| Accounts payable and accrued liabilities (note 6) | $ | 242,668 | $ | 345,632 | ||||
| Total current liabilities | 242,668 | 345,632 | ||||||
| Asset retirement obligations (note 4) | 418,637 | 419,286 | ||||||
| Lease liabilities (note 3) | 107,918 | – | ||||||
| Total liabilities | 769,223 | 764,918 | ||||||
| Shareholders’ equity | ||||||||
| Share capital (note 5) | 120,996,838 | 97,726,772 | ||||||
| Contributed surplus (note 5) | 13,069,647 | 11,467,753 | ||||||
| Accumulated other comprehensive income - cumulative translation differences | 1,291,278 | 1,382,223 | ||||||
| Deficit accumulated during the exploration stage | (107,510,256 | ) | (101,127,931 | ) | ||||
| Total shareholders’ equity | 27,847,507 | 9,448,817 | ||||||
| Total liabilities and shareholders’ equity | $ | 28,616,730 | $ | 10,213,735 | ||||
Nature and continuance of operations (note 1)
Approved on behalf of the Directors:
| “Jeffrey Pontius” | Director | |
| “Anton Drescher” | Director |
These accompanying notes form an integral part of these condensed interim consolidated financial statements
| 3 |
CORVUS GOLD INC.
CONDENSED INTERIM CONSOLIDATED STATEMENTS OF OPERATIONS AND COMPREHENSIVE LOSS
(Unaudited)
(Expressed in Canadian dollars)
| Three months ended February 28, | Nine months ended February 28, | Three months ended November 30, | Six months ended November 30, | |||||||||||||||||||||||||||||
| 2019 | 2018 | 2019 | 2018 | 2019 | 2018 | 2019 | 2018 | |||||||||||||||||||||||||
| Operating Expenses | ||||||||||||||||||||||||||||||||
| Administration | $ | 108 | $ | 105 | $ | 323 | $ | 316 | $ | 107 | $ | 109 | $ | 214 | $ | 215 | ||||||||||||||||
| Consulting fees (notes 5 and 6) | 393,195 | 183,224 | 663,884 | 468,982 | 492,052 | 129,994 | 935,159 | 270,689 | ||||||||||||||||||||||||
| Depreciation (note 3) | 3,787 | 4,468 | 11,262 | 13,477 | 18,716 | 3,802 | 27,747 | 7,475 | ||||||||||||||||||||||||
| Exploration expenditures (notes 4 and 5) | 1,071,392 | 1,623,436 | 4,218,191 | 4,075,384 | 1,200,791 | 1,493,699 | 2,594,946 | 3,146,799 | ||||||||||||||||||||||||
| Insurance | 55,565 | 49,151 | 157,791 | 147,279 | 54,458 | 50,597 | 110,156 | 102,226 | ||||||||||||||||||||||||
| Investor relations (notes 5 and 6) | 315,115 | 226,370 | 1,002,840 | 616,295 | 569,537 | 470,054 | 904,050 | 687,725 | ||||||||||||||||||||||||
| Office and miscellaneous | 25,679 | 30,453 | 85,934 | 108,437 | 26,588 | 36,847 | 53,320 | 60,255 | ||||||||||||||||||||||||
| Professional fees (note 5) | 109,969 | 94,610 | 267,401 | 194,435 | 73,528 | 101,269 | 150,617 | 157,432 | ||||||||||||||||||||||||
| Regulatory | 32,930 | 47,778 | 102,381 | 86,311 | 51,872 | 27,163 | 112,959 | 69,451 | ||||||||||||||||||||||||
| Rent | 18,835 | 17,241 | 55,521 | 79,484 | 1,765 | 18,479 | 15,906 | 36,686 | ||||||||||||||||||||||||
| Travel | 50,364 | 31,422 | 188,339 | 163,960 | 125,205 | 99,746 | 168,596 | 137,975 | ||||||||||||||||||||||||
| Wages and benefits (notes 5 and 6) | 788,617 | 570,899 | 1,335,653 | 1,033,069 | 831,420 | 289,817 | 1,281,227 | 547,036 | ||||||||||||||||||||||||
| Total operating expenses | (2,865,556 | ) | (2,879,157 | ) | (8,089,520 | ) | (6,987,429 | ) | (3,446,039 | ) | (2,721,576 | ) | (6,354,897 | ) | (5,223,964 | ) | ||||||||||||||||
| Other income (expense) | ||||||||||||||||||||||||||||||||
| Interest income | 26,337 | 6,445 | 54,941 | 12,567 | 61,892 | 13,304 | 77,958 | 28,604 | ||||||||||||||||||||||||
| Foreign exchange gain (loss) | (47,477 | ) | (58,884 | ) | 38,657 | (138,781 | ) | (62,772 | ) | 41,494 | (105,386 | ) | 86,134 | |||||||||||||||||||
| Total other income (expense) | (21,140 | ) | (52,439 | ) | 93,598 | (126,214 | ) | (880 | ) | 54,798 | (27,428 | ) | 114,738 | |||||||||||||||||||
| Net loss for the period | (2,886,696 | ) | (2,931,596 | ) | (7,995,922 | ) | (7,113,643 | ) | (3,446,919 | ) | (2,666,778 | ) | (6,382,325 | ) | (5,109,226 | ) | ||||||||||||||||
| Other comprehensive income (loss) | ||||||||||||||||||||||||||||||||
| Exchange difference on translating foreign operations | (41,777 | ) | (38,904 | ) | 105,541 | (287,646 | ) | (3,966 | ) | 101,950 | (90,945 | ) | 147,318 | |||||||||||||||||||
| Comprehensive loss for the period | $ | (2,928,473 | ) | $ | (2,970,500 | ) | $ | (7,890,381 | ) | $ | (7,401,289 | ) | $ | (3,450,885 | ) | $ | (2,564,828 | ) | $ | (6,473,270 | ) | $ | (4,961,908 | ) | ||||||||
| Basic and diluted loss per share | $ | (0.03 | ) | $ | (0.03 | ) | $ | (0.07 | ) | $ | (0.07 | ) | $ | (0.03 | ) | $ | (0.02 | ) | $ | (0.06 | ) | $ | (0.05 | ) | ||||||||
| Weighted average number of shares outstanding | 110,678,956 | 103,961,579 | 107,735,881 | 100,301,808 | 118,704,785 | 106,689,411 | 115,168,264 | 106,288,467 | ||||||||||||||||||||||||
These accompanying notes form an integral part of these condensed interim consolidated financial statements
| 4 |
4
CORVUS GOLD INC.
CONDENSED INTERIM CONSOLIDATED STATEMENTS OF CASH FLOWS
(Unaudited)
(Expressed in Canadian dollars)
NINESIX MONTHS ENDED FEBRUARY 28,NOVEMBER 30,
| 2019 | 2018 | 2019 |
2018 | |||||||||||||
| Operating activities | ||||||||||||||||
| Net loss for the period | $ | (7,995,922 | ) | $ | (7,113,643 | ) | $ | (6,382,325 | ) | $ | (5,109,226 | ) | ||||
| Add items not affecting cash: | ||||||||||||||||
| Depreciation | 11,262 | 13,477 | 27,747 | 7,475 | ||||||||||||
| Stock-based compensation (note 5) | 962,148 | 508,865 | 1,601,894 | 309,369 | ||||||||||||
| Foreign exchange gain (loss) | (38,657 | ) | 138,781 | |||||||||||||
| Foreign exchange (gain) loss | 105,386 | (86,134 | ) | |||||||||||||
| Changes in non-cash items: | ||||||||||||||||
| Accounts receivable | (20,496 | ) | (13,292 | ) | (52,725 | ) | (25,439 | ) | ||||||||
| Prepaid expenses | (135,103 | ) | (69,340 | ) | 191,361 | 135,722 | ||||||||||
| Accounts payable and accrued liabilities | (290,717 | ) | 56,231 | (102,964 | ) | 107,346 | ||||||||||
| Cash used in operating activities | (7,507,485 | ) | (6,478,921 | ) | (4,611,626 | ) | (4,660,887 | ) | ||||||||
| Financing activities | ||||||||||||||||
| Cash received from issuance of shares | 10,033,926 | 10,073,362 | 25,200,000 | 7,953,926 | ||||||||||||
| Share issuance costs | (31,059 | ) | (107,348 | ) | (1,978,684 | ) | (20,816 | ) | ||||||||
| Lease liabilities payments | (19,916 | ) | – | |||||||||||||
| Cash provided by financing activities | 10,002,867 | 9,966,014 | 23,201,400 | 7,933,110 | ||||||||||||
| Investing activities | ||||||||||||||||
| Expenditures on property and equipment | (1,769 | ) | (7,710 | ) | – | (1,769 | ) | |||||||||
| Capitalized acquisition costs | (47,318 | ) | (38,384 | ) | (51,705 | ) | (47,318 | ) | ||||||||
| Cash used in investing activities | (49,087 | ) | (46,094 | ) | (51,705 | ) | (49,087 | ) | ||||||||
| Effect of foreign exchange on cash | 60,271 | (170,097 | ) | (98,115 | ) | 98,393 | ||||||||||
| Increase in cash and cash equivalents | 2,506,566 | 3,270,902 | 18,439,954 | 3,321,529 | ||||||||||||
| Cash and cash equivalents, beginning of the period | 2,610,541 | 1,300,553 | 4,145,085 | 2,610,541 | ||||||||||||
| Cash and cash equivalents, end of the period | $ | 5,117,107 | $ | 4,571,455 | $ | 22,585,039 | $ | 5,932,070 | ||||||||
Supplemental cash flow information (note 9)
These accompanying notes form an integral part of these condensed interim consolidated financial statements
| 5 |
CORVUS GOLD INC.
CONDENSED INTERIM CONSOLIDATED STATEMENT OF CHANGES IN EQUITY
(Unaudited)
(Expressed in Canadian dollars)
NINESIX MONTHS ENDED FEBRUARY 28,NOVEMBER 30, 2019
| Number of shares | Amount | Contributed Surplus | Accumulated Other Comprehensive Income – Cumulative Translation Differences | Deficit | Total | Number of shares | Amount | Contributed Surplus | Accumulated Other Comprehensive Income – Cumulative Translation Differences | Deficit | Total | |||||||||||||||||||||||||||||||||||||
| Balance, May 31, 2018 | 104,255,175 | $ | 83,606,486 | $ | 13,030,715 | $ | 1,123,410 | $ | (90,269,926 | ) | $ | 7,490,685 | ||||||||||||||||||||||||||||||||||||
| Balance, May 31, 2019 | 111,462,845 | $ | 97,726,772 | $ | 11,467,753 | $ | 1,382,223 | $ | (101,127,931 | ) | $ | 9,448,817 | ||||||||||||||||||||||||||||||||||||
| Net loss for the period | — | — | — | — | (7,995,922 | ) | (7,995,922 | ) | – | – | – | – | (6,382,325 | ) | (6,382,325 | ) | ||||||||||||||||||||||||||||||||
| Shares issued for cash | ||||||||||||||||||||||||||||||||||||||||||||||||
| Private placement | 2,530,770 | 6,580,002 | — | — | — | 6,580,002 | 12,500,000 | 25,200,000 | – | – | – | 25,200,000 | ||||||||||||||||||||||||||||||||||||
| Exercise of stock options | 4,036,900 | 3,453,924 | — | — | — | 3,453,924 | ||||||||||||||||||||||||||||||||||||||||||
| Share issued for capitalized acquisition costs | 25,000 | 59,500 | — | — | — | 59,500 | 25,000 | 48,750 | – | – | – | 48,750 | ||||||||||||||||||||||||||||||||||||
| Other comprehensive income (loss) | ||||||||||||||||||||||||||||||||||||||||||||||||
| Other comprehensive income | ||||||||||||||||||||||||||||||||||||||||||||||||
| Exchange difference on translating foreign operations | — | — | — | 105,541 | — | 105,541 | – | – | – | (90,945 | ) | – | (90,945 | ) | ||||||||||||||||||||||||||||||||||
| Share issuance costs | — | (31,059 | ) | — | — | — | (31,059 | ) | – | (1,978,684 | ) | – | – | – | (1,978,684 | ) | ||||||||||||||||||||||||||||||||
| Reclassification of contributed surplus on exercise of stock options | — | 2,736,339 | (2,736,339 | ) | — | — | — | |||||||||||||||||||||||||||||||||||||||||
| Stock-based compensation | — | — | 962,148 | — | — | 962,148 | – | – | 1,601,894 | – | – | 1,601,894 | ||||||||||||||||||||||||||||||||||||
| Balance, February 28, 2019 | 110,847,845 | $ | 96,405,192 | $ | 11,256,524 | $ | 1,228,951 | $ | (98,265,848 | ) | $ | 10,624,819 | ||||||||||||||||||||||||||||||||||||
| Balance, November 30, 2019 | 123,987,845 | $ | 120,996,838 | $ | 13,069,647 | $ | 1,291,278 | $ | (107,510,256 | ) | $ | 27,847,507 | ||||||||||||||||||||||||||||||||||||
These accompanying notes form an integral part of these condensed interim consolidated financial statements
| 6 |
| 1. | NATURE AND CONTINUANCE OF OPERATIONS |
On August 25, 2010, International Tower Hill Mines Ltd. (“ITH”) completed a Plan of Arrangement (the “Arrangement”) whereby its existing Alaska mineral properties (other than the Livengood project) and related assets and the North Bullfrog mineral property and related assets in Nevada (collectively, the “Nevada and Other Alaska Business”) were indirectly spun out into a new public company, being Corvus Gold Inc. (“Corvus” or the “Company”). As part of the Arrangement, ITH transferred its wholly-owned subsidiary Corvus Gold Nevada Inc. (“Corvus Nevada”) (which held the North Bullfrog property), to Corvus and a wholly-owned Alaskan subsidiary of ITH, Talon Gold Alaska, Inc. sold to Raven Gold Alaska Inc. (“Raven Gold”), the Terra, Chisna, LMS and West Pogo properties. As a consequence of the completion of the Arrangement, the Terra, Chisna, LMS, West Pogo and North Bullfrog properties were transferred to Corvus.
The Company was incorporated on April 13, 2010 under theBusiness Corporations Act (British Columbia). These condensed interim consolidated financial statements reflect the cumulative operating results of the predecessor, as related to the mineral properties that were transferred to the Company from June 1, 2006.
The Company is engaged in the business of acquiring, exploring and evaluating mineral properties, and either joint venturing or developing these properties further or disposing of them when the evaluation is completed. At February 28,November 30, 2019, the Company had interests in properties in Nevada, U.S.A.
The business of mining and exploration involves a high degree of risk and there can be no assurance that current exploration programs will result in profitable mining operations. The Company has no source of revenue, and has significant cash requirements to meet its administrative overhead and maintain its mineral property interests. The recoverability of amounts shown for mineral properties is dependent on several factors. These include the discovery of economically recoverable reserves, the ability of the Company to obtain the necessary financing to complete the development of these properties, and future profitable production or proceeds from disposition of mineral properties. The carrying value of the Company’s mineral properties does not reflect current or future values.
These condensed interim consolidated financial statements have been prepared on a going concern basis, which presume the realization of assets and discharge of liabilities in the normal course of business for the foreseeable future. The Company’s ability to continue as a going concern is dependent upon achieving profitable operations and/or obtaining additional financing.
In assessing whether the going concern assumption is appropriate, management takes into account all available information about the future within one year from the date the condensed interim consolidated financial statements are issued. There is substantial doubt upon the Company’s ability to continue as going concern, as explained in the following paragraphs.
The Company has sustained significant losses from operations, has negative cash flows, and has an ongoing requirement for capital investment to explore its mineral properties. As at February 28,November 30, 2019, the Company had working capital of $5,514,929$22,608,364 compared to working capital of $2,562,047$4,204,082 as at May 31, 2018.2019. On June 7, 2018,5, 2019, the Company closed a non-brokered private placement equity financing and issued 1,730,770500,000 common shares at a price of $1.80 per common share for gross proceeds of $900,000. On August 19, 2019, the Company closed a non-brokered private placement equity financing and issued 500,000 common shares at a price of $2.60 per common share for gross proceeds of $4,500,002. In November of 2018, the Company issued 4,036,900 common shares on the exercise of 4,036,900 stock options at an exercise price of $0.86 per stock option for net proceeds of $3,453,924.$1,300,000. On December 20, 2018,October 10, 2019, the Company closed a non-brokered private placementpublic bought deal equity financing and issued 800,00011,500,000 common shares at a price of $2.60$2.00 per common share for gross proceeds of $2,080,000.$23,000,000. Based on its current plans, budgeted expenditures, and cash requirements, the Company has sufficient cash to finance its current plans for the 1712 months from the date the condensed interim consolidated financial statements are issued.
The Company expects that it will need to raise substantial additional capital to accomplish its business plan over the next several years. There is no assurance that additional capital or other types of financing will be available if needed or that these financings will be on terms at least as favourable to the Company as those previously obtained, or at all. Should such financing not be available in that time-frame, the Company will be required to reduce its activities and will not be able to carry out all of its presently planned exploration if warranted, and development activities on its currently anticipated scheduling.
These condensed interim consolidated financial statements do not include any adjustments to the amounts and classification of assets and liabilities that might be necessary should the Company be unable to continue in business.
All currency amounts are stated in Canadian dollars unless noted otherwise.
7
| 7 |
| 2. | SIGNIFICANT ACCOUNTING POLICIES |
Basis of presentation
These condensed interim consolidated financial statements have been prepared in accordance with accounting principles generally accepted in the United States (“U.S. GAAP”) for interim financial information and with the instructions to Form 10-Q and Article 10 of Regulation S-X under theSecurities Exchange Act of 1934, as amended. Accordingly, they do not include all of the information and footnotes required by U.S. GAAP for annual financial statements. These condensed interim consolidated financial statements should be read in conjunction with the audited consolidated financial statements for the year ended May 31, 20182019 as filed in our Annual Report on Form 10-K. In the opinion of the Company’s management these condensed interim consolidated financial statements reflect all adjustments, consisting of normal recurring adjustments, necessary to present fairly the Company’s financial position at February 28,November 30, 2019 and the results of its operations for the ninesix months then ended. Operating results for the ninesix months ended February 28,November 30, 2019 are not necessarily indicative of the results that may be expected for the year ending May 31, 2019.2020. The 20182019 year-end balance sheet data was derived from audited financial statements but does not include all disclosures required by U.S. GAAP.
The preparation of these condensed interim consolidated financial statements in conformity with U.S. GAAP requires management to make judgments, estimates and assumptions that affect the reported amounts of assets and liabilities and disclosure of contingent assets and liabilities at the date of these condensed interim consolidated financial statements, and the reported amounts of revenues and expenses during the period. These judgments, estimates and assumptions are continuously evaluated and are based on management’s experience and knowledge of the relevant facts and circumstances. While management believes the estimates to be reasonable, actual results could differ from those estimates and could impact future results of operations and cash flows.
Basis of consolidation
These condensed interim consolidated financial statements include the accounts of the Company and its wholly-owned subsidiaries (collectively, the “Group”), Corvus Gold (USA) Inc. (“Corvus USA”) (a Nevada corporation), Corvus Nevada (a Nevada corporation), Raven Gold (an Alaska corporation), SoN Land and Water LLC (“SoN”) (a Nevada limited liability company) and Mother Lode Mining Company LLC (a Nevada limited liability company). All intercompany transactions and balances were eliminated upon consolidation.
Loss per share
Basic loss per share is calculated using the weighted average number of common shares outstanding during the period. The Company uses the treasury stock method to compute the dilutive effect of options, warrants and similar instruments. Under this method, the dilutive effect on earnings (loss) per share is calculated presuming the exercise of outstanding options, warrants and similar instruments. It assumes that the proceeds of such exercise would be used to repurchase common shares at the average market price during the period. However, the calculation of diluted loss per share excludes the effects of various conversions and exercise of options and warrants that would be anti-dilutive. For the period ended February 28,November 30, 2019, 10,315,00011,135,000 outstanding stock options (2018 - 9,861,900)– 10,315,000) were not included in the calculation of diluted earnings (loss) per share as their inclusion was anti-dilutive.
| 3. | ADOPTION OF NEW ACCOUNTING STANDARDS AND AMENDMENTS |
RecentAccounting Standards Update: No. 2016-02 Leases (Topic 842)(“Topic 842 – Leases”)
Effective June 1, 2019, the Company adopted Topic 842 – Leases, which specifies how to recognize, measure, present and disclose leases. The standard provides a single accounting pronouncementsmodel, requiring the recognition of assets and liabilities for all major leases previously classified as “operational leases”.
| a) | The Company’s accounting policy under Topic 842 – Leases |
Definition of a lease
At inception of a contract, the Company assesses whether a contract is, or contains, a lease based on whether the contract conveys the right to control the use of an identified asset for a period of time in exchange for consideration. The Company has elected to apply the practical expedient to grandfather the lease definition for existing contracts on transition. It applied the definition of a lease under Topic 842 – Leases to existing contracts as of June 1, 2019.
The Company continually assesseshas also elected to apply the practical expedient to account for each lease component and any new accounting pronouncementsnon-lease components as a single lease component.
| 8 |
As a lessee
The Company leases its head office space, based on lease agreement having a fixed duration until January 30, 2023 and a Denver office space, based on lease agreement having a fixed duration until August 31, 2020.
The Company recognizes a right-of-use asset and a lease liability at the lease commencement date. The right-of-use asset is initially measured at cost, based on the initial amount of the lease liability. The assets are depreciated to determine their applicability. When it is determined that a new accounting pronouncement affects the Company's financial reporting,earlier of the end of the useful life of the right-of-use asset or the lease term using the straight-line method as this most closely reflects the expected pattern of consumption of the future economic benefits. The lease term includes periods covered by an option to extend if the Company undertakes a studyis reasonably certain to determineexercise that option. In addition, the consequencesright-of-use asset is periodically adjusted for certain remeasurements of the change to its consolidated financial statements and assureslease liability.
The lease liability is initially measured at the present value of the lease payments that there are proper controlsnot paid at the commencement date, discounted using the interest rate implicit in place to ascertainthe lease or, if that rate cannot be readily determined, the Company’s consolidated financial statements properly reflect the change.incremental borrowing rate.
In March 2016,The ongoing lease liability is measured at amortized cost using the Financial Accounting Standards Board (the “FASB”) issued Accounting Standards Update (“ASU”) No. 2016-02, Leases.effective interest method. It is measured when there is a change in future lease payments, if there is a change in the Company’s estimate of the amount expected to be payable under a residual value guarantee, or if the Company changes its assessment of whether it will exercise a purchase, extension or termination option.
When the lease liability is remeasured in this way a corresponding adjustment is made to the carrying amount of the right-of-use asset or is recorded in profit or loss if the carrying amount of the right-of-use asset has been reduced to zero.
| b) | Impact of transition to Topic 842 – Leases |
Effective June 1, 2019, the Company adopted Topic 842 – Leases using the modified retrospective approach and accordingly the information presented for the period ended November 30, 2018 has not been restated. The main difference betweencumulative effect of initial application is recognized in deficit at June 1, 2019. Comparative amounts for November 30, 2018 remain as previously reported.
On initial application, the provisionsCompany has elected to record right-of-use assets based on the corresponding lease receivables and/or lease liabilities. Lease receivables and liabilities have been measured by discounting future lease payments at the incremental borrowing rate at June 1, 2019. The incremental borrowing rate applied was 10% per annum and represents the Company’s best estimate of ASU No. 2016-02the rate of interest that it would expect to pay to borrow, on a collateralized basis, over a similar term, an amount equal to the lease payments in the current economic environment. As of the initial date of application of Topic 842 – Leases, the remaining non-cancellable period of the office lease was three years and previous U.S. GAAP iseight month.
The Company has elected to apply the practical expedient to account for leases for which the lease term ends within 12 months of the date of initial application and leases of low value assets as short-term leases. The lease payments associated with these leases are recognized as expenses on a straight-line basis over the lease term.
The Company has also elected to apply the practical expedient for excluding the initial direct costs for the measurement of right-of-use assets at the date of initial application, as well as for using hindsight in determining the lease term where the contract contains options to extend or terminate the lease.
| 9 |
The application of Topic 842 – Leases to leases previously classified as operating leases, resulted in the recognition of right-of-use assets and lease liabilities by lessees for those leases classified as operating leases under previous U.S. GAAP. ASU No. 2016-02 retains a distinction between finance leases and operating leases, andat June 1, 2019 as summarized in the recognition, measurement, and presentation of expenses and cash flows arising from a lease by a lessee have not significantly changed from previous U.S. GAAP. For leases with a term of 12 months or less, a lessee is permitted to make an accounting policy election by class of underlying asset not to recognize right-of-use assets and lease liabilities. The accounting applied by a lessor is largely unchanged from that applied under previous U.S. GAAP. In transition, lessees and lessors are required to recognize and measure leases at the beginning of the earliest period presented using a modified retrospective approach. This ASU is effective for public business entities in fiscal years, and interim periods within those fiscal years, beginning after December 15, 2018. Early adoption is permitted as of the beginning of any interim or annual reporting period. The Company has not yet determined the effect of the standard on its ongoing reporting.following table:
| June 1, 2019 prior to adoption of Topic 842 – Leases | Adjustments | June 1, 2019 after adoption of Topic 842 – Leases | ||||||||||
| Non-current assets: | ||||||||||||
| Right-of-use assets | $ | – | $ | 88,957 | $ | 88,957 | ||||||
| Non-current liabilities | ||||||||||||
| Lease liabilities | $ | – | $ | 88,957 | $ | 88,957 | ||||||
In June 2016, the FASB issued ASU No. 2016-13, Credit Losses, Measurement of Credit Losses on Financial Instruments. ASU No. 2016-13 significantly changes how entities will measure credit losses for most financial assets and certain other instruments that are not measured at fair value through net income. The standard will replace the current incurred loss approach with an expected loss model for instruments measured at amortized cost. Entities will apply the standard's provisions as a cumulative-effect adjustment to retained earnings as of the beginning of the first reporting period in which the guidance is effective. This ASU is effective for public entities for annual and interim periods beginning after December 15, 2019. Early adoption is permitted for all entities for annual periods beginning after December 15, 2018, and interim periods therein. The Company has not yet determined the effect of this standard on its ongoing reporting.
| Computer Equipment | Vehicles | Tent | Total | |||||||||||||
| Cost | ||||||||||||||||
| Balance, May 31, 2018 | $ | 83,619 | $ | 88,328 | $ | 64,740 | $ | 236,687 | ||||||||
| Additions | 1,769 | — | — | 1,769 | ||||||||||||
| Currency translation adjustments | 1,035 | 1,507 | 1,105 | 3,647 | ||||||||||||
| Balance, February 28, 2019 | $ | 86,423 | $ | 89,835 | $ | 65,845 | $ | 242,103 | ||||||||
| Depreciation | ||||||||||||||||
| Balance, May 31, 2018 | $ | 60,144 | $ | 79,178 | $ | 40,875 | $ | 180,197 | ||||||||
| Depreciation for the period | 5,530 | 2,092 | 3,640 | 11,262 | ||||||||||||
| Currency translation adjustments | 806 | 1,352 | 699 | 2,857 | ||||||||||||
| Balance, February 28, 2019 | $ | 66,480 | $ | 82,622 | $ | 45,214 | $ | 194,316 | ||||||||
| Carrying amounts | ||||||||||||||||
| Balance, May 31, 2018 | $ | 23,475 | $ | 9,150 | $ | 23,865 | $ | 56,490 | ||||||||
| Balance, February 28, 2019 | $ | 19,943 | $ | 7,213 | $ | 20,631 | $ | 47,787 | ||||||||
| 4. | MINERAL PROPERTIES |
The Company had the following activity related to capitalized acquisition costs:
| North Bullfrog | Mother Lode | Total | North Bullfrog | Mother Lode | Total | |||||||||||||||||||
| (note 4a)) | (note 4b)) | (note 4a)) | (note 4b)) | |||||||||||||||||||||
| Balance, May 31, 2018 | $ | 4,428,752 | $ | 810,037 | $ | 5,238,789 | ||||||||||||||||||
| Balance, May 31, 2019 | $ | 4,761,257 | $ | 857,748 | $ | 5,619,005 | ||||||||||||||||||
| Cash payments (note 4a)(ii)(1) | 47,318 | — | 47,318 | 51,705 | – | 51,705 | ||||||||||||||||||
| Shares issued (note 4a)(ii)(1) | 59,500 | — | 59,500 | 48,750 | – | 48,750 | ||||||||||||||||||
| Asset retirement obligations | — | 1,742 | 1,742 | |||||||||||||||||||||
| Currency translation adjustments | 75,567 | 13,829 | 89,396 | (83,099 | ) | (15,093 | ) | (98,192 | ) | |||||||||||||||
| Balance, February 28, 2019 | $ | 4,611,137 | $ | 825,608 | $ | 5,436,745 | ||||||||||||||||||
| Balance, November 30, 2019 | $ | 4,778,613 | $ | 842,655 | $ | 5,621,268 | ||||||||||||||||||
The following table presents costs incurred for exploration and evaluation activities for the ninesix months ended February 28,November 30, 2019:
| North Bullfrog | Mother Lode | Total | North Bullfrog | Mother Lode | Alaskan royalty interest | Total | ||||||||||||||||||||||
| (note 4a)) | (note 4b)) | (note 4a)) | (note 4b)) | (note 4c)) | ||||||||||||||||||||||||
| Exploration costs: | ||||||||||||||||||||||||||||
| Assay | $ | 2,990 | $ | 439,889 | $ | 442,879 | $ | 308,855 | $ | 54,441 | $ | – | $ | 363,296 | ||||||||||||||
| Asset retirement obligations | 13,965 | (7,238 | ) | – | 6,727 | |||||||||||||||||||||||
| Drilling | 1,239 | 1,438,354 | 1,439,593 | 739,660 | 8,341 | – | 748,001 | |||||||||||||||||||||
| Equipment rental | — | 49,655 | 49,655 | 38,997 | 211,740 | – | 250,737 | |||||||||||||||||||||
| Field costs | 356 | 187,757 | 188,113 | 122,106 | 106,863 | – | 228,969 | |||||||||||||||||||||
| Geological/ Geophysical | 28,362 | 483,319 | 511,681 | 267,692 | 210,043 | – | 477,735 | |||||||||||||||||||||
| Land maintenance & tenure | 337,178 | 258,274 | 595,452 | 341,865 | 112,546 | – | 454,411 | |||||||||||||||||||||
| Permits | 7,546 | 90,907 | 98,453 | 2,415 | 42,955 | – | 45,370 | |||||||||||||||||||||
| Studies | 85,578 | 719,095 | 804,673 | 59,908 | 184,267 | – | 244,175 | |||||||||||||||||||||
| Travel | 3,731 | 83,961 | 87,692 | 42,525 | 51,537 | – | 94,062 | |||||||||||||||||||||
| Total expenditures for the period | $ | 466,980 | $ | 3,751,211 | $ | 4,218,191 | ||||||||||||||||||||||
| 1,937,988 | 975,495 | – | 2,913,483 | |||||||||||||||||||||||||
| Cost recovery | – | – | (318,537 | ) | (318,537 | ) | ||||||||||||||||||||||
| Total expenditures (recovery) for the period | $ | 1,937,988 | $ | 975,495 | $ | (318,537 | ) | $ | 2,594,946 | |||||||||||||||||||
| 10 |
The following table presents costs incurred for exploration and evaluation activities for the ninesix months ended February 28,November 30, 2018:
| North Bullfrog | Mother Lode | Total | North Bullfrog | Mother Lode | Total | |||||||||||||||||||
| (note 4a)) | (note 4b)) | (note 4a)) | (note 4b)) | |||||||||||||||||||||
| Exploration costs: | ||||||||||||||||||||||||
| Assay | $ | 44,148 | $ | 576,806 | $ | 620,954 | $ | – | $ | 288,804 | $ | 288,804 | ||||||||||||
| Drilling | (3,265 | ) | 1,423,671 | 1,420,406 | 1,239 | 1,094,841 | 1,096,080 | |||||||||||||||||
| Equipment rental | 15,698 | 65,678 | 81,376 | – | 36,404 | 36,404 | ||||||||||||||||||
| Field costs | 32,121 | 236,373 | 268,494 | 322 | 116,337 | 116,659 | ||||||||||||||||||
| Geological/ Geophysical | 66,473 | 456,948 | 523,421 | 27,661 | 295,063 | 322,724 | ||||||||||||||||||
| Land maintenance & tenure | 267,977 | 125,699 | 393,676 | 223,584 | 254,313 | 477,897 | ||||||||||||||||||
| Permits | 6,395 | 92,254 | 98,649 | 5,602 | 68,304 | 73,906 | ||||||||||||||||||
| Studies | 473,213 | 115,415 | 588,628 | 8,403 | 667,671 | 676,074 | ||||||||||||||||||
| Travel | 10,243 | 69,537 | 79,780 | – | 58,251 | 58,251 | ||||||||||||||||||
| Total expenditures for the period | $ | 913,003 | $ | 3,162,381 | $ | 4,075,384 | $ | 266,811 | $ | 2,879,988 | $ | 3,146,799 | ||||||||||||
| a) | North Bullfrog Project, Nevada |
The Company’s North Bullfrog project consists of certain leased patented lode mining claims and federal unpatented mining claims owned 100% by the Company.
| (i) | Interests acquired from Redstar Gold Corp. |
On October 9, 2009, a US subsidiary of ITH at the time (Corvus Nevada) completed the acquisition of all of the interests of Redstar Gold Corp. (“Redstar”) and Redstar Gold U.S.A. Inc. (“Redstar US”) in the North Bullfrog project, which consisted of six leases covering 33 patented mining claims. The leases have an initial term of ten years, and for so long thereafter as mining activities continue on the following leases:claims or contiguous claims held by the Company:
The Company is required to pay annual advance minimum royalty payments (recoupable from production royalties) for as long as there are mining activities continuing on the claims or contiguous claims held by the Company. The required annual advance minimum royalty payments are:
| ○ | 17,700 USD (adjusted annually for |
The lessor is entitled to receive a separate NSR royalty related to all production from the leased property of the various individual leases which may be purchased by the Company as follows:
| ○ | a 4% NSR royalty, which may be purchased by the |
| ○ | a 3% NSR royalty on all production, which may be purchased by the Company for USD 850,000 per 1% (USD 2,550,000 for the entire royalty). |
| ○ | a 3% NSR royalty on all production which may be purchased by the Company for USD 770,000 per 1% (USD 2,310,000 for the entire royalty). |
| ○ | a 4% NSR royalty on all production, which may be purchased by the Company for USD 1,000,000 per 1% (USD 4,000,000 for the entire royalty). |
| ○ | a 2% NSR royalty on all production, which may be purchased by the Company for USD 1,000,000 per 1% (USD 2,000,000 for the entire royalty). |
| ○ | a 2% NSR royalty on all production, which may be purchased by the Company for USD 1,000,000 per 1% (USD 2,000,000 for the entire royalty). |
The various NSR royalties above relate only to the property covered by each specific lease and are not cumulative.
AsThe Company has an option to purchase a consequenceproperty related to twelve patented mining claims for USD 1,000,000 at any time during the life of the acquisitionlease (subject to the net smelter return (“NSR”) royalty of Redstar and Redstar US’s interest in4% which may be purchased by the foregoing leases, Corvus Nevada is nowCompany for USD 1,250,000 per 1% (USD 5,000,000 for the lessee under all of such leases.entire royalty).
| 11 |
| (ii) | Interests acquired directly by Corvus Nevada |
| (1) | Pursuant to a mining lease and option to purchase agreement made effective December 1, 2007 between Corvus Nevada and a group of arm’s length limited partnerships, Corvus Nevada has leased (and has the option to purchase) patented mining claims referred to as the “Mayflower” claims which form part of the North Bullfrog project. The terms of the lease/option are as follows: |
| Terms: Initial term of five years, commencing December 1, 2007, with the option to extend the lease for an additional five years. |
| Lease Payments: |
| Anti-Dilution: Pursuant to an amended agreement agreed to by the lessors in March 2015, the Company, |
| Work Commitments: USD 100,000 per year for the first three years (incurred), USD 200,000 per year for the years four to six (incurred), USD 300,000 for the years seven to ten (incurred) and USD 300,000 for the years 11 – 20 (incurred). Excess expenditures in any year may be carried forward. If Corvus Nevada does not incur the required expenditures in year one, the deficiency is required to be paid to the lessors. |
| Retained Royalty: Corvus Nevada will pay the lessors a NSR royalty of 2% if the average gold price is USD 400 per ounce or less, 3% |
| (2) | Pursuant to a mining lease and option to purchase made effective March 1, 2011 between Corvus Nevada and an arm’s length individual, Corvus Nevada has leased, and has the option to purchase, two patented mineral claims which form part of the North Bullfrog project holdings. The lease is for an initial term of ten years, subject to extension for an additional ten years (provided advance minimum royalties are timely paid), and for so long thereafter as mining activities continue on the claims. The lessee is required to pay advance minimum royalty payments (recoupable from production royalties, but not applicable to the purchase price if the option to purchase is exercised) of USD |
| (3) | Pursuant to a purchase agreement made effective March 28, 2013, Corvus Nevada agreed to purchase the surface rights of five patented mining claims owned by two arm’s length individuals for USD 160,000 paid on closing (March 28, 2013). The terms include payment by Corvus Nevada of a fee of USD 0.02 per ton of overburden to be stored on the property, subject to payment for a minimum of 12 million short tons. The minimum tonnage fee (USD 240,000) bears interest at 4.77% per annum from closing and is evidenced by a promissory note due on the sooner of the commencing of use of the property for waste materials storage or December 31, 2015 (balance paid December 17, 2015). As a result, the Company recorded $406,240 (USD 400,000) in acquisition costs with $157,408 paid in cash and the remaining $248,832 (USD 240,000) in promissory note payable during the year ended May 31, 2013. |
| (4) | In December 2013, SoN completed the purchase of a parcel of land approximately 30 kilometres north of the North Bullfrog project which carries with it 1,600 acre feet of irrigation water rights. The cost of the land and associated water rights was cash payment of $1,100,118 (USD 1,034,626). |
| 12 |
| (5) | On March 30, 2015, Lunar Landing, LLC signed a lease agreement with Corvus Nevada to lease private property containing the three patented Sunflower claims to Corvus Nevada, which are adjacent to the Yellow Rose claims leased in 2014. The term of the lease is three years with provision to extend the lease for an additional seven years, and an advance minimum royalty payment of USD 5,000 per year with USD 5,000 paid upon signing (paid to March 2019). The lease includes a 4% NSR royalty on production, with an option to purchase the royalty for USD 500,000 per 1% or USD 2,000,000 for the entire 4% |
| b) | Mother Lode Property, Nevada |
Pursuant to a purchase agreement made effective June 9, 2017 between Corvus Nevada and Goldcorp USA, Inc. (“Goldcorp USA”), Corvus Nevada has acquired 100% of the Mother Lode property (the “Mother Lode Property”). In addition, Corvus Nevada staked two additional adjacent claim blocks to the Mother Lode Property. In connection with the acquisition, the Company issued 1,000,000 common shares at a price of $0.81 per common share to Goldcorp USA.USA (note 5). The Mother Lode Property is subject to an NSR in favour of Goldcorp USA. The NSR pays 1% from production at the Mother Lode Property when the price of gold is less than USD 1,400 per ounce and an additional 1% NSR for a total of 2% NSR when gold price is greater than or equal to USD 1,400 per ounce.
| c) | Alaskan Royalty Interest, Alaska |
On June 7, 2019, the Company completed the sale of the royalties where four non-core Alaskan royalty interests owned by Corvus were sold to EMX Royalty Corporation (“EMX”) for a purchase price of $350,000. In connection with the Alaskan royalty package sale, the Company incurred $31,463 in legal fees, resulting in a total cost recovery for the Alaska Royalty Interest of $318,537.
The general terms of the Alaskan royalty package sale include:
| · | Chisna project 1% NSR |
| · | LMS project 3% NSR |
| · | Goodpaster District 1% NSR |
| · | West Pogo project 2% NSR. The Company has retained a 1% NSR in the West Pogo project which is immediately west of the operating Pogo mine in the Goodpaster District of Alaska. |
Acquisitions
The acquisition of title to mineral properties is a detailed and time-consuming process. The Company has taken steps, in accordance with industry norms, to verify title to mineral properties in which it has an interest. Although the Company has taken every reasonable precaution to ensure that legal title to its properties is properly recorded in the name of the Company (or, in the case of an option, in the name of the relevant optionor), there can be no assurance that such title will ultimately be secured.
Environmental Expenditures
The operations of the Company may in the future be affected from time to time in varying degrees by changes in environmental regulations, including those for future removal and site restoration costs. Both the likelihood of new regulations and their overall effect upon the Company vary greatly and are not predictable. The Company’s policy is to meet or, if possible, surpass standards set by relevant legislation by application of technically proven and economically feasible measures.
Environmental expenditures that relate to ongoing environmental and reclamation programs are charged against earnings as incurred or capitalized and amortized depending on their future economic benefits. Estimated future removal and site restoration costs, when the ultimate liability is reasonably determinable, are charged against earnings over the estimated remaining life of the related business operation, net of expected recoveries.
The Company has estimated the fair value of the liability for asset retirement that arose as a result of exploration activities to be $374,642$418,637 (USD 284,000)315,000) (May 31, 20182019 - $366,641$419,286 (USD 283,000)309,000)). The fair value of the liability was determined to be equal to the estimated reclamationremediation costs. Due to the early stagestages of the projects,project, and that extractive activities have not yet begun, the Company is unable to predict with any precision the timing of the cash flow related to the reclamation activities.
| 13 |
| 5. | SHARE CAPITAL |
Authorized
Unlimited common shares without par value.
Share issuances
During the six-month period ended February 28,November 30, 2019:
| a) | On June |
| b) | On August 19, 2019, the Company closed a private placement equity financing and issued 500,000 common shares at a price of $2.60 per common share for gross proceeds of |
| On |
| d) | On October 18, 2019, the Company issued 25,000 common shares in connection with the lease on the Mayflower property (note 4a)(ii)(1)), with a fair value of |
Stock options
Stock options awarded to employees and non-employees by the Company are measured and recognized in the Condensed Interim Consolidated Statement of Operations and Comprehensive Loss over the vesting period.
The Company has adopted an incentive stock option plan, first adopted in 2010 and then amended in 2013 and 2019 (the “Amended 2010 Plan”). The essential elements of the Amended 2010 Plan provide that the aggregate number of common shares of the Company’s share capital that may be made issuable pursuant to options granted under the Amended 2010 Plan (together with any other shares which may be issued under other share compensation plans of the Company) may not exceed 10% of the number of issued common shares of the Company at the time of the granting of the options. Options granted under the Amended 2010 Plan will have a maximum term of ten years. The exercise price of options granted under the Amended 2010 Plan will not be less than the greater of the market price of the common shares (as defined by TSX, currently defined as the five day volume weighted average price for the 5five trading days immediately preceding the date of grant) or the closing market price of the Company’s common shares for the trading day immediately preceding the date of grant,grant), or such other price as may be agreed to by the Company and accepted by the TSX. Options granted under the Amended 2010 Plan vest immediately, unless otherwise determined by the directors at the date of grant.
A summary of the status of the stock option plan as of February 28,November 30, 2019, and May 31, 2018,2019, and changes during the periods are presented below:
| Nine months ended February 28, 2019 | Year ended May 31, 2018 | Six months ended November 30, 2019 | Year ended May 31, 2019 | |||||||||||||||||||||||||||||
| Number of Options | Weighted Average Exercise Price | Number of Options | Weighted Average Exercise Price | Number of Options | Weighted Average Exercise Price | Number of Options | Weighted Average Exercise Price | |||||||||||||||||||||||||
| Balance, beginning of the period | 9,861,900 | $ | 0.85 | 8,846,900 | $ | 0.87 | 10,000,000 | $ | 1.40 | 9,861,900 | $ | 0.85 | ||||||||||||||||||||
| Granted | 4,520,000 | 2.06 | 1,840,000 | 0.77 | 1,135,000 | 2.18 | 4,920,000 | 2.06 | ||||||||||||||||||||||||
| Exercised | (4,036,900 | ) | (0.86 | ) | (256,660 | ) | (0.66 | ) | – | – | (4,651,900 | ) | (0.93 | ) | ||||||||||||||||||
| Forfeited | (30,000 | ) | (0.96 | ) | (568,340 | ) | (0.93 | ) | – | – | (130,000 | ) | (1.81 | ) | ||||||||||||||||||
| Balance, end of the period | 10,315,000 | $ | 1.38 | 9,861,900 | $ | 0.85 | 11,135,000 | $ | 1.48 | 10,000,000 | $ | 1.40 | ||||||||||||||||||||
| 14 |
The weighted average remaining contractual life of options outstanding at February 28,November 30, 2019 was 3.272.93 years (May 31, 2018 - 1.742019 – 3.25 years).
Stock options outstanding are as follows:
| February 28, 2019 | May 31, 2018 | November 30, 2019 | May 31, 2019 | |||||||||||||||||||||||||||||||||||||||||||||
| Expiry Date | Exercise Price | Number of Options | Exercisable at Period- End | Exercise Price | Number of Options | Exercisable at Year- End | Exercise Price | Number of | Exercisable End | Exercise Price | Number of Options | Exercisable at Period- End | ||||||||||||||||||||||||||||||||||||
| September 19, 2017* | $ | 0.96 | — | — | $ | 0.96 | 1,966,900 | 1,966,900 | ||||||||||||||||||||||||||||||||||||||||
| August 16, 2018* | $ | 0.76 | — | — | $ | 0.76 | 2,095,000 | 2,095,000 | ||||||||||||||||||||||||||||||||||||||||
| September 8, 2019 | $ | 1.40 | 1,250,000 | 1,250,000 | $ | 1.40 | 1,250,000 | 1,250,000 | ||||||||||||||||||||||||||||||||||||||||
| September 8, 2019* | $ | 1.40 | 635,000 | 635,000 | $ | 1.40 | 635,000 | 635,000 | ||||||||||||||||||||||||||||||||||||||||
| September 9, 2020 | $ | 0.46 | 620,000 | 620,000 | $ | 0.46 | 625,000 | 625,000 | $ | 0.46 | 620,000 | 620,000 | $ | 0.46 | 620,000 | 620,000 | ||||||||||||||||||||||||||||||||
| November 13, 2020 | $ | 0.49 | 1,000,000 | 1,000,000 | $ | 0.49 | 1,000,000 | 1,000,000 | $ | 0.49 | 1,000,000 | 1,000,000 | $ | 0.49 | 1,000,000 | 1,000,000 | ||||||||||||||||||||||||||||||||
| September 15, 2021 | $ | 0.91 | 1,085,000 | 1,085,000 | $ | 0.91 | 1,085,000 | 722,610 | $ | 0.91 | 1,085,000 | 1,085,000 | $ | 0.91 | 1,085,000 | 1,085,000 | ||||||||||||||||||||||||||||||||
| July 31, 2022 | $ | 0.77 | 1,840,000 | 612,720 | $ | 0.77 | 1,840,000 | — | $ | 0.77 | 1,840,000 | 1,225,440 | $ | 0.77 | 1,840,000 | 612,720 | ||||||||||||||||||||||||||||||||
| October 11, 2022 | $ | 2.00 | 20,000 | 6,661 | $ | – | – | – | ||||||||||||||||||||||||||||||||||||||||
| November 19, 2023 | $ | 2.06 | 4,520,000 | — | $ | — | — | — | $ | 2.06 | 4,420,000 | 772,560 | $ | 2.06 | 4,420,000 | – | ||||||||||||||||||||||||||||||||
| April 9, 2024 | $ | 2.04 | 400,000 | – | $ | 2.04 | 400,000 | – | ||||||||||||||||||||||||||||||||||||||||
| June 13, 2024 | $ | 2.18 | 1,115,000 | – | $ | – | – | – | ||||||||||||||||||||||||||||||||||||||||
| 10,315,000 | 4,567,720 | 9,861,900 | 7,659,510 | 11,135,000 | 5,344,661 | 10,000,000 | 3,952,720 | |||||||||||||||||||||||||||||||||||||||||
*The Company’s share trading policy (the “Policy”) requires that all restricted persons and others who are subject to the Policy refrain from conducting any transactions involving the purchase or sale of the Company’s securities, during the period in any quarter commencing 30 days prior to the scheduled issuance of the next quarter or year-end public disclosure of the financial results as well as when there is material data on hand. In accordance with the terms of the Amended 2010 Plan, if stock options are set to expire during a restricted period and are not exercised prior to any such restriction, they will not expire but instead will be available for exercise for ten days after such restrictions are lifted.
The Company uses the fair value method for determining stock-based compensation for all options granted during the periods. The fair value of options granted was $6,939,946$1,458,958 (2018 - $951,067)$6,939,946), determined using the Black-Scholes option pricing model based on the following weighted average assumptions:
| For the nine months ended Feburary 28, | 2019 | 2018 | ||||||||||||||
| For the period ended November 30, | 2019 | 2018 | ||||||||||||||
| Risk-free interest rate | 2.28 | % | 1.65 | % | 1.35 | % | 2.28 | % | ||||||||
| Expected life of options (in years) | 5 | 5 | 4.96 | 5 | ||||||||||||
| Annualized volatility | 73.69 | % | 79.14 | % | 74.92 | % | 73.69 | % | ||||||||
| Dividend yield | 0 | % | 0 | % | 0 | % | 0 | % | ||||||||
| Exercise price | $ | 2.06 | $ | 0.77 | $ | 2.18 | $ | 2.06 | ||||||||
| Fair value per share | $ | 1.54 | $ | 0.52 | $ | 1.29 | $ | 1.54 | ||||||||
Annualized volatility was determined by reference to historic volatility of the Company.
Stock-based compensation has been allocated to the same expenses as cash compensation paid to the same employees or consultants, as follows:
| For the nine months ended Feburary 28, | 2019 | 2018 | ||||||||||||||
| For the six months ended November 30, | 2019 | 2018 | ||||||||||||||
| Consulting fees | $ | 423,134 | $ | 231,065 | $ | 750,840 | $ | 140,189 | ||||||||
| Exploration expenditures - Geological/geophysical | 85,090 | 41,166 | ||||||||||||||
| Exploration expenditures – Geological/geophysical | 137,018 | 27,661 | ||||||||||||||
| Investor relations | 130,676 | 69,817 | 217,654 | 42,106 | ||||||||||||
| Professional fees | 7,533 | 5,511 | 12,003 | 3,000 | ||||||||||||
| Wages and benefits | 315,715 | 161,306 | 484,379 | 96,413 | ||||||||||||
| $ | 962,148 | $ | 508,865 | $ | 1,601,894 | $ | 309,369 | |||||||||
| 15 |
| 6. | RELATED PARTY TRANSACTIONS |
The Company entered into the following transactions with related parties:
| For the nine months ended Feburary 28, | 2019 | 2018 | ||||||||||||||
| For the six months ended November 30, | 2019 | 2018 | ||||||||||||||
| Consulting fees to CFO | $ | 107,500 | $ | 101,667 | $ | 85,000 | $ | 45,000 | ||||||||
| Wages and benefits to CEO and COO | 811,701 | 703,888 | 661,496 | 360,007 | ||||||||||||
| Directors fees (included in consulting fees) | 101,250 | 104,250 | 76,319 | 67,500 | ||||||||||||
| Stock-based compensation to related parties | 668,202 | 377,128 | 1,121,500 | 217,797 | ||||||||||||
| $ | 1,688,653 | $ | 1,286,933 | $ | 1,944,315 | $ | 690,304 | |||||||||
As at February 28,November 30, 2019, included in accounts payable and accrued liabilities was $1,427$3,786 (May 31, 2018 - $15,537)2019 – $12,810) in expenses owing to companies related to officers and officers of the Company.
These amounts were unsecured, non-interest bearing and had no fixed terms or terms of repayment. Accordingly, fair value could not be readily determined.
The Company has also entered into change of control agreements with officers of the Company. In the case of termination, the officers are entitled to an amount equal to a multiple (ranging from two times to three times) of the sum of the annual base salary or fees then payable to the officer, the aggregate amount of bonus(es) (if any) paid to the officer within the calendar year immediately preceding the Effective Date of Termination, and an amount equal to the vacation pay which would otherwise be payable for the one year period next following the Effective Date of Termination.
| 7. | GEOGRAPHIC SEGMENTED INFORMATION |
The Company operates in one industry segment, the mineral resources industry, and in two geographical segments, Canada and the United States. All current exploration activities are conducted in the United States.States and Canada. The significant asset categories identifiable with these geographical areas are as follows:
| Canada | United States | Total | Canada | United States | Total | |||||||||||||||||||
| February 28, 2019 | ||||||||||||||||||||||||
| November 30, 2019 | ||||||||||||||||||||||||
| Capitalized acquisition costs | $ | — | $ | 5,436,745 | $ | 5,436,745 | $ | – | $ | 5,621,268 | $ | 5,621,268 | ||||||||||||
| Property and equipment | $ | 8,680 | $ | 39,107 | $ | 47,787 | $ | 6,664 | $ | 32,026 | $ | 38,690 | ||||||||||||
| Right-of-use assets | $ | 76,545 | $ | 29,195 | $ | 105,740 | ||||||||||||||||||
| May 31, 2018 | ||||||||||||||||||||||||
| May 31, 2019 | ||||||||||||||||||||||||
| Capitalized acquisition costs | $ | — | $ | 5,238,789 | $ | 5,238,789 | $ | – | $ | 5,619,005 | $ | 5,619,005 | ||||||||||||
| Property and equipment | $ | 11,200 | $ | 45,290 | $ | 56,490 | $ | 7,840 | $ | 37,176 | $ | 45,016 | ||||||||||||
| For the six months ended November 30, | 2019 | 2018 | ||||||
| Net loss for the period – Canada | $ | (2,946,294 | ) | $ | (1,366,653 | ) | ||
| Net loss for the period – United States | (3,436,031 | ) | (3,742,573 | ) | ||||
| Net loss for the period | $ | (6,382,325 | ) | $ | (5,109,226 | ) | ||
| For the period ended February 28, | 2019 | 2018 | ||||||
| Net loss for the period - Canada | $ | (2,594,785 | ) | $ | (1,938,545 | ) | ||
| Net loss for the period - United States | (5,401,137 | ) | (5,175,098 | ) | ||||
| Net loss for the period | $ | (7,995,922 | ) | $ | (7,113,643 | ) | ||
| 16 |
| 8. | SUBSIDIARIES |
Significant subsidiaries for the nine monthsperiods ended February 28,November 30, 2019 and 2018 are:
| Country of Incorporation | Principal Activity | The Company’s effective interest for 2019 | The Company’s effective interest for 2018 | |||||||||
| Corvus Gold (USA) Inc. | USA | Holding company | 100 | % | 100 | % | ||||||
| Raven Gold Alaska Inc. | USA | Exploration company | 100 | % | 100 | % | ||||||
| Corvus Gold Nevada Inc. | USA | Exploration company | 100 | % | 100 | % | ||||||
| SoN Land & Water LLC | USA | Exploration company | 100 | % | 100 | % | ||||||
| Mother Lode Mining Company LLC | USA | Exploration company | 100 | % | 100 | % | ||||||
| 9. | SUPPLEMENTAL CASH FLOW INFORMATION |
| For the nine months ended February 28, | 2019 | 2018 | ||||||||||||||
| For the six months ended November 30, | 2019 | 2018 | ||||||||||||||
| Supplemental cash flow information | ||||||||||||||||
| Interest paid | $ | — | $ | — | $ | – | $ | – | ||||||||
| Income taxes paid (received) | $ | — | $ | — | $ | – | $ | – | ||||||||
| Non-cash financing and investing transactions | ||||||||||||||||
| Shares issued to acquire mineral properties | $ | 59,500 | $ | 847,000 | $ | 48,750 | $ | 59,500 | ||||||||
| Reclassification of contributed surplus on exercise of stock options | $ | 2,736,339 | $ | 123,302 | $ | – | $ | 2,736,339 | ||||||||
17
| 17 |
ITEM 2. MANAGEMENT’S DISCUSSION AND ANALYSIS OF FINANCIAL CONDITION AND RESULTS OF OPERATIONS
The following discussion and analysis should be read in conjunction with our condensed interim consolidated financial statements for the ninesix months ended February 28,November 30, 2019, and the related notes thereto, which have been prepared in accordance with generally accepted accounting principles in the United States (“U.S. GAAP”). This discussion and analysis contains forward-looking statements and forward-looking information that involve risks, uncertainties and assumptions. Our actual results may differ materially from those anticipated in these forward-looking statements and information as a result of many factors. See section heading “Note Regarding Forward-Looking Statements” below. All currency amounts are stated in Canadian dollars unless noted otherwise.
CAUTIONARY NOTE TO U.S. INVESTORS REGARDING ESTIMATES OF MEASURED, INDICATED AND INFERRED RESOURCES AND PROVEN AND PROBABLE RESERVES
Corvus Gold Inc. (“we”, “us”, “our,” “Corvus” or the “Company”) is a mineral exploration company engaged in the acquisition and exploration of mineral properties. The mineral estimates in the technical report entitled “Technical Report and Preliminary Economic Assessment for the Integrated Mother Lode and North Bullfrog Projects, Bullfrog Mining District, Nye County, Nevada”, dated November 1, 2018 and amended on November 8, 2018, with an effective date of September 18, 2018 (the “Technical Report”). referenced in this Quarterly Report on Form 10-Q have been prepared in accordance with the requirements of the securities laws in effect in Canada, which differ from the requirements of United States securities laws. As used in the Technical Report referenced in this Quarterly Report on Form 10-Q, the terms “Mineral Reserve”, “Proven Mineral Reserve” and “Probable Mineral Reserve” are Canadian mining terms as defined in accordance with Canadian National Instrument 43-101 “Standards of Disclosure for Mineral Projects” (“NI 43-101”) and the Canadian Institute of Mining, Metallurgy and Petroleum (the “CIM”) Definition Standards on Mineral Resources and Mineral Reserves, adopted by the CIM Council, as amended.
These definitions differ materially from the definitions in the United States Securities and Exchange Commission (“SEC”) Industry Guide 7 (“SEC Industry Guide 7”). Under SEC Industry Guide 7 standards, a “final” or “bankable” feasibility study is required to report reserves, the three-year historical average price is used in any reserve or cash flow analysis to designate reserves, and the primary environmental analysis or report must be filed with the appropriate governmental authority.
In addition, the terms “Mineral Resource”, “Measured Mineral Resource”, “Indicated Mineral Resource” and “Inferred Mineral Resource” are defined in and required to be disclosed by NI 43-101; however, these terms are not defined terms under SEC Industry Guide 7 and are normally not permitted to be used in reports and registration statements filed with the SEC. Investors are cautioned not to assume that all or any part of a mineral deposit in these categories will ever be converted into reserves. “Inferred Mineral Resources” have a great amount of uncertainty as to their existence, and great uncertainty as to their economic and legal feasibility. It cannot be assumed that all, or any part, of an Inferred Mineral Resource will ever be upgraded to a higher category. Under Canadian rules, estimates of Inferred Mineral Resources may not form the basis of feasibility or pre-feasibility studies, except in rare cases. Investors are cautioned not to assume that all or any part of an Inferred Mineral Resource exists or is economically or legally mineable. Disclosure of “contained ounces” in a resource is permitted disclosure under Canadian regulations; however, the SEC normally only permits issuers to report mineralization that does not constitute “reserves” by SEC standards as in place tonnage and grade without reference to unit measures.
Accordingly, information contained in this report and the Technical Report referenced in this report contain descriptions of our mineral deposits that may not be comparable to similar information made public by U.S. companies subjectreporting under SEC Industry Guide 7 requirements.
The SEC has adopted amendments to its disclosure rules to modernize the mineral property disclosure requirements for issuers whose securities are registered with the SEC. These amendments became effective February 25, 2019 (the “SEC Modernization Rules”) and, following a two-year transition period, the SEC Modernization Rules will replace the historical property disclosure requirements for mining registrants that are included in SEC Industry Guide 7. The Company is not required to provide disclosure on its mineral properties under the SEC Modernization Rules until its fiscal year beginning May 31, 2021. Under the SEC Modernization Rules, the definitions of “Proven Mineral Reserves” and “Probable Mineral Reserves” have been amended to be substantially similar to the reportingcorresponding CIM Definition Standards and disclosure requirementsthe SEC has added definitions to recognize “Measured Mineral Resources”, “Indicated Mineral Resources” and “Inferred Mineral Resources” which are also substantially similar to the corresponding CIM Definition Standards; however there are differences in the definitions under the United States federal securities lawsSEC Modernization Rules and the rulesCIM Definition Standards and regulations thereunder.therefore once the Company begins reporting under the SEC Modernization Rules there is no assurance that the Company’s Mineral Reserve and Mineral Resource estimates will be the same as those reported under CIM Definition Standards as contained in this report.
| 18 |
CAUTIONARY NOTE TO ALL INVESTORS CONCERNING ECONOMIC ASSESSMENTS THAT INCLUDE INFERRED RESOURCES AND HISTORICAL ESTIMATES
The Company currently holds or has the right to acquire interests in an advanced stage exploration project in Nye County, Nevada referred to as the North Bullfrog Project (the “NBP”) and the Mother Lode Project (“MLP” or “Mother Lode”). Mineral resources that are not mineral reserves have no demonstrated economic viability. The preliminary economic assessment included in the Technical Report on the NBP-MLP is preliminary in nature and includes Inferred Mineral Resources that have a great amount of uncertainty as to their existence, and are considered too speculative geologically to have economic considerations applied to them that would enable them to be categorized as Mineral Reserves. It cannot be assumed that all, or any part, of an Inferred Mineral Resource will ever be upgraded to a higher category. Under Canadian rules, estimates of Inferred Mineral Resources may not form the basis of feasibility or pre-feasibility studies. There is no certainty that such Inferred Mineral Resources at the NBP and MLP will ever be realized. Mineral Resources that are not Mineral Reserves do not have demonstrated economic viability. Investors are cautioned not to assume that all or any part of an Inferred Mineral Resource exists or is economically or legally mineable. Readers should refer to the Technical Report for additional information.
18
NOTE REGARDING FORWARD-LOOKING STATEMENTS
This Quarterly Report on Form 10-Q and the exhibits attached hereto contain “forward-looking statements” within the meaning of the United States Private Securities Litigation Reform Act of 1995, as amended, and “forward-looking information” within the meaning of applicable Canadian securities legislation, collectively “forward-looking statements”. Such forward-looking statements concern our anticipated results and developments in the operations of the Company in future periods, planned exploration activities, the adequacy of the Company’s financial resources and other events or conditions that may occur in the future. Forward-looking statements are frequently, but not always, identified by words such as “expects,” “anticipates,” “believes,” “intends,” “estimates,” “potential,” “possible” and similar expressions, or statements that events, conditions or results “will,” “may,” “could” or “should” (or the negative and grammatical variations of any of these terms) occur or be achieved. These forward-looking statements may include, but are not limited to, statements concerning:
| · | the Company’s strategies and objectives, both generally and in respect of its specific mineral properties; |
| · | the results of the preliminary economic assessment; |
| · | the timing of decisions regarding the timing and costs of exploration programs with respect to, and the issuance of the necessary permits and authorizations required for, the Company’s exploration programs, including for the NBP and the MLP; |
| · | the Company’s estimates of the quality and quantity of the Mineral Resources at its mineral properties; |
| · | the timing and cost of planned exploration programs of the Company, and the timing of the receipt of results therefrom; |
| · | the Company’s future cash requirements and use of proceeds of sales; |
| · | general business and economic conditions; |
| · | the Company’s ability to meet its financial obligations as they come due, and the ability to raise the necessary funds to continue operations; |
| · | the Company’s expectation that it will be able to add additional mineral projects of merit to its assets; |
| · | the potential for the existence or location of additional high-grade veins at the NBP, or high-grade mineralization at the MLP; |
| · | the potential to expand Company’s existing deposits and discover new deposits; |
| · | the potential for any delineation of higher grade mineralization at the NBP or MLP; |
| · | the potential for there to be one or more additional vein zones; |
| · | the potential discovery and delineation of mineral deposits/resources/reserves and any expansion thereof beyond the current estimate; |
| · | the potential for the NBP or the MLP mineralization systems to continue to grow and/or to develop into a major new higher-grade, bulk tonnage, Nevada gold discovery; |
| · | the Company’s expectation that it will be able to build itself into a non-operator gold producer with significant carried interests and royalty exposure; |
| · | that the Company will operate at a loss; |
| · | that the Company will need to scale back anticipated costs and activities or raise additional funds; |
| · | that the Company will have to raise substantial additional capital to accomplish its business plan over the next couple of years; |
| · | the |
| · | the plans related to the potential development of the MLP and the NBP; and |
| · | the NBP and MLP work plans and mine development plan/programs. |
| 19 |
Such forward-looking statements reflect the Company’s current views with respect to future events and are subject to certain known and unknown risks, uncertainties and assumptions. Many factors could cause actual results, performance or achievements to be materially different from any future results, performance or achievements that may be expressed or implied by such forward-looking statements, including, among others, risks related to:
| · | our requirement of significant additional capital; |
| · | our limited operating history; |
| · | our history of losses; |
| · | cost increases for our exploration and, if warranted, development projects; |
| · | our properties being in the exploration stage; |
| · | mineral exploration and production activities; |
| · | our lack of mineral production from our properties; |
| · | estimates of Mineral Resources; |
| · | changes in Mineral Resource estimates; |
| · | differences in United States and Canadian Mineral Reserve and Mineral Resource reporting; |
| · | our exploration activities being unsuccessful; |
| · | fluctuations in gold, silver and other metal prices; |
| · | our ability to obtain permits and licenses for production; |
| · | government and environmental regulations that may increase our costs of doing business or restrict our operations; |
| · | proposed legislation that may significantly affect the mining industry; |
| · | land reclamation requirements; |
| · | competition in the mining industry; |
| · | equipment and supply shortages; |
| · | tax issues; |
| · | current and future joint ventures and partnerships; |
| · | our ability to attract qualified management; |
| · | the ability to enforce judgment against certain of our directors; |
| · | currency fluctuations; |
| · | claims on the title to our properties; |
| · | surface access on our properties; |
| · | potential future litigation; |
| · | our lack of insurance covering all our operations; |
| · | our status as a “passive foreign investment company” under US federal tax code; and |
| · | the common shares. |
Should one or more of these risks or uncertainties materialize, or should underlying assumptions prove incorrect, actual results may vary materially from those described herein. This list is not exhaustive of the factors that may affect any of the Company’s forward-looking statements. Forward-looking statements are statements about the future and are inherently uncertain, and actual achievements of the Company or other future events or conditions may differ materially from those reflected in the forward-looking statements due to a variety of risks, uncertainties and other factors, including without limitation those discussed in Part I, Item 1A, Risk Factors, of our Annual Report on Form 10-K, as filed with the SEC on August 28, 2018,8, 2019, which are incorporated herein by reference, as well as other factors described elsewhere in this report and the Company’s other reports filed with the SEC.
The Company’s forward-looking statements contained in this Quarterly Report on Form 10-Q are based on the beliefs, expectations and opinions of management as of the date of this report. The Company does not assume any obligation to update forward-looking statements if circumstances or management’s beliefs, expectations or opinions should change, except as required by law. For the reasons set forth above, investors should not attribute undue certainty to or place undue reliance on forward-looking statements.
Current Business Activities
General
The Company’s material mineral properties are the NBP and the MLP, advanced exploration stage projects in Nevada which have a number of high-priority, bulk tonnage and high-grade vein targets (held through Corvus Nevada, a Nevada subsidiary). While exploring the NBP, the Company acquired the MLP in June 2017, which is located approximately 12 miles to the south east of the NBP. The MLP was mined in the late 1980s and has substantial gold mineralization remaining unexploited extending to the north of the existing open pit mine.
| 20 |
The primary focus of the Company will be to leverage its exploration expertise to expand its existing deposits and discover major new gold deposits. Other than with respect to the ongoing exploration of the MLP and NBP, the Company’s strategy is to leverage its other non-core assets by maintaining a retained royalty.
Highlights of activities during the period and to the date of this MD&A include:
| · |
| · | The drilling |
| · | Metallurgical test work |
| · |
| · | A vein and vein stockwork sample from YellowJacket core materials at NBP was created and shipped to Resource Development Labs in Denver. |
| · | Metallurgical testing was designed to evaluate agglomeration of a gravity tail material from YellowJacket core on to Sierra Blanca mineralization for column leaching. |
| · | The Mother Lode Environmental Assessment (“EA”) document was finalized and submitted to the Bureau of Land Management (“BLM”) |
| · | Revision #7 of the Mother Lode |
| · | Baseline characterization activities at the NBP continued with the water quality sampling of |
| · |
Corporate Financial Activities
On December 20, 2018,October 10, 2019, the Company announced the completion of a $2,080,000 non-brokered private placement,$23,000,000 public bought deal financing, where the Company issued 800,00011,500,000 common shares at a price of $2.60$2.00 per common share (the “Offering”). No warrants were issued in relation to this financing. The Offering was arranged by the sole underwriter, BMO Capital Markets. AngloGold Ashanti (USA) Inc. participated in the Offering on a key strategic shareholder. Proceedspro-rata basis to maintain ownership of 19.9 percent of the financing is expectedissued and outstanding shares of Corvus. The Company intends to fund an expandeduse the net proceeds of the Offering (i) for exploration programexpenditures at both the Company’s NBP and MLP and NBP.(ii) for corporate general and administrative expenses, land and permits.
Nevada Properties
NBP and MLP
Our principal mineral properties are the NBP and the MLP, which form a unified gold exploration project (the “NBP-MLP”) located in northwestern Nye County, Nevada, in the Northern Bullfrog Hills and Bare Mountains to the east, north and west of the town of Beatty. The NBP-MLP does not have any known proven or probable reserves under SEC Industry Guide 7 and the project is exploratory in nature. The Technical Report is available under Corvus’ SEDAR profile at www.sedar.com and EDGAR profile at www.sec.gov, which describes the integration of the two properties into a single mining operation. The Technical Report is referred to herein for informational purposes only and is not incorporated herein by reference. The Technical Report contains disclosure regarding Mineral Resources that are not SEC Industry Guide 7 compliant proven or probable reserves. See “Cautionary Note to U.S. Investors Regarding Estimates of Measured, Indicated and Inferred Resources and Proven and Probable Reserves” above.
The following disclosure is derived, in part, and supported by the Technical Report.
The NBP-MLP is located in the Bullfrog Hills and Bare Mountains of northwestern Nye County, Nevada (Figure 1). The NBP covers about 7,22312,707 hectares of patented and unpatented mining claims in Sections 19, 20, 21, 22, 23, 24, 25, 26, 27, 28, 29, 30, 31, 32, 33, 34, 35, and 36 of T10S, R46E; sections 1, 2, 3, 4, 5, 6, 10, 11, 12, 13, 14, 15, 23, 24, 25, 26, 34 and 1435 of T11S, R46E; section 30, 31, and 32 of T10S, R47E; and sections 4, 5, 6, 7, 8, 9, 10, 11, 14, 15, 16, 17, 18, 22, 23, 26, 27, 34, 35 and 1736 of T11S, R47E, sections 1, 2, 3, 9, 10, 11, 12 and 13 of T12S 47E , sections 2, 3, 4, 5, 6,7, 8, 9, 10, and18 of T12S R46E, sections 7, 8, 9, 16, 17 and 18 of T12S R48E, MDBM. We have a total of nine option/lease agreements in place that give us control of an aggregate of 51 patented lode mining claims (see Private Land LeasesLands in Figure 1). Corvus Nevada owns an additional five patented claims (the Millman claims) and a 430 acre property with 1600 acre-feet of water rights located north of NBP in the SacrobatusSarcobatus hydrographic basin (Basin 146). During October 2018, the NBP property was extended to the south by locating the GAP claims, which consist of 190 Federal Lode mining claims extending south from the previous southwest boundary of the NBP.NBP, and an additional 65 claims were added to the GAP claims in 2019.
| 21 |
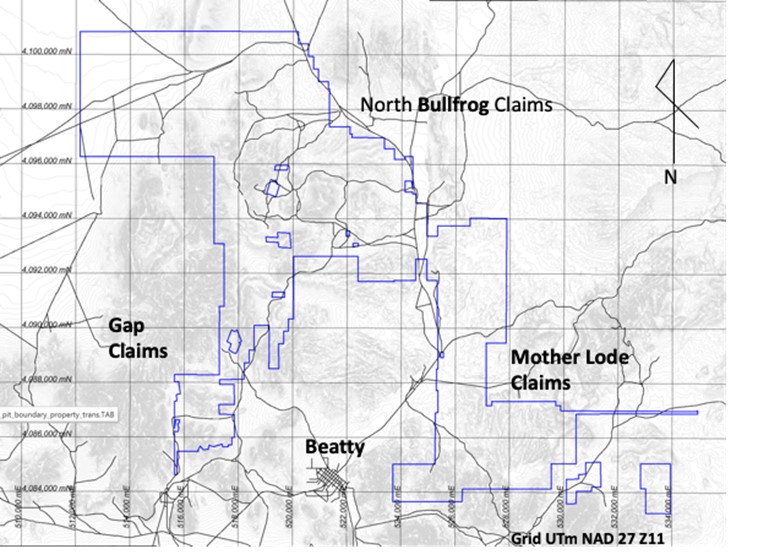
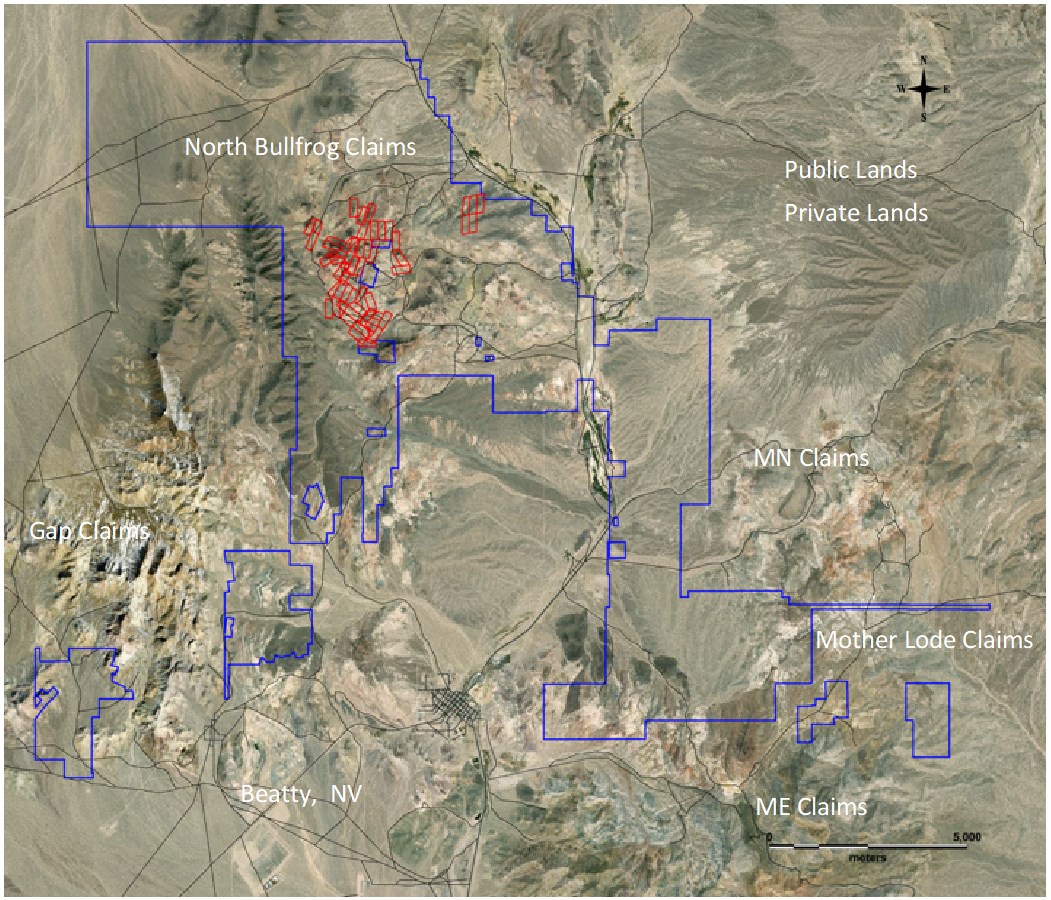
Figure 1. Property Map showing the Location of the NBP and the MLP with respect to the town of Beatty, NV.
Studies at the NBP have been focused on the integration of the NBP and the newly acquired MLP into a single mining operation. The Technical Report describing the integrated NBP-MLP dated November 1, 2018 and amended November 8, 2018 is available on SEDAR.
NBP Drilling Activities
The most recent phase of drilling at NBP was completed on October 20, 2019 with a total of 11,630 m drilled in 47 holes from the April 10, 2019 startup of drilling. These holes tested early stage targets at Cat Hill, the YellowJacket North Extension, North Jolly Jane and the West Sierra Blanca (“WSB”) targets. Results of this work are reported in NR19-10 (August 6, 2019), NR19-13 (September 23. 2019) and NR19-17 (October 23, 2019).
Promising results were obtained from Cat Hill, where the assays indicated gold associated with stockwork quartz veins and associated high silver and gold grades in multiple holes.
Drilling at WSB revealed expanding mineralization to the southwest of the main Sierra Blanca zone and the extension of a new higher-grade “NW Structural Target” in the northwest part of the WSB area. These results are being incorporated into a new Sierra Blanca/YellowJacket resource model.
| 22 |
Two of the four new holes drilled at North Jolly Jane were lost prior to hitting the target zones, however, the holes successfully drilled to depth suggest that the Jolly Jane system is large, approximately 2 km by 0.5 km of drill defined mineralization with good potential for a high grade feeder zone like the nearby Sierra Blanca/YellowJacket system.
MLP Drilling Activities
On June 9, 2017, the Company acquired the MLP, whose location is shown on the map in Figure 1, and which is located approximately six kilometres east of Beatty, Nevada, in Nye County. The MLP isPhase 4 drilling a Mother Lode began October 21, 2019 in the Bare Mountain District, and was previously mined by U.S. Nevada Gold Search Inc.southwest part of the deposit. The Company acquiredfirst two holes indicated that the thirteen Federal mining claims comprising the MLP from Goldcorp USA. The Company staked an additional 105 claims (the MN claim group)Main Zone mineralization extends to the northwestsouthwest part of the MLP claims and an additional 22 claims (the ME claim group) toresource area. The holes also indicated that the easthigher grade (+2 g/t) part of the MLP claims. The MN claim group was expanded again by an additional 54 claims during Q3 2017-2018, as surface exploration work revealed potential for mineralized targets similar to previously defined systems immediately to the south. An additional 255 MN claims were added in Q1 2018-2019 extending the MLP north to connect with the southeast end of the NBP.
The MLP is located in the northern Bare Mountain area of northwestern Nye County, Nevada. Figure 1 shows the MLP land position defined by unpatented lode mining claims in purple. The location of the property is indicated by the coordinate grid on the map which is in the UTM metres, NAD27, Zone 11 coordinate system. The MLP consists of approximately 3,590 hectares (8,872 acres) of unpatented lode mining claims located in Sections 10, 11, 14, 15, 22, 23, 26, 27, 34, 35 and 36 of T11S, R47E; Sections 1, 2, 3, 9, 10, 11, 12, and 13 of T12S, R47E; and Sections 6, 7, 8, 9, 16, 17 and 18 of T12S, R48E, Mount Diablo Base and Meridian. Corvus owns, through its wholly-owned subsidiary, Mother Lode Mining Company LLC,system extends farther to west than previously modeled. A new deep intrusive related gold zone was intersected in hole ML 19-119 (NR19-19; December 5, 2019), below the historic MLP which consisted of thirteen unpatented lode mining claims. The MN and ME claim groups were staked by Corvus in 2017 and the MN claims group was expanded to the north in 2018, connecting to the southeast corner of NBP (Figure 1). Themain Mother Lode MN and ME claim groups are 100% owned by Corvus.
The Company began its Phase I MLP drill program which utilized up to three drill rigs (two reverse circulation and one core),deposit in September 2017. The initial program completed 13,000 metres of drilling and focused on confirming the existing 172-hole database consisting of drilling results developed by previous exploration companies and mine operators at the MLP site. The initial program addressed resource expansion and exploration targets in four main zones of historic mineralization. Phase II of the MLP drilling program began in early January 2018 with a single RC drilling rig completing an additional 43 holes for 13,386 metres. Phase III drilling began in late July 2018, with an additional 35 holes and 13,000 m of drilling completed to the end of February 2019.
The Phase I and II drilling was used to verify and supplement the historic drill data and have been used as the basis for a maiden Mineral Resource estimation that was announced on September 18, 2018 (NR18-15). Preliminary results for 52 holes were released between October 11, 2017 and April 5, 2018, consisting of intervals in each hole with significant gold mineralization. Results for holes ML17-001 to -015 were reported in NR17-13 (October 11, 2017), NR17-15 (October 25, 2017), NR17-17 (November 7, 2017) and NR17-19 (December 12, 2017). Refer to news releases NR18-1 (January 10, 2018), NR18-2 (January 18, 2018), NR18-3 (February 1, 2018), NR18-5 (February 22, 2018), NR18-6 (March 1, 2018), NR18-7 (March 22, 2018), NR18-8 (April 5, 2018), NR18-9 (April 25, 2018), NR18-10 (May 24, 2018), NR18-12 (June 13, 2018), NR18-13 (July 12, 2018), and NR18-14 (September 5, 2018) for information on assay results and locations of the drill holes ML17-16 to ML18-78.Paleozoic carbonates.
Phase III assay4 has produced 2,965 meters of drilling, with results for 9 of the holes pending.
Corvus performed a preliminary geophysical study with a deep penetrating Induced Polarization (“IP”) survey over the Mother Lode deposit. The survey may have outlined a deep target with high conductivity and locations for holes ML18-079 to ML18-95 and ML18-99 to ML18-103 were reported in NR 18-16 (October 2, 2018), NR 18-17 (October 17, 2018), NR 19-01 (January 10,high resistivity (NR19-18; November 7, 2019), NR 19-02 (January 22, 2019) and NR 19-03 (February 21, 2019). Drilling operations at MLP were stopped in December for the holiday break, and were re-started on January 8, 2019. Up until the end of February 2019, the Company completed 10 additional RC holes for 3,828 metres.
Mother Lode Metallurgical Test Program
Preliminary metallurgical test work, performed on drill samples, were reported in the Technical Report. The testing included scoping level tests of flotation concentration, pressure oxidation of the concentrate, roasting of the concentrate, atmospheric alkaline oxidation of the concentrate and biologic oxidation of the concentrate. Gold recovery to concentrate was demonstrated to be 82-86%. Gold recovery from the oxidized concentrate filtrates ranged between 85-96% with pressure oxidation producing the highest gold recovery. Biox amenability testing on concentrate samples confirmed the earlier work performed on Mother Lode sulphide samples by Rayrock Resources Inc., and indicated the potential for application to Mother Lode mineralization.
Further metallurgical test work has been designed to increase and maximize the recovey of gold to concentrate. A test program to maximize flotation gold recovery was developedperformed during the reporting period to test the performance of biological oxidation on Mother Lode whole mineralization. This work was performed to compare to previously successful testwork on bioxidation of concentrate, and further samples have been transmitted toindicated 100% oxidation of the Resource Development Inc.sulphide minerals and 91-92.6% recovery of Wheatridge, CO for some scoping test work.the contained gold.
NBP-MLP Project Activities
NBP Activities
A bulk sample of Sierra Blanca heap leach mineralization was collected during the period. The sample will be used in conjunction with the tail material from gravity processed vein and vein stockwork mineralization from the YellowJacket zone, to test gold recovery from leach columns of agglomerated tail material and Sierra Blanca mineralization.
Monitoring programs to develop baseline characterization data for support of future permitting activities continued during the period. The new water production well, NB-WW-14, was pump tested and sampled for water quality.
The Company operated a meteorological monitoring station at NBP and submitted the report for calendar Q4 2018Q3 2019 to the Nevada Division of Environmental ProtectionNDEP in FebruaryOctober of 2019.
A quarterlyQuarterly pump testtests of the Sarcobatus water well wasand the water production well (NB-WW-14) were performed in December 2018 and in MarchJune 2019 and the production volumes reported to Nevada DivisionNDWR. Drill water at the NBP is being produced from NB-WW-14 in the NW corner of Water Resources. An application was submittedNBP, and production volumes are being reported monthly to the State Engineer’s office for temporary transfer of theNDWR. The extraction point for the entire quantity of the Sarcobatus water resource has been transferred to North Bullfrog. This was basedthe NBP on a temporary basis to support the performance of the new water production well NB-WW-14 which indicated the feasibility of developing a well field for future production needs on the North Bullfrog property.mining project.
The reclamation cost estimateA completion report for the North Bullfrog Baseline Characterization NOINB-WW-14 was updated, and the Company applied for a 2 year continuation of the Notice to 2021.filed with NDWR during this reporting period.
MLP Activities
The Company received further comments on the Mother Lode EA document from BLM. ModificationsA Right-of-Way documents were submitted to BLM and processing fees were paid to acquire access permission for use of the previously submitted document are underway.Fluorspar Canyon Road from Highway 95 east to the MLP project site and to the water production wells, MW-3, MW-4 and PW-2.
A reviewQuarterly pump tests were conducted at wells MW-3 and MW-4, and the production volumes were reported to NDWR in June 2019.
Use of Proceeds
The net proceeds to the Company from the Offering was $21,020,000 after deducting the Underwriter’s Fee in the amount of $1,380,000, and the estimated expenses of the Mother Lode metallugical test resultsOffering of $600,000, which was performed aspaid out of the basisproceeds of design fortesting program to maximize the gold recovery to concentrate. A testing program was designed and discussions were held with potential testing laboratories. The Company began a review of recent progress in nitric acid oxidation processes with potential for application at Mother Lode.Offering.
A video borehole log was generated in the historic water production well PW-2, which was a major water source for production operations at Rayrock Resources Inc. Daisy Project in the 1990s (Mother Lode was considered part
| 23 |
The net proceeds of the Daisy Project). Offering are anticipated to be applied as follows:
| Use of Net Proceeds | Amount | |||
| Exploration Expenditures at the North Bullfrog and Mother Lode Properties | ||||
| Resource Expansion Drilling (42,000 m) | $ | 10,000,000 | ||
| New Discovery Drilling (7,000 m) | $ | 2,300,000 | ||
| Metallurgical Studies | $ | 1,500,000 | ||
| Mining and Development Studies | $ | 600,000 | ||
| Corporate general and administration, land and permits | $ | 6,620,000 | ||
| TOTAL | $ | 21,020,000 |
The video log indicatedCompany expects to use the net proceeds over a period of approximately 20 months to accelerate resource expansion at both the MLP and NBP, by spending approximately $10,000,000 on drilling activities. This work includes approximately 12,000 m of core and 30,000 m of RC drilling, taking place over approximately a 12 to 15 month period of time. In addition, the Company will spend approximately $2,300,000 on its ongoing “New Discovery” drilling program that PW-2 was in good conditionis testing a series of high priority surface targets for the discovery of new ore deposits. This drilling program includes approximately 1,000 m of core and 6,000 m of RC drilling taking place over a period of approximately 12 to 15 months. The Company will also use the funding to advance the MLP and NBP processing and mining characterization to define an optimized development plan with approximately $1,500,000 of spending on advance metallurgical testing and design work for both the sulfide and oxide mineralization to more accurately define the process flow sheet and facility design criteria and approximately $600,000 on mining studies to further advance the overall project development design and financial requirements.
Working capital and general corporate expenditures cover costs over a period of approximately 20 months for land payments (approximately $1,000,000), personnel (approximately $2,800,000) and the office, general corporate, land and permitting operating expenses ($2,820,000).
Progress accounting of expenditures against the use of proceeds on a quarterly basis is listed as follows:
| Company Cost Center | Total Proceeds ($ M) | Expended ($ M) (October 1, 2019 – November 30, 2019) | Cumulative Expenditure ($ M) (October 1, 2019 – November 30, 2019) | |||||||||
| Exploration Expenditures at the North Bullfrog and Mother Lode Properties | ||||||||||||
| Resource Expansion Drilling | $ | 10.00 | $ | 0.73 | $ | 0.73 | ||||||
| New Discovery Drilling | $ | 2.30 | $ | 0.00 | $ | 0.00 | ||||||
| Metallurgical Studies | $ | 1.50 | $ | 0.03 | $ | 0.03 | ||||||
| Mining and Development Studies | $ | 0.60 | $ | 0.01 | $ | 0.01 | ||||||
| Corporate general and administration, land & permits | $ | 6.60 | $ | 1.46 | $ | 1.46 | ||||||
| TOTAL | $ | 21.02 | $ | 2.23 | $ | 2.23 | ||||||
Expenditures correlate with progress and time for the budgeted amounts for the period October 1, 2019 – November 30, 2019. Corporate general and administration, land and permits expenditures were impacted by scheduled timing of expenditures and financial fees due to the surveyed depth of 580 m (1,900 feet).
The Company applied for conveyance of PW-2 and transfer of the point of extraction of ½ of the water in permit 52847 (MW-4) to PW-2. The Company plans to re-comnplete PW-2 in December 2019.offering.
Qualified Person and Quality Control/Quality Assurance
Jeffrey A. Pontius (CPG 11044), a qualified person as defined by NI 43-101, has supervised the preparation of the scientific and technical information that forms the basis for the disclosure in this Report on Form 10-Q (other than the Mother Lode Mineral Resource estimate) and has reviewed and approved the disclosure herein. Mr. Pontius is not independent of the Company, as he is the Chief Executive Officer and President and holds common shares and incentive stock options in Corvus.
Carl E. Brechtel (Colorado PE 23212, Nevada PE 008744 and Registered Member 353000 of SME), a qualified person as defined by NI 43-101, has coordinated execution of the technical work and has reviewed and approved the disclosure in this Report on Form 10-Q related thereto. Mr. Brechtel is not independent of the Company, as he is the Chief Operating Officer and holds Common Shares and incentive stock options in Corvus.
The work program at the NBP and the MLP was designed and supervised by Mark Reischman, Corvus’ Nevada Exploration Manager, who is responsible for all aspects of the work, including the quality control/quality assurance program. On-site personnel at the project log and track all samples prior to sealing and shipping. Quality control is monitored by the insertion of blind certified standard reference materials and blanks into each sample shipment. All resource sample shipments are sealed and shipped to American Assay Laboratories in Reno, Nevada, for preparation and assaying.
| 24 |
Assaying for the NBP and the MLP holes has been performed by American Assay Laboratories (“AAL”) in Sparks, Nevada. Corvus has no business relationship with AAL beyond being a customer for analytical services. The Sparks laboratory is Standards Council of Canada, Ottawa, Ontario Accredited Laboratory No. 536 and conforms with requirements of CAN-P-1579, CAN-P-4E (ISO/IEC 17025:2005).
Check assaying has been performed by Bureau Veritas North America (“BV”, formerly Inspectorate America Corporation), in Sparks Nevada and Vancouver, Canada, and ALS Minerals Laboratories (“ALS Minerals”), in Sparks, Nevada. Corvus has no business relationship with BV or ALS Minerals beyond being a customer for analytical services. The BV laboratory is Accredited Laboratory No. 720 and conforms to requirements of CAN-P-1579, CAN-P-4E (ISO 9001:2008) and ALS is Accredited Laboratory No. 660 and conforms to requirements of CAN-P-1579, CAN-P-4E (ISO/IEC 17025:2005).
Mr. Scott E. Wilson, CPG (10965), Registered Member of SME (4025107) and President of Resource Development Associates Inc., is an independent consulting geologist specializing in Mineral Reserve and Mineral Resource calculation reporting, mining project analysis and due diligence evaluations. He has acted as the Qualified Person, as defined in NI 43-101, for the Mineral Resource estimate and the Technical Report. Mr. Wilson has over 29 years of experience in surface mining, resource estimation and strategic mine planning. Mr. Wilson and Resource Development Associates Inc. are independent of the Company under NI 43-101. Mr. Wilson, a Qualified Person, has verified the data underlying the information disclosed herein by reviewing the reports of AAL and all procedures undertaken for QA/QC. All matters were consistent and accurate accordingly to his professional judgment. There were no limitations on the verification process.
For additional information on the NBP-MLP, including information relating to exploration, data verification and the Mineral Resource estimates, see the Technical Report, which is available under Corvus’ SEDAR profile at www.sedar.com and EDGAR profile at www.sec.gov. The Technical Report is referred to herein for informational purposes only and is not incorporated herein by reference. The Technical Report contains disclosure regarding Mineral Resources that are not Guide 7 compliant proven or probable reserves, see “Cautionary Note to U.S. Investors Regarding Estimates of Measured, Indicated and Inferred Resources and Proven and Probable Reserves” above.
Results of Operations
NineSix months ended February 28,November 30, 2019 Compared to NineSix months ended February 28,November 30, 2018
For the ninesix months ended February 28,November 30, 2019, the Company had a net loss of $7,995,922$6,382,325 compared to a net loss of $7,113,643$5,109,226 in the comparative period of the prior year. Included in net loss was $962,148$1,601,894 (2018 - $508,865)$309,369) in stock-based compensation charges which is a result of stock options granted during the current period and previously granted stock options which vested during the period. The increase in loss of $882,279$1,273,099 in the ninesix month period of the current year was due to a combination of factors discussed below.
The primary factor forexploration expenditures decreased to $2,594,946 (2018 - $3,146,799) mainly due to decrease in exploration in the current period while the Company worked on securing additional financing. This was offset by an increase in the net loss was the exploration expendituresstock-based compensation charges of $4,218,191 incurred in$137,018 during the current period compared to $4,075,384$27,661 in the comparative period of the prior year. The exploration activities of the Company increased mainly due to an increaseManagement expects increases in exploration expenditurescosts over prior periods are likely to continue in the current period compared with the comparative period of the prior yearimmediate future periods as the Company secured additionalfurther financing in June 2018 and focused its exploration efforts on the NBP-MLP. Management expects exploration expenditures to continue to increase moving forward.October 2019.
Consulting expenses increased to $663,884$935,159 (2018 - $468,982)$270,689) mainly due to an increase in stock-based compensation charges of $423,134$750,840 during the current period compared to $231,065$140,189 in the comparative period of the prior year.year, and an increase in consultant fees due to additional services provided in relation to the final prospectus filed in October 2019.
Depreciation expenses increased to $27,747 (2018 - $7,475) mainly due to depreciation of ROU assets after the adoption of Topic 842 – Leases.
Investor relations expenses increased to $1,002,840$904,050 (2018 - $616,295)$687,725) mainly due to an increase in stock-based compensation charges of $217,654 during the current period compared to $42,106 in the comparative period of the prior year, an increase in advertising and marketing, and an increase in investor relations-related travels during the current period as part of the Company’s efforts to secure additional financing and financial advisory fees. There is an increase in stock-based compensation charges of $130,676 during the current period compared to $69,817 in the comparative period of the prior year. The increase was offset by a decrease in investor relations-related travels.
Office expenses decreasedfees during the current period as compared to $85,934 (2018 - $108,437) and rent expenses decreased to $55,521 (2018 - $79,484) mainly due to the Company moving its Denver office location in the comparative period of the prior year.
Professional fees increaseddecreased to $267,401$150,617 (2018 - $194,435) due to the professional fees incurred for updating the tax model for the Technical Report and the adjustment of prior years’ audit overaccrual. The increase is also due to an increase in stock-based compensation charges of $7,533 during the current period compared to $5,511 in the comparative period of the prior year.
Regulatory expenses increased to $102,381 (2018 - $86,311) mainly due to an increase in share prices which resulted in an increase to the reporting issuer participation fee which is calculated based on share prices.
Travel expenses increased to $188,339 (2018 - $163,960) mainly due to more property tours conducted during the current period.
Wages and benefits increased to $1,335,653 (2018 - $1,033,069) mainly due to an increase in stock-based compensation charges of $315,715 during the current period compared to $161,306 in the comparative period of the prior year and an increase of $148,175 in wages and benefits in the current period mainly as a result of increase in wages to the CEO of the Company and increase in employee expenses.
Other expense categories that reflected only moderate changes period over period were administration expenses of $323 (2018 - $316), depreciation expenses of $11,262 (2018 - $13,477), and insurance expenses of $157,791 (2018 - $147,279).
Other items amounted to an income of $93,598 compared to a loss of $126,214 in the comparative period of the prior year. There was an increase in foreign exchange gain to $38,657 (2018 - loss of $138,781), which is the result of factors outside of the Company’s control and an increase in interest income to $54,941 (2018 - $12,567) as a result of more investment in cashable GIC’s as a result of proceeds from the June 2018 financing during the current period.
Three months ended February 28, 2019 Compared to Three months ended February 28, 2018
For the three months ended February 28, 2019, the Company had a net loss of $2,886,696 compared to a net loss of $2,931,596 in the comparative period of the prior year. Included in net loss was $652,779 (2018 - $160,795) in stock-based compensation charges which is a result of previously granted stock options which vested during the period. The decrease in loss of $44,900 in the three month period of the current year was due to a combination of factors discussed below.
The primary factor for the decrease in the net loss was the exploration expenditures of $1,071,392 incurred in the current period compared to $1,623,436 in the comparative period of the prior year. The exploration activities of the Company decreased mainly due to a decrease of $552,044 incurred in the exploration in the current period compared with the comparative period of the prior year as the Company decreased exploration activities in the current period until further financing can be secured.
Consulting fees increased to $393,195 (2018 - $183,224) mainly due to an increase in stock-based compensation charges of $282,945 during the current period compared to $73,807 in the comparative period of the prior year.
Investor relations expenses increased to $315,115 (2018 - $226,370) mainly due to an increase in advertising and marketing during the current period as part of the Company’s efforts to secure additional financing and financial advisory fees and an increase in stock-based compensation charges of $88,570 during the current period compared to $22,045 in the comparative period of the prior year.
Professional fees increased to $109,969 (2018 - $94,610) mainly$157,432) due to the professional fees incurred for updating the tax model for the Technical Report and the adjustment of prior years’ audit overaccrual andduring the comparative period of the prior year. The decrease was offset by an increase in stock-based compensation charges of $4,533$12,003 during the current period compared to $1,779$3,000 in the comparative period of the prior year.
| 25 |
Regulatory expenses decreasedincreased to $32,930$112,959 (2018 - $47,778)$69,451) mainly due to an increase in the base and variable fee paid to the TSX in the comparativecurrent period ofwhich was based on the prior year.Company’s market capitalization.
Rent expenses decreased to $15,906 (2018 - $36,686) mainly due to the adoption of Topic 842 – Leases. Rent was classified as lease payment which was applied to lease liabilities and interest expenses.
Travel expenses increased to $50,364$168,596 (2018 - $31,422)$137,975) mainly due to more property tours conducted during the current period.attendances in conference to secure additional financing.
Wages and benefits increased to $788,617$1,281,227 (2018 - $570,899)$547,036) mainly due to an increase in stock-based compensation charges of $47,593$484,379 during the current period compared to $96,413 in the comparative period of the prior year, an increase of $374,304 in wages and benefits in the current period mainlyas the 2018 bonus was paid in the third quarter of the prior year whereas the 2019 bonus was paid in the second quarter of the current year. This increase was offset by a decrease of $28,079 in employee expenses due to expenses associated with stock option exercises in the comparative period of the prior year.
Other expense categories that reflected only moderate changes period over period were administration expenses of $214 (2018 - $215), insurance expenses of $110,156 (2018 - $102,226), and office expenses of $53,320 (2018 - $60,255).
Other items amounted to a loss of $27,428 compared to a gain of $114,738 in the comparative period of the prior year. There was an increase in foreign exchange loss to $105,386 (2018 – gain of $86,134), which is the result of factors outside of the Company’s control and an increase in interest income to $77,958 (2018 - $28,604) as a result of more investment in cashable GIC’s as a result of proceeds from the October 2019 financing during the current period.
Three months ended November 30, 2019 Compared to Three months ended November 30, 2018
For the three months ended November 30, 2019, the Company had a net loss of $3,446,919 compared to a net loss of $2,666,778 in the comparative period of the prior year. Included in net loss was $806,137 (2018 - $145,001) in stock-based compensation charges which is a result of stock options granted during the period and previously granted stock options which vested during the period. Stock-based compensation in the current period comprised of stock options granted on July 31, 2017, November 19, 2018, April 9, 2019, June 13, 2019 and October 11, 2019 which vested during the period. The prior period comparative had stock-based compensation arising from stock options granted on September 15, 2016, July 31, 2017, and November 19, 2018 which vested during the comparative period of the prior year. The increase in wages and employee expenses, andloss of $780,141 in the three month period of the current year was due to a combination of factors discussed below.
The exploration expenditures decreased to $1,200,791 (2018 - $1,493,699) mainly due to decrease in exploration in the current period while the Company worked on securing additional financing. This was offset by an increase in stock-based compensation charges of $219,302$69,051 during the current period compared to $49,177$13,363 in the comparative period of the prior year. Management expects increases in exploration costs over prior periods are likely to continue in the immediate future periods as the Company secured further financing in October 2019.
Consulting fees increased to $492,052 (2018 - $129,994) mainly due to an increase in stock-based compensation charges of $377,416 during the current period compared to $64,744 in the comparative period of the prior year and an increase in consultant fees and directors’ fees.
Depreciation expenses increased to $18,716 (2018 - $3,802) mainly due to depreciation of ROU assets after the adoption of Topic 842 – Leases.
Investor relations expenses increased to $569,537 (2018 - $470,054) mainly due to an increase in stock-based compensation charges of $110,811 during the current period compared to $19,572 in the comparative period of the prior year.
Office expenses decreased to $26,588 (2018 - $36,847) mainly due to the software acquisition in comparative period of the prior year.
Professional fees decreased to $73,528 (2018 - $101,269) mainly due the professional fees incurred for updating the tax model for the Technical Report and the adjustment of prior years’ audit overaccrual during the comparative period of the prior year. This was offset by an increase in stock-based compensation charges of $6,084 during the current period compared to $1,179 in the comparative period of the prior year.
| 26 |
Regulatory expenses increased to $51,872 (2018 - $27,163) mainly due to an increase in the base and variable fee paid to the TSX in the current period which was based on the Company’s market capitalization.
Rent expenses decreased to $1,765 (2018 - $18,479) mainly due to the adoption of Topic 842 – Leases. Rent was classified as lease payment which was applied to lease liabilities and interest expenses.
Travel expenses increased to $125,205 (2018 - $99,746) mainly due to more attendances in conference to secure additional financing.
Wages and benefits increased to $831,420 (2018 - $289,817) mainly due to an increase in stock-based compensation charges of $242,775 during the current period compared to $46,143 in the comparative period of the prior year, an increase of $370,692 in wages and benefits in the current period as the 2018 bonus was paid in the third quarter of the prior year whereas the 2019 bonus was paid in the second quarter of the current year. This increase was offset by a decrease of $27,662 in employee expenses due to expenses associated with stock option exercises in the comparative period of the prior year.
Other expense categories that reflected only moderate change period over period were administration expenses of $108$107 (2018 - $105), depreciation expenses of $3,787 (2018 - $4,468),$109) and insurance expenses of $55,565$54,458 (2018 - $49,151), office expenses of $25,679 (2018 - $30,453), and rent of $18,835 (2018 - $17,241)$50,597).
Other items amounted to a loss of $21,140$880 compared to a lossan income of $52,439$54,798 in the comparative period of the prior year.period. There was a decreasean increase in foreign exchange loss to $47,477of $62,772 (2018 - $58,884)gain of $41,494), which iswas the result of factors outside of the Company’s control and an increase in interest income to $26,337and expenses of $61,892 (2018 - $6,445)$13,304) as a result of more investment in cashable GIC’s during the current period.period net of interest expenses.
Liquidity and Capital Resources
The Company has no revenue generating operations from which it can internally generate funds. To date, the Company’s ongoing operations have been financed by the sale of its equity securities by way of public offerings, private placements and the exercise of incentive stock options and share purchase warrants. The Company believes that it will be able to secure additional private placements and public financings in the future, although it cannot predict the size or pricing of any such financings. In addition, the Company can raise funds through the sale of interests in its mineral properties, although current market conditions have substantially reduced the number of potential buyers/acquirers of any such interest(s). This situation is unlikely to change until such time as the Company can develop a bankable feasibility study on one of its projects. When acquiring an interest in mineral properties through purchase or option, the Company will sometimes issue common sharesCommon Shares to the vendor or optionee of the property as partial or full consideration for the property interest in order to conserve its cash.
The condensed interim consolidated financial statements have been prepared on a going concern basis, which presume the realization of assets and discharge of liabilities in the normal course of business for the foreseeable future. The Company’s ability to continue as a going concern is dependent upon achieving profitable operations and/or obtaining additional financing.
In assessing whether the going concern assumption is appropriate, management takes into account all available information about the future within one year from the date the condensed interim consolidated financial statements are issued. There is substantial doubt upon the Company’s ability to continue as going concern, as explained below and in the condensed interim consolidated financial statements.
The Company has sustained significant losses from operations, has negative cash flows and has an ongoing requirement for capital investment to explore its mineral properties. Based on its current plans, budgeted expenditures, and cash requirements, the Company hasdoes have sufficient cash to finance its current plans for the 1712 months from the date the condensed interim consolidated financial statement are issued.
The Company reported cash and cash equivalents of $5,117,105$22,585,039 as at February 28,November 30, 2019 compared to $2,610,541$4,145,085 as at May 31, 2018.2019. The change in cash position was the net result of $7,507,487$4,611,626 used for operating activities, $19,916 used for lease liabilities payments, and $10,002,867$23,221,316 received from the private placementplacements of common shares in June 20182019, August 2019 and December 2018October 2019 (net of share issue costs) and exercise of stock options during the period ended February 28,November 30, 2019.
As at February 28,November 30, 2019, the Company had working capital of $5,514,929$22,608,364 compared to working capital of $2,562,047$4,204,082 as at May 31, 2018.2019. On June 7, 2018,5, 2019, the Company closed a non-brokered private placement equity financing and issued 1,730,770500,000 common shares at a price of $2.60$1.80 per share for gross proceeds of $4,500,002. During the second quarter of the year, an aggregate of 4,036,900 common shares were issued on the exercise of 4,036,900 stock options at an exercise$900,000 and sold its non-core Alaskan royalty interests for a purchase price of $0.86 per stock option for net proceeds of $3,453,924.$350,000, before legal fees. On December 20, 2018,August 19, 2019, the Company closed a private placement equity financing and issued 800,000500,000 common shares at a price of $2.60 per common share for gross proceeds of $2,080,000.$1,300,000. On October 10, 2019, the Company closed a public bought deal equity financing and issued 11,500,000 common shares at a price of $2.00 per common share for gross proceeds of $23,000,000.
| 27 |
The Company expects that it will operate at a loss for the foreseeable future and believes the current cash and cash equivalents will be sufficient for it to maintain its currently held properties, and fund its currently anticipated general and administrative costs until July 31, 2020.May 2021. Following July 31, 2020,May 2021, the Company will need to scale back anticipated activities and costs or raise additional financing to fund operations through the year ending May 31, 2021.2022. The Company’s current anticipated operating expenses are $640,000$7,790,000 until May 31, 20192020 and $2,980,000$19,160,000 until February 29, 2020.May 31, 2021. The Company’s anticipated monthly burn rate averages approximately $213,000$1,298,000 for MarchDecember 2019 to May 2019,2020, where approximately $185,000$446,000 is budgeted for administrative purposes and approximately $28,000$852,000 is for planned exploration expenditures and holding costs for the NBP and the MLP. From MarchDecember 2019 to February 2020,May 2021, the Company’s anticipated monthly burn rate averages approximately $248,000,$1,064,000, of which $206,000$321,000 is budgeted for administrative purposes and approximately $42,000$743,000 is for planned exploration expenditures and holding costs for the NBP and the MLP. In any event, the Company will be required to raise additional funds, again through public or private equity financings, prior to the end of May 20202021 in order to continue in business. Should such financing not be available in that time-frame, the Company will be required to reduce its activities and will not be able to carry out all of its presently planned exploration and, if warranted, development activities at the NBP and the MLP on its currently anticipated scheduling.
Despite the Company’s success to date in raising significant equity financing to fund its operations, there is significant uncertainty that the Company will be able to secure any additional financing in the current or future equity markets. See “Risk Factors – We will require significant additional capitalfinancing to fund our business plan” in the Company’s Annual Report on Form 10-K as filed with the SEC on August 28, 2018.exploration and, if warranted, development and production”. Failure to obtain additional financing could have a material adverse effect on our financial condition and results of operation and could cast uncertainty on our ability to continue as a going concern. The quantity of funds to be raised and the terms of any proposed equity financing that may be undertaken will be negotiated by management as opportunities to raise funds arise. Specific plans related to the use of proceeds will be devised once financing has been completed and management knows what funds will be available for these purposes. Due to this uncertainty, if the Company is unable to secure additional financing, it may be required to reduce all discretionary activities at the NBP and the MLPMother Lode Property to preserve its working capital to fund anticipated non-discretionary expenditures beyond the 2019/20202021 fiscal year.
The Company has no exposure to any asset-backed commercial paper. Other than cash held by its subsidiaries for their immediate operating needs in Alaska and Nevada, all of the Company’s cash reserves are on deposit with a major Canadian chartered bank. The Company does not believe that the credit, liquidity or market risks with respect thereto have increased as a result of the current market conditions. However, in order to achieve greater security for the preservation of its capital, the Company has, of necessity, been required to accept lower rates of interest, which has also lowered its potential interest income.
Off-Balance Sheet Arrangements
The Company has no off-balance sheet arrangements.
Environmental Regulations
The operations of the Company may in the future be affected from time to time in varying degrees by changes in environmental regulations, including those for future removal and site restoration costs. Both the likelihood of new regulations and their overall effect upon the Company vary greatly and are not predictable. The Company’s policy is to meet or, if possible, surpass standards set by relevant legislation by application of technically proven and economically feasible measures.
Certain U.S. Federal Income Tax Considerations for U.S. Holders
The Company has been a “passive foreign investment company” (“PFIC”) for U.S. federal income tax purposes in recent years and expects to continue to be a PFIC in the future. Current and prospective U.S. shareholders should consult their tax advisors as to the tax consequences of PFIC classification and the U.S. federal tax treatment of PFICs. Additional information on this matter is included in the Company’s Annual Report on Form 10-K as filed with the SEC on August 28, 2018,8, 2019, under “Certain United States Federal Income Tax Considerations”.
Emerging Growth Company Status
We qualify as an “emerging growth company” as defined in Section 101 of the Jumpstart our Business Startups Act (“JOBS Act”) as we do not have more than $1,000,000,000 in annual gross revenue and did not have such amount as of May 31, 2018,2019, being the last day of our last fiscal year.
We maywill lose our status as an emerging growth company on the last day of our fiscal year during which (i) our annual gross revenue exceeds $1,000,000,000 or (ii) we issue more than $1,000,000,000 in non-convertible debt in a three-year period. We will lose our status as an emerging growth company if at any time we are deemed to be a large accelerated filer. We will lose our status as an emerging growth company onMay 31, 2020, the last day of our fiscal year following the fifth anniversary of the date of the first sale of common equity securities pursuant to an effective registration statement (August 28, 2019).statement.
| 28 |
As an emerging growth company, we are exempt from Section 404(b) of the Sarbanes-Oxley Act of 2002 and Section 14A (a) and (b) of the Securities Exchange Act of 1934.Act. Such sections are provided below:
| · | Section 404(b) of the Sarbanes-Oxley Act of 2002 requires a public company’s auditor to attest to, and report on, management's assessment of its internal controls. |
| · | Sections 14A(a) and (b) of the |
As long as we qualify as an emerging growth company, we will not be required to comply with the requirements of Section 404(b) of the Sarbanes-Oxley Act of 2002 and Section 14A(a) and (b) of the Securities Exchange Act, of 1934, we may however determine to voluntarily comply with such requirements in our discretion.
ITEM 3. QUANTITATIVE AND QUALITATIVE DISCLOSURES ABOUT MARKET RISK
Not applicable.
28
| 29 |
ITEM 4. CONTROLS AND PROCEDURES
Disclosure Controls and Procedures
As of February 28,November 30, 2019 an evaluation was carried out under the supervision of and with the participation of the Company’s management, including the Chief Executive Officer (the principal executive officer) and Chief Financial Officer (the principal financial officer and accounting officer), of the effectiveness of the design and operation of the Company’s disclosure controls and procedures (as defined in Rules 13a-15I and 15d-15(e) of the Exchange Act). Based on the evaluation, the Chief Executive Officer and the Chief Financial Officer have concluded that, as of February 28,November 30, 2019, the Company’s disclosure controls and procedures were effective in ensuring that: (i) information required to be disclosed in reports filed or submitted to the SEC under the Exchange Act is recorded, processed, summarized and reported within the time periods specified in applicable rules and forms and (ii) material information required to be disclosed in our reports filed under the Exchange Act is accumulated and communicated to management, including the Chief Executive Officer and Chief Financial Officer, in a manner that allows for accurate and timely decisions regarding required disclosures.
The effectiveness of our or any system of disclosure controls and procedures, however well designed and operated, can provide only reasonable assurance that the objectives of the system will be met and is subject to certain limitations, including the exercise of judgement in designing, implementing and evaluating controls and procedures and the assumptions used in identifying the likelihood of future events.
Changes in Internal Control over Financial Reporting
There were no changes in internal control over financial reporting during the period ended February 28,November 30, 2019 that have materially, or are reasonably likely to materially affect, the Company’s internal control over financial reporting.
| 30 |
None.
There have been no material changes fromExcept for the below risk factors, which update those previously set forth in our Annual Report on Form 10-K as filed with the SEC on August 28, 20188, 2019, there have been no material changes from the risk factors set forth in such Annual Report.
Ability to Continue as a Going Concern
The Company’s auditor has indicated in the Company’s audited annual financial statements that there is substantial doubt about the Company’s ability to continue as a going concern. The Company is in the preliminary stages of its planned operations and has not yet determined whether its processes and business plans are economically viable. The Company’s ability to determine if proven and probable mineral reserves exist at its properties, to continue exploration and if warranted, develop its existing properties and to identify and acquire additional properties to diversify its properties portfolio are dependent upon the ability of the Company to obtain sufficient financing, or alternatively, upon the Company’s ability to dispose of its interest on an advantageous basis, all of which are uncertain. Importantly, the inclusion in the Company’s financial statements of a going concern opinion may negatively impact the Company’s ability to raise future financing and achieve future revenue. If the Company is unable to obtain additional financing from outside sources and/or eventually generate enough revenues, the Company may be forced to sell a portion or all of the Company’s assets or, if applicable, curtail or discontinue its operations. If any of these events happens, a prospective investor could lose all or part of its investment. In addition, the Company’s financial statements do not include any adjustments to the Company’s recorded assets or liabilities that might be necessary if the Company becomes unable to continue as a going concern.
Need for Significant Additional Capital
We will be required to expend significant funds to determine if proven and probable mineral reserves exist at our properties, to continue exploration and if warranted, develop our existing properties and to identify and acquire additional properties to diversify our properties portfolio. We have spent and will be required to continue to expend significant amounts of capital for drilling, geological and geochemical analysis, assaying and feasibility studies with regard to the results of our exploration. We may not benefit from some of these investments if we are unable to identify commercially exploitable mineralized material.
Our ability to obtain necessary funding for these purposes, in turn, depends upon a number of factors, including the status of the national and worldwide economy and the price of gold and silver. We may not be successful in obtaining the required financing or, if we can obtain such financing, such financing may not be on terms that are favorable to us. Failure to obtain such additional financing could result in delay or indefinite postponement of further mining operations or exploration and development and the possible partial or total loss of our potential interest in our Registration StatementProperties.
Negative Operating Cash Flow
The Company is an exploration stage company and has not generated cash flow from operations. The Company is devoting significant resources to the development of its properties and to actively pursue exploration and development opportunities, however, there can be no assurance that it will generate positive cash flow from operations in the future. The Company expects to continue to incur negative consolidated operating cash flow and losses until such time as it achieves commercial production at a particular project. The Company currently has negative cash flow from operating activities.
Market Price of Securities
The market price of the Company’s common shares could be subject to significant fluctuations due to various factors and events, including any regulatory or economic changes affecting the Company’s operations, variations in the Company’s operating results, developments in the Company’s business or its competitors, or changes in market sentiment towards the common shares. Investors should be aware that the value of the common shares may be volatile and investors may, on Form S-3/Adisposing of the common shares, realize less than their original investment or may lose their entire investment.
The Company’s operating results and prospects from time to time may be below the expectations of market analysts and investors. In addition, stock markets from time to time suffer significant price and volume fluctuations that affect the market price of the securities listed thereon and which may be unrelated to the Company’s operating performance. Any of these events could result in a decline in the market price of the common shares. The common shares may, therefore, not be suitable as filed witha short-term investment. In addition, the SEC on February 15, 2019.market price of the common shares may not reflect the underlying value of the Company’s net assets. The price at which the common shares will be traded and the price at which investors may realize their shares will be influenced by a large number of factors, some specific to the Company and its proposed operations, and some which may affect the business sectors in which the Company operates. Such factors could also include the performance of the Company’s operations, variations in operating results, announcements by the Company (i.e. disappointing results of exploratory drilling, the incurrence of environmental liabilities or other material developments), announcements of material developments by the Company’s competitors, involvement in litigation, large purchases or sales of the common shares, liquidity or the absence of liquidity in the common shares, limited trading volume, the prices of gold and other precious metals, legislative or regulatory changes relating to the business of the Company, the Company’s ability to raise additional funds, other material events and general financial market and economic conditions. In the event that the occurrence of any of these events causes the price of the common shares to decrease, investors may be forced to sell their shares at a loss.
| 31 |
ITEM 2. UNREGISTERED SALES OF EQUITY SECURITIES AND USE OF PROCEEDS
Unregistered Sales of Equity Securities
Other than as reported below, all sales of unregistered equity securities during the period covered by this report were previously reported on Form 8-K.
On December 20, 2018, the Company announced the completion of a $2,080,000 non-brokered private placement, whereOctober 18, 2019, the Company issued 800,00025,000 common shares atin connection with the lease on the Mayflower property (see note 4a)(ii)(1) to the Financial Statements), with a pricefair value of $2.60 per common share to a key strategic shareholder.$48,750. The common shares were issued in reliance on the exemption from registration pursuant to Section 4(a)(2) underof the Securities Act of 1933, as amended based(the “Securities Act”) on the private naturebasis of the transactionrepresentations of eligibility and the representations and warranties of shareholdersuitability made to the Company.Company by the investor in the lease agreement.
Repurchase of Securities
None.
ITEM 3. DEFAULTS UPON SENIOR SECURITIES
None.
ITEM 4. MINE SAFETY DISCLOSURES
Pursuant to Section 1503(a) of the Dodd-Frank Act, issuers that are operators, or that have a subsidiary that is an operator, of a coal or other mine in the United States are required to disclose specified information about mine health and safety in their periodic reports. These reporting requirements are based on the safety and health requirements applicable to mines under the Federal Mine Safety and Health Act of 1977 (the “Mine Act”) which is administered by the U.S. Department of Labor’s Mine Safety and Health Administration (“MSHA”). During the ninethree months period ended February 28,November 30, 2019 the Company and its subsidiaries and their properties or operations were not subject to regulation by MSHA under the Mine Act and thus no disclosure is required under Section 1503(a) of the Dodd-Frank Act.
None.
30
| 32 |
(1) Submitted Electronically Herewith. Attached as Exhibit 101 to this report are the following formatted in XBRL (Extensible Business Reporting Language): (i) the Condensed Interim Consolidated Balance Sheets at February 28, 2019 and May 31, 2018, (ii) the Condensed Interim Consolidated Statements of Operations and Comprehensive Loss for the Nine Months and Three Months ended February 28, 2019 and February 28, 2018, (iii) the Condensed Interim Consolidated Statements of Cash Flows for the Nine Months Ended February 28, 2019 and February 28, 2018, (iv) the Condensed Interim Consolidated Statement of Changes in Equity for the Nine Months Ended February 28,
| (1) | Submitted Electronically Herewith. Attached as Exhibit 101 to this report are the following formatted in XBRL (Extensible Business Reporting Language): (i) the Condensed Interim Consolidated Balance Sheets at November 30, 2019 and May 31, 2019, (ii) the Condensed Interim Consolidated Statements of Operations and Comprehensive Loss for the Six Months ended November 30, 2019 and November 30, 2018, (iii) the Condensed Interim Consolidated Statements of Cash Flows for the Six Months Ended November 30, 2019 and November 30, 2018, (iv) the Condensed Interim Consolidated Statement of Changes in Equity for the Six Months Ended November 30, 2019, (v) the Notes to the Condensed Interim Consolidated Financial Statements. |
| 33 |
Pursuant to the requirements of Section 13 or 15(d) of theSecurities Exchange Act of 1934, the registrant has duly caused this report to be signed on its behalf by the undersigned, thereunto duly authorized.
CORVUS GOLD INC.
(the Registrant)
| CORVUS GOLD INC. | ||||
| (the Registrant) | ||||
| By: | /s/ Jeffrey Pontius | |||
| Jeffrey Pontius | ||||
| Chief Executive Officer | ||||
| (Principal Executive Officer) | ||||
| Date: | ||||
| By: | /s/ Peggy Wu | |||
| Peggy Wu | ||||
| Chief Financial Officer | ||||
| (Principal Financial and Accounting Officer) | ||||
| Date: | ||||
32
34