UNITED STATES
SECURITIES AND EXCHANGE COMMISSION
Washington, D.C. 20549
__________________________________________________________
FORM 10-Q
__________________________________________________________
|
| |
| ý | QUARTERLY REPORT PURSUANT TO SECTION 13 OR 15(d) OF THE SECURITIES EXCHANGE ACT OF 1934 |
For the quarterly period ended September 30, 2017March 31, 2018
OR
|
| |
| ¨ | TRANSITION REPORT PURSUANT TO SECTION 13 OR 15(d) OF THE SECURITIES EXCHANGE ACT OF 1934 |
For the transition period from to
Commission file number: 001-35004
__________________________________________________________
FleetCor Technologies, Inc.
(Exact name of registrant as specified in its charter)
__________________________________________________________
|
| | |
| Delaware | | 72-1074903 |
(State or other jurisdiction of incorporation or organization) | | (I.R.S. Employer Identification No.) |
| | | |
| 5445 Triangle Parkway, Peachtree Corners, Georgia | | 30092 |
| (Address of principal executive offices) | | (Zip Code) |
Registrant’s telephone number, including area code: (770) 449-0479
__________________________________________________________
Indicate by check mark whether the registrant (1) has filed all reports required to be filed by Section 13 or 15(d) of the Securities Exchange Act of 1934 during the preceding 12 months (or for such shorter period that the registrant was required to file such reports), and (2) has been subject to such filing requirements for the past 90 days. Yes ý No ¨
Indicate by check mark whether the registrant has submitted electronically and posted on its corporate Web site, if any, every Interactive Data File required to be submitted and posted pursuant to Rule 405 of Regulation S-T (§232.405 of this chapter) during the preceding 12 months (or for such shorter period that the registrant was required to submit and post such files). Yes ý No ¨
Indicate by check mark whether the registrant is a large accelerated filer, an accelerated filer, a non-accelerated filer, a smaller reporting company, or an emerging growth company. See the definitions of “large accelerated filer,” “accelerated filer,” “smaller reporting company” and "emerging growth company" in Rule 12b-2 of the Exchange Act. (Check one:)
|
| | | |
| Large accelerated filer | ý | Accelerated filer | ¨ |
| Non-accelerated filer | ¨ (Do not check if a smaller reporting company) | Smaller reporting company | ¨ |
| Emerging growth company | ¨ | | |
If an emerging growth company, indicate by check mark if the registrant has elected not to use the extended transition period for complying with any new or revised financial accounting standards provided pursuant to Section 13(a) of the Exchange Act. ¨
Indicate by check mark whether the registrant is a shell company (as defined in Rule 12b-2 of the Exchange Act). Yes ¨ No ý
Indicate the number of shares outstanding of each of the issuer’s classes of common stock, as of the latest practicable date.
|
| | |
| Class | | Outstanding at October 31, 2017April 18, 2018 |
| Common Stock, $0.001 par value | | 89,560,78889,637,705 |
FLEETCOR TECHNOLOGIES, INC. AND SUBSIDIARIES
FORM 10-Q
For the Three and Nine Month PeriodsPeriod Ended September 30, 2017March 31, 2018
INDEX
|
| | |
| | | Page |
| PART I—FINANCIAL INFORMATION |
| | | |
| Item 1. | | |
| | | |
| | | |
| | | |
| | | |
| | | |
| | | |
| | | |
| | | |
| | | |
| | | |
| | | |
| Item 2. | | |
| | | |
| Item 3. | | |
| | | |
| Item 4. | | |
| | | |
| PART II—OTHER INFORMATION | |
| | | |
| Item 1. | | |
| | | |
| Item 1A. | | |
| | | |
| Item 2. | | |
| | | |
| Item 3. | | |
| | | |
| Item 4. | | |
| | | |
| Item 5. | | |
| | | |
| Item 6. | | |
| | | |
| |
PART I—FINANCIAL INFORMATION
Item 1. Financial Statements
FleetCorFLEETCOR Technologies, Inc. and Subsidiaries
Consolidated Balance Sheets
(In Thousands, Except Share and Par Value Amounts)
|
| | | | | | | | |
| | | September 30, 2017 | | December 31, 2016 |
| | | (Unaudited) | | |
| Assets | | | | |
| Current assets: | | | | |
| Cash and cash equivalents | | $ | 834,756 |
| | $ | 475,018 |
|
| Restricted cash | | 183,515 |
| | 168,752 |
|
| Accounts and other receivables (less allowance for doubtful accounts of $47,779 and $32,506 at September 30, 2017 and December 31, 2016) | | 1,456,255 |
| | 1,202,009 |
|
| Securitized accounts receivable—restricted for securitization investors | | 794,000 |
| | 591,000 |
|
| Prepaid expenses and other current assets | | 252,975 |
| | 90,914 |
|
| Total current assets | | 3,521,501 |
|
| 2,527,693 |
|
| Property and equipment, net | | 168,065 |
| | 142,504 |
|
| Goodwill | | 4,644,559 |
| | 4,195,150 |
|
| Other intangibles, net | | 2,876,440 |
| | 2,653,233 |
|
| Investments | | 33,526 |
| | 36,200 |
|
| Other assets | | 86,203 |
| | 71,952 |
|
| Total assets | | $ | 11,330,294 |
|
| $ | 9,626,732 |
|
| Liabilities and stockholders’ equity | | | | |
| Current liabilities: | | | | |
| Accounts payable | | $ | 1,435,585 |
| | $ | 1,151,432 |
|
| Accrued expenses | | 285,841 |
| | 238,812 |
|
| Customer deposits | | 731,501 |
| | 530,787 |
|
| Securitization facility | | 794,000 |
| | 591,000 |
|
| Current portion of notes payable and lines of credit | | 808,507 |
| | 745,506 |
|
| Other current liabilities | | 117,464 |
| | 38,781 |
|
| Total current liabilities | | 4,172,898 |
|
| 3,296,318 |
|
| Notes payable and other obligations, less current portion | | 2,933,976 |
| | 2,521,727 |
|
| Deferred income taxes | | 742,498 |
| | 668,580 |
|
| Other noncurrent liabilities | | 50,504 |
| | 56,069 |
|
| Total noncurrent liabilities | | 3,726,978 |
|
| 3,246,376 |
|
| Commitments and contingencies (Note 12) | |
| |
|
| Stockholders’ equity: | | | | |
| Common stock, $0.001 par value; 475,000,000 shares authorized; 121,837,990 shares issued and 89,558,913 shares outstanding at September 30, 2017; and 121,259,960 shares issued and 91,836,938 shares outstanding at December 31, 2016 | | 122 |
| | 121 |
|
| Additional paid-in capital | | 2,165,326 |
| | 2,074,094 |
|
| Retained earnings | | 2,676,224 |
| | 2,218,721 |
|
| Accumulated other comprehensive loss | | (466,367 | ) | | (666,403 | ) |
| Less treasury stock 32,279,077 shares at September 30, 2017 and 29,423,022 shares at December 31, 2016 | | (944,887 | ) | | (542,495 | ) |
| Total stockholders’ equity | | 3,430,418 |
|
| 3,084,038 |
|
| Total liabilities and stockholders’ equity | | $ | 11,330,294 |
|
| $ | 9,626,732 |
|
See accompanying notes to unaudited consolidated financial statements. |
| | | | | | | | |
| | | March 31, 20181 | | December 31, 2017 |
| | | (Unaudited) | | |
| Assets | | | | |
| Current assets: | | | | |
| Cash and cash equivalents | | $ | 979,573 |
| | $ | 913,595 |
|
| Restricted cash | | 242,928 |
| | 217,275 |
|
| Accounts and other receivables (less allowance for doubtful accounts of $48,989 and $46,031 at March 31, 2018 and December 31, 2017, respectively) | | 1,691,762 |
| | 1,420,011 |
|
| Securitized accounts receivable—restricted for securitization investors | | 829,000 |
| | 811,000 |
|
| Prepaid expenses and other current assets | | 163,802 |
| | 187,820 |
|
| Total current assets | | 3,907,065 |
|
| 3,549,701 |
|
| Property and equipment, net | | 184,031 |
| | 180,057 |
|
| Goodwill | | 4,744,292 |
| | 4,715,823 |
|
| Other intangibles, net | | 2,682,516 |
| | 2,724,957 |
|
| Investments | | 32,859 |
| | 32,859 |
|
| Other assets | | 141,702 |
| | 114,962 |
|
| Total assets | | $ | 11,692,465 |
|
| $ | 11,318,359 |
|
| Liabilities and stockholders’ equity | | | | |
| Current liabilities: | | | | |
| Accounts payable | | $ | 1,609,240 |
| | $ | 1,437,314 |
|
| Accrued expenses | | 261,309 |
| | 238,472 |
|
| Customer deposits | | 746,332 |
| | 732,171 |
|
| Securitization facility | | 829,000 |
| | 811,000 |
|
| Current portion of notes payable and lines of credit | | 792,913 |
| | 805,512 |
|
| Other current liabilities | | 68,882 |
| | 71,033 |
|
| Total current liabilities | | 4,307,676 |
|
| 4,095,502 |
|
| Notes payable and other obligations, less current portion | | 2,867,532 |
| | 2,902,104 |
|
| Deferred income taxes | | 505,150 |
| | 518,912 |
|
| Other noncurrent liabilities | | 124,055 |
| | 125,319 |
|
| Total noncurrent liabilities | | 3,496,737 |
|
| 3,546,335 |
|
| Commitments and contingencies (Note 13) | |
| |
|
| Stockholders’ equity: | | | | |
| Common stock, $0.001 par value; 475,000,000 shares authorized; 122,359,407 shares issued and 89,637,705 shares outstanding at March 31, 2018; and 122,083,059 shares issued and 89,803,982 shares outstanding at December 31, 2017 | | 123 |
| | 122 |
|
| Additional paid-in capital | | 2,248,602 |
| | 2,214,224 |
|
| Retained earnings | | 3,181,110 |
| | 2,958,921 |
|
| Accumulated other comprehensive loss | | (508,603 | ) | | (551,857 | ) |
| Less treasury stock (32,721,702 shares at March 31, 2018 and 32,279,077 shares at December 31, 2017) | | (1,033,180 | ) | | (944,888 | ) |
| Total stockholders’ equity | | 3,888,052 |
|
| 3,676,522 |
|
| Total liabilities and stockholders’ equity | | $ | 11,692,465 |
|
| $ | 11,318,359 |
|
|
|
1Reflects the January 1, 2018 adoption of Accounting Standards Update 2014-09, "Revenue from Contracts with Customers (Topic 606)" and related cost capitalization guidance using the modified retrospective transition method. The adoption of Topic 606 resulted in an adjustment to retained earnings in our consolidated balance sheet for the cumulative effective of applying the standard, which included costs incurred to obtain a contract, as well as presentation changes in our statements of income, including the classification of certain amounts previously classified as merchant commissions and processing expense net with revenues. As a result of the application of the modified retrospective transition method, the Company's prior period results within its annual report on Form 10-K and quarterly reports on Form 10-Q will not be restated to reflect the impact of Topic 606. See footnote 1.
|
|
| See accompanying notes to unaudited consolidated financial statements. |
FLEETCOR Technologies, Inc. and Subsidiaries
Unaudited Consolidated Statements of Income
(In Thousands, Except Per Share Amounts)
| | | | | Three Months Ended
September 30, | | Nine Months Ended
September 30, | | Three Months Ended
March 31, |
| | | 2017 | | 2016 | | 2017 | | 2016 | | 2018¹ | | 2017 |
| Revenues, net | | $ | 577,877 |
| | $ | 484,426 |
| | $ | 1,639,547 |
| | $ | 1,316,593 |
| | $ | 585,500 |
| | $ | 520,433 |
|
| Expenses: | | | | | | | | | | | | |
| Merchant commissions | | 27,687 |
| | 28,214 |
| | 82,690 |
| | 78,755 |
| | — |
| | 24,384 |
|
| Processing | | 111,283 |
| | 96,233 |
| | 316,429 |
| | 256,738 |
| | 116,485 |
| | 101,824 |
|
| Selling | | 45,060 |
| | 34,180 |
| | 122,854 |
| | 92,680 |
| | 47,111 |
| | 38,837 |
|
| General and administrative | | 92,043 |
| | 77,904 |
| | 275,046 |
| | 209,084 |
| | 90,315 |
| | 95,454 |
|
| Depreciation and amortization | | 69,156 |
| | 57,084 |
| | 198,731 |
| | 141,848 |
| | 71,502 |
| | 64,866 |
|
| Other operating, net | | 11 |
| | (244 | ) | | 49 |
| | (690 | ) | |
| Operating income | | 232,637 |
|
| 191,055 |
| | 643,748 |
|
| 538,178 |
| | 260,087 |
|
| 195,068 |
|
| Investment loss (income) | | 47,766 |
| | 2,744 |
| | 52,497 |
| | (2,247 | ) | |
| Investment loss | | | — |
| | 2,377 |
|
| Other (income) expense, net | | (175,271 | ) | | 293 |
| | (173,626 | ) | | 1,056 |
| | (297 | ) | | 2,196 |
|
| Interest expense, net | | 29,344 |
| | 17,814 |
| | 76,322 |
| | 49,905 |
| | 31,065 |
| | 23,127 |
|
| Loss on extinguishment of debt | | 3,296 |
| | — |
| | 3,296 |
| | — |
| |
| Total other (income) expense | | (94,865 | ) |
| 20,851 |
| | (41,511 | ) |
| 48,714 |
| |
| Total other expense | | | 30,768 |
|
| 27,700 |
|
| Income before income taxes | | 327,502 |
| | 170,204 |
| | 685,259 |
| | 489,464 |
| | 229,319 |
| | 167,368 |
|
| Provision for income taxes | | 124,679 |
| | 40,586 |
| | 227,756 |
| | 132,503 |
| | 54,382 |
| | 43,675 |
|
| Net income | | $ | 202,823 |
|
| $ | 129,618 |
| | $ | 457,503 |
|
| $ | 356,961 |
| | $ | 174,937 |
|
| $ | 123,693 |
|
| Basic earnings per share | | $ | 2.23 |
| | $ | 1.40 |
| | $ | 4.99 |
| | $ | 3.85 |
| | $ | 1.95 |
| | $ | 1.34 |
|
| Diluted earnings per share | | $ | 2.18 |
| | $ | 1.36 |
| | $ | 4.87 |
| | $ | 3.75 |
| | $ | 1.88 |
| | $ | 1.31 |
|
| Weighted average shares outstanding: | | | | | | | | | | | | |
| Basic shares | | 90,751 |
| | 92,631 |
| | 91,619 |
| | 92,604 |
| | 89,765 |
| | 92,108 |
|
| Diluted shares | | 93,001 |
| | 95,307 |
| | 93,923 |
| | 95,204 |
| | 93,250 |
| | 94,560 |
|
|
|
1 Reflects the January 1, 2018 adoption of Accounting Standards Update 2014-09, "Revenue from Contracts with Customers (Topic 606)" and related cost capitalization guidance using the modified retrospective transition method. As a result of the application of the modified retrospective transition method, the Company's prior period results within its annual report on Form 10-K and quarterly reports on Form 10-Q will not be restated to reflect the impact of Topic 606. See footnote 1. |
|
| See accompanying notes to unaudited consolidated financial statements. |
FleetCorFLEETCOR Technologies, Inc. and Subsidiaries
Unaudited Consolidated Statements of Comprehensive Income
(In Thousands)
|
| | | | | | | | | | | | | | | | |
| | | Three Months Ended
September 30, | | Nine Months Ended
September 30, |
| | | 2017 | | 2016 | | 2017 | | 2016 |
| Net income | | $ | 202,823 |
| | $ | 129,618 |
| | $ | 457,503 |
| | $ | 356,961 |
|
| Other comprehensive (loss) income: | | | | | | |
| Foreign currency translation gains (losses), net of tax | | 112,301 |
| | (52,409 | ) | | 168,655 |
| | (41,339 | ) |
| Reclassification of foreign currency translation loss to investment, net of tax | | 31,381 |
| | — |
| | 31,381 |
| | — |
|
| Total other comprehensive income (loss) | | 143,682 |
|
| (52,409 | ) |
| 200,036 |
|
| (41,339 | ) |
| Total comprehensive income | | $ | 346,505 |
|
| $ | 77,209 |
|
| $ | 657,539 |
|
| $ | 315,622 |
|
|
| | | | | | | | |
| | | Three Months Ended
March 31, |
| | | 2018 | | 2017 |
| Net income | | $ | 174,937 |
| | $ | 123,693 |
|
| Other comprehensive income: | | | | |
| Foreign currency translation gains, net of tax | | 43,254 |
| | 93,614 |
|
| Total other comprehensive income | | 43,254 |
|
| 93,614 |
|
| Total comprehensive income | | $ | 218,191 |
|
| $ | 217,307 |
|
See accompanying notes to unaudited consolidated financial statements.
FleetCorFLEETCOR Technologies, Inc. and Subsidiaries
Unaudited Consolidated Statements of Cash Flows
| | | | | Nine Months Ended
September 30, | | Three Months Ended
March 31, |
| | | 2017 | | 2016 | | 2018¹ | | 2017¹ |
| Operating activities | | | | | | | | |
| Net income | | $ | 457,503 |
| | $ | 356,961 |
| | $ | 174,937 |
| | $ | 123,693 |
|
| Adjustments to reconcile net income to net cash provided by operating activities: | | | | | | | | |
| Depreciation | | 35,096 |
| | 25,706 |
| | 12,397 |
| | 10,667 |
|
| Stock-based compensation | | 68,897 |
| | 50,025 |
| | 14,403 |
| | 23,093 |
|
| Provision for losses on accounts receivable | | 35,949 |
| | 24,512 |
| | 11,997 |
| | 12,988 |
|
| Amortization of deferred financing costs and discounts | | 5,411 |
| | 5,568 |
| | 1,339 |
| | 1,914 |
|
| Amortization of intangible assets | | 158,897 |
| | 112,455 |
| | 57,836 |
| | 52,654 |
|
| Amortization of premium on receivables | | 4,738 |
| | 3,687 |
| | 1,269 |
| | 1,544 |
|
| Loss on extinguishment of debt | | 3,296 |
| | — |
| |
| Deferred income taxes | | (38,092 | ) | | (23,566 | ) | | (4,829 | ) | | (3,453 | ) |
| Investment loss (income) | | 52,497 |
| | (2,247 | ) | |
| Gain on disposition of business | | (174,984 | ) | | — |
| |
| Other non-cash operating income | | (49 | ) | | (690 | ) | |
| Changes in operating assets and liabilities (net of acquisitions and dispositions): | | | | | |
| Restricted cash | | (12,105 | ) | | (28,744 | ) | |
| Investment loss | | | — |
| | 2,377 |
|
| Other | | | (57 | ) | | — |
|
| Changes in operating assets and liabilities (net of acquisitions): | | | | | |
| Accounts and other receivables | | (440,011 | ) | | (527,255 | ) | | (288,152 | ) | | (236,564 | ) |
| Prepaid expenses and other current assets | | (86,648 | ) | | (1,291 | ) | | 32,074 |
| | (16,453 | ) |
| Other assets | | (15,378 | ) | | (9,115 | ) | | (7,101 | ) | | (2,673 | ) |
| Accounts payable, accrued expenses and customer deposits | | 364,473 |
| | 418,280 |
| | 194,589 |
| | 103,711 |
|
| Net cash provided by operating activities | | 419,490 |
|
| 404,286 |
| | 200,702 |
|
| 73,498 |
|
| Investing activities | | | | | | | | |
| Acquisitions, net of cash acquired | | (602,298 | ) | | (1,331,079 | ) | | (3,875 | ) | | — |
|
| Purchases of property and equipment | | (49,459 | ) | | (41,877 | ) | | (15,214 | ) | | (14,796 | ) |
| Proceeds from disposal of a business | | 316,501 |
| | — |
| |
| Other | | (6,327 | ) | | 1,411 |
| | (3,642 | ) | | (6,327 | ) |
| Net cash used in investing activities | | (341,583 | ) |
| (1,371,545 | ) | | (22,731 | ) |
| (21,123 | ) |
| Financing activities | | | | | | | | |
| Proceeds from issuance of common stock | | 20,192 |
| | 18,620 |
| | 19,975 |
| | 15,230 |
|
| Repurchase of common stock | | (402,392 | ) | | (35,492 | ) | | (88,292 | ) | | — |
|
| Borrowings on securitization facility, net | | 203,000 |
| | 42,000 |
| | 18,000 |
| | 85,000 |
|
| Deferred financing costs paid and debt discount | | (11,230 | ) | | (2,272 | ) | |
| Proceeds from issuance of notes payable | | 780,656 |
| | 600,000 |
| |
| Principal payments on notes payable | | (388,656 | ) | | (85,125 | ) | | (34,500 | ) | | (33,363 | ) |
| Borrowings from revolver – A Facility | | 845,000 |
| | 1,105,107 |
| |
| Payments on revolver – A Facility | | (804,808 | ) | | (670,940 | ) | |
| Borrowings from revolver | | | 420,258 |
| | 90,000 |
|
| Payments on revolver | | | (439,351 | ) | | (159,949 | ) |
| Borrowings on swing line of credit, net | | 7,800 |
| | 5,188 |
| | 5,009 |
| | 21,639 |
|
| Other | | 537 |
| | (673 | ) | | (92 | ) | | 537 |
|
| Net cash used in financing activities | | 250,099 |
|
| 976,413 |
| |
| Net cash (used in) provided by financing activities | | | (98,993 | ) |
| 19,094 |
|
| Effect of foreign currency exchange rates on cash | | 31,732 |
| | (50,871 | ) | | 12,653 |
| | 19,754 |
|
| Net increase (decrease) in cash and cash equivalents | | 359,738 |
| | (41,717 | ) | |
| Cash and cash equivalents, beginning of period | | 475,018 |
| | 447,152 |
| |
| Cash and cash equivalents, end of period | | $ | 834,756 |
|
| $ | 405,435 |
| |
| Net increase in cash and cash equivalents and restricted cash | | | 91,631 |
| | 91,223 |
|
| Cash and cash equivalents and restricted cash, beginning of period | | | $ | 1,130,870 |
| | 643,770 |
|
| Cash and cash equivalents and restricted cash, end of period | | | $ | 1,222,501 |
|
| $ | 734,993 |
|
| Supplemental cash flow information | | | | | | | | |
| Cash paid for interest | | $ | 79,144 |
| | $ | 48,525 |
| | $ | 35,634 |
| | $ | 33,190 |
|
| Cash paid for income taxes | | $ | 257,349 |
| | $ | 79,599 |
| | $ | 16,830 |
| | $ | 88,503 |
|
|
|
1 Reflects the January 1, 2018 adoption of Accounting Standards Update 2016-18, "Statement of Cash Flows (Topic 230)". The adoption of Topic 230 resulted in the presentation of the changes in the total of cash, cash equivalents and restricted cash on the consolidated statement of cash flows. |
| See accompanying notes to unaudited consolidated financial statements. |
FleetCorFLEETCOR Technologies, Inc. and Subsidiaries
Notes to Unaudited Consolidated Financial Statements
September 30, 2017March 31, 2018
1. Summary of Significant Accounting Policies
Basis of Presentation
Throughout this report, the terms “our,” “we,” “us,” and the “Company” refers to FleetCorFLEETCOR Technologies, Inc. and its subsidiaries. The Company prepared the accompanying interim consolidated financial statements in accordance with Rule 10-01 of Regulation S-X. Accordingly, they do not include all of the information and footnotes required by accounting principles generally accepted in the United States (“GAAP”). The unaudited consolidated financial statements reflect all adjustments considered necessary for fair presentation. These adjustments consist of normal recurring accruals and estimates that impact the carrying value of assets and liabilities. Actual results may differ from these estimates. Operating results for the three and nine month periods ended September 30, 2017 are not necessarily indicative of the results that may be expected for the year ending December 31, 2017.
The unaudited interim consolidated financial statements should be read in conjunction with the audited consolidated financial statements and notes thereto included in the Company’s Annual Report on Form 10-K for the year ended December 31, 2016.2017.
Foreign Currency Translation
Assets and liabilities of foreign subsidiaries are translated into U.S. dollars at the rates of exchange in effect at period-end. The related translation adjustments are made directly to accumulated other comprehensive income. Income and expenses are translated at the average monthly rates of exchange in effect during the period. Gains and losses from foreign currency transactions of these subsidiaries are included in net income. The Company recognized foreign exchange gains of $0.6$0.5 million and foreign exchange losses of $0.7$1.5 million in the three months ended September 30,March 31, 2018 and 2017, and 2016, respectively, which are recorded within other (income) expense, net in the Unaudited Consolidated Statements of Income. The Company recognized foreign exchange losses of $0.2 million and $1.5 million in the nine month periods ended September 30, 2017 and 2016, respectively.
Derivatives
WithThe Company, through its acquisition of Cambridge Global Payments ("Cambridge") in August 2017, the Company uses derivatives to facilitatesubsidiary, facilitates cross-currency corporate payments by writing derivatives to customers, which are not designated as hedging instruments. The majority of this business' revenue is from exchanges of currency at spot rates, which enable customers to make cross-currency payments. In addition, this businessthe Company also writes foreign currency forward and option contracts for its customers to facilitate future payments. The duration of these derivative contracts at inception is generally less than one year. The Company aggregates its foreign exchange exposures arising from customer contracts, including forwards, options and spot exchanges of currency, and hedges (economic hedge) the resulting net currency risks by entering into offsetting contracts with established financial institution counterparties. The changes in fair value related to these contracts are recorded in the Unaudited Consolidated Statements of Income.
The Company recognizes all derivatives in "prepaid expenses and other current assets" and "other current liabilities" in the accompanying Unaudited Consolidated Balance Sheets at their fair value. All cash flows associated with derivatives are included in cash flows from operating activities in the Unaudited Consolidated Statements of Cash Flows.
Adoption of New Accounting Standards
Revenue RecognitionImpact of Adoption of Topic 606
In May 2014, the FASB issued ASU 2014-09, "Revenue from Contracts with Customers (Topic 606).", which replaces numerous requirements in U.S. GAAP, including industry-specific requirements, and provides companies with a single revenue recognition model for recognizing revenue from contracts with customers. The core principle of ASU 2014-09 is that an entity should recognize revenue to depict the transfer of promised goods or services in an amount that reflects the consideration to which the entity expects to be entitled in exchange for those goods or services. ASU 2014-09 will replace most existing revenue recognition guidanceThe two permitted transition methods under the new standard are the full retrospective method, in GAAPwhich case the standard would be applied to each prior reporting period presented and permits the usecumulative effect of eitherapplying the retrospectivestandard would be recognized at the earliest period shown, or the modified retrospective transition method. The update requires significant additional disclosure aboutmethod, in which case the nature, amount, timing and uncertaintycumulative effect of revenue and cash flows arising from customer contracts, including significant judgments and changes in judgments.applying the standard would be recognized at the date of initial application. ASU 2014-09, as amended by ASU 2015-14, "Revenue from Contracts with Customers (Topic 606): Deferral of the Effective Date,"Date", is effective for years beginning after December 15, 2017, including interim periods, with early adoption permitted for years beginning after December 15, 2016. Since the issuance of ASU 2014-09, the FASB has issued additional interpretive guidance, including new accounting standardsstandard updates, thatwhich clarifies certain points of the standard and modifies certain requirements.
The Company has performed a review of
Effective January 1, 2018, we adopted Topic 606using the requirements of the new revenue standard and is monitoring the activity of the FASB and the transition resource group as it relates to specific interpretive guidance. The Company established an implementation team to assess the effects of the new revenue standard in a multi-phase approach. In the first phase, the Company is analyzing customermodified retrospective method, for contracts for its most significant contract categories, applied the five-step model of the new standard to each contract category and comparing the results to our current accounting practices. The second phase, which includes quantifying the potential effects identified during the first phase, assessing additional contract categories and principal versus agent considerations, revising accounting policies and considering the effects on related disclosures and/or internal control over financial reporting is ongoingthat were not completed as of the enddate of the third quarter.
The new standard could change the amount and timing of revenue and expensesinitial application, resulting in a cumulative effect adjustment to be recognized under certain of our arrangement types. In addition, it could also increase the administrative burden on our operations to account for customer contracts and provide the more expansive required disclosures. More judgment and estimates may be required within the process of applying the requirements of the new standard than are required under existing GAAP, such as identifying performance obligations in contracts, estimating the amount of variable consideration to include in transaction price, allocating transaction price to each separate performance obligation and estimating expected customer lives. The Company has not completed its assessment or quantified the effect the new guidance will have on its consolidated financial statements, related disclosures and/or its internal control over financial reporting. This assessment will occur over the remainder of the calendar year and will include evaluating the application of the principal vs. agent cost to obtain a contract guidance. However, the Company's preliminary view is that the expected amount and timing of revenue to be recognized under ASU 2014-09 for its most significant contract categories, fuel card payments, corporate payments, toll payments, lodging payments and gift cards, will be similar to the amount and timing of revenue recognized under our current accounting practices. The Company also may be required to capitalize additional costs to obtain contracts with customers, and, in some cases, may be required to amortize these costs over a contractual time period. Finally, the Company expects disclosures about its revenues and related customer acquisition costs will be more extensive.
The Company plans to adopt ASU 2014-09, as well as other clarifications and technical guidance issued by the FASB related to this new revenue standard,retained earnings on January 1, 2018. For contracts that were modified before January 1, 2018, the Company has not retrospectively restated contracts for those modifications but instead reflected the aggregate effect of these modifications when identifying the satisfied and unsatisfied performance obligations, as allowed within the transition practical expedients. The Company will apply the modified retrospective transition method, which would result in an adjustmentcumulative impact to our retained earnings forat January 1, 2018 was $30.9 million, due to the cumulative effect, if any,capitalization of applyingcosts to acquire contracts under the new standard, with a corresponding increase to contractsprepaid expense and other current assets of $10.2 million, other assets of $30.3 million and deferred income taxes (liabilities) of $9.6 million. Additionally, under the new standard certain costs (e.g., merchant commissions and fees paid to credit card associations) will be presented net in revenues as the amounts represent payments to our customers that are not completed atconsidered in exchange for a distinct good or service that the date of initial application. Under this method, the Company would not restate the prior financial statements presented, therefore the new standard requires the Company to provide additional disclosures of the amount by which each financial statement line item is affected in the current reporting period during 2018, as comparedcustomer transfers to the Company.
The impact to our fiscal quarter ended March 31, 2018, revenue, operating expenses, income from continuing operations after taxes, net income and basic and diluted earnings per share (EPS) was as follows:
|
| | | | | | | | | | | | |
| | | Three Months Ended March 31, |
| | | 2018 As Reported | | Impact of Topic 606 | | 2018 Prior to Adoption |
| Revenues, net | | $ | 585,500 |
| | $ | 24,218 |
| | $ | 609,718 |
|
| Expenses: | | | | | | |
| Merchant commissions | | — |
| | 26,903 |
| | 26,903 |
|
| Processing | | 116,485 |
| | (2,071 | ) | | 114,414 |
|
| Selling | | 47,111 |
| | 2,120 |
| | 49,231 |
|
| General and administrative | | 90,315 |
| | — |
| | 90,315 |
|
| Depreciation and amortization | | 71,502 |
| | — |
| | 71,502 |
|
| Operating income | | 260,087 |
| | (2,734 | ) | | 257,353 |
|
| Total other expense | | 30,768 |
| | — |
| | 30,768 |
|
| Income before income taxes | | 229,319 |
| | (2,734 | ) | | 226,585 |
|
| Provision for income taxes | | 54,382 |
| | (757 | ) | | 53,625 |
|
| Net income | | $ | 174,937 |
| | $ | (1,977 | ) | | $ | 172,960 |
|
| Basic earnings per share | | $ | 1.95 |
| | $ | (0.02 | ) | | $ | 1.93 |
|
| Diluted earnings per share | | $ | 1.88 |
| | $ | (0.02 | ) | | $ | 1.86 |
|
The adoption of Topic 606 did not impact our accounting for revenues derived from late fees, finance charges, and certain other charge card fees or certain of our foreign currency contracts, which continue to be accounted for under existing authoritative guidance, that was in effect before the change, and an explanation of the reasons for significant changes, if any.as discussed further below.
Accounting for Leases
In February 2016, the FASB issued ASU 2016-02, “Leases”, which requires lessees to recognize a right-of-use asset and a lease liability on the balance sheet for all leases with the exception of short-term leases. This ASU also requires disclosures to provide additional information about the amounts recorded in the financial statements. This ASU is effective for the Company for annual periods beginning after December 15, 2018 and interim periods therein. Early adoption is permitted. The new standard must be adopted using a modified retrospective transition and requires application of the new guidance for leases that exist or are entered into after the beginning of the earliest comparative period presented. The Company is currently evaluating the impact of ASU 2016-02 on our consolidated financial statements; however, we expectthe Company expects to recognize right of use assets and liabilities for ourits operating leases in the consolidated balance sheet upon adoption.
Accounting for Breakage
In March 2016, the FASB issued ASU 2016-04, “Liabilities-Extinguishments of Liabilities: Recognition of Breakage for Certain Prepaid Stored-Value Products”, which requires entities that sell prepaid stored value products redeemable for goods, services or cash at third-party merchants to derecognize liabilities related to those products for breakage. This ASU is effective for the Company for reporting periods beginning after December 15, 2017. Early adoption is permitted. The ASU must be adopted using either a modified retrospective approach with a cumulative effect adjustment to retained earnings as of the beginning of the period of adoption or a full retrospective approach. The Company’s adoption of this ASU is not expected to have a materialhad no impact on the results of operations, financial condition, or cash flows.
Intra-Entity Transfers
In October 2016, the FASB issued ASU 2016-16 “Income Taxes (Topic 740): Intra-Entity Transfers of Assets Other Than Inventory.” The new guidance requires the recognition of the income tax consequences of an intercompany asset transfer, other than transfers of inventory, when the transfer occurs. For intercompany transfers of inventory, the income tax effects will continue to be deferred until the inventory has been sold to a third party. The Company adopted this ASU on January 1, 2018 which resulted in an increase of approximately $17.1 million to retained earnings and deferred tax assets net of valuation allowances.
Cash Flow Classification
In August 2016, the FASB issued ASU 2016-15, "Classification of Certain Cash Receipts and Cash Payments", which amends the guidance in ASC 230, Statement of Cash Flows. This amended guidance reduces the diversity in practice that has resulted from the lack of consistent principles related to the classification of certain cash receipts and payments in the statement of cash flows. This ASU is effective for the Company for reporting periods beginning after December 15, 2017. Early adoption is permitted. Entities must apply the guidance retrospectively to all periods presented but may apply it prospectively from the earliest date practicable if retrospective application would be impracticable. The Company’sCompany adopted this new guidance on January 1, 2018. The adoption of this ASU isnew guidance did not expected to have a material impact on the results of operations, financial condition, or financial condition.
cash flows.
In November 2016, the FASB issued ASU 2016-18, "Statement of Cash Flows (Topic 230): Restricted Cash", which amends the guidance in ASC 230, Statement of Cash Flows, on the classification and presentation of restricted cash in the statement of cash flows. This ASU is effective for the Company for reporting periods beginning after December 15, 2017. Early2017 and changes due to adoption is permitted. If an entity early adopts the amendments in an interim period, any adjustments should be reflected as of the beginning of the fiscal year that includes that interim period. The amendments in this ASU should beare applied using a retrospective transition method to each period presented. The Company is evaluating what impact if any theadopted this new guidance on January 1, 2018, and applied retrospectively to results for 2017. The adoption of this ASU will have onTopic 230 resulted in the resultsstatement of operations, financial condition, or cash flows.flows presenting the changes in the total of cash, cash equivalents and restricted cash.
Intangibles - Goodwill and Other Impairment
In January 2017, the FASB issued ASU 2017-04, "Simplifying the Test for Goodwill Impairment,Impairment", which eliminates the requirement to calculate the implied fair value of goodwill (i.e., Step 2 of the goodwill impairment test) to measure a goodwill impairment charge. Instead, entities will record an impairment charge based on the excess of a reporting unit’s carrying amount over its fair value (i.e., measure the charge based on Step 1). The standard has tiered effective dates, starting in 2020 for calendar-year public business entities that meet the definition of an SEC filer. Early adoption is permitted for interim and annual goodwill impairment testing dates after January 1, 2017. The Company’s adoption of this ASU is not expected to have a material impact on the results of operations, financial condition, or cash flows, unless a goodwill impairment is identified.
Definition of a Business
In January 2017, the FASB issued ASU 2017-01, "Clarifying the Definition of a Business", which amends the definition of a business to assist entities with evaluating when a set of transferred assets and activities is a business. The guidance requires an entity to evaluate if substantially all of the fair value of the gross assets acquired is concentrated in a single identifiable asset or a group of similar identifiable assets. If so, the set of transferred assets and activities is not a business. The guidance also requires a business to include at least one substantive process and narrows the definition of outputs. The guidance is effective for the Company for reporting periods beginning after December 15, 2017, and interim periods within those years. Early adoption is permitted. The Company’sCompany adopted this new guidance on January 1, 2018. The adoption of this ASU isnew guidance did not expected to have a material impact on the results of operations, financial condition, or cash flows, however it could result in accounting for acquisitions as asset acquisitions versus business combinations upon adoption.flows.
Accounting for Modifications to Stock-Based Compensation
In May 2017, the FASB issued ASU 2017-09, "Compensation—Stock Compensation (Topic 718): Scope of Modification Accounting", which amends the scope of modification accounting for share-based payment arrangements. The ASU provides guidance on the types of changes to the terms or conditions of share-based payment awards to which an entity would be required to apply modification accounting under ASC 718. Specifically, an entity would not apply modification accounting if the fair value, vesting conditions and classification of the awards are the same immediately before and after the modification. The guidance is effective for the Company for reporting periods beginning after December 15, 2017, and interim periods within those years. Early adoption is permitted. The Company'sCompany adopted this new guidance on January 1, 2018. The adoption of this ASU isnew guidance did not expected to have a material impact on the results of operations, financial condition, or cash flows.
Accounting for Derivative Financial Instruments
In August 2017, the FASB issued ASU 2017-12, "Derivatives and Hedging (Topic 815): Targeted Improvements to Accounting for Hedging Activities", which amends the hedge accounting recognition and presentation requirements in ASC 815. The FASB issued accounting guidance to better align hedge accounting with a company’s risk management activities, simplify the application of hedge accounting and improve the disclosures of hedging arrangements. The guidance is effective for the Company for reporting periods beginning after December 15, 2018, and interim periods within those years. Early adoption is permitted. The Company's adoption of this ASU is not expected to have a material impact on the results of operations, financial condition, or cash flows.
Comprehensive Income Classification
In February 2018, the FASB issued ASU 2018-02, "Income Statement - Reporting Comprehensive Income (Topic 220): Reclassification of Certain Tax Effects from Accumulated Other Comprehensive Income", that gives entities the option to reclassify to retained earnings tax effects related to items that have been stranded in accumulated other comprehensive income as a result of the Tax Cuts and Jobs Act (the "Tax Act"). An entity that elects to reclassify these amounts must reclassify stranded tax effects related to the Tax Act’s change in U.S. federal tax rate for all items accounted for in other comprehensive income. These entities can also elect to reclassify other stranded effects that relate to the Tax Act but do not directly relate to the change in the federal rate. For all entities, the guidance is effective for fiscal years beginning after December 15, 2018, and interim periods within those fiscal years. Early adoption is permitted for periods for which financial statements have not yet been issues or made available for issuance. Entities can choose whether to apply the amendments retrospectively to each period in which the effect of the Tax Act is recognized or to apply the amendments in the period of adoption. The Company's adoption of this ASU is not expected to have a material impact on the results of operations, financial condition, or cash flows.
2. Revenue Recognition
The Company provides payment solutions to our business, merchant, consumer and payment network customers. Our payment solutions are primarily focused on specific commercial spend categories, including fuel, lodging, tolls, and general corporate payments, as well as gift card solutions (stored value cards). The Company provides products that assist businesses of all sizes control, simplify and secure payment of various domestic and cross-border payables using specialized payment products. The Company also provides other payment solutions for fleet maintenance, employee benefits and long haul transportation-related services.
Payment Services
The Company’s primary performance obligation for the majority of its payment solution products (fuel, lodging, tolls, corporate payments, among others) is to stand-ready to provide authorization and processing services (Payment Services) for an unknown or unspecified quantity of transactions and the consideration received is contingent upon the customer���s use (e.g., number of transactions submitted and processed) of the related payment service. Accordingly, the total transaction price is variable. The Payment Services is a series of distinct daily services that are substantially the same, with the same pattern of transfer to the customer. As a result, the Company allocates and recognizes variable consideration in the period it has the contractual right to invoice the customer.
The Company records revenue for its payment services net of (i) the cost of the underlying products and services; (ii) assessments and other fees charged by the credit and debit payment networks (along with any rebates provided by them); (iii) customer rebates and other discounts; and (iv) taxes assessed (e.g. VAT and VAT-like taxes) by a government, imposed concurrent with, a revenue producing transaction.
The majority of the transaction price the Company receives for fulfilling the Payment Services performance obligation are comprised of one or a combination of the following: 1) interchange fees earned from the payment networks; 2) discount fees earned from merchants; 3) fees calculated based on a number of transactions processed; and 4) fees calculated based upon a percentage of the transaction value of fuel, food, toll and transportation cards and vouchers.
The Company recognizes revenue when the underlying transactions are complete and its performance obligations are satisfied. Transactions are considered complete depending upon the related payment solution but generally when the Company has authorized the transaction, validated that the transaction has no errors and accepted and posted the data to the Company’s records.
The Company's performance obligation for its foreign exchange payment services is providing a foreign currency payment to a customer’s designated recipient and therefore, the Company recognizes revenue on foreign exchange payment services when the underlying payment is made. Revenues from foreign exchange and payment services are primarily comprised of the difference between the exchange rate set by the Company to the customer and the rate available in the wholesale foreign exchange market.
Gift Card Products and Services
The Company’s Gift product line delivers both stored value cards and card-based services primarily in the form of gift cards to retailers. These services each represent performance obligations that are separate and distinct. Revenue for stored valued cards are recognized (gross of the underlying cost of the related card) at the point in time when control passes to the Company's customer, which is generally upon shipment.
Card-based services consist of transaction processing and reporting of gift card transactions where the Company recognizes revenue based on output measure of elapsed time for an unknown or unspecified quantity of transactions. As a result, the
Company will allocate and recognize variable consideration over the estimated period of time over which the performance obligation is satisfied.
Other
The Company accounts for revenue from late fees and finance charges, in jurisdictions where permitted under local regulations, primarily in the U.S. and Canada in accordance with ASC 310, "Receivables". Such fees are recognized net of a provision for estimated uncollectible amounts, at the time the fees and finance charges are assessed and services are provided. The Company ceases billing and accruing for late fees and finance charges approximately 30 - 40 days after the customer’s balance becomes delinquent.
The Company also writes foreign currency forward and option contracts for its customers to facilitate future payments in foreign currencies, and recognizes revenue in accordance with authoritative fair value and derivative accounting (ASC 815, " Derivatives").
Revenue is also derived from the sale of equipment in certain of the Company’s businesses, which is recognized at the time the device is sold and the risks and rewards of ownership have passed. This revenue is recognized gross of the cost of sales related to the equipment in "revenues, net" within the Unaudited Consolidated Statements of Income. The related cost of sales for the equipment is recorded within "processing expenses" in the Unaudited Consolidated Statements of Income.
Disaggregation of Revenues
The Company provides its services to customers across different payment solutions and geographies. Revenue by product (in millions) for the three months ended March 31, 2018 was as follows:
|
| | | | | | |
| Revenue, net by Product Category | Three Months Ended March 31, |
| | 2018 | | % |
| Fuel Cards | $ | 259 |
| | 44 | % |
| Corporate Payments | 95 |
| | 16 | % |
| Tolls | 91 |
| | 16 | % |
| Lodging | 39 |
| | 7 | % |
| Gift | 49 |
| | 8 | % |
| Other | 53 |
| | 9 | % |
| Consolidated Revenues, net | $ | 586 |
| | 100 | % |
Revenue by geography (in millions) for the three months ended March 31, 2018 was as follows:
|
| | | | | | |
| Revenue, net by Geography | Three Months Ended March 31, |
| | 2018 | | % |
| United States | $ | 344 |
| | 59 | % |
| Brazil | 107 |
| | 18 | % |
| United Kingdom | 64 |
| | 11 | % |
| Other | 71 |
| | 12 | % |
| Consolidated Revenues, net | $ | 586 |
| | 100 | % |
Contract Liabilities
Deferred revenue contract liabilities for customers subject to Topic 606 were $23.0 million and $24.7 million as of March 31, 2018 and January 1, 2018, respectively. We expect to recognize these amounts in revenues within approximately 6 months. Revenue recognized in the three months ended March 31, 2018, that was included in the deferred revenue contract liability as of January 1, 2018 was approximately $21 million.
Costs to Obtain or Fulfill a Contract
With the adoption of Topic 606, the Company began capitalizing the incremental costs of obtaining a contract with a customer if the Company expects to recover those costs. The incremental costs of obtaining a contract are those that the Company incurs to obtain a contract with a customer that it would not have incurred if the contract had not been obtained (for example, a sales commission).
Costs incurred to fulfill a contract are capitalized if those costs meet all of the following criteria:
| |
| a. | The costs relate directly to a contract or to an anticipated contract that the Company can specifically identify. |
| |
| b. | The costs generate or enhance resources of the Company that will be used in satisfying (or in continuing to satisfy) performance obligations in the future. |
| |
| c. | The costs are expected to be recovered. |
In order to determine the appropriate amortization period for contract costs, the Company considered a combination of factors, including customer attrition rates, estimated terms of customer relationships, the useful lives of technology used by the Company to provide products and services to its customers, whether further contract renewals are expected and if there is any incremental commission to be paid on a contract renewal. Contract acquisition and fulfillment costs are amortized using the straight-line method over the expected period of benefit (ranging from five to ten years). Costs to obtain a contract with an expected period of benefit of one year or less are recognized as an expense when incurred. The amortization of contract acquisition costs associated with sales commissions that qualify for capitalization will be recorded as selling expense in the Company’s Unaudited Consolidated Statements of Income. The amortization of contract acquisition costs associated with cash payments for client incentives are included as a reduction of revenues in the Company’s Unaudited Consolidated Statements of Income. During the three months ended March 31, 2018, amortization of capitalized contract costs recorded in selling expense was $3.3 million.
Costs to obtain or fulfill a contract are classified as contract cost assets within "prepaid expenses and other current assets" and "other assets" in the Company’s Unaudited Consolidated Balance Sheets. At March 31, 2018, the Company had capitalized costs to obtain a contract of $11.2 million within prepaid expenses and $32.2 million within "other assets" in the Company’s Unaudited Consolidated Balance Sheets, respectively.
Practical Expedients
Topic 606 requires disclosure of the aggregate amount of the transaction price allocated to unsatisfied performance obligations; however, as allowed by Topic 606, the Company has elected to exclude this disclosure for any contracts with an original duration of one year or less and any variable consideration that meets specified criteria. As described above, the Company's most significant performance obligations consist of variable consideration under a stand-ready series of distinct days of service. Such variable consideration meets the specified criteria for the disclosure exclusion; therefore, the majority of the aggregate amount of transaction price that is allocated to performance obligations that have not yet been satisfied is variable consideration that is not required for this disclosure. The aggregate fixed consideration portion of customer contracts with an initial contract duration greater than one year is not material.
The Company has elected to exclude all sales taxes and other similar taxes from the transaction price. Accordingly, the Company presents all collections from customers for these taxes on a net basis, rather than having to assess whether the Company is acting as an agent or a principal in each taxing jurisdiction.
In certain arrangements with customers, the Company has determined that certain promised services and products are immaterial in the context of the contract, both quantitatively and qualitatively.
As a practical expedient, the Company is not required to adjust the promised amount of consideration for the effects of a significant financing component if the Company expects, at contract inception, that the period between when the Company transfers a promised service or product to a customer and when the customer pays for the service or product will be one year or less. As of March 31, 2018, the Company’s contracts with customers did not contain a significant financing component.
The Company adopted Topic 606 as of January 1, 2018, using the modified retrospective method for all contracts not completed as of the date of adoption. For contracts that were modified before the effective date, the Company utilized a practical expedient to consider the aggregate effect of all modifications when identifying performance obligations and allocating transaction price.
3. Accounts Receivable
The Company maintains a $950 million revolving trade accounts receivable Securitization Facility. Accounts receivable collateralized within our Securitization Facility relate to our U.S. trade receivables resulting from charge card activity. Pursuant to the terms of the Securitization Facility, the Company transfers certain of its domestic receivables, on a revolving basis, to FleetCorFLEETCOR Funding LLC (Funding) a wholly-owned bankruptcy remote subsidiary. In turn, Funding sells, without recourse,transfers, on a revolving basis, up to $950 million of undivided ownership interests in this pool of accounts receivable to a multi-seller, asset-backed commercial paper conduit (Conduit). Funding maintains a subordinated interest, in the form of over-collateralization, in a portion of the receivables sold to the Conduit. Purchases by the Conduit are financed with the sale of highly-rated commercial paper.
The Company utilizes proceeds from the sale of its accounts receivabletransferred assets as an alternative to other forms of financing to reduce its overall borrowing costs. The Company has agreed to continue servicing the sold receivables for the financial institution at market
rates, which approximates the Company’s cost of servicing. The Company retains a residual interest in the accounts
receivable sold as a form of credit enhancement. The residual interest’s fair value approximates carrying value due to its short-term nature. Funding determines the level of funding achieved by the sale of trade accounts receivable, subject to a maximum amount.
The Company’s consolidated balance sheetsUnaudited Consolidated Balance Sheets and statementsStatements of incomeIncome reflect the activity related to securitized accounts receivable and the corresponding securitized debt, including interest income, fees generated from late payments, provision for losses on accounts receivable and interest expense. The cash flows from borrowings and repayments, associated with the securitized debt, are presented as cash flows from financing activities.
The Company’s accounts receivable and securitized accounts receivable include the following at September 30, 2017March 31, 2018 and December 31, 20162017 (in thousands):
| | | | | September 30, 2017 | | December 31, 2016 | | March 31, 2018 | | December 31, 2017 |
| Gross domestic accounts receivable | | $ | 651,328 |
| | $ | 529,885 |
| | $ | 829,905 |
| | $ | 661,677 |
|
| Gross domestic securitized accounts receivable | | 794,000 |
| | 591,000 |
| | 829,000 |
| | 811,000 |
|
| Gross foreign receivables | | 852,706 |
| | 704,630 |
| | 910,846 |
| | 804,365 |
|
| Total gross receivables | | 2,298,034 |
|
| 1,825,515 |
| | 2,569,751 |
|
| 2,277,042 |
|
| Less allowance for doubtful accounts | | (47,779 | ) | | (32,506 | ) | | (48,989 | ) | | (46,031 | ) |
| Net accounts and securitized accounts receivable | | $ | 2,250,255 |
|
| $ | 1,793,009 |
| | $ | 2,520,762 |
|
| $ | 2,231,011 |
|
A rollforward of the Company’s allowance for doubtful accounts related to accounts receivable for nine monthsthe three month period ended September 30March 31 is as follows (in thousands):
| | | | | 2017 | | 2016 | | 2018 | | 2017 |
| Allowance for doubtful accounts beginning of period | | $ | 32,506 |
| | $ | 21,903 |
| | $ | 46,031 |
| | $ | 32,506 |
|
| Provision for bad debts | | 35,949 |
| | 24,512 |
| | 11,997 |
| | 12,988 |
|
| Write-offs | | (20,676 | ) | | (16,343 | ) | | (9,039 | ) | | (4,509 | ) |
| Allowance for doubtful accounts end of period | | $ | 47,779 |
| | $ | 30,072 |
| | $ | 48,989 |
| | $ | 40,985 |
|
3.4. Fair Value Measurements
Fair value is a market-based measurement that reflects assumptions that market participants would use in pricing an asset or liability. GAAP discusses valuation techniques, such as the market approach (comparable market prices), the income approach (present value of future income or cash flow), and the cost approach (cost to replace the service capacity of an asset or replacement cost). These valuation techniques are based upon observable and unobservable inputs. Observable inputs reflect market data obtained from independent sources, while unobservable inputs reflect the Company’s market assumptions.
As the basis for evaluating such inputs, a three-tier value hierarchy prioritizes the inputs used in measuring fair value as follows:
Level 1: Observable inputs such as quoted prices for identical assets or liabilities in active markets.
Level 2: Observable inputs other than quoted prices that are directly or indirectly observable for the asset or liability, including quoted prices for similar assets or liabilities in active markets; quoted prices for similar or identical assets or liabilities in markets that are not active; and model-derived valuations whose inputs are observable or whose significant value drivers are observable.
Level 3: Unobservable inputs for which there is little or no market data, which require the reporting entity to develop its own assumptions. The fair value hierarchy also requires an entity to maximize the use of observable inputs and minimize the use of unobservable inputs when measuring fair value.
The following table presents the Company’s financial assets and liabilities which are measured at fair values on a recurring basis as of September 30, 2017at March 31, 2018 and December 31, 2016,2017, (in thousands).
| | | | | Fair Value | | Level 1 | | Level 2 | | Level 3 | | Fair Value | | Level 1 | | Level 2 | | Level 3 |
| September 30, 2017 | | | | | | | | | |
| March 31, 2018 | | | | | | | | | |
| Assets: | | | | | | | | | | | | | | | | |
| Repurchase agreements | | $ | 363,335 |
| | $ | — |
| | $ | 363,335 |
| | $ | — |
| | $ | 498,216 |
| | $ | — |
| | $ | 498,216 |
| | $ | — |
|
| Money market | | 50,341 |
| | — |
| | 50,341 |
| | — |
| | 50,462 |
| | — |
| | 50,462 |
| | — |
|
| Certificates of deposit | | 9,370 |
| | — |
| | 9,370 |
| | — |
| | 5,621 |
| | — |
| | 5,621 |
| | — |
|
| Foreign exchange contracts | | 111,235 |
| | 28 |
| | 111,207 |
| | — |
| | 37,849 |
| | — |
| | 37,849 |
| |
|
|
| Total assets | | $ | 534,281 |
|
| $ | 28 |
|
| $ | 534,253 |
|
| $ | — |
| |
| Total cash equivalents | | | $ | 592,148 |
| | $ | — |
| | $ | 592,148 |
| | $ | — |
|
| Cash collateral for foreign exchange contracts | | $ | 33,911 |
| | $ | — |
| | $ | — |
| | $ | — |
| | $ | 11,046 |
| | $ | — |
| | $ | — |
| | $ | — |
|
| | | | | | | | | | |
| Liabilities: | | | | | | | | | | | | | | | | |
| Foreign exchange contracts contracts | | $ | 106,175 |
| | $ | 353 |
| | $ | 105,822 |
| | — |
| |
| Foreign exchange contracts | | | $ | 23,903 |
| | $ | — |
| | $ | 23,903 |
| | — |
|
| Total liabilities | | $ | 106,175 |
| | $ | 353 |
| | $ | 105,822 |
| | | | $ | 23,903 |
| | $ | — |
| | $ | 23,903 |
| | $ | — |
|
| Cash collateral obligation for foreign exchange contracts | | $ | 20,272 |
| | $ | — |
| | $ | — |
| | $ | — |
| | $ | 10,586 |
| | $ | — |
| | $ | — |
| | $ | — |
|
| | | | | | | | | | | | | | | | | |
| December 31, 2016 | | | | | | | | | |
| December 31, 2017 | | | | | | | | | |
| Assets: | | | | | | | | | | | | | | | | |
| Repurchase agreements | | $ | 232,131 |
| | $ | — |
| | $ | 232,131 |
| | $ | — |
| | $ | 420,838 |
| | $ | — |
| | $ | 420,838 |
| | $ | — |
|
| Money market | | 50,179 |
| | — |
| | 50,179 |
| | — |
| | 50,423 |
| | — |
| | 50,423 |
| | — |
|
| Certificates of deposit | | 48 |
| | — |
| | 48 |
| | — |
| | 7,417 |
| | — |
| | 7,417 |
| | — |
|
| Foreign exchange contracts | | | 39,045 |
| | 10 |
| | 39,035 |
| | — |
|
| Total cash equivalents | | $ | 282,358 |
|
| $ | — |
|
| $ | 282,358 |
|
| $ | — |
| | $ | 517,723 |
| | $ | 10 |
| | $ | 517,713 |
| | $ | — |
|
| Cash collateral for foreign exchange contracts | | | $ | 12,540 |
| | $ | — |
| | $ | — |
| | $ | — |
|
| Liabilities: | | | | | | | | | |
| Foreign exchange contracts | | | $ | 26,888 |
| | $ | 67 |
| | $ | 26,821 |
| | $ | — |
|
| Total liabilities | | | $ | 26,888 |
| | $ | 67 |
| | $ | 26,821 |
| | $ | — |
|
| Cash collateral obligation for foreign exchange contracts | | | $ | 10,882 |
| | $ | — |
| | $ | — |
| | $ | — |
|
The Company has highly-liquid investments classified as cash equivalents, with original maturities of 90 days or less, included in our Unaudited Consolidated Balance Sheets. The Company utilizes Level 2 fair value determinations derived from directly or indirectly observable (market based) information to determine the fair value of these highly liquid investments. The Company has certain cash and cash equivalents that are invested on an overnight basis in repurchase agreements, money markets and certificates of deposit. The value of overnight repurchase agreements is determined based upon the quoted market prices for the treasury securities associated with the repurchase agreements. The value of money market instruments is the financial institutions' month-end statement, as these instruments are not tradeable and must be settled directly by us with the respective financial institution. Certificates of deposit are valued at cost, plus interest accrued. Given the short-term nature of these instruments, the carrying value approximates fair value. Foreign exchange derivative contracts are carried at fair value, with changes in fair value recognized in the Unaudited Consolidated Statements of Income. The fair value of the Company's derivatives is derived with reference to a valuation from a derivatives dealer operating in an active market, which the Company accepts as the fair value of these instruments. The fair value represents what would be received and or paid by the Company if the contracts were terminated as of the reporting date. Cash collateral received for foreign exchange derivatives is recorded within customer deposits in ourthe Company's Unaudited Consolidated Balance SheetsSheet at September 30, 2017.March 31, 2018. Cash collateral paid for foreign exchange derivatives is recorded within restricted cash and cash equivalents in ourthe Company's Unaudited Consolidated Balance SheetsSheet at September 30, 2017.March 31, 2018.
The level within the fair value hierarchy and the measurement technique are reviewed quarterly. Transfers between levels are deemed to have occurred at the end of the quarter. There were no transfers between fair value levels during the periods presented for 20172018 and 2016.2017.
The Company’s assets that are measured at fair value on a nonrecurring basis andor are evaluated with periodic testing for impairment include property, plant and equipment, investments, goodwill and other intangible assets. Estimates of the fair value of assets acquired and liabilities assumed in business combinations are generally developed using key inputs such as management’s projections of cash flows on a held-and-used basis (if applicable), discounted as appropriate, management’s
projections of cash flows upon disposition and discount rates. Accordingly, these fair value measurements are in Level 3 of the fair value hierarchy. See footnote 13 for discussion of Masternaut's other than temporary decline in fair value during the third quarter of 2017.
The fair value of the Company’s cash, accounts receivable, securitized accounts receivable and related facility, prepaid expenses and other current assets, accounts payable, accrued expenses, customer deposits and short-term borrowings approximate their respective carrying values due to the short-term maturities of the instruments. The carrying value of the Company’s debt obligations approximates fair value as the interest rates on the debt are variable market based interest rates that
reset on a quarterly basis. These are each Level 2 fair value measurements, except for cash, which is a Level 1 fair value measurement.
4.5. Stockholders' Equity
On February 4, 2016, the Company's Board of Directors approved a stock repurchase program (the "Program") under which the Company may purchase up to an aggregate of $500 million of its common stock over the following 18 month period. On July 27, 2017, the Company's Board of Directors authorized an increase in the size of the Program by an additional $250 million and an extension of the Program by an additional 18 months. On November 1, 2017, the Company announced that its Board of Directors had authorized an increase in the size of the Program by an additional $350 million, resulting in total aggregate repurchases authorized under the Program of $1.1 billion. With the increase and giving effect to the Company's $590.1$678.4 million of previous repurchases, the Company may repurchase up to $510$421.6 million in shares of its common stock at any time prior to February 1, 2019.
Any stock repurchases may be made at times and in such amounts as deemed appropriate. The timing and amount of stock repurchases, if any, will depend on a variety of factors including the stock price, market conditions, corporate and regulatory requirements, and any additional constraints related to material inside information the Company may possess. Any repurchases have been and are expected to be funded by a combination of available cash flow from the business, working capital and debt.
On August 3, 2017, as part of the Program, the Company entered an Accelerated Share Repurchase agreement ("ASR Agreement") with a third-party financial institution to repurchase $250 million of its common stock. Pursuant to the ASR Agreement, the Company delivered $250 million in cash and received 1,491,647 shares based on a stock price of $142.46 on August 7, 2017. The ASR Agreement was completed on September 7, 2017, at which time the Company received 263,012 additional shares based on a final weighted average per share purchase price during the repurchase period of $142.48.
The Company accounted for the ASR Agreement as two separate transactions: (i) as shares of reacquired common stock for the shares delivered to us upon effectiveness of the ASR Agreement and (ii) as a forward contract indexed to the Company's common stock for the undelivered shares. The initial delivery of shares was included in treasury stock at cost and results in an immediate reduction of the outstanding shares used to calculate the weighted average common shares outstanding for basic and diluted earnings per share. The forward contracts indexed to our own common stock met the criteria for equity classification, and these amounts were initially recorded in additional paid-in capital and then reclassified to treasury stock upon completion of the ASR agreement.
Since the beginning of the Program, 4,114,1044,556,729 shares for an aggregate purchase price of $590.1$678.4 million have been repurchased. There were 2,854,959442,625 shares totaling $402.4$88.3 million repurchased under the Program during the ninethree months ended September 30, 2017.March 31, 2018.
5.6. Stock-Based Compensation
The Company has Stock Incentive Plans (the Plans) pursuant to which the Company’s Boardboard of Directorsdirectors may grant stock options or restricted stock to employees.
On February 7, 2018, the stockholders of the Company approved the FleetCor Technologies, Inc. Amended and Restated 2010 Equity Incentive Plan (the "Amended Plan"). The Amended Plan was authorized and approved by the Company's Board of Directors on December 20, 2017, and Company's stockholders at a meeting held on February 7, 2018. The Amended Plan amends the Registrant’s existing 2010 Equity Incentive Plan (as amended, the "Prior Plan") to, among other things, increase the number of shares of common stock available for issuance from 13,250,000 to 16,750,000 and make certain other amendments to the Prior Plan.
The table below summarizes the expense recognized related to share-based payments recognized for the three and nine month periodsperiod ended September 30March 31 (in thousands):
| | | | | Three Months Ended
September 30, | | Nine Months Ended
September 30, | | Three Months Ended
March 31, |
| | | 2017 | | 2016 | | 2017 | | 2016 | | 2018 | | 2017 |
| Stock options | | $ | 16,212 |
| | $ | 8,304 |
| | $ | 42,254 |
| | $ | 25,942 |
| | $ | 10,699 |
| | $ | 12,089 |
|
| Restricted stock | | 8,443 |
| | 9,101 |
| | 26,643 |
| | 24,083 |
| | 3,704 |
| | 11,004 |
|
| Stock-based compensation | | $ | 24,655 |
|
| $ | 17,405 |
|
| $ | 68,897 |
|
| $ | 50,025 |
| | $ | 14,403 |
|
| $ | 23,093 |
|
The tax benefits recorded on stock based compensation were $36.1$8.1 million and $28.4$15.0 million for the ninethree month periodsperiod ended September 30,March 31, 2018 and 2017, and 2016, respectively.
The following table summarizes the Company’s total unrecognized compensation cost related to stock-based compensation as of September 30, 2017March 31, 2018 (cost in thousands):
| | | | | Unrecognized Compensation Cost | | Weighted Average Period of Expense Recognition (in Years) | | Unrecognized Compensation Cost | | Weighted Average Period of Expense Recognition (in Years) |
| Stock options | | $ | 96,594 |
| | 1.52 | | $ | 80,807 |
| | 1.63 |
| Restricted stock | | 12,425 |
| | 0.43 | | 21,634 |
| | 0.83 |
| Total | | $ | 109,019 |
| | | $ | 102,441 |
| |
Stock Options
Stock options are granted with an exercise price estimated to be equal to the fair market value of the Company's stock on the date of grant as authorized by the Company’s Boardboard of Directors.directors. Options granted have vesting provisions ranging from one to five years and vesting of the options is generally based on the passage of time or performance. Stock option grants are subject to forfeiture if employment terminates prior to vesting.
The following summarizes the changes in the number of shares of common stock under option for the ninethree month period ended September 30, 2017March 31, 2018 (shares and aggregate intrinsic value in thousands):
| | | | | Shares | | Weighted Average Exercise Price | | Options Exercisable at End of Period | | Weighted Average Exercise Price of Exercisable Options | | Weighted Average Fair Value of Options Granted During the Period | | Aggregate Intrinsic Value | | Shares | | Weighted Average Exercise Price | | Options Exercisable at End of Period | | Weighted Average Exercise Price of Exercisable Options | | Weighted Average Fair Value of Options Granted During the Period | | Aggregate Intrinsic Value |
| Outstanding at December 31, 2016 | | 6,146 |
| | $ | 91.20 |
| | 3,429 |
| | $ | 55.00 |
| | | | $ | 309,238 |
| |
| Outstanding at December 31, 2017 | | | 8,031 |
| | $ | 109.78 |
| | 4,029 |
| | $ | 75.80 |
| | | | $ | 663,815 |
|
| Granted | | 2,764 |
| | 144.45 |
| | | | | | $ | 32.20 |
| | | | 181 |
| | 200.16 |
| | | | | | $ | 49.69 |
| | |
| Exercised | | (388 | ) | | 52.10 |
| | | | | | | | 39,789 |
| | (230 | ) | | 87.81 |
| | | | | | | | 26,357 |
|
| Forfeited | | (265 | ) | | 142.93 |
| | | | | | | | | | (16 | ) | | 146.27 |
| | | | | | | | |
| Outstanding at September 30, 2017 | | 8,257 |
| | $ | 109.20 |
| | 3,956 |
| | $ | 71.26 |
| | | | $ | 376,264 |
| |
| Expected to vest as of September 30, 2017 | | 8,257 |
| | $ | 109.20 |
| | | | | | | | | |
| Outstanding at March 31, 2018 | | | 7,966 |
| | $ | 112.39 |
| | 4,444 |
| | $ | 81.95 |
| | | | $ | 717,856 |
|
| Expected to vest as of March 31, 2018 | | | 7,966 |
| | $ | 112.39 |
| | | | | | | | |
The aggregate intrinsic value of stock options exercisable at September 30, 2017March 31, 2018 was $330.4$535.7 million. The weighted average remaining contractual term of options exercisable at September 30, 2017March 31, 2018 was 5.15.2 years.
The fair value of stock option awards granted was estimated using the Black-Scholes option pricing model during the nine months ended September 30, 2017 and 2016, with the following weighted-average assumptions for grants or modifications during the period:three month period ended March 31, 2018 and 2017:
| | | | | September 30, | | March 31, |
| | | 2017 | | 2016 | | 2018 | | 2017 |
| Risk-free interest rate | | 1.65 | % | | 1.09 | % | | 2.46 | % | | 1.83 | % |
| Dividend yield | | — |
| | — |
| | — |
| | — |
|
| Expected volatility | | 28.02 | % | | 27.37 | % | | 27.11 | % | | 27.31 | % |
| Expected life (in years) | | 3.4 |
| | 3.4 |
| | 3.9 |
| | 4.2 |
|
Restricted Stock
Awards of restricted stock and restricted stock units are independent of stock option grants and are subject to forfeiture if employment terminates prior to vesting. The vesting of shares granted is generally based on the passage of time, performance or performance,market conditions, or a combination of these. Shares vesting based on the passage of time have vesting provisions of one to three years.
The following table summarizes the changes in the number of shares of restricted stock and restricted stock units for the ninethree months ended September 30, 2017March 31, 2018 (shares in thousands):
|
| | | | | | | |
| | | Shares | | Weighted Average Grant Date Fair Value |
| Outstanding at December 31, 2016 | | 379 |
| | $ | 140.39 |
|
| Granted | | 204 |
| | 149.95 |
|
| Vested | | (204 | ) | | 136.85 |
|
| Cancelled or forfeited | | (48 | ) | | 153.24 |
|
| Outstanding at September 30, 2017 | | 331 |
| | $ | 149.24 |
|
|
| | | | | | | |
| | | Shares | | Weighted Average Grant Date Fair Value |
| Outstanding at December 31, 2017 | | 365 |
| | $ | 155.58 |
|
| Granted | | 49 |
| | 199.75 |
|
| Vested | | (47 | ) | | 158.54 |
|
| Canceled or forfeited | | (26 | ) | | 154.46 |
|
| Outstanding at March 31, 2018 | | 341 |
| | $ | 163.95 |
|
6.7. Acquisitions
2017 Acquisitions
During 2017, the Company completed acquisitions with an aggregate purchase price of $725.2 million, net of cash acquired of $96.3 million and inclusive of notes payable of $29.3 million. During 2017, the Company made investments in other businesses of $39 million.
Cambridge Global Payments
On August 9, 2017, the Company acquired Cambridge, a leading business to business (B2B) international payments provider, for approximately $584.1$616.1 million in cash, net of cash acquired of $132.3$94.5 million and inclusive of a note payable of $23.9$23.8 million. Cambridge processes B2B cross-border payments, assisting business clients in making international payments to suppliers and employees.payments. The purpose of this acquisition is to further expand the Company's corporate payments footprint. The Company financed the acquisition using a combination of existing cash and borrowings under its existing credit facility. The results from Cambridge are reported in its North America segment for business in the United States and Canada and within its International segment for business in all other countries outside of the United States and Canada, since acquisition.segment. The following table summarizes the preliminary acquisition accounting for Cambridge (in thousands):
| | | Restricted cash | | $ | 37,666 |
|
| Trade and other receivables | | 61,801 |
|
| Prepaid expenses and other | 79,725 |
| 15,190 |
|
| Property and equipment | 7,106 |
| 7,106 |
|
| Other long term assets | 10,025 |
| 10,025 |
|
| Goodwill | 436,138 |
| 500,391 |
|
| Customer relationships and other identifiable intangible assets | 358,168 |
| 271,793 |
|
| Liabilities assumed | (187,664 | ) | (194,552 | ) |
| Deferred tax liabilities | (119,419 | ) | (93,364 | ) |
| Aggregate purchase price | $ | 584,079 |
| $ | 616,056 |
|
| | | |
The estimated fair value of intangible assets acquired and the related estimated useful lives consisted of the following (in thousands):
|
| | | | |
| | Useful Lives (in Years) | Value |
| Customer relationships and other identifiable intangible assets | 10 | $ | 358,168 |
|
| | | $ | 358,168 |
|
|
| | | | |
| | Useful Lives (in Years) | Value |
| Banking relationships | 20 | $ | 705 |
|
| Trade name and trademarks | Indefinite | 35,110 |
|
| Technology | 5 | 16,039 |
|
| Customer relationships - excluding Accounts Payable Solutions | 7-18 | 178,190 |
|
| Customer relationships - Accounts Payable Solutions | 20 | 41,749 |
|
| | | $ | 271,793 |
|
Along with the Company's acquisition of Cambridge, the Company signed noncompete agreements with certain parties with an estimated fair value of $5.8 million. Acquisition accounting for Cambridge is preliminary as the Company is still completing the valuation for goodwill, intangible assets, income taxes, certain acquired contingencies, derivatives and the working capital
adjustment period remains open. Goodwill recorded is comprised primarily of expected synergies from combining the operations of the Company and Cambridge, as well as assembled workforce. The allocation of the goodwill to the reporting units is not yet complete.
Other
On September 26,During 2017, the Company acquired Creative Lodging Solutions ("CLS"), a lodging business, and a fuel card provider in Russia.Russia for approximately $109.1 million, net of cash acquired of $1.8 million and inclusive of a note payable of $5.5 million. The Company financed the acquisitions using a combination of existing cash and borrowings under its existing credit facility. The accounting for this acquisitionthese acquisitions is preliminary as the Company is still completing the valuation of goodwill, intangible assets, income taxes and evaluation of acquired contingencies. The following table summarizes the preliminary acquisition accounting for the Russian acquisitionacquisitions (in thousands):
| | | Trade and other receivables | $ | 8,175 |
| $ | 38,038 |
|
| Prepaid expenses and other | 783 |
| 1,426 |
|
| Property and equipment | 206 |
| 5,745 |
|
| Goodwill | 9,209 |
| 59,946 |
|
| Other intangible assets | 46,034 |
| 53,459 |
|
| Liabilities assumed | (11,078 | ) | (32,274 | ) |
| Deferred tax liabilities | (9,211 | ) | (17,217 | ) |
| Aggregate purchase prices | $ | 44,118 |
| $ | 109,123 |
|
The estimated fair value of intangible assets acquired and the related estimated useful lives consisted of the following (in thousands):
|
| | | | |
| | Useful Lives (in Years) | Value |
| Customer relationships and other identifiable intangible assets | 8 | $ | 46,034 |
|
| | | $ | 46,034 |
|
|
| | | | |
| | Useful Lives (in Years) | Value |
| Trade name and trademarks | 1 | $ | 180 |
|
| Technology | 4 | 1,750 |
|
| Customer relationships | 8 | 51,529 |
|
| | | $ | 53,459 |
|
Subsequently, on October 13, 2017, the Company completed the acquisition of Creative Lodging Solutions ("CLS"), a small lodging tuck-in business.
2016 Acquisitions
STP
On August 31, 2016, the Company acquired all of the outstanding stock of Serviços e Tecnologia de Pagamentos S.A. (“STP”), for $1.23 billion, net of cash acquired of $40.2 million. STP is an electronic toll payments company in Brazil and provides cardless fuel payments at a number of Shell sites throughout Brazil. The purpose of this acquisition was to expand the Company's presence in the toll market in Brazil. The Company financed the acquisition using a combination of existing cash and borrowings under its existing credit facility. Results from the acquired business have been reported in the Company's international segment since the date of acquisition. The following table summarizes the acquisition accounting for STP (in thousands):
|
| | | |
| Trade and other receivables | $ | 243,157 |
|
| Prepaid expenses and other | 6,998 |
|
| Deferred tax assets | 20,644 |
|
| Property and equipment | 44,226 |
|
| Other long term assets | 14,280 |
|
| Goodwill | 663,040 |
|
| Customer relationships and other identifiable intangible assets | 548,682 |
|
| Liabilities assumed | (315,082 | ) |
| Aggregate purchase price | $ | 1,225,945 |
|
| | |
The estimated fair value of intangible assets acquired and the related estimated useful lives consisted of the following (in thousands):
|
| | | | |
| | Useful Lives (in Years) | Value |
| Customer relationships | 8.5-20 | $ | 348,414 |
|
| Trade names and trademarks - indefinite | N/A | 154,851 |
|
| Technology | 6 | 45,417 |
|
| | | $ | 548,682 |
|
In connection with the STP acquisition, the Company recorded contingent liabilities aggregating $15.1 million, recorded within other noncurrent liabilities and accrued expenses in the consolidated balance sheet at the date of acquisition. A portion of these acquired liabilities have been indemnified by the respective sellers. As a result, an indemnification asset of $15.1 million was
recorded within prepaid and other current assets and other long term assets in the consolidated balance sheet. Along with the Company's acquisition of STP,CLS, the Company signed noncompete agreements with certain parties with an estimated fair value of $23.2$3.9 million.
Goodwill recognized is comprised primarily of expected synergies from combining the operations of the Company and STP, as well as assembled workforce. The goodwill and definite lived intangibles acquired with this business will be deductible for tax purposes.
Other
During 2016, the Company acquired additional fuel card portfolios in the U.S. and the United Kingdom, additional Shell fuel card markets in Europe and Travelcard in the Netherlands totaling $76.7 million, net of cash acquired of $11.1 million. The following table summarizes the acquisition accounting for these acquisitions (in thousands):
|
| | | |
| Trade and other receivables | $ | 27,810 |
|
| Prepaid expenses and other | 5,097 |
|
| Property and equipment | 992 |
|
| Goodwill | 28,540 |
|
| Other intangible assets | 61,823 |
|
| Deferred tax asset | 146 |
|
| Liabilities assumed | (42,550 | ) |
| Deferred tax liabilities | (5,123 | ) |
| Aggregate purchase prices | $ | 76,735 |
|
The estimated fair value of intangible assets acquired and the related estimated useful lives consisted of the following (in thousands):
|
| | | | |
| | Useful Lives (in Years) | Value |
| Customer relationships and other identifiable intangible assets | 10-18 | $ | 61,823 |
|
| | | $ | 61,823 |
|
7.8. Goodwill and Other Intangible Assets
A summary of changes in the Company’s goodwill by reportable business segment is as follows (in thousands):
| | | | | December 31, 2016 | | Acquisitions | | Dispositions | | Acquisition Accounting Adjustments | | Foreign Currency | | September 30, 2017 | | December 31, 2017 | | Acquisitions | | Acquisition Accounting Adjustments | | Foreign Currency | | March 31, 2018 |
| Segment | | | | | | | | | | | | | | | | | | | | | | |
| North America | | $ | 2,640,409 |
| | $ | 436,138 |
| | $ | (92,046 | ) | | $ | — |
| | $ | 707 |
| | $ | 2,985,208 |
| | $ | 3,084,123 |
| | $ | — |
| | $ | 4,215 |
| | $ | (2,587 | ) | | $ | 3,085,751 |
|
| International | | 1,554,741 |
| | 9,209 |
| | — |
| | 3,751 |
| | 91,650 |
| | 1,659,351 |
| | 1,631,700 |
| | — |
| | 20 |
| | 26,821 |
| | 1,658,541 |
|
| | | $ | 4,195,150 |
|
| $ | 445,347 |
| | $ | (92,046 | ) | | $ | 3,751 |
|
| $ | 92,357 |
|
| $ | 4,644,559 |
| | $ | 4,715,823 |
|
| $ | — |
| | $ | 4,235 |
|
| $ | 24,234 |
|
| $ | 4,744,292 |
|
Goodwill related to our acquisition of Cambridge is recorded in the Company's North America segment at September 30, 2017, as the acquisition accounting is preliminary. The Company is continuing to evaluate the reporting units and segments allocation related to its acquisition of Cambridge.
As of September 30, 2017March 31, 2018 and December 31, 2016,2017, other intangible assets consisted of the following (in thousands):
| | | | | | | September 30, 2017 | | December 31, 2016 | | | | March 31, 2018 | | December 31, 2017 |
| | | Weighted- Avg Useful Lives (Years) | | Gross Carrying Amounts | | Accumulated Amortization | | Net Carrying Amount | | Gross Carrying Amounts | | Accumulated Amortization | | Net Carrying Amount | | Weighted- Avg Useful Lives (Years) | | Gross Carrying Amounts | | Accumulated Amortization | | Net Carrying Amount | | Gross Carrying Amounts | | Accumulated Amortization | | Net Carrying Amount |
| Customer and vendor relationships | | 15.9 | | $ | 2,845,048 |
| | $ | (565,374 | ) | | $ | 2,279,674 |
| | $ | 2,449,389 |
| | $ | (458,118 | ) | | $ | 1,991,271 |
| | 16.9 | | $ | 2,707,354 |
| | $ | (650,237 | ) | | $ | 2,057,117 |
| | $ | 2,698,428 |
| | $ | (605,347 | ) | | $ | 2,093,081 |
|
| Trade names and trademarks—indefinite lived | | N/A | | 476,648 |
| | — |
| | 476,648 |
| | 510,952 |
| | — |
| | 510,952 |
| | N/A | | 505,295 |
| | — |
| | 505,295 |
| | 499,587 |
| | — |
| | 499,587 |
|
| Trade names and trademarks—other | | 14.6 | | 2,805 |
| | (2,130 | ) | | 675 |
| | 2,746 |
| | (2,021 | ) | | 725 |
| | 13.7 | | 3,008 |
| | (2,291 | ) | | 717 |
| | 2,986 |
| | (2,207 | ) | | 779 |
|
| Software | | 6.0 | | 203,643 |
| | (106,786 | ) | | 96,857 |
| | 211,331 |
| | (85,167 | ) | | 126,164 |
| | 6.0 | | 219,717 |
| | (126,968 | ) | | 92,749 |
| | 219,019 |
| | (116,654 | ) | | 102,365 |
|
| Non-compete agreements | | 4.9 | | 38,628 |
| | (16,042 | ) | | 22,586 |
| | 35,191 |
| | (11,070 | ) | | 24,121 |
| | 4.5 | | 48,260 |
| | (21,622 | ) | | 26,638 |
| | 48,221 |
| | (19,076 | ) | | 29,145 |
|
| Total other intangibles | | $ | 3,566,772 |
|
| $ | (690,332 | ) |
| $ | 2,876,440 |
|
| $ | 3,209,609 |
|
| $ | (556,376 | ) |
| $ | 2,653,233 |
| | $ | 3,483,634 |
|
| $ | (801,118 | ) |
| $ | 2,682,516 |
|
| $ | 3,468,241 |
|
| $ | (743,284 | ) |
| $ | 2,724,957 |
|
Changes in foreign exchange rates resulted in a $53.8$12.1 million increase to the carrying values of other intangible assets in the ninethree months ended September 30, 2017.March 31, 2018. Amortization expense related to intangible assets for the ninethree months ended September 30,March 31, 2018 and 2017 and 2016 was $158.9$57.8 million and $112.5$52.7 million, respectively. As part of the Company's plan to exit the telematics business, on July 27, 2017, the Company sold NexTraq, a U.S. fleet telematics business, to Michelin Group, resulting in a $41.8 million reduction in the net carrying values of other intangible assets.
8.9. Debt
The Company’s debt instruments consist primarily of term notes, revolving lines of credit and a Securitization Facility as follows (in thousands):
| | | | | September 30, 2017 | | December 31, 2016 | | March 31, 2018 | | December 31, 2017 |
| Term notes payable—domestic(a), net of discounts | | $ | 3,027,472 |
| | $ | 2,639,279 |
| | $ | 2,959,854 |
| | $ | 2,993,667 |
|
| Revolving line of credit A Facility—domestic(a) | | 595,000 |
| | 465,000 |
| | 365,000 |
| | 635,000 |
|
| Revolving line of credit A Facility—foreign(a) | | 38,047 |
| | 123,412 |
| |
| Revolving line of credit A Facility—swing line(a) | | 40,193 |
| | 26,608 |
| |
| Revolving line of credit B Facility—foreign(a) | | | 280,258 |
| | 28,334 |
|
| Revolving line of credit B Facility—swing line(a) | | | 12,324 |
| | 6,879 |
|
| Other debt(c) | | 41,771 |
| | 12,934 |
| | 43,009 |
| | 43,736 |
|
| Total notes payable and other obligations | | 3,742,483 |
|
| 3,267,233 |
| | 3,660,445 |
|
| 3,707,616 |
|
| Securitization Facility(b) | | 794,000 |
| | 591,000 |
| | 829,000 |
| | 811,000 |
|
| Total notes payable, credit agreements and Securitization Facility | | $ | 4,536,483 |
|
| $ | 3,858,233 |
| | $ | 4,489,445 |
|
| $ | 4,518,616 |
|
| Current portion | | $ | 1,602,507 |
| | $ | 1,336,506 |
| | $ | 1,621,913 |
| | $ | 1,616,512 |
|
| Long-term portion | | 2,933,976 |
| | 2,521,727 |
| | 2,867,532 |
| | 2,902,104 |
|
| Total notes payable, credit agreements and Securitization Facility | | $ | 4,536,483 |
|
| $ | 3,858,233 |
| | $ | 4,489,445 |
|
| $ | 4,518,616 |
|
______________________
| |
| (a) | The Company has a Credit Agreement, which has been amended multiple times and provides for senior secured credit facilities consisting of a revolving A credit facility in the amount of $1.285 billion, a term loan A facility in the amount of $2.69 billion and a term loan B facility in the amount of $350.0$350 million as of September 30, 2017.March 31, 2018. The revolving credit facility consists of (a) a revolving A credit facility in the amount of $800 million, with sublimits for letters of credit and swing line loans, (b) a revolving B facility in the amount of $450 million for swing line loans and multi-currency borrowings and, (c) a revolving C facility in the amount of $35 million for multi-currency borrowings in Australian Dollars or New Zealand Dollars. On January 20, 2017, the Company entered into the second amendment to theThe Credit Agreement which established a newalso includes an accordion feature for borrowing an additional $750 million in term A, term B loan. On August 2, 2017, the Company entered into the third amendment to the Credit Agreement, which increased the total facility by $708.7 million and extended the terms ofor revolver A debt. Proceeds from the credit facilities.facilities may be used for working capital purposes, acquisitions, and other general corporate purposes. The term A and revolver maturity dates are August 2, 2022 for term A loan, revolving loans, and letters of credit under the Credit Agreement and August 2, 2024 for the term B maturity date is August 2,2024. The term A and revolver pricing remains the same and the term B pricing was reduced by 25 basis points to LIBOR plus 200 basis points. In addition, the Company pays a quarterly commitment fee at a rate per annum ranging from 0.20% to 0.40% of the daily unused portion of the credit facility. The Company has unamortized debt discounts of $6.4 million related to the term A facility, $0.7 million related to the term B facility and deferred financings costs ofloan. |
$5.4Interest on amounts outstanding under the Credit Agreement (other than the term B loan) accrues based on the British Bankers Association LIBOR Rate (the Eurocurrency Rate), plus a margin based on a leverage ratio, or our option, the Base Rate (defined as the rate equal to the highest of (a) the Federal Funds Rate plus 0.50%, (b) the prime rate announced by Bank of America, N.A., or (c) the Eurocurrency Rate plus 1.00%) plus a margin based on a leverage ratio. Interest on the term B loan facility accrues based on the Eurocurrency Rate plus 2.00% for Eurocurrency Loans and at
1.00% for Base Rate Loans. In addition, the Company pays a quarterly commitment fee at a rate per annum ranging from 0.20% to 0.40% of the daily unused portion of the credit facility. The Company has unamortized debt discounts of $5.6 million related to the term A facility, and $0.7 million related to the term B facility and deferred financings costs of $4.8 million at September 30, 2017. In August 2017,March 31, 2018.
At March 31, 2018, the Company expensed $3.3 millioninterest rate on the term A loan and capitalized $10.6 millionthe domestic revolving A facility was 3.38%, the interest rate on the foreign revolving B facility was 2.00%, the interest rate on the revolving B facility foreign swing line of debt issuance costs associated withcredit was 1.97% and the refinancing of its Credit Facility.interest rate on the term B loan was 3.88%. The unused credit facility was 0.30% for all revolving facilities at March 31, 2018.
| |
| (b) | The Company is party to a $950 million receivables purchase agreement (Securitization Facility) that was amended and restated on December 1, 2015.November 14, 2017. There is a program fee equal to one month LIBOR andplus 0.90% or the Commercial Paper Rate of 1.27% plus 0.90% and 0.85%0.80%. The program fee was 1.91% plus 0.90%0.86% as of September 30, 2017March 31, 2018 and 1.55% plus 0.86% as of December 31, 2016, respectively.2017. The unused facility fee is payable at a rate of 0.40% per annum as of September 30, 2017March 31, 2018 and December 31, 2016.2017. |
| |
| (c) | Other debt includes the long-term portion of contingent consideration and deferred payments associated with certain of our businesses.business acquisitions. |
The Company was in compliance with all financial and non-financial covenants at September 30, 2017.March 31, 2018.
9.10. Income Taxes
Our tax provision or benefit from income taxes for interim periods is determined using an estimate of our annual effective tax rate, adjusted for discrete items, if any, that are taken into account in the relevant period. Each quarter we update our estimate of the annual effective tax rate, and if our estimated tax rate changes, we make a cumulative adjustment. Our quarterly tax provision and our quarterly estimate of our annual effective tax rate, are subject to significant variation due to several factors, including variability in accurately predicting our pre-tax and taxable income and loss and the mix of jurisdictions to which they relate. Additionally, our effective tax rate can be more or less volatile based on the amount of pre-tax income or loss. For example, the impact of discrete items and non-deductible expenses on our effective tax rate is greater when our pre-tax income is lower.
On December 22, 2017, the U.S. government enacted tax legislation referred to as the Tax Act. The Tax Act makes broad and complex changes to the U.S. tax code, including, but not limited to, (1) reducing the U.S. federal corporate tax rate from 35 percent to 21 percent; (2) requiring companies to pay a one-time Deemed Repatriation Transition Tax (“Transition Tax”) on certain unrepatriated earnings of foreign subsidiaries that can be paid over eight years; (3) a new provision designed to tax global intangible low-taxed income (GILTI), which allows for the possibility of using foreign tax credits (FTCs) and a deduction of up to 50 percent to offset the income tax liability (subject to some limitations); (4) the repeal of the domestic production activity deduction beginning January 1, 2018; (5) limitations on the deductibility of certain executive compensation; and (6) a new limitation on deductible interest expense beginning January 1, 2018.
The Company has not completed its accounting for the tax effects of enactment of the Tax Act. However, the Company has made a reasonable estimate of the effects on its existing deferred tax balances and the one-time Transition Tax. In other cases, the Company has not been able to make a reasonable estimate and continues to account for those items based on its existing accounting under ASC 740 ("Income Taxes"), and the provisions of the tax laws that were in effect immediately prior to enactment.
The SEC staff issued Staff Accounting Bulletin No. 118, Income Tax Accounting Implications of the Tax Cuts and Jobs Act ("SAB 118"), which provides guidance on accounting for the tax effects of the Tax Act. SAB 118 provides a measurement period that should not extend beyond one year from the Tax Act enactment date for companies to complete the accounting under ASC 740. In accordance with SAB 118, a company must reflect the income tax effects of those aspects of the Act for which the accounting under ASC 740 is complete. To the extent that a company’s accounting for certain income tax effects of the Tax Act is incomplete but it is able to determine a reasonable estimate, it must record a provisional estimate in the financial statements. If a company cannot determine a provisional estimate to be included in the financial statements, it should continue to apply ASC 740 on the basis of the provisions of the tax laws that were in effect immediately before the enactment of the Tax Act.
For those items for which it was able to determine a reasonable estimate, the Company recognized a provisional net tax benefit of $128.2 million during 2017. This net benefit primarily consists of a net benefit for the corporate rate reduction on the deferred tax assets and liabilities of $210 million and a net expense for the Transition Tax of $81.8 million.
While the Company was able to make a reasonable estimate of the impact of the reduction in corporate rate on its net deferred tax liabilities, the impact may be affected by other analysis related to the Tax Act, including, but not limited to, the Company’s calculation of deemed repatriation of deferred foreign income. The Company was also not able to make a reasonable estimate of the impact of state taxes on adjustments made to federal temporary differences as a result of the Tax Act, or the impact of the
new limitations on the deductibility of certain executive compensation. As a result, the Company continues to account for the impact of state taxes on adjustments made to federal temporary differences and the deductibility of certain executive compensation based on its existing accounting under ASC 740 and the provisions of the tax laws that were in effect immediately prior to enactment.
In all cases, the Company will continue to make and refine its calculations as additional analysis is completed. We did not make any adjustments to these provisional amounts during the three months ended March 31, 2018. We are continuing to gather additional information to complete our accounting for these items and expect to complete our accounting within the measurement period.
The provision for income taxes differs from amounts computed by applying the U.S. federal tax rate of 21% for 2018 and 35% for 2017 to income before income taxes for the three months ended September 30,March 31, 2018 and 2017 and 2016 due to the following (in thousands):
| | | | | 2017 | | 2016 | | 2018 | | 2017 |
| Computed tax expense at the U.S. federal tax rate | | $ | 114,626 |
| | 35.0 | % | | $ | 59,571 |
| | 35.0 | % | | $ | 48,157 |
| | 21.0 | % | | $ | 58,579 |
| | 35.0 | % |
| Changes resulting from: | | | | | | | | | | | | | | | | |
| Foreign income tax differential | | (9,247 | ) | | (2.8 | )% | | (4,265 | ) | | (2.5 | )% | | 2,016 |
| | 0.9 | % | | (5,843 | ) | | (3.5 | )% |
| Excess tax benefits related to stock-based compensation | | (4,360 | ) | | (1.3 | )% | | (8,247 | ) | | (4.9 | )% | | (4,624 | ) | | (2.0 | )% | | (8,721 | ) | | (5.2 | )% |
| State taxes net of federal benefits | | 5,926 |
| | 1.8 | % | | 1,678 |
| | 1.0 | % | | 3,373 |
| | 1.5 | % | | 1,607 |
| | 1.0 | % |
| Foreign-sourced nontaxable income | | 1,558 |
| | 0.5 | % | | (6,691 | ) | | (3.9 | )% | | (6,588 | ) | | (2.9 | )% | | (3,372 | ) | | (2.0 | )% |
| Valuation allowance on investment loss | | 16,718 |
| | 5.1 | % | | 960 |
| | 0.6 | % | |
| Foreign withholding taxes | | | 5,471 |
| | 2.4 | % | | 2,045 |
| | 1.2 | % |
| GILTI Tax, net of foreign tax credits | | | 4,921 |
| | 2.1 | % | | — |
| | — | % |
| Other | | (542 | ) | | (0.2 | )% | | (2,420 | ) | | (1.4 | )% | | 1,656 |
| | 0.7 | % | | (620 | ) | | (0.4 | )% |
| Provision for income taxes | | $ | 124,679 |
| | 38.1 | % | | $ | 40,586 |
| | 23.9 | % | | $ | 54,382 |
| | 23.7 | % | | $ | 43,675 |
| | 26.1 | % |
10.11. Earnings Per Share
The Company reports basic and diluted earnings per share. Basic earnings per share is computed by dividing net income attributable to shareholders of the Company by the weighted average number of common shares outstanding during the reported period. Diluted earnings per share reflect the potential dilution related to equity-based incentives using the treasury stock method. The calculation and reconciliation of basic and diluted earnings per share for the three and nine monthsmonth period ended September 30March 31 follows (in thousands, except per share data) follows::
| | | | | Three Months Ended
September 30, | | Nine Months Ended
September 30, | | Three Months Ended
March 31, |
| | | 2017 | | 2016 | | 2017 | | 2016 | | 2018 | | 2017 |
| Net income | | $ | 202,823 |
| | $ | 129,618 |
| | $ | 457,503 |
| | $ | 356,961 |
| | $ | 174,937 |
| | $ | 123,693 |
|
| Denominator for basic earnings per share | | 90,751 |
| | 92,631 |
| | 91,619 |
| | 92,604 |
| | 89,765 |
| | 92,108 |
|
| Dilutive securities | | 2,250 |
| | 2,676 |
| | 2,304 |
| | 2,600 |
| | 3,485 |
| | 2,452 |
|
| Denominator for diluted earnings per share | | 93,001 |
|
| 95,307 |
|
| 93,923 |
| | 95,204 |
| | 93,250 |
|
| 94,560 |
|
| Basic earnings per share | | $ | 2.23 |
| | $ | 1.40 |
| | $ | 4.99 |
| | $ | 3.85 |
| | $ | 1.95 |
| | $ | 1.34 |
|
| Diluted earnings per share | | $ | 2.18 |
| | $ | 1.36 |
| | $ | 4.87 |
| | $ | 3.75 |
| | $ | 1.88 |
| | $ | 1.31 |
|
Diluted earnings per share forThere were 0.8 million anti-dilutive shares during the three month periodsmonths ended September 30, 2017 excludes the effect of 3.5 million shares of common stock that may be issued upon the exercise of employee stock options because such effect would be antidilutive.2017. Diluted earnings per share also excludes the effect of 0.30.2 million shares of performance based restricted stock for which the performance criteria have not yet been achieved for both the three month periods ended September 30,March 31, 2018 and 2017, and 2016, respectively.
11.12. Segments
The Company reports information about its operating segments in accordance with the authoritative guidance related to segments. The Company’s reportable segments represent components of the business for which separate financial information is evaluated regularly by the chief operating decision maker in determining how to allocate resources and in assessing performance. The Company operates in two reportable segments, North America and International. The Company began reporting its results from Cambridge acquired in the third quarter of 2017 in its North America segment for Cambridge's business in the United States and Canada and within its International segment for Cambridge's business in all other countries outside of the United States and Canada. The Company is continuing to evaluate the allocation of Cambridge results to its reporting units and segments. The results of operations from the fuel card business acquired in Russia are included within our International segment, from the date of acquisition. There were no inter-segment sales.
The Company’s segment results are as follows for the three and nine month periods ended September 30March 31 (in thousands):
| | | | | Three Months Ended
September 30, | | Nine Months Ended
September 30, | | Three Months Ended
March 31, |
| | | 2017 | | 2016 | | 2017 | | 2016 | | 2018 | | 2017 |
| Revenues, net: | | | | | | | | | | | | |
| North America | | $ | 364,443 |
| | $ | 345,868 |
| | $ | 1,037,386 |
| | $ | 950,542 |
| | $ | 364,270 |
| | $ | 329,948 |
|
| International | | 213,434 |
| | 138,558 |
| | 602,161 |
| | 366,051 |
| | 221,230 |
| | 190,485 |
|
| | | $ | 577,877 |
|
| $ | 484,426 |
|
| $ | 1,639,547 |
|
| $ | 1,316,593 |
| | $ | 585,500 |
|
| $ | 520,433 |
|
| Operating income: | | | | | | | | | | | | |
| North America | | $ | 138,748 |
| | $ | 135,760 |
| | $ | 394,646 |
| | $ | 367,221 |
| | $ | 155,950 |
| | $ | 120,972 |
|
| International | | 93,889 |
| | 55,295 |
| | 249,102 |
| | 170,957 |
| | 104,137 |
| | 74,096 |
|
| | | $ | 232,637 |
|
| $ | 191,055 |
|
| $ | 643,748 |
|
| $ | 538,178 |
| | $ | 260,087 |
|
| $ | 195,068 |
|
| Depreciation and amortization: | | | | | | | | | | | | |
| North America | | $ | 37,600 |
| | $ | 32,739 |
| | $ | 104,161 |
| | $ | 96,351 |
| | $ | 38,675 |
| | $ | 33,177 |
|
| International | | 31,556 |
| | 24,345 |
| | 94,570 |
| | 45,497 |
| | 32,827 |
| | 31,689 |
|
| | | $ | 69,156 |
|
| $ | 57,084 |
|
| $ | 198,731 |
|
| $ | 141,848 |
| | $ | 71,502 |
|
| $ | 64,866 |
|
| Capital expenditures: | | | | | | | | | | | | |
| North America | | $ | 9,167 |
| | $ | 11,980 |
| | $ | 30,901 |
| | $ | 28,501 |
| | $ | 8,411 |
| | $ | 9,632 |
|
| International | | 7,692 |
| | 5,140 |
| | 18,558 |
| | 13,376 |
| | 6,803 |
| | 5,164 |
|
| | | $ | 16,859 |
|
| $ | 17,120 |
|
| $ | 49,459 |
|
| $ | 41,877 |
| | $ | 15,214 |
|
| $ | 14,796 |
|
12.13. Commitments and Contingencies
In the ordinary course of business, the Company is involved in various pending or threatened legal actions, arbitration proceedings, claims, subpoenas, and matters relating to compliance with laws and regulations (collectively, legal proceedings). Based on our current knowledge, management presently does not believe that the liabilities arising from these legal proceedings will have a material adverse effect on our consolidated financial condition, results of operations or cash flows. However, it is possible that the ultimate resolution of these legal proceedings could have a material adverse effect on our results of operations and financial condition for any particular period.
Shareholder Class Action and Derivative Lawsuits
On June 14, 2017, a shareholder filed a class action complaint in the United States District Court for the Northern District of Georgia against the Company and certain of its officers and directors on behalf of all persons who purchased or otherwise acquired the Company’s stock between February 5, 2016 and May 2, 2017. On October 13, 2017, the shareholder filed an amended complaint asserting claims on behalf of a putative class of all persons who purchased or otherwise acquired the Company's common stock between February 4, 2016 and May 3, 2017. The complaint alleges that the defendants made false or misleading statements regarding fee charges and the reasons for its earnings and growth in certain press releases and other public statements in violation of the federal securities laws. Plaintiff seeks class certification, unspecified monetary damages, costs, and attorneys’ fees. The Company disputes the allegations in the complaint and intends to vigorously defend against the claims.
On July 10, 2017, a shareholder derivative complaint was filed against the Company and certain of the Company’s directors and officers in the United States District Court for the Northern District of Georgia seeking recovery on behalf of the Company. The derivative complaint alleges that the defendants issued a false and misleading proxy statement in violation of the federal securities laws; that defendants breached their fiduciary duties by causing or permitting the Company to make allegedly false
and misleading public statements concerning the Company’s fee charges, and financial and business prospects; and that certain defendants breached their fiduciary duties through allegedly improper sales of stock. The complaint seeks unspecified monetary damages on behalf of the Company, corporate governance reforms, disgorgement of profits, benefits and
compensation by the defendants, restitution, costs, and attorneys’ and experts’ fees. On August 18, 2017, the court entered an order deferring the case pending a ruling on the defendants' motion to dismiss the putative shareholder class action, or until otherwise agreed to by the parties. The defendants dispute the allegations in the complaint and intend to vigorously defend against the claims.
Estimating an amount or range of possible losses resulting from litigation proceedings is inherently difficult and requires an extensive degree of judgment, particularly where the matters involve indeterminate claims for monetary damages, and are in the stages of the proceedings where key factual and legal issues have not been resolved. For these reasons, the Company is currently unable to predict the ultimate timing or outcome of, or reasonably estimate the possible losses or a range of possible losses resulting from the matters described above.
13.14. Asset Dispositions
Telematics Businesses
As part of the Company's plan to exit the telematics business, on July 27, 2017, the Company sold NexTraq, a U.S. fleet telematics business, to Michelin Group for $316 million. The Company recorded a pre-tax gain on the disposal of NexTraq of $175.0 million during the third quarter of 2017, which iswas net of transaction closing costs. The Company recorded tax on the gain of disposal of $65.8 million. The gain on the disposal is included in other (income) expense, net in the accompanying Unaudited Consolidated Statements of Income. NexTraq haswas historically been included in the Company's North America segment.
On September 30, 2017, the Company entered into an amended Masternaut investment agreement that resulted in the loss of significant influence, and the Company began accounting for the Masternaut investment by applying the cost method.
The Company regularly evaluates the carrying value of its investment and during the third quarter of 2017, the Company determined that the fair value of its 44% investment in Masternaut had declined as a result of the Company's loss of significant influence due to the amendment of the Masternaut investment agreement, executed September 30, 2017. As a result, the Company determined that the carrying value of its investment exceeded its fair value, and concluded that this decline in value was other than temporary. The Company recorded a $44.6 million impairment loss in the Masternaut investment that includes adjustment for $31.4 million of currency losses previously recognized in accumulated other comprehensive income, in the three and nine months ended September 30, 2017, in the accompanying Unaudited Consolidated Statements of Income.
14.15. Derivative Financial Instruments
As a result of the Cambridge acquisition during 2017, the Company writes derivatives, primarily foreign currency forward contracts, and option contracts, and swaps, mostly with small and medium size enterprises that are customers and derives a currency spread from this activity, which was acquired during the third quarter of 2017.activity. Derivative transactions include:
Forward contracts, which are commitments to buy or sell at a future date a currency at a contract price and will be settled in cash.
Option contracts, which gives the purchaser, the right, but not the obligation to buy or sell within a specified time a currency at a contracted price that may be settled in cash.
Swap contracts, which are commitments to settlement in cash at a future date or dates, usually on an overnight basis.
The primary credit risk inherent in derivative agreements represents the possibility that a loss may occur from the nonperformance of a counterparty to the agreements. The Company performs a review of the credit risk of these counterparties at the inception of the contract and on an ongoing basis. The Company also monitors the concentration of its contracts with any individual counterparty against limits at the individual counterparty level. The Company anticipates that the counterparties will be able to fully satisfy their obligations under the agreements, but takes action when doubt arises about the counterparties' ability to perform. These actions may include requiring customers to post or increase collateral, and for all counterparties, the possible termination of the related contracts. The Company does not designate any of its foreign exchange derivatives as hedging instruments in accordance with ASC 815.
The aggregate equivalent United StatesU.S. dollar notional amount of foreign exchange derivative customer contracts held by the Company as of September 30,March 31, 2018 and December 31, 2017 (in millions) is presented in the table below. Notional amounts do not reflect the netting of offsetting trades, although these offsetting positions may result in minimal overall market risk. Aggregate derivative notional amounts can fluctuate from period to period in the normal course of business based on market conditions, levels of customer activity and other factors.
| | | | | | Notional |
| | Net Notional | March 31, 2018 | | December 31, 2017 |
| Foreign exchange contracts: | | | | |
| Swaps | $ | 272.8 |
| $ | 855.3 |
| | $ | 515.4 |
|
| Futures, forwards and spot | 3,174.1 |
| 3,144.4 |
| | 3,274.5 |
|
| Written options | 1,338.6 |
| 3,559.6 |
| | 2,934.2 |
|
| Purchased options | 1,765.0 |
| 2,711.5 |
| | 2,314.1 |
|
| Total | $ | 6,550.5 |
| $ | 10,270.9 |
| | $ | 9,038.1 |
|
The majority of customer foreign exchange contracts are written in major currencies such as the U.S. Dollar, Canadian Dollar, British Pound, Euro and Australian Dollar.
The following table summarizes the fair value of derivatives reported in the Unaudited Consolidated Balance Sheet as of September 30,March 31, 2018 and December 31, 2017 (in millions):
| | | | | | | | March 31, 2018 | | December 31, 2017 |
| | Derivative Assets | | Derivative Liabilities | Fair Value, Gross | | Fair Value, Net | | Fair Value, Gross | | Fair Value, Net |
| | Fair Value | | Fair Value | Derivative Assets | | Derivative Liabilities | | Derivative Assets | | Derivative Liabilities | | Derivative Assets | | Derivative Liabilities | | Derivative Assets | | Derivative Liabilities |
| Derivatives - undesignated: | | | | | | | | | | | | | | | | | | |
| Over the counter | $ | 111.2 |
| | $ | 105.8 |
| $ | 103.8 |
| | $ | 89.9 |
| | $ | 37.8 |
| | $ | 23.9 |
| | $ | 80.4 |
| | $ | 68.2 |
| | $ | 39.0 |
| | $ | 26.8 |
|
| Exchange traded | — |
| | 0.4 |
| — |
| | — |
| | — |
| | — |
| | — |
| | 0.1 |
| | — |
| | 0.1 |
|
| Foreign exchange contracts | 111.2 |
| | 106.2 |
| 103.8 |
| | 89.9 |
| | 37.8 |
| | 23.9 |
| | 80.4 |
| | 68.3 |
| | 39.0 |
| | 26.9 |
|
| Cash collateral | (33.9 | ) | | (20.3 | ) | 11.0 |
| | 10.6 |
| | 11.0 |
| | 10.6 |
| | 12.5 |
| | 10.9 |
| | 12.5 |
| | 10.9 |
|
| Total net derivative assets and liabilities | $ | 77.3 |
| | $ | 85.9 |
| $ | 92.8 |
| | $ | 79.3 |
| | $ | 26.8 |
| | $ | 13.3 |
| | $ | 67.9 |
| | $ | 57.4 |
| | $ | 26.5 |
| | $ | 16.0 |
|
The fair values of derivative assets and liabilities associated with contracts thatwhich include netting language that the Company believes to be enforceable have been netted to present the Company's net exposure with these counterparties. The Company
recognizes all derivative assets, net in prepaid expense and other current assets and all derivative liabilities, net in other current liabilities, both netafter netting at the customer level, as right of offset exists, in its Unaudited Consolidated Balance Sheets at their fair value. The gain or loss on the fair value is recognized immediately within other (income) expense,revenues, net in the Unaudited Consolidated Statements of Income. At September 30, 2017, $150.7 millionThe Company does not offset fair value amounts recognized for the right to reclaim cash collateral or the obligation to return cash collateral. The derivative assets and $70.9 million derivative liabilities in the preceding table were recorded in "other current assets" and "other current liabilities" at each balance sheet date, respectively, in the Unaudited Consolidated Balance Sheet. The Company receives cash from customers as collateral for trade exposures, which is recorded within "cash and cash equivalents: and "customer deposits" in the Unaudited Consolidated Balance Sheet. The customer has the right to recall their collateral in the event exposures move in their favor, they unwind all outstanding trades or they cease to do business with the Company.
16. Subsequent Events
On April 26, 2018, Company personnel identified suspicious activity primarily on systems involving the Company’s Stored Value Solutions gift card business. The Company took immediate action to stop the activity and limit the improper use of accessed private label gift card information (these gift cards do not contain personally identifiable information such as consumer names, Social Security numbers, driver’s license numbers and other sensitive personal data). The Company through counsel has retained three information technology forensic firms, which have been examining the Company’s systems in detail over the approximately two week period since the incident was discovered. The Company also contacted federal law enforcement and merchants known to be affected. As of the date hereof, the Company does not believe that the unauthorized access incident will have a material adverse effect on its business and results of operations, though the Company’s investigation is ongoing.
Based upon information known as of the date hereof, the Company believes that a significant number of gift card and PIN numbers issued by six Stored Value Solutions customers were accessed. Following discovery, the Company has been working with merchant customers to limit the impact of the unauthorized access. We believe the mitigation steps discussed with merchants, if fully implemented, will severely restrict or eliminate the ability of the bad actors to use the information, while preserving the ability of legitimate holders of the gift cards to use them.
The Company has no evidence of access affecting its systems involving fleet cards and other payment products, or the proprietary and third-party payment networks used to deliver the Company’s payment solutions.
Subsequent to March 31, 2018, the Company has incurred, and expects to continue to incur, legal and other professional expenses related to the unauthorized access incident in future periods. The Company will recognize these expenses as services are received.
The Company maintains insurance coverage to limit its exposure to losses such as those related to the unauthorized access incident. The Company has not recorded a receivable for costs the Company has incurred to date as we have not yet concluded that the costs are reimbursable and probable of recovery under our insurance coverage.
|
| |
| Item 2. | Management’s Discussion and Analysis of Financial Condition and Results of Operations |
The following discussion and analysis of our financial condition and results of operations should be read in conjunction with the unaudited consolidated financial statements and related notes appearing elsewhere in this report. In addition to historical information, this discussion contains forward-looking statements that involve risks, uncertainties and assumptions that could cause actual results to differ materially from management’s expectations. See “Special Cautionary Notice Regarding Forward-Looking Statements”. All foreign currency amounts that have been converted into U.S. dollars in this discussion are based on the exchange rate as reported by OANDA for the applicable periods.
This management’s discussion and analysis should also be read in conjunction with the management’s discussion and analysis and consolidated financial statements and related notes included in our Annual Report on Form 10-K for the year ended December 31, 2016.2017.
General Business
FleetcorFLEETCOR is a leading global provider of commercial payment solutions. We primarily go to markethelp businesses of all sizes control, simplify and secure payment of various domestic and cross-border payables using specialized payment products. We serve businesses, merchants and partners in North America, Latin America, Europe, and Australasia. FLEETCOR’s predecessor company was organized in the United States in 1986, and FLEETCOR had its initial public offering in 2010 (NYSE: FLT).
FLEETCOR has two reportable segments, North America and International. We report these two segments as they align with our senior executive organizational structure, reflect how we organize and manage our employees around the world, manage operating performance, contemplate the differing regulatory environments in North America versus other geographies, and help us isolate the impact of foreign exchange fluctuations on our financial results.
Our payment solutions provide our customers with a payment method designed to be superior to and more robust and effective than what they use currently, whether they use a competitor’s product or another alternative method such as cash or check. Our solutions are comprised of payment products, networks and associated services.
Our payment products function like a charge card or prepaid card and tend to be specialized for specific spend categories, such as fuel card paymentsor lodging, and/or specific customer groups, such as long haul transportation. FLEETCOR’s five primary product solutions, corporate paymentslines are Fuel, Lodging, Tolls, Corporate Payments and Gift. Additionally, we provide other payment products toll products, lodging cardsincluding fleet maintenance, employee benefits and gift cards.long haul transportation-related services. Our products are used in 5356 countries around the world, with our primary geographies inbeing the U.S., Brazil and the U.K.,United Kingdom, which combined accounted for approximately 92%90% of our revenue in 2016. Our core products are primarily sold2017.
FLEETCOR uses both proprietary and third-party networks to businesses, retailers, major oil companiesdeliver our payment solutions. FLEETCOR owns and marketers and government entities. Our payment programs enable our customers to better manage and control their commercial payments, card programs, and employee spending and provide card-accepting merchantsoperates proprietary networks with a high volume customer base that can increase theirwell-established brands throughout the world, bringing incremental sales and customer loyalty. We also provide a suite of fleet relatedloyalty to affiliated merchants. Third-party networks are used to broaden payment product acceptance and workforce payment solution products, including mobile telematics services, fleet maintenance management and employee benefit and transportation related payments.use. In 2016,2017, we processed approximately 2.23 billion transactions on our proprietarywithin these networks, and third-party networks (which includesof which approximately 1.31.4 billion transactionswere related to our SVSGift product acquiredline.
FLEETCOR capitalizes on its products’ specialization with Comdata).sales and marketing efforts by deploying product-dedicated sales forces to target specific customer segments. We believe thatmarket our sizeproducts directly through multiple sales channels, including field sales, telesales and scale, geographic reach, advanced technology and our expansive suite of products, services, brands and proprietary networks contribute to our leading industry position.
We provide our payment products and services in a variety of combinations to create customized payment solutions for our customers and partners. We collectively refer to our suite of product offerings as workforce productivity enhancement products for commercial businesses. We sell a range of customized fleet and lodging payment programs directlydigital marketing, and indirectly tothrough our customers through partners, such as major oil companies, leasing companies and petroleum marketers. We refer to thesewhich include major oil companies, leasing companies, petroleum marketers, value-added resellers (VARs) and other referral partners with whom we have strategic relationships as our “partners.” We provide our customers with various card products that typically function like a charge card to purchase fuel, lodging, food, toll, transportation and related products and services at participating locations. While we refer to companies with whom we have strategic relationships as "partners", our legal relationships with these companies are contractual, and do not constitute legal partnerships.partners.
We supportbelieve that our products with specialized issuing, processingsize and information services that enable usscale, product breadth and specialization, geographic reach, proprietary networks, robust distribution capabilities and advanced technology contribute to manage card accounts, facilitate the routing, authorization, clearing and settlement of transactions, and provide value-added functionality and data, including customizable card-level controls and productivity analysis tools. In order to deliver our payment programs and services and process transactions, we own and operate proprietary “closed-loop” networks through which we electronically connect to merchants and capture, analyze and report customized information in North America and internationally. We also use third-party networks to deliver our payment programs and services in order to broaden our card acceptance and use. To support our payment products, we also provide a range of services, such as issuing and processing, as well as specialized information services that provide our customers with value-added functionality and data. Our customers can use this data to track important business productivity metrics, combat fraud and employee misuse, streamline expense administration and lower overall workforce and fleet operating costs. Depending on our customers’ and partners’ needs, we provide these services in a variety of outsourced solutions ranging from a comprehensive “end-to-end” solution (encompassing issuing, processing and network services) to limited back office processing services.industry leading position.
Executive Overview
We operate in two segments, which we refer to as our North America and International segments. Our revenue is reported net of the wholesale cost for underlying products and services. In this report, we refer to this net revenue as “revenue.”“revenues, net". See “Results of Operations” for additional segment information. We report our results from Cambridge acquired in the third quarter of 2017 in our North America segment for Cambridge's business in the United States and Canada and within our International segment for Cambridge's business in all other countries outside of the United States and Canada. We are continuing to evaluate the
allocation of Cambridge results to our reporting units and segments. As part of our plan to exit the telematics business, on July 27, 2017, we sold NexTraq, a U.S. fleet telematics business, which has historically been included in our North America segment.
Revenues, net, by Segment. For the three and nine months ended September 30,March 31, 2018 and 2017, and 2016, our North America and International segments generated the following revenue (in millions):
| | | | | Three Months Ended September 30, | | Nine Months Ended September 30, | | Three Months Ended March 31, |
| | | 2017 | | 2016 | | 2017 | | 2016 | | 2018 | | 2017 |
| (Unaudited) | | Revenues, net | | % of
total
revenues, net | | Revenues, net | | % of
total
revenues, net | | Revenues, net | | % of
total
revenues, net | | Revenues, net | | % of
total
revenues, net | | Revenues, net | | % of
total
revenues, net | | Revenues, net | | % of
total
revenues, net |
| North America | | $ | 364.4 |
| | 63.1 | % | | $ | 345.9 |
| | 71.4 | % | | $ | 1,037.4 |
| | 63.3 | % | | $ | 950.5 |
| | 72.2 | % | | $ | 364.3 |
| | 62.2 | % | | $ | 329.9 |
| | 63.4 | % |
| International | | 213.4 |
| | 36.9 | % | | 138.6 |
| | 28.6 | % | | 602.2 |
| | 36.7 | % | | 366.1 |
| | 27.8 | % | | 221.2 |
| | 37.8 | % | | 190.5 |
| | 36.6 | % |
| | | $ | 577.9 |
| | 100.0 | % | | $ | 484.4 |
| | 100.0 | % | | $ | 1,639.5 |
| | 100.0 | % | | $ | 1,316.6 |
| | 100.0 | % | | $ | 585.5 |
| | 100.0 | % | | $ | 520.4 |
| | 100.0 | % |
Revenues, net, Net Income and Net Income Per Diluted Share. Set forth below are revenues, net, net income and net income per diluted share for the three and nine months ended September 30,March 31, 2018 and 2017 and 2016 (in thousands,millions, except per share amounts).
| | | | | Three Months Ended September 30, | | Nine Months Ended September 30, | | Three Months Ended March 31, |
| (Unaudited) | | 2017 | | 2016 | | 2017 | | 2016 | | 2018 | | 2017 |
| Revenues, net | | $ | 577,877 |
| | $ | 484,426 |
| | $ | 1,639,547 |
| | $ | 1,316,593 |
| | $ | 585.5 |
| | $ | 520.4 |
|
| Net income | | $ | 202,823 |
| | $ | 129,618 |
| | $ | 457,503 |
| | $ | 356,961 |
| | $ | 174.9 |
| | $ | 123.7 |
|
| Net income per diluted share | | $ | 2.18 |
| | $ | 1.36 |
| | $ | 4.87 |
| | $ | 3.75 |
| | $ | 1.88 |
| | $ | 1.31 |
|
Adjusted Revenues, Adjusted Net Income and Adjusted Net Income Per Diluted Share. Set forth below are adjusted revenues, adjusted net income and adjusted net income per diluted share for the three and nine months ended September 30,March 31, 2018 and 2017 and 2016 (in thousands,millions, except per share amounts).
| | | | | Three Months Ended September 30, | | Nine Months Ended September 30, | | Three Months Ended March 31, |
| (Unaudited) | | 2017 | | 2016 | | 2017 | | 2016 | | 2018 | | 2017 |
| Adjusted revenues | | $ | 550,190 |
| | $ | 456,212 |
| | $ | 1,556,857 |
| | $ | 1,237,838 |
| |
| Adjusted net income | | $ | 202,769 |
| | $ | 183,310 |
| | $ | 574,795 |
| | $ | 478,959 |
| | $ | 233.5 |
| | $ | 185.0 |
|
| Adjusted net income per diluted share | | $ | 2.18 |
| | $ | 1.92 |
| | $ | 6.12 |
| | $ | 5.03 |
| | $ | 2.50 |
| | $ | 1.96 |
|
We useAdjusted net income and adjusted revenues as a basis to evaluate our revenues, net income per diluted share are supplemental non-GAAP financial measures of operating performance. See the commissions that are paid to merchants that participate in certainheading entitled “Management’s Use of our card programs. The commissions paid to merchants can vary when market spreads fluctuate in much the same way as revenues are impacted when market spreads fluctuate. Thus, we believe this is an effective way to evaluate our revenue performance on a consistent basis.Non-GAAP Financial Measures.” We use adjusted net income and adjusted net income per diluted share to eliminate the effect of items that we do not consider indicative of our core operating performance on a consistent basis. Adjusted revenues, adjusted net income and adjusted net income per diluted share are supplemental non-GAAP financial measures of operating performance. See the heading entitled “Management’s Use of Non-GAAP Financial Measures.”
Sources of Revenue
Transactions. In both of our segments, we derive revenue from transactions. As illustrated in the diagram below, aA transaction is defined as a purchase by a customer. Our customers include holderscustomer utilizing one of our cardpayment products and those of our partners, for whom we manage card programs, members of our proprietary networks who are provided access to our products and services and commercial businesses to whom we provide workforce payment productivity solutions. Revenue from transactions is derived from our merchant and network relationships, as well as our customers and partners. Through our merchant and network relationships we primarily offer fuel cards, corporate cards, virtual cards, purchasing cards, T&E cards, gift cards, stored value payroll cards, vehicle maintenance, food, fuel, toll and transportation cards and vouchers and lodging services to our customers.
at a participating merchant. The following diagram illustrates a typical transaction flow, for our fuel card, vehicle maintenance, lodging and food, toll and transportation card and voucher products. This illustrationwhich is representative of many, but not applicable to all, of our businesses.
Illustrative Transaction Flow
Illustrative Transaction FlowThe revenue we derive from transactions is generated from both customers and merchants. Customers may include commercial businesses (obtained through direct and indirect channels), as well as partners for whom we manage payment programs. Merchants, who may also be customers under relevant accounting guidance, may inc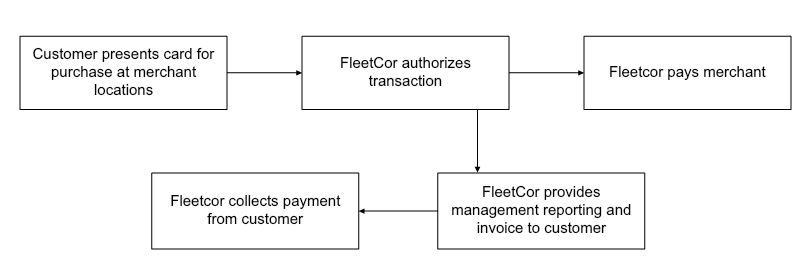
From our customers and partners, we derivegenerate revenue fromthrough a variety of program fees, including transaction fees, card fees, network fees and charges, which cancharges. These fees may be charged as fixed fees, costamounts, costs plus a mark-up, or based on a percentage discount from retail prices.of the transaction purchase amounts, or a combination thereof. Our programs include other fees and charges associated with late payments and based on customer credit risk.
From our merchantmerchants and network relationships,third-party networks, we derivegenerate revenue mostly from the difference between the priceamount charged to a customer for a transaction and the priceamount paid to the merchant or network for the samea given transaction, as well as network fees and charges in certain businesses. As illustrated in the table below, the priceThe amount paid to a merchant or network may be calculated as (i) the merchant’s wholesale product cost of the product plus a markup; (ii) the transaction purchase priceamount less a percentage discount; or (iii) the transaction purchase priceamount less a fixed fee per unit.
The following table presents an illustrative revenue model for transactions with theprovides illustrations of these three merchant payment models, which is primarily applicable to fuel based product transactions,are representative of many, but may also be applied to our vehicle maintenance, lodging and food, fuel, toll and transportation card and voucher products, substituting transactions for gallons. This representative model may not include all, of our businesses.
Illustrative Revenue Model for Fuel Purchases
(unit of one gallon)
|
| | | | | | | | | | | | | | | | | | | | | | |
| | | | | Merchant Payment Methods |
| Retail Price | | $ | 3.00 |
| | i) Cost Plus Mark-up: | | ii) Percentage Discount: | | iii) Fixed Fee: |
| Wholesale Cost | | (2.86 | ) | | Wholesale Cost | | $ | 2.86 |
| | Retail Price | | $ | 3.00 |
| | Retail Price | | $ | 3.00 |
|
| | | | | Mark-up | | 0.05 |
| | Discount (3%) | | (0.09 | ) | | Fixed Fee | | (0.09 | ) |
| FleetCor Revenue | | $ | 0.14 |
| | | | | | | | | | | | |
| Merchant Commission | | $ | (0.05 | ) | | Price Paid to Merchant | | $ | 2.91 |
| | Price Paid to Merchant | | $ | 2.91 |
| | Price Paid to Merchant | | $ | 2.91 |
|
| Price Paid to Merchant | | $ | 2.91 |
| | | | | | | | | | | | |
|
| | | | | | | | | | | | | | | | | |
| Illustrative Merchant Payment Models |
| | i) Cost Plus Mark-up: | | ii) Percentage Discount: | | iii) Fixed Fee: |
| | Wholesale Cost | | $ | 2.86 |
| | Retail Price | | $ | 3.00 |
| | Retail Price | | $ | 3.00 |
|
| | Mark-up | | 0.05 |
| | Discount (3%) | | (0.09 | ) | | Fixed Fee | | (0.09 | ) |
| | Price Paid to Merchant | | $ | 2.91 |
| | Price Paid to Merchant | | $ | 2.91 |
| | Price Paid to Merchant | | $ | 2.91 |
|
| | | | | | | | | | | | |
Revenues by geography, product and source. Set forth below are further breakdownsFor a transaction involving the purchase of revenue by geography, product and source forfuel where the three and nine months ended September 30, 2017 and 2016 (in millions). |
| | | | | | | | | | | | | | | | | | | | | | | | | | | | |
| | | Three Months Ended September 30, | | Nine Months Ended September 30, |
| Revenue by Geography* | | 2017 |
| 2016 | | 2017 | | 2016 |
| (Unaudited) | | Revenues, net | | % of total revenues, net | | Revenues, net | | % of total revenues, net | | Revenues, net | | % of
total
revenues, net | | Revenues, net | | % of
total
revenues, net |
| United States | | $ | 358 |
| | 62 | % | | $ | 346 |
| | 71 | % | | $ | 1,031 |
| | 63 | % | | $ | 951 |
| | 72 | % |
| United Kingdom | | 61 |
| | 11 | % | | 56 |
| | 12 | % | | 174 |
| | 11 | % | | 175 |
| | 13 | % |
| Brazil | | 101 |
| | 17 | % | | 43 |
| | 9 | % | | 287 |
| | 17 | % | | 78 |
| | 6 | % |
| Other | | 58 |
| | 10 | % | | 40 |
| | 8 | % | | 148 |
| | 9 | % | | 113 |
| | 9 | % |
| Consolidated revenues, net | | $ | 578 |
| | 100 | % | | $ | 484 |
| | 100 | % | | $ | 1,640 |
| | 100 | % | | $ | 1,317 |
| | 100 | % |
*Columns may not calculate due to impact of rounding.
Subsequent to 2016, as we continued to refine the level of detail behind the product category splits, we reclassified certain amounts into "Other" that we believe are more representative of that category. This reclassification has been appliedamount paid to the 2016merchant is calculated under the cost plus markup model, we refer to the difference between the amount charged to the customer and 2017 comparable data disclosed in the "Revenue by Product Category" table below. |
| | | | | | | | | | | | | | | | | | | | | | | | | | | | |
| | | Three Months Ended September 30, | | Nine Months Ended September 30,8 |
| Revenue by Product Category* | | 2017 | | 2016 | | 2017 | | 2016 |
| (Unaudited) | | Revenues, net | | % of total revenues, net | | Revenues, net | | % of total revenues, net | | Revenues, net | | % of total revenues, net | | Revenues,
net | | % of total
revenues, net |
| Fuel cards | | $ | 276 |
| | 48 | % | | $ | 259 |
| | 53 | % | | $ | 815 |
| | 50 | % | | $ | 741 |
| | 56 | % |
| Corporate Payments | | 72 |
| | 12 | % | | 46 |
| | 10 | % | | 169 |
| | 10 | % | | 132 |
| | 10 | % |
| Tolls | | 83 |
| | 14 | % | | 26 |
| | 5 | % | | 236 |
| | 14 | % | | 30 |
| | 2 | % |
| Lodging | | 33 |
| | 6 | % | | 28 |
| | 6 | % | | 86 |
| | 5 | % | | 74 |
| | 6 | % |
| Gift | | 55 |
| | 9 | % | | 58 |
| | 12 | % | | 144 |
| | 9 | % | | 138 |
| | 10 | % |
| Other | | 59 |
| | 10 | % | | 67 |
| | 14 | % | | 189 |
| | 12 | % | | 201 |
| | 15 | % |
| Consolidated revenues, net | | $ | 578 |
| | 100 | % | | $ | 484 |
| | 100 | % | | $ | 1,640 |
| | 100 | % | | $ | 1,317 |
| | 100 | % |
*Columns may not calculate dueamount paid to impact of rounding.
|
| | | | | | | | | | | | | | | | | | | | | | | | | | | |
| | Three Months Ended September 30, | | Nine Months Ended September 30,8 |
| Major Sources of Revenue* | 2017 | | 2016 | | 2017 | | 2016 |
| (Unaudited) | Revenues, net | | % of total revenues, net | | Revenues, net | | % of total revenues, net | | Revenues, net | | % of total revenues, net | | Revenues, net | | % of total revenues, net |
| Customer | | | | | | | | | | | | | | | |
Processing and program revenue1 | $ | 288 |
| | 50 | % | | $ | 218 |
| | 45 | % | | $ | 781 |
| | 48 | % | | $ | 563 |
| | 43 | % |
Late fees and finance charges2 | 34 |
| | 6 | % | | 31 |
| | 6 | % | | 105 |
| | 6 | % | | 86 |
| | 7 | % |
Miscellaneous fees3 | 32 |
| | 5 | % | | 34 |
| | 7 | % | | 97 |
| | 6 | % | | 93 |
| | 7 | % |
| | 354 |
| | 61 | % | | 283 |
| | 58 | % | | 983 |
| | 60 | % | | 742 |
| | 56 | % |
| Merchant |
|
| |
|
| |
|
| |
|
| |
|
| |
|
| |
|
| |
|
|
Discount revenue (fuel)4 | 77 |
| | 13 | % | | 68 |
| | 14 | % | | 223 |
| | 14 | % | | 194 |
| | 15 | % |
Discount revenue (nonfuel)5 | 45 |
| | 8 | % | | 40 |
| | 8 | % | | 130 |
| | 8 | % | | 116 |
| | 9 | % |
Tied to fuel-price spreads6 | 53 |
| | 9 | % | | 53 |
| | 11 | % | | 165 |
| | 10 | % | | 145 |
| | 11 | % |
Program revenue7 | 49 |
| | 8 | % | | 41 |
| | 8 | % | | 139 |
| | 8 | % | | 119 |
| | 9 | % |
| | 224 |
| | 39 | % | | 202 |
| | 42 | % | | 657 |
| | 40 | % | | 574 |
| | 44 | % |
| Consolidated revenues, net | $ | 578 |
| | 100 | % | | $ | 484 |
| | 100 | % | | $ | 1,640 |
| | 100 | % | | $ | 1,317 |
| | 100 | % |
|
|
1Includes revenue from customers based on accounts, cards, devices, transactions, load amounts and/or purchase amounts, etc. for participation in our various fleet and workforce related programs; as well as, revenue from partners (e.g., major retailers, leasing companies, oil companies, petroleum marketers, etc.) for processing and network management services. Primarily represents revenue from North American trucking, lodging, prepaid benefits, telematics, gifts cards and toll related businesses.
|
2Fees for late payment and interest charges for carrying a balance charged to a customer.
|
3Non-standard fees charged to customers based on customer behavior or optional participation, primarily including high credit risk surcharges, over credit limit charges, minimum processing fees, printing and mailing fees, environmental fees, etc.
|
4Interchange revenue directly influenced by the absolute price of fuel and other interchange related to fuel products.
|
5Interchange revenue related to nonfuel products.
|
6Revenue derived from the difference between the price charged to a fleet customer for a transaction and the price paid to the merchant for the same transaction.
|
7Revenue derived primarily from the sale of equipment, software and related maintenance to merchants.
|
8Amounts shown for the nine months ended September 30, 2017 and 2016 reflect immaterial corrections in estimated allocation of revenue by product and sources of revenue from previously disclosed amounts for the prior period.
|
*We may not be able to precisely calculate revenue by source, as certain estimates were made in these allocations. Columns may not calculate due to impact of rounding. This table reflects how management views the sources of revenue and may not be consistent with prior disclosure. |
the merchant as revenue tied to fuel-price spreads. In all other cases, we refer to the difference between the amount charged to the customer and the amount paid to the merchant for a given transaction as interchange revenue.
Revenue per transaction. Set forth below is revenue per transaction by segment information for the three and nine months ended September 30,March 31, 2018 and 2017. Revenue per transactions by segment is affected by the mix of products and 2016:
|
| | | | | | | | | | | | | | | | |
| | | Three Months Ended September 30, | | Nine Months Ended September 30, |
| (Unaudited) | | 2017 | | 2016 | | 2017 | | 2016 |
| Transactions (in millions) | | | | | | | | |
| North America | | 398.4 |
| | 370.1 |
| | 1,301.1 |
| | 1,214.3 |
|
| International | | 280.7 |
| | 127.4 |
| | 823.0 |
| | 233.3 |
|
| Total transactions | | 679.1 |
|
| 497.5 |
|
| 2,124.1 |
|
| 1,447.6 |
|
| Revenue per transaction | |
| |
| | | | |
| North America | | $ | 0.91 |
| | $ | 0.93 |
| | $ | 0.80 |
| | $ | 0.78 |
|
| International | | 0.76 |
| | 1.09 |
| | 0.73 |
| | 1.57 |
|
| Consolidated revenue per transaction | | 0.85 |
| | 0.97 |
| | 0.77 |
| | 0.91 |
|
For the three months ended September 30, 2017, total transactions increased from 497.5 million to 679.1 million, an increase of 181.6 million transactions, or 37%. For the nine months ended September 30, 2017, total transactions increased from 1,447.6 million to 2,124.1 million, an increase of 676.4 million transactions, or 47%. North American segment transactions increased approximately 8% and 7%acquisitions, which may result in the three and nine months ended September 30, 2017 as compared to 2016, respectively, due primarily to growth in our SVS and fuel card businesses. Transaction volumes in our international segment increased by 120% and 253% in the three and nine months ended September 30, 2017 as compared to 2016, respectively, primarily due to the acquisition of STP and Travelcard during the third quarter of 2016.
Set forth below is further breakdown of revenue and revenue per transaction by product categoryproviding more meaningful data for analysis.
|
| | | | | | | | | |
| | | Three Months Ended March 31, | |
| (Unaudited) | | 2018 | | 2017 | |
| Transactions (in millions) | | | | | |
| North America | | 449.7 |
| | 428.7 |
| 1 |
| International | | 273.0 |
| | 270.9 |
| |
| Total transactions | | 722.8 |
| | 699.6 |
| |
| Revenue per transaction | |
| |
| |
| North America | | $ | 0.81 |
| | $ | 0.77 |
| |
| International | | 0.81 |
| | 0.70 |
| |
| Consolidated revenue per transaction | | 0.81 |
| | 0.74 |
| |
|
|
1 For purposes of comparability, reflects adjustment for 44.3 million non-recurring transactions at SVS in the first quarter of 2017 due to system driven balance inquiries. |
The following table provides a breakdown of revenue per transaction by product for the three months ended
September 30, 2017March 31, 2018 and
2016 (in millions except revenues, net per transaction)*:2017. |
| | | | | | | | | | | | | | | | | | | | | | | | | | | | | | |
| | | As Reported | | Pro Forma and Macro Adjusted2 |
| | | Three Months Ended September 30, | | Three Months Ended September 30, |
| (Unaudited) | | 2017 | | 2016 | | Change | | % Change | | 20173 | | 20164 | | Change | | % Change |
| FUEL CARDS | | | | | | | | | | | | | | | | |
‑Transactions5 | | 119.6 |
| | 112.5 |
| | 7.1 |
| | 6 | % | | 119.6 |
| | 113.6 |
| | 6.0 |
| | 5 | % |
| ‑Revenues, net per transaction | | $ | 2.31 |
| | $ | 2.30 |
| | $ | 0.01 |
| | — | % | | $ | 2.29 |
| | $ | 2.28 |
| | $ | 0.01 |
| | — | % |
| ‑ Revenues, net | | $ | 276.2 |
| | $ | 258.8 |
| | $ | 17.4 |
| | 7 | % | | $ | 274.0 |
| | $ | 259.5 |
| | $ | 14.5 |
| | 6 | % |
| CORPORATE PAYMENTS | |
|
| |
|
| |
|
| |
|
| |
|
| |
|
| |
|
| |
|
|
| ‑Transactions | | 10.9 |
| | 10.0 |
| | 0.9 |
| | 9 | % | | 10.9 |
| | 10.2 |
| | 0.7 |
| | 7 | % |
| ‑Revenues, net per transaction | | $ | 6.63 |
| | $ | 4.61 |
| | $ | 2.02 |
| | 44 | % | | $ | 6.58 |
| | $ | 5.99 |
| | $ | 0.58 |
| | 10 | % |
| ‑ Revenues, net | | $ | 72.2 |
| | $ | 46.1 |
| | $ | 26.1 |
| | 57 | % | | $ | 71.7 |
| | $ | 61.3 |
| | $ | 10.4 |
| | 17 | % |
| TOLLS | |
|
| |
|
| |
|
| |
|
| |
|
| |
|
| |
|
| |
|
|
| ‑Transactions | | 231.0 |
| | 81.1 |
| | 149.8 |
| | 185 | % | | 231.0 |
| | 225.0 |
| | 5.9 |
| | 3 | % |
| ‑Revenues, net per transaction | | $ | 0.36 |
| | $ | 0.32 |
| | $ | 0.04 |
| | 13 | % | | $ | 0.35 |
| | $ | 0.30 |
| | $ | 0.05 |
| | 16 | % |
| ‑ Revenues, net | | $ | 82.9 |
| | $ | 25.8 |
| | $ | 57.1 |
| | 221 | % | | $ | 80.8 |
| | $ | 67.8 |
| | $ | 13.0 |
| | 19 | % |
| LODGING | |
|
| |
|
| |
|
| |
|
| |
|
| |
|
| |
|
| |
|
|
| ‑Transactions | | 4.1 |
| | 3.5 |
| | 0.6 |
| | 17 | % | | 4.1 |
| | 3.5 |
| | 0.6 |
| | 17 | % |
| ‑Revenues, net per transaction | | $ | 8.14 |
| | $ | 8.04 |
| | $ | 0.10 |
| | 1 | % | | $ | 8.14 |
| | $ | 8.04 |
| | $ | 0.10 |
| | 1 | % |
| ‑ Revenues, net | | $ | 33.2 |
| | $ | 28.1 |
| | $ | 5.2 |
| | 18 | % | | $ | 33.2 |
| | $ | 28.1 |
| | $ | 5.2 |
| | 18 | % |
| GIFT | |
|
| |
|
| |
|
| |
|
| |
|
| |
|
| |
|
| |
|
|
| ‑Transactions | | 294.1 |
| | 269.5 |
| | 24.6 |
| | 9 | % | | 294.1 |
| | 269.5 |
| | 24.6 |
| | 9 | % |
| ‑Revenues, net per transaction | | $ | 0.19 |
| | $ | 0.22 |
| | $ | (0.03 | ) | | (14 | )% | | $ | 0.19 |
| | $ | 0.22 |
| | $ | (0.03 | ) | | (14 | )% |
| ‑ Revenues, net | | $ | 54.8 |
| | $ | 58.3 |
| | $ | (3.5 | ) | | (6 | )% | | $ | 54.8 |
| | $ | 58.3 |
| | $ | (3.5 | ) | | (6 | )% |
OTHER1 | |
|
| |
|
| |
|
| |
|
| |
|
| |
|
| |
|
| |
|
|
‑Transactions5 | | 19.4 |
| | 20.8 |
| | (1.4 | ) | | (7 | )% | | 19.4 |
| | 20.4 |
| | (1.0 | ) | | (5 | )% |
| ‑Revenues, net per transaction | | $ | 3.01 |
| | $ | 3.24 |
| | $ | (0.22 | ) | | (7 | )% | | $ | 2.99 |
| | $ | 2.80 |
| | $ | 0.20 |
| | 7 | % |
| ‑ Revenues, net | | $ | 58.5 |
| | $ | 67.4 |
| | $ | (8.8 | ) | | (13 | )% | | $ | 58.1 |
| | $ | 57.1 |
| | $ | 1.0 |
| | 2 | % |
| FLEETCOR CONSOLIDATED REVENUES | |
|
| |
|
| |
|
| |
|
| |
|
| |
|
| |
|
| |
|
|
‑Transactions5 | | 679.1 |
| | 497.5 |
| | 181.6 |
| | 37 | % | | 679.1 |
| | 642.2 |
| | 36.8 |
| | 6 | % |
| ‑Revenues, net per transaction | | $ | 0.85 |
| | $ | 0.97 |
| | $ | (0.12 | ) | | (13 | )% | | $ | 0.84 |
| | $ | 0.83 |
| | $ | 0.01 |
| | 2 | % |
| ‑ Revenues, net | | $ | 577.9 |
| | $ | 484.4 |
| | $ | 93.5 |
| | 19 | % | | $ | 572.6 |
| | $ | 532.1 |
| | $ | 40.6 |
| | 8 | % |
|
| | | | | | | | | | | | | | | | | | | | | | | | | | | | | | |
| | | As Reported | | Pro Forma and Macro Adjusted |
| | | Three Months Ended March 31, | | Three Months Ended March 31, |
| (Unaudited)* | | 2018¹ | | 2017 | | Change | | % Change | | 2018¹ | | 2017¹ | | Change | | % Change |
| FUEL CARDS | | | | | | | | | | | | | | | | |
'- Transactions | | 117.6 |
| | 111.0 |
| | 6.6 |
| | 6 | % | | 117.6 |
| | 112.5 |
| | 5.1 |
| | 5 | % |
'- Revenues, net per transaction | | $ | 2.20 |
| | $ | 2.34 |
| | $ | (0.15 | ) | | (6 | )% | | $ | 2.04 |
| | $ | 2.11 |
| | $ | (0.07 | ) | | (3 | )% |
'- Revenues, net | | $ | 258.4 |
| | $ | 260.3 |
| | $ | (1.9 | ) | | (1 | )% | | $240.4 | | $ | 237.6 |
| | $ | 2.9 |
| | 1 | % |
| CORPORATE PAYMENTS | | | | | | | | | | | | | | | | |
'- Transactions | | 10.9 |
| | 9.5 |
| | 1.4 |
| | 15 | % | | 10.9 |
| | 9.7 |
| | 1.2 |
| | 12 | % |
'- Revenues, net per transaction | | $ | 8.69 |
| | $ | 4.93 |
| | $ | 3.76 |
| | 76 | % | | $ | 8.58 |
| | $ | 7.67 |
| | $ | 0.91 |
| | 12 | % |
'- Revenues, net | | $ | 94.8 |
| | $ | 46.8 |
| | $ | 47.9 |
| | 102 | % | | $ | 93.5 |
| | $ | 74.6 |
| | $ | 18.9 |
| | 25 | % |
| TOLLS | | | | | | | | | | | | | | | | |
'- Transactions | | 220.8 |
| | 222.9 |
| | (2.0 | ) | | (1 | )% | | 220.8 |
| | 222.9 |
| | (2.0 | ) | | (1 | )% |
'- Revenues, net per transaction | | $ | 0.41 |
| | $ | 0.35 |
| | $ | 0.07 |
| | 20 | % | | $ | 0.43 |
| | $ | 0.35 |
| | $ | 0.08 |
| | 23 | % |
'- Revenues, net | | $ | 91.2 |
| | $ | 77.0 |
| | $ | 14.2 |
| | 18 | % | | $ | 94.1 |
| | $ | 77.0 |
| | $ | 17.1 |
| | 22 | % |
| LODGING | | | | | | | | | | | | | | | | |
'- Transactions | | 5.4 |
| | 3.2 |
| | 2.2 |
| | 68 | % | | 5.4 |
| | 3.6 |
| | 1.8 |
| | 50 | % |
'- Revenues, net per transaction | | $ | 7.27 |
| | $ | 7.38 |
| | $ | (0.10 | ) | | (1 | )% | | $ | 7.27 |
| | $ | 7.92 |
| | $ | (0.64 | ) | | (8 | )% |
'- Revenues, net | | $ | 39.4 |
| | $ | 23.8 |
| | $ | 15.7 |
| | 66 | % | | $ | 39.4 |
| | $ | 28.6 |
| | $ | 10.8 |
| | 38 | % |
| GIFT | | | | | | | | | | | | | | | | |
'- Transactions | | 349.6 |
| | 333.4 |
| 2 | 16.2 |
| | 5 | % | | 349.6 |
| | 333.4 |
| 2 | 16.2 |
| | 5 | % |
'- Revenues, net per transaction | | $ | 0.14 |
| | $ | 0.15 |
| | $ | (0.01 | ) | | (4 | )% | | $ | 0.14 |
| | $ | 0.15 |
| | $ | (0.01 | ) | | (4 | )% |
'- Revenues, net | | $ | 48.6 |
| | $ | 48.4 |
| | $ | 0.2 |
| | — | % | | $ | 48.6 |
| | $ | 48.4 |
| | $ | 0.2 |
| | — | % |
OTHER3 | | | | | | | | | | | | | | | | |
'- Transactions | | 18.4 |
| | 19.6 |
| | (1.3 | ) | | (6 | )% | | 18.4 |
| | 19.2 |
| | (0.8 | ) | | (4 | )% |
'- Revenues, net per transaction | | $ | 2.89 |
| | $ | 3.26 |
| | $ | (0.37 | ) | | (11 | )% | | $ | 2.81 |
| | $ | 2.69 |
| | $ | 0.12 |
| | 4 | % |
'- Revenues, net | | $ | 53.1 |
| | $ | 64.1 |
| | $ | (11.0 | ) | | (17 | )% | | $ | 51.6 |
| | $ | 51.7 |
| | $ | — |
| | — | % |
| FLEETCOR CONSOLIDATED REVENUES | | | | | | | | | | | | | | | | |
'- Transactions | | 722.8 |
| | 699.6 |
| | 23.2 |
| | 3 | % | | 722.8 |
| | 701.3 |
| | 21.4 |
| | 3 | % |
'- Revenues, net per transaction | | $ | 0.81 |
| | $ | 0.74 |
| | $ | 0.07 |
| | 9 | % | | $ | 0.79 |
| | $ | 0.74 |
| | $ | 0.05 |
| | 6 | % |
'- Revenues, net | | $ | 585.5 |
| | $ | 520.4 |
| | $ | 65.1 |
| | 13 | % | | $ | 567.7 |
| | $ | 517.9 |
| | $ | 49.8 |
| | 10 | % |
|
|
*Columns may not calculate due to impact of rounding. |
1Reflects the January 1, 2018 adoption of Accounting Standards Update 2014-09, "Revenue from Contracts with Customers (Topic 606)", using the modified retrospective transition method. As a result of the application of the modified retrospective transition method, the Company's prior period results within its annual report on Form 10-K and quarterly reports on Form 10-Q will not be restated to reflect Topic 606. For purposes of comparability, 2017 revenue has been recast in this table. Pro forma amounts for 2017 include estimates made by the Company for the impact of Topic 606 on 2017 revenues, as the Company did not apply a full retrospective adoption. |
2 For purposes of comparability, reflects adjustment for 44.3 million non-recurring transaction at SVS in the first quarter of 2017 due to system driven balance inquiries. |
3 Other includes telematics, maintenance, food, and transportation related businesses. |
2 Pro forma and macro adjusted revenue is a non-GAAP financial measure defined as revenues, net adjusted for the impact of the macroeconomic environment and acquisitions and dispositions and other one-time items. We use pro forma and macro adjusted revenue as a basis to evaluate our organic growth. See the heading entitled “Management’s Use of Non-GAAP Financial Measures” for a reconciliation of pro forma and macro adjusted revenue by product, non-GAAP measures, to the GAAP equivalent.
|
32017 is adjusted to remove the impact of changes in the macroeconomic environment to be consistent with the same period of prior year, using constant fuel prices, fuel price spreads and foreign exchange rates.
|
42016 is pro forma to include acquisitions and exclude dispositions consistent with 2017 ownership.
|
52016 and YTD 2017 transactions reflect immaterial corrections from previously disclosed amounts for the prior period.
|
Revenue per transaction is derived from the various revenue types as discussed above and can vary based on geography, the relevant merchant relationship, the payment product utilized and the types of products or services purchased, the mix of which would be influenced by our acquisitions, organic growth in our business, and the overall macroeconomic environment, including fluctuations in foreign currency exchange rates, fuel prices and fuel spread margins. Revenue per transaction per customer changes as the level of services we provide to a customer increases or decreases, as macroeconomic factors change and as adjustments are made to merchant and customer rates. See “Results of Operations” for further discussion of transaction volumes and revenue per transaction.
Sources of Expenses
We incur expenses in the following categories:
Merchant commissions—In certain of our card programs, we incur merchant commissions expense when we reimburse merchants with whom we have direct, contractual relationships for specific transactions where a customer purchases products or services from the merchant. In the card programs where it is paid, merchant commissions equal the difference between the price paid by us to the merchant and the merchant’s wholesale cost of the underlying products or services. The adoption of Topic 606 on January 1, 2018, resulted in a change in the presentation of amounts previously classified as merchant commissions, resulting in these amounts being recorded within revenues, net in periods beginning in 2018.
Processing—Our processing expense consists of expenses related to processing transactions, servicing our customers and merchants, bad debt expense and cost of goods sold related to our hardware sales in certain businesses. Effective with the adoption of Topic 606 on January 1, 2018, certain third party processing expenses are netted with consolidated revenues, where the network is considered to be our customer.
Selling—Our selling expenses consist primarily of wages, benefits, sales commissions (other than merchant commissions) and related expenses for our sales, marketing and account management personnel and activities.
General and administrative—Our general and administrative expenses include compensation and related expenses (including stock-based compensation) for our executives, finance and accounting, information technology, human resources, legal and other administrative personnel. Also included are facilities expenses, third-party professional services fees, travel and entertainment expenses, and other corporate-level expenses.
Depreciation and amortization—Our depreciation expenses include depreciation of property and equipment, consisting of computer hardware and software (including proprietary software development amortization expense), card-reading equipment, furniture, fixtures, vehicles and buildings and leasehold improvements related to office space. Our amortization expenses include amortization of intangible assets related to customer and vendor relationships, trade names and trademarks, software and non-compete agreements. We are amortizing intangible assets related to business acquisitions and certain private label contracts associated with the purchase of accounts receivable.
Other operating, net—Our other operating, net includes other operating expenses and income items unusual to the period and presented separately.
Investment loss (income)—Our investment results relate to our minority interest in Masternaut, a provider of telematics solutions to commercial fleets in Europe, which we historically accounted for using the equity method. On September 30, 2017, we entered into an amended Masternaut investment agreement that resulted in the loss of significant influence, and we began accounting for the Masternaut investment by applying the cost method.
Other expense (income), net—Our other expense (income), net includes foreign currency transaction gains or losses, proceeds/costs from the sale of assets, foreign currency transaction gains or losses and other miscellaneous operating costs and revenue.
Interest expense, net—Our interest expense, net includes interest income on our cash balances and interest expense on our outstanding debt and on our Securitization Facility. We have historically invested our cash primarily in short-term money market funds.
Loss on extinguishment of debt—Loss on extinguishment of debt relates to our write-off of debt issuance costs associated with the refinancing of our existing credit facility.
Provision for income taxes—Our provision for income taxes consists primarily of corporate income taxes related to profits resulting from the sale of our products and services in the United States and internationally.service on a global basis.
Factors and Trends Impacting our Business
We believe that the following factors and trends are important in understanding our financial performance:
Global economic conditions—Our results of operations are materially affected by conditions in the economy generally, both in North America and internationally. Factors affected by the economy include our transaction volumes, the credit risk of our customers and changes in tax laws across the globe. These factors affected our businesses in both our North America and International segments.
Foreign currency changes—Our results of operations are significantly impacted by changes in foreign currency rates; namely, by movements of the Australian dollar, Brazilian real, British pound, Canadian dollar, Czech koruna, Euro, Mexican peso, New Zealand dollar and Russian ruble, relative to the U.S. dollar. Approximately 59% and 63% of our revenue in the three months ended March 31, 2018 and 2017, respectively, was derived in U.S. dollars and was not affected by foreign currency exchange rates. See “Results of Operations” for information related to foreign currency impact on our total revenue, net.
Fuel prices—Our fleet customers use our products and services primarily in connection with the purchase of fuel. Accordingly, our revenue is affected by fuel prices, which are subject to significant volatility. A change in retail fuel prices could cause a decrease or increase in our revenue from several sources, including fees paid to us based on a percentage of each customer’s total purchase. Changes in the absolute price of fuel may also impact unpaid account balances and the late fees and charges based on these amounts. See “Sources of Revenue” above for further information related to the absolute price of fuel.
Fuel-price spread volatility—A portion of our revenue involves transactions where we derive revenue from fuel-price spreads, which is the difference between the price charged to a fleet customer for a transaction and the price paid to the merchant for the same transaction. In these transactions, the price paid to the merchant is based on the wholesale cost of fuel. The merchant’s wholesale cost of fuel is dependent on several factors including, among others, the factors described above affecting fuel prices. The fuel price that we charge to our customer is dependent on several factors including, among others, the fuel price paid to the merchant, posted retail fuel prices and competitive fuel prices. We experience fuel-price spread contraction when the merchant’s wholesale cost of fuel increases at a faster rate than the fuel price we charge to our customers, or the fuel price we charge to our customers decreases at a faster rate than the merchant’s wholesale cost of fuel. See “Sources of Revenue” above for further information related to fuel-price spreads.
Acquisitions—Since 2002, we have completed over 75 acquisitions of companies and commercial account portfolios. Acquisitions have been an important part of our growth strategy, and it is our intention to continue to seek opportunities to increase our customer base and diversify our service offering through further strategic acquisitions. The impact of acquisitions has, and may continue to have, a significant impact on our results of operations and may make it difficult to compare our results between periods.
Interest rates—Our results of operations are affected by interest rates. We are exposed to market risk to changes in interest rates on our cash investments and debt.
Global economic conditions—Our results of operations are materially affected by conditions in the economy generally, both in North America and internationally. Factors affected by the economy include our transaction volumes and the credit risk of our customers. These factors affected our businesses in both our North America and International segments.
Foreign currency changes—Our results of operations are significantly impacted by changes in foreign currency rates; namely, by movements of the Australian dollar, Brazilian real, British pound, Canadian dollar, Czech koruna, Euro, Mexican peso, New Zealand dollar and Russian ruble, relative to the U.S. dollar. Approximately 63% and 72% of our revenue in the nine months ended September 30, 2017 and 2016, respectively, was derived in U.S. dollars and was not affected by foreign currency exchange rates. See “Results of Operations” for information related to foreign currency impact on our total revenue, net.
Expenses— Over the long term, we expect that our general and administrative expense will decrease as a percentage of revenue as our revenue increases. To support our expected revenue growth, we plan to continue to incur additional sales and marketing expense by investing in our direct marketing, third-party agents, internet marketing, telemarketing and field sales force.
Unauthorized Access to Systems
On May 3, 2018, the Company announced the unauthorized access into a portion of its systems. On April 26, 2018, Company personnel identified suspicious activity primarily on systems involving the Company’s Stored Value Solutions gift card business. The Company took immediate action to stop the activity and limit the improper use of accessed private label gift card information (these gift cards do not contain personally identifiable information such as consumer names, Social Security numbers, driver’s license numbers and other sensitive personal data). The Company through counsel has retained three information technology forensic firms, which have been examining the Company’s systems in detail over the approximately two week period since the incident was discovered. The Company also contacted federal law enforcement and merchants known to be affected. As of the date hereof, the Company does not believe that the unauthorized access incident will have a material adverse effect on its business and results of operations, though the Company’s investigation is ongoing.
Based upon information known as of the date hereof, the Company believes that a significant number of gift card and PIN numbers issued by six Stored Value Solutions customers were accessed. Following discovery, the Company has been working with merchant customers to limit the impact of the unauthorized access. We believe the mitigation steps discussed with merchants, if fully implemented, will severely restrict or eliminate the ability of the bad actors to use the information, while preserving the ability of legitimate holders of the gift cards to use them.
The Company has no evidence of access affecting its systems involving fleet cards and other payment products, or the proprietary and third-party payment networks used to deliver the Company’s payment solutions.
Acquisitions and Investments
During 2017, the Company completed acquisitions with an aggregate purchase price of $725.2 million, net of cash acquired of $96.3 million. During 2017, the Company made investments in other businesses of $39 million.
On August 9, 2017, we acquired Cambridge, Global Payments (“Cambridge”), a leading business to business (B2B) international payments provider, for approximately $584.1$616.1 million in cash, net of cash acquired of $132.3$94.5 million and inclusive of a note payable of $23.9$23.8 million. Cambridge processes B2B cross-border payments, assisting business clients in making international payments to suppliers and employees.payments. The purpose of this acquisition is to further expand our corporate payments footprint.
On September 26, 2017, we acquired a fuel card provider in Russia.
On October 13, 2017, we completed the acquisition of Creative Lodging Solutions ("CLS"),CLS, a small lodging tuck-in business.
During 2016, we completed acquisitions with an aggregate purchase price of $1.30 billion, net of cash acquired of $51.3 million, which includes deferred payments made during the period related to prior year acquisitions of $6.1 million.
In August 2016, we acquired all of the outstanding stock of STP for $1.23 billion, net of cash acquired of $40.2 million. STP is an electronic toll payments company in Brazil and provides cardless fuel payments at a number of Shell sites throughout Brazil. The purpose of this acquisition was to expand our presencebusiness, in the toll market in Brazil. We financed the acquisition using a combination of existing cash and borrowings under our credit facility.
During 2016, we acquired additional fuel card portfolios in the U.S. and the United Kingdom, additional Shell fuel card markets in Europe and Travelcard in the Netherlands totaling $76.7 million, net of cash acquired of $11.1 million.
During 2016, we made additional investments of $7.9 million related to our investment in Masternaut. We also received a $9.2 million return of our investment in Masternaut.States.
We report our results from Cambridge and CLC acquired in the third quarterand fourth quarters of 2017, respectively, in our North America segment, for Cambridge's business infrom the United States and Canada and within our International segment for Cambridge's business in all other countries outsidedate of the United States and Canada. We are continuing to evaluate the allocation of Cambridge results to our reporting units and segments.acquisition. The results of operations from the fuel card business in Russia are included within our International segment, from the date of acquisition. The results of operations from the fuel card portfolio acquired in the U.S. are included within our North America segment, from the date of acquisition. The results of operations of STP, the fuel card portfolio in the United Kingdom, the additional Shell markets, the Travelcard business in the Netherlands and the small business in Brazil are included within our International segment, from the date of acquisition.
Asset Dispositions
Telematics Businesses
As part of our plan to exit the telematics business, on July 27, 2017, we sold NexTraq, a U.S. fleet telematics business, to Michelin Group for $316 million. We recorded a pre-tax gain on the disposal of NexTraq of $175.0 million during the third quarter of 2017, which iswas net of transaction closing costs. We recorded tax on the gain of disposal of $65.8 million. The gain
on the disposal is included in other (income) expense, net in the accompanying Unaudited Consolidated Statements of Income. NexTraq haswas historically been included in our North America segment.
On September 30, 2017, we entered into an amended Masternaut investment agreement that resulted in the loss of significant influence, and we began accounting for the Masternaut investment by applying the cost method.
We regularly evaluate the carrying value of our Masternaut investment and during the third quarter of 2017, we determined that the fair value of our 44% investment in Masternaut had declined as a result of our loss of significant influence due to the amendment of the Masternaut investment agreement, executed September 30, 2017. As a result, we determined that the carrying value of our investment exceeded its fair value, and concluded that this decline in value was other than temporary. We recorded a $44.6 million impairment loss in the Masternaut investment that includes adjustment for $31.4 million of currency losses previously recognized in accumulated other comprehensive income, in the three and nine months ended September 30, 2017, in the accompanying Unaudited Consolidated Statements of Income.
Results of Operations
Three months ended September 30, 2017March 31, 2018 compared to the three months ended September 30, 2016March 31, 2017
The following table sets forth selected consolidated statement of income and selected operational data for the three months ended September 30,March 31, 2018 and 2017 and 2016 (in thousands)millions, except percentages)*.
| | | (Unaudited) | | Three Months Ended September 30, 2017 | | % of total revenue | | Three Months Ended September 30, 2016 | | % of total revenue | | Increase (decrease) | | % Change | | Three Months Ended March 31, 20181 | | % of total revenue | | Three Months Ended March 31, 2017 | | % of total revenue | | Increase (decrease) | | % Change |
| Revenues, net: | | | | | | | | | | | | |
| North America | | $ | 364,443 |
| | 63.1 | % | | $ | 345,868 |
| | 71.4 | % | | $ | 18,575 |
| | 5.4 | % | | $ | 364.3 |
| | 62.2 | % | | $ | 329.9 |
| | 63.4 | % | | $ | 34.3 |
| | 10.4 | % |
| International | | 213,434 |
| | 36.9 | % | | 138,558 |
| | 28.6 | % | | 74,876 |
| | 54.0 | % | | 221.2 |
| | 37.8 | % | | 190.5 |
| | 36.6 | % | | 30.7 |
| | 16.1 | % |
| Total revenues, net | | 577,877 |
| | 100.0 | % | | 484,426 |
| | 100.0 | % | | 93,451 |
| | 19.3 | % | | 585.5 |
| | 100.0 | % | | 520.4 |
| | 100.0 | % | | 65.1 |
| | 12.5 | % |
| Consolidated operating expenses: | | | | | | | | | | | | |
| Merchant commissions | | 27,687 |
| | 4.8 | % | | 28,214 |
| | 5.8 | % | | (527 | ) | | (1.9 | )% | | — |
| | — | % | | 24.4 |
| | 4.7 | % | | (24.4 | ) | | (100.0 | )% |
| Processing | | 111,283 |
| | 19.3 | % | | 96,233 |
| | 19.9 | % | | 15,050 |
| | 15.6 | % | | 116.5 |
| | 19.9 | % | | 101.8 |
| | 19.6 | % | | 14.7 |
| | 14.4 | % |
| Selling | | 45,060 |
| | 7.8 | % | | 34,180 |
| | 7.1 | % | | 10,880 |
| | 31.8 | % | | 47.1 |
| | 8.0 | % | | 38.8 |
| | 7.5 | % | | 8.3 |
| | 21.3 | % |
| General and administrative | | 92,043 |
| | 15.9 | % | | 77,904 |
| | 16.1 | % | | 14,139 |
| | 18.1 | % | | 90.3 |
| | 15.4 | % | | 95.5 |
| | 18.3 | % | | (5.1 | ) | | (5.4 | )% |
| Depreciation and amortization | | 69,156 |
| | 12.0 | % | | 57,084 |
| | 11.8 | % | | 12,072 |
| | 21.1 | % | | 71.5 |
| | 12.2 | % | | 64.9 |
| | 12.5 | % | | 6.6 |
| | 10.2 | % |
| Other operating, net | | 11 |
| | — | % | | (244 | ) | | (0.1 | )% | | 255 |
| | 104.5 | % | |
| Operating income | | 232,637 |
| | 40.3 | % | | 191,055 |
| | 39.4 | % | | 41,582 |
| | 21.8 | % | | 260.1 |
| | 44.4 | % | | 195.1 |
| | 37.5 | % | | 65.0 |
| | 33.3 | % |
| Investment loss | | 47,766 |
| | 8.3 | % | | 2,744 |
| | 0.6 | % | | 45,022 |
| | 1,640.7 | % | | — |
| | — | % | | 2.4 |
| | 0.5 | % | | (2.4 | ) | | (100.0 | )% |
| Other (income) expense, net | | (175,271 | ) | | (30.3 | )% | | 293 |
| | 0.1 | % | | 175,564 |
| | NM |
| | (0.3 | ) | | (0.1 | )% | | 2.2 |
| | 0.4 | % | | 2.5 |
| | NM |
|
| Interest expense, net | | 29,344 |
| | 5.1 | % | | 17,814 |
| | 3.7 | % | | 11,530 |
| | 64.7 | % | | 31.1 |
| | 5.3 | % | | 23.1 |
| | 4.4 | % | | 7.9 |
| | 34.3 | % |
| Loss on extinguishment of debt | | 3,296 |
| | 0.6 | % | | — |
| | — | % | | 3,296 |
| | — | % | |
| Provision for income taxes | | 124,679 |
| | 21.6 | % | | 40,586 |
| | 8.4 | % | | 84,093 |
| | 207.2 | % | | 54.4 |
| | 9.3 | % | | 43.7 |
| | 8.4 | % | | 10.7 |
| | 24.5 | % |
| Net income | | $ | 202,823 |
| | 35.1 | % | | $ | 129,618 |
| | 26.8 | % | | $ | 73,205 |
| | 56.5 | % | | $ | 174.9 |
| | 29.9 | % | | $ | 123.7 |
| | 23.8 | % | | $ | 51.2 |
| | 41.4 | % |
| Operating income for segments: | | | | | | | | | | | | |
| North America | | $ | 138,748 |
| | | | $ | 135,760 |
| | | | $ | 2,988 |
| | 2.2 | % | | $ | 156.0 |
| |
| | $ | 121.0 |
| | | | $ | 35.0 |
| | 28.9 | % |
| International | | 93,889 |
| | | | 55,295 |
| | | | 38,594 |
| | 69.8 | % | | 104.1 |
| |
| | 74.1 |
| | | | 30.0 |
| | 40.5 | % |
| Operating income | | $ | 232,637 |
| | | | $ | 191,055 |
| | | | $ | 41,582 |
| | 21.8 | % | | $ | 260.1 |
| | | | $ | 195.1 |
| | | | $ | 65.0 |
| | 33.3 | % |
| Operating margin for segments: | | | | | | | | | | | | | | | | | | | | | | | | |
| North America | | 38.1 | % | | | | 39.3 | % | | | | (1.2 | )% | | | | 42.8 | % | | | | 36.7 | % | | | | 6.1 | % | | |
| International | | 44.0 | % | | | | 39.9 | % | | | | 4.1 | % | | | | 47.1 | % | | | | 38.9 | % | | | | 8.2 | % | | |
| Consolidated | | 40.3 | % | | | | 39.4 | % | | | | 0.8 | % | | | |
| Total | | | 44.4 | % | | | | 37.5 | % | | | | 6.9 | % | | |
NM = Not Meaningful
*The sum of the columns and rows may not calculate due to rounding.
1 Reflects the January 1, 2018 adoption of Accounting Standards Update 2014-09, "Revenue from Contracts with Customers (Topic 606)" and related cost capitalization guidance using the modified retrospective transition method. As a result of the application of the modified retrospective transition method, the Company's prior period results within its Form 10-K and quarterly reports on Form 10-Q will not be restated to reflect the impact of Topic 606.
Revenues
Our consolidated revenues increased from $484.4were $585.5 million in the three months ended September 30, 2016 to $577.9March 31, 2018, an increase of $65.1 million or 12.5%, from $520.4 million in the three months ended September 30, 2017, an increase of $93.5 million, or 19.3%.March 31, 2017. The increase in our consolidated revenue was primarily due to:
The impact of acquisitions during 2016 and 2017, which contributed approximately $58$36 million in additional revenue.
Organic growth of approximately 8%10% on a constant fuel price, fuel spread margin, foreign currency and pro formaacquisition, and disposition basis, driven by increases in both volume and revenue per transaction in certain of our payment programs.
programs. Organic revenue growth has been calculated assuming Topic 606 was implemented on January 1, 2017, in order to calculate organic growth using comparable revenue results in each period.
Although we cannot precisely measure the impact of the macroeconomic environment, in total we believe it had a favorable impact on our consolidated revenue for the three months ended September 30, 2017March 31, 2018 over the comparable period in 20162017 of approximately $4$18 million. This wasWe believe the favorable impact of higher fuel prices and fuel spread margins, primarily in the U.S., had a favorable impact on consolidated revenues in the three months ended March 31, 2018 over the comparable period in 2017 of approximately $10 million. Additionally, foreign exchange rates had a favorable impact on consolidated revenues in the three months ended March 31, 2018 compared to the comparable period in 2017 of approximately $8 million, primarily due to favorable changes in foreign exchange rates in Brazil and the United Kingdom in the three months ended September 30, 2017 compared to 2016.almost all geographies.
These increases were partially offset by the impact of the adoption of Topic 606, which decreased consolidated revenues, net by approximately $24 million, for certain amounts previously classified as merchant commissions and processing expense, net with revenues and by approximately $12 million due to the disposition of the NexTraq business in July 2017 of approximately $10 million.2017.
North America segment revenues
North America revenues increased from $345.9were $364.3 million in the three months ended September 30, 2016 to $364.4March 31, 2018, an increase of $34.3 million or 10.4%, from $329.9 million in the three months ended September 30, 2017, an increase of $18.6 million, or 5.4%.March 31, 2017. The increase in our North America segment revenue was primarily due to:
The impact of our Cambridge acquisitionand CLS acquisitions during the third quarter of 2017, which contributed approximately $12$34 million in additional revenue.
Organic growth of approximately 5%8%, on a constant fuel price, fuel spread margin and pro formaacquisition and disposition basis, driven by increases in both volume and revenue per transaction in certain of our payment programs. Organic revenue growth has been calculated assuming Topic 606 was implemented on January 1, 2017, in order to calculate organic growth using comparable revenue results in each period.
Although we cannot precisely measure the impact of the macroeconomic environment, in total we believe it had a negativepositive impact on our North America segment revenue in three months ended September 30, 2017March 31, 2018 over the comparable period in 20162017 of approximately $2$9 million, primarily due to the favorable impact of lowerhigher fuel prices and slightly higher fuel spread margins.
These increases were partially offset by the impact of the adoption of Topic 606, which decreased North America revenues, net by approximately $19 million and by approximately $12 million due to the disposition of the NexTraq business in July 2017 of approximately $10 million.2017.
International segment revenues
International segment revenues increased from $138.6were $221.2 million in the three months ended September 30, 2016 to $213.4March 31, 2018, an increase of $221.2 million or 16.1%, from $190.5 million in the three months ended September 30, 2017, an increase of $74.9 million, or 54.0%.March 31, 2017. The increase in our International segment revenue was primarily due to:
The impact of acquisitionsa small fuel card acquisition during 2016 and 2017, which contributed approximately $462 million in additional revenue.
Organic growth of approximately 12%13% on a constant macroeconomicfuel price, fuel spread margin and pro formaacquisition basis, driven by increases in both volume and revenue per transaction in certain of our payment programs. Organic revenue growth has been calculated assuming Topic 606 was implemented in January 2017 in order to calculate organic growth using a consistent revenue standard in both periods.
Although we cannot precisely measure the impact of the macroeconomic environment, in total we believe it had a positive impact on our International segment revenue for the three months ended September 30, 2017March 31, 2018 over the comparable period in 20162017 of approximately $6$9 million. Changes in foreign exchange rates and higher fuel priceprices had favorable impacts on consolidated revenues of approximately $4$8 million and $2$1 million, respectively.
These increases were partially offset by the impact of the adoption of Topic 606, which decreased International revenues, net by approximately $5 million.
Revenues by geography, product and source. Set forth below are further breakdowns of revenue by geography, product and source for the three months ended March 31, 2018 and 2017 (in millions). |
| | | | | | | | | | | | | | |
| | | Three Months Ended March 31, |
| Revenue, net by Geography* | | 2018¹ | | 2017 |
| (Unaudited) | | Revenues, net | | % of total revenues, net | | Revenues, net | | % of total revenues, net |
| United States | | $ | 344 |
| | 59 | % | | $ | 330 |
| | 63 | % |
| Brazil | | 107 |
| | 18 | % | | 93 |
| | 18 | % |
| United Kingdom | | 64 |
| | 11 | % | | 54 |
| | 10 | % |
| Other | | 71 |
| | 12 | % | | 43 |
| | 8 | % |
| Consolidated revenues, net | | $ | 586 |
| | 100 | % | | $ | 520 |
| | 100 | % |
*Columns may not calculate due to rounding.
|
| | | | | | | | | | | | | | |
| | | Three Months Ended March 31, |
| Revenue, net by Product Category* | | 2018¹ | | 2017 |
| (Unaudited) | | Revenues, net | | % of total revenues, net | | Revenues, net | | % of total revenues, net |
| Fuel cards | | $ | 259 |
| | 44 | % | | $ | 260 |
| | 50 | % |
| Corporate Payments | | 95 |
| | 16 | % | | 47 |
| | 9 | % |
| Tolls | | 91 |
| | 16 | % | | 77 |
| | 15 | % |
| Lodging | | 39 |
| | 7 | % | | 24 |
| | 5 | % |
| Gift | | 49 |
| | 8 | % | | 48 |
| | 9 | % |
| Other | | 53 |
| | 9 | % | | 64 |
| | 12 | % |
| Consolidated revenues, net | | $ | 586 |
| | 100 | % | | $ | 520 |
| | 100 | % |
*Columns may not calculate due to rounding.
|
| | | | | | | | | | | | | | |
Major Sources of Revenue, net* | | Three Months Ended March 31, |
| (Unaudited) | | 2018¹ | | % | | 2017 | | % |
Processing and Program Revenue2 | | $ | 311 |
| | 53 | % | | $ | 244 |
| | 47 | % |
Late Fees and Finance Charges3 | | 36 |
| | 6 | % | | 37 |
| | 7 | % |
Miscellaneous Fees4 | | 34 |
| | 6 | % | | 34 |
| | 6 | % |
Discount Revenue (Fuel)5 | | 85 |
| | 14 | % | | 81 |
| | 15 | % |
Discount Revenue (NonFuel)6 | | 43 |
| | 7 | % | | 41 |
| | 8 | % |
Tied to Fuel-Price Spreads7 | | 26 |
| | 4 | % | | 50 |
| | 10 | % |
Merchant Program Revenue8 | | 50 |
| | 9 | % | | 34 |
| | 7 | % |
| Consolidated revenues, net | | $ | 586 |
| | 100 | % | | $ | 520 |
| | 100 | % |
|
|
1 Reflects the January 1, 2018 adoption of Accounting Standards Update 2014-09, "Revenue from Contracts with Customers (Topic 606)" and related cost capitalization guidance using the modified retrospective transition method. As a result of the application of the modified retrospective transition method, the Company's prior period results within its annual report on Form 10-K and quarterly reports on Form 10-Q will not be restated to reflect the impact of Topic 606. |
2 Includes revenue from customers based on accounts, cards, devices, transactions, load amounts and/or purchase amounts, etc. for participation in our various fleet and workforce related programs; as well as, revenue from partners (e.g., major retailers, leasing companies, oil companies, petroleum marketers, etc.) for processing and network management services. Primarily represents revenue from North American trucking, lodging, prepaid benefits, telematics, gift cards and toll related businesses. |
3 Fees for late payment and interest charges for carrying a balance charged to a customer. |
4 Non-standard fees charged to customers based on customer behavior or optional participation, primarily including high credit risk surcharges, over credit limit charges, minimum processing fees, printing and mailing fees, environmental fees, etc. |
5 Interchange revenue directly influenced by the absolute price of fuel and other interchange related to fuel products. |
6 Interchange revenue related to nonfuel products. |
7 Revenue derived from the difference between the price charged to a fleet customer for a transaction and the price paid to the merchant for the same transaction. |
8 Revenue derived primarily from the sale of equipment, software and related maintenance to merchants. |
| * We may not be able to precisely calculate revenue by source, as certain estimates were made in these allocations. Columns may not calculate due to rounding. |
Consolidated operating expenses
Merchant commissions. MerchantThe adoption of Topic 606 on January 1, 2018, resulted in a change in the presentation of amounts previously classified as merchant commissions decreased from $28.2of $27 million in the three months ended September 30, 2016 to $27.7March 31, 2018. As of January 1, 2018, these amounts are recorded within revenues, net. Merchant commissions were $24.4 million in the three months ended September 30, 2017, a decrease of $0.5 million, or 1.9%. This decrease was primarily due to the fluctuation of the margin between the wholesale cost and retail price of fuel.March 31, 2017.
Processing. Processing expenses increased from $96.2were $116.5 million in the three months ended September 30, 2016 to $111.3March 31, 2018, an increase of $14.7 million or 14.4%, from $101.8 million in the three months ended September 30, 2017, an increase of $15.1 million, or 15.6%.comparable prior period. Increases in processing expenses were primarily due to expenses related to acquisitions completed in 2016 and 2017 of approximately $14 million and the impact of foreign exchange rates and incremental spend due to increases in volume.million. These increases were partially offset by the impact of disposition of the NexTraq business of approximately $3$4 million. Additionally, the adoption of Topic 606 on January 1, 2018, resulted in a change in the presentation of certain third-party processing expenses and related rebates of $2 million and lower bad debt expensein the three months ended March 31, 2018. As of approximately $2 million.January 1, 2018, these amounts are recorded within revenues, net.
Selling. Selling expenses increased from $34.2were $47.1 million in the three months ended September 30, 2016 to $45.1March 31, 2018, an increase of $8.3 million or 21.3% from $38.8 million in the three months ended September 30, 2017, an increase of $10.9 million, or 31.8%.comparable prior period. Increases in spending were primarily due to ongoing incremental expenses related to acquisitions completed in 2016 and 2017 of approximately $9$6 million and additional spending in certain lines of business and the impact of foreign exchange rates.business. These increases were partially offset by the impact of disposition of the NexTraq business of approximately $1 million. Additionally, the adoption of Topic 606 and related cost capitalization guidance on January 1, 2018, resulted in the capitalization of certain costs incurred to obtain a contract (sales commissions) and deferral over the period of benefit, resulting in reduced selling expenses of approximately $2 million.
General and administrative. General and administrative expenses increased from $77.9were $90.3 million in the three months ended September 30, 2016 to $92.0March 31, 2018, a decrease of $5.1 million or 5.4%, from $95.5 million in the three months ended September 30, 2017, an increase of $14.1 million, or 18.1%.comparable prior period. The increasedecrease was primarily due to ongoing expenses related to acquisitions completeda decrease in 2016 and 2017stock compensation expense of approximately $10 million, increased stock based compensation expense of approximately $7a reduction in other professional and legal fees totaling $5 million and the impact of foreign exchange rates. These increases were partially offset by the impact of disposition of the NexTraq business of approximately $1 million. These decreases were partially offset by expenses related to acquisitions completed in 2017 of approximately $9 million and additional spending in certain lines of business.
Depreciation and amortization. Depreciation and amortization increased from $57.1expenses were $71.5 million in the three months ended September 30, 2016 to $69.2March 31, 2018, an increase of $6.6 million or 10.2%, from $64.9 million in the three months ended September 30, 2017, an increase of $12.1 million, or 21.1%.comparable prior period. The increase was primarily due to amortization of intangible assets related to acquisitions completed in 2016 and 2017 of approximately $13 million, incremental expense related to capitalized development of software and the impact of foreign exchange rates.$8 million. These increases were partially offset by the impact of disposition of the NexTraq business of approximately $2 million.
Investment loss. Investment loss was $47.8$2.4 million in the three months ended September 30, 2017, compared to $2.7 million in the three months ended September 30, 2016. We regularly evaluate the carrying value of our Masternaut investment and during the third quarter of 2017, we determined that the fair value of our 44% investment in Masternaut had declined asMarch 31, 2017. As a result of our loss of significant influence due to the amendment of the Masternaut investment agreement executed September 30, 2017. As a result,in 2017, we determined that the carrying value of our investment exceeded its fair value, and concluded that this decline in value was other than temporary. We recorded a $44.6 million impairment loss inbegan accounting for the Masternaut investment that includes adjustment for $31.4 millionby applying the cost method and no longer record gains and losses from the Masternaut investment as an investment loss or gain in our consolidated statement of currency losses previously recognized in accumulated other comprehensive income, in the three months ended September 30, 2017, in the accompanying Unaudited Consolidated Statements of Income. There was also a non-recurring net recovery of purchase price of approximately $11 million during the second quarter of 2016.operations.
Other (income) expense, net. Other income, net was $175.3 million in the three months ended September 30, 2017, compared to other expense, net of $0.3 million in the three months ended September 30, 2016. The increase was due primarilyMarch 31, 2018, compared to the pre-tax gain on the saleother expense, net of our Nextraq business of $175$2.2 million in the third quarter ofthree months ended March 31, 2017.
Interest expense, net. Interest expense increased from $17.8was $31.1 million in the three months ended September 30, 2016 to $29.3March 31, 2018, an increase of $7.9 million or 34.3%, from $23.1 million in the three months ended September 30, 2017, an increase of $11.5 million, or 64.7%.comparable prior period. The increase in interest expense is primarily due to the impact of additional borrowings to finance the acquisitionsacquisition of STP and Travelcard completed during the third quarter of 2016 and Cambridge completed during the third quarter ofin 2017, to repurchase our common stock and increases in LIBOR. The following table sets forth the average interest rates paid on borrowings under our Credit Facility, excluding the related unused credit facility fees.
| | | | | Three Months Ended September 30, | | Three Months Ended March 31, |
| (Unaudited) | | 2017 | | 2016 | | 2018 | | 2017 |
| Term loan A | | 2.98 | % | | 1.99 | % | | 3.27 | % | | 2.53 | % |
| Term loan B | | 3.32 | % | | 3.75 | % | | 3.60 | % | | 3.20 | % |
| Domestic Revolver A | | 2.99 | % | | 2.08 | % | | 3.27 | % | | 2.55 | % |
| Foreign Revolver A | | 2.00 | % | | 1.77 | % | | 2.20 | % | | 2.01 | % |
| Foreign swing line | | 1.97 | % | | 1.73 | % | | 2.14 | % | | 1.96 | % |
The average unused credit facility fee for Domestic Revolver A was 0.35%0.33% and 0.30%0.34% in the three month period ending September 30, 2017March 31, 2018 and 20162017, respectively.
Loss on extinguishment of debt. Loss on early extinguishment of debt of $3.3 million relates to our write-off of debt issuance costs associated with the refinancing of our existing credit facility during the third quarter of 2017.
Provision for income taxes. The provision for income taxes increased from $40.6was $54.4 million in the three months ended September 30, 2016 to $124.7March 31, 2018, an increase of $10.7 million or 24.5%, from $43.7 million in the three months ended September 30, 2017, an increase of $84.1 million, or 207.2%.comparable prior period. We provide for income taxes during interim periods based on an estimate of our effective tax rate for the year. Discrete items and changes in the estimate of the annual tax rate are recorded in the period they occur. Our effective tax rate increased from 23.9% for three months ended September 30, 2016decreased to 38.1%23.7% for the three months ended September 30,March 31, 2018 from 26.1% for three months ended March 31, 2017. The 2017decrease in the effective tax rate was impacted by the gain on sale of the NexTraq business of $175 million, all at the higher U.S. tax rate, and the Masternaut impairment charge in the quarter, which had no corresponding tax benefit. Our tax rate in the quarter was 29.4%, excludingdue primarily to the impact of the NexTraq sale, investment impairment and loss on extinguishment of debt. The 2016 tax rate was favorably impacted by a one-time nonrecurring net gain at our Masternaut investment that favorably impacted pre-tax earnings, but was not subject to income tax. The 2016 rate was also favorably impacted by higher excess tax benefits on share-based compensation in the third quarter of 2016 versus the third quarter of 2017.
We pay taxes in many different taxing jurisdictions, including the U.S., most U.S. states and many non-U.S. jurisdictions. The tax rates in certain non-U.S. taxing jurisdictions are lower thanTax Act, which reduced the U.S. tax rate. Consequently, as our earnings fluctuate between taxing jurisdictions, our effective taxfederal statutory rate fluctuates. Also, the excess tax benefit on share based compensation is part
of the effective tax rate. As a result, the tax rate is impacted by the number of stock options exercised or restricted shares vested during the reporting period.from 35% to 21%.
Net income. For the reasons discussed above, our net income increased from $129.6to $174.9 million in the three months ended September 30, 2016 to $202.8March 31, 2018, an increase of $51.2 million or 41.4%, from $123.7 million in the three months ended September 30, 2017, an increase of $73.2 million, or 56.5%.March 31, 2017.
Operating income and operating margin
Consolidated operating income. Operating income increased from $191.1was $260.1 million in the three months ended September 30, 2016 to $232.6March 31, 2018, an increase of $65.0 million or 33.3%, from $195.1 million in the three months ended September 30, 2017, an increase of $41.6 million, or 21.8%.comparable prior period. Our operating margin was 39.4%44.4% and 40.3%37.5% for the three months ended September 30, 2016March 31, 2018 and 2017, respectively. The increase in operating income was primarily due toThese increases were driven by acquisitions completed in 2016 and 2017, and organic growth, as well as the positive impact of the macroeconomic environment of approximately $4$15 million, driven primarily by favorablehigher fuel prices and fluctuationsfavorable movements in foreign exchange rates.rates, organic growth, and lower expenses due primarily to reductions in stock based compensation of $10 million and legal fess of approximately $5 million. These increases were partially offset by the negative impact of higher amortization and depreciation expense relateddue to acquisitions of STP and Travelcard completed in the third quarter of 2016 and Cambridge completed in the third quarter of 2017, additional stock based compensation of approximately $7 million and the disposition of the NexTraq business in July 2017 of approximately $4$3 million.
For the purpose of segment operating results, we calculate segment operating income by subtracting segment operating expenses from segment revenue. Segment operating margin is calculated by dividing segment operating income by segment revenue.
North America segment operating income. North America operating income increased from $135.8was $156.0 million in the three months ended September 30, 2016 to $138.7March 31, 2018, an increase of $35.0 million or 28.9%, from $121.0 million in the three months ended September 30, 2017, an increase of $3.0 million, or 2.2%.comparable prior period. North America operating margin was 39.3%42.8% and 38.1%36.7% for the three months ended September 30, 2016March 31, 2018 and 2017, respectively. The increase in operating income wasThese increases were due primarily to acquisitions completed in 2017, organic growth, and the positive impact of the macroeconomic environment of approximately $1$9 million driven by favorablehigher fuel prices.prices, and lower expense due primarily to reductions in stock based compensation of approximately $9 million and professional and legal fees totaling approximately $5 million. These increases were partially offset by additional stock based compensation of approximately $6 million, the negative impact of higher amortization and depreciation expense relateddue to our acquisition of Cambridge in the third quarter of 2017 and the disposition of the NexTraq business in July 2017 of approximately $4$3 million.
International segment operating income. International operating income increased from $55.3was $104.1 million in the three months ended September 30, 2016 to $93.9March 31, 2018, an increase of $30.0 million or 40.5%, from $74.1 million in the three months ended September 30, 2017, an increase of $38.6 million, or 69.8%.comparable prior period. International operating margin was 39.9%47.1% and 44.0%38.9% for the three months ended September 30, 2016March 31, 2018 and 2017, respectively. The increase in operating income wasThese increases were due primarily to the impact of acquisitions completed in 2016 and organic growth as well asresulting from growth initiatives implemented in our STP business during 2017, the positive impact of the macroeconomic environment of approximately $3$6 million driven primarily by higher fuel prices and favorable fluctuationsmovements in foreign exchange rates. The higher operating margin was driven by the positive impact of process improvementsrates and a reduction in our recently acquired STP business, offset by higher amortization and depreciation expense related to acquisitions of STP and Travelcard completed in the third quarter of 2016 and additional stock based compensation expense of approximately $1 million.
Nine months ended September 30, 2017 compared to the nine months ended September 30, 2016
The following table sets forth selected consolidated statement of income data for the nine months ended September 30, 2017 and 2016 (in thousands).
|
| | | | | | | | | | | | | | | | | | | | | |
| (Unaudited) | | Nine Months Ended September 30, 2017 | | % of total revenue | | Nine Months Ended September 30, 2016 | | % of total revenue | | Increase (decrease) | | % Change |
| Revenues, net: | | | | | | |
| North America | | $ | 1,037,386 |
| | 63.3 | % | | $ | 950,542 |
| | 72.2 | % | | $ | 86,844 |
| | 9.1 | % |
| International | | 602,161 |
| | 36.7 | % | | 366,051 |
| | 27.8 | % | | 236,110 |
| | 64.5 | % |
| Total revenues, net | | 1,639,547 |
| | 100.0 | % | | 1,316,593 |
| | 100.0 | % | | 322,954 |
| | 24.5 | % |
| Consolidated operating expenses: | | | | | | |
| Merchant commissions | | 82,690 |
| | 5.0 | % | | 78,755 |
| | 6.0 | % | | 3,935 |
| | 5.0 | % |
| Processing | | 316,429 |
| | 19.3 | % | | 256,738 |
| | 19.5 | % | | 59,691 |
| | 23.2 | % |
| Selling | | 122,854 |
| | 7.5 | % | | 92,680 |
| | 7.0 | % | | 30,174 |
| | 32.6 | % |
| General and administrative | | 275,046 |
| | 16.8 | % | | 209,084 |
| | 15.9 | % | | 65,962 |
| | 31.5 | % |
| Depreciation and amortization | | 198,731 |
| | 12.1 | % | | 141,848 |
| | 10.8 | % | | 56,883 |
| | 40.1 | % |
| Other operating, net | | 49 |
| | — | % | | (690 | ) | | (0.1 | )% | | 739 |
| | 107.1 | % |
| Operating income | | 643,748 |
| | 39.3 | % | | 538,178 |
| | 40.9 | % | | 105,570 |
| | 19.6 | % |
| Investment loss (income) | | 52,497 |
| | 3.2 | % | | (2,247 | ) | | (0.2 | )% | | 54,744 |
| | (2,436.3 | )% |
| Other (income) expense, net | | (173,626 | ) | | (10.6 | )% | | 1,056 |
| | 0.1 | % | | 174,682 |
| | NM |
|
| Interest expense, net | | 76,322 |
| | 4.7 | % | | 49,905 |
| | 3.8 | % | | 26,417 |
| | 52.9 | % |
| Loss on extinguishment of debt | | 3,296 |
| | 0.2 | % | | — |
| | — | % | | 3,296 |
| | — | % |
| Provision for income taxes | | 227,756 |
| | 13.9 | % | | 132,503 |
| | 10.1 | % | | 95,253 |
| | 71.9 | % |
| Net income | | $ | 457,503 |
| | 27.9 | % | | $ | 356,961 |
| | 27.1 | % | | $ | 100,542 |
| | 28.2 | % |
| Operating income for segments: | | | | | | |
| North America | | $ | 394,646 |
| | | | $ | 367,221 |
| | | | $ | 27,425 |
| | 7.5 | % |
| International | | 249,102 |
| | | | 170,957 |
| | | | 78,145 |
| | 45.7 | % |
| Operating income | | $ | 643,748 |
| | | | $ | 538,178 |
| | | | $ | 105,570 |
| | 19.6 | % |
| Operating margin for segments: | | | | | | | | | | | | |
| North America | | 38.0 | % | | | | 38.6 | % | | | | (0.6 | )% | |
|
| International | | 41.4 | % | | | | 46.7 | % | | | | (5.3 | )% | |
|
| Consolidated | | 39.3 | % | | | | 40.9 | % | | | | (1.6 | )% | |
|
NM = Not Meaningful
The sum of the columns and rows may not calculate due to rounding.
Revenues
Our consolidated revenues increased from $1,316.6 million in the nine months ended September 30, 2016 to $1,639.5 million in the nine months ended September 30, 2017, an increase of $323.0 million, or 24.5%. The increase in our consolidated revenue was primarily due to:
The impact of acquisitions during 2016 and 2017, which contributed approximately $175 million in additional revenue.
Organic growth of approximately 9% on a constant fuel price, fuel spread margin, foreign currency and pro forma basis, driven by increases in both volume and revenue per transaction in certain of our payment programs.
Although we cannot precisely measure the impact of the macroeconomic environment, in total we believe it had a positive impact on our consolidated revenue for the nine months ended September 30, 2017 over the comparable period
in 2016 of approximately $17 million. We believe the favorable impact of higher fuel prices and fuel spread margins, primarily in the U.S., had a favorable impact on consolidated revenues of approximately $22 million. Conversely, changes in foreign exchange rates had an unfavorable impact on consolidated revenues of approximately $5 million due to unfavorable fluctuations in foreign exchange rates primarily in Brazil and the United Kingdom in the nine months ended September 30, 2017 compared to 2016.
These increases were partially offset by the impact of the disposition of the NexTraq business in July 2017 of approximately $10 million.
North America segment revenues
North America revenues increased from $950.5 million in the nine months ended September 30, 2016 to $1,037.4 million in the nine months ended September 30, 2017, an increase of $86.8 million, or 9.1%. The increase in our North America segment revenue was primarily due to:
The impact of our Cambridge acquisition during the third quarter of 2017, which contributed approximately $12 million in additional revenue.
Organic growth of approximately 8%, on a constant fuel price, fuel spread margin and pro forma basis, driven by increases in both volume and revenue per transaction in certain of our payment programs.
Although we cannot precisely measure the impact of the macroeconomic environment, in total we believe it had a positive impact on our North America segment revenue in nine months ended September 30, 2017 over the comparable period in 2016 of approximately $19 million. This was primarily due to the favorable impact of changes in fuel prices and slightly higher fuel spread margins.
These increases were partially offset by the impact of the disposition of the NexTraq business in July 2017 of approximately $10 million.
International segment revenues
International segment revenues increased from $366.1 million in the nine months ended September 30, 2016 to $602.2 million in the nine months ended September 30, 2017, an increase of $236.1 million, or 64.5%. The increase in our International segment revenue was primarily due to:
The impact of acquisitions during 2016 and 2017, which contributed approximately $163 million in additional revenue.
Organic growth of approximately 10% on a constant macroeconomic and pro forma basis, driven by increases in both volume and revenue per transaction in certain of our payment programs.
Although we cannot precisely measure the impact of the macroeconomic environment, in total we believe it had a negative impact on our International segment revenue for the nine months ended September 30, 2017 over the comparable period in 2016 of approximately $2 million. This was primarily due to unfavorable fluctuations in foreign exchange rates, partially offset by the impact of higher fuel prices.
Consolidated operating expenses
Merchant commissions. Merchant commissions increased from $78.8 million in the nine months ended September 30, 2016 to $82.7 million in the nine months ended September 30, 2017, an an increase of $3.9 million, or 5.0%. This increase was primarily due to the fluctuation of the margin between the wholesale cost and retail price of fuel and the impact of higher volume in certain revenue streams where merchant commissions are paid.
Processing. Processing expenses increased from $256.7 million in the nine months ended September 30, 2016 to $316.4 million in the nine months ended September 30, 2017, an increase of $59.7 million, or 23.2%. Increases in processing expenses were primarily due to expenses related to acquisitions completed in 2016 and 2017 of approximately $45 million, inclusive of incremental bad debt expense of $11 million, as well as the impact of changes in foreign exchange rates, partially offset by the impact of negotiated lower vendor processing costs. The increase in bad debt was primarily due to bad debt inherent in the acquired STP business. These increases were partially offset by the impact of disposition of the NexTraq business of approximately $3 million.
Selling. Selling expenses increased from $92.7 million in the nine months ended September 30, 2016 to $122.9 million in the nine months ended September 30, 2017, an increase of $30.2 million, or 32.6%. Increases in spending were primarily due to ongoing expenses related to acquisitions completed in 2016 and 2017 of approximately $19 million and additional spending in certain lines of business. These increases were partially offset by the impact of disposition of the NexTraq business of approximately $1 million.
General and administrative. General and administrative expenses increased from $209.1 million in the nine months ended September 30, 2016 to $275.0 million in the nine months ended September 30, 2017, an increase of $66.0 million, or 31.5%. The increase was primarily due to ongoing expenses related to acquisitions completed in 2016 and 2017 of approximately $28 million, increased stock based compensation expense of approximately $19 million and increases in other professional fees of approximately $7 million. These increases were partially offset by the impact of disposition of the NexTraq business of approximately $1 million.
Depreciation and amortization. Depreciation and amortization increased from $141.8 million in the nine months ended September 30, 2016 to $198.7 million in the nine months ended September 30, 2017, an increase of $56.9 million, or 40.1%. The increase was primarily due to amortization of intangible assets related to acquisitions completed in 2016 and 2017 of approximately $39 million and incremental expense related to capitalized development of software. These increases were partially offset by the impact of disposition of the NexTraq business of approximately $2 million.
Investment loss (income). Investment loss was $52.5 million in the nine months ended September 30, 2017, compared to investment income of $2.2 million in the nine months ended September 30, 2016. We regularly evaluate the carrying value of our Masternaut investment and during the third quarter of 2017, we determined that the fair value of our 44% investment in Masternaut had declined as a result of our loss of significant influence due to the amendment of the Masternaut investment agreement, executed September 30, 2017. As a result, we determined that the carrying value of our investment exceeded its fair value, and concluded that this decline in value was other than temporary. We recorded a $44.6 million impairment loss in the Masternaut investment that includes adjustment for $31.4 million of currency losses previously recognized in accumulated other comprehensive income, in the nine months ended September 30, 2017, in the accompanying Unaudited Consolidated Statements of Income.
Other (income) expense, net. Other income, net was $173.6 million in the nine months ended September 30, 2017, compared to other expense, net of $1.1 million in the nine months ended September 30, 2016. The increase was due primarily to the pre-tax gain on the sale of our Nextraq business of $175 million in the third quarter of 2017.
Interest expense, net. Interest expense increased from $49.9 million in the nine months ended September 30, 2016 to $76.3 million in the nine months ended September 30, 2017, an increase of $26.4 million, or 52.9%. The increase in interest expense is primarily due to the impact of additional borrowings to finance the acquisitions of STP and Travelcard completed during the third quarter of 2016 and Cambridge completed during the third quarter of 2017, and increases in LIBOR. The following table sets forth the average interest rates paid on borrowings under our Credit Facility, excluding the related unused credit facility fees.
|
| | | | | | |
| | | Nine Months Ended September 30, |
| (Unaudited) | | 2017 | | 2016 |
| Term loan A | | 2.74 | % | | 1.96 | % |
| Term loan B | | 3.28 | % | | 3.75 | % |
| Domestic Revolver A | | 2.78 | % | | 2.00 | % |
| Foreign Revolver A | | 2.01 | % | | 1.77 | % |
| Foreign swing line | | 1.97 | % | | 1.73 | % |
The average unused credit facility fee for Domestic Revolver A was 0.35% and 0.30% in the nine month period ending September 30, 2017 and 2016, respectively.
Loss on extinguishment of debt. Loss on extinguishment of debt of $3.3 million relates to our write-off of debt issuance costs associated with the refinancing of our existing credit facility during the third quarter of 2017.
Provision for income taxes. The provision for income taxes increased from $132.5 million in the nine months ended September 30, 2016 to $227.8 million in the nine months ended September 30, 2017, an increase of $95.3 million, or 71.9%. We provide for income taxes during interim periods based on an estimate of our effective tax rate for the year. Discrete items and changes in the estimate of the annual tax rate are recorded in the period they occur. Our effective tax rate was 33.2% for the nine months ended September 30, 2017 as compared to 27.1% in the nine months ended September 30, 2016. The increase in the provision for income taxes was due primarily to the pretax gain on sale of the Nextraq business of $175 million at the higher U.S. tax rate, all at the higher U.S. tax rate, and the Masternaut impairment charge in the quarter, which had no corresponding tax benefit. The 2016 tax rate was favorably impacted by a one-time nonrecurring net gain at our Masternaut investment that favorably impacted pre-tax earnings, but was not subject to income tax. The 2016 rate was also favorably impacted by higher excess tax benefits on share-based compensation in 2016 versus 2017.
We pay taxes in many different taxing jurisdictions, including the U.S., most U.S. states and many non-U.S. jurisdictions. The tax rates in certain non-U.S. taxing jurisdictions are lower than the U.S. tax rate. Consequently, as our earnings fluctuate between taxing jurisdictions, our effective tax rate fluctuates. Also, the excess tax benefit on share based compensation is part of the effective tax rate. As a result, the tax rate is impacted by the number of stock options exercised or restricted shares vested during the reporting period.
Net income. For the reasons discussed above, our net income increased from $357.0 million in the nine months ended September 30, 2016 to $457.5 million in the nine months ended September 30, 2017, an increase of $100.5 million, or 28.2%.
Operating income and operating margin
Consolidated operating income. Operating income increased from $538.2 million in the nine months ended September 30, 2016 to $643.7 million in the nine months ended September 30, 2017, an increase of $105.6 million, or 19.6%. Our operating margin was 40.9% and 39.3% for the nine months ended September 30, 2016 and 2017, respectively. The increase in operating income was primarily due to acquisitions completed in 2016 and 2017, organic growth, as well as the positive impact of the macroeconomic environment of approximately $14 million, driven primarily by favorable fuel prices, partially offset by the unfavorable impact of fluctuations in foreign exchange rates. These increases were partially offset by the negative impact of higher amortization and depreciation expense related to acquisitions completed in 2016 and 2017, additional bad debt expense of $11 million, due to bad debt inherent in the acquired STP business, additional stock based compensation of approximately $19 million and the disposition of the NexTraq business in July 2017 of approximately $4 million.
For the purpose of segment operating results, we calculate segment operating income by subtracting segment operating expenses from segment revenue. Segment operating margin is calculated by dividing segment operating income by segment revenue.
North America segment operating income. North America operating income increased from $367.2 million in the nine months ended September 30, 2016 to $394.6 million in the nine months ended September 30, 2017, an increase of $27.4 million, or 7.5%. North America operating margin was 38.6% and 38.0% for the nine months ended September 30, 2016 and 2017, respectively. The increase in operating income was due primarily to organic growth and the positive impact of the macroeconomic environment of approximately $18 million, driven by primarily by higher fuel prices. These increases were partially offset by additional stock based compensation of approximately $14 million, additional bad debt expense of approximately $4 million, the negative impact of higher amortization and depreciation expense related to our acquisition of Cambridge in the third quarter of 2017 and the disposition of the NexTraq business in July 2017 of approximately $4 million.
International segment operating income. International operating income increased from $171.0 million in the nine months ended September 30, 2016 to $249.1 million in the nine months ended September 30, 2017, an increase of $78.1 million, or 45.7%. International operating margin was 46.7% and 41.4% for the nine months ended September 30, 2016 and 2017, respectively. The increase in operating income was due primarily to the impact of acquisitions completed in 2016 and 2017, organic growth. These increases were partially offset by the negative impact of higher amortization and depreciation expense related to acquisitions of STP and Travelcard completed in the third quarter of 2016, additional bad debt expense of $9 million, due to bad debt inherent in the acquired STP business, additional stock based compensation of approximately $5 million and the negative impact of the macroeconomic environment of approximately $4 million, driven primarily by the unfavorable impact of fluctuations in foreign exchange rates.
Liquidity and capital resources
Our principal liquidity requirements are to service and repay our indebtedness, make acquisitions of businesses and commercial account portfolios, repurchase shares of our common stock and meet working capital, needs, tax and capital expenditure needs.
Sources of liquidity
liquidity. At September 30, 2017,March 31, 2018, our cash balances totaled $1,018.3$1,222.5 million, with approximately $183.5$242.9 million restricted. Restricted cash represents customer deposits in the Czech Republic and in our Comdata business in the U.S., as well as collateral received from customers for cross-currency transactions in our Cambridge business, which we are restricted from usinguse other than to repay customer deposits.deposits, as well as secure and settle cross-currency transactions.
At September 30, 2017,March 31, 2018, cash and cash equivalents held in foreign subsidiaries where we have determined we are permanently reinvested is $509.3$663.0 million. All of the cash and cash equivalents held by our foreign subsidiaries, excluding restricted cash, are available for general corporate purposes. Our current intent is to permanently reinvest these funds outside of the U.S. Our current expectation for funds held in our foreign subsidiaries is to use the funds to finance foreign organic growth, to pay for potential future foreign acquisitions and to repay any foreign borrowings that may arise from time to time. We currently believe that funds generated from our U.S. operations, along with available borrowing capacity in the U.S. will be sufficient to fund our
U.S. operations for the foreseeable future, and therefore do not foresee a need to repatriate cash held by our foreign subsidiaries in a taxable transaction to fund our U.S. operations. However, if at a future date or time these funds are needed for our operations in
In the fourth quarter of 2017, the U.S. orgovernment enacted the Tax Act, which includes provisions for a tax on all previously undistributed earnings in foreign jurisdictions. We have provisionally recorded an $81.8 million charge on these undistributed earnings in 2017. We did not make any adjustments to these provisional amounts during the three months ended March 31, 2018. We are continuing to gather additional information to complete our accounting for these items and expect to complete our accounting within the measurement period. As permitted by the Tax Act, we otherwise believe itintend to pay the one-time transition tax in eight annual interest-free installments beginning in 2018. We are currently evaluating the remaining undistributed foreign earnings for which we have not provided deferred taxes for foreign withholding tax, as these earnings are considered to be indefinitely reinvested. The amount of these unrecorded deferred taxes is in our best interestsnot expected to repatriate all or a portion of such funds, we may be required to accrue and pay U.S. taxes to repatriate these funds. No assurances can be provided as to the amount or timing thereof, the tax consequences related thereto or the ultimate impact any such action may have on our results of operations or financial condition.
material.
We utilize an accounts receivable Securitization Facility to finance a majority of our domestic fuel card receivables, to lower our cost of borrowing and more efficiently use capital. We generate and record accounts receivable when a customer makes a purchase from a merchant using one of our card products and generally pay merchants before collecting the receivable. As a result, we utilize the Securitization Facility as a source of liquidity to provide the cash flow required to fund merchant payments while we collect customer balances. These balances are primarily composed of charge balances, which are typically billed to the customer on a weekly, semimonthly or monthly basis, and are generally required to be paid within 14 days of billing. We also consider the undrawn amounts under our Securitization Facility and Credit Facility as funds available for working capital purposes and acquisitions. At September 30, 2017,March 31, 2018, we had no additional liquidity under our Securitization Facility. At September 30, 2017,March 31, 2018, we had approximately $612$627 million available under our Credit Facility.
Based on our current forecasts and anticipated market conditions, we believe that our current cash balances, our available borrowing capacity and our ability to generate cash from operations, will be sufficient to fund our liquidity needs for at least the next twelve months. However, we regularly evaluate our cash requirements for current operations, commitments, capital requirements and acquisitions, and we may elect to raise additional funds for these purposes in the future, either through the issuance of debt or equity securities. We may not be able to obtain additional financing on terms favorable to us, if at all.
Cash flows
The following table summarizes our cash flows for the nine monthsthree month period ended September 30,March 31, 2018 and 2017 and 2016 (in millions).
| | | | | Nine Months Ended September 30, | | Three Months Ended March 31, |
| (Unaudited) | | 2017 | | 2016 | | 2018 | | 2017 |
| Net cash provided by operating activities | | $ | 419.5 |
| | $ | 404.3 |
| | $ | 200.7 |
| | $ | 73.5 |
|
| Net cash used in investing activities | | (341.6 | ) | | (1,371.5 | ) | | (22.7 | ) | | (21.1 | ) |
| Net cash provided by financing activities | | 250.1 |
| | 976.4 |
| |
| Net cash (used in) provided by financing activities | | | (99.0 | ) | | 19.1 |
|
Operating activities. Net cash provided by operating activities increased from $404.3was $200.7 million in the ninethree months ended September 30, 2016 to $419.5March 31, 2018, an increase from $73.5 million in the nine months ended September 30, 2017. Includedcomparable prior period. The increase in operating cash flows from operating activities werewas primarily due to higher net income and favorable non-cash adjustments of $151.7 million in the nine months ended September 30, 2017. Non-cash adjustments were driven primarily by higher depreciation and amortization and an impairment charge in our Masternaut investment, partially offset by the gain on the sale of our Nextraq business in the third quarter of 2017. Also included in cash flows from operating activities were unfavorable working capital adjustments of $189.7 million. Working capital adjustments are primarily due to the timing of cash receipts and payments duringin the ninethree months ended September 30, 2017March 31, 2018 over the comparable period in 2016.2017. The increase was partially offset by a reduction in non-cash stock based compensation of approximately $9 million in the three months ended March 31, 2018 over the comparable period in 2017.
Investing activities. Net cash used in investing activities decreased from $1,371.5was $22.7 million in the ninethree months ended September 30, 2016March 31, 2018 compared to $341.6$21.1 million in the ninethree months ended September 30, 2017. The decrease was primarily due to the reduction in cash outlay for acquisitions and the proceeds received from the sale of our Nextraq business during the third quarter of 2017.March 31, 2017, an immaterial change.
Financing activities. Net cash provided byused in financing activities decreased from $976.4was $99.0 million in the ninethree months ended September 30, 2016March 31, 2018 compared to $250.1net cash provided by operating activities of $19.1 million in the ninethree months ended September 30,March 31, 2017. The decrease inincrease use of cash provided by financing activities is primarily due to an increase in debt repaymentsincreased repurchases of $437.4 million on our credit facility in the nine months ended September 30, 2017 as compared to 2016, increased spending to repurchase our common stock of $367$88 million and a decreasereduction in borrowings of $76.8$67 million on our credit facility,Securitization Facility. These additional uses of cash were partially offset by an increase in borrowings of $161 million on our SecuritizationCredit Facility.
Capital spending summary
Our capital expenditures increased from $41.9was $15.2 million in the ninethree months ended September 30, 2016 to $49.5March 31, 2018, an increase of $0.4 million or 2.8%, from $14.8 million in the nine months ended September 30, 2017, an increase of $7.6 million, or 18.1%.comparable prior period. This increase is primarily due to increased spending on strategic projects, including continued investment in our operating systems, as well as incremental spending related to acquisitions completed in 2016 and 2017.
Credit Facility
FleetCorFLEETCOR Technologies Operating Company, LLC, and certain of our domestic and foreign owned subsidiaries, as designated co-borrowers (the “Borrowers”), hasare parties to a $4.33 billion Credit Agreement (the "Credit Agreement"), with Bank of America, N.A., as administrative agent, swing line lender and local currency issuer, and a syndicate of financial institutions (the “Lenders”), which has been amended multiple times. The Credit Agreement provides for senior secured credit facilities consisting of a revolving A credit facility in the amount of $1.285 billion, a term loan A facility in the amount of $2.69 billion and a term loan B facility in the amount of $350.0 million as of September 30, 2017.March 31, 2018. The revolving credit facility consists of (a) a revolving A credit facility in the amount of $800 million, with sublimits for letters of credit and swing line loans, (b) a revolving B facility in the amount of $450 million for swing line loans and multi-currency borrowings and, (c) a revolving C facility in the amount of $35 million for multi-currency borrowings in Australian Dollars or New Zealand Dollars. On January 20, 2017, we entered into the second amendment to the Credit Agreement, which established a new term B loan. On August 2, 2017, we entered into the third amendment to the Credit Agreement, which increased the total facility by $708.7 million and extended the terms of the credit facilities. The term A and revolver maturity dates are August 2, 2022 and the term B maturity date is August 2,2024. The term A and revolver pricing remains the same and the term B pricing was reduced by 25 basis points to LIBOR plus 200 basis points. In addition, we pay a quarterly commitment fee at a rate per annum ranging from 0.20% to 0.40% of the daily unused portion of the credit facility.
The Credit Agreement also contains an accordion feature for borrowing an additional $750 million in term A or revolver A and term B. Proceeds from the Credit Facility may be used for working capital purposes, acquisitions, and other general corporate purposes. The term A and revolver maturity dates are August 2, 2022 and the term B maturity date is August 2, 2024.
The term loans are payable in quarterly installments and are due on the last business day of each March, June, September, and December with the final principal payment due on the respective maturity date. Borrowings on the revolving line of credit are repayable at our option of one, two, three or nine months after borrowing, depending on the term of the borrowing on the facility. Borrowings on the foreign swing line of credit are due no later than ten business days after such loan is made.
The Credit Facility contains representations, warranties and events of default, as well as certain affirmative and negative covenants, customary for financings of this nature. These covenants include limitations on the ability to pay dividends and make other restricted payments under certain circumstances and compliance with certain financial ratios. As of September 30, 2017,March 31, 2018, we were in compliance with each of the covenants under the Credit Facility.
At September 30, 2017,March 31, 2018, the interest rate on the term A loan and the domestic revolving A facility was 3.38%, the interest rate on the foreign revolving B facility was 2.00%, the interest rate on the revolving B facility foreign swing line of credit was 1.97% and the interest rate on the term B loan was 3.88%. The unused credit facility was 0.30% for all revolving facilities at March 31, 2018.
At March 31, 2018, we had $2,690 million$2.6 billion in borrowings outstanding on the term A loan, excluding the related debt discount, $350$348.3 million in borrowings outstanding on Termterm B loan, excluding the related debt discount, $595$365 million in borrowings outstanding on the domestic revolving A facility, $38$280.3 million in borrowings outstanding on the foreign revolving AB facility and $40.2$12.3 million in borrowings outstanding on the swing line revolving AB facility. We have unamortized debt discounts and debt issuance costs of $6.4$6.3 million related to the term A facility and $0.7$4.8 million related to the term B facility at September 30, 2017.March 31, 2018, respectively.
During the ninethree months ended September 30, 2017,March 31, 2018, we made principal payments of $388.7$34.5 million on the term loans, $715.0$410.0 million on the domestic revolving A facility, $89.8$29.4 million on the foreign revolving AB facility and $52.7$17.2 million on the swing line revolving A facility.facilities.
Securitization Facility
We are a party to a receivables purchase agreement among FleetCorFLEETCOR Funding LLC, as seller, PNC Bank, National Association as administrator, and various purchaser agents, conduit purchasers and related committed purchasers parties thereto, which was amended and restated for the fifthFifth time as of November 14, 2014. We refer to this arrangement as the Securitization Facility. There have been several amendments to the Securitization Facility. The current purchase limit under
the Securitization Facility is $950 million and the Securitization Facility expires on November 14, 2017.2020. The Securitization Facility contains certain customary financial covenants.
There is a program fee equal to one month LIBOR plus 0.90% or the Commercial Paper Rate of 1.27% plus 0.90%0.80%. The program fee was 1.91% plus 0.86% and 0.85%1.55% plus 0.90%0.86% as of September 30, 2017March 31, 2018 and December 31, 2016,2017, respectively. The unused facility fee is payable at a rate of 0.40% as of September 30, 2017March 31, 2018 and December 31, 2016,2017, respectively.
The Securitization Facility provides for certain termination events, which includes nonpayment, upon the occurrence of which the administrator may declare the facility termination date to have occurred, may exercise certain enforcement rights with respect to the receivables, and may appoint a successor servicer, among other things.
We were in compliance with the financial covenant requirements related to our Securitization Facility as of September 30, 2017.March 31, 2018.
Stock Repurchase Program
On February 4, 2016, our Board of Directors approved a stock repurchase program (the "Program") under which we may purchase up to an aggregate of $500 million of our common stock over the following 18 month period. On July 27, 2017, our Board of Directors authorized an increase in the size of the Program by an additional $250 million and an extension of the Program by an additional 18 months. On NovemberMay 1, 2017,2018, we announced that our Board of Directors had authorized an increase in the size of the Program by an additional $350 million, resulting in total aggregate repurchases authorized under the Program of $1.1 billion. With the increase and giving effect to our $590$678.4 million of previous repurchases, we may repurchase up to $510$421.6 million in shares of our common stock at any time prior to February 1, 2019.
Any stock repurchases may be made at times and in such amounts as deemed appropriate. The timing and amount of stock repurchases, if any, will depend on a variety of factors including the stock price, market conditions, corporate and regulatory requirements, and any additional constraints related to material inside information the Company may possess. Any repurchases have been and are expected to be funded by a combination of available cash flow from the business, working capital and debt. .
On August 3, 2017, as part of the Program, we entered an Accelerated Share Repurchase agreement ("ASR Agreement") with a third-party financial institution to repurchase $250 million of its common stock. Pursuant to the ASR Agreement, we delivered $250 million in cash and received 1,491,647 shares based on a stock price of $142.46 on August 7, 2017. The ASR Agreement completed on September 7, 2017, at which time we received 263,012 additional shares based on a final weighted average per share purchase price during the repurchase period of $142.48.
We accounted for the ASR Agreement as two separate transactions: (i) as shares of reacquired common stock for the shares delivered to us upon effectiveness of the ASR Agreement and (ii) as a forward contract indexed to our common stock for the undelivered shares. The initial delivery of shares was included in treasury stock at cost and results in an immediate reduction of the outstanding shares used to calculate the weighted average common shares outstanding for basic and diluted earnings per share. The forward contracts indexed to our own common stock met the criteria for equity classification, were initially recorded in additional paid-in capital and then reclassified to treasury stock upon completion of the ASR agreement.
Since the beginning of the Program, 4,114,1044,556,729 shares for an aggregate purchase price of $590$678.4 million have been repurchased. There were 2,854,959442,625 shares totaling $402.4$88.3 million repurchased under the Program during the ninethree months ended September 30, 2017.March 31, 2018.
Sale of NexTraqUnauthorized Access to Systems
As part
On May 3, 2018, we announced the unauthorized access into a portion of our plansystems. Subsequent to exitMarch 31, 2018, we have incurred, and expect to continue to incur, legal and other professional expenses related to the telematics business, on July 27, 2017, we sold NexTraq, a U.S. fleet telematics business, to Michelin Group for $316 million. We recorded a pre-tax gain on the disposal of NexTraq of $175 million during the third quarter of 2017, which is net of transaction closing costs.We recorded tax on the gain of disposal of $65.8 million.unauthorized access incident in future periods. The gain on the disposal is included in other (income) expense, net in the accompanying Unaudited Consolidated Statements of Income. NexTraq has historically been included in the Company's North America segment.Company will recognize these expenses as services are received.
Critical accounting policies and estimates
In applying the accounting policies that we use to prepare our consolidated financial statements, we necessarily make accounting estimates that affect our reported amounts of assets, liabilities, revenue and expenses. Some of these estimates require us to make assumptions about matters that are highly uncertain at the time we make the accounting estimates. We base these assumptions and the resulting estimates on historical information and other factors that we believe to be reasonable under the circumstances, and we evaluate these assumptions and estimates on an ongoing basis. In many instances, however, we reasonably could have used different accounting estimates and, in other instances, changes in our accounting estimates could occur from period to period, with the result in each case being a material change in the financial statement presentation of our financial condition or results of operations. We refer to estimates of this type as critical accounting estimates.
Accounting estimates necessarily require subjective determinations about future events and conditions. During the ninethree months ended September 30, 2017,March 31, 2018, other than noted in footnote 1, "Summary of Significant Accounting Policies" and footnote 2, "Revenue Recognition", related to our adoption of new revenue recognition guidance in accordance with Topic 606, we have not adopted any new critical accounting policies that had a significant impact upon our consolidated financial statements, have not changed any critical accounting policies and have not changed the application of any critical accounting policies from the year ended December 31, 2016.2017. For critical accounting policies, refer to the Critical Accounting Estimates in Item 7 – Management’s Discussion and Analysis of Financial Condition and Results of Operations included in our Annual Report on Form 10-K for the year ended December 31, 20162017 and our summary of significant accounting policies in Note 1 of our notes to the unaudited consolidated financial statements in this Form 10-Q.
Management’s Use of Non-GAAP Financial Measures
We have included in the discussion above certain financial measures that were not prepared in accordance with GAAP. Any analysis of non-GAAP financial measures should be used only in conjunction with results presented in accordance with GAAP.
Below, we define the non-GAAP financial measures, provide a reconciliation of the non-GAAP financial measure to the most directly comparable financial measure calculated in accordance with GAAP, and discuss the reasons that we believe this information is useful to management and may be useful to investors.
Adjusted revenues
We have defined the non-GAAP measure adjusted revenues as revenues, net less merchant commissions as reflected in our income statement.
We use adjusted revenues as a basis to evaluate our revenues, net of the commissions that are paid to merchants to participate in our card programs. The commissions paid to merchants can vary when market spreads fluctuate in much the same way as revenues are impacted when market spreads fluctuate. We believe that adjusted revenue is an appropriate supplemental measure of financial performance and may be useful to investors to understanding our revenue performance on a consistent basis. Adjusted revenues are not intended to be a substitute for GAAP financial measures and should not be used as such.
Set forth below is a reconciliation of adjusted revenues to the most directly comparable GAAP measure, revenues, net (in thousands):
|
| | | | | | | | | | | | | | | | |
| | | Three Months Ended September 30, | | Nine Months Ended September 30, |
| (Unaudited) | | 2017 | | 2016 | | 2017 | | 2016 |
| Revenues, net | | $ | 577,877 |
| | $ | 484,426 |
| | $ | 1,639,547 |
| | $ | 1,316,593 |
|
| Merchant commissions | | (27,687 | ) | | (28,214 | ) | | (82,690 | ) | | (78,755 | ) |
| Total adjusted revenues | | $ | 550,190 |
|
| $ | 456,212 |
|
| $ | 1,556,857 |
|
| $ | 1,237,838 |
|
Adjusted net income and adjusted net income per diluted share
We have defined the non-GAAP measure adjusted net income as net income as reflected in our statement of income, adjusted to eliminate (a) non-cash stock based compensation expense related to share based compensation awards, (b) amortization of deferred financing costs, discounts and intangible assets, (c) amortization of the premium recognized on the purchase of receivables, (d)and our proportionate share of amortization of intangible assets at our Masternautequity method investment, (e)(c) a non-recurring net gain at our Masternautequity method investment, (f)(d) impairment of our Masternautequity method investment, (g)(e) net gain on disposition of business, (h)(f) loss on early extinguishment of debt and, (i) a(g) other non-recurring loss due to mergeritems, including the impact of entities.the Tax Reform Act and restructuring costs.
We have defined the non-GAAP measure adjusted net income per diluted share as the calculation previously noted divided by the weighted average diluted shares outstanding as reflected in our statement of income.
We use adjusted net income to eliminate the effect of items that we do not consider indicative of our core operating performance. We believe it is useful to exclude non-cash stock based compensation expense from adjusted net income because non-cash equity grants made at a certain price and point in time do not necessarily reflect how our business is performing at any particular time and stock based compensation expense is not a key measure of our core operating performance. We also believe that amortization expense can vary substantially from company to company and from period to period depending upon their financing and accounting methods, the fair value and average expected life of their acquired intangible assets, their capital structures and the method by which their assets were acquired. Therefore, we have excluded amortization expense from our adjusted net income. We also believe one-time non-recurring gains, losses, and impairment charges do not necessarily reflect how our investment and business is performing.We believe that adjusted net income and adjusted net income per diluted share are appropriate supplemental measures of financial performance and may be useful to investors to understanding our operating performance on a consistent basis. Adjusted net income and adjusted net income per diluted share are not intended to be a substitute for GAAP financial measures and should not be used as such.
Set forth below is a reconciliation of adjusted net income and adjusted net income per diluted share to the most directly comparable GAAP measure, net income and net income per diluted share (in thousands, except shares and per share amounts):*
|
| | | | | | | | | | | | | | | | |
| | | Three Months Ended September 30, | | Nine Months Ended September 30, |
| (Unaudited) | | 2017 | | 2016 | | 2017 | | 2016 |
| Net income | | $ | 202,823 |
| | $ | 129,618 |
| | $ | 457,503 |
| | $ | 356,961 |
|
| Net income per diluted share | | 2.18 |
| | 1.36 |
| | 4.87 |
| | 3.75 |
|
| Stock based compensation | | 24,654 |
| | 17,405 |
| | 68,897 |
| | 50,025 |
|
| Amortization of intangible assets | | 54,003 |
| | 46,341 |
| | 158,897 |
| | 112,455 |
|
| Amortization of premium on receivables | | 1,650 |
| | 1,348 |
| | 4,738 |
| | 3,687 |
|
| Amortization of deferred financing costs and discounts | | 1,611 |
| | 1,917 |
| | 5,411 |
| | 5,568 |
|
| Amortization of intangibles at Masternaut investment | | 2,965 |
| | 2,406 |
| | 8,341 |
| | 7,533 |
|
| Impairment of Masternaut investment | | 44,600 |
| | — |
| | 44,600 |
| | — |
|
| Net gain on disposition of business | | (109,205 | ) | | — |
| | (109,205 | ) | | — |
|
| Loss on extinguishment of debt | | 3,296 |
| | — |
| | 3,296 |
| | — |
|
| Non recurring loss due to merger of entities | | 2,028 |
| | — |
| | 2,028 |
| | — |
|
| Non-recurring net gain at Masternaut investment | | — |
| | — |
| | — |
| | (10,845 | ) |
| Total pre-tax adjustments | | 25,602 |
|
| 69,417 |
| | 187,003 |
|
| 168,423 |
|
Income tax impact of pre-tax adjustments at the effective tax rate1 | | (25,656 | ) | | (15,726 | ) | | (69,711 | ) | | (46,425 | ) |
| Adjusted net income | | $ | 202,769 |
| | $ | 183,310 |
| | $ | 574,795 |
| | $ | 478,959 |
|
| Adjusted net income per diluted share | | $ | 2.18 |
| | $ | 1.92 |
| | $ | 6.12 |
| | $ | 5.03 |
|
| Diluted shares | | 93,001 |
| | 95,307 |
| | 93,923 |
| | 95,204 |
|
|
| | | | | | | | | |
| | | Three Months Ended March 31, | |
| (Unaudited) | | 2018 | | 2017 | |
| Net income | | $ | 174,937 |
| | $ | 123,693 |
| |
| Stock based compensation | | 14,403 |
| | 23,093 |
| |
| Amortization of intangible assets, premium on receivables, deferred financing costs and discounts | | 60,444 |
| | 58,571 |
| |
| Restructuring costs | | 1,929 |
| | — |
| |
| Total pre-tax adjustments | | 76,776 |
|
| 81,664 |
| |
| Income tax impact of pre-tax adjustments at the effective tax rate | | (18,207 | ) | | (20,379 | ) | 1 |
| Adjusted net income | | $ | 233,506 |
| | $ | 184,978 |
| |
| Adjusted net income per diluted share | | $ | 2.50 |
| | $ | 1.96 |
| |
| Diluted shares | | 93,250 |
| | 94,560 |
| |
|
|
*Columns may not calculate due to impact of rounding. |
1Excludes the results of ourthe Company's Masternaut investment on our effective tax rate, as results from our Masternaut investment are reported within the Consolidated Income Statements on a post-tax basis and no tax-over-book outside basis differences related to our investment reversed during 2016 or are expected to reverse in 2017. Also excludes the net gain realized upon our disposition of NexTraq, representing a pretax gain of $175.0 and tax on gain of $65.8. The tax on the gain is included in "Net gain on disposition of business". |
Pro Forma and Macro Adjusted Revenue and Transactions by Product
We define pro forma and macro adjusted revenue as revenue, net as reflected in our statement of income, adjusted to eliminate the impact of the macroeconomic environment and the impact of acquisitions, dispositions and dispositions.the impact of adoption of Topic 606. The macroeconomic environment includes the impact that market fuel spread margins, fuel prices and foreign exchange rates have on our business. We use pro forma and macro adjusted revenue and transactions to evaluate the organic growth in our revenue and the associated transactions. Set forth below is a reconciliation of pro forma and macro adjusted revenue and transactions to the most directly comparable GAAP measure, revenue, net and transactions (in millions):*
| | | | | Revenue | | Transactions | | Revenues, net | | Transactions |
| | | Three Months Ended September 30, | Three Months Ended September 30, | | Three Months Ended March 31, | Three Months Ended March 31, |
| (Unaudited) | | 2017 | | 2016 | | 2017 | | 20164 | |
| (Unaudited)* | | | 2018* | | 2017* | | 2018* | | 2017* |
| FUEL CARDS | | | | | | | | | | | | | | | | |
Pro forma and macro adjusted2,3 | | $ | 274.0 |
| | $ | 259.5 |
| | $ | 119.6 |
| | $ | 113.6 |
| |
| Pro forma and macro adjusted | | | $ | 240.4 |
| | $ | 237.6 |
| | 117.6 |
| | 112.5 |
|
| Impact of acquisitions/dispositions | | — |
| | (0.7 | ) | | — |
| | (1.0 | ) | | — |
| | (1.9 | ) | | — |
| | (1.5 | ) |
| Impact of fuel prices/spread | | (0.6 | ) | | — |
| | — |
| | — |
| | 8.4 |
| | — |
| | — |
| | — |
|
| Impact of foreign exchange rates | | 2.9 |
| | — |
| | — |
| | — |
| | 9.6 |
| | — |
| | — |
| | — |
|
| Impact of adoption of Topic 606 | | | — |
| | 24.7 |
| | — |
| | — |
|
| As reported | | $ | 276.3 |
| | $ | 258.8 |
| | $ | 119.6 |
| | $ | 112.5 |
| | $ | 258.4 |
| | $ | 260.4 |
| | 117.6 |
| | 111.0 |
|
| CORPORATE PAYMENTS | | | | | | | | | | | | | | | | |
Pro forma and macro adjusted2,3 | | $ | 71.7 |
| | $ | 61.3 |
| | $ | 10.9 |
| | $ | 10.2 |
| |
| Pro forma and macro adjusted | | | $ | 93.5 |
| | $ | 74.6 |
| | 10.9 |
| | 9.7 |
|
| Impact of acquisitions/dispositions | | — |
| | (15.2 | ) | | — |
| | (0.2 | ) | | — |
| | (28.6 | ) | | — |
| | (0.2 | ) |
| Impact of fuel prices/spread | | 0.1 |
| | — |
| | — |
| | — |
| | 0.1 |
| | — |
| | — |
| | — |
|
| Impact of foreign exchange rates | | 0.4 |
| | — |
| | — |
| | — |
| | 1.2 |
| | — |
| | — |
| | — |
|
| Impact of adoption of Topic 606 | | | — |
| | 0.9 |
| | — |
| | — |
|
| As reported | | $ | 72.2 |
| | $ | 46.1 |
| | $ | 10.9 |
| | $ | 10.0 |
| | $ | 94.8 |
| | $ | 46.8 |
| | 10.9 |
| | 9.5 |
|
| TOLLS | | | | | | | | | | | | | | | | |
Pro forma and macro adjusted2,3 | | $ | 80.8 |
| | $ | 67.8 |
| | $ | 231.0 |
| | $ | 225.0 |
| |
| Pro forma and macro adjusted | | | $ | 94.1 |
| | $ | 77.0 |
| | 220.8 |
| | 222.9 |
|
| Impact of acquisitions/dispositions | | — |
| | (42.0 | ) | | — |
| | (143.9 | ) | | — |
| | — |
| | — |
| | — |
|
| Impact of fuel prices/spread | | — |
| | — |
| | — |
| | — |
| | — |
| | — |
| | — |
| | — |
|
| Impact of foreign exchange rates | | 2.1 |
| | — |
| | — |
| | — |
| | (2.9 | ) | | — |
| | — |
| | — |
|
| Impact of adoption of Topic 606 | | | — |
| | — |
| | — |
| | — |
|
| As reported | | $ | 82.9 |
| | $ | 25.8 |
| | $ | 231.0 |
| | $ | 81.1 |
| | $ | 91.2 |
| | $ | 77.0 |
| | 220.8 |
| | 222.9 |
|
| LODGING | | | | | | | | | | | | | | | | |
Pro forma and macro adjusted2,3 | | $ | 33.2 |
| | $ | 28.1 |
| | $ | 4.1 |
| | $ | 3.5 |
| |
| Pro forma and macro adjusted | | | $ | 39.4 |
| | $ | 28.6 |
| | 5.4 |
| | 3.6 |
|
| Impact of acquisitions/dispositions | | — |
| | — |
| | — |
| | — |
| | — |
| | (4.9 | ) | | — |
| | (0.4 | ) |
| Impact of fuel prices/spread | | — |
| | — |
| | — |
| | — |
| | — |
| | — |
| | — |
| | — |
|
| Impact of foreign exchange rates | | — |
| | — |
| | — |
| | — |
| | — |
| | — |
| | — |
| | — |
|
| Impact of adoption of Topic 606 | | | — |
| | — |
| | — |
| | — |
|
| As reported | | $ | 33.2 |
| | $ | 28.1 |
| | $ | 4.1 |
| | $ | 3.5 |
| | $ | 39.4 |
| | $ | 23.8 |
| | 5.4 |
| | 3.2 |
|
| GIFT | | | | | | | | | | | | | | | | |
Pro forma and macro adjusted2,3 | | $ | 54.8 |
| | $ | 58.3 |
| | $ | 294.1 |
| | $ | 269.5 |
| |
| Pro forma and macro adjusted | | | $ | 48.6 |
| | $ | 48.4 |
| | 349.6 |
| | 333.4 |
|
| Impact of acquisitions/dispositions | | — |
| | — |
| | — |
| | — |
| | — |
| | — |
| | — |
| | — |
|
| Impact of fuel prices/spread | | — |
| | — |
| | — |
| | — |
| | — |
| | — |
| | — |
| | — |
|
| Impact of foreign exchange rates | | — |
| | — |
| | — |
| | — |
| | — |
| | — |
| | — |
| | — |
|
| Impact of adoption of Topic 606 | | | — |
| | — |
| | — |
| | — |
|
| As reported | | $ | 54.8 |
| | $ | 58.3 |
| | $ | 294.1 |
| | $ | 269.5 |
| | $ | 48.6 |
| | $ | 48.4 |
| | 349.6 |
| | 333.4 |
|
OTHER1 | | | | | | | | | | | | | | | | |
Pro forma and macro adjusted2,3 | | $ | 58.1 |
| | $ | 57.1 |
| | $ | 19.4 |
| | $ | 20.4 |
| |
| Pro forma and macro adjusted | | | $ | 51.6 |
| | $ | 51.7 |
| | 18.4 |
| | 19.2 |
|
| Impact of acquisitions/dispositions | | — |
| | 10.3 |
| | — |
| | 0.4 |
| | — |
| | 12.0 |
| | — |
| | 0.4 |
|
| Impact of fuel prices/spread | | — |
| | — |
| | — |
| | — |
| | — |
| | — |
| | — |
| | — |
|
| Impact of foreign exchange rates | | 0.4 |
| | — |
| | — |
| | — |
| | 1.5 |
| | — |
| | — |
| | — |
|
| Impact of adoption of Topic 606 | | | — |
| | 0.4 |
| | — |
| | — |
|
| As reported | | $ | 58.5 |
| | $ | 67.4 |
| | $ | 19.4 |
| | $ | 20.8 |
| | $ | 53.1 |
| | $ | 64.1 |
| | 18.4 |
| | 19.6 |
|
| | | | | | | | | | | | | | | | | |
| FLEETCOR CONSOLIDATED REVENUES | | | | | | | | | | | | | | | | |
Pro forma and macro adjusted2,3 | | $ | 572.6 |
| | $ | 532.1 |
| | $ | 679.1 |
| | $ | 642.2 |
| |
| Pro forma and macro adjusted | | | $ | 567.7 |
| | $ | 517.9 |
| | 722.8 |
| | 701.3 |
|
| Impact of acquisitions/dispositions | | — |
| | (47.6 | ) | | — |
| | (144.7 | ) | | — |
| | (23.4 | ) | | — |
| | (1.7 | ) |
| Impact of fuel prices/spread | | (0.5 | ) | | — |
| | — |
| | — |
| | 8.5 |
| | — |
| | — |
| | — |
|
| Impact of foreign exchange rates | | 5.8 |
| | — |
| | — |
| | — |
| | 9.3 |
| | — |
| | — |
| | — |
|
| Impact of adoption of Topic 606 | | | — |
| | 26.0 |
| | — |
| | — |
|
| As reported | | $ | 577.9 |
| | $ | 484.4 |
| | $ | 679.1 |
| | $ | 497.5 |
| | $ | 585.5 |
| | $ | 520.4 |
| | 722.8 |
| | 699.6 |
|
| | | | | | | | | | | | | | | | | |
| * Columns may not calculate due to impact of rounding. | | | |
1Other includes telematics, maintenance, food and transportation related businesses. | | | |
22016 is pro forma to include acquisitions and exclude dispositions, consistent with 2017 ownership. | |
32017 is adjusted to remove the impact of changes in the macroeconomic environment to be consistent with the same period of prior year, using constant fuel prices, fuel price spreads and foreign exchange rates. | |
42016 transactions reflect immaterial corrections from previously disclosed amounts for the prior period. | |
| * Columns may not calculate due to rounding. | | * Columns may not calculate due to rounding. | | |
1Other includes telematics, maintenance, and transportation related businesses. | | 1Other includes telematics, maintenance, and transportation related businesses. | | |
Special Cautionary Notice Regarding Forward-Looking Statements
This report contains forward-looking statements within the meaning of the federal securities laws. Statements that are not historical facts, including statements about FleetCor's beliefs, expectations and future performance, are forward-looking statements. Forward-looking statements can be identified by the use of words such as “anticipate,” “intend,” “believe,” “estimate,” “plan,” “seek,” “project” or “expect,” “may,” “will,” “would,” “could” or “should,” the negative of these terms or other comparable terminology.
These forward-looking statements are not a guarantee of performance, and you should not place undue reliance on such statements. We have based these forward-looking statements largely on our current expectations and projections about future events. Forward-looking statements are subject to many uncertainties and other variable circumstances, such as delays or failures associated with implementation; fuel price and spread volatility; changes in credit risk of customers and associated losses; the actions of regulators relating to payment cards or investigations; failure to maintain or renew key business relationships; failure to maintain competitive offerings; failure to maintain or renew sources of financing; failure to complete, or delays in completing, anticipated new partnership arrangements or acquisitions and the failure to successfully integrate or otherwise achieve anticipated benefits from such partnerships or acquired businesses; failure to successfully expand business internationally; other risks related to our international operations, including the potential impact to our business as a result of the United Kingdom's referendum to leave the European Union; the impact of foreign exchange rates on operations, revenue and income; the effects of general economic and political conditions on fueling patterns and the commercial activity of fleets, risks related to litigation; our ability to complete an accelerated share repurchase,the final results of the unauthorized access incident, including the final scope of the intrusion, the type of systems and information accessed and the number of accounts and customers impacted; as well as the other risks and uncertainties identified under the caption “Risk Factors” in our Annual Report on Form 10-K for the year ended December 31, 2016, and 10-Q for the quarter ended June 30, 2017 filed with the Securities and Exchange Commission on March 1, 2017 and August 8, 2017, respectively.2018. These factors could cause our actual results and experience to differ materially from any forward-looking statement. Given these risks and uncertainties, you are cautioned not to place undue reliance on these forward-looking statements. The forward-looking statements included in this report are made only as of the date hereof. We do not undertake, and specifically disclaim, any obligation to update any such statements or to publicly announce the results of any revisions to any of such statements to reflect future events or developments.
|
| |
| Item 3. | Quantitative and Qualitative Disclosures About Market Risk |
With the acquisition of Cambridge in August 2017, we have additional foreign exchange risk and associated foreign exchange risk management requirements due to the nature of our international payments provider business. The majority of this business' revenue is from exchanges of currency at spot rates, which enable customers to make cross-currency payments. In addition, this business also writes foreign currency forward and option contracts for our customers to facilitate future payments. The duration of these derivative contracts at inception is generally less than one year. Cambridge aggregates its foreign exchange exposures arising from customer contracts, including the derivative contracts described above, and hedges (economic hedge) the resulting net currency risks by entering into offsetting contracts with established financial institution counterparties.
A hypothetical uniform 10% strengthening or weakening in the value of the U.S. dollar relative to all other currencies in which our net income is generated would have resulted in a decrease/increase to pre-tax income of approximately $1.5 million based on our unhedged exposure to foreign currency at September 30, 2017.
As of September 30, 2017, other than noted above,March 31, 2018, there have been no material changes to our market risk from that disclosed in our Annual Report on Form 10-K for the year ended December 31, 2016.2017.
|
| |
| Item 4. | Controls and Procedures |
Evaluation of Disclosure Controls and Procedures
As of September 30, 2017,March 31, 2018, management carried out, under the supervision and with the participation of our Chief Executive Officer and Chief Financial Officer, an evaluation of the effectiveness of the design and operation of our disclosure controls and procedures (as defined in Rules 13a-15(e) and 15d-15(e) under the Securities Exchange Act of 1934). Based on this evaluation, our Chief Executive Officer and Chief Financial Officer concluded that, as of September 30, 2017,March 31, 2018, our disclosure controls and procedures were effective in ensuring that information required to be disclosed by us in the reports that we file or submit under the Securities Exchange Act of 1934, as amended, is recorded, processed, summarized and reported within the time periods specified in applicable rules and forms and are designed to ensure that information required to be disclosed in those reports is accumulated and communicated to management, including our Chief Executive Officer and Chief Financial Officer, as appropriate to allow timely decisions regarding required disclosure.
Changes in Internal Control over Financial Reporting
We added internal controls in support of the accounting, reporting and disclosure requirements of the new revenue accounting standard, which became effective for us as of January 1, 2018. In August 2017, we completed the acquisition of Cambridge Global Payments. In accordance with our integration efforts, we plan to incorporate Cambridge Global Payments operations into our internal control over financial reporting program within the time period provided by the applicable SEC rules and regulations.
There were no changes in our internal control over financial reporting during the quarter ended September 30, 2017,March 31, 2018, that have materially affected, or are reasonably likely to materially affect, our internal control over financial reporting.
PART II—OTHER INFORMATION
In the ordinary course of business, we are subject to various pending and potential legal actions, arbitration proceedings, claims, subpoenas, and matters relating to compliance with laws and regulations (collectively, legal proceedings). Based on our current knowledge, management presently does not believe that the liabilities arising from these legal proceedings will have a material adverse effect on our consolidated financial condition, results of operations or cash flows. However, it is possible that the ultimate resolution of these legal proceedings could have a material adverse effect on our results of operations and financial condition for any particular period.
Shareholder Class Action and Derivative Lawsuits
On June 14, 2017, a shareholder filed a class action complaint in the United States District Court for the Northern District of Georgia against the Company and certain of its officers and directors on behalf of all persons who purchased or otherwise acquired the Company’s stock between February 5, 2016 and May 2, 2017. On October 13, 2017, the shareholder filed an amended complaint asserting claims on behalf of a putative class of all persons who purchased or otherwise acquired the Company's common stock between February 4, 2016 and May 3, 2017. The complaint alleges that the defendants made false or misleading statements regarding fee charges and the reasons for its earnings and growth in certain press releases and other public statements in violation of the federal securities laws. Plaintiff seeks class certification, unspecified monetary damages, costs, and attorneys’ fees. The Company disputes the allegations in the complaint and intends to vigorously defend against the claims.
On July 10, 2017, a shareholder derivative complaint was filed against the Company and certain of the Company’s directors and officers in the United States District Court for the Northern District of Georgia seeking recovery on behalf of the Company. The derivative complaint alleges that the defendants issued a false and misleading proxy statement in violation of the federal securities laws; that defendants breached their fiduciary duties by causing or permitting the Company to make allegedly false and misleading public statements concerning the Company’s fee charges, and financial and business prospects; and that certain defendants breached their fiduciary duties through allegedly improper sales of stock. The complaint seeks unspecified monetary damages on behalf of the Company, corporate governance reforms, disgorgement of profits, benefits and compensation by the defendants, restitution, costs, and attorneys’ and experts’ fees. On August 18, 2017, the court entered an order deferring the case pending a ruling on the defendants' motion to dismiss the putative shareholder class action, or until otherwise agreed to by the parties. The defendants dispute the allegations in the complaint and intend to vigorously defend against the claims.
Estimating an amount or range of possible losses resulting from litigation proceedings is inherently difficult and requires an extensive degree of judgment, particularly where the matters involve indeterminate claims for monetary damages, and are in the stages of the proceedings where key factual and legal issues have not been resolved. For these reasons, we are currently unable to predict the ultimate timing or outcome of, or reasonably estimate the possible losses or a range of possible losses resulting from the matters described above.
In addition to the other information set forth in this report, you should carefully consider the factors discussed in Part I, Item 1A. “Risk Factors” in our Annual Report on Form 10-K for the year ended December 31, 2016 and in Part II, Item 1A. "Risk Factors" in our Quarterly Report on Form 10-Q for the quarter ended June 30, 2017 filed with the Securities and Exchange Commission on March 1, 2017 and August 8, 2017, respectively,2018, which could materially affect our business, financial condition or future results. Other than the risk factors set forth below, there have been no material changes from the risk factors previously disclosed in the Company’s Annual Report on Form 10-K for the year ended December 31, 2016.2017.
Derivatives Regulations
Rules adopted underWe detected unauthorized access to our systems and are in the Dodd-Frank Act byprocess of assessing the Commodity Futures Trading Commission (the "CFTC"), as well as the provisionsimpact of the European Market Infrastructure Regulation and its technical standards, which are directly applicable in the member states of the European Union, have subjected certain of the foreign exchange derivative contracts we offer to our customers as part of Cambridge's business, to reporting, recordkeeping, and other requirements. Additionally, certain foreign exchange derivatives transactions we may enter into in the future may be subject to centralized clearing requirements, or may be subject to margin requirements in the United States and European Union. Other jurisdictions outside the United Statesunauthorized access incident and the European Union are considering, have implemented, or are implementing regulations similar to those described above. Derivatives regulations have added costs toresulting impact on our reputation, business and any additional requirements, such as future registration requirements and increased regulationresults of derivative contracts, may result in additional costs or impact the way we conduct our hedging activities, as well as impact how we
conduct our business within our international payments provider operations. In particular, the CFTC has recently issued a proposed rule that, if adopted as proposed, would increase the likelihood that we will have to register one or more of our subsidiaries with the CFTC as swap dealers. Swap dealers are subject to a comprehensive regulatory framework and compliance with this framework will lead to additional costs, including costs relating to regulatory capital and margin requirements, and may impact how we conduct our hedging activities and derivatives business with customers. We are currently evaluating the impact the proposed rule, if adopted, would have on our hedging activities and operations.
Our compliance with these requirementsOn May 3, 2018, the Company announced the unauthorized access into a portion of its systems. On April 26, 2018, Company personnel identified suspicious activity primarily on systems involving the Company’s Stored Value Solutions gift card business. The Company took immediate action to stop the activity and limit the improper use of accessed private label gift card information (these gift cards do not contain personally identifiable information such as consumer names, Social Security numbers, driver’s license numbers and other sensitive personal data). The Company through counsel has resulted,retained three information technology forensic firms, which have been examining the Company’s systems in detail over the approximately two week period since the incident was discovered. The Company also contacted federal law enforcement and may continuemerchants known to result, in additional costs to ourbe affected. As of the
date hereof, the Company does not believe that the unauthorized access incident will have a material adverse effect on its business and mayresults of operations, though the Company’s investigation is ongoing.
Based upon information known as of the date hereof, the Company believes that a significant number of gift card and PIN numbers issued by six Stored Value Solutions customers were accessed. Following discovery, the Company has been working with merchant customers to limit the impact our international payments provider business operations. Furthermore, our failureof the unauthorized access. We believe the mitigation steps discussed with merchants, if fully implemented, will severely restrict or eliminate the ability of the bad actors to comply with these requirements could result in finesuse the information, while preserving the ability of legitimate holders of the gift cards to use them.
The Company has no evidence of access affecting its systems involving fleet cards and other sanctions, as well as necessitatepayment products, or the proprietary and third-party payment networks used to deliver the Company’s payment solutions.
We may face lawsuits and claims for monetary damage or relief, or become subject to federal, state and foreign governmental and agency investigations related to any security breach or misuse of data.
In the event of any security breach or misuse of data, we may face lawsuits and claims asserted by or on behalf of consumers, customers, stockholders or others seeking monetary damages or other relief. We may also become subject to federal, state and foreign governmental officials and agencies investigations of the events related to any security breach or misuse of data, including how it occurred, the consequences thereof and our response thereto. We may also become subject to investigation by payment card networks for potential breaches of payment card network rules, which could subject us to a temporaryvariety of fines or permanent cessation to somepenalties that may be levied by the payment networks for certain acts or all of our derivative related activities. Any such fines, sanctions or limitations on our businessomissions and could adversely affect our operationscontinued payment card network registration and financial results. Additionally, the regulatory regimes for derivatives in the United Statesinstitution sponsorships. Any such claims and European Union, such as under the Dodd-Frank Act and the European Markets in Financial Instruments Directive known as "MiFID II," are continuing to evolve and changes to such regimes, our designation under such regimes, or the implementation of new rules under such regimes, such as future registration requirements and increased regulation of derivative contracts,investigations may result in additionalmaterial costs, toexpenses, fines and penalties and require significant attention by management, which may divert the focus of management from the operation of our business. Other jurisdictions outsideIn addition, the United Statesoutcome of such claims and the European Union are considering, have implemented, or are implementing regulations similar to those described above and these may result in greater costs to us as well.
Global economic downturns or slower growth or declines in the money transfer, payment service, and other markets in which we operate, including downturns or declines related to interruptions in migration patterns, and difficult conditions in global financial markets andfinancial market disruptionsinvestigations could adversely affect or cause us to change how we operate our business. Any governmental agencies investigating any security breach or misuse of data may seek to impose injunctive relief, consent decrees, or other civil or criminal penalties, which could, among other things, materially increase our data security costs and compliance costs and/or otherwise require us to alter how we operate our business, financialcondition, results of operations, and cash flows.put us at a competitive disadvantage with other payment solution providers.
The global economy has experiencedIn the event of any security breach or misuse of data, we may incur significant legal and other professional expenses, which could have an adverse impact on our operations and results of operations.
We maintain insurance coverage to limit our exposure to losses such as those related to a security breach. However, we cannot assure you that such insurance would be sufficient for these purposes and, in recent years,addition, insurance payments would not alleviate the effect of a breach on our reputation.
Our remediation and security and IT enhancement efforts for any security breach may be costly and may experience, downturns, volatility and disruption, and we face certain risks relating to such events, including:not be effective.
Our international payments provider business provides currency conversionFollowing the unauthorized access incident, we have taken actions based on our investigation of the causes of the unauthorized access incident to date to stop the unauthorized access and foreign exchange hedgingprevent future access, but there may be additional changes needed to prevent a similar incident. We cannot assure that all potential causes of the incident have been identified and remediated as of the date hereof and will not occur again. Because our products and services involve the storage and transmission of data and sensitive information about our customers and merchants, including bank account information, expense data, and credit card, debit card and checking account numbers, we have been, and will continue to be, routinely targeted by outside third parties, including technically sophisticated and well-resourced bad actors attempting to access or steal the data that we store. If we experience additional breaches of our security measures, sensitive customer and merchant data may be accessed, which could cause us significant additional legal and financial exposure and damage to our customers, exposing us to foreign currency exchange risk. In order to help mitigate these risks, we enter into derivative contracts. However, these contracts do not eliminate all of the risks related to fluctuating foreign currency rates.
Our international payments provider business is heavily dependent on global trade. A downturn in global trade or the failure of long-term import growth rates to return to historic levelsreputation that could have ana material adverse effect on our business financial condition,and results of operations, cash flows, and our cash management strategies. Additionally, as customer hedging activity in our international payments provider business generally varies with currency volatility, we have experienced and may experience in the future lower foreign exchange revenues in periods of lower currency volatility.
The counterparties to the derivative financial instruments that we use in our international payments provider business to reduce our exposure to various market risks, including changes in foreign exchange rates, may fail to honor their obligations, which could expose us to risks we had sought to mitigate. This includes the exposure generated when we write derivative contracts to our customers as part of our cross-currency payments business, and we typically hedge the net exposure through offsetting contracts with established financial institution counterparties. That failure could have an adverse effect on our financial condition, results of operations, and cash flows.
Risks associated with operations outside the United States and foreign currencies could adversely affect our business, financial condition, results of operations, and cash flows.operations.
We have additional foreign exchange risk and associated foreign exchange risk management requirements due to the nature of our international payments provider business. The majority of this business' revenue is from exchanges of currency at spot rates, which enable customers to make cross-currency payments. Additionally, this business also writes foreign currency forward and option contracts for our customers. The duration of these derivative contracts at inception is generally less than one year. The credit risk associated with our derivative contracts increases when foreign currency exchange rates move against our customers, possibly impacting their ability to honor their obligations to deliver currency to us or to maintain appropriate collateral with us.
Our international payments provider business aggregates its foreign exchange exposures arising from customer contracts, including the derivative contracts described above, and hedges the resulting net currency risks by entering into offsetting contracts with established financial institution counterparties. If we are unable to obtain offsetting positions, our business, financial condition, results of operations, and cash flows could be adversely affected.
We face credit, liquidity and fraud risks from our agents, consumers, businesses, and third-party processors that could adversely affect our business, financial condition, results of operations, and cash flows.
We are exposed to credit risk in our international payments provider business relating to: (a) derivatives written by us to our customers and (b) the extension of trade credit when transactions are paid to recipients prior to our receiving cleared funds from the sending customers. The credit risk associated with our derivative contracts increases when foreign currency exchange rates move against our customers, possibly impacting their ability to honor their obligations to deliver currency to us or
to maintain appropriate collateral with us. If a customer becomes insolvent, files for bankruptcy, commits fraud or otherwise fails to pay us, we may be exposed to the value of an offsetting position with a financial institution counterparty for the derivatives or may bear financial risk for those receivables where we have offered trade credit.
If we are unable to maintain our relationships with banks needed to conduct our services, or fail to comply with our contract requirements, our business, financial condition, results of operations, and cash flows would be adversely affected.
In our international payments provider business, we facilitate payment and foreign exchange solutions, primarily cross-border, cross-currency transactions, for small and medium size enterprises and other organizations. Increased regulation and compliance requirements are impacting these businesses by making it more costly for us to provide our services or by making it more cumbersome for businesses to do business with us. We may also have difficulty establishing or maintaining banking relationships needed to conduct our services due to banks’ policies. If we are unable to maintain our current business or banking relationships or establish new relationships under terms consistent with those currently in place, our ability to continue to offer our services may be adversely impacted, which could have an adverse effect on our business, financial condition, results of operations, and cash flows.
|
| |
| Item 2. | Unregistered Sales of Equity Securities and Use of Proceeds |
On February 4, 2016, our Board of Directors approved a stock repurchase program (the "Program") under which wethe Company may begin purchasingpurchase up to an aggregate of $500 million of the Company'sits common stock over the following 18 month period. On July 27, 2017, the Company'sour Board of Directors authorized an increase in the size of the Program by an additional $250 million and an extension of the Program by an additional 18 months. On November 1, 2017, the Company announced that itsour Board of Directors had authorized an increase in the size of the Program by an additional $350 million, resulting in total aggregate repurchases authorized under the Program of $1.1 billion. Since the beginning of the Program, 4,114,1044,556,729 shares for an aggregate purchase price of $590$678.4 million have been repurchased.
The following table presents information with respect to purchases of common stock of the Company made during the three months ended September 30, 2017March 31, 2018 by the Company as defined in Rule 10b-18(a)(3) under the Exchange Act:
|
| | | | | | | | | | | | | | |
| Period | | Total Number of Shares Purchased | | Average Price Paid Per Share | | Total Number of Shares Purchased as Part of the Publicly Announced Plan | | Maximum Value that May Yet be Purchased Under the Publicly Announced Plan (in thousands) |
| August 1, 2017 through August 31, 2017 | | 1,491,647 |
| | $ | 142.46 |
| | 3,161,958 |
| | $ | 647,430 |
|
| September 1, 2017 through September 30, 2017 | | 952,146 |
| | $ | 144.38 |
| | 4,114,104 |
| | $ | 509,957 |
|
|
| | | | | | | | | | | | | | |
| Period | | Total Number of Shares Purchased | | Average Price Paid Per Share | | Total Number of Shares Purchased as Part of the Publicly Announced Plan | | Maximum Value that May Yet be Purchased Under the Publicly Announced Plan (in thousands) |
| February 1, 2018 through February 28, 2018 | | 227,998 |
| | $ | 199.78 |
| | 4,342,102 |
| | $ | 464,376 |
|
| March 1, 2018 through March 31, 2018 | | 214,627 |
| | $ | 199.11 |
| | 4,556,729 |
| | $ | 421,638 |
|
|
| |
| Item 3. | Defaults Upon Senior Securities |
Not applicable.
|
| |
| Item 4. | Mine Safety Disclosures |
Not applicable.
Not applicable.
Item 6. Exhibits
|
| | |
| | | |
Exhibit No. | | |
| | Acquisition agreement to acquire Serviços e Tecnologia de Pagamentos S.A. (incorporated by reference to Exhibit 2.1 to the Registrant's Form 8-K, File No. 001-35004, filed with the Securities and Exchange Commission ("SEC") on March 18, 2016) |
| | | |
| | Amended and Restated Certificate of Incorporation of FleetCor Technologies, Inc. (incorporated by reference to Exhibit 3.1 to the Registrant’s Annual Report on Form 10-K, File No. 001-35004, filed with the SEC on March 25, 2011) |
| | |
| | Amended and Restated Bylaws of FleetCor Technologies, Inc. (incorporated by reference to Exhibit 3.23.1 to the Registrant’s Annual Report on Form 10-K,8-K, File No. 001-35004, filed with the SEC on October 28, 2016)January 29, 2018) |
| | |
| | Form of Stock Certificate for Common Stock (incorporated by reference to Exhibit 4.1 to Amendment No. 3 to the Registrant’s Registration Statement on Form S-1, File No. 333-166092, filed with the SEC on June 29, 2010) |
| | |
| | Third Amendment to Credit Agreement, date as of August 2, 2017, among FleetCor Technologies Operating Company, LLC, as the Company, FleetCorOffer letter, dated September 10, 2015, between FLEETCOR Technologies, Inc., as the Parent, the designated borrowers party hereto, the other guarantors party hereto, Bank of America, N.A., as administrative agent, swing line lender and l/c issuer,Alexey Gavrilenya |
| | |
| | FleetCor Technologies. Inc. Amended and the other lenders party hereto Merrill Lynch, Pierce, Fenner & Smith Incorporated, as sole lead arranger and sole book runnerRestated 2010 Equity Incentive Plan (incorporated by reference to Exhibit 10.1 to the Registrant's QuarterlyRegistrant’s Current Report on Form 10-Q,8-K, File No. 001-35004, filed with the SEC on August 8, 2017)February 12, 2018). |
| | | |
| | Certification of Chief Executive Officer pursuant to Rule 13a-14(a) and rule 15d-14(a) of the Securities Exchange Act, as amended |
| |
| | Certification of Chief Financial Officer pursuant to Rule 13a-14(a) and rule 15d-14(a) of the Securities Exchange Act, as amended |
| | |
| | Certification of Chief Executive Officer pursuant to 18 U.S.C. 1350, as adopted pursuant to Section 906 of the Sarbanes-Oxley Act of 2001 |
| | |
| | Certification of Chief Financial Officer pursuant to 18 U.S.C. 1350, as adopted pursuant to Section 906 of the Sarbanes-Oxley Act of 2001 |
| | |
| 101 | | The following financial information for the Registrant formatted in XBRL (Extensible Business Reporting Language): (i) the Consolidated Balance Sheets, (ii) the Unaudited Consolidated Statements of Income, (iii) the Unaudited Consolidated Statements of Comprehensive Income; (iv) the Unaudited Consolidated Statements of Cash Flows and (v) the Notes to Unaudited Consolidated Financial Statements |
SIGNATURES
Pursuant to the requirements of the Securities Exchange Act of 1934, the Registrant has duly caused this report to be signed on its behalf by the undersigned; thereunto duly authorized, in their capacities indicated on November 9, 2017.May 10, 2018.
|
| | | | |
| | | | | |
| | | | | FleetCor Technologies, Inc. |
| | | | | (Registrant) |
| | | |
| Signature | | | | Title |
| | | |
| /s/ Ronald F. Clarke | | | | President, Chief Executive Officer and Chairman of the Board of Directors (Duly Authorized Officer and Principal Executive Officer) |
| Ronald F. Clarke | | | |
| | | |
| /s/ Eric R. Dey | | | | Chief Financial Officer (Principal Financial Officer and Principal Accounting Officer) |
| Eric R. Dey | | | |