UNITED STATES
SECURITIES AND EXCHANGE COMMISSION
FORM 10-Q
(Mark One)
|
| |
| ý | QUARTERLY REPORT PURSUANT TO SECTION 13 OR 15(d) OF THE SECURITIES EXCHANGE ACT OF 1934 |
For the quarterly period ended JuneSeptember 30, 2017
OR
|
| |
| ¨ | TRANSITION REPORT PURSUANT TO SECTION 13 OR 15(d) OF THE SECURITIES EXCHANGE ACT OF 1934 |
For the transition period from to
Commission file number: 001-31719
MOLINA HEALTHCARE, INC.
(Exact name of registrant as specified in its charter)
|
| | |
| Delaware | | 13-4204626 |
| (State or other jurisdiction of incorporation or organization) | | (I.R.S. Employer Identification No.) |
| | |
200 Oceangate, Suite 100 Long Beach, California | | 90802 |
| (Address of principal executive offices) | | (Zip Code) |
(562) 435-3666
(Registrant’s telephone number, including area code)
Indicate by check mark whether the registrant (1) has filed all reports required to be filed by Section 13 or 15(d) of the Securities Exchange Act of 1934 during the preceding 12 months (or for such shorter period that the registrant was required to file such reports), and (2) has been subject to such filing requirements for the past 90 days. Yes ý No ¨
Indicate by check mark whether the registrant has submitted electronically and posted on its corporate Web site, if any, every Interactive Data File required to be submitted and posted pursuant to Rule 405 of Regulation S-T during the preceding 12 months (or for such shorter period that the registrant was required to submit and post such files). Yes ý No ¨
Indicate by check mark whether the registrant is a large accelerated filer, an accelerated filer, a non-accelerated filer, smaller reporting company, or an emerging growth company. See the definitions of “large accelerated filer,” “accelerated filer,” “smaller reporting company,” and “emerging growth company” in Rule 12b-2 of the Exchange Act.
|
| | | |
| Large accelerated filer | ý | Accelerated filer | ¨ |
| | | | |
| Non-accelerated filer | ¨ (Do not check if a smaller reporting company) | Smaller reporting company | ¨ |
| | | Emerging growth company | ¨ |
|
| |
| If an emerging growth company, indicate by check mark if the registrant has elected not to use the extended transition period for complying with any new or revised financial accounting standards provided pursuant to Section13(a) of the Exchange Act. | |
| ¨ |
Indicate by check mark whether the registrant is a shell company (as defined in Rule 12b-2 of the Exchange Act).
Yes ¨ No ý
The number of shares of the issuer’s Common Stock, $0.001 par value, outstanding as of July 28,October 27, 2017, was approximately 57,118,000.57,094,000.
MOLINA HEALTHCARE, INC. FORM 10-Q
FOR THE QUARTERLY PERIOD ENDED JuneSeptember 30, 2017
TABLE OF CONTENTS
CROSS-REFERENCE INDEX
| | | ITEM NUMBER | ITEM NUMBER | Page | ITEM NUMBER | Page |
| | | |
| PART I - Financial Information | PART I - Financial Information | | PART I - Financial Information | |
| | | |
| 1. | | | | |
| | | |
| 2. | | | | |
| | | |
| 3. | |
| |
|
| | | |
| 4. | | | | |
| | | |
| | | | |
| | | |
| 1. | | | | |
| | | |
| 1A. | | | | |
| | | |
| 2. | | | | |
| | | |
| 3. | Defaults Upon Senior Securities | Not Applicable. | Defaults Upon Senior Securities | Not Applicable. |
| | | |
| 4. | Mine Safety Disclosures | Not Applicable. | Mine Safety Disclosures | Not Applicable. |
| | | |
| 5. | Other Information | Not Applicable. | Other Information | Not Applicable. |
| | | |
| 6. | | | | |
| | | |
| | | | | |
| | | |
| | | |
FINANCIAL STATEMENTS
MOLINA HEALTHCARE, INC.
CONSOLIDATED STATEMENTS OF OPERATIONS | | | | Three Months Ended June 30, | | Six Months Ended June 30, | Three Months Ended September 30, | | Nine Months Ended September 30, |
| | 2017 | | 2016 | | 2017 | | 2016 | 2017 | | 2016 | | 2017 | | 2016 |
| | (In millions, except per-share data) (Unaudited) | (In millions, except per-share data) (Unaudited) |
| Revenue: | | | | | | | | | | | | | | |
| Premium revenue | $ | 4,740 |
| | $ | 4,029 |
| | $ | 9,388 |
| | $ | 8,024 |
| $ | 4,777 |
| | $ | 4,191 |
| | $ | 14,165 |
| | $ | 12,215 |
|
| Service revenue | 129 |
| | 135 |
| | 260 |
| | 275 |
| 130 |
| | 133 |
| | 390 |
| | 408 |
|
| Premium tax revenue | 114 |
| | 109 |
| | 225 |
| | 218 |
| 106 |
| | 127 |
| | 331 |
| | 345 |
|
| Health insurer fee revenue | — |
| | 76 |
| | — |
| | 166 |
| — |
| | 85 |
| | — |
| | 251 |
|
| Investment income and other revenue | 16 |
| | 10 |
| | 30 |
| | 19 |
| 18 |
| | 10 |
| | 48 |
| | 29 |
|
| Total revenue | 4,999 |
| | 4,359 |
| | 9,903 |
| | 8,702 |
| 5,031 |
| | 4,546 |
| | 14,934 |
| | 13,248 |
|
| Operating expenses: | | | | | | | | | | | | | | |
| Medical care costs | 4,491 |
| | 3,594 |
| | 8,602 |
| | 7,182 |
| 4,220 |
| | 3,748 |
| | 12,822 |
| | 10,930 |
|
| Cost of service revenue | 124 |
| | 116 |
| | 246 |
| | 243 |
| 123 |
| | 119 |
| | 369 |
| | 362 |
|
| General and administrative expenses | 405 |
| | 351 |
| | 844 |
| | 691 |
| 383 |
| | 343 |
| | 1,227 |
| | 1,034 |
|
| Premium tax expenses | 114 |
| | 109 |
| | 225 |
| | 218 |
| 106 |
| | 127 |
| | 331 |
| | 345 |
|
| Health insurer fee expenses | — |
| | 50 |
| | — |
| | 108 |
| — |
| | 55 |
| | — |
| | 163 |
|
| Depreciation and amortization | 37 |
| | 34 |
| | 76 |
| | 66 |
| 33 |
| | 36 |
| | 109 |
| | 102 |
|
| Impairment losses | 72 |
| | — |
| | 72 |
| | — |
| 129 |
| | — |
| | 201 |
| | — |
|
| Restructuring and separation costs | 43 |
| | — |
| | 43 |
| | — |
| 118 |
| | — |
| | 161 |
| | — |
|
| Total operating expenses | 5,286 |
| | 4,254 |
| | 10,108 |
| | 8,508 |
| 5,112 |
| | 4,428 |
| | 15,220 |
| | 12,936 |
|
| Operating (loss) income | (287 | ) | | 105 |
| | (205 | ) | | 194 |
| (81 | ) | | 118 |
| | (286 | ) | | 312 |
|
| Other expenses (income), net: | | | | | | | | |
| Other expenses, net: | | | | | | | | |
| Interest expense | 27 |
| | 25 |
| | 53 |
| | 50 |
| 32 |
| | 26 |
| | 85 |
| | 76 |
|
| Other income, net | — |
| | — |
| | (75 | ) | | — |
| — |
| | — |
| | (75 | ) | | — |
|
| Total other expenses (income), net | 27 |
| | 25 |
| | (22 | ) | | 50 |
| |
| Total other expenses, net | | 32 |
| | 26 |
| | 10 |
| | 76 |
|
| (Loss) income before income tax (benefit) expense | (314 | ) | | 80 |
| | (183 | ) | | 144 |
| (113 | ) | | 92 |
| | (296 | ) | | 236 |
|
| Income tax (benefit) expense | (84 | ) | | 47 |
| | (30 | ) | | 87 |
| (16 | ) | | 50 |
| | (46 | ) | | 137 |
|
| Net (loss) income | $ | (230 | ) | | $ | 33 |
| | $ | (153 | ) | | $ | 57 |
| $ | (97 | ) | | $ | 42 |
| | $ | (250 | ) | | $ | 99 |
|
| | | | | | | | | | | | | | | |
| Net (loss) income per share: | | | | | | | | | | | | | | |
| Basic | $ | (4.10 | ) | | $ | 0.58 |
| | $ | (2.74 | ) | | $ | 1.02 |
| $ | (1.70 | ) | | $ | 0.77 |
| | $ | (4.44 | ) | | $ | 1.79 |
|
| Diluted | $ | (4.10 | ) | | $ | 0.58 |
| | $ | (2.74 | ) | | $ | 1.01 |
| $ | (1.70 | ) | | $ | 0.76 |
| | $ | (4.44 | ) | | $ | 1.77 |
|
CONSOLIDATED STATEMENTS OF COMPREHENSIVE (LOSS) INCOME
| | | | Three Months Ended June 30, | | Six Months Ended June 30, | Three Months Ended September 30, | | Nine Months Ended September 30, |
| | 2017 | | 2016 | | 2017 | | 2016 | 2017 | | 2016 | | 2017 | | 2016 |
| | (Amounts in millions) (Unaudited) | (Amounts in millions) (Unaudited) |
| Net (loss) income | $ | (230 | ) | | $ | 33 |
| | $ | (153 | ) | | $ | 57 |
| $ | (97 | ) | | $ | 42 |
| | $ | (250 | ) | | $ | 99 |
|
| Other comprehensive income: | | | | | | | | | | | | | | |
| Unrealized investment gain | — |
| | 4 |
| | 1 |
| | 13 |
| |
| Unrealized investment gain (loss) | | 1 |
| | (3 | ) | | 2 |
| | 10 |
|
| Less: effect of income taxes | — |
| | 2 |
| | — |
| | 5 |
| 1 |
| | (2 | ) | | 1 |
| | 3 |
|
| Other comprehensive income, net of tax | — |
| | 2 |
| | 1 |
| | 8 |
| |
| Other comprehensive (loss) income, net of tax | | — |
| | (1 | ) | | 1 |
| | 7 |
|
| Comprehensive (loss) income | $ | (230 | ) | | $ | 35 |
| | $ | (152 | ) | | $ | 65 |
| $ | (97 | ) | | $ | 41 |
| | $ | (249 | ) | | $ | 106 |
|
See accompanying notes.
MOLINA HEALTHCARE, INC.
CONSOLIDATED BALANCE SHEETS | | | | June 30,
2017 | | December 31,
2016 | September 30,
2017 | | December 31,
2016 |
| | (Amounts in millions, except per-share data) | (Amounts in millions, except per-share data) |
| | (Unaudited) | | | (Unaudited) | | |
ASSETS | | Current assets: | | | | | | |
| Cash and cash equivalents | $ | 2,979 |
| | $ | 2,819 |
| $ | 3,934 |
| | $ | 2,819 |
|
| Investments | 2,192 |
| | 1,758 |
| 1,787 |
| | 1,758 |
|
| Restricted investments | 325 |
| | — |
| 326 |
| | — |
|
| Receivables | 1,006 |
| | 974 |
| 1,002 |
| | 974 |
|
| Income taxes refundable | 68 |
| | 39 |
| 60 |
| | 39 |
|
| Prepaid expenses and other current assets | 159 |
| | 131 |
| 174 |
| | 131 |
|
| Derivative asset | 440 |
| | 267 |
| 425 |
| | 267 |
|
| Total current assets | 7,169 |
| | 5,988 |
| 7,708 |
| | 5,988 |
|
| Property, equipment, and capitalized software, net | 449 |
| | 454 |
| 397 |
| | 454 |
|
| Deferred contract costs | 93 |
| | 86 |
| 97 |
| | 86 |
|
| Intangible assets, net | 112 |
| | 140 |
| 101 |
| | 140 |
|
| Goodwill | 559 |
| | 620 |
| 430 |
| | 620 |
|
| Restricted investments | 118 |
| | 110 |
| 117 |
| | 110 |
|
| Deferred income taxes | 36 |
| | 10 |
| 62 |
| | 10 |
|
| Other assets | 47 |
| | 41 |
| 42 |
| | 41 |
|
| | $ | 8,583 |
| | $ | 7,449 |
| $ | 8,954 |
| | $ | 7,449 |
|
| | | | | | | |
LIABILITIES AND STOCKHOLDERS’ EQUITY | | Current liabilities: | | | | | | |
| Medical claims and benefits payable | $ | 2,077 |
| | $ | 1,929 |
| $ | 2,478 |
| | $ | 1,929 |
|
| Amounts due government agencies | 1,844 |
| | 1,202 |
| 1,324 |
| | 1,202 |
|
| Accounts payable and accrued liabilities | 375 |
| | 385 |
| 485 |
| | 385 |
|
| Deferred revenue | 284 |
| | 315 |
| 468 |
| | 315 |
|
| Current portion of long-term debt | 773 |
| | 472 |
| 782 |
| | 472 |
|
| Derivative liability | 440 |
| | 267 |
| 425 |
| | 267 |
|
| Total current liabilities | 5,793 |
| | 4,570 |
| 5,962 |
| | 4,570 |
|
| Senior notes | 1,017 |
| | 975 |
| |
| Long-term debt | | 1,317 |
| | 975 |
|
| Lease financing obligations | 198 |
| | 198 |
| 198 |
| | 198 |
|
| Deferred income taxes | — |
| | 15 |
| — |
| | 15 |
|
| Other long-term liabilities | 54 |
| | 42 |
| 48 |
| | 42 |
|
| Total liabilities | 7,062 |
| | 5,800 |
| 7,525 |
| | 5,800 |
|
| | | | | | | |
| Stockholders’ equity: | | | | | | |
| Common stock, $0.001 par value; 150 shares authorized; outstanding: 57 shares at June 30, 2017 and at December 31, 2016 | — |
| | — |
| |
| Common stock, $0.001 par value; 150 shares authorized; outstanding: 57 shares at September 30, 2017 and at December 31, 2016 | | — |
| | — |
|
| Preferred stock, $0.001 par value; 20 shares authorized, no shares issued and outstanding | — |
| | — |
| — |
| | — |
|
| Additional paid-in capital | 865 |
| | 841 |
| 870 |
| | 841 |
|
| Accumulated other comprehensive loss | (1 | ) | | (2 | ) | (1 | ) | | (2 | ) |
| Retained earnings | 657 |
| | 810 |
| 560 |
| | 810 |
|
| Total stockholders’ equity | 1,521 |
| | 1,649 |
| 1,429 |
| | 1,649 |
|
| | $ | 8,583 |
| | $ | 7,449 |
| $ | 8,954 |
| | $ | 7,449 |
|
See accompanying notes.
MOLINA HEALTHCARE, INC.
CONSOLIDATED STATEMENTS OF CASH FLOWS
| | | | Six Months Ended June 30, | Nine Months Ended September 30, |
| | 2017 | | 2016 | 2017 | | 2016 |
| | (Amounts in millions)
(Unaudited) | (Amounts in millions)
(Unaudited) |
| Operating activities: | | | | | | |
| Net (loss) income | $ | (153 | ) | | $ | 57 |
| $ | (250 | ) | | $ | 99 |
|
| Adjustments to reconcile net (loss) income to net cash provided by operating activities: | | | | | | |
| Depreciation and amortization | 96 |
| | 89 |
| 139 |
| | 135 |
|
| Impairment losses | 72 |
| | — |
| 201 |
| | — |
|
| Deferred income taxes | (41 | ) | | 39 |
| (68 | ) | | 20 |
|
| Share-based compensation, including accelerated share-based compensation | 35 |
| | 16 |
| 38 |
| | 24 |
|
| Non-cash restructuring charges | | 49 |
| | — |
|
| Amortization of convertible senior notes and lease financing obligations | 16 |
| | 15 |
| 24 |
| | 23 |
|
| Other, net | 7 |
| | 11 |
| 13 |
| | 14 |
|
| Changes in operating assets and liabilities: | | | | | | |
| Receivables | (32 | ) | | (415 | ) | (28 | ) | | (427 | ) |
| Prepaid expenses and other assets | (38 | ) | | (143 | ) | (53 | ) | | (116 | ) |
| Medical claims and benefits payable | 148 |
| | 82 |
| 549 |
| | 168 |
|
| Amounts due government agencies | 642 |
| | 509 |
| 122 |
| | 503 |
|
| Accounts payable and accrued liabilities | (18 | ) | | 147 |
| 90 |
| | 1 |
|
| Deferred revenue | (32 | ) | | (119 | ) | 153 |
| | 157 |
|
| Income taxes | (30 | ) | | (10 | ) | (22 | ) | | 32 |
|
| Net cash provided by operating activities | 672 |
| | 278 |
| 957 |
| | 633 |
|
| Investing activities: | | | | | | |
| Purchases of investments | (1,636 | ) | | (974 | ) | (1,896 | ) | | (1,444 | ) |
| Proceeds from sales and maturities of investments | 874 |
| | 812 |
| 1,538 |
| | 1,512 |
|
| Purchases of property, equipment and capitalized software | (60 | ) | | (102 | ) | (85 | ) | | (143 | ) |
| (Increase) decrease in restricted investments held-to-maturity | (10 | ) | | 5 |
| (10 | ) | | 4 |
|
| Net cash paid in business combinations | — |
| | (8 | ) | — |
| | (48 | ) |
| Other, net | (13 | ) | | (6 | ) | (21 | ) | | (12 | ) |
| Net cash used in investing activities | (845 | ) | | (273 | ) | (474 | ) | | (131 | ) |
| Financing activities: | | | | | | |
| Proceeds from senior notes offering, net of issuance costs | 325 |
| | — |
| 325 |
| | — |
|
| Proceeds from borrowings under credit facility | | 300 |
| | — |
|
| Proceeds from employee stock plans | 11 |
| | 10 |
| 11 |
| | 10 |
|
| Other, net | (3 | ) | | 1 |
| (4 | ) | | 1 |
|
| Net cash provided by financing activities | 333 |
| | 11 |
| 632 |
| | 11 |
|
| Net increase in cash and cash equivalents | 160 |
| | 16 |
| 1,115 |
| | 513 |
|
| Cash and cash equivalents at beginning of period | 2,819 |
| | 2,329 |
| 2,819 |
| | 2,329 |
|
| Cash and cash equivalents at end of period | $ | 2,979 |
| | $ | 2,345 |
| $ | 3,934 |
| | $ | 2,842 |
|
MOLINA HEALTHCARE, INC.
CONSOLIDATED STATEMENTS OF CASH FLOWS
(continued)
| | | | Six Months Ended June 30, | Nine Months Ended September 30, |
| | 2017 | | 2016 | 2017 | | 2016 |
| | (Amounts in millions)
(Unaudited) | (Amounts in millions)
(Unaudited) |
| Supplemental cash flow information: | | | | | | |
| | | | | | | |
| Schedule of non-cash investing and financing activities: | | | | | | |
| Common stock used for share-based compensation | $ | (21 | ) | | $ | (7 | ) | $ | (21 | ) | | $ | (8 | ) |
| | | | | | | |
| Details of change in fair value of derivatives, net: | | | | | | |
| Gain (loss) on 1.125% Call Option | $ | 173 |
| | $ | (148 | ) | $ | 158 |
| | $ | (60 | ) |
| (Loss) gain on 1.125% Conversion Option | (173 | ) | | 148 |
| (158 | ) | | 60 |
|
| Change in fair value of derivatives, net | $ | — |
| | $ | — |
| $ | — |
| | $ | — |
|
| | | | | | | |
| Details of business combinations: | | | | | | |
| Fair value of assets acquired | $ | — |
| | $ | (131 | ) | $ | — |
| | $ | (186 | ) |
| Fair value of liabilities assumed | | — |
| | 28 |
|
| Purchase price amounts accrued/received | — |
| | 21 |
| — |
| | 8 |
|
| Reversal of amounts advanced to sellers in prior year | — |
| | 102 |
| — |
| | 102 |
|
| Net cash paid in business combinations | $ | — |
| | $ | (8 | ) | $ | — |
| | $ | (48 | ) |
See accompanying notes.
NOTES TO CONSOLIDATED FINANCIAL STATEMENTS (UNAUDITED)
JuneSeptember 30, 2017
1. Basis of Presentation
Organization and Operations
Molina Healthcare, Inc. provides quality managed health care to people receiving government assistance. We offer cost-effective Medicaid-related solutions to meet the health care needs of low-income families and individuals, and to assist government agencies in their administration of the Medicaid program. We have three reportable segments. These segments consist of our Health Plans segment, which constitutes the vast majority of our operations; our Molina Medicaid Solutions segment; and our Other segment.
The Health Plans segment consists of health plans operating in 12 states and the Commonwealth of Puerto Rico, and includes our direct delivery business.Rico. As of JuneSeptember 30, 2017, these health plans served approximately 4.74.5 million members eligible for Medicaid, Medicare, and other government-sponsored health care programs for low-income families and individuals. This membership includes Affordable Care Act Marketplace (Marketplace) members, most of whom receive government premium subsidies. The health plans are operated by our respective wholly owned subsidiaries in those states, each of which is licensed as a health maintenance organization (HMO). Our direct delivery business consists primarily of the operation of primary care clinics in several states in which we operate.
Our health plans’ state Medicaid contracts generally have terms of three to four years. These contracts typically contain renewal options exercisable by the state Medicaid agency, and allow either the state or the health plan to terminate the contract with or without cause. Our health plan subsidiaries have generally been successful in retaining their contracts, but such contracts are subject to risk of loss when a state issues a new request for proposal (RFP) open to competitive bidding by other health plans. If one of our health plans is not a successful responsive bidder to a state RFP, its contract may be subject to non-renewal.
In addition to contract renewal, our state Medicaid contracts may be periodically amended to include or exclude certain health benefits (such as pharmacy services, behavioral health services, or long-term care services); populations such as the aged, blind or disabled (ABD); and regions or service areas.
The Molina Medicaid Solutions segment provides support to state government agencies in the administration of their Medicaid programs, including business processing, information technology development and administrative services.
The Other segment includes primarily our Pathways behavioral health and social services provider, and corporate amounts not allocated to other reportable segments.
Restructuring Plan
We recorded $43 million in restructuring and separation costs in the second quarter of 2017 related primarily to contractually required termination benefits paid to our former chief executive officer (CEO) and chief financial officer (CFO). Also included in these costs are consulting fees incurred for the development and implementation of our corporate restructuring initiatives. See Note 11, “Restructuring and Separation Costs.”
Recent Developments — Health Plans Segment
Direct Delivery.Illinois Health Plan. OnIn August 2, 2017, we announced plansMolina Healthcare of Illinois, Inc. was awarded a statewide Medicaid managed care contract by the Illinois Department of Healthcare and Family Services. This Medicaid contract further integrates behavioral health and physical health by combining the State’s three current managed care programs into one program. The contract begins January 1, 2018, for four years with options to restructure our direct delivery operations.renew annually for up to four additional years.
Mississippi Health Plan. In June 2017, Molina Healthcare of Mississippi, Inc. was awarded a Medicaid Coordinated Care Contract for the statewide administration of the Mississippi Coordinated Access Network (MississippiCAN). The operational start date for the program is currently scheduled for October 1, 2018, pending the completion of a readiness review. The initial term of the contract begins July 1, 2017, for three yearsis through June 2020, with options to renew annually for up to two additional years. The operational start date for the program is currently scheduled for July 1, 2018, pending the completion of a readiness review.
Washington Health Plan. In May 2017, Molina Healthcare of Washington, Inc. was selected by the Washington State Health Care Authority to negotiate and enter into managed care contracts for the North Central region of the state’s Apple Health Integrated Managed Care Program. The start date for the new contract is scheduled for January 1, 2018.
Terminated Medicare Acquisition. In August 2016, we entered into agreements with each of Aetna Inc. and Humana Inc. to acquire certain assets related to their Medicare Advantage business. The transaction was subject to closing
conditions including the completion of the proposed acquisition of Humana by Aetna (the Aetna-Humana Merger). In January 2017, the U.S. District Court for the District of Columbia granted the request for relief made by the U.S. Department of Justice in its civil antitrust lawsuit against Aetna and Humana, to prohibit the Aetna-Humana Merger. In February 2017, our agreements with each of Aetna and Humana were terminated by the parties pursuant to the terms of the agreements. Under the termination agreements, we received an aggregate termination fee of $75 million from Aetna and Humana in the first quarter of 2017, which is reported in “Other income, net.” net” in the accompanying consolidated statements of operations.
New York Health Plan. In August 2016, we closed on our acquisition of the outstanding equity interests of Today’s Options of New York, Inc., which now operates as Molina Healthcare of New York, Inc. The purchase price allocation was completed, and the final purchase price adjustments were recorded, in the first quarter of 2017. Such adjustments were insignificant, and the final cash purchase price was $38 million.
Recent Developments — Other SegmentImpairment Losses
Molina Medicaid Solutions segment. In the third quarter of 2017, we recorded a non-cash goodwill impairment loss of $28 million.See Note 10, “Impairment Losses.”
Other segment. In the third quarter of 2017, we recorded a non-cash goodwill impairment loss of $101 million for our Pathways subsidiary. In the second quarter of 2017, we recorded non-cash goodwill and intangible assets impairment losses of $72 million, related primarily tofor our Pathways subsidiary. See Note 10, “Impairment Losses.”
Consolidation and Interim Financial Information
The consolidated financial statements include the accounts of Molina Healthcare, Inc., its subsidiaries, and variable interest entities (VIEs) in which Molina Healthcare, Inc. is considered to be the primary beneficiary. Such VIEs are insignificant to our consolidated financial position and results of operations. In the opinion of management, all adjustments considered necessary for a fair presentation of the results as of the date and for the interim periods presented have been included; such adjustments consist of normal recurring adjustments. All significant intercompany balances and transactions have been eliminated. The consolidated results of operations for the current interim period are not necessarily indicative of the results for the entire year ending December 31, 2017.
The unaudited consolidated interim financial statements have been prepared under the assumption that users of the interim financial data have either read or have access to our audited consolidated financial statements for the fiscal year ended December 31, 2016. Accordingly, certain disclosures that would substantially duplicate the disclosures contained in the December 31, 2016 audited consolidated financial statements have been omitted. These unaudited consolidated interim financial statements should be read in conjunction with our December 31, 2016 audited consolidated financial statements.
2. Significant Accounting Policies
Certain of our significant accounting policies are discussed within the note to which they specifically relate.
Revenue Recognition – Health Plans Segment
Premium revenue is fixed in advance of the periods covered and, except as described below, is not generally subject to significant accounting estimates. Premium revenues are recognized in the month that members are entitled to receive health care services, and premiums collected in advance are deferred. Certain components of premium revenue are subject to accounting estimates and fall into two broad categories discussed in further detail below: 1) “Contractual Provisions That May Adjust or Limit Revenue or Profit;” and 2) “Quality Incentives.”
Contractual Provisions That May Adjust or Limit Revenue or Profit
Medicaid
Medical Cost Floors (Minimums), and Medical Cost Corridors: A portion of our premium revenue may be returned if certain minimum amounts are not spent on defined medical care costs. In the aggregate, we recorded a liability under the terms of such contract provisions of $136$119 million and $272 million at JuneSeptember 30, 2017 and December 31, 2016, respectively, to “Amounts due government agencies.” Approximately $114$82 million and $244 million of the liability accrued at JuneSeptember 30, 2017 and December 31, 2016, respectively, relates to our participation in Medicaid Expansion programs.
In certain circumstances, our health plans may receive additional premiums if amounts spent on medical care costs exceed a defined maximum threshold. Receivables relating to such provisions were insignificant at JuneSeptember 30, 2017 and December 31, 2016.
Profit Sharing and Profit Ceiling: Our contracts with certain states contain profit-sharing or profit ceiling provisions under which we refund amounts to the states if our health plans generate profit above a certain specified percentage. In some cases, we are limited in the amount of administrative costs that we may deduct in calculating the refund, if any. Liabilities for profits in excess of the amount we are allowed to retain under these provisions were insignificant at JuneSeptember 30, 2017 and December 31, 2016.
Retroactive Premium Adjustments: State Medicaid programs periodically adjust premium rates on a retroactive basis. In these cases, we must adjust our premium revenue in the period in which we learn of the adjustment, rather than in the months of service to which the retroactive adjustment applies.
Medicare
Risk Adjustment: Our Medicare premiums are subject to retroactive increase or decrease based on the health status of our Medicare members (measured as a member risk score). We estimate our members’ risk scores and the related amount of Medicare revenue that will ultimately be realized for the periods presented based on our knowledge of our members’ health status, risk scores and the Centers for Medicare & Medicaid Services (CMS) practices. Consolidated balance sheet amounts related to anticipated Medicare risk adjustment premiums and Medicare Part D settlements were insignificant at JuneSeptember 30, 2017 and December 31, 2016.
Minimum MLR: Additionally, federal regulations have established a minimum annual medical loss ratio (Minimum MLR) of 85% for Medicare. The medical loss ratio represents medical costs as a percentage of premium revenue. Federal regulations define what constitutes medical costs and premium revenue. If the Minimum MLR is not met, we may be required to pay rebates to the federal government. We recognize estimated rebates under the Minimum MLR as an adjustment to premium revenue in our consolidated statements of operations.
Marketplace
Premium Stabilization Programs: The Affordable Care Act (ACA) established Marketplace premium stabilization programs effective January 1, 2014. These programs, commonly referred to as the “3R’s,” include a permanent risk adjustment program, a transitional reinsurance program, and a temporary risk corridor program. We record receivables or payables related to the 3R programs and the Minimum MLR when the amounts are reasonably estimable as described below, and, for receivables, when collection is reasonably assured. Our receivables (payables) for each of these programs, as of the dates indicated, were as follows:
| | | | June 30, 2017 | | December 31,
2016 | September 30, 2017 | | December 31,
2016 |
| | Current Benefit Year | | Prior Benefit Years | | Total | | Current Benefit Year | | Prior Benefit Years | | Total | |
| | | | | | | | | | | | | | | |
| | (In millions) | (In millions) |
| Risk adjustment | $ | (502 | ) | | $ | (546 | ) | | $ | (1,048 | ) | | $ | (522 | ) | $ | (655 | ) | | $ | — |
| | $ | (655 | ) | | $ | (522 | ) |
| Reinsurance | — |
| | 57 |
| | 57 |
| | 55 |
| — |
| | 10 |
| | 10 |
| | 55 |
|
| Risk corridor | — |
| | (1 | ) | | (1 | ) | | (1 | ) | — |
| | — |
| | — |
| | (1 | ) |
| Minimum MLR | (3 | ) | | (2 | ) | | (5 | ) | | (1 | ) | (27 | ) | | — |
| | (27 | ) | | (1 | ) |
Risk adjustment: Under this permanent program, our health plans’ composite risk scores are compared with the overall average risk score for the relevant state and market pool. Generally, our health plans will make a risk transfer payment into the pool if their composite risk scores are below the average risk score, and will receive a risk transfer payment from the pool if their composite risk scores are above the average risk score. We estimate our ultimate premium based on insurance policy year-to-date experience, and recognize estimated premiums relating to the risk adjustment program as an adjustment to premium revenue in our consolidated statements of operations.
Reinsurance: This program was designed to provide reimbursement to insurers for high cost members and ended December 31, 2016; we expect to settle the outstanding receivable balance in 2017.
Risk corridor: This program was intended to limit gains and losses of insurers by comparing allowable costs to a target amount as defined by CMS, and ended December 31, 2016; we expect to settle theall outstanding payable balance inbalances were settled as of September 30, 2017.
Additionally, the ACA established a Minimum MLR of 80% for the Marketplace. The medical loss ratio represents medical costs as a percentage of premium revenue. Federal regulations define what constitutes medical costs and premium revenue. If the Minimum MLR is not met, we may be required to pay rebates to our Marketplace policyholders. Each of the 3R programs is taken into consideration when computing the Minimum MLR. We
recognize estimated rebates under the Minimum MLR as an adjustment to premium revenue in our consolidated statements of operations.
Quality Incentives
At several of our health plans, revenue ranging from approximately 1% to 3% of certain health plan premiums is earned only if certain performance measures are met.
The following table quantifies the quality incentive premium revenue recognized for the periods presented, including the amounts earned in the periods presented and prior periods. Although the reasonably possible effects of a change in estimate related to quality incentive premium revenue as of JuneSeptember 30, 2017 are not known, we have no reason to believe that the adjustments to prior years noted below are not indicative of the potential future changes in our estimates as of JuneSeptember 30, 2017.
| | | | Three Months Ended June 30, | | Six Months Ended June 30, | Three Months Ended September 30, | | Nine Months Ended September 30, |
| | 2017 | | 2016 | | 2017 | | 2016 | 2017 | | 2016 | | 2017 | | 2016 |
| | (Dollars in millions) | (Dollars in millions) |
| Maximum available quality incentive premium - current period | $ | 39 |
| | $ | 41 |
| | $ | 77 |
| | $ | 81 |
| $ | 36 |
| | $ | 33 |
| | $ | 113 |
| | $ | 114 |
|
| Quality incentive premium revenue recognized in current period: | | | | | | | | | | | | | | |
| Earned current period | $ | 29 |
| | $ | 36 |
| | $ | 48 |
| | $ | 54 |
| $ | 24 |
| | $ | 26 |
| | $ | 72 |
| | $ | 80 |
|
| Earned prior periods | 1 |
| | 49 |
| | 6 |
| | 54 |
| 3 |
| | — |
| | 9 |
| | 54 |
|
| Total | $ | 30 |
| | $ | 85 |
| | $ | 54 |
| | 108 |
| $ | 27 |
| | $ | 26 |
| | $ | 81 |
| | 134 |
|
| | | | | | | | | | | | | | | |
| Quality incentive premium revenue recognized as a percentage of total premium revenue | 0.6 | % | | 2.1 | % | | 0.6 | % | | 1.3 | % | 0.6 | % | | 0.6 | % | | 0.6 | % | | 1.1 | % |
Income Taxes
The provision for income taxes is determined using an estimated annual effective tax rate, which generally differs from the U.S. federal statutory rate primarily because of state taxes, nondeductible expenses such as the Health Insurer Fee (HIF), goodwill impairment, certain compensation, and other general and administrative expenses. The effective tax rate was not impacted by HIF in 2017 given the 2017 HIF moratorium.
The effective tax rate may be subject to fluctuations during the year, particularly as a result of the level of pretax earnings, and also as new information is obtained. Such information may affect the assumptions used to estimate the annual effective tax rate, including factors such as the mix of pretax earnings in the various tax jurisdictions in which we operate, valuation allowances against deferred tax assets, the recognition or the reversal of the recognition of tax benefits related to uncertain tax positions, and changes in or the interpretation of tax laws in jurisdictions where we conduct business. We recognize deferred tax assets and liabilities for temporary differences between the financial reporting basis and the tax basis of our assets and liabilities, along with net operating loss and tax credit carryovers.
Premium Deficiency Reserves on Loss Contracts
We assess the profitability of our medical care policies to identify groups of contracts where current operating results or forecasts indicate probable future losses. If anticipated future variable costs exceed anticipated future premiums and investment income, a premium deficiency reserve is recognized. We assume a full-year CSR reconciliation (see further information below) in the premium deficiency reserve calculation for the Marketplace program. We recorded a premium deficiency reserve to “Medical claims and benefits payable” on our accompanying consolidated balance sheets relating to our Marketplace program of $30 million as of December 31, 2016, which increased to $100 million as of June 30, 2017, and then decreased to $70 million as of September 30, 2017. If a nine-month CSR reconciliation had been included in the computation rather than a full year, the premium deficiency reserve would have increased by $55 million, to $125 million as of September 30, 2017. The theoretical $55 million increase to the premium deficiency reserve is less than the potential fourth quarter 2017 impact described below, or $85 million, because such adjustment only recognizes the potential CSR impact to the extent it would have created a deficiency in premiums at September 30, 2017.
Marketplace Cost Share Reduction (CSR) Update
Our third quarter results do not include any potential impact from the October 12, 2017, direction to Centers for Medicare and Medicaid Services (CMS) from Acting Department of Health and Human Services Secretary Hargan to cease payment of Marketplace CSR subsidies. At September 30, 2017, we had a total of approximately $220 million in excess CSR subsidies, recorded as a payable to CMS. This payable represents the extent to which payments received by us from CMS exceeded our estimate of the actual cost of member subsidies incurred by us through September 30, 2017.
We expect to incur approximately $85 million in unreimbursed expense associated with the cessation of CSR subsidies in the fourth quarter of 2017. It has been the practice of CMS to perform a reconciliation on an annual basis of CSR subsidies paid to all health plans against the actual costs incurred by the health plans. Were such a reconciliation to be performed for the full calendar year of 2017—consistent with past practice—we would be able to offset nearly all of the $85 million expense incurred in the fourth quarter against the excess amounts received prior to September 30, 2017. However, should CMS transition to a nine month reconciliation period ending September 30, 2017—the last month for which CSR subsidies have been paid—the absence of CSR subsidy reimbursement would reduce income before income tax expense by approximately $85 million in the fourth quarter of 2017.
Recent Accounting Pronouncements
Goodwill Impairment. In January 2017, the Financial Accounting Standards Board (FASB) issued Accounting Standards Update (ASU) 2017-04, Simplifying the Test for Goodwill Impairment, which eliminates the requirement to calculate the implied fair value of goodwill to measure a goodwill impairment loss. Instead, an impairment loss is measured as the excess of the carrying amount of the reporting unit, including goodwill, over the fair value of the reporting unit. ASU 2017-04 is effective beginning January 1, 2020; we have early adopted ASU 2017-04 as of June 30, 2017, in connection with the interim assessment of our Pathways subsidiary. See further discussion at Note 10, “Impairment Losses.”
Restricted Cash. In November 2016, the FASB issued ASU 2016-18, Restricted Cash, which will require us to include in our consolidated statements of cash flows the balances of cash, cash equivalents, restricted cash and
restricted cash equivalents. When these items are presented in more than one line item on the balance sheet, the new guidance requires a reconciliation of the totals in the statement of cash flows to the related captions in the balance sheet. Transfers between cash and cash equivalents and restricted cash and restricted cash equivalents will no longer be presented in the statement of cash flows. ASU 2016-18 is effective beginning January 1, 2018; early adoption is permitted. We intend to early adopt ASU 2016-18 as of December 31, 2017, and are currently evaluating the effect tochanges that will be required in our consolidated statements of cash flows.
Stock Compensation. In March 2016, the FASB issued ASU 2016-09, Improvements to Employee Share-Based Payment Accounting, which amends ASC Topic 718, Compensation – Stock Compensation. ASU 2016-09 simplifies several aspects of accounting for employee share-based payment transactions, including the accounting for income taxes, forfeitures, statutory tax and classification in the statement of cash flows. We adopted ASU 2016-09 in the first quarter of 2017; such adoption did not significantly impact our consolidated financial statements. In addition, the prior period presentation in the statement of cash flows was not adjusted because such adjustments were insignificant.
Leases. In February 2016, the FASB issued ASU 2016-02, Leases (Topic 842), as modified by ASU 2017-03, Transition and Open Effective Date Information. Under ASU 2016-02, an entity will be required to recognize assets and liabilities for the rights and obligations created by leases on the entity’s balance sheet for both finance and operating leases. For leases with a term of 12 months or less, an entity can elect to not recognize lease assets and lease liabilities and expense the lease over a straight-line basis for the term of the lease. ASU 2016-02 will require new disclosures that depict the amount, timing, and uncertainty of cash flows pertaining to an entity’s leases. ASU 2016-02 is effective for us beginning January 1, 2019, and must be adopted using a modified retrospective approach for annual and interim periods beginning after December 15, 2018. Early adoption is permitted. Under this guidance, we will record assets and liabilities relating primarily to our long-term office leases, andleases. We are currently evaluating the effect to our consolidated financial statements.
Revenue Recognition. In May 2014, the FASB issued ASU 2014-09, Revenue from Contracts with Customers (Topic 606). We intend to adopt this standard and the related modifications on January 1, 2018, using the modified retrospective approach. Under this approach, the cumulative effect of initially applying the guidance will be reflected as an adjustment to beginning retained earnings.
We have determined that the insurance contracts of our Health Plans segment, which comprisessegment constitutes the vast majority of our operations, are excluded from the scope of ASU 2014-09Topic 606 because the recognition of revenue under these contracts is dictated by other accounting standards governing insurance contracts.
For our Molina Medicaid Solutions segment, we have reevaluated our earlier assessment and determined that certainrevenue for contracts that include design, development and implementation of Medicaid managed care systems shall be deferred until the system ‘go-live’ date, and then generally recognized on a straight-line basis over the hosting period. This approach is consistent with the FASB/IASB Joint Transition Resource Group for Revenue Recognition view for entities that provide software as a service solution, and similar to our historical revenue recognition methodology. We are continuing to evaluate the existence of customers’ rights with regard to renewal options and whether such rights may constitute separate performance obligations. We expect that cost of service revenue will no longer be deferred and recognized over the service delivery period. Rather, service revenue willgenerally be recognized based onin a manner consistent with the expected cost plus gross margin method, and cost of servicecorresponding revenue will be recognized as incurred. As of June 30, 2017, we expectrecognition.
We believe the cumulative adjustment for historical periods through June 30, 2017 to increase retained earnings by no more than $50 million. This estimateassociated with the adoption of Topic 606 effective January 1, 2018, will be updated in each quarterlyinsignificant for both our Molina Medicaid Solutions and annual report until adoption. We expect the cumulative adjustment, if any, relating to our Other segment to be insignificant.segments.
Other recent accounting pronouncements issued by the FASB (including its Emerging Issues Task Force), the American Institute of Certified Public Accountants, and the Securities and Exchange Commission (SEC) did not have, or are not believed by management to have, a significant impact on our present or future consolidated financial statements.
3. Net (Loss) Income per Share
The following table sets forth the calculation of basic and diluted net (loss) income per share: | | | | Three Months Ended June 30, | | Six Months Ended June 30, | Three Months Ended September 30, | | Nine Months Ended September 30, |
| | 2017 | | 2016 | | 2017 | | 2016 | 2017 | | 2016 | | 2017 | | 2016 |
| | (In millions, except net income per share) | (In millions, except net income per share) |
| Numerator: | | | | | | | | | | | | | | |
| Net (loss) income | $ | (230 | ) | | $ | 33 |
| | $ | (153 | ) | | $ | 57 |
| $ | (97 | ) | | $ | 42 |
| | $ | (250 | ) | | $ | 99 |
|
| Denominator: | | | | | | | | | | | | | | |
| Denominator for basic net (loss) income per share | 56 |
| | 55 |
| | 56 |
| | 55 |
| 57 |
| | 56 |
| | 56 |
| | 55 |
|
| Effect of dilutive securities: | | | | | | | | | | | | | | |
1.125% Warrants (1) | — |
| | — |
| | — |
| | 1 |
| — |
| | — |
| | — |
| | 1 |
|
| Denominator for diluted net (loss) income per share | 56 |
| | 55 |
| | 56 |
| | 56 |
| 57 |
| | 56 |
| | 56 |
| | 56 |
|
| | | | | | | | | | | | | | | |
Net (loss) income per share: (2) | | | | | | | | | | | | | | |
| Basic | $ | (4.10 | ) | | $ | 0.58 |
| | $ | (2.74 | ) | | $ | 1.02 |
| $ | (1.70 | ) | | $ | 0.77 |
| | $ | (4.44 | ) | | $ | 1.79 |
|
| Diluted | $ | (4.10 | ) | | $ | 0.58 |
| | $ | (2.74 | ) | | $ | 1.01 |
| $ | (1.70 | ) | | $ | 0.76 |
| | $ | (4.44 | ) | | $ | 1.77 |
|
| | | | | | | | | | | | | | | |
| Potentially dilutive common shares excluded from calculations: | | | | | | | | | | | | | | |
1.125% Warrants (1) | 2 |
| | — |
| | 1 |
| | — |
| 2 |
| | — |
| | 2 |
| | — |
|
1.625% Notes (1) | | 1 |
| | — |
| | — |
| | — |
|
| |
| (1) | For more information regarding the 1.125% Warrants, refer to Note 9, “Stockholders' Equity.” For more information regarding the 1.625% Notes, refer to Note 7, “Debt.” The dilutive effect of all potentially dilutive common shares is calculated using the treasury-stocktreasury stock method. Certain potentiallyPotentially dilutive common shares issuable arewere not included in the computation of diluted net (loss) incomeloss per share because to do so would be anti-dilutive. Forin the three and sixnine months ended JuneSeptember 30, 2017, the 1.125% Warrants were excluded from diluted shares outstanding because to do so would have been anti-dilutive. |
| |
| (2) | Source data for calculations in thousands. |
4. Fair Value Measurements
We consider the carrying amounts of cash, and cash equivalents and other current assets and current liabilities (not including derivatives and the current portion of long-term debt) to approximate their fair values because of the
relatively short period of time between the origination of these instruments and their expected realization or payment. For our financial instruments measured at fair value on a recurring basis, we prioritize the inputs used in measuring fair value according to athe three-tier fair value hierarchy defined by GAAP.hierarchy. For a description of the methods and assumptions that we use to a) estimate the fair value; and b) determine the classification according to the fair value hierarchy for each financial instrument, see Note 5, “Fair Value Measurements,” in our 2016 Annual Report on Form 10-K.
Derivative financial instruments include the 1.125% Call Option derivative asset and the 1.125% Conversion Option derivative liability. These derivatives are not actively traded and are valued based on an option pricing model that uses observable and unobservable market data for inputs. Significant market data inputs used to determine fair value as of JuneSeptember 30, 2017, included the price of our common stock, the time to maturity of the derivative instruments, the risk-free interest rate, and the implied volatility of our common stock. As described further in Note 8, “Derivatives,” the 1.125% Call Option asset and the 1.125% Conversion Option liability were designed such that changes in their fair values would offset, with minimal impact to the consolidated statements of operations. Therefore, the sensitivity of changes in the unobservable inputs to the option pricing model for such instruments is mitigated.
The net changes in fair value of Level 3 financial instruments were insignificant to our results of operations for the sixnine months ended JuneSeptember 30, 2017.
Our financial instruments measured at fair value on a recurring basis at JuneSeptember 30, 2017, were as follows: | | | | Total | | Quoted Market Prices (Level 1) | | Significant Other Observable Inputs (Level 2) | | Significant Unobservable Inputs (Level 3) | Total | | Quoted Market Prices (Level 1) | | Significant Other Observable Inputs (Level 2) | | Significant Unobservable Inputs (Level 3) |
| | (In millions) | (In millions) |
| Corporate debt securities | $ | 1,386 |
| | $ | — |
| | $ | 1,386 |
| | $ | — |
| $ | 1,162 |
| | $ | — |
| | $ | 1,162 |
| | $ | — |
|
| U.S. treasury notes | 263 |
| | 263 |
| | — |
| | — |
| |
| Government-sponsored enterprise securities (GSEs) | 241 |
| | 241 |
| | — |
| | — |
| 220 |
| | 220 |
| | — |
| | — |
|
| Municipal securities | 140 |
| | — |
| | 140 |
| | — |
| 131 |
| | — |
| | 131 |
| | — |
|
| Asset-backed securities | 128 |
| | — |
| | 128 |
| | — |
| 125 |
| | — |
| | 125 |
| | — |
|
| U.S. treasury notes | | 121 |
| | 121 |
| | — |
| | — |
|
| Certificates of deposit | 34 |
| | — |
| | 34 |
| | — |
| 28 |
| | — |
| | 28 |
| | — |
|
| Subtotal - current investments | 2,192 |
| | 504 |
| | 1,688 |
| | — |
| 1,787 |
| | 341 |
| | 1,446 |
| | — |
|
| Corporate debt securities | 228 |
| | — |
| | 228 |
| | — |
| 229 |
| | — |
| | 229 |
| | — |
|
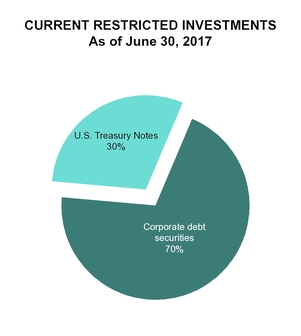
| U.S. treasury notes | 97 |
| | 97 |
| | — |
| | — |
| 97 |
| | 97 |
| | — |
| | — |
|
| Subtotal - current restricted investments | 325 |
| | 97 |
| | 228 |
| | — |
| 326 |
| | 97 |
| | 229 |
| | — |
|
| 1.125% Call Option derivative asset | 440 |
| | — |
| | — |
| | 440 |
| 425 |
| | — |
| | — |
| | 425 |
|
| Total assets | $ | 2,957 |
| | $ | 601 |
| | $ | 1,916 |
| | $ | 440 |
| $ | 2,538 |
| | $ | 438 |
| | $ | 1,675 |
| | $ | 425 |
|
| | | | | | | | | | | | | | | |
| 1.125% Conversion Option derivative liability | $ | 440 |
| | $ | — |
| | $ | — |
| | $ | 440 |
| $ | 425 |
| | $ | — |
| | $ | — |
| | $ | 425 |
|
| Total liabilities | $ | 440 |
| | $ | — |
| | $ | — |
| | $ | 440 |
| $ | 425 |
| | $ | — |
| | $ | — |
| | $ | 425 |
|
Our financial instruments measured at fair value on a recurring basis at December 31, 2016, were as follows: | | | | Total | | Quoted Market Prices (Level 1) | | Significant Other Observable Inputs (Level 2) | | Significant Unobservable Inputs (Level 3) | Total | | Quoted Market Prices (Level 1) | | Significant Other Observable Inputs (Level 2) | | Significant Unobservable Inputs (Level 3) |
| | (In millions) | (In millions) |
| Corporate debt securities | $ | 1,179 |
| | $ | — |
| | $ | 1,179 |
| | $ | — |
| $ | 1,179 |
| | $ | — |
| | $ | 1,179 |
| | $ | — |
|
| U.S. treasury notes | 84 |
| | 84 |
| | — |
| | — |
| |
| GSEs | 231 |
| | 231 |
| | — |
| | — |
| 231 |
| | 231 |
| | — |
| | — |
|
| Municipal securities | 142 |
| | — |
| | 142 |
| | — |
| 142 |
| | — |
| | 142 |
| | — |
|
| Asset-backed securities | 69 |
| | — |
| | 69 |
| | — |
| 69 |
| | — |
| | 69 |
| | — |
|
| U.S. treasury notes | | 84 |
| | 84 |
| | — |
| | — |
|
| Certificates of deposit | 53 |
| | — |
| | 53 |
| | — |
| 53 |
| | — |
| | 53 |
| | — |
|
| Subtotal - current investments | 1,758 |
| | 315 |
| | 1,443 |
| | — |
| 1,758 |
| | 315 |
| | 1,443 |
| | — |
|
| 1.125% Call Option derivative asset | 267 |
| | — |
| | — |
| | 267 |
| 267 |
| | — |
| | — |
| | 267 |
|
| Total assets | $ | 2,025 |
| | $ | 315 |
| | $ | 1,443 |
| | $ | 267 |
| $ | 2,025 |
| | $ | 315 |
| | $ | 1,443 |
| | $ | 267 |
|
| | | | | | | | | | | | | | | |
| 1.125% Conversion Option derivative liability | $ | 267 |
| | $ | — |
| | $ | — |
| | $ | 267 |
| $ | 267 |
| | $ | — |
| | $ | — |
| | $ | 267 |
|
| Total liabilities | $ | 267 |
| | $ | — |
| | $ | — |
| | $ | 267 |
| $ | 267 |
| | $ | — |
| | $ | — |
| | $ | 267 |
|
There were no current restricted investments as of December 31, 2016.
Fair Value Measurements – Disclosure Only
The carrying amounts and estimated fair values of our senior notes which are classified as Level 2 financial instruments,instruments. Fair value for these securities is determined using a market approach based on quoted market prices for similar securities in active markets or quoted prices for identical securities in inactive markets. The carrying amount and estimated fair value of the amount due under our Credit Facility is classified as a Level 3 financial instrument, because certain inputs used to determine its fair value are indicated innot observable. As of September 30, 2017, the following table.carrying value of the amount due under the Credit Facility approximates it fair value because of the recency of this borrowing during the third quarter of 2017.
| | | | June 30, 2017 | | December 31, 2016 | September 30, 2017 | | December 31, 2016 |
| | Carrying Value | |
Fair Value | | Carrying Value | |
Fair Value | Carrying Value | |
Fair Value | | Carrying Value | |
Fair Value |
| | (In millions) | (In millions) |
| 5.375% Notes | $ | 692 |
| | $ | 745 |
| | $ | 691 |
| | $ | 714 |
| $ | 692 |
| | $ | 726 |
| | $ | 691 |
| | $ | 714 |
|
| 1.125% Convertible Notes | 483 |
| | 976 |
| | 471 |
| | 792 |
| 489 |
| | 927 |
| | 471 |
| | 792 |
|
| 4.875% Notes | 325 |
| | 333 |
| | — |
| | — |
| 325 |
| | 324 |
| | — |
| | — |
|
| Credit Facility | | 300 |
| | 300 |
| | — |
| | — |
|
| 1.625% Convertible Notes | 289 |
| | 386 |
| | 284 |
| | 344 |
| 292 |
| | 373 |
| | 284 |
| | 344 |
|
| | $ | 1,789 |
| | $ | 2,440 |
| | $ | 1,446 |
| | $ | 1,850 |
| $ | 2,098 |
| | $ | 2,650 |
| | $ | 1,446 |
| | $ | 1,850 |
|
5. Investments
Available-for-Sale Investments
We consider all of our investments classified as current assets (including restricted investments) to be available-for-sale. Certain of our senior notes, as further discussed in Note 7, “Debt,” contain a limitation on the use of proceeds which required us to deposit the net proceeds from their issuance into a segregated deposit account, a current asset reported as “Restricted investments” in the accompanying consolidated balance sheets. Such proceeds, while restricted as to their use and held in a segregated deposit account, are available-for-sale based upon our contractual liquidity requirements.
The following tables summarize our investments as of the dates indicated: | | | | June 30, 2017 | September 30, 2017 |
| | Amortized | | Gross Unrealized | | Estimated Fair | Amortized | | Gross Unrealized | | Estimated Fair |
| | Cost | | Gains | | Losses | | Value | Cost | | Gains | | Losses | | Value |
| | (In millions) | (In millions) |
| Corporate debt securities | $ | 1,387 |
| | $ | 1 |
| | $ | 2 |
| | $ | 1,386 |
| $ | 1,162 |
| | $ | 1 |
| | $ | 1 |
| | $ | 1,162 |
|
| U.S. treasury notes | 263 |
| | — |
| | — |
| | 263 |
| |
| GSEs | 242 |
| | — |
| | 1 |
| | 241 |
| 221 |
| | — |
| | 1 |
| | 220 |
|
| Municipal securities | 140 |
| | — |
| | — |
| | 140 |
| 132 |
| | — |
| | 1 |
| | 131 |
|
| Asset-backed securities | 128 |
| | — |
| | — |
| | 128 |
| 125 |
| | — |
| | — |
| | 125 |
|
| U.S. treasury notes | | 121 |
| | — |
| | — |
| | 121 |
|
| Certificates of deposit | 34 |
| | — |
| | — |
| | 34 |
| 28 |
| | — |
| | — |
| | 28 |
|
| Subtotal - current investments | 2,194 |
| | 1 |
| | 3 |
| | 2,192 |
| 1,789 |
| | 1 |
| | 3 |
| | 1,787 |
|
| Corporate debt securities | 227 |
| | 1 |
| | — |
| | 228 |
| 229 |
| | — |
| | — |
| | 229 |
|
| U.S. treasury notes | 97 |
| | — |
| | — |
| | 97 |
| 97 |
| | — |
| | — |
| | 97 |
|
| Subtotal - current restricted investments | 324 |
| | 1 |
| | — |
| | 325 |
| 326 |
| | — |
| | — |
| | 326 |
|
| Total | $ | 2,518 |
| | $ | 2 |
| | $ | 3 |
| | $ | 2,517 |
| |
| | | $ | 2,115 |
| | $ | 1 |
| | $ | 3 |
| | $ | 2,113 |
|
| | | | December 31, 2016 | December 31, 2016 |
| | Amortized | | Gross Unrealized | | Estimated Fair | Amortized | | Gross Unrealized | | Estimated Fair |
| | Cost | | Gains | | Losses | | Value | Cost | | Gains | | Losses | | Value |
| | (In millions) | (In millions) |
| Corporate debt securities | $ | 1,180 |
| | $ | 1 |
| | $ | 2 |
| | $ | 1,179 |
| $ | 1,180 |
| | $ | 1 |
| | $ | 2 |
| | $ | 1,179 |
|
| U.S. treasury notes | 84 |
| | — |
| | — |
| | 84 |
| |
| GSEs | 232 |
| | — |
| | 1 |
| | 231 |
| 232 |
| | — |
| | 1 |
| | 231 |
|
| Municipal securities | 143 |
| | — |
| | 1 |
| | 142 |
| 143 |
| | — |
| | 1 |
| | 142 |
|
| Asset-backed securities | 69 |
| | — |
| | — |
| | 69 |
| 69 |
| | — |
| | — |
| | 69 |
|
| U.S. treasury notes | | 84 |
| | — |
| | — |
| | 84 |
|
| Certificates of deposit | 53 |
| | — |
| | — |
| | 53 |
| 53 |
| | — |
| | — |
| | 53 |
|
| Total - current investments | $ | 1,761 |
| | $ | 1 |
| | $ | 4 |
| | $ | 1,758 |
| |
| | | $ | 1,761 |
| | $ | 1 |
| | $ | 4 |
| | $ | 1,758 |
|
There were no current restricted investments as of December 31, 2016.
The contractual maturities of our available-for-sale investments as of JuneSeptember 30, 2017 are summarized below: | | | | Amortized Cost | | Estimated Fair Value | Amortized Cost | | Estimated Fair Value |
| | (In millions) | (In millions) |
| Due in one year or less | $ | 1,301 |
| | $ | 1,301 |
| $ | 1,154 |
| | $ | 1,153 |
|
| Due after one year through five years | 1,194 |
| | 1,193 |
| 944 |
| | 943 |
|
| Due after five years through ten years | 23 |
| | 23 |
| 17 |
| | 17 |
|
| Total | $ | 2,518 |
| | $ | 2,517 |
| |
| | | $ | 2,115 |
| | $ | 2,113 |
|
Gross realized gains and losses from sales of available-for-sale securities are calculated under the specific identification method and are included in investment income. Gross realized investment gains and losses for the three and sixnine months ended JuneSeptember 30, 2017 and 2016 were insignificant.
We have determined that unrealized losses at JuneSeptember 30, 2017 and December 31, 2016, are temporary in nature, because the change in market value for these securities has resulted from fluctuating interest rates, rather than a deterioration of the credit worthinesscreditworthiness of the issuers. So long as we maintain the intent and ability to hold these securities to maturity, we are unlikely to experience losses. In the event that we dispose of these securities before maturity, we expect that realized losses, if any, will be insignificant.
The following table segregates those available-for-sale investments that have been in a continuous loss position for less than 12 months, and those that have been in a loss position for 12 months or more as of June 30, 2017:
|
| | | | | | | | | | | | | | | | | | | | | |
| | In a Continuous Loss Position for Less than 12 Months | | In a Continuous Loss Position for 12 Months or More |
| | Estimated Fair Value | | Unrealized Losses | | Total Number of Positions | | Estimated Fair Value | | Unrealized Losses | | Total Number of Positions |
| | (Dollars in millions) |
| Corporate debt securities | $ | 913 |
| | $ | 2 |
| | 418 |
| | $ | — |
| | $ | — |
| | — |
|
| GSEs | 247 |
| | 1 |
| | 101 |
| | — |
| | — |
| | — |
|
| Total - current investments | $ | 1,160 |
| | $ | 3 |
| | 519 |
| | $ | — |
| | $ | — |
| | — |
|
The following table segregates those available-for-sale investments that have been in a continuous loss position for less than 12 months, and those that have been in a continuous loss position for 12 months or more as of September 30, 2017:
|
| | | | | | | | | | | | | | | | | | | | | |
| | In a Continuous Loss Position for Less than 12 Months | | In a Continuous Loss Position for 12 Months or More |
| | Estimated Fair Value | | Unrealized Losses | | Total Number of Positions | | Estimated Fair Value | | Unrealized Losses | | Total Number of Positions |
| | (Dollars in millions) |
| Corporate debt securities | $ | 783 |
| | $ | 1 |
| | 314 |
| | $ | — |
| | $ | — |
| | — |
|
| GSEs | — |
| | — |
| | — |
| | 58 |
| | 1 |
| | 20 |
|
| Municipal securities | 97 |
| | 1 |
| | 116 |
| | — |
| | — |
| | — |
|
| | $ | 880 |
| | $ | 2 |
| | 430 |
| | $ | 58 |
| | $ | 1 |
| | 20 |
|
The following table segregates those available-for-sale investments that have been in a continuous loss position for less than 12 months, and those that have been in a continuous loss position for 12 months or more as of December 31, 2016:
| | | | In a Continuous Loss Position for Less than 12 Months | | In a Continuous Loss Position for 12 Months or More | In a Continuous Loss Position for Less than 12 Months | | In a Continuous Loss Position for 12 Months or More |
| | Estimated Fair Value | | Unrealized Losses | | Total Number of Positions | | Estimated Fair Value | | Unrealized Losses | | Total Number of Positions | Estimated Fair Value | | Unrealized Losses | | Total Number of Positions | | Estimated Fair Value | | Unrealized Losses | | Total Number of Positions |
| | (Dollars in millions) | (Dollars in millions) |
| Corporate debt securities | $ | 542 |
| | $ | 2 |
| | 378 |
| | $ | — |
| | $ | — |
| | — |
| $ | 542 |
| | $ | 2 |
| | 378 |
| | $ | — |
| | $ | — |
| | — |
|
| GSEs | 198 |
| | 1 |
| | 73 |
| | — |
| | — |
| | — |
| 198 |
| | 1 |
| | 73 |
| | — |
| | — |
| | — |
|
| Municipal securities | 101 |
| | 1 |
| | 129 |
| | — |
| | — |
| | — |
| 101 |
| | 1 |
| | 129 |
| | — |
| | — |
| | — |
|
| Total - current investments | $ | 841 |
| | $ | 4 |
| | 580 |
| | $ | — |
| | $ | — |
| | — |
| |
| | | $ | 841 |
| | $ | 4 |
| | 580 |
| | $ | — |
| | $ | — |
| | — |
|
Held-to-Maturity Investments
Pursuant to the regulations governing our Health Plans segment subsidiaries, we maintain statutory deposits and deposits required by government authorities primarily in certificates of deposit and U.S. treasury securities. We also maintain restricted investments as protection against the insolvency of certain capitated providers. The use of these funds is limited as required by regulation in the various states in which we operate, or as needed in the event of insolvency of capitated providers. Therefore, such investments are reported as non-current “Restricted investments” in the accompanying consolidated balance sheet.sheets. We have the ability to hold these restricted investments until maturity, and as a result, we would not expect the value of these investments to decline significantly due to a sudden change in market interest rates.
The contractual maturities of our held-to-maturity restricted investments, which are carried at amortized cost, which approximates fair value, as of JuneSeptember 30, 2017 are summarized below: | | | | Amortized Cost | | Estimated Fair Value | Amortized Cost | | Estimated Fair Value |
| | (In millions) | (In millions) |
| Due in one year or less | $ | 100 |
| | $ | 100 |
| $ | 100 |
| | $ | 100 |
|
| Due after one year through five years | 18 |
| | 17 |
| 17 |
| | 17 |
|
| | $ | 118 |
| | $ | 117 |
| $ | 117 |
| | $ | 117 |
|
6. Medical Claims and Benefits Payable
The following table provides the details of our medical claims and benefits payable (including amounts payable for the provision of long-term services and supports, or LTSS) as of the dates indicated.indicated:
| | | | June 30,
2017 | | December 31,
2016 | September 30,
2017 | | December 31,
2016 |
| | (In millions) | (In millions) |
| Fee-for-service claims incurred but not paid (IBNP) | $ | 1,478 |
| | $ | 1,352 |
| $ | 1,681 |
| | $ | 1,352 |
|
| Pharmacy payable | 121 |
| | 112 |
| 125 |
| | 112 |
|
| Capitation payable | 45 |
| | 37 |
| 57 |
| | 37 |
|
| Other | 433 |
| | 428 |
| 615 |
| | 428 |
|
| | $ | 2,077 |
| | $ | 1,929 |
| $ | 2,478 |
| | $ | 1,929 |
|
“Other” medical claims and benefits payable include amounts payable to certain providers for which we act as an intermediary on behalf of various government agencies without assuming financial risk. Such receipts and payments do not impact our consolidated statements of operations. Non-risk provider payables amounted to $111$403 million and $225 million as of JuneSeptember 30, 2017 and December 31, 2016, respectively.
Reinsurance recoverables of $65$16 million and $83$72 million as of JuneSeptember 30, 2017 and 2016, respectively, are included in “Receivables” in the accompanying consolidated balance sheets.
The following table presents the components of the change in our medical claims and benefits payable for the periods indicated. The amounts presented for “Components of medical care costs related to: Prior periods” represent the amountamounts by which our original estimate of medical claims and benefits payable at the beginning of the period were moreless (more) than the actual amount of the liability based on information (principally the payment of claims) developed since that liability was first reported.
| | | | Six Months Ended June 30, | Nine Months Ended September 30, |
| | 2017 | | 2016 | 2017 | | 2016 |
| | (Dollars in millions) | (Dollars in millions) |
| Medical claims and benefits payable, beginning balance | $ | 1,929 |
| | $ | 1,685 |
| $ | 1,929 |
| | $ | 1,685 |
|
| Components of medical care costs related to: | | | | | | |
| Current period | 8,633 |
| | 7,371 |
| 12,813 |
| | 11,120 |
|
| Prior periods | (31 | ) | | (189 | ) | 9 |
| | (190 | ) |
| Total medical care costs | 8,602 |
| | 7,182 |
| 12,822 |
| | 10,930 |
|
| | | | | | | |
| Change in non-risk provider payables | (114 | ) | | 24 |
| 172 |
| | 70 |
|
| | | | | | | |
| Payments for medical care costs related to: | | | | | | |
| Current period | 6,883 |
| | 5,885 |
| 10,944 |
| | 9,536 |
|
| Prior periods | 1,457 |
| | 1,240 |
| 1,501 |
| | 1,278 |
|
| Total paid | 8,340 |
| | 7,125 |
| 12,445 |
| | 10,814 |
|
| Medical claims and benefits payable, ending balance | $ | 2,077 |
| | $ | 1,766 |
| $ | 2,478 |
| | $ | 1,871 |
|
| Benefit from prior period as a percentage of: | | | | | | |
| Balance at beginning of period | 1.6 | % | | 11.3 | % | (0.5 | )% | | 11.3 | % |
| Premium revenue, trailing twelve months | 0.2 | % | | 1.3 | % | — | % | | 1.2 | % |
| Medical care costs, trailing twelve months | 0.2 | % | | 1.4 | % | (0.1 | )% | | 1.3 | % |
Assuming that our initial estimate of IBNP is accurate, we believe that amounts ultimately paid would generally be between 8% and 10% less than the IBNP liability recorded at the end of the period as a result of the inclusion in that liability of the provision for adverse claims deviation and the accrued cost of settling those claims. Because the amount of our initial liability is merely an estimate (and therefore not perfectly accurate), we will always experience variability in that estimate as new information becomes available with the passage of time. Therefore, there can be no assurance that amounts ultimately paid out will fall within the range of 8% to 10% lower than the liability that was initially recorded. Furthermore, because our initial estimate of IBNP is derived from many factors, some of which are qualitative in nature rather than quantitative, we are seldom able to assign specific values to the reasons for a change in estimate—we only know when the circumstances for any one or more factors are out of the ordinary.
As indicated in the table above, the amounts ultimately paid out on our medical claims and benefits payable liabilities in fiscal years 2017 and 2016 were less than what we had expected when we had established those liabilities. The differences between our original estimates and the amounts ultimately paid out (or now expected to be ultimately paid out) for the most part related to IBNP. While many related factors working in conjunction with one another serve to determine the accuracy of our estimates, we are seldom able to quantify the impact that any single
factor has on a change in estimate. In addition, given the variability inherent in the reserving process, we will only be able to identify specific factors if they represent a significant departure from expectations. As a result, we do not expect to be able to fully quantify the impact of individual factors on changes in estimates.
While priorPrior period development of our estimate as of December 31, 2016, through JuneSeptember 30, 2017, was favorableunfavorable by $31$9 million, that amountwhich is substantially less than the favorable prior period development of $189$190 million we recognized for the same period in the prior year. Further, favorablethe unfavorable development through JuneSeptember 30, 2017, was less than the 8% to 10% favorable development we typically expect.
We believe that the most significant uncertainties surrounding our IBNP estimates at JuneSeptember 30, 2017 are as follows:
In the first half of 2017, our Marketplace enrollment across all health plans increased by over 400,000 members. Due to limited insight into the cost patterns associated with this large number of new Marketplace members, our liability estimates for these members are subject to more than the usual amount of uncertainty.
At our Florida health plan, the inventory of unpaid claims receipts increased significantly overduring the last few months due to an increasefirst two quarters of 2017, and then dropped in the receipt of secondary claims, many of which are not our liability. These claims will either be denied or will have very small paid amounts.third quarter. For this reason, the timing between the dates of service and the dates claims denial rates, amountsare paid per claim and other claims indicators will be impacted, making our liability estimates subject to more than the usual amount of uncertainty.
At our Illinois health plan, in 2017 we paid a large number of claims in the first half of 2017 that had previously been denied and were subsequently disputed by providers. We have also established a liability for additional expected claims resulting from provider disputes. This has created some distortion in the claims payment patterns, making our liability estimates subject to more than the usual amount of uncertainty.
At our California health plan, we adjusted our inpatient authorization process. As a result, due to the expected increase in authorized inpatient stays, our liability estimates are subject to more than the usual amount of uncertainty.
At our Illinois and New MexicoYork health plan,plans, we implemented a fee schedule reductionnew process for increased quality review of claims payments. While we do not anticipate this new process will impact the percentage of claims paid within the timely turnaround requirements, we believe it will have a large provider has createdminor impact on the timing of some distortion in the claims payment patterns, makingpaid claims. For this reason, our liability estimates in these two health plans are subject to more than the usual amount of uncertainty.
At our Puerto Rico health plan, Hurricane Maria had a significant impact on both utilization of services and our ability to process claims payments in Puerto Rico. For these reasons, we believe our liability estimates are subject to more than the usual amount of uncertainty.
7. Debt
Substantially all of our debt is held at the parent, which is reported in the Other segment. The following table summarizes our outstanding debt obligations and their classification in the accompanying consolidated balance sheets (in millions):
| | | | June 30,
2017 | | December 31,
2016 | September 30,
2017 | | December 31,
2016 |
| Current portion of long-term debt: | | | | | | |
| 1.125% Convertible Notes, net of unamortized discount | $ | 488 |
| | $ | 477 |
| $ | 494 |
| | $ | 477 |
|
| 1.625% Convertible Notes, net of unamortized premium and discount | 291 |
| | — |
| 293 |
| | — |
|
| Lease financing obligations | 1 |
| | 1 |
| 1 |
| | 1 |
|
| Debt issuance costs | (7 | ) | | (6 | ) | (6 | ) | | (6 | ) |
| | 773 |
| | 472 |
| 782 |
| | 472 |
|
| Non-current portion of long-term debt, reported as “Senior notes”: | | | | |
| Non-current portion of long-term debt: | | | | |
| 5.375% Notes | 700 |
| | 700 |
| 700 |
| | 700 |
|
| 4.875% Notes | 330 |
| | — |
| 330 |
| | — |
|
| Credit Facility | | 300 |
| | — |
|
| 1.625% Convertible Notes, net of unamortized premium and discount | — |
| | 286 |
| — |
| | 286 |
|
| Debt issuance costs | (13 | ) | | (11 | ) | (13 | ) | | (11 | ) |
| | 1,017 |
| | 975 |
| 1,317 |
| | 975 |
|
| Lease financing obligations | 198 |
| | 198 |
| 198 |
| | 198 |
|
| | $ | 1,988 |
| | $ | 1,645 |
| $ | 2,297 |
| | $ | 1,645 |
|
4.875% Notes due 2025
On June 6, 2017, we completed the private offering of $330 million aggregate principal amount of senior notes (4.875% Notes) due June 15, 2025, unless earlier redeemed. Interest on the 4.875% Notes is payable semiannually in arrears on June 15 and December 15. According to their terms, the guarantees under the 4.875% Notes mirror those of the Credit Facility, defined and described below. See Note 16, “Supplemental Condensed Consolidating Financial Information,” for more information on the guarantors. The 4.875% Notes contain customary non-financial covenants and change of control provisions.
The 4.875% Notes contain a limitation on the use of proceeds which required us to deposit the net proceeds from their issuance into a segregated deposit account, a current asset reported as “Restricted investments” in our consolidated balance sheets. These funds may be used by us as follows:
On or prior to August 20, 2018, to:
| |
| ◦ | Redeem, repurchase, repay, tender for, or acquire for value all or any portion of our 1.625% Convertible Notes, defined and discussed further below, or to satisfy the cash portion of any consideration due upon any conversion of the 1.625% Convertible Notes; and/or |
| |
| ◦ | Pay any interest due on all or any portion of the 4.875% Notes. |
On or after August 20, 2018, to repurchase all or any portion of the 1.625% Convertible Notes that we are obligated to repurchase; and
Subsequent to August 20, 2018 (or such earlier date in the event that there are no longer any 1.625% Convertible Notes outstanding), in any other manner not otherwise prohibited in the indenture governing the 4.875% Notes.
5.375% Notes due 2022
We have outstanding $700 million aggregate principal amount of senior notes (5.375% Notes) due November 15, 2022, unless earlier redeemed. According to their terms, the guarantees under the 5.375% Notes mirror those of the Credit Facility, defined and described below. See Note 16, “Supplemental Condensed Consolidating Financial Information,” for more information on the guarantors.
Credit Facility
In January 2017, we entered into an amended unsecured $500 million revolving credit facility (Credit Facility), referred to as the First Amendment. As of June 30, 2017, outstanding letters of credit amounting to $6 million reduced our borrowing capacity under the Credit Facility to $494 million. The Credit Facility has a term of five years and all amounts outstanding will be due and payable on January 31, 2022. As of JuneSeptember 30, 2017, no amounts were$300 million was outstanding under the Credit Facility, and we were in compliance with all financial and non-financial covenants under the Credit Facility. Also as of September 30, 2017, outstanding letters of credit amounting to $6 million reduced our remaining borrowing capacity under the Credit Facility to $194 million.
In addition to increasing amounts available to borrow under the Credit Facility and extending its term, the First Amendment provided that all guarantors immediately prior to January 3, 2017, other than Molina Information Systems, LLC, d/b/a Molina Medicaid Solutions, Molina Pathways, LLC, and Pathways Health and Community Support LLC, were automatically and unconditionally released from their obligations as guarantors of the Credit Facility and the 5.375% Notes.
The Credit Facility contains customary non-financial and financial covenants, including a net leverage ratio and an interest coverage ratio. In February 2017, we entered into a second amendment to the Credit Facility (the Second Amendment) which modified the Credit Facility’s definition of the earnings measure used in the financial covenant computations to a) allow us to receive credit for risk corridor payments owed to, but not received or accrued by us during 2016; and b) account for the difference between the amount of actual risk transfer payments made or accrued by us during 2016, and the amount of risk transfer payments that would have been due under the federal government’s proposed 2018 risk adjustment payment transfer formula.
In May 2017, we entered into a third amendment to the Credit Facility (the Third Amendment) which modified the Credit Facility’s definition of specified cash, to permit cash that is either subject to customary escrow arrangements or held in a segregated account to be netted from the Credit Facility’s consolidated net leverage ratio if the use of the cash is limited to the repayment of other indebtedness. The Third Amendment also adds a carve-out to the Credit Facility’s negative pledge covenant to allow for the escrow arrangements and segregated accounts. At June 30,
In August 2017, we were in compliance with all financial and non-financial covenants underentered into a fourth amendment to the Credit Facility.Facility (the Fourth Amendment). The Fourth Amendment modified the definition of consolidated adjusted EBITDA to permit the add-back of certain restructuring charges and cost savings subject to certain limitations, and modified the definition of the consolidated interest coverage ratio to include, when calculating such ratio, consolidated interest expense “paid in cash” only.
Convertible Senior Notes
We have outstanding $550 million aggregate principal amount of 1.125% cash convertible senior notes due January 15, 2020 (1.125% Convertible Notes), unless earlier repurchased or converted. We refer to these notes as our 1.125% Convertible Notes. We also have outstanding $302 million aggregate principal amount of 1.625% convertible senior notes due August 14, 2044 (1.625% Convertible Notes), unless earlier repurchased, redeemed, or converted. We refer to these notes as our 1.625% Convertible Notes. The 1.125% Convertible Notes are convertible entirely tointo cash, and the 1.625% Convertible Notes are convertible partially tointo cash, each prior to their respective maturity dates under certain circumstances, one of which relates to the closing price of our common stock over a specified period. We refer to this conversion trigger as the stock price trigger.
The stock price trigger for the 1.125% Convertible Notes is $53.00 per share. The 1.125% Convertible Notes met this trigger in the quarter ended JuneSeptember 30, 2017; therefore, they are convertible into cash and are reported in current portion of long-term debt as of JuneSeptember 30, 2017.
The stock price trigger for the 1.625% Convertible Notes is $75.51 per share. The 1.625% Convertible Notes did not meet this stock price trigger in the quarter ended JuneSeptember 30, 2017. OnHowever, on contractually specified dates beginning in 2018, holders of the 1.625% Convertible Notes may require us to repurchase some or all of such notes. In addition, beginning May 15, 2018 until August 19, 2018, holders may convert some or all of the 1.625% Convertible Notes. Because of thisthese put and conversion feature,features, the 1.625% Convertible Notes are reported in current portion of long-term debt as of JuneSeptember 30, 2017. As noted above, because the proceeds from the 4.875% Notes are initially restricted to payments upon conversion or redemption of the 1.625% Convertible Notes, such restricted investments are also classified as current in the accompanying consolidated balance sheets.
Cross-Default Provisions
The terms of our 4.875% Notes, 5.375% Notes and each of the 1.125% and 1.625% Convertible Notes contain cross-default provisions with the Credit Facility that are triggered upon an event of default under the Credit Facility, and when borrowings under the Credit Facility equal or exceed certain amounts as defined in the related indentures.
Debt Commitment Letter
In connection with the Terminatedterminated Medicare Acquisition, we entered into a debt commitment letter with Barclays Bank PLC (Barclays) in August 2016. Under this debt commitment letter, Barclays agreed to lend us up to $400 million, subject to satisfaction of certain conditions, including consummation of the Terminatedterminated Medicare Acquisition. The debt commitment letter automatically terminated in February 2017 as a result of the termination of this transaction. The costs associated with the debt commitment letter and its termination were reimbursed as described in Note 1, “Basis of Presentation–Health Plans Segment Recent Developments.”
8. Derivatives
The following table summarizes the fair values and the presentation of our derivative financial instruments (defined and discussed individually below) in the accompanying consolidated balance sheets:
| | | | Balance Sheet Location | | June 30,
2017 | | December 31,
2016 | Balance Sheet Location | | September 30,
2017 | | December 31,
2016 |
| | | (In millions) | | (In millions) |
| Derivative asset: | | | | | | | | |
| 1.125% Call Option | Current assets: Derivative asset | | $ | 440 |
| | $ | 267 |
| Current assets: Derivative asset | | $ | 425 |
| | $ | 267 |
|
| Derivative liability: | | | | | | | | |
| 1.125% Conversion Option | Current liabilities: Derivative liability | | $ | 440 |
| | $ | 267 |
| Current liabilities: Derivative liability | | $ | 425 |
| | $ | 267 |
|
Our derivative financial instruments do not qualify for hedge treatment; therefore, the change in fair value of these instruments is recognized immediately in our consolidated statements of operations, and reported in “Other income, net.” Gains and losses for our derivative financial instruments are presented individually in the accompanying consolidated statements of cash flows, “Supplemental cash flow information.”
1.125% Notes Call Spread Overlay. Concurrent with the issuance of the 1.125% Convertible Notes in 2013, we entered into privately negotiated hedge transactions (collectively, the 1.125% Call Option) and warrant transactions (collectively, the 1.125% Warrants), with certain of the initial purchasers of the 1.125% Convertible Notes (the Counterparties). We refer to these transactions collectively as the Call Spread Overlay. Under the Call Spread Overlay, the cost of the 1.125% Call Option we purchased to cover the cash outlay upon conversion of the 1.125% Convertible Notes was reduced by proceeds from the sale of the 1.125% Warrants. Assuming full performance by the Counterparties (and 1.125% Warrants strike prices in excess of the conversion price of the 1.125% Convertible Notes), these transactions are intended to offset cash payments in excess of the principal amount of the 1.125% Convertible Notes due upon any conversion of such Notes.notes.
1.125% Call Option. The 1.125% Call Option, which is indexed to our common stock, is a derivative asset that requires mark-to-market accounting treatment due to cash settlement features until the 1.125% Call Option settles or expires. For further discussion of the inputs used to determine the fair value of the 1.125% Call Option, refer to Note 4, “Fair Value Measurements.”
1.125% Conversion Option. The embedded cash conversion option within the 1.125% Convertible Notes is accounted for separately as a derivative liability, with changes in fair value reported in our consolidated statements of operations until the cash conversion option settles or expires. For further discussion of the inputs used to determine the fair value of the 1.125% Conversion Option, refer to Note 4, “Fair Value Measurements.”
As of JuneSeptember 30, 2017, the 1.125% Call Option and the 1.125% Conversion Option were classified as a current asset and current liability, respectively, because the 1.125% Convertible Notes may be converted within 12twelve months of JuneSeptember 30, 2017, as described in Note 7, “Debt.”
9. Stockholders' Equity
Stockholders’ equity decreased $128220 million during the sixnine months ended JuneSeptember 30, 2017 compared with stockholders’ equity at December 31, 2016. The decrease was due primarily to the net loss of $153250 million, partially offset by $24$29 million related to employee stock transactions in the sixnine months ended JuneSeptember 30, 2017, which are described further below.2017.
1.125% Warrants
In connection with the Call Spread Overlay transaction described in Note 8, “Derivatives,” in 2013, we issued 13,490,236 warrants with a strike price of $53.8475 per share. Under certain circumstances, beginning in April 2020, when the price of our common stock exceeds the strike price of the 1.125% Warrants, we will be obligated to issue shares of our common stock subject to a share delivery cap. The 1.125% Warrants could separately have a dilutive effect to the extent that the market value per share of our common stock exceeds the applicable strike price of the 1.125% Warrants. Refer to Note 3, “Net (Loss) Income per Share,” for dilution information for the periods presented. We will not receive any additional proceeds if the 1.125% Warrants are exercised.
Stock Incentive Plans
In connection with our equity incentive plans and employee stock purchase plan, approximately 692,000702,000 shares of common stock vested or were purchased, net of shares used to settle employees’ income tax obligations, during the sixnine months ended JuneSeptember 30, 2017.
Except as noted below, we record share-based compensation as “General and administrative expenses” in the accompanying consolidated statements of operations. Restricted stock awards (RSAs), performance stock awards (PSAs) and performance stock units (PSUs) activity for the sixnine months ended JuneSeptember 30, 2017 is summarized below: | | | | Restricted Stock Awards | | Performance Stock Awards | | Performance Stock Units | | Total | | Weighted Average Grant Date Fair Value | Restricted Stock Awards | | Performance Stock Awards | | Performance Stock Units | | Total | | Weighted Average Grant Date Fair Value |
| Unvested balance, December 31, 2016 | 577,244 |
| | 345,656 |
| | — |
| | 922,900 |
| | $ | 58.15 |
| 577,244 |
| | 345,656 |
| | — |
| | 922,900 |
| | $ | 58.15 |
|
| Granted | 377,076 |
| | — |
| | 231,100 |
| | 608,176 |
| | 56.98 |
| 386,273 |
| | — |
| | 231,100 |
| | 617,373 |
| | 57.16 |
|
| Vested | (380,812 | ) | | (260,894 | ) | | (139,272 | ) | | (780,978 | ) | | 57.63 |
| (391,680 | ) | | (260,894 | ) | | (139,272 | ) | | (791,846 | ) | | 57.78 |
|
| Forfeited | (58,643 | ) | | — |
| | — |
| | (58,643 | ) | | 54.48 |
| (69,346 | ) | | — |
| | — |
| | (69,346 | ) | | 54.37 |
|
| Unvested balance, June 30, 2017 | 514,865 |
| | 84,762 |
| | 91,828 |
| | 691,455 |
| | 57.57 |
| |
| Unvested balance, September 30, 2017 | | 502,491 |
| | 84,762 |
| | 91,828 |
| | 679,081 |
| | 57.61 |
|
The total fair value of RSAs granted during the sixnine months ended JuneSeptember 30, 2017 and 2016 was $19 million and $17$18 million, respectively. The total fair value of RSAs which vested during the sixnine months ended JuneSeptember 30, 2017 and 2016 was $20$21 million and $21$22 million, respectively.
No PSAs were granted during the sixnine months ended JuneSeptember 30, 2017. The total fair value of PSAs granted during the sixnine months ended JuneSeptember 30, 2016 was $15 million. The total fair value of PSAs which vested during the sixnine months ended JuneSeptember 30, 2017 was $15 million. No PSAs vested during the sixnine months ended JuneSeptember 30, 2016.
The total fair value of PSUs granted during the sixnine months ended JuneSeptember 30, 2017 was $16 million. The total fair value of PSUs which vested during the sixnine months ended JuneSeptember 30, 2017 was $9 million. There were no PSUs granted or vested in 2016.
During the sixnine months ended JuneSeptember 30, 2017, the vesting of 133,957 RSAs, 153,574 PSAs and 139,272 PSUs was accelerated in connection with the termination of our former Chief Executive Officer (CEO) and former Chief Financial Officer (CFO) in May 2017. Share-based compensation expense of $35$38 million was recorded during the sixnine months ended JuneSeptember 30, 2017, of which $23 million was recorded to “Restructuring and separation costs” in the accompanying consolidated statements of operations. See Note 11, “Restructuring and Separation Costs” for further discussion. Share-basedWe recorded share-based compensation expense of $16$24 million was recorded to “General and administrative expenses” in the sixnine months ended JuneSeptember 30, 2016.
As of JuneSeptember 30, 2017, there was $32$27 million of total unrecognized compensation expense related to unvested RSAs, including those with marketPSAs, and performance conditions, and unvested PSUs, which we expect to recognize over a remaining weighted-average period of 2.52.2 years and 2.11.9 years, respectively. This unrecognized compensation cost assumes an estimated forfeiture rate of 3.3%4.5% for non-executive employees as of JuneSeptember 30, 2017.
10. Impairment Losses
Goodwill represents the excess of the purchase price over the fair value of net assets acquired in business combinations. Goodwill is not amortized, but is subject to an annual impairment test. Refer to Note 2, “Significant Accounting Policies,” for a discussion of our adoption of ASU 2017-04, Simplifying the Test for Goodwill Impairment. We are required to test at least annually for impairment, or more frequently if adverse events or changes in circumstances indicate that the asset may be impaired. When testing goodwill for impairment, we may first assess qualitative factors, such as industry and market factors, cost factors, and changes in overall performance, to determine if it is more likely than not that the carrying value of a reporting unit exceeds its estimated fair value. If our qualitative assessment indicates that goodwill impairment is more likely than not, we perform additional quantitative analysis. We may also elect to skip the qualitative testing and proceed directly to the quantitative testing.
An impairment loss is measured as the excess of the carrying amount of the reporting unit, including goodwill, over the fair value of the reporting unit. We estimate the fair values of our reporting units using discounted cash flows. We apply our weighted average cost of capital (WACC) as the best estimate to discount future estimated cash flows to present value. The WACC is based on externally available data considering market participants’ cost of equity and debt, and capital structure. In addition, we apply a terminal growth rate that corresponds to the reporting unit’s long-term growth prospects.
In the discounted cash flow analyses, we must make assumptions about a wide variety of internal and external factors, and consider the price that would be received to sell the reporting unit as a whole in an orderly transaction between market participants at the measurement date. Significant assumptions include financial projections of free cash flow (including significant assumptions about operations, capital requirements and income taxes), long-term growth rates for determining terminal value beyond the discretely forecasted periods, and discount rates.
In the course of developing our restructuring and profitability improvement plan, discussed furtherMolina Medicaid Solutions Segment
As described in Note 11, “Restructuring and Separation Costs,” in the third quarter of 2017 we wrote off certain costs capitalized at our Molina Medicaid Solutions segment that supported our Health Plans segment provider information management processes to be re-designed. Although the intercompany revenues recorded by Molina Medicaid Solutions under this arrangement were insignificant on a consolidated basis, the termination of such revenue resulted in a triggering event for an interim goodwill impairment analysis of this segment in the third quarter of 2017. In the Molina Medicaid Solutions’ discounted cash flow model, we incorporated significant estimates and assumptions related to future periods, such as intercompany business support opportunities and prospects for new Medicaid management information systems contracts. Because management has determined that Molina Medicaid Solutions will provide fewer future benefits for its support of the Health Plans segment, the test resulted in a fair value less than Molina Medicaid Solutions’ carrying amount; therefore, we recorded a goodwill impairment loss for the difference, or $28 million, in the third quarter of 2017.
Other Segment
In the course of developing the Restructuring Plan in the second quarter of 2017, we determined that future benefits to be derived from our Pathways subsidiary, including the integration of its operations with our health plans,Health Plans segment, would be less than previously anticipated. In addition, poorer than expected year-to-date operating results, andas well as lower projections of operating results for periods in the near term at our Pathways subsidiary, led us to conclude that a triggering event for an interim impairment analysis had occurred in the second quarter of 2017.
In the third quarter of 2017, management determined that Pathways will not provide future benefits relating to the integration of its operations with the Health Plans segment to the extent previously expected. Therefore, we conducted an additional interim impairment analysis.
Intangible Assets.assets. We firstIn the second quarter of 2017, we evaluated Pathways’ finite-lived intangible assets (customer relationships and contract licenses) for impairment, using undiscounted cash flows expected over the longest remaining useful life of the assets tested. See below for a description of the estimates and assumptions used in the cash flow model. Because the undiscounted cash flows over the remaining useful life were less than Pathways’ carrying amount, the intangible assets were impaired. We recorded an impairment loss for the carrying amount of the intangible assets, or $11 million, in the second quarter of 2017.
Goodwill. We next tested Pathways’ goodwill for impairment. As describednoted above, we estimated Pathways’ fair value using discounted cash flows, incorporating significant estimates and assumptions related to future periods. Such estimates included anticipated client census which drives service revenue; management’s determination thatthe likelihood of future benefits to be derived from Pathways (including integration with our health plans) will be less than previously anticipated;; current prospects relating to the behavioral services labor market which drives cost of service revenue; and anticipated capital expenditures. In addition, we applied our weighted average costThe tests in each of capital (WACC) as the best estimate to discount future estimated cash flows to present value. The WACC was based on externally available data considering market participants’ cost of equitythree months ended June 30, 2017, and debt, and capital structure. We applied a terminal growth rate that corresponds to Pathways’ long-term growth prospects. The testSeptember 30, 2017, resulted in a fair value less than Pathways’ carrying amount; therefore, we recorded an
impairment loss for the difference, ordifference. The Pathways goodwill impairment losses amounted to $101 million in the third quarter of 2017, and $59 million in the second quarter of 2017. In addition to the Pathways impairment loss,second quarter of 2017, we also recorded ana goodwill impairment loss of $2 million for a separate subsidiary’s goodwillsubsidiary in the Other segment that did not pass theits impairment test. Both impairment losses were recorded to the Other segment, and reported as “Impairment losses” in the accompanying consolidated statements of operations.
There were no impairments of intangible assets or goodwill during 2016.
The goodwill impairment losses are recorded to the segments as indicated in following table, presentsand reported as “Impairment losses” in the balancesaccompanying consolidated statements of goodwill as of June 30, 2017 and December 31, 2016:operations.
| | | | Health Plans | | Molina Medicaid Solutions | | Other | | Total | Health Plans | | Molina Medicaid Solutions | | Other | | Total |
| | (In millions) | (In millions) |
| Historical goodwill | $ | 445 |
| | $ | 71 |
| | $ | 162 |
| | $ | 678 |
| $ | 445 |
| | $ | 71 |
| | $ | 162 |
| | $ | 678 |
|
| Accumulated impairment losses at December 31, 2016 | (58 | ) | | — |
| | — |
| | (58 | ) | (58 | ) | | — |
| | — |
| | (58 | ) |
| Balance, December 31, 2016 | 387 |
| | 71 |
| | 162 |
| | 620 |
| 387 |
| | 71 |
| | 162 |
| | 620 |
|
| Impairment losses | — |
| | — |
| | (61 | ) | | (61 | ) | |
| Balance, June 30, 2017 | $ | 387 |
| | $ | 71 |
| | $ | 101 |
| | $ | 559 |
| |
| Accumulated impairment losses at June 30, 2017 | $ | (58 | ) | | $ | — |
| | $ | (61 | ) | | $ | (119 | ) | |
| Impairment losses, three months ended June 30, 2017 | | — |
| | — |
| | (61 | ) | | (61 | ) |
| Impairment losses, three months ended September 30, 2017 | | — |
| | (28 | ) | | (101 | ) | | (129 | ) |
| Balance, September 30, 2017 | | $ | 387 |
| | $ | 43 |
| | $ | — |
| | $ | 430 |
|
| Accumulated impairment losses at September 30, 2017 | | $ | 58 |
| | $ | 28 |
| | $ | 162 |
| | $ | 248 |
|
11. Restructuring and Separation Costs
Following a management-initiated, broad operational assessment in early 2017, designed to improve our profitability and expand our core Medicaid business, in June 2017, we accelerated the implementation of a comprehensive restructuring and profitability improvement plan (the Restructuring Plan). Under the Restructuring Plan, we are taking the following actions:
| |
| 1. | We are streamlininghave streamlined our organizational structure, including the elimination of redundant layers of management, the consolidation of regional support services, and other reductions to our workforce, to improve efficiency as well as the speed and quality of our decision-making. |
| |
| 2. | We are re-designing core operating processes such as provider payment, utilization management, quality monitoring and improvement, and information technology to achieve more effective and cost efficient outcomes. |
| |
| 3. | We are remediating high cost provider contracts and building around high quality, cost-effective networks. |
| |
| 4. | We are restructuring our existing direct delivery operations. |
| |
| 5. | We are reviewing our vendor base to ensure that we are partnering with the lowest-cost, most-effective vendors. |
| |
| 6. | Throughout this process, we are taking precautions to ensure that our actions do not impede our ability to continue to deliver quality health care, retain existing managed care contracts, and to secure new managed care contracts. |
In addition to costs incurred under the Restructuring Plan, in the second quarter of 2017 we have recorded costs associated with the separation of our former CEO and former CFO, described in further detail below.
AllExpected Costs
We estimate that total pre-tax costs associated with the restructuring plan will be approximately $70 million to $90 million in the fourth quarter of 2017, with an additional $20 million to $40 million to be incurred in 2018. Since the initiation of our Restructuring Plan in the second quarter of 2017, the range of total estimated costs have increased by approximately $50 million due primarily to non-cash write-offs of certain capitalized software in connection with the re-design of core processes. Such write-offs were not included in our initial total cost estimates, but as our evaluation of core operating processes proceeded in the third quarter, we determined that certain projects were inconsistent with our future operating goals and separationwere therefore written off.
In addition, in the second quarter of 2017, we reported that we expected restructuring costs to relate only to the Health Plans and Other segments. In the third quarter of 2017, however, we wrote off certain costs capitalized at our Molina Medicaid Solutions segment that supported our Health Plans segment provider information management
processes to be re-designed. In addition, we now expect to incur consulting fees in connection with the review of Molina Medicaid Solutions’ core operating processes.
The following table illustrates our estimates of the total costs, by segment and major type of cost, that we expect to incur under the Restructuring Plan, and includes costs incurred inthrough September 30, 2017. We expect the six months ended June 30, 2017, are reported in “Restructuring and separation costs” inRestructuring Plan to be completed by the accompanying consolidated statementsend of 2018. |
| | | | | | | | | |
| Estimated Costs Expected to be Incurred by Reportable Segment | | Health Plans | | Molina Medicaid Solutions | | Other | | Total |
| | (In millions) |
| Termination benefits | | $30 to $35 | | — |
| | $30 to $35 | | $60 to $70 |
| Other restructuring costs | | $40 to $45 | | $10 | | $110 to $115 | | $160 to $170 |
| | $70 to $80 | | $10 | | $140 to $150 | | $220 to $240 |
Costs Incurred
Restructuring Plan
Restructuring costs incurred to date consist primarily of termination benefits, write-offs of capitalized software due to the re-design of our core operating processes, restructuring of our direct delivery operations, and are included in the Other segment because they represent corporate costs not allocated to the other reportable segments.consulting fees.
Separation Costs
Separation costs–ongoing benefit arrangements for former executives. We entered into amended and restatedOn May 2, 2017, we terminated the employment agreements withof our former CEO and former CFO in 2016. On May 2, 2017, their employment was terminated without cause. Under thetheir amended and restated employment agreements, they were each entitled to receive 400% of their base salary, a prorated termination bonus (150% of base salary for the former CEO and 125% of base salary for the former CFO), full vesting of equity compensation, and a cash payment for health and welfare benefits. During the second quarter of 2017, weWe recorded chargesseparation costs of $35 million for severance primarily related to these former executives.executives under FASB ASC Topic 712, Nonretirement and Postemployment Benefits. Of this total, $23 million related to the acceleration of their share-based compensation, as further discussed in Note 9, “Stockholders' Equity.” Employee separation costs were insignificant in 2016.
Restructuring and separation costs are reported in “Restructuring and separation costs” in the accompanying consolidated statements of operations. The following tables present the major types of such costs by segment. Long-lived assets include capitalized software, intangible assets and furniture, fixtures and equipment.
|
| | | | | | | | | | | | | | | | | | | | | | | |
| | Three Months Ended September 30, 2017 |
| | Separation Costs - Former Executives | | One-Time Termination Benefits | | Other Restructuring Costs | | Total |
| | | | Write-offs of Long-lived Assets | | Consulting Fees | | Contract Termination Costs | |
| | (In millions) |
| Health Plans | $ | — |
| | $ | 27 |
| | $ | 6 |
| | $ | — |
| | $ | — |
| | $ | 33 |
|
| Molina Medicaid Solutions | — |
| | — |
| | 8 |
| | — |
| | — |
| | 8 |
|
| Other | — |
| | 23 |
| | 35 |
| | 16 |
| | 3 |
| | 77 |
|
| | $ | — |
| | $ | 50 |
| | $ | 49 |
| | $ | 16 |
| | $ | 3 |
| | $ | 118 |
|
|
| | | | | | | | | | | | | | | | | | | | | | | |
| | Nine Months Ended September 30, 2017 |
| | Separation Costs - Former Executives | | One-Time Termination Benefits | | Other Restructuring Costs | | Total |
| | | | Write-offs of Long-lived Assets | | Consulting Fees | | Contract Termination Costs | |
| | (In millions) |
| Health Plans | $ | — |
| | $ | 27 |
| | $ | 6 |
| | $ | — |
| | $ | — |
| | $ | 33 |
|
| Molina Medicaid Solutions | — |
| | — |
| | 8 |
| | — |
| | — |
| | 8 |
|
| Other | 35 |
| | 23 |
| | 35 |
| | 24 |
| | 3 |
| | 120 |
|
| | $ | 35 |
| | $ | 50 |
| | $ | 49 |
| | $ | 24 |
| | $ | 3 |
| | $ | 161 |
|
Reconciliation of Liability
Separation costs–one-time benefit arrangement for workforce reduction. As partFor those restructuring and separation costs that require cash settlement (primarily separation costs, termination benefits and consulting fees), the following table presents a roll-forward of the Restructuring Plan, we are reducing our corporate and health plans workforce by approximately 10%, or 1,500 full-time-equivalent employees. This workforce rightsizing, which represents 7% of the total number of our employees, is expected to be completed by the end of 2017. Affected employees will be offered severance and outplacement assistance. Our board of
directors approved the reduction in our workforce under the Restructuring Plan effective July 27, 2017; as such no amounts were accrued for this termination plan as of June 30, 2017.
Other Restructuring Costs
In the six months ended June 30, 2017, we incurred approximately $8 million in other restructuring costs including primarily consulting fees relating to the operational assessment and restructuring initiatives described above.
The following table summarizes the year-to-date activities related to our Restructuring Plan, the reserve forliability, which is reported in “Accounts payable and accrued liabilities” in the accompanying consolidated balance sheets: |
| | | | | | | | | | | |
| | Separation Costs–Former Executives | | Other Restructuring Costs | | Total |
| | (In millions) |
| Accrued restructuring and separation costs as of December 31, 2016 | $ | — |
| | $ | — |
| | $ | — |
|
| Costs recognized | 35 |
| | 8 |
| | 43 |
|
| Cash payments | (1 | ) | | (2 | ) | | (3 | ) |
Other adjustments–acceleration of share-based compensation | (23 | ) | | — |
| | (23 | ) |
| Accrued restructuring and separation costs as of June 30, 2017 | $ | 11 |
| | $ | 6 |
| | $ | 17 |
|
Expected Costs
We estimate that total pre-tax costs associated with the Restructuring Plan will be approximately $130 million to $150 million for the second half of 2017, with an additional $40 million to be incurred in 2018. We expect these costs to relate only to the Health Plans and Other segments. Other restructuring costs will include primarily consulting fees; costs associated with the restructuring of our direct delivery operations including lease terminations and accelerated depreciation and amortization; and restructuring of various corporate business functions.
The following table illustrates our estimates of costs associated with the Restructuring Plan, which we expect to be completed by the end of 2018, by segment and major type of cost: |
| | | | | | |
Estimated Costs Expected to be Incurred by Reportable Segment | | Health Plans | | Other | | Total |
| | (In millions) |
Separation costs–one-time benefit arrangement for a workforce reduction | | $25 to $30 | | $35 to $40 | | $60 to $70 |
Other restructuring costs | | $55 to $60 | | $55 to $60 | | $110 to $120 |
| | $80 to $90 | | $90 to $100 | | $170 to $190 |
|
| | | | | | | | | | | | | | | |
| | Separation Costs - Former Executives | | One-Time Termination Benefits | | Other Restructuring Costs | | Total |
| | (In millions) |
| Accrued as of December 31, 2016 | $ | — |
| | $ | — |
| | $ | — |
| | $ | — |
|
| Charges | 12 |
| | 50 |
| | 27 |
| | 89 |
|
| Cash payments | (1 | ) | | (9 | ) | | (14 | ) | | (24 | ) |
| Accrued as of September 30, 2017 | $ | 11 |
| | $ | 41 |
| | $ | 13 |
| | $ | 65 |
|
12. Segment Information
We have three reportable segments. These segments consist of our Health Plans segment, which constitutes the vast majority of our operations; our Molina Medicaid Solutions segment; and our Other segment. Our reportable segments are consistent with how we currently manage the business and view the markets we serve.
Gross margin is the appropriate earnings measure for our reportable segments, based on how our chief operating decision maker currently reviews results, assesses performance, and allocates resources.
Gross margin for our Health Plans segment is referred to as “Medical margin,” and for our Molina Medicaid Solutions and Other segments, as “Service margin.” Medical margin represents the amount earned by the Health Plans segment after medical costs are deducted from premium revenue. The medical care ratio represents medical care costs as a percentage of premium revenue, and is one of the key metrics used to assess the performance of the Health Plans segment. Therefore, the underlying medical margin is the most important measure of earnings reviewed by the chief operating decision maker. The service margin is equal to service revenue minus cost of service revenue.
| | | | | Health Plans | | Molina Medicaid Solutions | | Other | | Consolidated | | Health Plans | | Molina Medicaid Solutions | | Other | | Consolidated |
| | | |
| | | (In millions) | | (In millions) |
| Three Months Ended June 30, 2017 | | | | | | | | | |
| Three Months Ended September 30, 2017 | | | | | | | | | |
Total revenue (1) | | $ | 4,868 |
| | $ | 47 |
| | $ | 84 |
| | $ | 4,999 |
| | $ | 4,899 |
| | $ | 47 |
| | $ | 85 |
| | $ | 5,031 |
|
| Gross margin | | 249 |
| | 4 |
| | 1 |
| | 254 |
| | 557 |
| | 5 |
| | 2 |
| | 564 |
|
| Impairment losses | | — |
| | — |
| | (72 | ) | | (72 | ) | | — |
| | (28 | ) | | (101 | ) | | (129 | ) |
| Restructuring and separation costs | | — |
| | — |
| | (43 | ) | | (43 | ) | | (33 | ) | | (8 | ) | | (77 | ) | | (118 | ) |
| | | | | | | | | | | | | | | | | |
| Six Months Ended June 30, 2017 | | | | | | | | | |
| Nine Months Ended September 30, 2017 | | | | | | | | | |
Total revenue (1) | | 9,639 |
| | 93 |
| | 171 |
| | 9,903 |
| | $ | 14,538 |
| | $ | 140 |
| | $ | 256 |
| | $ | 14,934 |
|
| Gross margin | | 786 |
| | 8 |
| | 6 |
| | 800 |
| | 1,343 |
| | 13 |
| | 8 |
| | 1,364 |
|
| Impairment losses | | — |
| | — |
| | (72 | ) | | (72 | ) | | — |
| | (28 | ) | | (173 | ) | | (201 | ) |
| Restructuring and separation costs | | — |
| | — |
| | (43 | ) | | (43 | ) | | (33 | ) | | (8 | ) | | (120 | ) | | (161 | ) |
| | | | | | | | | | | | | | | | | |
| Three Months Ended June 30, 2016 | | | | | | | | | |
| Three Months Ended September 30, 2016 | | | | | | | | | |
Total revenue (1) | | 4,223 |
| | 46 |
| | 90 |
| | 4,359 |
| | $ | 4,412 |
| | $ | 48 |
| | $ | 86 |
| | $ | 4,546 |
|
| Gross margin | | 435 |
| | 5 |
| | 14 |
| | 454 |
| | 443 |
| | 6 |
| | 8 |
| | 457 |
|
| Impairment losses | | — |
| | — |
| | — |
| | — |
| | — |
| | — |
| | — |
| | — |
|
| Restructuring and separation costs | | — |
| | — |
| | — |
| | — |
| | — |
| | — |
| | — |
| | — |
|
| | | | | | | | | | | | | | | | | |
| Six Months Ended June 30, 2016 | | | | | | | | | |
| Nine Months Ended September 30, 2016 | | | | | | | | | |
Total revenue (1) | | 8,424 |
| | 98 |
| | 180 |
| | 8,702 |
| | $ | 12,835 |
| | $ | 146 |
| | $ | 267 |
| | $ | 13,248 |
|
| Gross margin | | 842 |
| | 11 |
| | 21 |
| | 874 |
| | 1,285 |
| | 17 |
| | 29 |
| | 1,331 |
|
| Impairment losses | | — |
| | — |
| | — |
| | — |
| | — |
| | — |
| | — |
| | — |
|
| Restructuring and separation costs | | — |
| | — |
| | — |
| | — |
| | — |
| | — |
| | — |
| | — |
|
| | | | | | | | | | | | | | | | | |
| Total Assets | | | | | | | | | |
| June 30, 2017 | | 6,732 |
| | 240 |
| | 1,611 |
| | 8,583 |
| |
| Total assets | | | | | | | | | |
| September 30, 2017 | | | $ | 7,031 |
| | $ | 233 |
| | $ | 1,690 |
| | $ | 8,954 |
|
| December 31, 2016 | | 5,897 |
| | 267 |
| | 1,285 |
| | 7,449 |
| | 5,897 |
| | 267 |
| | 1,285 |
| | 7,449 |
|
| | | | | | | | | | | | | | | | | |
| Goodwill, and Intangible Assets, Net | | | | | | | | | |
| June 30, 2017 | | 498 |
| | 72 |
| | 101 |
| | 671 |
| |
| Goodwill and intangible assets, net | | | | | | | | | |
| September 30, 2017 | | | $ | 488 |
| | $ | 43 |
| | $ | — |
| | $ | 531 |
|
| December 31, 2016 | | 513 |
| | 72 |
| | 175 |
| | 760 |
| | 513 |
| | 72 |
| | 175 |
| | 760 |
|
______________________
| |
| (1) | Total revenue consists primarily of premium revenue, premium tax revenue and health insurer fee revenue for the Health Plans segment, and service revenue for the Molina Medicaid Solutions and Other segments. Inter-segment revenue is insignificant for all periods presented. |
The following table reconciles gross margin by segment to consolidated income before income tax expense: | | | | Three Months Ended June 30, | | Six Months Ended June 30, | Three Months Ended September 30, | | Nine Months Ended September 30, |
| | 2017 | | 2016 | | 2017 | | 2016 | 2017 | | 2016 | | 2017 | | 2016 |
| | (In millions) | (In millions) |
| Gross margin: | | | | | | | | | | | | | | |
| Health Plans | $ | 249 |
| | $ | 435 |
| | $ | 786 |
| | $ | 842 |
| $ | 557 |
| | $ | 443 |
| | $ | 1,343 |
| | $ | 1,285 |
|
| Molina Medicaid Solutions | 4 |
| | 5 |
| | 8 |
| | 11 |
| 5 |
| | 6 |
| | 13 |
| | 17 |
|
| Other | 1 |
| | 14 |
| | 6 |
| | 21 |
| 2 |
| | 8 |
| | 8 |
| | 29 |
|
| Total gross margin | 254 |
| | 454 |
| | 800 |
| | 874 |
| 564 |
| | 457 |
| | 1,364 |
| | 1,331 |
|
Add: other operating revenues (1) | 130 |
| | 195 |
| | 255 |
| | 403 |
| 124 |
| | 222 |
| | 379 |
| | 625 |
|
Less: other operating expenses (2) | (671 | ) | | (544 | ) | | (1,260 | ) | | (1,083 | ) | (769 | ) | | (561 | ) | | (2,029 | ) | | (1,644 | ) |
| Operating (loss) income | (287 | ) | | 105 |
| | (205 | ) | | 194 |
| (81 | ) | | 118 |
| | (286 | ) | | 312 |
|
| Other expenses (income), net | 27 |
| | 25 |
| | (22 | ) | | 50 |
| |
| Other expenses, net | | 32 |
| | 26 |
| | 10 |
| | 76 |
|
| (Loss) income before income taxes | $ | (314 | ) | | $ | 80 |
| | $ | (183 | ) | | $ | 144 |
| $ | (113 | ) | | $ | 92 |
| | $ | (296 | ) | | $ | 236 |
|
______________________
| |
| (1) | Other operating revenues include premium tax revenue, health insurer fee revenue, investment income and other revenue. |
| |
| (2) | Other operating expenses include general and administrative expenses, premium tax expenses, health insurer fee expenses, depreciation and amortization, impairment losses, and restructuring and separation costs. |
13. Commitments and Contingencies
Regulatory Capital Requirements and Dividend Restrictions
Our health plans, which are operated by our respective wholly owned subsidiaries in thosethe states in which our health plans operate, are subject to state laws and regulations that, among other things, require the maintenance of minimum levels of statutory capital, as defined by each state. Regulators in some states may also attempt to enforce capital requirements that require the retention of net worth in excess of amounts formally required by statute or regulation. Such statutes, regulations and informal capital requirements also restrict the timing, payment, and amount of dividends and other distributions that may be paid to us as the sole stockholder. To the extent our subsidiaries must comply with these regulations, they may not have the financial flexibility to transfer funds to us. Based on current statutes and regulations, the net assets in these subsidiaries (after intercompany eliminations) which may not be transferable to us in the form of loans, advances, or cash dividends was approximately $1,526$1,696 million at JuneSeptember 30, 2017, and $1,492 million at December 31, 2016. Because of the statutory restrictions that inhibit the ability of our health plans to transfer net assets to us, the amount of retained earnings readily available to pay dividends to our stockholders is generally limited to cash, cash equivalents and investments (excluding restricted investments) held by the parent company – Molina Healthcare, Inc. Such cash, cash equivalents and investments (excluding restricted investments) amounted to $165$391 million and $264 million as of JuneSeptember 30, 2017 and December 31, 2016, respectively.
The National Association of Insurance Commissioners (NAIC) adopted rules effective December 31, 1998, which, if implemented by the states, set minimum capitalization requirements for insurance companies, HMOs, and other entities bearing risk for health care coverage. The requirements take the form of risk-based capital (RBC) rules which may vary from state to state. All of the states in which our health plans operate, except California, Florida and New York, have adopted these rules. Such requirements, if adopted by California, Florida and New York, may increase the minimum capital required for those states.
As of JuneSeptember 30, 2017, our health plans had aggregate statutory capital and surplus of approximately $1,662$1,828 million compared with the required minimum aggregate statutory capital and surplus of approximately $1,118$1,113 million. Primarily as a result of the recognition of Marketplace-related premium deficiency reserves discussed in Note 2, “Significant Accounting Policies,” certainAll of our health plans did not meetwere in compliance with the minimum capital requirements on Juneat September 30, 2017. We intend to remedy the deficiencies to the satisfaction of our departments of insurance prior to the filing of the statutory financial statements on August 15, 2017. We have the ability, and have committed to provide, additional capital to each of our health plans as necessary to ensure compliance with statutory capital and surplus requirements.
Legal Proceedings
The health care and Medicaid-related business process outsourcing industries are subject to numerous laws and regulations of federal, state, and local governments. Compliance with these laws and regulations can be subject to government review and interpretation, as well as regulatory actions unknown and unasserted at this time. Penalties
associated with violations of these laws and regulations include significant fines, and penalties, exclusion from participating in publicly funded programs, and the repayment of previously billed and collected revenues.
We are involved in legal actions in the ordinary course of business, some of which seek monetary damages, including claims for punitive damages, which are not covered by insurance. We have accrued liabilities for certain matters for which we deem the loss to be both probable and estimable. Although we believe thatreasonably estimable, but the outcome of legal actions is inherently uncertain and our estimates of such losses are reasonable, these estimates could change as a result of further developments of these matters. The outcome of legal actions is inherently uncertain and suchFor certain pending matters, for which accruals have not been established because such matters have not progressed sufficiently through discovery, and/or development of important factual information and legal issues is insufficient to enable us to estimate a range of possible loss, if any. While it is not possible to accurately predict or determine the eventual outcomes of these items, anAn adverse determination in one or more of these pending matters could have a material adverse effect on our consolidated financial position, results of operations, or cash flows.
Marketplace Risk Corridor Program. On January 19, 2017, we filed suit against the United States of America in the United States Court of Federal Claims, Case Number 1:55-cv-01000-UNJ, on behalf of our health plans seeking recovery from the federal government of approximately $52 million in Marketplace risk corridor payments for calendar year 2015. Based upon current estimates, we believe our health plans are also owed approximately $76 million in Marketplace risk corridor payments from the federal government for calendar year 2016, and a further nominal amount for calendar year 2014. Our lawsuit seeks recovery of all of these unpaid amounts.2016. We have not recognized revenue, nor have we recorded a receivable, for any amount due from the federal government for unpaid Marketplace risk corridor payments as of JuneSeptember 30, 2017. We have fully recognized all liabilities due to the federal government that we have incurred under the Marketplace risk corridor program, and have paid all amounts due to the federal government as required.
Rodriguez v. Providence Community Corrections. On October 1, 2015, seven individuals, on behalf of themselves and all others similarly situated, filed a complaint in the District Court for the Middle District of Tennessee, Nashville Division, Case No. 3:15-cv-01048 (the Rodriquez Litigation), against Providence Community Corrections, Inc. (now known as Pathways Community Corrections, Inc., or PCC). Rutherford County, Tennessee formerly contracted with PCC for the administration of misdemeanor probation, which involved the collection of court costs and fees from probationers. The complaint alleges, among other things, that PCC illegally assessed fees and surcharges against probationers and made improper threats of arrest and probation revocation if the probationers did not pay such amounts. The plaintiffs in the Rodriguez Litigation seek alleged compensatory, treble, and punitive damages, plus attorneys’ fees, for alleged federal and state constitutional violations, as well as alleged violations of the Racketeer Influenced and Corrupt Organization Act. PCC’s agreement with Rutherford County terminated effective March 31, 2016. On November 1, 2015, one month after the Rodriguez Litigation commenced, we acquired PCC from The Providence Service Corporation (Providence) pursuant to a membership interest purchase agreement. In September 2016, the parties to the Rodriguez Litigation accepted a mediation proposal for settlement pursuant to which PCC and Rutherford County would pay the plaintiffs $14 million and $3 million, respectively. The parties are in the process of finalizing the settlement agreement. We expect to recover the full amount of the settlement under the indemnification provisions of the membership interest purchase agreement with Providence.
United States of America, ex rel., Anita Silingo v. Mobile Medical Examination Services, Inc., et al. On or around October 14, 2014, Molina Healthcare of California, Molina Healthcare of California Partner Plan, Inc., Mobile Medical Examination Services, Inc. (MedXM), and other health plan defendants were served with a Complaintcomplaint previously filed under seal in the Central District Court of California by Relator, Anita Silingo, Case No. SACV13-1348-FMO(SHx). The Complaintcomplaint alleges that MedXM improperly modified medical records and otherwise took inappropriate steps to increase members’ risk adjustment scores, and that the defendants, including Molina Healthcare of California and Molina Healthcare of California Partner Plan, Inc., purportedly turned a “blind eye” to these unlawful practices. On October 22, 2015, the Relator filed a third amended complaint, seeking general and compensatory damages, treble damages, civil penalties, plus interest and attorneys’ fees. On July 11, 2016, the District Court dismissed with prejudice the third amended complaint, without leave to amend. On September 23, 2016, the plaintiff filed an appeal with the Ninth Circuit Court of Appeals. The appeal has been fully briefed by the parties and we are awaiting the Court’s decision.
States’ Budgets
From time to time, the states in which our health plans operate may experience financial difficulties, which could lead to delays in premium payments. Until July 4, 2017, the state of Illinois operated without a budget for its current fiscal year. As of JuneSeptember 30, 2017, our Illinois health plan served approximately 163,000 members, and recognized premium revenue of approximately $310$447 million in the first half ofnine months ended September 30, 2017. As of July 28,September 30, 2017, the state of Illinois owed us approximately $116$220 million for certain March April, May and Junethrough September 2017 premiums.
On May 3, 2017, Puerto Rico’s financial oversight board filed for a form of bankruptcy in the U.S. District Court in Puerto Rico under Title III of PROMESA. The Title III provision allows for a court debt restructuring process similar to U.S. bankruptcy protection. To the extent such bankruptcy results in our failure to receive payment of amounts due under our Medicaid contract with the Commonwealth or the inability of the Commonwealth to extend our Medicaid contract at the end of its current term, such bankruptcy could have a material adverse effect on our business, financial condition, cash flows, or results of operations. As of JuneSeptember 30, 2017, the plan served approximately 322,000306,000 members and recorded premium revenue of approximately $362$553 million in the first half ofnine months ended September 30, 2017. As of July 28,October 27, 2017, the Commonwealth was current with its premium payments.
14. Related Party Transactions
Our California health plan has entered into a provider agreement with Pacific Healthcare IPA (Pacific), which is 50% owned by the brother-in-law of Dr. J. Mario Molina and John C. Molina, who are members of our board of directors. Under the terms of this provider agreement, the California health plan pays Pacific for medical care Pacific provides to health plan members. For the three and sixnine months ended JuneSeptember 30, 2017 and 2016, the amounts paid to Pacific were insignificant.
Refer to Note 15, “Variable Interest Entities (VIEs),” for a discussion of the Joseph M. Molina, M.D. Professional Corporations.
15. Variable Interest Entities (VIEs)
The Joseph M. Molina, M.D. Professional Corporations (JMMPC) were created to further advance our direct delivery business. On August 2,Effective September 30, 2017, we announcedterminated our relationship with JMMPC in Florida, Michigan, Washington, and Utah. Therefore, the agreements described below, for all of our health plans to restructure our direct delivery operations.other than those in California and New Mexico, were terminated effective September 30, 2017.
JMMPC’s primary shareholder is Dr. J. Mario Molina, who is a member of our board of directors. Dr. Molina is paid no salary and receives no dividends in connection with his work for, or ownership of, JMMPC. JMMPC provides primary care medical services through its employed physicians and other medical professionals. JMMPC also provides certain specialty referral services to our California health plan members through a contracted provider network. Substantially all of the individuals served by JMMPC are members of our California, Florida, New Mexico, Utah, and Washington health plans. TheseThe health plans had entered into primary care services agreements with JMMPC, under which the health plans paid $29 million and $31 million to JMMPC for health care services provided in the three months ended JuneSeptember 30, 2017 and 2016, respectively. Forrespectively, and $89 million and $92 million for the sixnine months ended JuneSeptember 30, 2017 and 2016, the health plans paid JMMPC $60 million and $61 million, respectively. JMMPC does not have agreements to provide professional medical services with any other entities.
Our wholly owned subsidiary, Molina Medical Management, Inc. (MMM), had also entered into services agreements with JMMPC to provide clinic facilities, clinic administrative support staff, patient scheduling services and medical supplies to JMMPC. The services agreements were designed such that JMMPC operated at break even, ensuring the availability of quality care and access for our health plan members. The services agreements further provided that the administrative fees charged to JMMPC by MMM were reviewed annually to assure the achievement of this goal. For each of the three months ended JuneSeptember 30, 2017 and 2016, JMMPC paid $12 million and $13 million to MMM for clinic administrative services.services, respectively. For the sixnine months ended JuneSeptember 30, 2017 and 2016, JMMPC paid $26$38 million and $27$40 million, respectively, to MMM for clinic administrative services.
As of JuneSeptember 30, 2017, we determined that JMMPC is a VIE, and that we are its primary beneficiary. We reached this conclusion under the power and benefits criterion model according to GAAP. Specifically, we had the power to direct the activities (excluding clinical decisions) that most significantly affected JMMPC’s economic performance, and the obligation to absorb losses or right to receive benefits that were potentially significant to the VIE, under the agreements described above. Because we were its primary beneficiary, we consolidated JMMPC. JMMPC’s assets may be used to settle only JMMPC’s obligations, and JMMPC’s creditors have no recourse to the general credit of
Molina Healthcare, Inc. As of JuneSeptember 30, 2017, JMMPC had total assets of $17$20 million, and total liabilities of $18$24 million. As of December 31, 2016, JMMPC had total assets of $18 million, and total liabilities of $18 million.
Our maximum exposure to loss as a result of our involvement with JMMPC wasis generally limited to the amounts needed to fund JMMPC’s ongoing payroll, employee benefits and medical care costs associated with JMMPC’s specialty referral activities.
16. Supplemental Condensed Consolidating Financial Information
The 5.375% Notes described in Note 7, “Debt,” are fully and unconditionally guaranteed by certain of our 100% owned subsidiaries on a joint and several basis, with certain exceptions considered customary for such guarantees. The 5.375% Notes and the guarantees are effectively subordinated to all of our and our guarantors’ existing and future secured debt to the extent of the assets securing such debt. In addition, the 5.375% Notes and the guarantees are structurally subordinated to all indebtedness and other liabilities and preferred stock, if any, of our subsidiaries that do not guarantee the 5.375% Notes.
As discussed in Note 7, “Debt,” the First Amendment to the Credit Facility provided that all guarantors immediately prior to January 3, 2017, other than Molina Information Systems, LLC, d/b/a Molina Medicaid Solutions, Molina Pathways, LLC, and Pathways Health and Community Support LLC, were automatically and unconditionally released from their obligations as guarantors under the Credit Facility and the 5.375% Notes.
The following condensed consolidating financial statements present Molina Healthcare, Inc. (as parent guarantor), the subsidiary guarantors, the subsidiary non-guarantors and eliminations, according to the guarantor structure as assessed at the most recent balance sheet date, JuneSeptember 30, 2017.
CONDENSED CONSOLIDATING STATEMENTS OF OPERATIONS
| | | | Three Months Ended June 30, 2017 | Three Months Ended September 30, 2017 |
| | Parent Guarantor | | Other Guarantors | | Non-Guarantors | | Eliminations | | Consolidated | Parent Guarantor | | Other Guarantors | | Non-Guarantors | | Eliminations | | Consolidated |
| | (In millions) | (In millions) |
| Revenue: | | | | | | | | | | | | | | | | | | |
| Total revenue | $ | 289 |
| | $ | 51 |
| | $ | 4,952 |
| | $ | (293 | ) | | $ | 4,999 |
| $ | 380 |
| | $ | 47 |
| | $ | 4,983 |
| | $ | (379 | ) | | $ | 5,031 |
|
| Expenses: | | | | | | | | | | | | | | | | | | |
| Medical care costs | 3 |
| | — |
| | 4,488 |
| | — |
| | 4,491 |
| 3 |
| | — |
| | 4,217 |
| | — |
| | 4,220 |
|
| Cost of service revenue | — |
| | 43 |
| | 81 |
| | — |
| | 124 |
| — |
| | 42 |
| | 81 |
| | — |
| | 123 |
|
| General and administrative expenses | 258 |
| | 7 |
| | 433 |
| | (293 | ) | | 405 |
| 244 |
| | (1 | ) | | 519 |
| | (379 | ) | | 383 |
|
| Premium tax expenses | — |
| | — |
| | 114 |
| | — |
| | 114 |
| — |
| | — |
| | 106 |
| | — |
| | 106 |
|
| Depreciation and amortization | 25 |
| | — |
| | 12 |
| | — |
| | 37 |
| 23 |
| | 1 |
| | 9 |
| | — |
| | 33 |
|
| Impairment losses | — |
| | — |
| | 72 |
| | — |
| | 72 |
| — |
| | 28 |
| | 101 |
| | — |
| | 129 |
|
| Restructuring and separation costs | 43 |
| | — |
| | — |
| | — |
| | 43 |
| 77 |
| | 8 |
| | 33 |
| | — |
| | 118 |
|
| Total operating expenses | 329 |
| | 50 |
| | 5,200 |
| | (293 | ) | | 5,286 |
| 347 |
| | 78 |
| | 5,066 |
| | (379 | ) | | 5,112 |
|
| Operating (loss) income | (40 | ) | | 1 |
| | (248 | ) | | — |
| | (287 | ) | |
| Operating income (loss) | | 33 |
| | (31 | ) | | (83 | ) | | — |
| | (81 | ) |
| Interest expense | 27 |
| | — |
| | — |
| | — |
| | 27 |
| 32 |
| | — |
| | — |
| | — |
| | 32 |
|
| (Loss) income before income taxes | (67 | ) | | 1 |
| | (248 | ) | | — |
| | (314 | ) | |
| Income tax benefit | (14 | ) | | — |
| | (70 | ) | | — |
| | (84 | ) | |
| Net (loss) income before equity in net losses of subsidiaries | (53 | ) | | 1 |
| | (178 | ) | | — |
| | (230 | ) | |
| Income (loss) before income taxes | | 1 |
| | (31 | ) | | (83 | ) | | — |
| | (113 | ) |
| Income tax expense (benefit) | | 9 |
| | (10 | ) | | (15 | ) | | — |
| | (16 | ) |
| Net loss before equity in net losses of subsidiaries | | (8 | ) | | (21 | ) | | (68 | ) | | — |
| | (97 | ) |
| Equity in net losses of subsidiaries | (177 | ) | | (64 | ) | | — |
| | 241 |
| | — |
| (89 | ) | | (77 | ) | | — |
| | 166 |
| | — |
|
| Net loss | $ | (230 | ) | | $ | (63 | ) | | $ | (178 | ) | | $ | 241 |
| | $ | (230 | ) | $ | (97 | ) | | $ | (98 | ) | | $ | (68 | ) | | $ | 166 |
| | $ | (97 | ) |
CONDENSED CONSOLIDATING STATEMENTS OF COMPREHENSIVE LOSS
| | | | Three Months Ended June 30, 2017 | Three Months Ended September 30, 2017 |
| | Parent Guarantor | | Other Guarantors | | Non-Guarantors | | Eliminations | | Consolidated | Parent Guarantor | | Other Guarantors | | Non-Guarantors | | Eliminations | | Consolidated |
| | (In millions) | (In millions) |
| Net loss | $ | (230 | ) | | $ | (63 | ) | | $ | (178 | ) | | $ | 241 |
| | $ | (230 | ) | $ | (97 | ) | | $ | (98 | ) | | $ | (68 | ) | | $ | 166 |
| | $ | (97 | ) |
| Other comprehensive loss, net of tax | — |
| | — |
| | — |
| | — |
| | — |
| — |
| | — |
| | — |
| | — |
| | — |
|
| Comprehensive loss | $ | (230 | ) | | $ | (63 | ) | | $ | (178 | ) | | $ | 241 |
| | $ | (230 | ) | $ | (97 | ) | | $ | (98 | ) | | $ | (68 | ) | | $ | 166 |
| | $ | (97 | ) |
CONDENSED CONSOLIDATING STATEMENTS OF INCOME
| | | | Three Months Ended June 30, 2016 | Three Months Ended September 30, 2016 |
| | Parent Guarantor | | Other Guarantors | | Non-Guarantors | | Eliminations | | Consolidated | Parent Guarantor | | Other Guarantors | | Non-Guarantors | | Eliminations | | Consolidated |
| | (In millions) | (In millions) |
| Revenue: | | | | | | | | | | | | | | | | | | |
| Total revenue | $ | 261 |
| | $ | 47 |
| | $ | 4,311 |
| | $ | (260 | ) | | $ | 4,359 |
| $ | 274 |
| | $ | 48 |
| | $ | 4,498 |
| | $ | (274 | ) | | $ | 4,546 |
|
| Expenses: | | | | | | | | | | | | | | | | | | |
| Medical care costs | 19 |
| | — |
| | 3,575 |
| | — |
| | 3,594 |
| 19 |
| | — |
| | 3,730 |
| | (1 | ) | | 3,748 |
|
| Cost of service revenue | — |
| | 23 |
| | 93 |
| | — |
| | 116 |
| — |
| | 42 |
| | 77 |
| | — |
| | 119 |
|
| General and administrative expenses | 219 |
| | 24 |
| | 368 |
| | (260 | ) | | 351 |
| 223 |
| | (4 | ) | | 397 |
| | (273 | ) | | 343 |
|
| Premium tax expenses | — |
| | — |
| | 109 |
| | — |
| | 109 |
| — |
| | — |
| | 127 |
| | — |
| | 127 |
|
| Health insurer fee expenses | — |
| | — |
| | 50 |
| | — |
| | 50 |
| — |
| | — |
| | 55 |
| | — |
| | 55 |
|
| Depreciation and amortization | 23 |
| | 1 |
| | 10 |
| | — |
| | 34 |
| 25 |
| | 2 |
| | 9 |
| | — |
| | 36 |
|
| Total operating expenses | 261 |
| | 48 |
| | 4,205 |
| | (260 | ) | | 4,254 |
| 267 |
| | 40 |
| | 4,395 |
| | (274 | ) | | 4,428 |
|
| Operating (loss) income | — |
| | (1 | ) | | 106 |
| | — |
| | 105 |
| |
| Operating income | | 7 |
| | 8 |
| | 103 |
| | — |
| | 118 |
|
| Interest expense | 25 |
| | — |
| | — |
| | — |
| | 25 |
| 26 |
| | — |
| | — |
| | — |
| | 26 |
|
| (Loss) income before income taxes | (25 | ) | | (1 | ) | | 106 |
| | — |
| | 80 |
| (19 | ) | | 8 |
| | 103 |
| | — |
| | 92 |
|
| Income tax (benefit) expense | (12 | ) | | (1 | ) | | 60 |
| | — |
| | 47 |
| |
| Income tax expense | | 4 |
| | — |
| | 46 |
| | — |
| | 50 |
|
| Net (loss) income before equity in net earnings of subsidiaries | (13 | ) | | — |
| | 46 |
| | — |
| | 33 |
| (23 | ) | | 8 |
| | 57 |
| | — |
| | 42 |
|
| Equity in net earnings of subsidiaries | 46 |
| | 1 |
| | — |
| | (47 | ) | | — |
| 65 |
| | — |
| | — |
| | (65 | ) | | — |
|
| Net income | $ | 33 |
| | $ | 1 |
| | $ | 46 |
| | $ | (47 | ) | | $ | 33 |
| $ | 42 |
| | $ | 8 |
| | $ | 57 |
| | $ | (65 | ) | | $ | 42 |
|
CONDENSED CONSOLIDATING STATEMENTS OF COMPREHENSIVE INCOME
| | | | Three Months Ended June 30, 2016 | Three Months Ended September 30, 2016 |
| | Parent Guarantor | | Other Guarantors | | Non-Guarantors | | Eliminations | | Consolidated | Parent Guarantor | | Other Guarantors | | Non-Guarantors | | Eliminations | | Consolidated |
| | | | | | | | | | | | | | | | | | | |
| | (In millions) | (In millions) |
| Net income | $ | 33 |
| | $ | 1 |
| | $ | 46 |
| | $ | (47 | ) | | $ | 33 |
| $ | 42 |
| | $ | 8 |
| | $ | 57 |
| | $ | (65 | ) | | $ | 42 |
|
| Other comprehensive income, net of tax | 2 |
| | — |
| | 2 |
| | (2 | ) | | 2 |
| |
| Other comprehensive loss, net of tax | | (1 | ) | | — |
| | (1 | ) | | 1 |
| | (1 | ) |
| Comprehensive income | $ | 35 |
| | $ | 1 |
| | $ | 48 |
| | $ | (49 | ) | | $ | 35 |
| $ | 41 |
| | $ | 8 |
| | $ | 56 |
| | $ | (64 | ) | | $ | 41 |
|
CONDENSED CONSOLIDATING STATEMENTS OF OPERATIONS
| | | | Six Months Ended June 30, 2017 | Nine Months Ended September 30, 2017 |
| | Parent Guarantor | | Other Guarantors | | Non-Guarantors | | Eliminations | | Consolidated | Parent Guarantor | | Other Guarantors | | Non-Guarantors | | Eliminations | | Consolidated |
| | (In millions) | (In millions) |
| Revenue: | | | | | | | | | | | | | | | | | | |
| Total revenue | $ | 630 |
| | $ | 99 |
| | $ | 9,809 |
| | $ | (635 | ) | | $ | 9,903 |
| $ | 1,010 |
| | $ | 146 |
| | $ | 14,792 |
| | $ | (1,014 | ) | | $ | 14,934 |
|
| Expenses: | | | | | | | | | | | | | | | | | | |
| Medical care costs | 7 |
| | — |
| | 8,595 |
| | — |
| | 8,602 |
| 10 |
| | — |
| | 12,812 |
| | — |
| | 12,822 |
|
| Cost of service revenue | — |
| | 85 |
| | 161 |
| | — |
| | 246 |
| — |
| | 127 |
| | 242 |
| | — |
| | 369 |
|
| General and administrative expenses | 555 |
| | 14 |
| | 910 |
| | (635 | ) | | 844 |
| 799 |
| | 13 |
| | 1,429 |
| | (1,014 | ) | | 1,227 |
|
| Premium tax expenses | — |
| | — |
| | 225 |
| | — |
| | 225 |
| — |
| | — |
| | 331 |
| | — |
| | 331 |
|
| Depreciation and amortization | 52 |
| | — |
| | 24 |
| | — |
| | 76 |
| 75 |
| | 1 |
| | 33 |
| | — |
| | 109 |
|
| Impairment losses | — |
| | — |
| | 72 |
| | — |
| | 72 |
| — |
| | 28 |
| | 173 |
| | — |
| | 201 |
|
| Restructuring and separation costs | 43 |
| | — |
| | — |
| | — |
| | 43 |
| 120 |
| | 8 |
| | 33 |
| | — |
| | 161 |
|
| Total operating expenses | 657 |
| | 99 |
| | 9,987 |
| | (635 | ) | | 10,108 |
| 1,004 |
| | 177 |
| | 15,053 |
| | (1,014 | ) | | 15,220 |
|
| Operating loss | (27 | ) | | — |
| | (178 | ) | | — |
| | (205 | ) | |
| Operating income (loss) | | 6 |
| | (31 | ) | | (261 | ) | | — |
| | (286 | ) |
| Interest expense | 53 |
| | — |
| | — |
| | — |
| | 53 |
| 85 |
| | — |
| | — |
| | — |
| | 85 |
|
| Other income, net | (75 | ) | | — |
| | — |
| | — |
| | (75 | ) | (75 | ) | | — |
| | — |
| | — |
| | (75 | ) |
| Loss before income taxes | (5 | ) | | — |
| | (178 | ) | | — |
| | (183 | ) | (4 | ) | | (31 | ) | | (261 | ) | | — |
| | (296 | ) |
| Income tax expense (benefit) | 17 |
| | — |
| | (47 | ) | | — |
| | (30 | ) | 26 |
| | (10 | ) | | (62 | ) | | — |
| | (46 | ) |
| Net loss before equity in net losses of subsidiaries | (22 | ) | | — |
| | (131 | ) | | — |
| | (153 | ) | (30 | ) | | (21 | ) | | (199 | ) | | — |
| | (250 | ) |
| Equity in net losses of subsidiaries | (131 | ) | | (66 | ) | | — |
| | 197 |
| | — |
| (220 | ) | | (143 | ) | | — |
| | 363 |
| | — |
|
| Net loss | $ | (153 | ) | | $ | (66 | ) | | $ | (131 | ) | | $ | 197 |
| | $ | (153 | ) | $ | (250 | ) | | $ | (164 | ) | | $ | (199 | ) | | $ | 363 |
| | $ | (250 | ) |
CONDENSED CONSOLIDATING STATEMENTS OF COMPREHENSIVE LOSS
| | | | Six Months Ended June 30, 2017 | Nine Months Ended September 30, 2017 |
| | Parent Guarantor | | Other Guarantors | | Non-Guarantors | | Eliminations | | Consolidated | Parent Guarantor | | Other Guarantors | | Non-Guarantors | | Eliminations | | Consolidated |
| | (In millions) | (In millions) |
| Net loss | $ | (153 | ) | | $ | (66 | ) | | $ | (131 | ) | | $ | 197 |
| | $ | (153 | ) | $ | (250 | ) | | $ | (164 | ) | | $ | (199 | ) | | $ | 363 |
| | $ | (250 | ) |
| Other comprehensive income, net of tax | 1 |
| | — |
| | 1 |
| | (1 | ) | | 1 |
| 1 |
| | — |
| | 1 |
| | (1 | ) | | 1 |
|
| Comprehensive loss | $ | (152 | ) | | $ | (66 | ) | | $ | (130 | ) | | $ | 196 |
| | $ | (152 | ) | $ | (249 | ) | | $ | (164 | ) | | $ | (198 | ) | | $ | 362 |
| | $ | (249 | ) |
CONDENSED CONSOLIDATING STATEMENTS OF INCOME
| | | | Six Months Ended June 30, 2016 | Nine Months Ended September 30, 2016 |
| | Parent Guarantor | | Other Guarantors | | Non-Guarantors | | Eliminations | | Consolidated | Parent Guarantor | | Other Guarantors | | Non-Guarantors | | Eliminations | | Consolidated |
| | (In millions) | (In millions) |
| Revenue: | | | | | | | | | | | | | | | | | | |
| Total revenue | $ | 512 |
| | $ | 99 |
| | $ | 8,601 |
| | $ | (510 | ) | | $ | 8,702 |
| $ | 786 |
| | $ | 147 |
| | $ | 13,099 |
| | $ | (784 | ) | | $ | 13,248 |
|
| Expenses: | | | | | | | | | | | | | | | | | | |
| Medical care costs | 31 |
| | — |
| | 7,151 |
| | — |
| | 7,182 |
| 50 |
| | — |
| | 10,881 |
| | (1 | ) | | 10,930 |
|
| Cost of service revenue | — |
| | 88 |
| | 155 |
| | — |
| | 243 |
| — |
| | 130 |
| | 232 |
| | — |
| | 362 |
|
| General and administrative expenses | 436 |
| | 9 |
| | 756 |
| | (510 | ) | | 691 |
| 659 |
| | 5 |
| | 1,153 |
| | (783 | ) | | 1,034 |
|
| Premium tax expenses | — |
| | — |
| | 218 |
| | — |
| | 218 |
| — |
| | — |
| | 345 |
| | — |
| | 345 |
|
| Health insurer fee expenses | — |
| | — |
| | 108 |
| | — |
| | 108 |
| — |
| | — |
| | 163 |
| | — |
| | 163 |
|
| Depreciation and amortization | 45 |
| | 3 |
| | 18 |
| | — |
| | 66 |
| 70 |
| | 5 |
| | 27 |
| | — |
| | 102 |
|
| Total operating expenses | 512 |
| | 100 |
| | 8,406 |
| | (510 | ) | | 8,508 |
| 779 |
| | 140 |
| | 12,801 |
| | (784 | ) | | 12,936 |
|
| Operating (loss) income | — |
| | (1 | ) | | 195 |
| | — |
| | 194 |
| |
| Operating income | | 7 |
| | 7 |
| | 298 |
| | — |
| | 312 |
|
| Interest expense | 50 |
| | — |
| | — |
| | — |
| | 50 |
| 76 |
| | — |
| | — |
| | — |
| | 76 |
|
| (Loss) income before income taxes | (50 | ) | | (1 | ) | | 195 |
| | — |
| | 144 |
| (69 | ) | | 7 |
| | 298 |
| | — |
| | 236 |
|
| Income tax (benefit) expense | (28 | ) | | (1 | ) | | 116 |
| | — |
| | 87 |
| (24 | ) | | (1 | ) | | 162 |
| | — |
| | 137 |
|
| Net (loss) income before equity in earnings of subsidiaries | (22 | ) | | — |
| | 79 |
| | — |
| | 57 |
| (45 | ) | | 8 |
| | 136 |
| | — |
| | 99 |
|
| Equity in net earnings of subsidiaries | 79 |
| | 3 |
| | — |
| | (82 | ) | | — |
| 144 |
| | 3 |
| | — |
| | (147 | ) | | — |
|
| Net income | $ | 57 |
| | $ | 3 |
| | $ | 79 |
| | $ | (82 | ) | | $ | 57 |
| $ | 99 |
| | $ | 11 |
| | $ | 136 |
| | $ | (147 | ) | | $ | 99 |
|
CONDENSED CONSOLIDATING STATEMENTS OF COMPREHENSIVE INCOME
| | | | Six Months Ended June 30, 2016 | Nine Months Ended September 30, 2016 |
| | Parent Guarantor | | Other Guarantors | | Non-Guarantors | | Eliminations | | Consolidated | Parent Guarantor | | Other Guarantors | | Non-Guarantors | | Eliminations | | Consolidated |
| | (In millions) | (In millions) |
| Net income | $ | 57 |
| | $ | 3 |
| | $ | 79 |
| | $ | (82 | ) | | $ | 57 |
| $ | 99 |
| | $ | 11 |
| | $ | 136 |
| | $ | (147 | ) | | $ | 99 |
|
| Other comprehensive income, net of tax | 8 |
| | — |
| | 7 |
| | (7 | ) | | 8 |
| 7 |
| | — |
| | 6 |
| | (6 | ) | | 7 |
|
| Comprehensive income | $ | 65 |
| | $ | 3 |
| | $ | 86 |
| | $ | (89 | ) | | $ | 65 |
| $ | 106 |
| | $ | 11 |
| | $ | 142 |
| | $ | (153 | ) | | $ | 106 |
|
CONDENSED CONSOLIDATING BALANCE SHEETS
| | | | June 30, 2017 | September 30, 2017 |
| | Parent Guarantor | | Other Guarantors | | Non-Guarantors | | Eliminations | | Consolidated | Parent Guarantor | | Other Guarantors | | Non-Guarantors | | Eliminations | | Consolidated |
| | (In millions) | (In millions) |
ASSETS | | Current assets: | | | | | | | | | | | | | | | | | | |
| Cash and cash equivalents | $ | 109 |
| | $ | 32 |
| | $ | 2,838 |
| | $ | — |
| | $ | 2,979 |
| $ | 356 |
| | $ | 58 |
| | $ | 3,520 |
| | $ | — |
| | $ | 3,934 |
|
| Investments | 56 |
| | — |
| | 2,136 |
| | — |
| | 2,192 |
| 35 |
| | — |
| | 1,752 |
| | — |
| | 1,787 |
|
| Restricted investments | 325 |
| | — |
| | — |
| | — |
| | 325 |
| 326 |
| | — |
| | — |
| | — |
| | 326 |
|
| Receivables | 2 |
| | 30 |
| | 974 |
| | — |
| | 1,006 |
| 2 |
| | 25 |
| | 975 |
| | — |
| | 1,002 |
|
| Income taxes refundable | 7 |
| | 1 |
| | 60 |
| | — |
| | 68 |
| 2 |
| | — |
| | 58 |
| | — |
| | 60 |
|
| Due from (to) affiliates | 137 |
| | (6 | ) | | (131 | ) | | — |
| | — |
| 203 |
| | (5 | ) | | (198 | ) | | — |
| | — |
|
| Prepaid expenses and other current assets | 70 |
| | 21 |
| | 68 |
| | — |
| | 159 |
| 65 |
| | 20 |
| | 89 |
| | — |
| | 174 |
|
| Derivative asset | 440 |
| | — |
| | — |
| | — |
| | 440 |
| 425 |
| | — |
| | — |
| | — |
| | 425 |
|
| Total current assets | 1,146 |
| | 78 |
| | 5,945 |
| | — |
| | 7,169 |
| 1,414 |
| | 98 |
| | 6,196 |
| | — |
| | 7,708 |
|
| Property, equipment, and capitalized software, net | 297 |
| | 47 |
| | 105 |
| | — |
| | 449 |
| 261 |
| | 37 |
| | 99 |
| | — |
| | 397 |
|
| Deferred contract costs | — |
| | 93 |
| | — |
| | — |
| | 93 |
| — |
| | 97 |
| | — |
| | — |
| | 97 |
|
| Goodwill and intangible assets, net | 56 |
| | 72 |
| | 543 |
| | — |
| | 671 |
| 55 |
| | 43 |
| | 433 |
| | — |
| | 531 |
|
| Restricted investments | — |
| | — |
| | 118 |
| | — |
| | 118 |
| — |
| | — |
| | 117 |
| | — |
| | 117 |
|
| Investment in subsidiaries, net | 2,597 |
| | 181 |
| | — |
| | (2,778 | ) | | — |
| 2,625 |
| | 95 |
| | — |
| | (2,720 | ) | | — |
|
| Deferred income taxes | 10 |
| | (43 | ) | | 79 |
| | (10 | ) | | 36 |
| 10 |
| | — |
| | 96 |
| | (44 | ) | | 62 |
|
| Other assets | 55 |
| | 2 |
| | 6 |
| | (16 | ) | | 47 |
| 50 |
| | 2 |
| | 6 |
| | (16 | ) | | 42 |
|
| | $ | 4,161 |
| | $ | 430 |
| | $ | 6,796 |
| | $ | (2,804 | ) | | $ | 8,583 |
| $ | 4,415 |
| | $ | 372 |
| | $ | 6,947 |
| | $ | (2,780 | ) | | $ | 8,954 |
|
| | | | | | | | | | | | | | | | | | | |
LIABILITIES AND STOCKHOLDERS’ EQUITY | | Current liabilities: | | | | | | | | | | | | | | | | | | |
| Medical claims and benefits payable | $ | — |
| | $ | — |
| | $ | 2,077 |
| | $ | — |
| | $ | 2,077 |
| $ | — |
| | $ | — |
| | $ | 2,478 |
| | $ | — |
| | $ | 2,478 |
|
| Amounts due government agencies | — |
| | — |
| | 1,844 |
| | — |
| | 1,844 |
| — |
| | — |
| | 1,324 |
| | — |
| | 1,324 |
|
| Accounts payable and accrued liabilities | 170 |
| | 35 |
| | 170 |
| | — |
| | 375 |
| 227 |
| | 40 |
| | 218 |
| | — |
| | 485 |
|
| Deferred revenue | — |
| | 49 |
| | 235 |
| | — |
| | 284 |
| — |
| | 52 |
| | 416 |
| | — |
| | 468 |
|
| Current portion of long-term debt | 773 |
| | — |
| | — |
| | — |
| | 773 |
| 782 |
| | — |
| | — |
| | — |
| | 782 |
|
| Derivative liability | 440 |
| | — |
| | — |
| | — |
| | 440 |
| 425 |
| | — |
| | — |
| | — |
| | 425 |
|
| Total current liabilities | 1,383 |
| | 84 |
| | 4,326 |
| | — |
| | 5,793 |
| 1,434 |
| | 92 |
| | 4,436 |
| | — |
| | 5,962 |
|
| Long-term debt | 1,215 |
| | — |
| | 16 |
| | (16 | ) | | 1,215 |
| 1,515 |
| | — |
| | 16 |
| | (16 | ) | | 1,515 |
|
| Deferred income taxes | 10 |
| | — |
| | — |
| | (10 | ) | | — |
| 12 |
| | 32 |
| | — |
| | (44 | ) | | — |
|
| Other long-term liabilities | 32 |
| | 1 |
| | 21 |
| | — |
| | 54 |
| 25 |
| | 1 |
| | 22 |
| | — |
| | 48 |
|
| Total liabilities | 2,640 |
| | 85 |
| | 4,363 |
| | (26 | ) | | 7,062 |
| 2,986 |
| | 125 |
| | 4,474 |
| | (60 | ) | | 7,525 |
|
| Total stockholders’ equity | 1,521 |
| | 345 |
| | 2,433 |
| | (2,778 | ) | | 1,521 |
| 1,429 |
| | 247 |
| | 2,473 |
| | (2,720 | ) | | 1,429 |
|
| | $ | 4,161 |
| | $ | 430 |
| | $ | 6,796 |
| | $ | (2,804 | ) | | $ | 8,583 |
| $ | 4,415 |
| | $ | 372 |
| | $ | 6,947 |
| | $ | (2,780 | ) | | $ | 8,954 |
|
CONDENSED CONSOLIDATING BALANCE SHEETS
|
| | | | | | | | | | | | | | | | | | | |
| | December 31, 2016 |
| | Parent Guarantor | | Other Guarantors | | Non-Guarantors | | Eliminations | | Consolidated |
| | (In millions) |
| ASSETS |
| Current assets: | | | | | | | | | |
| Cash and cash equivalents | $ | 86 |
| | $ | 6 |
| | $ | 2,727 |
| | $ | — |
| | $ | 2,819 |
|
| Investments | 178 |
| | — |
| | 1,580 |
| | — |
| | 1,758 |
|
| Receivables | 2 |
| | 34 |
| | 938 |
| | — |
| | 974 |
|
| Income tax refundable | 17 |
| | 4 |
| | 18 |
| | — |
| | 39 |
|
| Due from (to) affiliates | 104 |
| | (5 | ) | | (99 | ) | | — |
| | — |
|
| Prepaid expenses and other current assets | 58 |
| | 30 |
| | 43 |
| | — |
| | 131 |
|
| Derivative asset | 267 |
| | — |
| | — |
| | — |
| | 267 |
|
| Total current assets | 712 |
| | 69 |
| | 5,207 |
| | — |
| | 5,988 |
|
| Property, equipment, and capitalized software, net | 301 |
| | 46 |
| | 107 |
| | — |
| | 454 |
|
| Deferred contract costs | — |
| | 86 |
| | — |
| | — |
| | 86 |
|
| Goodwill and intangible assets, net | 58 |
| | 73 |
| | 629 |
| | — |
| | 760 |
|
| Restricted investments | — |
| | — |
| | 110 |
| | — |
| | 110 |
|
| Investment in subsidiaries, net | 2,609 |
| | 246 |
| | — |
| | (2,855 | ) | | — |
|
| Deferred income taxes | 10 |
| | — |
| | — |
| | — |
| | 10 |
|
| Other assets | 48 |
| | 3 |
| | 6 |
| | (16 | ) | | 41 |
|
| | $ | 3,738 |
| | $ | 523 |
| | $ | 6,059 |
| | $ | (2,871 | ) | | $ | 7,449 |
|
| | | | | | | | | | |
| LIABILITIES AND STOCKHOLDERS’ EQUITY |
| Current liabilities: | | | | | | | | | |
| Medical claims and benefits payable | $ | 1 |
| | $ | — |
| | $ | 1,928 |
| | $ | — |
| | $ | 1,929 |
|
| Amounts due government agencies | — |
| | — |
| | 1,202 |
| | — |
| | 1,202 |
|
| Accounts payable and accrued liabilities | 146 |
| | 34 |
| | 205 |
| | — |
| | 385 |
|
| Deferred revenue | — |
| | 40 |
| | 275 |
| | — |
| | 315 |
|
| Current portion of long-term debt | 472 |
| | — |
| | — |
| | — |
| | 472 |
|
| Derivative liability | 267 |
| | — |
| | — |
| | — |
| | 267 |
|
| Total current liabilities | 886 |
| | 74 |
| | 3,610 |
| | — |
| | 4,570 |
|
| Long-term debt | 1,173 |
| | — |
| | 16 |
| | (16 | ) | | 1,173 |
|
| Deferred income taxes | 11 |
| | 39 |
| | (35 | ) | | — |
| | 15 |
|
| Other long-term liabilities | 19 |
| | 1 |
| | 22 |
| | — |
| | 42 |
|
| Total liabilities | 2,089 |
| | 114 |
| | 3,613 |
| | (16 | ) | | 5,800 |
|
| Total stockholders’ equity | 1,649 |
| | 409 |
| | 2,446 |
| | (2,855 | ) | | 1,649 |
|
| | $ | 3,738 |
| | $ | 523 |
| | $ | 6,059 |
| | $ | (2,871 | ) | | $ | 7,449 |
|
CONDENSED CONSOLIDATING STATEMENTS OF CASH FLOWS
| | | | Six Months Ended June 30, 2017 | Nine Months Ended September 30, 2017 |
| | Parent Guarantor | | Other Guarantors | | Non-Guarantors | | Eliminations | | Consolidated | Parent Guarantor | | Other Guarantors | | Non-Guarantors | | Eliminations | | Consolidated |
| | (In millions) | (In millions) |
| Operating activities: | | | | | | | | | | | | | | | | | | |
| Net cash provided by operating activities | $ | 90 |
| | $ | 44 |
| | $ | 538 |
| | $ | — |
| | $ | 672 |
| $ | 215 |
| | $ | 81 |
| | $ | 661 |
| | $ | — |
| | $ | 957 |
|
| Investing activities: | | | | | | | | | | | | | | | | | | |
| Purchases of investments | (330 | ) | | — |
| | (1,306 | ) | | — |
| | (1,636 | ) | (333 | ) | | — |
| | (1,563 | ) | | — |
| | (1,896 | ) |
| Proceeds from sales and maturities of investments | 127 |
| | — |
| | 747 |
| | — |
| | 874 |
| 150 |
| | — |
| | 1,388 |
| | — |
| | 1,538 |
|
| Purchases of property, equipment and capitalized software | (45 | ) | | (9 | ) | | (6 | ) | | — |
| | (60 | ) | (67 | ) | | (10 | ) | | (8 | ) | | — |
| | (85 | ) |
| Increase in restricted investments held-to-maturity | — |
| | — |
| | (10 | ) | | — |
| | (10 | ) | — |
| | — |
| | (10 | ) | | — |
| | (10 | ) |
| Capital contributions to/from subsidiaries | (238 | ) | | 2 |
| | 236 |
| | — |
| | — |
| (363 | ) | | 2 |
| | 361 |
| | — |
| | — |
|
| Dividends to/from subsidiaries | 120 |
| | — |
| | (120 | ) | | — |
| | — |
| 136 |
| | — |
| | (136 | ) | | — |
| | — |
|
| Change in amounts due to/from affiliates | (34 | ) | | 2 |
| | 32 |
| | — |
| | — |
| (100 | ) | | — |
| | 100 |
| | — |
| | — |
|
| Other, net | — |
| | (13 | ) | | — |
| | — |
| | (13 | ) | — |
| | (21 | ) | | — |
| | — |
| | (21 | ) |
| Net cash used in investing activities | (400 | ) | | (18 | ) | | (427 | ) | | — |
| | (845 | ) | |
| Net cash (used in) provided by investing activities | | (577 | ) | | (29 | ) | | 132 |
| | — |
| | (474 | ) |
| Financing activities: | | | | | | | | | | | | | | | | | | |
| Proceeds from senior notes offerings, net of issuance costs | 325 |
| | — |
| | — |
| | — |
| | 325 |
| |
| Proceeds from senior notes offering, net of issuance costs | | 325 |
| | — |
| | — |
| | — |
| | 325 |
|
| Proceeds from borrowings under credit facility | | 300 |
| | — |
| | — |
| | — |
| | 300 |
|
| Proceeds from employee stock plans | 11 |
| | — |
| | — |
| | — |
| | 11 |
| 11 |
| | — |
| | — |
| | — |
| | 11 |
|
| Other, net | (3 | ) | | — |
| | — |
| | — |
| | (3 | ) | (4 | ) | | — |
| | — |
| | — |
| | (4 | ) |
| Net cash provided by financing activities | 333 |
| | — |
| | — |
| | — |
| | 333 |
| 632 |
| | — |
| | — |
| | — |
| | 632 |
|
| Net increase in cash and cash equivalents | 23 |
| | 26 |
| | 111 |
| | — |
| | 160 |
| 270 |
| | 52 |
| | 793 |
| | — |
| | 1,115 |
|
| Cash and cash equivalents at beginning of period | 86 |
| | 6 |
| | 2,727 |
| | — |
| | 2,819 |
| 86 |
| | 6 |
| | 2,727 |
| | — |
| | 2,819 |
|
| Cash and cash equivalents at end of period | $ | 109 |
| | $ | 32 |
| | $ | 2,838 |
| | $ | — |
| | $ | 2,979 |
| $ | 356 |
| | $ | 58 |
| | $ | 3,520 |
| | $ | — |
| | $ | 3,934 |
|
CONDENSED CONSOLIDATING STATEMENTS OF CASH FLOWS
| | | | Six Months Ended June 30, 2016 | Nine Months Ended September 30, 2016 |
| | Parent Guarantor | | Other Guarantors | | Non-Guarantors | | Eliminations | | Consolidated | Parent Guarantor | | Other Guarantors | | Non-Guarantors | | Eliminations | | Consolidated |
| | (In millions) | (In millions) |
| Operating activities: | | | | | | | | | | | | | | | | | | |
| Net cash (used in) provided by operating activities | $ | (21 | ) | | $ | 20 |
| | $ | 279 |
| | $ | — |
| | $ | 278 |
| |
| Net cash provided by operating activities | | $ | 43 |
| | $ | 34 |
| | $ | 556 |
| | $ | — |
| | $ | 633 |
|
| Investing activities: | | | | | | | | | | | | | | | | | | |
| Purchases of investments | (67 | ) | | — |
| | (907 | ) | | — |
| | (974 | ) | (114 | ) | | — |
| | (1,330 | ) | | — |
| | (1,444 | ) |
| Proceeds from sales and maturities of investments | 67 |
| | — |
| | 745 |
| | — |
| | 812 |
| 103 |
| | — |
| | 1,409 |
| | — |
| | 1,512 |
|
| Purchases of property, equipment and capitalized software | (73 | ) | | (19 | ) | | (10 | ) | | — |
| | (102 | ) | (102 | ) | | (23 | ) | | (18 | ) | | — |
| | (143 | ) |
| Decrease in restricted investments held-to-maturity | — |
| | — |
| | 5 |
| | — |
| | 5 |
| — |
| | — |
| | 4 |
| | — |
| | 4 |
|
| Net cash paid in business combinations | — |
| | (1 | ) | | (7 | ) | | — |
| | (8 | ) | — |
| | (5 | ) | | (43 | ) | | — |
| | (48 | ) |
| Capital contributions to/from subsidiaries | (106 | ) | | 2 |
| | 104 |
| | — |
| | — |
| (221 | ) | | 7 |
| | 214 |
| | — |
| | — |
|
| Dividends to/from subsidiaries | 50 |
| | — |
| | (50 | ) | | — |
| | — |
| 50 |
| | — |
| | (50 | ) | | — |
| | — |
|
| Change in amounts due to/from affiliates | (13 | ) | | 2 |
| | 11 |
| | — |
| | — |
| (12 | ) | | 4 |
| | 8 |
| | — |
| | — |
|
| Other, net | 5 |
| | (12 | ) | | 1 |
| | — |
| | (6 | ) | 6 |
| | (19 | ) | | 1 |
| | — |
| | (12 | ) |
| Net cash used in investing activities | (137 | ) | | (28 | ) | | (108 | ) | | — |
| | (273 | ) | |
| Net cash (used in) provided by investing activities | | (290 | ) | | (36 | ) | | 195 |
| | — |
| | (131 | ) |
| Financing activities: | | | | | | | | | | | | | �� | | | | | |
Proceeds from employee stock plans
| 10 |
| | — |
| | — |
| | — |
| | 10 |
| 10 |
| | — |
| | — |
| | — |
| | 10 |
|
| Other, net | 2 |
| | — |
| | (1 | ) | | — |
| | 1 |
| 2 |
| | — |
| | (1 | ) | | — |
| | 1 |
|
| Net cash provided by (used in) financing activities | 12 |
| | — |
| | (1 | ) | | — |
| | 11 |
| 12 |
| | — |
| | (1 | ) | | — |
| | 11 |
|
| Net (decrease) increase in cash and cash equivalents | (146 | ) | | (8 | ) | | 170 |
| | — |
| | 16 |
| (235 | ) | | (2 | ) | | 750 |
| | — |
| | 513 |
|
| Cash and cash equivalents at beginning of period | 360 |
| | 13 |
| | 1,956 |
| | — |
| | 2,329 |
| 360 |
| | 13 |
| | 1,956 |
| | — |
| | 2,329 |
|
| Cash and cash equivalents at end of period | $ | 214 |
| | $ | 5 |
| | $ | 2,126 |
| | $ | — |
| | $ | 2,345 |
| $ | 125 |
| | $ | 11 |
| | $ | 2,706 |
| | $ | — |
| | $ | 2,842 |
|
MANAGEMENT’S DISCUSSION AND ANALYSIS OF FINANCIAL CONDITION AND RESULTS OF OPERATIONS (MD&A)
FORWARD LOOKINGFORWARD-LOOKING STATEMENTS
This quarterly report on Form 10-Q contains forward-looking statements regarding our business, financial condition, and results of operations within the meaning of Section 27A of the Securities Act of 1933, or Securities Act, and Section 21E of the Securities Exchange Act of 1934, or Securities Exchange Act. We intend such forward-looking statements to be covered by the safe harbor provisions for forward-looking statements contained in the Private Securities Litigation Reform Act of 1995, and we are including this statement for purposes of complying with these safe harbor provisions. All statements, other than statements of historical facts, included in this quarterly report may be deemed to be forward-looking statements for purposes of the Securities Act and the Securities Exchange Act. Without limiting the foregoing, we use the words “anticipate(s),” “believe(s),” “estimate(s),” “expect(s),” “intend(s),” “may,” “plan(s),” “project(s),” “will,” “would,” “could,” “should” and similar expressions to identify forward-looking statements, although not all forward-looking statements contain these identifying words. We cannot guarantee that we will actually achieve the plans, intentions, or expectations disclosed in our forward-looking statements and, accordingly, you should not place undue reliance on our forward-looking statements. There are a number of important factors that could cause actual results or events to differ materially from the forward-looking statements that we make. You should read these factors and the other cautionary statements as being applicable to all related forward-looking statements wherever they appear in this quarterly report. We caution you that we do not undertake any obligation to update forward-looking statements made by us. Forward-looking statements involve known and unknown risks and uncertainties that may cause our actual results in future periods to differ materially from those projected, estimated, expected, or contemplated. Those known risks and uncertainties include, but are not limited to, the following:
the success of the Restructuring Plan,our previously announced restructuring plan, including the timing and amounts of the benefits realized;
the numerous political and market-based uncertainties associated with the Affordable Care Act (the “ACA”) or “Obamacare,” including any potential repeal and replacement of the law, amendment of the law, or move to state block grants for Medicaid;
the market dynamics surrounding the ACA Marketplaces, including but not limited to uncertainties associated with risk transfer requirements, the potential for disproportionate enrollment of higher acuity members, the withdrawaldiscontinuation of cost sharing subsidies and/or premium tax credits, the adequacy of agreed rates, and potential disruption associated with market withdrawal;withdrawal from Utah, Wisconsin, or other states;
subsequent adjustments to reported premium revenue based upon subsequent developments or new information, including changes to estimated amounts payable or receivable related to Marketplace risk adjustment/risk transfer, risk corridors, and reinsurance;
effective management of our medical costs;
our ability to predict with a reasonable degree of accuracy utilization rates, including utilization rates associated with seasonal flu patterns or other newly emergent diseases;
significant budget pressures on state governments and their potential inability to maintain current rates, to implement expected rate increases, or to maintain existing benefit packages or membership eligibility thresholds or criteria, including the payment of all amounts due to our Illinois health plan following the resolution of the Illinois budget impasse;
the success of our efforts to retain existing governmentmanaged care contracts, including those in Florida, Illinois, New Mexico, Puerto Rico, and Texas, and to obtain new government contracts in connection with state requests for proposals (RFPs) in both existing and new states;
any adverse impact resulting from the significant changes to our executive leadership team and the rightsizing of our workforce;
the impact of our decision to exit the Utah and Wisconsin ACA Marketplace markets effective December 31, 2017;
our ability to manage our operations, including maintaining and creating adequate internal systems and controls relating to authorizations, approvals, provider payments, and the overall success of our care management initiatives;
our ability to consummate and realize benefits from acquisitions or divestitures;
our receipt of adequate premium rates to support increasing pharmacy costs, including costs associated with specialty drugs and costs resulting from formulary changes that allow the option of higher-priced non-generic drugs;
our ability to operate profitably in an environment where the trend in premium rate increases lags behind the trend in increasing medical costs;
the interpretation and implementation of federal or state medical cost expenditure floors, administrative cost and profit ceilings, premium stabilization programs, profit sharing arrangements, and risk adjustment provisions;
our estimates of amounts owed for such cost expenditure floors, administrative cost and profit ceilings, premium stabilization programs, profit-sharing arrangements, and risk adjustment provisions;
the Medicaid expansion cost corridors in California, New Mexico, and Washington, and any other retroactive adjustment to revenue where methodologies and procedures are subject to interpretation or dependent upon information about the health status of participants other than Molina members;
the interpretation and implementation of at-risk premium rules and state contract performance requirements regarding the achievement of certain quality measures, and our ability to recognize revenue amounts associated therewith;
cyber-attacks or other privacy or data security incidents resulting in an inadvertent unauthorized disclosure of protected health information;
the success of our health plan in Puerto Rico, including the resolution of the Puerto Rico debt crisis, payment of all amounts due under our Medicaid contract, the effect of the PROMESA law, the impact of Hurricane Maria and our efforts to better manage the health care costs of our Puerto Rico health plan;
the success and renewal of our duals demonstration programs in California, Illinois, Michigan, Ohio, South Carolina, and Texas;
the accurate estimation of incurred but not reported or paid medical costs across our health plans;
efforts by states to recoup previously paid and recognized premium amounts;
the continuation and renewal of the government contracts of our health plans, Molina Medicaid Solutions, and Pathways, and the terms under which such contracts are renewed;
complications, member confusion, or enrollment backlogs related to the annual renewal of Medicaid coverage;
government audits and reviews, or potential investigations, and any fine, sanction, enrollment freeze, monitoring program, or premium recovery that may result therefrom, including any potential demand by the state of New Mexico to recover purportedly underpaid premium taxes;
changes with respect to our provider contracts and the loss of providers;
approval by state regulators of dividends and distributions by our health plan subsidiaries;
changes in funding under our contracts as a result of regulatory changes, programmatic adjustments, or other reforms;
high dollar claims related to catastrophic illness;
the favorable resolution of litigation, arbitration, or administrative proceedings;
the relatively small number of states in which we operate health plans;
the availability of adequate financing on acceptable terms to fund and capitalize our expansion and growth, repay our outstanding indebtedness at maturity and meet our liquidity needs, including the interest expense and other costs associated with such financing;
our failure to comply with the financial or other covenants in our credit agreement or the indentures governing our outstanding notes;
the sufficiency of our funds on hand to pay the amounts due upon conversion or maturity of our outstanding notes;
the failure of a state in which we operate to renew its federal Medicaid waiver;
changes generally affecting the managed care or Medicaid management information systems industries;
increases in government surcharges, taxes, and assessments, including but not limited to the deductibility of certain compensation costs;
newly emergent viruses or widespread epidemics, public catastrophes or terrorist attacks, and associated public alarm; and
increasing competition and consolidation in the Medicaid industry;
InvestorsReaders should refer to the section entitled “Risk Factors” in each of our Annual Report on Form 10-K for the year ended December 31, 2016, our Quarterly ReportReports on Form 10-Q for the quarterquarters ended March 31, 2017 and June 30, 2017, and this Quarterly Report on Form 10-Q, for a discussion of certain risk factors that could materially affect our business, financial condition, cash flows, or results of operations. Given these risks and uncertainties, we can give no assurance that any results or events projected or contemplated by our forward-looking statements will in fact occur.
This documentquarterly report and the following discussion of our financial condition and results of operations should be read in conjunction with the accompanying consolidated financial statements and the notes to those statements appearing elsewhere in this report, and the audited financial statements and Management’s Discussion and Analysis appearing in our Annual Report on Form 10-K for the year ended December 31, 2016.
ABOUT MOLINA HEALTHCARE
OUR MISSION IS TO PROVIDE QUALITY HEALTHCARE TO PEOPLE RECEIVING GOVERNMENT ASSISTANCE.
Molina Healthcare, Inc. provides quality managed health care to people receiving government assistance. We offer cost-effective Medicaid-related solutions to meet the health care needs of low-income families and individuals, and to assist government agencies in their administration of the Medicaid program. We have three reportable segments. These segments consist of our Health Plans segment, which constitutes the vast majority of our operations; our Molina Medicaid Solutions segment; and our Other segment.
OUR GOAL IS TO ACHIEVE OUR MISSION WHILE IMPROVING THE FINANCIAL STRENGTH OF OUR ORGANIZATION.
KEY PERFORMANCE INDICATORS
Non-GAAP Financial Measures
We use non-GAAP financial measures as supplemental metrics in evaluating our financial performance, making financing and business decisions, and forecasting and planning for future periods. For these reasons, management believes such measures are useful supplemental measures to investors in comparing our performance to the performance of other public companies in the health care industry. These non-GAAP financial measures should be considered as supplements to, and not as substitutes for or superior to, GAAP measures.
See further information regarding non-GAAP measures in the “Supplemental Information” section of this MD&A, including the reconciliations to U.S. GAAP. Non-GAAP financial measures referred to in this report are designated with an asterisk (*).
| | | | Three Months Ended June 30, | | Six Months Ended June 30, | Three Months Ended September 30, | | Nine Months Ended September 30, |
| | 2017 | | 2016 | | 2017 | | 2016 | 2017 | | 2016 | | 2017 | | 2016 |
| | (Dollar amounts in millions, except per-share amounts) | (Dollar amounts in millions, except per-share amounts) |
| Net (loss) income | $ | (230 | ) | | $ | 33 |
| | $ | (153 | ) | | $ | 57 |
| $ | (97 | ) | | $ | 42 |
| | $ | (250 | ) | | $ | 99 |
|
| Net (loss) income per diluted share | $ | (4.10 | ) | | $ | 0.58 |
| | $ | (2.74 | ) | | $ | 1.01 |
| $ | (1.70 | ) | | $ | 0.76 |
| | $ | (4.44 | ) | | $ | 1.77 |
|
MCR (1) | 94.8 | % | | 89.2 | % | | 91.6 | % | | 89.5 | % | 88.3 | % | | 89.4 | % | | 90.5 | % | | 89.5 | % |
G&A ratio (2) | 8.1 | % | | 8.1 | % | | 8.5 | % | | 7.9 | % | 7.6 | % | | 7.6 | % | | 8.2 | % | | 7.8 | % |
Premium tax ratio (1) | 2.4 | % | | 2.6 | % | | 2.3 | % | | 2.6 | % | 2.2 | % | | 2.9 | % | | 2.3 | % | | 2.7 | % |
| Effective tax rate | 26.8 | % | | 59.8 | % | | 16.0 | % | | 60.7 | % | 14.6 | % | | 54.0 | % | | 15.5 | % | | 58.0 | % |
Net profit margin (2) | (4.6 | )% | | 0.7 | % | | (1.5 | )% | | 0.7 | % | (1.9 | )% | | 0.9 | % | | (1.7 | )% | | 0.7 | % |
| EBITDA* | $ | (243 | ) | | $ | 144 |
| | $ | (40 | ) | | $ | 270 |
| $ | (42 | ) | | $ | 160 |
| | $ | (82 | ) | | $ | 430 |
|
| Adjusted net (loss) income* | $ | (225 | ) | | $ | 38 |
| | $ | (142 | ) | | $ | 67 |
| $ | (93 | ) | | $ | 47 |
| | $ | (235 | ) | | $ | 114 |
|
| Adjusted net (loss) income per diluted share* | $ | (4.01 | ) | | $ | 0.67 |
| | $ | (2.55 | ) | | $ | 1.18 |
| $ | (1.62 | ) | | $ | 0.85 |
| | $ | (4.17 | ) | | $ | 2.03 |
|
________________________
| |
| (1) | MCR represents medical care costs as a percentage of premium revenue; premium tax ratio represents premium tax expenses as a percentage of premium revenue plus premium tax revenue. |
| |
| (2) | G&A ratio represents general and administrative expenses as a percentage of total revenue. Net profit margin represents net income as a percentage of total revenue. |
CONSOLIDATED RESULTS
Three Months Ended JuneSeptember 30, 2017 Compared with Three Months Ended JuneSeptember 30, 20172016
Net loss per diluted share was $4.10 in$1.70 for the secondthird quarter of 2017 compared with net income per diluted share of $0.58$0.76 reported for the secondthird quarter of 2016. Adjusted net loss per diluted share* was $4.01$1.62 in the secondthird quarter of 2017, compared with adjusted net income per diluted shareshare* of $0.67$0.85 in the secondthird quarter of 2016. Loss before income tax benefit for the secondthird quarter of 2017 was $314$113 million.
Certain significant items contributed $330 million
Medical care costs measured as a percentage of premium revenue (the “medical care ratio”) declined to the loss before income tax benefit. See further discussion of these items88.3% in the table below,third quarter of 2017 from 89.4% in “Health Plans—Financial Performance by Program,”the third quarter of 2016 and “Other Consolidated Information.”
The medical care ratio increased to from 94.8% in the second quarter of 2017. Improved medical cost performance in the third quarter of 2017 compared to 89.2%was the result of:
| |
| ◦ | Improved sequential performance at our Illinois, New Mexico, Ohio, Puerto Rico, Texas, and Washington health plans, exclusive of the Marketplace program. |
| |
| ◦ | Improved performance of our Marketplace program, including a reduction to the premium deficiency reserve of $30 million ($0.33 per diluted share, net of tax). The reserve, which was $100 million at June 30, 2017, decreased to $70 million as of September 30, 2017. |
General and administrative costs, measured as a percentage of total revenue (the “administrative cost ratio”), were 7.6% in the third quarter of 2017, consistent with the third quarter of 2016, and 50 basis points lower than the second quarter of 2017. Excluding Marketplace broker commission and exchange fees, the administrative cost ratio decreased 30 basis points from the third quarter of 2016. See further discussion below
Restructuring costs and the impairment of certain purchased intangible assets increased loss before income tax benefit in “Reportable Segments—Health Plans—Financial Overview.”the third quarter of 2017 by approximately $247 million. Specifically:
We recorded $118 million ($1.39 per diluted share, net of tax) of restructuring costs in the third quarter of 2017. Restructuring costs incurred to date consist primarily of termination benefits, write-offs of capitalized software due to the re-design of our core operating processes, restructuring of our direct delivery operations, and consulting fees.
We recorded $129 million ($1.77 per diluted share, net of tax) in non-cash goodwill impairment losses for our Pathways behavioral health subsidiary and our Molina Medicaid Solutions (MMS) segment. In the third quarter of 2017, management determined that neither business will provide future benefits relating to the integration of their operations with the Health Plans segment to the extent previously expected.
The following table below summarizes the impact of certain items significant to our financial performance in the significant items:periods presented.
|
| | | | | | | | | | | | | | | |
| Summary of Significant Items Affecting 2017 Financial Results |
| | Three Months Ended | | Six Months Ended |
| | June 30, 2017 | | June 30, 2017 |
| | (In millions, except per diluted share amounts) |
| | Amount | | Per Diluted Share (1) | | Amount | | Per Diluted Share (1) |
| Impairment losses | $ | 72 |
| | $ | 1.01 |
| | $ | 72 |
| | $ | 1.02 |
|
| Losses at behavioral health subsidiary exclusive of impairment | 8 |
| | 0.09 |
| | 12 |
| | 0.14 |
|
| Medical care costs related to prior year service dates that were in excess of historical expectations | 85 |
| | 0.95 |
| | 74 |
| | 0.84 |
|
| Marketplace adjustments related to risk transfer, cost sharing subsidies, and other items for 2016 service dates | 44 |
| | 0.49 |
| | 47 |
| | 0.53 |
|
| Marketplace premium deficiency reserve for 2017 service dates | 78 |
| | 0.87 |
| | 70 |
| | 0.79 |
|
| Restructuring and separation costs | 43 |
| | 0.68 |
| | 43 |
| | 0.68 |
|
| Termination fee received for Terminated Medicare acquisition | — |
| | — |
| | (75 | ) | | (0.84 | ) |
| | $ | 330 |
| | $ | 4.09 |
| | $ | 243 |
| | $ | 3.16 |
|
|
| | | | | | | | | | | | | | | |
| Summary of Significant Items Affecting 2017 Financial Results |
| | Three Months Ended | | Nine Months Ended |
| | September 30, 2017 | | September 30, 2017 |
| | (In millions, except per diluted share amounts) |
| | Amount | | Per Diluted Share (1) | | Amount | | Per Diluted Share (1) |
| Restructuring and separation costs | $ | 118 |
| | $ | 1.39 |
| | $ | 161 |
| | $ | 1.92 |
|
| Impairment losses | 129 |
| | 1.77 |
| | 201 |
| | 2.77 |
|
| Change in Marketplace premium deficiency reserve for 2017 service dates | (30 | ) | | (0.33 | ) | | 40 |
| | 0.45 |
|
| Termination fee received for terminated Medicare acquisition | — |
| | — |
| | (75 | ) | | (0.84 | ) |
| | $ | 217 |
| | $ | 2.83 |
| | $ | 327 |
| | $ | 4.30 |
|
________________________
| |
| (1) | Except for certain items that are not deductible for tax purposes, per diluted share amounts are generally calculated at our statutory income tax rate of 37%, which is in excess of the effective tax rate recorded in our consolidated statements of operations. |
Certain significant items increased loss
Marketplace Cost Share Reduction (CSR) Update
Our third quarter results do not include any potential impact from the October 12, 2017, direction to Centers for Medicare and Medicaid Services (CMS) from Acting Department of Health and Human Services Secretary Hargan to cease payment of Marketplace CSR subsidies. At September 30, 2017, we had a total of approximately $220 million in excess CSR subsidies, recorded as a payable to CMS. This payable represents the extent to which payments received by us from CMS exceeded our estimate of the actual cost of member subsidies incurred by us through September 30, 2017.
We expect to incur approximately $85 million in unreimbursed expense associated with the cessation of CSR subsidies in the fourth quarter of 2017. It has been the practice of CMS to perform a reconciliation on an annual
basis of CSR subsidies paid to all health plans against the actual costs incurred by the health plans. Were such a reconciliation to be performed for the full calendar year of 2017—consistent with past practice—we would be able to offset nearly all of the $85 million expense incurred in the fourth quarter against the excess amounts received prior to September 30, 2017. However, should CMS transition to a nine month reconciliation period ending September 30, 2017—the last month for which CSR subsidies have been paid—the absence of CSR subsidy reimbursement would reduce income before income tax benefit in the second quarter of 2017expense by approximately $330 million. Specifically:
We recorded $72 million in non-cash impairment losses for goodwill and intangibles, primarily relating to our Pathways subsidiary. In the course of developing our restructuring and profitability improvement plan, we determined that future benefits to be derived from Pathways (including integration with our health plans) will be less than previously anticipated. While such impairment losses have a short-term impact on profitability, there is no impact to our cash flows. Pathways experienced operating losses of $8 million for the quarter ended June 30, 2017 and $12 million for the six months ended June 30, 2017.
Medical care costs related to 2016 service dates were significantly in excess of what the Company usually experiences for out-of-period claims development, particularly at the Florida, Illinois, New Mexico, and Puerto Rico health plans. In total, we experienced out-of-period claims development that was approximately $85 million higher than expected at December 31, 2016.
We recorded $44 million for Marketplace changes in estimates, including risk transfer and cost sharing subsidies, related to 2016 service dates. Liabilities for risk transfer payments and cost sharing subsidies that were estimated at December 31, 2016 were finalized during the secondfourth quarter of 2017.
Loss before income tax benefit increased by $78 million as a result of an increase to the premium deficiency reserve established for the Marketplace program. The reserve, which was $22 million at March 31, 2017, increased to $100 million as of June 30, 2017. Based upon revenue and cost trends observed in the second quarter of 2017, we now believe that Marketplace performance in the second half of 2017 will fall substantially short of previous expectations. Marketplace performance has been most disappointing in Florida, Utah, Washington, and Wisconsin.
We recorded $43 million in restructuring and separation costs in the second quarter of 2017 related primarily to contractually required termination benefits paid to our former chief executive officer and chief financial officer. Also included in these costs are consulting fees incurred for the development and implementation of our corporate restructuring initiatives. See below in “Liquidity and Financial Condition—Future Sources and Uses of Liquidity,” and Notes to Consolidated Financial Statements, Note 11, “Restructuring and Separation Costs,” for further information.
SixNine Months ended JuneSeptember 30, 2017 Compared with SixNine Months Ended JuneSeptember 30, 2016
Net loss per diluted share was $2.74$4.44 in the first half ofnine months ended September 30, 2017 compared with net income per diluted share of $1.01$1.77 reported for the first half ofnine months ended September 30, 2016. Adjusted net loss per diluted share* was $2.55$4.17 in the first half ofnine months ended September 30, 2017, compared with adjusted net income per diluted share* of $1.18$2.03 in the first half ofnine months ended September 30, 2016. Loss before income tax benefit for the first half ofnine months ended September 30, 2017 was $153$296 million. These resultsResults for the nine months ended September 30, 2017, were affected by several out-of-period adjustments asthe significant items presented in the table, and as further described, above. In total, these adjustments increased pretax loss in the first half ofnine months ended September 30, 2017 by $243 million.
$327 million.
RESTRUCTURING AND PROFIT IMPROVEMENT PLAN UPDATE
As a resultpreviously disclosed, we estimate that our restructuring plan will reduce annualized run-rate expenses by approximately $300 million to $400 million when completed by the end of our poor operating performance and catalyzed by our change2018. We have already achieved $200 million of these run-rate reductions on an annualized basis, which will take full effect no later than January 1, 2018. Our third quarter results include approximately $10 million of these reductions. All savings targets discussed in management, we accelerated the implementation of a comprehensive restructuring and profitability improvement plan (the Restructuring Plan). Under the Restructuring Plan, we are taking the following actions:
| |
1. | We are streamlining our organizational structure, including the elimination of redundant layers of management, the consolidation of regional support services, and other reductions to our workforce, to improve efficiency as well as the speed and quality of our decision-making. |
| |
2. | We are re-designing core operating processes such as provider payment, utilization management, quality monitoring and improvement, and information technology to achieve more effective and cost efficient outcomes. |
| |
3. | We are remediating high cost provider contracts and building around high quality, cost-effective networks. |
| |
4. | We are restructuring our existing direct delivery operations.
|
| |
5. | We are reviewing our vendor base to ensure that we are partnering with the lowest-cost, most-effective vendors. |
| |
6. | Throughout this process, we are taking precautions to ensure that our actions do not impede our ability to continue to deliver quality health care, retain existing managed care contracts, and to secure new managed care contracts. |
ACTION PLAN—2018 MARKETPLACE PERFORMANCE
In additionregards to the Restructuring Plan,restructuring plan represent annualized run-rate savings that we are taking these further stepsexpect to improve profitabilityachieve during the year following the indicated implementation date. We expect one-time costs associated with the restructuring plan to exceed the benefits realized in 2018:2017 due to the upfront payment of implementation costs and the delayed benefit of full savings until the beginning of 2018.
| |
1. | We are exiting the Utah and Wisconsin ACA Marketplaces effective December 31, 2017. For the three months ended June 30, 2017, these two health plans reported a total of $127 million in Marketplace premium revenue (16% of consolidated Marketplace premium revenue), and a combined Marketplace medical care ratio of 128%. |
| |
2. | In our remaining Marketplace plans, we are increasing 2018 premiums by 55%. The increase takes into account the absence of cost sharing reduction subsidies. Had we assumed that cost sharing reduction subsidies would be funded for 2018, the premium increase would have been 30%. |
| |
3. | We are also reducing the scope of our 2018 participation in the Washington Marketplace. |
| |
4. | We continue to closely monitor the current political and programmatic developments pertaining to our 2018 participation in other Marketplace states, and subject to those developments, will withdraw from 2018 participation as may be necessary. |
TRENDS AND UNCERTAINTIES
ACA and the Marketplace
The future of the Affordable Care Act (ACA) and its underlying programs, including the Marketplace, are subject to substantial uncertainty. We continuehave taken the following steps in regards to advocate for federal policies to stabilizeour participation in the ACA Marketplace program.in 2018:
| |
| 1. | As previously announced, we will exit the Utah and Wisconsin ACA Marketplaces effective December 31, 2017. |
| |
| 2. | In our remaining Marketplace plans, we are increasing 2018 premiums by 55% to take into account the absence of cost sharing reduction (CSR) subsidies and other risks related to ACA Marketplace uncertainties. |
| |
| 3. | We have reduced the scope of our 2018 participation in the state of Washington Marketplace. |
| |
| 4. | We continue to monitor the current political and programmatic developments pertaining to the ACA Marketplace. |
Medicaid Contract Re-Procurement
The following table illustrates Health Plans segment Medicaid contracts scheduled for re-procurement in the near term. While we have been notified of the Medicaid regulators’ intention to re-procure the contracts, the anticipated award dates and effective dates are management’s current best estimates. Suchestimates; such dates are subject to change and, in some cases, not yet known to us.change. Premium revenue is stated in millions.
| | | | | | | Premium Revenue | | | | | Premium Revenue | |
| | | Membership as of | | Six Months Ended | | Anticipated | | Membership as of | | Nine Months Ended | | Anticipated |
| State Health Plan | | Medicaid Program(s) | | June 30, 2017 | | June 30, 2017 | | Award Date | | Effective Date | | Medicaid Program(s) | | September 30, 2017 | | September 30, 2017 | | Award Date | | Effective Date |
| Florida | | All | | 359,000 |
| | $ | 726 |
| | Q1 2018 | | 1/1/2019 | | All | | 355,000 |
| | $ | 1,105 |
| | Q2 2018 | | 1/1/2019 |
| Illinois | | All | | 159,000 |
| | 259 |
| | Q3 2017 | | 1/1/2018 | |
| New Mexico | | All | | 234,000 |
| | 605 |
| | Q1 2018 | | 1/1/2019 | | All | | 225,000 |
| | 893 |
| | Q1 2018 | | 1/1/2019 |
| Puerto Rico | | All | | 322,000 |
| | 362 |
| | Q1 2018 | | 7/1/2018 | |
| Texas | | All | | 191,000 |
| | 920 |
| | Q3 2018 | | 9/1/2019 | | ABD | | 87,000 |
| | 1,065 |
| | Q3 2018 | | 9/1/2019 |
| Texas | | CHIP | | 25,000 |
| | 21 |
| | Q4 2017 | | 9/1/2018 | | CHIP | | 24,000 |
| | 31 |
| | Q4 2017 | | 9/1/2018 |
Illinois Health Plan. In August 2017, Molina Healthcare of Illinois, Inc. was awarded a statewide Medicaid managed care contract by the Illinois Department of Healthcare and Family Services. This Medicaid contract further integrates behavioral health and physical health by combining the State’s three current managed care programs into one program. The contract begins January 1, 2018, for four years with options to renew annually for up to four additional years.
Washington Health Plan. As discussed in Notes to Consolidated Financial Statements, Note 1, “Basis of Presentation,” inIn May 2017, Molina Healthcare of Washington, Inc. was selected by the Washington State Health Care Authority to negotiate and enter into managed care contracts for the North Central region of the state’s Apple Health Integrated Managed Care Program. The start date for the new contract is scheduled for January 1, 2018.
REPORTABLE SEGMENTS
How We Assess Performance
We derive our revenues primarily from health insurance premiums, and our primary customers are state Medicaid agencies and the federal government.
One of the key metrics used to assess the performance of our most significant segment, the Health Plans segment, is the medical care ratio, or MCR. The medical care ratio represents medical care costs as a percentage of premium revenue. Therefore, the underlying gross margin, or the amount earned by the Health Plans segment after medical costs are deducted from premium revenue, is the most important measure of earnings reviewed by management.
Gross margin for our Health Plans segment is referred to as “Medical margin,” and for our Molina Medicaid Solutions and Other segments, as “Service margin.” The service margin is equal to service revenue minus cost of service revenue. Management’s discussion and analysis of the changes in the individual components of gross
margin, by reportable segment, is presented in the “Health Plans—Financial Overview,” “Molina Medicaid Solutions—Financial Overview,” and “Other—Financial Overview” sections respectively, of this MD&A.
SEGMENT SUMMARY
| | | | Three Months Ended June 30, | | Six Months Ended June 30, | Three Months Ended September 30, | | Nine Months Ended September 30, |
| | 2017 | | 2016 | | 2017 | | 2016 | 2017 | | 2016 | | 2017 | | 2016 |
| | (In millions) | (In millions) |
| Segment gross margin: | | | | | | | | | | | | | | |
Health Plans medical margin (1) | $ | 249 |
| | $ | 435 |
| | $ | 786 |
| | $ | 842 |
| $ | 557 |
| | $ | 443 |
| | $ | 1,343 |
| | $ | 1,285 |
|
Molina Medicaid Solutions service margin (2) | 4 |
| | 5 |
| | 8 |
| | 11 |
| 5 |
| | 6 |
| | 13 |
| | 17 |
|
Other (2) | 1 |
| | 14 |
| | 6 |
| | 21 |
| 2 |
| | 8 |
| | 8 |
| | 29 |
|
| Total segment gross margin | 254 |
| | 454 |
| | 800 |
| | 874 |
| 564 |
| | 457 |
| | 1,364 |
| | 1,331 |
|
Other operating revenues (3) | 130 |
| | 195 |
| | 255 |
| | 403 |
| 124 |
| | 222 |
| | 379 |
| | 625 |
|
Other operating expenses (4) | (671 | ) | | (544 | ) | | (1,260 | ) | | (1,083 | ) | (769 | ) | | (561 | ) | | (2,029 | ) | | (1,644 | ) |
| Operating (loss) income | (287 | ) | | 105 |
| | (205 | ) | | 194 |
| (81 | ) | | 118 |
| | (286 | ) | | 312 |
|
| Other expenses (income), net | 27 |
| | 25 |
| | (22 | ) | | 50 |
| |
| Other expenses, net | | 32 |
| | 26 |
| | 10 |
| | 76 |
|
| (Loss) income before income tax expense | (314 | ) | | 80 |
| | (183 | ) | | 144 |
| (113 | ) | | 92 |
| | (296 | ) | | 236 |
|
| Income tax (benefit) expense | (84 | ) | | 47 |
| | (30 | ) | | 87 |
| (16 | ) | | 50 |
| | (46 | ) | | 137 |
|
| Net (loss) income | $ | (230 | ) | | $ | 33 |
| | $ | (153 | ) | | 57 | $ | (97 | ) | | $ | 42 |
| | $ | (250 | ) | | 99 |
_______________________
| |
| (1) | Represents premium revenue minus medical care costs. |
| |
| (2) | Represents service revenue minus cost of service revenue. |
| |
| (3) | Other operating revenues include premium tax revenue, health insurer fee revenue, investment income and other revenue. |
| |
| (4) | Other operating expenses include general and administrative expenses, premium tax expenses, health insurer fee expenses, depreciation and amortization, impairment losses, and restructuring and separation costs. |
HEALTH PLANS
The Health Plans segment consists of health plans operating in 12 states and the Commonwealth of Puerto Rico, and includes our direct delivery business.Rico. As of JuneSeptember 30, 2017, these health plans served approximately 4.74.5 million members eligible for Medicaid, Medicare, and other government-sponsored health care programs for low-income families and individuals. This membership includes Affordable Care Act Marketplace (Marketplace) members, most of whom receive government premium subsidies.
BUSINESS OVERVIEW
Recent Developments — Health Plans Segment
Refer to Notes to Consolidated Financial Statements, Note 1, “Basis of Presentation.”
Health Plans Membership
The following tables set forth our Health Plans membership as of the dates indicated: | | | | June 30,
2017 | | December 31,
2016 | | June 30,
2016 | September 30,
2017 | | December 31,
2016 | | September 30,
2016 |
| Ending Membership by Program: | | | | | | | | | | |
| Temporary Assistance for Needy Families (TANF) and Children’s Health Insurance Program (CHIP) | 2,517,000 |
| | 2,536,000 |
| | 2,500,000 |
| 2,451,000 |
| | 2,536,000 |
| | 2,529,000 |
|
| Marketplace | 949,000 |
| | 526,000 |
| | 597,000 |
| 877,000 |
| | 526,000 |
| | 568,000 |
|
| Medicaid Expansion | 678,000 |
| | 673,000 |
| | 654,000 |
| 662,000 |
| | 673,000 |
| | 658,000 |
|
| Aged, Blind or Disabled (ABD) | 408,000 |
| | 396,000 |
| | 387,000 |
| 411,000 |
| | 396,000 |
| | 395,000 |
|
Medicare-Medicaid Plan (MMP) – Integrated (1) | 54,000 |
| | 51,000 |
| | 51,000 |
| 58,000 |
| | 51,000 |
| | 51,000 |
|
| Medicare Special Needs Plans (Medicare) | 44,000 |
| | 45,000 |
| | 44,000 |
| 44,000 |
| | 45,000 |
| | 45,000 |
|
| | 4,650,000 |
| | 4,227,000 |
| | 4,233,000 |
| 4,503,000 |
| | 4,227,000 |
| | 4,246,000 |
|
| Ending Membership by Health Plan: | | | | | | | | | | |
| California | 766,000 |
| | 683,000 |
| | 680,000 |
| 751,000 |
| | 683,000 |
| | 683,000 |
|
| Florida | 672,000 |
| | 553,000 |
| | 565,000 |
| 641,000 |
| | 553,000 |
| | 563,000 |
|
| Illinois | 163,000 |
| | 195,000 |
| | 201,000 |
| 163,000 |
| | 195,000 |
| | 195,000 |
|
| Michigan | 414,000 |
| | 391,000 |
| | 393,000 |
| 399,000 |
| | 391,000 |
| | 387,000 |
|
| New Mexico | 266,000 |
| | 254,000 |
| | 251,000 |
| 256,000 |
| | 254,000 |
| | 253,000 |
|
New York (2) | 34,000 |
| | 35,000 |
| | — |
| 33,000 |
| | 35,000 |
| | 37,000 |
|
| Ohio | 351,000 |
| | 332,000 |
| | 341,000 |
| 343,000 |
| | 332,000 |
| | 339,000 |
|
| Puerto Rico | 322,000 |
| | 330,000 |
| | 336,000 |
| 306,000 |
| | 330,000 |
| | 331,000 |
|
| South Carolina | 112,000 |
| | 109,000 |
| | 105,000 |
| 113,000 |
| | 109,000 |
| | 109,000 |
|
| Texas | 465,000 |
| | 337,000 |
| | 367,000 |
| 444,000 |
| | 337,000 |
| | 352,000 |
|
| Utah | 167,000 |
| | 146,000 |
| | 151,000 |
| 160,000 |
| | 146,000 |
| | 150,000 |
|
| Washington | 788,000 |
| | 736,000 |
| | 709,000 |
| 770,000 |
| | 736,000 |
| | 716,000 |
|
| Wisconsin | 130,000 |
| | 126,000 |
| | 134,000 |
| 124,000 |
| | 126,000 |
| | 131,000 |
|
| | 4,650,000 |
| | 4,227,000 |
| | 4,233,000 |
| 4,503,000 |
| | 4,227,000 |
| | 4,246,000 |
|
_________________________ | |
| (1) | MMP members receive both Medicaid and Medicare coverage from Molina Healthcare. |
| |
(2) | The New York health plan was acquired on August 1, 2016. |
Premiums by Program
The amount of the premiums paid to our health plans may vary substantially between states and among various government programs. The following table sets forth the ranges of premiums paid to our state health plans by program on a per member per month (PMPM) basis, for the sixnine months ended JuneSeptember 30, 2017. The “Consolidated” column represents the weighted-average amounts for our total membership by program.
| | | | PMPM Premiums | PMPM Premiums |
| | Low | | High | | Consolidated | Low | | High | | Consolidated |
| TANF and CHIP | $ | 120.00 |
| | $ | 320.00 |
| | $ | 180.00 |
| $ | 120.00 |
| | $ | 310.00 |
| | $ | 180.00 |
|
| Marketplace | 180.00 |
| | 440.00 |
| | 270.00 |
| 190.00 |
| | 470.00 |
| | 280.00 |
|
| Medicaid Expansion | 320.00 |
| | 510.00 |
| | 390.00 |
| 320.00 |
| | 510.00 |
| | 390.00 |
|
| ABD | 370.00 |
| | 1,490.00 |
| | 1,030.00 |
| 380.00 |
| | 1,480.00 |
| | 1,030.00 |
|
| MMP – Integrated | 1,220.00 |
| | 3,250.00 |
| | 2,150.00 |
| 1,250.00 |
| | 3,280.00 |
| | 2,190.00 |
|
| Medicare | 910.00 |
| | 1,240.00 |
| | 1,100.00 |
| 960.00 |
| | 1,260.00 |
| | 1,140.00 |
|
FINANCIAL OVERVIEW
In the secondthird quarter of 2017, premium revenue increased approximately 18%14%, or $711$586 million, when compared with the secondthird quarter of 2016. Member months grew 8% while revenue PMPM increased 6%. Medical care costs as a percent of premium revenue decreased to 88.3% in the third quarter of 2017 from 89.4% in the third quarter of 2016. Medical margin increased 26% in the third quarter of 2017 from the third quarter of 2016.
In the nine months ended September 30, 2017, premium revenue increased approximately 16%, or $1,950 million, when compared with the nine months ended September 30, 2016. Member months grew 11% while revenue PMPM increased 7%5%. Medical care costs as a percent of premium revenue increased to 94.8%90.5% in the second quarter of 2017 from 89.2% in the second quarter of 2016. Medical margin decreased 43% in the second quarter of 2017 from the second quarter of 2016.
In the sixnine months ended June 30, 2017, premium revenue increased approximately 17%, or $1,364 million, when compared with the six months ended June 30, 2016. Member months grew 13% while revenue PMPM increased 4%. Medical care costs as a percent of premium revenue increased to 91.6% in the six months ended JuneSeptember 30, 2017 from 89.5% in the sixnine months ended JuneSeptember 30, 2016. Medical margin decreased 7%increased 5% in the sixnine months ended JuneSeptember 30, 2017 from the sixnine months ended JuneSeptember 30, 2016.
FINANCIAL PERFORMANCE BY PROGRAM
The following tables summarize member months, premium revenue, medical care costs, medical care ratio and medical margin by program for the periods indicated (PMPM amounts are in whole dollars; member months and other dollar amounts are in millions):
| | | | Three Months Ended June 30, 2017 | Three Months Ended September 30, 2017 |
| | Member Months (1) | | Premium Revenue | | Medical Care Costs | | MCR (2) | | Medical Margin | Member Months (1) | | Premium Revenue | | Medical Care Costs | | MCR (2) | | Medical Margin |
| | | Total | | PMPM | | Total | | PMPM | | | Total | | PMPM | | Total | | PMPM | |
| TANF and CHIP | 7.6 |
| | $ | 1,391 |
| | $ | 182.47 |
| | $ | 1,315 |
| | $ | 172.48 |
| | 94.5 | % | | $ | 76 |
| 7.5 |
| | $ | 1,392 |
| | $ | 185.95 |
| | $ | 1,242 |
| | $ | 165.76 |
| | 89.1 | % | | $ | 150 |
|
| Medicaid Expansion | 2.1 |
| | 786 |
| | 383.07 |
| | 689 |
| | 335.26 |
| | 87.5 |
| | 97 |
| 2.0 |
| | 773 |
| | 385.58 |
| | 667 |
| | 332.99 |
| | 86.4 |
| | 106 |
|
| ABD | 1.2 |
| | 1,285 |
| | 1,053.89 |
| | 1,245 |
| | 1,020.85 |
| | 96.9 |
| | 40 |
| 1.2 |
| | 1,288 |
| | 1,038.85 |
| | 1,259 |
| | 1,016.06 |
| | 97.8 |
| | 29 |
|
| Total Medicaid | 10.9 |
| | 3,462 |
| | 317.79 |
| | 3,249 |
| | 298.10 |
| | 93.8 |
| | 213 |
| 10.7 |
| | 3,453 |
| | 321.77 |
| | 3,168 |
| | 295.23 |
| | 91.8 |
| | 285 |
|
| MMP | 0.1 |
| | 361 |
| | 2,217.44 |
| | 333 |
| | 2,050.20 |
| | 92.5 |
| | 28 |
| 0.2 |
| | 378 |
| | 2,263.07 |
| | 336 |
| | 2,013.67 |
| | 89.0 |
| | 42 |
|
| Medicare | 0.2 |
| | 148 |
| | 1,126.14 |
| | 126 |
| | 963.34 |
| | 85.5 |
| | 22 |
| 0.1 |
| | 163 |
| | 1,231.61 |
| | 126 |
| | 951.01 |
| | 77.2 |
| | 37 |
|
| Total Medicare | 0.3 |
| | 509 |
| | 1,730.91 |
| | 459 |
| | 1,565.65 |
| | 90.5 |
| | 50 |
| 0.3 |
| | 541 |
| | 1,806.26 |
| | 462 |
| | 1,543.05 |
| | 85.4 |
| | 79 |
|
| Excluding Marketplace | 11.2 |
| | 3,971 |
| | 354.87 |
| | 3,708 |
| | 331.36 |
| | 93.4 |
| | 263 |
| 11.0 |
| | 3,994 |
| | 362.04 |
| | 3,630 |
| | 329.08 |
| | 90.9 |
| | 364 |
|
| Marketplace | 2.8 |
| | 769 |
| | 267.37 |
| | 783 |
| | 272.37 |
| | 101.9 |
| | (14 | ) | 2.7 |
| | 783 |
| | 301.72 |
| | 590 |
| | 227.22 |
| | 75.3 |
| | 193 |
|
| | 14.0 |
| | $ | 4,740 |
| | $ | 336.98 |
| | $ | 4,491 |
| | $ | 319.29 |
| | 94.8 | % | | $ | 249 |
| 13.7 |
| | $ | 4,777 |
| | $ | 350.55 |
| | $ | 4,220 |
| | $ | 309.68 |
| | 88.3 | % | | $ | 557 |
|
| | | | Three Months Ended June 30, 2016 | Three Months Ended September 30, 2016 |
| | Member Months (1) | | Premium Revenue | | Medical Care Costs | | MCR (2) | | Medical Margin | Member Months (1) | | Premium Revenue | | Medical Care Costs | | MCR (2) | | Medical Margin |
| | | Total | | PMPM | | Total | | PMPM | | | Total | | PMPM | | Total | | PMPM | |
| TANF and CHIP | 7.5 |
| | $ | 1,302 |
| | $ | 173.57 |
| | $ | 1,202 |
| | $ | 160.26 |
| | 92.3 | % | | $ | 100 |
| 7.6 |
| | $ | 1,373 |
| | $ | 180.74 |
| | $ | 1,246 |
| | $ | 164.04 |
| | 90.8 | % | | $ | 127 |
|
| Medicaid Expansion | 1.9 |
| | 742 |
| | 378.19 |
| | 634 |
| | 323.56 |
| | 85.6 |
| | 108 |
| 2.0 |
| | 763 |
| | 386.98 |
| | 642 |
| | 325.68 |
| | 84.2 |
| | 121 |
|
| ABD | 1.2 |
| | 1,168 |
| | 991.38 |
| | 1,038 |
| | 881.80 |
| | 88.9 |
| | 130 |
| 1.1 |
| | 1,186 |
| | 1,008.28 |
| | 1,094 |
| | 929.93 |
| | 92.2 |
| | 92 |
|
| Total Medicaid | 10.6 |
| | 3,212 |
| | 301.86 |
| | 2,874 |
| | 270.27 |
| | 89.5 |
| | 338 |
| 10.7 |
| | 3,322 |
| | 309.19 |
| | 2,982 |
| | 277.55 |
| | 89.8 |
| | 340 |
|
| MMP | 0.2 |
| | 315 |
| | 2,093.29 |
| | 270 |
| | 1,792.78 |
| | 85.6 |
| | 45 |
| 0.2 |
| | 334 |
| | 2,165.26 |
| | 280 |
| | 1,818.75 |
| | 84.0 |
| | 54 |
|
| Medicare | 0.2 |
| | 129 |
| | 997.44 |
| | 127 |
| | 974.30 |
| | 97.7 |
| | 2 |
| 0.1 |
| | 136 |
| | 1,019.19 |
| | 134 |
| | 1,003.85 |
| | 98.5 |
| | 2 |
|
| Total Medicare | 0.4 |
| | 444 |
| | 1,584.77 |
| | 397 |
| | 1,412.96 |
| | 89.2 |
| | 47 |
| 0.3 |
| | 470 |
| | 1,633.62 |
| | 414 |
| | 1,440.73 |
| | 88.2 |
| | 56 |
|
| Excluding Marketplace | 11.0 |
| | 3,656 |
| | 334.86 |
| | 3,271 |
| | 299.67 |
| | 89.5 |
| | 385 |
| 11.0 |
| | 3,792 |
| | 343.68 |
| | 3,396 |
| | 307.84 |
| | 89.6 |
| | 396 |
|
| Marketplace | 1.8 |
| | 373 |
| | 206.88 |
| | 323 |
| | 178.79 |
| | 86.4 |
| | 50 |
| 1.7 |
| | 399 |
| | 238.86 |
| | 352 |
| | 210.38 |
| | 88.1 |
| | 47 |
|
| | 12.8 |
| | $ | 4,029 |
| | $ | 316.72 |
| | $ | 3,594 |
| | $ | 282.54 |
| | 89.2 | % | | $ | 435 |
| 12.7 |
| | $ | 4,191 |
| | $ | 329.88 |
| | $ | 3,748 |
| | $ | 295.01 |
| | 89.4 | % | | $ | 443 |
|
| | | | Six Months Ended June 30, 2017 | Nine Months Ended September 30, 2017 |
| | Member Months (1) | | Premium Revenue | | Medical Care Costs | | MCR (2) | | Medical Margin | Member Months (1) | | Premium Revenue | | Medical Care Costs | | MCR (2) | | Medical Margin |
| | | Total | | PMPM | | Total | | PMPM | | | Total | | PMPM | | Total | | PMPM | |
| TANF and CHIP | 15.3 |
| | $ | 2,793 |
| | $ | 182.58 |
| | $ | 2,619 |
| | $ | 171.25 |
| | 93.8 | % | | $ | 174 |
| 22.8 |
| | $ | 4,185 |
| | $ | 183.69 |
| | $ | 3,861 |
| | $ | 169.44 |
| | 92.2 | % | | $ | 324 |
|
| Medicaid Expansion | 4.1 |
| | 1,603 |
| | 390.88 |
| | 1,378 |
| | 335.88 |
| | 85.9 |
| | 225 |
| 6.1 |
| | 2,376 |
| | 389.14 |
| | 2,045 |
| | 334.93 |
| | 86.1 |
| | 331 |
|
| ABD | 2.4 |
| | 2,481 |
| | 1,030.68 |
| | 2,375 |
| | 986.54 |
| | 95.7 |
| | 106 |
| 3.6 |
| | 3,769 |
| | 1,033.45 |
| | 3,634 |
| | 996.58 |
| | 96.4 |
| | 135 |
|
| Total Medicaid | 21.8 |
| | 6,877 |
| | 315.39 |
| | 6,372 |
| | 292.22 |
| | 92.7 |
| | 505 |
| 32.5 |
| | 10,330 |
| | 317.49 |
| | 9,540 |
| | 293.21 |
| | 92.4 |
| | 790 |
|
| MMP | 0.3 |
| | 705 |
| | 2,152.75 |
| | 640 |
| | 1,954.15 |
| | 90.8 |
| | 65 |
| 0.5 |
| | 1,083 |
| | 2,189.96 |
| | 976 |
| | 1,974.22 |
| | 90.1 |
| | 107 |
|
| Medicare | 0.3 |
| | 286 |
| | 1,097.36 |
| | 243 |
| | 933.20 |
| | 85.0 |
| | 43 |
| 0.4 |
| | 449 |
| | 1,142.68 |
| | 369 |
| | 939.21 |
| | 82.2 |
| | 80 |
|
| Total Medicare | 0.6 |
| | 991 |
| | 1,685.72 |
| | 883 |
| | 1,502.36 |
| | 89.1 |
| | 108 |
| 0.9 |
| | 1,532 |
| | 1,726.39 |
| | 1,345 |
| | 1,516.09 |
| | 87.8 |
| | 187 |
|
| Excluding Marketplace | 22.4 |
| | 7,868 |
| | 351.35 |
| | 7,255 |
| | 323.98 |
| | 92.2 |
| | 613 |
| 33.4 |
| | 11,862 |
| | 354.88 |
| | 10,885 |
| | 325.66 |
| | 91.8 |
| | 977 |
|
| Marketplace | 5.7 |
| | 1,520 |
| | 264.77 |
| | 1,347 |
| | 234.62 |
| | 88.6 |
| | 173 |
| 8.4 |
| | 2,303 |
| | 276.27 |
| | 1,937 |
| | 232.31 |
| | 84.1 |
| | 366 |
|
| | 28.1 |
| | $ | 9,388 |
| | $ | 333.68 |
| | $ | 8,602 |
| | $ | 305.74 |
| | 91.6 | % | | $ | 786 |
| 41.8 |
| | $ | 14,165 |
| | $ | 339.19 |
| | $ | 12,822 |
| | $ | 307.03 |
| | 90.5 | % | | $ | 1,343 |
|
| | | | Six Months Ended June 30, 2016 | Nine Months Ended September 30, 2016 |
| | Member Months (1) | | Premium Revenue | | Medical Care Costs | | MCR (2) | | Medical Margin | Member Months (1) | | Premium Revenue | | Medical Care Costs | | MCR (2) | | Medical Margin |
| | | Total | | PMPM | | Total | | PMPM | | | Total | | PMPM | | Total | | PMPM | |
| TANF and CHIP | 14.9 |
| | $ | 2,626 |
| | $ | 176.00 |
| | $ | 2,400 |
| | $ | 160.85 |
| | 91.4 | % | | $ | 226 |
| 22.5 |
| | $ | 3,999 |
| | $ | 177.60 |
| | $ | 3,646 |
| | $ | 161.93 |
| | 91.2 | % | | $ | 353 |
|
| Medicaid Expansion | 3.8 |
| | 1,421 |
| | 371.82 |
| | 1,208 |
| | 316.13 |
| | 85.0 |
| | 213 |
| 5.8 |
| | 2,184 |
| | 376.98 |
| | 1,850 |
| | 319.38 |
| | 84.7 |
| | 334 |
|
| ABD | 2.4 |
| | 2,280 |
| | 976.58 |
| | 2,079 |
| | 890.71 |
| | 91.2 |
| | 201 |
| 3.5 |
| | 3,466 |
| | 987.20 |
| | 3,173 |
| | 903.85 |
| | 91.6 |
| | 293 |
|
| Total Medicaid | 21.1 |
| | 6,327 |
| | 300.19 |
| | 5,687 |
| | 269.86 |
| | 89.9 |
| | 640 |
| 31.8 |
| | 9,649 |
| | 303.23 |
| | 8,669 |
| | 272.46 |
| | 89.9 |
| | 980 |
|
| MMP | 0.3 |
| | 655 |
| | 2,157.55 |
| | 587 |
| | 1,932.73 |
| | 89.6 |
| | 68 |
| 0.5 |
| | 989 |
| | 2,160.14 |
| | 867 |
| | 1,894.38 |
| | 87.7 |
| | 122 |
|
| Medicare | 0.3 |
| | 260 |
| | 1,013.04 |
| | 251 |
| | 977.35 |
| | 96.5 |
| | 9 |
| 0.4 |
| | 396 |
| | 1,015.14 |
| | 385 |
| | 986.40 |
| | 97.2 |
| | 11 |
|
| Total Medicare | 0.6 |
| | 915 |
| | 1,633.08 |
| | 838 |
| | 1,494.92 |
| | 91.5 |
| | 77 |
| 0.9 |
| | 1,385 |
| | 1,633.26 |
| | 1,252 |
| | 1,476.57 |
| | 90.4 |
| | 133 |
|
| Excluding Marketplace | 21.7 |
| | 7,242 |
| | 334.74 |
| | 6,525 |
| | 301.61 |
| | 90.1 |
| | 717 |
| 32.7 |
| | 11,034 |
| | 337.76 |
| | 9,921 |
| | 303.72 |
| | 89.9 |
| | 1,113 |
|
| Marketplace | 3.4 |
| | 782 |
| | 228.19 |
| | 657 |
| | 191.62 |
| | 84.0 |
| | 125 |
| 5.1 |
| | 1,181 |
| | 231.69 |
| | 1,009 |
| | 197.77 |
| | 85.4 |
| | 172 |
|
| | 25.1 |
| | $ | 8,024 |
| | $ | 320.17 |
| | $ | 7,182 |
| | $ | 286.57 |
| | 89.5 | % | | $ | 842 |
| 37.8 |
| | $ | 12,215 |
| | $ | 323.44 |
| | $ | 10,930 |
| | $ | 289.41 |
| | 89.5 | % | | $ | 1,285 |
|
_______________________
| |
| (1) | A member month is defined as the aggregate of each month’s ending membership for the period presented. |
| |
| (2) | “MCR” represents medical costs as a percentage of premium revenue. |
Medicaid: TANF/CHIP, Medicaid Expansion and ABD
The medical care ratios of the combined TANF/CHIP, Medicaid Expansion and ABD programs increased to 93.8%91.8% in the secondthird quarter of 2017, from 89.5%89.8% in the secondthird quarter of 2016.
As noted above, medical care costs recognized in Margin pressures at the second quarter of 2017 for services delivered in 2016 were significantly in excess of what we usually experience for out-of-period claims development. Favorable run-out of our reported in “Medical claimsCalifornia health plan (primarily due to reduced Medicaid Expansion premium rates effective July 1, 2017), the Florida health plan; and benefits payable” as of December 31, 2016, was $85 million lessthe Illinois health plan more than our typical experience, and was reflected in higher medical care costs foroffset improved performance at the quarter. This development was most notable at our Florida, Illinois, New Mexico, and Puerto RicoWashington health plans. Additionally, those same health plans experienced higher than expected current period medical care costs.plan.
The medical care ratios of the combined TANF/CHIP, Medicaid Expansion and ABD programs increased to 92.7%92.4% in the sixnine months ended JuneSeptember 30, 2017, from 89.9% in the sixnine months ended JuneSeptember 30, 2016, primarily due to2016. For the reasons noted abovenine months ended September 30, 2017, margin pressures at the Florida, Illinois, New Mexico and Texas health plans more than offset improved performance at the Washington health plan. Financial results for the increased medical care ratioTexas health plan in 2016 benefited from the second quarterrecognition of 2017.$44 million of quality revenue related to 2015 and 2014.
MMP and Medicare
The medical care ratio for these programs, in the aggregate, increaseddecreased in the secondthird quarter of 2017 when compared with the secondthird quarter of 2016. However, for2016, and also in the sixnine months ended JuneSeptember 30, 2017, compared with the sixnine months ended JuneSeptember 30, 2016,2016. Utilization of inpatient and pharmacy services among our Medicare members has been subdued for the aggregated medical care ratio for these two programs decreased.
first nine months of 2017.
Marketplace
The medical care ratio for the Marketplace programmember months increased to 101.9%64% in the second quarter of 2017, from 86.4% in the second quarter of 2016.
The medical care ratio for the Marketplace program increased to 88.6% in the sixnine months ended JuneSeptember 30, 2017, from 84.0% in the six months ended June 30, 2016.
In the second quarter of 2017, we recorded an increase to the premium deficiency reserve established for the Marketplace program. The reserve, which was $22 million at March 31, 2017, increased to $100 million as of June 30, 2017. In addition, we recorded $44 million for Marketplace changes in estimates, including risk transfer and cost sharing subsidies, related to 2016 service dates. Liabilities for risk transfer payments and cost sharing subsidies that were estimated at December 31, 2016 were finalized during the second quarter of 2017.
In the first half of 2016, adjustments related to 2015 dates of service reduced Marketplace pretax income by approximately $68 million.
Member months increased 68% in the second quarter of 2017, when compared with the second quarter ofnine months ended September 30, 2016, as a result of membership growth primarily in California, Florida and Texas.
The medical care ratio for the Marketplace program decreased to 75.3% in the third quarter of 2017, from 88.1% in the third quarter of 2016. Absent a $30 million reduction to a previously established premium deficiency reserve, the medical care ratio for our Marketplace program would have been approximately 79% in the third quarter of 2017. The medical care ratio of the Marketplace program for the nine months ended September 30, 2017 was 84.1%, and generally consistent with the medical care ratio reported for the same period in 2016.
FINANCIAL PERFORMANCE BY STATE
The ongoing poor performance at our Florida, Illinois, New Mexico and Puerto Rico health plans in 2017 all contributed to our disappointing financial performance in the second quarter of 2017. The following tables summarize member months, premium revenue, medical care costs, medical care ratio, and medical margin by state health plan for the periods indicated (PMPM amounts are in whole dollars; member months and other dollar amounts are in millions):
Health Plans Segment Financial Data — Non-Marketplace
|
| | | | | | | | | | | | | | | | | | | | | | | | | |
| | Three Months Ended September 30, 2017 |
| | Member
Months | | Premium Revenue | | Medical Care Costs | | MCR | | Medical Margin |
| | | Total | | PMPM | | Total | | PMPM | | |
| California | 1.9 |
| | $ | 601 |
| | $ | 322.97 |
| | $ | 563 |
| | $ | 302.67 |
| | 93.7 | % | | $ | 38 |
|
| Florida | 1.0 |
| | 388 |
| | 355.59 |
| | 390 |
| | 356.83 |
| | 100.3 |
| | (2 | ) |
| Illinois | 0.5 |
| | 137 |
| | 287.69 |
| | 138 |
| | 289.36 |
| | 100.6 |
| | (1 | ) |
| Michigan | 1.2 |
| | 390 |
| | 337.17 |
| | 345 |
| | 298.83 |
| | 88.6 |
| | 45 |
|
| New Mexico | 0.7 |
| | 304 |
| | 429.07 |
| | 277 |
| | 390.91 |
| | 91.1 |
| | 27 |
|
| New York (3) | 0.1 |
| | 43 |
| | 435.00 |
| | 41 |
| | 413.02 |
| | 94.9 |
| | 2 |
|
| Ohio | 0.9 |
| | 549 |
| | 560.06 |
| | 483 |
| | 492.61 |
| | 88.0 |
| | 66 |
|
| Puerto Rico | 1.0 |
| | 191 |
| | 202.59 |
| | 159 |
| | 168.25 |
| | 83.1 |
| | 32 |
|
| South Carolina | 0.3 |
| | 113 |
| | 332.48 |
| | 101 |
| | 297.74 |
| | 89.6 |
| | 12 |
|
| Texas | 0.7 |
| | 541 |
| | 778.50 |
| | 506 |
| | 728.19 |
| | 93.5 |
| | 35 |
|
| Utah | 0.2 |
| | 89 |
| | 318.98 |
| | 71 |
| | 254.99 |
| | 79.9 |
| | 18 |
|
| Washington | 2.3 |
| | 612 |
| | 276.73 |
| | 522 |
| | 236.11 |
| | 85.3 |
| | 90 |
|
| Wisconsin | 0.2 |
| | 34 |
| | 175.77 |
| | 27 |
| | 141.78 |
| | 80.7 |
| | 7 |
|
| Other (4) | — |
| | 2 |
| | — |
| | 7 |
| | — |
| | — |
| | (5 | ) |
| | 11.0 |
| | $ | 3,994 |
| | $ | 362.04 |
| | $ | 3,630 |
| | $ | 329.08 |
| | 90.9 | % | | $ | 364 |
|
|
| | | | | | | | | | | | | | | | | | | | | | | | | |
| | Three Months Ended September 30, 2016 |
| | Member
Months | | Premium Revenue | | Medical Care Costs | | MCR | | Medical Margin |
| | | Total | | PMPM | | Total | | PMPM | | |
| California | 1.8 |
| | $ | 575 |
| | $ | 310.64 |
| | $ | 493 |
| | $ | 266.81 |
| | 85.9 | % | | $ | 82 |
|
| Florida | 1.0 |
| | 335 |
| | 323.98 |
| | 317 |
| | 305.71 |
| | 94.4 |
| | 18 |
|
| Illinois | 0.6 |
| | 163 |
| | 275.26 |
| | 145 |
| | 244.86 |
| | 89.0 |
| | 18 |
|
| Michigan | 1.2 |
| | 385 |
| | 335.34 |
| | 335 |
| | 291.69 |
| | 87.0 |
| | 50 |
|
| New Mexico | 0.7 |
| | 323 |
| | 451.06 |
| | 293 |
| | 409.24 |
| | 90.7 |
| | 30 |
|
| New York (3) | 0.1 |
| | 32 |
| | 427.40 |
| | 30 |
| | 403.71 |
| | 94.5 |
| | 2 |
|
| Ohio | 1.0 |
| | 492 |
| | 497.08 |
| | 417 |
| | 421.95 |
| | 84.9 |
| | 75 |
|
| Puerto Rico | 1.0 |
| | 184 |
| | 183.46 |
| | 167 |
| | 167.44 |
| | 91.3 |
| | 17 |
|
| South Carolina | 0.3 |
| | 102 |
| | 312.28 |
| | 94 |
| | 285.97 |
| | 91.6 |
| | 8 |
|
| Texas | 0.7 |
| | 534 |
| | 728.84 |
| | 484 |
| | 662.79 |
| | 90.9 |
| | 50 |
|
| Utah | 0.3 |
| | 83 |
| | 288.59 |
| | 71 |
| | 242.77 |
| | 84.1 |
| | 12 |
|
| Washington | 2.0 |
| | 546 |
| | 264.01 |
| | 500 |
| | 241.49 |
| | 91.5 |
| | 46 |
|
| Wisconsin | 0.3 |
| | 35 |
| | 166.82 |
| | 26 |
| | 125.86 |
| | 75.4 |
| | 9 |
|
| Other (4) | — |
| | 3 |
| | — |
| | 24 |
| | — |
| | — |
| | (21 | ) |
| | 11.0 |
| | $ | 3,792 |
| | $ | 343.68 |
| | $ | 3,396 |
| | $ | 307.84 |
| | 89.6 | % | | $ | 396 |
|
|
| | | | | | | | | | | | | | | | | | | | | | | | | |
| | Nine Months Ended September 30, 2017 |
| | Member
Months | | Premium Revenue | | Medical Care Costs | | MCR | | Medical Margin |
| | | Total | | PMPM | | Total | | PMPM | | |
| California | 5.6 |
| | $ | 1,771 |
| | $ | 316.83 |
| | $ | 1,586 |
| | $ | 283.82 |
| | 89.6 | % | | $ | 185 |
|
| Florida | 3.2 |
| | 1,132 |
| | 347.41 |
| | 1,112 |
| | 341.15 |
| | 98.2 |
| | 20 |
|
| Illinois | 1.6 |
| | 447 |
| | 284.18 |
| | 492 |
| | 312.54 |
| | 110.0 |
| | (45 | ) |
| Michigan | 3.5 |
| | 1,162 |
| | 332.60 |
| | 1,035 |
| | 296.28 |
| | 89.1 |
| | 127 |
|
| New Mexico | 2.2 |
| | 933 |
| | 431.70 |
| | 887 |
| | 410.24 |
| | 95.0 |
| | 46 |
|
| New York (3) | 0.3 |
| | 135 |
| | 444.77 |
| | 128 |
| | 421.58 |
| | 94.8 |
| | 7 |
|
| Ohio | 2.9 |
| | 1,598 |
| | 541.56 |
| | 1,434 |
| | 486.02 |
| | 89.7 |
| | 164 |
|
| Puerto Rico | 2.9 |
| | 553 |
| | 190.99 |
| | 513 |
| | 177.01 |
| | 92.7 |
| | 40 |
|
| South Carolina | 1.0 |
| | 329 |
| | 325.43 |
| | 301 |
| | 298.43 |
| | 91.7 |
| | 28 |
|
| Texas | 2.1 |
| | 1,592 |
| | 760.76 |
| | 1,468 |
| | 701.32 |
| | 92.2 |
| | 124 |
|
| Utah | 0.8 |
| | 267 |
| | 315.35 |
| | 219 |
| | 258.64 |
| | 82.0 |
| | 48 |
|
| Washington | 6.7 |
| | 1,835 |
| | 275.60 |
| | 1,603 |
| | 240.83 |
| | 87.4 |
| | 232 |
|
| Wisconsin | 0.6 |
| | 101 |
| | 170.64 |
| | 80 |
| | 136.04 |
| | 79.7 |
| | 21 |
|
| Other (4) | — |
| | 7 |
| | — |
| | 27 |
| | — |
| | — |
| | (20 | ) |
| | 33.4 |
| | $ | 11,862 |
| | $ | 354.88 |
| | $ | 10,885 |
| | $ | 325.66 |
| | 91.8 | % | | $ | 977 |
|
|
| | | | | | | | | | | | | | | | | | | | | | | | | |
| | Nine Months Ended September 30, 2016 |
| | Member
Months | | Premium Revenue | | Medical Care Costs | | MCR | | Medical Margin |
| | | Total | | PMPM | | Total | | PMPM | | |
| California | 5.5 |
| | $ | 1,603 |
| | $ | 291.20 |
| | $ | 1,411 |
| | $ | 256.41 |
| | 88.1 | % | | $ | 192 |
|
| Florida | 3.0 |
| | 974 |
| | 322.69 |
| | 892 |
| | 295.43 |
| | 91.6 |
| | 82 |
|
| Illinois | 1.8 |
| | 466 |
| | 266.11 |
| | 414 |
| | 236.39 |
| | 88.8 |
| | 52 |
|
| Michigan | 3.6 |
| | 1,136 |
| | 323.08 |
| | 1,013 |
| | 288.13 |
| | 89.2 |
| | 123 |
|
| New Mexico | 2.1 |
| | 974 |
| | 460.71 |
| | 873 |
| | 412.92 |
| | 89.6 |
| | 101 |
|
| New York (3) | 0.1 |
| | 32 |
| | 427.40 |
| | 30 |
| | 403.71 |
| | 94.5 |
| | 2 |
|
| Ohio | 2.9 |
| | 1,444 |
| | 489.63 |
| | 1,286 |
| | 435.99 |
| | 89.0 |
| | 158 |
|
| Puerto Rico | 3.0 |
| | 535 |
| | 176.44 |
| | 516 |
| | 170.46 |
| | 96.6 |
| | 19 |
|
| South Carolina | 0.9 |
| | 273 |
| | 288.93 |
| | 232 |
| | 245.13 |
| | 84.8 |
| | 41 |
|
| Texas | 2.2 |
| | 1,650 |
| | 744.71 |
| | 1,466 |
| | 662.01 |
| | 88.9 |
| | 184 |
|
| Utah | 0.9 |
| | 255 |
| | 293.33 |
| | 221 |
| | 253.79 |
| | 86.5 |
| | 34 |
|
| Washington | 6.0 |
| | 1,576 |
| | 261.23 |
| | 1,431 |
| | 237.20 |
| | 90.8 |
| | 145 |
|
| Wisconsin | 0.7 |
| | 107 |
| | 165.53 |
| | 78 |
| | 120.82 |
| | 73.0 |
| | 29 |
|
| Other (4) | — |
| | 9 |
| | — |
| | 58 |
| | — |
| | — |
| | (49 | ) |
| | 32.7 |
| | $ | 11,034 |
| | $ | 337.76 |
| | $ | 9,921 |
| | $ | 303.72 |
| | 89.9 | % | | $ | 1,113 |
|
Health Plans Segment Financial Data — Marketplace
| | | | Three Months Ended June 30, 2017 | Three Months Ended September 30, 2017 |
| | Member Months | | Premium Revenue | | Medical Care Costs | | MCR | | Medical Margin | Member
Months | | Premium Revenue | | Medical Care Costs | | MCR | | Medical Margin |
| | | Total | | PMPM | | Total | | PMPM | | | Total | | PMPM | | Total | | PMPM | |
| California | 2.4 |
| | $ | 679 |
| | $ | 294.09 |
| | $ | 606 |
| | $ | 262.34 |
| | 89.2 | % | | $ | 73 |
| 0.3 |
| | $ | 88 |
| | $ | 208.19 |
| | $ | 63 |
| | $ | 147.87 |
| | 71.0 | % | | $ | 25 |
|
| Florida | 2.0 |
| | 649 |
| | 318.21 |
| | 687 |
| | 337.39 |
| | 106.0 |
| | (38 | ) | 0.9 |
| | 260 |
| | 313.36 |
| | 235 |
| | 283.13 |
| | 90.4 |
| | 25 |
|
| Illinois | 0.5 |
| | 149 |
| | 289.51 |
| | 174 |
| | 336.76 |
| | 116.3 |
| | (25 | ) | |
| Michigan | 1.2 |
| | 406 |
| | 325.38 |
| | 368 |
| | 295.06 |
| | 90.7 |
| | 38 |
| — |
| | 14 |
| | 212.08 |
| | 10 |
| | 150.24 |
| | 70.8 |
| | 4 |
|
| New Mexico | 0.8 |
| | 352 |
| | 435.34 |
| | 334 |
| | 411.83 |
| | 94.6 |
| | 18 |
| 0.1 |
| | 29 |
| | 383.58 |
| | 20 |
| | 269.28 |
| | 70.2 |
| | 9 |
|
New York (1) | 0.1 |
| | 46 |
| | 457.96 |
| | 45 |
| | 442.16 |
| | 96.5 |
| | 1 |
| |
| Ohio | 1.0 |
| | 553 |
| | 527.14 |
| | 516 |
| | 490.75 |
| | 93.1 |
| | 37 |
| 0.1 |
| | 23 |
| | 386.09 |
| | 20 |
| | 364.31 |
| | 94.4 |
| | 3 |
|
| Puerto Rico | 0.9 |
| | 179 |
| | 184.28 |
| | 189 |
| | 194.42 |
| | 105.5 |
| | (10 | ) | |
| South Carolina | 0.4 |
| | 111 |
| | 326.57 |
| | 102 |
| | 304.14 |
| | 93.1 |
| | 9 |
| |
| Texas | 1.4 |
| | 701 |
| | 495.93 |
| | 602 |
| | 426.41 |
| | 86.0 |
| | 99 |
| 0.7 |
| | 183 |
| | 291.14 |
| | 109 |
| | 172.70 |
| | 59.3 |
| | 74 |
|
| Utah | 0.5 |
| | 130 |
| | 258.10 |
| | 129 |
| | 255.00 |
| | 98.8 |
| | 1 |
| 0.3 |
| | 49 |
| | 241.65 |
| | 31 |
| | 155.13 |
| | 64.2 |
| | 18 |
|
| Washington | 2.4 |
| | 662 |
| | 279.21 |
| | 595 |
| | 251.16 |
| | 90.0 |
| | 67 |
| 0.1 |
| | 42 |
| | 327.40 |
| | 33 |
| | 256.52 |
| | 78.3 |
| | 9 |
|
| Wisconsin | 0.4 |
| | 120 |
| | 303.59 |
| | 135 |
| | 342.43 |
| | 112.8 |
| | (15 | ) | 0.2 |
| | 95 |
| | 527.17 |
| | 70 |
| | 385.65 |
| | 73.2 |
| | 25 |
|
Other (2) | — |
| | 3 |
| | — |
| | 9 |
| | — |
| | — |
| | (6 | ) | |
Other (3) | | — |
| | — |
| | — |
| | (1 | ) | | — |
| | — |
| | 1 |
|
| | 14.0 |
| | $ | 4,740 |
| | $ | 336.98 |
| | $ | 4,491 |
| | $ | 319.29 |
| | 94.8 | % | | $ | 249 |
| 2.7 |
| | $ | 783 |
| | $ | 301.72 |
| | $ | 590 |
| | $ | 227.22 |
| | 75.3 | % | | $ | 193 |
|
|
| | | | | | | | | | | | | | | | | | | | | | | | | |
| | Three Months Ended September 30, 2016 |
| | Member
Months | | Premium Revenue | | Medical Care Costs | | MCR | | Medical Margin |
| | | Total | | PMPM | | Total | | PMPM | | |
| California | 0.3 |
| | $ | 37 |
| | $ | 185.04 |
| | $ | 30 |
| | $ | 140.10 |
| | 75.7 | % | | $ | 7 |
|
| Florida | 0.6 |
| | 159 |
| | 253.16 |
| | 145 |
| | 231.78 |
| | 91.6 |
| | 14 |
|
| Michigan | — |
| | 2 |
| | 221.84 |
| | 2 |
| | 132.62 |
| | 59.8 |
| | — |
|
| New Mexico | 0.1 |
| | 15 |
| | 290.63 |
| | 11 |
| | 220.32 |
| | 75.8 |
| | 4 |
|
| Ohio | — |
| | 9 |
| | 307.24 |
| | 7 |
| | 215.01 |
| | 70.0 |
| | 2 |
|
| Texas | 0.4 |
| | 63 |
| | 189.85 |
| | 41 |
| | 121.06 |
| | 63.8 |
| | 22 |
|
| Utah | 0.1 |
| | 23 |
| | 142.10 |
| | 33 |
| | 208.48 |
| | 146.7 |
| | (10 | ) |
| Washington | 0.1 |
| | 23 |
| | 307.55 |
| | 21 |
| | 300.71 |
| | 97.8 |
| | 2 |
|
| Wisconsin | 0.1 |
| | 68 |
| | 375.60 |
| | 64 |
| | 357.60 |
| | 95.2 |
| | 4 |
|
| Other (3) | — |
| | — |
| | — |
| | (2 | ) | | — |
| | — |
| | 2 |
|
| | 1.7 |
| | $ | 399 |
| | $ | 238.86 |
| | $ | 352 |
| | $ | 210.38 |
| | 88.1 | % | | $ | 47 |
|
|
| | | | | | | | | | | | | | | | | | | | | | | | | |
| | Nine Months Ended September 30, 2017 |
| | Member
Months | | Premium Revenue | | Medical Care Costs | | MCR | | Medical Margin |
| | | Total | | PMPM | | Total | | PMPM | | |
| California | 1.2 |
| | $ | 241 |
| | $ | 193.33 |
| | $ | 156 |
| | $ | 124.32 |
| | 64.3 | % | | $ | 85 |
|
| Florida | 2.8 |
| | 821 |
| | 296.14 |
| | 758 |
| | 273.55 |
| | 92.4 |
| | 63 |
|
| Michigan | 0.2 |
| | 41 |
| | 187.96 |
| | 27 |
| | 126.76 |
| | 67.4 |
| | 14 |
|
| New Mexico | 0.2 |
| | 82 |
| | 338.18 |
| | 62 |
| | 256.05 |
| | 75.7 |
| | 20 |
|
| Ohio | 0.2 |
| | 68 |
| | 365.35 |
| | 64 |
| | 346.93 |
| | 95.0 |
| | 4 |
|
| Texas | 2.1 |
| | 517 |
| | 252.32 |
| | 351 |
| | 171.57 |
| | 68.0 |
| | 166 |
|
| Utah | 0.7 |
| | 135 |
| | 209.43 |
| | 135 |
| | 209.13 |
| | 99.9 |
| | — |
|
| Washington | 0.4 |
| | 123 |
| | 315.95 |
| | 128 |
| | 327.51 |
| | 103.7 |
| | (5 | ) |
| Wisconsin | 0.6 |
| | 275 |
| | 469.44 |
| | 260 |
| | 443.41 |
| | 94.5 |
| | 15 |
|
| Other (3) | — |
| | — |
| | — |
| | (4 | ) | | — |
| | — |
| | 4 |
|
| | 8.4 |
| | $ | 2,303 |
| | $ | 276.27 |
| | $ | 1,937 |
| | $ | 232.31 |
| | 84.1 | % | | $ | 366 |
|
| | | | Three Months Ended June 30, 2016 | Nine Months Ended September 30, 2016 |
| | Member Months | | Premium Revenue | | Medical Care Costs | | MCR | | Medical Margin | Member
Months | | Premium Revenue | | Medical Care Costs | | MCR | | Medical Margin |
| | | Total | | PMPM | | Total | | PMPM | | | Total | | PMPM | | Total | | PMPM | |
| California | 2.0 |
| | $ | 554 |
| | $ | 268.95 |
| | $ | 493 |
| | $ | 239.63 |
| | 89.1 | % | | $ | 61 |
| 0.6 |
| | $ | 104 |
| | $ | 177.57 |
| | $ | 74 |
| | $ | 124.29 |
| | 70.0 | % | | $ | 30 |
|
| Florida | 1.8 |
| | 464 |
| | 273.90 |
| | 426 |
| | 251.69 |
| | 91.9 |
| | 38 |
| 2.0 |
| | 473 |
| | 237.37 |
| | 409 |
| | 205.37 |
| | 86.5 |
| | 64 |
|
| Illinois | 0.6 |
| | 154 |
| | 256.17 |
| | 137 |
| | 227.71 |
| | 88.9 |
| | 17 |
| |
| Michigan | 1.2 |
| | 369 |
| | 312.18 |
| | 334 |
| | 282.86 |
| | 90.6 |
| | 35 |
| — |
| | 7 |
| | 213.35 |
| | 5 |
| | 138.37 |
| | 64.9 |
| | 2 |
|
| New Mexico | 0.8 |
| | 342 |
| | 451.72 |
| | 305 |
| | 403.52 |
| | 89.3 |
| | 37 |
| 0.2 |
| | 42 |
| | 264.76 |
| | 32 |
| | 201.73 |
| | 76.2 |
| | 10 |
|
New York (1) | — |
| | — |
| | — |
| | — |
| | — |
| | — |
| | — |
| |
| Ohio | 1.0 |
| | 483 |
| | 473.91 |
| | 433 |
| | 424.87 |
| | 89.7 |
| | 50 |
| 0.1 |
| | 28 |
| | 322.36 |
| | 20 |
| | 232.44 |
| | 72.1 |
| | 8 |
|
| Puerto Rico | 1.0 |
| | 170 |
| | 169.04 |
| | 175 |
| | 173.49 |
| | 102.6 |
| | (5 | ) | |
| South Carolina | 0.3 |
| | 87 |
| | 277.22 |
| | 71 |
| | 226.27 |
| | 81.6 |
| | 16 |
| |
| Texas | 1.1 |
| | 635 |
| | 571.14 |
| | 499 |
| | 448.23 |
| | 78.5 |
| | 136 |
| 1.1 |
| | 202 |
| | 196.45 |
| | 133 |
| | 128.97 |
| | 65.7 |
| | 69 |
|
| Utah | 0.5 |
| | 110 |
| | 240.26 |
| | 106 |
| | 233.12 |
| | 97.0 |
| | 4 |
| 0.4 |
| | 75 |
| | 160.33 |
| | 91 |
| | 194.78 |
| | 121.5 |
| | (16 | ) |
| Washington | 2.1 |
| | 559 |
| | 264.40 |
| | 500 |
| | 236.32 |
| | 89.4 |
| | 59 |
| 0.2 |
| | 58 |
| | 281.80 |
| | 48 |
| | 235.78 |
| | 83.7 |
| | 10 |
|
| Wisconsin | 0.4 |
| | 99 |
| | 244.88 |
| | 96 |
| | 235.88 |
| | 96.3 |
| | 3 |
| 0.5 |
| | 192 |
| | 357.80 |
| | 200 |
| | 373.94 |
| | 104.5 |
| | (8 | ) |
Other (2) | — |
| | 3 |
| | — |
| | 19 |
| | — |
| | — |
| | (16 | ) | |
| Other (3) | | — |
| | — |
| | — |
| | (3 | ) | | — |
| | — |
| | 3 |
|
| | 12.8 |
| | $ | 4,029 |
| | $ | 316.72 |
| | $ | 3,594 |
| | $ | 282.54 |
| | 89.2 | % | | $ | 435 |
| 5.1 |
| | $ | 1,181 |
| | $ | 231.69 |
| | $ | 1,009 |
| | $ | 197.77 |
| | 85.4 | % | | $ | 172 |
|
Health Plans Segment Financial Data — Total
| | | | Six Months Ended June 30, 2017 | Three Months Ended September 30, 2017 |
| | Member Months | | Premium Revenue | | Medical Care Costs | | MCR | | Medical Margin | Member Months | | Premium Revenue | | Medical Care Costs | | MCR | | Medical Margin |
| | | Total | | PMPM | | Total | | PMPM | | | Total | | PMPM | | Total | | PMPM | |
| California | 4.6 |
| | $ | 1,323 |
| | $ | 290.56 |
| | $ | 1,116 |
| | $ | 245.02 |
| | 84.3 | % | | $ | 207 |
| 2.2 |
| | $ | 689 |
| | $ | 301.64 |
| | $ | 626 |
| | $ | 273.90 |
| | 90.8 | % | | $ | 63 |
|
| Florida | 4.1 |
| | 1,305 |
| | 317.53 |
| | 1,245 |
| | 303.09 |
| | 95.5 |
| | 60 |
| 1.9 |
| | 648 |
| | 337.40 |
| | 625 |
| | 325.09 |
| | 96.4 |
| | 23 |
|
| Illinois | 1.1 |
| | 310 |
| | 282.66 |
| | 354 |
| | 322.63 |
| | 114.1 |
| | (44 | ) | 0.5 |
| | 137 |
| | 287.69 |
| | 138 |
| | 289.36 |
| | 100.6 |
| | (1 | ) |
| Michigan | 2.5 |
| | 799 |
| | 321.10 |
| | 707 |
| | 284.24 |
| | 88.5 |
| | 92 |
| 1.2 |
| | 404 |
| | 330.27 |
| | 355 |
| | 290.63 |
| | 88.0 |
| | 49 |
|
| New Mexico | 1.6 |
| | 682 |
| | 421.11 |
| | 652 |
| | 402.27 |
| | 95.5 |
| | 30 |
| 0.8 |
| | 333 |
| | 424.61 |
| | 297 |
| | 378.98 |
| | 89.3 |
| | 36 |
|
New York (1) | 0.2 |
| | 92 |
| | 449.48 |
| | 87 |
| | 425.72 |
| | 94.7 |
| | 5 |
| 0.1 |
| | 43 |
| | 435.00 |
| | 41 |
| | 413.02 |
| | 94.9 |
| | 2 |
|
| Ohio | 2.1 |
| | 1,094 |
| | 521.57 |
| | 995 |
| | 473.95 |
| | 90.9 |
| | 99 |
| 1.0 |
| | 572 |
| | 550.75 |
| | 503 |
| | 485.61 |
| | 88.2 |
| | 69 |
|
| Puerto Rico | 1.9 |
| | 362 |
| | 185.40 |
| | 354 |
| | 181.24 |
| | 97.8 |
| | 8 |
| 1.0 |
| | 191 |
| | 202.59 |
| | 159 |
| | 168.25 |
| | 83.1 |
| | 32 |
|
| South Carolina | 0.7 |
| | 216 |
| | 321.85 |
| | 200 |
| | 298.79 |
| | 92.8 |
| | 16 |
| 0.3 |
| | 113 |
| | 332.48 |
| | 101 |
| | 297.74 |
| | 89.6 |
| | 12 |
|
| Texas | 2.8 |
| | 1,385 |
| | 491.46 |
| | 1,204 |
| | 427.48 |
| | 87.0 |
| | 181 |
| 1.4 |
| | 724 |
| | 546.57 |
| | 615 |
| | 463.83 |
| | 84.9 |
| | 109 |
|
| Utah | 1.0 |
| | 264 |
| | 261.42 |
| | 252 |
| | 248.77 |
| | 95.2 |
| | 12 |
| 0.5 |
| | 138 |
| | 286.39 |
| | 102 |
| | 212.91 |
| | 74.3 |
| | 36 |
|
| Washington | 4.7 |
| | 1,304 |
| | 276.99 |
| | 1,176 |
| | 249.79 |
| | 90.2 |
| | 128 |
| 2.4 |
| | 654 |
| | 279.52 |
| | 555 |
| | 237.23 |
| | 84.9 |
| | 99 |
|
| Wisconsin | 0.8 |
| | 247 |
| | 307.50 |
| | 243 |
| | 302.95 |
| | 98.5 |
| | 4 |
| 0.4 |
| | 129 |
| | 345.63 |
| | 97 |
| | 259.66 |
| | 75.1 |
| | 32 |
|
Other (2) | — |
| | 5 |
| | — |
| | 17 |
| | — |
| | — |
| | (12 | ) | — |
| | 2 |
| | — |
| | 6 |
| | — |
| | — |
| | (4 | ) |
| | 28.1 |
| | $ | 9,388 |
| | $ | 333.68 |
| | $ | 8,602 |
| | $ | 305.74 |
| | 91.6 | % | | $ | 786 |
| 13.7 |
| | $ | 4,777 |
| | $ | 350.55 |
| | $ | 4,220 |
| | $ | 309.68 |
| | 88.3 | % | | $ | 557 |
|
| | | | Six Months Ended June 30, 2016 | Three Months Ended September 30, 2016 |
| | Member Months | | Premium Revenue | | Medical Care Costs | | MCR | | Medical Margin | Member Months | | Premium Revenue | | Medical Care Costs | | MCR | | Medical Margin |
| | | Total | | PMPM | | Total | | PMPM | | | Total | | PMPM | | Total | | PMPM | |
| California | 4.0 |
| | $ | 1,095 |
| | $ | 271.14 |
| | $ | 962 |
| | $ | 238.30 |
| | 87.9 | % | | $ | 133 |
| 2.1 |
| | $ | 612 |
| | $ | 298.05 |
| | $ | 523 |
| | $ | 254.11 |
| | 85.3 | % | | $ | 89 |
|
| Florida | 3.4 |
| | 953 |
| | 284.53 |
| | 839 |
| | 250.58 |
| | 88.1 |
| | 114 |
| 1.6 |
| | 494 |
| | 297.24 |
| | 462 |
| | 277.79 |
| | 93.5 |
| | 32 |
|
| Illinois | 1.2 |
| | 303 |
| | 261.43 |
| | 269 |
| | 232.06 |
| | 88.8 |
| | 34 |
| 0.6 |
| | 163 |
| | 275.26 |
| | 145 |
| | 244.86 |
| | 89.0 |
| | 18 |
|
| Michigan | 2.4 |
| | 756 |
| | 316.18 |
| | 681 |
| | 285.13 |
| | 90.2 |
| | 75 |
| 1.2 |
| | 387 |
| | 334.25 |
| | 337 |
| | 290.16 |
| | 86.8 |
| | 50 |
|
| New Mexico | 1.5 |
| | 678 |
| | 450.62 |
| | 601 |
| | 399.17 |
| | 88.6 |
| | 77 |
| 0.8 |
| | 338 |
| | 440.12 |
| | 304 |
| | 396.35 |
| | 90.1 |
| | 34 |
|
New York (1) | — |
| | — |
| | — |
| | — |
| | — |
| | — |
| | — |
| 0.1 |
| | 32 |
| | 427.40 |
| | 30 |
| | 403.71 |
| | 94.5 |
| | 2 |
|
| Ohio | 2.0 |
| | 971 |
| | 481.44 |
| | 882 |
| | 437.35 |
| | 90.8 |
| | 89 |
| 1.0 |
| | 501 |
| | 491.51 |
| | 424 |
| | 415.87 |
| | 84.6 |
| | 77 |
|
| Puerto Rico | 2.0 |
| | 351 |
| | 172.98 |
| | 349 |
| | 171.95 |
| | 99.4 |
| | 2 |
| 1.0 |
| | 184 |
| | 183.46 |
| | 167 |
| | 167.44 |
| | 91.3 |
| | 17 |
|
| South Carolina | 0.6 |
| | 171 |
| | 276.61 |
| | 138 |
| | 223.58 |
| | 80.8 |
| | 33 |
| 0.3 |
| | 102 |
| | 312.28 |
| | 94 |
| | 285.97 |
| | 91.6 |
| | 8 |
|
| Texas | 2.2 |
| | 1,255 |
| | 575.87 |
| | 1,074 |
| | 492.65 |
| | 85.5 |
| | 181 |
| 1.1 |
| | 597 |
| | 559.98 |
| | 525 |
| | 493.07 |
| | 88.1 |
| | 72 |
|
| Utah | 0.9 |
| | 224 |
| | 252.08 |
| | 208 |
| | 234.46 |
| | 93.0 |
| | 16 |
| 0.4 |
| | 106 |
| | 236.31 |
| | 104 |
| | 230.53 |
| | 97.6 |
| | 2 |
|
| Washington | 4.1 |
| | 1,065 |
| | 260.05 |
| | 958 |
| | 233.84 |
| | 89.9 |
| | 107 |
| 2.1 |
| | 569 |
| | 265.48 |
| | 521 |
| | 243.49 |
| | 91.7 |
| | 48 |
|
| Wisconsin | 0.8 |
| | 196 |
| | 247.57 |
| | 188 |
| | 236.92 |
| | 95.7 |
| | 8 |
| 0.4 |
| | 103 |
| | 262.32 |
| | 90 |
| | 231.86 |
| | 88.4 |
| | 13 |
|
Other (2) | — |
| | 6 |
| | — |
| | 33 |
| | — |
| | — |
| | (27 | ) | — |
| | 3 |
| | — |
| | 22 |
| | — |
| | — |
| | (19 | ) |
| | 25.1 |
| | $ | 8,024 |
| | $ | 320.17 |
| | $ | 7,182 |
| | $ | 286.57 |
| | 89.5 | % | | $ | 842 |
| 12.7 |
| | $ | 4,191 |
| | $ | 329.88 |
| | $ | 3,748 |
| | $ | 295.01 |
| | 89.4 | % | | $ | 443 |
|
|
| | | | | | | | | | | | | | | | | | | | | | | | | |
| | Nine Months Ended September 30, 2017 |
| | Member Months | | Premium Revenue | | Medical Care Costs | | MCR | | Medical Margin |
| | | Total | | PMPM | | Total | | PMPM | | |
| California | 6.8 |
| | $ | 2,012 |
| | $ | 294.26 |
| | $ | 1,742 |
| | $ | 254.67 |
| | 86.5 | % | | $ | 270 |
|
| Florida | 6.0 |
| | 1,953 |
| | 323.86 |
| | 1,870 |
| | 310.09 |
| | 95.7 |
| | 83 |
|
| Illinois | 1.6 |
| | 447 |
| | 284.18 |
| | 492 |
| | 312.54 |
| | 110.0 |
| | (45 | ) |
| Michigan | 3.7 |
| | 1,203 |
| | 324.12 |
| | 1,062 |
| | 286.35 |
| | 88.3 |
| | 141 |
|
| New Mexico | 2.4 |
| | 1,015 |
| | 422.25 |
| | 949 |
| | 394.66 |
| | 93.5 |
| | 66 |
|
New York (1) | 0.3 |
| | 135 |
| | 444.77 |
| | 128 |
| | 421.58 |
| | 94.8 |
| | 7 |
|
| Ohio | 3.1 |
| | 1,666 |
| | 531.17 |
| | 1,498 |
| | 477.81 |
| | 90.0 |
| | 168 |
|
| Puerto Rico | 2.9 |
| | 553 |
| | 190.99 |
| | 513 |
| | 177.01 |
| | 92.7 |
| | 40 |
|
| South Carolina | 1.0 |
| | 329 |
| | 325.43 |
| | 301 |
| | 298.43 |
| | 91.7 |
| | 28 |
|
| Texas | 4.2 |
| | 2,109 |
| | 509.09 |
| | 1,819 |
| | 439.11 |
| | 86.3 |
| | 290 |
|
| Utah | 1.5 |
| | 402 |
| | 269.48 |
| | 354 |
| | 237.20 |
| | 88.0 |
| | 48 |
|
| Washington | 7.1 |
| | 1,958 |
| | 277.83 |
| | 1,731 |
| | 245.62 |
| | 88.4 |
| | 227 |
|
| Wisconsin | 1.2 |
| | 376 |
| | 319.57 |
| | 340 |
| | 289.24 |
| | 90.5 |
| | 36 |
|
Other (2) | — |
| | 7 |
| | — |
| | 23 |
| | — |
| | — |
| | (16 | ) |
| | 41.8 |
| | $ | 14,165 |
| | $ | 339.19 |
| | $ | 12,822 |
| | $ | 307.03 |
| | 90.5 | % | | $ | 1,343 |
|
|
| | | | | | | | | | | | | | | | | | | | | | | | | |
| | Nine Months Ended September 30, 2016 |
| | Member Months | | Premium Revenue | | Medical Care Costs | | MCR | | Medical Margin |
| | | Total | | PMPM | | Total | | PMPM | | |
| California | 6.1 |
| | $ | 1,707 |
| | $ | 280.21 |
| | $ | 1,485 |
| | $ | 243.64 |
| | 86.9 | % | | $ | 222 |
|
| Florida | 5.0 |
| | 1,447 |
| | 288.74 |
| | 1,301 |
| | 259.60 |
| | 89.9 |
| | 146 |
|
| Illinois | 1.8 |
| | 466 |
| | 266.11 |
| | 414 |
| | 236.39 |
| | 88.8 |
| | 52 |
|
| Michigan | 3.6 |
| | 1,143 |
| | 322.08 |
| | 1,018 |
| | 286.77 |
| | 89.0 |
| | 125 |
|
| New Mexico | 2.3 |
| | 1,016 |
| | 447.07 |
| | 905 |
| | 398.22 |
| | 89.1 |
| | 111 |
|
New York (1) | 0.1 |
| | 32 |
| | 427.40 |
| | 30 |
| | 403.71 |
| | 94.5 |
| | 2 |
|
| Ohio | 3.0 |
| | 1,472 |
| | 484.82 |
| | 1,306 |
| | 430.14 |
| | 88.7 |
| | 166 |
|
| Puerto Rico | 3.0 |
| | 535 |
| | 176.44 |
| | 516 |
| | 170.46 |
| | 96.6 |
| | 19 |
|
| South Carolina | 0.9 |
| | 273 |
| | 288.93 |
| | 232 |
| | 245.13 |
| | 84.8 |
| | 41 |
|
| Texas | 3.3 |
| | 1,852 |
| | 570.65 |
| | 1,599 |
| | 492.79 |
| | 86.4 |
| | 253 |
|
| Utah | 1.3 |
| | 330 |
| | 246.78 |
| | 312 |
| | 233.14 |
| | 94.5 |
| | 18 |
|
| Washington | 6.2 |
| | 1,634 |
| | 261.91 |
| | 1,479 |
| | 237.15 |
| | 90.5 |
| | 155 |
|
| Wisconsin | 1.2 |
| | 299 |
| | 252.45 |
| | 278 |
| | 235.25 |
| | 93.2 |
| | 21 |
|
Other (2) | — |
| | 9 |
| | — |
| | 55 |
| | — |
| | — |
| | (46 | ) |
| | 37.8 |
| | $ | 12,215 |
| | $ | 323.44 |
| | $ | 10,930 |
| | $ | 289.41 |
| | 89.5 | % | | $ | 1,285 |
|
| |
| (1) | The New York health plan was acquired on August 1, 2016. |
| |
| (2) | “Other” medical care costs include primarily medically related administrative costs of the parent company, and direct delivery costs. |
MEDICAL CARE COSTS BY TYPE
The following table provides the details of consolidated medical care costs by category for the periods indicated (dollars in millions except PMPM amounts):
| | | | Three Months Ended June 30, | Three Months Ended September 30, |
| | 2017 | | 2016 | 2017 | | 2016 |
| | Amount | | PMPM | | % of Total | | Amount | | PMPM | | % of Total | Amount | | PMPM | | % of Total | | Amount | | PMPM | | % of Total |
| Fee for service | $ | 3,348 |
| | $ | 238.04 |
| | 74.5 | % | | $ | 2,620 |
| | $ | 206.01 |
| | 72.9 | % | $ | 3,196 |
| | $ | 234.51 |
| | 75.8 | % | | $ | 2,799 |
| | $ | 220.29 |
| | 74.7 | % |
| Pharmacy | 650 |
| | 46.23 |
| | 14.5 |
| | 529 |
| | 41.59 |
| | 14.7 |
| 638 |
| | 46.85 |
| | 15.1 |
| | 567 |
| | 44.65 |
| | 15.1 |
|
| Capitation | 356 |
| | 25.29 |
| | 7.9 |
| | 304 |
| | 23.87 |
| | 8.5 |
| 342 |
| | 25.07 |
| | 8.1 |
| | 302 |
| | 23.83 |
| | 8.1 |
|
| Direct delivery | 22 |
| | 1.54 |
| | 0.5 |
| | 18 |
| | 1.39 |
| | 0.5 |
| 18 |
| | 1.37 |
| | 0.4 |
| | 21 |
| | 1.66 |
| | 0.5 |
|
| Other | 115 |
| | 8.19 |
| | 2.6 |
| | 123 |
| | 9.68 |
| | 3.4 |
| 26 |
| | 1.88 |
| | 0.6 |
| | 59 |
| | 4.58 |
| | 1.6 |
|
| | $ | 4,491 |
| | $ | 319.29 |
| | 100.0 | % | | $ | 3,594 |
| | $ | 282.54 |
| | 100.0 | % | $ | 4,220 |
| | $ | 309.68 |
| | 100.0 | % | | $ | 3,748 |
| | $ | 295.01 |
| | 100.0 | % |
| | | | Six Months Ended June 30, | Nine Months Ended September 30, |
| | 2017 | | 2016 | 2017 | | 2016 |
| | Amount | | PMPM | | % of Total | | Amount | | PMPM | | % of Total | Amount | | PMPM | | % of Total | | Amount | | PMPM | | % of Total |
| Fee for service | $ | 6,434 |
| | $ | 228.68 |
| | 74.8 | % | | $ | 5,357 |
| | $ | 213.77 |
| | 74.6 | % | $ | 9,630 |
| | $ | 230.58 |
| | 75.1 | % | | $ | 8,156 |
| | $ | 215.96 |
| | 74.6 | % |
| Pharmacy | 1,266 |
| | 45.00 |
| | 14.7 |
| | 1,054 |
| | 42.05 |
| | 14.7 |
| 1,904 |
| | 45.60 |
| | 14.8 |
| | 1,621 |
| | 42.93 |
| | 14.8 |
|
| Capitation | 680 |
| | 24.17 |
| | 7.9 |
| | 599 |
| | 23.87 |
| | 8.3 |
| 1,022 |
| | 24.47 |
| | 8.0 |
| | 901 |
| | 23.86 |
| | 8.3 |
|
| Direct delivery | 44 |
| | 1.56 |
| | 0.5 |
| | 34 |
| | 1.36 |
| | 0.5 |
| 62 |
| | 1.50 |
| | 0.5 |
| | 55 |
| | 1.46 |
| | 0.5 |
|
| Other | 178 |
| | 6.33 |
| | 2.1 |
| | 138 |
| | 5.52 |
| | 1.9 |
| 204 |
| | 4.88 |
| | 1.6 |
| | 197 |
| | 5.20 |
| | 1.8 |
|
| | $ | 8,602 |
| | $ | 305.74 |
| | 100.0 | % | | $ | 7,182 |
| | $ | 286.57 |
| | 100.0 | % | $ | 12,822 |
| | $ | 307.03 |
| | 100.0 | % | | $ | 10,930 |
| | $ | 289.41 |
| | 100.0 | % |
PREMIUM TAXES
The premium tax ratio (premium tax expense as a percentage of premium revenue plus premium tax revenue) was 2.4%2.2% in the secondthird quarter of 2017 compared with 2.6%2.9% in the secondthird quarter of 2016 and 2.3% in the sixnine months
ended JuneSeptember 30, 2017, compared with 2.6%2.7% in the sixnine months ended JuneSeptember 30, 2016. This decline was primarily due to the temporary suspension of a Michigan HMO use tax effective January 1, 2017, which was partially offset by a higher California premium tax rate effective July 1, 2016, and significant revenue growth at our Florida health plan, which operates in a state with no premium tax.
HEALTH INSURER FEE (HIF) REVENUE AND EXPENSES
The Consolidated Appropriations Act of 2016 provided for a HIF moratorium in 2017. Therefore, there are no HIF revenues or expenses in 2017.
MOLINA MEDICAID SOLUTIONS
The Molina Medicaid Solutions segment provides support to state government agencies in the administration of their Medicaid programs, including business processing, information technology development and administrative services.
FINANCIAL OVERVIEW
The Molina Medicaid Solutions segment service margin for the secondthird quarter of 2017 and 2016, and for the sixnine months ended JuneSeptember 30, 2017 and 2016, was insignificant.
As discussed further in Notes to Consolidated Financial Statements, Note 10, “Impairment Losses,” we recorded a goodwill impairment charge of $28 million, reported in our consolidated statements of operations as “Impairment losses.”
OTHER
The Other segment includes primarily our Pathways behavioral health and social services provider, and corporate amounts not allocated to other reportable segments.
Substantially all of Pathways’ revenue is derived from contracts with state or local government agencies and government intermediaries, the majority of which are negotiated fee-for-service arrangements. A significant number of these contracts allow the payer to terminate the contract immediately with or without cause.
FINANCIAL OVERVIEW
The Other segment service margin for the secondthird quarter of 2017 and 2016, and for the sixnine months ended JuneSeptember 30, 2017 and 2016, was insignificant.
In the course of developing the Restructuring Plan, asAs discussed further in Notes to Consolidated Financial Statements, Note 11, “Restructuring and Separation Costs,10, “Impairment Losses,” we determined that future benefits to be derived from Pathways, including integration with our health plans, would be less than previously anticipated. In addition, poorer than expected year-to-date operating results and lower projections of operating results for periods in the near term led us to conclude that a triggering event for an interim impairment analysis had occurred in the second quarter of 2017.
For the Other segment in total,2017 we recorded impairment chargeslosses, primarily relating to our Pathways subsidiary, of $61 million for goodwill and $11 million for intangible assets, or $72 million in the aggregate, reported in our consolidated statementsaggregate. In the third quarter of operations as “Impairment losses.”2017, we recorded a further goodwill impairment loss relating to the Pathways subsidiary, of $101 million.
OTHER CONSOLIDATED INFORMATION
GENERAL AND ADMINISTRATIVE EXPENSES
The G&A ratio was 8.1% in7.6% for both the secondthird quarter of 2017 and 2016. The G&A ratio increased to 8.5%8.2% for the sixnine months ended JuneSeptember 30, 2017, compared with 7.9%7.8% for the sixnine months ended JuneSeptember 30, 2016. The yearRefer to date G&A ratio increased over 2016 primarily due to costs associated with increased Marketplace enrollmentdiscussion above, in 2017 and the reduction to revenue as a result of the 2017 Health Insurer Fee (HIF) moratorium.“Consolidated Results.”
DEPRECIATION AND AMORTIZATION
Depreciation and amortization, as a percentage of total revenue, was 0.7% and 0.8% in the sixnine months ended JuneSeptember 30, 2017 and 2016.2016, respectively.
IMPAIRMENT LOSSES
See Notes to Consolidated Financial Statements, Note 10, “Impairment Losses.”
RESTRUCTURING AND SEPARATION COSTS
See Notes to Consolidated Financial Statements, Note 11, “Restructuring and Separation Costs.”
INTEREST EXPENSE
Interest expense was $27$32 million for the secondthird quarter of 2017, compared with $25$26 million for the secondthird quarter of 2016. Interest expense increased to $53was $85 million for the sixnine months ended JuneSeptember 30, 2017, from $50compared with $76 million for the sixnine months ended JuneSeptember 30, 2016. Interest expense includes non-cash interest expense relating primarily to the amortization of the discount on convertible senior notes, which amounted to $8 million and $7 million for secondboth the third quarter of 2017 and 2016, respectively and $16$24 million and $15$23 million in the sixnine months ended JuneSeptember 30, 2017 and 2016, respectively. We expect interest expense to continue to increase in future periods as a result of our recent $330 million offering of 4.875% Notes.Notes, and borrowings under the Credit Facility. See further discussion in Notes to Consolidated Financial Statements, Note 7, “Debt.”
OTHER INCOME, NET
As described in Notes to Consolidated Financial Statements, Note 1, “Basis of Presentation,” in February 2017, we received an aggregate termination fee of $75 million for the Terminatedterminated Medicare Acquisition. This amount is reported in “Other income, net” in our consolidated statements of operations.
INCOME TAXES
The (benefit) provision for income taxes was recorded at an effective rate of 26.8%14.6% for the secondthird quarter of 2017, compared with 59.8%54.0% for the secondthird quarter of 2016, and an effective rate of 16.0%15.5% for the sixnine months ended JuneSeptember 30, 2017 compared with 60.7%58.0% for the sixnine months ended JuneSeptember 30, 2016. The significant change in the effective tax rate was primarily a result of pretax losses in 2017 combined with significant nondeductible expenses (primarily, compensationseparation costs and goodwill impairment) and the 2017 HIF moratorium as described above in “Health Plans—Health Insurer Fee (HIF) Revenue and Expenses.”
LIQUIDITY AND FINANCIAL CONDITION
INTRODUCTION
We manage our cash, investments, and capital structure to meet the short- and long-term obligations of our business while maintaining liquidity and financial flexibility. We forecast, analyze, and monitor our cash flows to enable prudent investment management and financing within the confines of our financial strategy.
A majority of the assets held by our Health Plans segment regulated subsidiaries is in the form of cash, cash equivalents, and investments. After considering expected cash flows from operating activities, we generally invest
cash of regulated subsidiaries that exceeds our expected short-term obligations in longer term, investment-grade, and marketable debt securities to improve our overall investment return. These investments are made pursuant to board-approved investment policies that conform to applicable state laws and regulations.
Our investments are classified as current assets, except for our held-to-maturity restricted investments, which are classified as non-current assets, and which are not included in the totals below. Our held-to-maturity restricted investments are invested principally in certificates of deposit and U.S. treasury securities.
Investment income increased to $22$37 million for the sixnine months ended JuneSeptember 30, 2017, compared with $16$25 million for the sixnine months ended JuneSeptember 30, 2016, primarily due to the increase in invested assets.
MARKET RISK
Our earnings and financial position are exposed to financial market risk relating to changes in interest rates, and the resulting impact on investment income and interest expense.
Substantially all of our investments and restricted investments are subject to interest rate risk and will decrease in value if market interest rates increase. Assuming a hypothetical and immediate 1% increase in market interest rates at JuneSeptember 30, 2017, the fair value of our fixed income investments would decrease by approximately $27$25 million. Declines in interest rates over time will reduce our investment income.
For further information on fair value measurements and our investment portfolio, please refer to Notes to Consolidated Financial Statements, Note 4, “Fair Value Measurements,” and Note 5, “Investments.”
Borrowings under our Credit Facility bear interest based, at our election, on a base rate or an adjusted London Interbank Offered Rate (LIBOR), plus in each case the applicable margin. As of JuneSeptember 30, 2017, no amounts were$300 million was outstanding under the Credit Facility.
LIQUIDITY
A condensed schedule of cash flows to facilitate our discussion of liquidity follows:
| | | | Six Months Ended June 30, | Nine Months Ended September 30, |
| | 2017 | | 2016 | | Change | 2017 | | 2016 | | Change |
| | (In millions) | (In millions) |
| Net cash provided by operating activities | $ | 672 |
| | $ | 278 |
| | $ | 394 |
| $ | 957 |
| | $ | 633 |
| | $ | 324 |
|
| Net cash used in investing activities | (845 | ) | | (273 | ) | | (572 | ) | (474 | ) | | (131 | ) | | (343 | ) |
| Net cash provided by financing activities | 333 |
| | 11 |
| | 322 |
| 632 |
| | 11 |
| | 621 |
|
| Net increase in cash and cash equivalents | $ | 160 |
| | $ | 16 |
| | $ | 144 |
| $ | 1,115 |
| | $ | 513 |
| | $ | 602 |
|
Operating Activities
Cash provided by operating activities increased $394$324 million in the sixnine months ended JuneSeptember 30, 2017 compared with the sixnine months ended JuneSeptember 30, 2016. The change in net (loss) income, pluspartially offset by the effect of adjustments to reconcile net loss to net cash provided by operating activities, reduced cash provided by operating activities by $195$169 million. This change was more than offset by the aggregate of the following changes:
Medical claims and benefits payable. In 2017, the change in medical claims and benefits payable increased cash flows from operations by $381 million, primarily due to additional accruals relating to increased membership in 2017.
Receivables and deferred revenue. In 2017, the aggregate change in receivables and deferred revenue increased cash flows from operations by $470$395 million. Cash flows from operations in each period were impacted by the timing of premium revenues receipts. In general, state or federal payors may delay our premium payments, which we record as a receivable, or they may prepay the following month’s premium payment, which we record as deferred revenue. We typically receive capitation payments monthly; however, state or federal payors may decide to adjust their payment schedules which could positively or negatively impact our reported cash flows from operating activities in a any given period. In 2017, the year-over-year effect of the timing of premiums received at our California, Florida, Michigan, Ohio, Texas and Washington health plans positively impacted our cash flows from operating activities.
Amounts due government agencies. In 2017, the change in amounts due government agencies increased cash flows from operations by $133 million, due primarily to additional accruals for ACA Marketplace risk transfer payments.
Accounts payable and accrued liabilities. In 2017, the change in accounts payable and accrued liabilities decreased cash flows from operations by $165 million. In 2016, accounts payable and accrued liabilities increased $147$381 million, primarily due to payments in the HIF payable at June 30, 2016. Asthird quarter of June 30, 2017, there is no comparable accrual because of the HIF moratorium.2017.
Investing Activities
Net cash used in investing activities increased $572$343 million in the sixnine months ended JuneSeptember 30, 2017 compared with the sixnine months ended JuneSeptember 30, 2016, primarily due to higher purchases of investments, net of sales and maturities, in the current year.
Financing Activities
Net cash provided by financing activities increased $322$621 million in the sixnine months ended JuneSeptember 30, 2017 compared with the sixnine months ended JuneSeptember 30, 2016, due to proceeds received from the 4.875% Notes offering.offering and borrowings under the Credit Facility.
FINANCIAL CONDITION
We believe that our cash resources, combined with borrowing capacity available under our Credit Facility, as discussed further below in “Future“Future Sources and Uses of Liquidity — Sources”Liquidity—Sources”, and internally generated funds will be sufficient to support costs under the Restructuring Plan, operations, regulatory requirements, and capital expenditures for at least the next 12 months.
On a consolidated basis, at JuneSeptember 30, 2017, our working capital was $1,376$1,746 million, compared with $1,418 million at December 31, 2016. At JuneSeptember 30, 2017, our cash and investments amounted to $5,616$6,166 million, compared with $4,689 million at December 31, 2016.
Debt Ratings. Our 5.375% Notes are rated “BB” by Standard & Poor’s, and “Ba3”“B2” by Moody’s Investor Service, Inc. A significant downgrade in our ratings could adversely affect our borrowing capacity and costs.
Financial Covenants. Our Credit Facility contains customary non-financial and financial covenants, including a net leverage ratio and an interest coverage ratio,ratio. Such ratios, presented below, are computed as follows:defined by the terms of the Credit Facility.
|
| | | |
| Credit Facility Financial Covenants | Required Per Agreement | | As of JuneSeptember 30, 2017 |
| | | | |
| Net leverage ratio | <4.0x | | 3.3x2.5x |
| Interest coverage ratio | >3.5x | | 4.5x8.8x |
In addition, the terms of our 4.875% Notes, 5.375% Notes and each of the 1.125% and 1.625% Convertible Notes contain cross-default provisions with the Credit Facility that are triggered upon an event of default under the Credit Facility, and when borrowings under the Credit Facility equal or exceed certain amounts as defined in the related indentures. As of JuneSeptember 30, 2017, we were in compliance with all covenants under the Credit Facility.
FUTURE SOURCES AND USES OF LIQUIDITY
Sources
Our Health Plans segment regulated subsidiaries generate significant cash flows from premium revenue, which we generally receive a short time before we pay for the related health care services. Such cash flows are our primary source of liquidity. Thus, any future decline in our profitability may have a negative impact on our liquidity.
Dividends from Subsidiaries. When available and as permitted by applicable regulations, cash in excess of the capital needs of our regulated health plans is generally paid in the form of dividends to our unregulated parent company to be used for general corporate purposes. In the sixnine months ended JuneSeptember 30, 2017 and 2016, we received $120$100 million and $50 million, respectively, in dividends from our regulated health plan subsidiaries. We received $36 million in dividends from our unregulated subsidiaries in the nine months ended September 30, 2017. See further discussion in Notes to Consolidated Financial Statements, Note 13, “Commitments and Contingencies—Regulatory Capital Requirements and Dividend Restrictions.”
Restructuring Plan. In total,As previously disclosed, we estimate that the Restructuring Planour restructuring plan will reduce annualized run-rate expenses by approximately $300 million to $400 million upon its completion in latewhen completed by the end of 2018. We have already achieved $200 million of these run-rate reductions on an annualized basis, which are a result of staff reductions, will be in place by December 2017, and therefore will fully contribute to our 2018 results. Since the close of the second quarter, we have already achieved $55 million of our annualized run-rate reduction target as a result of staff reductions taken on July 27th.take full effect no later than January 1, 2018. All savings targets discussed in regards to the Restructuring Planrestructuring plan represent annualized run-rate savings that we expect to achieve during the year following the indicated implementation date. One-timeWe expect one-time costs associated with the Restructuring Plan are expectedrestructuring plan to exceed the benefits realized in 2017 due to the upfront payment of implementation costs and the delayed benefit of full savings until the beginning of 2018. We expect the cost savings to reduce both “General and administrative expenses” and “Medical care costs” reported on our consolidated statements of operations.
The following table illustrates our estimates of run-rate savings associated with the Restructuring Plan.restructuring plan. Such savings will be offset, through the end of 2018, by the costs noted below in “Future Sources and Uses of Liquidity—Uses.” Following 2018, the savings will be offset by approximately $20 million in run-rate expenses resulting from the implementation of Restructuring Planrestructuring plan initiatives. |
| | | | | | |
| Estimated Savings Expected to be Realized by Reportable Segment | | Health Plans | | Other | | Total |
| | | (In millions) |
| General and administrative expenses | | $50 | | $120 to $140 | | $170 to $190 |
| Medical care costs | | $110 to $190 | | $20 | | $130 to $210 |
| | | $160 to $240 | | $140 to $160 | �� | $300 to $400 |
Credit Facility. Refer to Notes to Consolidated Financial Statements, Note 7, “Debt,” for a detailed discussion of our Credit Facility. We intend to borrow approximately $300 million underIn August 2017, we drew against the Credit Facility in early August 2017.the amount of $300 million.
4.875% Notes. The 4.875% Notes contain a limitation on the use of proceeds which required us to deposit the net proceeds from their issuance into a segregated deposit account, a current asset reported as “Restricted investments” in our consolidated balance sheets. See further discussion in Notes to Consolidated Financial Statements, Note 7, “Debt.”
Shelf Registration Statement. We have a shelf registration statement on file with the Securities and Exchange Commission to register an unlimited amount of any combination of debt or equity securities in one or more
offerings. Specific information regarding the terms and securities being offered will be provided at the time of an offering. Proceeds from future offerings are expected to be used for general corporate purposes, including, but not limited to, the repayment of debt, investments in or extensions of credit to our subsidiaries and the financing of possible acquisitions or business expansion.
Uses
Restructuring. We recorded $118 million of restructuring costs in the third quarter of 2017. Restructuring costs incurred to date consist primarily of termination benefits, write-offs of capitalized software due to the re-design of our core operating processes, restructuring of our direct delivery operations, and consulting fees. Under the restructuring plan, and also including separation costs to former executives, we have made cash payments of $24 million in the nine months ended September 30, 2017, and have accrued a liability of $65 million for future payments as of September 30, 2017.
We estimate that total pre-tax costs associated with the Restructuring Planrestructuring plan will be approximately $130$70 million to $150$90 million forin the second halffourth quarter of 2017, with an additional $20 million to $40 million to be incurred in 2018. We currently estimate that a majority of the costs we expect to incur in the fourth quarter of 2017 will be settled in cash. The costs we incur associated with the Restructuring Plan will berestructuring plan are reported in “Restructuring and separation costs” in our consolidated statements of operations.
|
| | | | | | | | | |
| Estimated Costs Expected to be Incurred by Reportable Segment | | Health Plans | | Molina Medicaid Solutions | | Other | | Total |
| | | (In millions) |
Separation costs–one-time benefit arrangement for a workforce reductionTermination benefits | | $2530 to $30$35 | | — |
| | $3530 to $40$35 | | $60 to $70 |
| Other restructuring costs | | $5540 to $60$45 | | $55 to $6010 | | $110 to $120$115 | | $160 to $170 |
| | | $8070 to $90$80 | | $90 to $10010 | | $170140 to $190$150 | | $220 to $240 |
Regulatory Capital Requirements and Dividend Restrictions. For more information on our regulatory capital requirements and dividend restrictions, refer to Notes to Consolidated Financial Statements, Note 13, “Commitments and Contingencies.”
States’ Budgets. From time to time, the states in which our health plans operate may experience financial difficulties, which could lead to delays in premium payments. Until July 4, 2017, the state of Illinois operated without a budget for its current fiscal year. As of JuneSeptember 30, 2017, our Illinois health plan served approximately 163,000 members, and recognized premium revenue of approximately $310$447 million in the first half ofnine months ended September 30, 2017. As of July 28,October 27, 2017, the state of Illinois owed us approximately $116$220 million for certain March April, May and Junethrough September 2017 premiums.
On May 3, 2017, Puerto Rico’s financial oversight board filed for a form of bankruptcy in the U.S. District Court in Puerto Rico under Title III of PROMESA. The Title III provision allows for a court debt restructuring process similar to U.S. bankruptcy protection. To the extent such bankruptcy results in our failure to receive payment of amounts due under our Medicaid contract with the Commonwealth or the inability of the Commonwealth to extend our Medicaid contract at the end of its current term, such bankruptcy could have a material adverse effect on our business, financial condition, cash flows, or results of operations. As of JuneSeptember 30, 2017, the plan served approximately 322,000306,000 members and recorded premium revenue of approximately $362$553 million in the first half ofnine months ended September 30, 2017. As of July 28,October 27, 2017, the Commonwealth was current with its premium payments.
Convertible Notes. We have outstanding $550 million aggregate principal amount of 1.125% cash convertible senior notes due January 15, 2020, unless earlier repurchased or converted. We refer to these notes as our 1.125% Convertible Notes. We also have outstanding $302 million aggregate principal amount of 1.625% convertible senior notes due August 14, 2044, unless earlier repurchased, redeemed, or converted. We refer to these notes as our 1.625% Convertible Notes. We refer to the 1.125% Convertible Notes and 1.625% Convertible Notes collectively as the Convertible Notes. The 1.125% Convertible Notes are convertible entirely tointo cash, and the 1.625% Convertible Notes are convertible partially tointo cash, each prior to their respective maturity dates under certain circumstances, one of which relates to the closing price of our common stock over a specified period. We refer to this conversion trigger as the stock price trigger.
The stock price trigger for the 1.125% Convertible Notes is $53.00 per share. The 1.125% Convertible Notes met this trigger in the quarter ended JuneSeptember 30, 2017; therefore, they are convertible into cash and are reported in current portion of long-term debt as of JuneSeptember 30, 2017.
The stock price trigger for the 1.625% Convertible Notes is $75.51 per share. The 1.625% Convertible Notes did not meet this stock price trigger in the quarter ended JuneSeptember 30, 2017. OnHowever, on contractually specified dates beginning in 2018, holders of the 1.625% Convertible Notes may require us to repurchase some or all of such notes. In addition, beginning May 15, 2018 until August 19, 2018, holders may convert some or all of the 1.625% Convertible Notes. Because of thisthese put and conversion feature,features, the 1.625% Convertible Notes are reported in current portion of long-term debt as of JuneSeptember 30, 2017. As noted above, because the proceeds from the 4.875% Notes are initially restricted to payments upon conversion or redemption of the 1.625% Convertible Notes, such restricted investments are also classified as current in the accompanying consolidated balance sheets.
For economic reasons related to the trading market for our Convertible Notes, we believe that the amount of the notes that may be converted over the next twelve months, if any, will not be significant. However, if the trading market for our Convertible Notes becomes closed or restricted due to market turmoil or other reasons such that the notes cannot be traded, or if the trading price of our Convertible Notes, which normally trade at a marginal premium to the underlying composite stock-and-interest economic value, no longer includes that marginal premium, holders of our Convertible Notes may elect to convert the notes to cash.
We currently have sufficient available cash, combined with borrowing capacity available under our Credit Facility, to fund such conversions.
CONTRACTUAL OBLIGATIONS
A summary of future obligations under our various contractual obligations and commitments as of December 31, 2016, was disclosed in our 2016 Annual Report on Form 10-K. There
As described further in the Notes to Consolidated Financial Statements, Note 7 “Debt,” on June 6, 2017, we completed the private offering of $330 million aggregate principal amount of senior notes (4.875% Notes) due June 15, 2025. In addition, in the third quarter of 2017, we borrowed $300 million under our Credit Facility.
Other than the transactions described above, there were no material changes to this previously filed information outside the ordinary course of business during the sixnine months ended JuneSeptember 30, 2017. For additional information regarding our long-term debt, including maturity dates, refer to Notes to Consolidated Financial Statements, Note 7, “Debt.”
CRITICAL ACCOUNTING ESTIMATES
When we prepare our consolidated financial statements, we use estimates and assumptions that may affect reported amounts and disclosures; actual results could differ from these estimates. Our critical accounting estimates relate to:
Health Plans segment medical claims and benefits payable. Refer to Notes to Consolidated Financial Statements, Note 6, “Medical Claims and Benefits Payable,” for a table that presents the components of the change in medical claims and benefits payable, and for additional information regarding the factors used to determine our changes in estimates for all periods presented in the accompanying consolidated financial statements. Other than the discussion as noted above, there have been no significant changes during the sixnine months ended JuneSeptember 30, 2017, to our disclosure reported in “Critical Accounting Estimates” in our Annual Report on Form 10-K for the year ended December 31, 2016.
Health Plans segment contractual provisions that may adjust or limit revenue or profit. For a discussion of this topic, including amounts recorded in our consolidated financial statements, refer to Notes to Consolidated Financial Statements, Note 2, “Significant Accounting Policies.”
Health Plans segment quality incentives. For a discussion of this topic, including amounts recorded in our consolidated financial statements, refer to Notes to Consolidated Financial Statements, Note 2, “Significant Accounting Policies.”
Molina Medicaid Solutions segment revenue and cost recognition. There have been no significant changes during the sixnine months ended JuneSeptember 30, 2017, to our disclosure reported in “Critical Accounting Estimates” in our Annual Report on Form 10-K for the year ended December 31, 2016.
Goodwill and intangible assets, net. Please refer to Notes to Consolidated Financial Statements, Note 2, “Significant Accounting Policies,” regarding our adoption of Accounting Standards Update No. 2017-04 as of June 30, 2017, which has simplified the test for goodwill impairment. WeIn the third quarter of 2017, we
recorded impairment charges of $129 million for goodwill, and in the second quarter of 2017, we recorded impairment charges of $61 million for goodwill and $11 million for intangible assets, or $72 million in the aggregate,aggregate. Such charges are reported in the accompanying consolidated statements of operations as “Impairment losses.” At JuneSeptember 30, 2017, goodwill and intangible assets, net, represented approximately 8%6% of total assets and 44%37% of total stockholders’ equity, compared with 10% and 46%, respectively, at December 31, 2016. Refer to Notes to Consolidated Financial Statements, Note 10, “Impairment Losses.”
SUPPLEMENTAL INFORMATION
FINANCIAL MEASURES THAT SUPPLEMENT U.S. GAAP (NON-GAAP FINANCIAL MEASURES)
We use these non-GAAP financial measures as supplemental metrics in evaluating our financial performance, making financing and business decisions, and forecasting and planning for future periods. For these reasons, management believes such measures are useful supplemental measures to investors in comparing our performance to the performance of other public companies in the health care industry.
EBITDA*
We believe that earnings before interest, taxes, depreciation and amortization (EBITDA*) is helpful in assessing our ability to meet the cash demands of our operating units.
| | | | Three Months Ended June 30, | | Six Months Ended June 30, | Three Months Ended September 30, | | Nine Months Ended September 30, |
| 2017 | | 2016 | | 2017 | | 2016 | 2017 | | 2016 | | 2017 | | 2016 |
| | (In millions) | (In millions) |
| Net (loss) income | $ | (230 | ) | | $ | 33 |
| | $ | (153 | ) | | $ | 57 |
| $ | (97 | ) | | $ | 42 |
| | $ | (250 | ) | | $ | 99 |
|
| Adjustments: | | | | | | | | | | | | | | |
| Depreciation, and amortization of intangible assets and capitalized software | 44 |
| | 39 |
| | 90 |
| | 76 |
| 39 |
| | 42 |
| | 129 |
| | 118 |
|
| Interest expense | 27 |
| | 25 |
| | 53 |
| | 50 |
| 32 |
| | 26 |
| | 85 |
| | 76 |
|
| Income tax (benefit) expense | (84 | ) | | 47 |
| | (30 | ) | | 87 |
| (16 | ) | | 50 |
| | (46 | ) | | 137 |
|
| EBITDA* | $ | (243 | ) | | $ | 144 |
| | $ | (40 | ) | | $ | 270 |
| $ | (42 | ) | | $ | 160 |
| | $ | (82 | ) | | $ | 430 |
|
ADJUSTED NET (LOSS) INCOME* AND ADJUSTED NET (LOSS) INCOME PER SHARE*
We believe that adjusted net (loss) income* and adjusted net (loss) income per diluted share* are helpful in assessing our financial performance exclusive of the non-cash impact of the amortization of purchased intangibles. The following table reconciles net income, which we believe to be the most comparable GAAP measure, to adjusted net (loss) income*.
| | | | Three Months Ended June 30, | | Six Months Ended June 30, | Three Months Ended September 30, | | Nine Months Ended September 30, |
| 2017 | | 2016 | | 2017 | | 2016 | 2017 | | 2016 | | 2017 | | 2016 |
| | (In millions, except diluted per-share amounts) | (In millions, except diluted per-share amounts) |
| Net (loss) income | $ | (230 | ) | | $ | (4.10 | ) | | $ | 33 |
| | $ | 0.58 |
| | $ | (153 | ) | | $ | (2.74 | ) | | $ | 57 |
| | $ | 1.01 |
| $ | (97 | ) | | $ | (1.70 | ) | | $ | 42 |
| | $ | 0.76 |
| | $ | (250 | ) | | $ | (4.44 | ) | | $ | 99 |
| | $ | 1.77 |
|
| Adjustment: | | | | | | | | | | | | | | | | | | | | | | | | | | | | | | |
| Amortization of intangible assets | 8 |
| | 0.14 |
| | 8 |
| | 0.14 |
| | 17 |
| | 0.30 |
| | 15 |
| | 0.27 |
| 7 |
| | 0.13 |
| | 9 |
| | 0.15 |
| | 24 |
| | 0.43 |
| | 24 |
| | 0.42 |
|
Income tax effect (1) | (3 | ) | | (0.05 | ) | | (3 | ) | | (0.05 | ) | | (6 | ) | | (0.11 | ) | | (5 | ) | | (0.10 | ) | (3 | ) | | (0.05 | ) | | (4 | ) | | (0.06 | ) | | (9 | ) | | (0.16 | ) | | (9 | ) | | (0.16 | ) |
| Amortization of intangible assets, net of tax effect | 5 |
| | 0.09 |
| | 5 |
| | 0.09 |
| | 11 |
| | 0.19 |
| | 10 |
| | 0.17 |
| 4 |
| | 0.08 |
| | 5 |
| | 0.09 |
| | 15 |
| | 0.27 |
| | 15 |
| | 0.26 |
|
| Adjusted net (loss) income* | $ | (225 | ) | | $ | (4.01 | ) | | $ | 38 |
| | $ | 0.67 |
| | $ | (142 | ) | | $ | (2.55 | ) | | $ | 67 |
| | $ | 1.18 |
| $ | (93 | ) | | $ | (1.62 | ) | | $ | 47 |
| | $ | 0.85 |
| | $ | (235 | ) | | $ | (4.17 | ) | | $ | 114 |
| | $ | 2.03 |
|
__________________________
| |
| (1) | Income tax effect of adjustments calculated at the blended federal and state statutory tax rate of 37%. |
CONTROLS AND PROCEDURES
Evaluation of Disclosure Controls and Procedures: Our management, with the participation of our interim chief executive officer and our chief financial officer, has concluded, based upon its evaluation as of the end of the period covered by this report, that the Company’s “disclosure controls and procedures” (as defined in Rules 13a-15(e) and 15d-15(e) under the Securities Exchange Act of 1934, as amended (the “Exchange Act”)), were not effective at the reasonable assurance level because of the material weakness in our internal control over financial reporting described below. Notwithstanding the material weakness described below, management has concluded that our consolidated financial statements included in this interim report on Form 10-Q are fairly stated in all material
respects in accordance with U.S. generally accepted accounting principles (GAAP) for each of the periods presented herein.
Existence of a Material Weakness in Internal Control as of September 30, 2017
During the quarter ended September 30, 2017, we determined that a material weakness existed in our internal control over financial reporting relating to the design and operating effectiveness of our internal control for our interim goodwill impairment tests for our Pathways subsidiary and Molina Medicaid Solutions segment. Specifically, spreadsheet formula errors in our valuation model, and errors made in the calculation of impairment losses recorded, were not detected in our review procedures. As a result, we initially miscalculated the goodwill impairment in the three and nine months ended September 30, 2017. The impairment calculation was corrected prior to the filing of our unaudited consolidated financial statements as of and for the three and nine months ended September 30, 2017.
Remediation Plan for Material Weakness
We will implement a remediation plan developed to address this material weakness as of September 30, 2017. The remediation efforts we intend to implement include the enhancement of the design of the controls relating to the computation and rigor of review of the goodwill impairment tests. The enhancement of the controls will include the engagement of additional subject matter experts to support the valuation calculations, key assumptions and review process. In addition, we intend to develop new review controls that operate at an appropriate level of precision to prevent or detect potential material errors within the valuation calculations. We believe these measures will remediate the material weakness identified above and will strengthen our internal control over financial reporting for the computation of reporting unit fair value and potential consequent goodwill impairment. We are currently targeting to complete the implementation of the control enhancements during the fourth quarter of 2017. We will test the operating effectiveness of the control enhancements subsequent to implementation. If the remedial measures described above are insufficient to address the material weakness described above, or are not implemented timely, or additional deficiencies arise in the future, material misstatements in our interim or annual financial statements may occur in the future and could have the effects described in “Risk Factors,” in our Annual Report on Form 10-K for the year ended December 31, 2016.
Changes in Internal Control Over Financial Reporting: Except as described above, management did not identify any change in our internal control over financial reporting during the fiscal quarter ended September 30, 2017 that has materially affected, or is reasonably likely to materially affect, our internal controls over financial reporting.
Existence of a Material Weakness in Internal Control as of December 31, 2016
As disclosed in our Annual Report on Form 10-K for the year ended December 31, 2016, our management assessed the effectiveness of our internal control over financial reporting as of December 31, 2016, based on the framework set forth in Internal Control-Integrated Framework (2013) issued by the Committee of Sponsoring Organizations of the Treadway Commission (COSO). A material weakness is a deficiency, or a combination of deficiencies, in internal control over financial reporting, such that there is a reasonable possibility that a material misstatement of the annual or interim financial statements will not be prevented or detected on a timely basis.
We determined that a material weakness existed in our internal control over financial reporting relating to the operation of an element of our process for calculating the amount owed to California by our California health plan. More specifically, a Medicaid Expansion contract amendment executed in the fourth quarter of 2016 changed the medical loss ratio corridor formula and such amendment was not initially considered in determining the liability. As a result, we understated net income by $44 million for the year ended December 31, 2016, which was material to our consolidated results for the year ended December 31, 2016. This amount was corrected prior to the issuance of our consolidated financial statements as of and for the year ended December 31, 2016.
Because of this material weakness, management concluded that we did not maintain effective internal control over financial reporting as of December 31, 2016, based on criteria described in Internal Control - Integrated Framework (2013) issued by COSO.
Remediation Plan for Material Weakness
We are executing the remediation plan developed to address the material weakness reported as of December 31, 2016. The remediation efforts we have implemented include the development of robust protocols to ensure that the control, relating to the review of a contractual amendment affecting the computation of the Medicaid Expansion medical loss ratio corridor for our California health plan, is operating as designed. We believe these measures will remediate the material weakness identified above and will strengthen our internal control over financial reporting for the computation of our California Medicaid Expansion medical loss ratio corridor. We currently are targeting to complete the implementation of the control enhancements during 2017. We will test the ongoing operating effectiveness of the control enhancements subsequent to implementation, and consider the material weakness remediated after the applicable remedial control enhancements operate effectively for a sufficient period of time. If the remedial measures described above are insufficient to address the material weakness described above, or are not implemented timely, or additional deficiencies arise in the future, material misstatements in our interim or annual financial statements may occur in the future and could have the effects described in “Risk Factors” in our Annual Report on Form 10-K for the year ended December 31, 2016.
Changes in Internal Control Over Financial Reporting: Except as described above, management did not identify any change in our internal control over financial reporting during the fiscal quarter ended June 30, 2017 that has materially affected, or is reasonably likely to materially affect, our internal controls over financial reporting.
LEGAL PROCEEDINGS
For information regarding legal proceedings, see Notes to Consolidated Financial Statements, Note 13, “Commitments and Contingencies.”
RISK FACTORS
Certain risk factorsrisks may have a material adverse effect on our business, financial condition, cash flows, or results of operations, or stock price, and you should carefully consider them.them before making an investment decision. In addition to the other information set forth in this report, you should carefully consider the risk factors discussed in “Risk Factors,” in our Annual Report on Form 10-K for the year ended December 31, 2016 and our Quarterly ReportReports on Form 10-Q for the quarterquarters ended March 31, 2017 and June 30, 2017. The risk factors described herein, and in our 2016 Annual Report on Form 10-K and our Quarterly ReportReports on Form 10-Q for the quarterquarters ended March 31, 2017 and June 30, 2017, are not the only risks facing our Company.that we face. Additional risks and uncertainties not currently known to us or that we currently deem to be immaterial may also materially adversely affect our business, financial condition, cash flows, or results of operations.
The Restructuring Plan may be disruptive, and we may not fully realize the anticipated benefits.
As discussed herein, we recently initiated a comprehensive Restructuring Plan to improve our profitability and operational efficiency. As part of that Restructuring Plan, we are re-designing core operating processes such as provider payment, utilization management, quality monitoring and improvement, and information technology. We are also streamlining our organization structure, including eliminating redundant layers of management. Finally, we are reducing our workforce by approximately 10%, or 1,400 full-time-equivalent positions. While we expect to benefit from the implementation of the Restructuring Plan, estimates of cost savings are inherently uncertain, and we may not be able to achieve these cost savings, or the expected operating efficiencies, within the periods we have projected, or at all. Restructuring activities may also result in a loss of continuity or institutional knowledge, inefficiency, depressed employee morale, and litigation during transitional periods and thereafter. Internal restructurings can also require a significant amount of time and focus from management and other employees, which may divert attention from our ongoing business operations. In addition, our implementation of the Restructuring Plan will require significant upfront costs. Our estimate of the costs necessary to achieve the cost savings we have identified may prove to be inaccurate, and any increase in such costs may affect our ability to achieve our anticipated cost savings within the period we have projected, or at all. If the Restructuring Plan fails to achieve all of the anticipated benefits, our business, financial condition, cash flows, or results of operations, could be materially and adversely affected. or stock price.
An impairment charge with respect to our recorded goodwill, or our finite-lived intangible assets, could have a material impact on our financial results.
As of December 31, 2016, the carrying amounts of goodwill and intangible assets, net, amounted to $620 million, and $140 million, respectively. Intangible assets are amortized generally on a straight-line basis over their estimated useful lives. For the reasons described below, as of June 30, 2017 the carrying amounts of goodwill and intangible assets, net, had declined to $559 million, and $112 million, respectively.
Goodwill represents the excess of the purchase price over the fair value of net assets acquired in business combinations. Goodwill is not amortized, but is subject to an annual impairment test. We are required to test at least annually for impairment, or more frequently if adverse events or changes in circumstances indicate that the asset may be impaired. We estimate the fair values of our reporting units using discounted cash flows.
Finite-lived, separately-identified intangible assets acquired in business combinations are assets that represent future expected benefits but lack physical substance (such as purchased contract rights and provider contracts). Following the identification of any potential impairment indicators, to determine whether an impairment exists, we would compare the carrying amount of a finite-lived intangible asset with the undiscounted cash flows that are expected to result from the use of the asset or related group of assets.
In the discounted cash flow analyses, we must make assumptions about a wide variety of internal and external factors, and consider the price that would be received to sell the reporting unit as a whole in an orderly transaction between market participants at the measurement date. Significant assumptions include financial projections of free
cash flow (including significant assumptions about operations, capital requirements and income taxes), long-term growth rates for determining terminal value beyond the discretely forecasted periods, and discount rates. If these assumptions differ from actual results, the outcome of our impairment tests could be adversely affected.
Based on our impairment tests, we recorded $72 million in non-cash impairment losses for goodwill and intangibles, primarily relating to our Pathways subsidiary. In the course of developing our restructuring and profitability improvement plan, we determined that future benefits to be derived from Pathways (including integration with our health plans) will be less than previously anticipated.
We cannot accurately predict the amount and timing of any future impairment charges. Additional events could occur that would cause us to further revise our estimates and assumptions used in analyzing the value of our goodwill, and intangible assets, net. For example, if the responsive bid of one or more of our health plans is not successful, we will lose our Medicaid contract in the applicable state or states. If such state health plans have recorded goodwill and intangible assets, net, the contract loss could result in a non-cash impairment charge. Additionally, if we are unable to procure new state MMIS contracts, the outcome of our goodwill impairment tests could be adversely affected and result in a non-cash impairment charge. Such a non-cash impairment charge could have a material adverse impact on our financial results.
UNREGISTERED SALES OF EQUITY SECURITIES AND USE OF PROCEEDS
ISSUER PURCHASES OF EQUITY SECURITIES
Purchases of common stock made by us, or on our behalf during the quarter ended JuneSeptember 30, 2017, including shares withheld by us to satisfy our employees’ income tax obligations, are set forth below: |
| | | | | | | | | | | | | |
| | Total Number of Shares Purchased (1) | | Average Price Paid per Share | | Total Number of Shares Purchased as Part of Publicly Announced Plans or Programs | | Approximate Dollar Value of Shares Authorized to Be Purchased Under the Plans or Programs |
| April 1 - April 30 | 12,389 |
| | $ | 45.60 |
| | — |
| | $ | — |
|
| May 1 - May 31 | 223,661 |
| | $ | 62.45 |
| | — |
| | $ | — |
|
| June 1 - June 30 | — |
| | $ | — |
| | — |
| | $ | — |
|
| Total | 236,050 |
| | $ | 61.56 |
| | — |
| | |
|
| | | | | | | | | | | | | |
| | Total Number of Shares Purchased (1) | | Average Price Paid per Share | | Total Number of Shares Purchased as Part of Publicly Announced Plans or Programs | | Approximate Dollar Value of Shares Authorized to Be Purchased Under the Plans or Programs |
| July 1 - July 31 | 665 |
| | $ | 69.18 |
| | — |
| | $ | — |
|
| August 1 - August 31 | 285 |
| | $ | 57.03 |
| | — |
| | $ | — |
|
| September 1 - September 30 | — |
| | $ | — |
| | — |
| | $ | — |
|
| Total | 950 |
| | $ | 65.54 |
| | — |
| | |
_______________________
| |
| (1) | During the three months ended JuneSeptember 30, 2017, we withheld 236,050950 shares of common stock under our 2011 Equity Incentive Plan to settle employee income tax obligations. |
INDEX TO EXHIBITS
|
| | |
| Exhibit No. | | Title |
| | |
4.1 | | |
| | |
4.2 | | |
| | |
4.3 | | |
| | |
10.1 | | |
| | | |
| | |
| | |
| | |
| | |
| | |
| | |
| | |
| | |
31.1 | | |
| | |
| | |
| | |
| 101.INS | | XBRL Taxonomy Instance Document. |
| | |
| 101.SCH | | XBRL Taxonomy Extension Schema Document. |
| | |
| 101.CAL | | |
| | |
| 101.DEF | | |
| | |
| 101.LAB | | |
| | |
| 101.PRE | | |
SIGNATURES
Pursuant to the requirements of the Securities Exchange Act of 1934, the registrant has duly caused this report to be signed on its behalf by the undersigned thereunto duly authorized.
|
| | | |
| | | | MOLINA HEALTHCARE, INC. |
| | | | (Registrant) |
| | | |
| Dated: | August 2,November 5, 2017 | | /s/ JOSEPH W. WHITE |
| | | | Joseph W. White |
| | | | Interim Chief Executive Officer |
| | | | (Principal Executive Officer) |
| | | |
| Dated: | August 2,November 5, 2017 | | /s/ JOSEPH W. WHITE |
| | | | Joseph W. White |
| | | | Chief Financial Officer and Treasurer |
| | | | (Principal Financial Officer) |
Molina Healthcare, Inc. 2017 Form 10-Q | 6267