UNITED STATES
SECURITIES AND EXCHANGE COMMISSION
FORM 10-Q
(Mark One)
|
| |
| ý | QUARTERLY REPORT PURSUANT TO SECTION 13 OR 15(d) OF THE SECURITIES EXCHANGE ACT OF 1934 |
For the quarterly period ended JuneSeptember 30, 2018
OR
|
| |
| ¨ | TRANSITION REPORT PURSUANT TO SECTION 13 OR 15(d) OF THE SECURITIES EXCHANGE ACT OF 1934 |
For the transition period from to
Commission file number: 001-31719
MOLINA HEALTHCARE, INC.
(Exact name of registrant as specified in its charter)
|
| | |
| Delaware | | 13-4204626 |
| (State or other jurisdiction of incorporation or organization) | | (I.R.S. Employer Identification No.) |
| | |
200 Oceangate, Suite 100 Long Beach, California | | 90802 |
| (Address of principal executive offices) | | (Zip Code) |
(562) 435-3666
(Registrant’s telephone number, including area code)
Indicate by check mark whether the registrant (1) has filed all reports required to be filed by Section 13 or 15(d) of the Securities Exchange Act of 1934 during the preceding 12 months (or for such shorter period that the registrant was required to file such reports), and (2) has been subject to such filing requirements for the past 90 days. Yes ý No ¨
Indicate by check mark whether the registrant has submitted electronically and posted on its corporate Web site, if any, every Interactive Data File required to be submitted and posted pursuant to Rule 405 of Regulation S-T during the preceding 12 months (or for such shorter period that the registrant was required to submit and post such files). Yes ý No ¨
Indicate by check mark whether the registrant is a large accelerated filer, an accelerated filer, a non-accelerated filer, a smaller reporting company, or emerging growth company. See the definitions of “large accelerated filer,” “accelerated filer,” “smaller reporting company,” and “emerging growth company” in Rule 12b-2 of the Exchange Act.
|
| | | |
| Large accelerated filer | ý | Accelerated filer | ¨ |
| Non-accelerated filer | ¨ (Do not check if a smaller reporting company) | Smaller reporting company | ¨ |
| | | Emerging growth company | ¨ |
|
| |
| If an emerging growth company, indicate by check mark if the registrant has elected not to use the extended transition period for complying with any new or revised financial accounting standards provided pursuant to Section13(a) of the Exchange Act. | |
| ¨ |
Indicate by check mark whether the registrant is a shell company (as defined in Rule 12b-2 of the Exchange Act).
Yes ¨ No ý
The number of shares of the issuer’s Common Stock, $0.001 par value, outstanding as of July 27,October 26, 2018, was approximately 61,762,000.62,389,000.
MOLINA HEALTHCARE, INC. FORM 10-Q
FOR THE QUARTERLY PERIOD ENDED JuneSeptember 30, 2018
TABLE OF CONTENTS
| | | ITEM NUMBER | ITEM NUMBER | Page | ITEM NUMBER | Page |
| | | |
| PART I - Financial Information | PART I - Financial Information | | PART I - Financial Information | |
| | | |
| 1. | | | | |
| | | |
| 2. | | | | |
| | | |
| 3. | | | | |
| | | |
| 4. | | | | |
| | | |
| | | | |
| | | |
| 1. | | | | |
| | | |
| 1A. | | | | |
| | | |
| 2. | | | | |
| | | |
| 3. | Defaults Upon Senior Securities | Not Applicable. | Defaults Upon Senior Securities | Not Applicable. |
| | | |
| 4. | Mine Safety Disclosures | Not Applicable. | Mine Safety Disclosures | Not Applicable. |
| | | |
| 5. | Other Information | Not Applicable. | Other Information | Not Applicable. |
| | | |
| 6. | | | | |
| | | |
| | | | | |
| | | |
| | | |
CONSOLIDATED STATEMENTS OF OPERATIONS | | | | Three Months Ended June 30, | | Six Months Ended June 30, | Three Months Ended September 30, | | Nine Months Ended September 30, |
| | 2018 | | 2017 | | 2018 | | 2017 | 2018 | | 2017 | | 2018 | | 2017 |
| | (In millions, except per-share data) (Unaudited) | (In millions, except per-share data) (Unaudited) |
| Revenue: | | | | | | | | | | | | | | |
| Premium revenue | $ | 4,514 |
| | $ | 4,740 |
| | $ | 8,837 |
| | $ | 9,388 |
| $ | 4,337 |
| | $ | 4,777 |
| | $ | 13,174 |
| | $ | 14,165 |
|
| Service revenue | 127 |
| | 129 |
| | 261 |
| | 260 |
| 130 |
| | 130 |
| | 391 |
| | 390 |
|
| Premium tax revenue | 106 |
| | 114 |
| | 210 |
| | 225 |
| 110 |
| | 106 |
| | 320 |
| | 331 |
|
| Health insurer fees reimbursed | 104 |
| | — |
| | 165 |
| | — |
| 83 |
| | — |
| | 248 |
| | — |
|
| Investment income and other revenue | 32 |
| | 16 |
| | 56 |
| | 30 |
| 37 |
| | 18 |
| | 93 |
| | 48 |
|
| Total revenue | 4,883 |
| | 4,999 |
| | 9,529 |
| | 9,903 |
| 4,697 |
| | 5,031 |
| | 14,226 |
| | 14,934 |
|
| Operating expenses: | | | | | | | | | | | | | | |
| Medical care costs | 3,850 |
| | 4,491 |
| | 7,572 |
| | 8,602 |
| 3,790 |
| | 4,220 |
| | 11,362 |
| | 12,822 |
|
| Cost of service revenue | 118 |
| | 124 |
| | 238 |
| | 246 |
| 111 |
| | 123 |
| | 349 |
| | 369 |
|
| General and administrative expenses | 335 |
| | 405 |
| | 687 |
| | 844 |
| 311 |
| | 383 |
| | 998 |
| | 1,227 |
|
| Premium tax expenses | 106 |
| | 114 |
| | 210 |
| | 225 |
| 110 |
| | 106 |
| | 320 |
| | 331 |
|
| Health insurer fees | 99 |
| | — |
| | 174 |
| | — |
| 87 |
| | — |
| | 261 |
| | — |
|
| Depreciation and amortization | 25 |
| | 37 |
| | 51 |
| | 76 |
| 25 |
| | 33 |
| | 76 |
| | 109 |
|
| Restructuring and separation costs | | 5 |
| | 118 |
| | 38 |
| | 161 |
|
| Impairment losses | — |
| | 72 |
| | — |
| | 72 |
| — |
| | 129 |
| | — |
| | 201 |
|
| Restructuring and separation costs | 8 |
| | 43 |
| | 33 |
| | 43 |
| |
| Total operating expenses | 4,541 |
| | 5,286 |
| | 8,965 |
| | 10,108 |
| 4,439 |
| | 5,112 |
| | 13,404 |
| | 15,220 |
|
| Gain on sale of subsidiary | | 37 |
| | — |
| | 37 |
| | — |
|
| Operating income (loss) | 342 |
| | (287 | ) | | 564 |
| | (205 | ) | 295 |
| | (81 | ) | | 859 |
| | (286 | ) |
| Other expenses (income), net: | | | | | | | | |
| Other expenses, net: | | | | | | | | |
| Interest expense | 32 |
| | 27 |
| | 65 |
| | 53 |
| 26 |
| | 32 |
| | 91 |
| | 85 |
|
| Other expense (income), net | 5 |
| | — |
| | 15 |
| | (75 | ) | |
| Total other expenses (income), net | 37 |
| | 27 |
| | 80 |
| | (22 | ) | |
| Other expenses (income), net | | 10 |
| | — |
| | 25 |
| | (75 | ) |
| Total other expenses, net | | 36 |
| | 32 |
| | 116 |
| | 10 |
|
| Income (loss) before income tax expense (benefit) | 305 |
| | (314 | ) | | 484 |
| | (183 | ) | 259 |
| | (113 | ) | | 743 |
| | (296 | ) |
| Income tax expense (benefit) | 103 |
| | (84 | ) | | 175 |
| | (30 | ) | 62 |
| | (16 | ) | | 237 |
| | (46 | ) |
| Net income (loss) | $ | 202 |
| | $ | (230 | ) | | $ | 309 |
| | $ | (153 | ) | $ | 197 |
| | $ | (97 | ) | | $ | 506 |
| | $ | (250 | ) |
| | | | | | | | | | | | | | | |
| Net income (loss) per share: | | | | | | | | | | | | | | |
| Basic | $ | 3.29 |
| | $ | (4.10 | ) | | $ | 5.10 |
| | $ | (2.74 | ) | $ | 3.22 |
| | $ | (1.70 | ) | | $ | 8.32 |
| | $ | (4.44 | ) |
| Diluted | $ | 3.02 |
| | $ | (4.10 | ) | | $ | 4.68 |
| | $ | (2.74 | ) | $ | 2.90 |
| | $ | (1.70 | ) | | $ | 7.60 |
| | $ | (4.44 | ) |
CONSOLIDATED STATEMENTS OF COMPREHENSIVE INCOME (LOSS)
| | | | Three Months Ended June 30, | | Six Months Ended June 30, | Three Months Ended September 30, | | Nine Months Ended September 30, |
| | 2018 | | 2017 | | 2018 | | 2017 | 2018 | | 2017 | | 2018 | | 2017 |
| | (Amounts in millions) (Unaudited) | (In millions) (Unaudited) |
| Net income (loss) | $ | 202 |
| | $ | (230 | ) | | $ | 309 |
| | $ | (153 | ) | $ | 197 |
| | $ | (97 | ) | | $ | 506 |
| | $ | (250 | ) |
| Other comprehensive income (loss): | | | | | | | | | | | | | | |
| Unrealized investment gain (loss) | 1 |
| | — |
| | (6 | ) | | 1 |
| 1 |
| | 1 |
| | (5 | ) | | 2 |
|
| Less: effect of income taxes | (1 | ) | | — |
| | (1 | ) | | — |
| — |
| | 1 |
| | (1 | ) | | 1 |
|
| Other comprehensive income (loss), net of tax | 2 |
| | — |
| | (5 | ) | | 1 |
| 1 |
| | — |
| | (4 | ) | | 1 |
|
| Comprehensive income (loss) | $ | 204 |
| | $ | (230 | ) | | $ | 304 |
| | $ | (152 | ) | $ | 198 |
| | $ | (97 | ) | | $ | 502 |
| | $ | (249 | ) |
See accompanying notes.
CONSOLIDATED BALANCE SHEETS | | | | June 30,
2018 | | December 31,
2017 | September 30,
2018 | | December 31,
2017 |
| | (Amounts in millions, except per-share data) | (In millions, except per-share data) |
| | (Unaudited) | | | (Unaudited) | | |
ASSETS | | Current assets: | | | | | | |
| Cash and cash equivalents | $ | 3,392 |
| | $ | 3,186 |
| $ | 2,814 |
| | $ | 3,186 |
|
| Investments | 2,176 |
| | 2,524 |
| 1,812 |
| | 2,524 |
|
| Restricted investments | 80 |
| | 169 |
| — |
| | 169 |
|
| Receivables | 1,148 |
| | 871 |
| 1,346 |
| | 871 |
|
| Prepaid expenses and other current assets | 344 |
| | 239 |
| 486 |
| | 239 |
|
| Derivative asset | 657 |
| | 522 |
| 843 |
| | 522 |
|
| Assets held for sale | 230 |
| | — |
| |
| Total current assets | 8,027 |
| | 7,511 |
| 7,301 |
| | 7,511 |
|
| Property, equipment, and capitalized software, net | 276 |
| | 342 |
| 264 |
| | 342 |
|
| Goodwill and intangible assets, net | 201 |
| | 255 |
| 195 |
| | 255 |
|
| Restricted investments | 117 |
| | 119 |
| 118 |
| | 119 |
|
| Deferred income taxes | 114 |
| | 103 |
| 143 |
| | 103 |
|
| Other assets | 28 |
| | 141 |
| 30 |
| | 141 |
|
| | $ | 8,763 |
| | $ | 8,471 |
| $ | 8,051 |
| | $ | 8,471 |
|
| | | | | | | |
LIABILITIES AND STOCKHOLDERS’ EQUITY | | Current liabilities: | | | | | | |
| Medical claims and benefits payable | $ | 1,920 |
| | $ | 2,192 |
| $ | 2,042 |
| | $ | 2,192 |
|
| Amounts due government agencies | 1,746 |
| | 1,542 |
| 1,030 |
| | 1,542 |
|
| Accounts payable and accrued liabilities | 754 |
| | 366 |
| 824 |
| | 366 |
|
| Deferred revenue | 193 |
| | 282 |
| 178 |
| | 282 |
|
| Current portion of long-term debt | 484 |
| | 653 |
| 296 |
| | 653 |
|
| Derivative liability | 657 |
| | 522 |
| 843 |
| | 522 |
|
| Liabilities held for sale | 66 |
| | — |
| |
| Total current liabilities | 5,820 |
| | 5,557 |
| 5,213 |
| | 5,557 |
|
| Long-term debt | 1,019 |
| | 1,318 |
| 1,019 |
| | 1,318 |
|
| Lease financing obligations | 198 |
| | 198 |
| 198 |
| | 198 |
|
| Other long-term liabilities | 68 |
| | 61 |
| 60 |
| | 61 |
|
| Total liabilities | 7,105 |
| | 7,134 |
| 6,490 |
| | 7,134 |
|
| | | | | | | |
| Stockholders’ equity: | | | | | | |
| Common stock, $0.001 par value, 150 shares authorized; outstanding: 62 shares at June 30, 2018 and 60 shares at December 31, 2017 | — |
| | — |
| |
| Common stock, $0.001 par value, 150 shares authorized; outstanding: 62 shares at September 30, 2018 and 60 shares at December 31, 2017 | | — |
| | — |
|
| Preferred stock, $0.001 par value; 20 shares authorized, no shares issued and outstanding | — |
| | — |
| — |
| | — |
|
| Additional paid-in capital | 1,055 |
| | 1,044 |
| 760 |
| | 1,044 |
|
| Accumulated other comprehensive loss | (11 | ) | | (5 | ) | (10 | ) | | (5 | ) |
| Retained earnings | 614 |
| | 298 |
| 811 |
| | 298 |
|
| Total stockholders’ equity | 1,658 |
| | 1,337 |
| 1,561 |
| | 1,337 |
|
| | $ | 8,763 |
| | $ | 8,471 |
| $ | 8,051 |
| | $ | 8,471 |
|
See accompanying notes.
CONSOLIDATED STATEMENT OF STOCKHOLDERS’ EQUITY
| | | | Common Stock | | Additional Paid-in Capital | | Accumulated Other Comprehensive Loss | | Retained Earnings | | Total | Common Stock | | Additional Paid-in Capital | | Accumulated Other Comprehensive Loss | | Retained Earnings | | Total |
| | Outstanding | | Amount | | Outstanding | | Amount | |
| | (In millions) | (In millions) |
| | (Unaudited) | (Unaudited) |
| Balance at January 1, 2018 | 60 |
| | $ | — |
| | $ | 1,044 |
| | $ | (5 | ) | | $ | 298 |
| | $ | 1,337 |
| 60 |
| | $ | — |
| | $ | 1,044 |
| | $ | (5 | ) | | $ | 298 |
| | $ | 1,337 |
|
| Net income | — |
| | — |
| | — |
| | — |
| | 309 |
| | 309 |
| — |
| | — |
| | — |
| | — |
| | 107 |
| | 107 |
|
| Adoption of Topic 606 | — |
| | — |
| | — |
| | — |
| | 6 |
| | 6 |
| — |
| | — |
| | — |
| | — |
| | 6 |
| | 6 |
|
| Adoption of ASU 2018-02 | — |
| | — |
| | — |
| | (1 | ) | | 1 |
| | — |
| — |
| | — |
| | — |
| | (1 | ) | | 1 |
| | — |
|
| Partial termination of 1.125% Warrants | — |
| | — |
| | (113 | ) | | — |
| | — |
| | (113 | ) | |
| 1.625% Convertible Notes exchange transaction | 2 |
| | — |
| | 108 |
| | — |
| | — |
| | 108 |
| |
| Exchange of 1.625% Notes | | 2 |
| | — |
| | 108 |
| | — |
| | — |
| | 108 |
|
| Other comprehensive loss, net | — |
| | — |
| | — |
| | (5 | ) | | — |
| | (5 | ) | — |
| | — |
| | — |
| | (6 | ) | | — |
| | (6 | ) |
| Share-based compensation | — |
| | — |
| | 16 |
| | — |
| | — |
| | 16 |
| — |
| | — |
| | 1 |
| | — |
| | — |
| | 1 |
|
| Balance at March 31, 2018 | | 62 |
| | — |
| | 1,153 |
| | (12 | ) | | 412 |
| | 1,553 |
|
| Net income | | — |
| | — |
| | — |
| | — |
| | 202 |
| | 202 |
|
| Partial termination of 1.125% Warrants | | — |
| | — |
| | (113 | ) | | — |
| | — |
| | (113 | ) |
| Other comprehensive income, net | | — |
| | — |
| | — |
| | 1 |
| | — |
| | 1 |
|
| Share-based compensation | | — |
| | — |
| | 15 |
| | — |
| | — |
| | 15 |
|
| Balance at June 30, 2018 | 62 |
| | $ | — |
| | $ | 1,055 |
| | $ | (11 | ) | | $ | 614 |
| | $ | 1,658 |
| 62 |
| | — |
| | 1,055 |
| | (11 | ) | | 614 |
| | 1,658 |
|
| Net income | | — |
| | — |
| | — |
| | — |
| | 197 |
| | 197 |
|
| Partial termination of 1.125% Warrants | | — |
| | — |
| | (306 | ) | | — |
| | — |
| | (306 | ) |
| Conversion of 1.625% Notes | | — |
| | — |
| | 4 |
| | — |
| | — |
| | 4 |
|
| Other comprehensive income, net | | — |
| | — |
| | — |
| | 1 |
| | — |
| | 1 |
|
| Share-based compensation | | — |
| |
|
| | 7 |
| | — |
| | — |
| | 7 |
|
| Balance at September 30, 2018 | | 62 |
| | $ | — |
| | $ | 760 |
| | $ | (10 | ) | | $ | 811 |
| | $ | 1,561 |
|
|
| | | | | | | | | | | | | | | | | | | | | | |
| | Common Stock | | Additional Paid-in Capital | | Accumulated Other Comprehensive Loss | | Retained Earnings | | Total |
| | Outstanding | | Amount | | | | |
| | (In millions) |
| | (Unaudited) |
| Balance at January 1, 2017 | 57 |
| | $ | — |
| | $ | 841 |
| | $ | (2 | ) | | $ | 810 |
| | $ | 1,649 |
|
| Net income | — |
| | — |
| | — |
| | — |
| | 77 |
| | 77 |
|
| Other comprehensive income, net | — |
| | — |
| | — |
| | 1 |
| | — |
| | 1 |
|
| Balance at March 31, 2017 | 57 |
| | — |
| | 841 |
| | (1 | ) | | 887 |
| | 1,727 |
|
| Net loss | — |
| | — |
| | — |
| | — |
| | (230 | ) | | (230 | ) |
| Share-based compensation | — |
| | — |
| | 24 |
| | — |
| | — |
| | 24 |
|
| Balance at June 30, 2017 | 57 |
| | — |
| | 865 |
| | (1 | ) | | 657 |
| | 1,521 |
|
| Net loss | — |
| | — |
| | — |
| | — |
| | (97 | ) | | (97 | ) |
| Share-based compensation | — |
| | — |
| | 5 |
| | — |
| | — |
| | 5 |
|
| Balance at September 30, 2017 | 57 |
| | $ | — |
| | $ | 870 |
| | $ | (1 | ) | | $ | 560 |
| | $ | 1,429 |
|
See accompanying notes.
CONSOLIDATED STATEMENTS OF CASH FLOWS
| | | | Six Months Ended June 30, | Nine Months Ended September 30, |
| | 2018 | | 2017 | 2018 | | 2017 |
| | (Amounts in millions)
(Unaudited) | (In millions)
(Unaudited) |
| Operating activities: | | | | | | |
| Net income (loss) | $ | 309 |
| | $ | (153 | ) | $ | 506 |
| | $ | (250 | ) |
| Adjustments to reconcile net income (loss) to net cash provided by operating activities: | | | | |
| Adjustments to reconcile net income (loss) to net cash (used in) provided by operating activities: | | | | |
| Depreciation and amortization | 73 |
| | 96 |
| 104 |
| | 139 |
|
| Impairment losses | — |
| | 72 |
| |
| Deferred income taxes | (6 | ) | | (41 | ) | (32 | ) | | (68 | ) |
| Share-based compensation | 13 |
| | 35 |
| 20 |
| | 38 |
|
| Non-cash restructuring costs | 17 |
| | — |
| 17 |
| | 49 |
|
| Amortization of convertible senior notes and lease financing obligations | 13 |
| | 16 |
| 18 |
| | 24 |
|
| Gain on sale of subsidiary | | (37 | ) | | — |
|
| Loss on debt extinguishment | 15 |
| | — |
| 25 |
| | — |
|
| Impairment losses | | — |
| | 201 |
|
| Other, net | 4 |
| | 7 |
| 6 |
| | 13 |
|
| Changes in operating assets and liabilities: | | | | | | |
| Receivables | (315 | ) | | (32 | ) | (507 | ) | | (28 | ) |
| Prepaid expenses and other current assets | (181 | ) | | (38 | ) | (117 | ) | | (53 | ) |
| Medical claims and benefits payable | (267 | ) | | 148 |
| (144 | ) | | 549 |
|
| Amounts due government agencies | 205 |
| | 642 |
| (511 | ) | | 122 |
|
| Accounts payable and accrued liabilities | 349 |
| | (18 | ) | 398 |
| | 90 |
|
| Deferred revenue | (42 | ) | | (32 | ) | (55 | ) | | 153 |
|
| Income taxes | 127 |
| | (30 | ) | 118 |
| | (22 | ) |
| Net cash provided by operating activities | 314 |
| | 672 |
| |
| Net cash (used in) provided by operating activities | | (191 | ) | | 957 |
|
| Investing activities: | | | | | | |
| Purchases of investments | (914 | ) | | (1,636 | ) | (1,202 | ) | | (1,894 | ) |
| Proceeds from sales and maturities of investments | 1,335 |
| | 874 |
| 2,070 |
| | 1,536 |
|
| Purchases of property, equipment and capitalized software | (14 | ) | | (60 | ) | (24 | ) | | (85 | ) |
| Other, net | (9 | ) | | (24 | ) | (23 | ) | | (33 | ) |
| Net cash provided by (used in) investing activities | 398 |
| | (846 | ) | 821 |
| | (476 | ) |
| Financing activities: | | | | | | |
| Repayment of credit facility | (300 | ) | | — |
| (300 | ) | | — |
|
| Repayment of 1.125% Convertible Notes | (89 | ) | | — |
| |
| Repayment of principal amount of 1.125% Notes | | (236 | ) | | — |
|
| Cash paid for partial settlement of 1.125% Conversion Option | (134 | ) | | — |
| (477 | ) | | — |
|
| Cash received for partial termination of 1.125% Call Option | 134 |
| | — |
| 477 |
| | — |
|
| Cash paid for partial termination of 1.125% Warrants | (113 | ) | | — |
| (419 | ) | | — |
|
| Repayment of principal amount of 1.625% Notes | | (64 | ) | | — |
|
| Proceeds from senior notes offerings, net of issuance costs | — |
| | 325 |
| — |
| | 325 |
|
| Proceeds from borrowings under credit facility | | — |
| | 300 |
|
| Other, net | (1 | ) | | 8 |
| 7 |
| | 7 |
|
| Net cash (used in) provided by financing activities | (503 | ) | | 333 |
| (1,012 | ) | | 632 |
|
| Net increase in cash, cash equivalents, and restricted cash and cash equivalents | 209 |
| | 159 |
| |
| Net (decrease) increase in cash, cash equivalents, and restricted cash and cash equivalents | | (382 | ) | | 1,113 |
|
| Cash, cash equivalents, and restricted cash and cash equivalents at beginning of period | 3,290 |
| | 2,912 |
| 3,290 |
| | 2,912 |
|
| Cash, cash equivalents, and restricted cash and cash equivalents at end of period | $ | 3,499 |
| | $ | 3,071 |
| $ | 2,908 |
| | $ | 4,025 |
|
CONSOLIDATED STATEMENTS OF CASH FLOWS
(continued)
| | | | Six Months Ended June 30, | Nine Months Ended September 30, |
| | 2018 | | 2017 | 2018 | | 2017 |
| | (Amounts in millions)
(Unaudited) | (In millions)
(Unaudited) |
| Supplemental cash flow information: | | | | | | |
| | | | | | | |
| Schedule of non-cash investing and financing activities: | | | | | | |
| Common stock used for share-based compensation | $ | (6 | ) | | $ | (21 | ) | $ | (6 | ) | | $ | (21 | ) |
| | | | | | | |
| Details of sale of subsidiary: | | | | |
| Decrease in carrying amount of assets | | $ | (243 | ) | | $ | — |
|
| Decrease in carrying amount of liabilities | | 59 |
| | — |
|
| Transaction costs | | (12 | ) | | — |
|
| Receivable from buyer - recorded in prepaid expenses and other current assets | | 233 |
| | — |
|
| Gain on sale of subsidiary | | $ | 37 |
| | $ | — |
|
| | | | | |
| Details of change in fair value of derivatives, net: | | | | | | |
| Gain on 1.125% Call Option | $ | 135 |
| | $ | 173 |
| $ | 321 |
| | $ | 158 |
|
| Loss on 1.125% Conversion Option | (135 | ) | | (173 | ) | (321 | ) | | (158 | ) |
| Change in fair value of derivatives, net | $ | — |
| | $ | — |
| $ | — |
| | $ | — |
|
| | | | | | | |
| 1.625% Convertible Notes exchange transaction: | | | | |
| Common stock issued in exchange for 1.625% Convertible Notes | $ | 131 |
| | $ | — |
| |
| Component of 1.625% Convertible Notes allocated to additional paid-in capital, net of income taxes | (23 | ) | | — |
| |
| 1.625% Notes exchange transaction: | | | | |
| Common stock issued in exchange for 1.625% Notes | | $ | 131 |
| | $ | — |
|
| Component of 1.625% Notes allocated to additional paid-in capital, net of income taxes | | (23 | ) | | — |
|
| Net increase to additional paid-in capital | $ | 108 |
| | $ | — |
| $ | 108 |
| | $ | — |
|
See accompanying notes.
NOTES TO CONSOLIDATED FINANCIAL STATEMENTS (UNAUDITED)
JuneSeptember 30, 2018
1. Organization and Basis of Presentation
Organization and Operations
Molina Healthcare, Inc. provides quality managed health care to people receiving government assistance. We offer cost-effective Medicaid-related solutions to meet the health care needs of low-income families and individuals, and to assist government agencies in their administration of the Medicaid program. We have three reportable segments. These segments, consistconsisting of our Health Plans segment, which constitutes the vast majority of our operations; our Molina Medicaid Solutions segment; and our Other segment.
The Health Plans segment consists of health plans operating in 13 states and the Commonwealth of Puerto Rico. As of JuneSeptember 30, 2018, these health plans served approximately 4.14.0 million members eligible for Medicaid, Medicare, and other government-sponsored health care programs for low-income families and individuals. This membership includes Affordable Care Act Marketplace (Marketplace) members, most of whom receive government premium subsidies. The health plans are operated by our respective wholly owned subsidiaries in those states, each of which is licensed as a health maintenance organization (HMO).
Our health plans’ state Medicaid contracts generally have terms of three to five years. These contracts typically contain renewal options exercisable by the state Medicaid agency, and allow either the state or the health plan to terminate the contract with or without cause. Such contracts are subject to risk of loss in states that issue requests for proposal (RFP) open to competitive bidding by other health plans. If one of our health plans is not a successful responsive bidder to a state RFP, its contract may not be renewed.
In addition to contract renewal, our state Medicaid contracts may be periodically amended to include or exclude certain health benefits (such as pharmacy services, behavioral health services, or long-term care services); populations such as the aged, blind or disabled (ABD); and regions or service areas.
The Molina Medicaid Solutions segment provides support to state government agencies’ administration of their Medicaid programs, including business processing, information technology development and administrative services. The Other segment includes primarily our Pathways behavioral health and social services provider subsidiary (Pathways), and corporate amounts not allocated to other reportable segments.
Recent Developments – Health Plans Segment
New Mexico Health Plan. In our Annual Report on Form 10-K for 2017, we reported that we were notified by the New Mexico Medicaid agency that we had not been selected for a tentative award of a 2019 Medicaid contract. A hearing was held on our judicial protest on October 17, 2018, with a decision expected in the fourth quarter of 2018. Regardless of the court’s decision on our protest, we would have further rights of appeal. We are continuing to manage the business in run-off until such time as a different outcome is determined. As of September 30, 2018, we served approximately 206,000 Medicaid members in New Mexico, which represented premium revenue of $891 million for the nine months ended September 30, 2018.
Puerto Rico Health Plan. In July 2018, our Puerto Rico health plan was selected by the Puerto Rico Health Insurance Administration to be one of the organizations to administer the Commonwealth’s new Medicaid Managed Care contract. ServicesWe expect to serve approximately 290,000 members under the new contract, currently expected to begin on November 1, 2018, would cover the entire island.contract. The base contract runs for a period of three years with an optional one yearone-year extension. As of JuneSeptember 30, 2018, we served approximately 326,000320,000 Medicaid members in the East and Southwest regions of Puerto Rico, which represented premium revenue of $370$549 million for the sixnine months ended JuneSeptember 30, 2018.
Florida Health Plan. In June 2018, our Florida health plan was awarded comprehensive Medicaid Managed Care contracts by the Florida Agency for Health Care Administration (AHCA) in Regions 8 and 11 of the Florida Statewide Medicaid Managed Care Invitation to Negotiate. As of JuneSeptember 30, 2018, we served approximately 96,000 Medicaid members in those regions, which represented premium revenue of approximately $232$346 million for the sixnine months ended JuneSeptember 30, 2018. Services under the new contract are expected to begin on January 1, 2019. We will be serving both the Medicaid and long-term care populations in the two regions.
Washington Health Plan. In May 2018, our Washington health plan was selected by the Washington State Health Care Authority (HCA) to enter into a managed care contract for the eight remaining regions of the state’s Apple Health Integrated Managed Care program, in addition to the two regions previously awarded to us. We were
selected by HCA for the following regions: Greater Columbia, King, North Sound, Pierce, and Spokane beginning January 1, 2019; and Salish, Thurston-Mason, and Great Rivers beginning January 1, 2020. As of JuneSeptember 30, 2018, we served approximately 742,000738,000 Medicaid members in Washington, which represented premium revenue of $1,083$1,558 million for the sixnine months ended JuneSeptember 30, 2018.
Recent Developments – Molina Medicaid Solutions Segment
In June 2018, we entered into a definitive agreement to sellWe closed on the sale of Molina Medicaid Solutions (MMS) to DXC Technology Company.Company on September 30, 2018. The divestiture, expected to close innet cash selling price for the third quarterequity interests of 2018, is subject to the satisfactionMMS was $233 million, which we received on October 1, 2018. As a result of customary
closing conditions and the receiptthis transaction, we recognized a pretax gain, net of certain third party consents and regulatory approvals.transaction costs, of $37 million. Refer to Note 11, “Segments,” for further information.
Subsequent Event – Other Segment
On October 19, 2018, we sold our Pathways subsidiary to Pyramid Health Holdings, LLC for a nominal purchase price. We expect to record a loss on sale of subsidiary amounting to approximately $40 million, net of income tax benefits.
Presentation and Reclassification
We have reclassified certain amounts in the 2017 consolidated statement of cash flows to conform to the 2018 presentation, relating to the presentation of restricted cash and cash equivalents. The reclassification is a result of our adoption of Accounting Standards Update (ASU) 2016-18, Restricted Cash effective January 1, 2018. See Note 2, “Significant Accounting Policies,” for further information, including the amount reclassified.
We have combined certain line items in the accompanying consolidated balance sheets. For all periods presented, we have combined the presentation of:
Income taxes refundable with “Prepaid expenses and other current assets;”
Income taxes payable with “Accounts payable and accrued liabilities;”
Goodwill, and intangible assets, net to a single line; and
Deferred contract costs with “Other assets.”
Consolidation and Interim Financial Information
The consolidated financial statements include the accounts of Molina Healthcare, Inc., its subsidiaries, and variable interest entities (VIEs) in which Molina Healthcare, Inc. is considered to be the primary beneficiary. Such VIEs are insignificant to our consolidated financial position and results of operations. In the opinion of management, all adjustments considered necessary for a fair presentation of the results as of the date and for the interim periods presented have been included; such adjustments consist of normal recurring adjustments. All significant intercompany balances and transactions have been eliminated. The consolidated results of operations for the sixnine months ended JuneSeptember 30, 2018 are not necessarily indicative of the results for the entire year ending December 31, 2018.
The unaudited consolidated interim financial statements have been prepared under the assumption that users of the interim financial data have either read or have access to our audited consolidated financial statements for the fiscal year ended December 31, 2017. Accordingly, certain disclosures that would substantially duplicate the disclosures contained in our December 31, 2017 audited consolidated financial statements have been omitted. These unaudited consolidated interim financial statements should be read in conjunction with our audited consolidated financial statements for the fiscal year ended December 31, 2017.
2. Significant Accounting Policies
Cash and Cash Equivalents
Cash and cash equivalents consist of cash and short-term, highly liquid investments that are both readily convertible into known amounts of cash and have a maturity of three months or less on the date of purchase. The following table provides a reconciliation of cash, cash equivalents, and restricted cash and cash equivalents reported within the accompanying consolidated balance sheets that sum to the total of the same such amounts presented in the accompanying consolidated statements of cash flows. The restricted cash and cash equivalents presented below are included in non-current “Restricted investments” in the accompanying consolidated balance sheets.
| | | | Six Months Ended June 30, | Nine Months Ended September 30, |
| | 2018 | | 2017 | 2018 | | 2017 |
| | (In millions) | (In millions) |
| Cash and cash equivalents | $ | 3,392 |
| | $ | 2,979 |
| $ | 2,814 |
| | $ | 3,934 |
|
| Restricted cash and cash equivalents | 98 |
| | 92 |
| 94 |
| | 91 |
|
| Cash and cash equivalents reported in assets held for sale | 9 |
| | — |
| |
| Total cash, cash equivalents, and restricted cash and cash equivalents presented in the statements of cash flows | $ | 3,499 |
| | $ | 3,071 |
| $ | 2,908 |
| | $ | 4,025 |
|
Revenue Recognition
We adopted ASU 2014-09, Revenue from Contracts with Customers (Topic 606) effective January 1, 2018, using the modified retrospective approach. The insurance contracts of our Health Plans segment, which segment constitutes the vast majority of our operations, are excluded from the scope of Topic 606 because the recognition of revenue under these contracts is dictated by other accounting standards governing insurance contracts. The cumulative effect of initially applying the guidance, relating entirely to our Molina Medicaid Solutions segment contracts, resulted in an immaterial impact to beginning retained earnings, as presented in the accompanying consolidated statement of stockholders’ equity. Topic 606 was only applied to service contracts that were not completed as of December 31, 2017. Refer to “Molina Medicaid Solutions segment” and “Other segment” below for further information.
Health Plans segment
Premium revenue is fixed in advance of the periods covered and, except as described below, is not generally subject to significant accounting estimates. Premium revenues are recognized in the month that members are entitled to receive health care services, and premiums collected in advance are deferred. Certain components of premium revenue are subject to accounting estimates and fall into two broad categories discussed in further detail below: 1) “Contractual Provisions That May Adjust or Limit Revenue or Profit;” and 2) “Quality Incentives.” Liabilities recorded for such provisions are included in “Amounts due government agencies” in the accompanying consolidated balance sheets.
| |
| 1) | Contractual Provisions That May Adjust or Limit Revenue or Profit: |
Medicaid
Medical Cost Floors (Minimums), and Medical Cost Corridors: APursuant to certain contract provisions, a portion of our premium revenue may be returned if certain minimum amounts are not spent on defined medical care costs. In the aggregate, we recorded a liability under the terms of such contract provisions of $144$198 million and $135 million at JuneSeptember 30, 2018 and December 31, 2017, respectively. Approximately $97$144 million and $96 million of thethis liability accrued at JuneSeptember 30, 2018 and December 31, 2017, respectively, relates to our participation in Medicaid Expansion programs. Refer to Note 12, “Commitments and Contingencies,” for further information regarding the California Medicaid Expansion program.
Retroactive Premium Adjustments: State Medicaid programs periodically adjust premium rates on a retroactive basis. In these cases, we must adjust our premium revenue in the period in which we learn of the adjustment, rather than in the months of service to which the retroactive adjustment applies.
Medicare
Minimum MLR: Federal regulations haveThe Affordable Care Act (ACA) has established a minimum annual medical loss ratio (Minimum MLR) of 85% for Medicare. The medical loss ratio represents medical costs as a percentage of premium revenue. Federal regulations define what constitutes medical costs and premium revenue. If the Minimum MLR is not met, we may be required to pay rebates to the federal government. We recognize estimated rebates under the Minimum MLR as an adjustment to premium revenue in our consolidated statements of operations. The payable for the Medicare Minimum MLR was not significant at September 30, 2018 and December 31, 2017.
Marketplace
Risk adjustment: Under this program, our health plans’ composite risk scores are compared with the overall average risk score for the relevant state and market pool. Generally, our health plans will make a risk adjustment payment into the pool if their composite risk scores are below the average risk score, and will receive a risk adjustment payment from the pool if their composite risk scores are above the average risk score. We estimate our ultimate premium based on insurance policy year-to-date experience, and recognize estimated premiums relating to the risk adjustment program as an adjustment to premium
revenue in our consolidated statements of operations. As of JuneSeptember 30, 2018, and December 31, 2017, the Marketplace risk adjustment payable amounted to $1,159$390 million and $912 million, respectively. Refer to Note 12, “Commitments and Contingencies,” for further information regarding recent developments in the Marketplace risk adjustment program.
Minimum MLR: The Affordable Care Act (ACA)ACA has established a Minimum MLR of 80% for the Marketplace. If the Minimum MLR is not met, we may be required to pay rebates to our Marketplace policyholders. The Marketplace risk adjustment program is taken into consideration when computing the Minimum MLR. We recognize estimated rebates under the Minimum MLR as an adjustment to premium revenue in our consolidated statements of operations. The payable for the Marketplace Minimum MLR was not significant at September 30, 2018 and December 31, 2017.
At many of our health plans, revenue ranging from approximately 1% to 3% of certain health plan premiums is earned only if certain performance measures are met.
The following table quantifies the quality incentive premium revenue recognized for the periods presented, including the amounts earned in the periods presented and prior periods. Although the reasonably possible effects of a change in estimate related to quality incentive premium revenue as of JuneSeptember 30, 2018 are not known, we have no reason to believe that the adjustments to prior years noted below are not indicative of the potential future changes in our estimates as of JuneSeptember 30, 2018.
|
| | | | | | | | | | | | | | | |
| | Three Months Ended June 30, | | Six Months Ended June 30, |
| | 2018 | | 2017 | | 2018 | | 2017 |
| | (Dollars in millions) |
| Maximum available quality incentive premium - current period | $ | 47 |
| | $ | 39 |
| | $ | 87 |
| | $ | 77 |
|
| Quality incentive premium revenue recognized in current period: | | | | | | | |
| Earned current period | $ | 34 |
| | $ | 29 |
| | $ | 58 |
| | $ | 48 |
|
| Earned prior periods | 12 |
| | 1 |
| | 23 |
| | 6 |
|
| Total | $ | 46 |
| | $ | 30 |
| | $ | 81 |
| | 54 |
|
| | | | | | | | |
| Quality incentive premium revenue recognized as a percentage of total premium revenue | 1.0 | % | | 0.6 | % | | 0.9 | % | | 0.6 | % |
Molina Medicaid Solutions segment
MMS is under contract with Medicaid agencies in six states and the U.S. Virgin Islands. Our existing contracts have terms that currently extend to 2018 through 2025, before renewal options. As of June 30, 2018, the aggregate amount of service revenue relating to unsatisfied performance obligations amounted to approximately $638 million.
Business process outsourcing services are billed immediately following the end of the month in which such services are performed, with payment received soon thereafter. Payments for the design, development and implementation (DDI) of Medicaid management information systems milestones are received following our performance, and the customer’s acceptance, of the milestone deliverable. However, recognition of DDI revenue is deferred until the system ‘go-live’ date, and is amortized over the initial contract hosting period. |
| | | | | | | | | | | | | | | |
| | Three Months Ended September 30, | | Nine Months Ended September 30, |
| | 2018 | | 2017 | | 2018 | | 2017 |
| | (Dollars in millions) |
| Maximum available quality incentive premium - current period | $ | 48 |
| | $ | 36 |
| | $ | 135 |
| | $ | 113 |
|
| Quality incentive premium revenue recognized in current period: | | | | | | | |
| Earned current period | $ | 39 |
| | $ | 24 |
| | $ | 97 |
| | $ | 72 |
|
| Earned prior periods | 9 |
| | 3 |
| | 32 |
| | 9 |
|
| Total | $ | 48 |
| | $ | 27 |
| | $ | 129 |
| | 81 |
|
| | | | | | | | |
| Quality incentive premium revenue recognized as a percentage of total premium revenue | 1.1 | % | | 0.6 | % | | 1.0 | % | | 0.6 | % |
Other segment
Our Pathways behavioral health subsidiary’s revenue is all variable, and generally invoiced after services are rendered; customer payment follows invoicing. We have concluded that there is no change to revenue recognition under Topic 606 for our Pathways, behavioral health subsidiary, and therefore no impact to retained earnings effective January 1, 2018.
The following table presents the opening As discussed in Note 1, “Organization and closing balancesBasis of receivables, deferred contract costs (contract assets), and deferred revenue (contract liabilities) from contracts with customers, by segment.
|
| | | | | | | |
| | June 30,
2018 | | December 31,
2017 |
| | (In millions) |
| Receivables: | | | |
| Molina Medicaid Solutions | $ | 34 |
| | $ | 30 |
|
| Other | 40 |
| | 44 |
|
| Deferred contract costs (contract assets) – Molina Medicaid Solutions | 109 |
| | 101 |
|
| Deferred revenue (contract liabilities) – Molina Medicaid Solutions | 39 |
| | 49 |
|
Medical Care Costs - Marketplace Cost Share Reduction (CSR) Update
DuringIn the first half ofnine months ended September 30, 2018, we recognized a benefit of approximately $76$81 million in reduced medical expense related to 2017 dates of service, including $5 million in the third quarter of 2018, as a result of the federal government’s confirmation that the reconciliation of 2017 Marketplace CSR subsidies would be performed on an annual basis. In the fourth quarter of 2017, we had assumed
a nine-month reconciliation of this item pending confirmation of the time period to which the 2017 reconciliation would be applied.
Concentrations of Credit Risk
Financial instruments that potentially subject us to concentrations of credit risk consist primarily of cash and cash equivalents, investments, receivables, and restricted investments. Our investments and a portion of our cash equivalents are managed by professional portfolio managers operating under documented investment guidelines. Our portfolio managers must obtain our prior approval before selling investments where the loss position of those investments exceeds certain levels. Our investments consist primarily of investment-grade debt securities with a maximum maturity of 10 years and an average duration of three years or less. Restricted investments are invested principally in certificates of deposit and U.S. treasury securities. Concentration of credit risk with respect to accounts receivable is generally limited because our payors consist principally of the governments of each state in which our health plan subsidiaries operate.
Income Taxes
The provision for income taxes is determined using an estimated annual effective tax rate, which generally differs from the U.S. federal statutory rate primarily because of state taxes, nondeductible expenses such as the Health Insurer Fee (HIF), certain compensation, and other general and administrative expenses. The effective tax rate was not impacted by HIF in 2017 given the 2017 HIF moratorium.
The effective tax rate may be subject to fluctuations during the year as new information is obtained. Such information may affect the assumptions used to estimate the annual effective tax rate, including projected pretax earnings, the mix of pretax earnings in the various tax jurisdictions in which we operate, valuation allowances against deferred tax assets, the recognition or the reversal of the recognition of tax benefits related to uncertain tax positions, and changes in or the interpretation of tax laws in jurisdictions where we conduct business. We recognize deferred tax assets and liabilities for temporary differences between the financial reporting basis and the tax basis of our assets and liabilities, along with net operating loss and tax credit carryovers.
The Tax Cuts and Jobs Act (TCJA) was enacted on December 22, 2017. The TCJA, in part, reduced the U.S. federal statutory corporate income tax rate from 35% to 21% effective January 1, 2018. Accounting guidance allows filers a measurement period of one year subsequent tofrom the end of the tax yearenactment date to finalize the provisional valuation of deferred tax assets and liabilities. During the third quarter of 2018, we recognized approximately $4 million in adjustments to our provisional valuation of our deferred tax assets and liabilities recorded at December 31, 2017, and included these adjustments as a component of income tax expense from continuing operations, which decreased our effective tax rate by 150 basis points in the quarter. At JuneSeptember 30, 2018, we had not completed our accounting for the tax effects resulting from enactment of TCJA with respect to valuation of our deferred tax assets and liabilities. We will continue to make and refine our calculations as additional analysis is completed. In addition, our estimates may also be affected as we gain a more thorough understanding ofby expected future guidance on the tax law based on expected future guidance from the Internal Revenue Service and U.S. Treasury.
Recent Accounting Pronouncements Adopted
Revenue Recognition (Topic 606). See discussion above, in “Revenue Recognition.”
Comprehensive Income. In February 2018, the Financial Accounting Standards Board (FASB) issued ASU 2018-02, Reclassification of Certain Tax Effects from Accumulated Other Comprehensive Income, which allows a reclassification from accumulated other comprehensive income to retained earnings for stranded tax effects resulting from the TCJA. ASU 2018-02 is effective beginning January 1, 2019; we early adopted this ASU effective January 1, 2018. The effect of applying the guidance resulted in an immaterial impact to beginning retained earnings, as presented in the accompanying consolidated statement of stockholders’ equity.
Restricted Cash. In November 2016, the FASB issued ASU 2016-18, Restricted Cash, which requires us to include in our consolidated statements of cash flows the changes in the balances of cash, cash equivalents, restricted cash and restricted cash equivalents. We adopted ASU 2016-18 on January 1, 2018. We have applied the guidance retrospectively to all periods presented. Such retrospective adoption resulted in a $92$91 million reclassification of restricted cash and cash equivalents from “Investing activities”activities,” to the beginning and ending balances of cash and cash equivalents in our consolidated statements of cash flows for the sixnine months ended JuneSeptember 30, 2017. There was no impact to our consolidated statements of operations, balance sheets, or stockholders’ equity. The reconciliation of cash and cash equivalents to cash, cash equivalents, and restricted cash and cash equivalents is presented at the beginning of this note.
Recent Accounting Pronouncements Not Yet Adopted
Software Licenses. In August 2018, the FASB issued ASU 2018-15, Customer’s Accounting for Implementation Costs Incurred in a Cloud Computing Arrangement That Is a Service Contract, which aligns the requirements for capitalizing implementation costs incurred in a hosting arrangement that is a service contract with the requirements for capitalizing implementation costs incurred to develop or obtain internal-use software. ASU 2018-15 is effective beginning January 1, 2020, and can be applied either retrospectively or prospectively to all implementation costs incurred after the date of adoption; early adoption is permitted. We are evaluating the effect of this guidance.
Callable Debt Securities. In March 2017, the FASB issued ASU 2017-08, Premium Amortization on Purchased Callable Debt Securities, which shortens the amortization period for certain callable debt securities held at a premium. Specifically, the amendments require the premium to be amortized to the earliest call date. ASU 2017-08 is effective beginning January 1, 2019, and must be adopted as a cumulative effect adjustment to retained earnings; early adoption is permitted. We are evaluating the effect of this guidance.
Credit Losses. In June 2016, the FASB issued ASU 2016-13, Measurement of Credit Losses on Financial Instruments. Rather than generally recognizing credit losses when it is probable that the loss has been incurred, the
revised guidance requires companies to recognize an allowance for credit losses for the difference between the amortized cost basis of a financial instrument and the amount of amortized cost that the company expects to collect over the instrument’s contractual life. ASU 2016-13 is effective beginning January 1, 2020, and must be adopted as a cumulative effect adjustment to retained earnings; early adoption is permitted. We are evaluating the effect of this guidance.
Leases. In February 2016, the FASB issued ASU 2016-02, Leases (Topic 842), as modified by by:
ASU 2017-03, Transition and Open Effective Date InformationInformation;
ASU 2018-01, and Leases (Topic 842): Land Easement Practical Expedient for Transition to Topic 842;
ASU 2018-10, Codification Improvements to Topic 842, LeasesLeases; and
ASU 2018-11, . Leases (Topic 842): Targeted Improvements.
Under ASU 2016-02,Topic 842, an entity will be required to recognize assets and liabilities for the rights and obligations created by leases on the entity’s balance sheet for both financing and operating leases. For leases with a term of 12 months or less, an entity may elect to not recognize lease assets and lease liabilities and expense the lease over a straight-line basis for the term of the lease. ASU 2016-02 will requireTopic 842 also requires new disclosures that depict the amount, timing,
and uncertainty of cash flows pertaining to an entity’s leases. ASU 2016-02 must be adoptedWe will adopt Topic 842 effective January 1, 2019, using athe modified retrospective approach for annual and interim periods beginning after December 15, 2018. Early adoption is permitted.method. Under this method, we will recognize the cumulative effect of initially applying the standard as an adjustment to the opening balance of retained earnings on January 1, 2019. In addition, we have elected the transition option provided under ASU 2018-11, which allows entities to continue to apply the legacy guidance in Topic 840, Leases, including its disclosure requirements, in the comparative periods presented in the year of adoption.
Under Topic 842, we will record right of useright-of-use assets and liabilities relating primarily to our long-term office operating leases. We are currently updatinghave substantially completed the configuration of our lease database management system for the adoption of Topic 842; we842. We do not currently expect the adoption of this guidance to have a material effect on our consolidated results of operations, financial condition or cash flows.
3. Net Income (Loss) per Share
The following table sets forth the calculation of basic and diluted net income (loss) per share: | | | | Three Months Ended June 30, | | Six Months Ended June 30, | Three Months Ended September 30, | | Nine Months Ended September 30, |
| | 2018 | | 2017 | | 2018 | | 2017 | 2018 | | 2017 | | 2018 | | 2017 |
| | (In millions, except net income per share) | (In millions, except net income per share) |
| Numerator: | | | | | | | | | | | | | | |
| Net income (loss) | $ | 202 |
| | $ | (230 | ) | | $ | 309 |
| | $ | (153 | ) | $ | 197 |
| | $ | (97 | ) | | $ | 506 |
| | $ | (250 | ) |
| Denominator: | | | | | | | | | | | | | | |
| Shares outstanding at the beginning of the period | 61 |
| | 56 |
| | 59 |
| | 56 |
| 61.3 |
| | 56.5 |
| | 59.3 |
| | 55.8 |
|
| Weighted-average number of shares issued: | | | | | | | | | | | | | | |
1.625% Exchange (1) | — |
| | — |
| | 2 |
| | — |
| |
Exchange of 1.625% Notes (1) | | — |
| | — |
| | 1.3 |
| | — |
|
| Stock-based compensation | | — |
| | — |
| | 0.2 |
| | 0.4 |
|
| Denominator for basic net income per share | 61 |
| | 56 |
| | 61 |
| | 56 |
| 61.3 |
| | 56.5 |
| | 60.8 |
| | 56.2 |
|
| Effect of dilutive securities: | | | | | | | | | | | | | | |
1.625% Convertible Notes (1) | 1 |
| | — |
| | — |
| | — |
| |
1.125% Warrants (1) | 5 |
| | — |
| | 5 |
| | — |
| 5.6 |
| | — |
| | 5.0 |
| | — |
|
1.625% Notes (1) | | 0.6 |
| | — |
| | 0.5 |
| | — |
|
| Stock-based compensation | | 0.4 |
| | — |
| | 0.3 |
| | — |
|
| Denominator for diluted net income per share | 67 |
| | 56 |
| | 66 |
| | 56 |
| 67.9 |
| | 56.5 |
| | 66.6 |
| | 56.2 |
|
| | | | | | | | | | | | | | | |
Net income (loss) per share: (2) | | | | | | | | | | | | | | |
| Basic | $ | 3.29 |
| | $ | (4.10 | ) | | $ | 5.10 |
| | $ | (2.74 | ) | $ | 3.22 |
| | $ | (1.70 | ) | | $ | 8.32 |
| | $ | (4.44 | ) |
| Diluted | $ | 3.02 |
| | $ | (4.10 | ) | | $ | 4.68 |
| | $ | (2.74 | ) | $ | 2.90 |
| | $ | (1.70 | ) | | $ | 7.60 |
| | $ | (4.44 | ) |
| | | | | | | | | | | | | | | |
| Potentially dilutive common shares excluded from calculations: | | | | | | | | | | | | | | |
1.125% Warrants (1) | — |
| | 2 |
| | — |
| | 1 |
| — |
| | 2.3 |
| | — |
| | 1.3 |
|
1.625% Notes (1) | | — |
| | 0.6 |
| | — |
| | 0.3 |
|
| Stock-based compensation | | — |
| | 0.2 |
| | — |
| | 0.3 |
|
| |
| (1) | For more information and definitions regarding the 1.625% Exchange and the 1.625% Convertible Notes, refer to Note 7, “Debt.” For more information and definitions regarding the 1.125% Warrants, refer to Note 9, “Stockholders' Equity.” The dilutive effect of all potentially dilutive common shares is calculated using the treasury stock method. Certain potentially dilutive common shares issuable are not included in the computation of diluted net income (loss) per share because to do so would be anti-dilutive. For the three and six months ended June 30, 2017, the 1.125% Warrants were not included in diluted shares outstanding because to do so would have been anti-dilutive. |
| |
| (2) | Source data for calculations in thousands. |
4. Fair Value Measurements
We consider the carrying amounts of cash, cash equivalents and other current assets and current liabilities (not including derivatives and the current portion of long-term debt, and certain accounts reported in assets and liabilities held for sale)debt) to approximate their fair values because of the relatively short period of time between the origination of these instruments and their expected realization or payment. For our financial instruments measured at fair value on a recurring basis, we prioritize the inputs used in measuring fair value according to the three-tier fair value hierarchy. For a description of the methods and assumptions that we use to a) estimate the fair value; and b) determine the classification according to the fair value hierarchy for each financial instrument, see Note 4, “Fair Value Measurements,” in our 2017 Annual Report on Form 10-K.
Derivative financial instruments include the 1.125% Call Option derivative asset and the 1.125% Conversion Option derivative liability.liability (see Note 8 “Derivatives,” for definitions and further information). These derivatives are not actively traded and are valued based on an option pricing model that uses observable and unobservable market data for inputs. Significant market data inputs used to determine fair value as of JuneSeptember 30, 2018, included the price of our common stock, the time to maturity of the derivative instruments, the risk-free interest rate, and the implied volatility of our common stock. As described further in Note 8, “Derivatives,” theThe 1.125% Call Option derivative asset and the 1.125% Conversion Option
derivative liability were designed such that changes in their fair values would offset, with minimal impact to the consolidated statements of operations. Therefore, the sensitivity of changes in the unobservable inputs to the option pricing model for such derivative instruments is mitigated.
The net changes in fair value of Level 3 financial instruments were insignificant to our results of operations for the sixnine months ended JuneSeptember 30, 2018.
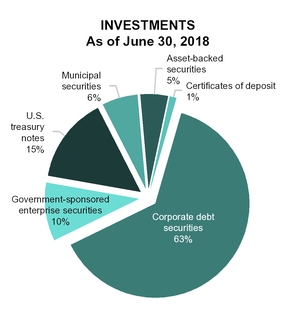
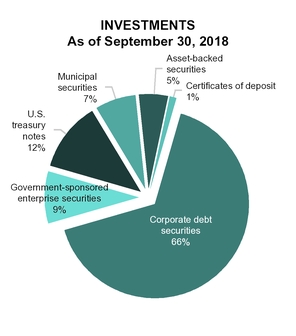
Our financial instruments measured at fair value on a recurring basis at JuneSeptember 30, 2018, were as follows: | | | | Total | | Quoted Market Prices (Level 1) | | Significant Other Observable Inputs (Level 2) | | Significant Unobservable Inputs (Level 3) | Total | | Quoted Market Prices (Level 1) | | Significant Other Observable Inputs (Level 2) | | Significant Unobservable Inputs (Level 3) |
| | (In millions) | (In millions) |
| Corporate debt securities | $ | 1,382 |
| | $ | — |
| | $ | 1,382 |
| | $ | — |
| $ | 1,191 |
| | $ | — |
| | $ | 1,191 |
| | $ | — |
|
| U.S. treasury notes | 330 |
| | 330 |
| | — |
| | — |
| 221 |
| | 221 |
| | — |
| | — |
|
| Government-sponsored enterprise securities (GSEs) | 207 |
| | 207 |
| | — |
| | — |
| 170 |
| | 170 |
| | — |
| | — |
|
| Municipal securities | 136 |
| | — |
| | 136 |
| | — |
| 119 |
| | — |
| | 119 |
| | — |
|
| Asset-backed securities | 99 |
| | — |
| | 99 |
| | — |
| 92 |
| | — |
| | 92 |
| | — |
|
| Certificate of deposit | 19 |
| | — |
| | 19 |
| | — |
| 15 |
| | — |
| | 15 |
| | — |
|
| Other | 3 |
| | — |
| | 3 |
| | — |
| 4 |
| | — |
| | 4 |
| | — |
|
| Subtotal - current investments | 2,176 |
| | 537 |
| | 1,639 |
| | — |
| 1,812 |
| | 391 |
| | 1,421 |
| | — |
|
| Corporate debt securities | 55 |
| | — |
| | 55 |
| | — |
| |
| U.S. treasury notes | 25 |
| | 25 |
| | — |
| | — |
| |
| Subtotal - current restricted investments | 80 |
| | 25 |
| | 55 |
| | — |
| |
| 1.125% Call Option derivative asset | 657 |
| | — |
| | — |
| | 657 |
| 843 |
| | — |
| | — |
| | 843 |
|
| Total assets | $ | 2,913 |
| | $ | 562 |
| | $ | 1,694 |
| | $ | 657 |
| $ | 2,655 |
| | $ | 391 |
| | $ | 1,421 |
| | $ | 843 |
|
| | | | | | | | | | | | | | | |
| 1.125% Conversion Option derivative liability | $ | 657 |
| | $ | — |
| | $ | — |
| | $ | 657 |
| $ | 843 |
| | $ | — |
| | $ | — |
| | $ | 843 |
|
| Total liabilities | $ | 657 |
| | $ | — |
| | $ | — |
| | $ | 657 |
| $ | 843 |
| | $ | — |
| | $ | — |
| | $ | 843 |
|
Our financial instruments measured at fair value on a recurring basis at December 31, 2017, were as follows: |
| | | | | | | | | | | | | | | |
| | Total | | Quoted Market Prices (Level 1) | | Significant Other Observable Inputs (Level 2) | | Significant Unobservable Inputs (Level 3) |
| | (In millions) |
| Corporate debt securities | $ | 1,588 |
| | $ | — |
| | $ | 1,588 |
| | $ | — |
|
| U.S. treasury notes | 388 |
| | 388 |
| | — |
| | — |
|
| GSEs | 253 |
| | 253 |
| | — |
| | — |
|
| Municipal securities | 141 |
| | — |
| | 141 |
| | — |
|
| Asset-backed securities | 117 |
| | — |
| | 117 |
| | — |
|
| Certificates of deposit | 37 |
| | — |
| | 37 |
| | — |
|
| Subtotal - current investments | 2,524 |
| | 641 |
| | 1,883 |
| | — |
|
| Corporate debt securities | 101 |
| | — |
| | 101 |
| | — |
|
| U.S. treasury notes | 68 |
| | 68 |
| | — |
| | — |
|
| Subtotal - current restricted investments | 169 |
| | 68 |
| | 101 |
| | — |
|
| 1.125% Call Option derivative asset | 522 |
| | — |
| | — |
| | 522 |
|
| Total assets | $ | 3,215 |
| | $ | 709 |
| | $ | 1,984 |
| | $ | 522 |
|
| | | | | | | | |
| 1.125% Conversion Option derivative liability | $ | 522 |
| | $ | — |
| | $ | — |
| | $ | 522 |
|
| Total liabilities | $ | 522 |
| | $ | — |
| | $ | — |
| | $ | 522 |
|
Fair Value Measurements – Disclosure Only
The carrying amounts and estimated fair values of our senior notes are classified as Level 2 financial instruments. Fair value for these securities is determined using a market approach based on quoted market prices for similar securities in active markets or quoted prices for identical securities in inactive markets. The carrying amount and estimated fair value of the amount due under our Credit Facility was classified as a Level 3 financial instrument, because certain inputs used to determine its fair value were not observable. The carrying amount of the amount due under the Credit Facility as of December 31, 2017, approximated its fair value because the Credit Facility’s interest rate is a variable rate that approximates rates currently available to us.
| | | | June 30, 2018 | | December 31, 2017 | September 30, 2018 | | December 31, 2017 |
| | Carrying Amount | |
Fair Value | | Carrying Amount | |
Fair Value | Carrying Amount | |
Fair Value | | Carrying Amount | |
Fair Value |
| | (In millions) | (In millions) |
| 5.375% Notes | $ | 693 |
| | $ | 706 |
| | $ | 692 |
| | $ | 730 |
| $ | 693 |
| | $ | 711 |
| | $ | 692 |
| | $ | 730 |
|
1.125% Convertible Notes (1) | 420 |
| | 1,099 |
| | 496 |
| | 1,052 |
| |
1.125% Notes (1) | | 295 |
| | 1,142 |
| | 496 |
| | 1,052 |
|
| 4.875% Notes | 326 |
| | 320 |
| | 325 |
| | 329 |
| 326 |
| | 325 |
| | 325 |
| | 329 |
|
| 1.625% Convertible Notes | 63 |
| | 107 |
| | 157 |
| | 220 |
| |
1.625% Notes (2) | | — |
| | — |
| | 157 |
| | 220 |
|
Credit Facility | — |
| | — |
| | 300 |
| | 300 |
| — |
| | — |
| | 300 |
| | 300 |
|
| | $ | 1,502 |
| | $ | 2,232 |
| | $ | 1,970 |
| | $ | 2,631 |
| $ | 1,314 |
| | $ | 2,178 |
| | $ | 1,970 |
| | $ | 2,631 |
|
______________________
| |
| (1) | The fair value of the 1.125% Conversion Option (the embedded cash conversion option), which is included in the fair value amounts presented above, amounted to $657$843 million and $522 million as of JuneSeptember 30, 2018, and December 31, 2017, respectively. See further discussion at Note 7, “Debt,” and Note 8, “Derivatives.” |
| |
| (2) | For more information on debt repayments in the nine months ended September 30, 2018, refer to Note 7, “Debt.” |
5. Investments
Available-for-Sale Investments
We consider all of our investments classified as current assets (including restricted investments) to be available-for-sale. Our 4.875% Notes, as further discussed in Note 7, “Debt,” contain a limitation on the use of proceeds which required us to deposit the net proceeds from their issuance into a segregated deposit account, a current asset reported as “Restricted investments” in the accompanying consolidated balance sheets. Such proceeds, while
restricted as to their use and held in a segregated deposit account, are available-for-sale based upon our contractual liquidity requirements.
The following tables summarize our investments as of the dates indicated: | | | | June 30, 2018 | September 30, 2018 |
| | Amortized | | Gross Unrealized | | Estimated Fair | Amortized | | Gross Unrealized | | Estimated Fair |
| | Cost | | Gains | | Losses | | Value | Cost | | Gains | | Losses | | Value |
| | (In millions) | (In millions) |
| Corporate debt securities | $ | 1,390 |
| | $ | — |
| | $ | 8 |
| | $ | 1,382 |
| $ | 1,197 |
| | $ | 1 |
| | $ | 7 |
| | $ | 1,191 |
|
| U.S. treasury notes | 331 |
| | — |
| | 1 |
| | 330 |
| 222 |
| | — |
| | 1 |
| | 221 |
|
| GSEs | 209 |
| | — |
| | 2 |
| | 207 |
| 172 |
| | — |
| | 2 |
| | 170 |
|
| Municipal securities | 138 |
| | — |
| | 2 |
| | 136 |
| 121 |
| | — |
| | 2 |
| | 119 |
|
| Asset backed securities | 100 |
| | — |
| | 1 |
| | 99 |
| 93 |
| | — |
| | 1 |
| | 92 |
|
| Certificates of deposit | 19 |
| | — |
| | — |
| | 19 |
| 15 |
| | — |
| | — |
| | 15 |
|
| Other | 3 |
| | — |
| | — |
| | 3 |
| 4 |
| | — |
| | — |
| | 4 |
|
| Subtotal - current investments | 2,190 |
| | — |
| | 14 |
| | 2,176 |
| |
| Corporate debt securities | 55 |
| | — |
| | — |
| | 55 |
| |
| U.S. treasury notes | 25 |
| | — |
| | — |
| | 25 |
| |
| Subtotal - current restricted investments | 80 |
| | — |
| | — |
| | 80 |
| |
| | $ | 2,270 |
| | $ | — |
| | $ | 14 |
| | $ | 2,256 |
| $ | 1,824 |
| | $ | 1 |
| | $ | 13 |
| | $ | 1,812 |
|
|
| | | | | | | | | | | | | | | |
| | December 31, 2017 |
| | Amortized | | Gross Unrealized | | Estimated Fair |
| | Cost | | Gains | | Losses | | Value |
| | (In millions) |
| Corporate debt securities | $ | 1,591 |
| | $ | 1 |
| | $ | 4 |
| | $ | 1,588 |
|
| U.S. treasury notes | 389 |
| | — |
| | 1 |
| | 388 |
|
| GSEs | 255 |
| | — |
| | 2 |
| | 253 |
|
| Municipal securities | 142 |
| | — |
| | 1 |
| | 141 |
|
| Asset-backed securities | 117 |
| | — |
| | — |
| | 117 |
|
| Certificates of deposit | 37 |
| | — |
| | — |
| | 37 |
|
| Subtotal - current investments | 2,531 |
| | 1 |
| | 8 |
| | 2,524 |
|
| Corporate debt securities | 101 |
| | — |
| | — |
| | 101 |
|
| U.S. treasury notes | 68 |
| | — |
| | — |
| | 68 |
|
| Subtotal - current restricted investments | 169 |
| | — |
| | — |
| | 169 |
|
| | $ | 2,700 |
| | $ | 1 |
| | $ | 8 |
| | $ | 2,693 |
|
The contractual maturities of our available-for-sale investments as of JuneSeptember 30, 2018 are summarized below: | | | | Amortized Cost | | Estimated Fair Value | Amortized Cost | | Estimated Fair Value |
| | (In millions) | (In millions) |
| Due in one year or less | $ | 1,356 |
| | $ | 1,354 |
| $ | 1,025 |
| | $ | 1,023 |
|
| Due after one year through five years | 914 |
| | 902 |
| 799 |
| | 789 |
|
| | $ | 2,270 |
| | $ | 2,256 |
| $ | 1,824 |
| | $ | 1,812 |
|
As discussed further in Note 7, “Debt,” the 4.875% Notes’ indenture required us to hold a portion of the net proceeds from their issuance in a segregated account to be used to settle the conversion of the 1.625% Notes. Prior to September 30, 2018, this account was reported as a current asset, entitled “Restricted investments,” in the accompanying consolidated balance sheets. Because this account was used to settle the conversion of the 1.625% Notes in the third quarter of 2018, current restricted investments, as of September 30, 2018, was reduced to zero.
Gross realized gains and losses from sales of available-for-sale securities are calculated under the specific identification method and are included in investment income. Gross realized investment gains and losses for the three and sixnine months ended JuneSeptember 30, 2018 and 2017 were insignificant.
We have determined that unrealized losses at JuneSeptember 30, 2018 and December 31, 2017, are temporary in nature, because the change in market value for these securities has resulted from fluctuating interest rates, rather than a deterioration of the creditworthiness of the issuers. So long as we maintain the intent and ability to hold these securities to maturity, we are unlikely to experience losses. In the event that we dispose of these securities before maturity, we expect that realized losses, if any, will be insignificant.
The following table segregates those available-for-sale investments that have been in a continuous loss position for less than 12 months, and those that have been in a continuous loss position for 12 months or more as of JuneSeptember 30, 2018:
| | | | In a Continuous Loss Position for Less than 12 Months | | In a Continuous Loss Position for 12 Months or More | In a Continuous Loss Position for Less than 12 Months | | In a Continuous Loss Position for 12 Months or More |
| | Estimated Fair Value | | Unrealized Losses | | Total Number of Positions | | Estimated Fair Value | | Unrealized Losses | | Total Number of Positions | Estimated Fair Value | | Unrealized Losses | | Total Number of Positions | | Estimated Fair Value | | Unrealized Losses | | Total Number of Positions |
| | (Dollars in millions) | (Dollars in millions) |
| Corporate debt securities | $ | 959 |
| | $ | 7 |
| | 535 |
| | $ | 116 |
| | $ | 1 |
| | 72 |
| $ | 727 |
| | $ | 4 |
| | 460 |
| | $ | 186 |
| | $ | 3 |
| | 127 |
|
| U.S. Treasury notes | 224 |
| | 1 |
| | 52 |
| | — |
| | — |
| | — |
| — |
| | — |
| | — |
| | 94 |
| | 1 |
| | 31 |
|
| GSEs | — |
| | — |
| | — |
| | 113 |
| | 2 |
| | 56 |
| — |
| | — |
| | — |
| | 127 |
| | 2 |
| | 68 |
|
| Municipal securities | 81 |
| | 1 |
|
| 79 |
|
| 40 |
|
| 1 |
|
| 52 |
| 63 |
| | 1 |
|
| 63 |
|
| 55 |
|
| 1 |
|
| 57 |
|
| Asset backed securities | 90 |
| | 1 |
| | 59 |
| | — |
| | — |
| | — |
| 72 |
| | 1 |
| | 41 |
| | — |
| | — |
| | — |
|
| | $ | 1,354 |
| | $ | 10 |
| | 725 |
| | $ | 269 |
| | $ | 4 |
| | 180 |
| $ | 862 |
| | $ | 6 |
| | 564 |
| | $ | 462 |
| | $ | 7 |
| | 283 |
|
The following table segregates those available-for-sale investments that have been in a continuous loss position for less than 12 months, and those that have been in a continuous loss position for 12 months or more as of December 31, 2017:
|
| | | | | | | | | | | | | | | | | | | | | |
| | In a Continuous Loss Position for Less than 12 Months | | In a Continuous Loss Position for 12 Months or More |
| | Estimated Fair Value | | Unrealized Losses | | Total Number of Positions | | Estimated Fair Value | | Unrealized Losses | | Total Number of Positions |
| | (Dollars in millions) |
| Corporate debt securities | $ | 1,297 |
| | $ | 3 |
| | 561 |
| | $ | 94 |
| | $ | 1 |
| | 69 |
|
| U.S. Treasury Notes | 470 |
| | 1 |
| | 89 |
| | — |
| | — |
| | — |
|
| GSEs | 173 |
| | 1 |
| | 69 |
| | 95 |
| | 1 |
| | 47 |
|
| Municipal securities | — |
| | — |
| | — |
| | 38 |
| | 1 |
| | 48 |
|
| | $ | 1,940 |
| | $ | 5 |
| | 719 |
| | $ | 227 |
| | $ | 3 |
| | 164 |
|
Held-to-Maturity Investments
Pursuant to the regulations governing our Health Plans segment subsidiaries, we maintain statutory deposits and deposits required by government authorities primarily in certificates of deposit and U.S. treasury securities. We also maintain restricted investments as protection against the insolvency of certain capitated providers. The use of these funds is limited as required by regulations in the various states in which we operate, or as needed in the event of insolvency of capitated providers. Therefore, such investments are reported as non-current “Restricted investments” in the accompanying consolidated balance sheets. We have the ability to hold these restricted investments until maturity, and as a result, we would not expect the value of these investments to decline significantly due to a sudden change in market interest rates.
Our held-to-maturity restricted investments are carried at amortized cost, which approximates fair value. SuchHeld-to-maturity restricted investments amounted to $117 million at Juneas of September 30, 2018, and mature in one year or less.are summarized below:
|
| | | | | | | |
| | Amortized Cost | | Estimated Fair Value |
| | (In millions) |
| Due in one year or less | $ | 111 |
| | $ | 111 |
|
| Due after one year through five years | 7 |
| | 7 |
|
| | $ | 118 |
| | $ | 118 |
|
6. Medical Claims and Benefits Payable
The following table provides the details of our medical claims and benefits payable (including amounts payable for the provision of long-term services and supports, or LTSS) as of the dates indicated:
| | | | June 30,
2018 | | December 31,
2017 | September 30,
2018 | | December 31,
2017 |
| | (In millions) | (In millions) |
| Fee-for-service claims incurred but not paid (IBNP) | $ | 1,510 |
| | $ | 1,717 |
| $ | 1,609 |
| | $ | 1,717 |
|
| Pharmacy payable | 116 |
| | 112 |
| 121 |
| | 112 |
|
| Capitation payable | 49 |
| | 67 |
| 48 |
| | 67 |
|
| Other | 245 |
| | 296 |
| 264 |
| | 296 |
|
| | $ | 1,920 |
| | $ | 2,192 |
| $ | 2,042 |
| | $ | 2,192 |
|
“Other” medical claims and benefits payable includes amounts payable to certain providers for which we act as an intermediary on behalf of various government agencies without assuming financial risk. Such receipts and payments do not impact our consolidated statements of operations. Non-risk provider payables amounted to $158 million and $122 million as of JuneSeptember 30, 2018 and December 31, 2017, respectively.
The following table presents the components of the change in our medical claims and benefits payable for the periods indicated. The amounts presented for “Components of medical care costs related to: Prior periods” represent the amounts by which our original estimate of medical claims and benefits payable at the beginning of the
period were more(more) less than the actual amount of the liability based on information (principally the payment of claims) developed since that liability was first reported.
| | | | Six Months Ended June 30, | Nine Months Ended September 30, |
| | 2018 | | 2017 | 2018 | | 2017 |
| | (Dollars in millions) | (In millions) |
| Medical claims and benefits payable, beginning balance | $ | 2,192 |
| | $ | 1,929 |
| $ | 2,192 |
| | $ | 1,929 |
|
| Components of medical care costs related to: | | | | | | |
| Current period | 7,794 |
| | 8,633 |
| 11,589 |
| | 12,813 |
|
| Prior periods | (222 | ) | | (31 | ) | (227 | ) | | 9 |
|
| Total medical care costs | 7,572 |
| | 8,602 |
| 11,362 |
| | 12,822 |
|
| | | | | | | |
| Change in non-risk provider payables | 56 |
| | (114 | ) | 60 |
| | 172 |
|
| | | | | | | |
| Payments for medical care costs related to: | | | | | | |
| Current period | 6,248 |
| | 6,883 |
| 9,866 |
| | 10,944 |
|
| Prior periods | 1,652 |
| | 1,457 |
| 1,706 |
| | 1,501 |
|
| Total paid | 7,900 |
| | 8,340 |
| 11,572 |
| | 12,445 |
|
| Medical claims and benefits payable, ending balance | $ | 1,920 |
| | $ | 2,077 |
| $ | 2,042 |
| | $ | 2,478 |
|
The differences between our original estimates and the amounts ultimately paid out for the most part relate to IBNP. Assuming that our initial estimate of IBNP is accurate, we believe that amounts ultimately paid would generally be between 8% and 10% less than the IBNP liability recorded at the end of the period as a result of the inclusion in that liability of the provision for adverse claims deviation and the accrued cost of settling those claims. Because we establish the provision for adverse claims deviation and the accrued cost of settling claims on a consistent basis every quarter, the lower cost recognized in a subsequent period if such a provision proved unnecessary would be offset by the establishment of a similar provision during that subsequentsame period.
Because the amount of our initial liability is an estimate, we will always experience variability in that estimate as new information becomes available with the passage of time. Therefore, there can be no assurance that amounts ultimately paid out will fall within the range of 8% to 10% lower than the liability that was initially recorded. Furthermore,
Further, because our initial estimate of IBNP is derived from many factors, some of which are qualitative in nature rather than quantitative, we are seldom able to assign specific values to the reasons for a change in estimate—we only know when the circumstances for any one or more factors are out of the ordinary.
The differences between our original estimates and the amounts ultimately paid out for the most part relate to IBNP. While many related factors working in conjunction with one another serve to determine the accuracy of our estimates, we are seldom able to quantify the impact that any single factor has on a change in estimate. In addition, given the variability inherent in the reserving process, we will only be able to identify specific factors if they represent a significant departure from expectations. As a result, we do not expect to be able to fully quantify the impact of individual factors on changes in estimates.
We believe that the most significant uncertainties surrounding our IBNP estimates at JuneSeptember 30, 2018 are as follows:
Across all of our health plans, the inventory of unpaid claims increased significantly during the first half of 2017, then decreased in the last half of 2017 and into 2018. Changes in claims inventories impact the timing between date of service and the date of claim payment, increasing the volatility of our liability estimates.
In June 2018, our Puerto Rico health plan implemented state prescribed claim billing requirements to ensure more accurate claims submissions. The billing requirements were more stringent and caused a significant number of claim denials. Although we expect providers to ultimately submit updated claims with
the required information, the impact of the new billing requirements createcreates more uncertainty in our liability estimates.
At our Florida health plan, a new clinical service system was implemented in the first quarter of 2018. This system impacted the reporting of inpatient authorizations used in our development of claims liabilities, which makes our liability estimates subject to more than the usual amount of uncertainty.
We recently implemented a new process for increased quality review of claims payments in nine11 of our health plans. While we do not anticipate this new process will impact the percentage of claims paid within the timely turnaround requirements, we believe it will have a minor impact on the timing of some paid claims. For this reason, our liability estimates in the ninethese 11 health plans are subject to more than the usual amount of uncertainty.
We recognized favorable prior period claims development in the amount of $222$227 million for the sixnine months ended JuneSeptember 30, 2018. This amount represents our estimate as of JuneSeptember 30, 2018, of the extent to which our initial estimate of medical claims and benefits payable at December 31, 2017, was more than the amount that will ultimately be paid out in satisfaction of that liability. We believe the overestimation wasthese differences were due primarily to the following factors:
The impact of the provision for adverse claims deviation and the accrued cost of settling claims as discussed above. Because we re-establish the provision for adverse claims deviation and the accrued cost of settling claims on a consistent basis every quarter, the impact of this item onto medical care costs in the first half ofnine months ended September 30, 2018, results was minimal.
Across all of our health plans, the inventory of unpaid claims increased significantly during the first half of 2017, then decreased in the last half of 2017. In hindsight, the impact of the changes in claims processing timing reduced our liabilities more than we had anticipated.
December 2017 data from The Centers for Disease Control and Prevention indicated widespread influenza activity in several states in which we operate health plans. The additional liabilities established in consideration of increased claims related to a more severe influenza season turned out to be higher than our actual experience.
In establishing our liability at December 31, 2017, we anticipated an increase in the utilization of medical services by Marketplace members concerned about the future of their healthcare coverage as a result of uncertainties related to high premium increases and issuer exits. This induced demand did not materialize to the degree we expected.
7. Debt
As of September 30, 2018, contractual maturities of debt were as follows. All amounts represent the principal amounts of the debt instruments outstanding.
|
| | | | | | | | | | | | | | | | | | | | | | | | | | | |
| | Total | | 2019 | | 2020 | | 2021 | | 2022 | | 2023 | | Thereafter |
| | | | | | | | | | | | | | |
| | (In millions) |
| 5.375% Notes | $ | 700 |
| | $ | — |
| | $ | — |
| | $ | — |
| | $ | 700 |
| | $ | — |
| | $ | — |
|
| 4.875% Notes | 330 |
| | — |
| | — |
| | — |
| | — |
| | — |
| | 330 |
|
| 1.125% Notes | 314 |
| | — |
| | 314 |
| | — |
| | — |
| | — |
| | — |
|
| | $ | 1,344 |
| | $ | — |
| | $ | 314 |
| | $ | — |
| | $ | 700 |
| | $ | — |
| | $ | 330 |
|
All of our debt is held at the parent, which is reported in the Other segment. The following table summarizes our outstanding debt obligations and their classification in the accompanying consolidated balance sheets:
| | | | June 30,
2018 | | December 31,
2017 | September 30,
2018 | | December 31,
2017 |
| | (In millions) | (In millions) |
| Current portion of long-term debt: | | | | | | |
| 1.125% Convertible Notes, net of unamortized discount | $ | 422 |
| | $ | 499 |
| |
| 1.625% Convertible Notes, net of unamortized discount | 63 |
| | 157 |
| |
| 1.125% Notes, net of unamortized discount of $18 at September 30, 2018, and $51 at December 31, 2017 | | $ | 296 |
| | $ | 499 |
|
| 1.625% Notes, net of unamortized discount of $3 at December 31, 2017 | | — |
| | 157 |
|
| Lease financing obligations | 1 |
| | 1 |
| 1 |
| | 1 |
|
| Debt issuance costs | (2 | ) | | (4 | ) | (1 | ) | | (4 | ) |
| | 484 |
| | 653 |
| 296 |
| | 653 |
|
| Non-current portion of long-term debt: | | | | | | |
| 5.375% Notes | 700 |
| | 700 |
| 700 |
| | 700 |
|
| 4.875% Notes | 330 |
| | 330 |
| 330 |
| | 330 |
|
| Credit Facility | — |
| | 300 |
| — |
| | 300 |
|
| Debt issuance costs | (11 | ) | | (12 | ) | (11 | ) | | (12 | ) |
| | 1,019 |
| | 1,318 |
| 1,019 |
| | 1,318 |
|
| Lease financing obligations | 198 |
| | 198 |
| 198 |
| | 198 |
|
| | $ | 1,701 |
| | $ | 2,169 |
| $ | 1,513 |
| | $ | 2,169 |
|
Interest cost recognized relating to our convertible senior notes for the periods presented was as follows:
| | | | Three Months Ended June 30, | | Six Months Ended June 30, | Three Months Ended September 30, | | Nine Months Ended September 30, |
| | 2018 | | 2017 | | 2018 | | 2017 | 2018 | | 2017 | | 2018 | | 2017 |
| | (In millions) | (In millions) |
| Contractual interest at coupon rate | $ | 2 |
| | $ | 3 |
| | $ | 4 |
| | $ | 6 |
| $ | 1 |
| | $ | 3 |
| | $ | 5 |
| | $ | 9 |
|
| Amortization of the discount | 6 |
| | 8 |
| | 13 |
| | 16 |
| 5 |
| | 8 |
| | 18 |
| | 24 |
|
| | $ | 8 |
| | $ | 11 |
| | $ | 17 |
| | $ | 22 |
| $ | 6 |
| | $ | 11 |
| | $ | 23 |
| | $ | 33 |
|
Credit Facility
In January 2017, we entered into an amended unsecured $500 million revolving credit facility (Credit(the Credit Facility). The Credit Facility has a term of five years and all amounts outstanding will be due and payable on January 31, 2022. In May 2018, we repaid allthe $300 million outstanding borrowings under the Credit Facility. As of JuneSeptember 30, 2018, no amounts were outstanding under the Credit Facility, and outstanding letters of credit amounting to $6 million reduced our borrowing capacity under the Credit Facility to $494 million.
Borrowings under our Credit Facility bear interest based, at our election, on a base rate or an adjusted London Interbank Offered Rate (LIBOR), plus in each case the applicable margin. In addition to interest payable on the principal amount of indebtedness outstanding from time to time under the Credit Facility, we are required to pay a quarterly commitment fee. Certain of our wholly owned subsidiaries guarantee our obligations under the Credit Facility. The Credit Facility contains customary non-financial and financial covenants, including a net leverage ratio and an interest coverage ratio. As of JuneSeptember 30, 2018, we were in compliance with all financial and non-financial covenants under the Credit Facility and other long-term debt.
Bridge Credit Agreement
In January 2018, we entered into a bridge credit agreement (Bridge Credit Agreement) with several banks. Under the Bridge Credit Agreement, we may borrow up to $550 million to: (i) satisfy conversions of our 1.125% Convertible Notes; (ii) satisfy and/or refinance indebtedness incurred to satisfy conversion of the 1.125% Convertible Notes; (iii) repay or refinance our Credit Facility; and (iv) pay fees and expensesbanks, which was subsequently terminated in connection with the foregoing. Subject to the satisfaction of certain conditions, the remaining amount of any borrowing may be used for general corporate purposes.
Borrowings under the Bridge Credit Agreement are reduced by the following:
Any future debt and/or equity transactions including term loans, but excluding any Credit Facility drawing (excluding transactions with proceeds used for working capital purposes and acquisition financings up to $300 million); and
On August 20, 2018 (the first put date for the 1.625% Convertible Notes), the Bridge Credit Agreement shall permanently be reduced by the greater of $150 million; and the principal amount of the 1.625% Convertible Notes that are exchanged into equity or otherwise defeased on or prior to that date.
The Bridge Credit Agreement matures on January 1, 2019 and, subject to the satisfaction of certain conditions, we may elect to extend twice the initial maturity date by a period of six months each. The amount available for borrowing under the Bridge Credit Agreement at June 30, 2018, was $550 million.
Borrowings under the Bridge Credit Agreement bear interest based, at our election, at a base rate or an adjusted LIBOR rate, plus in each case the applicable margin. Our wholly owned subsidiaries that guarantee our obligations under the indenture governing the 4.875% Notes, the 5.375% Notes, and the Credit Facility have jointly and severally guaranteed our obligations under the Bridge Credit Agreement.
The Bridge Credit Agreement contains usual and customary (a) affirmative covenants for credit facilities of this type which are substantially similar to those contained in the Credit Facility, (b) negative covenants consistent with those contained in the 4.875% Notes and (c) events of default for credit facilities of this type which are substantially similar to those contained in the 4.875% Notes.
4.875% Notes due 2025
We have outstanding $330 million aggregate principal amount of senior notes (4.875% Notes) due June 15, 2025, unless earlier redeemed. Interest on the 4.875% Notes is payable semiannually in arrears on June 15 and December 15. Guarantees under the 4.875% Notes mirror those of the Credit Facility. See Note 13, “Supplemental Condensed Consolidating Financial Information,” for more information on the guarantors. The 4.875% Notes contain customary non-financial covenants and change of control provisions.
The 4.875% Notes contain a limitation on the use of proceeds which required us to deposit a portion of the net proceeds from their issuance into a segregated deposit account. These funds may be used by us as follows:
On or prior to August 20, 2018, to:
| |
◦ | Redeem, repurchase, repay, tender for, or acquire for value all or any portion of our 1.625% Convertible Notes, defined and discussed further below, or to satisfy the cash portion of any consideration due upon any conversion of the 1.625% Convertible Notes and/or |
| |
◦ | Pay any interest due on all or any portion of the 4.875% Notes. |
On or after August 20, 2018, to repurchase all or any portion of the 1.625% Convertible Notes that we are obligated to repurchase; and
Subsequent to August 20, 2018 (or such earlier date in the event that there are no longer any 1.625% Convertible Notes outstanding), in any other manner not otherwise prohibited in the indenture governing the 4.875% Notes.
The investments that constitute the segregated funds are current assets reported as “Restricted investments” in the accompanying consolidated balance sheets. As a result of the 1.625% Exchange described below, approximately $94 million of such investments were transferred to unrestricted current investments in the first quarter of 2018. As of June 30, 2018, the balance of current restricted investments was $80 million.
5.375% Notes due 2022
We have outstanding $700 million aggregate principal amount of senior notes (5.375%(the 5.375% Notes) outstanding as of September 30, 2018, which are due November 15, 2022, unless earlier redeemed. Interest on the 5.375% Notes is payable semiannually in arrears on May 15 and November 15. Certain of our wholly owned subsidiaries guarantee our obligations under the 5.375% Notes. SuchNotes; such guarantees mirror those of the Credit Facility. See Note 13, “Supplemental
“Supplemental Condensed Consolidating Financial Information,” for more information on the guarantors. The 5.375% Notes contain customary non-financial covenants and change in control provisions.
4.875% Notes due 2025
We have $330 million aggregate principal amount of senior notes (the 4.875% Notes) outstanding as of September 30, 2018, which are due June 15, 2025, unless earlier redeemed. Interest on the 4.875% Notes is payable semiannually in arrears on June 15 and December 15. Certain of our wholly owned subsidiaries guarantee our obligations under the 4.875% Notes; such guarantees mirror those of the Credit Facility. The 4.875% Notes contain customary non-financial covenants and change of control provisions.
1.125% Cash Convertible Senior Notes due 2020
In Junethe second and third quarters of 2018, we entered into two separate, privately negotiated note purchase agreements with certain holders of our outstanding 1.125% cash convertible senior notes due January 15, 2020 (1.125% Convertible(the 1.125% Notes).
In these transactions,the third quarter of 2018, we repaid $96$140 million aggregate principal amount of the 1.125% Convertible Notes, plus accrued interest, for an aggregatea total cash payment of $228$483 million. The $132$343 million difference between the principal amount extinguished and our cash payment primarily represents primarily the settlement of the fair value of the 1.125% Convertible Notes’ embedded cash conversion option feature at fair value (which is a derivative liability we refer to as the 1.125% Conversion Option).
In addition,the second quarter of 2018, we repaid $96 million aggregate principal amount of the 1.125% Notes, plus accrued interest, for a total cash payment of $228 million. As noted above, the $132 million difference between the principal amount extinguished and our cash payment primarily represents the settlement of the embedded cash conversion option feature at fair value.
In the nine months ended September 30, 2018, we have recorded a loss on debt extinguishment of $5$15 million for the 1.125% Notes purchases, including $10 million in the third quarter of 2018, primarily relating to the acceleration of the debt discount, whichdiscount. This loss is recordedreported in “Other expenses (income), net” in the accompanying consolidated statements of operations. No common shares were issued in connection with these transactions.
Also in June 2018, inIn connection with the 1.125% Notes purchases, we also entered into privately negotiated termination agreements with each of the counterparties in the second and third quarters of 2018, to partially terminate the Call Spread Overlay, defined and further discussed in Notes 8, “Derivatives,” and 9, “Stockholders' Equity.” The net cash proceeds from the Call Spread Overlay partial termination transactions partially offset the cash paid to settle the 1.125% Notes.
Following the transactions described above, we have outstanding $454$314 million aggregate principal amount of the 1.125% Convertible Notes.Notes outstanding at September 30, 2018. Interest is payable semiannually in arrears on January 15 and July 15.
The 1.125% Convertible Notes are convertible only into cash, and not into shares of our common stock or any other securities. The initial conversion rate for the 1.125% Convertible Notes is 24.5277 shares of our common stock per $1,000 principal amount, or approximately $40.77 per share of our common stock. Upon conversion, in lieu of receiving shares of our common stock, a holder will receive an amount in cash, per $1,000 principal amount of 1.125% Convertible Notes, equal to the settlement amount, determined in the manner set forth in the indenture. We may not redeem the 1.125% Convertible Notes prior to the maturity date.
The stock price trigger for the 1.125% Convertible Notes is $53.00 per share. The 1.125% Convertible Notes met this trigger inare convertible by the quarter ended June 30, 2018;holders within one year of the current balance sheet date until they mature; therefore, they are convertible into cash and are reported in current portion of long-term debt asdebt.
Concurrent with the issuance of June 30, 2018.
Thethe 1.125% Notes, the 1.125% Conversion Option was separated from the 1.125% Convertible Notes and accounted for separately as a derivative liability, with changes in fair value reported in our consolidated statements of operations until the 1.125% Conversion Option fully settles or expires. This initial liability simultaneously reduced the carrying value of the 1.125% Notes’ principal amount (effectively an original issuance discount), which is amortized to the principal amount through the recognition of non-cash interest expense over the expected life of the debt. The effective interest rate approximating what we would have incurred had nonconvertible debt with otherwise similar terms been issued is approximately 6%. As of JuneSeptember 30,
2018, the 1.125% Convertible Notes had a remaining amortization period of 1.5 years. The 1.125% Convertible Notes’ if-converted1.3 years, and their ‘if-converted’ value exceeded their principal amount by approximately $503$626 million and $406 million as of JuneSeptember 30, 2018 and December 31, 2017, respectively.
1.625% Convertible Senior Notes due 2044
Conversion. On July 11, 2018, we announced notice of our election to redeem the remaining $64 million aggregate principal amount of the 1.625% convertible senior notes due 2044 (the 1.625% Notes) on August 20, 2018 (the Redemption Date), pursuant to the terms of the indenture. Also pursuant to the indenture, the 1.625% Notes were convertible until August 17, 2018, at a conversion rate of 17.2157 shares of our common stock per $1,000 principal amount equal to the settlement amount (as defined in the related indenture), or approximately $58.09 per share of our common stock.
Through August 17, 2018, we received conversion notices from substantially all of the remaining holders of the 1.625% Notes outstanding. Under the conversions, we paid cash for the remaining $64 million aggregate principal amount and delivered 0.6 million shares of our common stock to the converting holders on the settlement dates in September 2018.
Exchange.In March 2018, we entered into separate, privately negotiated, synthetic exchange agreements (1.625% Exchange) with certain holders of our outstanding 1.625% convertible senior notes due 2044 (1.625% Convertible Notes). In this transaction,Notes, under which we exchanged $97 million aggregate principal amount and accrued interest for 1.8 million shares of our common stock. We recorded a loss on debt extinguishment, including transaction fees, of $10 million, for the transaction, primarily relating to the inducement premium paid to the bondholders, which is recorded in “Other expenses (income), net” in the accompanying consolidated statements of operations. We did not receive any proceeds from the 1.625% Exchange.
On July 11, 2018, we announced notice of our election to redeem the remaining $64 million aggregate principal amount of the 1.625% Convertible Notes on August 20, 2018 (the Redemption Date). Pursuant to the terms of the indenture, the 1.625% Convertible Notes will be redeemed for cash equal to 100% of the principal amount plus accrued and unpaid interest to, but excluding the Redemption Date (the Redemption Price).transaction.
Also pursuant to the indenture, the 1.625% Convertible Notes may be converted until August 17, 2018, at a conversion rate of 17.2157 shares of our common stock per $1,000 principal amount, or approximately $58.09 per share of our common stock. Upon conversion, we will pay cash for the principal and, if applicable, deliver shares of our common stock to the converting holders in an amount per $1,000 principal amount equal to the settlement amount (as defined in the related indenture). After August 17, 2018, holders will be entitled only to the Redemption Price.
Because the 1.625% Convertible Notes are convertible within 12 months, they are reported in current portion of long-term debt as of June 30, 2018.
From the issuance date in 2014, the expected life of the 1.625% Convertible Notes has been approximately four years, ending on the first date we may redeem the 1.625% Convertible Notes in August 2018. As of June 30, 2018, the 1.625% Convertible Notes had a remaining amortization period of 0.1 years. The effective interest rate approximating what we would have incurred had nonconvertible debt with otherwise similar terms been issued is approximately 5%. The outstanding 1.625% Convertible Notes’ if-converted value exceeded their principal amount at June 30, 2018 and December 31, 2017 by approximately $39 million and $50 million, respectively. At June 30, 2018 and December 31, 2017, the equity component of the 1.625% Convertible Notes, including the impact of deferred taxes, was $5 million and $12 million, respectively.
Cross-Default Provisions
The indentures governing the 4.875% Notes, the 5.375% Notes the 1.125% Convertible Notes and the 1.625% Convertible1.125% Notes contain cross-default provisions that are triggered upon default by us or any of our subsidiaries on any indebtedness in excess of the amount specified in the applicable indenture.
8. Derivatives
The following table summarizes the fair values and the presentation of our derivative financial instruments (defined and discussed individually below) in the accompanying consolidated balance sheets:
| | | | Balance Sheet Location | | June 30,
2018 | | December 31,
2017 | Balance Sheet Location | | September 30,
2018 | | December 31,
2017 |
| | | (In millions) | | (In millions) |
| Derivative asset: | | | | | | | | |
| 1.125% Call Option | Current assets: Derivative asset | | $ | 657 |
| | $ | 522 |
| Current assets: Derivative asset | | $ | 843 |
| | $ | 522 |
|
| Derivative liability: | | | | | | | | |
| 1.125% Conversion Option | Current liabilities: Derivative liability | | $ | 657 |
| | $ | 522 |
| Current liabilities: Derivative liability | | $ | 843 |
| | $ | 522 |
|
Our derivative financial instruments do not qualify for hedge treatment; therefore, the change in fair value of these instruments is recognized immediately in our consolidated statements of operations, and reported in “Other expenses (income), net.” Gains and losses for our derivative financial instruments are presented individually in the accompanying consolidated statements of cash flows, “Supplemental cash flow information.”
1.125% Notes Call Spread Overlay. Concurrent with the issuance of the 1.125% Convertible Notes in 2013, we entered into privately negotiated hedge transactions (collectively, the 1.125% Call Option) and warrant transactions (collectively, the 1.125% Warrants), with certain of the initial purchasers of the 1.125% Convertible Notes (the Counterparties). We refer to these transactions collectively as the Call Spread Overlay. Under the Call Spread Overlay, the cost of the 1.125% Call Option we purchased to cover the cash outlay upon conversion of the 1.125% Convertible Notes was reduced by proceeds from the sale of the 1.125% Warrants. Assuming full performance by the Counterparties (and 1.125% Warrants strike prices in excess of the conversion price of the 1.125% Convertible Notes), these transactions are intended to offset cash payments in excess of the principal amount of the 1.125% Convertible Notes due upon any conversion of such notes.
In Junethe second and third quarters of 2018, in connection with the 1.125% Convertible Notes purchases (described in Note 7, “Debt”), we entered into privately negotiated termination agreements with each of the Counterparties to partially terminate the Call Spread Overlay, in notional amounts corresponding to the aggregate principal amount of the 1.125% Convertible Notes purchased. ThisIn the third quarter of 2018, this resulted in our receipt of $343 million for the settlement of the 1.125% Call Option (which is a derivative asset), and the payment of $306 million for the partial termination of the 1.125% Warrants, for an aggregate net cash receipt of $37 million from the Counterparties.
In the second quarter of 2018, this resulted in our receipt of $134 million for the settlement of the 1.125% Call Option, (which is a derivative asset), and the payment of $113 million for the partial termination of the 1.125% Warrants, for an aggregate net cash receipt of $21 million from the Counterparties.
1.125% Call Option. The 1.125% Call Option, which is indexed to our common stock, is a derivative asset that requires mark-to-market accounting treatment due to cash settlement features until the 1.125% Call Option settles or expires. For further discussion of the inputs used to determine the fair value of the 1.125% Call Option, refer to Note 4, “Fair Value Measurements.”
1.125% Conversion Option. The embedded cash conversion option within the 1.125% Convertible Notes is accounted for separately as a derivative liability, with changes in fair value reported in our consolidated statements of operations until the cash conversion option settles or expires. For further discussion of the inputs used to determine the fair value of the 1.125% Conversion Option, refer to Note 4, “Fair Value Measurements.”
As of JuneSeptember 30, 2018, the 1.125% Call Option and the 1.125% Conversion Option were classified as a current asset and current liability, respectively, because the 1.125% Convertible Notes may be converted within twelve months of JuneSeptember 30, 2018, as described in Note 7, “Debt.”
9. Stockholders' Equity
1.625% ExchangeNotes
Conversion. As described in Note 7, “Debt,” we issued 0.6 million shares of our common stock in connection with the conversion of the 1.625% Notes in the third quarter of 2018.
Exchange. As described in Note 7, “Debt,” we issued 1.8 million shares of our common stock in connection with the exchange of the 1.625% ExchangeNotes in March 2018.
1.125% Warrants
In connection with the Call Spread Overlay transaction described in Note 8, “Derivatives,” in 2013, we issued 13.5 million warrants with a strike price of $53.8475 per share. Under certain circumstances, beginning in April 2020, if the price of our common stock exceeds the strike price of the 1.125% Warrants, we will be obligated to issue shares of our common stock subject to a share delivery cap. The 1.125% Warrants could separately have a dilutive effect to the extent that the market value per share of our common stock exceeds the applicable strike price of the 1.125% Warrants. Refer to Note 3, “Net Income (Loss) per Share,” for dilution information for the periods presented. We will not receive any additional proceeds if the 1.125% Warrants are exercised. Following the transactions described below, 7.7 million of the 1.125% Warrants remain outstanding.
As described in Note 8, “Derivatives,” in Junethe second and third quarters of 2018, we entered into privately negotiated termination agreements with each of the Counterparties to partially terminate the Call Spread Overlay, in notional amounts corresponding to the aggregate principal amount of the 1.125% Convertible Notes purchased. WeIn the third quarter of 2018, we paid $306 million to the Counterparties for the termination of 3.4 million of the 1.125% Warrants outstanding, which resulted in a reduction of additional paid-in-capital for the same amount.
In the second quarter of 2018, we paid $113 million to the Counterparties for the termination of 2.4 million of the 1.125% Warrants outstanding, which resulted in a reduction of additional paid-in capital for the same amount. Following this transaction, 11.1 million of the 1.125% Warrants remain outstanding.
Share-Based Compensation
In connection with our equity incentive plans and employee stock purchase plan, approximately 276,000281,000 shares of common stock vested or were purchased, net of shares used to settle employees’ income tax obligations, during the sixnine months ended JuneSeptember 30, 2018.
We record share-basedShare-based compensation asis generally recorded to “General and administrative expenses” in the accompanying consolidated statements of operations. Total share-based compensation expense for the three and nine months ended September 30, 2018, amounted to $7 million and $20 million, respectively. Total share-based compensation expense for the three months ended September 30, 2017, amounted to $3 million. Total share-based compensation expense for the nine months ended September 30, 2017, amounted to $38 million, of which $23 million was recorded to “Restructuring and separation costs” in the accompanying consolidated statements of operations.
As of JuneSeptember 30, 2018, there was $46$41 million of total unrecognized compensation expense
related to unvested restricted stock awards (RSAs), performance stock awards (PSAs), and performance stock units (PSUs), which we expect to recognize over a remaining weighted-average period of 3.12.8 years, 0.70.4 years and 2.62.3 years, respectively. This unrecognized compensation cost assumes an estimated forfeiture rate of 10.8%12.1% for non-executive employees as of JuneSeptember 30, 2018.
Also as of JuneSeptember 30, 2018, there was $12$11 million of total unrecognized compensation expense related to unvested stock options, which we expect to recognize over a weighted-average period of 2.32.0 years. No stock options were granted or exercised in the sixnine months ended JuneSeptember 30, 2018.
Activity for RSAs, PSAs and PSUs, for the sixnine months ended JuneSeptember 30, 2018, is summarized below:
| | | | Restricted Stock Awards | | Performance Stock Awards | | Performance Stock Units | | Total | | Weighted Average Grant Date Fair Value | Restricted Stock Awards | | Performance Stock Awards | | Performance Stock Units | | Total | | Weighted Average Grant Date Fair Value |
| Unvested balance, December 31, 2017 | 401,804 |
| | 84,762 |
| | 91,828 |
| | 578,394 |
| | $ | 58.35 |
| 401,804 |
| | 84,762 |
| | 91,828 |
| | 578,394 |
| | $ | 58.35 |
|
| Granted | 346,491 |
| | — |
| | 211,969 |
| | 558,460 |
| | 73.43 |
| 353,618 |
| | — |
| | 212,926 |
| | 566,544 |
| | 73.85 |
|
| Vested | (183,595 | ) | | (32,929 | ) | | — |
| | (216,524 | ) | | 57.04 |
| (188,954 | ) | | (32,929 | ) | | — |
| | (221,883 | ) | | 57.87 |
|
| Forfeited | (124,690 | ) | | (48,701 | ) | | (101,320 | ) | | (274,711 | ) | | 63.38 |
| (152,243 | ) | | (48,701 | ) | | (104,527 | ) | | (305,471 | ) | | 63.67 |
|
| Unvested balance, June 30, 2018 | 440,010 |
| | 3,132 |
| | 202,477 |
| | 645,619 |
| | 69.69 |
| |
| Unvested balance, September 30, 2018 | | 414,225 |
| | 3,132 |
| | 200,227 |
| | 617,584 |
| | 70.11 |
|
The aggregate fair values of RSAs, PSAs and PSUs granted and vested are presented in the following table:
| | | | Six Months Ended June 30, | Nine Months Ended September 30, |
| | 2018 | | 2017 | 2018 | | 2017 |
| | (In millions) | (In millions) |
| Granted: | | | | | | |
| Restricted stock awards | $ | 25 |
| | $ | 19 |
| $ | 26 |
| | $ | 19 |
|
| Performance stock units | 16 |
| | 16 |
| 16 |
| | 16 |
|
| | $ | 41 |
| | $ | 35 |
| $ | 42 |
| | $ | 35 |
|
| Vested: | | | | | | |
| Restricted stock awards | $ | 14 |
| | $ | 20 |
| $ | 14 |
| | $ | 21 |
|
| Performance stock awards | 3 |
| | 15 |
| 3 |
| | 15 |
|
| Performance stock units | — |
| | 9 |
| — |
| | 9 |
|
| | $ | 17 |
| | $ | 44 |
| $ | 17 |
| | $ | 45 |
|
10. Restructuring and Separation Costs
Restructuring and separation costs are reported by the same name in the accompanying consolidated statements of operations.
IT Restructuring
Following the 2017 Restructuring Plan noted below, our new executive team has focused on a margin recovery plan that includes identification and implementation of various profit improvement initiatives. To that end, we have begun to implement a plan to restructure our information technology department (the IT Restructuring) in the third quarter of 2018.
Expected Costs
In addition to $3 million incurred in the third quarter of 2018, we expect to incur approximately $6 million for the IT Restructuring in the fourth quarter of 2018. We expect such costs to consist primarily of one-time termination benefits and other costs in the Other segment. We will update the total estimated costs for the IT Restructuring in our 2018 Annual Report on Form 10-K.
Costs Incurred
We have incurred expenses under the IT Restructuring as follows:
|
| | | | | | | | | | | | | | | |
| | Three and Nine Months Ended September 30, 2018 |
| | One-Time Termination Benefits | | Other Restructuring Costs | | Total |
| | | Consulting Fees | | Contract Termination Costs | |
| | (In millions) |
| Other | $ | 2 |
| | $ | 1 |
| | $ | — |
| | $ | 3 |
|
Reconciliation of Liability
For those restructuring and separation costs that require cash settlement (one-time termination benefits and consulting fees), the following table presents a roll-forward of the accrued liability, which is reported in “Accounts payable and accrued liabilities” in the accompanying consolidated balance sheets. |
| | | | | | | | | | | |
| | One-Time Termination Benefits | | Other Restructuring Costs | | Total |
| | |
| Accrued as of December 31, 2017 | $ | — |
| | $ | — |
| | $ | — |
|
| Charges | 2 |
| | 1 |
| | 3 |
|
| Cash payments | — |
| | — |
| | — |
|
| Accrued as of September 30, 2018 | $ | 2 |
| | $ | 1 |
| | $ | 3 |
|
2017 Restructuring Plan
Following a management-initiated, broad operational assessment in early 2017, our board of directors approved, and we committed to, a comprehensive restructuring and profitability improvement plan in June 2017 (the 2017 Restructuring Plan). Key activities under this plan to date have included:
Streamlining of our organizational structure to eliminate redundant layers of management, consolidate regional support services, and other staff reductions to improve efficiency and the speed and quality of decision making;
Re-design of core operating processes such as provider payment, utilization management, quality monitoring and improvement, and information technology, to achieve more effective and cost-efficient outcomes;
Remediation of high-cost provider contracts and enhancement of high quality, cost-effective networks;
Restructuring, including selective exits, of direct delivery operations; and
Partnering with the lowest-cost, most effective vendors.
Costs Incurred
In our 2017 Annual Report on Form 10-K, we reported that we had incurred substantially all of the costs associated with the 2017 Restructuring Plan in 2017, amounting to $234 million. In the first half ofnine months ended September 30, 2018, we incurred an
additional $33$35 million in such costs, primarily as a result of our further evaluation and write-off of a utilization and care management project terminated because of its inconsistency with the goals of the 2017 Restructuring Plan. We also recorded nominal amounts for one-time termination benefits, true-ups of certain lease contract termination costs, and consulting fees recorded in 2017. As of JuneSeptember 30, 2018, we had incurred $267$269 million in total costs under the 2017 Restructuring Plan; wePlan. We expect to complete all activities under the 2017 Restructuring Plan in 2018, with the exception of the cash settlement of lease termination liabilities. We expect to continue to settle those liabilities through 2025, unless the leases are terminated sooner.
Restructuring and separation costs are reported by the same name in the accompanying consolidated statements of operations. The following tables present the major types of such costs by segment. Current and long-lived assets include current and non-current capitalized project costs, and capitalized software determined to be unrecoverable.
|
| | | | | | | | | | | | | | | | | | | |
| | Three Months Ended June 30, 2018 |
| | One-Time Termination Benefits | | Other Restructuring Costs | | Total |
| | | Write-offs of Current and Long-lived Assets | | Consulting Fees | | Contract Termination Costs | |
| | (In millions) |
| Health Plans | $ | (1 | ) | | $ | — |
| | $ | — |
| | $ | 9 |
| | $ | 8 |
|
| | $ | (1 | ) | | $ | — |
| | $ | — |
| | $ | 9 |
| | $ | 8 |
|
|
| | | | | | | | | | | | | | | | | | | |
| | Three Months Ended September 30, 2018 |
| | One-Time Termination Benefits | | Other Restructuring Costs | | Total |
| | | Write-offs of Current and Long-lived Assets | | Consulting Fees | | Contract Termination Costs | |
| | (In millions) |
| Health Plans | $ | — |
| | $ | — |
| | $ | — |
| | $ | 2 |
| | $ | 2 |
|
| | $ | — |
| | $ | — |
| | $ | — |
| | $ | 2 |
| | $ | 2 |
|
| | | | Six Months Ended June 30, 2018 | Nine Months Ended September 30, 2018 |
| | One-Time Termination Benefits | | Other Restructuring Costs | | Total | One-Time Termination Benefits | | Other Restructuring Costs | | Total |
| | | Write-offs of Current and Long-lived Assets | | Consulting Fees | | Contract Termination Costs | | | Write-offs of Current and Long-lived Assets | | Consulting Fees | | Contract Termination Costs | |
| | (In millions) | (In millions) |
| Health Plans | $ | — |
| | $ | (1 | ) | | $ | — |
| | $ | 8 |
| | $ | 7 |
| $ | — |
| | $ | (1 | ) | | $ | — |
| | $ | 10 |
| | $ | 9 |
|
| Other | 5 |
| | 20 |
| | 1 |
| | — |
| | 26 |
| 5 |
| | 20 |
| | 1 |
| | — |
| | 26 |
|
| | $ | 5 |
| | $ | 19 |
| | $ | 1 |
| | $ | 8 |
| | $ | 33 |
| $ | 5 |
| | $ | 19 |
| | $ | 1 |
| | $ | 10 |
| | $ | 35 |
|
|
| | | | | | | | | | | | | | | | | | | | | | | |
| | Three Months and Six Months Ended June 30, 2017 |
| | Separation Costs - Former Executives | | One-Time Termination Benefits | | Other Restructuring Costs | | Total |
| | | | Write-offs of Current and Long-lived Assets | | Consulting Fees | | Contract Termination Costs | |
| | (In millions) |
| Other | $ | 35 |
| | $ | — |
| | $ | — |
| | $ | 8 |
| | $ | — |
| | $ | 43 |
|
| | $ | 35 |
| | $ | — |
| | $ | — |
| | $ | 8 |
| | $ | — |
| | $ | 43 |
|
|
| | | | | | | | | | | | | | | | | | | | | | | |
| | Three Months Ended September 30, 2017 |
| | Separation Costs - Former Executives | | One-Time Termination Benefits | | Other Restructuring Costs | | Total |
| | | | Write-offs of Current and Long-lived Assets | | Consulting Fees | | Contract Termination Costs | |
| | (In millions) |
| Health Plans | $ | — |
| | $ | 27 |
| | $ | 6 |
| | $ | — |
| | $ | — |
| | $ | 33 |
|
| Molina Medicaid Solutions | — |
| | — |
| | 8 |
| | — |
| | — |
| | 8 |
|
| Other | — |
| | 23 |
| | 35 |
| | 16 |
| | 3 |
| | 77 |
|
| | $ | — |
| | $ | 50 |
| | $ | 49 |
| | $ | 16 |
| | $ | 3 |
| | $ | 118 |
|
|
| | | | | | | | | | | | | | | | | | | | | | | |
| | Nine Months Ended September 30, 2017 |
| | Separation Costs - Former Executives | | One-Time Termination Benefits | | Other Restructuring Costs | | Total |
| | | | Write-offs of Current and Long-lived Assets | | Consulting Fees | | Contract Termination Costs | |
| | (In millions) |
| Health Plans | $ | — |
| | $ | 27 |
| | $ | 6 |
| | $ | — |
| | $ | — |
| | $ | 33 |
|
| Molina Medicaid Solutions | — |
| | — |
| | 8 |
| | — |
| | — |
| | 8 |
|
| Other | 35 |
| | 23 |
| | 35 |
| | 24 |
| | 3 |
| | 120 |
|
| | $ | 35 |
| | $ | 50 |
| | $ | 49 |
| | $ | 24 |
| | $ | 3 |
| | $ | 161 |
|
As of JuneSeptember 30, 2018, we had incurred cumulative restructuring costs under the 2017 Restructuring Plan as follows: | | | | Separation Costs - Former Executives | | One-Time Termination Benefits | | Other Restructuring Costs | | Total | Separation Costs - Former Executives | | One-Time Termination Benefits | | Other Restructuring Costs | | Total |
| | | Write-offs of Current and Long-lived Assets | | Consulting Fees | | Contract Termination Costs | | | Write-offs of Current and Long-lived Assets | | Consulting Fees | | Contract Termination Costs | |
| | (In millions) | (In millions) |
| Health Plans | $ | — |
| | $ | 33 |
| | $ | 15 |
| | $ | — |
| | $ | 32 |
| | $ | 80 |
| $ | — |
| | $ | 33 |
| | $ | 15 |
| | $ | — |
| | $ | 34 |
| | $ | 82 |
|
| Molina Medicaid Solutions | — |
| | — |
| | 8 |
| | — |
| | — |
| | 8 |
| — |
| | — |
| | 8 |
| | — |
| | — |
| | 8 |
|
| Other | 36 |
| | 39 |
| | 57 |
| | 45 |
| | 2 |
| | 179 |
| 36 |
| | 39 |
| | 57 |
| | 45 |
| | 2 |
| | 179 |
|
| | $ | 36 |
| | $ | 72 |
| | $ | 80 |
| | $ | 45 |
| | $ | 34 |
| | $ | 267 |
| $ | 36 |
| | $ | 72 |
| | $ | 80 |
| | $ | 45 |
| | $ | 36 |
| | $ | 269 |
|
Reconciliation of Liability
For those restructuring and separation costs that require cash settlement (primarily separation costs, one-time termination benefits, consulting fees and contract termination costs), the following table presents a roll-forward of
the accrued liability, which is reported in “Accounts payable and accrued liabilities” in the accompanying
consolidated balance sheets. The adjustments are due to true-ups of costs recorded in 2017.
| | | | Separation Costs - Former Executives | | One-Time Termination Benefits | | Other Restructuring Costs | | Total | Separation Costs - Former Executives | | One-Time Termination Benefits | | Other Restructuring Costs | | Total |
| | (In millions) | (In millions) |
| Accrued as of December 31, 2017 | $ | 2 |
| | $ | 11 |
| | $ | 35 |
| | $ | 48 |
| $ | 2 |
| | $ | 11 |
| | $ | 35 |
| | $ | 48 |
|
| Adjustments | — |
| | (1 | ) | | 8 |
| | 7 |
| — |
| | (1 | ) | | 10 |
| | 9 |
|
| Charges | — |
| | 6 |
| | 2 |
| | 8 |
| — |
| | 6 |
| | 2 |
| | 8 |
|
| Cash payments | (2 | ) | | (15 | ) | | (13 | ) | | (30 | ) | (2 | ) | | (15 | ) | | (15 | ) | | (32 | ) |
| Accrued as of June 30, 2018 | $ | — |
| | $ | 1 |
| | $ | 32 |
| | $ | 33 |
| |
| Accrued as of September 30, 2018 | | $ | — |
| | $ | 1 |
| | $ | 32 |
| | $ | 33 |
|
11. Segments
We have three reportable segments. These segments, consistconsisting of our Health Plans segment, which constitutes the vast majority of our operations; our Molina Medicaid Solutions segment; and our Other segment. Our reportable segments are consistent with how we currently manage the business and view the markets we serve. Refer to Note 1, “Organization and Basis of Presentation,” for a discussion of our recent divestiture of Pathways.
Recent Developments – Molina Medicaid Solutions Segment
In late 2017, as partWe closed on the sale of the 2017 Restructuring Plan, management decided to pursue the divestiture of MMS.
In June 2018, we entered into a definitive agreement to sell Molina Medicaid Solutions (MMS)MMS to DXC Technology Company.Company on September 30, 2018. The divestiture, expected to close in the third quarter of 2018, is subject to the satisfaction of customary closing conditions and the receipt of certain third party consents and regulatory approvals. We expect the net cash selling price for the equity interests of MMS to approximate $220was $233 million, after certain adjustments.
which we received on October 1, 2018. As a result of June 30, 2018, Molina Medicaid Solutions’ major classesthis transaction, we recognized a pretax gain, net of assets and liabilities were as follows:
|
| | | |
| | (In millions) |
| Cash and cash equivalents | $ | 9 |
|
| Receivables and prepaid expenses | 41 |
|
| Goodwill and property, equipment, and capitalized software, net | 70 |
|
| Deferred contract costs and other assets | 110 |
|
| Total assets held for sale | $ | 230 |
|
| | |
| Accounts payable and accrued and other liabilities | $ | 27 |
|
| Deferred revenue | 39 |
|
| Total liabilities held for sale | $ | 66 |
|
Description of Earnings Measures for Reportable Segments
Gross marginMargin is the appropriate earnings measure for our reportable segments, based on how our chief operating decision maker currently reviews results, assesses performance, and allocates resources.
Gross marginMargin for our Health Plans segment is referred to as “Medical margin,” and for our Molina Medicaid Solutions and Other segments, as “Service margin.” Medical margin represents the amount earned by the Health Plans segment after medical care costs are deducted from premium revenue. The medical care ratio represents medical care costs as a percentage of premium revenue, and is one of the key metrics used to assess the performance of the Health Plans segment. Therefore, the underlying medical margin is the most important measure of earnings reviewed by the chief operating decision maker. The service margin is equal to service revenue minus cost of service revenue.
The following table presents total revenue by segment. Inter-segment revenue was insignificant for all periods presented.
| | | | Three Months Ended June 30, | | Six Months Ended June 30, | Three Months Ended September 30, | | Nine Months Ended September 30, |
| | 2018 | | 2017 | | 2018 | | 2017 | 2018 | | 2017 | | 2018 | | 2017 |
| | (In millions) | (In millions) |
| Total revenue: | | | | | | | | | | | | | | |
| Health Plans | $ | 4,752 |
| | $ | 4,868 |
| | $ | 9,261 |
| | $ | 9,639 |
| $ | 4,565 |
| | $ | 4,899 |
| | $ | 13,826 |
| | $ | 14,538 |
|
| Molina Medicaid Solutions | 48 |
| | 47 |
| | 99 |
| | 93 |
| 53 |
| | 47 |
| | 152 |
| | 140 |
|
| Other | 83 |
| | 84 |
| | 169 |
| | 171 |
| 79 |
| | 85 |
| | 248 |
| | 256 |
|
| Consolidated | $ | 4,883 |
| | $ | 4,999 |
| | $ | 9,529 |
| | $ | 9,903 |
| $ | 4,697 |
| | $ | 5,031 |
| | $ | 14,226 |
| | $ | 14,934 |
|
The following table reconciles gross margin by segment to consolidated income (loss) before income taxes: | | | | Three Months Ended June 30, | | Six Months Ended June 30, | Three Months Ended September 30, | | Nine Months Ended September 30, |
| | 2018 | | 2017 | | 2018 | | 2017 | 2018 | | 2017 | | 2018 | | 2017 |
| | (In millions) | (In millions) |
| Gross margin: | | | | | | | | |
| Margin: | | | | | | | | |
| Health Plans | $ | 664 |
| | $ | 249 |
| | $ | 1,265 |
| | $ | 786 |
| $ | 547 |
| | $ | 557 |
| | $ | 1,812 |
| | $ | 1,343 |
|
| Molina Medicaid Solutions | 4 |
| | 4 |
| | 12 |
| | 8 |
| 14 |
| | 5 |
| | 26 |
| | 13 |
|
| Other | 5 |
| | 1 |
| | 11 |
| | 6 |
| 5 |
| | 2 |
| | 16 |
| | 8 |
|
| Total gross margin | 673 |
| | 254 |
| | 1,288 |
| | 800 |
| |
| Total margin | | 566 |
| | 564 |
| | 1,854 |
| | 1,364 |
|
Add: other operating revenues (1) | 242 |
| | 130 |
| | 431 |
| | 255 |
| 230 |
| | 124 |
| | 661 |
| | 379 |
|
| Add: gain on sale of subsidiary | | 37 |
| | — |
| | 37 |
| | — |
|
Less: other operating expenses (2) | (573 | ) | | (671 | ) | | (1,155 | ) | | (1,260 | ) | (538 | ) | | (769 | ) | | (1,693 | ) | | (2,029 | ) |
| Operating income (loss) | 342 |
| | (287 | ) | | 564 |
| | (205 | ) | 295 |
| | (81 | ) | | 859 |
| | (286 | ) |
| Other expenses (income), net | 37 |
| | 27 |
| | 80 |
| | (22 | ) | |
| Other expenses, net | | 36 |
| | 32 |
| | 116 |
| | 10 |
|
| Income (loss) before income taxes | $ | 305 |
| | $ | (314 | ) | | $ | 484 |
| | $ | (183 | ) | $ | 259 |
| | $ | (113 | ) | | $ | 743 |
| | $ | (296 | ) |
______________________
| |
| (1) | Other operating revenues include premium tax revenue, health insurer fees reimbursed, and investment income and other revenue. |
| |
| (2) | Other operating expenses include general and administrative expenses, premium tax expenses, health insurer fees, depreciation and amortization, impairment losses, and restructuring and separation costs.costs, and impairment losses. |
12. Commitments and Contingencies
Marketplace Risk Adjustment Program
On July 7, 2018, the Centers for Medicare and Medicaid Services (CMS) announced that a February 28, 2018 ruling in the U.S. District Court for the District of New Mexico prevents CMS from making further collections or payments under the risk adjustment program, including amounts for the 2017 benefit year, until the litigation is resolved. In light of a contrary decision by the U.S. District Court for the District of Massachusetts, the government moved the New Mexico district court to reconsider its decision, and CMS is currently awaiting the court’s ruling. On July 30, 2018, CMS published in the Federal Register the final rule that reissues, with additional policy explanation, the risk adjustment methodology that CMS had previously established. Due to the reissuance of the rule, the risk adjustment program for the 2017 benefit year will proceed, with solely a one-month delay — from August 2018 to September 2018 — in collection settlement.
As reported in Note 2, “Significant Accounting Policies,” our Marketplace risk adjustment payable amounted to $1,159 million as of June 30, 2018, and is reported in “Amounts due government agencies” in the accompanying consolidated balance sheets.
California Medicaid Expansion Risk Corridor
In October 2018, we entered into contract amendments with the second quarterCalifornia Department of 2018, California health plans participating inHealth Care Services that retroactively reinstated the Medicaid Expansion program received unofficial and unverified information that CMS did not approve premium ratesrisk corridor requirement for the state fiscal year ended June 30, 2017. It is our understanding that, as a condition of approving the rates, CMS may require the application of aThis risk corridor similar to the risk corridor that was in effect for periods prior to July 2016. The risk corridor for that prior period appliedmandates a minimum medical loss ratio (MLR) of 85% and a maximum MLR of 95%. It is our understanding that the state of California is currently evaluating what actions it will take, if any, with respect to the 2016-2017 rates
and risk corridor issue. The potentialestimated impact of retroactively reinstating a minimum MLRsuch requirement if effected, would beresulted in a reduction to 2016 and 2017 premium revenue relating to 2016 and 2017. Such an adjustment for these prior periods, if effected, could have a material adverse effect on our consolidated financial position, results of operations, or cash flows.totaling approximately $57 million, which we recognized in the quarter ended September 30, 2018.
Regulatory Capital Requirements and Dividend Restrictions
Our health plans are subject to state laws and regulations that, among other things, require the maintenance of minimum levels of statutory capital, as defined by each state. Regulators in some states may also attempt to enforce capital requirements that require the retention of net worth in excess of amounts formally required by statute or regulation. Such statutes, regulations, and informal capital requirements also restrict the timing, payment, and amount of dividends and other distributions that may be paid to us as the sole stockholder. To the extent our subsidiaries must comply with these regulations, they may not have the financial flexibility to transfer funds to us. Based on current statutes and regulations, the net assets in these subsidiaries (after intercompany eliminations) which may not be transferable to us in the form of loans, advances, or cash dividends was approximately $2,008$2,041 million at JuneSeptember 30, 2018, and $1,691 million at December 31, 2017. Because of the statutory restrictions that inhibit the ability of our health plans to transfer net assets to us, the amount of retained earnings readily available to pay dividends to our stockholders is generally limited to cash, cash equivalents and investments held by the parent company—Molina Healthcare, Inc. Such cash, cash equivalents and investments amounted to approximately $350 million and $696 million as of June 30, 2018 and December 31, 2017, respectively.
As of JuneSeptember 30, 2018, our health plans had aggregate statutory capital and surplus of approximately $2,152$2,125 million compared with the estimated required minimum aggregate statutory capital and surplus of approximately $1,180$1,138 million. All of our health plans were in compliance with the minimum capital requirements at JuneSeptember 30, 2018. We have the ability, and have committed to provide, additional capital to each of our health plans as necessary to ensure compliance with statutory capital and surplus requirements.
Legal Proceedings
The health care industry is subject to numerous laws and regulations of federal, state, and local governments. Penalties associated with violations of these laws and regulations include significant fines, exclusion from participating in publicly funded programs, and the repayment of previously collected revenues.
In the ordinary course of business we are involved in legal actions, some of which seek monetary damages, including claims for punitive damages, which are not covered by insurance. We have accrued liabilities for certain matters for which we deem the loss to be both probable and reasonably estimable, but the outcome of legal actions is inherently uncertain and our estimates of such losses could change as a result of further developments of these matters. For certain pending matters, accruals have not been established because such matters have not progressed sufficiently through discovery or factual development to enable us to reasonably estimate a range of possible loss. An adverse determination in one or more of these pending matters could have a material adverse effect on our consolidated financial position, results of operations, or cash flows.
Steamfitters Local 449 Pension Plan v. Molina Healthcare, Inc,Inc., et al. On April 27,October 5, 2018, the Steamfitters Local 449 Pension Plan filed aits first amended class action securities complaint in the Central District Court of California against the Company and its former executive officers, J. Mario Molina, John C. Molina, Terry P. Bayer, and Rick Hopfer, Case 2:18-cv-03579. The amended complaint purports to seek recovery on behalf of all persons or entities who purchased Molina common stock between October 31, 2014, and August 2, 2017, for alleged violations under Sections 10(b) and 20(a) of the Securities Exchange Act of 1934, as amended, and Rule 10b-5 promulgated thereunder. The plaintiff alleges the defendants misled investors regarding the scalability of the Company’s administrative infrastructure during the identified class period. The Company believes it has meritorious defenses to the alleged claims and intends to defend the matter vigorously.
States’ Budgets
Nearly all of our premium revenues come from the joint federal and state funding of the Medicaid and Children’s Health Insurance Program (CHIP) programs. The states and Commonwealth in which we operate our health plans regularly face significant budgetary pressures.
13. Supplemental Condensed Consolidating Financial Information
As discussed in Note 7, “Debt,” we have outstanding $700 million aggregate principal amount of 5.375% Notes due November 15, 2022, unless earlier redeemed. TheAt September 30, 2018, the 5.375% Notes were registered in September 2016, and are fully
and unconditionally guaranteed by certain of our wholly owned subsidiaries on a joint and several basis, with exceptions considered customary for such guarantees.
For all periods presented, the following condensed consolidating financial statements present Molina Healthcare, Inc. (as “Parent Guarantor”), the subsidiary guarantors (as “Other Guarantors”), the subsidiary non-guarantors (as “Non-Guarantors”) and “Eliminations”, according to the guarantor structure as assessed as of and for the sixnine months ended JuneSeptember 30, 2018.
In connection with the divestiture of MMS described in Note 11, “Segments,” MMS was released as an “Other Guarantor” effective September 30, 2018, and is reported in “Non-Guarantors” for all periods presented.
CONDENSED CONSOLIDATING STATEMENTS OF INCOME
|
| | | | | | | | | | | | | | | | | | | |
| | Three Months Ended June 30, 2018 |
| | Parent Guarantor | | Other Guarantors | | Non-Guarantors | | Eliminations | | Consolidated |
| | (In millions) |
| Revenue: | | | | | | | | | |
| Total revenue | $ | 261 |
| | $ | 49 |
| | $ | 4,834 |
| | $ | (261 | ) | | $ | 4,883 |
|
| Expenses: | | | | | | | | | |
| Medical care costs | 3 |
| | — |
| | 3,847 |
| | — |
| | 3,850 |
|
| Cost of service revenue | — |
| | 44 |
| | 74 |
| | — |
| | 118 |
|
| General and administrative expenses | 252 |
| | 3 |
| | 341 |
| | (261 | ) | | 335 |
|
| Premium tax expenses | — |
| | — |
| | 106 |
| | — |
| | 106 |
|
| Health insurer fees | — |
| | — |
| | 99 |
| | — |
| | 99 |
|
| Depreciation and amortization | 18 |
| | — |
| | 7 |
| | — |
| | 25 |
|
| Restructuring and separation costs | (1 | ) | | — |
| | 9 |
| | — |
| | 8 |
|
| Total operating expenses | 272 |
| | 47 |
| | 4,483 |
| | (261 | ) | | 4,541 |
|
| Operating (loss) income | (11 | ) | | 2 |
| | 351 |
| | — |
| | 342 |
|
| Interest expense | 31 |
| | — |
| | 1 |
| | — |
| | 32 |
|
| Other expenses, net | 5 |
| | — |
| | — |
| | — |
| | 5 |
|
| (Loss) income before income taxes | (47 | ) | | 2 |
| | 350 |
| | — |
| | 305 |
|
| Income tax expense | 1 |
| | 1 |
| | 101 |
| | — |
| | 103 |
|
| Net (loss) income before equity in net earnings (losses) of subsidiaries | (48 | ) | | 1 |
| | 249 |
| | — |
| | 202 |
|
| Equity in net earnings (losses) of subsidiaries | 250 |
| | (1 | ) | | — |
| | (249 | ) | | — |
|
| Net income | $ | 202 |
| | $ | — |
| | $ | 249 |
| | $ | (249 | ) | | $ | 202 |
|
CONDENSED CONSOLIDATING STATEMENTS OF COMPREHENSIVE INCOME
|
| | | | | | | | | | | | | | | | | | | |
| | Three Months Ended June 30, 2018 |
| | Parent Guarantor | | Other Guarantors | | Non-Guarantors | | Eliminations | | Consolidated |
| | (In millions) |
| Net income | $ | 202 |
| | $ | — |
| | $ | 249 |
| | $ | (249 | ) | | $ | 202 |
|
| Other comprehensive gain, net of tax | 2 |
| | — |
| | 2 |
| | (2 | ) | | 2 |
|
| Comprehensive income | $ | 204 |
| | $ | — |
| | $ | 251 |
| | $ | (251 | ) | | $ | 204 |
|
CONDENSED CONSOLIDATING STATEMENTS OF OPERATIONS
| | | | Three Months Ended June 30, 2017 | Three Months Ended September 30, 2018 |
| | Parent Guarantor | | Other Guarantors | | Non-Guarantors | | Eliminations | | Consolidated | Parent Guarantor | | Other Guarantors | | Non-Guarantors | | Eliminations | | Consolidated |
| | (In millions) | (In millions) |
| Revenue: | | | | | | | | | | | | | | | | | | |
| Total revenue | $ | 289 |
| | $ | 51 |
| | $ | 4,952 |
| | $ | (293 | ) | | $ | 4,999 |
| $ | 273 |
| | $ | — |
| | $ | 4,695 |
| | $ | (271 | ) | | $ | 4,697 |
|
| Expenses: | | | | | | | | | | | | | | | | | | |
| Medical care costs | 3 |
| | — |
| | 4,488 |
| | — |
| | 4,491 |
| (11 | ) | | — |
| | 3,801 |
| | — |
| | 3,790 |
|
| Cost of service revenue | — |
| | 43 |
| | 81 |
| | — |
| | 124 |
| — |
| | — |
| | 111 |
| | — |
| | 111 |
|
| General and administrative expenses | 258 |
| | 7 |
| | 433 |
| | (293 | ) | | 405 |
| 243 |
| | 1 |
| | 338 |
| | (271 | ) | | 311 |
|
| Premium tax expenses | — |
| | — |
| | 114 |
| | — |
| | 114 |
| — |
| | — |
| | 110 |
| | — |
| | 110 |
|
| Health insurer fees | | — |
| | — |
| | 87 |
| | — |
| | 87 |
|
| Depreciation and amortization | 25 |
| | — |
| | 12 |
| | — |
| | 37 |
| 17 |
| | — |
| | 8 |
| | — |
| | 25 |
|
| Impairment losses | — |
| | — |
| | 72 |
| | — |
| | 72 |
| |
| Restructuring and separation costs | 43 |
| | — |
| | — |
| | — |
| | 43 |
| 3 |
| | — |
| | 2 |
| | — |
| | 5 |
|
| Total operating expenses | 329 |
| | 50 |
| | 5,200 |
| | (293 | ) | | 5,286 |
| 252 |
| | 1 |
| | 4,457 |
| | (271 | ) | | 4,439 |
|
| Operating (loss) income | (40 | ) | | 1 |
| | (248 | ) | | — |
| | (287 | ) | |
| Gain on sale of subsidiary | | 37 |
| | — |
| | — |
| | — |
| | 37 |
|
| Operating income (loss) | | 58 |
| | (1 | ) | | 238 |
| | — |
| | 295 |
|
| Interest expense | 27 |
| | — |
| | — |
| | — |
| | 27 |
| 26 |
| | — |
| | — |
| | — |
| | 26 |
|
| (Loss) income before income taxes | (67 | ) | | 1 |
| | (248 | ) | | — |
| | (314 | ) | |
| Income tax benefit | (14 | ) | | — |
| | (70 | ) | | — |
| | (84 | ) | |
| Net (loss) income before equity in net losses of subsidiaries | (53 | ) | | 1 |
| | (178 | ) | | — |
| | (230 | ) | |
| Equity in net losses of subsidiaries | (177 | ) | | (64 | ) | | — |
| | 241 |
| | — |
| |
| Net loss | $ | (230 | ) | | $ | (63 | ) | | $ | (178 | ) | | $ | 241 |
| | $ | (230 | ) | |
| Other expenses, net | | 10 |
| | — |
| | — |
| | — |
| | 10 |
|
| Income (loss) before income taxes | | 22 |
| | (1 | ) | | 238 |
| | — |
| | 259 |
|
| Income tax (benefit) expense | | (6 | ) | | — |
| | 68 |
| | — |
| | 62 |
|
| Net income (loss) before equity in net earnings (losses) of subsidiaries | | 28 |
| | (1 | ) | | 170 |
| | — |
| | 197 |
|
| Equity in net earnings (losses) of subsidiaries | | 169 |
| | (2 | ) | | — |
| | (167 | ) | | — |
|
| Net income (loss) | | $ | 197 |
| | $ | (3 | ) | | $ | 170 |
| | $ | (167 | ) | | $ | 197 |
|
CONDENSED CONSOLIDATING STATEMENTS OF COMPREHENSIVE INCOME (LOSS)
|
| | | | | | | | | | | | | | | | | | | |
| | Three Months Ended June 30, 2017 |
| | Parent Guarantor | | Other Guarantors | | Non-Guarantors | | Eliminations | | Consolidated |
| | (In millions) |
| Net loss | $ | (230 | ) | | $ | (63 | ) | | $ | (178 | ) | | $ | 241 |
| | $ | (230 | ) |
| Other comprehensive income, net of tax | — |
| | — |
| | — |
| | — |
| | — |
|
| Comprehensive loss | $ | (230 | ) | | $ | (63 | ) | | $ | (178 | ) | | $ | 241 |
| | $ | (230 | ) |
|
| | | | | | | | | | | | | | | | | | | |
| | Three Months Ended September 30, 2018 |
| | Parent Guarantor | | Other Guarantors | | Non-Guarantors | | Eliminations | | Consolidated |
| | (In millions) |
| Net income (loss) | $ | 197 |
| | $ | (3 | ) | | $ | 170 |
| | $ | (167 | ) | | $ | 197 |
|
| Other comprehensive gain, net of tax | 1 |
| | — |
| | 1 |
| | (1 | ) | | 1 |
|
| Comprehensive income (loss) | $ | 198 |
| | $ | (3 | ) | | $ | 171 |
| | $ | (168 | ) | | $ | 198 |
|
CONDENSED CONSOLIDATING STATEMENTS OF INCOMEOPERATIONS
| | | | Six Months Ended June 30, 2018 | Three Months Ended September 30, 2017 |
| | Parent Guarantor | | Other Guarantors | | Non-Guarantors | | Eliminations | | Consolidated | Parent Guarantor | | Other Guarantors | | Non-Guarantors | | Eliminations | | Consolidated |
| | (In millions) | (In millions) |
| Revenue: | | | | | | | | | | | | | | | | | | |
| Total revenue | $ | 594 |
| | $ | 101 |
| | $ | 9,426 |
| | $ | (592 | ) | | $ | 9,529 |
| $ | 380 |
| | $ | (1 | ) | | $ | 5,031 |
| | $ | (379 | ) | | $ | 5,031 |
|
| Expenses: | | | | | | | | | | | | | | | | | | |
| Medical care costs | 7 |
| | — |
| | 7,565 |
| | — |
| | 7,572 |
| 3 |
| | — |
| | 4,217 |
| | — |
| | 4,220 |
|
| Cost of service revenue | — |
| | 87 |
| | 151 |
| | — |
| | 238 |
| — |
| | — |
| | 123 |
| | — |
| | 123 |
|
| General and administrative expenses | 519 |
| | 7 |
| | 753 |
| | (592 | ) | | 687 |
| 244 |
| | — |
| | 518 |
| | (379 | ) | | 383 |
|
| Premium tax expenses | — |
| | — |
| | 210 |
| | — |
| | 210 |
| — |
| | — |
| | 106 |
| | — |
| | 106 |
|
| Health insurer fees | — |
| | — |
| | 174 |
| | — |
| | 174 |
| |
| Depreciation and amortization | 36 |
| | — |
| | 15 |
| | — |
| | 51 |
| 23 |
| | — |
| | 10 |
| | — |
| | 33 |
|
| Restructuring and separation costs | 25 |
| | — |
| | 8 |
| | — |
| | 33 |
| 77 |
| | — |
| | 41 |
| | — |
| | 118 |
|
| Impairment losses | | — |
| | — |
| | 129 |
| | — |
| | 129 |
|
| Total operating expenses | 587 |
| | 94 |
| | 8,876 |
| | (592 | ) | | 8,965 |
| 347 |
| | — |
| | 5,144 |
| | (379 | ) | | 5,112 |
|
| Operating income | 7 |
| | 7 |
| | 550 |
| | — |
| | 564 |
| |
| Operating income (loss) | | 33 |
| | (1 | ) | | (113 | ) | | — |
| | (81 | ) |
| Interest expense | 64 |
| | — |
| | 1 |
| | — |
| | 65 |
| 32 |
| | — |
| | — |
| | — |
| | 32 |
|
| Other expenses, net | 15 |
| | — |
| | — |
| | — |
| | 15 |
| |
| (Loss) income before income taxes | (72 | ) | | 7 |
| | 549 |
| | — |
| | 484 |
| |
| Income tax expense | 10 |
| | 2 |
| | 163 |
| | — |
| | 175 |
| |
| Net (loss) income before equity in net earnings (losses of subsidiaries | (82 | ) | | 5 |
| | 386 |
| | — |
| | 309 |
| |
| Equity in net earnings (losses) of subsidiaries | 391 |
| | (4 | ) | | — |
| | (387 | ) | | — |
| |
| Net income | $ | 309 |
| | $ | 1 |
| | $ | 386 |
| | $ | (387 | ) | | $ | 309 |
| |
| Income (loss) before income taxes | | 1 |
| | (1 | ) | | (113 | ) | | — |
| | (113 | ) |
| Income tax expense (benefit) | | 9 |
| | (1 | ) | | (24 | ) | | — |
| | (16 | ) |
| Net loss before equity in net (losses) earnings of subsidiaries | | (8 | ) | | — |
| | (89 | ) | | — |
| | (97 | ) |
| Equity in net (losses) earnings of subsidiaries | | (89 | ) | | (86 | ) | | 8 |
| | 167 |
| | — |
|
| Net loss | | $ | (97 | ) | | $ | (86 | ) | | $ | (81 | ) | | $ | 167 |
| | $ | (97 | ) |
CONDENSED CONSOLIDATING STATEMENTS OF COMPREHENSIVE INCOMELOSS
|
| | | | | | | | | | | | | | | | | | | |
| | Six Months Ended June 30, 2018 |
| | Parent Guarantor | | Other Guarantors | | Non-Guarantors | | Eliminations | | Consolidated |
| | (In millions) |
| Net income | $ | 309 |
| | $ | 1 |
| | $ | 386 |
| | $ | (387 | ) | | $ | 309 |
|
| Other comprehensive loss, net of tax | (5 | ) | | — |
| | (5 | ) | | 5 |
| | (5 | ) |
| Comprehensive income | $ | 304 |
| | $ | 1 |
| | $ | 381 |
| | $ | (382 | ) | | $ | 304 |
|
|
| | | | | | | | | | | | | | | | | | | |
| | Three Months Ended September 30, 2017 |
| | Parent Guarantor | | Other Guarantors | | Non-Guarantors | | Eliminations | | Consolidated |
| | (In millions) |
| Net loss | $ | (97 | ) | | $ | (86 | ) | | $ | (81 | ) | | $ | 167 |
| | $ | (97 | ) |
| Other comprehensive income, net of tax | — |
| | — |
| | — |
| | — |
| | — |
|
| Comprehensive loss | $ | (97 | ) | | $ | (86 | ) | | $ | (81 | ) | | $ | 167 |
| | $ | (97 | ) |
CONDENSED CONSOLIDATING STATEMENTS OF OPERATIONS
| | | | Six Months Ended June 30, 2017 | Nine Months Ended September 30, 2018 |
| | Parent Guarantor | | Other Guarantors | | Non-Guarantors | | Eliminations | | Consolidated | Parent Guarantor | | Other Guarantors | | Non-Guarantors | | Eliminations | | Consolidated |
| | (In millions) | (In millions) |
| Revenue: | | | | | | | | | | | | | | | | | | |
| Total revenue | $ | 630 |
| | $ | 99 |
| | $ | 9,809 |
| | $ | (635 | ) | | $ | 9,903 |
| $ | 867 |
| | $ | 2 |
| | $ | 14,220 |
| | $ | (863 | ) | | $ | 14,226 |
|
| Expenses: | | | | | | | | | | | | | | | | | | |
| Medical care costs | 7 |
| | — |
| | 8,595 |
| | — |
| | 8,602 |
| (4 | ) | | — |
| | 11,366 |
| | — |
| | 11,362 |
|
| Cost of service revenue | — |
| | 85 |
| | 161 |
| | — |
| | 246 |
| — |
| | — |
| | 349 |
| | — |
| | 349 |
|
| General and administrative expenses | 555 |
| | 14 |
| | 910 |
| | (635 | ) | | 844 |
| 762 |
| | 3 |
| | 1,096 |
| | (863 | ) | | 998 |
|
| Premium tax expenses | — |
| | — |
| | 225 |
| | — |
| | 225 |
| — |
| | — |
| | 320 |
| | — |
| | 320 |
|
| Health insurer fees | | — |
| | — |
| | 261 |
| | — |
| | 261 |
|
| Depreciation and amortization | 52 |
| | — |
| | 24 |
| | — |
| | 76 |
| 53 |
| | — |
| | 23 |
| | — |
| | 76 |
|
| Impairment losses | — |
| | — |
| | 72 |
| | — |
| | 72 |
| |
| Restructuring and separation costs | 43 |
| | — |
| | — |
| | — |
| | 43 |
| 28 |
| | — |
| | 10 |
| | — |
| | 38 |
|
| Total operating expenses | 657 |
| | 99 |
| | 9,987 |
| | (635 | ) | | 10,108 |
| 839 |
| | 3 |
| | 13,425 |
| | (863 | ) | | 13,404 |
|
| Operating loss | (27 | ) | | — |
| | (178 | ) | | — |
| | (205 | ) | |
| Gain on sale of subsidiary | | 37 |
| | — |
| | — |
| | — |
| | 37 |
|
| Operating income (loss) | | 65 |
| | (1 | ) | | 795 |
| | — |
| | 859 |
|
| Interest expense | 53 |
| | — |
| | — |
| | — |
| | 53 |
| 90 |
| | — |
| | 1 |
| | — |
| | 91 |
|
| Other income, net | (75 | ) | | — |
| | — |
| | — |
| | (75 | ) | |
| Loss before income taxes | (5 | ) | | — |
| | (178 | ) | | — |
| | (183 | ) | |
| Income tax expense (benefit) | 17 |
| | — |
| | (47 | ) | | — |
| | (30 | ) | |
| Net loss before equity in net losses of subsidiaries | (22 | ) | | — |
| | (131 | ) | | — |
| | (153 | ) | |
| Equity in net losses of subsidiaries | (131 | ) | | (66 | ) | | — |
| | 197 |
| | — |
| |
| Net loss | $ | (153 | ) | | $ | (66 | ) | | $ | (131 | ) | | $ | 197 |
| | $ | (153 | ) | |
| Other expenses, net | | 25 |
| | — |
| | — |
| | — |
| | 25 |
|
| (Loss) income before income taxes | | (50 | ) | | (1 | ) | | 794 |
| | — |
| | 743 |
|
| Income tax expense | | 4 |
| | — |
| | 233 |
| | — |
| | 237 |
|
| Net (loss) income before equity in net earnings (losses) of subsidiaries | | (54 | ) | | (1 | ) | | 561 |
| | — |
| | 506 |
|
| Equity in net earnings (losses) of subsidiaries | | 560 |
| | (6 | ) | | — |
| | (554 | ) | | — |
|
| Net income (loss) | | $ | 506 |
| | $ | (7 | ) | | $ | 561 |
| | $ | (554 | ) | | $ | 506 |
|
CONDENSED CONSOLIDATING STATEMENTS OF COMPREHENSIVE INCOME (LOSS)
|
| | | | | | | | | | | | | | | | | | | |
| | Nine Months Ended September 30, 2018 |
| | Parent Guarantor | | Other Guarantors | | Non-Guarantors | | Eliminations | | Consolidated |
| | (In millions) |
| Net income (loss) | $ | 506 |
| | $ | (7 | ) | | $ | 561 |
| | $ | (554 | ) | | $ | 506 |
|
| Other comprehensive loss, net of tax | (4 | ) | | — |
| | (4 | ) | | 4 |
| | (4 | ) |
| Comprehensive income (loss) | $ | 502 |
| | $ | (7 | ) | | $ | 557 |
| | $ | (550 | ) | | $ | 502 |
|
CONDENSED CONSOLIDATING STATEMENTS OF OPERATIONS
|
| | | | | | | | | | | | | | | | | | | |
| | Nine Months Ended September 30, 2017 |
| | Parent Guarantor | | Other Guarantors | | Non-Guarantors | | Eliminations | | Consolidated |
| | (In millions) |
| Revenue: | | | | | | | | | |
| Total revenue | $ | 1,010 |
| | $ | 1 |
| | $ | 14,937 |
| | $ | (1,014 | ) | | $ | 14,934 |
|
| Expenses: | | | | | | | | | |
| Medical care costs | 10 |
| | — |
| | 12,812 |
| | — |
| | 12,822 |
|
| Cost of service revenue | — |
| | — |
| | 369 |
| | — |
| | 369 |
|
| General and administrative expenses | 799 |
| | 2 |
| | 1,440 |
| | (1,014 | ) | | 1,227 |
|
| Premium tax expenses | — |
| | — |
| | 331 |
| | — |
| | 331 |
|
| Depreciation and amortization | 75 |
| | — |
| | 34 |
| | — |
| | 109 |
|
| Restructuring and separation costs | 120 |
| | — |
| | 41 |
| | — |
| | 161 |
|
| Impairment losses | — |
| | — |
| | 201 |
| | — |
| | 201 |
|
| Total operating expenses | 1,004 |
| | 2 |
| | 15,228 |
| | (1,014 | ) | | 15,220 |
|
| Operating income (loss) | 6 |
| | (1 | ) | | (291 | ) | | — |
| | (286 | ) |
| Interest expense | 85 |
| | — |
| | — |
| | — |
| | 85 |
|
| Other income, net | (75 | ) | | — |
| | — |
| | — |
| | (75 | ) |
| Loss before income taxes | (4 | ) | | (1 | ) | | (291 | ) | | — |
| | (296 | ) |
| Income tax expense (benefit) | 26 |
| | (1 | ) | | (71 | ) | | — |
| | (46 | ) |
| Net loss before equity in net (losses) earnings of subsidiaries | (30 | ) | | — |
| | (220 | ) | | — |
| | (250 | ) |
| Equity in net (losses) earnings of subsidiaries | (220 | ) | | (152 | ) | | 8 |
| | 364 |
| | — |
|
| Net loss | $ | (250 | ) | | $ | (152 | ) | | $ | (212 | ) | | $ | 364 |
| | $ | (250 | ) |
CONDENSED CONSOLIDATING STATEMENTS OF COMPREHENSIVE LOSS
| | | | Six Months Ended June 30, 2017 | Nine Months Ended September 30, 2017 |
| | Parent Guarantor | | Other Guarantors | | Non-Guarantors | | Eliminations | | Consolidated | Parent Guarantor | | Other Guarantors | | Non-Guarantors | | Eliminations | | Consolidated |
| | (In millions) | (In millions) |
| Net loss | $ | (153 | ) | | $ | (66 | ) | | $ | (131 | ) | | $ | 197 |
| | $ | (153 | ) | $ | (250 | ) | | $ | (152 | ) | | $ | (212 | ) | | $ | 364 |
| | $ | (250 | ) |
| Other comprehensive income, net of tax | 1 |
| | — |
| | 1 |
| | (1 | ) | | 1 |
| 1 |
| | — |
| | 1 |
| | (1 | ) | | 1 |
|
| Comprehensive loss | $ | (152 | ) | | $ | (66 | ) | | $ | (130 | ) | | $ | 196 |
| | $ | (152 | ) | $ | (249 | ) | | $ | (152 | ) | | $ | (211 | ) | | $ | 363 |
| | $ | (249 | ) |
CONDENSED CONSOLIDATING BALANCE SHEETS
| | | | June 30, 2018 | September 30, 2018 |
| | Parent Guarantor | | Other Guarantors | | Non-Guarantors | | Eliminations | | Consolidated | Parent Guarantor | | Other Guarantors | | Non-Guarantors | | Eliminations | | Consolidated |
| | (In millions) | (In millions) |
ASSETS | | Current assets: | | | | | | | | | | | | | | | | | | |
| Cash and cash equivalents | $ | 235 |
| | $ | 2 |
| | $ | 3,155 |
| | $ | — |
| | $ | 3,392 |
| $ | 399 |
| | $ | 2 |
| | $ | 2,413 |
| | $ | — |
| | $ | 2,814 |
|
| Investments | 105 |
| | — |
| | 2,071 |
| | — |
| | 2,176 |
| 106 |
| | — |
| | 1,706 |
| | — |
| | 1,812 |
|
| Restricted investments | 80 |
| | — |
| | — |
| | — |
| | 80 |
| |
| Receivables | 2 |
| | — |
| | 1,146 |
| | — |
| | 1,148 |
| 2 |
| | — |
| | 1,344 |
| | — |
| | 1,346 |
|
| Due from (to) affiliates | 68 |
| | (6 | ) | | (62 | ) | | — |
| | — |
| 63 |
| | (4 | ) | | (59 | ) | | — |
| | — |
|
| Prepaid expenses and other current assets | 62 |
| | — |
| | 282 |
| | — |
| | 344 |
| 293 |
| | — |
| | 193 |
| | — |
| | 486 |
|
| Derivative asset | 657 |
| | — |
| | — |
| | — |
| | 657 |
| 843 |
| | — |
| | — |
| | — |
| | 843 |
|
| Assets held for sale | — |
| | 230 |
| | — |
| | — |
| | 230 |
| |
| Total current assets | 1,209 |
| | 226 |
| | 6,592 |
| | — |
| | 8,027 |
| 1,706 |
| | (2 | ) | | 5,597 |
| | — |
| | 7,301 |
|
| Property, equipment, and capitalized software, net | 196 |
| | — |
| | 80 |
| | — |
| | 276 |
| 187 |
| | — |
| | 77 |
| | — |
| | 264 |
|
| Goodwill and intangible assets, net | 14 |
| | — |
| | 187 |
| | — |
| | 201 |
| 14 |
| | — |
| | 181 |
| | — |
| | 195 |
|
| Restricted investments | — |
| | — |
| | 117 |
| | — |
| | 117 |
| — |
| | — |
| | 118 |
| | — |
| | 118 |
|
| Investment in subsidiaries, net | 2,761 |
| | 76 |
| | — |
| | (2,837 | ) | | — |
| 2,578 |
| | 74 |
| | — |
| | (2,652 | ) | | — |
|
| Deferred income taxes | 33 |
| | — |
| | 99 |
| | (18 | ) | | 114 |
| 48 |
| | — |
| | 95 |
| | — |
| | 143 |
|
| Other assets | 39 |
| | — |
| | 5 |
| | (16 | ) | | 28 |
| 40 |
| | — |
| | 6 |
| | (16 | ) | | 30 |
|
| | $ | 4,252 |
| | $ | 302 |
| | $ | 7,080 |
| | $ | (2,871 | ) | | $ | 8,763 |
| $ | 4,573 |
| | $ | 72 |
| | $ | 6,074 |
| | $ | (2,668 | ) | | $ | 8,051 |
|
| | | | | | | | | | | | | | | | | | | |
LIABILITIES AND STOCKHOLDERS’ EQUITY | | Current liabilities: | | | | | | | | | | | | | | | | | | |
| Medical claims and benefits payable | $ | 2 |
| | $ | — |
| | $ | 1,918 |
| | $ | — |
| | $ | 1,920 |
| $ | 4 |
| | $ | — |
| | $ | 2,038 |
| | $ | — |
| | $ | 2,042 |
|
| Amounts due government agencies | — |
| | — |
| | 1,746 |
| | — |
| | 1,746 |
| — |
| | — |
| | 1,030 |
| | — |
| | 1,030 |
|
| Accounts payable and accrued liabilities | 211 |
| | — |
| | 543 |
| | — |
| | 754 |
| 635 |
| | — |
| | 189 |
| | — |
| | 824 |
|
| Deferred revenue | — |
| | — |
| | 193 |
| | — |
| | 193 |
| — |
| | — |
| | 178 |
| | — |
| | 178 |
|
| Current portion of long-term debt | 484 |
| | — |
| | — |
| | — |
| | 484 |
| 296 |
| | — |
| | — |
| | — |
| | 296 |
|
| Derivative liability | 657 |
| | — |
| | — |
| | — |
| | 657 |
| 843 |
| | — |
| | — |
| | — |
| | 843 |
|
| Liabilities held for sale | — |
| | 66 |
| | — |
| | — |
| | 66 |
| |
| Total current liabilities | 1,354 |
| | 66 |
| | 4,400 |
| | — |
| | 5,820 |
| 1,778 |
| | — |
| | 3,435 |
| | — |
| | 5,213 |
|
| Long-term debt | 1,217 |
| | — |
| | 16 |
| | (16 | ) | | 1,217 |
| |
| Deferred income taxes | — |
| | 18 |
| | — |
| | (18 | ) | | — |
| |
| Long-term debt and lease financing obligations | | 1,217 |
| | — |
| | 16 |
| | (16 | ) | | 1,217 |
|
| Other long-term liabilities | 23 |
| | 1 |
| | 44 |
| | — |
| | 68 |
| 17 |
| | — |
| | 43 |
| | — |
| | 60 |
|
| Total liabilities | 2,594 |
| | 85 |
| | 4,460 |
| | (34 | ) | | 7,105 |
| 3,012 |
| | — |
| | 3,494 |
| | (16 | ) | | 6,490 |
|
| Total stockholders’ equity | 1,658 |
| | 217 |
| | 2,620 |
| | (2,837 | ) | | 1,658 |
| 1,561 |
| | 72 |
| | 2,580 |
| | (2,652 | ) | | 1,561 |
|
| | $ | 4,252 |
| | $ | 302 |
| | $ | 7,080 |
| | $ | (2,871 | ) | | $ | 8,763 |
| $ | 4,573 |
| | $ | 72 |
| | $ | 6,074 |
| | $ | (2,668 | ) | | $ | 8,051 |
|
CONDENSED CONSOLIDATING BALANCE SHEETS
| | | | December 31, 2017 | December 31, 2017 |
| | Parent Guarantor | | Other Guarantors | | Non-Guarantors | | Eliminations | | Consolidated | Parent Guarantor | | Other Guarantors | | Non-Guarantors | | Eliminations | | Consolidated |
| | (In millions) | (In millions) |
ASSETS | | Current assets: | | | | | | | | | | | | | | | | | | |
| Cash and cash equivalents | $ | 504 |
| | $ | 28 |
| | $ | 2,654 |
| | $ | — |
| | $ | 3,186 |
| $ | 504 |
| | $ | — |
| | $ | 2,682 |
| | $ | — |
| | $ | 3,186 |
|
| Investments | 192 |
| | — |
| | 2,332 |
| | — |
| | 2,524 |
| 192 |
| | — |
| | 2,332 |
| | — |
| | 2,524 |
|
| Restricted investments | 169 |
| | — |
| | — |
| | — |
| | 169 |
| 169 |
| | — |
| | — |
| | — |
| | 169 |
|
| Receivables | 2 |
| | 30 |
| | 839 |
| | — |
| | 871 |
| 2 |
| | — |
| | 869 |
| | — |
| | 871 |
|
| Due from (to) affiliates | 148 |
| | (6 | ) | | (142 | ) | | — |
| | — |
| 148 |
| | (5 | ) | | (143 | ) | | — |
| | — |
|
| Prepaid expenses and other current assets | 103 |
| | 14 |
| | 138 |
| | (16 | ) | | 239 |
| 103 |
| | 16 |
| | 136 |
| | (16 | ) | | 239 |
|
| Derivative asset | 522 |
| | — |
| | — |
| | — |
| | 522 |
| 522 |
| | — |
| | — |
| | — |
| | 522 |
|
| Total current assets | 1,640 |
| | 66 |
| | 5,821 |
| | (16 | ) | | 7,511 |
| 1,640 |
| | 11 |
| | 5,876 |
| | (16 | ) | | 7,511 |
|
| Property, equipment, and capitalized software, net | 223 |
| | 33 |
| | 86 |
| | — |
| | 342 |
| 223 |
| | — |
| | 119 |
| | — |
| | 342 |
|
| Goodwill and intangible assets, net | 15 |
| | 43 |
| | 197 |
| | — |
| | 255 |
| 15 |
| | — |
| | 240 |
| | — |
| | 255 |
|
| Restricted investments | — |
| | — |
| | 119 |
| | — |
| | 119 |
| — |
| | — |
| | 119 |
| | — |
| | 119 |
|
| Investment in subsidiaries, net | 2,306 |
| | 82 |
| | — |
| | (2,388 | ) | | — |
| 2,306 |
| | 82 |
| | — |
| | (2,388 | ) | | — |
|
| Deferred income taxes | 17 |
| | — |
| | 101 |
| | (15 | ) | | 103 |
| 17 |
| | — |
| | 101 |
| | (15 | ) | | 103 |
|
| Other assets | 32 |
| | 103 |
| | 7 |
| | (1 | ) | | 141 |
| 32 |
| | — |
| | 110 |
| | (1 | ) | | 141 |
|
| | $ | 4,233 |
| | $ | 327 |
| | $ | 6,331 |
| | $ | (2,420 | ) | | $ | 8,471 |
| $ | 4,233 |
| | $ | 93 |
| | $ | 6,565 |
| | $ | (2,420 | ) | | $ | 8,471 |
|
| | | | | | | | | | | | | | | | | | | |
LIABILITIES AND STOCKHOLDERS’ EQUITY | | Current liabilities: | | | | | | | | | | | | | | | | | | |
| Medical claims and benefits payable | $ | 3 |
| | $ | — |
| | $ | 2,189 |
| | $ | — |
| | $ | 2,192 |
| $ | 3 |
| | $ | — |
| | $ | 2,189 |
| | $ | — |
| | $ | 2,192 |
|
| Amounts due government agencies | — |
| | 1 |
| | 1,541 |
| | — |
| | 1,542 |
| — |
| | — |
| | 1,542 |
| | — |
| | 1,542 |
|
| Accounts payable and accrued liabilities | 178 |
| | 40 |
| | 148 |
| | — |
| | 366 |
| 178 |
| | 14 |
| | 174 |
| | — |
| | 366 |
|
| Deferred revenue | — |
| | 49 |
| | 233 |
| | — |
| | 282 |
| — |
| | — |
| | 282 |
| | — |
| | 282 |
|
| Current portion of long-term debt | 653 |
| | — |
| | 16 |
| | (16 | ) | | 653 |
| 653 |
| | — |
| | 16 |
| | (16 | ) | | 653 |
|
| Derivative liability | 522 |
| | — |
| | — |
| | — |
| | 522 |
| 522 |
| | — |
| | — |
| | — |
| | 522 |
|
| Total current liabilities | 1,356 |
| | 90 |
| | 4,127 |
| | (16 | ) | | 5,557 |
| 1,356 |
| | 14 |
| | 4,203 |
| | (16 | ) | | 5,557 |
|
| Long-term debt | 1,516 |
| | — |
| | — |
| | — |
| | 1,516 |
| |
| Long-term debt and lease financing obligations | | 1,516 |
| | — |
| | — |
| | — |
| | 1,516 |
|
| Deferred income taxes | — |
| | 15 |
| | — |
| | (15 | ) | | — |
| — |
| | — |
| | 15 |
| | (15 | ) | | — |
|
| Other long-term liabilities | 24 |
| | 2 |
| | 36 |
| | (1 | ) | | 61 |
| 24 |
| | 1 |
| | 37 |
| | (1 | ) | | 61 |
|
| Total liabilities | 2,896 |
| | 107 |
| | 4,163 |
| | (32 | ) | | 7,134 |
| 2,896 |
| | 15 |
| | 4,255 |
| | (32 | ) | | 7,134 |
|
| Total stockholders’ equity | 1,337 |
| | 220 |
| | 2,168 |
| | (2,388 | ) | | 1,337 |
| 1,337 |
| | 78 |
| | 2,310 |
| | (2,388 | ) | | 1,337 |
|
| | $ | 4,233 |
| | $ | 327 |
| | $ | 6,331 |
| | $ | (2,420 | ) | | $ | 8,471 |
| $ | 4,233 |
| | $ | 93 |
| | $ | 6,565 |
| | $ | (2,420 | ) | | $ | 8,471 |
|
CONDENSED CONSOLIDATING STATEMENTS OF CASH FLOWS
| | | | Six Months Ended June 30, 2018 | Nine Months Ended September 30, 2018 |
| | Parent Guarantor | | Other Guarantors | | Non-Guarantors | | Eliminations | | Consolidated | Parent Guarantor | | Other Guarantors | | Non-Guarantors | | Eliminations | | Consolidated |
| | (In millions) | (In millions) |
| Operating activities: | | | | | | | | | | | | | | | | | | |
| Net cash provided by operating activities | $ | 49 |
| | $ | 9 |
| | $ | 256 |
| | $ | — |
| | $ | 314 |
| |
| Net cash provided by (used in) operating activities | | $ | 451 |
| | $ | 1 |
| | $ | (643 | ) | | $ | — |
| | $ | (191 | ) |
| Investing activities: | | | | | | | | | | | | | | | | | | |
| Purchases of investments | (136 | ) | | — |
| | (778 | ) | | — |
| | (914 | ) | (136 | ) | | — |
| | (1,066 | ) | | — |
| | (1,202 | ) |
| Proceeds from sales and maturities of investments | 303 |
| | — |
| | 1,032 |
| | — |
| | 1,335 |
| 383 |
| | — |
| | 1,687 |
| | — |
| | 2,070 |
|
| Purchases of property, equipment and capitalized software | (9 | ) | | (3 | ) | | (2 | ) | | — |
| | (14 | ) | (16 | ) | | — |
| | (8 | ) | | — |
| | (24 | ) |
| Capital contributions to subsidiaries | (117 | ) | | — |
| | 117 |
| | — |
| | — |
| (122 | ) | | — |
| | 122 |
| | — |
| | — |
|
| Dividends from subsidiaries | 60 |
| | (10 | ) | | (50 | ) | | — |
| | — |
| 268 |
| | — |
| | (268 | ) | | — |
| | — |
|
| Change in amounts due to/from affiliates | 75 |
| | 1 |
| | (76 | ) | | — |
| | — |
| 70 |
| | 1 |
| | (71 | ) | | — |
| | — |
|
| Other, net | — |
| | (14 | ) | | 5 |
| | — |
| | (9 | ) | — |
| | — |
| | (23 | ) | | — |
| | (23 | ) |
| Net cash provided (used in) by investing activities | 176 |
| | (26 | ) | | 248 |
| | — |
| | 398 |
| |
| Net cash provided by investing activities | | 447 |
| | 1 |
| | 373 |
| | — |
| | 821 |
|
| Financing activities: | | | | | | | | | | | | | | | | | | |
| Repayment of credit facility | (300 | ) | | — |
| | — |
| | — |
| | (300 | ) | (300 | ) | | — |
| | — |
| | — |
| | (300 | ) |
| Repayment of 1.125% Convertible Notes | (89 | ) | | — |
| | — |
| | — |
| | (89 | ) | |
| Repayment of principal amount of 1.125% Notes | | (236 | ) | | — |
| | — |
| | — |
| | (236 | ) |
| Cash paid for partial settlement of 1.125% Conversion Option | (134 | ) | | — |
| | — |
| | — |
| | (134 | ) | (477 | ) | | — |
| | — |
| | — |
| | (477 | ) |
| Cash received for partial termination of 1.125% Call Option | 134 |
| | — |
| | — |
| | — |
| | 134 |
| 477 |
| | — |
| | — |
| | — |
| | 477 |
|
| Cash paid for partial termination of 1.125% Warrants | (113 | ) | | — |
| | — |
| | — |
| | (113 | ) | (419 | ) | | — |
| | — |
| | — |
| | (419 | ) |
| Repayment of principal amount of 1.625% Notes | | (64 | ) | | — |
| | — |
| | — |
| | (64 | ) |
| Other, net | (1 | ) | | — |
| | — |
| | — |
| | (1 | ) | 7 |
| | — |
| | — |
| | — |
| | 7 |
|
| Net cash used in financing activities | (503 | ) | | — |
| | — |
| | — |
| | (503 | ) | (1,012 | ) | | — |
| | — |
| | — |
| | (1,012 | ) |
| Net (decrease) increase in cash, cash equivalents, and restricted cash and cash equivalents | (278 | ) | | (17 | ) | | 504 |
| | — |
| | 209 |
| (114 | ) | | 2 |
| | (270 | ) | | — |
| | (382 | ) |
| Cash, cash equivalents, and restricted cash and cash equivalents at beginning of period | 513 |
| | 28 |
| | 2,749 |
| | — |
| | 3,290 |
| 513 |
| | — |
| | 2,777 |
| | — |
| | 3,290 |
|
| Cash, cash equivalents, and restricted cash and cash equivalents at end of period | $ | 235 |
| | $ | 11 |
| | $ | 3,253 |
| | $ | — |
| | $ | 3,499 |
| $ | 399 |
| | $ | 2 |
| | $ | 2,507 |
| | $ | — |
| | $ | 2,908 |
|
| | | | Six Months Ended June 30, 2017 | Nine Months Ended September 30, 2017 |
| | Parent Guarantor | | Other Guarantors | | Non-Guarantors | | Eliminations | | Consolidated | Parent Guarantor | | Other Guarantors | | Non-Guarantors | | Eliminations | | Consolidated |
| | (In millions) | (In millions) |
| Operating activities: | | | | | | | | | | | | | | | | | | |
| Net cash provided by operating activities | $ | 90 |
| | $ | 44 |
| | $ | 538 |
| | $ | — |
| | $ | 672 |
| $ | 215 |
| | $ | — |
| | $ | 742 |
| | $ | — |
| | $ | 957 |
|
| Investing activities: | | | | | | | | | | | | | | | | | | |
| Purchases of investments | (330 | ) | | — |
| | (1,306 | ) | | — |
| | (1,636 | ) | (331 | ) | | — |
| | (1,563 | ) | | — |
| | (1,894 | ) |
| Proceeds from sales and maturities of investments | 127 |
| | — |
| | 747 |
| | — |
| | 874 |
| 148 |
| | — |
| | 1,388 |
| | — |
| | 1,536 |
|
| Purchases of property, equipment and capitalized software | (45 | ) | | (9 | ) | | (6 | ) | | — |
| | (60 | ) | (67 | ) | | — |
| | (18 | ) | | — |
| | (85 | ) |
| Capital contributions to subsidiaries | (238 | ) | | 2 |
| | 236 |
| | — |
| | — |
| (363 | ) | | 2 |
| | 361 |
| | — |
| | — |
|
| Dividends from subsidiaries | 120 |
| | — |
| | (120 | ) | | — |
| | — |
| 136 |
| | — |
| | (136 | ) | | — |
| | — |
|
| Change in amounts due to/from affiliates | (34 | ) | | 2 |
| | 32 |
| | — |
| | — |
| (100 | ) | | — |
| | 100 |
| | — |
| | — |
|
| Other, net | — |
| | (13 | ) | | (11 | ) | | — |
| | (24 | ) | — |
| | — |
| | (33 | ) | | — |
| | (33 | ) |
| Net cash used in investing activities | (400 | ) | | (18 | ) | | (428 | ) | | — |
| | (846 | ) | |
| Net cash (used in) provided by investing activities | | (577 | ) | | 2 |
| | 99 |
| | — |
| | (476 | ) |
| Financing activities: | | | | | | | | | | | | | | | | | | |
| Proceeds from senior notes offerings, net of issuance costs | 325 |
| | — |
| | — |
| | — |
| | 325 |
| 325 |
| | — |
| | — |
| | — |
| | 325 |
|
| Proceeds from borrowings under credit facility | | 300 |
| | — |
| | — |
| | — |
| | 300 |
|
| Other, net | 8 |
| | — |
| | — |
| | — |
| | 8 |
| 7 |
| | — |
| | — |
| | — |
| | 7 |
|
| Net cash provided by financing activities | 333 |
| | — |
| | — |
| | — |
| | 333 |
| 632 |
| | — |
| | — |
| | — |
| | 632 |
|
| Net increase in cash, cash equivalents, and restricted cash and cash equivalents | 23 |
| | 26 |
| | 110 |
| | — |
| | 159 |
| 270 |
| | 2 |
| | 841 |
| | — |
| | 1,113 |
|
| Cash, cash equivalents, and restricted cash and cash equivalents at beginning of period | 86 |
| | 6 |
| | 2,820 |
| | — |
| | 2,912 |
| 86 |
| | — |
| | 2,826 |
| | — |
| | 2,912 |
|
| Cash, cash equivalents, and restricted cash and cash equivalents at end of period | $ | 109 |
| | $ | 32 |
| | $ | 2,930 |
| | $ | — |
| | $ | 3,071 |
| $ | 356 |
| | $ | 2 |
| | $ | 3,667 |
| | $ | — |
| | $ | 4,025 |
|
MANAGEMENT’S DISCUSSION AND ANALYSIS OF FINANCIAL CONDITION AND RESULTS OF OPERATIONS (MD&A)
FORWARD-LOOKING STATEMENTS
This quarterly report on Form 10-Q contains forward-looking statements regarding our business, financial condition, and results of operations within the meaning of Section 27A of the Securities Act of 1933, or Securities Act, and Section 21E of the Securities Exchange Act of 1934, or Securities Exchange Act. We intend such forward-looking statements to be covered by the safe harbor provisions for forward-looking statements contained in the Private Securities Litigation Reform Act of 1995, and we are including this statement for purposes of complying with these safe harbor provisions. All statements included in this quarterly report, other than statements of historical fact, may be deemed to be forward-looking statements for purposes of the Securities Act and the Securities Exchange Act. Without limiting the foregoing, we use the words “anticipate(s),” “believe(s),” “estimate(s),” “expect(s),” “intend(s),” “may,” “plan(s),” “project(s),” “will,” “would,” “could,” “should” and similar expressions to identify forward-looking statements, although not all forward-looking statements contain these identifying words. We cannot guarantee that we will actually achieve the plans, intentions, or expectations disclosed in our forward-looking statements and, accordingly, you should not place undue reliance on our forward-looking statements. We caution you that we do not undertake any obligation to update forward-looking statements made by us. Forward-looking statements involve known and unknown risks and uncertainties that may cause our actual results in future periods to differ materially from those projected, estimated, or expected. Those known risks and uncertainties include, but are not limited to, the following:
the success of the Company’s profit improvement and maintenance initiatives, including the timing and amounts of the benefits realized, and administrative and medical cost savings achieved;
the numerous political and market-based uncertainties associated with the Affordable Care Act (the “ACA”) or “Obamacare;”
the market dynamics surrounding the ACA Marketplaces, including but not limited to uncertainties associated with risk adjustment requirements, the potential for disproportionate enrollment of higher acuity members, the discontinuation of premium tax credits, and the adequacy of agreed rates;
subsequent adjustments to reported premium revenue based upon subsequent developments or new information, including changes to estimated amounts payable or receivable related to Marketplace risk adjustment;
effective management of the Company’s medical costs;
the Company’s ability to predict with a reasonable degree of accuracy utilization rates, including utilization rates associated with seasonal flu patterns or other newly emergent diseases;
significant budget pressures on state governments and their potential inability to maintain current rates, to implement expected rate increases, or to maintain existing benefit packages or membership eligibility thresholds or criteria;
the full reimbursement of the ACA health insurer fee, or HIF;
the success of the Company’s efforts to retain existing or awarded government contracts, including those in New Mexico and Texas, and those for Regions 8 and 11 in Florida, including the success of any protest filings or defenses;
the Company’s ability to manage its operations, including maintaining and creating adequate internal systems and controls relating to authorizations, approvals, provider payments, and the overall success of its care management initiatives;
the Company’s ability to consummate and realize benefits from divestitures and acquisitions, including the timely closing of therecently consummated MMS divestiture;and Pathways divestitures;
the Company’s receipt of adequate premium rates to support increasing pharmacy costs, including costs associated with specialty drugs and costs resulting from formulary changes that allow the option of higher-priced non-generic drugs;
the Company’s ability to operate profitably in an environment where the trend in premium rate increases lags behind the trend in increasing medical costs;
the interpretation and implementation of federal or state medical cost expenditure floors, administrative cost and profit ceilings, premium stabilization programs, profit sharing arrangements, and risk adjustment provisions and requirements;
the Company’s estimates of amounts owed for such cost expenditure floors, administrative cost and profit ceilings, premium stabilization programs, profit-sharing arrangements, and risk adjustment provisions;
the Medicaid expansion medical cost corridors in California, New Mexico, and Washington, and any other retroactive adjustment to revenue where methodologies and procedures are subject to interpretation or dependent upon information about the health status of participants other than Molina members;
the interpretation and implementation of at-risk premium rules and state contract performance requirements regarding the achievement of certain quality measures, and the Company’s ability to recognize revenue amounts associated therewith;
cyber-attacks or other privacy or data security incidents resulting in an inadvertent unauthorized disclosure of protected health information;
the success of the Company’s health plan in Puerto Rico, including the resolution of the debt crisis and the effect of the PROMESA law, and the impact of any future significant weather events;
the success and renewal of the Company’s duals demonstration programs in California, Illinois, Michigan, Ohio, South Carolina, and Texas;
the accurate estimation of incurred but not reported or paid medical costs across the Company’s health plans;
efforts by states to recoup previously paid and recognized premium amounts;
complications, member confusion, or enrollment backlogs related to the annual renewal of Medicaid coverage;
government audits and reviews, or potential investigations, and any fine, sanction, enrollment freeze, monitoring program, or premium recovery that may result therefrom;
changes with respect to the Company’s provider contracts and the loss of providers;
approval by state regulators of dividends and distributions by the Company’s health plan subsidiaries;
changes in funding under the Company’s contracts as a result of regulatory changes, programmatic adjustments, or other reforms;
high dollar claims related to catastrophic illness;
the favorable resolution of litigation, arbitration, or administrative proceedings, including litigation involving the ACA to which we ourselves are not a direct party;
the relatively small number of states in which we operate health plans, including the greater scale and revenues of the Company’s California, Ohio, Texas, and Washington health plans;
the availability of adequate financing on acceptable terms to fund and capitalize the Company’s expansion and growth, repay the Company’s outstanding indebtedness at maturity and meet its liquidity needs, including the interest expense and other costs associated with such financing;
the Company’s failure to comply with the financial or other covenants in its credit agreementsagreement or the indentures governing its outstanding notes;
the sufficiency of the Company’s funds on hand to pay the amounts due upon conversion or maturity of its outstanding notes;
the failure of a state in which we operate to renew its federal Medicaid waiver;
changes generally affecting the managed care or Medicaid management information systems industries;
increases in government surcharges, taxes, and assessments, including but not limited to the deductibility of certain compensation costs;
newly emergent viruses or widespread epidemics, public catastrophes or terrorist attacks, and associated public alarm;
the unexpected loss of the leadership of one or more of our senior executives; and
increasing competition and consolidation in the Medicaid industry;
Readers should refer to the section entitled “Risk Factors” in our Annual Report on Form 10-K for the year ended December 31, 2017 for a discussion of certain risk factors that could materially affect our business, financial condition, cash flows, or results of operations. Given these risks and uncertainties, we can give no assurance that any results or events projected or contemplated by our forward-looking statements will in fact occur.
This Quarterly Report on Form 10-Q and the following discussion of our financial condition and results of operations should be read in conjunction with the accompanying consolidated financial statements and the notes to those statements appearing elsewhere in this report, and the audited financial statements and Management’s Discussion and Analysis appearing in our Annual Report on Form 10-K for the year ended December 31, 2017.
ABOUT MOLINA HEALTHCARE
OUR MISSION IS TO PROVIDE QUALITY HEALTHCARE TO PEOPLE RECEIVING GOVERNMENT ASSISTANCE.
Molina Healthcare, Inc. provides quality managed health care to people receiving government assistance. We offer cost-effective Medicaid-related solutions to meet the health care needs of low-income families and individuals, and to assist government agencies in their administration of the Medicaid program. We have three reportable segments. These segments, consist
consisting of our Health Plans segment, which constitutes the vast majority of our operations; our Molina Medicaid Solutions segment; and our Other segment.
OVERVIEW - FINANCIAL SUMMARY
KEY PERFORMANCE INDICATORS |
| | | | | | | | | | | | | | | |
| | Three Months Ended June 30, | | Six Months Ended June 30, |
| | 2018 | | 2017 | | 2018 | | 2017 |
| | (In millions, except per-share amounts) |
| Ending total membership | 4.1 |
| | 4.7 |
| | 4.1 |
| | 4.7 |
|
| | | | | | | | |
| Premium revenue | $ | 4,514 |
| | $ | 4,740 |
| | $ | 8,837 |
| | $ | 9,388 |
|
Health Plans segment medical margin (1) | $ | 664 |
| | $ | 249 |
| | $ | 1,265 |
| | $ | 786 |
|
| Operating income (loss) | $ | 342 |
| | $ | (287 | ) | | $ | 564 |
| | $ | (205 | ) |
| | | | | | | | |
| Net income (loss) | $ | 202 |
| | $ | (230 | ) | | $ | 309 |
| | $ | (153 | ) |
| Net income (loss) per diluted share | $ | 3.02 |
| | $ | (4.10 | ) | | $ | 4.68 |
| | $ | (2.74 | ) |
| Diluted weighted average shares outstanding | 66.7 |
| | 56.2 |
| | 66.0 |
| | 56.1 |
|
| | | | | | | | |
| Adjusted net income (loss) per diluted share* | $ | 3.08 |
| | $ | (4.01 | ) | | $ | 4.80 |
| | $ | (2.55 | ) |
| EBITDA* | $ | 370 |
| | $ | (243 | ) | | $ | 616 |
| | $ | (40 | ) |
| | | | | | | | |
| Operating Statistics: | | | | | | | |
MCR (2) | 85.3 | % | | 94.8 | % | | 85.7 | % | | 91.6 | % |
G&A ratio (3) | 6.9 | % | | 8.1 | % | | 7.2 | % | | 8.5 | % |
Premium tax ratio (2) | 2.3 | % | | 2.4 | % | | 2.3 | % | | 2.3 | % |
| Effective income tax rate | 33.8 | % | | 26.8 | % | | 36.2 | % | | 16.0 | % |
Net profit (loss) margin (3) | 4.1 | % | | (4.6 | )% | | 3.2 | % | | (1.5 | )% |
|
| | | | | | | | | | | | | | | |
| | Three Months Ended September 30, | | Nine Months Ended September 30, |
| | 2018 | | 2017 | | 2018 | | 2017 |
| | (In millions, except per-share amounts) |
| Revenue: | | | | | | | |
| Premium revenue | $ | 4,337 |
| | $ | 4,777 |
| | $ | 13,174 |
| | $ | 14,165 |
|
| Premium tax revenue | 110 |
| | 106 |
| | 320 |
| | 331 |
|
| Health insurer fees reimbursed | 83 |
| | — |
| | 248 |
| | — |
|
| Investment income and other revenue | 37 |
| | 18 |
| | 93 |
| | 48 |
|
| | | | | | | | |
| Operating expenses: | | | | | | | |
| Medical care costs | 3,790 |
| | 4,220 |
| | 11,362 |
| | 12,822 |
|
| General and administrative expenses | 311 |
| | 383 |
| | 998 |
| | 1,227 |
|
| Premium tax expenses | 110 |
| | 106 |
| | 320 |
| | 331 |
|
| Health insurer fees | 87 |
| | — |
| | 261 |
| | — |
|
| | | | | | | | |
| Gain on sale of subsidiary | 37 |
| | — |
| | 37 |
| | — |
|
| Operating income (loss) | 295 |
| | (81 | ) | | 859 |
| | (286 | ) |
| Interest expense | 26 |
| | 32 |
| | 91 |
| | 85 |
|
| Other expenses (income), net | 10 |
| | — |
| | 25 |
| | (75 | ) |
| Income tax expense (benefit) | 62 |
| | (16 | ) | | 237 |
| | (46 | ) |
| Net income (loss) | 197 |
| | (97 | ) | | 506 |
| | (250 | ) |
| | | | | | | | |
| Operating Statistics: | | | | | | | |
| Ending total membership | 4.0 |
| | 4.5 |
| | 4.0 |
| | 4.5 |
|
MCR (1) | 87.4 | % | | 88.3 | % | | 86.2 | % | | 90.5 | % |
G&A ratio (2) | 6.6 | % | | 7.6 | % | | 7.0 | % | | 8.2 | % |
Premium tax ratio (1) | 2.5 | % | | 2.2 | % | | 2.4 | % | | 2.3 | % |
| Effective income tax rate | 24.0 | % | | 14.6 | % | | 31.9 | % | | 15.5 | % |
Net profit (loss) margin (2) | 4.2 | % | | (1.9 | )% | | 3.6 | % | | (1.7 | )% |
| Net income (loss) per diluted share | $ | 2.90 |
| | $ | (1.70 | ) | | $ | 7.60 |
| | $ | (4.44 | ) |
________________________
| |
| (1) | Medical margin is equal to premium revenue minus medical care costs. |
| |
(2) | MCR represents medical care costs as a percentage of premium revenue; premium tax ratio represents premium tax expenses as a percentage of premium revenue plus premium tax revenue. |
| |
(3)(2) | Net profit margin represents net income as a percentage of total revenue. G&A ratio represents general and administrative expenses as a percentage of total revenue. Net profit margin represents net income as a percentage of total revenue. |
*Non-GAAP Financial Measures
We use non-GAAP financial measures as supplemental metrics in evaluating our financial performance, making financing and business decisions, and forecasting and planning for future periods. For these reasons, management believes such measures are useful supplemental measures to investors in comparing our performance to the performance of other public companies in the health care industry. These non-GAAP financial measures should be considered as supplements to, and not as substitutes for or superior to, GAAP measures.
See further information regarding non-GAAP measures in the “Supplemental Information” section of this MD&A, including the reconciliations to U.S. GAAP. Non-GAAP financial measures referred to in this report are designated with an asterisk (*).
CONSOLIDATED RESULTS
Three Months Ended June 30, 2018 Compared with Three Months Ended June 30, 2017See tables below, under “Summary of Significant Items,” for details relating to significant non-run rate items, such as impairment losses, restructuring costs and material out of period adjustments to premiums or medical care costs.
NET INCOME AND OPERATING INCOME
Net income for the secondthird quarter of 2018 was $202amounted to $197 million, or $2.90 per diluted share, compared with a net loss of $230$97 million, or $1.70 per diluted share for the third quarter of 2017. Operating income for the third quarter of 2018 amounted to $295 million, compared with an operating loss of $81 million in the third quarter of 2017. The
year-over-year improvement is mainly driven by a decline in the medical care ratio (MCR). Additionally, results for the third quarter of 2017 reflect $247 million in impairment and restructuring charges, or $3.16 per diluted share.
Net income for the nine months ended September 30, 2018 was $506 million, or $7.60 per diluted share, compared with a net loss of $250 million, or $4.44 per diluted share for the nine months ended September 30, 2017. Operating income for the nine months ended September 30, 2018 amounted to $859 million, compared with an operating loss of $286 million for the second quarter ofnine months ended September 30, 2017. Net incomeThe year-over-year improvement is mainly driven by a decline in the MCR. Additionally, results for the nine months ended September 30, 2017 reflect $362 million in impairment and restructuring charges, or $4.69 per diluted share was $3.02 for the second quarter of 2018, compared with net loss per diluted share of $4.10 reported for the second quarter of 2017.share.
PREMIUM REVENUE
Premium revenue decreased approximately 5%, or $226$440 million in the secondthird quarter of 2018, when compared with the secondthird quarter of 2017. Member months declined 14%11%, partially offset by a PMPMper-member per-month (PMPM) revenue increase of 9%2%. Lower premium revenue was driven by a decrease in Marketplace membership, partially offset by Marketplace premium rate increases.
Overall, In addition, we recognized a $57 million reduction in revenues for a retroactive California Medicaid Expansion risk corridor for the medical care ratio improved to 85.3%, from 94.8%state’s 2017 fiscal year in the secondthird quarter of 2017. See further discussion below in “Financial Performance by Program.”
Medical margin increased 167% in the second quarter of 2018, compared with the second quarter of 2017.
The general and administrative (G&A) expense ratio decreased to 6.9%, from 8.1% in the second quarter of 2017. Excluding the impact of Marketplace broker commissions and exchange fees in both periods, the G&A ratio decreased to 6.2%, from 6.7% in the second quarter of 2017. This year-over-year improvement was primarily the result of our efforts to reduce G&A costs under the 2017 Restructuring Plan.
Six Months Ended June 30, 2018 Compared with Six Months Ended June 30, 2017
Net income for the six months ended June 30, 2018 was $309 million, compared with a net loss of $153 million for the six months ended June 30, 2017. Net income per diluted share was $4.68 in the six months ended June 30, 2018, compared with net loss per diluted share of $2.74 reported in the six months ended June 30, 2017.2018.
Premium revenue decreased approximately 6%, or $551$991 million in the sixnine months ended JuneSeptember 30, 2018, when compared with the sixnine months ended JuneSeptember 30, 2017. Member months declined 13%, partially offset by a revenue PMPM increase of 7%6%, primarily relating to Marketplace membership as noted above.
Overall,PREMIUM TAX REVENUE AND EXPENSES
The premium tax ratio (premium tax expense as a percentage of premium revenue plus premium tax revenue) was 2.5% for the medical care ratio improved to 85.7%, from 91.6% inthird quarter of 2018 compared with 2.2% for the sixthird quarter of 2017; and 2.4% compared with 2.3% for the nine months ended JuneSeptember 30, 2017. See further discussion below2018 and 2017, respectively. At our California health plan, the premium tax rate is based on the prior state fiscal year enrollment. Because the California health plan’s enrollment and premium revenue have declined in “Financial Performance by Program.”2018, premium taxes recognized in 2018 have driven a higher premium tax ratio in 2018.
Medical marginINVESTMENT INCOME AND OTHER REVENUE
Investment income and other revenue increased 61% into $37 million for the sixthird quarter of 2018, compared with $18 million for the third quarter of 2017, and increased to $93 million for the nine months ended JuneSeptember 30, 2018, compared with $48 million for the sixnine months ended JuneSeptember 30, 2017.
Approximately $8 million ($0.10 per diluted share) The current quarter and $33 million ($0.39 per diluted share)year-to-date increases were a result of restructuring costs were recognizedtwo factors. First, investment income improved due to annualized portfolio yields, and, for the nine months ended September 30, 2018, we had higher average invested assets. In addition, other revenue increased in the secondthird quarter and sixnine months ended JuneSeptember 30, 2018, respectively. For more information, referdue to Notes to Consolidated Financial Statements, Note 10, “Restructuring and Separation Costs.”
Approximately $5 million ($0.06 per diluted share) and $15 million ($0.21 per diluted share) loss on debt extinguishment was recognizedadministrative services fees earned in the second quarter and six months ended June 30, 2018, respectively. For more information, refer to Notes to Consolidated Financial Statements, Note 7, “Debt.”
As presented in the table below, in the second quarter and six months ended June 30, 2017, we recorded significant medical care costs relating to prior year dates of service in excess of historical expectations, and Marketplace-related premium deficiency reserves and changes in estimates for prior year dates of service. In addition, we recorded significant impairment losses and restructuring costs under the 2017 Restructuring Plan.
Renewal of Medicaid Contracts
Year to date in 2018, we renewed Medicaid contracts in Washington, Florida and Puerto Rico as follows:
In May 2018, our Washington health plan was selected byfollowing that state’s decision to transition the Washington State Health Care Authority (HCA)management of Medicaid pharmacy benefits to enter intoan administrative services-based arrangement in 2018.
MEDICAL CARE RATIO (MCR)
Overall, the MCR decreased to 87.4% in the third quarter of 2018, from 88.3% in the third quarter of 2017. Excluding the retroactive California Medicaid Expansion risk corridor adjustment and a managed care contractsmall benefit from the 2017 Marketplace cost sharing reduction (CSR), the MCR would have been 86.4% in the third quarter of 2018. Excluding the change in Marketplace premium deficiency reserve for 2017 dates of service, the MCR for the eight remaining regionsthird quarter of 2017 would have been 89.0%. The improvement was mainly due to a decrease in the Medicaid and Marketplace MCRs, partially offset by an increase in the Medicare MCR.
Overall, the MCR improved to 86.2% for the nine months ended September 30, 2018, from 90.5% in the nine months ended September 30, 2017. Excluding adjustments for the retroactive California Medicaid Expansion risk corridor, and the combined benefit of the state’s Apple 2017 Marketplace risk adjustment and CSR reimbursement, the MCR for the nine months ended September 30, 2018 would have been 86.9%. Excluding the change in Marketplace premium deficiency reserve for 2017 dates of service, the MCR for the nine months ended September 30, 2017 would have been 90.2%. The improvement was due to a decrease in the MCRs across our Medicaid, Medicare and Marketplace plans.
GENERAL AND ADMINISTRATIVE (G&A) EXPENSES
The general and administrative (G&A) expense ratio decreased to 6.6% for the third quarter of 2018, from 7.6% for the third quarter of 2017, and decreased to 7.0% for the nine months ended September 30, 2018, from 8.2% for the
nine months ended September 30, 2017. This year-over-year improvement was primarily the result of continued G&A cost containment.
HEALTH INSURER FEES (HIF)
Health Integrated Managed Care program,insurer fees amounted to $87 million and $261 million, and health insurer fees reimbursed amounted to $83 million and $248 million, in additionthe third quarter of 2018 and the nine months ended September 30, 2018, respectively.
There were no HIF expensed or reimbursed in 2017 due to the two regions previously awardedHIF moratorium under the Consolidated Appropriations Act of 2016.
GAIN ON SALE OF SUBSIDIARY
We closed on the sale of Molina Medicaid Solutions (MMS) to us. We were selected by HCADXC Technology Company on September 30, 2018. The net cash selling price for the following regions: Greater Columbia, King, North Sound, Pierce, and Spokane beginning Januaryequity interests of MMS was $233 million, which we received on October 1, 2019; and Salish, Thurston-Mason, and Great Rivers beginning January 1, 2020.2018. As a result of June 30, 2018,this transaction, we served approximately 742,000 Medicaid membersrecognized a pretax gain, net of transaction costs, of $37 million, or $0.42 per diluted share in Washington, which represented premium revenuethe third quarter of $1,0832018.
INTEREST EXPENSE
Interest expense was $26 million for the six months ended June 30, 2018.
In Junethird quarter of 2018, our Florida health plan was awarded comprehensive Medicaid Managed Care contracts by the Florida Agency for Health Care Administration (AHCA) in Regions 8 and 11 of the Florida Statewide Medicaid Managed Care Invitation to Negotiate. As of June 30, 2018, we served approximately 96,000 Medicaid members
in those regions, which represented premium revenue of approximately $232compared with $32 million for the six months ended June 30, 2018. Services under the new contract are expected to begin on January 1, 2019. We will be serving both the Medicaid and long-term care populations in the two regions.
In July 2018, our Puerto Rico health planthird quarter of 2017. Interest expense was selected by the Puerto Rico Health Insurance Administration to be one of the organizations to administer the Commonwealth’s new Medicaid Managed Care contract. Services under the new contract, currently expected to begin on November 1, 2018, would cover the entire island. The base contract runs for a period of three years with an optional one year extension. As of June 30, 2018, we served approximately 326,000 Medicaid members in the East and Southwest regions of Puerto Rico, which represented premium revenue of $370$91 million for the sixnine months ended JuneSeptember 30, 2018.
Capital Plan Progress
In2018, compared with $85 million for the second quarter of 2018, we repaid $300 million outstanding under the revolving credit facility. In addition, we repaid $96 million aggregate principal amount of our 1.125% Notes, and entered into privately negotiated termination agreements to partially terminate the related 1.125% Call Option and 1.125% Warrants. In the first quarter of 2018, we exchanged $97 million aggregate principal amount and accrued interest of our 1.625% Convertible Notes for 1.8 million shares of our common stock. Yearnine months ended September 30, 2017. As further described below in “Liquidity,” year to date we have reduced the principal amount of outstanding debt by $493$697 million.
SaleInterest expense includes non-cash interest expense relating primarily to the amortization of Molina Medicaid Solutions Segment
In June 2018, we entered into a definitive agreementthe discount on convertible senior notes, which amounted to sell Molina Medicaid Solutions (MMS) to DXC Technology Company. The divestiture, expected to close$5 million and $8 million in the third quarter of 2018 is subjectand 2017, respectively and $18 million and $24 million in the nine months ended September 30, 2018 and 2017, respectively. See further discussion in Notes to Consolidated Financial Statements, Note 7, “Debt.”
OTHER EXPENSES (INCOME), NET
In the three and nine months ended September 30, 2018, we recorded other expenses of $10 million and $25 million, respectively, due to the satisfaction of customary closing conditionsloss on debt extinguishment resulting from our 1.125% Notes repayments and the receipt1.625% Notes exchange. These transactions are described further in Notes to Consolidated Financial Statements, Note 7, “Debt.” In early 2017, we received a $75 million fee in connection with a terminated Medicare acquisition.
INCOME TAXES
The provision for income taxes was recorded at an effective rate of certain third party consents and regulatory approvals. We expect the net cash selling price24.0% for the equity intereststhird quarter of Molina Medicaid Solutions2018, compared with a benefit of 14.6% for the third quarter of 2017, and 31.9% for the nine months ended September 30, 2018, compared with a benefit of 15.5% for the nine months ended September 30, 2017. The effective tax rate for 2018 differs from 2017 as a result of the reduction in the federal statutory rate from 35% to approximate $220 million after certain adjustments.21% under the TCJA and higher non-deductible expenses in 2018, primarily related to the non-deductible HIF, as a percentage of pre-tax income (loss). The HIF was not applicable in 2017 due to the 2017 HIF moratorium.
Summary of Significant Items
SUMMARY OF SIGNIFICANT ITEMS
The tables below summarize the impact of certain items significant to our financial performance in the periods presented. The individual items presented below increase (decrease) income (loss) before income tax expense.expense (benefit).
|
| | | | | | | | | | | | | | | |
| | Three Months Ended September 30, 2018 | | Nine Months Ended September 30, 2018 |
| | Amount | | Per Diluted Share (1) | | Amount | | Per Diluted Share (1) |
| | |
| Retroactive California Medicaid Expansion risk corridor for the state fiscal year ended June 30, 2017 | $ | (57 | ) | | $ | (0.65 | ) | | $ | (57 | ) | | $ | (0.67 | ) |
| Marketplace risk adjustment, for 2017 dates of service | — |
| | — |
| | 56 |
| | 0.66 |
|
| Marketplace CSR subsidies, for 2017 dates of service | 5 |
| | 0.06 |
| | 81 |
| | 0.95 |
|
| Gain on sale of subsidiary | 37 |
| | 0.42 |
| | 37 |
| | 0.43 |
|
Restructuring costs (2) | (5 | ) | | (0.06 | ) | | (38 | ) | | (0.45 | ) |
| Loss on debt extinguishment | (10 | ) | | (0.12 | ) | | (25 | ) | | (0.33 | ) |
| | $ | (30 | ) | | $ | (0.35 | ) | | $ | 54 |
| | $ | 0.59 |
|
|
| | | | | | | | | | | | | | | |
| | Three Months Ended June 30, 2018 | | Six Months Ended June 30, 2018 |
| | Amount | | Per Diluted Share (1) | | Amount | | Per Diluted Share (1) |
| | (In millions, except per diluted share amounts) |
| Marketplace risk adjustment, for 2017 dates of service | $ | 79 |
| | $ | 0.92 |
| | $ | 56 |
| | $ | 0.66 |
|
| Marketplace cost sharing reduction (CSR) subsidies, for 2017 dates of service | 6 |
| | 0.07 |
| | 76 |
| | 0.90 |
|
| Restructuring costs | (8 | ) | | (0.10 | ) | | (33 | ) | | (0.39 | ) |
| Loss on debt extinguishment | (5 | ) | | (0.06 | ) | | (15 | ) | | (0.21 | ) |
| | $ | 72 |
| | $ | 0.83 |
| | $ | 84 |
| | $ | 0.96 |
|
|
| | | | | | | | | | | | | | | |
| | Three Months Ended June 30, 2017 | | Six Months Ended June 30, 2017 |
| | Amount | | Per Diluted Share (1) | | Amount | | Per Diluted Share (1) |
| | (In millions, except per diluted share amounts) |
| Impairment losses | $ | (72 | ) | | $ | (1.01 | ) | | $ | (72 | ) | | $ | (1.02 | ) |
| Losses at behavioral health subsidiary exclusive of impairment | (8 | ) | | (0.09 | ) | | (12 | ) | | (0.14 | ) |
| Medical care costs related to prior year dates of service that were in excess of historical expectations | (85 | ) | | (0.95 | ) | | (74 | ) | | (0.84 | ) |
| Marketplace adjustments related to risk adjustment, CSR, and other items for 2016 dates of service | (44 | ) | | (0.49 | ) | | (47 | ) | | (0.53 | ) |
| Marketplace premium deficiency reserve for 2017 dates of service | (78 | ) | | (0.87 | ) | | (70 | ) | | (0.79 | ) |
| Restructuring and separation costs | (43 | ) | | (0.68 | ) | | (43 | ) | | (0.68 | ) |
| Fee received for terminated acquisition | — |
| | — |
| | 75 |
| | 0.84 |
|
| | $ | (330 | ) | | $ | (4.09 | ) | | $ | (243 | ) | | $ | (3.16 | ) |
|
| | | | | | | | | | | | | | | |
| | Three Months Ended September 30, 2017 | | Nine Months Ended September 30, 2017 |
| | Amount | | Per Diluted Share (1) | | Amount | | Per Diluted Share (1) |
| | |
Restructuring costs (2) | $ | (118 | ) | | $ | (1.39 | ) | | $ | (161 | ) | | $ | (1.92 | ) |
Impairment losses (3) | (129 | ) | | (1.77 | ) | | (201 | ) | | (2.77 | ) |
| Change in Marketplace premium deficiency reserve for 2017 service dates | 30 |
| | 0.33 |
| | (40 | ) | | (0.45 | ) |
| Termination fee received for terminated Medicare acquisition | — |
| | — |
| | 75 |
| | 0.84 |
|
| | $ | (217 | ) | | $ | (2.83 | ) | | $ | (327 | ) | | $ | (4.30 | ) |
| |
| (1) | Except for certain items that are not deductible for tax purposes, per diluted share amounts are generally calculated at the statutory income tax rates of 22% for 2018, and 37% for 2017. |
TRENDS AND UNCERTAINTIES
MEDICAID CONTRACT RE-PROCUREMENT
The following table illustrates Health Plans segment Medicaid contracts scheduled for re-procurement in the near term. While we have been notified of the Medicaid regulators’ intention to re-procure the contracts, the anticipated award dates and effective dates are management’s current best estimates; such dates are subject to change. Premium revenue is stated in millions.
|
| | | | | | | | | | | | | |
| | | | | | | Premium Revenue | | | | |
| | | | | Membership as of | | Six Months Ended | | Anticipated |
| State Health Plan | | Medicaid Program(s) | | June 30, 2018 | | June 30, 2018 | | Award Date | | Effective Date |
| Texas | | ABD, MMP | | 99,000 |
| | $ | 966 |
| | Q2 2019 | | 6/1/2020 |
| Texas | | TANF, CHIP | | 127,000 |
| | 159 |
| | Q1 2019 | | 1/1/2020 |
New Mexico Health Plan Update. | |
| (2) | For more information, refer to Notes to Consolidated Financial Statements, Note 10, “Restructuring and Separation Costs.” |
| |
| (3) | In the nine months ended September 30, 2017, we recorded non-cash impairment losses for goodwill and intangibles, primarily relating to our Pathways subsidiary. In our Annual Report on Form 10-K for 2017, we reported that we were notified by the New Mexico Medicaid agency that we had not been selected for a tentative award of a 2019 Medicaid contract. We filed a brief in support of our judicial protest on July 20, 2018, with proposed protest hearing dates set for September 2018, and a decision expected in or around October 2018. In the interim, a temporary stay allows us to participate in the readiness review process for the new contract award. We are continuing to manage the business in run-off until such time as a different outcome is determined. Ohio Health Plan MMP Update. In July 2018, the Ohio Medicaid agency submitted a request to Centers for Medicare and Medicaid Services (CMS) for a three-year extension of the MyCare Ohio Duals Demonstration program, through December 31, 2022. The current authority for the program ends December 31, 2019. We estimate annualized premium revenues of approximately $680 million in 2018 under the Ohio MMP program.
PRESSURES ON MEDICAID FUNDING
Currently, there are a number of different legislative proposals being considered, some of which would involve significantly reduced federal spending on the Medicaid program and constitute a fundamental change in the federal role in health care. These proposals include elements such as the following:
Ending the entitlement nature of Medicaid by capping future increases in federal health spending for these programs, and shifting more of the risk for health costs in the future to states and consumers;
Reversing the ACA’s expansion of Medicaid that enables states to cover low-income childless adults;
Changing Medicaid to a state block grant program, including potentially capping spending on a per-enrollee
|
basis (a “per capita cap”);
Requiring Medicaid beneficiaries to work;
Limiting the amount of lifetime benefits for Medicaid beneficiaries; and
Numerous other potential changes and reforms.
ACA AND THE MARKETPLACE
The future of the Affordable Care Act (ACA) and its underlying programs, including the Marketplace, are subject to substantial uncertainty. Effective January 1, 2018, we have:
Exited the Utah and Wisconsin Marketplaces. We are currently evaluating the re-entry into these markets in 2019;
Reduced the scope of our Washington state Marketplace participation;
Increased premiums averaging 58%;
Mitigated our exposure to uncertainties relating to cost share reduction (CSR) funding and reconciliation; and
Adjusted broker commissions to market rates.
Effective January 2019, we have filed rates in nine Marketplace states, including the Utah and Wisconsin Marketplaces.
REPORTABLE SEGMENTS
HOW WE ASSESS PERFORMANCE
We derive our revenues primarily from health insurance premiums, and our primary customers are state Medicaid agencies and the federal government.
One of the key metrics used to assess the performance of our most significant segment, the Health Plans segment, is the medical care ratio (MCR). The MCR, which represents medical care costs as a percentage of premium revenue. Therefore, the underlying gross margin, or the amount earned by the Health Plans segment after medical costs are deducted from premium revenue, is the most important measure of earnings reviewed by management.
Gross marginMargin for our Health Plans segment is referred to as “Medical margin,” and for our Molina Medicaid Solutions and Other segments, as “Service margin.” The service margin is equal to service revenue minus cost of service revenue. Management’s discussion and analysis of the changes in the individual components of medical margin and service margin follows.
SEGMENT SUMMARY
| | | | Three Months Ended June 30, | | Six Months Ended June 30, | Three Months Ended September 30, | | Nine Months Ended September 30, |
| | 2018 | | 2017 | | 2018 | | 2017 | 2018 | | 2017 | | 2018 | | 2017 |
| | (In millions) | (In millions) |
Health Plans segment medical margin (1) | $ | 664 |
| | $ | 249 |
| | $ | 1,265 |
| | $ | 786 |
| $ | 547 |
| | $ | 557 |
| | $ | 1,812 |
| | $ | 1,343 |
|
Molina Medicaid Solutions segment service margin (2) | 4 |
| | 4 |
| | 12 |
| | 8 |
| 14 |
| | 5 |
| | 26 |
| | 13 |
|
Other segment service margin (2) | 5 |
| | 1 |
| | 11 |
| | 6 |
| 5 |
| | 2 |
| | 16 |
| | 8 |
|
| | 673 |
| | 254 |
| | $ | 1,288 |
| | $ | 800 |
| |
| Total margin | | $ | 566 |
| | $ | 564 |
| | $ | 1,854 |
| | $ | 1,364 |
|
| | | | | | | | | | | | | | | |
| Health Plans segment medical care ratio | 85.3 | % | | 94.8 | % | | 85.7 | % | | 91.6 | % | 87.4 | % | | 88.3 | % | | 86.2 | % | | 90.5 | % |
_______________________
| |
| (1) | Represents premium revenue minus medical care costs. |
| |
| (2) | Represents service revenue minus cost of service revenue. |
HEALTH PLANS
The Health Plans segment consists of health plans operating in 13 states and the Commonwealth of Puerto Rico. As of JuneSeptember 30, 2018, these health plans served approximately 4.14.0 million members eligible for Medicaid, Medicare, and other government-sponsored health care programs for low-income families and individuals. This membership includes Marketplace members, most of whom receive government premium subsidies.
BUSINESS OVERVIEWRECENT DEVELOPMENTS
Renewal of Medicaid Contracts
Year to date in 2018, we renewed Medicaid contracts in Washington, Florida and Puerto Rico as follows:
In May 2018, our Washington health plan was selected by the Washington State Health Care Authority (HCA) to enter into a managed care contract for the eight remaining regions of the state’s Apple Health Integrated Managed Care program, in addition to the two regions previously awarded to us. We were selected by HCA for the following regions: Greater Columbia, King, North Sound, Pierce, and Spokane beginning January 1, 2019; and Salish, Thurston-Mason, and Great Rivers beginning January 1, 2020. As of September 30, 2018, we served approximately 738,000 Medicaid members in Washington, which represented premium revenue of $1,558 million for the nine months ended September 30, 2018.
In June 2018, our Florida health plan was awarded comprehensive Medicaid Managed Care contracts by the Florida Agency for Health Care Administration (AHCA) in Regions 8 and 11 of the Florida Statewide Medicaid Managed Care Invitation to Negotiate. As of September 30, 2018, we served approximately 96,000 Medicaid members in those regions, which represented premium revenue of approximately $346 million for the nine months ended September 30, 2018. Services under the new contract are expected to begin on January 1, 2019. We will be serving both the Medicaid and long-term care populations in the two regions.
In July 2018, our Puerto Rico health plan was selected by the Puerto Rico Health Insurance Administration to be one of the organizations to administer the Commonwealth’s new Medicaid Managed Care contract. We expect to serve approximately 290,000 members under the new contract. The base contract runs for a period of three years with an optional one-year extension. As of September 30, 2018, we served approximately 320,000 Medicaid members in the East and Southwest regions of Puerto Rico, which represented premium revenue of $549 million for the nine months ended September 30, 2018.
TRENDS AND UNCERTAINTIES
Upcoming Contract Reprocurements
The following table illustrates Health Plans Membershipsegment Medicaid contracts scheduled for re-procurement in the near term. While we have been notified of the Medicaid regulators’ intention to re-procure the contracts, the anticipated award dates and effective dates are management’s current best estimates; such dates are subject to change. Premium revenue is stated in millions.
|
| | | | | | | | | | | | | |
| | | | | | | Premium Revenue | | | | |
| | | | | Membership as of | | Nine Months Ended | | Anticipated |
| State Health Plan | | Medicaid Program(s) | | September 30, 2018 | | September 30, 2018 | | Award Date | | Effective Date |
| Texas | | ABD, MMP | | 99,000 |
| | $ | 1,460 |
| | Q2 2019 | | 6/1/2020 |
| Texas | | TANF, CHIP | | 124,000 |
| | 236 |
| | Q3 2019 | | 9/1/2020 |
New Mexico Health Plan Update. In our Annual Report on Form 10-K for 2017, we reported that we were notified by the New Mexico Medicaid agency that we had not been selected for a tentative award of a 2019 Medicaid contract. A hearing was held on our judicial protest on October 17, 2018, with a decision expected in the fourth quarter of 2018. Regardless of the court’s decision on our protest, we would have further rights of appeal. We are continuing to manage the business in run-off until such time as a different outcome is determined. As of September 30, 2018, we served approximately 206,000 Medicaid members in New Mexico, which represented premium revenue of $891 million for the nine months ended September 30, 2018.
Medicare-Medicaid Plans (MMP) Update. The current authority for three of our MMP programs, in California, Illinois and Ohio, ends December 31, 2019. In July 2018, the Ohio Medicaid agency submitted a request to Centers for Medicare and Medicaid Services (CMS) for a three-year extension of its duals demonstration program, through December 31, 2022. We estimate annualized premium revenues of approximately $690 million in 2018 under our Ohio MMP program.
In June 2018, the California Medicaid agency submitted a request to CMS for a one-year extension of its duals demonstration program, through December 31, 2020. We estimate annualized premium revenues of approximately $180 million in 2018 under our California MMP program.
As of October 31, 2018, the Illinois Medicaid agency had not yet submitted an extension request to CMS for its duals demonstration program. We estimate annualized premium revenues of approximately $80 million in 2018 under our Illinois MMP program.
Pressures on Medicaid Funding
Currently, there are a number of different legislative proposals being considered, some of which would involve significantly reduced federal spending on the Medicaid program and constitute a fundamental change in the federal role in health care. These proposals include elements such as the following:
Ending the entitlement nature of Medicaid by capping future increases in federal health spending for these programs, and shifting more of the risk for health costs in the future to states and consumers;
Reversing the ACA’s expansion of Medicaid that enables states to cover low-income childless adults;
Changing Medicaid to a state block grant program, including potentially capping spending on a per-enrollee basis (a “per capita cap”);
Requiring Medicaid beneficiaries to work;
Limiting the amount of lifetime benefits for Medicaid beneficiaries; and
Numerous other potential changes and reforms.
ACA and the Marketplace
The future of the Affordable Care Act (ACA) and its underlying programs, including the Marketplace, are subject to substantial uncertainty. While we continue to monitor the current political and programmatic developments pertaining to the Marketplace, in 2018 we have taken various actions to improve our Marketplace operating performance. The action with the greatest impact to year-to-date results, effective January 1, 2018, was the significant increase to premium rates (averaging 58%).
We have entered into contracts to participate in nine Marketplace states, including the Utah and Wisconsin Marketplaces, effective January 2019.
MEMBERSHIP
The following tables set forth our Health Plans membership as of the dates indicated: | | | | June 30,
2018 | | December 31,
2017 | | June 30,
2017 | September 30,
2018 | | December 31,
2017 | | September 30,
2017 |
| Ending Membership by Program: | | | | | | | | | | |
| Temporary Assistance for Needy Families (TANF) and Children’s Health Insurance Program (CHIP) | 2,464,000 |
| | 2,457,000 |
| | 2,517,000 |
| 2,436,000 |
| | 2,457,000 |
| | 2,451,000 |
|
| Medicaid Expansion | 675,000 |
| | 668,000 |
| | 678,000 |
| 664,000 |
| | 668,000 |
| | 662,000 |
|
| Aged, Blind or Disabled (ABD) | 415,000 |
| | 412,000 |
| | 408,000 |
| 415,000 |
| | 412,000 |
| | 411,000 |
|
| Total Medicaid | 3,554,000 |
| | 3,537,000 |
| | 3,603,000 |
| 3,515,000 |
| | 3,537,000 |
| | 3,524,000 |
|
Medicare-Medicaid Plan (MMP) – Integrated (1) | 55,000 |
| | 57,000 |
| | 54,000 |
| 55,000 |
| | 57,000 |
| | 58,000 |
|
| Medicare Special Needs Plans (Medicare) | 45,000 |
| | 44,000 |
| | 44,000 |
| 45,000 |
| | 44,000 |
| | 44,000 |
|
| Total Medicare | 100,000 |
| | 101,000 |
| | 98,000 |
| 100,000 |
| | 101,000 |
| | 102,000 |
|
| Total Medicaid and Medicare | 3,654,000 |
| | 3,638,000 |
| | 3,701,000 |
| 3,615,000 |
| | 3,638,000 |
| | 3,626,000 |
|
| Marketplace | 409,000 |
| | 815,000 |
| | 949,000 |
| 384,000 |
| | 815,000 |
| | 877,000 |
|
| | 4,063,000 |
| | 4,453,000 |
| | 4,650,000 |
| 3,999,000 |
| | 4,453,000 |
| | 4,503,000 |
|
| | | | | | | | | | | |
| Ending Membership by Health Plan: | | | | | | | | | | |
| California | 639,000 |
| | 746,000 |
| | 766,000 |
| 623,000 |
| | 746,000 |
| | 751,000 |
|
| Florida | 398,000 |
| | 625,000 |
| | 672,000 |
| 395,000 |
| | 625,000 |
| | 641,000 |
|
| Illinois | 219,000 |
| | 165,000 |
| | 163,000 |
| 223,000 |
| | 165,000 |
| | 163,000 |
|
| Michigan | 397,000 |
| | 398,000 |
| | 414,000 |
| 394,000 |
| | 398,000 |
| | 399,000 |
|
| New Mexico | 241,000 |
| | 253,000 |
| | 266,000 |
| 234,000 |
| | 253,000 |
| | 256,000 |
|
| Ohio | 320,000 |
| | 327,000 |
| | 351,000 |
| 315,000 |
| | 327,000 |
| | 343,000 |
|
| Puerto Rico | 326,000 |
| | 314,000 |
| | 322,000 |
| 320,000 |
| | 314,000 |
| | 306,000 |
|
| South Carolina | 114,000 |
| | 116,000 |
| | 112,000 |
| 117,000 |
| | 116,000 |
| | 113,000 |
|
| Texas | 450,000 |
| | 430,000 |
| | 465,000 |
| 436,000 |
| | 430,000 |
| | 444,000 |
|
| Washington | 776,000 |
| | 777,000 |
| | 788,000 |
| 770,000 |
| | 777,000 |
| | 770,000 |
|
Other (2) | 183,000 |
| | 302,000 |
| | 331,000 |
| 172,000 |
| | 302,000 |
| | 317,000 |
|
| | 4,063,000 |
| | 4,453,000 |
| | 4,650,000 |
| 3,999,000 |
| | 4,453,000 |
| | 4,503,000 |
|
_________________________ | |
| (1) | MMP members receive both Medicaid and Medicare coverage from Molina Healthcare. |
| |
| (2) | “Other” includes the Idaho, New York, Utah and Wisconsin health plans, which are not individually significant to our consolidated operating results. |
Premiums by Program
The amount of the premiums paid to our health plans vary substantially between states and among various government programs. The following table sets forth the ranges of premiums paid to our state health plans by program on a per member per month (PMPM)PMPM basis, for the sixnine months ended JuneSeptember 30, 2018. The “Consolidated” column represents the weighted-average amounts for our total membership by program.
| | | | PMPM Premiums | PMPM Premiums |
| | Low | | High | | Consolidated | Low | | High | | Consolidated |
| TANF and CHIP | $ | 120.00 |
| | $ | 330.00 |
| | $ | 190.00 |
| $ | 120.00 |
| | $ | 340.00 |
| | $ | 190.00 |
|
| Medicaid Expansion | 320.00 |
| | 500.00 |
| | 370.00 |
| 300.00 |
| | 510.00 |
| | 360.00 |
|
| ABD | 530.00 |
| | 1,510.00 |
| | 1,020.00 |
| 520.00 |
| | 1,530.00 |
| | 1,030.00 |
|
| MMP – Integrated | 1,360.00 |
| | 3,180.00 |
| | 2,180.00 |
| 1,360.00 |
| | 3,190.00 |
| | 2,170.00 |
|
| Medicare | 690.00 |
| | 1,300.00 |
| | 1,180.00 |
| 600.00 |
| | 1,270.00 |
| | 1,170.00 |
|
| Marketplace | 250.00 |
| | 650.00 |
| | 370.00 |
| 250.00 |
| | 650.00 |
| | 380.00 |
|
FINANCIAL PERFORMANCE BY PROGRAM
The following tables summarize member months, premium revenue, medical care costs, medical care ratioMCR and medical margin by program for the periods indicated (PMPM amounts are in whole dollars; member months and other dollar amounts are in millions):
| | | | Three Months Ended June 30, 2018 | Three Months Ended September 30, 2018 |
| | Member Months (1) | | Premium Revenue | | Medical Care Costs | | MCR (2) | | Medical Margin | Member Months (1) | | Premium Revenue | | Medical Care Costs | | MCR (2) | | Medical Margin |
| | | Total | | PMPM | | Total | | PMPM | | | Total | | PMPM | | Total | | PMPM | |
| TANF and CHIP | 7.5 |
| | $ | 1,393 |
| | $ | 186.18 |
| | $ | 1,205 |
| | $ | 161.13 |
| | 86.5 | % | | $ | 188 |
| 7.4 |
| | $ | 1,379 |
| | $ | 187.03 |
| | $ | 1,228 |
| | $ | 166.41 |
| | 89.0 | % | | $ | 151 |
|
| Medicaid Expansion | 2.1 |
| | 761 |
| | 372.04 |
| | 676 |
| | 330.83 |
| | 88.9 |
| | 85 |
| 2.0 |
| | 671 |
| | 333.11 |
| | 640 |
| | 317.62 |
| | 95.3 |
| | 31 |
|
| ABD | 1.3 |
| | 1,288 |
| | 1,033.34 |
| | 1,209 |
| | 969.27 |
| | 93.8 |
| | 79 |
| 1.2 |
| | 1,322 |
| | 1,054.92 |
| | 1,186 |
| | 946.38 |
| | 89.7 |
| | 136 |
|
| Total Medicaid | 10.9 |
| | 3,442 |
| | 319.52 |
| | 3,090 |
| | 286.89 |
| | 89.8 |
| | 352 |
| 10.6 |
| | 3,372 |
| | 316.86 |
| | 3,054 |
| | 286.86 |
| | 90.5 |
| | 318 |
|
| MMP | 0.1 |
| | 367 |
| | 2,224.30 |
| | 313 |
| | 1,893.91 |
| | 85.1 |
| | 54 |
| 0.2 |
| | 353 |
| | 2,159.72 |
| | 323 |
| | 1,981.45 |
| | 91.7 |
| | 30 |
|
| Medicare | 0.2 |
| | 157 |
| | 1,168.40 |
| | 133 |
| | 989.33 |
| | 84.7 |
| | 24 |
| 0.1 |
| | 156 |
| | 1,157.71 |
| | 121 |
| | 895.25 |
| | 77.3 |
| | 35 |
|
| Total Medicare | 0.3 |
| | 524 |
| | 1,751.49 |
| | 446 |
| | 1,488.85 |
| | 85.0 |
| | 78 |
| 0.3 |
| | 509 |
| | 1,706.95 |
| | 444 |
| | 1,490.63 |
| | 87.3 |
| | 65 |
|
| Total Medicaid and Medicare | 11.2 |
| | 3,966 |
| | 358.23 |
| | 3,536 |
| | 319.37 |
| | 89.2 |
| | 430 |
| 10.9 |
| | 3,881 |
| | 354.70 |
| | 3,498 |
| | 319.63 |
| | 90.1 |
| | 383 |
|
| Marketplace | 1.2 |
| | 548 |
| | 440.93 |
| | 314 |
| | 253.04 |
| | 57.4 |
| | 234 |
| 1.2 |
| | 456 |
| | 394.02 |
| | 292 |
| | 252.61 |
| | 64.1 |
| | 164 |
|
| | 12.4 |
| | $ | 4,514 |
| | $ | 366.57 |
| | $ | 3,850 |
| | $ | 312.68 |
| | 85.3 | % | | $ | 664 |
| 12.1 |
| | $ | 4,337 |
| | $ | 358.46 |
| | $ | 3,790 |
| | $ | 313.23 |
| | 87.4 | % | | $ | 547 |
|
| | | | Three Months Ended June 30, 2017 | Three Months Ended September 30, 2017 |
| | Member Months (1) | | Premium Revenue | | Medical Care Costs | | MCR (2) | | Medical Margin | Member Months (1) | | Premium Revenue | | Medical Care Costs | | MCR (2) | | Medical Margin |
| | | Total | | PMPM | | Total | | PMPM | | | Total | | PMPM | | Total | | PMPM | |
| TANF and CHIP | 7.6 |
| | $ | 1,391 |
| | $ | 182.47 |
| | $ | 1,315 |
| | $ | 172.48 |
| | 94.5 | % | | $ | 76 |
| 7.5 |
| | $ | 1,392 |
| | $ | 185.95 |
| | $ | 1,242 |
| | $ | 165.76 |
| | 89.1 | % | | $ | 150 |
|
| Medicaid Expansion | 2.1 |
| | 786 |
| | 383.07 |
| | 689 |
| | 335.26 |
| | 87.5 |
| | 97 |
| 2.0 |
| | 773 |
| | 385.58 |
| | 667 |
| | 332.99 |
| | 86.4 |
| | 106 |
|
| ABD | 1.2 |
| | 1,285 |
| | 1,053.89 |
| | 1,245 |
| | 1,020.85 |
| | 96.9 |
| | 40 |
| 1.2 |
| | 1,288 |
| | 1,038.85 |
| | 1,259 |
| | 1,016.06 |
| | 97.8 |
| | 29 |
|
| Total Medicaid | 10.9 |
| | 3,462 |
| | 317.79 |
| | 3,249 |
| | 298.10 |
| | 93.8 |
| | 213 |
| 10.7 |
| | 3,453 |
| | 321.77 |
| | 3,168 |
| | 295.23 |
| | 91.8 |
| | 285 |
|
| MMP | 0.1 |
| | 361 |
| | 2,217.44 |
| | 333 |
| | 2,050.20 |
| | 92.5 |
| | 28 |
| 0.2 |
| | 378 |
| | 2,263.07 |
| | 336 |
| | 2,013.67 |
| | 89.0 |
| | 42 |
|
| Medicare | 0.2 |
| | 148 |
| | 1,126.14 |
| | 126 |
| | 963.34 |
| | 85.5 |
| | 22 |
| 0.1 |
| | 163 |
| | 1,231.61 |
| | 126 |
| | 951.01 |
| | 77.2 |
| | 37 |
|
| Total Medicare | 0.3 |
| | 509 |
| | 1,730.91 |
| | 459 |
| | 1,565.65 |
| | 90.5 |
| | 50 |
| 0.3 |
| | 541 |
| | 1,806.26 |
| | 462 |
| | 1,543.05 |
| | 85.4 |
| | 79 |
|
| Total Medicaid and Medicare | 11.2 |
| | 3,971 |
| | 354.87 |
| | 3,708 |
| | 331.36 |
| | 93.4 |
| | 263 |
| 11.0 |
| | 3,994 |
| | 362.04 |
| | 3,630 |
| | 329.08 |
| | 90.9 |
| | 364 |
|
| Marketplace | 2.8 |
| | 769 |
| | 267.37 |
| | 783 |
| | 272.37 |
| | 101.9 |
| | (14 | ) | 2.7 |
| | 783 |
| | 301.72 |
| | 590 |
| | 227.22 |
| | 75.3 |
| | 193 |
|
| | 14.0 |
| | $ | 4,740 |
| | $ | 336.98 |
| | $ | 4,491 |
| | $ | 319.29 |
| | 94.8 | % | | $ | 249 |
| 13.7 |
| | $ | 4,777 |
| | $ | 350.55 |
| | $ | 4,220 |
| | $ | 309.68 |
| | 88.3 | % | | $ | 557 |
|
|
| | | | | | | | | | | | | | | | | | | | | | | | | |
| | Nine Months Ended September 30, 2018 |
| | Member Months (1) | | Premium Revenue | | Medical Care Costs | | MCR (2) | | Medical Margin |
| | | Total | | PMPM | | Total | | PMPM | | |
| TANF and CHIP | 22.3 |
| | $ | 4,145 |
| | $ | 186.12 |
| | $ | 3,705 |
| | $ | 166.35 |
| | 89.4 | % | | $ | 440 |
|
| Medicaid Expansion | 6.1 |
| | 2,184 |
| | 359.37 |
| | 1,957 |
| | 322.01 |
| | 89.6 |
| | 227 |
|
| ABD | 3.7 |
| | 3,864 |
| | 1,034.25 |
| | 3,550 |
| | 950.11 |
| | 91.9 |
| | 314 |
|
| Total Medicaid | 32.1 |
| | 10,193 |
| | 317.70 |
| | 9,212 |
| | 287.10 |
| | 90.4 |
| | 981 |
|
| MMP | 0.5 |
| | 1,077 |
| | 2,173.90 |
| | 941 |
| | 1,899.26 |
| | 87.4 |
| | 136 |
|
| Medicare | 0.4 |
| | 470 |
| | 1,171.59 |
| | 385 |
| | 959.54 |
| | 81.9 |
| | 85 |
|
| Total Medicare | 0.9 |
| | 1,547 |
| | 1,725.71 |
| | 1,326 |
| | 1,479.06 |
| | 85.7 |
| | 221 |
|
| Total Medicaid and Medicare | 33.0 |
| | 11,740 |
| | 355.96 |
| | 10,538 |
| | 319.50 |
| | 89.8 |
| | 1,202 |
|
| Marketplace | 3.8 |
| | 1,434 |
| | 379.91 |
| | 824 |
| | 218.44 |
| | 57.5 |
| | 610 |
|
| | 36.8 |
| | $ | 13,174 |
| | $ | 358.42 |
| | $ | 11,362 |
| | $ | 309.12 |
| | 86.2 | % | | $ | 1,812 |
|
|
| | | | | | | | | | | | | | | | | | | | | | | | | |
| | Six Months Ended June 30, 2018 |
| | Member Months (1) | | Premium Revenue | | Medical Care Costs | | MCR (2) | | Medical Margin |
| | | Total | | PMPM | | Total | | PMPM | | |
| TANF and CHIP | 14.9 |
| | $ | 2,766 |
| | $ | 185.66 |
| | $ | 2,477 |
| | $ | 166.32 |
| | 89.6 | % | | $ | 289 |
|
| Medicaid Expansion | 4.1 |
| | 1,513 |
| | 372.39 |
| | 1,317 |
| | 324.19 |
| | 87.1 |
| | 196 |
|
| ABD | 2.5 |
| | 2,542 |
| | 1,023.83 |
| | 2,364 |
| | 951.99 |
| | 93.0 |
| | 178 |
|
| Total Medicaid | 21.5 |
| | 6,821 |
| | 318.11 |
| | 6,158 |
| | 287.22 |
| | 90.3 |
| | 663 |
|
| MMP | 0.3 |
| | 724 |
| | 2,180.86 |
| | 618 |
| | 1,858.87 |
| | 85.2 |
| | 106 |
|
| Medicare | 0.3 |
| | 314 |
| | 1,178.58 |
| | 264 |
| | 992.05 |
| | 84.2 |
| | 50 |
|
| Total Medicare | 0.6 |
| | 1,038 |
| | 1,735.05 |
| | 882 |
| | 1,473.30 |
| | 84.9 |
| | 156 |
|
| Total Medicaid and Medicare | 22.1 |
| | 7,859 |
| | 356.59 |
| | 7,040 |
| | 319.43 |
| | 89.6 |
| | 819 |
|
| Marketplace | 2.6 |
| | 978 |
| | 373.67 |
| | 532 |
| | 203.34 |
| | 54.4 |
| | 446 |
|
| | 24.7 |
| | $ | 8,837 |
| | $ | 358.40 |
| | $ | 7,572 |
| | $ | 307.11 |
| | 85.7 | % | | $ | 1,265 |
|
| | | | Six Months Ended June 30, 2017 | Nine Months Ended September 30, 2017 |
| | Member Months (1) | | Premium Revenue | | Medical Care Costs | | MCR (2) | | Medical Margin | Member Months (1) | | Premium Revenue | | Medical Care Costs | | MCR (2) | | Medical Margin |
| | | Total | | PMPM | | Total | | PMPM | | | Total | | PMPM | | Total | | PMPM | |
| TANF and CHIP | 15.3 |
| | $ | 2,793 |
| | $ | 182.58 |
| | $ | 2,619 |
| | $ | 171.25 |
| | 93.8 | % | | $ | 174 |
| 22.8 |
| | $ | 4,185 |
| | $ | 183.69 |
| | $ | 3,861 |
| | $ | 169.44 |
| | 92.2 | % | | $ | 324 |
|
| Medicaid Expansion | 4.1 |
| | 1,603 |
| | 390.88 |
| | 1,378 |
| | 335.88 |
| | 85.9 |
| | 225 |
| 6.1 |
| | 2,376 |
| | 389.14 |
| | 2,045 |
| | 334.93 |
| | 86.1 |
| | 331 |
|
| ABD | 2.4 |
| | 2,481 |
| | 1,030.68 |
| | 2,375 |
| | 986.54 |
| | 95.7 |
| | 106 |
| 3.6 |
| | 3,769 |
| | 1,033.45 |
| | 3,634 |
| | 996.58 |
| | 96.4 |
| | 135 |
|
| Total Medicaid | 21.8 |
| | 6,877 |
| | 315.39 |
| | 6,372 |
| | 292.22 |
| | 92.7 |
| | 505 |
| 32.5 |
| | 10,330 |
| | 317.49 |
| | 9,540 |
| | 293.21 |
| | 92.4 |
| | 790 |
|
| MMP | 0.3 |
| | 705 |
| | 2,152.75 |
| | 640 |
| | 1,954.15 |
| | 90.8 |
| | 65 |
| 0.5 |
| | 1,083 |
| | 2,189.96 |
| | 976 |
| | 1,974.22 |
| | 90.1 |
| | 107 |
|
| Medicare | 0.3 |
| | 286 |
| | 1,097.36 |
| | 243 |
| | 933.20 |
| | 85.0 |
| | 43 |
| 0.4 |
| | 449 |
| | 1,142.68 |
| | 369 |
| | 939.21 |
| | 82.2 |
| | 80 |
|
| Total Medicare | 0.6 |
| | 991 |
| | 1,685.72 |
| | 883 |
| | 1,502.36 |
| | 89.1 |
| | 108 |
| 0.9 |
| | 1,532 |
| | 1,726.39 |
| | 1,345 |
| | 1,516.09 |
| | 87.8 |
| | 187 |
|
| Total Medicaid and Medicare | 22.4 |
| | 7,868 |
| | 351.35 |
| | 7,255 |
| | 323.98 |
| | 92.2 |
| | 613 |
| 33.4 |
| | 11,862 |
| | 354.88 |
| | 10,885 |
| | 325.66 |
| | 91.8 |
| | 977 |
|
| Marketplace | 5.7 |
| | 1,520 |
| | 264.77 |
| | 1,347 |
| | 234.62 |
| | 88.6 |
| | 173 |
| 8.4 |
| | 2,303 |
| | 276.27 |
| | 1,937 |
| | 232.31 |
| | 84.1 |
| | 366 |
|
| | 28.1 |
| | $ | 9,388 |
| | $ | 333.68 |
| | $ | 8,602 |
| | $ | 305.74 |
| | 91.6 | % | | $ | 786 |
| 41.8 |
| | $ | 14,165 |
| | $ | 339.19 |
| | $ | 12,822 |
| | $ | 307.03 |
| | 90.5 | % | | $ | 1,343 |
|
_______________________
| |
| (1) | A member month is defined as the aggregate of each month’s ending membership for the period presented. |
| |
| (2) | “MCR” represents medical costs as a percentage of premium revenue. |
Medicaid
Overall
Medical care costs as a percent of premium revenue improvedThe Medicaid MCR decreased to 85.3%90.5% in the secondthird quarter of 2018, from 94.8%91.8% in the secondthird quarter of 2017, and decreased to 90.4% for the nine months ended September 30, 2018, from 92.4% for the nine months ended September 30, 2017. Excluding recognition of the Marketplace$57 million retroactive California Medicaid Expansion risk adjustments and cost sharing reduction (CSR) adjustments relating to prior year dates of service in both periods noted incorridor adjustment, the tables above in “Overview—Consolidated Results,” the overall medical care ratioMedicaid MCR would have been 87.0%89.0% in the secondthird quarter of 2018, and 93.9% in89.9% for the second quarter of 2017.
Medical care costs as a percent of premium revenue improved to 85.7% in the sixnine months ended JuneSeptember 30, 2018, from 91.6%2018. The decreases were mainly due to improved performance for ABD and TANF and CHIP, partially offset by a decline in the six months ended June 30, 2017. Excluding the Marketplace risk adjustments and CSR adjustments relating to prior year dates of service in both periods, the overall medical care ratio would have been 87.1% in the six months ended June 30, 2018, and 91.2% in the six months ended June 30, 2017.
performance for Medicaid Expansion.
TANF and CHIP. The medical care ratioMCR for TANF and CHIP improved to 86.5%89.0% in the secondthird quarter of 2018, from 94.5%89.1% in the secondthird quarter of 2017; and was 89.6% inimproved to 89.4% for the sixnine months ended JuneSeptember 30, 2018, down from 93.8% in92.2% for the sixnine months ended JuneSeptember 30, 2017. The year over year improvement was primarily due to improved performance at our Illinois, California and Puerto RicoTexas health plans.plans, partially offset by a decline in performance at our New Mexico health plan.
Medicaid Expansion. The medical care ratioMCR for Medicaid Expansion was 88.9%95.3% in the secondthird quarter of 2018, up from 87.5%86.4% in the secondthird quarter of 2017, and was 87.1% in89.6% for the sixnine months ended JuneSeptember 30, 2018, up from 85.9%86.1% for the nine months ended September 30, 2017. Excluding recognition of the $57 million retroactive California Medicaid Expansion risk corridor adjustment, the Medicaid Expansion MCR would have been 87.9% in the sixthird quarter of 2018, and 87.3% for the nine months ended JuneSeptember 30, 2017.2018. These increases were primarily due to the premium reduction we received
in California in July 2017. Medicaid Expansion has generally performed well because rate adequacy has trended favorably, and membership is concentrated in our higher performing health plans, particularly California, Michigan, and Washington.
ABD. The medical care ratioMCR for ABD improved to 93.8%89.7% in the secondthird quarter of 2018, compared with 96.9%97.8% in the secondthird quarter of 2017; and was 93.0% inimproved to 91.9% for the sixnine months ended JuneSeptember 30, 2018, down from 95.7% in96.4% for the sixnine months ended JuneSeptember 30, 2017. The year over yearyear-over-year improvement can be attributed to a number of actions, including our continued advancement on key,management of high acuity management fundamentals.members.
Medicare and MMP
The medical care ratiooverall MCR for the combined Medicare programs improvedincreased to 85.0%87.3% in the secondthird quarter of 2018, from 90.5%85.4% in the secondthird quarter of 2017; and was 84.9%2017, but improved to 85.7% for the nine months ended September 30, 2018, from 87.8% for the nine months ended September 30, 2017. The MCR increase in the sixthird quarter of 2018 is mainly due to certain premium transfers between the MMP and Medicaid programs that had no impact on consolidated results, and higher inpatient costs in our MMP program. The improvement for the nine months ended JuneSeptember 30, 2018 down from 89.1% in the six months ended June 30, 2017. This improvement was partly driven by the recognition of additional MMP at‑risk revenue for dates of service in 2016 and 2017, because at‑risk revenue is oftenresulting from ultimate settlements with CMS that were higher than the original estimates recognized long after medical services have been provided.in those periods. The Medicare business also benefited from favorable medical care trends and improved medical management of inpatient utilization for this population. Accurate and complete risk score documentation and effective management of chronic and high acuity conditions are critical to the successful management of this program for the rest of the year.program.
Marketplace
Lower Marketplace premium revenue was driven by a decrease in membership of over 50%, partially offset by premium rate increases. As previously disclosed, we increased premium rates and reduced our Marketplace presence effective January 1, 2018, as part of our overall program to improve profitability.
The medical care ratioMCR for the Marketplace program decreased to 57.4%64.1% in the secondthird quarter of 2018, from 101.9%75.3% in the secondthird quarter of 2017; and was 54.4%improved to 57.5% in the sixnine months ended JuneSeptember 30, 2018, down from 88.6% in84.1% for the sixnine months ended JuneSeptember 30, 2017.
Excluding the benefit of the 2017 Marketplace cost sharing reduction (CSR) reimbursement recognized in 2018, the MCR for the third quarter of 2018 would have been 65.3%. Excluding the combined benefit of the 2017 Marketplace risk adjustmentsadjustment and CSR adjustments relating to prior yearreimbursement recognized in 2018, the MCR for the nine months ended September 30, 2018 would have been 65.7%. Excluding the changes in Marketplace premium deficiency reserves for 2017 dates of service, in both periods, the Marketplace medical care ratioMCR for the third quarter of 2017 would have been 68.4% in79.1%, and 82.4% for the second quarter of 2018, compared with 96.3% in second quarter of 2017, and would have been 66.0% in the sixnine months ended JuneSeptember 30, 2018, compared with 86.2% in2017. The year over year improvement is mainly due to the six months ended June 30, 2017.overall program to improve profitability, as discussed above.
FINANCIAL PERFORMANCE BY STATE
The following tables summarize member months, premium revenue, medical care costs, medical care ratio,MCR, and medical margin by state health plan for the periods indicated (PMPM amounts are in whole dollars; member months and other dollar amounts are in millions):
Health Plans Segment Financial Data — Medicaid and Medicare
| | | | Three Months Ended June 30, 2018 | Three Months Ended September 30, 2018 |
| | Member
Months | | Premium Revenue | | Medical Care Costs | | MCR | | Medical Margin | Member
Months | | Premium Revenue | | Medical Care Costs | | MCR | | Medical Margin |
| | | Total | | PMPM | | Total | | PMPM | | | Total | | PMPM | | Total | | PMPM | |
| California | 1.8 |
| | $ | 517 |
| | $ | 289.80 |
| | $ | 441 |
| | $ | 247.36 |
| | 85.4 | % | | $ | 76 |
| 1.7 |
| | $ | 435 |
| | $ | 249.00 |
| | $ | 446 |
| | $ | 255.22 |
| | 102.5 | % | | $ | (11 | ) |
| Florida | 1.2 |
| | 377 |
| | 353.81 |
| | 362 |
| | 339.31 |
| | 95.9 |
| | 15 |
| 1.0 |
| | 388 |
| | 363.16 |
| | 362 |
| | 339.33 |
| | 93.4 |
| | 26 |
|
| Illinois | 0.6 |
| | 203 |
| | 311.60 |
| | 170 |
| | 261.59 |
| | 84.0 |
| | 33 |
| 0.7 |
| | 207 |
| | 312.72 |
| | 182 |
| | 274.98 |
| | 87.9 |
| | 25 |
|
| Michigan | 1.2 |
| | 388 |
| | 342.45 |
| | 331 |
| | 292.20 |
| | 85.3 |
| | 57 |
| 1.1 |
| | 397 |
| | 350.05 |
| | 321 |
| | 282.49 |
| | 80.7 |
| | 76 |
|
| New Mexico | 0.7 |
| | 313 |
| | 469.88 |
| | 290 |
| | 435.36 |
| | 92.7 |
| | 23 |
| 0.6 |
| | 304 |
| | 471.66 |
| | 275 |
| | 426.69 |
| | 90.5 |
| | 29 |
|
| Ohio | 1.0 |
| | 535 |
| | 571.08 |
| | 482 |
| | 514.57 |
| | 90.1 |
| | 53 |
| 0.9 |
| | 584 |
| | 624.84 |
| | 532 |
| | 568.93 |
| | 91.1 |
| | 52 |
|
| Puerto Rico | 0.9 |
| | 184 |
| | 188.26 |
| | 165 |
| | 168.20 |
| | 89.3 |
| | 19 |
| 1.0 |
| | 179 |
| | 189.65 |
| | 162 |
| | 171.96 |
| | 90.7 |
| | 17 |
|
| South Carolina | 0.4 |
| | 123 |
| | 350.22 |
| | 107 |
| | 304.20 |
| | 86.9 |
| | 16 |
| 0.4 |
| | 124 |
| | 354.53 |
| | 112 |
| | 318.56 |
| | 89.9 |
| | 12 |
|
| Texas | 0.7 |
| | 576 |
| | 835.66 |
| | 510 |
| | 740.55 |
| | 88.6 |
| | 66 |
| 0.7 |
| | 577 |
| | 848.47 |
| | 525 |
| | 772.14 |
| | 91.0 |
| | 52 |
|
| Washington | 2.2 |
| | 571 |
| | 252.61 |
| | 526 |
| | 232.49 |
| | 92.0 |
| | 45 |
| 2.3 |
| | 511 |
| | 226.77 |
| | 444 |
| | 197.04 |
| | 86.9 |
| | 67 |
|
Other (1) | 0.5 |
| | 179 |
| | 322.99 |
| | 152 |
| | 274.59 |
| | 85.0 |
| | 27 |
| 0.5 |
| | 175 |
| | 334.29 |
| | 137 |
| | 261.49 |
| | 78.2 |
| | 38 |
|
| | 11.2 |
| | $ | 3,966 |
| | $ | 358.23 |
| | $ | 3,536 |
| | $ | 319.37 |
| | 89.2 | % | | $ | 430 |
| 10.9 |
| | $ | 3,881 |
| | $ | 354.70 |
| | $ | 3,498 |
| | $ | 319.63 |
| | 90.1 | % | | $ | 383 |
|
|
| | | | | | | | | | | | | | | | | | | | | | | | | |
| | Three Months Ended September 30, 2017 |
| | Member
Months | | Premium Revenue | | Medical Care Costs | | MCR | | Medical Margin |
| | | Total | | PMPM | | Total | | PMPM | | |
| California | 1.9 |
| | $ | 601 |
| | $ | 322.97 |
| | $ | 563 |
| | $ | 302.67 |
| | 93.7 | % | | $ | 38 |
|
| Florida | 1.0 |
| | 388 |
| | 355.59 |
| | 390 |
| | 356.83 |
| | 100.3 |
| | (2 | ) |
| Illinois | 0.5 |
| | 137 |
| | 287.69 |
| | 138 |
| | 289.36 |
| | 100.6 |
| | (1 | ) |
| Michigan | 1.2 |
| | 390 |
| | 337.17 |
| | 345 |
| | 298.83 |
| | 88.6 |
| | 45 |
|
| New Mexico | 0.7 |
| | 304 |
| | 429.07 |
| | 277 |
| | 390.91 |
| | 91.1 |
| | 27 |
|
| Ohio | 0.9 |
| | 549 |
| | 560.06 |
| | 483 |
| | 492.61 |
| | 88.0 |
| | 66 |
|
| Puerto Rico | 1.0 |
| | 191 |
| | 202.59 |
| | 159 |
| | 168.25 |
| | 83.1 |
| | 32 |
|
| South Carolina | 0.3 |
| | 113 |
| | 332.48 |
| | 101 |
| | 297.74 |
| | 89.6 |
| | 12 |
|
| Texas | 0.7 |
| | 541 |
| | 778.50 |
| | 506 |
| | 728.19 |
| | 93.5 |
| | 35 |
|
| Washington | 2.3 |
| | 612 |
| | 276.73 |
| | 522 |
| | 236.11 |
| | 85.3 |
| | 90 |
|
Other (1) | 0.5 |
| | 168 |
| | 294.99 |
| | 146 |
| | 256.99 |
| | 87.1 |
| | 22 |
|
| | 11.0 |
| | $ | 3,994 |
| | $ | 362.04 |
| | $ | 3,630 |
| | $ | 329.08 |
| | 90.9 | % | | $ | 364 |
|
| | | | Three Months Ended June 30, 2017 | Nine Months Ended September 30, 2018 |
| | Member
Months | | Premium Revenue | | Medical Care Costs | | MCR | | Medical Margin | Member
Months | | Premium Revenue | | Medical Care Costs | | MCR | | Medical Margin |
| | | Total | | PMPM | | Total | | PMPM | | | Total | | PMPM | | Total | | PMPM | |
| California | 1.9 |
| | $ | 598 |
| | $ | 318.89 |
| | $ | 539 |
| | $ | 287.36 |
| | 90.1 | % | | $ | 59 |
| 5.3 |
| | $ | 1,446 |
| | $ | 270.63 |
| | $ | 1,299 |
| | $ | 243.14 |
| | 89.8 | % | | $ | 147 |
|
| Florida | 1.1 |
| | 380 |
| | 347.20 |
| | 370 |
| | 337.92 |
| | 97.3 |
| | 10 |
| 3.2 |
| | 1,147 |
| | 356.15 |
| | 1,069 |
| | 331.93 |
| | 93.2 |
| | 78 |
|
| Illinois | 0.5 |
| | 149 |
| | 289.51 |
| | 174 |
| | 336.76 |
| | 116.3 |
| | (25 | ) | 1.8 |
| | 551 |
| | 308.45 |
| | 474 |
| | 265.47 |
| | 86.1 |
| | 77 |
|
| Michigan | 1.1 |
| | 390 |
| | 333.26 |
| | 358 |
| | 305.40 |
| | 91.6 |
| | 32 |
| 3.4 |
| | 1,161 |
| | 343.08 |
| | 983 |
| | 290.26 |
| | 84.6 |
| | 178 |
|
| New Mexico | 0.8 |
| | 321 |
| | 443.13 |
| | 311 |
| | 428.58 |
| | 96.7 |
| | 10 |
| 2.0 |
| | 936 |
| | 469.19 |
| | 875 |
| | 438.70 |
| | 93.5 |
| | 61 |
|
| Ohio | 1.0 |
| | 529 |
| | 536.90 |
| | 489 |
| | 496.41 |
| | 92.5 |
| | 40 |
| 2.8 |
| | 1,670 |
| | 590.71 |
| | 1,474 |
| | 521.26 |
| | 88.2 |
| | 196 |
|
| Puerto Rico | 0.9 |
| | 179 |
| | 184.28 |
| | 189 |
| | 194.42 |
| | 105.5 |
| | (10 | ) | 2.9 |
| | 549 |
| | 190.34 |
| | 501 |
| | 173.83 |
| | 91.3 |
| | 48 |
|
| South Carolina | 0.4 |
| | 111 |
| | 326.57 |
| | 102 |
| | 304.14 |
| | 93.1 |
| | 9 |
| 1.1 |
| | 369 |
| | 350.94 |
| | 323 |
| | 306.76 |
| | 87.4 |
| | 46 |
|
| Texas | 0.7 |
| | 524 |
| | 752.01 |
| | 473 |
| | 679.43 |
| | 90.3 |
| | 51 |
| 2.1 |
| | 1,715 |
| | 831.21 |
| | 1,554 |
| | 753.31 |
| | 90.6 |
| | 161 |
|
| Washington | 2.2 |
| | 618 |
| | 276.90 |
| | 546 |
| | 244.58 |
| | 88.3 |
| | 72 |
| 6.8 |
| | 1,666 |
| | 245.40 |
| | 1,544 |
| | 227.41 |
| | 92.7 |
| | 122 |
|
Other (1) | 0.6 |
| | 172 |
| | 294.15 |
| | 157 |
| | 268.91 |
| | 91.4 |
| | 15 |
| 1.6 |
| | 530 |
| | 323.84 |
| | 442 |
| | 269.98 |
| | 83.4 |
| | 88 |
|
| | 11.2 |
| | $ | 3,971 |
| | $ | 354.87 |
| | $ | 3,708 |
| | $ | 331.36 |
| | 93.4 | % | | $ | 263 |
| 33.0 |
| | $ | 11,740 |
| | $ | 355.96 |
| | $ | 10,538 |
| | $ | 319.50 |
| | 89.8 | % | | $ | 1,202 |
|
|
| | | | | | | | | | | | | | | | | | | | | | | | | |
| | Six Months Ended June 30, 2018 |
| | Member
Months | | Premium Revenue | | Medical Care Costs | | MCR | | Medical Margin |
| | | Total | | PMPM | | Total | | PMPM | | |
| California | 3.6 |
| | $ | 1,011 |
| | $ | 281.14 |
| | $ | 853 |
| | $ | 237.26 |
| | 84.4 | % | | $ | 158 |
|
| Florida | 2.2 |
| | 759 |
| | 352.68 |
| | 707 |
| | 328.26 |
| | 93.1 |
| | 52 |
|
| Illinois | 1.1 |
| | 344 |
| | 305.94 |
| | 292 |
| | 259.87 |
| | 84.9 |
| | 52 |
|
| Michigan | 2.3 |
| | 764 |
| | 339.56 |
| | 662 |
| | 294.19 |
| | 86.6 |
| | 102 |
|
| New Mexico | 1.4 |
| | 632 |
| | 468.00 |
| | 600 |
| | 444.44 |
| | 95.0 |
| | 32 |
|
| Ohio | 1.9 |
| | 1,086 |
| | 573.87 |
| | 942 |
| | 497.75 |
| | 86.7 |
| | 144 |
|
| Puerto Rico | 1.9 |
| | 370 |
| | 190.68 |
| | 339 |
| | 174.74 |
| | 91.6 |
| | 31 |
|
| South Carolina | 0.7 |
| | 245 |
| | 349.15 |
| | 211 |
| | 300.87 |
| | 86.2 |
| | 34 |
|
| Texas | 1.4 |
| | 1,138 |
| | 822.72 |
| | 1,029 |
| | 744.05 |
| | 90.4 |
| | 109 |
|
| Washington | 4.5 |
| | 1,155 |
| | 254.64 |
| | 1,100 |
| | 242.48 |
| | 95.2 |
| | 55 |
|
Other (1) | 1.1 |
| | 355 |
| | 318.94 |
| | 305 |
| | 273.97 |
| | 85.9 |
| | 50 |
|
| | 22.1 |
| | $ | 7,859 |
| | $ | 356.59 |
| | $ | 7,040 |
| | $ | 319.43 |
| | 89.6 | % | | $ | 819 |
|
| | | | Six Months Ended June 30, 2017 | Nine Months Ended September 30, 2017 |
| | Member
Months | | Premium Revenue | | Medical Care Costs | | MCR | | Medical Margin | Member
Months | | Premium Revenue | | Medical Care Costs | | MCR | | Medical Margin |
| | | Total | | PMPM | | Total | | PMPM | | | Total | | PMPM | | Total | | PMPM | |
| California | 3.7 |
| | $ | 1,170 |
| | $ | 313.76 |
| | $ | 1,023 |
| | $ | 274.42 |
| | 87.5 | % | | $ | 147 |
| 5.6 |
| | $ | 1,771 |
| | $ | 316.83 |
| | $ | 1,586 |
| | $ | 283.82 |
| | 89.6 | % | | $ | 185 |
|
| Florida | 2.2 |
| | 744 |
| | 343.29 |
| | 722 |
| | 333.23 |
| | 97.1 |
| | 22 |
| 3.2 |
| | 1,132 |
| | 347.41 |
| | 1,112 |
| | 341.15 |
| | 98.2 |
| | 20 |
|
| Illinois | 1.1 |
| | 310 |
| | 282.66 |
| | 354 |
| | 322.63 |
| | 114.1 |
| | (44 | ) | 1.6 |
| | 447 |
| | 284.18 |
| | 492 |
| | 312.54 |
| | 110.0 |
| | (45 | ) |
| Michigan | 2.3 |
| | 772 |
| | 330.34 |
| | 690 |
| | 295.02 |
| | 89.3 |
| | 82 |
| 3.5 |
| | 1,162 |
| | 332.60 |
| | 1,035 |
| | 296.28 |
| | 89.1 |
| | 127 |
|
| New Mexico | 1.5 |
| | 629 |
| | 432.98 |
| | 610 |
| | 419.65 |
| | 96.9 |
| | 19 |
| 2.2 |
| | 933 |
| | 431.70 |
| | 887 |
| | 410.24 |
| | 95.0 |
| | 46 |
|
| Ohio | 2.0 |
| | 1,049 |
| | 532.35 |
| | 951 |
| | 482.73 |
| | 90.7 |
| | 98 |
| 2.9 |
| | 1,598 |
| | 541.56 |
| | 1,434 |
| | 486.02 |
| | 89.7 |
| | 164 |
|
| Puerto Rico | 1.9 |
| | 362 |
| | 185.40 |
| | 354 |
| | 181.24 |
| | 97.8 |
| | 8 |
| 2.9 |
| | 553 |
| | 190.99 |
| | 513 |
| | 177.01 |
| | 92.7 |
| | 40 |
|
| South Carolina | 0.7 |
| | 216 |
| | 321.85 |
| | 200 |
| | 298.79 |
| | 92.8 |
| | 16 |
| 1.0 |
| | 329 |
| | 325.43 |
| | 301 |
| | 298.43 |
| | 91.7 |
| | 28 |
|
| Texas | 1.4 |
| | 1,051 |
| | 751.94 |
| | 962 |
| | 687.96 |
| | 91.5 |
| | 89 |
| 2.1 |
| | 1,592 |
| | 760.76 |
| | 1,468 |
| | 701.32 |
| | 92.2 |
| | 124 |
|
| Washington | 4.4 |
| | 1,223 |
| | 275.05 |
| | 1,081 |
| | 243.18 |
| | 88.4 |
| | 142 |
| 6.7 |
| | 1,835 |
| | 275.60 |
| | 1,603 |
| | 240.83 |
| | 87.4 |
| | 232 |
|
Other (1) | 1.2 |
| | 342 |
| | 291.93 |
| | 308 |
| | 262.97 |
| | 90.1 |
| | 34 |
| 1.7 |
| | 510 |
| | 292.93 |
| | 454 |
| | 261.01 |
| | 89.1 |
| | 56 |
|
| | 22.4 |
| | $ | 7,868 |
| | $ | 351.35 |
| | $ | 7,255 |
| | $ | 323.98 |
| | 92.2 | % | | $ | 613 |
| 33.4 |
| | $ | 11,862 |
| | $ | 354.88 |
| | $ | 10,885 |
| | $ | 325.66 |
| | 91.8 | % | | $ | 977 |
|
______________________
| |
| (1) | “Other” includes the Idaho, New York, Utah and Wisconsin health plans, which are not individually significant to our consolidated operating results. |
Health Plans Segment Financial Data — Marketplace
|
| | | | | | | | | | | | | | | | | | | | | | | | | |
| | Three Months Ended June 30, 2018 |
| | Member
Months | | Premium Revenue | | Medical Care Costs | | MCR | | Medical Margin |
| | | Total | | PMPM | | Total | | PMPM | | |
| California | 0.2 |
| | $ | 73 |
| | $ | 426.16 |
| | $ | 21 |
| | $ | 117.92 |
| | 27.7 | % | | $ | 52 |
|
| Florida | 0.1 |
| | 100 |
| | 698.31 |
| | 38 |
| | 269.86 |
| | 38.6 |
| | 62 |
|
| Michigan | — |
| | 15 |
| | 288.67 |
| | 7 |
| | 146.97 |
| | 50.9 |
| | 8 |
|
| New Mexico | — |
| | 31 |
| | 418.82 |
| | 18 |
| | 247.06 |
| | 59.0 |
| | 13 |
|
| Ohio | — |
| | 31 |
| | 518.64 |
| | 23 |
| | 381.46 |
| | 73.6 |
| | 8 |
|
| Texas | 0.7 |
| | 222 |
| | 330.12 |
| | 160 |
| | 238.72 |
| | 72.3 |
| | 62 |
|
| Washington | 0.2 |
| | 56 |
| | 787.80 |
| | 41 |
| | 572.48 |
| | 72.7 |
| | 15 |
|
Other (1) | — |
| | 20 |
| | NM |
| | 6 |
| | NM |
| | NM | | 14 |
|
| | 1.2 |
| | $ | 548 |
| | $ | 440.93 |
| | $ | 314 |
| | $ | 253.04 |
| | 57.4 | % | | $ | 234 |
|
| | | | Three Months Ended June 30, 2017 | Three Months Ended September 30, 2018 |
| | Member
Months | | Premium Revenue | | Medical Care Costs | | MCR | | Medical Margin | Member
Months | | Premium Revenue | | Medical Care Costs | | MCR | | Medical Margin |
| | | Total | | PMPM | | Total | | PMPM | | | Total | | PMPM | | Total | | PMPM | |
| California | 0.5 |
| | $ | 81 |
| | $ | 186.90 |
| | $ | 67 |
| | $ | 154.23 |
| | 82.5 | % | | $ | 14 |
| 0.2 |
| | $ | 49 |
| | $ | 309.04 |
| | $ | 37 |
| | $ | 235.63 |
| | 76.2 | % | | $ | 12 |
|
| Florida | 0.9 |
| | 269 |
| | 284.60 |
| | 317 |
| | 336.78 |
| | 118.3 |
| | (48 | ) | 0.2 |
| | 66 |
| | 548.60 |
| | 45 |
| | 362.39 |
| | 66.1 |
| | 21 |
|
| Michigan | 0.1 |
| | 16 |
| | 204.15 |
| | 10 |
| | 135.89 |
| | 66.6 |
| | 6 |
| — |
| | 12 |
| | 233.51 |
| | 7 |
| | 145.13 |
| | 62.1 |
| | 5 |
|
| New Mexico | — |
| | 31 |
| | 367.98 |
| | 23 |
| | 266.91 |
| | 72.5 |
| | 8 |
| 0.1 |
| | 28 |
| | 419.20 |
| | 18 |
| | 249.33 |
| | 59.5 |
| | 10 |
|
| Ohio | — |
| | 24 |
| | 377.94 |
| | 27 |
| | 404.20 |
| | 106.9 |
| | (3 | ) | 0.1 |
| | 27 |
| | 485.08 |
| | 18 |
| | 336.86 |
| | 69.4 |
| | 9 |
|
| Texas | 0.7 |
| | 177 |
| | 247.49 |
| | 129 |
| | 180.92 |
| | 73.1 |
| | 48 |
| 0.6 |
| | 228 |
| | 357.54 |
| | 134 |
| | 209.80 |
| | 58.7 |
| | 94 |
|
| Washington | 0.2 |
| | 44 |
| | 317.42 |
| | 49 |
| | 359.87 |
| | 113.4 |
| | (5 | ) | — |
| | 44 |
| | 656.70 |
| | 34 |
| | 518.75 |
| | 79.0 |
| | 10 |
|
Other (1) | 0.4 |
| | 127 |
| | 304.00 |
| | 161 |
| | 383.02 |
| | 126.0 |
| | (34 | ) | — |
| | 2 |
| | NM |
| | (1 | ) | | NM |
| | NM | | 3 |
|
| | 2.8 |
| | $ | 769 |
| | $ | 267.37 |
| | $ | 783 |
| | $ | 272.37 |
| | 101.9 | % | | $ | (14 | ) | 1.2 |
| | $ | 456 |
| | $ | 394.02 |
| | $ | 292 |
| | $ | 252.61 |
| | 64.1 | % | | $ | 164 |
|
| | | | Six Months Ended June 30, 2018 | Three Months Ended September 30, 2017 |
| | Member
Months | | Premium Revenue | | Medical Care Costs | | MCR | | Medical Margin | Member
Months | | Premium Revenue | | Medical Care Costs | | MCR | | Medical Margin |
| | | Total | | PMPM | | Total | | PMPM | | | Total | | PMPM | | Total | | PMPM | |
| California | 0.4 |
| | $ | 122 |
| | $ | 334.47 |
| | $ | 52 |
| | $ | 141.73 |
| | 42.4 | % | | $ | 70 |
| 0.3 |
| | $ | 88 |
| | $ | 208.19 |
| | $ | 63 |
| | $ | 147.87 |
| | 71.0 | % | | $ | 25 |
|
| Florida | 0.3 |
| | 145 |
| | 468.36 |
| | 22 |
| | 73.13 |
| | 15.6 |
| | 123 |
| 0.9 |
| | 260 |
| | 313.36 |
| | 235 |
| | 283.13 |
| | 90.4 |
| | 25 |
|
| Michigan | 0.1 |
| | 28 |
| | 254.69 |
| | 16 |
| | 145.49 |
| | 57.1 |
| | 12 |
| — |
| | 14 |
| | 212.08 |
| | 10 |
| | 150.24 |
| | 70.8 |
| | 4 |
|
| New Mexico | 0.1 |
| | 65 |
| | 429.19 |
| | 37 |
| | 246.77 |
| | 57.5 |
| | 28 |
| 0.1 |
| | 29 |
| | 383.58 |
| | 20 |
| | 269.28 |
| | 70.2 |
| | 9 |
|
| Ohio | 0.1 |
| | 57 |
| | 458.48 |
| | 40 |
| | 319.53 |
| | 69.7 |
| | 17 |
| 0.1 |
| | 23 |
| | 386.09 |
| | 20 |
| | 364.31 |
| | 94.4 |
| | 3 |
|
| Texas | 1.4 |
| | 451 |
| | 318.93 |
| | 306 |
| | 216.83 |
| | 68.0 |
| | 145 |
| 0.7 |
| | 183 |
| | 291.14 |
| | 109 |
| | 172.70 |
| | 59.3 |
| | 74 |
|
| Washington | 0.2 |
| | 95 |
| | 653.89 |
| | 71 |
| | 486.90 |
| | 74.5 |
| | 24 |
| 0.1 |
| | 42 |
| | 327.40 |
| | 33 |
| | 256.52 |
| | 78.3 |
| | 9 |
|
Other (1) | — |
| | 15 |
| | NM |
| | (12 | ) | | NM |
| | NM | | 27 |
| 0.5 |
| | 144 |
| | 375.83 |
| | 100 |
| | 259.15 |
| | 69.0 |
| | 44 |
|
| | 2.6 |
| | $ | 978 |
| | $ | 373.67 |
| | $ | 532 |
| | $ | 203.34 |
| | 54.4 | % | | $ | 446 |
| 2.7 |
| | $ | 783 |
| | $ | 301.72 |
| | $ | 590 |
| | $ | 227.22 |
| | 75.3 | % | | $ | 193 |
|
| | | | Six Months Ended June 30, 2017 | Nine Months Ended September 30, 2018 |
| | Member
Months | | Premium Revenue | | Medical Care Costs | | MCR | | Medical Margin | Member
Months | | Premium Revenue | | Medical Care Costs | | MCR | | Medical Margin |
| | | Total | | PMPM | | Total | | PMPM | | | Total | | PMPM | | Total | | PMPM | |
| California | 0.9 |
| | $ | 153 |
| | $ | 185.68 |
| | $ | 93 |
| | $ | 112.20 |
| | 60.4 | % | | $ | 60 |
| 0.6 |
| | $ | 171 |
| | $ | 326.82 |
| | $ | 89 |
| | $ | 169.98 |
| | 52.0 | % | | $ | 82 |
|
| Florida | 1.9 |
| | 561 |
| | 288.81 |
| | 523 |
| | 269.48 |
| | 93.3 |
| | 38 |
| 0.5 |
| | 211 |
| | 491.13 |
| | 67 |
| | 155.24 |
| | 31.6 |
| | 144 |
|
| Michigan | 0.2 |
| | 27 |
| | 177.12 |
| | 17 |
| | 116.21 |
| | 65.6 |
| | 10 |
| 0.1 |
| | 40 |
| | 248.24 |
| | 23 |
| | 145.38 |
| | 58.6 |
| | 17 |
|
| New Mexico | 0.1 |
| | 53 |
| | 317.10 |
| | 42 |
| | 249.90 |
| | 78.8 |
| | 11 |
| 0.2 |
| | 93 |
| | 426.07 |
| | 55 |
| | 247.57 |
| | 58.1 |
| | 38 |
|
| Ohio | 0.1 |
| | 45 |
| | 356.20 |
| | 44 |
| | 339.26 |
| | 95.2 |
| | 1 |
| 0.2 |
| | 84 |
| | 466.75 |
| | 58 |
| | 324.91 |
| | 69.6 |
| | 26 |
|
| Texas | 1.4 |
| | 334 |
| | 235.07 |
| | 242 |
| | 171.07 |
| | 72.8 |
| | 92 |
| 2.0 |
| | 679 |
| | 330.92 |
| | 440 |
| | 214.65 |
| | 64.9 |
| | 239 |
|
| Washington | 0.3 |
| | 81 |
| | 310.26 |
| | 95 |
| | 362.78 |
| | 116.9 |
| | (14 | ) | 0.2 |
| | 139 |
| | 654.78 |
| | 105 |
| | 497.00 |
| | 75.9 |
| | 34 |
|
Other (1) | 0.8 |
| | 266 |
| | 313.77 |
| | 291 |
| | 342.88 |
| | 109.3 |
| | (25 | ) | — |
| | 17 |
| | NM |
| | (13 | ) | | NM |
| | NM | | 30 |
|
| | 5.7 |
| | $ | 1,520 |
| | $ | 264.77 |
| | $ | 1,347 |
| | $ | 234.62 |
| | 88.6 | % | | $ | 173 |
| 3.8 |
| | $ | 1,434 |
| | $ | 379.91 |
| | $ | 824 |
| | $ | 218.44 |
| | 57.5 | % | | $ | 610 |
|
|
| | | | | | | | | | | | | | | | | | | | | | | | | |
| | Nine Months Ended September 30, 2017 |
| | Member
Months | | Premium Revenue | | Medical Care Costs | | MCR | | Medical Margin |
| | | Total | | PMPM | | Total | | PMPM | | |
| California | 1.2 |
| | $ | 241 |
| | $ | 193.33 |
| | $ | 156 |
| | $ | 124.32 |
| | 64.3 | % | | $ | 85 |
|
| Florida | 2.8 |
| | 821 |
| | 296.14 |
| | 758 |
| | 273.55 |
| | 92.4 |
| | 63 |
|
| Michigan | 0.2 |
| | 41 |
| | 187.96 |
| | 27 |
| | 126.76 |
| | 67.4 |
| | 14 |
|
| New Mexico | 0.2 |
| | 82 |
| | 338.18 |
| | 62 |
| | 256.05 |
| | 75.7 |
| | 20 |
|
| Ohio | 0.2 |
| | 68 |
| | 365.35 |
| | 64 |
| | 346.93 |
| | 95.0 |
| | 4 |
|
| Texas | 2.1 |
| | 517 |
| | 252.32 |
| | 351 |
| | 171.57 |
| | 68.0 |
| | 166 |
|
| Washington | 0.4 |
| | 123 |
| | 315.95 |
| | 128 |
| | 327.51 |
| | 103.7 |
| | (5 | ) |
Other (1) | 1.3 |
| | 410 |
| | 333.05 |
| | 391 |
| | 316.86 |
| | 95.1 |
| | 19 |
|
| | 8.4 |
| | $ | 2,303 |
| | $ | 276.27 |
| | $ | 1,937 |
| | $ | 232.31 |
| | 84.1 | % | | $ | 366 |
|
_________________________
| |
| (1) | “Other” includes the Utah and Wisconsin health plans, which are not individually significant to our consolidated operating results. We terminated Marketplace operations at these plans effective January 1, 2018, so the ratios for 2018 periods are not meaningful (NM). |
Health Plans Segment Financial Data — Total
| | | | Three Months Ended June 30, 2018 | Three Months Ended September 30, 2018 |
| | Member Months | | Premium Revenue | | Medical Care Costs | | MCR | | Medical Margin | Member Months | | Premium Revenue | | Medical Care Costs | | MCR | | Medical Margin |
| | | Total | | PMPM | | Total | | PMPM | | | Total | | PMPM | | Total | | PMPM | |
| California | 2.0 |
| | $ | 590 |
| | $ | 301.73 |
| | $ | 462 |
| | $ | 236.04 |
| | 78.2 | % | | $ | 128 |
| 1.9 |
| | $ | 484 |
| | $ | 253.96 |
| | $ | 483 |
| | $ | 253.60 |
| | 99.9 | % | | $ | 1 |
|
| Florida | 1.3 |
| | 477 |
| | 394.38 |
| | 400 |
| | 331.13 |
| | 84.0 |
| | 77 |
| 1.2 |
| | 454 |
| | 382.20 |
| | 407 |
| | 341.70 |
| | 89.4 |
| | 47 |
|
| Illinois | 0.6 |
| | 203 |
| | 311.60 |
| | 170 |
| | 261.59 |
| | 84.0 |
| | 33 |
| 0.7 |
| | 207 |
| | 312.72 |
| | 182 |
| | 274.98 |
| | 87.9 |
| | 25 |
|
| Michigan | 1.2 |
| | 403 |
| | 340.08 |
| | 338 |
| | 285.78 |
| | 84.0 |
| | 65 |
| 1.1 |
| | 409 |
| | 345.28 |
| | 328 |
| | 276.88 |
| | 80.2 |
| | 81 |
|
| New Mexico | 0.7 |
| | 344 |
| | 464.90 |
| | 308 |
| | 416.99 |
| | 89.7 |
| | 36 |
| 0.7 |
| | 332 |
| | 466.63 |
| | 293 |
| | 409.68 |
| | 87.8 |
| | 39 |
|
| Ohio | 1.0 |
| | 566 |
| | 567.96 |
| | 505 |
| | 506.66 |
| | 89.2 |
| | 61 |
| 1.0 |
| | 611 |
| | 616.95 |
| | 550 |
| | 555.83 |
| | 90.1 |
| | 61 |
|
| Puerto Rico | 0.9 |
| | 184 |
| | 188.26 |
| | 165 |
| | 168.20 |
| | 89.3 |
| | 19 |
| 1.0 |
| | 179 |
| | 189.65 |
| | 162 |
| | 171.96 |
| | 90.7 |
| | 17 |
|
| South Carolina | 0.4 |
| | 123 |
| | 350.22 |
| | 107 |
| | 304.20 |
| | 86.9 |
| | 16 |
| 0.4 |
| | 124 |
| | 354.53 |
| | 112 |
| | 318.56 |
| | 89.9 |
| | 12 |
|
| Texas | 1.4 |
| | 798 |
| | 585.50 |
| | 670 |
| | 492.23 |
| | 84.1 |
| | 128 |
| 1.3 |
| | 805 |
| | 611.01 |
| | 659 |
| | 500.14 |
| | 81.9 |
| | 146 |
|
| Washington | 2.4 |
| | 627 |
| | 268.84 |
| | 567 |
| | 242.80 |
| | 90.3 |
| | 60 |
| 2.3 |
| | 555 |
| | 239.25 |
| | 478 |
| | 206.38 |
| | 86.3 |
| | 77 |
|
Other (1) | 0.5 |
| | 199 |
| | 360.90 |
| | 158 |
| | 285.65 |
| | 79.1 |
| | 41 |
| 0.5 |
| | 177 |
| | 336.18 |
| | 136 |
| | 260.19 |
| | 77.4 |
| | 41 |
|
| | 12.4 |
| | $ | 4,514 |
| | $ | 366.57 |
| | $ | 3,850 |
| | $ | 312.68 |
| | 85.3 | % | | $ | 664 |
| 12.1 |
| | $ | 4,337 |
| | $ | 358.46 |
| | $ | 3,790 |
| | $ | 313.23 |
| | 87.4 | % | | $ | 547 |
|
|
| | | | | | | | | | | | | | | | | | | | | | | | | |
| | Three Months Ended September 30, 2017 |
| | Member Months | | Premium Revenue | | Medical Care Costs | | MCR | | Medical Margin |
| | | Total | | PMPM | | Total | | PMPM | | |
| California | 2.2 |
| | $ | 689 |
| | $ | 301.64 |
| | $ | 626 |
| | $ | 273.90 |
| | 90.8 | % | | $ | 63 |
|
| Florida | 1.9 |
| | 648 |
| | 337.40 |
| | 625 |
| | 325.09 |
| | 96.4 |
| | 23 |
|
| Illinois | 0.5 |
| | 137 |
| | 287.69 |
| | 138 |
| | 289.36 |
| | 100.6 |
| | (1 | ) |
| Michigan | 1.2 |
| | 404 |
| | 330.27 |
| | 355 |
| | 290.63 |
| | 88.0 |
| | 49 |
|
| New Mexico | 0.8 |
| | 333 |
| | 424.61 |
| | 297 |
| | 378.98 |
| | 89.3 |
| | 36 |
|
| Ohio | 1.0 |
| | 572 |
| | 550.75 |
| | 503 |
| | 485.61 |
| | 88.2 |
| | 69 |
|
| Puerto Rico | 1.0 |
| | 191 |
| | 202.59 |
| | 159 |
| | 168.25 |
| | 83.1 |
| | 32 |
|
| South Carolina | 0.3 |
| | 113 |
| | 332.48 |
| | 101 |
| | 297.74 |
| | 89.6 |
| | 12 |
|
| Texas | 1.4 |
| | 724 |
| | 546.57 |
| | 615 |
| | 463.83 |
| | 84.9 |
| | 109 |
|
| Washington | 2.4 |
| | 654 |
| | 279.52 |
| | 555 |
| | 237.23 |
| | 84.9 |
| | 99 |
|
Other (1) | 1.0 |
| | 312 |
| | 327.47 |
| | 246 |
| | 257.86 |
| | 78.7 |
| | 66 |
|
| | 13.7 |
| | $ | 4,777 |
| | $ | 350.55 |
| | $ | 4,220 |
| | $ | 309.68 |
| | 88.3 | % | | $ | 557 |
|
|
| | | | | | | | | | | | | | | | | | | | | | | | | |
| | Nine Months Ended September 30, 2018 |
| | Member Months | | Premium Revenue | | Medical Care Costs | | MCR | | Medical Margin |
| | | Total | | PMPM | | Total | | PMPM | | |
| California | 5.9 |
| | $ | 1,617 |
| | $ | 275.64 |
| | $ | 1,388 |
| | $ | 236.61 |
| | 85.8 | % | | $ | 229 |
|
| Florida | 3.7 |
| | 1,358 |
| | 372.07 |
| | 1,136 |
| | 311.09 |
| | 83.6 |
| | 222 |
|
| Illinois | 1.8 |
| | 551 |
| | 308.45 |
| | 474 |
| | 265.47 |
| | 86.1 |
| | 77 |
|
| Michigan | 3.5 |
| | 1,201 |
| | 338.83 |
| | 1,006 |
| | 283.77 |
| | 83.7 |
| | 195 |
|
| New Mexico | 2.2 |
| | 1,029 |
| | 464.92 |
| | 930 |
| | 419.78 |
| | 90.3 |
| | 99 |
|
| Ohio | 3.0 |
| | 1,754 |
| | 583.29 |
| | 1,532 |
| | 509.52 |
| | 87.4 |
| | 222 |
|
| Puerto Rico | 2.9 |
| | 549 |
| | 190.34 |
| | 501 |
| | 173.83 |
| | 91.3 |
| | 48 |
|
| South Carolina | 1.1 |
| | 369 |
| | 350.94 |
| | 323 |
| | 306.76 |
| | 87.4 |
| | 46 |
|
| Texas | 4.1 |
| | 2,394 |
| | 581.74 |
| | 1,994 |
| | 484.70 |
| | 83.3 |
| | 400 |
|
| Washington | 7.0 |
| | 1,805 |
| | 257.82 |
| | 1,649 |
| | 235.59 |
| | 91.4 |
| | 156 |
|
Other (1) | 1.6 |
| | 547 |
| | 334.26 |
| | 429 |
| | 262.27 |
| | 78.5 |
| | 118 |
|
| | 36.8 |
| | $ | 13,174 |
| | $ | 358.42 |
| | $ | 11,362 |
| | $ | 309.12 |
| | 86.2 | % | | $ | 1,812 |
|
|
| | | | | | | | | | | | | | | | | | | | | | | | | |
| | Three Months Ended June 30, 2017 |
| | Member Months | | Premium Revenue | | Medical Care Costs | | MCR | | Medical Margin |
| | | Total | | PMPM | | Total | | PMPM | | |
| California | 2.4 |
| | $ | 679 |
| | $ | 294.09 |
| | $ | 606 |
| | $ | 262.34 |
| | 89.2 | % | | $ | 73 |
|
| Florida | 2.0 |
| | 649 |
| | 318.21 |
| | 687 |
| | 337.39 |
| | 106.0 |
| | (38 | ) |
| Illinois | 0.5 |
| | 149 |
| | 289.51 |
| | 174 |
| | 336.76 |
| | 116.3 |
| | (25 | ) |
| Michigan | 1.2 |
| | 406 |
| | 325.38 |
| | 368 |
| | 295.06 |
| | 90.7 |
| | 38 |
|
| New Mexico | 0.8 |
| | 352 |
| | 435.34 |
| | 334 |
| | 411.83 |
| | 94.6 |
| | 18 |
|
| Ohio | 1.0 |
| | 553 |
| | 527.14 |
| | 516 |
| | 490.75 |
| | 93.1 |
| | 37 |
|
| Puerto Rico | 0.9 |
| | 179 |
| | 184.28 |
| | 189 |
| | 194.42 |
| | 105.5 |
| | (10 | ) |
| South Carolina | 0.4 |
| | 111 |
| | 326.57 |
| | 102 |
| | 304.14 |
| | 93.1 |
| | 9 |
|
| Texas | 1.4 |
| | 701 |
| | 495.93 |
| | 602 |
| | 426.41 |
| | 86.0 |
| | 99 |
|
| Washington | 2.4 |
| | 662 |
| | 279.21 |
| | 595 |
| | 251.16 |
| | 90.0 |
| | 67 |
|
Other (1) | 1.0 |
| | 299 |
| | 298.29 |
| | 318 |
| | 316.89 |
| | 106.2 |
| | (19 | ) |
| | 14.0 |
| | $ | 4,740 |
| | $ | 336.98 |
| | $ | 4,491 |
| | $ | 319.29 |
| | 94.8 | % | | $ | 249 |
|
|
| | | | | | | | | | | | | | | | | | | | | | | | | |
| | Six Months Ended June 30, 2018 |
| | Member Months | | Premium Revenue | | Medical Care Costs | | MCR | | Medical Margin |
| | | Total | | PMPM | | Total | | PMPM | | |
| California | 4.0 |
| | $ | 1,133 |
| | $ | 286.07 |
| | $ | 905 |
| | $ | 228.44 |
| | 79.9 | % | | $ | 228 |
|
| Florida | 2.5 |
| | 904 |
| | 367.18 |
| | 729 |
| | 296.29 |
| | 80.7 |
| | 175 |
|
| Illinois | 1.1 |
| | 344 |
| | 305.94 |
| | 292 |
| | 259.87 |
| | 84.9 |
| | 52 |
|
| Michigan | 2.4 |
| | 792 |
| | 335.59 |
| | 678 |
| | 287.23 |
| | 85.6 |
| | 114 |
|
| New Mexico | 1.5 |
| | 697 |
| | 464.11 |
| | 637 |
| | 424.58 |
| | 91.5 |
| | 60 |
|
| Ohio | 2.0 |
| | 1,143 |
| | 566.77 |
| | 982 |
| | 486.79 |
| | 85.9 |
| | 161 |
|
| Puerto Rico | 1.9 |
| | 370 |
| | 190.68 |
| | 339 |
| | 174.74 |
| | 91.6 |
| | 31 |
|
| South Carolina | 0.7 |
| | 245 |
| | 349.15 |
| | 211 |
| | 300.87 |
| | 86.2 |
| | 34 |
|
| Texas | 2.8 |
| | 1,589 |
| | 567.95 |
| | 1,335 |
| | 477.43 |
| | 84.1 |
| | 254 |
|
| Washington | 4.7 |
| | 1,250 |
| | 267.01 |
| | 1,171 |
| | 250.05 |
| | 93.6 |
| | 79 |
|
Other (1) | 1.1 |
| | 370 |
| | 333.35 |
| | 293 |
| | 263.24 |
| | 79.0 |
| | 77 |
|
| | 24.7 |
| | $ | 8,837 |
| | $ | 358.40 |
| | $ | 7,572 |
| | $ | 307.11 |
| | 85.7 | % | | $ | 1,265 |
|
| | | | Six Months Ended June 30, 2017 | Nine Months Ended September 30, 2017 |
| | Member Months | | Premium Revenue | | Medical Care Costs | | MCR | | Medical Margin | Member Months | | Premium Revenue | | Medical Care Costs | | MCR | | Medical Margin |
| | | Total | | PMPM | | Total | | PMPM | | | Total | | PMPM | | Total | | PMPM | |
| California | 4.6 |
| | $ | 1,323 |
| | $ | 290.56 |
| | $ | 1,116 |
| | $ | 245.02 |
| | 84.3 | % | | $ | 207 |
| 6.8 |
| | $ | 2,012 |
| | $ | 294.26 |
| | $ | 1,742 |
| | $ | 254.67 |
| | 86.5 | % | | $ | 270 |
|
| Florida | 4.1 |
| | 1,305 |
| | 317.53 |
| | 1,245 |
| | 303.09 |
| | 95.5 |
| | 60 |
| 6.0 |
| | 1,953 |
| | 323.86 |
| | 1,870 |
| | 310.09 |
| | 95.7 |
| | 83 |
|
| Illinois | 1.1 |
| | 310 |
| | 282.66 |
| | 354 |
| | 322.63 |
| | 114.1 |
| | (44 | ) | 1.6 |
| | 447 |
| | 284.18 |
| | 492 |
| | 312.54 |
| | 110.0 |
| | (45 | ) |
| Michigan | 2.5 |
| | 799 |
| | 321.10 |
| | 707 |
| | 284.24 |
| | 88.5 |
| | 92 |
| 3.7 |
| | 1,203 |
| | 324.12 |
| | 1,062 |
| | 286.35 |
| | 88.3 |
| | 141 |
|
| New Mexico | 1.6 |
| | 682 |
| | 421.11 |
| | 652 |
| | 402.27 |
| | 95.5 |
| | 30 |
| 2.4 |
| | 1,015 |
| | 422.25 |
| | 949 |
| | 394.66 |
| | 93.5 |
| | 66 |
|
| Ohio | 2.1 |
| | 1,094 |
| | 521.57 |
| | 995 |
| | 473.95 |
| | 90.9 |
| | 99 |
| 3.1 |
| | 1,666 |
| | 531.17 |
| | 1,498 |
| | 477.81 |
| | 90.0 |
| | 168 |
|
| Puerto Rico | 1.9 |
| | 362 |
| | 185.40 |
| | 354 |
| | 181.24 |
| | 97.8 |
| | 8 |
| 2.9 |
| | 553 |
| | 190.99 |
| | 513 |
| | 177.01 |
| | 92.7 |
| | 40 |
|
| South Carolina | 0.7 |
| | 216 |
| | 321.85 |
| | 200 |
| | 298.79 |
| | 92.8 |
| | 16 |
| 1.0 |
| | 329 |
| | 325.43 |
| | 301 |
| | 298.43 |
| | 91.7 |
| | 28 |
|
| Texas | 2.8 |
| | 1,385 |
| | 491.46 |
| | 1,204 |
| | 427.48 |
| | 87.0 |
| | 181 |
| 4.2 |
| | 2,109 |
| | 509.09 |
| | 1,819 |
| | 439.11 |
| | 86.3 |
| | 290 |
|
| Washington | 4.7 |
| | 1,304 |
| | 276.99 |
| | 1,176 |
| | 249.79 |
| | 90.2 |
| | 128 |
| 7.1 |
| | 1,958 |
| | 277.83 |
| | 1,731 |
| | 245.62 |
| | 88.4 |
| | 227 |
|
Other (1) | 2.0 |
| | 608 |
| | 301.11 |
| | 599 |
| | 296.58 |
| | 98.5 |
| | 9 |
| 3.0 |
| | 920 |
| | 309.56 |
| | 845 |
| | 284.16 |
| | 91.8 |
| | 75 |
|
| | 28.1 |
| | $ | 9,388 |
| | $ | 333.68 |
| | $ | 8,602 |
| | $ | 305.74 |
| | 91.6 | % | | $ | 786 |
| 41.8 |
| | $ | 14,165 |
| | $ | 339.19 |
| | $ | 12,822 |
| | $ | 307.03 |
| | 90.5 | % | | $ | 1,343 |
|
__________________
| |
| (1) | “Other” includes the Idaho, New York, Utah and Wisconsin health plans, which are not individually significant to our consolidated operating results. |
MEDICAL CARE COSTS BY TYPE
The following table provides the details of consolidated medical care costs by category for the periods indicated (dollars in millions except PMPM amounts):
| | | | Three Months Ended June 30, | Three Months Ended September 30, |
| | 2018 | | 2017 | 2018 | | 2017 |
| | Amount | | PMPM | | % of Total | | Amount | | PMPM | | % of Total | Amount | | PMPM | | % of Total | | Amount | | PMPM | | % of Total |
| Fee for service | $ | 2,861 |
| | $ | 232.40 |
| | 74.4 | % | | $ | 3,348 |
| | $ | 238.04 |
| | 74.5 | % | $ | 2,865 |
| | $ | 236.74 |
| | 75.6 | % | | $ | 3,196 |
| | $ | 234.51 |
| | 75.8 | % |
| Pharmacy | 567 |
| | 46.05 |
| | 14.7 |
| | 650 |
| | 46.23 |
| | 14.5 |
| 495 |
| | 40.90 |
| | 13.1 |
| | 638 |
| | 46.85 |
| | 15.1 |
|
| Capitation | 282 |
| | 22.89 |
| | 7.3 |
| | 356 |
| | 25.29 |
| | 7.9 |
| 297 |
| | 24.52 |
| | 7.8 |
| | 342 |
| | 25.07 |
| | 8.1 |
|
| Other | 140 |
| | 11.34 |
| | 3.6 |
| | 137 |
| | 9.73 |
| | 3.1 |
| 133 |
| | 11.07 |
| | 3.5 |
| | 44 |
| | 3.25 |
| | 1.0 |
|
| | $ | 3,850 |
| | $ | 312.68 |
| | 100.0 | % | | $ | 4,491 |
| | $ | 319.29 |
| | 100.0 | % | $ | 3,790 |
| | $ | 313.23 |
| | 100.0 | % | | $ | 4,220 |
| | $ | 309.68 |
| | 100.0 | % |
|
| | | | | | | | | | | | | | | | | | | | | |
| | Six Months Ended June 30, |
| | 2018 | | 2017 |
| | Amount | | PMPM | | % of Total | | Amount | | PMPM | | % of Total |
| Fee for service | $ | 5,606 |
| | $ | 227.38 |
| | 74.1 | % | | $ | 6,434 |
| | $ | 228.68 |
| | 74.8 | % |
| Pharmacy | 1,150 |
| | 46.66 |
| | 15.2 |
| | 1,266 |
| | 45.00 |
| | 14.7 |
|
| Capitation | 594 |
| | 24.09 |
| | 7.8 |
| | 680 |
| | 24.17 |
| | 7.9 |
|
| Other | 222 |
| | 8.98 |
| | 2.9 |
| | 222 |
| | 7.89 |
| | 2.6 |
|
| | $ | 7,572 |
| | $ | 307.11 |
| | 100.0 | % | | $ | 8,602 |
| | $ | 305.74 |
| | 100.0 | % |
PREMIUM TAXES
The premium tax ratio (premium tax expense as a percentage of premium revenue plus premium tax revenue) was 2.3% in the second quarter of 2018 compared with 2.4% in the second quarter of 2017 and 2.3% in both the six months ended June 30, 2018 and 2017.
HEALTH INSURER FEES (HIF)
Health insurer fees reimbursed amounted to $104 million and $165 million, and health insurer fees amounted to $99 million and $174 million, in the second quarter of 2018 and the six months ended June 30, 2018, respectively. In the second quarter of 2018, we recognized revenue related to the reimbursement of Medicaid health insurer fees from New Mexico, New York, and Puerto Rico, because we received adequate documentation of the intent to reimburse such fees.
There were no HIF reimbursed or expensed in 2017 due to the HIF moratorium under the Consolidated Appropriations Act of 2016. |
| | | | | | | | | | | | | | | | | | | | | |
| | Nine Months Ended September 30, |
| | 2018 | | 2017 |
| | Amount | | PMPM | | % of Total | | Amount | | PMPM | | % of Total |
| Fee for service | $ | 8,471 |
| | $ | 230.46 |
| | 74.6 | % | | $ | 9,630 |
| | $ | 230.58 |
| | 75.1 | % |
| Pharmacy | 1,645 |
| | 44.76 |
| | 14.5 |
| | 1,904 |
| | 45.60 |
| | 14.8 |
|
| Capitation | 891 |
| | 24.23 |
| | 7.8 |
| | 1,022 |
| | 24.47 |
| | 8.0 |
|
| Other | 355 |
| | 9.67 |
| | 3.1 |
| | 266 |
| | 6.38 |
| | 2.1 |
|
| | $ | 11,362 |
| | $ | 309.12 |
| | 100.0 | % | | $ | 12,822 |
| | $ | 307.03 |
| | 100.0 | % |
MOLINA MEDICAID SOLUTIONS
The Molina Medicaid Solutions segment provides support to state government agencies’ administrationWe closed on the sale of their Medicaid programs, including business processing, information technology development and administrative services.
In June 2018, we entered into a definitive agreement to sell Molina Medicaid Solutions (MMS)MMS to DXC Technology Company. The divestiture, expected to close in the third quarter of 2018, is subject to the satisfaction of customary closing conditions and the receipt of certain third party consents and regulatory approvals.Company on September 30, 2018.
FINANCIAL OVERVIEW
The Molina Medicaid Solutions segment service margin for the secondthird quarter of 2018 and 2017 and for the sixnine months ended JuneSeptember 30, 2018 and 2017, was insignificant.
OTHER
The Other segment includes primarily our Pathways behavioral health and social services provider, and corporate amounts not allocated to other reportable segments.
We sold our Pathways subsidiary on October 19, 2018. See further information in the Notes to Consolidated Financial Statements, Note 1. “Organization and Basis of Presentation.”
FINANCIAL OVERVIEW
The Other segment service margin for the secondthird quarter of 2018 and 2017 and for the sixnine months ended JuneSeptember 30, 2018 and 2017, was insignificant.
OTHER CONSOLIDATED INFORMATION
GENERAL AND ADMINISTRATIVE EXPENSES
The G&A ratio decreased to 6.9% in the second quarter of 2018, compared with 8.1% in the second quarter of 2017. The G&A ratio decreased to 7.2% for the six months ended June 30, 2018, compared with 8.5% for the six months ended June 30, 2017. Refer to the discussion above, in “Consolidated Results.”
IMPAIRMENT LOSSES
No impairment losses were recorded in the first half of 2018.
In the second quarter of 2017, we recorded $72 million in non-cash impairment losses for goodwill and intangibles, primarily relating to our Pathways subsidiary. In the course of developing the 2017 Restructuring Plan, we determined that future benefits to be derived from Pathways (including integration with our health plans) would be less than previously anticipated.
RESTRUCTURING AND SEPARATION COSTS
See Notes to Consolidated Financial Statements, Note 10, “Restructuring and Separation Costs.”
INTEREST EXPENSE
Interest expense was $32 million for the second quarter of 2018, compared with $27 million for the second quarter of 2017. Interest expense was $65 million for the six months ended June 30, 2018, compared with $53 million for the six months ended June 30, 2017. As further described below in “Liquidity,” year to date we have reduced the principal amount of outstanding debt by $493 million.
Interest expense includes non-cash interest expense relating primarily to the amortization of the discount on convertible senior notes, which amounted to $6 million and $8 million in the second quarter of 2018 and 2017, respectively and $13 million and $16 million in the six months ended June 30, 2018 and 2017, respectively. See further discussion in Notes to Consolidated Financial Statements, Note 7, “Debt.”
OTHER EXPENSES (INCOME), NET
In the six months ended June 30, 2018, we recorded other expenses of $15 million due to the loss on debt extinguishment resulting from our 1.125% Convertible Notes repayments and the 1.625% Exchange. These transactions are described further in Notes to Consolidated Financial Statements, Note 7, “Debt.” In February of 2017, we received a $75 million fee in connection with a terminated Medicare acquisition.
INCOME TAXES
The provision for income taxes was recorded at an effective rate of 33.8% for the second quarter of 2018, compared with a benefit of 26.8% for the second quarter of 2017, and 36.2% for the six months ended June 30, 2018, compared with a benefit of 16.0% for the six months ended June 30, 2017. The effective tax rate for 2018 differs from 2017 as a result of the reduction in the federal statutory rate from 35% to 21% under the TCJA, combined with higher non-deductible expenses in 2018 primarily related to the non-deductible HIF as a percentage of pre-tax income (loss). The HIF was not applicable in 2017 due to the 2017 HIF moratorium.
LIQUIDITY AND FINANCIAL CONDITION
INTRODUCTION
We manage our cash, investments, and capital structure to meet the short- and long-term obligations of our business while maintaining liquidity and financial flexibility. We forecast, analyze, and monitor our cash flows to enable prudent investment management and financing within the confines of our financial strategy.
A majority of the assets held by our Health Plans segment regulated subsidiaries is in the form of cash, cash equivalents, and investments. After considering expected cash flows from operating activities, we generally invest cash of regulated subsidiaries that exceeds our expected short-term obligations in longer term, investment-grade, and marketable debt securities to improve our overall investment return. These investments are made pursuant to board-approved investment policies that conform to applicable state laws and regulations.
Our investments are classified as current assets, except for our held-to-maturity restricted investments, which are classified as non-current assets, and which are not included in the totals below. Our held-to-maturity restricted investments are invested principally in certificates of deposit and U.S. treasury securities.
Investment income increased to $42 million for the six months ended June 30, 2018, compared with $22 million for the six months ended June 30, 2017, primarily due to increases in our average invested assets, and in our annualized portfolio yield.
MARKET RISK
Our earnings and financial position are exposed to financial market risk relating to changes in interest rates, and the resulting impact on investment income and interest expense.
Substantially all of our investments and restricted investments are subject to interest rate risk and will decrease in value if market interest rates increase. Assuming a hypothetical and immediate 1% increase in market interest rates at JuneSeptember 30, 2018, the fair value of our fixed income investments would decrease by approximately $19$16 million. Declines in interest rates over time will reduce our investment income.
For further information on fair value measurements and our investment portfolio, please refer to Notes to Consolidated Financial Statements, Note 4, “Fair Value Measurements,” and Note 5, “Investments.”
Borrowings under our Credit Facility bear interest based, at our election, on a base rate or an adjusted London Interbank Offered Rate (LIBOR), plus in each case the applicable margin. As of JuneSeptember 30, 2018, no amounts were outstanding under the Credit Facility.
LIQUIDITY
A condensed schedule of cash flows to facilitate our discussion of liquidity follows:
| | | | Six Months Ended June 30, | Nine Months Ended September 30, |
| | 2018 | | 2017 | | Change | 2018 | | 2017 | | Change |
| | (In millions) | (In millions) |
| Net cash provided by operating activities | $ | 314 |
| | $ | 672 |
| | $ | (358 | ) | |
| Net cash (used in) provided by operating activities | | $ | (191 | ) | | $ | 957 |
| | $ | (1,148 | ) |
| Net cash provided by (used in) investing activities | 398 |
| | (846 | ) | | 1,244 |
| 821 |
| | (476 | ) | | 1,297 |
|
| Net cash (used in) provided by financing activities | (503 | ) | | 333 |
| | (836 | ) | (1,012 | ) | | 632 |
| | (1,644 | ) |
| Net increase in cash, cash equivalents, and restricted cash and cash equivalents | $ | 209 |
| | $ | 159 |
| | $ | 50 |
| |
| Net (decrease) increase in cash, cash equivalents, and restricted cash and cash equivalents | | $ | (382 | ) | | $ | 1,113 |
| | $ | (1,495 | ) |
Operating Activities
Net cash provided by operating activities decreased $358 million in the six months ended June 30, 2018, compared with the six months ended June 30, 2017. Increased net income of $462 million was offset by the following:
Receivables and deferred revenue. The aggregate year-over-year change in receivables and deferred revenue reduced cash flows from operations by $293 million. Cash flows from operations in each period were impacted by the timing of premium receipts, including health insurer fees (HIF) to be reimbursed in 2018. In general, state or federal payors may delay our premium payments, which we record as a receivable, or they may prepay the following month’s premium payment, which we record as deferred revenue. We typically receive capitation payments monthly;monthly, in advance of payments for medical claims; however, state or federal payors may decide to adjust their payment schedules which could positively or negatively impact our reported cash flows from operating activities in any given period. InState or federal payors may delay our premium payments, or they may prepay the following month’s premium payment.
Net cash used in operations for the nine months ended September 30, 2018, was $191 million, compared with $957 million of net cash provided for the year-over-yearnine months ended September 30, 2017. The year over year decline was mainly due to the following:
The timing effect of premium receipts and other revenues negatively impacted our cash flows from operating activities by $687 million on a year-over-year comparative basis. This impact was mainly related to the timing of premiums received at our California, Florida, Ohio, and Washington health plans negatively impacted our cash flows from operating activities. In 2017, no receivables were recorded for the HIF due to the moratorium in that year.plans.
Prepaid expenses and other current assets, and accounts payable and accrued liabilities. Each of these accounts increased significantly in the six months ended June 30, 2018, primarily due to amounts recorded in connection with the reinstatement of the HIF in 2018, with no comparable activity in 2017.
Medical claims and benefits payable. In the six months ended June 30, 2018, the changeThe decline in medical claims and benefits payable, decreased cash flows from operations by $415 million, primarily due to the decline in reservesmainly resulting from reduced Marketplace membership in Florida, Utah, Washington and Wisconsin.
Amounts due government agencies. While amounts due government agencies increased $205 million in the six months ended June 30, 2018, this increase was less than the increase experienced in the six months ended June 30, 2017, resulting in a year over year reduction inWisconsin decreased cash flows from operations of $437 million. This decrease wasby $693 million.
Settlements with government agencies decreased our cash flows by $633 million on a year-over-year comparative basis, primarily due to a declinepayments in the amounts accrued forthird quarter of 2018, including risk transfer payments associated with our Marketplace CSR subsidies year over year.health plans.
The declines discussed above were partially offset by favorable timing differences in the settlement of various operating expenses, including the health insurer fee (HIF). The HIF payable of $348 million was paid on October 1, 2018, after receiving certain related state reimbursements. These favorable timing differences benefited our cash flows by $308 millionon a year-over-year comparative basis.
Investing Activities
InvestingNet cash provided by investing activities were a source of cash of $398was $821 million infor the sixnine months ended JuneSeptember 30, 2018, and a usecompared with $476 million of net cash of $846 millionused in investing activities for the sixnine months ended JuneSeptember 30, 2017. This wasThe year over year improvement is primarily due to reduced purchases of investments and higher proceeds from sales and maturities of investments, innet of purchases, for the sixnine months ended JuneSeptember 30, 2018, largely a result of thedriven by cash flow needs associated with our financing activities, as described below.
Financing Activities
Net cash used in financing activities increased $836was $1,012 million infor the sixnine months ended JuneSeptember 30, 2018, compared with $632 million of net cash provided by financing activities for the sixnine months ended JuneSeptember 30, 2017. The increase in cash used in the six months ended June 30, 2018year over year decline was mainly due to the following:
$300 million repayment of the Credit Facility;Facility in 2018;
$89236 million partial principal repayment of the 1.125% Convertible Notes;Notes in 2018;
$134477 million cash paid for partial settlement of the 1.125% Conversion Option; andOption in 2018;
$113419 million cash paid for partial termination of the 1.125% Warrants.Warrants in 2018;
$64 million principal repayment of 1.625% Notes in 2018; and
$625 million of proceeds from the sale of the 4.875% Notes and borrowings under the Credit Facility in 2017.
These uses of cash were partially offset by $134$477 million of cash received in the nine months ended September 30, 2018 for thea partial settlement of a portion of the 1.125% Call Option. In the six months ended June 30, 2017, we received proceeds of $325 million from the sale of the 4.875% Notes.
FINANCIAL CONDITION
We believe that our cash resources, our borrowing capacity available under our Bridge Credit Agreement and Credit Facility as discussed further below in “Future Sources and Uses of Liquidity—Future Sources,” and internally generated funds will be sufficient to support operations, regulatory requirements, debt repayment obligations and capital expenditures for at least the next 12 months.
On a consolidated basis, at JuneSeptember 30, 2018, our working capital was $2,207$2,088 million, compared with $1,954 million at December 31, 2017. At JuneSeptember 30, 2018, our cash and investments amounted to $5,767$4,746 million, compared with $6,000 million at December 31, 2017.
Because of the statutory restrictions that inhibit the ability of our health plans to transfer net assets to us, the amount of retained earnings readily available to pay dividends to our stockholders is generally limited to cash, cash equivalents and investments held by the parent company—Molina Healthcare, Inc. Such cash, cash equivalents and investments amounted to $350$505 million as of September 30, 2018, or $390 million when adjusted for the timing of the HIF payment and the proceeds received from the sale of MMS, both of which occurred on October 1, 2018. Parent company cash, cash equivalents and investments amounted to $696 million as of JuneDecember 31, 2017. The decrease is mainly attributed to reductions in the principal amount of outstanding debt, partially offset by net cash paid to the parent company by our subsidiaries.
In the nine months ended September 30, 2018, the regulated health plan subsidiaries paid $258 million in dividends to the parent, and December 31, 2017, respectively.our unregulated subsidiaries paid $10 million in dividends to the parent. In the nine months ended September 30, 2018, the parent company contributed capital of $122 million to our regulated health plan subsidiaries to satisfy statutory net worth requirements.
Debt Ratings. Ratings
Our 5.375% Notes are rated “BB-” by Standard & Poor’s, and “B3” by Moody’s Investor Service, Inc. A significant downgrade in our ratings could adversely affect our borrowing capacity and increase our borrowing costs.
Financial Covenants.Covenants
Our Credit Facility contains customary non-financial and financial covenants, including a net leverage ratio and an interest coverage ratio. Such ratios, presented below, are computed as defined by the terms of the Credit Facility.
|
| | | |
| Credit Facility Financial Covenants | Required Per Agreement | | As of JuneSeptember 30, 2018 |
| | | | |
| Net leverage ratio | <4.0x | | 1.4x1.2x |
| Interest coverage ratio | >3.5x | | 9.7x10.8x |
In addition, the indentures governing the 4.875% Notes, the 5.375% Notes the 1.125% Convertible Notes and the 1.625% Convertible1.125% Notes contain cross-default provisions that are triggered upon default by us or any of our subsidiaries on any indebtedness in excess of the amount specified in the applicable indenture. Our Bridge Credit Agreement contains customary non-financial covenants. As of JuneSeptember 30, 2018, we were in compliance with all covenants under the Credit Facility our Bridge Credit Agreement and the indentures governing our outstanding notes.
Capital Plan Progress
Year to date, we have reduced the principal amount of outstanding debt by $697 million.
In the third quarter of 2018, we repaid $140 million aggregate principal amount of our 1.125% Notes and entered into privately negotiated termination agreements to partially terminate the related 1.125% Call Option and 1.125% Warrants. In addition, we converted the remaining $64 million aggregate principal amount of our 1.625% Notes for
cash and 0.6 million shares of our common stock. Additionally, we terminated our bridge credit agreement in the third quarter of 2018.
In the second quarter of 2018, we repaid $300 million outstanding under our Credit Facility. In addition, we repaid $96 million aggregate principal amount of our 1.125% Notes, and entered into privately negotiated termination agreements to partially terminate the related 1.125% Call Option and 1.125% Warrants.
In the first quarter of 2018, we exchanged $97 million aggregate principal amount and accrued interest of our 1.625% Notes for 1.8 million shares of our common stock.
FUTURE SOURCES AND USES OF LIQUIDITY
Future Sources
Our Health Plans segment regulated subsidiaries generate significant cash flows from premium revenue, which we generally receive a short time before we pay for the related health care services. Such cash flows are our primary source of liquidity. Thus, any future decline in our profitability may have a negative impact on our liquidity.
Dividends from Subsidiaries. When available and as permitted by applicable regulations, cash in excess of the capital needs of our regulated health plans is generally paid in the form of dividends to our unregulated parent company to be used for general corporate purposes. In the six months ended June 30, 2018, the regulated health plan subsidiaries paid $50 million in dividends to the parent, and the unregulated subsidiaries paid $10 million in dividends to the parent. In July 2018, the regulated health plan subsidiaries paid $60 million in dividends to the parent. For more information on our regulatory capital requirements and dividend restrictions, refer to Notes to Consolidated Financial Statements, Note 12, “Commitments and Contingencies—Regulatory Capital Requirements and Dividend Restrictions.”
Borrowing Capacity and Debt Financing. We have available borrowing capacity of $550 million under our Bridge Credit Agreement (which amount is subject to the use of proceeds restrictions set forth in the Bridge Credit Agreement), and $494 million under our Credit Facility. In addition, we have adequate cash held in a restricted
account available to satisfy the redemption or conversion cash payments applicable to the $64 million principal balance outstanding under our 1.625% Convertible Notes, when they are redeemed or converted in the third quarter of 2018. See further discussion in the Notes to Consolidated Financial Statements, Note 7, “Debt.”
Sale of MMS.We expectclosed on the sale of Molina Medicaid Solutions (MMS) to DXC Technology Company on September 30, 2018. The net cash selling price for the equity interests of MMS was $233 million, which we received on October 1, 2018.
Savings from Restructuring Plans. Our new executive team has focused on a margin recovery plan that includes identification and implementation of various profit improvement initiatives. To that end, we have begun to approximate $220 million after certain adjustments. See further discussionimplement a plan to restructure our information technology department (the IT Restructuring) in the Notes to Consolidated Financial Statements, Note 1, “Basis of Presentation.”
2017 Restructuring Plan. As previously disclosed, we estimate that the 2017 Restructuring Plan will reduce annualized run-rate expenses by approximately $300 million to $400 million when completed by the end of 2018. This estimate includes run-rate savings of approximately $10 million relating to actions taken in the firstthird quarter of 2018. We expectAs we further implement the costIT Restructuring in the fourth quarter of 2018, we will report estimates of anticipated future savings to reducein our 2018 Annual Report on Form 10-K.
Under the restructuring plan we implemented in 2017 (the 2017 Restructuring Plan), we have achieved savings in our Health Plans and Other segments of approximately $230 million since the plan’s inception through September 30, 2018. These savings have reduced both “General and administrative expenses” and “Medical care costs” reported in our consolidated statements of operations. The following table illustrates
Further details of our
estimates of run-rate savingsrestructuring plans, including costs associated with
the 2017 Restructuring Plan, which have not changed significantly since our estimate at December 31, 2017. Such savings will be offset, through the end of 2018, by the costs referred tosuch plans, are described in the Notes to Consolidated Financial Statements, Note 10, “Restructuring and Separation Costs.”
|
| | | | | | |
Estimated Savings Expected to be Realized by Reportable Segment | | Health Plans | | Other | | Total |
| | (In millions) |
General and administrative expenses | | $65 | | $92 to $152 | | $157 to $217 |
Medical care costs | | $126 to $166 | | $17 | | $143 to $183 |
| | $191 to $231 | | $109 to $169 | | $300 to $400 |
Shelf Registration Statement. We have a shelf registration statement on file with the Securities and Exchange Commission to register an unlimited amount of any combination of debt or equity securities in one or more offerings. Specific information regarding the terms and securities being offered and the use of proceeds will be provided at the time of an offering.
Future Uses
Regulatory Capital Requirements and Dividend Restrictions. InWe have the six months ended June 30, 2018, the parent company contributedability, and have committed to provide, additional capital to each of $117 millionour health plans as necessary to our regulated health plan subsidiaries to satisfyensure compliance with statutory net worthcapital and surplus requirements.
Convertible Senior1.125% Notes. Refer to the Notes to Consolidated Financial Statements, Note 7, “Debt,” for a detailed discussion of our convertible senior notes, including recent transactions.
1.625% Convertible Notes. On July 11, 2018, we announced notice of our election to redeem the remaining $64 million aggregate principal amount of the 1.625% Convertible Notes on August 20, 2018 (the Redemption Date). Pursuant to the terms of the indenture, the 1.625% Convertible Notes will be redeemed for cash equal to 100% of the principal amount plus accrued and unpaid interest to, but excluding the Redemption Date (the Redemption Price).
Also pursuant to the indenture, the 1.625% Convertible Notes may be converted until August 17, 2018, at a conversion rate of 17.2157 shares of our common stock per $1,000 principal amount, or approximately $58.09 per share of our common stock. Upon conversion, we will pay cash for the principal and, if applicable, deliver shares of our common stock to the converting holders in an amount per $1,000 principal amount equal to the settlement amount (as defined in the related indenture). After August 17, 2018, holders will be entitled only to the Redemption Price. As noted above, we have adequate cash held in a restricted account available to satisfy the redemption or conversion cash payments applicable to the $64 million principal balance outstanding under our 1.625% Convertible Notes, when they are redeemed or converted in the third quarter of 2018.
1.125% Convertible Notes. The principal amount of our 1.125% Convertible Notes is convertible into cash prior to its maturity date under certain circumstances, one of which relates to the closing price of our common stock over a specified period. We refer to this conversion trigger as the stock price trigger. The stock price trigger, for the 1.125% Noteswhich is $53.00 per share. The 1.125% Convertible Notes met this trigger in the quarter ended JuneSeptember 30, 2018, and are convertible to cash through at least September 30,December 31, 2018. BecauseIn addition, they are convertible by the 1.125% Convertible Notes may be converted into cashholders within 12 months,one year of the $420 million carrying amount iscurrent balance sheet date until they mature; therefore, they are reported in current portion of long-term debt as of June 30, 2018.debt. If conversion requests are received, the settlement of the notes must be paid in cash pursuant to the terms of the relevant indentures. We have sufficient available cash, combined with borrowing capacity available under our Credit Facility, and Bridge Credit Agreement, to fund conversions should they occur.
HIF. The HIF payable of $348 million was paid on October 1, 2018.
CONTRACTUAL OBLIGATIONS
A summary of future obligations under our various contractual obligations and commitments as of December 31, 2017, was disclosed in our 2017 Annual Report on Form 10-K. Other than
As of September 30, 2018, the financing transactionsprincipal amount of debt outstanding was $1,344 million, compared with $2,041 million reported at December 31, 2017. Refer to the Notes to Consolidated Financial Statements, Note 7, “Debt,” for a description of debt repayments in 2018.
As of December 31, 2017, we reported operating lease obligations of $262 million. Of this total, approximately $49 million related to the Molina Medicaid Solutions and Pathways subsidiaries. As noted in the Notes to Consolidated Financial Statements, Note 7, “Debt,1, “Organization and Basis of Presentation,” these subsidiaries were recently sold; therefore, such lease obligations are no longer obligations of Molina Healthcare.
Other than these items, there were no materialsignificant changes to this previously filed information outside the ordinary course of business during the sixnine months ended JuneSeptember 30, 2018.
CRITICAL ACCOUNTING ESTIMATES
When we prepare our consolidated financial statements, we use estimates and assumptions that may affect reported amounts and disclosures; actual results could differ from these estimates. Our critical accounting estimates relate to:
Health Plans segment medical claims and benefits payable. Refer to Notes to Consolidated Financial Statements, Note 6, “Medical Claims and Benefits Payable,” for a table that presents the components of the change in medical claims and benefits payable, and for additional information regarding the factors used to determine our changes in estimates for all periods presented in the accompanying consolidated financial statements. Other than the discussion as noted above, there have been no significant changes during the sixnine months ended JuneSeptember 30, 2018, to our disclosure reported in “Critical Accounting Estimates” in our Annual Report on Form 10-K for the year ended December 31, 2017.
Health Plans segment contractual provisions that may adjust or limit revenue or profit. For a discussion of this topic, including amounts recorded in our consolidated financial statements, refer to Notes to Consolidated Financial Statements, Note 2, “Significant Accounting Policies.”
Health Plans segment quality incentives. For a discussion of this topic, including amounts recorded in our consolidated financial statements, refer to Notes to Consolidated Financial Statements, Note 2, “Significant Accounting Policies.”
Goodwill and intangible assets, net. ThereAs result of the divestiture of MMS on September 30, 2018, the carrying amount of goodwill was reduced by $43 million; therefore, goodwill and intangible assets, net, represented approximately 2% of total assets and 12% of stockholders’ equity as of September 30, 2018, compared with 3% and 19%, respectively, at December 31, 2017. Other than the divestiture of MMS, there have been no significant changes during the sixnine months ended JuneSeptember 30, 2018, to our disclosure reported in “Critical Accounting Estimates” in our Annual Report on Form 10-K for the year ended December 31, 2017.
SUPPLEMENTAL INFORMATION
FINANCIAL MEASURES THAT SUPPLEMENT U.S. GAAP (NON-GAAP FINANCIAL MEASURES)
We use these non-GAAP financial measures as supplemental metrics in evaluating our financial performance, making financing and business decisions, and forecasting and planning for future periods. For these reasons, management believes such measures are useful supplemental measures to investors in comparing our performance to the performance of other public companies in the health care industry.
EBITDA*
We believe that earnings before interest, taxes, depreciation and amortization (EBITDA*) is helpful in assessing our ability to meet the cash demands of our operating units.
|
| | | | | | | | | | | | | | | |
| | Three Months Ended June 30, | | Six Months Ended June 30, |
| 2018 | | 2017 | | 2018 | | 2017 |
| | (In millions) |
| Net income (loss) | $ | 202 |
| | $ | (230 | ) | | $ | 309 |
| | $ | (153 | ) |
| Adjustments: | | | | | | | |
| Depreciation, and amortization of intangible assets and capitalized software | 33 |
| | 44 |
| | 67 |
| | 90 |
|
| Interest expense | 32 |
| | 27 |
| | 65 |
| | 53 |
|
| Income tax expense (benefit) | 103 |
| | (84 | ) | | 175 |
| | (30 | ) |
| EBITDA* | $ | 370 |
| | $ | (243 | ) | | $ | 616 |
| | $ | (40 | ) |
ADJUSTED NET INCOME (LOSS)* AND ADJUSTED NET INCOME (LOSS) PER SHARE*
We believe that adjusted net income (loss)* and adjusted net income (loss) per diluted share* are helpful in assessing our financial performance exclusive of the non-cash impact of the amortization of purchased intangibles. The following table reconciles net income (loss), which we believe to be the most comparable GAAP measure, to adjusted net income (loss)*.
|
| | | | | | | | | | | | | | | | | | | | | | | | | | | | | | | |
| | Three Months Ended June 30, | | Six Months Ended June 30, |
| 2018 | | 2017 | | 2018 | | 2017 |
| | (In millions, except diluted per-share amounts) |
| Net income (loss) | $ | 202 |
| | $ | 3.02 |
| | $ | (230 | ) | | $ | (4.10 | ) | | $ | 309 |
| | $ | 4.68 |
| | $ | (153 | ) | | $ | (2.74 | ) |
| Adjustment: | | | | | | | | | | | | | | | |
| Amortization of intangible assets | 5 |
| | 0.08 |
| | 8 |
| | 0.14 |
| | 10 |
| | 0.16 |
| | 17 |
| | 0.30 |
|
Income tax effect (1) | (1 | ) | | (0.02 | ) | | (3 | ) | | (0.05 | ) | | (2 | ) | | (0.04 | ) | | (6 | ) | | (0.11 | ) |
| Amortization of intangible assets, net of tax effect | 4 |
| | 0.06 |
| | 5 |
| | 0.09 |
| | 8 |
| | 0.12 |
| | 11 |
| | 0.19 |
|
| Adjusted net income (loss)* | $ | 206 |
| | $ | 3.08 |
| | $ | (225 | ) | | $ | (4.01 | ) | | $ | 317 |
| | $ | 4.80 |
| | $ | (142 | ) | | $ | (2.55 | ) |
__________________________
| |
(1) | Income tax effect of adjustments calculated at the blended federal and state statutory tax rates of 22% and 37% for 2018 and 2017, respectively. |
CONTROLS AND PROCEDURES
Evaluation of Disclosure Controls and Procedures. Our management, with the participation of our chief executive officer and our chief financial officer, has concluded, based upon its evaluation as of the end of the period covered by this report, that the Company’s “disclosure controls and procedures” (as defined in Rules 13a-15(e) and 15d-15(e) under the Securities Exchange Act of 1934, as amended (the “Exchange Act”)), are effective to ensure that information required to be disclosed in the reports that we file or submit under the Exchange Act is recorded, processed, summarized, and reported within the time periods specified in the SEC’s rules and forms.
Changes in Internal Control Over Financial Reporting. There has been no change in our internal control over financial reporting during the fiscal quarter ended JuneSeptember 30, 2018 that has materially affected, or is reasonably likely to materially affect, our internal controls over financial reporting.
LEGAL PROCEEDINGS
For information regarding legal proceedings, see Notes to Consolidated Financial Statements, Note 12, “Commitments and Contingencies.”
RISK FACTORS
Certain risks may have a material adverse effect on our business, financial condition, cash flows, results of operations, or stock price, and you should carefully consider them before making an investment decision with respect to our securities. In addition to the other information set forth in this report, you should carefully consider the risk factors discussed in “Risk Factors,” in our Annual Report on Form 10-K for the year ended December 31, 2017. The risk factors described in our 2017 Annual Report on Form 10-K are not the only risks that we face. Additional risks and uncertainties not currently known to us or that we currently deem to be immaterial may also materially adversely affect our business, financial condition, cash flows, results of operations, or stock price.
UNREGISTERED SALES OF EQUITY SECURITIES AND USE OF PROCEEDS
ISSUER PURCHASES OF EQUITY SECURITIES
Purchases of common stock made by us, or on our behalf during the quarter ended JuneSeptember 30, 2018, including shares withheld by us to satisfy our employees’ income tax obligations, are set forth below: |
| | | | | | | | | | | | | |
| | Total Number of Shares Purchased (1) | | Average Price Paid per Share | | Total Number of Shares Purchased as Part of Publicly Announced Plans or Programs | | Approximate Dollar Value of Shares Authorized to Be Purchased Under the Plans or Programs |
| April 1 - April 30 | 2,528 |
| | $ | 81.18 |
| | — |
| | $ | — |
|
| May 1 - May 31 | — |
| | $ | — |
| | — |
| | $ | — |
|
| June 1 - June 30 | 4,096 |
| | $ | 85.46 |
| | — |
| | $ | — |
|
| Total | 6,624 |
| | $ | 83.83 |
| | — |
| | |
|
| | | | | | | | | | | | | |
| | Total Number of Shares Purchased (1) | | Average Price Paid per Share | | Total Number of Shares Purchased as Part of Publicly Announced Plans or Programs | | Approximate Dollar Value of Shares Authorized to Be Purchased Under the Plans or Programs |
| July 1 - July 31 | 105 |
| | $ | 97.94 |
| | — |
| | $ | — |
|
| August 1 - August 31 | 243 |
| | $ | 134.01 |
| | — |
| | $ | — |
|
| September 1 - September 30 | — |
| | $ | — |
| | — |
| | $ | — |
|
| Total | 348 |
| | $ | 123.13 |
| | — |
| | |
_______________________
| |
| (1) | During the three months ended JuneSeptember 30, 2018, we withheld 6,624348 shares of common stock under our 2011 Equity Incentive Plan to settle employee income tax obligations. |
INDEX TO EXHIBITS
|
| | | | |
| Exhibit No. | | Title | | Method of Filing |
| | | | |
| | Membership Interest Purchase and Sale Agreement, dated as of June 26,October 19, 2018, by and betweenamong Pyramid Health Holdings, LLC, Molina Pathways, LLC, and Molina Healthcare, Inc. and DXC Technology Company* | | Filed as Exhibit 2.1 to registrant’s Form 8-K filed June 27, 2018. |
| | | | |
| | Fifth Amended and Restated Bylaws of Molina Healthcare, Inc. | | Filed as Exhibit 3.1 to registrant’s Form 8-K filed May 7, 2018. |
| | | | |
| | Offer Letter, dated May 4, 2018, by and between Molina Healthcare, Inc. and Thomas L. Tran. | | Filed as Exhibit 10.1 to registrant’s Form 8-K filed May 24, 2018. |
| | | | |
| | Molina Healthcare, Inc. Amended and Restated Deferred Compensation Plan (2018)* | | Filed herewith. |
| | | | | |
| | Section 302 Certification of Chief Executive Officer | | Filed herewith. |
| | | | |
| | Section 302 Certification of Chief Financial Officer | | Filed herewith. |
| | | | | |
| | Certification of Chief Executive Officer pursuant to 18 U.S.C. Section 1350, as adopted pursuant to Section 906 of the Sarbanes-Oxley Act of 2002. | | Filed herewith. |
| | | | |
| | Certification of Chief Financial Officer pursuant to 18 U.S.C. Section 1350, as adopted pursuant to Section 906 of the Sarbanes-Oxley Act of 2002. | | Filed herewith. |
| | | | | |
| 101.INS | | XBRL Taxonomy Instance Document. | | Filed herewith. |
| | | | |
| 101.SCH | | XBRL Taxonomy Extension Schema Document. | | Filed herewith. |
| | | | |
| 101.CAL | | XBRL Taxonomy Extension Calculation Linkbase Document. | | Filed herewith. |
| | | | |
| 101.DEF | | XBRL Taxonomy Extension Definition Linkbase Document. | | Filed herewith. |
| | | | |
| 101.LAB | | XBRL Taxonomy Extension Label Linkbase Document. | | Filed herewith. |
| | | | |
| 101.PRE | | XBRL Taxonomy Extension Presentation Linkbase Document | | Filed herewith. |
* Certain schedules and exhibits to this agreement have been omitted in accordance with Item 601(b)(2) of Regulation S-K. A copy of any omitted schedule and/or exhibit will be furnished to the Securities and Exchange Commission upon request.
SIGNATURES
Pursuant to the requirements of the Securities Exchange Act of 1934, the registrant has duly caused this report to be signed on its behalf by the undersigned thereunto duly authorized.
|
| | | |
| | | | MOLINA HEALTHCARE, INC. |
| | | | (Registrant) |
| | | |
| Dated: | AugustNovember 1, 2018 | | /s/ JOSEPH M. ZUBRETSKY |
| | | | Joseph M. Zubretsky |
| | | | Chief Executive Officer |
| | | | (Principal Executive Officer) |
| | | |
| Dated: | AugustNovember 1, 2018 | | /s/ THOMAS L. TRAN |
| | | | Thomas L. Tran |
| | | | Chief Financial Officer and Treasurer |
| | | | (Principal Financial Officer) |
Molina Healthcare, Inc. JuneSeptember 30, 2018 Form 10-Q | 62