UNITED STATES
SECURITIES AND EXCHANGE COMMISSION
Washington, D.C. 20549
FORM 10-Q
|
| |
| x | Quarterly report pursuant to Section 13 or 15(d) of the Securities Exchange Act of 1934. |
| | |
| | For the quarterly period ended April 30, 20132014 |
| | |
| | OR |
| | |
| o | Transition report pursuant to Section 13 or 15(d) of the Securities Exchange Act of 1934. |
| | |
| | For the transition period from to . |
| | |
| | COMMISSION FILE NUMBER 000-51277 |
GRANITE FALLS ENERGY, LLC
(Exact name of registrant as specified in its charter)
|
| | | | |
| Minnesota | | 41-1997390 |
(State or other jurisdiction of incorporation or organization) | | (I.R.S. Employer Identification No.) |
| | | |
| 15045 Highway 23 SE, Granite Falls, MN 56241-0216 |
| (Address of principal executive offices) |
| |
| (320) 564-3100 |
| (Registrant's telephone number, including area code) |
Indicate by check mark whether the registrant (1) has filed all reports required to be filed by Section 13 or 15(d) of the Securities Exchange Act of 1934 during the preceding 12 months (or for such shorter period that the registrant was required to file such reports), and (2) has been subject to such filing requirements for the past 90 days.
x Yes o No
Indicate by check mark whether the registrant has submitted electronically and posted on its corporate Web site, if any, every Interactive Data File required to be submitted and posted pursuant to Rule 405 of Regulation S-T (§232.405 of this chapter) during the preceding 12 months (or for such shorter period that the registrant was required to submit and post such files).
x Yes o No
Indicate by check mark whether the registrant is a large accelerated filer, an accelerated filer, a non-accelerated filer, or a smaller reporting company. See the definitions of "large accelerated filer," "accelerated filer" and "smaller reporting company" in Rule 12b-2 of the Exchange Act:
|
| |
Large Accelerated Filer o | Accelerated Filer o |
Non-Accelerated Filer x | Smaller Reporting Company o |
Indicate by check mark whether the registrant is a shell company (as defined in Rule 12b-2 of the Exchange Act).
o Yes x No
Indicate the number of shares outstanding of each of the issuer's classes of common stock, as of the latest practicable date: As of June 14, 201316, 2014 there were 30,606 membership units outstanding.
INDEX
PART I FINANCIAL INFORMATION
Item 1. Financial Statements
GRANITE FALLS ENERGY, LLC
Condensed Consolidated Balance Sheets
| | | ASSETS | | April 30, 2013 | | October 31, 2012 | | April 30, 2014 | | October 31, 2013 |
| | (Unaudited) | |
| | (Unaudited) | |
|
| Current Assets | |
| |
| |
| |
|
| Cash | | $ | 1,386,003 |
| | $ | 685,828 |
| | $ | 15,113,456 |
| | $ | 1,158,774 |
|
| Restricted cash | | 474,000 |
| | 494,000 |
| | 634,820 |
| | 393,750 |
|
| Accounts receivable | | 6,152,560 |
| | 7,356,534 |
| | 12,439,619 |
| | 6,450,694 |
|
| Inventory | | 12,790,395 |
| | 12,013,169 |
| | 9,009,359 |
| | 12,370,277 |
|
| Commodity derivative instruments | | | 362,438 |
| | — |
|
| Prepaid expenses and other current assets | | 262,314 |
| | 165,519 |
| | 662,434 |
| | 1,096,483 |
|
| Total current assets | | 21,065,272 |
| | 20,715,050 |
| | 38,222,126 |
| | 21,469,978 |
|
| |
| |
| |
| |
|
| Property, Plant and Equipment | |
| |
| |
| |
|
| Land and improvements | | 6,552,967 |
| | 7,095,172 |
| | 13,348,732 |
| | 12,307,063 |
|
| Railroad improvements | | 7,961,096 |
| | 4,121,148 |
| | 8,005,523 |
| | 8,005,523 |
|
| Process equipment and tanks | | 64,678,860 |
| | 64,678,860 |
| | 112,142,583 |
| | 110,440,407 |
|
| Administration building | | 279,734 |
| | 279,734 |
| | 1,318,144 |
| | 1,015,361 |
|
| Office equipment | | 244,160 |
| | 154,072 |
| | 265,792 |
| | 265,792 |
|
| Rolling stock | | 1,305,395 |
| | 1,305,395 |
| | 1,752,745 |
| | 1,691,857 |
|
| Construction in progress | | 1,636,310 |
| | 3,831,263 |
| | 850,934 |
| | 2,067,213 |
|
| | | 82,658,522 |
| | 81,465,644 |
| | 137,684,453 |
| | 135,793,216 |
|
| Less accumulated depreciation | | 43,365,199 |
| | 41,047,562 |
| | 51,525,180 |
| | 46,984,361 |
|
| Net property, plant and equipment | | 39,293,323 |
| | 40,418,082 |
| | 86,159,273 |
| | 88,808,855 |
|
| |
| |
| |
| |
|
| Goodwill | | | 1,372,473 |
| | 1,372,473 |
|
| | |
| |
|
| Other Assets | | | 951,734 |
| | 1,021,916 |
|
| | | | | | | | | |
| Total Assets | | $ | 60,358,595 |
| | $ | 61,133,132 |
| | $ | 126,705,606 |
| | $ | 112,673,222 |
|
Notes to Unaudited Condensed Consolidated Financial Statements are an integral part of this Statement.
GRANITE FALLS ENERGY, LLC
Condensed Consolidated Balance Sheets
| | | LIABILITIES AND MEMBERS' EQUITY | | April 30, 2013 | | October 31, 2012 | |
| LIABILITIES AND EQUITY | | | April 30, 2014 | | October 31, 2013 |
| | (Unaudited) | |
| | (Unaudited) | |
|
| Current Liabilities | |
| |
| |
| |
|
| Current portion of long-term debt | | $ | 116,953 |
| | $ | 114,718 |
| | $ | 7,579,332 |
| | $ | 3,490,808 |
|
| Accounts payable | | 1,432,609 |
| | 3,527,840 |
| | 5,131,655 |
| | 3,058,633 |
|
| Corn payable to FCE | | 4,496,144 |
| | 1,995,997 |
| | 1,369,516 |
| | 4,001,852 |
|
| Commodity derivative instruments | | 47,813 |
| | 45,563 |
| | — |
| | 75,113 |
|
| Accrued liabilities | | 602,592 |
| | 318,819 |
| | 1,046,283 |
| | 696,858 |
|
| Total current liabilities | | 6,696,111 |
| | 6,002,937 |
| | 15,126,786 |
| | 11,323,264 |
|
| |
| |
| | | | |
| Long-Term Debt, less current portion | | 553,789 |
| | 5,274,870 |
| | 18,970,883 |
| | 32,981,955 |
|
| |
| |
| |
| |
|
| Commitments and Contingencies | |
| |
| |
| |
|
| |
| |
| |
| |
|
| Members' Equity, 30,606 units authorized, issued and outstanding | | 53,108,695 |
| | 49,855,325 |
| |
| Members' Equity | | | | | |
| Members' equity attributable to Granite Falls Energy, LLC consists of 30,606 units authorized, issued and outstanding | | | 79,182,623 |
| | 59,887,346 |
|
| Noncontrolling interest | | | 13,425,314 |
| | 8,480,657 |
|
| Total Members' Equity | | | 92,607,937 |
| | 68,368,003 |
|
| Total Liabilities and Members' Equity | | | $ | 126,705,606 |
| | $ | 112,673,222 |
|
| |
| |
| | | | |
| Total Liabilities and Members’ Equity | | $ | 60,358,595 |
| | $ | 61,133,132 |
| |
| | | | | | |
| | | | | | |
Notes to Unaudited Condensed Consolidated Financial Statements are an integral part of this Statement.
GRANITE FALLS ENERGY, LLC
Condensed Consolidated Statements of Operations
|
| | | | | | | | | | | | | | | |
| Three Months Ended | | Three Months Ended | | Six Months Ended | | Six Months Ended |
| April 30, 2013 | | April 30, 2012 | | April 30, 2013 | | April 30, 2012 |
| (Unaudited) | | (Unaudited) | | (Unaudited) | | (Unaudited) |
| | | | | |
|
| |
|
|
| Revenues | $ | 48,020,602 |
| | $ | 39,025,122 |
| | $ | 95,137,724 |
| | $ | 82,770,898 |
|
|
| |
| |
| |
|
| Cost of Goods Sold | 44,390,630 |
| | 38,367,706 |
| | 90,675,608 |
| | 78,425,531 |
|
|
| |
| |
|
| |
|
|
| Gross Profit | 3,629,972 |
| | 657,416 |
| | 4,462,116 |
| | 4,345,367 |
|
|
| |
| |
| |
|
| Operating Expenses | 582,965 |
| | 590,481 |
| | 1,145,660 |
| | 1,254,217 |
|
|
| |
| |
| |
|
| Operating Income | 3,047,007 |
| | 66,935 |
| | 3,316,456 |
| | 3,091,150 |
|
|
| |
| |
| |
|
| Other Income (Expense) |
| |
| |
| |
|
| Other income, net | 23,078 |
| | 51,004 |
| | 24,225 |
| | 65,548 |
|
| Interest income | 41 |
| | 4,052 |
| | 95 |
| | 15,281 |
|
| Interest expense | (38,183 | ) | | (5,525 | ) | | (87,406 | ) | | (13,225 | ) |
| Total other income (expense), net | (15,064 | ) | | 49,531 |
| | (63,086 | ) | | 67,604 |
|
|
| |
| |
| |
|
| Net Income | $ | 3,031,943 |
| | $ | 116,466 |
| | $ | 3,253,370 |
| | $ | 3,158,754 |
|
|
| |
| |
| |
|
| Weighted Average Units Outstanding - Basic and Diluted | 30,606 |
| | 30,606 |
| | 30,606 |
| | 30,623 |
|
| | | | | |
| |
|
| Net Income Per Unit - Basic and Diluted | $ | 99.06 |
| | $ | 3.81 |
| | $ | 106.30 |
| | $ | 103.15 |
|
|
| |
| |
| |
|
| Distributions Per Unit - Basic and Diluted | $ | — |
| | $ | — |
| | $ | — |
| | $ | 300.00 |
|
| | | | | | | | |
|
| | | | | | | | | | | | | | | |
| Three Months Ended | | Three Months Ended | | Six Months Ended | | Six Months Ended |
| April 30, 2014 | | April 30, 2013 | | April 30, 2014 | | April 30, 2013 |
| (Unaudited) | | (Unaudited) | | (Unaudited) | | (Unaudited) |
| Revenues | $ | 81,324,024 |
| | $ | 48,020,602 |
| | $ | 158,787,837 |
| | $ | 95,137,724 |
|
|
| |
| |
| |
|
| Cost of Goods Sold | 63,111,765 |
| | 44,390,630 |
| | 126,155,119 |
| | 90,675,608 |
|
|
|
| |
| | | | |
| Gross Profit | 18,212,259 |
| | 3,629,972 |
| | 32,632,718 |
| | 4,462,116 |
|
|
| |
| |
| |
|
| Operating Expenses | 1,379,875 |
| | 582,965 |
| | 2,675,376 |
| | 1,145,660 |
|
|
| |
| |
| |
|
| Operating Income | 16,832,384 |
| | 3,047,007 |
| | 29,957,342 |
| | 3,316,456 |
|
|
| |
| |
| |
|
| Other Income (Expense) |
| |
| |
| |
|
| Other income, net | 121,652 |
| | 23,078 |
| | 178,290 |
| | 24,225 |
|
| Interest income | 705 |
| | 41 |
| | 926 |
| | 95 |
|
| Interest expense | (195,606 | ) | | (38,183 | ) | | (472,351 | ) | | (87,406 | ) |
| Total other expense, net | (73,249 | ) | | (15,064 | ) | | (293,135 | ) | | (63,086 | ) |
|
| |
| |
| |
|
| Net Income | $ | 16,759,135 |
| | $ | 3,031,943 |
| | $ | 29,664,207 |
| | $ | 3,253,370 |
|
| |
| |
| |
| |
|
| Net Income Attributable to Noncontrolling Interest | $ | 2,509,722 |
| | $ | — |
| | $ | 4,859,850 |
| | $ | — |
|
|
| |
| | | | |
| Net Income Attributable to Granite Falls Energy, LLC | $ | 14,249,413 |
| | $ | 3,031,943 |
| | $ | 24,804,357 |
| | $ | 3,253,370 |
|
| | | | | | | | |
| Weighted Average Units Outstanding - Basic and Diluted | 30,606 |
| | 30,606 |
| | 30,606 |
| | 30,606 |
|
| | | | | | | | |
| Amounts attributable to Granite Falls Energy, LLC: | | | | |
| |
|
| | | | | | | | |
| Net Income Per Unit - Basic and Diluted | $ | 465.58 |
| | $ | 99.06 |
| | $ | 810.44 |
| | $ | 106.30 |
|
|
| |
| |
| |
|
| Distributions Per Unit - Basic and Diluted | $ | — |
| | $ | — |
| | $ | 180.00 |
| | $ | — |
|
| | | | | | | | |
Notes to Unaudited Condensed Consolidated Financial Statements are an integral part of this Statement.
GRANITE FALLS ENERGY, LLC
Condensed Consolidated Statements of Cash Flows
| |
| Six Months Ended | | Six Months Ended | Six Months Ended | | Six Months Ended |
| April 30, 2013 | | April 30, 2012 | April 30, 2014 | | April 30, 2013 |
| (Unaudited) | | (Unaudited) | (Unaudited) | | (Unaudited) |
| Cash Flows from Operating Activities |
| |
|
| |
|
| Net income | $ | 3,253,370 |
| | $ | 3,158,754 |
| $ | 29,664,207 |
| | $ | 3,253,370 |
|
| Adjustments to reconcile net income to net cash provided by operations: |
| |
|
| |
|
| Depreciation | 2,317,637 |
| | 2,100,078 |
| |
| Depreciation and amortization | | 4,611,001 |
| | 2,317,637 |
|
| Change in fair value of derivative instruments | (26,582 | ) | | 1,301,250 |
| (1,602,553 | ) | | (26,582 | ) |
| Changes in assets and liabilities: |
| |
| |
| Gain on sale of equipment | | (25,953 | ) | | — |
|
| Changes in operating assets and liabilities: | |
| |
|
| Restricted cash | 20,000 |
| | 903,000 |
| (241,070 | ) | | 20,000 |
|
| Derivative Instruments | 28,832 |
| | (897,200 | ) | 1,165,002 |
| | 28,832 |
|
| Accounts receivable | 1,203,974 |
| | (462,167 | ) | (5,988,925 | ) | | 1,203,974 |
|
| Inventory | (777,226 | ) | | 3,567,709 |
| 3,360,918 |
| | (777,226 | ) |
| Prepaid expenses and other current assets | (96,795 | ) | | (77,308 | ) | 434,049 |
| | (96,795 | ) |
| Accounts payable | 404,916 |
| | 37,793 |
| (559,314 | ) | | 404,916 |
|
| Accrued liabilities | 283,773 |
| | (103,164 | ) | 434,232 |
| | 283,773 |
|
| Net Cash Provided by Operating Activities | 6,611,899 |
| | 9,528,745 |
| 31,251,594 |
| | 6,611,899 |
|
|
| |
|
| |
|
| Cash Flows from Investing Activities |
| |
|
| |
|
| Proceeds from sale of land | 540,000 |
| | — |
| |
| Proceeds from sale or disposal of assets | | 22,285 |
| | 540,000 |
|
| Payments for capital expenditures | (1,732,878 | ) | | (8,174 | ) | (1,887,569 | ) | | (1,732,878 | ) |
| Payments for land acquisition | — |
| | (3,990,270 | ) | |
| Net Cash Used in Investing Activities | (1,192,878 | ) | | (3,998,444 | ) | (1,865,284 | ) | | (1,192,878 | ) |
|
| |
|
| |
|
| Cash Flows from Financing Activities |
| |
|
| |
|
| Payments on long-term debt, net | (4,718,846 | ) | | (45,619 | ) | |
| Proceeds from long-term debt | | 759,009 |
| | — |
|
| Payments on long-term debt | | (10,681,557 | ) | | (4,718,846 | ) |
| Member distributions paid | — |
| | (9,196,800 | ) | (5,509,080 | ) | | — |
|
| Net Cash Used in Financing Activities | (4,718,846 | ) | | (9,242,419 | ) | (15,431,628 | ) | | (4,718,846 | ) |
|
| |
|
| |
|
| Net Increase (Decrease) in Cash | 700,175 |
| | (3,712,118 | ) | |
| Net Increase in Cash | | 13,954,682 |
| | 700,175 |
|
|
| |
|
| |
|
| Cash - Beginning of Period | 685,828 |
| | 13,064,560 |
| 1,158,774 |
| | 685,828 |
|
|
| |
|
| |
|
| Cash - End of Period | $ | 1,386,003 |
| | $ | 9,352,442 |
| $ | 15,113,456 |
| | $ | 1,386,003 |
|
|
| |
|
| |
|
| Supplemental Cash Flow Information |
| |
|
| |
|
| Cash paid during the period for: |
| |
|
| |
|
| Interest expense | $ | 87,406 |
| | $ | 13,225 |
| $ | 865,428 |
| | $ | 87,406 |
|
|
| |
|
| |
|
| Supplemental Disclosure of Non-Cash Investing and Financing Activities |
| |
|
| |
|
| Transfer of construction in process to fixed assets | $ | 2,194,953 |
| | $ | 366,979 |
| |
| Capital expenditures financed with long-term debt | $ | — |
| | $ | 598,974 |
| |
| Cancellation of accrued distribution to noncontrolling interest | | $ | 84,807 |
| | $ | — |
|
|
| |
| | | |
Notes to Unaudited Condensed Consolidated Financial Statements are an integral part of this Statement.
GRANITE FALLS ENERGY, LLC AND SUBSIDIARIES
Notes to UNAUDITED Condensed Consolidated Financial Statements
April 30, 2013
2014
1. SUMMARY OF SIGNIFICANT ACCOUNTING POLICIES
Basis of Presentation and Principles of Consolidation
The accompanying financial statements consolidate the operating results and financial position of Granite Falls Energy, LLC (“GFE” or the “Company”), and its wholly owned subsidiary, Project Viking, L.L.C. ("Project Viking") which owns 60.8% of Heron Lake BioEnergy, LLC (“HLBE”). The remaining 39.2% ownership of HLBE is included in the consolidated financial statements as a non-controlling interest. HLBE, through its wholly owned subsidiary, HLBE Pipeline Company, LLC, owns 73% of Agrinatural Gas, LLC ("Agrinatural"). Given HLBE's control over the operations of Agrinatural and its majority voting interest, HLBE consolidates the financial statements of Agrinatural with its consolidated financial statements, with the equity and earnings (loss) attributed to the remaining 27% noncontrolling interest. All intercompany balances and transactions are eliminated in consolidation.
The accompanying condensed consolidated balance sheet as of October 31, 20122013 is derived from audited consolidated financial statements. The unaudited interim condensed consolidated financial statements of Granite Falls Energy, LLC (the “Company”)the Company reflect all adjustments consisting only of normal recurring adjustments that are, in the opinion of management, necessary for a fair presentation of financial position and results of operations and cash flows. The results for the three and six month periods ended April 30, 20132014 are not necessarily indicative of the results that may be expected for a full fiscal year. Certain information and note disclosures normally included in annual consolidated financial statements prepared in accordance with accounting principles generally accepted in the United States of America (“GAAP”) are condensed or omitted pursuant to the rules and regulations of the Securities and Exchange Commission (“SEC”), although the Company believes that the disclosures made are adequate to make the information not misleading. These condensed consolidated financial statements should be read in conjunction with the Company's audited consolidated financial statements and notes thereto included in its annual report for the year ended October 31, 20122013 filed on Form 10-K with the SEC.
Nature of Business
Granite Falls Energy, LLC (“GFE” or the “Company”)GFE is a Minnesota limited liability company currently producing fuel-grade ethanol, distillers grains, and crude corn oil near Granite Falls, Minnesota and sells these products, pursuant to marketing agreements, throughout the continental United States and on the international market.States. GFE's plant has an approximate annual production capacity of 60 million gallons, but is currently permitted to produce up to 70 million gallons of undenatured ethanol on a twelve month rolling sum basis.
HLBE is a Minnesota limited liability company currently producing fuel-grade ethanol, distillers grains, and crude corn oil near Heron Lake, Minnesota and sells these products, pursuant to marketing agreements, throughout the continental United States. HLBE's plant has an approximate annual production capacity of 50 million gallons, but is currently permitted to produce up to 59.2 million gallons.
Accounting Estimates
Management uses estimates and assumptions in preparing these condensed consolidated financial statements in accordance with generally accepted accounting principles in the United States of America. Those estimates and assumptions affect the reported amounts of assets and liabilities, the disclosure of contingent assets and liabilities, and the reported revenues and expenses. The Company uses estimates and assumptions in accounting for the following significant matters, among others: economic lives of property, plant, and equipment, valuation of commodity derivatives and inventory, and the assumptions used in the impairment analysis of long-lived assets.assets and goodwill, and the assumptions used to estimate the fair market value of acquired assets and liabilities. Actual results may differ from previously estimated amounts, and such differences may be material to our condensed consolidated financial statements. The Company periodically reviews estimates and assumptions, and the effects of revisions are reflected in the period in which the revision is made.
Revenue Recognition
The Company generally sells ethanol and related products pursuant to marketing agreements. Revenues from the production of ethanol and the related products are recorded when the customer has taken title and assumed the risks and rewards of ownership, prices are fixed or determinable and collectability is reasonably assured. Ethanol and related products are generally shipped free on board (FOB) shipping point. The Company believes there are no ethanol sales, during any given month, which should be considered contingent and recorded as deferred revenue.
GRANITE FALLS ENERGY, LLC AND SUBSIDIARIES
Notes to UNAUDITED Condensed Consolidated Financial Statements
April 30, 2014
In accordance with the Company's agreements for the marketing and sale of ethanol and related products, marketing fees and commissions due to the marketers are deducted from the gross sales price as earned. These fees and commissions are recorded net of revenues, as they do not provide an identifiable benefit that is sufficiently separable from the sale of ethanol and related products. Shipping costs paid by the Company to the marketer in the sale of ethanol are not specifically identifiable and, as a result, are recorded based on the net selling price reported to the Company from the marketer. Shipping costs incurred by the Company in the sale of distillers grains and corn oil are included in cost of goods sold.
Derivative Instruments
From time to time the Company enters into derivative transactions to hedge its exposures to commodity price fluctuations. The Company is required to record these derivatives inon the balance sheets at fair value.
GRANITE FALLS ENERGY, LLC
Notes to UNAUDITED Condensed Financial Statements
April 30, 2013
In order for a derivative to qualify as a hedge, specific criteria must be met and appropriate documentation maintained. Gains and losses from derivatives that do not qualify as hedges, or are undesignated, must be recognized immediately in earnings. If the derivative does qualify as a hedge, depending on the nature of the hedge, changes in the fair value of the derivative will be either offset against the change in fair value of the hedged assets, liabilities, or firm commitments through earnings or recognized in other comprehensive income until the hedged item is recognized in earnings. Changes in the fair value of undesignated derivatives are recorded in earnings.
Additionally, the Company is required to evaluate its contracts to determine whether the contracts are derivatives. Certain contracts that literally meet the definition of a derivative may be exempted as “normal purchases or normal sales”. Normal purchases and normal sales are contracts that provide for the purchase or sale of something other than a financial instrument or derivative instrument that will be delivered in quantities expected to be used or sold over a reasonable period in the normal course of business. Contracts that meet the requirements of normal purchases or sales are documented as normal and exempted from accounting and reporting requirements, and therefore, are not marked to market in our condensed consolidated financial statements.
In order to reduce the risks caused by market fluctuations, the Company occasionally hedges its anticipated corn, natural gas, and denaturant purchases and ethanol sales by entering into options and futures contracts. These contracts are used with the intention to fix the purchase price of anticipated requirements for corn in the Company's ethanol production activities and the related sales price of ethanol. The fair value of these contracts is based on quoted prices in active exchange-traded or over-the-counter market conditions. Although the Company believes its commodity derivative positions are economic hedges, none have been formally designated as a hedge for accounting purposes and derivative positions are recorded on the balance sheet at their fair market value, with changes in fair value recognized in current period earnings or losses. The Company does not enter into financial instruments for trading or speculative purposes.
The Company has adopted authoritative guidance related to “Derivatives and Hedging,” and has included the required enhanced quantitative and qualitative disclosure about objectives and strategies for using derivatives, quantitative disclosures about fair value amounts of gains and losses from derivative instruments, and disclosures about credit-risk-related contingent features in derivative agreements. See further discussion in Note 4.
Business Combinations
The Company allocates the total purchase price of a business combination to the assets acquired and the liabilities assumed based on their estimated fair values at the acquisition date, with the excess purchase price recorded as goodwill. The Company used current market data to assist them in determining the fair value of the assets acquired and liabilities assumed, including goodwill, based on recognized business valuation methodology. Subsequent to the acquisition but not to exceed one year from the acquisition date, the Company will record any material adjustments retrospectively to the initial estimate based on new information obtained about facts and circumstances that existed as of the acquisition date. The Company expenses any acquisition-related costs as incurred in connection with business combinations. An income, market or cost valuation method may be utilized to estimate the fair value of the assets acquired or liabilities assumed in a business combination. The income valuation method represents the present value of future cash flows over the life of the asset using (i) discrete financial forecasts, which rely on management's estimates of revenue and operating expenses, (ii) long-term growth rates, and (iii) an appropriate discount rate. The market valuation method uses prices paid for a reasonably similar asset by other purchasers in the market, with adjustments relating to any differences between the assets. The cost valuation method is based on the replacement cost of a comparable asset at prices at the time of the acquisition reduced for depreciation of the asset.
GRANITE FALLS ENERGY, LLC AND SUBSIDIARIES
Notes to UNAUDITED Condensed Consolidated Financial Statements
April 30, 2014
2. RISKS AND UNCERTAINTIES
The Company has certain risks and uncertainties that it experiences during volatile market conditions. These volatilities can have a severe impact on operations. The Company's revenues are derived from the sale and distribution of ethanol, distillers grains, and corn oil to customers primarily located in the United States. Corn for the production process is supplied to our plant primarily from local agricultural producers and from purchases on the open market. Ethanol sales typically average 7580 -85% of total revenues and corn costs typically average 7570 -85% 80% of cost of goods sold.
The Company's operating and financial performance is largely driven by the prices at which they sell ethanol and the net expense of corn. The price of ethanol is influenced by factors such as supply and demand, the weather, government policies and programs, and unleaded gasoline prices and the petroleum markets as a whole. Excess ethanol supply in the market, in particular, puts downward pressure on the price of ethanol. Our largest cost of production is corn. The cost of corn is generally impacted by factors such as supply and demand, the weather, government policies and programs, and our risk management program used to protect against the price volatility of these commodities.
3. INVENTORY
Inventories consist of the following:
| | | | April 30, 2013 | | October 31, 2012 | April 30, 2014 | | |
| | (Unaudited) | | | (Unaudited) | | October 31, 2013 |
| Raw materials | $ | 8,817,361 |
| | $ | 8,977,820 |
| $ | 3,141,846 |
| | $ | 4,652,465 |
|
| Spare parts | 671,881 |
| | 682,896 |
| 1,756,980 |
| | 1,636,466 |
|
| Work in process | 1,174,317 |
| | 1,183,188 |
| 2,061,099 |
| | 1,643,574 |
|
| Finished goods | 2,126,836 |
| | 1,169,265 |
| 2,049,434 |
| | 4,437,772 |
|
| Totals | $ | 12,790,395 |
| | $ | 12,013,169 |
| $ | 9,009,359 |
| | $ | 12,370,277 |
|
GRANITE FALLS ENERGY, LLC
Notes to UNAUDITED Condensed Financial Statements
April 30, 2013
The Company performs a lower of cost or market analysis on inventory to determine if the market values of certain inventories are less than their carrying value, which is attributable primarily to decreases in market prices of corn and ethanol. Based on the lower of cost or market analysis, the Company did not record a lower of cost or market adjustment on certain inventories for the three or six month periods ended April 30, 2013 and 2012.2014 or 2013.
4. DERIVATIVE INSTRUMENTS
As of April 30, 2013,2014, the total notional amount of the Company's outstanding corn derivative instruments was approximately 1,185,0001,555,000 bushels that were entered into to hedge forecasted corn purchases through July 2013.March 2015. There may be offsetting positions that are not shown on a net basis that could lower the notional amount of positions outstanding as disclosed above.
The following tables provide details regarding the Company's derivative instruments at April 30, 2013,2014, none of which arewere designated as hedging instruments:
|
| | | | | | | | | |
| | Balance Sheet location | | Assets | | Liabilities |
| | | | | | |
| Corn contracts | Commodity Derivative instruments | | $ | — |
| | $ | (47,813 | ) |
| | | | | | |
| Totals | | | $ | — |
| | $ | (47,813 | ) |
In addition, as of April 30, 2013 the Company maintained $474,000 of restricted cash related to margin requirements for the Company's commodity derivative instrument positions. |
| | | | | | | | | | | |
| | | Balance Sheet location | | Assets | | Liabilities | |
| | Corn contracts - GFE | Commodity derivative instruments | | $ | 298,250 |
| | $ | — |
| |
| | Corn contracts - HLBE | Commodity derivative instruments | | 64,188 |
| | — |
| |
| | Totals | | | $ | 362,438 |
| | $ | — |
| |
As of October 31, 2012,2013, the total notional amount of the Company's outstanding corn derivative instruments was approximately 1,235,0001,125,000 bushels that were entered into to hedge forecasted corn purchases through MarchDecember 2013. There may be offsetting positions that are shown on a net basis that could lower the notional amount of positions outstanding as disclosed above.
GRANITE FALLS ENERGY, LLC AND SUBSIDIARIES
Notes to UNAUDITED Condensed Consolidated Financial Statements
April 30, 2014
The following tables provide details regarding the Company's derivative instruments at October 31, 2012,2013, none of which are designated as hedging instruments:
|
| | | | | | | | | | | |
| | Balance Sheet location | | Assets | | Liabilities |
| | | | | | |
| Corn contracts | Commodity Derivative instruments | | $ | — |
| | | $ | (45,563 | ) | |
| | | | | | |
| Totals | | | $ | — |
| | | $ | (45,563 | ) | |
|
| | | | | | | | | | | |
| | | Balance Sheet location | | Assets | | Liabilities | |
| | Corn contracts - GFE | Commodity derivative instruments | | $ | — |
| | $ | (75,113 | ) | |
| | Totals | | | $ | — |
| | $ | (75,113 | ) | |
In addition, as of October 31, 2012 the Company maintained $494,000 of restricted cash related to margin requirements for the Company's commodity derivative instrument positions.
The following tables provide details regarding the gains and (losses) from Company's derivative instruments in statements of operations, none of which are designated as hedging instruments:
|
| | | | | | | | | | | | |
| | | Statement of Operations location | | Three Months Ended April 30, |
| | | | 2013 | | | 2012 | |
| | | | | | | |
| Corn contracts | | Cost of Goods Sold | | $ | (248,955 | ) | | $ | (30,682 | ) |
| | | | | | | |
| Total Gain (Loss) | | | | $ | (248,955 | ) | | $ | (30,682 | ) |
| | | | | | | |
GRANITE FALLS ENERGY, LLC
Notes to UNAUDITED Condensed Financial Statements
April 30, 2013
|
| | | | | | | | | | | | | | |
| | | | Statement of Operations location | | Three Months Ended April 30, | |
| | | | | 2014 | | 2013 | |
| | | | | | | | | |
| | Corn contracts | | Cost of Goods Sold | | $ | 1,643,325 | | | $ | (248,955 | ) | |
| | | | | | | | | |
| | Total Gain (Loss) | | | | $ | 1,643,325 | | | $ | (248,955 | ) | |
| | | | | | | | | |
|
| | | | | | | | | | | | |
| | | Statement of Operations location | | Six Months Ended April 30, |
| | | | 2013 | | | 2012 | |
| | | | | | | |
| Corn contracts | | Cost of Goods Sold | | $ | 26,582 | | | $ | (1,301,250 | ) |
| | | | | | | |
| Total Gain (Loss) | | | | $ | 26,582 | | | $ | (1,301,250 | ) |
| | | | | | | |
|
| | | | | | | | | | | | | | |
| | | | Statement of Operations location | | Six Months Ended April 30, | |
| | | | | 2014 | | 2013 | |
| | | | | | | | | |
| | Corn contracts | | Cost of Goods Sold | | $ | 1,602,553 | | | $ | 26,582 | | |
| | | | | | | | | |
| | Total Gain | | | | $ | 1,602,553 | | | $ | 26,582 | | |
| | | | | | | | | |
5. REVOLVING LINE OF CREDIT AND LONG-TERM DEBT FACILITIES
The CompanyGranite Falls Energy:
GFE has two credit facilities with a lender. The first is a seasonal revolving operating loan facility in the amount of $6,000,0005,600,000. The second is a revolving term loan facility in the amount of $8,000,00018,000,000. However, the amount available for borrowing under this facility reduces by $1,000,0002,000,000 every six months,semi-annually, beginning September 1, 2013,2014, with final payment due March 1, 2017.2018.
The interest rates for both facilities are based on the bank's "One Month LIBOR Index Rate," plus 2652.8% and 290 basis points3.05% on the seasonal and revolving term commitments, respectively. Both facilities are available through March 2017.31, 2017 and March 31, 2018, respectively. The outstanding balance on the revolving term loan on April 30, 20132014 and October 31, 20122013 was $229,9120 and $4,891,9522,513,674, respectively, and the interest rates were 3.10% and 3.12%rate as of both of those dates respectively. The Companywas 3.21%. GFE currently has no outstanding balance on the seasonal revolving operating loan facility.
The Company's credit facilities with United FCS require the Company to comply with certain financial covenants.covenants that require minimum debt service coverage and working capital requirements. As of April 30, 20132014 and October 31, 2012, the Company2013, GFE was in compliance with these financial covenants and expects to be in compliance throughthroughout fiscal 2013. 2014.
The credit facilities are secured by substantially all assets of the Company. There are no savings account balance collateral requirements as part of this credit facility.
At April 30, 2013, the Company2014, GFE also had letters of credit totaling $337,928288,928 with the bank as part of a credit requirement of Northern Natural Gas. These letters of credit reducereduced the total amount available on the revolving operating facility to approximately $5,711,000.
GRANITE FALLS ENERGY, LLC AND SUBSIDIARIES
Notes to UNAUDITED Condensed Consolidated Financial Statements
April 30, 2014
Heron Lake BioEnergy:
Term Note Payable
On May 17, 2013, HLBE renegotiated its term loan with AgStar in the amount availableof $17,400,000. HLBE must make equal monthly payments of principal and interest of approximately $223,000 on the term loan based on a 10-year amortization, provided the entire principal balance and accrued and unpaid interest on the term loan is due and payable in full on the maturity date of September 1, 2016. In addition, HLBE is required to make additional payments annually on debt for up to 25% of the excess cash flow, as defined by the agreement, up to $2,000,000 per year. Through September 1, 2014, the loan bears interest at 5.75% as long as HLBE is in compliance with their debt covenants.
On September 1, 2014, the interest term loan will be adjusted to LIBOR plus 3.50% but not less than 5%. The loan agreements are secured by substantially all business assets and are subject to various financial and non-financial covenants that limit distributions and debt and require minimum debt service coverage, net worth, and working capital requirements. As described above, HLBE was in compliance with the covenants of its master loan agreement with AgStar as of April 30, 2014.
Revolving Term Note
HLBE also obtained a three-year term revolving loan commitment in the amount of $20,500,000, under which AgStar agreed to make periodic advances to HLBE up to this original amount until September 1, 2016. Amounts borrowed by HLBE under the seasonalterm revolving operating loan and repaid or prepaid may be re-borrowed at any time prior to maturity date of the term revolving loan, provided that outstanding advances may not exceed the amount of the term revolving loan commitment. Amounts outstanding on the term revolving loan bear interest at a variable rate equal to the greater of a LIBOR rate plus 3.50% or 5.0%, payable monthly. HLBE also pays an unused commitment fee on the unused portion of the term revolving loan commitment at the rate of 0.35% per annum, payable in arrears in quarterly installments during the term of the term revolving loan. Under the terms of the new agreement, the term revolving loan commitment is scheduled to decline by $2,000,000 annually, beginning on October 31, 2013 and each anniversary date thereafter. The maturity date of the term revolving loan is September 1, 2016.
Subordinated Convertible Debt
On May 17, 2013, HLBE's previous Board of Governors loaned HLBE approximately $5,662,0001,400,000. as part of the subordinated convertible debt offering. An additional $3,700,000 was raised as part of a subordinated convertible debt offering during September 2013. The convertible secured debt is subordinated to the AgStar debt. The notes bear interest at 7.25% and are due on October 1, 2018. On October 1, 2014, or immediately prior to the sale of all or effectively all of HLBE assets, each note is convertible into Class A stock at a rate of $0.30 per Class A unit. The Company reserves the right to issue Class B units upon conversion if the principal balance of the convertible debt exceeds the authorized Class A units at the conversion date. At the issuance, each debt holder had the option to convert to Class A units. As a result, holders elected to convert $934,500 in September 2013 for 3,115,000 Class A units. The notes outstanding on April 30, 2014 could be converted into 13,810,000 units.
On May 2, 2014, HLBE issued a notice that it intends to redeem all of the outstanding principal amount of the subordinated convertible debt on July 1, 2014. The announced redemption is pursuant to the HLBE's "optional redemption" right in the indenture governing the notes. The notes, which have an outstanding principal balance of $4,143,000, will be redeemed at a redemption price equal to 100% of the aggregate principal amount plus accrued and unpaid interest to, but excluding, the redemption date. HLBE's obligation to pay the redemption price on the redemption date is subject to the right of the holders of the notes to elect to convert the principal amount of their Notes into capital units of HLBE at a conversion rate of $0.30 per unit. To the extent holders of the notes do not elect to convert the notes called for redemption prior to the redemption date, HLBE expects to use a combination of cash and borrowings under its credit facilities to fund the redemption price. As of June 16, 2014, approximately $2.7 million of the Notes had been submitted for conversion into 8,857,500 capital units of HLBE.
GRANITE FALLS ENERGY, LLC AND SUBSIDIARIES
Notes to UNAUDITED Condensed Consolidated Financial Statements
April 30, 2014
Long-term debt consists of the following:
|
| | | | | | | |
| | April 30, 2013 | | October 31, 2012 |
| Capital One Equipment Leasing/Finance: | | | |
| Shuttlewagon Railcar Mover (5 year term at 3.875%) | $ | 440,830 |
| | $ | 497,636 |
|
| Revolving Term Loan | 229,912 | | | 4,891,952 | |
| Total Debt | 670,742 | | | 5,389,588 | |
| Less: Current Maturities | (116,953 | ) | | (114,718 | ) |
| | | | |
| Total Long-Term Debt | $ | 553,789 |
| | $ | 5,274,870 |
|
The estimated maturities of long-term debt at April 30, 2013 are as follows:
|
| | | | |
| May 1, 2013 to April 30, 2014 | | $ | 116,953 |
|
| May 1, 2014 to April 30, 2015 | 351,468 | |
| May 1, 2015 to April 30, 2016 | 126,340 | |
| May 1, 2016 to April 30, 2017 | 75,981 | |
| Total debt |
| $ | 670,742 |
|
|
| | | | | | | | | |
| | | April 30,
2014 | | October 31, 2013 | |
| | Granite Falls Energy: | (unaudited) | | | |
| | Capital One Shuttlewagon Railcar Mover. This note was paid in full January 2014. | $ | — |
| | $ | 382,918 |
| |
| | Revolving Term Loan - see terms above | — |
| | 2,513,674 |
| |
| | Heron Lake BioEnergy: | | | | |
| | Term note payable to lending institution (including premium of approximately $1.6m) - see terms above | 17,333,797 |
| | 18,317,800 |
| |
| | Revolving term note payable to lending institution - see terms above | — |
| | 6,263,158 |
| |
| | Assessments payable | 2,588,414 |
| | 2,604,678 |
| |
| | Note payable to electrical company | 256,250 |
| | 293,750 |
| |
| | Note payable on pipeline assets (Agrinatural) | 1,550,374 |
| | 1,013,132 |
| |
| | Note payable to non-controlling interest member of Agrinatural. | 300,000 |
| | 300,000 |
| |
| | Corn oil recovery system note payable | 378,380 |
| | 640,653 |
| |
| | Subordinated Convertible Debt - see terms above. | 4,143,000 |
| | 4,143,000 |
| |
| | Total debt | 26,550,215 |
| | 36,472,763 |
| |
| | Less: Current Maturities | (7,579,332 | ) | | (3,490,808 | ) | |
| | Total Long-Term Debt | $ | 18,970,883 |
| | $ | 32,981,955 |
| |
6. LEASES
The Company has a lease agreement with Trinity Industries Leasing Company (“Trinity”) for 75 hopperGFE leases equipment, primarily rail cars, to assist with the transport of distiller's grains by railunder operating leases through April 2018. The Company will pay Trinity $620 per month plus $0.03 per mile traveled in excess of 36,000 miles per year. Rent expense for these leases was approximately $139,000551,500 and $137,000$503,500 for the three month
GRANITE FALLS ENERGY, LLC
Notes to UNAUDITED Condensed Financial Statements
April 30, 2013
periods ended April 30, 20132014 and 2012,2013, respectively. Rent expense for these leases was approximately $278,000$1,089,000 and $272,000$1,041,000 for the six month periods ended April 30, 20132014 and 2012,2013, respectively.
The Company has lease agreements with three leasing companies for 177HLBE leases equipment, primarily rail carcars, under operating leases for the transportation of the Company's ethanol with various maturity dates through October 2017. The rail car lease payments are due monthly in the aggregate amount of approximately $107,000. Rent expense for these leases was approximately $364,000$375,000 and $318,000$823,000 for the three month periods ended April 30, 2013 and 2012, respectively. Rent expense for these leases was approximately $709,000 and $636,000 for the six month periods ended April 30, 2013 and 2012,2014, respectively.
7. MEMBERS' EQUITY
The CompanyGFE has one class of membership units. The units have no par value and have identical rights, obligations and privileges. Income and losses are allocated to all members based upon their respective percentage of units held. As of April 30, 20132014 and October 31, 2012, the Company2013, GFE had 30,606 membership units authorized, issued, and outstanding.
8. FAIR VALUE
The following table provides information on those derivative liabilities measured at fair value on a recurring basis at April 30, 2013:
|
| | | | | | | | | | | | | | | | | | | | |
| |
Carrying Amount in Balance Sheet April 30, 2013 |
Fair Value April 30, 2013 | Fair Value Measurement Using |
Quoted Prices in Active Markets (Level 1) | Significant Other Observable Inputs (Level 2) |
Significant unobservable inputs (Level 3) |
| Financial Liabilities: | | | | | |
| Commodity derivative instruments | $ | (47,813 | ) | | $ | (47,813 | ) | | $ | (47,813 | ) | | $ | — |
| | $ | — |
| |
The following table provides information on those derivative liabilities measured at fair value on a recurring basis at October 31, 2012:
|
| | | | | | | | | | | | | | | |
| |
Carrying Amount in Balance Sheet October 31, 2012 |
Fair Value October 31, 2012 | Fair Value Measurement Using |
Quoted Prices in Active Markets (Level 1) | Significant Other Observable Inputs (Level 2) |
Significant unobservable inputs (Level 3) |
| Financial Liabilities: | | | | | |
| Commodity derivative instruments | $ | (45,563 | ) | $ | (45,563 | ) | $ | (45,563 | ) | $ | — |
| $ | — |
|
The Company determinesIn December 2013, the fair value of commodity derivative instruments by obtaining fair value measurements from an independent pricing service. The fair value measurements consider observable data that may include dealer quotes and live trading levels from the Chicago Board of Trade market and New York Mercantile Exchange.Governors declared a cash distribution of $180 per unit or $5,509,080 for unit holders of record as of December 19, 2013. The distribution was paid on December 31, 2013.
9.8. COMMITMENTS AND CONTINGENCIES
Corn Storage and Grain Handling Agreement and Purchase Commitments
The CompanyGFE has a corn storage and grain handling agreement with Farmers Cooperative Elevator Company (FCE), a member. Under the current agreement, the Company agrees to purchase all of the corn needed for the operation of the plant from FCE. The price of the corn purchased will be the bid price the member establishes for the plant plus a set fee per bushel.
At October 31, 2013, GFE also had 550,000 bushels of stored corn totaling approximately $2,346,000 with FCE that is included in inventory. All of this corn was consumed in production during the three months ended January 31, 2014.
GRANITE FALLS ENERGY, LLC AND SUBSIDIARIES
Notes to UNAUDITED Condensed Consolidated Financial Statements
April 30, 2014
At April 30, 2013, the Company2014, GFE had basis contracts for forward corn purchase commitments with FCE for 2,375,0001,850,000 bushels for deliveries from May 2013 through June 2013. October 2014.
At April 30, 2013, the Company also2014, HLBE had 885,000basis contracts for forward corn purchase commitments for approximately 2,710,000 bushels of stored corn totaling approximately $6,511,000 with FCE that is included in inventory.for deliveries through December 2014.
GRANITE FALLS ENERGY, LLC
Notes to UNAUDITED Condensed Financial Statements
April 30, 2013
Ethanol Contracts
At April 30, 2013, the Company2014, GFE had forward contracts to sell approximately $13,212,00014,000,000 of ethanol for deliveriesvarious delivery periods from May 20132014 through June 2013July 2014 which approximates 50%40% of its anticipated ethanol sales during that period.
At April 30, 2014, HLBE had forward contracts to sell approximately $14,000,000 of ethanol for various delivery periods from May 2014 through July 2014 which approximates 40% of its anticipated ethanol sales during that period.
Distillers GrainsGrain Contracts
At April 30, 2013, the Company2014, GFE had forward contracts to sell approximately $600,0001,875,000 of distillers grainsgrain for deliverydeliveries in May 2014 through June 2013September 2014 which approximates 10%14% of its anticipated distillers grain sales during that period.
10. LEGAL PROCEEDINGSAt April 30, 2014, HLBE had forward contracts to sell approximately $2,056,000 of distillers grains for delivery in May 2014 through September 2014 which approximates 16% of its anticipated distillers grain sales during that period.
From time to time in the ordinary courseNatural Gas
At April 30, 2014, HLBE has natural gas agreements with a minimum purchase commitment of business, the Company may be named as a defendant in legal proceedings related to various issues, including without limitation, workers' compensation claims, tort claims, or contractual disputes. We are not currently a party to any material pending legal proceedings and we are not currently aware of any such proceedings contemplated by governmental authorities.approximately 1.6 million MMBTU per year until October 2014.
Item 2. Management's Discussion and Analysis of Financial Condition and Results of Operations
We prepared the following discussion and analysis to help you better understand our financial condition, changes in our financial condition, and results of operations for the three and six month periods ended April 30, 20132014, compared to the same period of the prior fiscal year. This discussion should be read in conjunction with the condensed financial statements and notes and the information contained in the Company's Annual Report on Form 10-K for the fiscal year ended October 31, 2012.2013.
Available Information
Our website address is www.granitefallsenergy.com. Our annual report on Form 10-K, quarterly reports on Form 10-Q, current reports on Form 8-K, and amendments to those reports filed or furnished pursuant to Section 13(a) or 15(d) of the Securities Exchange Act of 1934, are available, free of charge, on our website under the link “SEC Compliance,” as soon as reasonably practicable after we electronically file such materials with, or furnish such materials to, the Securities and Exchange Commission. The contents of our website are not incorporated by reference in this Quarterly Report on Form 10-Q.
Disclosure Regarding Forward-Looking Statements
This report contains historical information, as well as forward-looking statements regarding our business, financial condition, results of operations, performance and prospects. All statements that are not historical or current facts are forward-looking statements. TheseYou can identify forward-looking statements include any statements that involve known and unknown risks and relate to future events and our expectations regarding future performance or conditions. Wordsby terms such as “anticipates,” “believes,” “could,” “estimates,” “expects,” “intends,” “may,” “plans,” “potential,” “predicts,” “projects,” “should,” “will,” “should,“would,” “expect,” “plan,” “anticipate,” “believe,” “estimate,” “future,” “intend,” “could,” “hope,” “predict,” “target,” “potential,” or “continue” or the negative of these terms or otherand similar expressions are intended to identify forward-looking statements, but are not the exclusive means of identifying such statements. These forward-lookingForward-looking statements and others we make from time to time, are subject to a number of known and unknown risks, uncertainties and uncertainties. Manyother factors, couldmany of which may be beyond our control, and may cause actual results, performance or achievements to differ materially from those projected in, expressed or implied by forward-looking statements. While it is impossible to identify all such factors, factors that could cause actual results to differ materially from those estimated by us include, butCertain of these risks and uncertainties are not limited to:
Changesdescribed in the availability and price of corn and natural gas;
Demand for corn exceeding supply; and corresponding corn price increases;
Changes in our business strategy, capital improvements or development plans;
Our ability to profitably operate the ethanol plant and maintain a positive spread between the selling price“Risk Factors” section of our productsAnnual Report on Form 10-K for the year ended October 31, 2013 and our raw materials costs;
Results of our hedging transactions and other risk management strategies;
Decreases in the market prices of ethanol and distillers grains;
Ethanol supply exceeding demand; and corresponding ethanol price reductions;
Changes in the environmental regulations that apply to our plant operations and changes in our ability to comply with such regulations;
Changes in plant production capacity or technical difficulties in operating the plant;
Changes in general economic conditions or the occurrence of certain events causing an economic impact in the agriculture, oil or automobile industries;
Lack of transport, storage and blending infrastructure preventing ethanol from reaching high demand markets;
Changes in federal and/or state laws or regulations, including the elimination or modification of the federal renewable fuels standard;
Changes and advances in ethanol production technology;
Effects of mergers, consolidations or contractions in the ethanol industry;
Competition from alternative fuel additives;
The development of infrastructure related to the sale and distribution of ethanol;
Our inelastic demand for corn, as it is the only available feedstock for our plant;
Our ability to retain key employees and maintain labor relations;
Changes to our current water intake system, or our ability to cost-effectively construct a modified water intake system;
The imposition of tariffs or other duties on ethanol imported into Europe; and
Volatile commodity and financial markets.
The cautionary statements referred to in this section also should be considered in connection with any subsequent written or oral forward-looking statements that may be issued by us or persons acting on our behalf.Form 10-Q. We do not undertake any duty to update forward-looking statements after the date they are made or to conform forward-looking statements to actual results or to changes in circumstances or expectations. Furthermore, we cannot guarantee future results, events, levels of activity, performance, or achievements. We caution you not to put undue reliance on any forward-looking statements, which speak only as of the date of this report. You should read this report and the documents that we reference in this report and have filed as exhibits, completely and with the understanding that our actual future results may be materially different from what we currently expect. We qualify all of our forward-looking statements by these cautionary statements.
Overview
Granite Falls Energy, LLC (“Granite Falls Energy” or the “Company”) is a Minnesota Limited Liability Company formed on December 29, 2000.
We are currently producing fuel-gradelimited liability company operating an ethanol distillers grainsplant in Granite Falls, Minnesota. References to "we," "us," "our", Granite Falls Energy", "GFE", and crude corn oil for sale. Ourthe "Company" refer to Granite Falls Energy, LLC. GFE's ethanol plant has an approximate annual production capacity of 60 million gallons of denatured ethanol, but is currently permitted to produce up to 70 million gallons of undenatured ethanol on a twelve month rolling sum basis. We intend to continue working toward increasing production to take advantage of the additional production allowed pursuant to our permit as long as we believe it is profitable to do so.
Our operating resultsrevenues primarily consist of sales of the ethanol and distillers grains we produce; however, we also realize revenue from the sale of corn oil we separate from our distillers syrup. Eco-Energy, LLC ("Eco") markets our ethanol and Renewable Products Marketing Group, LLC (“RPMG”) markets our distillers grains and our corn oil produced at the GFE plant. We also independently market a small portion of our ethanol production as E-85 to local retailers.
Our costs of our goods sold consist primarily of costs relating to the corn and natural gas supplies necessary to produce ethanol and distillers grains for sale. Farmers Cooperative Elevator Company is the exclusive supplier of corn to the GFE ethanol plant.
In July 2013, we indirectly acquired a majority interest in Heron Lake BioEnergy, LLC ("Heron Lake" or "HLBE"), a Minnesota limited liability company, through our purchase of 100% of the membership units of Project Viking, L.L.C. ("Project Viking"). HLBE owns a 50 million gallon per year ethanol plant located in Heron Lake, Minnesota, but is currently permitted to produce up to 59.2 million gallons. As of June 16, 2014, we are largely driventhe indirect owner of approximately 60.8% of HLBE's outstanding membership units and are entitled to appoint five (5) of the nine (9) governors to HLBE's board of governors under HLBE's member control agreement.
On May 2, 2014, HBLE issued a notice pursuant to the indenture governing its 7.25% Subordinated Secured Notes due 2018 (the "Notes") that HLBE intends to redeem all of the outstanding $4.1 million principal amount of the Notes on July 1, 2014. The Notes will be redeemed at a redemption price equal to 100% of the aggregate principal amount plus accrued and unpaid interest to interest to the redemption date subject to the right of the Note holders to convert the principal amount of their Notes into capital units of HLBE at a conversion rate of $0.30 per unit. As of June 16, 2014, approximately $2.665 million of the Notes had been submitted for conversion into 8,882,500 capital units of HLBE. If all of the holders of the Notes called for redemption elect to convert their Notes, HLBE will issue an additional 13,810,000 units. Assuming all Note holders elect to convert there notes, our ownership interest in HLBE will be diluted to 50.1% following the redemption of the Notes. Notwithstanding this dilution, we will retain our governor appointment rights as we will continue to own a majority of HLBE.
In July 2013, we entered into a Management Services Agreement with HLBE pursuant to which our Chief Executive Officer, Chief Financial Officer, and Commodity Risk Manager also hold those same offices with HLBE. The initial term of the Management Services Agreement expires in July 2016, but automatically renews for successive one-year terms unless either party gives the other party written notice of termination prior to expiration of the then current term. The Management Services Agreement may also be terminated by either party for cause under certain circumstances.
HLBE's revenues are primarily derived from the prices at which we sell oursale of its ethanol, distillers grains and corn oiloil. HLBE has contracted with Eco to market all of its ethanol, Gavilon Ingredients, LLC ("Gavilon") to market its distillers grains and RPMG to market its corn oil. HLBE grinds approximately 1,640,000 bushels of corn each month at the HLBE plant. HLBE generally does not have long-term, fixed price contracts for the purchase of corn. Typically, HLBE purchases its corn directly from grain elevators, farmers, and local dealers within approximately 80 miles of Heron Lake, Minnesota.
We expect to have sufficient cash generated by continuing operations and current lines of credit to fund our operations. However, should we experience unfavorable operating conditions in the ethanol industry that prevent us from profitably operating the ethanol plant, we may need to seek additional funding.
Trends and Uncertainties Impacting Our Operations
Our current results of operation are affected and will continue to be affected by factors such as (a) volatile and uncertain pricing of ethanol and corn; (b) availability of corn that is, in turn, affected by trends such as corn acreage, weather conditions, and yields on existing and new acreage diverted from other crops; and (c) the supply and demand for ethanol, which is affected by acceptance of ethanol as a substitute for fuel, public perception of the ethanol industry, government incentives and regulation, and competition from new and existing construction, among other things.
The demand for ethanol is affected by what is commonly referred to as the "blending wall" which is the threshold at which the RFS volume requirement exceeds the demand for E10 (10 percent ethanol and 90 percent gasoline) gasoline. E10 is the most common ethanol blend sold and the only blend the EPA has approved for use in all American automobiles. There is growing availability of E85 (85 percent ethanol and 15 percent gasoline) for use in flexible fuel vehicles. In addition, the industry has been working to introduce E15 (15 percent ethanol and 85 percent gasoline) to the retail market since the EPA issued final approval in 2012 for the sale and use of E15 ethanol blends in light duty passenger vehicles model year 2001 and newer. Since that time, our application with the EPA to register ethanol for use in making E15 has also been approved, as well as 81 other fuel manufacturers according to EPA data. However, wide spread adoption of E15 is hampered by regulatory and infrastructure hurdles in many states, as well as consumer acceptance. To date only thirteen states have approved the other costs related to production. The pricecommercial sale of E15. As such, we do not anticipate that E15 will impact ethanol demand or pricing in the near term. Rather, management believes consumer acceptance of E15 and flex fuel vehicles, along with continued growth of E85, is necessary before ethanol can achieve any market growth beyond the blend wall. As industry production capacity reaches the blend wall, the supply of ethanol in the market may surpass the demand which in turn may negatively impact prices.
According to the Renewable Fuel Association (RFA), ethanol production was 13.3 billion gallons in 2013 compared with production of 13.2 billion gallons in 2012 and 13.8 billion gallons mandated by Renewable Fuel Standard’s (RFS) 2013 renewable volume requirement. In November 2013 the EPA issued a proposed rule that would reduce the 2014 renewable volume obligation ("RVO") to 13.0 billion gallons of corn-based renewable fuel. Although the EPA has historically fluctuatedpreviously set the RVO for cellulosic biofuels below the mandated volume for such fuels in past program years, the proposed 2014 RFS rule would be the first time that the corn-based renewable fuel and total renewable fuel RVOs have been set below the legislated targets. As presently proposed, the 2014 RVO would be 1.4 billion gallon below the statutory RVO for 2014 and 800 million gallons less than the 2013 RVO. The proposal was subject to a 60-day comment period which ended in January 2014. The EPA plans to release the final version of the 2014 RVOs in June 2014. If the EPA's proposal becomes a final rule, or if RFS were to be otherwise reduced or eliminated by the exercise of the EPA's waiver authority or by Congress, the demand for ethanol may decrease.
High demand on the rail industry due to high volumes of corn, oil and coal rail shipments and a harsh winter which saw record cold and snow have resulted in industry-wide delays and logistical problems. These delays have caused many ethanol plants to slow or suspend production due to inability to secure railcars to transport their ethanol to market. Our plant has not experienced any material delays from the rail congestion problems. Recently, rail congestion and delays have lessened recently as spring weather conditions improved. However, management believes that slower rail shipping may continue through late spring and may continue to impact ethanol producers unless rail shipping capacity increases to meet the increased demand. If rail delays and congestion continue, we may begin to see material impacts to our plant if we run out of ethanol storage capacity and we are forced to reduce or cease production.
Other factors that may affect our future results of operation include those factors below in our Results of Operations of this Form 10-Q and those discussed in “Item 1. Business” and “Item 1A. Risk Factors” of our Annual Report on Form 10-K for the year ended October 31, 2013, and in other filings we make with the price of petroleum-based products such as unleaded gasoline, heating oilSecurities and crude oil. The price of distillers grains has historically been influenced by the price of corn as a substitute livestock feed. We expect these price relationships to continue for the foreseeable future, although recent volatility in the commodities markets makes historical price relationships less reliable. Our largest costs of production are corn, natural gas, depreciation and manufacturing chemicals. Our cost of corn is largely impacted by geopolitical supply and demand factors and the outcome of our risk management strategies. Prices for natural gas, manufacturing chemicals and denaturant are tied directly to the overall energy sector, crude oil and unleaded gasoline.Exchange Commission.
As of the date of this report, we have 37 full time employees. Ten of these employees are involved primarily in management and administration. The remaining employees are involved primarily in plant operations. We do not currently anticipate any significant change in the number of employees at our plant.
Results of Operations for the Three Months Ended April 30, 20132014 and 20122013
The following table shows the results of our operations and the approximate percentage of revenues, costs of goods sold, operating expenses and other items to total revenues infrom our unaudited consolidated statements of operations for the three months ended April 30, 20132014 and 20122013:. Due to the acquisition of a majority ownership of HLBE on July 31, 2013, the following table includes the consolidated amounts of GFE and HLBE for the three months ended April 30, 2014.
|
| | | | | | | | | | | | | |
| | 2013 | | 2012 |
| Income Statement Data | Amount | | % | | Amount | | % |
| Revenue | $ | 48,020,602 |
| | 100.0 | % | | $ | 39,025,122 |
| | 100.0 | % |
| Cost of Goods Sold | 44,390,630 |
| | 92.4 | % | | 38,367,706 |
| | 98.3 | % |
| Gross Profit | 3,629,972 |
| | 7.6 | % | | 657,416 |
| | 1.7 | % |
| Operating Expenses | 582,965 |
| | 1.2 | % | | 590,481 |
| | 1.5 | % |
| Operating Income | 3,047,007 |
| | 6.4 | % | | 66,935 |
| | 0.2 | % |
| Other Income (Expense), net | (15,064 | ) | | — | % | | 49,531 |
| | 0.1 | % |
| Net Income | $ | 3,031,943 |
| | 6.4 | % | | $ | 116,466 |
| | 0.3 | % |
|
| | | | | | | | | | | | | | | |
| | | Three Months Ended | | Three Months Ended | |
| | | April 30, 2014 | | April 30, 2013 | |
| | Income Statement Data | Amount | | % | | Amount | | % | |
| | Revenue | $ | 81,324,024 |
| | 100.0 | % | | $ | 48,020,602 |
| | 100.0 | % | |
| | Cost of Goods Sold | 63,111,765 |
| | 77.6 | % | | 44,390,630 |
| | 92.4 | % | |
| | Gross Profit | 18,212,259 |
| | 22.4 | % | | 3,629,972 |
| | 7.6 | % | |
| | Operating Expenses | 1,379,875 |
| | 1.7 | % | | 582,965 |
| | 1.2 | % | |
| | Operating Income | 16,832,384 |
| | 20.7 | % | | 3,047,007 |
| | 6.4 | % | |
| | Other Expense, net | (73,249 | ) | | (0.1 | )% | | (15,064 | ) | | (0.1 | )% | |
| | Net Income | 16,759,135 |
| | 20.6 | % | | 3,031,943 |
| | 6.3 | % | |
| | Net Income Attributable to Noncontrolling Interest | 2,509,722 |
| | 3.1 | % | | — |
| | — | % | |
| | Net Income Attributable to Granite Falls Energy, LLC | $ | 14,249,413 |
| | 17.5 | % | | $ | 3,031,943 |
| | 6.3 | % | |
Revenues
OurNearly all of our revenues from operations come from three primary sources: sales of fuel ethanol, sales of distillers grains and sales of corn oil. The remaining 0.5% is made up of incidental sales of syrup at HLBE's plant and revenues from Agrinatural Gas, LLC, a pipeline company, of which HLBE owns 73% of the outstanding membership interests. Our results of operations will continue to beare affected by volatility in the commodity markets. In the event that we experience a prolonged period of negative operating margins, our liquidity may be negatively impacted.
Revenues increased by 69.4% for the three months ended April 30, 2014 as compared to the three months ended April 30, 2013. Management attributes this increase in revenues primarily to an increase in the quantities sold as a result of our indirect acquisition of HLBE, since its results of operations were not consolidated into our statements of operations until the fourth fiscal quarter in 2013.
The following table shows the sources of our consolidated revenue for the three months ended April 30, 2014 (unaudited):
|
| | | | | | | | |
| | Revenue Sources | Amount | | Percentage of Total Revenues | |
| | Ethanol sales | $ | 64,627,382 |
| | 79.5 | % | |
| | Distillers grains sales | 14,698,434 |
| | 18.0 | % | |
| | Corn oil sales | 1,602,775 |
| | 2.0 | % | |
| | Miscellaneous other | 395,433 |
| | 0.5 | % | |
| | Total Revenues | $ | 81,324,024 |
| | 100.0 | % | |
The following table shows the sources of our revenue for the three months ended April 30, 2013 (unaudited):
|
| | | | | | | | |
| | Revenue Sources | Amount | | Percentage of Total Revenues | |
| | Ethanol sales | $ | 37,209,376 |
| | 77.5 | % | |
| | Distillers grains sales | 9,546,923 |
| | 19.9 | % | |
| | Corn oil sales | 1,264,303 |
| | 2.6 | % | |
| | Total Revenues | $ | 48,020,602 |
| | 100.0 | % | |
The following table showsRevenues from ethanol sales at the sources of our revenueGFE plant decreased by 9.5% for the three months ended April 30, 20122014:
|
| | | | | | | |
| Revenue Sources | Amount | | Percentage of Total Revenues |
| | | | |
| Ethanol sales | $ | 31,250,125 |
| | 80.1 |
| % |
| Distillers grains sales | 6,860,000 |
| | 17.6 |
| % |
| Corn oil sales | 914,997 |
| | 2.3 |
| % |
| Total Revenues | $ | 39,025,122 |
| | 100.0 |
| % |
In as compared to the same period in 2013, due to a decrease of 2.7% in the volumes sold from the GFE plant and decrease in the average price received at the GFE plant per gallon of 7.0% from period to period. However, our total ethanol sales increased from period to period due to an increase in total volume of ethanol sold as a result of the HLBE acquisition and increase in net ethanol revenues at the HLBE plant. Net ethanol revenues at the HLBE plant increased 15.3% for the three month periodmonths ended April 30, 20132014, as compared to the same period in 2013, despite a decrease of approximately 7.4% in the price per gallon received at the HLBE plant due to a 24.5% increase in the gallons of ethanol sales comprised 77.5% of our revenues and distillers grains sales comprised 19.9% percent of our revenues, while corn oil sales comprised 2.6% of our revenues. Forsold at the HLBE plant from period to period. There were no ethanol derivative gains or losses during the three month periodmonths ended April 30, 20122014, ethanol sales comprised 80.1% of our revenue, distillers grains sales comprised 17.6% of our revenue, while corn oil sales comprised 2.3% of our revenues. and 2013.
TheAlthough the average ethanol sales price we received for the three month period ended April 30, 2013 was approximately 12.7% higher than our average ethanol sales price for the comparable 2012 period. Management attributes the increase in our average ethanol sales price to decreased ethanol inventories and a decrease in ethanol production in the industry compared to the prior year. Downward pressure on ethanol prices throughout much of calendar year 2012, combined with increased corn prices particularly during the last half of calendar 2012, have caused some ethanolboth plants to suspend or reduce production, leading to the decrease in ethanol inventories and production. As ethanol prices increase, some plants that have suspended or reduced production may resume or increase production, which may once again pressure ethanol prices downward. Management anticipates that the price of ethanol will continue to be volatile during the remainder of our 2013 fiscal year. Our volume of ethanol soldwas lower during the three month period ended April 30, 20132014 as compared to the same period in 2013, there was approximately 5.7%a favorable spread between the price of ethanol and the price of corn. Management attributes the drop in ethanol prices to continuing lower corn prices due to the record 2013 corn crop. Management anticipates that ethanol prices will continue to change in relation to changes in corn and energy prices. However, the decline in ethanol prices less than the decline in corn prices as a result of reduced ethanol production across the industry due to rail congestion, increased demand for gasoline, increased ethanol exports and decreased imports, which has resulted in lower US ethanol stocks. These factors have created a positive price spread and operating margins. Management anticipates that the favorable price spread between ethanol and corn will continue until the supply and demand balance for ethanol returns to more traditional levels.
Demand for ethanol is also impacted by regulatory developments and United States gasoline consumption. Although gasoline consumption was higher than expected during the volume soldpast quarter and the approaching summer months typically experience a seasonal increase in gasoline consumption, reduced gasoline demand has occurred in the past and could occur in the future as a result of increased gasoline or oil prices. Additionally, the EPA is expected to release the final 2014 RFS RVO before June 30, 2014. Management believes that if the EPA's final rule reduces the 2014 RVOs from statutory levels as proposed in November 2013, domestic demand for the comparable 2012 period as weethanol could decline and ethanol prices may decrease. Any of these outcomes could have continued to increase production efficiencies.a material adverse effect on our results of operations, cash flows and financial condition.
Distillers Grains
Total revenue from the sales of distillers grains represented a larger portion of our revenuesat the GFE plant decreased by 39.9% during the three months ended April 30, 20132014 compared to the same period of 20122013, due to a decrease of 13.3% in the volumes sold from the GFE plant and decrease in the average price received at the GFE plant per gallon of 14.3% from period to period. However, our total distillers grains sales increased from period to period due to an increase in total tons of distillers grains sold as a result of higher prices and greater quantitiesthe HLBE acquisition. The tons of distillers grains produced and sold duringHLBE plant increased 63.1% for the three months ended April 30, 20132014 as compared to the same period in 2013, however, this volume increase was partially offset by a decrease of 2012. The price we received for our dried distillers grainsapproximately 30.7% in the three monthprice per tone received at the HLBE plant from period ended to period.April 30, 2013 was approximately 34.0% higher than the price we received during the three months ended April 30, 2012.
Management believes these higherlower distillers grains prices are primarily a result of the highdecline in the price of corn, as market prices for distillers grains tend to move directionally with the prices of other livestock feed products available to livestock producers.products. We anticipate that the market price of our dried distillers grains will continue to be volatile as a result oftrack changes in the price of corn and competing animal feed substitutes such as soybean meal. VolatilityHowever, volatility in distillers grains supplies related to changes in ethanol production is another factor thatforeign demand for distillers grains in Asia may impact the sales price of our distillers grains. Additionally, our quantitypush prices further down. In particular, China has recently rejected shipments of distillers grains soldthat contained a non-approved GMO trait. Any additional rejections of shipments by the Chinese may adversely impact US prices. In addition, if plants that have suspended or reduced production due to rail shipping bottlenecks are able to resume or increase production, distillers grains prices may be negatively impacted.
Corn Oil
Total corn oil sales increased approximately 3.9% in the three month period ended April 30, 2013 compared toby 26.8%, for the three months ended April 30, 2012. This increase in quantity sold was largely a result of increased production during the three months ended April 30, 2013 as compared to the three months ended April 30, 2012. The price and quantity increases resulted in distillers grains sales comprising a larger percentage of our total revenues during the three months ended April 30, 2013 relative to the same period during the prior year, despite increases in the price and quantity sold of ethanol discussed above.
Corn oil represented a greater portion of our revenues during the three months ended April 30, 2013 than it did for the same period of 2012. Corn oil sales accounted for approximately 2.6% of our revenues during our quarter ended April 30, 2013 compared to 2.3% for our quarter ended April 30, 2012. The price we received for our corn oil decreased by approximately 9.4% during the three months ended April 30, 20132014 compared to the same period of 2012. However, offsetting this price decrease, our total volume2013. The increase was due an increase in aggregate amount of corn oil sold increased by 52.5% as a result higher production rates at our facility and increased extraction efficiencies. Management attributesdue to the decrease in corn oil prices to additional corn oil enteringsales as result of HLBE acquisition despite a decrease of 16.5% in the market. However, increased use of cornprice per pound received by the Company from period to period. Corn oil by biodiesel producersprices could experience further decreases if additional plants enter into the market and animal feeders have continued to support demand.cause in an oversupply unless additional demand can be created.
Cost of Goods Sold
Our costs of goods sold as a percentage of revenues were 92.4%77.6% for the three month period ended April 30, 20132014 compared to 98.3%92.4% for the same period of 2012.2013. Our two largest costs of production are corn (83.7%(72.0% of cost of goods sold for our three months ended April 30, 20132014) and natural gas (4.0%(8.7% of cost of goods sold for our three months ended April 30, 20132014). Our total cost of goods sold increased to approximately $44,390,63063.1 million for the three months ended April 30, 20132014 from approximately $38,367,70644.4 million in the three months ended April 30, 20122013.
Corn
The volume of corn we processed was up 3.3%91.0% for the three months ended April 30, 20132014 as compared to the same period for our 20122013 fiscal year. Additionally, ouryear due primarily to the acquisition of HLBE. Total corn ground at the GFE plant decreased by 4.6% and the average price paid per bushel of corn, costs increased by approximately 11.8%net of hedging activity, for the three
monthsGFE plant was approximately $2.94 less for the quarter ended April 30, 20132014 as compared to the same period ended April 30, 2013. Total corn ground at the HLBE plant increased by approximately 5.1% for our 2012 fiscal year. Tight corn supply following last growing season's drought has continued to place upward pressure on corn prices. Although the 2012 drought did not impact corn production in Minnesotaquarter ended April 30, 2014 as compared to the same extent as otherquarter of April 30, 2013 due to decreased production at HLBE's plant in 2013 when margins were poor. This increase was offset by a decrease in corn producing states, as aprices paid at the HLBE plant of approximately 38.8% from period to period.
Management believes that the significant decrease in corn prices is largely attributable to the record 2013 corn harvest and sufficient local consumer of corn we must nevertheless be cost competitive when sourcing corn in order to procure sufficient quantities for ethanol production. Management anticipatessupplies. We expect that corn prices will remain high for the duration ofstay lower through our 2013 fiscal year.third quarter due to 2014 corn crop projections. The USDA's World Agricultural Supply and Demand Estimates published on May 10, 20139, 2014 projects domestic corn production of 14.1413.9 billion bushels for the 20132014 growing season, which would be a significantslight increase over the estimate2013 harvest. In addition, the USDA estimates that 95% of 10.78 billion bushels produced during the 2012 growing season. However,2014 corn planting in several Midwestern states has been behind historical pacewas complete as of June 1. However, corn prices may be volatile during the 2014 growing season depending on weather, world supply and demand, current and anticipated stocks, and other factors. If corn prices were to increase as a result of such volatility, our ability to generate income may be negatively impacted due to wet conditions.the higher cost of operating our plant.
ForRealized and unrealized gains related to our corn derivative instruments totaled approximately $1,643,000 for the three month periodmonths ended April 30, 2014, which decreased our cost of goods sold. By comparison, we experienced losses of $249,000 for the three months ended April 30, 2013, we experienced an increase related to our corn derivative instruments, which increased our cost of approximately 21.1% in our overall natural gas costs compared to the same period of 2012 as a result of increases in natural gas prices and our quantity of natural gas consumed. Natural gas prices continue to remain low compared to historic averages. We expect the market price for natural gas to remain steady in the near term as we continue to enjoy an abundant supply of domestic natural gas, due in part to the continued commissioning of new, highly productive natural gas wells.
We occasionally engage in hedging activities with respect to corn.goods sold. We recognize the gains or losses that result from the changes in the value of our derivative instruments from corn in cost of goods sold as the changes occur. As corn prices fluctuate, the value of our derivative instruments are impacted, which affects our financial performance. We anticipate continued volatility in our cost of goods sold due to the timing of the changes in value of the derivative instruments relative to the cost and use of the commodity being hedged.
Natural Gas
For the three month period ended April 30, 2014, we experienced an increase of approximately 381.1% in our overall natural gas costs compared to the same period of 2013. This increase was primarily the result of the HLBE acquisition (approximately $4.3 million increase); although we also experienced a 133.9% increase in natural gas costs at our Granite
Falls plant for the quarter ended April 30, 2014 compared to the same period for the prior year as a result of the increase in natural gas prices. Natural gas prices increased significantly during the quarter then backed off slightly towards the end of the quarter. Management anticipates that natural gas prices will hold steady or slowly decline as we move into summer months. However, if the natural gas industry experiences production problems, supply disruptions from hurricane activity, or if there are large increases in natural gas demand that limits the amount of gas that can be injected into storage ahead of winter demand, we may experience significant increases in natural gas prices.
Operating Expenses
Our operating expenses as a percentage of revenues increased to 1.7% for the three month period ended April 30, 2014 up from 1.2% for the same period ended April 30, 2013. Operating expenses include salaries and benefits of administrative employees, insurance, taxes, professional fees and other general administrative costs. We continue to focus on increasing our operating efficiency and we strive to lower our operating expenses. We expect that going forward our operating expenses will remain relatively steady.
Operating Income
We had income from operations of $16.8 million for the three months ended April 30, 2014, compared to income from operations of $3.0 million for the three months ended April 30, 2013. This increase in our operating income is primarily due to the increase in the amount of ethanol sold due the HLBE acquisition and more favorable operating margins.
Other Expense, Net
Our other expense, net for the three months ended April 30, 2014 was approximately $73,000, compared to an expense of approximately $15,000 for the three months ended April 30, 2013. This change is primarily a result of increased interest expense during the quarter ended April 30, 2014 as compared to the same period the prior year, attributable to HLBE borrowings on its AgStar credit facilities.
Results of Operations for the Six Months Ended April 30, 2014 and 2013
The following table shows the results of our operations and the percentage of revenues, cost of goods sold, operating expenses and other items to total revenues in our unaudited consolidated statement of operations for the six months ended April 30, 2014 and 2013:
|
| | | | | | | | | | | | | | | |
| | | Six Months Ended | | Six Months Ended | |
| | | April 30, 2014 | | April 30, 2013 | |
| | Income Statement Data | Amount | | % | | Amount | | % | |
| | Revenue | $ | 158,787,837 |
| | 100.0 | % | | $ | 95,137,724 |
| | 100.0 | % | |
| | Cost of Goods Sold | 126,155,119 |
| | 79.4 | % | | 90,675,608 |
| | 95.3 | % | |
| | Gross Profit | 32,632,718 |
| | 20.6 | % | | 4,462,116 |
| | 4.7 | % | |
| | Operating Expenses | 2,675,376 |
| | 1.7 | % | | 1,145,660 |
| | 1.2 | % | |
| | Operating Income | 29,957,342 |
| | 18.9 | % | | 3,316,456 |
| | 3.5 | % | |
| | Other Expense, net | (293,135 | ) | | (0.2 | )% | | (63,086 | ) | | (0.1 | )% | |
| | Net Income | 29,664,207 |
| | 18.7 | % | | 3,253,370 |
| | 3.4 | % | |
| | Net Income Attributable to Noncontrolling Interest | 4,859,850 |
| | 3.1 | % | | — |
| | — | % | |
| | Net Income Attributable to Granite Falls Energy, LLC | $ | 24,804,357 |
| | 15.6 | % | | $ | 3,253,370 |
| | 3.4 | % | |
Revenues
The following table shows the sources of our revenue for the six months ended April 30, 2014:
|
| | | | | | | | |
| | Revenue Sources | Amount | | Percentage of Total Revenues | |
| | | | | | |
| | Ethanol sales | $ | 124,707,363 |
| | 78.5 | % | |
| | Distillers grains sales | 218,812,230 |
| | 137.8 | % | |
| | Corn oil sales | 3,425,148 |
| | 2.2 | % | |
| | Miscellaneous other | (188,156,904 | ) |
| (118.5 | )% | |
| | Total Revenues | $ | 158,787,837 |
| | 100.0 | % | |
The following table shows the sources of our revenue for the six months ended April 30, 2013:
|
| | | | | | | | |
| | Revenue Sources | Amount | | Percentage of Total Revenues | |
| | | | | | |
| | Ethanol sales | $ | 72,495,495 |
| | 76.2 | % | |
| | Distillers grains sales | 20,251,604 |
| | 21.3 | % | |
| | Corn oil sales | 2,390,625 |
| | 2.5 | % | |
| | Total Revenues | $ | 95,137,724 |
| | 100.0 | % | |
Our total revenues were higher for the six months ended April 30, 2014 compared to the same period of 2013. With respect to ethanol, we sold approximately 92.0% more gallons of ethanol during the six months ended April 30, 2014 than we did in the same period of 2013 due primarily to the increase in the gallons of ethanol sold as a result of the HLBE acquisition. However, the average price we received for our ethanol was approximately 10.4% lower for the six months ended April 30, 2014 compared to the same period of 2013.
Total sales of distillers grains during the six months ended April 30, 2014 were up approximately 8.0% compared to the same period of 2013. This increase is primarily due to a 36.4% increase in the tons sold for the six months ended April 30, 2014 compared to the same period of 2013, which was offset by a 20.8% decline in the average price we received for our distillers grains from period to period.
We sold approximately 64.6% more pounds of corn oil during the first six months ended April 30, 2014 compared to the same period of 2013. However, offsetting our increase in corn oil sales due the HLBE acquisition, our average price per pound of corn oil decreased by approximately 12.9% for the six months ended April 30, 2014 compared to the same period of 2013.
Cost of Goods Sold
Our costs of goods sold were higher for the six months ended April 30, 2014 compared to the same period of 2013. However, our costs of good sold as a percentage of our revenues decreased for the six months ended April 30, 2014 compared to the same period of 2013. Our average cost per bushel of corn was approximately 7.6% higher during the six months ended April 30, 2014 compared to the same period of 2013. Additionally, we ground approximately 4.3% more corn during the six months ended April 30, 2014 compared to the same period of 2013 due to our increased production.
Our natural gas costs increased during the six months ended April 30, 2014 compared to the same period of 2013. Our total cost of natural gas was approximately 15.8% higher during the six months ended April 30, 2014 compared to the same period of 2013. This increase was primarily the result increase in MMBTUs used due to the HLBE acquisition and a significant increase in natural gas prices for the quarter ended April 30, 2014 compared to the same period for the prior year.
We experienced an approximate $249,000$1,603,000 combined realized and unrealized lossgain for the three month periodsix months ended April 30, 2014 related to our corn derivative instruments, which decreased our cost of goods sold. By comparison, we experienced an approximately $27,000 combined realized and unrealized gain for the six months ended April 30, 2013 related to our corn derivative instruments, which increased our cost of goods sold. By comparison, we experienced an approximate $31,000 combined realized and unrealized loss for the three months ended April 30, 2012 related to our corn derivative instruments, which increaseddecreased our cost of goods sold. We recognize the gains or losses that result from the changes in the value of our derivative instruments from corn in cost of goods sold as the changes occur. As corn prices fluctuate, the value of our derivative instruments are impacted, which affects our financial performance.
Operating Expense
Our operating expenses as a percentage of revenues decreased to 1.2% for the three month period ended April 30, 2013 from 1.5% for the same period ended April 30, 2012. Our total operating expenses for the three months ended April 30, 2013 as compared to the same period for our 2012 fiscal year decreased slightly. We continue to focus on increasing our operating efficiency and we strive to lower our operating expenses.
Operating Income
Our income from operations for the three months ended April 30, 2013 was approximately $3,047,000, compared to income from operations of approximately $67,000 for the three months ended April 30, 2012. This increase in our operating income is primarily due to more favorable operating margins.
Other Income (Expense), Net
Our other income (expense), net for the three months ended April 30, 2013 was an expense of approximately $15,000, compared to income of approximately $50,000 for the three months ended April 30, 2012. This change is primarily a result of increased interest expense during the quarter ended April 30, 2013 as compared to the same period the prior year, attributable to borrowings on our United FCS credit facilities.
Results of Operations for the Six Months Ended April 30, 2013 and 2012
The following table shows the results of our operations and the percentage of revenues, cost of goods sold, operating expenses and other items to total revenues in our statement of operations for the six months ended April 30, 2013 and 2012:
|
| | | | | | | | | | | | | |
| | 2013 | | 2012 |
| Income Statement Data | Amount | | % | | Amount | | % |
| Revenue | $ | 95,137,724 |
| | 100.0 | % | | $ | 82,770,898 |
| | 100.0 | % |
| Cost of Goods Sold | 90,675,608 |
| | 95.3 | % | | 78,425,531 |
| | 94.8 | % |
| Gross Profit | 4,462,116 |
| | 4.7 | % | | 4,345,367 |
| | 5.2 | % |
| Operating Expenses | 1,145,660 |
| | 1.2 | % | | 1,254,217 |
| | 1.5 | % |
| Operating Income | 3,316,456 |
| | 3.5 | % | | 3,091,150 |
| | 3.7 | % |
| Other Income (Expense), net | (63,086 | ) | | (0.1 | )% | | 67,604 |
| | 0.1 | % |
| Net Income | $ | 3,253,370 |
| | 3.4 | % | | 3,158,754 |
| | 3.8 | % |
Revenues
The following table shows the sources of our revenue for the six months ended April 30, 2013:
|
| | | | | | |
| Revenue Sources | Amount | | Percentage of Total Revenues |
| | | | |
| Ethanol sales | $ | 72,495,495 |
| | 76.2 | % |
| Distillers grains sales | 20,251,604 |
| | 21.3 | % |
| Corn oil sales | 2,390,625 |
| | 2.5 | % |
| Total Revenues | $ | 95,137,724 |
| | 100.0 | % |
The following table shows the sources of our revenue for the six months ended April 30, 2012:
|
| | | | | | |
| Revenue Sources | Amount | | Percentage of Total Revenues |
| | | | |
| Ethanol sales | $ | 67,447,635 |
| | 81.5 | % |
| Distillers grains sales | 13,562,618 |
| | 16.4 | % |
| Corn oil sales | 1,760,645 |
| | 2.1 | % |
| Total Revenues | $ | 82,770,898 |
| | 100.0 |
|
Our total revenues were higher for the six months ended April 30, 2013 compared to the same period of 2012. With respect to ethanol, we sold approximately 4.5% more gallons of ethanol during the six months ended April 30, 2013 than we did in the same period of 2012. Additionally, the price we received for our ethanol was approximately 2.8% higher for the six months ended April 30, 2013 compared to the same period of 2012.
The average price we received for our distillers grains was approximately 35.1% higher for the first six months of our 2013 fiscal year compared to the same period of 2012. We also sold approximately 10.5% more tons of distillers grains during the first six months of our 2013 fiscal year compared to the same period of 2012.
We sold approximately 51.2% more pounds of corn oil during the first six months of our 2013 fiscal year compared to the same period of 2012. However, offsetting our increase in corn oil sales, our average price per pound of corn oil decreased by approximately 10.2% for the first six months of our 2013 fiscal year compared to the same period of 2012.
Cost of Goods Sold
Our costs of goods sold were significantly higher for the first six months of our 2013 fiscal year compared to the same period of our 2012 fiscal year. Additionally, our costs of good sold as a percentage of our revenues were higher for the first six months of our 2013 fiscal year compared to the same period of our 2012 fiscal year. Our average cost per bushel of corn was approximately 11.9% higher during the first six months of our 2013 fiscal year compared to the same period of 2012. Additionally, we ground approximately 6.3% more corn during the first six months of our 2013 fiscal year compared to the same period of 2012 due to our increased production.
Our natural gas costs increased during the first six months of our 2013 fiscal year compared to the same period of 2012. Our total cost of natural gas was approximately 8.2% higher during the first six months of our 2013 fiscal year compared to the same period of 2012.
We experienced an approximate $27,000 combined realized and unrealized gain for the six months ended April 30, 2013 related to our corn derivative instruments, which decreased our cost of goods sold. By comparison, we experienced an approximately $1,301,000 combined realized and unrealized loss for the six months ended April 30, 2012 related to our corn derivative instruments, which increased our cost of goods sold. We recognize the gains or losses that result from the changes in the value of our derivative instruments from corn, natural gas, and denaturant in cost of goods sold as the changes occur. As corn prices fluctuate, the value of our derivative instruments are impacted, which affects our financial performance.
Operating Expenses
Our total operating expenses and our operating expenses as a percentage of revenues decreasedincreased in the six months ended April 30, 20132014 when compared to the same period ended April 30, 20122013. The decreaseincrease in our operating expenses for the six months ended April 30, 20132014 as compared to the same period for ourof 20122013 fiscal year is due primarily to a decrease in personnel expenses following the accrualour acquisition of our former Chief Executive Officer's bonus and vacation during the six months ended April 30, 2012 in connection with his departure from the Company, as well as a decrease in professional service expense in the six months ended April 30, 2013 compared to the six months ended April 30, 2012, when we conducted studies related to our rail infrastructure and water intake.HLBE.
Other Income (Expense), Net
We had other expense, net for the six months ended April 30, 20132014 of $63,086approximately $293,000 compared to other income,expense, net of $67,604approximately $63,000 for the six months ended April 30, 20122013. This change resulted primarily from increased interest expense during the six months ended April 30, 20132014 as compared to the same period the prior year, attributable to HLBE borrowings on our United FCSits AgStar credit facilities.facilities, which was partially offset by increased miscellaneous income.
Changes in Financial Condition for the Six Months Ended April 30, 20132014
The following table highlights our financial condition at April 30, 20132014 and October 31, 20122013:
|
| | | | | | |
| | April 30, 2013 | October 31, 2012 |
| Current Assets | $ | 21,065,272 |
| $ | 20,715,050 |
|
| Current Liabilities | $ | 6,696,111 |
| $ | 6,002,937 |
|
| Long-Term Debt | $ | 553,789 |
| $ | 5,274,870 |
|
| Members' Equity | $ | 53,108,695 |
| $ | 49,855,325 |
|
|
| | | | | | | | |
| | | April 30, 2014 | October 31, 2013 | |
| | Current Assets | $ | 38,222,126 |
| $ | 21,469,978 |
| |
| | Total Assets | $ | 126,705,606 |
| $ | 112,673,222 |
| |
| | Current Liabilities | $ | 15,126,786 |
| $ | 11,323,264 |
| |
| | Long-Term Debt | $ | 18,970,883 |
| $ | 32,981,955 |
| |
| | Members' Equity Attributable to Granite Falls Energy, LLC | $ | 79,182,623 |
| $ | 59,887,346 |
| |
| | Non-controlling Interest | $ | 13,425,314 |
| $ | 8,480,657 |
| |
TotalOur total current assets were approximately $60,359,000$38.2 million at April 30, 20132014 compared to approximately $61,133,000$21.5 million at October 31, 20122013. IncludedWe experienced an increase in our total assets is an approximate $540,000 decrease in landcash on hand of $14.0 million and improvements resulting from our sale of land and a net increasetrade accounts receivable of approximately $1,645,000 in rail improvements and construction in progress. The additions in property, plant and equipment were offset with additional depreciation of approximately $2,318,000.
Current assets totaled approximately $21,065,000$6.0 million at April 30, 2014 as compared to October 31, 2013, which is more thanwas partially offset by a decrease of approximately $3.4 million in the value of our current assets as ofinventory at April 30, 2014 compared to October 31, 20122013, which totaled approximately $20,715,000. The increase is primarily due to increaseshaving more corn and ethanol on hand at October 31, 2013. We also experienced an increase in inventory and cash, offset slightly by a decrease in accounts receivable.commodity derivative instruments of approximately $0.4 million at April 30, 2014 as compared to October 31, 2013.
Total current liabilities increased and totaled approximately $6,696,000$15.1 million at April 30, 20132014 and, a increase of approximately $6,003,000 at$3.8 million from October 31, 20122013. This increase was mainly due to an increase in the current portion of our long-term debt and our accounts payable of approximately $4.1 million and $2.1 million, respectively, at April 30, 2014 as compared to October 31, 2013. This increase in the current portion of our long-term debt and our accounts payable for corn was partially offset by an decrease in corn payable to FCE slightlyof approximately $2.6 million at April 30, 2014 as compared to October 31, 2013. The increase in current portion of our long-term debt was a result of the reclassification of HLBE's subordinated convertible debt as part of our current liabilities due to HLBE's intent at April 30, 2014 to exercise the right to call for redemption of the subordinated convertible debt effective July 1, 2014. The increase in our accounts payable is due to to the quantity and amounts of corn payable in both GFE and HLBE, and the termination of the HLBE corn supply agreement with Gavilon, its former procurement contractor. Since terminating the corn supply agreement, HLBE is buying their own corn and longer netting corn purchases with sales of ethanol and distillers grain.
Our long-term debt decreased approximately $14,011,000 from October 31, 2013 to April 30, 2014. The decrease is due to our paying the balance of our Capital One Shuttlewagon Railcar Mover note, payments on HLBE’s debt facilities and the reclassification of HLBE's subordinated convertible debt to a current liability as discussed above.
Members’ equity attributable to Granite Falls Energy, LLC totaled approximately $79.2 million at April 30, 2014, which is more than our members’ equity attributable to Granite Falls Energy, LLC as of October 31, 2013 which totaled approximately $59.9 million. The increase was directly related to the net income attributable to Granite Falls Energy, LLC of approximately $24.8 million for the six months ended April 30, 2014. The net income was offset by a decreasethe declaration and payment of $5,509,080 in ourdistributions to members during the quarter ended January 31, 2014.
accounts payable. Long-term debt decreased fromNoncontrolling interest totaled approximately $5,275,000$13.4 million at April 30, 2014 compared to approximately $8.5 million at October 31, 20122013. This is directly related to recognition of the 39.2% to approximately $554,000noncontrolling interest in HLBE at April 30, 20132014 as we paid down amounts drawn on our long-term revolving credit facilityand net income attributable to the noncontrolling interest during the six months ended April 30, 20132014.
Plant Operations
We are currently producing fuel-grade ethanol, distillers grains and crude corn oil for sale. Our plant has an approximate annual production capacity of 60 million gallons of denatured ethanol. We have obtained an amendment to our environmental permits allowing us to produce up to 70 million gallons of undenatured ethanol on a twelve month rolling sum basis. We intend to continue working to increase production to take advantage of the additional capacity our permits allow us to produce. Any plant bottlenecks are assessed and a cost benefit analysis is performed prior to further capital investment.
We have completed several de-bottlenecking projects and we are in the process of completing our remaining projects. Each of these projects help our facility to be more efficient, productive and improve the environmental aspects of our process. For the three and six month periods ended April 30, 2013 we have incurred approximately $704,000 and $1,032,000, respectively, in costs associated with our equipment construction projects. For the three and six month periods ended April 30, 2012 we incurred approximately $500,000 and $900,000, respectively, in costs associated with our equipment construction projects. Since starting our de-bottlenecking projects we have incurred approximately $6,167,000 associated with the cost of these equipment improvements.
We expect to have sufficient cash generated by continuing operations and current lines of credit to cover our usual operating costs, which consist primarily of our corn supply, our natural gas supply, de-bottlenecking projects, staffing expense, office expense, audit and legal compliance, working capital costs and debt service obligations.
Trends and Uncertainties Impacting the Ethanol and Distillers Grains Industries and Our Future Revenues
Our revenues primarily consist of sales of the ethanol and distillers grains we produce; however, we also realize revenue from the sale of corn oil we separate from our distillers syrup. The ethanol industry needs to continue to expand the market for ethanol and distillers grains in order to maintain current price levels.LIQUIDITY AND CAPITAL RESOURCES
The following charttable shows our cash flows for the averagesix months ended April 30, 2014 and 2013:
|
| | | | | | | |
| | | 2014 | | 2013 | |
| | Net cash provided by operating activities | 31,251,594 |
| | 6,611,899 |
| |
| | Net cash used in investing activities | (1,865,284 | ) | | (1,192,878 | ) | |
| | Net cash used in financing activities | (15,431,628 | ) | | (4,718,846 | ) | |
Operating Cash Flows.Cash provided by operating activities was approximately $31.3 million for the six months ended April 30, 2014, as compared to cash price per gallonprovided by operations of ethanolapproximately $6.6 million for the six months ended April 30, 2013. The increase was primarily related to our net income of $29.7 million for the six months ended April 30, 2014. Currently, our capital needs are being adequately met through cash flows from our operating activities and our currently available credit facilities.
Investing Cash Flows.Cash used in Minnesotainvesting activities was approximately $1.9 million for the six months ended April 30, 2014, compared to cash used in investing activities of approximately $1.2 million for the six months ended April 30, 2013. Our payments for capital expenditures during the six months ended April 30, 2014 totaled approximately $1.9 million, compared to payments of approximately $1.7 million for the six months ended April 30, 2013. Additionally, during the six months ended April 30, 2013 we received proceeds from January 2011 through June 1,the sale of land of approximately $540,000, as compared to proceeds of approximately $22,000 from the sales of equipment the six months ended April 30, 2014, when we did not sell any land.
Financing Cash Flows.Cash used in financing activities was approximately $15.4 million for the six months ended April 30, 2014, consisting primarily of payments made on our credit facilities and a distribution to our members. For the six months ended April 30, 2013, our cash used in financing activities was approximately $4.7 million, which consisted primarily of payments made on our credit facilities.
Indebtedness
Granite Falls Energy
In August 2012, we entered into two new credit facilities, one short-term and one long-term, with United FCS. CoBank serves as compiledadministrative agent for these new credit facilities.
The Company's credit facilities with United FCS require the Company to comply with certain financial covenants, including (i) maintaining working capital of at least $10,000,000, (ii) maintaining local net worth, defined as total assets, minus total liabilities, minus investments by the USDA Agricultural Marketing Service.Company in other entities, of at least $45,000,000, and (iii) achieving a debt service coverage ratio of at least 2.0 to 1.0. Our debt service coverage ratio is calculated as follows: (1) net income, plus depreciation and amortization, minus extraordinary gains (plus extraordinary losses), minus gain on asset sales (plus loss on asset sales); (2) divided by $2,000,000. As of April 30, 2014 and October 31, 2013, we were in compliance with these financial covenants and expect to be in compliance throughout fiscal 2014.
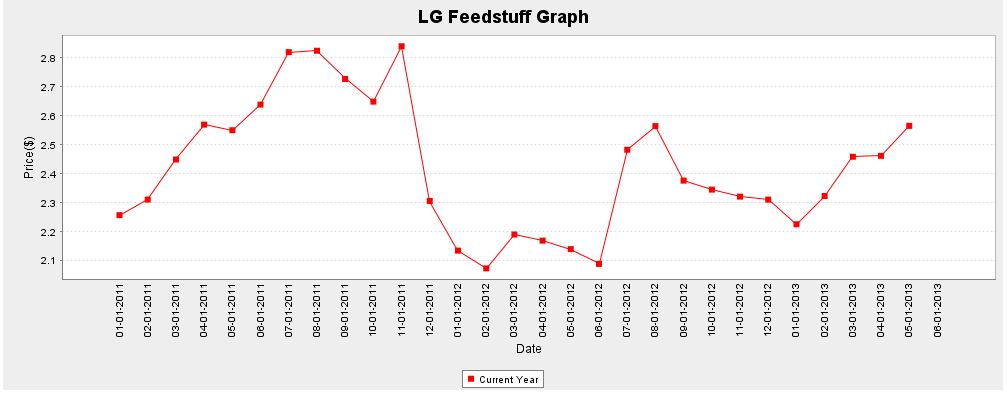
AccordingGFE Short-Term Debt Sources
The Company's short-term credit facility with United FCS is a revolving line of credit. This facility allows us to borrow, repay, and re-borrow up to $5,600,000 subject to outstanding letters of credit and a borrowing base calculation. Final payment of amounts borrowed under this credit facility is due August 1, 2014. The interest rate for the Company's short-term credit facility is based on the bank's "One Month LIBOR Index Rate" plus 2.8%. The short-term credit facility is available through March 31, 2017. As of April 30, 2014, there was no outstanding balance on the short-term credit facility.
We expect to utilize this credit facility to finance inventory and receivables as needed.
GFE Long-Term Debt Sources
The Company's long-term credit facility with United FCS is a revolving term loan. Under this facility, we may borrow, repay, and re-borrow up to $18,000,000. However, the amount available for borrowing under this facility reduces by $2,000,000 every six months, beginning September 1, 2014, with final payment due March 1, 2018. Interest on amounts borrowed is payable monthly in arrears. The interest rates for this facility is based on the bank's "One Month LIBOR Index Rate" plus 3.05%. The facility is available through March 31, 2018. As of April 30, 2014, there was no outstanding balance on the revolving term loan.
We have used this credit facility to fund our rail infrastructure improvement project and to meet working capital needs.
Other GFE Credit Arrangements
In December 2011, the Company purchased a Shuttlewagon Railcar Mover for use at its facility. The Company financed the entire purchase price through Capital One Equipment Leasing and Finance. In January 2014, the Company paid the loan balance in full.
Heron Lake BioEnergy
Credit Arrangements with AgStar
HLBE entered into an amended and restated master loan agreement with AgStar Financial Services, PCA ("AgStar") under which it has two forms of debt as of April 30, 2014: a term note and a revolving term note. HLBE's total indebtedness to AgStar as of April 30, 2014 was approximately $21.3 million (which includes a fair value premium of approximately $1.8 million), consisting of approximately $15.7 million under the term note and $0 under the revolving term note.
HLBE's loan agreements with AgStar are secured by substantially all business assets and are subject to various financial and non-financial covenants that limit distributions and debt and require minimum debt service coverage, net worth, and working capital requirements. HLBE was in compliance with the covenants of its loan agreements with AgStar as of April 30, 2014.
In the past, HLBE’s failure to comply with the covenants of the master loan agreement and failure to timely pay required installments of principal has resulted in events of default under the master loan agreement, entitling AgStar to accelerate and declare due all amounts outstanding under the master loan agreement. There can be no assurance that HLBE will be able to maintain compliance with its agreements with AgStar. Upon an occurrence of an event of default or an event that will lead to HLBE's default, AgStar may upon notice terminate its commitment to loan funds and declare the entire unpaid principal balance of the loans, plus accrued interest, immediately due and payable. An event of default includes, but is not limited to, HLBE's failure to make payments when due, insolvency, any material adverse change in HLBE's financial condition or HLBE's breach of any of the covenants, representations or warranties we have given in connection with the transaction.
AgStar Term Note
With respect to the Renewable Fuelsterm loan, HLBE must make equal monthly payments of principal and interest of approximately $223,000 on the term loan based on a 10-year amortization, provided the entire principal balance and accrued and unpaid interest on the term loan is due and payable in full on the maturity date of September 1, 2016. In addition, HLBE is required to make additional payments annually on debt for up to 25% of the excess cash flow, as defined by the agreement, up to $2 million per year. Through September 1, 2014, the loan bears interest at 5.25% as long as HLBE is in compliance with its debt covenants. On September 1, 2014, the interest on the term loan will be adjusted to LIBOR plus 3.50%, but the total interest rate shall not be less than 5.00%.
AgStar Revolving Term Note
With respect to the revolving term loan, the loan matures in September 2016. Amounts borrowed by HLBE under the term revolving loan can be repaid and may be re-borrowed at any time prior to maturity date of the term revolving loan, provided that outstanding advances may not exceed the amount of the term revolving loan commitment. Amounts outstanding on the term revolving loan bear interest at a variable rate equal to the greater of a LIBOR rate plus 3.50% or 5.00%, payable monthly. At October 31, 2013, the revolving term loan carried an interest rate of 5.00%. HLBE also pays an unused commitment fee on the unused portion of the term revolving term loan commitment at the rate of 0.35% per annum, payable in arrears in quarterly installments during the term of the revolving term loan. At April 30, 2014, HLBE did not have a balance outstanding under the revolving term loan and had an additional $18.5 million available. The amount available under the revolving term loan is reduced by $2 million at October 31 each year until September 2016, when the unpaid balance is due.
HLBE Subordinated Convertible Debt
On September 18, 2013, HLBE entered into an indenture with U.S. Bank National Association (“RFA”U.S. Bank”), as of May 20, 2013, there were 209 ethanol plants nationwidetrustee and collateral agent, in connection with the capacity to produce approximately 14.7 billion gallonsclosing of ethanol annually. The RFA estimates that plants withHLBE's offering of a maximum of $12 million aggregate principal amount of 7.25% Secured Subordinated Notes due 2018 (the “Notes”). On September 18, 2013, HLBE sold an annual production capacityaggregate principal amount of approximately 13.3 billion gallons are currently operating and that approximately 9.2%$3.7 million of the nameplate production capacity is not currently operational. Management believes the production capacityNotes. Prior to that, HLBE sold approximately $1.4 million of the ethanol industry is greater than ethanol demand which may depress ethanol prices.
Currently, ethanol is primarily blended with conventional gasolinenotes in May 2013. Additionally, subscribers from HLBE's subordinated notes offering holding an aggregate principal amount of approximately $935,000 of HLBE's subordinated notes elected to exchange their notes for use in standard (non-flex fuel) vehicles to create a blend which is 10% ethanol and 90% conventional gasoline. Estimates indicate that approximately 135 billion gallons of gasoline
are sold inNotes under the United States each year. However, gasoline demand may be shrinking inindenture, per the United States as a resultoriginal terms of the global economic slowdowninterim subordinated notes. Therefore, HLBE has an aggregate principal amount of approximately $4.1 million in Notes. The Notes are subordinated secured obligations, with interest payable on April 1 and improved fuel efficiency. Assuming that all gasoline inOctober 1 of each year, beginning April 1, 2014, through the United States is blendedmaturity date of October 1, 2018 at a rate of 10% ethanol7.25% per annum. The Notes are secured by a second mortgage and 90% gasoline,lien position on, among other assets, HLBE's property, plant and equipment located in Heron Lake, Minnesota, which mortgage and lien position are junior to and subordinated to HLBE's senior debt with AgStar.
On May 2, 2014, HLBE issued a notice to U.S. Bank that HLBE intended to redeem all of the maximum demand for ethanol is 13.5 billion gallons. This is commonly referredoutstanding Notes on July 1, 2014, pursuant to as the “blend wall”, which represents a limit where more ethanol cannot be blended into the national gasoline pool. This is a theoretical limit since it is believed it would not be possible to blend ethanol into every gallon of gasoline that is usedHLBE's "optional redemption" right in the United Statesindenture governing the Notes. A notice of the redemption was mailed to Note holders by the trustee on May 23, 2014. The outstanding principal balance of approximately $4.1 million, will be redeemed at a redemption price equal to 100% of the aggregate principal amount plus accrued and it discounts higher percentage blendsunpaid interest to, but excluding, the redemption date. HLBE's obligation to pay the redemption price on the redemption date is subject to the right of ethanol such as E15 and E85 used in flex fuel vehicles.
In April 2012, the U.S. Environmental Protection Agency ("EPA") approvedholders of the first applications for registering ethanol for use in makingNotes to elect to convert the principal amount of their notes into Class A units of HLBE at a blendconversion rate of fifteen percent ethanol, known as E15. Since that time, our application with$0.30 per unit. To the EPA to register ethanol for use in making E15 has also been approved. Weextent holders of the Notes do not anticipate that the EPA's approval of applications for registering ethanol forelect to convert their Notes, HLBE expects to use in making E15 will impact ethanol demand or pricing in the near term.
According to industry sources, United States ethanol industry exports decreased approximately 38% in 2012 as compared to 2011. The Company, through its ethanol marketer, has in the past exported a portion of its ethanol production to foreign markets. The European Union recently imposed a five-year tariff of approximately $83 per metric ton on imported U.S. ethanol. This tariff may further slow overall demand for U.S. ethanol. The exportation of domestic ethanol had helped to mitigate the effects of the blend wall and had thereby helped to maintain ethanol price levels. Whether export markets will make economic sense for us in the future will depend on domestic ethanol blend rates as well as global supply and demand for our product.
The federal Renewable Fuels Standard, known as RFS2, requires the use of a specified amount of renewable fuels in the United States. In 2013, RFS2 requires approximately 16.55 billion gallons, of which corn based ethanol can be used to satisfy approximately 13.8 billion gallons. This is an increase from 2012 levels, which required approximately 15.2 billion gallons, of which corn based ethanol could be used to satisfy approximately 13.2 billion gallons.
Certain legislators and certain industry groups and have advocated for changes to RFS2 and other statutes and regulations that, if adopted, would negatively impact our business. At various times over the past several months, legislation has been proposed that would repeal RFS2, repeal the corn based ethanol portion of RFS2, or ban E15. While the ethanol industry has resisted these proposals, we cannot be assured that RFS2 will remain in its current form going forward or that E15 or higher blends of ethanol will be widely available.
The ethanol production process requires a reliable water supply. The removal of a dam on the Minnesota River located downstream from our water intake structure has resulted in the water level lowering below our current intake structure. We have opted to upgrade our intake structure, finding that option preferable to acquiring ownership of the dam prior to its removal. We are working on plans for this upgrade and expect to complete the necessary modifications during the third quarter of our 2013 fiscal year. We currently estimate that this project will cost a total of $1,000,000 and anticipate using a combination of cash flows from fiscal 2013 operations and the Company's debtborrowings under its credit facilities to fund the entire upgrade. However,redemption price. If all of the actual cost may be different than our current estimate.holders of the Notes called for redemption elect to convert their Notes, HLBE will issue an additional 13,810,000 units in connection with the conversion of the Notes. As of June 16, 2014, approximately $2.7 million of the Notes had been submitted for conversion into 8,882,500 capital units of HLBE.
TrendsAs of June 16, 2014, we own approximately 60.8% of our outstanding membership units of HLBE and Uncertainties Impactingare entitled to appoint five (5) of the Corn and Natural Gas Markets and Our Future Costnine (9) governors to HLBE's board of Goods Soldgovernors under its member control agreement. Following the redemption of the Notes, assuming all Note holders elect to convert there notes, our ownership interest in HLBE will be diluted to 50.1%. Notwithstanding this dilution, we will retain our governor appointment rights as we will continue to own a majority of HLBE.
Our costs of our goods sold consist primarily of costs relating to the corn and natural gas supplies necessary to produce ethanol and distillers grains for sale. We grind approximately 1,800,000 bushels of corn each month. For the quarter ended April 30, 2013, our average cost of corn per bushel, net of hedging activity, was approximately $0.75 greater than our cost of corn for the same period ended April 30, 2012.Other HLBE Credit Arrangements
Corn pricesIn addition to HLBE's primary credit arrangement with AgStar and our subordinated convertible debt, HLBE has other material credit arrangements and debt obligations.
In October 2003, HLBE entered into an industrial water supply development and distribution agreement with the City of Heron Lake, Jackson County, and Minnesota Soybean Processors. In consideration of this agreement, HLBE and Minnesota Soybean Processors are allocated equally the debt service on $735,000 in water revenue bonds that were issued by the City to support this project that mature in February 2019. The parties have agreed that prior to the scheduled expiration of the agreement, they will negotiate in good faith to replace the agreement with a further agreement regarding the wells and related facilities. In May 2006, HLBE entered into an industrial water supply treatment agreement with the City of Heron Lake and Jackson County. Under this agreement, HLBE pays monthly installments over 24 months starting January 1, 2007 equal to one years' debt service on approximately $3.6 million in water revenue bonds, which will be returned to HLBE if any funds remain above historical averages. Tight corn supply following last growing season's drought has continuedafter final payment in full on the bonds and assuming HLBE complies with all payment obligations under the agreement. As of April 30, 2014, there was a total of $2.6 million in outstanding water revenue bonds. HLBE classifies its obligations under these bonds as assessments payable. The interest rates on the bonds range from 0.50% to place upward pressure on corn prices. We anticipate that corn prices will remain high through at least8.73%.
To fund the 2013 harvest, as that ispurchase of the earliest possible time that corn producers may be able to generate significant additional domestic production. The USDA's World Agricultural Supplydistribution system and Demand Estimates published on May 10, 2013 projects domestic corn production of 14.14 billion bushelssubstation for the 2013 growing season,plant, HLBE entered into a loan agreement with Federated Rural Electric Association pursuant to which would beHLBE borrowed $600,000 by a significant increase oversecured promissory note. Under the estimatenote HLBE is required to make monthly payments to Federated Rural Electric Association of 10.78 billion bushels produced during$6,250 consisting of principal and an annual fee of 1% beginning on October 10, 2009. In exchange for this loan, Federated Rural Electric Association was granted a security interest in the 2012 growing season. However, corn planting in several Midwestern states has been behind historical pace due to wet conditions. If a perioddistribution system and substation for the plant. The balance of high corn prices were to be sustained following the 2013 harvest, such pricing may reduce our ability to generate income because of the higher cost of operating our plant.this loan at April 30, 2014 was approximately$256,000.
Natural gas is also an important input commodityHLBE has a note payable in connection with the construction of its pipeline assets. This loan was initially due in December 2011, but was converted in February 2012 to our manufacturing process. Our natural gas usage isa term loan with a three-year repayment period. In November 2013, the note payable was refinanced with the lending institution with additional borrowings of approximately 120,000 million British thermal units (mmBTU) per month. We continue to work to find ways to limit our natural gas price risk through efficient usage practices, research of new technologies, and pricing and hedging strategies. We use a marketing firm and an energy consultant for our natural gas procurement and will work with them on an ongoing basis to mitigate our exposure to volatile gas prices.$759,000 being
Management anticipates that natural gas prices will be relatively stable inmade. The balance of this loan at April 30, 2014 was approximately $1.6 million. Interest on the next several months as a resultloan is at 5.29%. The note is secured by the assets of an ample amount of gas in the supply chain. However, should we experience any natural gas supply disruptions, including disruptions from hurricane activity, we may experience significant increases in natural gas prices.Agrinatural Gas, LLC.
Compliance with Environmental LawsHLBE financed its corn oil separation equipment from the equipment vendor. HLBE pays approximately $40,000 per month on this debt, conditioned upon revenue generated from the corn oil separation equipment. The monthly payment includes implicit interest of 5.57% until maturity in May 2015. The note is secured by the corn oil separation equipment. The balances of this loan at April 30, 2014 was approximately $378,000.
We are subject to extensive air, water and other environmental regulations and we have been required to obtainHLBE also has a number of environmental permits to construct and operate the plant. As such, any changes that are madenote payable to the plant or its operations must be reviewed to determine if amended permits need to be obtained in order to implement these changes.
Contracting Activity
Farmers Cooperative Elevator Company supplies our corn. Eco-Energy,minority owner of Agrinatural Gas, LLC markets our ethanol and Renewable Products Marketing Group, LLC (“RPMG”) markets our distillers grains and our corn oil. Each of these contracts is critical to our success and we are very dependent on each of these companies. Accordingly, the financial stability of these partners is critical to the successful operation of our business.
We independently market a small portion of our ethanol production as E-85 to local retailers.
Commodity Price Risk Protection
We occasionally seek to minimize the risks from fluctuations in the prices of corn, ethanol, denaturant and natural gas through the use of derivative instruments. In practice, as markets move, we actively manage our risk and adjust hedging strategies as appropriate. We do not use hedge accounting which would match the gain or loss on our hedge positions to the specific commodity contracts being hedged. Instead, we are using fair value accounting for our hedge positions, which means that as the current market price of our hedge positions changes, the gains and losses are immediately recognized in our revenue or cost of goods sold depending on the commodity that is hedged. The immediate recognition of hedging gains and losses under fair value accounting can cause net income to be volatile from quarter to quarter due to the timing of the change in value of the derivative instruments relative to the cost and use of the commodity being hedged.
As of April 30, 2013, we recorded a net liability for our derivative instruments in the amount of $47,813. As of October 31, 2012, we recorded a net liability for our derivative instruments in the amount of $45,563. There are several variables that could affect the extent to which our derivative instruments are impacted by fluctuations in the price of corn, ethanol, denaturant or natural gas. However, it is likely that commodity cash prices will have the greatest impact$300,000 at April 30, 2014. Interest on the derivative instruments with delivery dates nearestnote is 5.43% and the current cash price. As we move forward, additional protection may be necessary. As the prices of these hedged commodities movenote has a maturity date in reaction to market trendsOctober 2014.
Critical Accounting Policies and information, our statement of operations will be affected depending on the impact such market movements have on the value of our derivative instruments. Depending on market movements, crop prospects and weather, these price protection positions may cause immediate adverse effects, but are expected to produce long-term positive growth for Granite Falls Energy.Estimates
At April 30, 2013, we had fixed basis contracts for forward corn purchase commitments totaling approximately 2,375,000 bushels. We also had 885,000 bushels of stored corn included in inventory at April 30, 2013.
The derivative accounts are reported at fair value. We have categorized the cash flows related to the hedging activities with cash provided by operations, in the same category as the item being hedged.
Critical Accounting Estimates
Management uses estimates and assumptions in preparing our financial statements in accordance with generally accepted accounting principles. These estimates and assumptions affect the reported amounts of assets and liabilities, the disclosure of contingent assets and liabilities, and the reported revenues and expenses.
Liquidity and Capital Resources
The following table shows We believe that of our cash flowssignificant accounting policies summarized in Note 1 to our condensed consolidated financial statements included with this Form 10-Q. At April 30, 2014, our critical accounting estimates continue to include those described in our Annual Report on Form 10-K for the six monthsfiscal year ended April 30,October 31, 2013. Management has not changed the method of calculating and 2012:
|
| | | | | | | |
| | 2013 | | 2012 |
| Net cash provided by operating activities | $ | 6,611,899 |
| | $ | 9,528,745 |
|
| Net cash used in investing activities | (1,192,878 | ) | | (3,998,444 | ) |
| Net cash used in financing activities | (4,718,846 | ) | | (9,242,419 | ) |
Operating Cash Flows.Cash provided by operating activities was approximately $6,612,000 forusing estimates and assumptions in preparing our condensed consolidated financial statements in accordance with generally accepted accounting principles in the six months ended April 30, 2013, as compared to cash provided by operationsUnited States of approximately $9,529,000 for the six months ended April 30, 2012. Currently, our capital needs are being adequately met through cash flows from our operating activities and our currently available credit facilities.America.
Investing Cash Flows.Cash used in investing activities was approximately $1,193,000 for the six months ended April 30, 2013, compared to cash used in investing activities of approximately $3,998,000 for the six months ended April 30, 2012. During the six months ended April 30, 2013 we made payments totaling approximately $1,733,000 for capital expenditures, compared to payments of approximately $8,000 for the six months ended April 30, 2012. Additionally, during the six months ended April 30, 2013 we received proceeds from the sale of land of approximately $540,000, as compared to the six months ended April 30, 2012, when we made payments totaling approximately $3,990,000 for land acquisitions.
Financing Cash Flows.Cash used in financing activities was approximately $4,719,000 for the six months ended April 30, 2013, consisting entirely of net payments made on our credit facilities. For the the six months ended April 30, 2012, our cash used in financing activities was approximately $9,242,000, most of which was used to pay a distribution to our members.
Indebtedness
In August 2012, the Company entered into two credit facilities, one short-term and one long-term, with United FCS. CoBank serves as administrative agent for United FCS for these credit facilities. These facilities replaced the Company's prior $6,000,000 revolving line of credit with Minnwest Bank M.V. of Marshall, MN.
Short-Term Debt Sources
The Company's short-term credit facility with United FCS is a revolving line of credit. This facility allows us to borrow, repay, and reborrow up to $6,000,000 subject to a borrowing base calculation. Final payment of amounts borrowed under this credit facility is due August 1, 2013. Amounts borrowed under the revolving line of credit bear interest at one of three interest rate options selected by us, (i) at a variable weekly rate equal to 2.65% above the rate quoted by the British Bankers Association for the offering of one-month U.S. Dollar deposits, (ii) at a fixed rate to be quoted by CoBank, or (iii) at a fixed rate for up to 12 months equal to LIBOR plus 2.65%. Interest on amounts borrowed is payable monthly in arrears. We expect to utilize this credit facility to finance inventory and receivables as needed. We have not yet made any advances on this line of credit.
The Company also has letters of credit totaling $337,928 as part of a credit requirement of Northern Natural Gas. In August 2012, these letters of credit were transferred to United FCS as part of the new credit facilities. These letters of credit reduce the amount available under our line of credit to approximately $5,662,000.
Long-Term Debt Sources
The Company's long-term credit facility with United FCS is a revolving term loan. Under this facility we may borrow, repay, and reborrow up to $8,000,000. However, the amount available for borrowing under this facility reduces by $1,000,000 every six months, beginning September 1, 2013, with final payment due March 1, 2017. Amounts borrowed under the revolving term loan bear interest at one of three interest rate options selected by us, (i) at a variable weekly rate equal to 2.90% above the rate quoted by the British Bankers Association for the offering of one-month U.S. Dollar deposits, (ii) at a fixed rate to be quoted by CoBank, or (iii) at a fixed rate for up to 12 months equal to LIBOR plus 2.90%. Interest on amounts borrowed is payable monthly in arrears. We have used this credit facility to fund our rail infrastructure improvement project and working capital. As of April 30, 2013, the outstanding balance on our revolving term loan was $229,912 and the interest rate as of that date was 3.10%.
The Company's credit facilities with United FCS require the Company to comply with certain financial covenants. As of April 30, 2013, we were in compliance with our financial covenants and expect to remain in compliance throughout our 2013 fiscal year.
Our credit facilities with United FCS are secured by substantially all our assets. There are no savings account balance collateral requirements as part of our credit facilities.
In December 2011, the Company purchased a shuttlewagon railcar mover for use at its facility. The Company financed the entire purchase price through Capital One Equipment Leasing and Finance. As of April 30, 2013, the loan balance was approximately $441,000, of which approximately $324,000 is classified as long-term debt. The note is on a five-year term at a fixed annual interest rate of 3.875%.
Off-Balance Sheet Arrangements.Arrangements
We currently have no off-balance sheet arrangements.
Item 3. Quantitative and Qualitative Disclosures About Market Risk
We are exposed to the impact of market fluctuations associated with interest rates and commodity prices as discussed below. We have no exposure to foreign currency risk as all of our business is conducted in U.S. Dollars. We use derivative financial instruments as part of an overall strategy to manage market risk. We use cash, futures and option contracts to hedge changes to the commodity prices of corn, ethanol and natural gas. We do not enter into these derivative financial instruments for trading or speculative purposes, nor do we designate these contracts as hedges for accounting purposes pursuant to the requirements of Generally Accepted Accounting Principles ("GAAP").
Interest Rate Risk
We are exposed to market risk from changes in interest rates. Exposure to interest rate risk results primarily from our credit facilities with United FCS, PCA and HLBE's credit facilities with AgStar Financial Services, PCA. Specifically, we have $229,912 outstanding in variable rate debt as of April 30, 2013. The specifics of these credit facilities are discussed in greater detail in “Item 2 - Management's Discussion and Analysis of Financial Condition and Results of Operations - Indebtedness.”
Below is a sensitivity analysis we prepared regarding our income exposure to changes in interest rates. The sensitivity analysis below shows the anticipated effect on our income from a 10% adverse change in interest rates for a one-year period.
|
| | | | | |
| Outstanding Variable Rate Debt at April 30, 2013 | Interest Rate at April 30, 2013 | Interest Rate Following 10% Adverse Change | Annual Adverse Change to Income |
| $229,912 | 3.10 | % | 3.41 | % | $713 |
Commodity Price Risk
We seek to minimize the risks from fluctuations in the prices of raw material inputs, such as corn and natural gas, and finished products, such as ethanol and distillers grains, through the use of hedging instruments. In practice, as markets move, we actively manage our risk and adjust hedging strategies as appropriate. Although we believe our hedge positions accomplish an economic hedge against our future purchases and sales, management has chosen not to use hedge accounting, which would match the gain or loss on our hedge positions to the specific commodity purchase being hedged. We are using fair value accounting for our hedge positions, which means as the current market price of our hedge positions changes, the realized or unrealized gains and losses are immediately recognized in our cost of goods sold or as an offset to revenues. The immediate recognition of hedging gains and losses under fair value accounting can cause net income to be volatile from quarter to quarter due to the timing of the change in value of the derivative instruments relative to the cost and use of the commodity being hedged.
As corn prices move in reaction to market trends and information, our income statement will be affected depending on the impact such market movements have on the value of our derivative instruments. Depending on market movements, crop prospects and weather, these price protection positions may cause immediate adverse effects, but are expected to produce long-term positive growth for us.
A sensitivity analysis has been prepared to estimate our exposure to ethanol, corn and natural gas price risk. Market risk related to these factors is estimated as the potential change in income resulting from a hypothetical 10% adverse change in the
fair value of our corn and natural gas prices and average ethanol price as of April 30, 20132014, net of the forward and future contracts used to hedge our market risk for corn and natural gas usage requirements. The volumes are based on our expected use and sale of these commodities for both the Granite Falls, Minnesota and Heron Lake, Minnesota production plants for a one year period from April 30, 20132014. The results of this analysis, which may differ from actual results, are as follows:
| | | | Estimated Volume Requirements for the next 12 months (net of forward and futures contracts) | Unit of Measure | Hypothetical Adverse Change in Price as of April 30, 2013 | Approximate Adverse Change to Income | Estimated Volume Requirements for the next 12 months (net of forward and futures contracts) | Unit of Measure | Hypothetical Adverse Change in Price as of January 31, 2014 | Approximate Adverse Change to Income |
| Natural Gas | 1,694,500 |
| MMBTU | 10 | % | $ | 842,000 |
| 3,000,000 |
| MMBTU | 10 | % | $ | 1,650,000 |
|
| Ethanol | 56,894,000 |
| Gallons | 10 | % | $ | 13,371,000 |
| 110,800,000 |
| Gallons | 10 | % | $ | 24,951,000 |
|
| Corn | 19,784,000 |
| Bushels | 10 | % | $ | 13,691,000 |
| 38,150,000 |
| Bushels | 10 | % | $ | 18,132,000 |
|
Participation in Captive Reinsurance Company
We participate in a captive reinsurance company (“Captive”("Captive"). The Captive reinsures losses related to workman's compensation, commercial property and general liability. Premiums are accrued by a charge to income for the period to which the premium relates and is remitted by our insurer to the captive reinsurer. The Captive reinsures losses in excess of a predetermined amount. The Captive insurer has estimated and collected a premium amount in excess of expected losses but less than the aggregate loss limits reinsured by the Captive. We have contributed limited capital surplus to the Captive that is available to fund losses should the actual losses sustained exceed premium funding. So long as the Captive is fully-funded through premiums and capital contributions to the aggregate loss limits reinsured, and the fronting insurers are financially strong, we cannot be assessed over the amount of our current contributions.
Item 4. Controls and Procedures
We maintain disclosure controls and procedures that are designed to ensure that information required to be disclosed in the reports that we file or submit pursuant to the Securities Exchange Act of 1934 (the “Exchange Act”) is recorded, processed, summarized and reported within the time periods specified in the Securities and Exchange Commission's rules and forms, and that such information is accumulated and communicated to our management, including our Chief Executive Officer and Chief Financial Officer, as appropriate, to allow for timely decisions regarding required disclosures.
Our management, including our Chief Executive Officer and General Manager (the principal executive officer), Steve Christensen, along with our Chief Financial Officer (the principal financial officer), Stacie Schuler, have reviewed and evaluated the effectiveness of our disclosure controls and procedures as of April 30, 20132014. Based upon this review and evaluation, these officers have concluded that our disclosure controls and procedures are effective to ensure that information required to be disclosed in the reports that we file or submit under the Exchange Act is recorded, processed, summarized and reported within the time periods required by the forms and rules of the Securities and Exchange Commission; and to ensure that the information required to be disclosed by an issuer in the reports that it files or submits under the Exchange Act is accumulated and communicated to our management, including our principal executive and principal financial officers, or persons performing similar functions, as appropriate to allow timely decisions regarding required disclosure.
Changes in Internal Control over Financial Reporting
Our management, including our principal executive officer and principal financial officer, have reviewed and evaluated any changes in our internal control over financial reporting that occurred during the quarter ended April 30, 20132014 and there has been no change that has materially affected or is reasonably likely to materially affect our internal control over financial reporting.
PART II. OTHER INFORMATION
Item 1. Legal Proceedings
From time to time in the ordinary course of business, Granite Falls Energy, LLC and Heron Lake BioEnergy, LLC may be named as a defendant in legal proceedings related to various issues, including workers' compensation claims, tort claims, or contractual disputes. We are not currently involved in any material legal proceedings.
Item 1A. Risk Factors
There have been no material changes, except as describedThe risk factors below toshould be read in conjunction with the risk factors disclosed in Item 1A of our Form 10-K for the fiscal year ended October 31, 2012.2013. Additional risks and uncertainties, including risks and uncertainties not presently known to us, or that we currently deem immaterial, could also have an adverse effect on our business, financial condition and/or results of operations.
Risks Related to Regulation and Government Action
Changes to the Renewable Fuels Standard or to permissible levels of ethanol blended into gasoline could negatively impact our profitability. RFS2 requires the use of a specified amount of renewable fuels in the United States. Additionally, the EPA has approved the use of E15, gasoline which is blended at a rate of 15% ethanol and 85% gasoline, in vehicles manufactured in the model year 2001 and later. These two measures, taken together, help ensure that there is a market for the ethanol we produce. However, certain legislators and certain industry groups have advocated for changes to RFS2 and other statutes and regulations that, if adopted, would negatively impact our business. At various times over the past several months, legislation has been proposed that would repeal RFS2, repeal the corn based ethanol portion of RFS2, or ban E15. While the ethanol industry has resisted these proposals, we cannot be assured that RFS2 will remain in its current form going forward or that E15 or higher blends of ethanol will be widely available, which may negatively impact the demand for ethanol.
Item 2. Unregistered Sales of Equity Securities and Use of Proceeds
None.
Item 3. Defaults Upon Senior Securities
None.
Item 4. Mine Safety Disclosures
None.
Item 5. Other Information
None.
Item 6. Exhibits.
| |
| (a) | The following exhibits are filed as part ofincluded in this report. |
|
| | | |
| Exhibit No. | | Exhibit |
3.1 |
| | Third Amendment to the Fifth Amended and Restated Operating and Member Control Agreement* |
| 31.1 |
| | Certification of Chief Executive Officer pursuant to 17 CFR 240.13a-14(a)* |
| 31.2 |
| | Certification of Chief Financial Officer pursuant to 17 CFR 240.13a-14(a)* |
| 32.1 |
| | Certification of Chief Executive Officer pursuant to 18 U.S.C. Section 1350* |
| 32.2 |
| | Certification of Chief Financial Officer pursuant to 18 U.S.C. Section 1350* |
| 101 |
| | The following financial information from Granite Falls Ethanol, LLC's Quarterly Report on Form 10-Q for the quarter ended April 30, 2013,2014, formatted in XBRL (eXtensible Business Reporting Language): (i) Condensed Balance Sheets, as of April 30, 2013 and October 31, 2012, (ii) Condensed Statements of Operations, for the three and six months ended April 30, 2013 and 2012, (iii) Statements of Cash Flows, for the six months ended April 30, 2013 and 2012, and (iv) the Notes to Condensed Financial Statements.** |
* Filed herewith.
** Furnished herewith.
SIGNATURES
Pursuant to the requirements of the Securities Exchange Act of 1934, the registrant has duly caused this report to be signed on its behalf by the undersigned thereunto duly authorized.
|
| | |
| | | GRANITE FALLS ENERGY, LLC |
| | | |
| Date: | June 14, 201316, 2014 | /s/ Steve Christensen |
| | | Steve Christensen |
| | | Chief Executive Officer |
| | | |
| | | |
| Date: | June 14, 201316, 2014 | /s/ Stacie Schuler |
| | | Stacie Schuler |
| | | Chief Financial Officer |
| | | |