UNITED STATES SECURITIES AND EXCHANGE COMMISSION
Washington, D.C. 20549
FORM 10-Q
☒ Quarterly Report Pursuant to Section 13 or 15(d) of the Securities Exchange Act of 1934
For the quarterly period ended June 30, 2020March 31, 2021
☐ Transition Report pursuant to Section 13 or 15(d) of the Securities Exchange Act of 1934
For the transition period from ________ to ________
Commission File Number: 000-50058
PRA Group, Inc.
(Exact name of registrant as specified in its charter)
| | | | | | | | | | | | | | |
| Delaware | | | | 75-3078675 |
| (State or other jurisdiction of incorporation or organization) | | | | (I.R.S. Employer Identification No.) |
120 Corporate Boulevard
Norfolk, Virginia 23502
(Address of principal executive offices)
(888) 772-7326
(Registrant's Telephone No., including area code)
Not Applicable
(Former name, former address and former fiscal year, if changed since last report)
Securities registered pursuant to Section 12(b) of the Act:
| | | | | | | | |
| Title of each class | Trading Symbol(s) | Name of each exchange on which registered |
| Common Stock, $0.01 par value per share | PRAA | NASDAQ Global Select Market |
Indicate by check mark whether the registrant (1) has filed all reports required to be filed by Section 13 or 15(d) of the Securities Exchange Act of 1934 during the preceding 12 months (or for such shorter period that the registrant was required to file such reports), and (2) has been subject to such filing requirements for the past 90 days. Yes þ No ¨
Indicate by check mark whether the registrant has submitted electronically every Interactive Data File required to be submitted pursuant to Rule 405 of Regulation S-T during the preceding 12 months (or for such shorter period that the registrant was required to submit such files). Yes þ No ¨
Indicate by check mark whether the registrant is a large accelerated filer, an accelerated filer, a non-accelerated filer, a smaller reporting company, or an emerging growth company. See the definitions of "large accelerated filer," "accelerated filer," "smaller reporting company," and "emerging growth company" in Rule 12b-2 of the Exchange Act.
Large accelerated filer þ Accelerated filer ¨ Non-accelerated filer ¨ Smaller reporting company ☐ Emerging growth company ☐
If an emerging growth company, indicate by check mark if the registrant has elected not to use the extended transition period for complying with any new or revised financial accounting standards provided pursuant to Section 13(a) of the Exchange Act. ¨
Indicate by check mark whether the registrant is a shell company (as defined in Rule 12b-2 of the Exchange Act). Yes ☐ No þ
The number of shares of the registrant's common stock outstanding as of August 4, 2020May 5, 2021 was 45,579,483.45,799,855.
Table of Contents
| | | | | | | | |
| | |
| | |
| Item 1. | | |
| | |
| | |
| | |
| | |
| | |
| | |
| | |
| | |
| | |
| | |
| | |
| | |
| | |
| | |
| | |
| | |
| | |
| | |
| | |
| | |
| | |
| | |
| | |
| | |
| | |
| Item 2. | | |
| Item 3. | | |
| Item 4. | | |
| | |
| | |
| | |
| Item 1. | | |
| Item 1A. | | |
| Item 2. | | |
| Item 3. | | |
| Item 4. | | |
| Item 5. | | |
| Item 6. | | |
| | |
| Signatures | | |
Part I. Financial Information
Item 1. Financial Statements (Unaudited)
PRA Group, Inc.
Consolidated Balance Sheets
June 30, 2020March 31, 2021 and December 31, 20192020
(Amounts in thousands)
| | | (unaudited) | | | (unaudited) | |
| | June 30,
2020 | | December 31,
2019 | | March 31,
2021 | | December 31,
2020 |
| Assets | Assets | | | | Assets | | | |
| Cash and cash equivalents | Cash and cash equivalents | $ | 115,741 | | | $ | 119,774 | | Cash and cash equivalents | $ | 92,798 | | | $ | 108,613 | |
| Restricted cash | | Restricted cash | 16,057 | | | 12,434 | |
| Investments | Investments | 18,746 | | | 56,176 | | Investments | 54,682 | | | 55,759 | |
| Finance receivables, net | Finance receivables, net | 3,351,532 | | | 3,514,165 | | Finance receivables, net | 3,372,666 | | | 3,514,788 | |
| Other receivables, net | Other receivables, net | 15,532 | | | 10,606 | | Other receivables, net | 3,223 | | | 13,194 | |
| Income taxes receivable | Income taxes receivable | 23,166 | | | 17,918 | | Income taxes receivable | 27,246 | | | 21,928 | |
| Deferred tax asset, net | 64,548 | | | 63,225 | | |
| Deferred tax assets, net | | Deferred tax assets, net | 72,523 | | | 83,205 | |
| Right-of-use assets | | Right-of-use assets | 50,839 | | | 52,951 | |
| Property and equipment, net | Property and equipment, net | 59,285 | | | 56,501 | | Property and equipment, net | 56,825 | | | 58,356 | |
| Right-of-use assets | 58,213 | | | 68,972 | | |
| Goodwill | Goodwill | 444,507 | | | 480,794 | | Goodwill | 492,751 | | | 492,989 | |
| Intangible assets, net | 3,666 | | | 4,497 | | |
| Other assets | Other assets | 42,888 | | | 31,263 | | Other assets | 38,920 | | | 38,844 | |
| | Total assets | Total assets | $ | 4,197,824 | | | $ | 4,423,891 | | Total assets | $ | 4,278,530 | | | $ | 4,453,061 | |
| Liabilities and Equity | Liabilities and Equity | | | | Liabilities and Equity | | | |
| Liabilities: | Liabilities: | | Liabilities: | |
| Accounts payable | Accounts payable | $ | 4,667 | | | $ | 4,258 | | Accounts payable | $ | 4,817 | | | $ | 5,294 | |
| Accrued expenses | Accrued expenses | 72,871 | | | 88,925 | | Accrued expenses | 76,684 | | | 97,320 | |
| Income taxes payable | Income taxes payable | 31,226 | | | 4,046 | | Income taxes payable | 31,853 | | | 29,692 | |
| Deferred tax liability, net | 59,860 | | | 85,390 | | |
| Deferred tax liabilities, net | | Deferred tax liabilities, net | 39,739 | | | 40,867 | |
| Lease liabilities | Lease liabilities | 62,706 | | | 73,377 | | Lease liabilities | 55,322 | | | 57,348 | |
| Interest-bearing deposits | Interest-bearing deposits | 120,520 | | | 106,246 | | Interest-bearing deposits | 124,998 | | | 132,739 | |
| Borrowings | Borrowings | 2,580,068 | | | 2,808,425 | | Borrowings | 2,501,133 | | | 2,661,289 | |
| Other liabilities | Other liabilities | 71,044 | | | 26,211 | | Other liabilities | 40,755 | | | 54,986 | |
| | Total liabilities | Total liabilities | 3,002,962 | | | 3,196,878 | | Total liabilities | 2,875,301 | | | 3,079,535 | |
| | Equity: | Equity: | | | | Equity: | | | |
| Preferred stock, $0.01 par value, 2,000 shares authorized, no shares issued and outstanding | Preferred stock, $0.01 par value, 2,000 shares authorized, no shares issued and outstanding | — | | | — | | Preferred stock, $0.01 par value, 2,000 shares authorized, no shares issued and outstanding | 0 | | | 0 | |
| Common stock, $0.01 par value, 100,000 shares authorized, 45,579 shares issued and outstanding at June 30, 2020; 100,000 shares authorized, 45,416 shares issued and outstanding at December 31, 2019 | 456 | | | 454 | | |
| Common stock, $0.01 par value, 100,000 shares authorized, 45,799 shares issued and outstanding at March 31, 2021; 100,000 shares authorized, 45,585 shares issued and outstanding at December 31, 2020 | | Common stock, $0.01 par value, 100,000 shares authorized, 45,799 shares issued and outstanding at March 31, 2021; 100,000 shares authorized, 45,585 shares issued and outstanding at December 31, 2020 | 458 | | | 456 | |
| Additional paid-in capital | Additional paid-in capital | 70,065 | | | 67,321 | | Additional paid-in capital | 47,236 | | | 75,282 | |
| Retained earnings | Retained earnings | 1,439,680 | | | 1,362,631 | | Retained earnings | 1,582,384 | | | 1,511,970 | |
| Accumulated other comprehensive loss | Accumulated other comprehensive loss | (347,212) | | | (261,018) | | Accumulated other comprehensive loss | (253,576) | | | (245,791) | |
| Total stockholders' equity - PRA Group, Inc. | Total stockholders' equity - PRA Group, Inc. | 1,162,989 | | | 1,169,388 | | Total stockholders' equity - PRA Group, Inc. | 1,376,502 | | | 1,341,917 | |
| Noncontrolling interest | Noncontrolling interest | 31,873 | | | 57,625 | | Noncontrolling interest | 26,727 | | | 31,609 | |
| Total equity | Total equity | 1,194,862 | | | 1,227,013 | | Total equity | 1,403,229 | | | 1,373,526 | |
| Total liabilities and equity | Total liabilities and equity | $ | 4,197,824 | | | $ | 4,423,891 | | Total liabilities and equity | $ | 4,278,530 | | | $ | 4,453,061 | |
The accompanying notes are an integral part of these consolidated financial statements.Consolidated Financial Statements.
PRA Group, Inc.
Consolidated Income Statements
For the three and six months ended June 30,March 31, 2021 and 2020 and 2019
(unaudited)
(Amounts in thousands, except per share amounts)
| | | Three Months Ended June 30, | | | Six Months Ended June 30, | | | Three Months Ended March 31, |
| | 2020 | | 2019 | | 2020 | | 2019 | | 2021 | | 2020 |
| Revenues: | Revenues: | | | | | | | | Revenues: | | | | |
| Portfolio income | Portfolio income | $ | 248,284 | | | $ | — | | | $ | 510,306 | | | $ | — | | Portfolio income | | $ | 231,672 | | | $ | 262,022 | |
| Changes in expected recoveries | Changes in expected recoveries | 19,801 | | | — | | | 6,985 | | | — | | Changes in expected recoveries | | 50,136 | | | (12,816) | |
| Income recognized on finance receivables | — | | | 249,219 | | | — | | | 488,055 | | |
| | Fee income | Fee income | 2,639 | | | 2,707 | | | 4,848 | | | 9,081 | | Fee income | | 2,181 | | | 2,209 | |
| Other revenue | Other revenue | 1,186 | | | 131 | | | 1,555 | | | 798 | | Other revenue | | 5,480 | | | 369 | |
| Total revenues | Total revenues | 271,910 | | | 252,057 | | | 523,694 | | | 497,934 | | Total revenues | | 289,469 | | | 251,784 | |
| | Net allowance charges | — | | | (1,196) | | | — | | | (7,291) | | |
| | | Operating expenses: | Operating expenses: | | Operating expenses: | |
| Compensation and employee services | Compensation and employee services | 70,472 | | | 79,808 | | | 145,643 | | | 159,453 | | Compensation and employee services | | 73,984 | | | 75,171 | |
| Legal collection fees | Legal collection fees | 13,742 | | | 14,297 | | | 28,314 | | | 27,356 | | Legal collection fees | | 12,926 | | | 14,572 | |
| Legal collection costs | Legal collection costs | 19,507 | | | 33,121 | | | 53,954 | | | 68,350 | | Legal collection costs | | 21,312 | | | 34,447 | |
| Agency fees | Agency fees | 10,343 | | | 13,013 | | | 23,719 | | | 27,045 | | Agency fees | | 15,591 | | | 13,376 | |
| Outside fees and services | Outside fees and services | 18,683 | | | 16,293 | | | 38,077 | | | 31,541 | | Outside fees and services | | 20,760 | | | 19,394 | |
| Communication | Communication | 8,812 | | | 10,824 | | | 22,323 | | | 24,025 | | Communication | | 12,663 | | | 13,511 | |
| Rent and occupancy | Rent and occupancy | 4,471 | | | 4,491 | | | 8,955 | | | 8,854 | | Rent and occupancy | | 4,480 | | | 4,484 | |
| Depreciation and amortization | Depreciation and amortization | 4,109 | | | 4,723 | | | 8,193 | | | 9,295 | | Depreciation and amortization | | 3,981 | | | 4,084 | |
| Other operating expenses | Other operating expenses | 10,491 | | | 10,926 | | | 22,696 | | | 22,511 | | Other operating expenses | | 13,018 | | | 12,205 | |
| | Total operating expenses | Total operating expenses | 160,630 | | | 187,496 | | | 351,874 | | | 378,430 | | Total operating expenses | | 178,715 | | | 191,244 | |
| | Income from operations | Income from operations | 111,280 | | | 63,365 | | | 171,820 | | | 112,213 | | Income from operations | | 110,754 | | | 60,540 | |
| Other income and (expense): | Other income and (expense): | | Other income and (expense): | |
| | Interest expense, net | Interest expense, net | (35,416) | | | (36,027) | | | (72,627) | | | (70,008) | | Interest expense, net | | (31,552) | | | (37,211) | |
| Foreign exchange gain/(loss) | 683 | | | (311) | | | 2,966 | | | 5,953 | | |
| Foreign exchange (loss)/gain | | Foreign exchange (loss)/gain | | (26) | | | 2,283 | |
| Other | Other | (1,582) | | | 248 | | | (1,658) | | | (104) | | Other | | 26 | | | (76) | |
| Income before income taxes | Income before income taxes | 74,965 | | | 27,275 | | | 100,501 | | | 48,054 | | Income before income taxes | | 79,202 | | | 25,536 | |
| Income tax expense | Income tax expense | 14,137 | | | 5,075 | | | 17,237 | | | 8,942 | | Income tax expense | | 17,322 | | | 3,100 | |
| Net income | Net income | 60,828 | | | 22,200 | | | 83,264 | | | 39,112 | | Net income | | 61,880 | | | 22,436 | |
| Adjustment for net income attributable to noncontrolling interests | Adjustment for net income attributable to noncontrolling interests | 2,914 | | | 3,581 | | | 6,215 | | | 5,266 | | Adjustment for net income attributable to noncontrolling interests | | 3,474 | | | 3,301 | |
| Net income attributable to PRA Group, Inc. | Net income attributable to PRA Group, Inc. | $ | 57,914 | | | $ | 18,619 | | | $ | 77,049 | | | $ | 33,846 | | Net income attributable to PRA Group, Inc. | | $ | 58,406 | | | $ | 19,135 | |
| Net income per common share attributable to PRA Group, Inc.: | Net income per common share attributable to PRA Group, Inc.: | | | | | | | | Net income per common share attributable to PRA Group, Inc.: | | | | |
| Basic | Basic | $ | 1.27 | | | $ | 0.41 | | | $ | 1.69 | | | $ | 0.75 | | Basic | | $ | 1.28 | | | $ | 0.42 | |
| Diluted | Diluted | $ | 1.26 | | | $ | 0.41 | | | $ | 1.68 | | | $ | 0.74 | | Diluted | | $ | 1.27 | | | $ | 0.42 | |
| Weighted average number of shares outstanding: | Weighted average number of shares outstanding: | | Weighted average number of shares outstanding: | |
| Basic | Basic | 45,548 | | | 45,387 | | | 45,500 | | | 45,363 | | Basic | | 45,669 | | | 45,452 | |
| Diluted | Diluted | 45,987 | | | 45,495 | | | 45,886 | | | 45,457 | | Diluted | | 46,045 | | | 45,784 | |
The accompanying notes are an integral part of these consolidated financial statements.Consolidated Financial Statements.
PRA Group, Inc.
Consolidated Statements of Comprehensive Income/(Loss)
For the three and six months ended June 30,March 31, 2021 and 2020 and 2019
(unaudited)
(Amounts in thousands)
| | | Three Months Ended June 30, | | | Six Months Ended June 30, | | | Three Months Ended March 31, |
| | 2020 | | 2019 | | 2020 | | 2019 | | 2021 | | 2020 |
| Net income | Net income | $ | 60,828 | | | $ | 22,200 | | | $ | 83,264 | | | $ | 39,112 | | Net income | | $ | 61,880 | | | $ | 22,436 | |
| Other comprehensive income/(loss), net of tax: | Other comprehensive income/(loss), net of tax: | | Other comprehensive income/(loss), net of tax: | |
| Currency translation adjustments | Currency translation adjustments | 28,923 | | | 4,740 | | | (79,153) | | | 3,567 | | Currency translation adjustments | | (24,531) | | | (108,076) | |
| Cash flow hedges | Cash flow hedges | (3,753) | | | (8,002) | | | (24,321) | | | (13,717) | | Cash flow hedges | | 12,323 | | | (20,568) | |
| Debt securities available-for-sale | Debt securities available-for-sale | 51 | | | 37 | | | 221 | | | 82 | | Debt securities available-for-sale | | 0 | | | 170 | |
| Other comprehensive income/(loss) | 25,221 | | | (3,225) | | | (103,253) | | | (10,068) | | |
| Other comprehensive loss | | Other comprehensive loss | | (12,208) | | | (128,474) | |
| Total comprehensive income/(loss) | Total comprehensive income/(loss) | 86,049 | | | 18,975 | | | (19,989) | | | 29,044 | | Total comprehensive income/(loss) | | 49,672 | | | (106,038) | |
| Less comprehensive (loss)/ income attributable to noncontrolling interests | (270) | | | 3,959 | | | (10,844) | | | 5,213 | | |
| Less comprehensive loss attributable to noncontrolling interests | | Less comprehensive loss attributable to noncontrolling interests | | (950) | | | (10,574) | |
| Comprehensive income/(loss) attributable to PRA Group, Inc. | Comprehensive income/(loss) attributable to PRA Group, Inc. | $ | 86,319 | | | $ | 15,016 | | | $ | (9,145) | | | $ | 23,831 | | Comprehensive income/(loss) attributable to PRA Group, Inc. | | $ | 50,622 | | | $ | (95,464) | |
The accompanying notes are an integral part of these consolidated financial statements.Consolidated Financial Statements.
PRA Group, Inc.
Consolidated Statements of Changes in Equity
For the sixthree months ended June 30,March 31, 2021 and 2020
(unaudited)
(Amounts in thousands)
| | | Common Stock | | | Additional Paid-in Capital | | Retained Earnings | | Accumulated Other Comprehensive (Loss) | | Noncontrolling Interest | | Total Equity | | | Common Stock | | Additional Paid-In | | Retained | | Accumulated Other Comprehensive | | Noncontrolling | | Total | |
| | Shares | | Amount | | | | | | | | | | | | Shares | | Amount | | Capital | | Earnings | | (Loss) | | Interest | | Equity | |
| Balance at December 31, 2019 | 45,416 | | | $ | 454 | | | $ | 67,321 | | | $ | 1,362,631 | | | $ | (261,018) | | | $ | 57,625 | | | $ | 1,227,013 | | | |
| | Balance at December 31, 2020 | | Balance at December 31, 2020 | 45,585 | | | $ | 456 | | | $ | 75,282 | | | $ | 1,511,970 | | | $ | (245,791) | | | $ | 31,609 | | | $ | 1,373,526 | | |
Effect of change in accounting principle (1) | | Effect of change in accounting principle (1) | — | | | — | | | (26,697) | | | 12,008 | | | — | | | — | | | (14,689) | | |
| Balance at January 1, 2021 | | Balance at January 1, 2021 | 45,585 | | | 456 | | | 48,585 | | | 1,523,978 | | | (245,791) | | | 31,609 | | | 1,358,837 | | |
| Components of comprehensive income, net of tax: | Components of comprehensive income, net of tax: | | | | | | | | | | | | | | | Components of comprehensive income, net of tax: | | |
| Net income | Net income | — | | | — | | | — | | | 19,135 | | | — | | | 3,301 | | | 22,436 | | | Net income | — | | | — | | | — | | | 58,406 | | | — | | | 3,474 | | | 61,880 | | |
| Currency translation adjustments | Currency translation adjustments | — | | | — | | | — | | | — | | | (94,201) | | | (13,875) | | | (108,076) | | | Currency translation adjustments | — | | | — | | | — | | | — | | | (20,108) | | | (4,423) | | | (24,531) | | |
| Cash flow hedges | Cash flow hedges | — | | | — | | | — | | | — | | | (20,568) | | | — | | | (20,568) | | | Cash flow hedges | — | | | — | | | — | | | — | | | 12,323 | | | — | | | 12,323 | | |
| | Debt securities available-for-sale | — | | | — | | | — | | | — | | | 170 | | | — | | | 170 | | | |
| | Distributions to noncontrolling interest | | Distributions to noncontrolling interest | — | | | — | | | — | | | — | | | — | | | (3,933) | | | (3,933) | | |
| | Vesting of restricted stock | Vesting of restricted stock | 124 | | | 1 | | | — | | | — | | | — | | | — | | | 1 | | | Vesting of restricted stock | 214 | | | 2 | | | (2) | | | — | | | — | | | — | | | 0 | | |
| | Share-based compensation expense | Share-based compensation expense | — | | | — | | | 2,857 | | | — | | | — | | | — | | | 2,857 | | | Share-based compensation expense | — | | | — | | | 4,113 | | | — | | | — | | | — | | | 4,113 | | |
| | Employee stock relinquished for payment of taxes | Employee stock relinquished for payment of taxes | — | | | — | | | (3,157) | | | — | | | — | | | — | | | (3,157) | | | Employee stock relinquished for payment of taxes | — | | | — | | | (5,460) | | | — | | | — | | | — | | | (5,460) | | |
| | Balance at March 31, 2020 | 45,540 | | | $ | 455 | | | $ | 67,021 | | | $ | 1,381,766 | | | $ | (375,617) | | | $ | 47,051 | | | $ | 1,120,676 | | | |
| Balance at March 31, 2021 | | Balance at March 31, 2021 | 45,799 | | | $ | 458 | | | $ | 47,236 | | | $ | 1,582,384 | | | $ | (253,576) | | | $ | 26,727 | | | $ | 1,403,229 | | |
| | | | Common Stock | | Additional Paid-In | | Retained | | Accumulated Other Comprehensive | | Noncontrolling | | Total | |
| | | Shares | | Amount | | Capital | | Earnings | | (Loss) | | Interest | | Equity | |
| Balance at December 31, 2019 | | Balance at December 31, 2019 | 45,416 | | | $ | 454 | | | $ | 67,321 | | | $ | 1,362,631 | | | $ | (261,018) | | | $ | 57,625 | | | $ | 1,227,013 | | |
| Components of comprehensive income, net of tax: | Components of comprehensive income, net of tax: | | | | | | | | | | | | | | | Components of comprehensive income, net of tax: | | |
| Net income | Net income | — | | | — | | | — | | | 57,914 | | | — | | | 2,914 | | | 60,828 | | | Net income | — | | | — | | | — | | | 19,135 | | | — | | | 3,301 | | | 22,436 | | |
| Currency translation adjustments | Currency translation adjustments | — | | | — | | | — | | | — | | | 32,107 | | | (3,184) | | | 28,923 | | | Currency translation adjustments | — | | | — | | | — | | | — | | | (94,201) | | | (13,875) | | | (108,076) | | |
| Cash flow hedges | Cash flow hedges | — | | | — | | | — | | | — | | | (3,753) | | | — | | | (3,753) | | | Cash flow hedges | — | | | — | | | — | | | — | | | (20,568) | | | — | | | (20,568) | | |
| Debt securities available-for-sale | Debt securities available-for-sale | — | | | — | | | — | | | — | | | 51 | | | — | | | 51 | | | Debt securities available-for-sale | — | | | — | | | — | | | — | | | 170 | | | — | | | 170 | | |
| Distributions to noncontrolling interest | — | | | — | | | — | | | — | | | — | | | (14,908) | | | (14,908) | | | |
| | Vesting of restricted stock | Vesting of restricted stock | 39 | | | 1 | | | (1) | | | — | | | — | | | — | | | — | | | Vesting of restricted stock | 124 | | | 1 | | | — | | | — | | | — | | | — | | | 1 | | |
| Share-based compensation expense | Share-based compensation expense | — | | | — | | | 3,063 | | | — | | | — | | | — | | | 3,063 | | | Share-based compensation expense | — | | | — | | | 2,857 | | | — | | | — | | | — | | | 2,857 | | |
| Employee stock relinquished for payment of taxes | Employee stock relinquished for payment of taxes | — | | | — | | | (18) | | | — | | | — | | | — | | | (18) | | | Employee stock relinquished for payment of taxes | — | | | — | | | (3,157) | | | — | | | — | | | — | | | (3,157) | | |
| | Balance at June 30, 2020 | 45,579 | | | $ | 456 | | | $ | 70,065 | | | $ | 1,439,680 | | | $ | (347,212) | | | $ | 31,873 | | | $ | 1,194,862 | | | |
| | Balance at March 31, 2020 | | Balance at March 31, 2020 | 45,540 | | | $ | 455 | | | $ | 67,021 | | | $ | 1,381,766 | | | $ | (375,617) | | | $ | 47,051 | | | $ | 1,120,676 | | |
PRA Group, Inc.
Consolidated Statements of Changes in Equity
For the six months ended June 30, 2019
(unaudited)
(Amounts in thousands)
| | | | | | | | | | | | | | | | | | | | | | | | | | | | | | | | | | | | | | | | | | |
| Common Stock | | | | Additional Paid-in Capital | | Retained Earnings | | Accumulated Other Comprehensive (Loss) | | Noncontrolling Interest | | Total Equity | |
| Shares | | Amount | | | | | | | | | | | |
| Balance at December 31, 2018 | 45,304 | | | $ | 453 | | | $ | 60,303 | | | $ | 1,276,473 | | | $ | (242,109) | | | $ | 28,849 | | | $ | 1,123,969 | | |
| | | | | | | | | | | | | | |
| | | | | | | | | | | | | | |
| Components of comprehensive income, net of tax: | | | | | | | | | | | | | | |
| Net income | — | | | — | | | — | | | 15,227 | | | — | | | 1,685 | | | 16,912 | | |
| Currency translation adjustments | — | | | — | | | — | | | — | | | (742) | | | (431) | | | (1,173) | | |
| Cash flow hedges | — | | | — | | | — | | | — | | | (5,715) | | | — | | | (5,715) | | |
| Debt securities available-for-sale | — | | | — | | | — | | | — | | | 45 | | | — | | | 45 | | |
| | | | | | | | | | | | | | |
| | | | | | | | | | | | | | |
| Distributions to noncontrolling interest | — | | | — | | | — | | | — | | | — | | | (6,877) | | | (6,877) | | |
| Contributions from noncontrolling interest | — | | | — | | | — | | | — | | | — | | | 89 | | | 89 | | |
| | | | | | | | | | | | | | |
| | | | | | | | | | | | | | |
| | | | | | | | | | | | | | |
| Vesting of restricted stock | 80 | | | 1 | | | (1) | | | — | | | — | | | — | | | — | | |
| | | | | | | | | | | | | | |
| Share-based compensation expense | — | | | — | | | 2,314 | | | — | | | — | | | — | | | 2,314 | | |
| | | | | | | | | | | | | | |
| Employee stock relinquished for payment of taxes | — | | | — | | | (1,437) | | | — | | | — | | | — | | | (1,437) | | |
| Other | — | | | — | | | (2,088) | | | — | | | — | | | — | | | (2,088) | | |
| Balance at March 31, 2019 | 45,384 | | | $ | 454 | | | $ | 59,091 | | | $ | 1,291,700 | | | $ | (248,521) | | | $ | 23,315 | | | $ | 1,126,039 | | |
| Components of comprehensive income, net of tax: | | | | | | | | | | | | | | |
| Net income | — | | | — | | | — | | | 18,619 | | | — | | | 3,581 | | | 22,200 | | |
| Currency translation adjustments | — | | | — | | | — | | | — | | | 4,362 | | | 378 | | | 4,740 | | |
| Cash flow hedges | — | | | — | | | — | | | — | | | (8,002) | | | — | | | (8,002) | | |
| Debt securities available-for-sale | — | | | — | | | — | | | — | | | 37 | | | — | | | 37 | | |
| | | | | | | | | | | | | | |
| Contributions from noncontrolling interest | — | | | — | | | — | | | — | | | — | | | 3,229 | | | 3,229 | | |
| Vesting of restricted stock | 25 | | | — | | | — | | | — | | | — | | | — | | | — | | |
| Share-based compensation expense | — | | | — | | | 2,620 | | | — | | | — | | | — | | | 2,620 | | |
| Employee stock relinquished for payment of taxes | — | | | — | | | (6) | | | — | | | — | | | — | | | (6) | | |
| | | | | | | | | | | | | | |
| Balance at June 30, 2019 | 45,409 | | | $ | 454 | | | $ | 61,705 | | | $ | 1,310,319 | | | $ | (252,124) | | | $ | 30,503 | | | $ | 1,150,857 | | |
| | | | | | | | | | | | | | |
| | | | | | | | | | | | | | |
| | | | | | | | | | | | | | |
| | | | | | | | | | | | | | |
| | | | | | | | | | | | | | |
| | | | | | | | | | | | | | |
| | | | | | | | | | | | | | |
| | | | | | | | | | | | | | |
| | | | | | | | | | | | | | |
| | | | | | | | | | | | | | |
| | | | | | | | | | | | | | |
| | | | | | | | | | | | | | |
The accompanying notes are an integral part of these consolidated financial statements.Consolidated Financial Statements.
PRA Group, Inc.
Consolidated Statements of Cash Flows
For the sixthree months ended June 30,March 31, 2021 and 2020 and 2019
(unaudited)
(Amounts in thousands)
| | | Six Months Ended June 30, | | | Three Months Ended March 31, |
| | 2020 | | 2019 | | 2021 | | 2020 |
| Cash flows from operating activities: | Cash flows from operating activities: | | | | Cash flows from operating activities: | | | |
| Net income | Net income | $ | 83,264 | | | $ | 39,112 | | Net income | $ | 61,880 | | | $ | 22,436 | |
| Adjustments to reconcile net income to net cash provided by operating activities: | Adjustments to reconcile net income to net cash provided by operating activities: | | Adjustments to reconcile net income to net cash provided by operating activities: | |
| Share-based compensation expense | Share-based compensation expense | 5,920 | | | 4,934 | | Share-based compensation expense | 4,113 | | | 2,857 | |
| Depreciation and amortization | Depreciation and amortization | 8,193 | | | 9,295 | | Depreciation and amortization | 3,981 | | | 4,084 | |
| | Amortization of debt discount and issuance costs | Amortization of debt discount and issuance costs | 11,846 | | | 11,403 | | Amortization of debt discount and issuance costs | 2,256 | | | 5,857 | |
| Changes in expected recoveries | Changes in expected recoveries | (6,985) | | | — | | Changes in expected recoveries | (50,136) | | | 12,816 | |
| | Deferred income taxes | Deferred income taxes | (21,361) | | | (25,287) | | Deferred income taxes | 10,371 | | | (12,755) | |
| Net unrealized foreign currency transactions | Net unrealized foreign currency transactions | 33,320 | | | (7,437) | | Net unrealized foreign currency transactions | 2,134 | | | 24,873 | |
| Fair value in earnings for equity securities | Fair value in earnings for equity securities | 1,412 | | | (1,448) | | Fair value in earnings for equity securities | (107) | | | (7,566) | |
| Net allowance charges | — | | | 7,291 | | |
| Other | Other | (256) | | | — | | Other | (419) | | | (135) | |
| | Changes in operating assets and liabilities: | Changes in operating assets and liabilities: | | Changes in operating assets and liabilities: | |
| Other assets | Other assets | 256 | | | 1,863 | | Other assets | 670 | | | (1,242) | |
| Other receivables, net | Other receivables, net | (4,733) | | | 2,978 | | Other receivables, net | 10,043 | | | (545) | |
| Accounts payable | Accounts payable | 507 | | | (2,956) | | Accounts payable | (431) | | | 221 | |
| Income taxes payable, net | Income taxes payable, net | 22,527 | | | (8,766) | | Income taxes payable, net | (3,669) | | | 3,835 | |
| Accrued expenses | Accrued expenses | (13,336) | | | (1,979) | | Accrued expenses | (20,227) | | | (8,990) | |
| Other liabilities | Other liabilities | 1,821 | | | 1,799 | | Other liabilities | (336) | | | 994 | |
| Right of use asset/lease liability | Right of use asset/lease liability | 105 | | | — | | Right of use asset/lease liability | 85 | | | 66 | |
| Other, net | — | | | 146 | | |
| | Net cash provided by operating activities | Net cash provided by operating activities | 122,500 | | | 30,948 | | Net cash provided by operating activities | 20,208 | | | 46,806 | |
| Cash flows from investing activities: | Cash flows from investing activities: | | | | Cash flows from investing activities: | | | |
| Net, purchases of property and equipment | (10,597) | | | (5,646) | | |
| Purchases of property and equipment, net | | Purchases of property and equipment, net | (2,366) | | | (7,639) | |
| | Purchases of finance receivables | Purchases of finance receivables | (436,097) | | | (549,377) | | Purchases of finance receivables | (159,328) | | | (271,845) | |
| Recoveries applied to negative allowance | Recoveries applied to negative allowance | 501,583 | | | — | | Recoveries applied to negative allowance | 328,559 | | | 236,656 | |
| Collections applied to principal on finance receivables | — | | | 443,390 | | |
| Purchase of investments | (8,317) | | | (82,648) | | |
| | Proceeds from sales and maturities of investments | Proceeds from sales and maturities of investments | 41,505 | | | 43,011 | | Proceeds from sales and maturities of investments | 764 | | | 648 | |
| Business acquisition, net of cash acquired | Business acquisition, net of cash acquired | — | | | (57,610) | | Business acquisition, net of cash acquired | (647) | | | 0 | |
| | Proceeds from sale of subsidiaries, net | — | | | 31,177 | | |
| | Net cash provided by/(used in) investing activities | Net cash provided by/(used in) investing activities | 88,077 | | | (177,703) | | Net cash provided by/(used in) investing activities | 166,982 | | | (42,180) | |
| Cash flows from financing activities: | Cash flows from financing activities: | | | | Cash flows from financing activities: | | | |
| Proceeds from lines of credit | Proceeds from lines of credit | 395,152 | | | 769,021 | | Proceeds from lines of credit | 45,369 | | | 315,118 | |
| Principal payments on lines of credit | Principal payments on lines of credit | (568,912) | | | (324,103) | | Principal payments on lines of credit | (226,621) | | | (227,459) | |
| Principal payments on notes payable and long-term debt | (5,000) | | | (308,165) | | |
| | Principal payments on long-term debt | | Principal payments on long-term debt | (2,500) | | | (2,500) | |
| | Payments of origination cost and fees | Payments of origination cost and fees | (9,781) | | | — | | Payments of origination cost and fees | (113) | | | (8,203) | |
| Tax withholdings related to share-based payments | Tax withholdings related to share-based payments | (3,176) | | | (1,443) | | Tax withholdings related to share-based payments | (5,460) | | | (3,156) | |
| Distributions paid to noncontrolling interest | Distributions paid to noncontrolling interest | (14,908) | | | (6,877) | | Distributions paid to noncontrolling interest | (3,933) | | | 0 | |
| | Purchase of noncontrolling interest | — | | | (1,166) | | |
| | Net increase in interest-bearing deposits | 13,675 | | | 28,429 | | |
| Other financing activities | — | | | 1,141 | | |
| | Net increase/(decrease) in interest-bearing deposits | | Net increase/(decrease) in interest-bearing deposits | 303 | | | (1,658) | |
| | | Net cash (used in)/provided by financing activities | Net cash (used in)/provided by financing activities | (192,950) | | | 156,837 | | Net cash (used in)/provided by financing activities | (192,955) | | | 72,142 | |
| Effect of exchange rate on cash | Effect of exchange rate on cash | (16,503) | | | (3,281) | | Effect of exchange rate on cash | (6,427) | | | (16,575) | |
| Net increase in cash and cash equivalents | 1,124 | | | 6,801 | | |
| Cash and cash equivalents, beginning of period | 123,807 | | | 98,695 | | |
| Cash and cash equivalents, end of period | $ | 124,931 | | | $ | 105,496 | | |
| Net (decrease)/increase in cash, cash equivalents and restricted cash | | Net (decrease)/increase in cash, cash equivalents and restricted cash | (12,192) | | | 60,193 | |
| Cash, cash equivalents and restricted cash beginning of period | | Cash, cash equivalents and restricted cash beginning of period | 121,047 | | | 123,807 | |
| Cash, cash equivalents and restricted cash, end of period | | Cash, cash equivalents and restricted cash, end of period | $ | 108,855 | | | $ | 184,000 | |
| Supplemental disclosure of cash flow information: | Supplemental disclosure of cash flow information: | | | | Supplemental disclosure of cash flow information: | | | |
| Cash paid for interest | Cash paid for interest | $ | 60,618 | | | $ | 54,973 | | Cash paid for interest | $ | 32,622 | | | $ | 30,502 | |
| Cash paid for income taxes | Cash paid for income taxes | 16,796 | | | 42,172 | | Cash paid for income taxes | 10,463 | | | 12,100 | |
| Cash, cash equivalents and restricted cash reconciliation: | | |
| Cash and cash equivalents per Consolidated Balance Sheets | $ | 115,741 | | | $ | 105,496 | | |
| Restricted cash included in Other assets per Consolidated Balance Sheets | 9,190 | | | — | | |
| Total cash, cash equivalents and restricted cash | $ | 124,931 | | | $ | 105,496 | | |
|
The accompanying notes are an integral part of these consolidated financial statements.Consolidated Financial Statements.
PRA Group, Inc.
Notes to Consolidated Financial Statements
1. Organization and Business:
As used herein, the terms "PRA Group," the "Company," or similar terms refer to PRA Group, Inc. and its subsidiaries.
PRA Group, Inc., a Delaware corporation, is a global financial and business services company with operations in the Americas, Europe and Australia. The Company's primary business is the purchase, collection and management of portfolios of nonperforming loans. The Company also provides fee-based services on class action claims recoveries and by servicing consumer bankruptcy accounts in the United States ("U.S.").
On March 11, 2020, due to the global outbreak of the novel coronavirus ("COVID-19"), the World Health Organization declared a global pandemic. Since the initial outbreak was reported, COVID-19 has continued to adversely impact all countries in which the Company operates. As a result, the Company continues to operate in business continuity mode globally. The Company's business continuity plans have allowed the Company to operate its business while minimizing disruption and complying with country-specific, federal, state and local laws, regulations and governmental actions related to the pandemic.
Basis of presentation: The consolidated financial statementsConsolidated Financial Statements of the Company are prepared in accordance with U.S. generally accepted accounting principles ("GAAP"). The accompanying interim financial statements have been prepared in accordance with the instructions for Quarterly Reports on Form 10-Q and, therefore, do not include all information and Notes to the Consolidated Financial Statements necessary for a complete presentation of financial position, results of operations, comprehensive income/(loss) and cash flows in conformity with GAAP. In the opinion of management, all adjustments, consisting of normal and recurring items, necessary for the fair presentation of the Company's Consolidated Balance Sheets as of June 30, 2020,March 31, 2021 and its Consolidated Income Statements, and its Consolidated Statements of Comprehensive Income/(Loss) for the three and six months ended June 30, 2020 and 2019, and its Consolidated, Statements of Changes in Equity and Consolidated Statements of Cash Flows for the sixthree months ended June 30,March 31, 2021 and 2020, and 2019, have been included. The Company's Consolidated Income Statements of the Company for the three and six months ended June 30, 2020March 31, 2021 may not be indicative of future results.
These unaudited consolidated financial statementsConsolidated Financial Statements should be read in conjunction with the audited consolidated financial statementsConsolidated Financial Statements and notes thereto included in the Company's Annual Report on Form 10-K for the year ended December 31, 20192020 (the "2019"2020 Form 10-K").
Consolidation: The consolidated financial statementsConsolidated Financial Statements include the accounts of PRA Group and other entities in which the Company has a controlling interest. All significant intercompany accounts and transactions have been eliminated.
Entities in which the Company has a controlling financial interest, through ownership of the majority of the entities’ voting equity interests, or through other contractual rights that give the Company control, consist of entities which purchase and collect on portfolios of nonperforming loans.
Investments in companies in which the Company has significant influence over operating and financing decisions, but does not own a majority of the voting equity interests, are accounted for in accordance with the equity method of accounting, which requires the Company to recognize its proportionate share of the entity’s net earnings. These investments are included in otherOther assets, with income or loss included in otherOther revenue.
The Company performs on-going reassessments of whether changes in the facts and circumstances regarding the Company’s involvement with an entity cause the Company’s consolidation conclusion to change.
Restricted cash: Cash that is subject to legal restrictions or is unavailable for general operating purposes is classified as restricted cash.
Segments: Under the guidance of the Financial Accounting Standards Board ("FASB") Accounting Standards Codification ("ASC") ASC Topic 280 "Segment Reporting" ("ASC 280"), the Company has determined that it has several operating segments that meet the aggregation criteria of ASC 280, and, therefore, it has 1 reportable segment, accounts receivable management. This conclusion is based on similarities among the operating units, including economic characteristics, the nature of the products and services, the nature of the production processes, the types or class of customer for their products and services, the methods used to distribute their products and services and the nature of the regulatory environment.
PRA Group, Inc.
Notes to Consolidated Financial Statements
The following table shows the amount of revenue generated for the three and six months ended June 30,March 31, 2021 and 2020, and 2019, and long-lived assets held at June 30,March 31, 2021 and 2020, and 2019, both for the U.S., the Company's country of domicile, and outside of the U.S. (amounts in thousands):
| | | As of and for the | | | As of and for the | | | As of and for the | | As of and for the |
| | Three Months Ended June 30, 2020 | | | Three Months Ended June 30, 2019 | | | Three Months Ended March 31, 2021 | | Three Months Ended March 31, 2020 |
| | Revenues | | Long-Lived Assets | | Revenues | | Long-Lived Assets | | Revenues (2) | | Long-Lived Assets | | Revenues (2) | | Long-Lived Assets |
| United States | United States | $ | 192,293 | | | $ | 105,996 | | | $ | 167,923 | | | $ | 110,323 | | United States | $ | 178,181 | | | $ | 96,630 | | | $ | 153,335 | | | $ | 115,053 | |
| United Kingdom | United Kingdom | 28,041 | | | 2,755 | | | 28,292 | | | 3,917 | | United Kingdom | 48,177 | | | 2,269 | | | 36,340 | | | 3,076 | |
Other (1) | Other (1) | 51,576 | | | 8,747 | | | 55,842 | | | 10,061 | | Other (1) | 63,111 | | | 8,765 | | | 62,109 | | | 8,408 | |
| Total | Total | $ | 271,910 | | | $ | 117,498 | | | $ | 252,057 | | | $ | 124,301 | | Total | $ | 289,469 | | | $ | 107,664 | | | $ | 251,784 | | | $ | 126,537 | |
| | As of and for the | | | As of and for the | | |
| Six Months Ended June 30, 2020 | | | Six Months Ended June 30, 2019 | | |
| Revenues | | Long-Lived Assets | | Revenues | | Long-Lived Assets | |
| United States | $ | 345,628 | | | $ | 105,996 | | | $ | 335,499 | | | $ | 110,323 | | |
| United Kingdom | 64,381 | | | 2,755 | | | 58,048 | | | 3,917 | | |
Other (1) | 113,685 | | | 8,747 | | | 104,387 | | | 10,061 | | |
| Total | $ | 523,694 | | | $ | 117,498 | | | $ | 497,934 | | | $ | 124,301 | | |
(1) None of the countries included in "Other" comprise greater than 10% of the Company's consolidated revenues or long-lived assets.
(2) Based on the Company’s financial statement information used to produce the Company's general-purpose financial statements, it is impracticable to report further breakdowns of revenues from external customers by product or service.
PRA Group, Inc.
Notes to Consolidated Financial Statements
Beginning January 1, 2020, the Company implemented Accounting Standards Update ("ASU") ASU 2016-13, "Financial Instruments - Credit Losses" ("Topic 326") ("ASU 2016-13") and ASU 2019-11, “Codification Improvements to Topic 326, Financial Instruments - Credit Losses” (“ASU 2019-11”), collectively referred to as "ASC 326", on a prospective basis. Prior to January 1, 2020, the vast majority of the Company's investment in finance receivables were accounted for under ASC 310-30 "Loans and Debt Securities Acquired with Deteriorated Credit Quality" ("ASC 310-30"). Refer to Note 2.
Finance receivables and income recognition: 4The Company accounts for its investment in finance receivables at amortized cost under the guidance of ASC Topic 310 “Receivables” (“ASC 310”) and ASC Topic 326-20 “Financial Instruments - Credit Losses - Measured at Amortized Cost” (“ASC 326-20”). ASC 326-20 requires a financial asset (or a group of financial assets) measured at amortized cost basis to be presented at the net amount expected to be collected.
Credit quality information: The Company acquires portfolios of accounts that have experienced deterioration of credit quality between origination and the Company's acquisition of the accounts. The amount paid for a portfolio reflects the Company's determination that it is probable the Company will be unable to collect all amounts due according to an account's contractual terms. The Company accounts for the portfolios in accordance with the guidance for purchased credit deteriorated ("PCD") assets. The initial allowance for credit losses is added to the purchase price rather than recorded as a credit loss expense. The Company has established a policy to writeoff the amortized cost of individual assets when it deems probable that it will not collect on an individual asset. Due to the deteriorated credit quality of the individual accounts, the Company may writeoff the unpaid principal balance of all accounts in a portfolio at the time of acquisition. However, when the Company has an expectation of collecting cash flows at the portfolio level, a negative allowance is established for expected recoveries at an amount not to exceed the amount paid for the financial portfolios.
Portfolio segments: The Company develops systematic methodologies to determine its allowance for credit losses at the portfolio segment level. The Company’s nonperforming loan portfolio segments consist of two broad categories: Core and Insolvency. The Company’s Core portfolios contain loan accounts that are in default, which were purchased at a substantial discount to face value because either the credit grantor and/or other third-party collection agencies have been unsuccessful in collecting the full balance owed. The Company’s Insolvency portfolios contain loan accounts that are in default where the customer is involved in a bankruptcy or insolvency proceeding and were purchased at a substantial discount to face value. Each of the two broad portfolio segments of purchased nonperforming loan portfolios consist of large numbers of homogeneous receivables with similar risk characteristics.
PRA Group, Inc.
Notes to Consolidated Financial Statements
Effective interest rate and accounting pools: Within each portfolio segment, the Company pools accounts with similar risk characteristics that are acquired in the same year. Similar risk characteristics generally include portfolio segment and geographic region. The initial effective interest rate of the pool is established based on the purchase price and expected recoveries of each individual purchase at the purchase date. During the year of acquisition, the annual pool is aggregated, and the blended effective interest rate will change to reflect new acquisitions and new cash flow estimates until the end of the year. The effective interest rate for a pool is fixed for the remaining life of the pool once the year has ended.
Methodology: The Company develops its estimates of expected recoveries in the Consolidated Balance Sheets by applying discounted cash flow methodologies to its estimated remaining collections (“ERC”) and recognizes income over the estimated life of the pool at the constant effective interest rate of the pool. Subsequent changes (favorable and unfavorable) in expected cash flows are recognized within changes in expected recoveries in the Consolidated Income Statements by adjusting the present value of increases or decreases in ERC at a constant effective interest rate. Amounts included in the estimate of recoveries do not exceed the aggregate amount of the amortized cost basis previously written off or expected to be written off.
The measurement of expected recoveries is based on relevant information about past events, including historical experience, current conditions, and reasonable and supportable forecasts that affect the collectability of the reported amount. Factors that may contribute to the changes in estimated cash flows include both external and internal factors. External factors that may have an impact on the collectability, and subsequently on the overall profitability of acquired pools of nonperforming loans, would include new laws or regulations relating to collections, new interpretations of existing laws or regulations, and the overall condition of the economy. Internal factors that may have an impact on the collectability, and subsequently the overall profitability of acquired pools of nonperforming loans, would include necessary revisions to initial and post-acquisition scoring and modeling estimates, operational activities, expected impact of operational strategies and changes in productivity related to turnover and tenure of the Company's collection staff.
Portfolio income: The recognition of income on expected recoveries is based on the constant effective interest rate established for a pool.
Changes in expected recoveries: The activity consists of differences between actual recoveries compared to expected recoveries for the reporting period, as well as the net present value of increases or decreases in ERC at the constant effective interest rate.
Agreements to acquire the aforementioned receivables include general representations and warranties from the sellers covering matters such as account holder death or insolvency and accounts settled or disputed prior to sale. The representation and warranty period permitting the return of these accounts from the Company to the seller is typically 90 to 180 days, with certain international agreements extending as long as 24 months. Any funds received from the seller as a return of purchase price are referred to as buybacks. Buyback funds are included in changes in expected recoveries when received.
Fees paid to third parties other than the seller related to the direct acquisition of a portfolio of accounts are expensed when incurred.
Goodwill and intangible assets: Goodwill, in accordance with ASC Topic 350, "Intangibles-Goodwill and Other" ("ASC 350"), is not amortized but rather is reviewed for impairment annually or more frequently if indicators of potential impairment exist. On January 1, 2020, the Company adopted ASU 2017-04, "Intangibles - Goodwill and Other (Topic 350): Simplifying the Test for Goodwill Impairment" ("ASU 2017-04"). The Company performs its annual assessment of goodwill as of October 1. The Company may first assess qualitative factors to determine whether it is more likely than not that the fair value of a reporting unit is less than its carrying amount, including goodwill. If management concludes that it is more likely than not that the fair value of a reporting unit is less than its carrying amount, an impairment loss is recognized. The loss will be recorded at the amount by which the carrying amount exceeds the reporting unit’s fair value, not to exceed the total amount of goodwill allocated to the respective reporting unit.
2. Change in Accounting Principle:
Financial Instruments - Credit Losses
In June 2016,August 2020, the FASB issued Accounting Standards Update ("ASU") 2020-06 Debt—Debt with Conversion and Other Options (Subtopic 470-20) and Derivatives and Hedging—Contracts in Entity’s Own Equity (Subtopic 815-40): Accounting for Convertible Instruments and Contracts in an Entity’s Own Equity ("ASU 2016-13, which introduced a new methodology requiring2020-06"). ASU 2020-06 reduces the measurementnumber of expected credit lossesaccounting models for financialconvertible debt instruments held at the reporting date based on historical experience, currentand convertible preferred stock. Additionally, ASU 2020-06 removes certain settlement conditions and reasonable and supportable forecasts. ASU 2016-13 utilizes a lifetime “expected credit loss” measurement objectivethat are required for equity contracts to qualify for the recognition of credit lossesderivative scope exception and simplifies the diluted earnings per share ("EPS") calculation in certain areas.
The Company accounts for loans, held-to-maturity debt securitiesits 3.50% Convertible Notes due 2023 (the "2023 Notes" or the "Convertible Notes") in accordance with ASC 470-20, "Debt with Conversion and other receivables measured at amortized cost. The
PRA Group, Inc.
NotesOther Options" ("ASC 470"). Under ASU 2020-06, the embedded conversion features are no longer separated from the host contract for convertible instruments with conversion features that are not required to Consolidated Financial Statements
new methodology requires an entity to present on the balance sheet the net amount expected to be collected. This methodology replaces the multiple impairment methods under prior GAAP, including for purchased credit impaired ("PCI") assets, and introduces the concept of PCD assets. The Company's PCI assets previously accounted for under ASC 310-30 are now accounted for as PCD assets upon adoption. ASU 2016-13 requires PCD assets toderivatives under ASC Topic 815 "Derivatives and Hedging" ("ASC 815"), or that do not result in substantial premiums accounted for as paid-in capital. Consequently, a convertible debt instrument will be recognizedaccounted for as a single liability measured at their purchase price plus the allowance for credit losses expected at the time of acquisition. ASU 2016-13 also requires that financial assets should be written off when they are deemed uncollectible.
In November 2019, FASB issued ASU 2019-11, which amended the PCD asset guidance in ASU 2016-13 to clarify that expected recoveries of amounts previously written off and expected to be written off should be included in the valuation account. Additionally, they should not exceed the aggregate of amounts previously written off and expected to be written off by an entity. Further, ASU 2019-11 clarifies that a negative allowance is recognized when an entity determines, after a full or partial writeoff of theits amortized cost basis, that it will recover all or a portion of the basis.
cost. The Company adopted ASC 326 on January 1, 2020 onthe standard using a prospective basis. In accordancemodified retrospective method, with adjustments which increased retained earnings by $12.0 million, reduced additional paid-in capital by $26.7 million and increased the guidance, substantially all the Company’s PCI assets were transitioned using the PCD guidance, with immediate writeoffnet carrying amount of the amortized cost basis of individual accounts and establishment of a negative allowance for expected recoveries equal to the amortized cost basis written off. Accounts previously accounted for under ASC 310-30, were aggregated into annual pools based on similar risk characteristics and an effective interest rate was established based on the estimated remaining cash flows of the annual pool. The immediate writeoff and subsequent recognition of expected recoveries had no impact on the Company’s Consolidated Income Statements or the Consolidated Balance Sheets at the date of adoption. The Company develops its estimate of expected recoveries2023 Notes by applying discounted cash flow methodologies to its ERC and recognizes income over the estimated life of the pool at the constant effective interest rate of the pool. Changes (favorable and unfavorable) in expected cash flows are recognized in current period earnings by adjusting the present value of the changes in expected recoveries.
Following the transition guidance for PCD assets, the Company grossed up the amortized cost of its net finance receivables$19.8 million at January 1, 2020 as shown below (amounts in thousands):
| | | | | |
Amortized cost2021. Additionally, the effect of adoption reduced interest expense for the three months ended March 31, 2021 by $2.0 million, increased net income by $1.6 million and increased earnings per share by $0.04 per share. For more information on the 2023 Notes, see Note 7. | $ | 3,514,165 | |
Allowance for credit losses | 125,757,689 | |
Noncredit discount | 3,240,131 | |
Face value | $ | 132,511,985 | |
| |
Allowance for credit losses | $ | 125,757,689 | |
Writeoffs, net | (125,757,689) | |
Expected recoveries | 3,514,165 | |
Initial negative allowance for expected recoveries | $ | 3,514,165 | |
3. Finance Receivables, net:
Finance Receivables, net after the adoption of ASC 326 (refer to Note 2)
Finance receivables, net consistsconsisted of the following at June 30,March 31, 2021 and December 31, 2020 (amounts in thousands):
| | | | | |
Amortized cost | $ | — | |
Negative allowance for expected recoveries (1)
| 3,351,532 | |
Balance at end of period | $ | 3,351,532 | |
| | | | | | | | | | | |
| March 31, 2021 | | December 31, 2020 |
| Amortized cost | $ | 0 | | | $ | 0 | |
Negative allowance for expected recoveries (1) | 3,372,666 | | | 3,514,788 | |
| Balance at end of period | $ | 3,372,666 | | | $ | 3,514,788 | |
(1) The negative allowance balance includes certain portfolios of nonperforming loans for which the Company holds a beneficial interest representing approximately 1% of the balance.
PRA Group, Inc.
Notes to Consolidated Financial Statements
Three Months Ended June 30, 2020
Changes in the negative allowance for expected recoveries by portfolio segment for the three months ended June 30,March 31, 2021 and 2020 were as follows (amounts in thousands):
| | | For the three months ended June 30, 2020 | | | March 31, 2021 |
| | Core | | Insolvency | | Total | | Core | | Insolvency | | Total |
| Balance at beginning of period | Balance at beginning of period | $ | 2,949,384 | | | $ | 458,690 | | | $ | 3,408,074 | | Balance at beginning of period | $ | 3,019,477 | | | $ | 495,311 | | | $ | 3,514,788 | |
Initial negative allowance for expected recoveries - portfolio acquisitions (1) | Initial negative allowance for expected recoveries - portfolio acquisitions (1) | 144,721 | | | 19,778 | | | 164,499 | | Initial negative allowance for expected recoveries - portfolio acquisitions (1) | 133,007 | | | 25,954 | | | 158,961 | |
| Foreign currency translation adjustment | Foreign currency translation adjustment | 24,215 | | | (130) | | | 24,085 | | Foreign currency translation adjustment | (24,249) | | | 1,589 | | | (22,660) | |
Recoveries applied to negative allowance (2) | Recoveries applied to negative allowance (2) | (231,435) | | | (33,492) | | | (264,927) | | Recoveries applied to negative allowance (2) | (285,171) | | | (43,388) | | | (328,559) | |
Changes in expected recoveries (3) | Changes in expected recoveries (3) | 21,251 | | | (1,450) | | | 19,801 | | Changes in expected recoveries (3) | 48,410 | | | 1,726 | | | 50,136 | |
| Balance at end of period | Balance at end of period | $ | 2,908,136 | | | $ | 443,396 | | | $ | 3,351,532 | | Balance at end of period | $ | 2,891,474 | | | $ | 481,192 | | | $ | 3,372,666 | |
PRA Group, Inc.
Notes to Consolidated Financial Statements
| | | | | | | | | | | | | | | | | |
| March 31, 2020 |
| Core | | Insolvency | | Total |
| Balance at beginning of period | $ | 3,051,426 | | | $ | 462,739 | | | $ | 3,514,165 | |
Initial negative allowance for expected recoveries - portfolio acquisitions (1) | 233,687 | | | 39,550 | | | 273,237 | |
| Foreign currency translation adjustment | (120,214) | | | (9,642) | | | (129,856) | |
Recoveries applied to negative allowance (2) | (199,038) | | | (37,618) | | | (236,656) | |
Changes in expected recoveries (3) | (16,477) | | | 3,661 | | | (12,816) | |
| Balance at end of period | $ | 2,949,384 | | | $ | 458,690 | | | $ | 3,408,074 | |
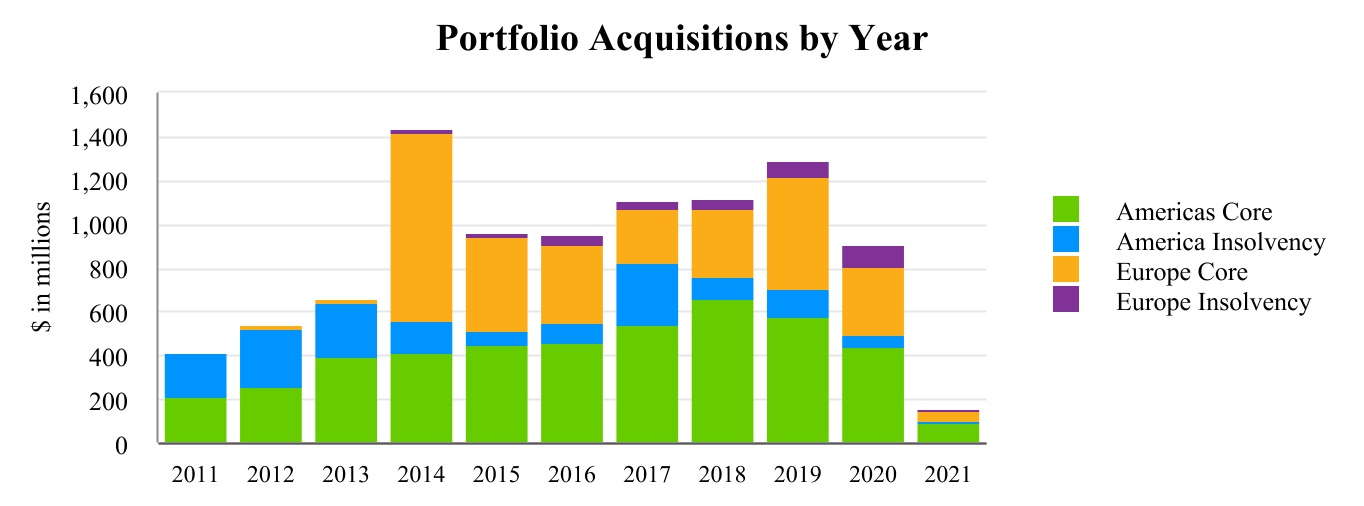
(1) Initial negative allowance for expected recoveries - portfolio acquisitions
Portfolio acquisitions for the three months ended June 30,March 31, 2021 and 2020 were as follows (amounts in thousands):
| | | For the three months ended June 30, 2020 | | | March 31, 2021 |
| | Core | | Insolvency | | Total | | Core | | Insolvency | | Total |
| Face value | Face value | $ | 1,288,243 | | | $ | 96,964 | | | $ | 1,385,207 | | Face value | $ | 1,088,655 | | | $ | 134,811 | | | $ | 1,223,466 | |
| Noncredit discount | Noncredit discount | (160,409) | | | (7,979) | | | (168,388) | | Noncredit discount | (132,532) | | | (7,498) | | | (140,030) | |
| Allowance for credit losses at acquisition | Allowance for credit losses at acquisition | (983,113) | | | (69,207) | | | (1,052,320) | | Allowance for credit losses at acquisition | (823,116) | | | (101,359) | | | (924,475) | |
| Purchase price | Purchase price | $ | 144,721 | | | $ | 19,778 | | | $ | 164,499 | | Purchase price | $ | 133,007 | | | $ | 25,954 | | | $ | 158,961 | |
| | | | | | | | | | | | | | | | | |
| March 31, 2020 |
| Core | | Insolvency | | Total |
| Face value | $ | 1,891,142 | | | $ | 177,454 | | | $ | 2,068,596 | |
| Noncredit discount | (213,289) | | | (13,032) | | | (226,321) | |
| Allowance for credit losses at acquisition | (1,444,166) | | | (124,872) | | | (1,569,038) | |
| Purchase price | $ | 233,687 | | | $ | 39,550 | | | $ | 273,237 | |
The initial negative allowance recorded on portfolio acquisitions for the three months ended June 30,March 31, 2021 and 2020 were as follows (amounts in thousands):
| | | For the three months ended June 30, 2020 | | | March 31, 2021 |
| | Core | | Insolvency | | Total | | Core | | Insolvency | | Total |
| Allowance for credit losses at acquisition | Allowance for credit losses at acquisition | $ | (983,113) | | | $ | (69,207) | | | $ | (1,052,320) | | Allowance for credit losses at acquisition | $ | (823,116) | | | $ | (101,359) | | | $ | (924,475) | |
| Writeoffs, net | Writeoffs, net | 983,113 | | | 69,207 | | | 1,052,320 | | Writeoffs, net | 823,116 | | | 101,359 | | | 924,475 | |
| Expected recoveries | Expected recoveries | 144,721 | | | 19,778 | | | 164,499 | | Expected recoveries | 133,007 | | | 25,954 | | | 158,961 | |
| Initial negative allowance for expected recoveries | Initial negative allowance for expected recoveries | $ | 144,721 | | | $ | 19,778 | | | $ | 164,499 | | Initial negative allowance for expected recoveries | $ | 133,007 | | | $ | 25,954 | | | $ | 158,961 | |
(2) Recoveries applied to negative allowance
Recoveries applied to the negative allowance were computed as follows for the three months ended June 30, 2020 (amounts in thousands):
| | | | | | | | | | | | | | | | | |
| For the three months ended June 30, 2020 | | | | |
| Core | | Insolvency | | Total |
Recoveries (a) | $ | 461,238 | | | $ | 51,973 | | | $ | 513,211 | |
Less - amounts reclassified to portfolio income (b) | 229,803 | | | 18,481 | | | 248,284 | |
| Recoveries applied to negative allowance | $ | 231,435 | | | $ | 33,492 | | | $ | 264,927 | |
(a) Recoveries includes cash collections, buybacks and other adjustments.
(b) The Company reported income on expected recoveries based on the constant effective interest rate in portfolio income on the Company's Consolidated Income Statements. | | | | | | | | | | | | | | | | | |
| March 31, 2020 |
| Core | | Insolvency | | Total |
| Allowance for credit losses at acquisition | $ | (1,444,166) | | | $ | (124,872) | | | $ | (1,569,038) | |
| Writeoffs, net | 1,444,166 | | | 124,872 | | | 1,569,038 | |
| Expected recoveries | 233,687 | | | 39,550 | | | 273,237 | |
| Initial negative allowance for expected recoveries | $ | 233,687 | | | $ | 39,550 | | | $ | 273,237 | |
PRA Group, Inc.
Notes to Consolidated Financial Statements
(3) Changes in expected recoveries
Changes in expected recoveries consists of the following for the three months ended June 30, 2020 (amounts in thousands):
| | | | | | | | | | | | | | | | | |
| For the three months ended June 30, 2020 | | | | |
| Core | | Insolvency | | Total |
| Changes in expected future recoveries | $ | (97,910) | | | $ | (1,788) | | | $ | (99,698) | |
| Recoveries received in excess of forecast | 119,161 | | | 338 | | | 119,499 | |
| Changes in expected recoveries | $ | 21,251 | | | $ | (1,450) | | | $ | 19,801 | |
Six Months Ended June 30, 2020
Changes in the negative allowance for expected recoveries by portfolio segment for the six months ended June 30, 2020 were as follows (amounts in thousands):
| | | | | | | | | | | | | | | | | |
| For the six months ended June 30, 2020 | | | | |
| Core | | Insolvency | | Total |
| Balance at beginning of period | $ | 3,051,426 | | | $ | 462,739 | | | $ | 3,514,165 | |
Initial negative allowance for expected recoveries - portfolio acquisitions (1) | 378,408 | | | 59,328 | | | 437,736 | |
| Foreign currency translation adjustment | (95,999) | | | (9,772) | | | (105,771) | |
Recoveries applied to negative allowance (2) | (430,473) | | | (71,110) | | | (501,583) | |
Changes in expected recoveries (3) | 4,774 | | | 2,211 | | | 6,985 | |
| Balance at end of period | $ | 2,908,136 | | | $ | 443,396 | | | $ | 3,351,532 | |
(1) Initial negative allowance for expected recoveries - portfolio acquisitions
Portfolio acquisitions for the six months ended June 30, 2020 were as follows (amounts in thousands):
| | | | | | | | | | | | | | | | | |
| For the six months ended June 30, 2020 | | | | |
| Core | | Insolvency | | Total |
| Face value | $ | 3,179,386 | | | $ | 274,418 | | | $ | 3,453,804 | |
| Noncredit discount | (373,699) | | | (21,011) | | | (394,710) | |
| Allowance for credit losses at acquisition | (2,427,279) | | | (194,079) | | | (2,621,358) | |
| Purchase price | $ | 378,408 | | | $ | 59,328 | | | $ | 437,736 | |
The initial negative allowance recorded on portfolio acquisitions for the six months ended was as follows June 30, 2020 (amounts in thousands):
| | | | | | | | | | | | | | | | | |
| For the six months ended June 30, 2020 | | | | |
| Core | | Insolvency | | Total |
| Allowance for credit losses at acquisition | $ | (2,427,279) | | | $ | (194,079) | | | $ | (2,621,358) | |
| Writeoffs, net | 2,427,279 | | | 194,079 | | | 2,621,358 | |
| Expected recoveries | 378,408 | | | 59,328 | | | 437,736 | |
| Initial negative allowance for expected recoveries | $ | 378,408 | | | $ | 59,328 | | | $ | 437,736 | |
PRA Group, Inc.
Notes to Consolidated Financial Statements
(2) Recoveries applied to negative allowance
Recoveries applied to the negative allowance were computed as follows for the sixthree months ended June 30,March 31, 2021 and 2020 (amounts in thousands):
| | | For the six months ended June 30, 2020 | | | March 31, 2021 |
| | Core | | Insolvency | | Total | | Core | | Insolvency | | Total |
Recoveries (a) | Recoveries (a) | $ | 901,932 | | | $ | 109,957 | | | $ | 1,011,889 | | Recoveries (a) | $ | 500,332 | | | $ | 59,899 | | | $ | 560,231 | |
Less - amounts reclassified to portfolio income (b) | Less - amounts reclassified to portfolio income (b) | 471,459 | | | 38,847 | | | 510,306 | | Less - amounts reclassified to portfolio income (b) | 215,161 | | | 16,511 | | | 231,672 | |
| Recoveries applied to negative allowance | Recoveries applied to negative allowance | $ | 430,473 | | | $ | 71,110 | | | $ | 501,583 | | Recoveries applied to negative allowance | $ | 285,171 | | | $ | 43,388 | | | $ | 328,559 | |
| | | | | | | | | | | | | | | | | |
| March 31, 2020 |
| Core | | Insolvency | | Total |
Recoveries (a) | $ | 440,694 | | | $ | 57,984 | | | $ | 498,678 | |
Less - amounts reclassified to portfolio income (b) | 241,656 | | | 20,366 | | | 262,022 | |
| Recoveries applied to negative allowance | $ | 199,038 | | | $ | 37,618 | | | $ | 236,656 | |
(a) Recoveries includes cash collections, buybacks and other cash-based adjustments.
(b) The Company reported income on expected recoveries based onFor more information, refer to the constant effective interest rate inCompany's discussion of portfolio income onwithin finance receivables and income recognition within Note 1 of the Company's Consolidated Income Statements.Financial Statements included in Item 8 of the 2020 Form 10-K.
(3) Changes in expected recoveries
Changes in expected recoveries consistsconsisted of the following for the sixthree months ended June 30,March 31, 2021 and 2020 (amounts in thousands):
| | | For the six months ended June 30, 2020 | | | March 31, 2021 |
| | Core | | Insolvency | | Total | | Core | | Insolvency | | Total |
| Changes in expected future recoveries | Changes in expected future recoveries | $ | (118,434) | | | $ | (1,890) | | | $ | (120,324) | | Changes in expected future recoveries | $ | (46,502) | | | $ | (6,350) | | | $ | (52,852) | |
| Recoveries received in excess of forecast | Recoveries received in excess of forecast | 123,208 | | | 4,101 | | | 127,309 | | Recoveries received in excess of forecast | 94,912 | | | 8,076 | | | 102,988 | |
| Changes in expected recoveries | Changes in expected recoveries | $ | 4,774 | | | $ | 2,211 | | | $ | 6,985 | | Changes in expected recoveries | $ | 48,410 | | | $ | 1,726 | | | $ | 50,136 | |
| | | | | | | | | | | | | | | | | |
| March 31, 2020 |
| Core | | Insolvency | | Total |
| Changes in expected future recoveries | $ | (20,524) | | | $ | (102) | | | $ | (20,626) | |
| Recoveries received in excess of forecast | 4,047 | | | 3,763 | | | 7,810 | |
| Changes in expected recoveries | $ | (16,477) | | | $ | 3,661 | | | $ | (12,816) | |
In order to evaluate the impact of the COVID-19 pandemic on expectationsmake estimates of future cash collections, the Company considered historical performance, current economic forecasts, regarding the duration of the impact to short-term and long-term growth in the various geographies in which the Company operates and evolving information regarding its effect on economic activity and consumer habits as reopening initiatives occur.habits. The Company also considered currentrecent collection activity in its determination to adjust theassumptions related to near-term estimated timing of near term ERCremaining collections ("ERC") for certain pools. Based on these considerations, the Company’s estimates incorporate changes in both amounts and in the timing of expected cash collections over the next 6 to 18 months.forecast period.
For the three months ended June 30, 2020,March 31, 2021, changes in expected recoveries increased $19.8were a positive $50.1 million. This reflects $119.5$103.0 million in recoveries received during the quarter in excess of forecast, partially offset by a $99.7 million decrease to the present value of expected future recoveries. The majority of the decrease reflects the Company's assumption that the overperformance was acceleration in cash collections rather than an increase to total expected collections. Additionally, the Company made forecast adjustments deemed appropriate given the current environment in which the Company operates.
For the six months ended June 30, 2020, changes in expected recoveries increased $7.0 million. This reflects $127.3 million in recoveries in excess of forecast, which was largely due to significant cash collections overperformance, during the most recent quarter. This was mostly offsetreduced by a $120.3$52.9 million decreasenegative adjustment to changes in the present value of expected future recoveries. The majority of the decrease reflectschanges in expected future recoveries reflect the Company's assumption that the majority of the current quarter overperformance was primarily due to acceleration in the timing of cash collections rather than an increase to total expected collections. Additionally,collections resulting in a present value adjustment.
For the Company madethree months ended March 31, 2020, changes in expected recoveries were a negative $12.8 million. This reflected a $20.6 million negative adjustment to the present value of expected future recoveries primarily related to an expected delay in cash collections from the impact of the novel coronavirus ("COVID-19") pandemic, partially offset by $7.8 million in recoveries received in excess of forecast adjustments in both quarters deemed appropriate given the current environment in which the Company operates.
Changes in the Company’s assumptions regarding the duration and impact of COVID-19 to cash collections could change significantly as conditions evolve.
Finance Receivables, net prior to adoption of ASC 326
The following information reflects finance receivables, net as previously disclosed in the Company's Quarterly Report on Form 10-Q for the three and six months ended June 30, 2019 which was under previous revenue recognition accounting standard ASC 310-30.quarter.
PRA Group, Inc.
Notes to Consolidated Financial Statements
Changes in finance receivables, net for the three and six months ended June 30, 2019 were as follows (amounts in thousands):
| | | | | | | | | | | | | | | | | | | |
| | | Three Months Ended June 30, 2019 | | | | Six Months Ended June 30, 2019 |
| | | | | | | |
| Balance at beginning of period | | | $ | 3,177,229 | | | | | $ | 3,084,777 | |
Acquisitions of finance receivables (1) | | | 284,448 | | | | | 597,894 | |
| | | | | | | |
| Foreign currency translation adjustment | | | (8,477) | | | | | (1,041) | |
| Cash collections | | | (470,274) | | | | | (931,445) | |
| Income recognized on finance receivables | | | 249,219 | | | | | 488,055 | |
| Net allowance charges | | | (1,196) | | | | | (7,291) | |
| | | | | | | |
| Balance at end of period | | | $ | 3,230,949 | | | | | $ | 3,230,949 | |
(1) Includes portfolio purchases adjusted for buybacks and acquisition related costs, and portfolios from the acquisition of a business in Canada made during the first quarter of 2019.
During the three months ended June 30, 2019, the Company acquired finance receivable portfolios with a face value of $1.8 billion for $289.2 million. During the six months ended June 30, 2019, the Company acquired finance receivables portfolios with a face value of $6.6 billion for $608.0 million. At June 30, 2019, the ERC on the receivables acquired during the three and six months ended June 30, 2019 were $513.0 million and $1.02 billion, respectively.
At the time of acquisition and each quarter thereafter, the life of each quarterly accounting pool was estimated based on projected amounts and timing of future cash collections using the proprietary models of the Company. Based upon projections, cash collections expected to be applied to principal were estimated to be as follows for the twelve-month periods ending June 30, (amounts in thousands):
| | | | | |
| 2020 | $ | 845,437 | |
| 2021 | 694,169 | |
| 2023 | 531,004 | |
| 2024 | 393,087 | |
| 2025 | 281,166 | |
| 2026 | 173,283 | |
| 2027 | 101,570 | |
| 2028 | 77,943 | |
| 2029 | 51,868 | |
| 2030 | 35,070 | |
| Thereafter | 46,352 | |
| Total ERC expected to be applied to principal | $ | 3,230,949 | |
At June 30, 2019, the Company had aggregate net finance receivables balances in pools accounted for under the cost recovery method of $39.4 million.
Accretable yield represented the amount of income on finance receivables the Company expected to recognize over the remaining life of its existing portfolios based on estimated future cash flows as of the balance sheet date. Additions represented the original expected accretable yield on portfolios acquired during the period. Net reclassifications from nonaccretable difference to accretable yield primarily resulted from the increase in the Company's estimate of future cash flows. When applicable, net reclassifications to nonaccretable difference from accretable yield resulted from the decrease in the Company's estimates of future cash flows and allowance charges that together exceeded the increase in the Company's estimate of future cash flows.
PRA Group, Inc.
Notes to Consolidated Financial Statements
Changes in accretable yield for the three and six months ended June 30, 2019 were as follows (amounts in thousands):
| | | | | | | | | | | | | | | |
| Three Months Ended June 30, 2019 | | Six Months Ended June 30, 2019 | | | | |
| Balance at beginning of period | $ | 3,080,168 | | | $ | 3,058,445 | | | | | |
| Income recognized on finance receivables | (249,219) | | | (488,055) | | | | | |
| Net allowance charges | 1,196 | | | 7,291 | | | | | |
| Additions from portfolio acquisitions | 228,796 | | | 464,610 | | | | | |
| Reclassifications from nonaccretable difference | 112,901 | | | 132,062 | | | | | |
| Foreign currency translation adjustment | (829) | | | (1,340) | | | | | |
| Balance at end of period | $ | 3,173,013 | | | $ | 3,173,013 | | | | | |
The following is a summary of activity within the Company's valuation allowance account, all of which relates to acquired finance receivables, for the three and six months ended June 30, 2019 (amounts in thousands):
| | | | | | | | | | | |
| Three Months Ended June 30, 2019 | | Six Months Ended June 30, 2019 |
| Beginning balance | $ | 263,324 | | | $ | 257,148 | |
| Allowance charges | 5,532 | | | 13,509 | |
| Reversal of previously recorded allowance charges | (4,336) | | | (6,218) | |
| Net allowance charges | 1,196 | | | 7,291 | |
| Foreign currency translation adjustment | 71 | | | 152 | |
| Ending balance | $ | 264,591 | | | $ | 264,591 | |
4. Investments:
Investments consisted of the following at June 30, 2020March 31, 2021 and December 31, 20192020 (amounts in thousands):
| | | June 30, 2020 | | December 31, 2019 | | March 31, 2021 | | December 31, 2020 |
| | Debt securities | Debt securities | | | | Debt securities | | | |
| | Available-for-sale | Available-for-sale | $ | 4,767 | | | $ | 5,052 | | Available-for-sale | $ | 5,308 | | | $ | 5,368 | |
| | Equity securities | Equity securities | | Equity securities | |
| Exchange traded funds | | Exchange traded funds | 34,841 | | | 34,847 | |
| Private equity funds | Private equity funds | 5,588 | | | 7,218 | | Private equity funds | 6,155 | | | 6,123 | |
| Mutual funds | Mutual funds | 743 | | | 33,677 | | Mutual funds | 896 | | | 1,023 | |
| Equity method investments | Equity method investments | 7,648 | | | 10,229 | | Equity method investments | 7,482 | | | 8,398 | |
| | Total investments | Total investments | $ | 18,746 | | | $ | 56,176 | | Total investments | $ | 54,682 | | | $ | 55,759 | |
Debt Securities
Available-for-sale
Government bonds: The Company's investments in government bonds are classified as available-for-sale and are stated at fair value.
PRA Group, Inc.
Notes to Consolidated Financial Statements
The amortized cost and estimated fair value of investments in debt securities at June 30, 2020March 31, 2021 and December 31, 20192020 were as follows (amounts in thousands):
| | | June 30, 2020 | | | March 31, 2021 |
| | Amortized Cost | | Gross Unrealized Gains | | Gross Unrealized Losses | | Aggregate Fair Value | | Amortized Cost | | Gross Unrealized Gains | | Gross Unrealized Losses | | Aggregate Fair Value |
| Available-for-sale | Available-for-sale | | | | | | | | Available-for-sale | | | | | | | |
| | Government bonds | Government bonds | $ | 4,589 | | | $ | 178 | | | $ | — | | | $ | 4,767 | | Government bonds | $ | 5,179 | | | $ | 129 | | | $ | 0 | | | $ | 5,308 | |
| | | | December 31, 2019 | | | December 31, 2020 |
| | Amortized Cost | | Gross Unrealized Gains | | Gross Unrealized Losses | | Aggregate Fair Value | | Amortized Cost | | Gross Unrealized Gains | | Gross Unrealized Losses | | Aggregate Fair Value |
| Available-for-sale | Available-for-sale | | | | | | | | Available-for-sale | | | | | | | |
| | Government bonds | Government bonds | $ | 5,095 | | | $ | — | | | $ | 43 | | | $ | 5,052 | | Government bonds | $ | 5,239 | | | $ | 129 | | | $ | 0 | | | $ | 5,368 | |
|
Equity Securities
InvestmentsExchange traded funds: The Company invests in privatecertain treasury bill exchange traded funds, which are accounted for as equity securities and carried at fair value. Gains and losses from these investments are included within Other income and (expense) in the Company's Consolidated Income Statements.
Private equity funds: Investments in private equity funds represent limited partnerships in which the Company has less than a 1% interest.
Mutual funds: The Company invests certain excessMutual funds represent funds held in Brazil in a Brazilian real denominated mutual fund benchmarked to the U.S. dollar that invests principally in Brazilian fixed income securities. The investments are carried at fair value based on quoted market prices. Gains and losses from this investment are included as a foreign exchange component of otherOther income and (expense) in the Company's Consolidated Income Statements.
Equity Method Investments
The Company has an 11.7% interest in RCB Investimentos S.A. ("RCB"), a servicing platform for nonperforming loans in Brazil. This investment is accounted for on the equity method because the Company exercises significant influence over RCB’s operating and financial activities. Accordingly, the Company’s investment in RCB is adjusted for the Company’s proportionate share of RCB’s earnings or losses, capital contribution made and distributions received.
5. Goodwill and Intangible Assets, net:Goodwill:
In connection with the Company's business acquisitions, the Company acquired certain tangible and intangible assets. Intangible assets resulting from these acquisitions include client and customer relationships, non-compete agreements, trademarks and technology. The Company performs an annual review of goodwill as of October 1 of each year or more frequently if indicators of impairment exist. The Company performed its most recent annual review as of October 1, 20192020 and concluded that no goodwill
PRA Group, Inc.
Notes to Consolidated Financial Statements
impairment was necessary. The Company performed its quarterly assessment by evaluating whether any triggering events had occurred as of June 30, 2020,March 31, 2021, which included considering current market conditions resulting from the global COVID-19 pandemic.conditions. The Company concluded that no triggering event had occurred at June 30, 2020as of March 31, 2021 and will continue to monitor the market for any adverse conditions resulting from the COVID-19 pandemic.conditions.
The following table represents the changes in goodwill for the three and six months ended June 30,March 31, 2021 and 2020, and 2019were as follows (amounts in thousands):
| | | | | | | | | | | | | | | | | | | | | | | |
| Three Months Ended June 30, | | | | Six Months Ended June 30, | | |
| 2020 | | 2019 | | 2020 | | 2019 |
| Goodwill: | | | | | | | |
| Balance at beginning of period | $ | 418,565 | | | $ | 480,518 | | | $ | 480,794 | | | $ | 464,116 | |
| | | | | | | |
| | | | | | | |
| Changes: | | | | | | | |
Acquisition (1) | — | | | 4,711 | | | — | | | 18,364 | |
| | | | | | | |
| | | | | | | |
| Foreign currency translation adjustment | 25,942 | | | 4,064 | | | (36,287) | | | 6,813 | |
| Net change in goodwill | 25,942 | | | 8,775 | | | (36,287) | | | 25,177 | |
| | | | | | | |
| | | | | | | |
| | | | | | | |
| Balance at end of period | $ | 444,507 | | | $ | 489,293 | | | $ | 444,507 | | | $ | 489,293 | |
| | | | | | | | | | | |
| Three Months Ended March 31, |
| 2021 | | 2020 |
| Balance at beginning of period | $ | 492,989 | | | $ | 480,794 | |
| | | |
| | | |
| | | |
| | | |
| | | |
| | | |
| Change in foreign currency translation adjustment | (238) | | | (62,229) | |
| | | |
| | | |
| | | |
| | | |
| Balance at end of period | $ | 492,751 | | | $ | 418,565 | |
(1) The $4.7 million and $18.4 million additions to goodwill during the three and six months ended June 30, 2019 respectively, were related to the acquisition of a business in Canada.
PRA Group, Inc.
Notes to Consolidated Financial Statements
6. Leases:
The Company's operating lease portfolio primarily includes corporate offices and call centers. The majority of its leases have remaining lease terms of 1one year to 2015 years, some of which include options to extend the leases for 5five years, and others include options to terminate the leases within 1one year. Exercises of lease renewal options are typically at the Company's sole discretion and are included in its right-of-use ("ROU") assets and lease liabilities based upon whether the Company is reasonably certain of exercising the renewal options. The Company has lease agreements with lease and non-lease components, which are generally accounted for separately. The Company's lease agreements do not contain any material residual value guarantees or material restrictive covenants.
As most of the Company's leases do not provide an implicit rate, the Company uses its incremental borrowing rate based on the information available at the lease commencement date in determining the present value of the lease payments.
The components of lease expense for the three and six months ended June 30,March 31, 2021 and 2020, and 2019, were as follows (amounts in thousands):
| | | | | | | | | | | | | | | | | | | | | | | |
| Three months ended June 30, | | | | Six months ended June 30, | | |
| 2020 | | 2019 | | 2020 | | 2019 |
| Operating lease expense | $ | 2,974 | | | $ | 3,067 | | | $ | 6,037 | | | $ | 5,930 | |
| Short-term lease expense | 676 | | | 720 | | | 1,369 | | | 1,562 | |
| | | | | | | |
| | | | | | | |
| | | | | | | |
| | | | | | | |
| | | | | | | |
| | | | | | | |
| | | | | | | |
| Total lease expense | $ | 3,650 | | | $ | 3,787 | | | $ | 7,406 | | | $ | 7,492 | |
| | | | | | | | | | | |
| Three Months Ended March 31, |
| 2021 | | 2020 |
| Operating lease expense | $ | 2,981 | | | $ | 3,063 | |
| Short-term lease expense | 676 | | | 693 | |
| | | |
| | | |
| | | |
| | | |
| | | |
| | | |
| | | |
| Total lease expense | $ | 3,657 | | | $ | 3,756 | |
Supplemental cash flow information and non-cash activity related to leases for the sixthree months ended June 30,March 31, 2021 and 2020 and 2019 were as follows (amounts in thousands):
| | | | | | | | | | | |
| Six months ended June 30, | | |
| 2020 | | 2019 |
| Cash paid for amounts included in the measurement of operating lease liabilities | $ | 6,014 | | | $ | 5,671 | |
| | | |
| ROU assets obtained in exchange for operating lease obligations | (5,999) | | | 80,543 | |
| | | | | | | | | | | |
| Three Months Ended March 31, |
| 2021 | | 2020 |
| Cash paid for amounts included in the measurement of operating lease liabilities | $ | 2,865 | | | $ | 2,991 | |
| | | |
| ROU assets obtained in exchange for operating lease obligations | 304 | | | 531 | |
Lease term and discount rate information related to operating leases were as follows as of the dates indicated:
| | | June 30, | | | Three Months Ended March 31, |
| | 2020 | | 2019 | | 2021 | | 2020 |
| Weighted-average remaining lease term (years) | Weighted-average remaining lease term (years) | 9.5 | | 11.0 | Weighted-average remaining lease term (years) | 9.0 | | 10.6 |
| | | Weighted-average discount rate | Weighted-average discount rate | 4.82 | % | | 4.96 | % | Weighted-average discount rate | 4.72 | % | | 4.89 | % |
|
PRA Group, Inc.
Notes to Consolidated Financial Statements
Maturities of lease liabilities at June 30, 2020March 31, 2021 are as follows for the following periods (amounts in thousands):
| | | | | | | |
| Operating Leases | | |
For the sixnine months ending December 31, 2020 | $ | 5,860 | | | |
For the year ending December 31, 2021 | 11,338 $ | 8,821 | | | |
| For the year ending December 31, 2022 | 9,3209,745 | | | |
| For the year ending December 31, 2023 | 7,1417,421 | | | |
| For the year ending December 31, 2024 | 6,3366,374 | | | |
| For the year ending December 31, 2025 | 6,178 | | | |
| Thereafter | 38,91929,877 | | | |
| Total lease payments | $ | 78,91468,416 | | | |
LessLess: imputed interest | 16,20813,094 | | | |
| Total | $ | 62,70655,322 | | | |
PRA Group, Inc.
Notes to Consolidated Financial Statements
7. Borrowings:
The Company's borrowings consisted of the following as of the dates indicated (amounts in thousands):
| | | June 30, 2020 | | December 31, 2019 | | March 31, 2021 | | December 31, 2020 |
Americas revolving credit | Americas revolving credit | $ | 558,103 | | | $ | 772,037 | | Americas revolving credit | $ | 376,392 | | | $ | 405,706 | |
| Europe revolving credit | Europe revolving credit | 999,971 | | | 1,017,465 | | Europe revolving credit | 1,023,039 | | | 1,171,890 | |
| | Term loan | Term loan | 420,000 | | | 425,000 | | Term loan | 467,500 | | | 470,000 | |
| | Convertible senior notes | 632,500 | | | 632,500 | | |
| Senior Notes | | Senior Notes | 300,000 | | | 300,000 | |
| Convertible Notes | | Convertible Notes | 345,000 | | | 345,000 | |
| | 2,610,574 | | | 2,847,002 | | | 2,511,931 | | | 2,692,596 | |
| Less: Debt discount and issuance costs | Less: Debt discount and issuance costs | (30,506) | | | (38,577) | | Less: Debt discount and issuance costs | (10,798) | | | (31,307) | |
| Total | Total | $ | 2,580,068 | | | $ | 2,808,425 | | Total | $ | 2,501,133 | | | $ | 2,661,289 | |
(1) Includes North American revolver and Colombian revolver.
The following principal payments are due on the Company's borrowings as of June 30, 2020March 31, 2021 for the 12-month periods ending June 30,March 31, (amounts in thousands):
| | 2021 | $ | 298,468 | | |
| 2022 | 2022 | 966,715 | | 2022 | $ | 10,979 | |
| 2023 | 2023 | 1,345,391 | | 2023 | 1,033,708 | |
| | 2024 | | 2024 | 355,000 | |
| 2025 | | 2025 | 812,244 | |
| 2026 | | 2026 | 300,000 | |
| | Total | Total | $ | 2,610,574 | | Total | $ | 2,511,931 | |
The Company determined that it was in compliance with the covenants of its financing arrangements as of June 30, 2020.March 31, 2021.
North American Revolving Credit and Term Loan
On May 5, 2017, theThe Company amended and restated its existinghas a credit agreement (as amended, and modified from time to time, the “North American Credit Agreement”) with Bank of America, N.A., as administrative agent, Bank of America, National Association, acting through its Canada branch, as the Canadian administrative agent, and a syndicate of lenders named therein. On May 6, 2020, therein,(the Company entered into the Second Amendment to the North"North American Credit Agreement.Agreement").
The total credit facility under the North American Credit Agreement includes an aggregate principal amount of $1,538.0 million$1.5 billion (subject to compliance with a borrowing base and applicable debt covenants), which consists of (i) a fully-funded $420.0$467.5 million term loan, (ii) a $1,068.0 million$1.0 billion domestic revolving credit facility, and (iii) a $50.0$75.0 million Canadian revolving credit facility. The facility includes an accordion feature for up to $500.0 million in additional commitments (at the option of the lender) and also provides for up to $25.0 million of letters of credit and a $25.0 million swingline loan sublimitsub-limit that would reduce amounts available for borrowing. The term and revolving loans accrue interest, at the option of the Company, at either the base rate or the Eurodollar rate (as defined in the North American Credit Agreement), for the applicable term plus 2.50% per annum in the case of the Eurodollar rate loans and 1.50% in the case of the base rate loans (unless the ERC Advance Rate Increase Period event, as defined in the North American Credit Agreement, triggers an additional 55 basis points that would be added to the margin). The base rate is the highest of (a) the Federal Funds Rate (as defined in the North American Credit Agreement) plus 0.50%, (b) Bank of America's prime rate, or (c) the one-month Eurodollar rate plus 1.00%. Canadian Prime Rate Loans bear interest at a rate per annum equal to the Canadian Prime Rate plus 1.50% (unless the ERC Advance Rate Increase Period event, as defined in the North American Credit Agreement, triggers an additional 55 basis points that would be added to the margin).loans. The revolving loans within the credit facility are subject to a 1%0.75% floor.
PRA Group, Inc.
Notes to Consolidated Financial Statements
The revolving credit facilities also bear an unused line fee of 0.375% per annum, payable quarterly in arrears. The loans under the North American Credit Agreement mature May 5, 2022.2024. As of June 30, 2020,March 31, 2021, the unused portion of the North American Credit Agreement was $562.3$700.3 million. Considering borrowing base restrictions, as of June 30, 2020,March 31, 2021, the amount available to be drawn was $313.6$251.0 million.
The North American Credit Agreement is secured by a first priority lien on substantially all of the Company's North American assets. The North American Credit Agreement contains restrictive covenants and events of default including the following:
•borrowings under each of the domestic revolving loan facility and the Canadian revolving loan facility are subject to borrowing base calculations and may not exceed 35% of the ERC through July 30, 2020 on all domestic or Canadian, as applicable, Core eligible pools. On July 31, 2020, the ERC borrowing base limit will increase to 40% until January 31, 2021. If the ERC advance rate drops back tois 35% or below during this period, the ERC borrowing base will return to 35%.
PRA Group, Inc.
Notes to Consolidated Financial Statements
•provided no ERC increase has occurred, after January 31, 2021, borrowings under each of the domestic revolving loan facilityfor all eligible core asset pools and the Canadian revolving loan facility are subject to separate borrowing base calculations and may not exceed 55% of the ERC offor all domestic or Canadian, as applicable, insolvency eligible asset pools, plus 75% of domestic or Canadian, as applicable, eligible accounts receivable;pools;
•the consolidated total leverage ratio cannot exceed 2.753.50 to 1.0 as of the end of June 30, 2020. After June 30, 2020 through December 31, 2020 the limit will increase to 3.25 to 1.0. Ending after December 31, 2020, the limit will decrease to 3.0 until maturity;any fiscal quarter;
•the consolidated senior secured leverage ratio cannot exceed 2.752.25 to 1.0 as of the end of any fiscal quarter until March 31, 2021. On March 31, 2021, the senior secured leverage ratio will decrease to 2.25 to 1.0 until maturity;quarter;
•subject to no default or event of default, cash dividends and distributions during any fiscal year cannot exceed $20.0 million;
•subject to no default or event of default, stock repurchases during any fiscal year cannot exceed $100.0 million plus 50% of the prior year's consolidated net income;
•permitted acquisitions during any fiscal year cannot exceed $250.0 million (with a $50.0 million per year sublimit for permitted acquisitions by non-loan parties);
•indebtedness in the form of senior, unsecured convertible notes or other unsecured financings cannot exceed $750.0 million in the aggregate (without respect to the 2020 Notes); and
•the Company must maintain positive consolidated income from operations during any fiscal quarter; and
•restrictions on changes in control.quarter.
European Revolving Credit Facility and Term Loan
On October 23, 2014, European subsidiaries of the Company ("PRA Europe") entered intoare parties to a credit agreement with DNB Bank ASA and a syndicate of lenders named therein, for a Multicurrency Revolving Credit Facility (such agreement as later amended or modified, the "European Credit Agreement"). In the first quarter of 2020,On March 12, 2021, the Company entered into the SixthSeventh Amendment and Restatement Agreement to its European Credit Agreement which,that, among other things, increased the total commitmentsborrowings by $200.0 million, extended the majority of the facility by 2 years and includes an accordion feature of no less than $50.0 million not to exceed $500.0 million, to allow for future increases.through the accordion feature.
Under the terms of theThe European Credit Agreement the credit facility includesprovides borrowings for an aggregate amount of $1,300.0 millionapproximately $1.35 billion (subject to the borrowing base), accrues interest at the Interbank Offered Rate ("IBOR") plus 2.70% - 3.80% (as determined by the estimated remaining collections ratio ("ERC Ratio") as defined in the European Credit Agreement), bears an unused line fee, currently 1.23% per annum, or 35% of the margin, is payable monthly in arrears and matures February 19, 2023. The European Credit Agreement also includes an overdraft facility in the aggregate amount of $40.0 million (subject to the borrowing base), which accrues interest (per currency) at the daily rates as published by the facility agent, bears a facility line fee of 0.125% per quarter, payable quarterly in arrears and matures February 19, 2023. As of June 30, 2020,March 31, 2021, the unused portion of the European Credit Agreement (including the overdraft facility) was $340.0$367.0 million. Considering borrowing base restrictions and other covenants as of June 30, 2020,March 31, 2021, the amount available to be drawn under the European Credit Agreement (including the overdraft facility) was $97.4$237.0 million.
The European Credit Agreement is secured by the shares of most of the Company's European subsidiaries and all intercompany loans receivable in Europe. The European Credit Agreement contains restrictive covenants and events of default including the following:
•the ERC Ratio cannot exceed 45%;
•the gross interest-bearing debt ratio in Europe cannot exceed 3.25 to 1.0 as of the end of any fiscal quarter;
•interest bearing deposits in AK Nordic AB cannot exceed SEK 1.2 billion; and
•PRA Europe's cash collections must meet certain thresholds, measured on a quarterly basis.
Colombian Revolving Credit Facility
PRA Group Colombia Holding SAS, a subsidiary of the Company in Colombia, hasis party to a credit agreement that provides for borrowingswith Bancolombia in an aggregate amount of approximately $5.4$5.3 million. As of June 30, 2020,March 31, 2021, the outstanding balance under the credit agreement was $2.4approximately $1.6 million, with a weighted average interest rate of 7.13%. The outstanding balance accrues interest at the Indicador Bancario de Referencia rate ("IBR") plus a weighted average spread of 2.74%, is payable quarterly in arrears, amortizes quarterly and matures on October 17, 2022 (per the credit agreement, maturity represents three years from the last draw). This credit facility is fully collateralized using time deposits with the lender that are subject to certain limitations regarding withdrawal and usage and are included within other assets on the Company's Consolidated Balance Sheets.lender. As of June 30, 2020,March 31, 2021, the unused portion of the Colombia Credit Agreementcredit agreement was approximately $3.0$3.7 million.
Senior Notes due 2025
On August 27, 2020, the Company completed the private offering of $300.0 million in aggregate principal amount of its 7.375% Senior Notes due September 1, 2025 (the "2025 Notes" or "Senior Notes"). The 2025 Notes were issued pursuant to an Indenture dated August 27, 2020 (the "2020 Indenture"), between the Company and Regions Bank, as a trustee. The 2020
PRA Group, Inc.
Notes to Consolidated Financial Statements
Convertible Senior Notes due 2020
On August 13, 2013, the Company completed the private offering of $287.5 million in aggregate principal amount of its 3.00% Convertible Senior Notes due August 1, 2020 (the "2020 Notes"). The 2020 Notes were issued pursuant to an Indenture, dated August 13, 2013 (the "2013 Indenture"), between the Company and Regions Bank, as successor trustee. The 2013 Indenture contains customary terms and covenants, including certain events of default after which the 20202025 Notes may be due and payable immediately. The 20202025 Notes are senior unsecured obligations of the Company.Company and are guaranteed on a senior unsecured basis by all of the Company's existing and future domestic restricted subsidiaries that guarantee the North American Credit Agreement, subject to certain exceptions. Interest on the 20202025 Notes is payable semi-annually, in arrears, on FebruaryMarch 1 and AugustSeptember 1 of each year. Prior
On or after September 1, 2022, the 2025 Notes may be redeemed, in whole or in part, at a price equal to February 1, 2020, the 2020 Notes were convertible only upon the occurrence103.688% of specified events. As of June 30, 2020 the 2020 Notes are convertible at any time.
The conversion rate for the 2020 Notes is initially 15.2172 shares per $1,000 principal amount of 2020 Notes, which is equivalent to an initial conversion price of approximately $65.72 per share of the Company's common stock, and is subject to adjustment in certain circumstances pursuant to the 2013 Indenture. Upon conversion, holders of the 2020 Notes will receive cash, shares of the Company's common stock or a combination of cash and shares of the Company's common stock, at the Company's election. The Company's intent is to settle conversions through combination settlement (i.e., the 2020 Notes would be convertedinto cash up to the aggregate principal amount and shares of the Company's2025 Notes being redeemed. The applicable redemption price changes if redeemed during the 12-months beginning September 1 of each year to, 101.844% for 2023 and then 100% for 2024 and thereafter.
In addition, on or before September 1, 2022, the Company may redeem up to 40% of the aggregate principal amount of the 2025 Notes at a redemption price of 107.375% plus accrued and unpaid interest subject to the rights of holders of the 2025 Notes with the net cash proceeds of a public offering of common stock or a combination of cash and shares of the Company's common stock,Company provided, that at the Company's election, for the remainder). As a result andleast 60% in accordance with authoritative guidance related to derivatives and hedging and earnings per share, only the conversion spread is included in the diluted earnings per share calculation, if dilutive. Under such method, the settlementaggregate principal amount of the conversion spread has a dilutive effect when2025 Notes remains outstanding immediately after the average share priceoccurrence of the Company's common stock during any quarter exceeds $65.72.
The Company determinedsuch redemption and that the fair valuesuch redemption will occur within 90 days of the 2020 Notes at the date of issuance was approximately $255.3 million, and designated the residual valueclosing of approximately $32.2 million assuch public offering.
In the equity component. Additionally,event of a Change of Control (as defined in the 2020 Indenture), the Company allocated approximately $7.3 millionmust offer to repurchase all of the $8.2 million 20202025 Notes issuance cost as debt issuance cost(unless otherwise redeemed) at a price equal to 101% of their aggregate principal amount, plus accrued and unpaid interest. If the remaining $0.9 million as equity issuance cost.
The 2020Company sells assets under certain circumstances and does not use the proceeds for specified purposes, the Company will be required to make an offer to repurchase the 2025 Notes matured on August 1, 2020. For more information refer to Note 15.at 100% of their principal amount, plus accrued and unpaid interest.
Convertible Senior Notes due 2023
On May 26, 2017, the Company completed the private offering of $345.0 million in aggregate principal amount of its 3.50% Convertible Senior Notes due June 1, 2023 (the "2023 Notes" and, together with the 2020 Notes, the "Notes").2023. The 2023 Notes were issued pursuant to an Indenture, dated May 26, 2017 (the "2017 Indenture"), between the Company and Regions Bank, as trustee. The 2017 Indenture contains customary terms and covenants, including certain events of default after which the 2023 Notes may be due and payable immediately. The 2023 Notes are senior unsecured obligations of the Company. Interest on the 2023 Notes is payable semi-annually, in arrears, on June 1 and December 1 of each year. Prior
The holders of the 2023 Notes have the right to convert all, or a portion of, the 2023 Notes upon occurrence of specific events prior to the close of business on the business day immediately preceding prior to March 1, 2023 including:
•if during any calendar quarter, the last reported sales price of the Company's common stock is greater than 130% of the conversion price for at least 20 trading days during the period of 30 consecutive trading days;
•if the trading price of the 2023 Notes will be convertible only uponis less than 98% of the occurrenceproduct of specified events. the last reported sales price of the Company's common stock and the conversion rate for a 10 consecutive trading day period;
•the Company elects to issue to all, or substantially all, holders of its common stock any rights, options or warrants entitling them, for a period of more than 45 calendar days, to subscribe for or purchase shares at a price per share that is less than the average of the last reported sales price (as defined in the 2017 Indenture) for the 10 consecutive trading day-period ending on the trading day immediately preceding the date of announcement of such issuance;
•the Company elects to distribute to all, or substantially all, holders of its common stock the Company’s assets, debt securities or rights to purchase securities of the Company, which distribution has a share value exceeding 10% of the last reported sale price (as defined in the 2017 Indenture) on the trading day preceding the announcement of such distribution; or
•a transaction occurs that constitutes a fundamental change (as defined in the 2017 Indenture) or, the Company is party to a consolidation, merger, binding share exchange, or transfer or lease of all, or substantially all, of the Company’s assets.
On or after March 1, 2023, the 2023 Notes will be convertible at any time. TheAs of March 31, 2021, the Company does not believe that any of the conditions allowing holders of the 2023 Notes to convert their notes has occurred.
Furthermore, the Company has the right, at its election, to redeem all or any part of the outstanding 2023 Notes at any time on or after June 1, 2021 for cash, but only if the last reported sale price (as defined in the 2017 Indenture) of the Company's common stock exceeds 130% of the conversion price on each of at least 20 trading days during the 30 consecutive trading days ending on and including the trading day immediately before the date the Company sends the related redemption notice. As of June 30, 2020, the Company does not believe that any of the conditions allowing holders of the 2023
PRA Group, Inc.
Notes to convert their notes have occurred.Consolidated Financial Statements
The conversion rate for the 2023 Notes is initially 21.6275 shares per $1,000 principal amount of 2023 Notes, which is equivalent to an initial conversion price of approximately $46.24 per share of the Company's common stock, and is subject to adjustment in certain circumstances pursuant to the 2017 Indenture. Upon conversion, holders of the 2023 Notes will receive cash, shares of the Company's common stock or a combination of cash and shares of the Company's common stock, at the Company's election. The Company's intent isCompany has made an irrevocable election to settle conversions through combination settlement (i.e., by paying holders of the 2023 Notes would be convertedinto cash up to the aggregate principal amount of the 2023 Notes and shares of the Company's common stock or a combination of cash andand shares of the Company's common stock, at the Company's election, for the remainder). As a result and inremaining amounts owed, if any.
In accordance with authoritative guidance related to derivatives and hedging and earnings per share, only the conversion spread is included in the diluted earnings per shareEPS calculation, if dilutive. Under such method, the settlement of the conversion spread has a dilutive effect when the average share price of the Company's common stock during any quarter exceeds $46.24.market conversion criteria is met.
The Company determined that the fair value of the 2023 Notes at the date of issuance was approximately $298.8 million, and designated the residual value of approximately $46.2 million as the equity component. Additionally, the Company allocated approximately $8.3 million of the $9.6 million 2023 Notes issuance cost as debt issuance cost and the remaining $1.3 million as equity issuance cost.
PRA Group, Inc.
Notes Upon adoption of ASU 2020-06, the equity classification model was eliminated, resulting in an adjustment to Consolidated Financial Statements
retained earnings and an increase to the 2023 Notes. Refer to Note2, Change in Accounting Principle, for further information.The balances of the liability and equity components of the NotesCompany's convertible notes outstanding as of March 31, 2021 and December 31, 2020, were as follows as of the dates indicated (amounts in thousands):
| | | June 30, 2020 | | December 31, 2019 | | March 31, 2021 | | December 31, 2020 |
| Liability component - principal amount | Liability component - principal amount | $ | 632,500 | | | $ | 632,500 | | Liability component - principal amount | $ | 345,000 | | | $ | 345,000 | |
| Unamortized debt discount | Unamortized debt discount | (24,950) | | | (31,414) | | Unamortized debt discount | 0 | | | (20,603) | |
| Unamortized debt issuance costs | | Unamortized debt issuance costs | (3,732) | | | (3,335) | |
| Liability component - net carrying amount | Liability component - net carrying amount | $ | 607,550 | | | $ | 601,086 | | Liability component - net carrying amount | $ | 341,268 | | | $ | 321,062 | |
| Equity component | Equity component | $ | 76,216 | | | $ | 76,216 | | Equity component | $ | 0 | | | $ | 44,910 | |
The Company amortizes debt discount is being amortized into interest expenseissuance costs over the remaining life of the 2020 Notes and the 2023 Notesdebt using the effective interest method. Upon adoption of ASU 2020-06 the debt discount was eliminated and the debt issuance costs were remeasured, resulting in an effective interest rate which is 4.92% and 6.20%, respectively.of 4.00%.
Interest expense related to the NotesCompany's convertible notes for the three months ended March 31, 2021 and 2020, was as follows for the periods indicated (amounts in thousands):
| | | Three Months Ended June 30, | | | Six Months Ended June 30, | | | Three Months Ended March 31, | |
| | 2020 | | 2019 | | 2020 | | 2019 | | 2021 | | 2020 (1) | |
| Interest expense - stated coupon rate | Interest expense - stated coupon rate | $ | 5,175 | | | $ | 5,175 | | | $ | 10,350 | | | $ | 10,350 | | Interest expense - stated coupon rate | $ | 3,019 | | | $ | 5,175 | | |
| Interest expense - amortization of debt discount | Interest expense - amortization of debt discount | 3,247 | | | 3,071 | | | 6,464 | | | 6,113 | | Interest expense - amortization of debt discount | 0 | | | 3,217 | | |
| Total interest expense - convertible senior notes | $ | 8,422 | | | $ | 8,246 | | | $ | 16,814 | | | $ | 16,463 | | |
| Interest expense - amortization of debt issuance costs | | Interest expense - amortization of debt issuance costs | $ | 404 | | | $ | 606 | | |
| Total interest expense - convertible notes | | Total interest expense - convertible notes | $ | 3,423 | | | $ | 8,998 | | |
(1) 2020 amounts include interest expense related to the 3.00% Convertible Senior Notes due August 1, 2020, which were repaid in the third quarter of 2020. Refer to Note 7 of the Company's Consolidated Financial Statements included in Item 8 of the 2020 Form 10-K.
8. Derivatives:
The Company periodically enters into derivative financial instruments, typically interest rate swap agreements, interest rate caps and foreign currency contracts to reduce its exposure to fluctuations in interest rates on variable-rate debt and foreign currency exchange rates. The Company does not utilize derivative financial instruments with a level of complexity or with a risk greater than the exposure to be managed nor does it enter into or hold derivatives for trading or speculative purposes. The Company periodically reviews the creditworthiness of the counterparty to assess the counterparty’s ability to honor its obligation. Counterparty default would expose the Company to fluctuations in interest and currency rates. Derivative financial instruments are recognized at fair value in the Consolidated Balance Sheets, in accordance with the guidance of ASC Topic 815 “Derivatives and Hedging”815. In 2020, the Company adopted ASU 2020-04, “Reference Rate Reform (Topic 848): Facilitation of the Effect of Reference Rate Reform on Financial Reporting” (“ASC 815”ASU 2020-04”). ASU 2020-04 allows the Company to elect certain expedients to continue accounting for its interest rate swap contracts designated as cash flow hedges.
PRA Group, Inc.
Notes to Consolidated Financial Statements
The following table summarizes the fair value of derivative instruments in the Company's Consolidated Balance Sheets as of the dates indicatedMarch 31, 2021 and December 31, 2020 (amounts in thousands):
| | | June 30, 2020 | | | December 31, 2019 | | | March 31, 2021 | | December 31, 2020 |
| | Balance Sheet Location | | Fair Value | | Balance Sheet Location | | Fair Value | | Balance Sheet Location | | Fair Value | | Balance Sheet Location | | Fair Value |
| Derivatives designated as hedging instruments: | Derivatives designated as hedging instruments: | | | | | | | | | Derivatives designated as hedging instruments: | | | | | | | | |
| Interest rate contracts | Interest rate contracts | | Other assets | | $ | — | | | Other assets | | $ | 323 | | Interest rate contracts | | Other assets | | $ | 1,413 | | | Other assets | | $ | 0 | |
| Interest rate contracts | Interest rate contracts | | Other liabilities | | 48,279 | | | Other liabilities | | 17,807 | | Interest rate contracts | | Other liabilities | | 29,081 | | | Other liabilities | | 43,017 | |
| Derivatives not designated as hedging instruments: | Derivatives not designated as hedging instruments: | | | Derivatives not designated as hedging instruments: | |
| Foreign currency contracts | Foreign currency contracts | | Other assets | | 1,804 | | | Other assets | | 552 | | Foreign currency contracts | | Other assets | | 3,437 | | | Other assets | | 3,512 | |
| Foreign currency contracts | Foreign currency contracts | | Other liabilities | | 17,858 | | | Other liabilities | | 5,856 | | Foreign currency contracts | | Other liabilities | | 2,369 | | | Other liabilities | | 2,415 | |
|
Derivatives Designated as Hedging Instruments:
Changes in fair value of derivative contracts designated as cash flow hedging instruments are recognized in other comprehensive income ("OCI"). As of June 30, 2020March 31, 2021 and December 31, 2019,2020, the notional amount of interest rate contracts designated as cash flow hedging instruments was $910.8$901.8 million and $959.0$967.2 million, respectively. Derivatives designated as cash flow hedging instruments were evaluated and remain highly effective at June 30, 2020March 31, 2021 and have initial terms of one to sixfive years. The Company estimates that approximately $9.9$9.1 million of net derivative loss included in OCI will be reclassified into earnings within the next 12 months.
PRA Group, Inc.
Notes to Consolidated Financial Statements
The following table summarizes the effects of derivatives designated as cash flow hedging instruments on the consolidated financial statementsConsolidated Financial Statements for the three and six months ended June 30,March 31, 2021 and 2020 and 2019 (amounts in thousands):
| | | Gain or (loss) recognized in OCI, net of tax | | | | | | | | | | | | |
| | Three Months Ended June 30, | | | | | Six Months Ended June 30, | | | Gain or (loss) recognized in OCI, net of tax | |
| Derivatives designated as cash flow hedging instruments | Derivatives designated as cash flow hedging instruments | | 2020 | | 2019 | | | | 2020 | | 2019 | Derivatives designated as cash flow hedging instruments | | March 31, 2021 | March 31, 2020 | |
| Interest rate contracts | Interest rate contracts | | $ | (5,515) | | | $ | (8,121) | | | | | $ | (26,865) | | | $ | (13,915) | | Interest rate contracts | | $ | 9,692 | | $ | (21,350) | | |
| | | Gain or (loss) reclassified from OCI into income | | | Gain or (loss) reclassified from OCI into income | |
| Three Months Ended June 30, | | | | | Six Months Ended June 30, | | |
| Location of gain or (loss) reclassified from OCI into income | Location of gain or (loss) reclassified from OCI into income | | 2020 | | 2019 | | | | 2020 | | 2019 | Location of gain or (loss) reclassified from OCI into income | | March 31, 2021 | March 31, 2020 | |
| Interest expense, net | Interest expense, net | | $ | (2,301) | | | $ | (119) | | | | | $ | (3,313) | | | $ | (198) | | Interest expense, net | | $ | (3,336) | | $ | (1,012) | | |
Derivatives Not Designated as Hedging Instruments:
Changes in fair value of derivative contracts not designated as hedging instruments are recognized in earnings. The Company also enters into foreign currency contracts to economically hedge the foreign currency re-measurement exposure related to certain balances that are denominated in currencies other than the functional currency of the entity. As of June 30, 2020March 31, 2021 and December 31, 2019,2020, the notional amount of foreign currency contracts that are not designated as hedging instruments was $455.6$447.2 million and $469.9$500.8 million, respectively.
The following table summarizes the effects of derivatives not designated as hedging instruments on the Company’s Consolidated Income Statements for the three and six months ended June 30,March 31, 2021 and 2020 and 2019 (amounts in thousands):
| | | Amount of gain or (loss) recognized in income | | | Amount of gain or (loss) recognized in income |
| | Three Months Ended June 30, | | |
| Derivatives not designated as hedging instruments | Derivatives not designated as hedging instruments | | Location of gain or (loss) recognized in income | | 2020 | | 2019 | Derivatives not designated as hedging instruments | | Location of gain or (loss) recognized in income | | March 31, 2021 | | March 31, 2020 |
| Foreign currency contracts | Foreign currency contracts | | Foreign exchange gain/(loss) | | $ | (1,629) | | | $ | (2,415) | | Foreign currency contracts | | Foreign exchange (loss)/gain | | $ | 2,097 | | | $ | 26,786 | |
| Foreign currency contracts | Foreign currency contracts | | Interest expense, net | | (812) | | | (1,487) | | Foreign currency contracts | | Interest expense, net | | 114 | | | (1,001) | |
| Interest rate contracts | Interest rate contracts | | Interest expense, net | | — | | | (158) | | Interest rate contracts | | Interest expense, net | | 0 | | | 1,038 | |
| | Amount of gain or (loss) recognized in income | | |
| Six Months Ended June 30, | | |
| Derivatives not designated as hedging instruments | | Location of gain or (loss) recognized in income | | 2020 | | 2019 | |
| Foreign currency contracts | | Foreign exchange gain/(loss) | | $ | 25,157 | | | $ | (7,671) | | |
| Foreign currency contracts | | Interest expense, net | | (1,813) | | | (1,487) | | |
| Interest rate contracts | | Interest expense, net | | — | | | (507) | | |
9. Fair Value:
As defined by ASC Topic 820, "Fair Value MeasurementsMeasurement and Disclosures" ("ASC 820"), fair value is the price that would be received to sell an asset or paid to transfer a liability in an orderly transaction between market participants at the measurement date. ASC 820 requires the consideration of differing levels of inputs in the determination of fair values.
Those levels of input are summarized as follows:
•Level 1: Quoted prices in active markets for identical assets and liabilities.
PRA Group, Inc.
Notes to Consolidated Financial Statements
•Level 2: Observable inputs other than Level 1 quoted prices, such as quoted prices for similar instruments in active markets, quoted prices for identical or similar instruments in markets that are not active, and model-based valuation techniques for which all significant assumptions are observable in the market.
•Level 3: Unobservable inputs that are supported by little or no market activity. Level 3 assets and liabilities include financial instruments whose value is determined using pricing models, discounted cash flow methodologies, or similar techniques as well as instruments for which the determination of fair value requires significant management judgment or estimation.
PRA Group, Inc.
Notes to Consolidated Financial Statements
The level in the fair value hierarchy within which a fair value measurement in its entirety falls is based on the lowest level input that is significant to the fair value measurement in its entirety.
Financial Instruments Not Required To Be Carried at Fair Value
In accordance with the disclosure requirements of ASC Topic 825, "Financial Instruments" ("ASC 825"), the table below summarizes fair value estimates for the Company's financial instruments that are not required to be carried at fair value. The total of the fair value calculations presented does not represent, and should not be construed to represent, the underlying value of the Company.
The carrying amounts in the table are recorded in the Consolidated Balance Sheets at June 30, 2020March 31, 2021 and December 31, 20192020 (amounts in thousands):
| | | June 30, 2020 | | | December 31, 2019 | | | March 31, 2021 | | December 31, 2020 |
| | Carrying
Amount | | Estimated
Fair Value | | Carrying
Amount | | Estimated
Fair Value | | Carrying
Amount | | Estimated
Fair Value | | Carrying
Amount | | Estimated
Fair Value |
| Financial assets: | Financial assets: | | | | | | | | Financial assets: | | | | | | | |
| Cash and cash equivalents | Cash and cash equivalents | $ | 115,741 | | | $ | 115,741 | | | $ | 119,774 | | | $ | 119,774 | | Cash and cash equivalents | $ | 92,798 | | | $ | 92,798 | | | $ | 108,613 | | | $ | 108,613 | |
| | Restricted cash | | Restricted cash | 16,057 | | | 16,057 | | | 12,434 | | | 12,434 | |
| Finance receivables, net | Finance receivables, net | 3,351,532 | | | 3,426,048 | | | 3,514,165 | | | 3,645,610 | | Finance receivables, net | 3,372,666 | | | 3,365,936 | | | 3,514,788 | | | 3,541,159 | |
| Financial liabilities: | Financial liabilities: | | Financial liabilities: | |
| Interest-bearing deposits | Interest-bearing deposits | 120,520 | | | 120,520 | | | 106,246 | | | 106,246 | | Interest-bearing deposits | 124,998 | | | 124,998 | | | 132,739 | | | 132,739 | |
| Revolving lines of credit | Revolving lines of credit | 1,558,074 | | | 1,558,074 | | | 1,789,502 | | | 1,789,502 | | Revolving lines of credit | 1,399,431 | | | 1,399,431 | | | 1,577,596 | | | 1,577,596 | |
| Term loan | Term loan | 420,000 | | | 420,000 | | | 425,000 | | | 425,000 | | Term loan | 467,500 | | | 467,500 | | | 470,000 | | | 470,000 | |
| | Convertible senior notes | 607,550 | | | 642,499 | | | 601,086 | | | 648,968 | | |
| Senior Notes | | Senior Notes | 300,000 | | | 321,495 | | | 300,000 | | | 324,408 | |
| Convertible Notes | | Convertible Notes | 345,000 | | | 370,627 | | | 324,397 | | | 376,012 | |
Disclosure of the estimated fair values of financial instruments often requires the use of estimates. The carrying amount and estimates of the fair value of the Company's debt obligations outlined above do not include any related debt issuance costs associated with the debt obligations. The Company uses the following methods and assumptions to estimate the fair value of financial instruments:
Cash and cash equivalents:equivalents and restricted cash: The carrying amount approximates fair value and quoted prices for identical assets that can be found in active markets. Accordingly, the Company estimates the fair value of cash, and cash equivalents and restricted cash using Level 1 inputs.
Finance receivables, net: The Company estimates the fair value of these receivables using proprietary pricing models that the Company utilizes to make portfolio acquisition decisions. Accordingly, the Company's fair value estimates use Level 3 inputs as there is little observable market data available and management is required to use significant judgment in its estimates.
Interest-bearing deposits: The carrying amount approximates fair value due to the short-term nature of the deposits and the observable quoted prices for similar instruments in active markets. Accordingly, the Company uses Level 2 inputs for its fair value estimates.
Revolving lines of credit: The carrying amount approximates fair value due to the short-term nature of the interest rate periods and the observable quoted prices for similar instruments in active markets. Accordingly, the Company uses Level 2 inputs for its fair value estimates.
Term loan: The carrying amount approximates fair value due to the short-term nature of the interest rate periods and the observable quoted prices for similar instruments in active markets. Accordingly, the Company uses Level 2 inputs for its fair value estimate.
PRA Group, Inc.
Notes to Consolidated Financial Statements
Senior and Convertible senior notes:Notes: The fair value estimates for the Senior Notes and the Convertible Notes incorporate quoted market prices, which were obtained from secondary market broker quotes, which were derived from a variety of inputs including client orders, information from their pricing vendors, modeling software and actual trading prices when they occur. Accordingly, the Company uses Level 2 inputs for its fair value estimates. Furthermore, in the table above, the carrying amount of December 31, 2020 represents the portionConvertible Notes net of the Notes classified as debt while estimated fair value pertains todiscount. Upon adoption of ASU 2020-06, the facecarrying amount of the Notes.
PRA Group, Inc.
Convertible Notes to Consolidated Financial Statements
reflects face value as the debt discount was eliminated.Financial Instruments Required To Be Carried At Fair Value
The carrying amounts in the following table are measured at fair value on a recurring basis in the accompanying Consolidated Balance Sheets at June 30, 2020March 31, 2021 and December 31, 20192020 (amounts in thousands):
| | | Fair Value Measurements as of June 30, 2020 | | | Fair Value Measurements as of March 31, 2021 |
| | Level 1 | | Level 2 | | Level 3 | | Total | | Level 1 | | Level 2 | | Level 3 | | Total |
| Assets: | Assets: | | | | | | | | Assets: | | | | | | | |
| | Available-for-sale investments | Available-for-sale investments | | Available-for-sale investments | |
| Government bonds | Government bonds | $ | 4,767 | | | $ | — | | | $ | — | | | $ | 4,767 | | Government bonds | $ | 5,308 | | | $ | 0 | | | $ | 0 | | | $ | 5,308 | |
| Fair value through net income | Fair value through net income | | Fair value through net income | |
| Exchange traded funds | | Exchange traded funds | 34,841 | | | 0 | | | 0 | | | 34,841 | |
| Mutual funds | Mutual funds | 743 | | | — | | | — | | | 743 | | Mutual funds | 896 | | | 0 | | | 0 | | | 896 | |
| Derivative contracts (recorded in other assets) | Derivative contracts (recorded in other assets) | — | | | 1,804 | | | — | | | 1,804 | | Derivative contracts (recorded in other assets) | 0 | | | 4,850 | | | 0 | | | 4,850 | |
| Liabilities: | Liabilities: | | Liabilities: | |
| Derivative contracts (recorded in other liabilities) | Derivative contracts (recorded in other liabilities) | — | | | 66,137 | | | — | | | 66,137 | | Derivative contracts (recorded in other liabilities) | 0 | | | 31,450 | | | 0 | | | 31,450 | |
| | | Fair Value Measurements as of December 31, 2019 | | | Fair Value Measurements as of December 31, 2020 |
| | Level 1 | | Level 2 | | Level 3 | | Total | | Level 1 | | Level 2 | | Level 3 | | Total |
| Assets: | Assets: | | | | | | | | Assets: | | | | | | | |
| | Available-for-sale investments | Available-for-sale investments | | Available-for-sale investments | |
| Government bonds | Government bonds | $ | 5,052 | | | $ | — | | | $ | — | | | $ | 5,052 | | Government bonds | $ | 5,368 | | | $ | 0 | | | $ | 0 | | | $ | 5,368 | |
| Fair value through net income | Fair value through net income | | Fair value through net income | |
| Exchange traded funds | | Exchange traded funds | 34,847 | | | 0 | | | 0 | | | 34,847 | |
| Mutual funds | Mutual funds | 33,677 | | | — | | | — | | | 33,677 | | Mutual funds | 1,023 | | | 0 | | | 0 | | | 1,023 | |
| Derivative contracts (recorded in other assets) | Derivative contracts (recorded in other assets) | — | | | 875 | | | — | | | 875 | | Derivative contracts (recorded in other assets) | 0 | | | 3,512 | | | 0 | | | 3,512 | |
| Liabilities: | Liabilities: | | Liabilities: | |
| Derivative contracts (recorded in other liabilities) | Derivative contracts (recorded in other liabilities) | — | | | 23,663 | | | — | | | 23,663 | | Derivative contracts (recorded in other liabilities) | 0 | | | 45,432 | | | 0 | | | 45,432 | |
Available-for-sale investments
Government bonds: Fair value of the Company's investment in government bonds is estimated using quoted market prices. Accordingly, the Company uses Level 1 inputs.
Fair value through net income investments
Exchange traded funds: Fair value of the Company's investment in exchange traded funds is estimated using quoted market prices. Accordingly, the Company uses Level 1 inputs.
Mutual funds: Fair value of the Company's investment in mutual funds is estimated using quoted market prices. Accordingly, the Company uses Level 1 inputs.
Derivative contracts: The estimated fair value of the derivative contracts is determined using industry standard valuation models. These models project future cash flows and discount the future amounts to a present value using market-based observable inputs, including interest rate curves and other factors. Accordingly, the Company uses Level 2 inputs for its fair value estimates.
PRA Group, Inc.
Notes to Consolidated Financial Statements
Investments measured using net asset value ("NAV")
Private equity funds: This class of investments consists of private equity funds that invest primarily in loans and securities including single-family residential debt; corporate debt products; and financially-oriented, real-estate-rich and other operating companies in the Americas, Western Europe and Japan. These investments are subject to certain restrictions regarding transfers and withdrawals. The investments cannot be redeemed with the funds. Instead, the nature of the investments in this class is that distributions are received through the liquidation of the underlying assets of the fund. The investments are expected to be returned through distributions as a result of liquidations of the funds' underlying assets over one to five years. The fair value of these private equity funds following the application of the Net Asset Value ("NAV")NAV practical expedient was $5.6$6.2 million and $7.2$6.1 million as of June 30, 2020March 31, 2021 and December 31, 2019,2020, respectively.
PRA Group, Inc.
Notes to Consolidated Financial Statements
10. Accumulated Other Comprehensive Loss:
The following table provides details about the reclassifications out offrom accumulated other comprehensive gain/(loss)loss for the three and six months ended June 30,March 31, 2021 and 2020 and 2019 (amounts in thousands):
| | | | | | | | | | | | | | | | | | | | | | | | |
| | Three Months Ended June 30, | | | | | | | | |
| Gains and losses on cash flow hedges | | 2020 | | 2019 | | | | | | Affected line in the consolidated income statement |
| Interest rate swaps | | $ | (2,301) | | | $ | (119) | | | | | | | Interest expense, net |
| Income tax effect of item above | | 539 | | | — | | | | | | | Income tax expense |
| Total losses on cash flow hedges | | $ | (1,762) | | | $ | (119) | | | | | | | Net of tax |
| | | | | | | | | | |
| | Six Months Ended June 30, | | | | | | | | |
| Gains and losses on cash flow hedges | | 2020 | | 2019 | | | | | | Affected line in the consolidated income statement |
| Interest rate swaps | | $ | (3,313) | | | $ | (198) | | | | | | | Interest expense, net |
| Income tax effect of item above | | 769 | | | — | | | | | | | Income tax expense |
| Total losses on cash flow hedges | | $ | (2,544) | | | $ | (198) | | | | | | | Net of tax |
| | | | | | | | | | | | | | | | | | | | | | | | |
| | Three Months Ended March 31, | | | | |
| Gains and losses on cash flow hedges | | 2021 | | 2020 | | | | | | Affected line in the Consolidated Income Statement |
| Interest rate swaps | | $ | (3,336) | | | $ | (1,012) | | | | | | | Interest expense, net |
| Income tax effect of item above | | 705 | | | 230 | | | | | | | Income tax expense |
| Total losses on cash flow hedges | | $ | (2,631) | | | $ | (782) | | | | | | | Net of tax |
The following table represents the changes in accumulated other comprehensive gain/(loss)loss by component, after tax, for the three and six months ended June 30,March 31, 2021 and 2020 and 2019 (amounts in thousands):
| | | Three Months Ended June 30, 2020 | | | Three Months Ended March 31, 2021 |
| | Debt Securities | | Cash Flow | | Currency Translation | | Accumulated Other | | Debt Securities | | Cash Flow | | Currency Translation | | Accumulated Other |
| | Available-for-sale | | Hedges | | Adjustments | | Comprehensive Loss (1) | | Available-for-sale | | Hedges | | Adjustments | | Comprehensive Loss (1) |
| Ending balance at March 31, 2020 | | $ | 126 | | | $ | (33,656) | | | $ | (342,087) | | | $ | (375,617) | | |
| Balance at beginning of period | | Balance at beginning of period | | $ | 127 | | | $ | (33,349) | | | $ | (212,569) | | | $ | (245,791) | |
| Other comprehensive loss before reclassifications | Other comprehensive loss before reclassifications | | 51 | | | (5,515) | | | 32,107 | | | 26,643 | | Other comprehensive loss before reclassifications | | 0 | | | 9,692 | | | (20,108) | | | (10,416) | |
| Reclassifications, net | Reclassifications, net | | — | | | 1,762 | | | — | | | 1,762 | | Reclassifications, net | | 0 | | | 2,631 | | | 0 | | | 2,631 | |
| Net current period other comprehensive loss | Net current period other comprehensive loss | | 51 | | | (3,753) | | | 32,107 | | | 28,405 | | Net current period other comprehensive loss | | 0 | | | 12,323 | | | (20,108) | | | (7,785) | |
| Ending balance at June 30, 2020 | | $ | 177 | | | $ | (37,409) | | | $ | (309,980) | | | $ | (347,212) | | |
| Balance at end of period | | Balance at end of period | | $ | 127 | | | $ | (21,026) | | | $ | (232,677) | | | $ | (253,576) | |
| | | Three Months Ended June 30, 2019 | | | Three Months Ended March 31, 2020 |
| | Debt Securities | | Cash Flow | | Currency Translation | | Accumulated Other | | Debt Securities | | Cash Flow | | Currency Translation | | Accumulated Other |
| | Available-for-sale | | Hedges | | Adjustments | | Comprehensive Loss (1) | | Available-for-sale | | Hedges | | Adjustments | | Comprehensive Loss (1) |
| Ending balance at March 31, 2019 | | $ | (38) | | | $ | (5,671) | | | $ | (242,812) | | | $ | (248,521) | | |
| Balance at beginning of period | | Balance at beginning of period | | $ | (44) | | | $ | (13,088) | | | $ | (247,886) | | | $ | (261,018) | |
| Other comprehensive loss before reclassifications | Other comprehensive loss before reclassifications | | 37 | | | (8,121) | | | 4,362 | | | (3,722) | | Other comprehensive loss before reclassifications | | 170 | | | (21,350) | | | (94,201) | | | (115,381) | |
| Reclassifications, net | Reclassifications, net | | — | | | 119 | | | — | | | 119 | | Reclassifications, net | | 0 | | | 782 | | | 0 | | | 782 | |
| Net current period other comprehensive loss | Net current period other comprehensive loss | | 37 | | | (8,002) | | | 4,362 | | | (3,603) | | Net current period other comprehensive loss | | 170 | | | (20,568) | | | (94,201) | | | (114,599) | |
| Ending balance at June 30, 2019 | | $ | (1) | | | $ | (13,673) | | | $ | (238,450) | | | $ | (252,124) | | |
| Balance at end of period | | Balance at end of period | | $ | 126 | | | $ | (33,656) | | | $ | (342,087) | | | $ | (375,617) | |
| | | | |
(1) For the three months ended June 30, 2020 and 2019, netNet of deferred taxes for unrealized losses from cash flow hedges were $0.7of $6.4 million and $2.8$10.0 million for the three months ended March 31, 2021 and 2020, respectively.
PRA Group, Inc.
Notes to Consolidated Financial Statements
| | | | | | | | | | | | | | | | | | | | | | | | | | |
| | Six Months Ended June 30, 2020 | | | | | | |
| | Debt Securities | | Cash Flow | | Currency Translation | | Accumulated Other |
| | Available-for-sale | | Hedges | | Adjustments | | Comprehensive Loss (2) |
| Ending balance at December 31, 2019 | | $ | (44) | | | $ | (13,088) | | | $ | (247,886) | | | $ | (261,018) | |
| Other comprehensive loss before reclassifications | | 221 | | | (26,865) | | | (62,094) | | | (88,738) | |
| Reclassifications, net | | — | | | 2,544 | | | — | | | 2,544 | |
| Net current period other comprehensive loss | | 221 | | | (24,321) | | | (62,094) | | | (86,194) | |
| Ending balance at June 30, 2020 | | $ | 177 | | | $ | (37,409) | | | $ | (309,980) | | | $ | (347,212) | |
| | | | | | | | |
| | Six Months Ended June 30, 2019 | | | | | | |
| | Debt Securities | | Cash Flow | | Currency Translation | | Accumulated Other |
| | Available-for-sale | | Hedges | | Adjustments | | Comprehensive Loss (2) |
| Ending balance December 31, 2018 | | $ | (83) | | | $ | 44 | | | $ | (242,070) | | | $ | (242,109) | |
| Other comprehensive loss before reclassifications | | 82 | | | (13,915) | | | 3,620 | | | (10,213) | |
| Reclassifications, net | | — | | | 198 | | | — | | | 198 | |
| Net current period other comprehensive loss | | 82 | | | (13,717) | | | 3,620 | | | (10,015) | |
| Ending balance June 30, 2019 | | $ | (1) | | | $ | (13,673) | | | $ | (238,450) | | | $ | (252,124) | |
| (2) For the six months ended June 30, 2020 and 2019, net of deferred taxes for unrealized losses from cash flow hedges were $10.7 million and $4.5 million, respectively. | | | | | | | | |
11. Earnings per Share:
Basic earnings per share ("EPS") are computed by dividing net income available to common stockholders of PRA Group, Inc. by weighted average common shares outstanding. Diluted EPS are computed using the same components as basic EPS with the denominator adjusted for the dilutive effect of the Convertible Notes and nonvested share awards, if dilutive. There has been no dilutive effect of the convertible senior notesConvertible Notes since issuance through June 30, 2020.March 31, 2021. Share-based awards that are contingent upon the attainment of performance goals are included in the computation of diluted EPS if the effect is dilutive. The dilutive effect of nonvested shares is computed using the treasury stock method, which assumes any proceeds that could be
PRA Group, Inc.
Notes to Consolidated Financial Statements
obtained upon the vesting of nonvested shares would be used to purchase common shares at the average market price for the period.
The following table provides a reconciliation between the computation of basic EPS and diluted EPS for the three and six months ended June 30,March 31, 2021 and 2020 and 2019 (amounts in thousands, except per share amounts):
| | | For the Three Months Ended June 30, | | | For the Three Months Ended March 31, |
| | 2020 | | | 2019 | | | 2021 | | 2020 |
| | Net Income Attributable to PRA Group, Inc. | | Weighted
Average
Common Shares | | EPS | | Net Income Attributable to PRA Group, Inc. | | Weighted
Average
Common Shares | | EPS | | Net Income Attributable to PRA Group, Inc. | | Weighted
Average
Common Shares | | EPS | | Net Income Attributable to PRA Group, Inc. | | Weighted
Average
Common Shares | | EPS |
| Basic EPS | Basic EPS | $ | 57,914 | | | 45,548 | | | $ | 1.27 | | | $ | 18,619 | | | 45,387 | | | $ | 0.41 | | Basic EPS | $ | 58,406 | | | 45,669 | | | $ | 1.28 | | | $ | 19,135 | | | 45,452 | | | $ | 0.42 | |
| Dilutive effect of nonvested share awards | Dilutive effect of nonvested share awards | | | 439 | | | (0.01) | | | | | 108 | | | — | | Dilutive effect of nonvested share awards | — | | | 376 | | | (0.01) | | | — | | | 332 | | | 0 | |
| | Diluted EPS | Diluted EPS | $ | 57,914 | | | 45,987 | | | $ | 1.26 | | | $ | 18,619 | | | 45,495 | | | $ | 0.41 | | Diluted EPS | $ | 58,406 | | | 46,045 | | | $ | 1.27 | | | $ | 19,135 | | | 45,784 | | | $ | 0.42 | |
| | For the Six Months Ended June 30, | | |
| 2020 | | | 2019 | | |
| Net income attributable to PRA Group, Inc. | | Weighted
Average
Common Shares | | EPS | | Net income attributable to PRA Group, Inc. | | Weighted
Average
Common Shares | | EPS | |
| Basic EPS | $ | 77,049 | | | 45,500 | | | $ | 1.69 | | | $ | 33,846 | | | 45,363 | | | $ | 0.75 | | |
| Dilutive effect of nonvested share awards | | 386 | | | (0.01) | | | 94 | | | (0.01) | | |
| Diluted EPS | $ | 77,049 | | | 45,886 | | | $ | 1.68 | | | $ | 33,846 | | | 45,457 | | | $ | 0.74 | | |
There were 0 antidilutive options outstanding, for the threeantidilutive or otherwise, as of March 31, 2021 and six months ended June 30, 2020 and 2019.2020.
PRA Group, Inc.
Notes to Consolidated Financial Statements
12. Income Taxes:
The Company follows the guidance ofaccounts for income taxes in accordance with FASB ASC Topic 740 "Income Taxes" ("ASC 740") as it relates to the provision for income taxes and uncertainty in income taxes. The guidance prescribes a recognition threshold and measurement attribute for the financial statement recognition and measurement of a tax position taken or expected to be taken in a tax return.
On May 10, 2017, the Company reached a settlement with the Internal Revenue Service ("IRS") regarding the IRS assertion that tax revenue recognition using the cost recovery method did not clearly reflect taxable income. In accordance with the settlement, the Company changed its tax accounting method used to recognize finance receivables revenue effective with tax year 2017. Under the new method, a portion of the annual collections amortizes principal and the remaining portion is taxable income. The deferred tax liability related to the difference in timing between the new method and the cost recovery method has been incorporated evenly into the Company’s tax filings over four years effective with tax year 2017 and ending with tax year 2020. The Company was not required to pay any interest or penalties in connection with the settlement.
OnAt March 27, 2020, the Coronavirus Aid, Relief, and Economic Security ("CARES") Act was enacted into U.S. law in response to COVID-19 with varying legislation enacted in many of the countries in which the Company operates. While the Company is continuing to evaluate impact, the Company has implemented the tax payment and filing deferral provisions as applicable on a global basis and does not believe that any of the other provisions will have a material impact to its financial reporting. As tax legislative updates continue to be released, they will be monitored by the Company.
At June 30, 2020,31, 2021, the tax years subject to examination by the major federal, state and international taxing jurisdictions are 2013 and subsequent years.
The Company intends for predominantly all international earnings to be indefinitely reinvested in its international operations; therefore, the recording of deferred tax liabilities for such unremitted earnings is not required. If international earnings were repatriated, the Company may need to accrue and pay taxes, although foreign tax credits may be available to partially reduce U.S. income taxes. The amount of cash on hand related to international operations with indefinitely reinvested earnings was $96.7$62.2 million and $109.7$97.0 million as of June 30, 2020March 31, 2021 and December 31, 2019,2020, respectively.
13. Commitments and Contingencies:
Employment Agreements:
The Company has entered into employment agreements mostwith each of its U.S. executive officers, which expire on December 31, 2020, with all of its U.S. executive officers and with several members of its U.S. senior management group.2023. Such agreements provide for base salary payments as well as potential discretionary bonuses that take into considerationconsider the Company’s overall performance against its short and long-term financial and strategic objectives. The agreements also contain customary confidentiality and non-compete provisions. At June 30, 2020,March 31, 2021, estimated future compensation under these agreements was approximately $4.0$17.8 million. The agreements also contain confidentiality and non-compete provisions. Outside the U.S., the Company has entered into employment agreements are in place with certain employees pursuant to local country regulations. Generally, these agreements do not have expiration dates and thereforedates. As a result it is impractical to estimate the amount of future compensation under these agreements. Accordingly, the future compensation under these agreements is not included in the $4.0$17.8 million total above.
Forward Flow Agreements:
The Company is party to several forward flow agreements that allow for the purchase of nonperforming loans at pre-established prices. The maximum remaining amount to be purchased under forward flow agreements at June 30, 2020,March 31, 2021, was approximately $383.7$640.7 million.
Finance Receivables:
Certain agreements for the purchase of finance receivables portfolios contain provisions that may, in limited circumstances, require the Company to refund a portion or all of the collections subsequently received by the Company on particular accounts. The potential refunds as of the balance sheet date are not considered to be significant.
PRA Group, Inc.
Notes to Consolidated Financial Statements
Litigation and Regulatory Matters:
The Company and its subsidiaries are from time to time subject to a variety of routine legal and regulatory claims, inquiries and proceedings and regulatory matters, most of which are incidental to the ordinary course of its business. The Company initiates lawsuits against customers and is occasionally countersued by them in such actions. Also, customers, either individually, as members of a class action, or through a governmental entity on behalf of customers, may initiate litigation against the Company in which they allege that the Company has violated a state or federal law in the process of collecting on an
PRA Group, Inc.
Notes to Consolidated Financial Statements
account. From time to time, other types of lawsuits are brought against the Company. Additionally, the Company receives subpoenas and other requests or demands for information from regulators or governmental authorities who are investigating the Company's debt collection activities.
The Company accrues for potential liability arising from legal proceedings and regulatory matters when it is probable that such liability has been incurred and the amount of the loss can be reasonably estimated. This determination is based upon currently available information for those proceedings in which the Company is involved, taking into account the Company's best estimate of such losses for those cases for which such estimates can be made. The Company's estimate involves significant judgment, given the varying stages of the proceedings (including the fact that many of them are currently in preliminary stages), the number of unresolved issues in many of the proceedings (including issues regarding class certification and the scope of many of the claims), and the related uncertainty of the potential outcomes of these proceedings. In making determinations of the likely outcome of pending litigation, the Company considers many factors, including, but not limited to, the nature of the claims, the Company's experience with similar types of claims, the jurisdiction in which the matter is filed, input from outside legal counsel, the likelihood of resolving the matter through alternative mechanisms, the matter's current status and the damages sought or demands made. Accordingly, the Company's estimate will change from time to time, and actual losses could be more than the current estimate.
The Company believes that the estimate of the aggregate range of reasonably possible losses in excess of the amount accrued for its legal proceedings outstanding at June 30, 2020,March 31, 2021, where the range of loss can be estimated, was not material.
In certain legal proceedings, the Company may have recourse to insurance or third-party contractual indemnities to cover all or portions of its litigation expenses, judgments, or settlements. Loss estimates and accruals for potential liability related to legal proceedings are typically exclusive of potential recoveries, if any, under the Company's insurance policies or third-party indemnities. At June 30, 2020 and December 31, 2019, the Company had $1.8 million and $1.0 million in recoveries receivable under the Company's insurance policies or third-party indemnities, respectively. These amounts
Matters that are included in other receivables, net in the Consolidated Balance Sheets.
The matter below, in addition to the mattersnot considered routine legal proceedings were disclosed previously in the 20192020 Form 10-K, fall outside of the normal parameters of the Company's routine legal proceedings.
Telephone Consumer Protection Act ("TCPA") Litigation
On January 25, 2017, the Company settled the matter of In Re Portfolio Recovery Associates, LLC Telephone Consumer Protection Act Litigation, which consisted of a number of class actions and single plaintiff claims consolidated by order of the Panel for Multi-District Litigation ("MDL"). While the settlement disposed of a large number of claims, several hundred class members opted out ("Opt-Out Plaintiffs") of that settlement. Many of these Opt-Out Plaintiffs have been consolidated before the MDL appointed court, the United States District Court for the Southern District of California, and are pending a determination on cross-motions for summary judgment. On July 9, 2020, the Supreme Court of the United States granted certiorari in the matter of Facebook v. Duguid to resolve the split between the Circuit Courts of Appeal on the issue of the definition of an Automatic Telephone Dialing System. A decision in that case is expected to be dispositive of many or all TCPA matters currently pending, most of which are now stayed as a result of the grant of certiorari. The range of loss, if any, cannot be estimated at this time due to the uncertainty surrounding liability.10-K.
14. Recently Issued Accounting Standards:
Recently issued accounting standards adopted:
Financial Instruments - Credit Losses
Effective January 1, 2020, the Company adopted ASC 326 on a prospective basis. Prior to January 1, 2020, substantially all of the Company's investment in finance receivables were accounted for under ASC 310-30. Refer to Note 2 for comprehensive details.
Intangibles - Goodwill and Other
In January 2017, FASB issued ASU 2017-04 which eliminates Step 2 of the goodwill impairment test. Instead, an entity performs its annual or interim goodwill impairment test by comparing the fair value of a reporting unit with its carrying amount. An entity recognizes an impairment charge for the amount by which the carrying amount exceeds the reporting unit’s fair value; however, the loss recognized should not exceed the total amount of goodwill allocated to that reporting unit. An entity still has the option to perform the qualitative assessment for a reporting unit to determine if the quantitative impairment
PRA Group, Inc.
Notes to Consolidated Financial Statements
test is necessary. The Company adopted ASU 2017-04 on January 1, 2020 which had no impact on its consolidated financial statements.
Fair Value Measurement
In August 2018, the FASB issued ASU 2018-13, “Fair Value Measurement (Topic 820): Disclosure Framework - Changes to the Disclosure Requirements for Fair Value Measurement” ("ASU 2018-13"). ASU 2018-13 eliminates, adds and modifies certain disclosure requirements for fair value measurements as part of its disclosure framework project. The Company adopted ASU 2018-13 on January 1, 2020 which had no impact to the Company's Notes to Consolidated Financial Statements.
Recently issued accounting standards not yet adopted:
Income Taxes
In December 2019, the FASB issued ASU 2019-12, Income Taxes (Topic 740): Simplifying the Accounting for Income Taxes (“("ASU 2019-12”2019-12"). ASU 2019-12 removes certain exceptions for recognizing deferred taxes for investments and calculating income taxes in interim periods. Additionally, itthe standard adds guidance to reduce complexity in certain areas, including recognizing taxes for tax goodwill and allocating taxes to members of a consolidated group. ASU 2019-12 is effective for annual and interim periods beginning after December 15, 2020 on a prospective basis, and early adoption is permitted. The Company is currently evaluating the impact ofadopted ASU 2019-12 on January 1, 2021 with no material impact to its consolidated financial statements and expects to adopt January 1, 2021. The Company does not expect adoption to have a material impact on its consolidated financial statements.upon adoption.
Investments-Equity Securities
In January 2020, the FASB issued ASU 2020-01 “Investments-Equity Securities (Topic 321), Investments-Equity Method and Joint Ventures (Topic 323), and Derivatives and Hedging (Topic 815)-Clarifying the Interactions between Topic 321, Topic 323, and Topic 815” (“("ASU 2020-01”2020-01"). ASU 2020-01 clarifies that a company should consider observable transactions that require a company to either apply or discontinue the equity method of accounting under Topic 323, Investments-Equity Method and Joint Ventures, for the purposes of applying the measurement alternative in accordance with Topic 321 immediately before applying or upon discontinuing the equity method. Additionally, it clarifies that, when determining the accounting for certain forward contracts and purchased options a company should not consider, whether upon settlement or exercise, if the underlying securities would be accounted for under the equity method or fair value option. This standard is effective for public entities forThe Company adopted ASU 2020-01 on January 1, 2021 with no impact to its financial statements issuedupon adoption.
PRA Group, Inc.
Notes to Consolidated Financial Statements
Accounting for fiscal years and interim periods beginning after December 15, 2020. TheConvertible Instruments
Effective January 1, 2021, the Company is evaluating the impact ofearly adopted ASU 2020-01 but does not expect adoption2020-06. Refer to have a material effect on its consolidated financial statements.Note 2 for details. Reference Rate Reform
In March 2020,January 2021, the FASB issued ASU 2020-04, “Reference2021-01, "Reference Rate Reform (Topic 848): Facilitation of the Effects of Reference Rate Reform on Financial Reporting” (“Overall" ("ASU 2020-04”2021-01"). ASU 2020-04 provides temporary optional guidance2021-01 expands the scope of ASC 848 to easeinclude derivatives affected by the potential burden in accountingdiscounting transition for reference rate reform. The new guidance providescertain optional expedients and exceptions for applying generally accepted accounting principles to contract modifications and hedging relationships, subject to meeting certain criteria, that reference London Inter-bank Offered Rate ("LIBOR") or another reference rate expected to be discontinued.exceptions. ASU 2020-042021-01 is effective immediately for a limited time through December 31, 2022. The Company is currently evaluating the impact of ASU 2020-04.2021-01 but does not expect it to have a material impact on its financial statements.
Recently issued accounting standards not yet adopted:
The Company does not expect that any other recently issued accounting pronouncements will have a material effect on its consolidated financial statements.
15. Subsequent Events:
Subsequent to June 30, 2020, the Company repaid, in full, the 2020 Notes. On July 7, 2020, the Company repurchased $21.0 million of the 2020 Notes at a discount plus accrued interest. The remaining $266.5 million aggregate principal amount was repaid, at par, plus accrued interest at maturity in accordance with the terms of the 2013 Indenture. The Company repaid the 2020 Notes primarily using borrowings under the domestic revolving loan facility in the North American Credit Agreement.Consolidated Financial Statements.
Item 2. Management's Discussion and Analysis of Financial Condition and Results of Operations
Forward-Looking Statements:
ThisAll references in this Quarterly Report on Form 10-Q (this "Quarterly Report") to "PRA Group," "we," "us," "the Company" or similar terms are to PRA Group, Inc. and its subsidiaries.
Forward-Looking Statements:
This Quarterly Report contains forward-looking statements withinas defined by the meaningPrivate Securities Litigation Reform Act of the federal securities laws. These forward-looking statements involve risks, uncertainties and assumptions that could cause our results to differ materially from those expressed or implied by such forward-looking statements. All statements,1995. Statements other than statements of historical fact are forward-looking statements, including statements regarding overall cash collection trends, operating cost trends, liquidity and capital needs and other statements of expectations, beliefs, future plans, strategies and strategies, anticipated events or trends, and similar expressions concerning matters that are not historical facts. Thetrends. Our results could differ materially from those expressed or implied by such forward-looking statements, or our forward looking statements could be wrong, as a result of risks, uncertainties and assumptions referred to above may includeincluding the following:
•a deterioration in the economic or inflationary environment in the Americas or Europe, including the interest rate environment;
•changes or volatility in the credit or capital markets, which affect our ability to borrow money or raise capital, including as a result of the impact of the novel coronavirus ("COVID-19") pandemic;
•our ability to replace our portfolios of nonperforming loans with additional portfolios sufficient to operate efficiently and profitably;
•our ability to continue to purchase nonperforming loans at appropriate prices;
•our ability to collect sufficient amounts on our nonperforming loans to fund our operations;
•the possibility that we could recognize significant decreases in our estimate of future recoveries on nonperforming loans;
•changes in, or interpretations of, federal, state, local, or international laws, including bankruptcy and collection laws, or changes in the administrative practices of various bankruptcy courts, which could negatively affect our business or our ability to collect on nonperforming loans;
•our ability to successfully manage the challenges associated with a disease outbreak, including epidemics, pandemics or similar widespread public health concerns, including the COVID-19 pandemic;
•the impact of the COVID-19 pandemic on the markets in which we operate, including business disruptions, unemployment, economic disruption, overall market volatility and the inability or unwillingness of consumers to pay the amounts owed to us;
•our inability to successfully manage the challenges associated with a disease outbreak, including epidemics, pandemics or similar widespread public health concerns, including the COVID-19 pandemic;
•a deterioration in the economic or inflationary environment in the markets in which we operate;
•our inability to replace our portfolios of nonperforming loans with additional portfolios sufficient to operate efficiently and profitably and/or purchase nonperforming loans at appropriate prices;
•our inability to collect sufficient amounts on our nonperforming loans to fund our operations, including as a result of restrictions imposed by federal, state and international laws and regulations;
•changes in accounting standards and their interpretations;
•the recognition of significant decreases in our abilityestimate of future recoveries on nonperforming loans;
•the occurrence of goodwill impairment charges;
•loss contingency accruals that are inadequate to cover actual losses;
•our inability to manage risks associated with our international operations;
•changes in tax laws and interpretations regarding earnings of our domestic and international operations;
•the impact of the Tax Cuts and Jobs Act ("Tax Act") and/or the Coronavirus Aide, Relief and Economic Security Act including interpretations and determinations by tax authorities;
•the possibility that we could incur goodwill or other intangible asset impairment charges;
•adverse effects from the exit of the United Kingdom ("UK") from the European Union ("EU");
•our loss contingency accruals may not be adequate to cover actual losses;changes in federal, state, local or international laws or the interpretation of these laws, including tax, bankruptcy and collection laws;
•adverse outcomeschanges in pending litigation orthe administrative proceedings;
•the possibility that class action suits and other litigation could divert management's attention and increase our expenses;
•the possibility that we could incur business or technology disruptions or cyber incidents;
•disruptionspractices of business operations caused by the underperformance or failure of information technology infrastructure, networks or telephone systems;various bankruptcy courts;
•our ability to collect and enforce our nonperforming loans may be limited under federal, state, and international laws, regulations and policies;
•our abilityinability to comply with existing and new regulations of the collection industry, the failure of which could result in penalties, fines, litigation, damage to our reputation, or the suspension or termination of or required modification to our ability to conduct our business;industry;
•investigations, reviews, or enforcement actions by governmental authorities, including the Consumer Financial Protection Bureau ("CFPB"), which could result in changes to our business practices, negatively impact our portfolio acquisitions volume, make collection of account balances more difficult or expose us to the risk of fines, penalties, restitution payments, and litigation;
•the possibility that compliance with complex and evolving international and United States ("U.S.") laws and regulations that apply to our international operations could increase our cost of doing business in international jurisdictions;;
•our abilityinability to comply with data privacy regulations such as the General Data Protection Regulation ("GDPR");
•adverse outcomes in pending litigation or administrative proceedings;
•our abilityinability to retain, expand, renegotiate or replace our credit facilities and our ability to comply with the covenants under our financing arrangements;
•our abilityinability to raise the funds necessary to repurchasemanage effectively our convertible senior notescapital and liquidity needs, including as a result of changes in credit or to settle conversions in cash;
•our ability to refinance our indebtedness, including our outstanding convertible senior notes;capital markets;
•changes in interest or exchange rates, which could reduce our net income, and the possibility that future hedging strategies may not be successful;
•the possibility that the adoption of future accounting standards could negatively impact our business;rates;
•default by or failure of one or more of our counterparty financial institutions could cause us to incur significant losses;institutions;
•uncertainty about the future of the London Inter-Bank Offer Rate ("LIBOR") may adversely affect our business;Rate;
•disruptions of business operations caused by cybersecurity incidents or the underperformance or failure of information technology infrastructure, networks or communication systems; and
•the risk factors discussed herein"Risk Factors" in Item 1A of our Annual Report on Form 10-K for the year ended December 31, 2020 ("2020 Form 10-K") and in our other filings with the Securities and Exchange Commission ("SEC").Commission.
You should assume that the information appearing in this Quarterly Report is accurate only as of the date it was issued. Our business, financial condition, results of operations and prospects may have changed since that date.
You should carefully consider the factors listed above and review the following "Management's Discussion and Analysis of Financial Condition and Results of Operations," as well as the "Risk Factors" section and "Business" section of our Annual Report on Form 10-K for the year ended December 31, 2019 ("2019 Form 10-K") and the "Risk Factors" section in Part II, Item 1A of our Quarterly Report on Form 10-Q for the period ended March 31, 2020 ("2020 First Quarter Form 10-Q").
Our forward-looking statements could be wrong in light of these and other risks, uncertainties and assumptions. The future events, developments or results described in, or implied by, this Quarterly Report could turn out to be materially different. Except as required by law, we assume no obligation to publiclypublically update or revise our forward-looking statements after the date of this Quarterly Report and you should not expect us to do so.
Investors should also be aware that while we do, from time to time, communicate with securities analysts and others, we do not, by policy, selectively disclose to them any material nonpublic information or other confidential commercial information. Accordingly, investors should not assume that we agree with any statement or report issued by any analyst regardless of the content of the statement or report. We do not, by policy, confirm forecasts or projections issued by others. Thus, to the extent that reports issued by securities analysts contain any projections, forecasts or opinions, such reports are not our responsibility.
Frequently Used Terms
We may use the following terminology throughout this document:
•"Amortization rate" refers to cash collections applied to principal on finance receivables as a percentage of total cash collections.Quarterly Report:
•"Buybacks" refers to purchase price refunded by the seller due to the return of ineligible accounts.
•"Cash collections" refers to collections on our owned finance receivables portfolios.
•"Cash receipts" refers to cash collections on our owned finance receivables portfolios plus fee income.
•"Change in expected recoveries" refers to the differences of actual recoveries received when compared to expected recoveries and the net present value of changes in ERC.estimated remaining collections.
•"Core" accounts or portfolios refer to accounts or portfolios that are nonperforming loans and are not in an insolvent status upon acquisition. These accounts are aggregated separately from insolvency accounts.
•"Estimated remaining collections" or "ERC" refers to the sum of all future projected cash collections on our owned finance receivables portfolios.
•"Insolvency" accounts or portfolios refer to accounts or portfolios of receivables that are in an insolvent status when we purchase them and as such are purchased as a pool of insolvent accounts. These accounts include Individual Voluntary Arrangements ("IVAs"), Trust Deeds in the UK, Consumer Proposals in Canada and bankruptcy accounts in the U.S., Canada, Germany and the UK.
•"Negative Allowance" refers to the present value of cash flows expected to be collected on our finance receivables, carried as an asset on the balance sheet.
•"Portfolio acquisitions" refers to all portfolios added as a result of a purchase, but also includes portfolios added as a result of a business acquisition.
•"Portfolio purchases" refers to all portfolios purchased in the normal course of business and excludes those purchased viaadded as a result of business acquisitions.
•"Portfolio income" reflects revenue recorded due to the passage of time using the effective interest rate calculated based on the purchase price of portfolios and estimated remaining collections.
•"Principal amortization" refers to cash collections applied to principal on finance receivables.
•"Purchase price" refers to the cash paid to a seller to acquire nonperforming loans. Prior to the adoption of ASC 326 purchase price also included certain capitalized costs and adjustments for buybacks.
•"Purchase price multiple" refers to the total estimated collections (as defined below) on owned finance receivables portfolios divided by purchase price.
•"Recoveries" refers to cash collections plus buybacks and other adjustments.
•"Total estimated collections" or "TEC" refers to actual cash collections including cash sales, plus estimated remaining collections on our finance receivables portfolios.
All references in this Quarterly Report to "PRA Group," "our," "we," "us," "the Company" or similar terms are to PRA Group, Inc. and its subsidiaries.
Overview
We are a global financial and business services company with operations in the Americas, Europe and Australia. Our primary business is the purchase, collection and management of portfolios of nonperforming loans.
We are headquartered in Norfolk, Virginia, and as of June 30, 2020,March 31, 2021, employed 3,7933,822 full time equivalents. Our shares of common stock are traded on the NASDAQ Global Select Market under the symbol "PRAA"."PRAA."
COVID-19 Update
The COVID-19 pandemic has continued to adversely impact all countries in which we operate. As a result,We have taken steps to modify our operations to mitigate adverse effects where possible while conforming with various COVID-19 protocols within the countries in which we operate. We continue to enable employees to work remotely and follow social distancing in the workplaces that remain open. These actions have allowed us to operate inour business continuity mode globally. Our business continuity plans seek to minimize disruptions to our global operations while minimizing disruption and complying with country-specific, federal, state and local laws, regulations, guidelines and governmental actions related to the pandemic. Impacts on our business, results of operations and financial condition have included:
•a reduction in U.S. staffing in mid-March 2020, which returned to almost normal levels byAdditional information regarding the end of April and remains at these levels;
•an increase in U.S. Core cash collections, which we believe is due to our increased ability to contact customers and customers choosing to use additional discretionary funds to voluntarily resolve their debts;
•a decrease in the volume of U.S. accounts sent through the legal channel, due to our decision to temporarily pause placing accounts into a legal eligible status, along with the closure of courts in many of our European countries, which resulted in decreased legal collection costs;
•decreases in certain expenses such as communications expenses due to mailing decisions made during the COVID-19 pandemic and interruptions in postal mailings and deliveries; and
•decreased portfolio purchases due to deferrals by sellers of nonperforming loan portfolio sales.
Funds generated from operations and from cash collections on finance receivables, together with existing cash, available borrowings under our revolving credit facilities and recent modifications to the terms of those facilities, have been sufficient to finance our operations, planned capital expenditures, forward flow purchase commitments, debt maturities and additional portfolio purchases during the pandemic.
Our analysis of the current and future impact of COVID-19 on our operations is based on management’s constant monitoring of key data and information, including (1) changesbusiness can be found in laws, regulations and governmental actions, (2) trends in the macroeconomic environment, consumer behavior and key operational metrics such as cash collections and (3) conditions in the nonperforming loan market. However, we cannot predict the full extent to which COVID-19 will impact our business, results of operations and financial condition due to the numerous evolving factors associated with the pandemic. See Part I, Item 2 “Forward-Looking Statements” and Part II, Item 1A "Risk Factors" in this7 to our 2020 Form 10-Q for additional information. 10-K.
Results of Operations
The results of operations include the financial results of the Company and all of our subsidiaries. As of January 1, 2020 we adopted ASU 2016-13, "Financial Instruments - Credit Losses" ("Topic 326") ("ASU 2016-13") and ASU 2019-11, “Codification Improvements to Topic 326, Financial Instruments - Credit Losses” (“ASU 2019-11”), collectively referred to as "ASC 326", on a prospective basis. Prior period amounts were accounted for under ASC Topic 310-30 "Loans and Debt Securities Acquired with Deteriorated Credit Quality" ("ASC 310-30"). For further information refer to Note 2 to our Consolidated Financial Statements included in Part 1, Item 1 of this Quarterly Report. The following table sets forth Consolidated Income Statement amounts as a percentage of totalTotal revenues for the periods indicated (dollars in thousands):
| | | For the Three Months Ended June 30, | | | For the Six Months Ended June 30, | | | For the Three Months Ended March 31, |
| | 2020 | | | 2019 | | | 2020 | | | 2019 | | | 2021 | | 2020 |
| Revenues: | Revenues: | | | | | | | | Revenues: | | | |
| Portfolio income | Portfolio income | $ | 248,284 | | | 91.3 | % | | $ | — | | | — | % | | $ | 510,306 | | | 97.5 | % | | $ | — | | | — | % | Portfolio income | $ | 231,672 | | | 80.0 | % | | $ | 262,022 | | | 104.1 | % |
| Changes in expected recoveries | Changes in expected recoveries | 19,801 | | | 7.3 | | | — | | | — | | | 6,985 | | | 1.3 | | | — | | | — | | Changes in expected recoveries | 50,136 | | | 17.3 | | | (12,816) | | | (5.1) | |
| Income recognized on finance receivables | — | | | — | | | 249,219 | | | 98.9 | | | — | | | — | | | 488,055 | | | 98.0 | | |
| Fee income | Fee income | 2,639 | | | 1.0 | | | 2,707 | | | 1.1 | | | 4,848 | | | 0.9 | | | 9,081 | | | 1.8 | | Fee income | 2,181 | | | 0.8 | | | 2,209 | | | 0.9 | |
| Other revenue | Other revenue | 1,186 | | | 0.4 | | | 131 | | | — | | | 1,555 | | | 0.3 | | | 798 | | | 0.2 | | Other revenue | 5,480 | | | 1.9 | | | 369 | | | 0.1 | |
| Total revenues | Total revenues | 271,910 | | | 100.0 | | | 252,057 | | | 100.0 | | | 523,694 | | | 100.0 | | | 497,934 | | | 100.0 | | Total revenues | 289,469 | | | 100.0 | | | 251,784 | | | 100.0 | |
| | Net allowance charges | — | | | — | | | (1,196) | | | (0.5) | | | — | | | — | | | (7,291) | | | (1.5) | | |
| | Operating expenses: | Operating expenses: | | Operating expenses: | |
| Compensation and employee services | Compensation and employee services | 70,472 | | | 25.9 | | | 79,808 | | | 31.7 | | | 145,643 | | | 27.8 | | | 159,453 | | | 32.0 | | Compensation and employee services | 73,984 | | | 25.6 | | | 75,171 | | | 29.9 | |
| Legal collection fees | Legal collection fees | 13,742 | | | 5.1 | | | 14,297 | | | 5.7 | | | 28,314 | | | 5.4 | | | 27,356 | | | 5.5 | | Legal collection fees | 12,926 | | | 4.5 | | | 14,572 | | | 5.8 | |
| Legal collection costs | Legal collection costs | 19,507 | | | 7.2 | | | 33,121 | | | 13.1 | | | 53,954 | | | 10.3 | | | 68,350 | | | 13.7 | | Legal collection costs | 21,312 | | | 7.4 | | | 34,447 | | | 13.7 | |
| Agency fees | Agency fees | 10,343 | | | 3.8 | | | 13,013 | | | 5.2 | | | 23,719 | | | 4.5 | | | 27,045 | | | 5.4 | | Agency fees | 15,591 | | | 5.4 | | | 13,376 | | | 5.3 | |
| Outside fees and services | Outside fees and services | 18,683 | | | 6.9 | | | 16,293 | | | 6.5 | | | 38,077 | | | 7.3 | | | 31,541 | | | 6.3 | | Outside fees and services | 20,760 | | | 7.1 | | | 19,394 | | | 7.7 | |
| Communication | Communication | 8,812 | | | 3.2 | | | 10,824 | | | 4.3 | | | 22,323 | | | 4.3 | | | 24,025 | | | 4.8 | | Communication | 12,663 | | | 4.4 | | | 13,511 | | | 5.4 | |
| Rent and occupancy | Rent and occupancy | 4,471 | | | 1.6 | | | 4,491 | | | 1.8 | | | 8,955 | | | 1.7 | | | 8,854 | | | 1.8 | | Rent and occupancy | 4,480 | | | 1.5 | | | 4,484 | | | 1.8 | |
| Depreciation and amortization | Depreciation and amortization | 4,109 | | | 1.5 | | | 4,723 | | | 1.9 | | | 8,193 | | | 1.6 | | | 9,295 | | | 1.9 | | Depreciation and amortization | 3,981 | | | 1.4 | | | 4,084 | | | 1.6 | |
| Other operating expenses | Other operating expenses | 10,491 | | | 3.9 | | | 10,926 | | | 4.3 | | | 22,696 | | | 4.3 | | | 22,511 | | | 4.4 | | Other operating expenses | 13,018 | | | 4.5 | | | 12,205 | | | 4.8 | |
| | Total operating expenses | Total operating expenses | 160,630 | | | 59.1 | | | 187,496 | | | 74.4 | | | 351,874 | | | 67.2 | | | 378,430 | | | 76.0 | | Total operating expenses | 178,715 | | | 61.8 | | | 191,244 | | | 76.0 | |
| | Income from operations | Income from operations | 111,280 | | | 40.9 | | | 63,365 | | | 25.1 | | | 171,820 | | | 32.8 | | | 112,213 | | | 22.5 | | Income from operations | 110,754 | | | 38.2 | | | 60,540 | | | 24.0 | |
| Other income and (expense): | Other income and (expense): | | Other income and (expense): | |
| | Interest expense, net | Interest expense, net | (35,416) | | | (13.0) | | | (36,027) | | | (14.3) | | | (72,627) | | | (13.9) | | | (70,008) | | | (14.1) | | Interest expense, net | (31,552) | | | (10.9) | | | (37,211) | | | (14.8) | |
| Foreign exchange gain/(loss) | 683 | | | 0.3 | | | (311) | | | (0.1) | | | 2,966 | | | 0.6 | | | 5,953 | | | 1.2 | | |
| Foreign exchange (loss)/gain | | Foreign exchange (loss)/gain | (26) | | | — | | | 2,283 | | | 0.9 | |
| Other | Other | (1,582) | | | (0.6) | | | 248 | | | 0.1 | | | (1,658) | | | (0.3) | | | (104) | | | — | | Other | 26 | | | — | | | (76) | | | — | |
| Income before income taxes | Income before income taxes | 74,965 | | | 27.6 | | | 27,275 | | | 10.8 | | | 100,501 | | | 19.2 | | | 48,054 | | | 9.7 | | Income before income taxes | 79,202 | | | 27.3 | | | 25,536 | | | 10.1 | |
| Income tax expense | Income tax expense | 14,137 | | | 5.2 | | | 5,075 | | | 2.0 | | | 17,237 | | | 3.3 | | | 8,942 | | | 1.8 | | Income tax expense | 17,322 | | | 5.9 | | | 3,100 | | | 1.2 | |
| Net income | Net income | 60,828 | | | 22.4 | | | 22,200 | | | 8.8 | | | 83,264 | | | 15.9 | | | 39,112 | | | 7.9 | | Net income | 61,880 | | | 21.4 | | | 22,436 | | | 8.9 | |
| Adjustment for net income attributable to noncontrolling interests | Adjustment for net income attributable to noncontrolling interests | 2,914 | | | 1.1 | | | 3,581 | | | 1.4 | | | 6,215 | | | 1.2 | | | 5,266 | | | 1.1 | | Adjustment for net income attributable to noncontrolling interests | 3,474 | | | 1.2 | | | 3,301 | | | 1.3 | |
| Net income attributable to PRA Group, Inc. | Net income attributable to PRA Group, Inc. | $ | 57,914 | | | 21.3 | % | | $ | 18,619 | | | 7.4 | % | | $ | 77,049 | | | 14.7 | % | | $ | 33,846 | | | 6.8 | % | Net income attributable to PRA Group, Inc. | $ | 58,406 | | | 20.2 | % | | $ | 19,135 | | | 7.6 | % |
Three Months Ended June 30, 2020March 31, 2021 Compared To Three Months Ended June 30, 2019March 31, 2020
Cash Collections
Cash collections for the periods indicated were as follows for the periods indicated:(amounts in thousands):
| | | For the Three Months Ended June 30, | | | Changes | | | For the Three Months Ended March 31, | |
| (Amounts in thousands) | 2020 | | 2019 | | 2020 vs. 2019 | | |
| Americas Core | $ | 343,269 | | | $ | 294,243 | | | $ | 49,026 | | | |
| | | 2021 | | 2020 | | Change | |
| Americas and Australia Core | | Americas and Australia Core | $ | 347,638 | | | $ | 305,780 | | | $ | 41,858 | | |
| Americas Insolvency | Americas Insolvency | 38,685 | | | 49,770 | | | (11,085) | | | Americas Insolvency | 35,253 | | | 43,210 | | | (7,957) | | |
| Europe Core | Europe Core | 115,145 | | | 117,635 | | | (2,490) | | | Europe Core | 149,486 | | | 131,340 | | | 18,146 | | |
| Europe Insolvency | Europe Insolvency | 12,841 | | | 8,626 | | | 4,215 | | | Europe Insolvency | 23,510 | | | 14,243 | | | 9,267 | | |
| Total cash collections | Total cash collections | $ | 509,940 | | | $ | 470,274 | | | $ | 39,666 | | | Total cash collections | $ | 555,887 | | | $ | 494,573 | | | $ | 61,314 | | |
| Cash collections adjusted (1) | Cash collections adjusted (1) | $ | 509,940 | | | $ | 459,595 | | | $ | 50,345 | | | Cash collections adjusted (1) | $ | 555,887 | | | $ | 502,305 | | | $ | 53,582 | | |
|
(1) Cash collections adjusted refers to 20192020 cash collections remeasured using 20202021 exchange rates.
Cash collections were $509.9$555.9 million for the three months ended June 30, 2020,March 31, 2021, an increase of $39.7$61.3 million, or 8.4%12.4%, compared to $470.3$494.6 million for the three months ended June 30, 2019. The increase wasMarch 31, 2020. Cash collections increased in Americas and Australia Core largely due to our U.S. call center and other collections, including increasedhigher level of collections through our digital platform,platforms, increasing $59.4$54.3 million, or 37.0%,32.3%. This was primarily due to what we believe to be various circumstances that have provided U.S. consumers with additional discretionary funds and a willingness to voluntarily resolve their debts. TheThis increase was partiallypartly offset by an $11.1a $10.8 million, or 22.3%10.4%, decrease in cashlegal collections for Americas Insolvency, mainlydue to a lower volume of accounts in the legal channel primarily as a result of investment levels not offsettinga shift in collections from the runoff of older portfolioslegal channel to our call centers and a $6.1digital platforms. Cash collections in Americas Insolvency also decreased $8.0 million, or 18.8%18.4%, decrease in cash collections for Other Americas Core,mainly due to the strengthening of the U.S dollar and investment levels not offsetting the runoff of older portfolios. Furthermore, our U.S. legalWhile cash collections were slightly lower by $4.3in Other Americas Core decreased $1.6 million, or 4.2%4.8%, reflecting a decision we made to temporarily pause placing accounts into a legal eligible status in the U.S. as a resultprimary driver of the COVID-19 pandemic. These legal collection activities largely returned to normal operations in June.decrease was foreign exchange rates. Europe cash collections increased $27.4 million, or 18.8%, primarily reflecting the impact of 2020 purchases.
Revenues
A summary of our revenue generation during the three months ended June 30,March 31, 2021 and 2020 and 2019 is as follows (amounts in thousands):
| | | For the Three Months Ended June 30, | | | For the Three Months Ended March 31, |
| | 2020 | | 2019 | | 2021 | | 2020 | | Change |
| Portfolio income | Portfolio income | $ | 248,284 | | | $ | — | | Portfolio income | $ | 231,672 | | | $ | 262,022 | | | $ | (30,350) | |
| Changes in expected recoveries | Changes in expected recoveries | 19,801 | | | — | | Changes in expected recoveries | 50,136 | | | (12,816) | | | 62,952 | |
| | Income recognized on finance receivables | — | | | 249,219 | | |
| Fee income | Fee income | 2,639 | | | 2,707 | | Fee income | 2,181 | | | 2,209 | | | (28) | |
| Other revenue | Other revenue | 1,186 | | | 131 | | Other revenue | 5,480 | | | 369 | | | 5,111 | |
| Total revenues | Total revenues | $ | 271,910 | | | $ | 252,057 | | Total revenues | $ | 289,469 | | | $ | 251,784 | | | $ | 37,685 | |
Total revenues were $271.9Portfolio Income
Portfolio income was $231.7 million for the three months ended June 30, 2020, an increaseMarch 31, 2021, a decrease of $19.8$30.3 million, or 7.9%11.6%, compared to $252.1$262.0 million for the three months ended June 30, 2019.March 31, 2020. The increase is largelydecrease was mainly due to our assumption that the significant cash collections overperformance in 2020 was largely acceleration versus an increase in total estimated collections combined with recent purchases not offsetting runoff, primarily in Americas Insolvency and Other Americas.
Changes in Expected Recoveries
Changes in expected recoveries for the quarter, partially offsetthree months ended March 31, 2021, were a positive $50.1 million. The change was the net result of recoveries received in excess of forecast of $103.0 million from significant cash collection overperformance reduced by adjustmentsa $52.9 million negative adjustment to our estimated remaining collections tochanges in expected future recoveries. The changes in expected future recoveries reflect our assumption that the majority of the current quarter overperformance was primarily due to acceleration in the timing of cash collections rather than an increase to total expected collections. Additionally, we madecollections resulting in a present value adjustment. This compares to a negative $12.8 million for the three months ended March 31, 2020. The change was the net result of recoveries in excess of forecast adjustments deemed appropriate given the current environment in which we are operating.
Net Allowance Charges
In 2019, under ASC 310-30, net allowance charges were recorded for significant decreases in expected cash flows orof $7.8 million reduced by a change in timing of cash flows which would otherwise require a reduction in the stated yield on a pool of accounts. Effective January 1, 2020, under ASC 326, changes$20.6 million negative adjustment to expected cash flows are recorded in changes in expected future recoveries within revenues.due to an expected delay in cash collections from the impact of COVID-19.
Other Revenue
Other revenue was $5.5 million for the three months ended March 31, 2021, an increase of $5.1 million compared to $0.4 million for the three months ended March 31, 2020 reflecting a gain on sale from certain other assets.
Operating Expenses
Total operating expenses were $160.6$178.7 million for the three months ended June 30, 2020,March 31, 2021, a decrease of $26.9$12.5 million, or 14.3%6.5%, compared to $187.5$191.2 million for the three months ended June 30, 2019.
Compensation and Employee Services
Compensation and employee services expenses were $70.5$74.0 million for the three months ended June 30, 2020,March 31, 2021, a decrease of $9.3$1.2 million, or 11.7%1.6%, compared to $79.8$75.2 million for the three months ended June 30, 2019.March 31, 2020. The slight decrease in compensation expense was primarily attributable to a reduction in the U.S. call center workforce due to efficiencies realized through technology, training and data and analytics.mostly offset by higher headcount in Europe. Total full-time equivalents decreased to 3,7933,822 as of June 30, 2020,March 31, 2021, from 4,8634,014 as of June 30, 2019.March 31, 2020.
Legal Collection Fees
Legal collection fees represent contingent fees incurred for the cash collections generated by our independent third-party attorney network. Legal collection fees were $13.7$12.9 million for the three months ended June 30, 2020,March 31, 2021, a decrease of $0.6$1.7 million, or 4.2%11.6%, compared to $14.3$14.6 million for the three months ended June 30, 2019 primarilyMarch 31, 2020. The decrease was due to a slight decrease inlower external legal cash collections in the U.S.
Legal Collection Costs
Legal collection costs primarily consist of costs paid to courts where a lawsuit is filed for the purpose of attempting to collect on an account. Legal collection costs were $19.5$21.3 million for the three months ended June 30, 2020,March 31, 2021, a decrease of $13.6$13.1 million, or 41.1%38.1%, compared to $33.1$34.4 million for the three months ended June 30, 2019.March 31, 2020. The decrease was primarily reflects a decision we madedue to temporarily pause placinglower levels of accounts into a legal eligible statusplaced in the U.S., along withlegal channel in the closureU.S. primarily reflecting a shift in collections from the legal channel to our call centers and digital platforms partially offset by higher levels of courtsaccounts placed in many of our European countries, as a result of the COVID-19 pandemic. These legal collection activities largely returned to normal operationschannel in June.Europe.
Agency Fees
Agency fees primarily represent third-party collection fees. Agency fees were $10.3$15.6 million for the three months ended June 30, 2020, a decreaseMarch 31, 2021, an increase of $2.7$2.2 million, or 20.8%16.4%, compared to $13.0$13.4 million for the three months ended June 30, 2019. The decrease was due to lower cash collectionsMarch 31, 2020 primarily reflecting an increase in areasagency fees primarily outside of the U.S. where we utilize third party collection agencies.
Outside Fees and Services
Outside fees and services expenses were $18.7$20.8 million for the three months ended June 30, 2020,March 31, 2021, an increase of $2.4$1.4 million, or 14.7%7.2%, compared to $16.3$19.4 million for the three months ended June 30, 2019. The increase wasMarch 31, 2020 primarily due to higher corporate legal expenses and higher fees associated with processingrelated to an increased number of debit card transactions duetransactions.
Interest Expense, Net
Interest expense, net was $31.6 million during the three months ended March 31, 2021, a decrease of $5.6 million, or 15.1%, compared to the increase in cash collections.
Communication
Communication expense primarily represents postage and telephone related expenses incurred as a result of our collection efforts. Communication expenses were $8.8$37.2 million for the three months ended
June 30,March 31, 2020
a decreaseprimarily reflecting the 2021 change in accounting related to our convertible notes (seeNote 2 to our Consolidated Financial Statements included in Part I, Item 1 of $2.0 million, or 18.5%, compared to $10.8 millionthis Quarterly Report for the three months ended June 30, 2019. The decrease primarily reflects lower postage costs due to mailing decisions made during the COVID-19 pandemic.Interest Expense, Net
Interest expense, net was $35.4 million during the three months ended June 30, 2020, a decrease of $0.6 million, or 1.7%, compared to $36.0 million for the three months ended June 30, 2019. The decrease was primarily related tofurther information) and lower levels of average outstanding borrowings coupled with lower average interest rates.on our debt obligations.
Interest expense, net consisted of the following for the three months ended June 30,March 31, 2021 and 2020 and 2019 (amounts in thousands):
| | | For the Three Months Ended June 30, | | | For the Three Months Ended March 31, |
| | 2020 | | 2019 | | Change | | 2021 | | 2020 | | Change |
| Interest on debt obligations and unused line fees | Interest on debt obligations and unused line fees | $ | 24,565 | | | $ | 25,645 | | | $ | (1,080) | | Interest on debt obligations and unused line fees | $ | 20,910 | | | $ | 26,498 | | | $ | (5,588) | |
| Interest on senior notes | | Interest on senior notes | 5,531 | | | — | | | 5,531 | |
| Coupon interest on convertible debt | Coupon interest on convertible debt | 5,175 | | | 5,175 | | | — | | Coupon interest on convertible debt | 3,019 | | | 5,175 | | | (2,156) | |
| Amortization of convertible debt discount | Amortization of convertible debt discount | 3,247 | | | 3,071 | | | 176 | | Amortization of convertible debt discount | — | | | 3,217 | | | (3,217) | |
| Amortization of loan fees and other loan costs | Amortization of loan fees and other loan costs | 2,743 | | | 2,655 | | | 88 | | Amortization of loan fees and other loan costs | 2,256 | | | 2,640 | | | (384) | |
| | Interest income | Interest income | (314) | | | (519) | | | 205 | | Interest income | (164) | | | (319) | | | 155 | |
| Interest expense, net | Interest expense, net | $ | 35,416 | | | $ | 36,027 | | | $ | (611) | | Interest expense, net | $ | 31,552 | | | $ | 37,211 | | | $ | (5,659) | |
Net Foreign Currency Transaction GainsExchange (Loss)/Gain
Foreign currency transaction losses were near zero for the three months ended March 31, 2021, compared to foreign currency gains were $0.7of $2.3 million for the three months ended June 30, 2020, compared to foreign currency transaction losses of $0.3 million for the three months ended June 30, 2019.March 31, 2020. In any given period, we may incur foreign currency transaction gains or losses from transactions in currencies other than the functional currency.
Income Tax Expense
Income tax expense was $14.1$17.3 million for the three months ended June 30, 2020,March 31, 2021, an increase of $9.0$14.2 million, or 176.5%458.1%, compared to $5.1$3.1 million for the three months ended June 30, 2019.March 31, 2020. The increase was primarily due to higher income before taxes, which increased $47.7$53.7 million, or 174.7%.210.6%, and the mix of earnings between jurisdictions. During the three months ended June 30, 2020,March 31, 2021, our effective tax rate was 18.9%21.9%, compared to 18.6%12.1% for the three months ended June 30, 2019.
Six Months Ended June 30, 2020 Compared To Six Months Ended June 30, 2019
Cash Collections
Cash collections were as follows for the periods indicated:
| | | | | | | | | | | | | | | | | | | |
| For the Six Months Ended June 30, | | | | Change | | |
| (Amounts in thousands) | 2020 | | 2019 | | 2020 vs. 2019 | | |
| Americas-Core | $ | 649,049 | | | $ | 584,966 | | | $ | 64,083 | | | |
| Americas-Insolvency | 81,895 | | | 94,383 | | | (12,488) | | | |
| Europe-Core | 246,485 | | | 234,493 | | | 11,992 | | | |
| Europe-Insolvency | 27,084 | | | 17,603 | | | 9,481 | | | |
| Total cash collections | $ | 1,004,513 | | | $ | 931,445 | | | $ | 73,068 | | | |
| | | | | | | |
Cash collections adjusted (1) | $ | 1,004,513 | | | $ | 914,201 | | | $ | 90,312 | | | |
| | | | | | | |
| | | | | | | |
| | | | | | | |
(1) Cash collections adjusted refers to 2019 cash collections remeasured using 2020 exchange rates.
Cash collections were $1,004.5 million for the six months ended June 30, 2020, an increase of $73.1 million, or 7.8%, compared to $931.4 million for the six months ended June 30, 2019.March 31, 2020. The increase was largely due to our U.S. call center and other collections, including increased collections through our digital platform, increasing $57.8 million or 17.5%, primarily due to what we believe to be various circumstances that have provided U.S. consumers with additional discretionary funds and a willingness to voluntarily resolve their debts. Additionally, Europe cash collections increased $21.5 million, or 8.5%, reflecting higher 2019 purchases. Furthermore, our U.S. legal collections increased $5.6 million, or 2.8%, mainly due to a higher number of accounts placed in the legal channel in 2019 partially offset by, a decision we made to temporarily pause placing accounts into a legal eligible status in the U.S. as a result of the COVID-19 pandemic. These legal collection activities largely returned to normal operations in June. These increases were partially offset by a decline of $12.5 million, or 13.2%, in Americas Insolvency cash collections mainly reflectinginvestment levels not offsetting the runoff of older portfolios.
Revenues
A summary of our revenue generation during the six months ended June 30, 2020 and 2019 is as follows (amounts in thousands):
| | | | | | | | | | | |
| For the Six Months Ended June 30, | | |
| 2020 | | 2019 |
| Portfolio income | $ | 510,306 | | | $ | — | |
| Changes in expected recoveries | 6,985 | | | — | |
| | | |
| | | |
| Income recognized on finance receivables | — | | | 488,055 | |
| Fee income | 4,848 | | | 9,081 | |
| Other revenue | 1,555 | | | 798 | |
| Total revenues | $ | 523,694 | | | $ | 497,934 | |
Total revenues were $523.7 million for the six months ended June 30, 2020, an increase of $25.8 million, or 5.2%, compared to $497.9 million for the six months ended June 30, 2019. The increase was driven primarily by a record level of portfolio purchases in 2019.
Net Allowance Charges
In 2019, under ASC 310-30, net allowance charges were recorded for significant decreases in expected cash flows or a change in timing of cash flows which would otherwise require a reduction in the stated yield on a pool of accounts. Effective January 1, 2020, under ASC 326, changes to expected cash flows are recorded in changes in expected recoveries within revenues.
Operating Expenses
Operating expenses were $351.9 million for the six months ended June 30, 2020, a decrease of $26.5 million, or 7.0%, compared to $378.4 million for the six months ended June 30, 2019.
Compensation and Employee Services
Compensation and employee services expenses were $145.6 million for the six months ended June 30, 2020, a decrease of $13.9 million, or 8.7%, compared to $159.5 million for the six months ended June 30, 2019. The decrease in compensation expense was primarily attributable to a reduction in U.S. call center workforce due to efficiencies realized through technology, training and data and analytics. Total full-time equivalents decreased to 3,793 as of June 30, 2020, compared to 4,863 as of June 30, 2019.
Legal Collection Fees
Legal collection fees were $28.3 million for the six months ended June 30, 2020, an increase of $0.9 million, or 3.3%, compared to $27.4 million for the six months ended June 30, 2019. The increaserate was primarily due to an increase in external legal cash collectionsestimated provision to return adjustment recorded in the U.S. during the first quarter.
Legal Collection Costs
Legal collection costs were $54.0 million for the six months ended June 30, 2020,prior year and a decreasechange in mix of $14.4 million, or 21.1%, compared to $68.4 million for the six months ended June 30, 2019. The decrease primarily reflects a decision we made to temporarily pause placing accounts into a legal eligible status in the U.S., along with the closureincome between countries of courts in many of our European countries, as a result of the COVID-19 pandemic. These legal collection activities largely returned to normal operations in June.
Agency Fees
Agency fees were $23.7 million for the six months ended June 30, 2020, a decrease of $3.3 million, or 12.2%, compared to $27.0 million for the six months ended June 30, 2019. The decrease was primarily due to lower cash collections in areas outside the U.S. where we utilize third party collection agencies.
Outside Fees and Services
Outside fees and services expenses were $38.1 million for the six months ended June 30, 2020, an increase of $6.6 million, or 21.0%, compared to $31.5 million for the six months ended June 30, 2019. The increase was primarily the result of higher corporate legal expenses and higher fees associated with processing an increased number of debit card transactions due to the increase in cash collections.
Interest Expense, Net
Interest expense, net was $72.6 million for the six months ended June 30, 2020, an increase of $2.6 million, or 3.7%, compared to $70.0 million for the six months ended June 30, 2019. The increase was primarily due to higher levels of outstanding borrowings partially offset by lower average interest rates.
Interest expense, net consisted of the following for the six months ended June 30, 2020 and 2019 (amounts in thousands):
| | | | | | | | | | | | | | | | | |
| For the Six Months Ended June 30, | | | | |
| 2020 | | 2019 | | Change |
| Interest on debt obligations and unused line fees | $ | 51,063 | | | $ | 49,391 | | | $ | 1,672 | |
| Coupon interest on convertible debt | 10,350 | | | 10,350 | | | — | |
| Amortization of convertible debt discount | 6,464 | | | 6,113 | | | 351 | |
| Amortization of loan fees and other loan costs | 5,382 | | | 5,291 | | | 91 | |
| | | | | |
| Interest income | (632) | | | (1,137) | | | 505 | |
| Interest expense, net | $ | 72,627 | | | $ | 70,008 | | | $ | 2,619 | |
Net Foreign Currency Transaction Gains
Foreign currency transaction gains were $3.0 million for the six months ended June 30, 2020, compared to $6.0 million for the six months ended June 30, 2019. The decrease was primarily related to lower foreign currency gains in Europe and slightly lower gains on U.S. dollar linked investments held in Brazil during the first quarter.operation.
Income Tax Expense
Income tax expense was $17.2 million for the six months ended June 30 2020, an increase of $8.3 million, or 93.3%, compared to $8.9 million for the six months ended June 30, 2019. The increase was primarily due to higher income before income taxes which increased $52.4 million or 108.9%. The increase was partially offset by estimated return to provision adjustments during the first quarter. During the six months ended June 30, 2020, our effective tax rate was 17.2%, compared to 18.6% for the six months ended June 30, 2019. The decrease was due to the mix of international earnings between jurisdictions.
Supplemental Performance Data
Finance Receivables Portfolio Performance
The following tables show certain data related to our finance receivables portfolios. Certain adjustments, as noted inWe purchase nonperforming loans from a variety of credit originators and segregate them into two main portfolio segments: Core or Insolvency, based on the footnotes to these tables, have been made to reducestatus of the impact of foreign currency fluctuations on ERC and purchase price multiples.
account upon acquisition. In addition, the accounts are further segregated into geographical regions based upon where the account was purchased. The accounts represented in the Insolvency tables below are those portfolios of accounts that were in an insolvency status at the time of purchase. This contrasts with accounts in our Core portfolios that file for bankruptcy/insolvency protection after we purchase them, which continue to be tracked in their corresponding Core portfolio. Core customers sometimes file for bankruptcy/insolvency protection subsequent to our purchase of the related Core portfolio. When this occurs, we adjust our collection practices to comply with bankruptcy/insolvency rules and procedures; however, for accounting purposes, these accounts remain in the original Core portfolio.pool. Insolvency accounts may be dismissed voluntarily or involuntarily subsequent to our purchase of the Insolvency portfolio. Dismissal occurs when the terms of the bankruptcy are not met by the petitioner. When this occurs, we are typically free to pursue collection outside of bankruptcy procedures; however, for accounting purposes, these accounts remain in the original Insolvency pool.
Purchase price multiples can vary over time due to a variety of factors, including pricing competition, supply levels, age of the receivables acquired, and changes in our operational efficiency. For example, increased pricing competition during the 2005 to 2008 period negatively impacted purchase price multiples of our Core portfolio compared to prior years. Conversely, during the 2009 to 2011 period, additional supply occurred as a result of the economic downturn. This created unique and advantageous purchasing opportunities, particularly within the Insolvency market, relative to the prior four years. Purchase price multiples can also vary among types of finance receivables. For example, we generally incur lower collection costs on our Insolvency portfolio compared with our Core portfolio. This allows us, in general, to pay more for an Insolvency portfolio and experience lower purchase price multiples, while generating similar net income margins when compared with a Core portfolio.
When competition increases and/or supply decreases, pricing often becomes negatively impacted relative to expected collections, and yields tend to trend lower. The opposite tends to occur when competition decreases and/or supply increases.
Within a given portfolio type, to the extent that lower purchase price multiples are the result of more competitive pricing and lower net yields, this will generally lead to lower profitability. As portfolio pricing becomes more favorable on a relative basis, our profitability will tend to increase. Profitability within given Core portfolio types may also be impacted by the age and quality of the receivables, which impact the cost to collect those accounts. Fresher accounts, for example, typically carry lower associated collection expenses, while older accounts and lower balance accounts typically carry higher costs and, as a result, require higher purchase price multiples to achieve the same net profitability as fresher paper.
Revenue recognition under Accounting Standards Codification ("ASC") Topic 326 "Financial Instruments-Credit Losses" ("ASC 310-10 and ASC 326326") is driven by estimates of the amount and timing of collections. We record new portfolio acquisitions at the purchase price which reflects the amount we expect to collect discounted at an effective interest rate. During the year of acquisition, the annual pool is aggregated and the blended effective interest rate will change to reflect new buying and new cash flow estimates until the end of the year. At that time, the effective interest rate is fixed at the amount we expect to collect discounted at the rate to equate purchase price to the recovery estimate. During the first year of purchase, we typically do not allow purchase price multiples to expand. Subsequent to the initial year, as we gain collection experience and confidence with a pool of accounts, we regularly update ERC. As a result, our estimate of total collections has often increased as pools have aged. These processes have tended to cause the ratio of ERC to purchase price for any given year of buying to gradually increase over time. Thus, all factors being equal in terms of pricing, one would typically tend to see a higher collection to purchase price ratio from a pool of accounts that was six years from acquisition than a pool that was just two years from acquisition.
The numbers presented in the following tables represent gross cash collections and do not reflect any costs to collect; therefore, they may not represent relative profitability. Due to all the factors described above, readers should be cautious when making comparisons of purchase price multiples among periods and between types of receivables.
| Purchase Price Multiples as of June 30, 2020 Amounts in thousands | | |
Purchase Price Multiples as of March 31, 2021 Amounts in thousands | | Purchase Price Multiples as of March 31, 2021 Amounts in thousands |
| Purchase Period | Purchase Period | Purchase Price (1)(2) | | ERC-Historical Period Exchange Rates (3) | Total Estimated Collections (4) | ERC-Current Period Exchange Rates (5) | Current Estimated Purchase Price Multiple | Original Estimated Purchase Price Multiple(6) | Purchase Period | Purchase Price (1)(2) | | Total Estimated Collections (3) | Estimated Remaining Collections (4) | Current Purchase Price Multiple | Original Estimated Purchase Price Multiple(5) |
| Americas Core | | | | |
| 1996-2009 | $ | 930,026 | | | $ | 25,275 | | $ | 2,876,410 | | $ | 25,275 | | 309 | % | 238 | % | |
| 2010 | 148,193 | | | 16,361 | | 527,054 | | 16,361 | | 356 | % | 247 | % | |
| Americas and Australia Core | | Americas and Australia Core | | |
| 1996-2010 | | 1996-2010 | $ | 1,078,219 | | | $ | 3,397,952 | | $ | 24,585 | | 315% | 240% |
| 2011 | 2011 | 209,602 | | | 29,000 | | 725,887 | | 29,000 | | 346 | % | 245 | % | 2011 | 209,602 | | | 719,618 | | 15,897 | | 343% | 245% |
| 2012 | 2012 | 254,076 | | | 35,475 | | 661,919 | | 35,475 | | 261 | % | 226 | % | 2012 | 254,076 | | | 652,293 | | 18,061 | | 257% | 226% |
| 2013 | 2013 | 390,826 | | | 62,664 | | 912,274 | | 62,664 | | 233 | % | 211 | % | 2013 | 390,826 | | | 894,640 | | 30,051 | | 229% | 211% |
| 2014 | 2014 | 404,117 | | | 99,011 | | 891,394 | | 96,700 | | 221 | % | 204 | % | 2014 | 404,117 | | | 859,775 | | 45,345 | | 213% | 204% |
| 2015 | 2015 | 443,114 | | | 163,023 | | 933,558 | | 162,489 | | 211 | % | 205 | % | 2015 | 443,114 | | | 913,857 | | 106,551 | | 206% | 205% |
| 2016 | 2016 | 455,767 | | | 301,974 | | 1,099,686 | | 287,328 | | 241 | % | 201 | % | 2016 | 455,767 | | | 1,098,295 | | 207,608 | | 241% | 201% |
| 2017 | 2017 | 532,851 | | | 453,291 | | 1,207,541 | | 448,520 | | 227 | % | 193 | % | 2017 | 532,851 | | | 1,211,584 | | 325,675 | | 227% | 193% |
| 2018 | 2018 | 653,975 | | | 670,175 | | 1,340,743 | | 657,985 | | 205 | % | 202 | % | 2018 | 653,975 | | | 1,368,879 | | 447,682 | | 209% | 202% |
| 2019 | 2019 | 581,476 | | | 898,263 | | 1,222,926 | | 868,031 | | 210 | % | 206 | % | 2019 | 581,476 | | | 1,239,777 | | 622,713 | | 213% | 206% |
| 2020 | 2020 | 283,041 | | | 543,573 | | 580,673 | | 543,573 | | 205 | % | 205 | % | 2020 | 435,668 | | | 931,493 | | 717,342 | | 214% | 213% |
| 2021 | | 2021 | 88,822 | | | 188,644 | | 184,196 | | 212% |
| Subtotal | Subtotal | 5,287,064 | | | 3,298,085 | | 12,980,065 | | 3,233,401 | | | Subtotal | 5,528,513 | | | 13,476,807 | | 2,745,706 | | |
| Americas Insolvency | Americas Insolvency | | | | Americas Insolvency | | | |
| 1996-2009 | 397,453 | | | 681 | | 835,919 | | 681 | | 210 | % | 178 | % | |
| 2010 | 208,942 | | | 868 | | 546,829 | | 868 | | 262 | % | 184 | % | |
| 1996-2010 | | 1996-2010 | 606,395 | | | 1,382,677 | | 920 | | 228% | 180% |
| 2011 | 2011 | 180,432 | | | 743 | | 370,148 | | 743 | | 205 | % | 155 | % | 2011 | 180,432 | | | 370,183 | | 493 | | 205% | 155% |
| 2012 | 2012 | 251,395 | | | 495 | | 392,466 | | 495 | | 156 | % | 136 | % | 2012 | 251,395 | | | 392,723 | | 184 | | 156% | 136% |
| 2013 | 2013 | 227,834 | | | 1,380 | | 354,901 | | 1,380 | | 156 | % | 133 | % | 2013 | 227,834 | | | 354,943 | | 651 | | 156% | 133% |
| 2014 | 2014 | 148,420 | | | 2,088 | | 217,662 | | 2,074 | | 147 | % | 124 | % | 2014 | 148,420 | | | 218,432 | | 1,695 | | 147% | 124% |
| 2015 | 2015 | 63,170 | | | 4,344 | | 87,824 | | 4,344 | | 139 | % | 125 | % | 2015 | 63,170 | | | 87,087 | | 876 | | 138% | 125% |
| 2016 | 2016 | 91,442 | | | 14,160 | | 115,267 | | 14,146 | | 126 | % | 123 | % | 2016 | 91,442 | | | 117,159 | | 6,736 | | 128% | 123% |
| 2017 | 2017 | 275,257 | | | 86,263 | | 345,821 | | 86,263 | | 126 | % | 125 | % | 2017 | 275,257 | | | 349,209 | | 51,318 | | 127% | 125% |
| 2018 | 2018 | 97,879 | | | 81,259 | | 130,790 | | 81,259 | | 134 | % | 127 | % | 2018 | 97,879 | | | 131,461 | | 58,999 | | 134% | 127% |
| 2019 | 2019 | 123,077 | | | 132,192 | | 160,420 | | 132,061 | | 130 | % | 128 | % | 2019 | 123,077 | | | 158,692 | | 105,361 | | 129% | 128% |
| 2020 | 2020 | 35,298 | | | 44,941 | | 47,686 | | 44,941 | | 135 | % | 135 | % | 2020 | 62,130 | | | 84,972 | | 75,489 | | 137% | 136% |
| 2021 | | 2021 | 9,486 | | | 13,185 | | 13,168 | | 139% |
| Subtotal | Subtotal | 2,100,599 | | | 369,414 | | 3,605,733 | | 369,255 | | | Subtotal | 2,136,917 | | | 3,660,723 | | 315,890 | | |
| Total Americas | 7,387,663 | | | 3,667,499 | | 16,585,798 | | 3,602,656 | | | |
| Total Americas and Australia | | Total Americas and Australia | 7,665,430 | | | 17,137,530 | | 3,061,596 | | |
| Europe Core | Europe Core | | | | | Europe Core | | | | |
| 2012 | 2012 | 20,409 | | | 292 | | 40,720 | | 221 | | 200 | % | 187 | % | 2012 | 20,409 | | | 41,543 | | — | | 204% | 187% |
| 2013 | 2013 | 20,334 | | | 148 | | 25,132 | | 110 | | 124 | % | 119 | % | 2013 | 20,334 | | | 25,653 | | — | | 126% | 119% |
| 2014 | 2014 | 773,811 | | | 731,226 | | 2,215,272 | | 632,283 | | 286 | % | 208 | % | 2014 | 773,811 | | | 2,240,653 | | 586,113 | | 290% | 208% |
| 2015 | 2015 | 411,340 | | | 308,026 | | 733,076 | | 273,940 | | 178 | % | 160 | % | 2015 | 411,340 | | | 725,713 | | 250,732 | | 176% | 160% |
| 2016 | 2016 | 333,090 | | | 298,696 | | 556,757 | | 290,948 | | 167 | % | 167 | % | 2016 | 333,090 | | | 562,194 | | 285,405 | | 169% | 167% |
| 2017 | 2017 | 252,174 | | | 218,286 | | 359,556 | | 197,823 | | 143 | % | 144 | % | 2017 | 252,174 | | | 354,024 | | 184,108 | | 140% | 144% |
| 2018 | 2018 | 341,775 | | | 374,650 | | 524,165 | | 361,620 | | 153 | % | 148 | % | 2018 | 341,775 | | | 529,154 | | 346,370 | | 155% | 148% |
| 2019 | 2019 | 518,610 | | | 668,732 | | 782,184 | | 637,980 | | 151 | % | 152 | % | 2019 | 518,610 | | | 776,604 | | 587,133 | | 150% | 152% |
| 2020 | 2020 | 94,763 | | | 165,081 | | 172,597 | | 165,081 | | 182 | % | 182 | % | 2020 | 324,119 | | | 557,506 | | 491,301 | | 172% |
| 2021 | | 2021 | 43,635 | | | 77,780 | | 76,397 | | 178% |
| Subtotal | Subtotal | 2,766,306 | | | 2,765,137 | | 5,409,459 | | 2,560,006 | | | Subtotal | 3,039,297 | | | 5,890,824 | | 2,807,559 | | |
| Europe Insolvency | Europe Insolvency | | | | Europe Insolvency | | | |
| 2014 | 2014 | 10,876 | | | 573 | | 18,136 | | 490 | | 167 | % | 129 | % | 2014 | 10,876 | | | 18,228 | | 130 | | 168% | 129% |
| 2015 | 2015 | 18,973 | | | 4,220 | | 29,099 | | 3,534 | | 153 | % | 139 | % | 2015 | 18,973 | | | 29,018 | | 1,997 | | 153% | 139% |
| 2016 | 2016 | 39,338 | | | 12,951 | | 56,808 | | 13,132 | | 144 | % | 130 | % | 2016 | 39,338 | | | 56,926 | | 8,784 | | 145% | 130% |
| 2017 | 2017 | 39,235 | | | 24,680 | | 48,839 | | 22,626 | | 124 | % | 128 | % | 2017 | 39,235 | | | 49,255 | | 17,707 | | 126% | 128% |
| 2018 | 2018 | 44,908 | | | 41,089 | | 55,096 | | 39,915 | | 123 | % | 123 | % | 2018 | 44,908 | | | 52,080 | | 32,060 | | 116% | 123% |
| 2019 | 2019 | 77,218 | | | 85,331 | | 101,282 | | 79,841 | | 131 | % | 130 | % | 2019 | 77,218 | | | 101,866 | | 72,242 | | 132% | 130% |
| 2020 | 2020 | 23,017 | | | 29,757 | | 30,776 | | 29,757 | | 134 | % | 134 | % | 2020 | 105,440 | | | 135,896 | | 121,891 | | 129% |
| 2021 | | 2021 | 16,621 | | | 20,786 | | 20,151 | | 125% |
| Subtotal | Subtotal | 253,565 | | | 198,601 | | 340,036 | | 189,295 | | | Subtotal | 352,609 | | | 464,055 | | 274,962 | | |
| Total Europe | Total Europe | 3,019,871 | | | 2,963,738 | | 5,749,495 | | 2,749,301 | | | Total Europe | 3,391,906 | | | 6,354,879 | | 3,082,521 | | |
| Total PRA Group | Total PRA Group | $ | 10,407,534 | | | $ | 6,631,237 | | $ | 22,335,293 | | $ | 6,351,957 | | | Total PRA Group | $ | 11,057,336 | | | $ | 23,492,409 | | $ | 6,144,117 | | |
(1)Includes the acquisition date finance receivables portfolios that were acquired through our business acquisitions.
(2)For our non-USnon-U.S. amounts, purchase price is presented at the exchange rate at the end of the year in which the poolportfolio was purchased. In addition, any purchase price adjustments that occur throughout the life of the poolportfolio are presented at the year-end exchange rate for the respective year of purchase.
(3)For our non-USnon-U.S. amounts, ERC-Historical Period Exchange RatesTEC is presented at the year-end exchange rate for the respective year of purchase.
(4)For our non-USnon-U.S. amounts, TECERC is presented at the year-end exchange rate for the respective year of purchase.
(5)For our non-U.S. amounts, ERC-Current Period Exchange Rates is presented at the June 30, 2020March 31, 2021 exchange rate.
(6)(5)The Original Estimated Purchase Price Multiple represents the purchase price multiple at the end of the year of acquisition.
| | | | | | | | | | | | | | | | | |
Portfolio Financial Information
Year-to-date as of June 30, 2020
Amounts in thousands
| | | | | |
Purchase Period | Cash
Collections (1)
| Portfolio Income (1)
| Changes in Expected Recoveries (1)
| Total Portfolio Revenue (1)(2)
| Net Finance Receivables as of June 30, 2020 (3)
|
Americas Core | | | | | |
1996-2009 | $ | 7,348 | | $ | 5,560 | | $ | (1,406) | | $ | 4,154 | | $ | 6,071 | |
2010 | 3,678 | | 3,536 | | (857) | | 2,679 | | 2,486 | |
2011 | 6,281 | | 5,941 | | (2,248) | | 3,693 | | 5,117 | |
2012 | 6,802 | | 6,093 | | (4,225) | | 1,868 | | 11,070 | |
2013 | 13,149 | | 9,990 | | (8,009) | | 1,981 | | 22,418 | |
2014 | 18,121 | | 14,251 | | (15,672) | | (1,421) | | 35,200 | |
2015 | 32,948 | | 19,999 | | (13,822) | | 6,177 | | 66,386 | |
2016 | 57,081 | | 32,839 | | (755) | | 32,084 | | 113,660 | |
2017 | 108,504 | | 50,175 | | 17,559 | | 67,734 | | 200,463 | |
2018 | 183,021 | | 76,976 | | 6,452 | | 83,428 | | 356,085 | |
2019 | 175,029 | | 95,119 | | 14,877 | | 109,996 | | 448,861 | |
2020 | 37,087 | | 21,374 | | 10,312 | | 31,686 | | 277,335 | |
Subtotal | 649,049 | | 341,853 | | 2,206 | | 344,059 | | 1,545,152 | |
Americas Insolvency | | | | | |
1996-2009 | 197 | | 235 | | (38) | | 197 | | — | |
2010 | 269 | | 312 | | (43) | | 269 | | — | |
2011 | 275 | | 229 | | 46 | | 275 | | — | |
2012 | 546 | | 458 | | 174 | | 632 | | — | |
2013 | 742 | | 763 | | (20) | | 743 | | — | |
2014 | 1,378 | | 1,789 | | (896) | | 893 | | 262 | |
2015 | 5,624 | | 2,819 | | (219) | | 2,600 | | 2,755 | |
2016 | 7,709 | | 2,060 | | (616) | | 1,444 | | 11,164 | |
2017 | 32,245 | | 9,047 | | (2,692) | | 6,355 | | 69,529 | |
2018 | 15,394 | | 4,655 | | 3,010 | | 7,665 | | 66,722 | |
2019 | 14,770 | | 5,870 | | 2,790 | | 8,660 | | 108,218 | |
2020 | 2,746 | | 1,098 | | (264) | | 834 | | 33,190 | |
Subtotal | 81,895 | | 29,335 | | 1,232 | | 30,567 | | 291,840 | |
Total Americas | 730,944 | | 371,188 | | 3,438 | | 374,626 | | 1,836,992 | |
Europe Core | | | | | |
2012 | 591 | | 454 | | 137 | | 591 | | — | |
2013 | 320 | | 216 | | 104 | | 320 | | — | |
2014 | 72,661 | | 54,323 | | 2,336 | | 56,659 | | 166,870 | |
2015 | 26,772 | | 15,775 | | (213) | | 15,562 | | 142,997 | |
2016 | 23,270 | | 13,529 | | (1,336) | | 12,193 | | 167,532 | |
2017 | 17,870 | | 6,932 | | (1,285) | | 5,647 | | 136,984 | |
2018 | 35,776 | | 13,293 | | 3,562 | | 16,855 | | 234,775 | |
2019 | 61,779 | | 22,118 | | (2,085) | | 20,033 | | 422,528 | |
2020 | 7,446 | | 2,966 | | 1,348 | | 4,314 | | 91,298 | |
Subtotal | 246,485 | | 129,606 | | 2,568 | | 132,174 | | 1,362,984 | |
Europe Insolvency | | | | | |
2014 | 410 | | 320 | | (17) | | 303 | | 192 | |
2015 | 1,603 | | 769 | | 93 | | 862 | | 2,154 | |
2016 | 4,064 | | 1,700 | | (241) | | 1,459 | | 9,262 | |
2017 | 4,747 | | 1,054 | | 191 | | 1,245 | | 19,580 | |
2018 | 4,845 | | 1,521 | | (237) | | 1,284 | | 33,977 | |
2019 | 10,386 | | 3,429 | | 992 | | 4,421 | | 63,555 | |
2020 | 1,029 | | 719 | | 198 | | 917 | | 22,836 | |
Subtotal | 27,084 | | 9,512 | | 979 | | 10,491 | | 151,556 | |
Total Europe | 273,569 | | 139,118 | | 3,547 | | 142,665 | | 1,514,540 | |
Total PRA Group | $ | 1,004,513 | | $ | 510,306 | | $ | 6,985 | | $ | 517,291 | | $ | 3,351,532 | |
| | | | | | | | | | | | | | | | | |
Portfolio Financial Information Year-to-date as of March 31, 2021 Amounts in thousands |
| Purchase Period | Cash
Collections (1) | Portfolio Income (1) | Changes in Expected Recoveries (1) | Total Portfolio Revenue (1)(2) | Net Finance Receivables as of March 31, 2021 (3) |
| Americas and Australia Core | | | | | |
| 1996-2010 | $ | 3,726 | | $ | 2,319 | | $ | 447 | | $ | 2,766 | | $ | 5,178 | |
| 2011 | 2,259 | | 1,405 | | 309 | | 1,714 | | 2,596 | |
| 2012 | 2,786 | | 1,286 | | 375 | | 1,661 | | 5,638 | |
| 2013 | 4,968 | | 2,526 | | (351) | | 2,175 | | 13,495 | |
| 2014 | 6,937 | | 3,494 | | (2,154) | | 1,340 | | 19,677 | |
| 2015 | 11,958 | | 6,355 | | (4,961) | | 1,394 | | 45,306 | |
| 2016 | 24,893 | | 11,990 | | 3,908 | | 15,898 | | 84,015 | |
| 2017 | 41,722 | | 18,236 | | 3,937 | | 22,173 | | 145,799 | |
| 2018 | 75,462 | | 25,404 | | 10,591 | | 35,995 | | 245,467 | |
| 2019 | 88,246 | | 35,129 | | 6,417 | | 41,546 | | 331,169 | |
| 2020 | 80,231 | | 35,446 | | 16,613 | | 52,059 | | 369,418 | |
| 2021 | 4,450 | | 2,728 | | 838 | | 3,566 | | 87,902 | |
| Subtotal | 347,638 | | 146,318 | | 35,969 | | 182,287 | | 1,355,660 | |
| Americas Insolvency | | | | | |
| 1996-2010 | 181 | | 186 | | (5) | | 181 | | — | |
| 2011 | 76 | | 73 | | 3 | | 76 | | — | |
| 2012 | 190 | | 72 | | 120 | | 192 | | — | |
| 2013 | 201 | | 181 | | 20 | | 201 | | — | |
| 2014 | 298 | | 355 | | (90) | | 265 | | 190 | |
| 2015 | 446 | | 247 | | (202) | | 45 | | 497 | |
| 2016 | 2,727 | | 491 | | 241 | | 732 | | 5,429 | |
| 2017 | 11,752 | | 2,621 | | 468 | | 3,089 | | 43,107 | |
| 2018 | 7,812 | | 1,778 | | 751 | | 2,529 | | 50,368 | |
| 2019 | 8,594 | | 2,488 | | (1,786) | | 702 | | 89,380 | |
| 2020 | 2,960 | | 1,897 | | 535 | | 2,432 | | 57,174 | |
| 2021 | 16 | | 101 | | (14) | | 87 | | 9,553 | |
| Subtotal | 35,253 | | 10,490 | | 41 | | 10,531 | | 255,698 | |
| Total Americas and Australia | 382,891 | | 156,808 | | 36,010 | | 192,818 | | 1,611,358 | |
| Europe Core | | | | | |
| 2012 | 283 | | — | | 283 | | 283 | | — | |
| 2013 | 171 | | — | | 171 | | 171 | | — | |
| 2014 | 37,843 | | 25,589 | | 7,184 | | 32,773 | | 159,401 | |
| 2015 | 13,464 | | 7,427 | | (6,091) | | 1,336 | | 130,541 | |
| 2016 | 11,956 | | 6,431 | | (649) | | 5,782 | | 164,228 | |
| 2017 | 9,565 | | 3,191 | | (1,076) | | 2,115 | | 127,233 | |
| 2018 | 18,365 | | 6,289 | | 4,576 | | 10,865 | | 226,773 | |
| 2019 | 32,020 | | 10,111 | | 2,450 | | 12,561 | | 390,892 | |
| 2020 | 24,425 | | 9,595 | | 4,578 | | 14,173 | | 293,315 | |
| 2021 | 1,394 | | 210 | | 1,015 | | 1,225 | | 43,431 | |
| Subtotal | 149,486 | | 68,843 | | 12,441 | | 81,284 | | 1,535,814 | |
| Europe Insolvency | | | | | |
| 2014 | 88 | | 48 | | 6 | | 54 | | 55 | |
| 2015 | 530 | | 225 | | 5 | | 230 | | 1,335 | |
| 2016 | 1,762 | | 546 | | 118 | | 664 | | 6,487 | |
| 2017 | 2,484 | | 398 | | 140 | | 538 | | 15,696 | |
| 2018 | 2,967 | | 640 | | (764) | | (124) | | 27,919 | |
| 2019 | 6,222 | | 1,554 | | 183 | | 1,737 | | 59,244 | |
| 2020 | 8,817 | | 2,410 | | 850 | | 3,260 | | 98,227 | |
| 2021 | 640 | | 200 | | 1,147 | | 1,347 | | 16,531 | |
| Subtotal | 23,510 | | 6,021 | | 1,685 | | 7,706 | | 225,494 | |
| Total Europe | 172,996 | | 74,864 | | 14,126 | | 88,990 | | 1,761,308 | |
| Total PRA Group | $ | 555,887 | | $ | 231,672 | | $ | 50,136 | | $ | 281,808 | | $ | 3,372,666 | |
(1)For our non-U.S. amounts, amounts are presented using the average exchange rates during the current reporting period.
(2)Total Portfolio Revenue refers to portfolio incomePortfolio Income and changesChanges in expected recoveriesExpected Recoveries combined.
(3)For our non-U.S. amounts, net finance receivablesNet Finance Receivables are presented at the June 30, 2020March 31, 2021 exchange rate.
The following table, which excludes any proceeds from cash sales of finance receivables, illustrates historical cash collections, by year, on our portfolios.
| Cash Collections by Year, By Year of Purchase (1) as of June 30, 2020 Amounts in millions | | |
Cash Collections by Year, By Year of Purchase (1) as of March 31, 2021 Amounts in millions | | Cash Collections by Year, By Year of Purchase (1) as of March 31, 2021 Amounts in millions |
| | Cash Collections | | | Cash Collections | |
| Purchase Period | Purchase Period | Purchase Price (2)(3) | 1996-
2009 | 2010 | 2011 | 2012 | 2013 | 2014 | 2015 | 2016 | 2017 | 2018 | 2019 | 2020 | Total | | Purchase Period | Purchase Price (2)(3) | 1996-2010 | 2011 | 2012 | 2013 | 2014 | 2015 | 2016 | 2017 | 2018 | 2019 | 2020 | 2021 | Total | |
| Americas Core | | | | |
| 1996-2009 | $ | 930.0 | | $ | 1,647.7 | | $ | 295.7 | | $ | 253.5 | | $ | 201.6 | | $ | 146.4 | | $ | 101.8 | | $ | 71.2 | | $ | 45.7 | | $ | 30.5 | | $ | 23.3 | | $ | 19.2 | | $ | 7.3 | | $ | 2,843.9 | | | |
| 2010 | 148.2 | | — | | 47.1 | | 113.6 | | 109.9 | | 82.0 | | 55.9 | | 38.1 | | 24.5 | | 15.6 | | 11.1 | | 9.2 | | 3.7 | | 510.7 | | | |
| Americas and Australia Core | | Americas and Australia Core | |
| 1996-2010 | | 1996-2010 | $ | 1,078.2 | | $ | 1,990.5 | | $ | 367.1 | | $ | 311.5 | | $ | 228.4 | | $ | 157.7 | | $ | 109.3 | | $ | 70.2 | | $ | 46.0 | | $ | 34.4 | | $ | 28.4 | | $ | 18.8 | | $ | 3.7 | | $ | 3,366.0 | | |
| 2011 | 2011 | 209.6 | | — | | — | | 62.0 | | 174.5 | | 152.9 | | 108.5 | | 73.8 | | 48.7 | | 32.0 | | 21.6 | | 16.6 | | 6.3 | | 696.9 | | | 2011 | 209.6 | | — | | 62.0 | | 174.5 | | 152.9 | | 108.5 | | 73.8 | | 48.7 | | 32.0 | | 21.6 | | 16.6 | | 10.9 | | 2.3 | | 703.8 | | |
| 2012 | 2012 | 254.1 | | — | | — | | — | | 56.9 | | 173.6 | | 146.2 | | 97.3 | | 60.0 | | 40.0 | | 27.8 | | 17.9 | | 6.8 | | 626.5 | | | 2012 | 254.1 | | — | | — | | 56.9 | | 173.6 | | 146.2 | | 97.3 | | 60.0 | | 40.0 | | 27.8 | | 17.9 | | 11.8 | | 2.8 | | 634.3 | | |
| 2013 | 2013 | 390.8 | | — | | — | | — | | — | | 101.6 | | 247.8 | | 194.0 | | 120.8 | | 78.9 | | 56.4 | | 36.9 | | 13.2 | | 849.6 | | | 2013 | 390.8 | | — | | — | | — | | 101.6 | | 247.8 | | 194.0 | | 120.8 | | 78.9 | | 56.4 | | 36.9 | | 23.2 | | 5.0 | | 864.6 | | |
| 2014 | 2014 | 404.1 | | — | | — | | — | | — | | — | | 92.7 | | 253.4 | | 170.3 | | 114.2 | | 82.2 | | 55.3 | | 18.2 | | 786.3 | | | 2014 | 404.1 | | — | | — | | — | | — | | 92.7 | | 253.4 | | 170.3 | | 114.2 | | 82.2 | | 55.3 | | 31.9 | | 6.9 | | 806.9 | | |
| 2015 | 2015 | 443.1 | | — | | — | | — | | — | | — | | — | | 117.0 | | 228.4 | | 185.9 | | 126.6 | | 83.6 | | 32.9 | | 774.4 | | | 2015 | 443.1 | | — | | — | | — | | — | | — | | 117.0 | | 228.4 | | 185.9 | | 126.6 | | 83.6 | | 57.2 | | 12.0 | | 810.7 | | |
| 2016 | 2016 | 455.8 | | — | | — | | — | | — | | — | | — | | — | | 138.7 | | 256.5 | | 194.6 | | 140.6 | | 57.1 | | 787.5 | | | 2016 | 455.8 | | — | | — | | — | | — | | — | | — | | 138.7 | | 256.5 | | 194.6 | | 140.6 | | 105.9 | | 24.9 | | 861.2 | | |
| 2017 | 2017 | 532.9 | | — | | — | | — | | — | | — | | — | | — | | — | | 107.3 | | 278.7 | | 256.5 | | 108.5 | | 751.0 | | | 2017 | 532.9 | | — | | — | | — | | — | | — | | — | | — | | 107.3 | | 278.7 | | 256.5 | | 192.5 | | 41.7 | | 876.7 | | |
| 2018 | 2018 | 654.0 | | — | | — | | — | | — | | — | | — | | — | | — | | — | | 122.7 | | 361.9 | | 183.0 | | 667.6 | | | 2018 | 654.0 | | — | | — | | — | | — | | — | | — | | — | | — | | 122.7 | | 361.9 | | 337.7 | | 75.5 | | 897.8 | | |
| 2019 | 2019 | 581.5 | | — | | — | | — | | — | | — | | — | | — | | — | | — | | — | | 143.8 | | 175.0 | | 318.8 | | | 2019 | 581.5 | | — | | — | | — | | — | | — | | — | | — | | — | | — | | 143.8 | | 349.0 | | 88.2 | | 581.0 | | |
| 2020 | 2020 | 283.0 | | — | | — | | — | | — | | — | | — | | — | | — | | — | | — | | — | | 37.1 | | 37.1 | | | 2020 | 435.7 | | — | | — | | — | | — | | — | | — | | — | | — | | — | | — | | 133.0 | | 80.2 | | 213.2 | | |
| 2021 | | 2021 | 88.8 | | — | | — | | — | | — | | — | | — | | — | | — | | — | | — | | — | | 4.4 | | 4.4 | | |
| Subtotal | Subtotal | 5,287.1 | | 1,647.7 | | 342.8 | | 429.1 | | 542.9 | | 656.5 | | 752.9 | | 844.8 | | 837.1 | | 860.9 | | 945.0 | | 1,141.5 | | 649.1 | | 9,650.3 | | | Subtotal | 5,528.6 | | 1,990.5 | | 429.1 | | 542.9 | | 656.5 | | 752.9 | | 844.8 | | 837.1 | | 860.8 | | 945.0 | | 1,141.5 | | 1,271.9 | | 347.6 | | 10,620.6 | | |
| Americas Insolvency | Americas Insolvency | | | | Americas Insolvency | | |
| 1996-2009 | 397.5 | | 204.3 | | 147.1 | | 156.7 | | 145.4 | | 109.3 | | 57.0 | | 7.6 | | 3.6 | | 2.2 | | 1.1 | | 0.7 | | 0.2 | | 835.2 | | | |
| 2010 | 208.9 | | — | | 39.5 | | 104.5 | | 125.0 | | 121.7 | | 101.9 | | 43.6 | | 5.0 | | 2.4 | | 1.4 | | 0.7 | | 0.3 | | 546.0 | | | |
| 1996-2010 | | 1996-2010 | 606.4 | | 390.9 | | 261.2 | | 270.4 | | 231.0 | | 158.9 | | 51.2 | | 8.6 | | 4.6 | | 2.5 | | 1.4 | | 0.8 | | 0.2 | | 1,381.7 | | |
| 2011 | 2011 | 180.4 | | — | | — | | 15.2 | | 66.4 | | 82.8 | | 85.8 | | 76.9 | | 36.0 | | 3.7 | | 1.6 | | 0.7 | | 0.3 | | 369.4 | | | 2011 | 180.4 | | — | | 15.2 | | 66.4 | | 82.8 | | 85.8 | | 76.9 | | 36.0 | | 3.7 | | 1.6 | | 0.7 | | 0.5 | | 0.1 | | 369.7 | | |
| 2012 | 2012 | 251.4 | | — | | — | | — | | 17.4 | | 103.6 | | 94.1 | | 80.1 | | 60.7 | | 29.3 | | 4.3 | | 1.9 | | 0.5 | | 391.9 | | | 2012 | 251.4 | | — | | — | | 17.4 | | 103.6 | | 94.1 | | 80.1 | | 60.7 | | 29.3 | | 4.3 | | 1.9 | | 0.9 | | 0.2 | | 392.5 | | |
| 2013 | 2013 | 227.8 | | — | | — | | — | | — | | 52.5 | | 82.6 | | 81.7 | | 63.4 | | 47.8 | | 21.9 | | 2.9 | | 0.7 | | 353.5 | | | 2013 | 227.8 | | — | | — | | — | | 52.5 | | 82.6 | | 81.7 | | 63.4 | | 47.8 | | 21.9 | | 2.9 | | 1.3 | | 0.2 | | 354.3 | | |
| 2014 | 2014 | 148.4 | | — | | — | | — | | — | | — | | 37.0 | | 50.9 | | 44.3 | | 37.4 | | 28.8 | | 15.8 | | 1.4 | | 215.6 | | | 2014 | 148.4 | | — | | — | | — | | — | | 37.0 | | 50.9 | | 44.3 | | 37.4 | | 28.8 | | 15.8 | | 2.2 | | 0.3 | | 216.7 | | |
| 2015 | 2015 | 63.2 | | — | | — | | — | | — | | — | | — | | 3.4 | | 17.9 | | 20.1 | | 19.8 | | 16.7 | | 5.6 | | 83.5 | | | 2015 | 63.2 | | — | | — | | — | | — | | — | | 3.4 | | 17.9 | | 20.1 | | 19.8 | | 16.7 | | 7.9 | | 0.4 | | 86.2 | | |
| 2016 | 2016 | 91.4 | | — | | — | | — | | — | | — | | — | | — | | 18.9 | | 30.4 | | 25.0 | | 19.9 | | 7.7 | | 101.9 | | | 2016 | 91.4 | | — | | — | | — | | — | | — | | — | | 18.9 | | 30.4 | | 25.0 | | 19.9 | | 14.4 | | 2.7 | | 111.3 | | |
| 2017 | 2017 | 275.3 | | — | | — | | — | | — | | — | | — | | — | | — | | 49.1 | | 97.3 | | 80.9 | | 32.3 | | 259.6 | | | 2017 | 275.3 | | — | | — | | — | | — | | — | | — | | — | | 49.1 | | 97.3 | | 80.9 | | 58.8 | | 11.8 | | 297.9 | | |
| 2018 | 2018 | 97.9 | | — | | — | | — | | — | | — | | — | | — | | — | | — | | 6.7 | | 27.4 | | 15.4 | | 49.5 | | | 2018 | 97.9 | | — | | — | | — | | — | | — | | — | | — | | — | | 6.7 | | 27.4 | | 30.5 | | 7.8 | | 72.4 | | |
| 2019 | 2019 | 123.1 | | — | | — | | — | | — | | — | | — | | — | | — | | — | | — | | 13.4 | | 14.8 | | 28.2 | | | 2019 | 123.1 | | — | | — | | — | | — | | — | | — | | — | | — | | — | | 13.3 | | 31.4 | | 8.6 | | 53.3 | | |
| 2020 | 2020 | 35.3 | | — | | — | | — | | — | | — | | — | | — | | — | | — | | — | | — | | 2.7 | | 2.7 | | | 2020 | 62.1 | | — | | — | | — | | — | | — | | — | | — | | — | | — | | — | | 6.6 | | 3.0 | | 9.6 | | |
| 2021 | | 2021 | 9.5 | | — | | — | | — | | — | | — | | — | | — | | — | | — | | — | | — | | — | | — | | |
| Subtotal | Subtotal | 2,100.6 | | 204.3 | | 186.6 | | 276.4 | | 354.2 | | 469.9 | | 458.4 | | 344.2 | | 249.8 | | 222.4 | | 207.9 | | 181.0 | | 81.9 | | 3,237.0 | | | Subtotal | 2,136.9 | | 390.9 | | 276.4 | | 354.2 | | 469.9 | | 458.4 | | 344.2 | | 249.8 | | 222.4 | | 207.9 | | 180.9 | | 155.3 | | 35.3 | | 3,345.6 | | |
| Total Americas | 7,387.7 | | 1,852.0 | | 529.4 | | 705.5 | | 897.1 | | 1,126.4 | | 1,211.3 | | 1,189.0 | | 1,086.9 | | 1,083.3 | | 1,152.9 | | 1,322.5 | | 731.0 | | 12,887.3 | | | |
| Total Americas and Australia | | Total Americas and Australia | 7,665.5 | | 2,381.4 | | 705.5 | | 897.1 | | 1,126.4 | | 1,211.3 | | 1,189.0 | | 1,086.9 | | 1,083.2 | | 1,152.9 | | 1,322.4 | | 1,427.2 | | 382.9 | | 13,966.2 | | |
| Europe Core | Europe Core | | | | Europe Core | | |
| 2012 | 2012 | 20.4 | | — | | — | | — | | 11.6 | | 9.0 | | 5.6 | | 3.2 | | 2.2 | | 2.0 | | 2.0 | | 1.5 | | 0.6 | | 37.7 | | | 2012 | 20.4 | | — | | — | | 11.6 | | 9.0 | | 5.6 | | 3.2 | | 2.2 | | 2.0 | | 2.0 | | 1.5 | | 1.2 | | 0.3 | | 38.6 | | |
| 2013 | 2013 | 20.3 | | — | | — | | — | | — | | 7.1 | | 8.5 | | 2.3 | | 1.3 | | 1.2 | | 1.3 | | 0.9 | | 0.3 | | 22.9 | | | 2013 | 20.3 | | — | | — | | — | | 7.1 | | 8.5 | | 2.3 | | 1.3 | | 1.2 | | 1.3 | | 0.9 | | 0.7 | | 0.2 | | 23.5 | | |
| 2014 | 2014 | 773.8 | | — | | — | | — | | — | | — | | 153.2 | | 292.0 | | 246.4 | | 220.8 | | 206.3 | | 172.9 | | 72.6 | | 1,364.2 | | | 2014 | 773.8 | | — | | — | | — | | — | | 153.2 | | 292.0 | | 246.4 | | 220.8 | | 206.3 | | 172.9 | | 149.8 | | 37.8 | | 1,479.2 | | |
| 2015 | 2015 | 411.3 | | — | | — | | — | | — | | — | | — | | 45.8 | | 100.3 | | 86.2 | | 80.9 | | 66.1 | | 26.7 | | 406.0 | | | 2015 | 411.3 | | — | | — | | — | | — | | — | | 45.8 | | 100.3 | | 86.2 | | 80.9 | | 66.1 | | 54.3 | | 13.4 | | 447.0 | | |
| 2016 | 2016 | 333.1 | | — | | — | | — | | — | | — | | — | | — | | 40.4 | | 78.9 | | 72.6 | | 58.0 | | 23.3 | | 273.2 | | | 2016 | 333.1 | | — | | — | | — | | — | | — | | — | | 40.4 | | 78.9 | | 72.6 | | 58.0 | | 48.3 | | 12.0 | | 310.2 | | |
| 2017 | 2017 | 252.2 | | — | | — | | — | | — | | — | | — | | — | | — | | 17.9 | | 56.0 | | 44.1 | | 17.9 | | 135.9 | | | 2017 | 252.2 | | — | | — | | — | | — | | — | | — | | — | | 17.9 | | 56.0 | | 44.1 | | 36.1 | | 9.6 | | 163.7 | | |
| 2018 | 2018 | 341.8 | | — | | — | | — | | — | | — | | — | | — | | — | | — | | 24.3 | | 88.7 | | 35.8 | | 148.8 | | | 2018 | 341.8 | | — | | — | | — | | — | | — | | — | | — | | — | | 24.3 | | 88.7 | | 71.2 | | 18.4 | | 202.6 | | |
| 2019 | 2019 | 518.6 | | — | | — | | — | | — | | — | | — | | — | | — | | — | | — | | 48.0 | | 61.8 | | 109.8 | | | 2019 | 518.6 | | — | | — | | — | | — | | — | | — | | — | | — | | — | | 47.9 | | 125.7 | | 32.0 | | 205.6 | | |
| 2020 | 2020 | 94.8 | | — | | — | | — | | — | | — | | — | | — | | — | | — | | — | | — | | 7.5 | | 7.5 | | | 2020 | 324.1 | | — | | — | | — | | — | | — | | — | | — | | — | | — | | — | | 32.4 | | 24.4 | | 56.8 | | |
| 2021 | | 2021 | 43.6 | | — | | — | | — | | — | | — | | — | | — | | — | | — | | — | | — | | 1.4 | | 1.4 | | |
| Subtotal | Subtotal | 2,766.3 | | — | | — | | — | | 11.6 | | 16.1 | | 167.3 | | 343.3 | | 390.6 | | 407.0 | | 443.4 | | 480.2 | | 246.5 | | 2,506.0 | | | Subtotal | 3,039.2 | | — | | — | | 11.6 | | 16.1 | | 167.3 | | 343.3 | | 390.6 | | 407.0 | | 443.4 | | 480.1 | | 519.7 | | 149.5 | | 2,928.6 | | |
| Europe Insolvency | Europe Insolvency | | | | Europe Insolvency | | |
| 2014 | 2014 | 10.9 | | — | | — | | — | | — | | — | | — | | 4.3 | | 3.9 | | 3.2 | | 2.6 | | 1.5 | | 0.4 | | 15.9 | | | 2014 | 10.9 | | — | | — | | — | | — | | — | | 4.3 | | 3.9 | | 3.2 | | 2.6 | | 1.5 | | 0.8 | | 0.1 | | 16.4 | | |
| 2015 | 2015 | 19.0 | | — | | — | | — | | — | | — | | — | | 3.0 | | 4.4 | | 5.0 | | 4.8 | | 3.9 | | 1.6 | | 22.7 | | | 2015 | 19.0 | | — | | — | | — | | — | | — | | 3.0 | | 4.4 | | 5.0 | | 4.8 | | 3.9 | | 2.9 | | 0.5 | | 24.5 | | |
| 2016 | 2016 | 39.3 | | — | | — | | — | | — | | — | | — | | — | | 6.2 | | 12.7 | | 12.9 | | 10.7 | | 4.0 | | 46.5 | | | 2016 | 39.3 | | — | | — | | — | | — | | — | | — | | 6.2 | | 12.7 | | 12.9 | | 10.7 | | 7.9 | | 1.8 | | 52.2 | | |
| 2017 | 2017 | 39.2 | | — | | — | | — | | — | | — | | — | | — | | — | | 1.2 | | 7.9 | | 9.2 | | 4.8 | | 23.1 | | | 2017 | 39.2 | | — | | — | | — | | — | | — | | — | | — | | 1.2 | | 7.9 | | 9.2 | | 9.8 | | 2.5 | | 30.6 | | |
| 2018 | 2018 | 44.9 | | — | | — | | — | | — | | �� | | — | | — | | — | | — | | 0.6 | | 8.4 | | 4.9 | | 13.9 | | | 2018 | 44.9 | | — | | — | | — | | — | | — | | — | | — | | — | | 0.6 | | 8.4 | | 10.3 | | 3.0 | | 22.3 | | |
| 2019 | 2019 | 77.2 | | — | | — | | — | | — | | — | | — | | — | | — | | — | | — | | 5.0 | | 10.3 | | 15.3 | | | 2019 | 77.2 | | — | | — | | — | | — | | — | | — | | — | | — | | — | | 5.1 | | 21.1 | | 6.2 | | 32.4 | | |
| 2020 | 2020 | 23.0 | | — | | — | | — | | — | | — | | — | | — | | — | | — | | — | | — | | 1.0 | | 1.0 | | | 2020 | 105.4 | | — | | — | | — | | — | | — | | — | | — | | — | | — | | — | | 6.1 | | 8.8 | | 14.9 | | |
| 2021 | | 2021 | 16.7 | | — | | — | | — | | — | | — | | — | | — | | — | | — | | — | | — | | 0.6 | | 0.6 | | |
| Subtotal | Subtotal | 253.5 | | — | | — | | — | | — | | — | | — | | 7.3 | | 14.5 | | 22.1 | | 28.8 | | 38.7 | | 27.0 | | 138.4 | | | Subtotal | 352.6 | | — | | — | | — | | — | | — | | 7.3 | | 14.5 | | 22.1 | | 28.8 | | 38.8 | | 58.9 | | 23.5 | | 193.9 | | |
| Total Europe | Total Europe | 3,019.8 | | — | | — | | — | | 11.6 | | 16.1 | | 167.3 | | 350.6 | | 405.1 | | 429.1 | | 472.2 | | 518.9 | | 273.5 | | 2,644.4 | | | Total Europe | 3,391.8 | | — | | — | | 11.6 | | 16.1 | | 167.3 | | 350.6 | | 405.1 | | 429.1 | | 472.2 | | 518.9 | | 578.6 | | 173.0 | | 3,122.5 | | |
| Total PRA Group | Total PRA Group | $ | 10,407.5 | | $ | 1,852.0 | | $ | 529.4 | | $ | 705.5 | | $ | 908.7 | | $ | 1,142.5 | | $ | 1,378.6 | | $ | 1,539.6 | | $ | 1,492.0 | | $ | 1,512.4 | | $ | 1,625.1 | | $ | 1,841.4 | | $ | 1,004.5 | | $ | 15,531.7 | | | Total PRA Group | $ | 11,057.3 | | $ | 2,381.4 | | $ | 705.5 | | $ | 908.7 | | $ | 1,142.5 | | $ | 1,378.6 | | $ | 1,539.6 | | $ | 1,492.0 | | $ | 1,512.3 | | $ | 1,625.1 | | $ | 1,841.3 | | $ | 2,005.8 | | $ | 555.9 | | $ | 17,088.7 | | |
(1)For our non-U.S. amounts, cash collections are presented using the average exchange rates during the cash collection period.
(2)Includes the acquisition date finance receivables portfolios that were acquired through our business acquisitions.
(3)For our non-USnon-U.S. amounts, purchase price is presented at the exchange rate at the end of the year in which the poolportfolio was purchased. In addition, any purchase price adjustments that occur throughout the life of the pool are presented at the year-end exchange rate for the respective year of purchase.
Estimated remaining collections
The following chart shows our ERC of $6,352.0$6,144.1 million at June 30, 2020March 31, 2021 by geographical region (amounts in millions).
The following chart shows our ERC by year for the 12 month periods ending March 31 in each of the years represented below. The forecast amounts reflect our estimate at March 31, 2021 of how much we expect to collect on our portfolios. These estimates are translated to U.S. dollar at the March 31, 2021 exchange rate (amounts in millions).
Seasonality
CashAlthough 2020 deviated from usual seasonal patterns due to the impact of COVID-19, typically cash collections in the Americas tend to be higher in the first half of the year due to the high volume of income tax refunds received by individuals in the U.S., and trend lower as the year progresses. Customer payment patterns in all of the countries in which we operate can be affected by seasonal employment trends, income tax refunds, and holiday spending habits.
Cash Collections
The following table displays our quarterly cash collections by geography and portfolio type, for the periods indicated.indicated (amounts in thousands).
| | | | | | | | | | | | | | | | | | | | | | | | | | | | | | | | | | | | | | | | | | | | | | | | | | | | | | | | | | | | | | | |
Cash Collections by Geography and Type Amounts in thousands | | | | | | | | | | | | | | | | | | | | | | | | | | | | | | | |
| | | | | 2020 | | | | 2019 | | | | | | | | 2018 | | | | | | | | | | | | | | |
| | | | | Q2 | | Q1 | | Q4 | | Q3 | | Q2 | | Q1 | | Q4 | | Q3 | | | | | | | | | | | | |
| Americas Core | | | | | $ | 343,269 | | | $ | 305,780 | | | $ | 276,639 | | | $ | 279,902 | | | $ | 294,243 | | | $ | 290,723 | | | $ | 233,937 | | | $ | 231,253 | | | | | | | | | | | | | |
| Americas Insolvency | | | | | 38,685 | | | 43,210 | | | 40,801 | | | 45,759 | | | 49,770 | | | 44,613 | | | 48,000 | | | 48,518 | | | | | | | | | | | | | |
| Europe Core | | | | | 115,145 | | | 131,340 | | | 126,649 | | | 118,917 | | | 117,635 | | | 116,858 | | | 113,154 | | | 102,780 | | | | | | | | | | | | | |
| Europe Insolvency | | | | | 12,841 | | | 14,243 | | | 12,520 | | | 8,639 | | | 8,626 | | | 8,977 | | | 7,618 | | | 6,731 | | | | | | | | | | | | | |
| Total Cash Collections | | | | | $ | 509,940 | | | $ | 494,573 | | | $ | 456,609 | | | $ | 453,217 | | | $ | 470,274 | | | $ | 461,171 | | | $ | 402,709 | | | $ | 389,282 | | | | | | | | | | | | | |
| | | | | | | | | | | | | | | | | | | | | | | | | | | | | | | | | | | | | | | | | | | | | | | | | | | | | | | | | | | | | | | |
| Cash Collections by Geography and Type |
| | | 2021 | | 2020 | | 2019 | | | | | | | | |
| | | Q1 | | Q4 | | Q3 | | Q2 | | Q1 | | Q4 | | Q3 | | Q2 | | | | | | | | | | | | | | |
| Americas and Australia Core | | | $ | 347,638 | | | $ | 286,524 | | | $ | 336,322 | | | $ | 343,269 | | | $ | 305,780 | | | $ | 276,639 | | | $ | 279,902 | | | $ | 294,243 | | | | | | | | | | | | | | | |
| Americas Insolvency | | | 35,253 | | | 36,048 | | | 37,344 | | | 38,685 | | | 43,210 | | | 40,801 | | | 45,759 | | | 49,770 | | | | | | | | | | | | | | | |
| Europe Core | | | 149,486 | | | 141,471 | | | 131,702 | | | 115,145 | | | 131,340 | | | 126,649 | | | 118,917 | | | 117,635 | | | | | | | | | | | | | | | |
| Europe Insolvency | | | 23,510 | | | 17,830 | | | 13,971 | | | 12,841 | | | 14,243 | | | 12,520 | | | 8,639 | | | 8,626 | | | | | | | | | | | | | | | |
| Total Cash Collections | | | $ | 555,887 | | | $ | 481,873 | | | $ | 519,339 | | | $ | 509,940 | | | $ | 494,573 | | | $ | 456,609 | | | $ | 453,217 | | | $ | 470,274 | | | | | | | | | | | | | | | |
The following table provides additional details on the composition of our U.S. Core cash collections for the periods indicated.indicated (amounts in thousands).
| U.S. Core Portfolio Cash Collections by Source Amounts in thousands | | |
| Cash Collections by Source - Core Portfolios Only | | Cash Collections by Source - Core Portfolios Only |
| | | 2020 | | | 2019 | | | 2018 | | | | 2021 | | 2020 | | 2019 | |
| | | Q2 | | Q1 | | Q4 | | Q3 | | Q2 | | Q1 | | Q4 | | Q3 | | | | Q1 | | Q4 | | Q3 | | Q2 | | Q1 | | Q4 | | Q3 | | Q2 | |
| Call Center and Other Collections | Call Center and Other Collections | | $ | 219,856 | | | $ | 168,166 | | | $ | 139,399 | | | $ | 149,782 | | | $ | 160,479 | | | $ | 169,753 | | | $ | 134,543 | | | $ | 137,325 | | | Call Center and Other Collections | | $ | 355,043 | | | $ | 296,865 | | | $ | 325,898 | | | $ | 319,236 | | | $ | 288,596 | | | $ | 262,570 | | | $ | 254,798 | | | $ | 264,478 | | |
| External Legal Collections | External Legal Collections | | 62,792 | | | 66,190 | | | 58,831 | | | 64,301 | | | 63,490 | | | 57,419 | | | 47,410 | | | 41,935 | | | External Legal Collections | | 65,613 | | | 58,481 | | | 68,861 | | | 70,310 | | | 75,699 | | | 70,867 | | | 75,082 | | | 75,624 | | |
| Internal Legal Collections | Internal Legal Collections | | 34,467 | | | 38,111 | | | 33,944 | | | 35,679 | | | 38,065 | | | 37,018 | | | 30,724 | | | 32,064 | | | Internal Legal Collections | | 76,468 | | | 72,649 | | | 73,265 | | | 68,868 | | | 72,825 | | | 69,851 | | | 68,939 | | | 71,776 | | |
| Total U.S. Core Cash Collections | | $ | 317,115 | | | $ | 272,467 | | | $ | 232,174 | | | $ | 249,762 | | | $ | 262,034 | | | $ | 264,190 | | | $ | 212,677 | | | $ | 211,324 | | | |
| Total Core Cash Collections | | Total Core Cash Collections | | $ | 497,124 | | | $ | 427,995 | | | $ | 468,024 | | | $ | 458,414 | | | $ | 437,120 | | | $ | 403,288 | | | $ | 398,819 | | | $ | 411,878 | | |
Collections Productivity (U.S. Portfolio)
The following tables display certaindisplays a collections productivity measures:measure for our U.S. Portfolios for the periods indicated.
| | | | | | | | | Cash Collections per Collector Hour Paid
U.S. Portfolio | Cash Collections per Collector Hour Paid
U.S. Portfolio | | Cash Collections per Collector Hour Paid
U.S. Portfolio |
| | Call center and other cash collections (1) | | | Call center and other cash collections (1) |
| | 2020 | | 2019 | | 2018 | | 2017 | | 2016 | | 2021 | | 2020 | | 2019 | | 2018 | | 2017 |
| First Quarter | First Quarter | $ | 172 | | | $ | 139 | | | $ | 121 | | | $ | 161 | | | $ | 168 | | First Quarter | $ | 279 | | | $ | 172 | | | $ | 139 | | | $ | 121 | | | $ | 161 | |
| Second Quarter | Second Quarter | 263 | | | 139 | | | 101 | | | 129 | | | 167 | | Second Quarter | — | | | 263 | | | 139 | | | 101 | | | 129 | |
| Third Quarter | Third Quarter | — | | | 124 | | | 107 | | | 125 | | | 177 | | Third Quarter | — | | | 246 | | | 124 | | | 107 | | | 125 | |
| Fourth Quarter | Fourth Quarter | — | | | 128 | | | 104 | | | 112 | | | 153 | | Fourth Quarter | — | | | 204 | | | 128 | | | 104 | | | 112 | |
(1)Represents total cash collections less internal legal cash collections, external legal cash collections, and Insolvencyinsolvency cash collections from trustee-administered accounts.
Portfolio AcquisitionsCash Efficiency Ratio
The following table displays our cash efficiency for the periods indicated.
| | | | | | | | | | | | | | | | | | | | | |
| |
| | | | | | | | | |
| | | | | | | | | |
| | | | | | | | | |
| | | | | | | | | |
| | | | | | | | | |
| | | | | | | | | |
| |
| | | | | | | | | |
| | | | | | | | | |
| | | | | | | | | |
| | | | | | | | | |
| | | | | | | | | |
| | | | | | | | | |
| |
| | | | | | | | | |
| | | | | | | | | |
| | | | | | | | | |
| | | | | | | | | |
| | | | | | | | | |
| | | | | | | | | |
| |
| | | | | | | | | |
| | | | | | | | | |
| | | | | | | | | |
| | | | | | | | | |
| | | | | | | | | |
Cash Efficiency Ratio (1) |
| 2021 | | 2020 | | 2019 | | | | |
| First Quarter | 68.0% | | 61.5% | | 59.2% | | | | |
| Second Quarter | — | | 68.7 | | 60.4 | | | | |
| Third Quarter | — | | 65.6 | | 60.2 | | | | |
| Fourth Quarter | — | | 61.9 | | 59.7 | | | | |
| Full Year | — | | 64.5 | | 59.9 | | | | |
(1) Calculated by dividing cash receipts less operating expenses by cash receipts.
Portfolio Acquisitions
The following graph shows the purchase price of our portfolios by year since 2010.2011. It includes the acquisition date finance receivable portfolios that were acquired through our business acquisitions. The 20202021 totals represent portfolio acquisitions through the sixthree months ended June 30, 2020March 31, 2021 while the prior year totals are for the full year.
The following table displays our quarterly portfolio acquisitions for the periods indicated.indicated (amounts in thousands).
| | | | | | | | | | | | | | | | | | | | | | | | | | | | | | | | | | | | | | | | | | | | | | | | | | | | | | | |
Portfolio Acquisitions by Geography and Type Amounts in thousands | | | | | | | | | | | | | | | | | | | | | | | |
| 2020 | | | | 2019 | | | | | | | | 2018 | | | | | | | | | | |
| Q2 | | Q1 | | Q4 | | Q3 | | Q2 | | Q1 | | Q4 | | Q3 | | | | | | | | |
| Americas Core | $ | 110,474 | | | $ | 172,697 | | | $ | 118,153 | | | $ | 168,185 | | | $ | 121,996 | | | $ | 169,189 | | | $ | 172,511 | | | $ | 170,426 | | | | | | | | | |
| Americas Insolvency | 14,527 | | | 20,772 | | | 22,650 | | | 26,311 | | | 26,092 | | | 48,243 | | | 52,871 | | | 17,151 | | | | | | | | | |
| Europe Core | 34,247 | | | 60,990 | | | 218,919 | | | 64,728 | | | 136,344 | | | 94,283 | | | 231,810 | | | 45,754 | | | | | | | | | |
| Europe Insolvency | 5,251 | | | 18,778 | | | 42,613 | | | 19,772 | | | 4,715 | | | 7,134 | | | 33,661 | | | 4,159 | | | | | | | | | |
| Total Portfolio Acquisitions | $ | 164,499 | | | $ | 273,237 | | | $ | 402,335 | | | $ | 278,996 | | | $ | 289,147 | | | $ | 318,849 | | | $ | 490,853 | | | $ | 237,490 | | | | | | | | | |
| | | | | | | | | | | | | | | | | | | | | | | | | | | | | | | | | | | | | | | | | | | | | | | | | | | | | | | | | |
| Portfolio Acquisitions by Geography and Type | | | | | | |
| 2021 | | 2020 | | 2019 | | | | | | |
| Q1 | | Q4 | | Q3 | | Q2 | | Q1 | | Q4 | | Q3 | | Q2 | | | | | | | | | | |
| Americas and Australia Core | $ | 88,912 | | | $ | 67,460 | | | $ | 84,139 | | | $ | 110,474 | | | $ | 172,697 | | | $ | 118,153 | | | $ | 168,185 | | | $ | 121,996 | | | | | | | | | | | |
| Americas Insolvency | 9,486 | | | 12,504 | | | 14,328 | | | 14,527 | | | 20,772 | | | 22,650 | | | 26,311 | | | 26,092 | | | | | | | | | | | |
| Europe Core | 44,095 | | | 137,647 | | | 74,930 | | | 34,247 | | | 60,990 | | | 218,919 | | | 64,728 | | | 136,344 | | | | | | | | | | | |
| Europe Insolvency | 16,468 | | | 72,171 | | | 4,203 | | | 5,251 | | | 18,778 | | | 42,613 | | | 19,772 | | | 4,715 | | | | | | | | | | | |
| Total Portfolio Acquisitions | $ | 158,961 | | | $ | 289,782 | | | $ | 177,600 | | | $ | 164,499 | | | $ | 273,237 | | | $ | 402,335 | | | $ | 278,996 | | | $ | 289,147 | | | | | | | | | | | |
Portfolio Acquisitions by Stratification (U.S. Only)
The following table categorizes our quarterly U.S. portfolio acquisitions for the periods indicated into major asset type and delinquency category. Since our inception in 1996, we have acquired more than 5657 million customer accounts in the U.S.U.S (amounts in thousands).
| U.S. Portfolio Acquisitions by Major Asset Type Amounts in thousands | | |
U.S. Portfolio Acquisitions by Major Asset Type
| | U.S. Portfolio Acquisitions by Major Asset Type
|
| | | 2020 | | | 2019 | | | | 2021 | | 2020 | |
| | | Q2 | | | Q1 | | | Q4 | | | Q3 | | | Q2 | | | | Q1 | | Q4 | | Q3 | | Q2 | | Q1 | |
| Major Credit Cards | Major Credit Cards | | $ | 50,270 | | 40.9 | % | | $ | 71,225 | | 38.3 | % | | $ | 30,337 | | 24.3 | % | | $ | 50,500 | | 40.1 | % | | $ | 39,468 | | 28.2 | % | | Major Credit Cards | | $ | 28,230 | | 31.1 | % | | $ | 22,500 | | 28.9 | % | | $ | 23,322 | | 25.7 | % | | $ | 50,270 | | 40.9 | % | | $ | 71,225 | | 38.3 | % | |
| Private Label Credit Cards | Private Label Credit Cards | | 69,651 | | 56.7 | | | 104,300 | | 56.0 | | | 85,351 | | 68.4 | | | 72,714 | | 57.7 | | | 70,536 | | 50.4 | | | Private Label Credit Cards | | 50,180 | | 55.4 | | | 48,335 | | 62.1 | | | 60,331 | | 66.5 | | | 69,651 | | 56.7 | | | 104,300 | | 56.0 | | |
| Consumer Finance | Consumer Finance | | 2,430 | | 2.0 | | | 2,109 | | 1.1 | | | 2,046 | | 1.7 | | | 2,090 | | 1.7 | | | 28,649 | | 20.4 | | | Consumer Finance | | 11,861 | | 13.1 | | | 5,978 | | 7.6 | | | 6,333 | | 7.0 | | | 2,430 | | 2.0 | | | 2,109 | | 1.1 | | |
| Auto Related | Auto Related | | 460 | | 0.4 | | | 8,510 | | 4.6 | | | 6,991 | | 5.6 | | | 638 | | 0.5 | | | 1,407 | | 1.0 | | | Auto Related | | 381 | | 0.4 | | | 1,081 | | 1.4 | | | 680 | | 0.8 | | | 460 | | 0.4 | | | 8,510 | | 4.6 | | |
| Total | Total | | $ | 122,811 | | 100.0 | % | | $ | 186,144 | | 100.0 | % | | $ | 124,725 | | 100.0 | % | | $ | 125,942 | | 100.0 | % | | $ | 140,060 | | 100.0 | % | | Total | | $ | 90,652 | | 100.0 | % | | $ | 77,894 | | 100.0 | % | | $ | 90,666 | | 100.0 | % | | $ | 122,811 | | 100.0 | % | | $ | 186,144 | | 100.0 | % | |
| | | | | | | | | | | | | | | | | | | | | | | | | | | | | | | | | | | | | | | | | | | | | | | | | | | | | | | | | | | | |
U.S. Portfolio Acquisitions by Delinquency Category Amounts in thousands | | | | | | | | | | | | | | | | | | | | | | | | | | | | | | |
| 2020 | | | | | | 2019 | | | | | | | | | | | | | | | | | | | | | | | |
| Q2 | | | Q1 | | | Q4 | | | Q3 | | | Q2 | | | | | | | | | | | | | | | | | |
Fresh (1) | $ | 28,847 | | 26.6 | % | | $ | 51,126 | | 30.9 | % | | $ | 35,330 | | 34.6 | % | | $ | 27,600 | | 27.1 | % | | $ | 33,288 | | 29.3 | % | | | | | | | | | | | | | | | | |
Primary (2) | 9,887 | | 9.1 | | | 18,152 | | 11.0 | | | 5,796 | | 5.7 | | | 17,658 | | 17.3 | | | 40,027 | | 35.1 | | | | | | | | | | | | | | | | | |
Secondary (3) | 67,609 | | 62.5 | | | 92,855 | | 56.1 | | | 52,899 | | 51.8 | | | 50,082 | | 49.2 | | | 34,920 | | 30.6 | | | | | | | | | | | | | | | | | |
Tertiary (3) | 1,941 | | 1.8 | | | 3,239 | | 2.0 | | | 4,409 | | 4.3 | | | 6,483 | | 6.4 | | | 5,733 | | 5.0 | | | | | | | | | | | | | | | | | |
Other (4) | — | | — | | | — | | — | | | 3,641 | | 3.6 | | | — | | — | | | — | | — | | | | | | | | | | | | | | | | | |
| Total Core | 108,284 | | 100.0 | % | | 165,372 | | 100.0 | % | | 102,075 | | 100.0 | % | | 101,823 | | 100.0 | % | | 113,968 | | 100.0 | % | | | | | | | | | | | | | | | | |
| Insolvency | 14,527 | | | | 20,772 | | | | 22,650 | | | | 24,119 | | | | 26,092 | | | | | | | | | | | | | | | | | | |
| Total | $ | 122,811 | | | | $ | 186,144 | | | | $ | 124,725 | | | | $ | 125,942 | | | | $ | 140,060 | | | | | | | | | | | | | | | | | | |
| | | | | | | | | | | | | | | | | | | | | | | | | | | | | | | | | | | | | | | | | | | | | | | | | | | | | | | | | | | | | | | |
| U.S. Portfolio Acquisitions by Delinquency Category |
| 2021 | | 2020 | | | | | | | | |
| Q1 | | Q4 | | Q3 | | Q2 | | Q1 | | | | | | | | | | | | | | | | |
Fresh (1) | $ | 21,502 | | 26.4 | % | | $ | 21,985 | | 33.6 | % | | $ | 25,236 | | 33.1 | % | | $ | 28,847 | | 26.6 | % | | $ | 51,126 | | 30.9 | % | | | | | | | | | | | | | | | | | | | |
Primary (2) | 1,360 | | 1.7 | | | 1,002 | | 1.5 | | | 5,187 | | 6.8 | | | 9,887 | | 9.1 | | | 18,152 | | 11.0 | | | | | | | | | | | | | | | | | | | | |
Secondary (3) | 50,546 | | 62.1 | | | 41,164 | | 63.0 | | | 44,534 | | 58.3 | | | 67,609 | | 62.5 | | | 92,855 | | 56.1 | | | | | | | | | | | | | | | | | | | | |
Other (4) | 8,050 | | 9.8 | | | 1,239 | | 1.9 | | | 1,381 | | 1.8 | | | 1,941 | | 1.8 | | | 3,239 | | 2.0 | | | | | | | | | | | | | | | | | | | | |
| | | | | | | | | | | | | | | | | | | | | | | | | | | | | | | | | |
| Total Core | 81,458 | | 100.0 | % | | 65,390 | | 100.0 | % | | 76,338 | | 100.0 | % | | 108,284 | | 100.0 | % | | 165,372 | | 100.0 | % | | | | | | | | | | | | | | | | | | | |
| Insolvency | 9,194 | | | | 12,504 | | | | 14,328 | | | | 14,527 | | | | 20,772 | | | | | | | | | | | | | | | | | | | | | |
| Total | $ | 90,652 | | | | $ | 77,894 | | | | $ | 90,666 | | | | $ | 122,811 | | | | $ | 186,144 | | | | | | | | | | | | | | | | | | | | | |
(1)Fresh accounts are typically past due 120 to 270 days, charged-off by the credit originator and are either being sold prior to any post-charge-off collection activity or placement with a third-party for the first time.
(2)Primary accounts are typically 360 to 450 days past due and charged-off and have been previously placed with one contingent fee servicer.
(3)Secondary and tertiary accounts are typically more than 660 days past due and charged-off and have been placed with two or three contingent fee servicers.
(4)Other accounts are typically two to three years or more past due and charged-off and have previously been worked by fourthree or more contingent fee servicers.
Non-GAAP Financial Measures
We report financial results in accordance with U.S. generally accepted accounting principles ("GAAP"). However, management uses certain non-GAAP financial measures including adjusted earnings before interest, taxes, depreciation and amortization ("Adjusted EBITDA"), to evaluate our operating and financial performance as well as to set performance goals. We present Adjusted EBITDA because we consider it an important supplemental measure of operations and financial performance. Management believes Adjusted EBITDA helps provide enhanced period-to-period comparability of operations and financial performance, as it excludes certain items whose fluctuations from period to period do not necessarily correspond to changes in the operations of our business, and is useful to investors as other companies in the industry report similar financial measures. Adjusted EBITDA should not be considered as an alternative to net income determined in accordance with GAAP. In addition, our calculation of Adjusted EBITDA may not be comparable to the calculation of similarly titled measures presented by other companies.
Adjusted EBITDA is calculated starting with our GAAP financial measure, net income attributable to PRA Group, Inc. and is adjusted for:
•income tax expense (or less income tax benefit);
•foreign exchange loss (or less foreign exchange gain);
•interest expense, net (or less interest income, net);
•other expense (or less other income);
•depreciation and amortization;
•net income attributable to noncontrolling interests; and
•recoveries applied to negative allowance less changes in expected recoveries.
The following table is a reconciliation of net income, as reported in accordance with GAAP, to Adjusted EBITDA for the last 12 months ("LTM") as of March 31, 2021 and for the year ended December 31, 2020 (amounts in thousands):
| | | | | | | | | | | |
| Reconciliation of Non-GAAP Financial Measures |
| LTM | | For the Year Ended |
| March 31, 2021 | | December 31, 2020 |
| Net income attributable to PRA Group, Inc. | $ | 188,610 | | | $ | 149,339 | |
| Adjustments: | | | |
| Income tax expense | 55,425 | | | 41,203 | |
| Foreign exchange losses/(gains) | 304 | | | (2,005) | |
| Interest expense, net | 136,053 | | | 141,712 | |
Other expense (1) | 947 | | | 1,049 | |
| Depreciation and amortization | 18,362 | | | 18,465 | |
| Adjustment for net income attributable to noncontrolling interests | 18,576 | | | 18,403 | |
| | | |
| Recoveries applied to negative allowance less Changes in expected recoveries | 997,313 | | | 968,362 | |
| Adjusted EBITDA | $ | 1,415,590 | | | $ | 1,336,528 | |
(1) Other expense reflects non-operating expenses.
Additionally, we evaluate our business using certain ratios that use Adjusted EBITDA. Debt to Adjusted EBITDA is calculated by dividing borrowings by Adjusted EBITDA.The following table reflects our Debt to Adjusted EBITDA for the LTM as of March 31, 2021 and for the year ended December 31, 2020 (amounts in thousands):
| | | | | | | | | | | | | | | | | |
| Debt to Adjusted EBITDA |
| LTM | | For the Year Ended |
| March 31, 2021 | | December 31, 2020 |
| Borrowings | $ | 2,501,133 | | | | $ | 2,661,289 | | |
| Adjusted EBITDA | $ | 1,415,590 | | | | $ | 1,336,528 | | |
| Debt to Adjusted EBITDA | 1.77 | x | | 1.99 | x |
Liquidity and Capital Resources
We actively manage our liquidity to help provide access to sufficient funding to meet our business needs and financial obligations. As of June 30, 2020,March 31, 2021, cash and cash equivalents totaled $115.7$92.8 million. Of the cash and cash equivalent balance as of June 30, 2020, $96.7March 31, 2021, $62.2 million consisted of cash on hand related to international operations with indefinitely reinvested earnings. See the "Undistributed Earnings of International Subsidiaries" section below for more information.
At June 30, 2020,March 31, 2021, we had approximately $2.6 billion inthe following borrowings outstanding with $905.3 million ofand availability under all of our credit facilities (subject to the(amounts in thousands):
| | | | | | | | | | | | | | | | | | | | |
| | Outstanding | | Available without Restrictions | | Available with Restrictions (1) |
Americas revolving credit (2) | | $ | 376,392 | | | $ | 703,995 | | | $ | 254,772 | |
| European revolving credit | | 1,023,039 | | | 366,961 | | | 236,961 | |
| Term loan | | 467,500 | | | — | | | — | |
| Senior Notes | | 300,000 | | | — | | | — | |
| Convertible Notes | | 345,000 | | | — | | | — | |
| Less: Debt discounts and issuance costs | | (10,798) | | | — | | | — | |
| Total | | $ | 2,501,133 | | | $ | 1,070,956 | | | $ | 491,733 | |
| | | | | | |
| | | | | | |
| | | | | | |
| | | | | | |
(1) Available borrowings after calculation of current borrowing base and applicable debt covenants). Considering borrowing base restrictions, as of June 30, 2020, the amount available to be drawn was $414.0 million. Of the $905.3 million of borrowing availability, $340.0 million was available under our European credit facility, $562.3 million was available under ourcovenants.
(2) Includes North American credit facilityrevolver and $3.0 million was available under our Colombian revolving credit facility. Of the $414.0 million available considering borrowing base restrictions, $97.4 million was available under our European credit facility, $313.6 million was available under our North American credit facility and $3.0 million was available under the Colombian revolving credit facility. For more information, see Note 7 to our Consolidated Financial Statements included in Part I, Item 1 of this Quarterly Report.revolver.
An additional funding source for our Europe operations is interest-bearing deposits. Per the terms of our European credit facility, we are permitted to obtain interest-bearing deposit funding of up to SEK 1.2 billion (approximately $128.5$137.4 million as of June 30, 2020)March 31, 2021). Interest-bearing deposits as of June 30, 2020March 31, 2021 were $120.5$125.0 million.
We determined that we were in compliance with the covenants of our financing arrangements as of June 30, 2020.March 31, 2021.
We have the ability to slow the purchase of finance receivables if necessary, and use the net cash flow generated from our cash collections from our existing finance receivables to temporarily service our debt and fund existing operations.
Contractual obligations over the next year are primarily related to debt maturities and purchase commitments. Our North American credit facility expires in May 2022. Our European credit facility expires in February 2023. Of our $420.0 million in term loans outstanding at June 30, 2020, $10.0 million in principal is due within one year.
At June 30, 2020,As of March 31, 2021, we had outstanding $287.5 million aggregate principal amount of 3.00% Convertible Senior Notes due August 1, 2020. Subsequently, we retired the notes in full through repurchase and cash settlement in connection with their maturity. For more information, see Note 15 to our Consolidated Financial Statements included in Part. I, Item 1 to this Quarterly Report.
We have in place forward flow commitments in place for the purchase of nonperforming loans primarily over the next 12 months with a maximum purchase price of $383.1$640.7 million, as of June 30, 2020.which $621.2 million is due within the next 12 months. The $383.1$640.7 million is comprised of $271.7$452.7 million for the Americas and $111.4Australia and $188.0 million for Europe. We may also enter into new or renewed forward flow commitments and close on spot transactions in addition to the aforementioned forward flow agreements.
In May 2017, we reached a settlement withAdditionally, of our $2.5 billion borrowings at March 31, 2021, estimated interest, unused fees and principal payments for the Internal Revenue Service ("IRS") in regardnext 12 months are approximately $106.7 million, of which, $11.0 million relates to the IRS assertion that tax revenue recognition using the cost recovery method did not clearly reflect taxable income. In accordance with the settlement, our tax accounting method to recognize finance receivables revenue changed effective with tax year 2017. Under the new method, a portion of the annual collections amortizesprincipal. Our principal and the remaining portion is taxable income. The revenuepayment obligations related to the differencedebt maturities occur within three to five years as our European credit facility expires in timing between the new method and the cost recovery method has been included evenly intoFebruary 2023, our tax filings over four years effective with tax year 2017 and ending with tax year 2020. We estimate the related tax payments to be approximately $9.2 million per quarter through the year 2020. No interest or penalties were assessed as part of the settlement.
We continue to monitor the recent outbreak of COVID-19 onconvertible notes mature in June 2023, our operations and how that may impact our cash flowsNorth American credit facility expires in May 2024 and our ability to settle debt. As a result of COVID-19, global financial markets have experienced overall volatility and disruptions to capital and credit markets. senior notes mature in September 2025.
We believe that funds generated from operations and from cash collections on finance receivables, together with existing cash, available borrowings under our revolving credit facilities, including recent modifications to the terms of those facilities, and access to the capital markets will be sufficient to finance our operations, planned capital expenditures, forward flow purchase commitments, debt maturities and additional portfolio purchases during the next 12 months. We may, however, seek to access the debt or equity capital markets as we deem appropriate, market conditions permit.permitting. Business acquisitions adverse outcomes in pending litigation or higher than expected levels of portfolio purchasing could require additional financing from other sources.
For more information, see Note 7 to our Consolidated Financial Statements included in Part I, Item 1 of this Quarterly Report.
Cash Flows Analysis
The following table summarizes our cash flow activity for the sixthree months ended June 30, 2020March 31, 2021 compared to the sixthree months ended June 30, 2019March 31, 2020 (amounts in thousands):
| | | Six Months Ended June 30, | | | Three Months Ended March 31, |
| | 2020 | | 2019 | | 2021 | | 2020 | | Change |
| Total cash provided by (used in): | Total cash provided by (used in): | | | | | Total cash provided by (used in): | | | | | |
| Operating activities | Operating activities | | $ | 122,500 | | | $ | 30,948 | | Operating activities | $ | 20,208 | | | $ | 46,806 | | | $ | (26,598) | |
| Investing activities | Investing activities | | 88,077 | | | (177,703) | | Investing activities | 166,982 | | | (42,180) | | | 209,162 | |
| Financing activities | Financing activities | | (192,950) | | | 156,837 | | Financing activities | (192,955) | | | 72,142 | | | (265,097) | |
| Effect of exchange rate on cash | Effect of exchange rate on cash | | (16,503) | | | (3,281) | | Effect of exchange rate on cash | (6,427) | | | (16,575) | | | 10,148 | |
| Net increase in cash and cash equivalents | | $ | 1,124 | | | $ | 6,801 | | |
| Net (decrease)/increase in cash and cash equivalents | | Net (decrease)/increase in cash and cash equivalents | $ | (12,192) | | | $ | 60,193 | | | $ | (72,385) | |
Operating Activities
Cash provided by operating activities mainly reflects cash collections recognized as revenue partially offset by cash paid for operating expenses, interest and income taxes. Key drivers of operating activities were adjusted for (i) non-cash items included in net income such as provisions for unrealized gains and losses, changes in expected recoveries, depreciation and amortization, deferred taxes, fair value changes in equity securities, and stock-based compensation as well as (ii) changes in the balances of operating assets and liabilities, which can vary significantly in the normal course of business due to the amount and timing of payments.
Net cash provided by operating activities increased $91.6decreased $26.6 million during the sixthree months ended June 30, 2020,March 31, 2021, mainly driven by higherlower cash collections lower operating expenses, the impact of unrealized foreign currency transactionsrecognized as revenue and lower levels of income tax payments.other various offsetting noncash items.
Investing Activities
Cash provided by investing activities mainly reflects recoveries applied to our negative allowance. Cash used in investing activities mainly reflects acquisitionspurchases of nonperforming loans.
Net cash provided by investing activities increased $265.8$209.2 million during the sixthree months ended June 30, 2020,March 31, 2021 primarily fromdriven by a $113.3$112.5 million decrease in purchases of nonperforming loans and a $58.2$91.9 million increase in recoveries applied to our negative allowance in the current year versus of collections applied to principal in the prior year, a $72.8 million decrease in net purchases of investments and $57.6 million of cash used related to a business acquisition during the first quarter of 2019. These changes were partially offset by $31.2 million of cash received during the first quarter of 2019 related to the sale of a subsidiary in the fourth quarter of 2018 and a $5.0 million increase in net purchases of property and equipment.allowance.
Financing Activities
Cash provided by financing activities is normally provided by draws on our lines of credit and proceeds from debt offerings. Cash used in financing activities is primarily driven by principal payments on our lines of credit and long-term debt.
Cash usedChanges in net cash flow related to financing activities increased $349.8 million during the six months ended June 30, 2020,was driven primarily fromby a $373.9$269.7 million decrease in proceeds from our lines of credit, a $14.8 million decrease in cash provided by interest-bearing deposits and an $8.0 million increase in distributions paid to noncontrolling interests. These changes were partially offset by a $48.6 million increase in net payments on our lines of credit, origination costs and long-term debt.credit.
Undistributed Earnings of International Subsidiaries
We intend to use predominantly all of our accumulated and future undistributed earnings of international subsidiaries to expand operations outside the U.S.; therefore, such undistributed earnings of international subsidiaries are considered to be indefinitely reinvested outside the U.S. Accordingly, no provision for income tax and withholding tax has been provided thereon. If management's intentions change and eligible undistributed earnings of international subsidiaries are repatriated, we could be subject to additional income taxes and withholding taxes. This could result in a higher effective tax rate in the period in which such a decision is made to repatriate accumulated or future undistributed international earnings. The amount of cash on hand related to international operations with indefinitely reinvested earnings was $96.7$62.2 million and $109.7$97.0 million as of June 30, 2020March 31, 2021 and December 31, 2019,2020, respectively. Refer to Note 12 to our Consolidated Financial Statements
included in Part I, Item 1 of this Quarterly Report for further information related to our income taxes and undistributed international earnings.
Off-Balance Sheet Arrangements
We do not have any off-balance sheet arrangements as defined by Item 303(a)(4) of Regulation S-K promulgated under the Securities Exchange Act of 1934, as amended (the "Exchange Act").
Recent Accounting Pronouncements
For a summary of recent accounting pronouncements and the anticipated effects on our Consolidated Financial Statements see Note 14 to our Consolidated Financial Statements included in Part I, Item 1 of this Quarterly Report. Critical Accounting Policies and Estimates
Our Consolidated Financial Statements have been prepared in accordance with GAAP. Our significant accounting policies are discussed in Note 1 to our Consolidated Financial Statements included in Item 8 of our 20192020 Form 10-K. Our significant accounting policies are fundamental to understanding our results of operations and financial condition because they require that we use estimates, assumptions and judgments that affect the reported amounts of revenues, expenses, assets, and liabilities.
Three of these policies are considered to be critical because they are important to the portrayal of our financial condition and results, and because they require management to make judgments and estimates that are difficult, subjective, and complex regarding matters that are inherently uncertain.
We base our estimates on historical experience, current trends and various other assumptions that we believe are reasonable under the circumstances, the results of which form the basis for making judgments about the carrying values of assets and liabilities that are not readily apparent from other sources. If these estimates differ significantly from actual results, the impact on our Consolidated Financial Statements may be material.
Management has reviewed these critical accounting policies with the Audit Committee of our Board of Directors.
Revenue Recognition - Finance Receivables
We account for the majority of our investment in finance receivables under the guidance of ASC Topic 310 “Receivables” (“ASC 310”) and ASC Topic 326-20 “Financial Instruments - Credit Losses - Measured at Amortized Cost” (“ASC 326-20”).326. Revenue recognition for finance receivables involves the use of estimates and the exercise of judgment on the part of management. These estimates include projections of the quantity and timing of future cash flows and economic lives of our pools of finance receivables. Significant changes in such estimates could result in increased or decreased revenue as we immediately recognize the discounted value of such changes using the constant effective interest rate of the pool.
We account for our finance receivables as follows:
We create each annual accounting pool using our projections of estimated cash flows and expected economic life. We then compute a constant effective interest rate based on the net carrying amount of the pool and reasonable projections of estimated cash flows and expectation of its economic life. As actual cash flow results are received we record the time value of the expected cash as portfolioPortfolio income and over and under performance and changes in expected future cash flows from expected cash as changesChanges in expected recoveries. We review each pool watching for trends, actual performance versus projections and curve shape (a graphical depiction of the timing of cash flows). We then re-forecast future cash flows by applying discounted cash flow methodologies to our ERC and recognize income over the estimated life of the pool at the constant effective interest rate of the pool.
Significant judgment is used in evaluating expected recoveries using the discounted cash flow approach and the estimated life of the pool.
Valuation of Acquired Intangibles and Goodwill
In accordance with FASB ASC Topic 350, "Intangibles-Goodwill and Other" ("ASC 350"), we amortize intangible assets over their estimated useful lives.evaluate Goodwill pursuant to ASC 350, is not amortized but rather evaluated for impairment annually and more frequently if indicators of potential impairment exist. Goodwill is reviewed for potential impairment at the reporting unit level. A reporting unit is an operating segment or one level below an operating segment.
Goodwill is evaluated for impairment either under the qualitative assessment option.option or using a quantitative forecast approach depending on facts and circumstances of a reporting unit, including the excess of fair value over carrying amount in the last valuation, changes in the business environment and changes of the reporting unit or its composition. If upon evaluation of the qualitative factors, we qualitatively determine it is more likely than not that the fair value of a reporting unit is greater than its carrying amount, anthere is no impairment loss to record and a quantitative assessment is recognized for the amount by whichnot required. If the carrying amount exceeds the reporting unit’s fair value.value, then we are required to determine the reporting unit’s fair value and record as an impairment loss the amount the carrying value exceeds fair value, not to exceed the total amount of goodwill allocated to the respective reporting unit.
We determine the fair value of a reporting unit by applying the approaches prescribed under the fair value measurement accounting framework:ASC Topic 820 "Fair Value Measurements and Disclosures": the income approach and the market approach. Depending on the availability of public data and suitable comparables, we may or may not use the market approach or we may emphasize the results from the approach differently. Under the income approach, we estimate the fair value of a reporting unit based on the present value of estimated future cash flows and a residual terminal value. Cash flow projections are based on management's estimates of revenue growth rates, operating margins, necessary working capital and capital expenditure requirements, taking into consideration industry and market conditions. The discount rate used is based on the weighted-average cost of capital adjusted for the relevant risk associated with business-specific characteristics and the uncertainty related to the reporting unit's ability to execute on the projected cash flows. Under the market approach, we estimate fair value based on prices and other relevant market transactions involving comparable publicly-traded companies with operating and investment characteristics similar to the reporting unit.
Income Taxes
We are subject to income taxes throughout the income tax laws of the various jurisdictionsU.S. and in which we operate, including U.S. federal, state, local, andnumerous international jurisdictions. These tax laws are complex and are subject to different interpretations by the taxpayer and the relevant government taxing authorities. When determining our domestic and international income tax expense, we must make judgments about the application of these inherently complex laws.
We follow the guidance of FASB ASC Topic 740 "Income Taxes" ("ASC 740") as it relates to the provision for income taxes and uncertainty in income taxes. Accordingly, we record a tax provision for the anticipated tax consequences of the reported results of operations. In accordance with ASC 740, theThe provision for income taxes is computedestimated using the asset and liability method, under which deferred tax assets and liabilities are recognized for the expected future tax consequences of temporary differences between the financial reporting and tax basis of assets and liabilities, and for operating losses and tax credit carry-forwards. Deferred tax assets and liabilities are measured using the currently enacted tax rates that apply to taxable income in effect for the years in which those tax assets and liabilities are expected to be realized or settled. The evaluation of
We exercise significant judgment in estimating the potential exposure to unresolved tax matters and apply a more-likely-than-not criteria approach for recording tax positionbenefits related to uncertain tax positions in accordance with the guidance is a two-step process. The first step is recognition: we determine whether it is more-likely-than-not that a tax position will be sustained upon examination, including resolution of any related appeals or litigation processes, based on the technical meritsapplication of the position. In evaluating whether acomplex tax position has metlaws. While actual results could vary, we believe we have adequate tax accruals with respect to the more-likely-than-not recognition threshold, we should presume that the position will be examined by the appropriate taxing authority that would have full knowledgeultimate outcome of all relevant information. The second step is measurement: asuch unresolved tax position that meets the more-likely-than-not recognition threshold is measured to determine the amount of benefit to recognize in the financial statements. The tax position is measured as the largest amount of benefit that is greater than fifty percent likely of being realized upon ultimate settlement. Tax positions that previously failed to meet the more-likely-than-not recognition threshold should be recognized in the first subsequent financial reporting period in which that threshold is met. Previously recognized tax positions that no longer meet the more-likely-than-not recognition threshold should be derecognized in the first subsequent financial reporting period in which that threshold is no longer met.matters. We record interest and penalties related to unrecognizedunresolved tax benefitsmatters as a component of income tax expense.expense when the more-likely-than-not standards are met.
In the event that all or part of the deferred tax assets are determined not to be realizable in the future, we would establish a valuation allowance would be established and chargedcharge to earnings the impact in the period such a determination is made. If we subsequently realize deferred tax assets that were previously determined to be unrealizable, the respective valuation allowance would be reversed, resulting in a positive adjustment to earnings in the period such determination is made.earnings. The establishment or release of a valuation allowance does not have an impact on cash, nor does such an allowance preclude the use of loss carryforwards or other deferred tax assets in future periods. The calculation of tax liabilities involves significant judgment in estimating the impact of uncertainties in the application of complex tax laws. Resolution of these uncertainties in a manner inconsistent with our expectations could have a material impact on our results of operations and financial position.
Item 3. Quantitative and Qualitative Disclosures About Market Risk
Our activities are subject to various financial risks, including market risk, currency and interest rate risk, credit risk, liquidity risk and cash flow risk. Our financial risk management program focuses on the unpredictability of financial markets and seeks to minimize potential adverse effects on our financial performance. We may periodically enter into derivative financial instruments, typically interest rate and currency derivatives, to reduce our exposure to fluctuations in interest rates on variable-rate debt, fluctuations in currency rates and their impact on earnings and cash flows. We do not utilize derivative financial instruments with a level of complexity or with a risk greater than the exposure to be managed nor do we enter into or hold derivatives for trading or speculative purposes. Derivative instruments involve, to varying degrees, elements of non-performance, or credit risk. We do not believe that we currently face a significant risk of loss in the event of non-performance by the counterparties associated with these instruments, as these transactions were executed with a diversified group of major financial institutions with an investment-grade credit rating. Our intention is to spread our counterparty credit risk across a number of counterparties so that exposure to a single counterparty is minimized.
Interest Rate Risk
We are subject to interest rate risk from outstanding borrowings on our variable rate credit facilities. As such, our consolidated financial results are subject to fluctuations due to changes in the market rate of interest. We assess this interest rate risk by estimating the increase or decrease in interest expense that would occur due to a change in short-term interest rates. The borrowings on our variable rate credit facilities were approximately $2.0$1.9 billion as of June 30, 2020.March 31, 2021. Based on our debt structure at June 30, 2020,March 31, 2021, assuming a 50 basis point decrease in interest rates, for example, interest expense over the following 12 months would decrease by an estimated $3.4$1.8 million. Assuming a 50 basis point increase in interest rates, interest expense over the following 12 months would increase by an estimated $3.4$3.7 million.
To reduce the exposure to changes in the market rate of interest and to be in compliance with the terms of our European credit facility, we have entered into interest rate derivative contracts for a portion of our borrowings under our floating rate financing arrangements. We apply hedge accounting to certain of our interest rate derivative contracts. By applying hedge accounting, changes in market value are reflected as adjustments in Other Comprehensive Income. All derivatives to which we have applied hedge accounting were evaluated and remained highly effective at June 30, 2020.March 31, 2021. Terms of the interest rate derivative contracts require us to receive a variable interest rate and pay a fixed interest rate. The sensitivity calculations above consider the impact of our interest rate derivative contracts.contracts and a 75 basis point floor on revolving loans in our North American credit facility.
Currency Exchange Risk
We operate internationally and enter into transactions denominated in various foreign currencies. During the three months ended June 30, 2020,March 31, 2021, we generated $79.6$111.3 million of revenues from operations outside the U.S. and used eleven12 functional currencies, excluding the U.S. dollar. Weakness in one particular currency might be offset by strength in other currencies over time.
As a result of our international operations, fluctuations in foreign currencies could cause us to incur foreign currency exchange gains and losses, and could adversely affect our comprehensive income and stockholders' equity. Additionally, our reported financial results could change from period to period due solely to fluctuations between currencies.
Foreign currency gains and losses are primarily the result of the re-measurement of transactions in certain other currencies into an entity's functional currency. Foreign currency gains and losses are included as a component of other income and (expense) in our Consolidated Income Statements. From time to time we may elect to enter into foreign exchange derivative contracts to reduce these variations in our Consolidated Income Statements.
When an entity's functional currency is different than the reporting currency of its parent, foreign currency translation adjustments may occur. Foreign currency translation adjustments are included as a component of other comprehensive (loss)/income in our Consolidated Statements of Comprehensive Income and as a component of equity in our Consolidated Balance Sheets.
We have taken measures to mitigate the impact of foreign currency fluctuations. We have organized our European operations so that portfolio ownership and collections generally occur within the same entity. Our European credit facility is a multi-currency facility, allowing us to better match funding and portfolio acquisitions by currency. We actively monitor the value of our finance receivables by currency. In the event adjustments are required to our liability composition by currency we may, from time to time, execute re-balancing foreign exchange contracts to more closely align funding and portfolio acquisitions by currency.
Item 4. Controls and Procedures
Evaluation of Disclosure Controls and Procedures. We maintain disclosure controls and procedures (as defined in Exchange Act Rules 13a-15(e) and 15d-15(e)) that are designed to ensure that information required to be disclosed in our Exchange Act reports is recorded, processed, summarized and reported within the time periods specified in the SEC’s rules and forms, and that such information is accumulated and communicated to our management, including our Chief Executive Officer and Chief Financial Officer, as appropriate, to allow timely decisions regarding required disclosure. In designing and evaluating the disclosure controls and procedures, management recognized that any controls and procedures, no matter how well designed and operated, can provide only reasonable assurance of achieving the desired control objectives, and management necessarily was required to apply its judgment in evaluating the cost-benefit relationship of possible controls and procedures. Also, projections of any evaluation of effectiveness to future periods are subject to the risk that controls may become inadequate because of changes in conditions or that the degree of compliance with the policies or procedures may deteriorate. We conducted an evaluation, under the supervision and with the participation of our principal executive officer and principal financial officer, of the effectiveness of our disclosure controls and procedures as of the end of the period covered by this Quarterly Report. Based on this evaluation, the principal executive officer and principal financial officer have concluded that, as of June 30, 2020,March 31, 2021, our disclosure controls and procedures were effective.
Changes in Internal Control over Financial Reporting. There was no change in our internal control over financial reporting that occurred during the quarter ended June 30, 2020March 31, 2021 that has materially affected, or is reasonably likely to materially affect, our internal control over financial reporting.
Part II. Other Information
Item 1. Legal Proceedings
For information regarding legal proceedings as of June 30, 2020,March 31, 2021, refer to Note 13 to our Consolidated Financial Statements included in Part I, Item 1 of this Quarterly Report. Item 1A. Risk Factors
There have been no material changes in our risk factors from those disclosed in Part I, Item 1A, of our 20192020 Form 10-K and in Part II, Item 1A of our 2020 First Quarter Form 10-Q.10-K.
Item 2. Unregistered Sales of Equity Securities and Use of Proceeds
None.
Item 3. Defaults Upon Senior Securities
None.
Item 4. Mine Safety Disclosures
Not applicable.
Item 5. Other Information
None.
Item 6. Exhibits
| | | | | |
| |
| |
| |
| |
| |
| |
| |
| Second Amendment to the Credit Agreement dated as of May 6, 2020, by and among PRA Group Inc. and PRA Group Canada Inc.,the Guarantors, the Lenders party thereto, Bank of America, N.A., as Administrative Agent and Bank of America, N.A., acting through its Canada Branch, as Canadian Administrative Agent (filed herewith). |
| |
| |
| |
| |
| |
| |
| 101.INS | XBRL Instance Document - the instance document does not appear in the Interactive Data File because its XBRL tags are embedded within the Inline XBRL document |
| 101.SCH | XBRL Taxonomy Extension Schema Document |
| 101.CAL | XBRL Taxonomy Extension Calculation Linkable Document |
| 101.LAB | XBRL Taxonomy Extension Label Linkable Document |
| 101.PRE | XBRL Taxonomy Extension Presentation Linkable Document |
| 101.DEF | XBRL Taxonomy Extension Definition Linkbase Document |
| | | | | |
| 104 | Cover Page Interactive Data File (formatted as Inline XBRL and contained in Exhibit 101) |
SIGNATURES
Pursuant to the requirements of the Securities Exchange Act of 1934, the registrant has duly caused this report to be signed on its behalf by the undersigned, thereunto duly authorized.
| | | | | | | | | | | |
| | | |
| PRA Group, Inc. | | |
| (Registrant) | | |
| | | |
AugustMay 6, 20202021 | By: | | /s/ Kevin P. Stevenson |
| | | Kevin P. Stevenson |
| | | President and Chief Executive Officer |
| | | (Principal Executive Officer) |
| | | | | | | | | | | |
| | | |
| | | |
AugustMay 6, 20202021 | By: | | /s/ Peter M. Graham |
| | | Peter M. Graham |
| | | Executive Vice President and Chief Financial Officer |
| | | (Principal Financial and Accounting Officer) |