UNITED STATES
SECURITIES AND EXCHANGE COMMISSION
WASHINGTON, D.C. 20549
FORM 10-Q
| x | QUARTERLY REPORT PURSUANT TO SECTION 13 OR 15(d) OF THE SECURITIES EXCHANGE ACT OF 1934 |
For the Quarterly Period Ended September 30, 2006March 31, 2007
| ¨ | TRANSITION REPORT PURSUANT TO SECTION 13 OR 15(d) OF THE SECURITIES EXCHANGE ACT OF 1934 |
For the Transition Period From to
Commission File Number 1-3157
INTERNATIONAL PAPER COMPANY
(Exact name of registrant as specified in its charter)
| New York | 13-0872805 | |
(State or other jurisdiction of incorporation of organization) | (I.R.S. Employer Identification No.) | |
| 6400 Poplar Avenue, Memphis, TN | 38197 | |
| (Address of principal executive offices) | (Zip Code) | |
Registrant’s telephone number, including area code: (901) 419-7000
Indicate by check mark whether the registrant: (1) has filed all reports required to be filed by Section 13 or 15(d) of the Securities Exchange Act of 1934 during the preceding 12 months (or for such shorter period that the registrant was required to file such reports), and (2) has been subject to such filing requirements for the past 90 days. Yes x No ¨
Indicate by check mark whether the registrant is a large accelerated filer, an accelerated filer, or a non-accelerated filer. See definition of “accelerated filer and large accelerated filer” in Rule 12b-2 of the Exchange Act. (Check one):
Large accelerated filer x Accelerated filer ¨ Non-accelerated filer ¨
Indicate by check mark whether the registrant is a shell company (as defined in Rule 12b-2 of the Exchange Act). Yes¨ No x
The number of shares outstanding of the registrant’s common stock as of October 31, 2006May 4, 2007 was 454,969,467.435,568,358.
| PAGE NO. | |||||
| PART I. | FINANCIAL INFORMATION | |||||
Item 1. | Financial Statements | |||||
| 1 | ||||||
Consolidated Balance Sheet - | 2 | |||||
| 3 | ||||||
| 4 | ||||||
| Condensed Notes to Consolidated Financial Statements | 5 | |||||
| Financial Information by Industry Segment | ||||||
Item 2. | Management’s Discussion and Analysis of Financial Condition and Results of Operations | |||||
Item 3. | Quantitative and Qualitative Disclosures About Market Risk | 41 | ||||
| Item 4. | Controls and Procedures | 42 | ||||
| OTHER INFORMATION | |||||
| Item 1. | 43 | |||||
| Risk Factors | 43 | ||||
Item | ||||||
| ||||||
| ||||||
Item 3. | Defaults | * | ||||
Item 4. | Submission of Matters to a Vote of Security Holders | * | ||||
Item 5. | Other Information | * | ||||
Item 6. | Exhibits | |||||
| * | Omitted since no answer is called for, answer is in the negative or inapplicable. |
Consolidated Statement of Operations
(Unaudited)
(In millions, except per share amounts)
| Three Months Ended September 30, | Nine Months Ended September 30, | Three Months Ended March 31, | ||||||||||||||||||||||
| 2006 | 2005 | 2006 | 2005 | 2007 | 2006 | |||||||||||||||||||
Net Sales | $ | 5,867 | $ | 5,925 | $ | 18,107 | $ | 17,650 | $ | 5,217 | $ | 5,526 | ||||||||||||
Costs and Expenses | ||||||||||||||||||||||||
Cost of products sold | 4,335 | 4,444 | 13,513 | 13,162 | 3,851 | 4,168 | ||||||||||||||||||
Selling and administrative expenses | 471 | 459 | 1,431 | 1,408 | 435 | 472 | ||||||||||||||||||
Depreciation, amortization and cost of timber harvested | 308 | 339 | 944 | 1,005 | 262 | 314 | ||||||||||||||||||
Distribution expenses | 291 | 261 | 905 | 776 | 256 | 285 | ||||||||||||||||||
Taxes other than payroll and income taxes | 55 | 58 | 171 | 174 | 42 | 53 | ||||||||||||||||||
Restructuring and other charges | 92 | 70 | 192 | 125 | 18 | 44 | ||||||||||||||||||
Insurance recoveries | — | (188 | ) | (19 | ) | (223 | ) | — | (19 | ) | ||||||||||||||
Net (gains) losses on sales and impairments of businesses | (110 | ) | 5 | 1,248 | 65 | (314 | ) | 1,283 | ||||||||||||||||
Reversal of reserves no longer required, net | — | (3 | ) | — | (3 | ) | ||||||||||||||||||
Interest expense, net | 144 | 121 | 441 | 444 | 61 | 149 | ||||||||||||||||||
Earnings (Loss) From Continuing Operations Before Income Taxes and Minority Interest | 281 | 359 | (719 | ) | 717 | 606 | (1,223 | ) | ||||||||||||||||
Income tax provision | 163 | (377 | ) | 227 | (210 | ) | ||||||||||||||||||
Income tax provision (benefit) | 143 | (16 | ) | |||||||||||||||||||||
Minority interest expense, net of taxes | 5 | 3 | 14 | 8 | 6 | 5 | ||||||||||||||||||
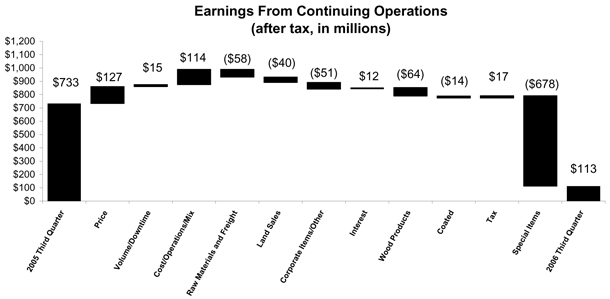
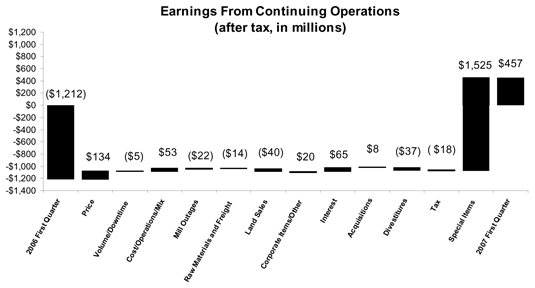
Earnings (Loss) From Continuing Operations | 113 | 733 | (960 | ) | 919 | 457 | (1,212 | ) | ||||||||||||||||
Discontinued operations, net of taxes and minority interest | 88 | 290 | 39 | 258 | (23 | ) | (24 | ) | ||||||||||||||||
Net Earnings (Loss) | $ | 201 | $ | 1,023 | $ | (921 | ) | $ | 1,177 | $ | 434 | $ | (1,236 | ) | ||||||||||
Basic Earnings (Loss) Per Common Share | ||||||||||||||||||||||||
Earnings (loss) from continuing operations | $ | 0.23 | $ | 1.51 | $ | (1.98 | ) | $ | 1.89 | $ | 1.03 | $ | (2.49 | ) | ||||||||||
Discontinued operations | 0.19 | 0.59 | 0.08 | 0.53 | (0.05 | ) | (0.05 | ) | ||||||||||||||||
Net earnings (loss) | $ | 0.42 | $ | 2.10 | $ | (1.90 | ) | $ | 2.42 | $ | 0.98 | $ | (2.54 | ) | ||||||||||
Diluted Earnings (Loss) Per Common Share | ||||||||||||||||||||||||
Earnings (loss) from continuing operations | $ | 0.23 | $ | 1.46 | $ | (1.98 | ) | $ | 1.85 | $ | 1.02 | $ | (2.49 | ) | ||||||||||
Discontinued operations | 0.19 | 0.57 | 0.08 | 0.51 | (0.05 | ) | (0.05 | ) | ||||||||||||||||
Net earnings (loss) | $ | 0.42 | $ | 2.03 | $ | (1.90 | ) | $ | 2.36 | $ | 0.97 | $ | (2.54 | ) | ||||||||||
Average Shares of Common Stock Outstanding - assuming dilution | 484.9 | 507.1 | 485.2 | 507.5 | 448.4 | 486.3 | ||||||||||||||||||
Cash Dividends Per Common Share | $ | 0.25 | $ | 0.25 | $ | 0.75 | $ | 0.75 | $ | 0.25 | $ | 0.25 | ||||||||||||
The accompanying notes are an integral part of these financial statements.
Consolidated Balance Sheet
(Unaudited)
(In millions)
| September 30, 2006 | December 31, 2005 | March 31, 2007 | December 31, 2006 | |||||||||||||
Assets | ||||||||||||||||
Current Assets | ||||||||||||||||
Cash and temporary investments | $ | 736 | $ | 1,641 | $ | 2,390 | $ | 1,624 | ||||||||
Accounts and notes receivable, net | 3,048 | 2,750 | 2,924 | 2,704 | ||||||||||||
Inventories | 2,306 | 2,287 | 2,009 | 1,909 | ||||||||||||
Assets of businesses held for sale | 270 | 3,321 | 100 | 1,778 | ||||||||||||
Deferred income tax assets | 288 | 279 | 491 | 490 | ||||||||||||
Other current assets | 136 | 110 | 163 | 132 | ||||||||||||
Total Current Assets | 6,784 | 10,388 | 8,077 | 8,637 | ||||||||||||
Plants, Properties and Equipment, net | 9,992 | 10,137 | 9,992 | 8,993 | ||||||||||||
Forestlands | 357 | 2,127 | 637 | 259 | ||||||||||||
Forestlands Held for Sale | 1,575 | — | ||||||||||||||
Investments | 648 | 625 | 631 | 641 | ||||||||||||
Goodwill | 3,661 | 3,838 | 3,251 | 2,929 | ||||||||||||
Assets Held for Exchange | — | 1,324 | ||||||||||||||
Deferred Charges and Other Assets | 1,672 | 1,656 | 1,278 | 1,251 | ||||||||||||
Total Assets | $ | 24,689 | $ | 28,771 | $ | 23,866 | $ | 24,034 | ||||||||
Liabilities and Common Shareholders’ Equity | ||||||||||||||||
Current Liabilities | ||||||||||||||||
Notes payable and current maturities of long-term debt | $ | 1,399 | $ | 1,181 | $ | 542 | $ | 692 | ||||||||
Accounts payable | 2,000 | 1,967 | 1,911 | 1,907 | ||||||||||||
Accrued payroll and benefits | 401 | 396 | 303 | 466 | ||||||||||||
Liabilities of businesses held for sale | 98 | 238 | 31 | 333 | ||||||||||||
Other accrued liabilities | 1,137 | 1,094 | 1,120 | 1,243 | ||||||||||||
Total Current Liabilities | 5,035 | 4,876 | 3,907 | 4,641 | ||||||||||||
Long-Term Debt | 9,051 | 11,023 | 6,358 | 6,531 | ||||||||||||
Deferred Income Taxes | 754 | 711 | 3,277 | 2,233 | ||||||||||||
Other Liabilities | 3,790 | 3,599 | 2,163 | 2,453 | ||||||||||||
Minority Interest | 185 | 211 | 236 | 213 | ||||||||||||
Common Shareholders’ Equity | ||||||||||||||||
Common stock, $1 par value, 493.3 shares in 2006 and 490.5 shares in 2005 | 494 | 491 | ||||||||||||||
Common stock, $1 par value, 493.3 shares in 2007 and 2006 | 493 | 493 | ||||||||||||||
Paid-in capital | 6,710 | 6,627 | 6,660 | 6,735 | ||||||||||||
Retained earnings | 1,879 | 3,172 | 3,963 | 3,737 | ||||||||||||
Accumulated other comprehensive loss | (1,817 | ) | (1,935 | ) | (1,452 | ) | (1,564 | ) | ||||||||
| 7,266 | 8,355 | 9,664 | 9,401 | |||||||||||||
Less: Common stock held in treasury, at cost, 2006 - 38.5 shares; 2005 - 0.1 shares | 1,392 | 4 | ||||||||||||||
Less: Common stock held in treasury, at cost, 48.4 shares in 2007 and 39.8 shares in 2006 | 1,739 | 1,438 | ||||||||||||||
Total Common Shareholders’ Equity | 5,874 | 8,351 | 7,925 | 7,963 | ||||||||||||
Total Liabilities and Common Shareholders’ Equity | $ | 24,689 | $ | 28,771 | $ | 23,866 | $ | 24,034 | ||||||||
The accompanying notes are an integral part of these financial statements.
Consolidated Statement of Cash Flows
(Unaudited)
(In millions)
| Nine Months Ended September 30, | Three Months Ended March 31, | |||||||||||||||
| 2006 | 2005 | 2007 | 2006 | |||||||||||||
| Operating Activities | ||||||||||||||||
Net (loss) earnings | $ | (921 | ) | $ | 1,177 | |||||||||||
Net earnings (loss) | $ | 434 | $ | (1,236 | ) | |||||||||||
Discontinued operations, net of taxes and minority interest | (39 | ) | (258 | ) | 23 | 24 | ||||||||||
Net (loss) earnings from continuing operations | (960 | ) | 919 | |||||||||||||
Earnings (loss) from continuing operations | 457 | (1,212 | ) | |||||||||||||
Depreciation and amortization | 944 | 1,005 | 262 | 314 | ||||||||||||
Deferred income tax expense | 132 | 139 | ||||||||||||||
Tax benefit - non-cash settlement of IRS audits | — | (553 | ) | |||||||||||||
Deferred income tax expense (benefit), net | 74 | (10 | ) | |||||||||||||
Restructuring and other charges | 192 | 125 | 18 | 44 | ||||||||||||
Payments related to restructuring and legal reserves | (65 | ) | (133 | ) | (22 | ) | (26 | ) | ||||||||
Insurance recoveries | (19 | ) | (223 | ) | — | (19 | ) | |||||||||
Reversal of reserves no longer required, net | — | (3 | ) | |||||||||||||
Net losses on sales and impairments of businesses held for sale | 1,248 | 65 | ||||||||||||||
Net (gains) losses on sales and impairments of businesses | (314 | ) | 1,283 | |||||||||||||
Periodic pension expense, net | 283 | 182 | 52 | 93 | ||||||||||||
Other, net | 145 | 167 | 51 | (11 | ) | |||||||||||
Changes in current assets and liabilities | ||||||||||||||||
Accounts and notes receivable | (164 | ) | (91 | ) | (81 | ) | (110 | ) | ||||||||
Inventories | (31 | ) | (25 | ) | (129 | ) | 9 | |||||||||
Accounts payable and accrued liabilities | 90 | (609 | ) | (61 | ) | (83 | ) | |||||||||
Other | (201 | ) | (56 | ) | (11 | ) | (87 | ) | ||||||||
Cash provided by operations - continuing operations | 1,594 | 909 | 296 | 185 | ||||||||||||
Cash provided by operations - discontinued operations | 44 | 47 | ||||||||||||||
Cash (used for) provided by operations - discontinued operations | (44 | ) | 61 | |||||||||||||
Cash Provided by Operations | 1,638 | 956 | 252 | 246 | ||||||||||||
Investment Activities | ||||||||||||||||
Invested in capital projects | (802 | ) | (756 | ) | (178 | ) | (168 | ) | ||||||||
Acquisitions, net of cash acquired | — | (39 | ) | |||||||||||||
Proceeds from divestitures | 2,163 | 1,440 | 1,633 | — | ||||||||||||
Other | (241 | ) | 63 | (118 | ) | (100 | ) | |||||||||
Cash provided by investment activities - continuing operations | 1,120 | 708 | ||||||||||||||
Cash provided by (used for) investment activities - continuing operations | 1,337 | (268 | ) | |||||||||||||
Cash used for investment activities - discontinued operations | (19 | ) | (219 | ) | (11 | ) | (31 | ) | ||||||||
Cash Provided by Investment Activities | 1,101 | 489 | ||||||||||||||
Cash Provided by (Used for) Investment Activities | 1,326 | (299 | ) | |||||||||||||
Financing Activities | ||||||||||||||||
Repurchases of common stock | (398 | ) | — | |||||||||||||
Issuance of common stock | 26 | 20 | 30 | 7 | ||||||||||||
Repurchase of common stock | (1,385 | ) | — | |||||||||||||
Issuance of debt | 1,259 | 278 | ||||||||||||||
Reduction of debt | (3,156 | ) | (2,543 | ) | (362 | ) | (743 | ) | ||||||||
Change in book overdrafts | (50 | ) | (30 | ) | 20 | (38 | ) | |||||||||
Dividends paid | (372 | ) | (368 | ) | (114 | ) | (123 | ) | ||||||||
Other | (3 | ) | (44 | ) | (3 | ) | 4 | |||||||||
Cash used for financing activities - continuing operations | (3,681 | ) | (2,687 | ) | (827 | ) | (893 | ) | ||||||||
Cash used for financing activities - discontinued operations | 22 | (172 | ) | |||||||||||||
Cash provided by financing activities - discontinued operations | — | 2 | ||||||||||||||
Cash Used for Financing Activities | (3,659 | ) | (2,859 | ) | (827 | ) | (891 | ) | ||||||||
Effect of Exchange Rate Changes on Cash - Continuing Operations | 14 | (85 | ) | |||||||||||||
Effect of Exchange Rate Changes on Cash - Discontinued Operations | 1 | (5 | ) | |||||||||||||
Effect of Exchange Rate Changes on Cash | 15 | 12 | ||||||||||||||
Change in Cash and Temporary Investments | (905 | ) | (1,504 | ) | 766 | (932 | ) | |||||||||
Cash and Temporary Investments | ||||||||||||||||
Beginning of the period | 1,641 | 2,596 | 1,624 | 1,641 | ||||||||||||
End of the period | 736 | 1,092 | $ | 2,390 | $ | 709 | ||||||||||
Less - Cash, End of Period - Discontinued Operations | — | — | ||||||||||||||
Cash, End of Period - Continuing Operations | $ | 736 | $ | 1,092 | ||||||||||||
The accompanying notes are an integral part of these financial statements.
Consolidated Statement of Changes in Common Shareholders’ Equity
(Unaudited)
(In millions, except share amounts in thousands)
NineThree Months Ended September 30,March 31, 2007
| Common Stock Issued | Paid-in Capital | Retained Earnings | Accumulated Other Income (Loss) | Treasury Stock | Total Common Shareholders’ Equity | |||||||||||||||||||||||
| Shares | Amount | Shares | Amount | |||||||||||||||||||||||||
Balance, December 31, 2006 | 493,340 | $ | 493 | $ | 6,735 | $ | 3,737 | $ | (1,564 | ) | 39,844 | $ | 1,438 | $ | 7,963 | |||||||||||||
Issuance of stock for various plans, net | 2 | — | (75 | ) | — | — | (2,681 | ) | (97 | ) | 22 | |||||||||||||||||
Repurchases of stock | — | — | — | — | — | 11,231 | 398 | (398 | ) | |||||||||||||||||||
Cash dividends - Common stock ($0.25 per share) | — | — | — | (114 | ) | — | — | — | (114 | ) | ||||||||||||||||||
Comprehensive income (loss): | ||||||||||||||||||||||||||||
Net earnings | — | — | — | 434 | — | — | — | 434 | ||||||||||||||||||||
Amortization of pension and post retirement prior service costs and net loss (less tax of $10) | — | — | — | — | 18 | — | — | 18 | ||||||||||||||||||||
Change in cumulative foreign currency translation adjustment (less tax of $0) | — | — | — | — | 88 | — | — | 88 | ||||||||||||||||||||
Net gains on cash flow hedging derivatives: | ||||||||||||||||||||||||||||
Net gain arising during the period (less tax of $1) | — | — | — | — | 10 | — | — | 10 | ||||||||||||||||||||
Less: Reclassification adjustment for gains included in net income (less tax of $0) | — | — | — | — | (4 | ) | — | — | (4 | ) | ||||||||||||||||||
Total comprehensive income | 546 | |||||||||||||||||||||||||||
Adoption of FIN 48 (Note 8) | — | — | — | (94 | ) | — | — | — | (94 | ) | ||||||||||||||||||
Balance, March 31, 2007 | 493,342 | $ | 493 | $ | 6,660 | $ | 3,963 | $ | (1,452 | ) | 48,394 | $ | 1,739 | $ | 7,925 | |||||||||||||
Three Months Ended March 31, 2006
| Common Stock Issued | Paid-in Capital | Retained Earnings | Accumulated Income (Loss) | Treasury Stock | Total Equity | ||||||||||||||||||||||
| Shares | Amount | Shares | Amount | ||||||||||||||||||||||||
Balance, December 31, 2005 | 490,501 | $ | 491 | $ | 6,627 | $ | 3,172 | $ | (1,935 | ) | 112 | $ | 4 | $ | 8,351 | ||||||||||||
Issuance of stock for various plans, net | 2,802 | 3 | 83 | — | — | (115 | ) | (4 | ) | 90 | |||||||||||||||||
Repurchase of stock | — | — | — | — | — | 38,465 | 1,392 | (1,392 | ) | ||||||||||||||||||
Cash dividends - Common stock ($0.75 per share) | — | — | — | (372 | ) | — | — | — | (372 | ) | |||||||||||||||||
Comprehensive income (loss): | |||||||||||||||||||||||||||
Net loss | — | — | — | (921 | ) | — | — | — | (921 | ) | |||||||||||||||||
Change in cumulative foreign currency translation adjustment (less tax of $8) | — | — | — | — | 135 | — | — | 135 | |||||||||||||||||||
Net gains (losses) on cash flow hedging derivatives: | |||||||||||||||||||||||||||
Net loss arising during the period (less tax of $6) | — | — | — | — | (9 | ) | — | — | (9 | ) | |||||||||||||||||
Less: Reclassification adjustment for gains included in net income (less tax of $0) | — | — | — | — | (8 | ) | — | — | (8 | ) | |||||||||||||||||
Total comprehensive income | (803 | ) | |||||||||||||||||||||||||
Balance, September 30, 2006 | 493,303 | $ | 494 | $ | 6,710 | $ | 1,879 | $ | (1,817 | ) | 38,462 | $ | 1,392 | $ | 5,874 | ||||||||||||
Nine Months Ended September 30, 2005
| Common Stock Issued | Paid-in Capital | Retained Earnings | Accumulated Income (Loss) | Treasury Stock | Total Equity | ||||||||||||||||||||
| Shares | Amount | Shares | Amount | ||||||||||||||||||||||
Balance, December 31, 2004 | 487,495 | $ | 487 | $ | 6,562 | $ | 2,562 | $ | (1,357 | ) | 16 | $ | — | $ | 8,254 | ||||||||||
Issuance of stock for various plans, net | 3,004 | 3 | 42 | — | — | 78 | 3 | 42 | |||||||||||||||||
Cash dividends - Common stock ($0.75 per share) | — | — | — | (368 | ) | — | — | — | (368 | ) | |||||||||||||||
Comprehensive income (loss): | |||||||||||||||||||||||||
Net earnings | — | — | — | 1,177 | — | — | — | 1,177 | |||||||||||||||||
Minimum pension liability adjustment (less tax of $1) | — | — | — | — | 3 | — | — | 3 | |||||||||||||||||
Change in cumulative foreign currency translation adjustment (less tax of $1) | — | — | — | — | (215 | ) | — | — | (215 | ) | |||||||||||||||
Net gains (losses) on cash flow hedging derivatives: | |||||||||||||||||||||||||
Net gain arising during the period (less tax of $13) | — | — | — | — | 38 | — | — | 38 | |||||||||||||||||
Less: Reclassification adjustment for gains included in net income (less tax of $29) | — | — | — | — | (64 | ) | — | — | (64 | ) | |||||||||||||||
Total comprehensive income | 939 | ||||||||||||||||||||||||
Balance, September 30, 2005 | 490,499 | $ | 490 | $ | 6,604 | $ | 3,371 | $ | (1,595 | ) | 94 | $ | 3 | $ | 8,867 | ||||||||||
| Common Stock Issued | Paid-in Capital | Retained Earnings | Accumulated Other Comprehensive Income (Loss) | Treasury Stock | Total Common Shareholders’ Equity | |||||||||||||||||||||||
| Shares | Amount | Shares | Amount | |||||||||||||||||||||||||
Balance, December 31, 2005 | 490,501 | $ | 491 | $ | 6,627 | $ | 3,172 | $ | (1,935 | ) | 112 | $ | 4 | $ | 8,351 | |||||||||||||
Issuance of stock for various plans, net | 2,216 | 2 | (28 | ) | — | — | (79 | ) | (3 | ) | (23 | ) | ||||||||||||||||
Cash dividends - Common stock ($0.25 per share) | — | — | — | (123 | ) | — | — | — | (123 | ) | ||||||||||||||||||
Comprehensive income (loss): | ||||||||||||||||||||||||||||
Net earnings | — | — | — | (1,236 | ) | — | — | — | (1,236 | ) | ||||||||||||||||||
Change in cumulative foreign currency translation adjustment (less tax of $2) | — | — | — | — | 81 | — | — | 81 | ||||||||||||||||||||
Net gains (losses) on cash flow hedging derivatives: | ||||||||||||||||||||||||||||
Net gain arising during the period (less tax of $0) | — | — | — | — | — | — | — | — | ||||||||||||||||||||
Less: Reclassification adjustment for gains included in net income (less tax of $1) | — | — | — | — | (1 | ) | — | — | (1 | ) | ||||||||||||||||||
Total comprehensive income | (1,156 | ) | ||||||||||||||||||||||||||
Balance, March 31, 2006 | 492,717 | $ | 493 | $ | 6,599 | $ | 1,813 | $ | (1,855 | ) | 33 | $ | 1 | $ | 7,049 | |||||||||||||
The accompanying notes are an integral part of these financial statements.
Condensed Notes to Consolidated Financial Statements
(Unaudited)
NOTE 1 - BASIS OF PRESENTATION
The accompanying unaudited consolidated financial statements have been prepared in accordance with the instructions to Form 10-Q and, in the opinion of Management, include all adjustments that are necessary for the fair presentation of International Paper’s (the Company)the Company’s financial position, results of operations, and cash flows for the interim periods presented. Except as disclosed in these Condensedthe Notes to Consolidated Financial Statements, such adjustments are of a normal, recurring nature. Results for the first ninethree months of the year may not necessarily be indicative of full year results. It is suggested that these consolidated financial statements be read in conjunction with the audited financial statements and the notes thereto included in International Paper’s (the Company) Annual Report on Form 10-K for the year ended December 31, 2005, and in International Paper’s Current Report on Form 8-K filed on August 14, 2006, to update the historical financial statements included in the Company’s Form 10-K for the year ended December 31, 2005, as amended by Form 10-K/A, to reflect that the Company’s Kraft Papers business is treated as a discontinued operation (collectively the “2005 10-K”), both of which havehas previously been filed with the Securities and Exchange Commission.
Financial information by industry segment is presented on page 23.
See Note 10 for required pro forma21. In connection with sales of businesses under the Transformation Plan and additional disclosures related to stock-based compensation awards.
Prior-year amounts have been restated to presentthe resulting changes in the Company’s Kraftbusiness portfolio, a review of the Company’s operating business segments was conducted during the first quarter of 2007 under the provisions of Statement of Financial Accounting Standards No. 131. While this review resulted in no changes in the Company’s reportable segments, a decision was made to include the Company’s European coated paperboard operations, previously reported in the Printing Papers and Brazilian Coated Papers businesses as discontinuedsegment, with other similar operations (see Note 4).in the Consumer Packaging segment. Accordingly, prior period industry segment information has been revised to reflect this presentation.
NOTE 2 - EARNINGS PER COMMON SHARE
EarningsBasic earnings per common share from continuing operations are computed by dividing earnings from continuing operations by the weighted average number of common shares outstanding. EarningsDiluted earnings per common share from continuing operations assuming dilution, are computed assuming that all potentially dilutive securities, including “in-the-money” stock options, are converted into common shares at the beginning of each period. In addition, the computation of diluted earnings per share reflects the inclusion of contingently convertible securities in periods when dilutive. A reconciliation of the amounts included in the computation of earnings per common share from continuing operations, and diluted earnings per common share from continuing operations assuming dilution, is shown below:as follows:
| Three Months Ended September 30, | Nine Months Ended September 30, | Three Months Ended March 31, | ||||||||||||||||||
In millions, except per share amounts | 2006 | 2005 | 2006 | 2005 | 2007 | 2006 | ||||||||||||||
Earnings (loss) from continuing operations | $ | 113 | $ | 733 | $ | (960 | ) | $ | 919 | $ | 457 | $ | (1,212 | ) | ||||||
Effect of dilutive securities | — | 7 | — | 20 | — | — | ||||||||||||||
Earnings (loss) from continuing operations - assuming dilution | $ | 113 | $ | 740 | $ | (960 | ) | $ | 939 | $ | 457 | $ | (1,212 | ) | ||||||
Average common shares outstanding | 482.5 | 486.0 | 485.2 | 486.0 | 445.3 | 486.3 | ||||||||||||||
Effect of dilutive securities | ||||||||||||||||||||
Profit sharing plan | 2.1 | 1.0 | — | 1.2 | ||||||||||||||||
Restricted performance share plan | 2.7 | — | ||||||||||||||||||
Stock options | 0.3 | 0.1 | — | 0.3 | 0.4 | — | ||||||||||||||
Zero coupon convertible debentures | — | 20.0 | 20.0 | |||||||||||||||||
Average common shares outstanding - assuming dilution | 484.9 | 507.1 | 485.2 | 507.5 | 448.4 | 486.3 | ||||||||||||||
Earnings (loss) per common share from continuing operations | $ | 0.23 | $ | 1.51 | $ | (1.98 | ) | $ | 1.89 | $ | 1.03 | $ | (2.49 | ) | ||||||
Earnings (loss) per common share from continuing operations - assuming dilution | $ | 0.23 | $ | 1.46 | $ | (1.98 | ) | $ | 1.85 | |||||||||||
Diluted earnings (loss) per common share from continuing operations | $ | 1.02 | $ | (2.49 | ) | |||||||||||||||
| Note: |
In July 2006, in connection with the planned use of projected proceeds from the Company’s Transformation Plan, International Paper’s Board of Directors authorized a share repurchase program to acquire up to $3.0 billion of the Company’s stock. In a modified “Dutch Auction” tender offer completed in September 2006, International Paper purchased 38,465,260 shares of its common stock at a price of $36.00 per share, plus costs to acquire the shares, for a total cost of approximately $1.4 billion. Following the completion of this tender offer, International Paper had approximately 454.8 million shares of common stock outstanding.
NOTE 3 - RESTRUCTURING AND OTHER CHARGES
20062007::
During the thirdfirst quarter of 2006,2007, restructuring and other charges totaling $92$18 million before taxes ($5611 million after taxes) were recorded. These charges consisted of a pre-tax charge of $57 million ($35 million after taxes), including severance and other termination benefit costs of approximately $15 million, $25 million of lease termination costs and $17 million of other chargesrecorded for organizational restructuring programs associated with the Company’s Transformation Plan, andPlan. Additionally, a $35$2 million pre-tax chargecredit ($211 million after taxes) was recorded in Interest expense, net, for adjustments to legal reserves (see Note 7).interest received from the Canadian government on refunds of prior-year softwood lumber duties.
During the second quarter of 2006 restructuring and other charges totaling $54 million before taxes ($33 million after taxes) were recorded, consisting of a pre-tax charge of $50 million ($30 million after taxes), including severance and other termination benefit costs of approximately $31 million and $19 million of other charges associated with the Company’s Transformation Plan, and a $4 million pre-tax charge ($3 million after taxes) for legal settlements.:
During the first quarter of 2006, restructuring and other charges totaling $46$44 million before taxes ($2827 million after taxes) were recorded. Included in these charges were a pre-tax charge of $20$18 million ($1211 million after taxes) for organizational restructuring programs, principally severance costs associated with the Company’s Transformation Plan, a pre-tax charge of $8 million ($5 million after taxes) for losses on early extinguishment of debt, and a pre-tax charge of $18 million ($11 million after taxes) for adjustments to legal reserves. Also recorded was a pre-tax credit of $19 million ($12 million after taxes) for net insurance recoveries related to the hardboard siding and roofing litigation (see Note 7)9) and a charge of $6$3 million for tax adjustments.
2005:NOTE 4 – ACQUISITIONS
DuringOn February 1, 2007, the thirdCompany completed the non-cash exchange of certain pulp and paper assets in Brazil with Votorantim Celulose e Papel S.A. (VCP) that had been announced in the fourth quarter of 2005, restructuring2006. The Company exchanged its in-progress pulp mill project and other charges totaling $70certain forestland operations including approximately 100,000 hectares of surrounding forestlands in Tres Lagoas, Brazil, for VCP’s Luiz Antonio uncoated paper and pulp mill and approximately 55,000 hectares of forestlands in the state of Sao Paulo, Brazil. The exchange was accounted for based on the fair value of assets exchanged, resulting in the recognition in the 2007 first quarter of a pre-tax gain of $205 million before taxes ($48164 million after taxes) were recorded. Includedrepresenting the difference between the fair value and book value of the assets exchanged. This gain is included in this charge were a pre-tax chargeNet losses (gains) on sales and impairments of $44 million ($32 million after taxes) for organizational restructuring charges and a pre-tax charge of $26 million ($16 million after taxes) for losses on early extinguishment of debt. Also recordedbusinesses in the thirdaccompanying consolidated statement of operations. The net assets exchanged were included as Assets held for exchange in the accompanying consolidated balance sheet at December 31, 2006.
Based on preliminary estimates, expected to be finalized during the 2007 second quarter were a pre-tax creditupon the completion of $188 million ($109 million after taxes) for insurance recoveries relatedfinal asset appraisals and any post-closing adjustments, the following table summarizes the allocation of the fair value of the assets exchanged to the hardboard sidingassets and roofing litigation (see Note 7)liabilities acquired:
In millions | |||
Accounts receivable | $ | 55 | |
Inventory | 24 | ||
Other current assets | 40 | ||
Plants, properties and equipment, net | 1,000 | ||
Forestlands | 355 | ||
Goodwill | 304 | ||
Other intangible assets | 160 | ||
Other long-term assets | 7 | ||
Total assets acquired | 1,945 | ||
Other current liabilities | 20 | ||
Deferred taxes | 382 | ||
Other liabilities | 23 | ||
Total liabilities assumed | 425 | ||
Net assets acquired | $ | 1,520 | |
Net sales and a $3 million pre-tax credit ($2 million after taxes)earnings before income taxes for the net adjustment of previously provided reserves. In addition, a $517 million net reduction of the income tax provision was recorded, including a credit from an agreement reached with the U.S. Internal Revenue Service concerning the 1997 through 2000 U.S. federal income tax audits, a charge related to cash repatriations from non-U.S. subsidiaries, and a charge relating to a change in Ohio state tax laws. Interest expense, net, also includes a $43 million pre-tax credit ($26 million after taxes) relating to this agreement.
During the second quarter of 2005, a pre-tax charge of $31 million ($19 million after taxes)Luiz Antonio mill for organizational restructuring charges, and a pre-tax credit of $35 million ($21 million after taxes) for insurance recoveries related to the hardboard siding and roofing litigation were recorded. The organizational restructuring charges included $17 million before taxes ($11 million after taxes) recorded in the Printing Papers business segment for severance and other charges associated with the indefinite shutdown of three U.S. paper machines, and $14 million before taxes ($8 million after taxes) in the Forest Products business segment for costs associated with relocating the business headquarters to Memphis, Tennessee from Savannah, Georgia. Additionally, an $82 million increase in the income tax provision was recorded, including approximately $79 million for deferred taxes related to earnings repatriated during the quarter under the American Jobs Creation Act of 2004.
During the first quarter of 2005,2007, and pro-forma amounts as if this transaction has occurred as of the beginning of the period, are not material to consolidated results of operations.
In October and November 2006, International Paper paid approximately $82 million for a special charge50% interest in the International Paper & Sun Cartonboard Co., Ltd. joint venture that currently operates two coated paperboard machines in Yanzhou City, China. In December 2006, a 50% interest was acquired in a second joint venture, Shandong International Paper & Sun Coated Paperboard Co., Ltd., for approximately $28 million. The operating results of $24 million before taxes ($15 million after taxes) was recorded for lossesthese consolidated joint ventures did not have a material effect on early extinguishmentthe Company’s consolidated results of high-coupon-rate debt.operations in 2007 or 2006.
NOTE 45 - BUSINESSES HELD FOR SALE AND DIVESTITURES
Discontinued Operations:
2007:
During the first quarter of 2007, the Company recorded pre-tax credits of $21 million ($9 million after taxes) and $6 million ($4 million after taxes) relating to the sales of its Wood Products and Kraft Papers businesses, respectively. In addition, a $15 million pre-tax charge ($39 million after taxes) was recorded for adjustments to the loss on the completion of the sale of most of the Beverage Packaging business. Finally, a pre-tax credit of approximately $10 million ($6 million after taxes) was recorded for refunds received from the Canadian government of duties paid by the Company’s former Weldwood of Canada Limited business.
2006:
During the fourth quarter of 2006, the Company entered into an agreement to sell its Beverage Packaging business to Carter Holt Harvey Limited for approximately $500 million, subject to certain adjustments. The sale of the North American Beverage Packaging operations subsequently closed on January 31, 2007, with the sale of the remaining non-U.S. operations expected to close later in 2007.
Also during the fourth quarter of 2006, the Company entered into separate agreements for the sale of 13 lumber mills for approximately $325 million, and five wood products plants for approximately $237 million, both subject to various adjustments at closing. Both of the sales were completed in March 2007.
The Company determined that the accounting requirements for both businesses under Statement of Financial Accounting Standards (SFAS) No. 144, “Accounting for the Impairment or Disposal of Long-Lived Assets,” as discontinued operations were met. Accordingly, the operating results for these businesses are included in Discontinued operations for all periods presented.
Revenues, earnings and earnings per share related to the Beverage Packaging business were as follows:
In millions, except per share amounts | Three Months Ended March 31, 2007 | Three Months Ended March 31, 2006 | ||||||
Revenues | $ | 86 | $ | 211 | ||||
Earnings from discontinued operation | ||||||||
Earnings from operation | $ | 15 | $ | 11 | ||||
Income tax expense | (5 | ) | (4 | ) | ||||
Earnings from operation, net of taxes | 10 | 7 | ||||||
Loss on sales and impairments | (15 | ) | — | |||||
Income tax expense | (24 | ) | — | |||||
Loss on sales and impairments, net of taxes | (39 | ) | — | |||||
Earnings (loss) from discontinued operation, net of taxes | $ | (29 | ) | $ | 7 | |||
Earnings (loss) per common share from discontinued operation - assuming dilution | ||||||||
Earnings from operation | $ | 0.02 | $ | 0.01 | ||||
Loss on sales and impairments | (0.08 | ) | — | |||||
Earnings (loss) per common share from discontinued operation, net of taxes and minority interest - assuming dilution | $ | (0.06 | ) | $ | 0.01 | |||
Revenues, earnings and earnings per share related to the Wood Products business were as follows: |
| |||||||
In millions, except per share amounts | Three Months Ended March 31, 2007 | Three Months Ended March 31, 2006 | ||||||
Revenues | $ | 201 | $ | 394 | ||||
Earnings (loss) from discontinued operation | ||||||||
Earnings (loss) from operation | $ | (22 | ) | $ | 36 | |||
Income tax benefit (expense) | 9 | (14 | ) | |||||
Earnings (loss) from operation, net of taxes | (13 | ) | 22 | |||||
Gain on sales and impairments | 21 | — | ||||||
Income tax expense | (12 | ) | — | |||||
Gain on sales and impairments, net of taxes | 9 | — | ||||||
Earnings (loss) from discontinued operation, net of taxes | $ | (4 | ) | $ | 22 | |||
Earnings (loss) per common share from discontinued operation - assuming dilution | ||||||||
Earnings (loss) from operation | $ | (0.03 | ) | $ | 0.05 | |||
Gain on sales and impairments | 0.02 | — | ||||||
Earnings (loss) per common share from discontinued operation, net of taxes - assuming dilution | $ | (0.01 | ) | $ | 0.05 | |||
During the 2006 third quarter, International Paper completed the previously announced sale of its Brazilian Coated Papers business to Stora Enso Oyj for approximately $420 million, subject to certain post-closing adjustments. The business includes a coated paper mill and lumber mill in Arapoti, Parana State, Brazil, as well as 50,000 hectares (approximately 124,000 acres) of forestland in Parana.business. The operating results of this business for all periods presented are included in Discontinued operations infor all periods presented.
Revenues, earnings and earnings per share related to the accompanying consolidated statementBrazilian Coated Papers business were as follows:
In millions, except per share amounts | Three Months Ended March 31, 2006 | |||
Revenues | $ | 42 | ||
Earnings from discontinued operation | ||||
Earnings from operation | $ | 10 | ||
Income tax expense | (6 | ) | ||
Earnings from operation, net of taxes | 4 | |||
Gain on sale | — | |||
Income tax expense | — | |||
Gain on sale, net of taxes | — | |||
Earnings from discontinued operation, net of taxes | $ | 4 | ||
Earnings per common share from discontinued operation - assuming dilution | ||||
Earnings from operation | $ | 0.01 | ||
Gain on sale | — | |||
Earnings per common share from discontinued operation, net of taxes - assuming dilution | $ | 0.01 | ||
During the first quarter of operations, including2006, the Company determined that the accounting requirements under SFAS No. 144 for reporting the Kraft Papers business as a discontinued operation were met. Accordingly, a $100 million pre-tax gain of $101 millioncharge ($8061 million after taxes) was recorded in the 2006 third quarter as a result of the sale. Revenues associated with this business were $33 million and $127 million, respectively for the three-month and nine-month periods ended September 30, 2006. Revenues for the comparable 2005 periods were $57 million and $149 million, respectively.
During the 2006 second quarter, the Company signed a definitive agreement to sell its Kraft Papers business for approximately $155 million in cash, subject to certain closing and post-closing adjustments, and two additional payments totaling up to $60 million payable five years from the date of closing contingent upon business performance. The operating results of this business for all periods presented are included in Discontinued operations in the accompanying consolidated statement of operations, including a pre-tax charge of $101 million ($62 million after taxes) recorded in the 2006 first quarter to reduce the carrying value of the business’s net assets of this business to their estimated fair values. Additionally, a pre-tax chargevalue. The sale of $16 million ($10 million after taxes)this business was recordedcompleted in January 2007. The operating results of this business are included in Discontinued operations in the 2006 second quarter to further reduce the carrying value of the assets of this business based on the terms of the definitive agreement
discussed above. Revenues, associated with the Kraft Papers business were $62 millionearnings and $174 million, respectively for the three-month and nine-month periods ended September 30, 2006. Revenues for the comparable 2005 periods were $54 million and $165 million, respectively.
Earnings and diluted earnings per share related to the Kraft Papers and Brazilian Coated Papers operationsbusiness were as follows:
| Three Months Ended September 30, | Nine Months Ended September 30, | |||||||||||||||
In millions, except per share amounts | 2006 | 2005 | 2006 | 2005 | ||||||||||||
Earnings (loss) from discontinued operations | ||||||||||||||||
Earnings from operations | $ | 14 | $ | 14 | $ | 49 | $ | 33 | ||||||||
Gain (loss) on sales or impairments | 101 | — | (16 | ) | — | |||||||||||
Income tax (expense) benefit | (27 | ) | (5 | ) | 6 | (11 | ) | |||||||||
Earnings from discontinued operations, net of taxes | $ | 88 | $ | 9 | $ | 39 | $ | 22 | ||||||||
Earnings (loss) per common share from discontinued operations - assuming dilution | ||||||||||||||||
Earnings from operations, net of taxes | $ | 0.02 | $ | 0.02 | $ | 0.06 | $ | 0.05 | ||||||||
Gain on sales or impairments, net of taxes | 0.17 | — | 0.02 | — | ||||||||||||
Earnings per common share from discontinued operations, net of taxes - assuming dilution | $ | 0.19 | $ | 0.02 | $ | 0.08 | $ | 0.05 | ||||||||
In millions, except per share amounts Three Months Ended March 31, 2007 Three Months Ended March 31, 2006 Revenues Earnings from discontinued operation Earnings from operation Income tax expense Earnings from operation, net of taxes Gain (loss) on sales and impairments Income tax (expense) benefit Gain (loss) on sales and impairments, net of taxes Earnings (loss) from discontinued operation, net of taxes Earnings (loss) per common share from discontinued operation - assuming dilution Earnings from operation Gain (loss) on sales and impairments Earnings (loss) per common share from discontinued operation, net of taxes - assuming dilutionAt September 30, 2006 and December 31, 2005, assets of businesses held for sale totaled $270 million and $3.3 billion, respectively, and liabilities of businesses held for sale totaled $98 million and $238 million, respectively, and included the Kraft Papers business, the Brazilian Coated Papers business, the Coated and Supercalendered Papers business and certain smaller businesses, as follows: $ — $ 55 $ — $ 7 — (3 ) — 4 6 (100 ) (2 ) 39 4 (61 ) $ 4 $ (57 ) $ — $ 0.01 0.01 (0.13 ) $ 0.01 $ (0.12 )
In millions | September 30, 2006 | December 31, 2005 | ||||
Accounts receivable, net | $ | 48 | $ | 176 | ||
Inventories | 52 | 161 | ||||
Plants, properties and equipment, net | 114 | 1,664 | ||||
Forestland | 38 | 63 | ||||
Goodwill | — | 1,205 | ||||
Other assets | 18 | 52 | ||||
Assets of businesses held for sale | $ | 270 | $ | 3,321 | ||
Accounts payable | $ | 35 | $ | 137 | ||
Accrued payroll and benefits | 14 | 37 | ||||
Other accrued liabilities | 23 | 29 | ||||
Other liabilities | 26 | 35 | ||||
Liabilities of businesses held for sale | $ | 98 | $ | 238 | ||
2005:
In the third quarter of 2005, International Paper completed the sale of its 50.5% interest in Carter Holt Harvey Limited (CHH) for approximately U.S. $1.1 billion. The pre-tax gain on the sale of $29 million ($361 million after taxes and minority interest), including a $186 million pre-tax credit from cumulative translation adjustments, was included in Discontinued operations, together with CHH’s operating results prior to the sale. Revenues associated with the discontinued operation were $541 million and $1.7 billion for the three-month and nine-month periods ended September 30, 2005. Earnings and diluted earnings per share related to these operations were as follows:
In millions, except per share amounts Earnings (loss) from discontinued operations Earnings (loss) from operations Gain on sale of business Income tax expense Minority interest, net of taxes Loss from discontinued operations, net of taxes and minority interest Earnings (loss) per common share from discontinue operation - assuming dilution Loss from operations, net of taxes Gain on sale, net of taxes and minority interest Earnings per common share from discontinued operations, net of taxes and minority interest - assuming dilution Three Months Ended
September 30, 2005 Nine Months Ended
September 30, 2005 $ (11 ) $ (43 ) 29 29 265 242 (2 ) 8 $ 281 $ 236 $ (0.16 ) $ (0.25 ) 0.71 0.71 $ 0.55 $ 0.46
Other Transactions:Divestitures and Impairments of Businesses:
20062007::
During the thirdfirst quarter of 2006,2007, a net$103 million pre-tax gain of $110 million (a loss of $13($96 million after taxes) was recorded for gains (losses) on sales and impairments of businesses. This net gain included pre-tax credits of $304 million ($185 million after taxes) for gains on sales of U.S. forestlands included in the Transformation Plan, the recognition of a previously deferred $110 million pre-tax gain ($68 million after taxes) related to a 2004 sale of forestlands in Maine, pre-tax losses of $165 million and $115 million ($165 million and $82 million after taxes) to adjust the carrying values of the Company’s Wood Products and Beverage Packaging businesses to estimated fair values based on preliminary bids received, a pre-tax charge of $38 million ($23 million after taxes) to reflectupon the completion of the sale of the Company’s Coated and Supercalendered Papers businessArizona Chemical business. As part of the transaction, International Paper acquired a minority interest of approximately 10% in the 2006 third quarter, and a net pre-tax gain of $14 million (a loss of $2 million after taxes) related to other smaller sales.
Also duringresulting new entity. Since the third quarter of 2006, International Paper Investments (Holland) B.V. (IPI), a wholly-owned subsidiary of International Paper, announced that it had entered into an agreement with Votorantim Celulose e Papel S.A. (VCP) to exchange IPI’s pulp mill project being developed in Tres Lagoas, state of Mato Grosso do Sul, Brazil (together with approximately 100,000 hectares of forestlands) for VCP’s Luiz Antonio pulp and uncoated paper mill and approximately 60,000 hectares of forestlands locatedinterest acquired represents significant continuing involvement in the stateoperations of Sao Paulo, Brazil. IPI will fund the Tres Lagoas pulp mill projectbusiness under U.S. Generally Accepted Accounting Principles, the operating results for Arizona Chemical are included in continuing operations in the amountaccompanying consolidated statement of U.S. $1.15 billion. This transaction isoperations. Final sale proceeds are subject to post-closing adjustments, expected to close by February 1, 2007.be finalized in the 2007 second quarter.
During the second quarter of 2006,In addition, a net$6 million pre-tax charge of $75 millioncredit ($514 million after taxes) was recorded including a pre-tax creditto adjust previously estimated gains/losses of $62 million ($39 million after taxes)businesses previously sold.
These gains are included, along with the gain on the exchange for gainsthe Luiz Antonio mill in Brazil (see Note 4), in Net losses (gains) on sales and impairments of U.S. forestlands includedbusinesses in the Transformation Plan, a pre-tax chargeaccompanying consolidated statement of $85 million ($53 million after taxes) recorded to adjust the carrying value of the assets of the Company’s Coated and Supercalendered Papers business to their estimated fair value based on the terms of the definitive sales agreement signed in the second quarter, and a pre-tax charge of $52 million ($37 million after taxes) recorded to write down the carrying value of certain assets in Brazil to their estimated fair value. The assets in Brazil were written down to estimated net realizable value upon sale since the sale of these assets was considered probable at June 30, 2006.operations.
2006:
During the first quarter, of 2006, a pre-tax special charge of $1.3 billion was recorded to write down the assets of the Company’s Coated and Supercalendered Papers business to their estimated fair value.value, as management had committed to a plan to sell this business. In addition, other pre-tax charges totaling $3 million ($2 million after taxes) were recorded to adjust estimated losses of certain smaller operations that are held for sale.
InAt December 31, 2006, assets and liabilities of businesses held for sale included the 2006 first quarter, the Company had reported its Coated and SupercalenderedKraft Papers business, as a discontinued operation based on a plan to sell the business. InBeverage Packaging business, the second quarterWood Products business, and the Arizona Chemical business, and consisted of:
In millions | December 31, 2006 | ||
Accounts receivable, net | $ | 298 | |
Inventories | 401 | ||
Plants, properties and equipment, net | 995 | ||
Goodwill | 10 | ||
Other assets | 74 | ||
Assets of businesses held for sale | $ | 1,778 | |
Accounts payable | $ | 184 | |
Accrued payroll and benefits | 50 | ||
Other accrued liabilities | 32 | ||
Other liabilities | 67 | ||
Liabilities of businesses held for sale | $ | 333 | |
Assets and liabilities of 2006, the Company signed a definitive agreement to sell this business for approximately $1.4 billion, subject to certain post-closing adjustments, and agreed to acquire a 10% limited partnership interest in CMP Investments L.P., the parent company that will own this business. Since this limited partnership interest will represent significant continuing involvement in the operations of this business under U.S. generally accepted accounting principles, the operating results for Coated and Supercalendered Papers are required to be included in continuing operations in the accompanying consolidated statement of operations. Accordingly, the operating results for this business, including a charge in the first quarter of $1.3 billion before and after taxes to write down the assets of the business to their estimated fair value, are now included in continuing operations for all periods presented. This sale was subsequently completed on August 1, 2006.
In March 2006, International Paper, The Nature Conservancy and The Conservation Fund reached an agreement to sell approximately 218,000 acres of forestlands across 10 U.S. states. The Nature Conservancy will acquire more than 173,000 acres in North Carolina, Virginia, Georgia, Florida, Alabama, Arkansas, Tennessee, Louisiana and Mississippi. The Conservation Fund will acquire more than 5,000 acres in Florida and 500 acres in North Carolina. The two groups will jointly purchase an additional 39,000 acres in South Carolina. Also in March 2006, International Paper announced an agreement to sell 69,000 acres of forestlands in Wisconsin to The Nature Conservancy for approximately $83 million.
On April 4, 2006 International Paper announced definitive agreements with two separate investor groups under which it will sell a total of approximately 5.1 million acres of forestlands for aggregate proceeds of approximately $6.1 billion. Under one of the agreements, International Paper will sell approximately 3.8 million acres of forestlands located in the southern U.S. and 440,000 acres in Michigan to an investor group led by Resource Management Service, LLC (RMS) for approximately $5 billion in cash and notes at closing. Under a separate agreement, International Paper will sell approximately 900,000 acres of forestlands in Louisiana, Texas and Arkansas to an investor group led by TimberStar for approximately $1.1 billion in cash and notes at closing.
On April 11, 2006, International Paper announced a definitive agreement with The Lyme Timber Company, for the benefit of the Lyme Forest Fund L.P., for the sale of approximately 275,000 acres of forestlands in New York’s Adirondack Park for approximately $137 million.
During the third quarter of 2006, the Company completed sales of approximately 477,000 acres of forestlands under the Nature Conservancy, Conservation Fund and Lyme Forest Fund L.P. agreements for approximately $401 million, including an installment note receivable of $136 million, resulting in a pre-tax gain of approximately $304 million ($185 million after taxes). During the second quarter of 2006, the Company completed the sales of approximately 75,000 acres of forestlands under the above agreements for approximately $97 million, resulting in a pre-tax gain of approximately $62 million ($39 million after taxes).
The remaining sales under the agreements discussed above are expected to be completed during the fourth quarter of 2006. This will substantially complete International Paper’s sales of U.S. forestlands identified as part of the Company’s Transformation Plan. Anticipated total proceeds from all of these sale agreements, covering about 5.7 million acres or over 85% of the Company’s U.S. forestland holdings, are approximately $6.6 billion. The carrying value of these forestlands is included in the accompanying consolidated balance sheet as of September 30, 2006 under the caption Forestlandsbusinesses held for sale. The amount of gain that will be recognizedsale by the Company upon the completion of these transactions will be dependent upon the final amount of proceeds received, costs incurred and transactions terms, and the portion, if any, of the gain that will be required to be deferred under applicable accounting standards. International Paper has retained approximately 660,000 acres of forestlands at September 30, 2006, some of which may be later sold in separate transactions to maximize the proceeds from the land.
2005:
In the third quarter of 2005, charges totaling $5 million before taxes ($3 million after taxes) were recorded for adjustments of losses on businesses previously sold.
In the second quarter of 2005, a $19 million pre-tax credit ($12 million after taxes) was recorded, including a $25 million credit before taxes ($15 million after taxes) from the collection of a note receivable from the 2001 sale of the Flexible Packaging business, final charges related to the sale of Fine Papers and Industrial Papers, as well as net adjustments of losses from businesses previously sold.
During the first quarter of 2005, International Paper announced an agreement to sell its Fine Papers business to Mohawk Paper Mills, Inc. of Cohoes, New York. A $24 million pre-tax loss ($13 million after taxes) was recorded in the first quarter to write down the net assets of the Fine Papers business to their estimated net realizable value. The sale of Fine Papers was completed in the second quarter of 2005.
Also during the first quarter of 2005, International Paper announced that it had signed an agreement to sell its Industrial Papers business to an affiliate of Kohlberg and Company, LLC. A $49 million pre-tax loss ($35 million after taxes) was recorded in the first quarter to write down the net assets of the Industrial Papers business and related corporate assets to their estimated net realizable value. The sale of Industrial Papers was completed in the second quarter of 2005.
Also in the first quarter of 2005, charges totaling $6 million before taxes ($4 million after taxes) were recorded for adjustments to estimated losses on sales of certain smaller operations.
In millions | December 31, 2006 | |||||
| Assets | Liabilities | |||||
Kraft | $ | 148 | $ | 16 | ||
Arizona Chemical | 496 | 159 | ||||
Beverage Packaging | 572 | 107 | ||||
Wood Products | 562 | 51 | ||||
Total | $ | 1,778 | $ | 333 | ||
NOTE 56 - SUPPLEMENTAL FINANCIAL STATEMENT INFORMATION
Inventories by major category were:
In millions | September 30, 2006 | December 31, 2005 | March 31, 2007 | December 31, 2006 | ||||||||
Raw materials | $ | 380 | $ | 376 | $ | 292 | $ | 265 | ||||
Finished pulp, paper and packaging products | 1,519 | 1,534 | 1,398 | 1,341 | ||||||||
Finished lumber and panel products | 17 | 31 | ||||||||||
Operating supplies | 319 | 276 | 288 | 271 | ||||||||
Other | 71 | 70 | 31 | 32 | ||||||||
Total | $ | 2,306 | $ | 2,287 | $ | 2,009 | $ | 1,909 | ||||
Temporary investments with an original maturity of three months or less are treated as cash equivalents and are stated at cost. Temporary investments totaled $473 million$1.8 billion and $1.4 billion at September 30, 2006March 31, 2007 and December 31, 2005,2006, respectively.
Interest payments made during the nine-monththree-month periods ended September 30,March 31, 2007 and 2006 and 2005 were $507$108 million and $630$159 million, respectively. The 2005 interest payments include a $52 million payment to the U.S. Internal Revenue Service related to the settlement of the 1997 – 2000 U.S. federal income tax audits. Capitalized net interest costs were $13$11 million and $8$3 million for the ninethree months ended September 30,March 31, 2007 and 2006, and 2005, respectively. Total interest expense was $498$114 million for the first ninethree months of 20062007 and $507$171 million for the first ninethree months of 2005, net of a $43 million credit related to the settlement of the tax audits described above.2006. Preferred Securities distributions paid by Southeast Timber, Inc., a consolidated subsidiary of International Paper, were $10 million and $7$3 million during the first ninethree months of 2006both 2007 and 2005, respectively.2006. The expense related to these preferred securities was included in minority interest expense in the consolidated statement of operations. Income tax payments of $114$33 million and $357$37 million were made during the first ninethree months of 2007 and 2006, and 2005, respectively.
Accumulated depreciation was $17.9$14.3 billion at September 30, 2006March 31, 2007 and $18.2$14.0 billion at December 31, 2005.2006. The allowance for doubtful accounts was $100$86 million at September 30, 2006March 31, 2007 and $98$85 million at December 31, 2005.2006.
The following tables present changes in the goodwill balances as allocated to each business segment for the nine-monththree-month periods ended September 30, 2006March 31, 2007 and 2005:
2006:
In millions | Balance December 31, 2005 | Reclassifications and Other (a) | Additions/ (Reductions) | Balance September 30, 2006 | Balance December 31, 2006 | Reclassifications Other (a) | Additions/ (Reductions) | Balance March 31, 2007 | |||||||||||||||||||
Printing Papers | $ | 1,674 | $ | 1 | $ | — | $ | 1,675 | $ | 1,500 | $ | (47 | ) | $ | 304 | (b) | $ | 1,757 | |||||||||
Industrial Packaging | 676 | 3 | 11 | (b) | 690 | 670 | — | (3 | )(c) | 667 | |||||||||||||||||
Consumer Packaging | 987 | 1 | (28 | )(c) | 960 | 451 | 60 | 8 | (d) | 519 | |||||||||||||||||
Distribution | 299 | — | — | 299 | 308 | — | — | 308 | |||||||||||||||||||
Forest Products | 191 | — | (165 | )(c) | 26 | ||||||||||||||||||||||
Corporate | 11 | — | — | 11 | |||||||||||||||||||||||
Total | $ | 3,838 | $ | 5 | $ | (182 | ) | $ | 3,661 | $ | 2,929 | $ | 13 | $ | 309 | $ | 3,251 | ||||||||||
| (a) | Represents the effects of foreign currency translations and |
| (b) | Reflects a |
| (c) | Reflects a |
| Reflects |
2005:
In millions | Balance December 31, 2004 | Reclassifications and Other (a) | Additions/ (Reductions) | Balance September 30, 2005 | Balance December 31, 2005 | Reclassifications Other (a) | Additions/ (Reductions) | Balance March 31, 2006 | |||||||||||||||||||
Printing Papers | $ | 1,671 | $ | 3 | $ | — | $ | 1,674 | $ | 1,674 | $ | — | $ | — | $ | 1,674 | |||||||||||
Industrial Packaging | 591 | (5 | ) | 16 | (b) | 602 | 677 | 1 | 1 | (b) | 679 | ||||||||||||||||
Consumer Packaging | 1,014 | (4 | ) | 51 | (c) | 1,061 | 960 | — | — | 960 | |||||||||||||||||
Distribution | 299 | — | — | 299 | 299 | — | — | 299 | |||||||||||||||||||
Forest Products | 190 | 1 | — | 191 | |||||||||||||||||||||||
Corporate | 24 | — | (13 | )(d) | 11 | 11 | — | — | 11 | ||||||||||||||||||
Total | $ | 3,789 | $ | (5 | ) | $ | 54 | $ | 3,838 | $ | 3,621 | $ | 1 | $ | 1 | $ | 3,623 | ||||||||||
| (a) | Represents the effects of foreign currency translations and reclassifications. |
| (b) | Reflects the completion of the accounting for the acquisition of |
Goodwill totaling approximately $1.2 billion at December 31, 2005 relating to the Company’s Coated and Supercalendered Papers business was written off in connection with the 2006 first-quarter $1.3 billion pre-tax charge to reduce the net assets of that business to estimated fair value (see Note 4).
The following table presents an analysis of activity related to the Company’s asset retirement obligations:
| Nine Months Ended September 30, | Three Months Ended March 31, | ||||||||||||||
In millions | 2006 | 2005 | 2007 | 2006 | |||||||||||
Asset retirement obligation, January 1 | $ | 33 | $ | 30 | $ | 29 | $ | 33 | |||||||
New liabilities | 1 | 6 | — | — | |||||||||||
Liabilities settled | (3 | ) | (4 | ) | — | (1 | ) | ||||||||
Net adjustments to existing liabilities | 1 | (4 | ) | — | — | ||||||||||
Accretion expense | 1 | 1 | — | 1 | |||||||||||
Asset retirement obligation, September 30 | $ | 33 | $ | 29 | |||||||||||
Asset retirement obligation, March 31 | $ | 29 | $ | 33 | |||||||||||
This obligation is included in Other liabilities in the accompanying consolidated balance sheet.
The components of the Company’s postretirement benefit expense were as follows:
| Three Months Ended September 30, | Nine Months Ended September 30, | |||||||||||||||||||||||
In millions | Three Months Ended March 31, | |||||||||||||||||||||||
| 2006 | 2005 | 2006 | 2005 | 2007 | 2006 | |||||||||||||||||||
Service cost | $ | 1 | $ | 1 | $ | 2 | $ | 2 | $ | — | $ | 1 | ||||||||||||
Interest cost | 8 | 10 | 24 | 29 | 9 | 9 | ||||||||||||||||||
Actuarial loss | 6 | 5 | 17 | 15 | 5 | 4 | ||||||||||||||||||
Amortization of prior service cost | (13 | ) | (10 | ) | (37 | ) | (30 | ) | (11 | ) | (9 | ) | ||||||||||||
Net postretirement benefit cost (a) | $ | 2 | $ | 6 | $ | 6 | $ | 16 | $ | 3 | $ | 5 | ||||||||||||
| (a) | Excludes a |
NOTE 67 – RECENT ACCOUNTING DEVELOPMENTS
Employers’ AccountingFair Value Option for Defined Benefit PensionFinancial Assets and Other Postretirement Plans:Financial Liabilities:
In September 2006,February 2007, the Financial Accounting Standards Board (FASB) issued SFAS No. 158, “Employers’ Accounting159, “The Fair Value Option for Defined Benefit PensionFinancial Assets and Other Postretirement PlansFinancial Liabilities – Including an Amendment of FASB StatementsStatement No. 87, 88, 106, and 132(R).115.” This Statement requires a calendar year-end companystatement permits an entity to measure certain financial assets and financial liabilities at fair value which would result in the reporting of unrealized gains and losses in earnings at each subsequent reporting date. The fair value option may be elected on an instrument-by-instrument basis, with publicly traded equity securities that sponsors a postretirement benefit planfew exceptions, as long as it is applied to fully recognize, as an asset or liability, the overfunded or underfunded status of its benefit plan(s)instrument in its 2006 year-end balance sheet. It also requires a companyentirety. The statement establishes presentation and disclosure requirements to measurehelp financial statement users understand the effect of an entity’s election on its plan assets and benefit obligationsearnings, but does not eliminate the disclosure requirements of other accounting standards. This statement will be effective as of its year-end balance sheet datethe beginning withof the first fiscal years endingyear that begins after DecemberNovember 15, 2008.2007, and is to be applied prospectively as of the beginning of the year in which it is initially applied. The Company is currently evaluating the provisions of this Statement.statement.
Fair Value Measurements:
In September 2006, the FASB also issued SFAS No. 157, “Fair Value Measurements,” which provides a single definition of fair value, together with a framework for measuring it, and requires additional disclosure about the use of fair value to measure assets and liabilities. It also emphasizes that fair value is a market-based measurement, not an entity-specific measurement, and sets out a fair value hierarchy with the highest priority being quoted prices in active markets. This Statement isstatement will be effective for financial statements issued for fiscal years beginning after November 15, 2007, and interim periods within those fiscal years, and is to be applied prospectively as of the beginning of the year in which it is initially applied. The Company is currently evaluating the provisions of this statement.
Accounting for Planned Major Maintenance Activities:
In September 2006, the FASB issued FSPFASB Staff Position (FSP) No. AUG AIR-1, “Accounting for Planned Major Maintenance Activities,” which prohibits the use of the accrue-in-advance method of accounting for planned major maintenance activities in annual and interim reporting periods. The FSP permits the application of three alternative methods of accounting for planned major maintenance activities: the direct expense, built-in-overhaul, and deferral methods. The FSP iswas effective for the first fiscal year beginning after December 15, 2006. International Paper is currently evaluatingadopted the direct expense method of accounting for these costs in the first quarter of 2007 with no impact on its annual consolidated financial statements. See Note 13 for a discussion of the effects of implementing the provisions of this FSP.accounting change on quarterly financial information.
Accounting for Uncertainty in Income Taxes:
In June 2006, the FASB issued FASB Interpretation No. 48 (FIN 48), “Accounting for Uncertainty in Income Taxes, an interpretationInterpretation of FASB Statement No. 109.” FIN 48 prescribes a recognition threshold and measurement attribute for the financial statement recognition and measurement of a tax position taken or expected to be taken in a tax return. This Interpretationinterpretation also provides guidance on classification, interest and penalties, accounting in interim periods and transition, and significantly expands income tax disclosure requirements. It applies to all tax positions accounted for in accordance with SFAS No. 109 and iswas effective for fiscal years beginning after December 15, 2006. The Company is currently evaluating the effects of implementingInternational Paper applied the provisions of this Interpretation.interpretation beginning January 1, 2007. See Note 8 for a discussion of the effects of this accounting change.
Accounting for Certain Hybrid Financial Instruments:
In February 2006, the FASB issued SFAS No. 155, “Accounting for Certain Hybrid Financial Instruments – an Amendment of FASB Statements No. 133 and 140,” which provides entities with relief from having to separately determine the fair value of an embedded derivative that would otherwise be required to be bifurcated from its host contract in accordance with SFAS No. 133. This Statementstatement allows an entity to make an irrevocable election to measure such a hybrid financial instrument at fair value in its entirety, with changes in fair value recognized in earnings. This Statement isstatement was effective for International Paper for all financial instruments acquired, issued, or subject to a remeasurement event occurring after the beginning of an entity’s first fiscal year that begins after September 15, 2006. International Paper believes that theJanuary 1, 2007. The adoption of SFAS No. 155 in 2007 willdid not have a material impact on itsthe Company’s consolidated financial statements.
Exchanges of Nonmonetary Assets:NOTE 8 – INCOME TAXES
In December 2004, theInternational Paper adopted FASB issued SFASInterpretation No. 153, “Exchanges of Nonmonetary Assets, an Amendment of APB Opinion No. 29,” that replaces the exception from fair value measurement in APB Opinion No. 29,48, “Accounting for Nonmonetary Transactions,Uncertainty in Income Taxes,” for nonmonetary exchangeson January 1, 2007. The adoption of similar productive assets withthis standard resulted in a general exception from fair value measurement for exchangescharge to the beginning balance of nonmonetary assetsretained earnings of $94 million at the date of adoption. Including this cumulative effect amount, total unrecognized tax benefits at the date of adoption were $919 million. Of this total, $562 million represents unrecognized tax benefits that, do not have commercial substance. A nonmonetary exchange has commercial substance if recognized, would reduce the future cash flows ofCompany’s effective tax rate.
The major jurisdictions where the entityCompany files income tax returns are expectedthe United States, Brazil, France, Poland and Russia. Generally, tax years 2001 through 2006 remain open and subject to change significantly asexamination by the relevant tax authorities. The Company is typically engaged in various tax examinations at any given time, both in the United States and overseas. As a result of tax audit closings, settlements, and the exchange. International Paper appliedexpiration of statutes to examine such returns in various jurisdictions over the provisionsnext 12 months, the Company estimates that the amount of SFAS No. 153 prospectively in the first quarterunrecognized tax benefits could be reduced by approximately $150 million.
The Company accrues interest on unrecognized tax benefits as a component of 2006, with no material effect on its consolidated financial statements.
Inventory Costs:
In November 2004, the FASB issued SFAS No. 151, “Inventory Costs, an Amendment of ARB No. 43, Chapter 4.” This Statement requires that abnormal amounts of idle facility expense, freight, handling costs and wasted materialinterest expense. Penalties, if incurred, would be recognized as current-period charges. This Statement also introduces the concepta component of “normal capacity” and requires the allocation of fixed production overhead to inventory based on the normal capacityincome tax expense. As of the production facilities. Unallocated overhead must be recognized as an expensedate of adoption of this standard, the Company had approximately $88 million of such accrued interest and penalties included in the period in which it is incurred. International Paper adopted SFAS No. 151 in the first quarter of 2006,Other accrued liabilities associated with no material effect on its consolidated financial statements.unrecognized tax benefits.
Share-Based Payment Transactions:
In December 2004, the FASB issued SFAS No. 123 (revised 2004), “Share-Based Payment,” that requires compensation costs related to share-based payment transactions to be recognized in the financial statements. The amount of the compensation cost is measured based on the grant-date fair value of the equity or liability instruments issued. In addition, liability awards are remeasured each reporting period. Compensation cost is recognized over the period that an employee provides service in exchange for the award. This Statement applies to all awards granted after the required effective date and to awards modified, repurchased, or cancelled after that date. International Paper adopted SFAS No. 123(R) in the first quarter 2006, with no material effect on its consolidated financial statements. See Note 10 for a further discussion of stock-based compensation plans.
NOTE 79 - COMMITMENTS AND CONTINGENCIES
Under the terms of the sale agreement for the Beverage Packaging business, the purchase price received by the Company is subject to a post-closing adjustment if adjusted annualized earnings of the Beverage Packaging business for the first six months of 2007 are less than a targeted amount. The adjustment, if any, would equal five times the shortfall from the targeted amount. Management does not currently believe that any such adjustment is probable based upon current operating results. However, such an adjustment could be required in 2007 if expected second-quarter results are not met.
Exterior Siding and Roofing Litigation:
International Paper has established reserves relating to the settlement, during 1998 and 1999, of three nationwide class action lawsuits against the Company and Masonite Corp., a former wholly-owned subsidiary of the Company. Those settlements relate to (1) exterior hardboard siding installed during the 1980’s (the “1980’s1980’s Hardboard Claims”)Claims) and during the 1990’s (the “1990’s1990’s Hardboard Claims,” and together with the 1980’s Hardboard Claims, the “Hardboard Claims”)Hardboard Claims); (2) Omniwood siding installed during the 1990’s (the “Omniwood Claims”)Omniwood Claims); and (3) Woodruf roofing installed during the 1980’s and 1990’s (the “Woodruf Claims”)Woodruf Claims). Each of these settlements is discussed in detail in Note 10, Commitments and Contingent Liabilities, to the Financial Statements included in International Paper’s Annual Report on Form 10-K for the year ended December 31, 2005 (the “2005 10-K”).2006.
Claims Data
1980’s Hardboard Claims
Since 2002,Throughout 2006, Omniwood and until 2005, the aggregateWoodruf claims activity with respect to the exterior siding and roofing settlements (the “Settlements”) had been in line with the projections prepared by the Company’s third-party consultant. As reported in the 2005 10-K, the number of valid 1980’s Hardboard Claims filed prior to the January 18, 2005 filing deadline significantly exceeded those projections. This increase, together with an increase in the average cost per claim, had resulted in payments by the Company in 2005 of approximately $119 million. These amounts exceeded projections by approximately $40 million.
Substantially all of the 1980’s Hardboard Claims were settled as of June 30, 2006, although settlement payments made in 2006 were approximately $8 million more than projected.
1990’s Hardboard Claims
In 2005, the number of 1990’s Hardboard Claims filed was in line with projections. However, as reportedactivity for Hardboard claims in the 2005 10-K,first three quarters of 2006 was in excess of projected amounts. Accordingly, additional pre-tax charges totaling $50 million were recorded in the average costfirst three quarters of those2006 to reflect this higher claims increased aboveactivity pending completion of an updated projection by the Company’s third-party consultant. In the fourth quarter of 2006, this updated projection was completed, resulting in an additional pre-tax charge of $40 million to increase the reserve to management’s best estimate of projected levels in 2005. As wasfuture claims and expense payments through the caseend of the Hardboard claims period (January 15, 2008). Claims activity for the 1980’s Hardboard Claims, the increased cost was due,first quarter of 2007 has been generally in part, to a 2005 increase in the Means Price Data (an inflation-adjusted compensation formula based on replacement and refinishing cost for a particular area that is used in the determination of claims payments) compared to prior years. For the nine months ended September 30, 2006, the number of 1990’s Hardboard Claims filed and the average cost per claim were both higher than projected,line with claims payments totaling approximately $8 million more than projected. The claims filing deadline for the 1990’s Hardboard Claims is January 15, 2008.these updated projections.
The following table presents the claims activity of the 1980’s and 1990’s Hardboard Claims for the nine-monththree-month period ended September 30, 2006:March 31, 2007:
In thousands | Single Family | Multi- Family | Total | Single Family | Multi- Family | Total | ||||||||||||
December 31, 2005 | 20.2 | 3.2 | 23.4 | |||||||||||||||
December 31, 2006 | 21.8 | 2.1 | 23.9 | |||||||||||||||
No. of Claims Filed | 14.1 | 0.4 | 14.5 | 4.9 | 0.2 | 5.1 | ||||||||||||
No. of Claims Paid | (9.9 | ) | (1.4 | ) | (11.3 | ) | (4.5 | ) | (0.3 | ) | (4.8 | ) | ||||||
No. of Claims Dismissed | (4.0 | ) | (0.1 | ) | (4.1 | ) | (1.3 | ) | — | (1.3 | ) | |||||||
September 30, 2006 | 20.4 | 2.1 | 22.5 | |||||||||||||||
March 31, 2007 | 20.9 | 2.0 | 22.9 | |||||||||||||||
The average settlement cost per claim for the nine-monththree-month period ended September 30, 2006March 31, 2007 for the Hardboard settlement was $2,369.$2,231.
Omniwood and Woodruf Claims
Throughout 2005, and through September 30, 2006, the Omniwood Claims activity and the Woodruf Claims activity have been in line with projections. The Company expects this trend to continue. The filing deadline for both the Omniwood and Woodruf Claims is January 6, 2009. The following table presents the claims activity of the Omniwood Claims and the Woodruf Claims for the nine-monththree-month period ended September 30, 2006:March 31, 2007:
| Omniwood | Woodruf | Total | Omniwood | Woodruf | Total | |||||||||||||||||||||||||||||||||
In thousands | Single Family | Multi- Family | Single Family | Multi- Family | Single Family | Multi- Family | Total | Single Family | Multi- Family | Single Family | Multi- Family | Single Family | Multi- Family | Total | ||||||||||||||||||||||||
December 31, 2005 | 2.4 | 0.5 | 0.8 | 0.3 | 3.2 | 0.8 | 4.0 | |||||||||||||||||||||||||||||||
December 31, 2006 | 2.7 | 0.6 | 0.8 | 0.3 | 3.5 | 0.9 | 4.4 | |||||||||||||||||||||||||||||||
No. of Claims Filed | 4.2 | 0.2 | 0.4 | — | 4.6 | 0.2 | 4.8 | 1.4 | 0.1 | — | — | 1.4 | 0.1 | 1.5 | ||||||||||||||||||||||||
No. of Claims Paid | (3.3 | ) | (0.2 | ) | (0.3 | ) | — | (3.6 | ) | (0.2 | ) | (3.8 | ) | (1.3 | ) | — | (0.1 | ) | — | (1.4 | ) | — | (1.4 | ) | ||||||||||||||
No. of Claims Dismissed | (0.8 | ) | — | (0.2 | ) | — | (1.0 | ) | — | (1.0 | ) | (0.3 | ) | — | — | — | (0.3 | ) | — | (0.3 | ) | |||||||||||||||||
September 30, 2006 | 2.5 | 0.5 | 0.7 | 0.3 | 3.2 | 0.8 | 4.0 | |||||||||||||||||||||||||||||||
March 31, 2007 | 2.5 | 0.7 | 0.7 | 0.3 | 3.2 | 1.0 | 4.2 | |||||||||||||||||||||||||||||||
The average settlement costs per claim for the nine-monththree-month period ended September 30, 2006March 31, 2007 for the Omniwood and Woodruf settlements were $4,571$4,363 and $5,765,$3,121, respectively.
Reserve Analysis
The following table presents an analysis of the net reserve activity for the nine-monththree-month period ended September 30, 2006:March 31, 2007:
In millions | Hard- board | Omni- wood | Woodruf | Total | ||||||||||||
Balance, December 31, 2005 | $ | 34 | $ | 74 | $ | 5 | $ | 113 | ||||||||
Additional Provisions | 50 | — | — | 50 | ||||||||||||
Payments | (43 | ) | (21 | ) | (2 | ) | (66 | ) | ||||||||
Balance, September 30, 2006 | $ | 41 | $ | 53 | $ | 3 | $ | 97 | ||||||||
During the first quarter of 2006, based on advice from the Company’s third-party consultant, a charge of $15 million was recorded to increase the aggregate hardboard siding and roofing reserve to management’s best estimate of the amount required for future payments. In the second and third quarters of 2006, claims activity for the 1990s Hardboard Claims was in excess of projected amounts as both the number and average cost per claim exceeded projections. At the end of the third quarter, the Company determined that, pending receipt of an updated projection by the third-party consultant that takes into account trends and data through the end of the claims period (January 15, 2008) that is expected to be completed in the fourth quarter, an additional $35 million charge was required to increase the Hardboard Claims reserve balance to reflect these higher claims. Reserve balances at September 30, 2006 for Omniwood and Woodruf Claims continued to be in line with projections. The Company will reevaluate these reserve balances following the completion of the updated projection to determine whether any additional adjustments are required.
Hardboard Insurance Matters
As discussed in the 2005 10-K, the Company has entered into favorable agreements with various insurance carriers to settle claims relating to their refusal to indemnify and/or defend the Company and Masonite for, among other things, the settlement of Hardboard Claims. In the second quarter, the Company participated in a binding arbitration proceeding with Ace Insurance to resolve the sole remaining coverage dispute. The arbitration panel has now determined that the Company is not entitled to recover any amounts for these claims under the Ace insurance policy.
Cumulative net cash settlements received by the Company through September 30, 2006 in connection with Hardboard insurance settlements totaled approximately $359 million. Total insurance recoveries are expected to be approximately $625 million, with the balance to be received in installments through the end of 2008.
Antitrust Matters
As disclosed in the 2005 10-K, the Company is party to a class action lawsuit by a group of private landowners alleging that the Company and certain of its fiber suppliers, known as Quality Suppliers, engaged in an unlawful conspiracy to artificially depress the prices at which the Company procures fiber for its mills. While the Company continues to maintain that its Quality Supplier program did not violate any antitrust laws, it agreed to settle this case in the second quarter for a payment by the Company to the class of $12.4 million, including plaintiff counsel fees. An order from the Federal District Court in Columbia, South Carolina approving the settlement was issued on September 27, 2006.
Also as disclosed in the 2005 10-K, the Company was a defendant in a purported antitrust class action brought by purchasers of coated publication papers in various U.S. federal and state courts. The Company has been dismissed from all indirect-purchaser cases, including one previously disclosed California case from which the Company was dismissed during the third quarter.
In millions | Hardboard | Omniwood | Woodruf | Total | ||||||||||||
Balance, December 31, 2006 | $ | 72 | $ | 49 | $ | 3 | $ | 124 | ||||||||
Additional Provisions | — | — | — | — | ||||||||||||
Payments | (14 | ) | (7 | ) | (1 | ) | (22 | ) | ||||||||
Balance, March 31, 2007 | $ | 58 | $ | 42 | $ | 2 | $ | 102 | ||||||||
Other MattersLegal Matters:
International Paper is involved from time to time in various other inquiries, administrative proceedings and litigation relating to contracts, sales of property, environmental protection, tax, antitrust, personal injury employment and other matters, some of which allege substantial monetary damages.matters. While any proceedingadministrative proceedings, litigation or litigation has theclaims have an element of uncertainty, International Paper believes that the outcome of any suchof these matters that are pending or threatened, or all of them combined, will not have a material adverse effect on its consolidated financial statements.
NOTE 810 - DEBT
In August 2006,March 2007, International Paper used approximately $320Investments (Luxembourg) S.ar.l, a wholly-owned subsidiary of International Paper, repaid $143 million of cash to repay its maturing 5.375% euro-denominated notes that were designated aslong-term debt with an interest rate of LIBOR plus 40 basis points and a hedge of euro functional currency net investments.maturity date in November 2010. Other debt activity in the third quarter included the repayment of $143$198 million of 7.875%7 5/8% notes and $96 million of 7% debentures, all maturing withinthat matured in the quarter.
On June 20, 2006, International Paper paid approximately $1.2 billion to repurchase substantially all of its zero-coupon convertible debentures at a price equal to their accreted principal value plus interest, using proceeds from divestitures and $730 million of third party commercial paper issued under the Company’s receivables securitization program. As of September 30, 2006, International Paper had reduced this commercial paper borrowing by a net of $30 million, reflecting repayments of second-quarter borrowings less amounts required for the “Dutch Auction” tender offer in September, and plans to repay the remainder by the end of 2006.
In February 2006, International Paper repurchased $195 million 6.4% debentures with an original maturity date of February 2026. Other reductions in the first quarter 2006 included early payment of approximately $495 million of notes with coupon rates ranging from 4% to 8.875% and original maturities from 2007 to 2029. Pre-tax early debt retirement costs of $8 million related to first quarter 2006 debt reductions are included in Restructuring and other charges in the accompanying consolidated statement of operations.
InAt March 31, 2007 and December 31, 2006, International Paper replacedclassified $100 million of current maturities of long-term debt as Long-term debt. International Paper has the intent and ability to renew or refinance these obligations as evidenced by its maturing $750contractually committed $1.5 billion bank credit agreement.
At December 31, 2006, International Paper had unused contractually committed bank credit agreements totaling $3.0 billion. In March 2007, International Paper’s 364-day $500 million revolvingfully-committed bank credit agreement with a 364-day $500 million fullyexpired and was not renewed by the Company after reviewing its liquidity position. This leaves approximately $2.5 billion of committed revolving bank credit agreement that expires in March 2007 and has a facility feeliquidity, consisting of 0.08% payable quarterly, and replaced its $1.25 billion revolving bank credit agreement with a $1.5 billion fullycontractually committed revolving bank credit agreement that expires in March 2011, and has a facility fee of 0.10% payable quarterly. The new agreements generally provide for interest rates at a floating rate index plus a pre-determined margin dependent upon International Paper’s credit rating.
On October 25, 2006, the Company amended its existing$1.0 billion receivables securitization program that provides for up to $1.2 billion of commercial paper-based financings with a facility fee of 0.20% and an expiration dateexpires in November 2007, to provide up to $1 billion of available commercial paper-based financings with a facility fee of 0.10% and an expiration date of October 2009.
During 2006, the Company entered into a series of fixed-to-floating interest rate agreements with a notional amount of approximately $1.2 billion. The objective of these transactions, all of which qualify as fully effective fair value hedges under SFAS No. 133, was to manage interest rate risks associated with International Paper’s debt. These additional agreements increased the outstanding notional amounts of fully effective fair value interest rate swaps to approximately $3 billion, with a fair value net asset of approximately $18 million as of September 30, 2006.
In September 2005, International Paper used proceeds from the sale of its interest in CHH to repay the remaining $250 million portion of a subsidiary’s $650 million long-term debt withMaintaining an interest rate of LIBOR plus 62.5 basis points and a maturity date of June 2007, and $312 million of commercial paper that had been issued in the same quarter. Other reductions in the 2005 third quarter included repayment of $662 million of notes with coupon rates ranging from 4% to 7.35% and original maturities from 2009 to 2029, and the repayment of $150 million of 7.10% notes with a maturity date of September 2005. Pre-tax early debt retirement costs of $26 million related to third quarter 2005 debt reductions are included in Restructuring and other charges in the accompanying consolidated statement of operations.
In June 2005, International Paper repaid approximately $400 million of a subsidiary’s long-term debt with an interest rate of LIBOR plus 62.5 basis points and a maturity date of June 2007.
In February 2005, International Paper redeemed the outstanding $464 million aggregate principal amount of International Paper Capital Trust 5.25% convertible subordinated debentures originally due in July 2025 at 100.5% of par plus accrued interest. Other reductions in the first quarter of 2005 included early payment of approximately $295 million of principal on notes with coupon rates ranging from 4% to 7.875% and original maturities from 2006 to 2015. Pre-tax early debt retirement costs of $24 million related to first quarter 2005 debt reductions are included in Restructuring and other charges in the accompanying consolidated statement of operations.
At December 31, 2005, International Paper had classified as Long-term debt $1.25 billion of tenderable bonds, commercial paper and bank notes and current maturities of long-term debt. International Paper had the intent and ability to renew or convert these obligations as evidenced by credit facilities existing at that date.
Maintaining a strong investment-grade credit rating is an important element of International Paper’s corporate financefinancing strategy. InAt March 31, 2007, the third quarterCompany held long-term credit ratings of 2006,BBB (stable outlook) and Baa3 (stable outlook) by Standard & Poor’s revised the outlook on the Company’s long-term(S&P) and Moody’s Investor Services (Moody’s), respectively. The Company currently has short-term credit ratings from BBB negative to stable outlookby S&P and upgraded its short-term credit rating from A-3 to A-2. At September 30, 2006, the Company also held a long-term credit ratingMoody’s of Baa3 (stable outlook)A-2 and a short-term credit rating of P-3, from Moody’s Investor Services.respectively.
NOTE 911 – RETIREMENT PLANS
International Paper maintains pension plans that provide retirement benefits to substantially all domestic employees hired prior to July 1, 2004. These employees generally are eligible to participate in the plans upon completion of one year of service and attainment of age 21. Employees hired after June 30, 2004, who are not eligible for this pension plan, will receive an additional company contribution to their savings plan.
The plans provide defined benefits based on years of credited service and either final average earnings (salaried employees), hourly job rates or specified benefit rates (hourly and union employees). A detailed discussion of these plans is presented in Note 15 to the Financial Statements included in International Paper’s Annual Report on Form 10-K for the year ended December 31, 2005.2006.
Net periodic pension expense for the Company’sour qualified and nonqualified U.S. defined benefit plans consisted of the following:
| Three Months Ended September 30, | Nine Months Ended September 30, | Three Months Ended March 31, | ||||||||||||||||||||||
In millions | 2006 | 2005 | 2006 | 2005 | 2007 | 2006 | ||||||||||||||||||
Service cost | $ | 35 | $ | 32 | $ | 106 | $ | 97 | $ | 27 | $ | 36 | ||||||||||||
Interest cost | 127 | 118 | 380 | 355 | 131 | 126 | ||||||||||||||||||
Expected return on plan assets | (135 | ) | (139 | ) | (405 | ) | (417 | ) | (159 | ) | (135 | ) | ||||||||||||
Actuarial loss | 60 | 41 | 182 | 125 | 48 | 59 | ||||||||||||||||||
Amortization of prior service cost | 7 | 8 | 20 | 22 | 5 | 7 | ||||||||||||||||||
Net periodic pension expense (a) | $ | 94 | $ | 60 | $ | 283 | $ | 182 | $ | 52 | $ | 93 | ||||||||||||
| (a) | Excludes |
WhileFor its qualified defined benefit pension plan, International Paper may electmakes contributions that are sufficient to fully fund its actuarially determined costs, generally equal to the minimum amounts required by the Employee Retirement Income Security Act (ERISA). International Paper made voluntary contributions of $1.0 billion to the qualified defined benefit plan in 2006 and does not expect to make voluntary contributions to its U.S. qualified plan up to the maximum deductible amount per Internal Revenue Service tax regulations in the coming years, it is unlikely that any contributions to the plan will be required before 2007 unless investment performance is negative or International Paper changes its funding policy.in 2007. The nonqualified plan is funded to the extent of benefit payments, which equaled $23$18 million through September 30, 2006.March 31, 2007.
NOTE 1012 – STOCK-BASED COMPENSATION
International Paper has a Long-Term Incentive Compensation Plan (LTICP) that includes a Stock Option Program,performance share program, a Restricted Performance Share Programservice-based restricted stock award program, an executive continuity award program that provides for tandem grants of restricted stock and stock options, and a Continuity Award Program,stock option program (discontinued as described below). The LTICP is administered by a committee of independent membersthe Management Development and Compensation
Committee of the Board of Directors (the Committee) who are not eligible for these awards. A detailed discussion of these plans is presented in Note 17 to the Financial Statements included in International Paper’s Annual Report on Form 10-K for the year ended December 31, 2005.2006. As of September 30, 2006, 22.7March 31, 2007, 24.2 million shares were available for grant under the LTICP.
Effective January 1, 2006, the Company adopted the provisions of SFAS No. 123(R), “Share-Based Payment,Payment.” usingCompensation expense is recorded over the modified prospective transition method and, accordingly, priorrelated service period amounts have not been restated. This pronouncement requires that compensation costs related to share-based payments be recognized in the financial statements. For equity awards, the amount of compensation cost is measured based on the grant dategrant-date fair value of the award. The resulting cost is recognized over the period during which an employee is required to provide servicemarket value. Since all outstanding options are vested, only replacement option grants will be expensed in exchange for the award, usually the vesting period. Prior to January 1, 2006, the Company applied the provisions of APB Opinion No. 25, “Accounting for Stock Issued to Employees,” and related interpretations and the disclosure provisions of SFAS No. 123, “Accounting for Stock-Based Compensation,” in accounting for its plans.future periods.
Total stock-based compensation cost recognized in Selling and administrative expense in the accompanying consolidated statement of operations for the ninethree months ended September 30,March 31, 2007 and 2006 and 2005 was $98.8$26 million and $31.5$18 million, respectively. The actual tax benefit realized for stock-based compensation costs was $2.5$3 million and $1 million for both nine-monththe three-month periods ended September 30,March 31, 2007 and 2006, and 2005.respectively. At September 30, 2006, $121.1March 31, 2007, $211 million, net of estimated forfeitures, of compensation cost related to unvested restricted performance shares, andexecutive continuity awards and restricted stock attributable to future performance had not yet been recognized. This amount will be recognized in expense over a weighted-average period of 1.4two years.
Performance-Based Restricted Performance Share Program:
RestrictedUnder the Performance Share Program (PSP), contingent awards of International Paper common stock are granted by the Committee. Awards are earned based on the achievement of defined performance rankings of return on investment (ROI) and total shareholder return (TSR) compared to aROI and TSR peer groupgroups of companies. For awards issued to non-senior management, the awardsAwards are weighted 75% for ROI and 25% for TSR. For awards issued toTSR for all participants except for certain members of senior management thefor whom awards are weighted 50% for ROI and 50% for TSR. The ROI component of the PSP awards is valued at the closing stock price on the day prior to the grant date. As the ROI component contains a performance condition, compensation expense, net of estimated forfeitures, is recorded over the requisite service period based on the most probable number of awards expected to vest. The TSR component of the PSP awards is valued using a Monte Carlo simulation as the TSR component contains a market condition. The Monte Carlo simulation estimates the fair value of the TSR component based on the expected term of the award, risk-free rate, expected dividends, and the expected volatility for the Company and its competitors. The expected term was estimated based on the vesting period of the awards, the risk-free rate was based on the yield on U.S. Treasury securities matching the vesting period, the expected dividends were assumed to be zero for all companies, and the volatility was based on the Company’s historical volatility over the expected term.
The PSP awards issued to the senior management group are liability awards, which are required to be remeasured at fair value at each balance sheet date. The valuation of these PSP liability awards is computed based on the same methodology as the PSP equity awards.
The following table sets forth the assumptions used to determine compensation cost for the market condition component of the PSP plan consistent with the requirements of SFAS No. 123(R):
Three Months Ended |
| |||
Expected volatility | ||||
Risk-free interest rate |
The following summarizes the activity for all performance-based programs for the ninethree months ended September 30, 2006:March 31, 2007:
| Nonvested Shares | Weighted Average Fair Value | Nonvested Shares | Weighted Average Grant Date Fair Value | |||||||||
Outstanding at December 31, 2005 | 4,195,317 | $ | 41.47 | |||||||||
Outstanding at December 31, 2006 | 5,504,458 | $ | 38.61 | |||||||||
Granted | 2,320,858 | 33.58 | 2,261,611 | 33.52 | ||||||||
Shares Issued (a) | (378,042 | ) | 35.89 | (1,243,350 | ) | 36.26 | ||||||
Forfeited | (50,666 | ) | 39.16 | (104,286 | ) | 39.69 | ||||||
Outstanding at September 30, 2006 | 6,087,467 | $ | 38.83 | |||||||||
Outstanding at March 31, 2007 | 6,418,433 | $ | 37.25 | |||||||||
| (a) | Includes |
Stock Option Program:
The Company discontinued its stock option program in 2004 for members of executive management, and in 2005 for all other eligible U.S. and non-U.S. employees. Stock-based compensation expense totaling $5,000$5,300 related to a stock option reload was recorded for the ninethree months ended September 30, 2006.March 31, 2007. The expense was calculated under the Black-Scholes option pricing model using 19.7%20.46% expected volatility, an interest rate of 4.97%4.92%, a 2.7%2.74% expected dividend yield and a term of two years. As of September 30, 2006,March 31, 2007, all outstanding options were fully vested.
A summary of option activity under the plan as of September 30, 2006March 31, 2007 is presented below:
| Options | Weighted Average | Weighted Average Remaining Life (years) | Aggregate Intrinsic Value (thousands) | Options | Weighted Average Exercise Price | Weighted Average Remaining Life (years) | Aggregate Intrinsic Value (thousands) | |||||||||||||||
Outstanding at December 31, 2005 | 41,581,598 | $ | 39.49 | |||||||||||||||||||
Outstanding at December 31, 2006 | 35,982,698 | $ | 39.52 | |||||||||||||||||||
Granted | 997 | 37.06 | 1,120 | 36.54 | ||||||||||||||||||
Exercised | (785,628 | ) | 32.61 | (905,634 | ) | 33.21 | ||||||||||||||||
Forfeited | (678,339 | ) | 44.95 | (337,528 | ) | 47.15 | ||||||||||||||||
Expired | (2,299,835 | ) | 41.30 | (1,855,395 | ) | 42.78 | ||||||||||||||||
Outstanding at September 30, 2006 | 37,818,793 | $ | 39.43 | 5.18 | $ | 1,491 | ||||||||||||||||
Outstanding at March 31, 2007 | 32,885,261 | $ | 39.43 | 4.84 | $ | 1,296 | ||||||||||||||||
All options are exercisable as of September 30, 2006.March 31, 2007.
Executive Continuity and Restricted Stock Award Program:
The following summarizes the activity of the Executive Continuity and Restricted Stock Award Program for the ninethree months ended September 30, 2006:March 31, 2007:
| Nonvested Shares | Weighted Average Fair Value | Nonvested Shares | Weighted Average Grant Date Fair Value | |||||||||
Outstanding at December 31, 2005 | 250,375 | $ | 38.49 | |||||||||
Outstanding at December 31, 2006 | 177,250 | $ | 37.21 | |||||||||
Granted | 55,000 | 34.41 | 3,000 | 33.70 | ||||||||
Shares Issued | (81,958 | ) | 38.74 | (7,500 | ) | 38.12 | ||||||
Forfeited | (49,667 | ) | 37.15 | — | — | |||||||
Outstanding at September 30, 2006 | 173,750 | $ | 37.46 | |||||||||
Outstanding at March 31, 2007 | 172,750 | $ | 37.11 | |||||||||
Pro Forma Information for Periods Prior to the Adoption of SFAS No. 123(R):NOTE 13 – ACCOUNTING CHANGE
Effective January 1, 2007, International Paper adopted FASB Staff Position (FSP) No. AUG AIR-1, “Accounting for Planned Major Maintenance Activities.” Prior to January 1, 2006, the Company2007, International Paper accounted for stock-based awards under the intrinsic valuecost of planned major maintenance by expensing the costs ratably throughout the year. Effective January 1, 2007, International Paper adopted the direct expense method which followedof accounting whereby all costs for repair and maintenance activities are expensed in the recognition and measurement principles of APB Opinion No. 25. The following table illustratesmonth that the related activity is performed. International Paper retrospectively applied the effect on netof the adoption of this FSP resulting in adjustments to prior-period quarterly operating results, resulting in a $1 million reduction in pre-tax earnings net earnings per common share and net earnings per common share, assuming dilution, for the three and nine months ended September 30, 2005 if the Company had applied the fair value recognition provisions of SFAS No. 123.
In millions, except per share amounts | Three Months Ended September 30, 2005 | Nine Months Ended September 30, 2005 | ||||||
Net earnings, as reported | $ | 1,023 | $ | 1,177 | ||||
Deduct: Total stock-based employee compensation expense determined under fair value based method for all awards, net of related tax effects | (27 | ) | (55 | ) | ||||
Pro forma net earnings | $ | 996 | $ | 1,122 | ||||
Earnings per common share | ||||||||
Basic - as reported | $ | 2.10 | $ | 2.42 | ||||
Basic - pro forma | $ | 2.04 | $ | 2.31 | ||||
Earnings per common share | ||||||||
Diluted - as reported | $ | 2.03 | $ | 2.36 | ||||
Diluted - pro forma | $ | 1.98 | $ | 2.25 | ||||
NOTE 11 – SUBSEQUENT EVENTS
On October 25, 2006, International Paper and Ilim Pulp, the largest forest products enterprise in Russia, announced that a letter of intent had been signed to establish a 50-50 joint venture. If definitive agreements are reached, this joint venture would be the largest foreign-domestic alliance in the Russian forest sector. It is currently contemplated that International Paper will purchase a 50% equity interest infirst quarter of 2006. However, this accounting change had no effect on previously reported full-year operating results or on the joint venture for approximately $400 million in cash. The total enterprise value of the joint venture is approximately $1.3 billion, excluding approximately $500 million of debt that will be nonrecourse to the joint venture partners. The parties currently expect to finalize the agreement in the next six months, following completion of due diligence, receipt of required regulatory approvals, and the approvals of their respective boards of directors.
On October 30,December 31, 2006 and November 3, 2006, International Paper completed the previously announced sales of approximately 5.1 million acres of forestlands to TimberStar and Resource Management Service, LLC, respectively, for proceeds totaling approximately $6.1 billion of cash and notes. These sales will result in an estimated special fourth-quarter pre-tax gain in excess of $4 billion.balance sheet.
Financial Information by Industry Segment
(Unaudited)
(In millions)
Sales by Industry Segment
| Three Months Ended September 30, | Nine Months Ended September 30, | |||||||||||||||
| 2006 | 2005 (1) | 2006 (1) | 2005 (1) | |||||||||||||
Printing Papers | $ | 1,670 | $ | 1,795 | $ | 5,385 | $ | 5,350 | ||||||||
Industrial Packaging | 1,250 | 1,075 | 3,660 | 3,455 | ||||||||||||
Consumer Packaging | 855 | 785 | 2,425 | 2,290 | ||||||||||||
Distribution | 1,730 | 1,645 | 5,070 | 4,745 | ||||||||||||
Forest Products | 445 | (4) | 700 | (4) | 1,670 | (4) | 1,915 | (4) | ||||||||
Specialty Businesses and Other (2) | 245 | 220 | 710 | 725 | ||||||||||||
Corporate and Inter-segment Sales | (328 | ) | (295 | ) | (813 | ) | (830 | ) | ||||||||
Net Sales | $ | 5,867 | $ | 5,925 | $ | 18,107 | $ | 17,650 | ||||||||
Operating Profit by Industry Segment
| Three Months Ended September 30, | Nine Months Ended September 30, | Three Months Ended March 31, | ||||||||||||||||||||||
| 2006 | 2005 (1) | 2006 (1) | 2005 (1) | 2007 | 2006 | |||||||||||||||||||
Printing Papers | $ | 249 | $ | 117 | (7) | $ | 615 | $ | 413 | (7,9) | ||||||||||||||
Printing Papers (2) | $ | 1,540 | $ | 1,805 | ||||||||||||||||||||
Industrial Packaging | 138 | (6) | 29 | (7) | 277 | (6) | 215 | (7) | 1,235 | 1,175 | ||||||||||||||
Consumer Packaging | 64 | 43 | (7) | 140 | 128 | (7) | ||||||||||||||||||
Consumer Packaging (2) | 750 | 615 | ||||||||||||||||||||||
Distribution | 34 | 23 | 97 | 59 | 1,675 | 1,650 | ||||||||||||||||||
Forest Products | 129 | (5) | 271 | (5,7) | 539 | (5) | 669 | (5,7,9) | 85 | 235 | ||||||||||||||
Specialty Businesses and Other (2) | 22 | (8 | )(7) | 48 | 9 | (7) | ||||||||||||||||||
Other Businesses (3) | 135 | 225 | ||||||||||||||||||||||
Corporate and Inter-segment Sales | (203 | ) | (179 | ) | ||||||||||||||||||||
Net Sales | $ | 5,217 | $ | 5,526 | ||||||||||||||||||||
Operating Profit by Industry Segment
| ||||||||||||||||||||||||
Three Months Ended March 31, | ||||||||||||||||||||||||
| 2007 | 2006 (1) | |||||||||||||||||||||||
Printing Papers (2) | $ | 231 | $ | 105 | ||||||||||||||||||||
Industrial Packaging | 103 | 29 | ||||||||||||||||||||||
Consumer Packaging (2) | 61 | 47 | ||||||||||||||||||||||
Distribution | 29 | 27 | ||||||||||||||||||||||
Forest Products | 100 | 190 | ||||||||||||||||||||||
Other Businesses (3) | 6 | 13 | ||||||||||||||||||||||
Operating Profit | 636 | 475 | 1,716 | 1,493 | 530 | 411 | ||||||||||||||||||
Interest expense, net | (144 | ) | (121 | )(8) | (441 | ) | (444 | )(8,10) | (61 | ) | (149 | ) | ||||||||||||
Minority interest (3) | — | — | 5 | 1 | ||||||||||||||||||||
Minority interest (4) | 5 | 3 | ||||||||||||||||||||||
Corporate items, net | (216 | ) | (140 | ) | (565 | ) | (429 | ) | (164 | ) | (180 | ) | ||||||||||||
Restructuring and other charges | (92 | ) | (41 | ) | (192 | ) | (65 | ) | (18 | ) | (44 | ) | ||||||||||||
Insurance recoveries | — | 188 | 19 | 223 | — | 19 | ||||||||||||||||||
Net (losses) gains on sales and impairments of businesses held for sale | 97 | (5 | ) | (1,261 | ) | (65 | ) | |||||||||||||||||
Reserve adjustments | — | 3 | — | 3 | ||||||||||||||||||||
Net gains (losses) on sales and impairments of businesses held for sale | 314 | (1,283 | ) | |||||||||||||||||||||
Earnings (loss) from continuing operations before income taxes and minority interest | $ | 281 | $ | 359 | $ | (719 | ) | $ | 717 | $ | 606 | $ | (1,223 | ) | ||||||||||
| (1) |
| (2) | Reflects the reclassification of the European coated paperboard business from Printing Papers to Consumer Packaging in all periods. |
| (3) | Includes Arizona Chemical |
| Operating profits for industry segments include each segment’s percentage share of the profits of subsidiaries included in that segment that are less than wholly owned. The pre-tax minority interest for these subsidiaries is added here to present consolidated earnings before income taxes and minority interest. |
INTERNATIONAL PAPER COMPANY
Sales Volumes By Product (1) (2)
(Unaudited)
| Three Months Ended September 30, | Nine Months Ended September 30, | Three Months Ended March 31, | |||||||||||
| 2006 | 2005 | 2006 | 2005 | 2007 | 2006 | ||||||||
Printing Papers (In thousands of short tons) | |||||||||||||
U.S. Uncoated Papers | 982 | 1,026 | |||||||||||
Europe & Russia Uncoated Papers | 376 | 379 | |||||||||||
Brazil Uncoated Papers | 121 | 111 | 353 | 330 | 144 | 118 | |||||||
Europe & Russia Uncoated Papers | 353 | 342 | 1,072 | 1,059 | |||||||||
U.S. Uncoated Papers | 1,006 | 940 | 3,031 | 2,886 | |||||||||
Asia Uncoated Papers | 5 | 3 | |||||||||||
Uncoated Papers | 1,480 | 1,393 | 4,456 | 4,275 | 1,507 | 1,526 | |||||||
Coated Papers | 220 | (4) | 582 | 1,300 | 1,630 | — | 502 | ||||||
Market Pulp (3) | 282 | 335 | 856 | 938 | 335 | 285 | |||||||
Packaging (In thousands of short tons) | |||||||||||||
Container of the Americas | 902 | 886 | 2,733 | 2,682 | 882 | 901 | |||||||
European Container (Boxes) | 293 | 262 | 939 | 794 | 307 | 321 | |||||||
Other Industrial and Consumer Packaging | 115 | 126 | 354 | 387 | 131 | 146 | |||||||
Industrial and Consumer Packaging | 1,310 | 1,274 | 4,026 | 3,863 | 1,320 | 1,368 | |||||||
Containerboard | 451 | 466 | 1,385 | 1,375 | 392 | 496 | |||||||
Bleached Packaging Board | 405 | 341 | 1,174 | 1,063 | 491 | 338 | |||||||
Coated Bristols | 101 | 101 | 311 | 311 | 100 | 108 | |||||||
Kraft | 62 | 63 | 196 | 185 | |||||||||
Forest Products (In millions) | |||||||||||||
Panels (sq. ft. 3/8” - basis) | 404 | 444 | 1,219 | 1,212 | |||||||||
Lumber (board feet) | 613 | 675 | 1,907 | 1,951 | |||||||||
Saturated and Bleached Kraft Papers | 53 | 60 | |||||||||||
| (1) | Sales volumes include third party and inter-segment sales. |
| (2) | Sales volumes for divested businesses are included through the date of sale, except for discontinued operations. |
| (3) | Includes internal sales to mills. |
Sales Volumes represent supplemental information that is not included in Part I, Item 1. Financial Information.
ITEM 2. MANAGEMENT’S DISCUSSION AND ANALYSIS OF FINANCIAL CONDITION AND RESULTS OF OPERATIONS
EXECUTIVE SUMMARY
For the first quarter of 2007, International Paper reported solid 2006 third quarterthe strongest first-quarter operating results driven by muchsince 2000. Pricing momentum remained strong during the quarter with improved performance in our key platform North American Paperproduct pricing for European and Packaging businesses. Average product prices improvedBrazilian paper and global pulp. First-quarter sales volumes were flat compared with the second2006 fourth quarter as we shifted product sales across all uncoatedglobal markets and took some lack-of-order downtime in North American paper pulp and packaging grades as a number of announced price increases were fully implemented. Sales volumes were solid and generally comparablecontainerboard operations to match production with the second quarter.our customers’ demand. Global manufacturing operations continued to perform well, led by record performance in our European operations. Freight and raw material costs were somewhat higher, driven by increased wood costs, but these increases were partially offset by favorable energy costs. Earnings from land sales for the quarter although we continue to be challenged by high input and distribution costs. However, the operating results for our Wood Products business were down sharplydeclined from 2006 fourth-quarter levels. Net interest expense also declined reflecting lower product prices in a weak housing market. The effectivedebt levels. Excluding special items, the income tax rate was lower for the third quarter reflecting a lower projected full-year rate.was higher than in both the 2006 fourth and first quarters.
Looking forward to the fourth2007 second quarter, sales volumes are expected to be seasonally slower toward the end of the year. For North America, we have realized substantially all of our announced paper and packaging price increases and believeexpect that we are near the bottom on wood products prices. Input and distribution costs are likely to remain high, although we believe there are some favorable signs on the horizon. Benefits from expected continued improvement in our global manufacturing operations will be somewhat offset by an increase in planned maintenance downtime. Net interest expense should be lower in the quarter due to interest income from the installment notes we will receive as the Transformation Plan forestland sales close. Thus, earnings from continuing operations, beforeexcluding special items, will be somewhat higher than in the first quarter. Average price realizations should further improve as we implement previously announced North American, European and Brazilian paper price increases as well as announced second-quarter increases for containerboard and boxes. Sales volumes should be seasonally stronger and should benefit from contributions from the Luiz Antonio mill in Brazil for a full quarter. Input costs for raw materials, energy and freight are expected to remain high, and planned maintenance outage expenses should be higher than in the first quarter. Second quarter earnings from land sales are expected to be slightly lower than in the thirdfirst quarter.
RESULTS OF OPERATIONS
For the thirdfirst quarter of 2006,2007, International Paper reported net sales of $5.9$5.2 billion, compared with $5.9$5.5 billion in the thirdfirst quarter of 20052006 and $6.2$5.3 billion in the secondfourth quarter of 2006.
Net earnings totaled $201$434 million, or $0.42$0.97 per share, in the 2006 third2007 first quarter. This compared with net earningslosses of $1.0$1.2 billion, or $2.03$2.54 per share, in the thirdfirst quarter of 20052006 and $115 million,earnings of $2.0 billion, or $0.24$4.38 per share, in the secondfourth quarter of 2006.
Earnings from continuing operations were $113$457 million in the thirdfirst quarter of 2007 compared with a loss of $1.2 billion in the first quarter of 2006 compared withand earnings of $733 million in the third quarter of 2005 and $112 million$2.0 billion in the 2006 secondfourth quarter. EarningsCompared with the first quarter of 2006, earnings in the 2006 third2007 first quarter benefited from higher average price realizations ($127134 million), higher sales volumes and decreased market-related downtime ($15 million), and lower operating costs and a more favorable mix of products sold ($11453 million) compared with the 2005 third quarter. These benefits were partially offset by higher raw material and freight costs, lower corporate charges ($5820 million) reflecting lower pension expenses, and lower gains from land sales ($40 million). In addition, corporate items and other costs ($51 million) increased reflecting higher pension costs, incentive compensation and other benefit-related charges and supply chain costs. Netnet interest expense ($1265 million) decreased. The Wood Products business reported significantly lower earnings ($64 million) as a result of lower price realizations. The Coated and Supercalendered business had lower after-tax earnings ($14 million) reflecting the sale of the business on August 1, 2006. Net special items were an expense of $75 million in the 2006 third quarter versus income of $603 million in the third quarter of 2005. Income tax expense was $17 million lower in the 2006 third quarter reflecting a lower estimated effective tax rate.
Compared with the second quarter of 2006, earnings from continuing operations benefited from higher average price realizations ($41 million), higher sales volumes ($7 million), and improved manufacturing costs ($26 million) resulting from cost reduction actions in prior periods.. These benefits were partially offset by higher raw material and freight costs ($14 million), lower gains from land sales ($40 million), higher costs due to mill production outages ($22 million), lower sales volumes and increased lack-of-order downtime ($5 million), reduced business earnings due to the net impact of divestitures/acquisitions ($29 million), and a higher income tax provision ($18 million) reflecting a higher estimated effective tax rate in 2007. Additionally, net special items were a gain of $254 million in the 2007 first quarter versus an expense of $1.3 billion in the first quarter of 2006.
Compared with the fourth quarter of 2006, earnings from continuing operations benefited from improved manufacturing costs ($39 million) resulting from cost reduction actions in prior periods. These benefits were offset by higher raw material costs ($13 million), higher freight costs ($2 million), and higher mill outage costs ($30 million). Corporate and other items increased ($31 million) due to higher incentive compensation and other benefit-related charges. Net interest expense ($3 million) decreased. Wood Products earnings were lower ($41 million) reflecting the sharp decline in price realizations. The Coated and Supercalendered Papers business had lower after-tax earningsdecreased ($18 million) due to lower pension costs, partially offset by higher benefit-related costs and the saleeffect of a 2006 fourth quarter favorable inventory-related adjustment. Net interest expense decreased ($17 million), while the business. Additionally, compared withearnings impact to the 2006 secondbusinesses of divestitures/acquisitions was lower ($3 million). Income tax expense was $12 million higher in the 2007 first quarter 2006 third-quarter earnings reflected benefits from lower special charges ($9 million) andreflecting a lowerhigher estimated effective tax rate ($19 million).rate. Net special items were a gain of $254 million versus a gain of $1.8 billion in the fourth quarter of 2006.
To measure the performance of the Company’s business segments from period to period without variations caused by special or unusual items, International Paper’s management focuses on business segment operating profit. This is defined as earnings before taxes and minority interest, excluding interest expense, corporate charges and special items that include restructuring charges, early debt extinguishment costs, legal reserves, insurance recoveries, gains (losses) on sales and impairments of businesses, and the reversal of reserves no longer required. Prior-year industry segmentPrior-period information has been restated to conform to minor changes in the 2006 operational structure andrevised to reflect the classificationretrospective application of the Kraft Papers and the Brazilian Coated Papers businesses as discontinued operations.a change in accounting for planned major maintenance activities.
The following table presents a reconciliation of International Paper’s net earnings to its operating profit:
| Three Months Ended | Three Months Ended | |||||||||||||||||||||||
| September 30, | June 30, | March 31, | Dec. 31, | |||||||||||||||||||||
In millions | 2006 | 2005 | 2006 | 2007 | 2006 | 2006 | ||||||||||||||||||
Net Earnings (Loss) | $ | 201 | $ | 1,023 | $ | 115 | $ | 434 | $ | (1,236 | ) | $ | 1,979 | |||||||||||
Deduct - Discontinued operations: | ||||||||||||||||||||||||
(Earnings) loss from operations | (8 | ) | 71 | (13 | ) | |||||||||||||||||||
(Gain) loss on sales or impairments | (80 | ) | (361 | ) | 10 | |||||||||||||||||||
Earnings from operations | (3 | ) | (37 | ) | (13 | ) | ||||||||||||||||||
Loss on sales or impairments | 26 | 61 | 81 | |||||||||||||||||||||
Earnings From Continuing Operations | 113 | 733 | 112 | |||||||||||||||||||||
Earnings (Loss) From Continuing Operations | 457 | (1,212 | ) | 2,047 | ||||||||||||||||||||
Add back (deduct): | ||||||||||||||||||||||||
Income tax provision (benefit) | 163 | (377 | ) | 59 | ||||||||||||||||||||
Income tax (benefit) provision | 143 | (16 | ) | 1,668 | ||||||||||||||||||||
Minority interest expense, net of taxes | 5 | 3 | 5 | 6 | 5 | 3 | ||||||||||||||||||
Earnings From Continuing Operations Before Income Taxes and Minority Interest | 281 | 359 | 176 | |||||||||||||||||||||
Earnings (Loss) From Continuing Operations Before Income Taxes and Minority Interest | 606 | (1,223 | ) | 3,718 | ||||||||||||||||||||
Interest expense, net | 144 | 121 | 147 | 61 | 149 | 80 | ||||||||||||||||||
Minority interest included in operations | — | — | (2 | ) | (5 | ) | (3 | ) | (3 | ) | ||||||||||||||
Corporate items | 216 | 140 | 174 | 164 | 180 | 166 | ||||||||||||||||||
Special items: | ||||||||||||||||||||||||
Restructuring and other charges | 92 | 41 | 54 | 18 | 44 | 111 | ||||||||||||||||||
Insurance recoveries | — | (188 | ) | — | — | (19 | ) | — | ||||||||||||||||
Net (gains) losses on sales and impairments of businesses held for sale | (97 | ) | 5 | 75 | ||||||||||||||||||||
Gains on forestland sales | — | — | (4,422 | ) | ||||||||||||||||||||
Impairments of goodwill | — | — | 759 | |||||||||||||||||||||
Net (gains) losses on sales and impairments of businesses | (314 | ) | 1,283 | 21 | ||||||||||||||||||||
Reserve adjustments | — | (3 | ) | — | — | — | (5 | ) | ||||||||||||||||
| $ | 636 | $ | 475 | $ | 624 | $ | 530 | $ | 411 | $ | 425 | |||||||||||||
Industry Segment Operating Profit | ||||||||||||||||||||||||
Printing Papers | $ | 249 | $ | 117 | $ | 247 | $ | 231 | $ | 105 | $ | 63 | ||||||||||||
Industrial Packaging | 138 | 29 | 100 | 103 | 29 | 130 | ||||||||||||||||||
Consumer Packaging | 64 | 43 | 41 | 61 | 47 | 27 | ||||||||||||||||||
Distribution | 34 | 23 | 36 | 29 | 27 | 31 | ||||||||||||||||||
Forest Products | 129 | 271 | 184 | 100 | 190 | 162 | ||||||||||||||||||
Specialty Businesses and Other | 22 | (8 | ) | 16 | 6 | 13 | 12 | |||||||||||||||||
Total Industry Segment Operating Profit | $ | 636 | $ | 475 | $ | 624 | $ | 530 | $ | 411 | $ | 425 | ||||||||||||
Industry Segment Operating Profit
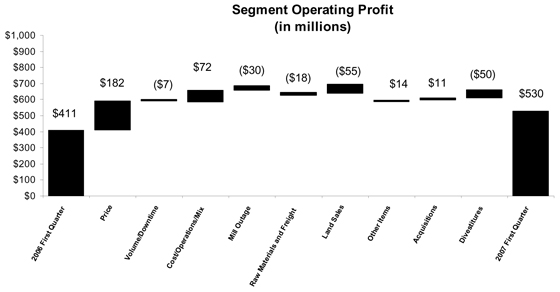
Industry segment operating profits of $530 million in the 2007 first quarter were higher than both $411 million in the 2006 first quarter and $425 million in the 2006 fourth quarter. Compared with the first quarter of 2006, earnings in the current quarter benefited from higher average prices ($182 million), lower manufacturing operating costs and a more profitable mix of products sold ($72 million), slightly lower raw material costs ($2 million), and other items ($14 million). These benefits were partially offset by lower gains from land sales ($55 million), higher costs due to mill outages ($30 million), higher freight costs ($20 million), and lower sales volumes and increased lack-of-order downtime ($7 million). The impact of acquisitions and divestitures also reduced profits ($39 million).
Compared with the 2006 fourth quarter, operating profits benefited from improved manufacturing operating performance and the impact of cost reduction efforts ($54 million), lower other costs ($27 million), and favorable special charges ($128 million). These benefits were partially offset by higher raw material costs ($18 million), higher freight costs ($3 million), lower gains from land sales ($70 million), and higher costs due to mill outages ($17 million). The impact of acquisitions and divestitures increased profits ($4 million).
During the 2007 first quarter, International Paper took approximately 180,000 tons of downtime, including 35,000 tons for lack-of-order downtime, compared with approximately 165,000 tons of downtime in the first quarter of 2006, which included 28,000 tons of lack-of-order downtime. During the 2006 fourth quarter, International Paper took approximately 235,000 tons of downtime, including 75,000 tons for lack-of-order downtime. Lack-of-order downtime is taken to balance internal supply with our customer demand to help manage inventory levels, while maintenance downtime, which makes up the majority of the difference between total downtime and lack-of-order downtime, is taken periodically during the year.
Discontinued Operations
2007:
During the first quarter of 2007, the Company recorded pre-tax credits of $21 million ($9 million after taxes) and $6 million ($4 million after taxes) relating to the sales of its Wood Products and Kraft Papers businesses, respectively. In addition, a $15 million pre-tax charge ($39 million after taxes) was recorded for adjustments to the loss on the completion of the sale of most of the Beverage Packaging business. Finally, a pre-tax credit of approximately $10 million ($6 million after taxes) was recorded for refunds received from the Canadian government of duties paid by the Company’s former Weldwood of Canada Limited business.
2006:
During the fourth quarter of 2006, the Company entered into an agreement to sell its Beverage Packaging business to Carter Holt Harvey Limited for approximately $500 million, subject to certain adjustments. The sale of the North American Beverage Packaging operations subsequently closed on January 31, 2007, with the sale of the remaining non-U.S. operations expected to close later in 2007.
Also during the fourth quarter of 2006, the Company entered into separate agreements for the sale of 13 lumber mills for approximately $325 million, and five wood products plants for approximately $237 million, both subject to various adjustments at closing. Both of the sales were completed in March 2007.
The Company determined that the accounting requirements for both businesses under Statement of Financial Accounting Standards (SFAS) No. 144, “Accounting for the Impairment or Disposal of Long-Lived Assets,” as discontinued operations were met. Accordingly, the operating results for these businesses are included in Discontinued operations for all periods presented.
During the 2006 third quarter, International Paper completed the previously announced sale of its Brazilian Coated Papers business to Stora Enso Oyj for approximately $420 million, subject to certain post-closing adjustments.business. The operating results of this business for all periods presented are included in Discontinued operations infor all periods presented.
During the accompanying consolidated statementfirst quarter of operations, including2006, the Company determined that the accounting requirements under SFAS No. 144 for reporting the Kraft Papers business as a discontinued operation were met. Accordingly, a $100 million pre-tax gain of $101 millioncharge ($8061 million after taxes) recorded in the 2006 third quarter as a result of the sale.
In the 2006 first quarter, a pre-tax charge of $101 million ($0.13 per share) had beenwas recorded to write downreduce the carrying value of the net assets of the Kraft Papersthis business to their estimated fair value. During the 2006 second quarter, International Paper signed a definitive agreement to sellThe sale of this business to Stone Arcade Acquisition Corp. and recorded an additional pre-tax charge of $16 million ($0.02 per share) based on the termswas completed in January 2007. The operating results of this agreement.
business are included in Discontinued operations for the second quarter of 2005 also includes the operating results of Carter Holt Harvey Limited sold in the third quarter of 2005.all periods presented.
Income Taxes
The income tax provision was $163$143 million for the 2006 third2007 first quarter. Excluding a $93$44 million charge relating to the tax effects of special items, the effective income tax rate for continuing operations was 27%32% for the quarter.
The income tax provision was $1.7 billion in the 2006 fourth quarter, bringingprincipally reflecting deferred taxes on the 2006 Transformation Plan forestland sales. Excluding the impact of this item and a $99 million tax benefit associated with other special items, the effective tax rate for the 2006 nine-month period to 31%, the revised estimated full-year rate for 2006.quarter was 28%.
The income tax provisionbenefit was $59$16 million in the 2006 secondfirst quarter. Excluding a $45$38 million credit relatingbenefit related to the tax effects of special items, the effective income tax rate for continuing operations was 34%before special items for the quarter.first quarter 2006 was 26%.
TheDeferred income tax benefittaxes increased from $2.2 billion at December 31, 2006 to $3.3 billion at March 31, 2007, principally due to the effects of $377 millionthe adoption of FIN 48, preliminary purchase accounting for the Luiz Antonio mill, and deferred taxes associated with businesses sold in the third quarter of 2005 included a $553 million non-cash income tax benefit resulting from an agreement reached with the U.S. Internal Revenue Service concerning the Company’s 1997 through 2000 federal income tax audits, a $21 million provision related to cash repatriated from non –U.S. subsidiaries under the American Jobs Creation Act of 2004, and a $15 million provision related to a change in Ohio state tax laws. Excluding these items, and a $73 million charge relating to the tax effects of special items, the effective income tax rate for continuing operations was 34% for the2007 first quarter.
Interest Expense and Corporate Items
Net interest expense for the 2006 third2007 first quarter was $144$61 million slightly lower than the $148compared with $80 million infor the 2006 secondfourth quarter but higher thanand $149 million for the $121 million in the 2005 third2006 first quarter. Net interest expense in the 2005 third quarter included a pre-tax credit of $43 for a reduction of accrued interest related to the agreement with the U.S. Internal Revenue Service discussed above. Excluding this, net interest expense was $164 million. The lower expense in the current quarter reflects lower average debt balances and interest rates due to debt refinancings and repayments and includes $6 million of interest income relating to the collection of a note receivable that had been written off in 2005 and 2006.prior years.
Corporate items, net, of $216$164 million in the 2006 third2007 first quarter were higher thanabout equal to the 2006 second-quarterfourth-quarter net expenses of $174$166 million, andbut were higherlower than the net expenses of $140$180 million in the thirdfirst quarter of 2005.2006. Compared with the fourth quarter of 2006, lower pension expenses were offset by higher benefits-related expenses. Fourth-quarter corporate items also included a favorable one-time inventory-related adjustment. The higher expensedecrease in expenses compared with the currentfirst quarter of 2006 is primarily due primarily to higher incentive compensation and other benefit costs.lower pension expenses.
Special Items
Restructuring and Other Charges
2007:
During the thirdfirst quarter of 2007, restructuring and other charges totaling $18 million before taxes ($11 million after taxes) were recorded for organizational restructuring programs associated with the Company’s Transformation Plan. Additionally, a $2 million pre-tax credit ($1 million after taxes) was recorded in Interest expense for interest received from the Canadian government on refunds of prior-year softwood lumber duties.
2006:
During the first quarter of 2006, restructuring and other charges totaling $92$44 million before taxes ($5627 million after taxes) were recorded. Included in these charges were a pre-tax charge of $57$18 million ($35 million after taxes), including severance and other charges associated with the Company’s Transformation Plan and a $35 million pre-tax charge ($21 million after taxes) for adjustments to legal reserves.
During the second quarter of 2006, restructuring and other charges totaling $54 million before taxes ($33 million after taxes) were recorded. Included in these charges were a pre-tax charge of $50 million ($30 million after taxes) for severance and other charges associated with the Company’s Transformation Plan and a $4 million pre-tax charge ($3 million after taxes) for legal settlements.
During the first quarter of 2006, restructuring and other charges totaling $46 million before taxes ($28 million after taxes) were recorded. Included in these charges were a pre-tax charge of $20 million ($1211 million after taxes) for organizational restructuring programs, principally severance costs associated with the Company’s Transformation Plan, a pre-tax charge of $8 million ($5 million after taxes) for losses on early extinguishment of debt, and a pre-tax charge of $18 million ($11 million after taxes) for adjustments to legal reserves. Also recorded was a pre-tax credit of $19 million ($12 million after taxes) for net insurance recoveries related to the hardboard siding and roofing litigation (see Note 9) and a charge of $6$3 million for tax adjustments.
During the thirdfourth quarter of 2005,2006, restructuring and other charges totaling $70$111 million before taxes ($4869 million after taxes) were recorded. Included in this charge were a pre-tax charge of $44$34 million ($3221 million after taxes) for organizational restructuring charges andprograms, principally severance costs associated with the Company’s Transformation Plan, a pre-tax charge of $26$157 million ($1697 million after taxes) for losses on early extinguishment of debt.
During the second quarter of 2005,debt, a pre-tax charge of $31$40 million ($1925 million after taxes) for organizational restructuring charges was recorded. The organizational restructuring charges included $17legal reserves, a pre-tax credit of $115 million ($70 million after taxes) for interest received from the Canadian government on refunds of prior-year softwood lumber duties and a $5 million credit before taxes ($114 million after taxes) recorded in the Printing Papers business segment for severance and other charges associated with the indefinite shutdown of three U.S. paper machines, and $14 million before taxes ($8 million after taxes) in the Forest Products business segment for costs associated with relocating the business headquarters to Memphis, Tennessee from Savannah, Georgia.
During the first quarter of 2005, a special charge of $24 million before taxes ($15 million after taxes) was recorded for losses on early extinguishment of high-coupon-rate debt.items.
Insurance RecoveriesImpairments of Goodwill
During the firstfourth quarter of 2006, a pre-tax creditin connection with annual goodwill impairment testing, charges of $19$630 million ($12and $129 million after taxes) waswere recorded for net insurance recoveries related to write down the hardboard sidingcarrying values of goodwill of the Company’s coated paperboard and roofing litigation (see Note 7). The second and third quartersShorewood Packaging businesses, respectively, based on the estimated fair values of 2005 also included pre-tax credit of $35 million ($21 million after taxes) and $188 million ($109 million after taxes), respectively, for insurance recoveries related to this litigation.these businesses determined using the projected future operating cash flows.
Net (Gains) Losses on Sales and Impairments of Businesses
2007:
During the thirdfirst quarter of 2006,2007, a net$103 million pre-tax gain of $110 million (a loss of $13($96 million after taxes) was recorded upon the completion of the sale of the Company’s Arizona Chemical business. As part of the transaction, International Paper acquired a minority interest of approximately 10% in the resulting new entity. Final sale proceeds are subject to post-closing adjustments, expected to be finalized in the 2007 second quarter.
In addition, a $6 million pre-tax credit ($4 million after taxes) was recorded to adjust previously estimated gains/losses of businesses previously sold.
These gains are included, along with the gain on the exchange for the Luiz Antonio mill in Brazil (see Note 4), in Net (gains) losses on sales and impairments of businesses including a $13 million pre-tax gain on sale of property in Spain recorded in the Industrial Packaging business. This net gain included pre-tax creditsaccompanying consolidated statement of $304 million ($185 million after taxes) for gains on sales of U.S. forestlands included in the Transformation Plan, the recognition of a previously deferred $110 million pre-tax gain ($68 million after taxes) related to a 2004 sale of forestlands in Maine, pre-tax losses of $165 million and $115 million ($165 million and $82 million after taxes) to adjust the carrying values of the Company’s Wood Products and Beverage Packaging businesses to estimated fair values, a pre-tax charge of $38 million ($23 million after taxes) to reflect the completion of the sale of the Company’s Coated and Supercalendered Papers business in the 2006 third quarter, and a net pre-tax gain of $14 million (a loss of $2 million after taxes) related to other smaller sales.operations.
During the second quarter of 2006, a net pre-tax charge of $75 million ($51 million after taxes) for net (gains) losses on sales and impairments of businesses was recorded, including a pre-tax credit of $62 million ($39 million after taxes) for gains on sales of U.S. forestlands included in the Transformation Plan, a pre-tax charge of $85 million ($53 million after taxes) to adjust the net assets of the Company’s Coated and Supercalendered Papers business to their estimated fair value based on the terms of the definitive sales agreement signed in the second quarter, and a pre-tax charge of $52 million ($37 million after taxes) to write down the carrying value of certain assets in Brazil to their estimated fair value.2006:
During the first quarter, of 2006, a pre-tax charge of $1.3 billion before and after taxes was recorded to write down the assets of the Company’s Coated and Supercalendered Papers business to their estimated fair value.value, as management had committed to a plan to sell this business. In addition, other pre-tax charges totaling $3 million ($2 million after taxes) were recorded to adjust estimated losses of certain smaller operations that are held for sale.
InDuring the thirdfourth quarter of 2005, charges totaling $52006, a charge of $21 million before and after taxes was recorded for losses on sales and impairments of businesses. This charge included a pre-tax loss of $18 million ($36 million after taxes) were recorded for adjustmentsrelating to the sale of losses on businesses previously sold.
Incertain box plants in the second quarterUnited Kingdom and Ireland, and $3 million of 2005, a pre-tax gain of $19 million ($12 million after taxes) was recorded for net adjustments of losses on businesses previously sold.
During the first quarter of 2005, pre-tax charges of $79 million ($52 million after taxes) were recorded, including a $24 million pre-tax loss ($13 million after taxes) to write down the net assets of the Fine Papers business to their estimated net realizable value, $49 million pre-tax loss ($35 million after taxes) to write down the net assets of the Industrial Papers business and related corporate assets to their estimated net realizable value and a(a $6 million charge before taxes ($4 millioncredit after taxes) for adjustments to estimated losses on sales of certain smaller operations.
INDUSTRY SEGMENT OPERATING PROFIT
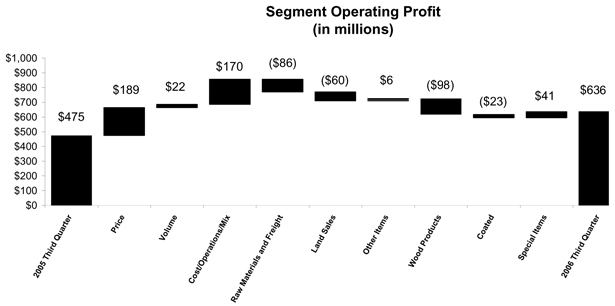
Industry segment operating profits of $636 million in the 2006 third quarter were higher than both $475 million in the 2005 third quarter and $624 million in the 2006 second quarter. Compared with the third quarter of 2005, earnings in the current quarter benefited from higher average prices ($189 million), higher sales volumes and the impact of reduced market-related downtime ($22 million), lower manufacturing operating costs and a more profitable mix of products sold ($170 million), and other items ($6 million). Additionally, special items ($41 million) were favorable in the quarter. These benefits more than offset the effects of higher raw material and freight costs ($86 million), and lower gains from land sales ($60 million). Wood Products earnings were significantly lower ($98 million) due to dramatically lower price realizations. The Coated and Supercalendered business had lower earnings ($23 million) as a result of the sale of the business on August 1, 2006.
Compared with the 2006 second quarter, operating profits benefited from higher average prices ($62 million), higher sales volumes ($11 million), improved manufacturing operating performance and the impact of cost reduction efforts ($39 million), favorable special charges ($13 million) and lower other costs ($1 million). These benefits were partially offset by higher raw material and freight costs ($22 million). Wood Products earnings declined ($61 million) due to lower price realizations; while the Coated and Supercalendered business had lower earnings ($31 million) because of the sale of the business.
During the 2006 third quarter, International Paper took approximately 130,000 tons of downtime, including 28,000 tons for market-related downtime, compared with approximately 400,000 tons of downtime in the third quarter of 2005, which included 270,000 tons of market-related downtime. During the 2006 second quarter, International Paper took approximately 240,000 tons of downtime, including 25,000 tons for market-related downtime. Market-related downtime is taken to balance internal supply with our customer demand to help manage inventory levels, while maintenance downtime, which makes up the majority of the difference between total downtime and market-related downtime, is taken periodically during the year. The costs for annual planned maintenance downtime are charged to expense evenly in each quarter. Market-related downtime costs are expensed in the periods in which the downtime is taken.small asset sales.
BUSINESS SEGMENT OPERATING RESULTS
The following presents segment discussions for the thirdfirst quarter of 2006.2007.
Printing Papers
| 2006 | 2005 | 2007 | 2006 | ||||||||||||||||||||||||
In millions | 3rd Quarter | 2nd Quarter | Nine Months | 3rd Quarter | 2nd Quarter | Nine Months | 1st Quarter | 1st Quarter | 4th Quarter | ||||||||||||||||||
Sales | $ | 1,670 | $ | 1,860 | $ | 5,385 | $ | 1,795 | $ | 1,725 | $ | 5,350 | $ | 1,540 | $ | 1,805 | $ | 1,475 | |||||||||
Operating Profit | 249 | 247 | 615 | 117 | 128 | 413 | 231 | 105 | 63 | ||||||||||||||||||
Printing Papers net sales for the thirdfirst quarter of 2007 were 4% higher than the fourth quarter of 2006, were 10%but 15% lower than the secondfirst quarter of 2006. Operating profits in the first quarter of 2007 were more than double those of both the fourth and first quarters of 2006.
North American Printing Papersnet sales were $885 million in the first quarter of 2007 compared with $870 million in the fourth quarter of 2006 and 7% lower than$1.2 billion in the thirdfirst quarter of 2005.2006. Operating profitsearnings of $124 million were improved compared with $115 million in the thirdfourth quarter of 2006 were only slightly above profitsand $58 million in the secondfirst quarter of 2006, but were more than double profits2006.
Sales volumes in the thirdfirst quarter of 2005.
U.S. Uncoated Papers earnings increased substantially in the third quarter of 2006 versus the second quarter of 2006 to record levels. Sales volumes2007 were flat as increases in printing paper and form shipments were offset by decreases in cut size and envelope paper shipments. Average price realizations were up for uncoated freesheet papers reflecting the full realization of previously announced price increases for both roll and cut-size paper product lines. Input costs for wood and energy were unfavorable during the quarter. Freight costs remained high, while manufacturing operations were favorable for the quarter reflecting seasonally lower energy consumption and fewer planned maintenance outages.
Earnings were also significantly higher than in the third quarter of 2005. Average sales prices were higher reflecting the benefits from price increases announced earlier in 2006. Sales volumes were up, reflecting improvements in cut size and printing papers and envelopes, while forms volumes declined slightly. Strong product demand in the 2006 quarter resulted in virtually no market-related downtime, compared with 173,000 tons taken in the third quarter of 2005. However, wood, energy and freight costs were all above 2005 levels. Manufacturing operations were favorable, benefiting from improved machine performance and energy conservation efforts. In addition, operating results for the third quarter of 2005 included a $6 million special charge for severance and other charges related to the indefinite shutdown of three paper machines, and a $3 million special charge for environmental reserves.
Looking ahead to the 2006 fourth quarter, earnings are expected to be slightly lower. Average sales price realizations will be slightly higher with a full quarter of realizations of previous price announcements. Scheduled maintenance outages are expected to increase costs, as will seasonally higher energy consumption. Natural gas prices are expected to average slightly lower.
European Papers earnings for the third quarter of 2006 were essentially flat with the 2006 second quarter. Sales volumes increased primarily in Eastern Europe as the inventory supply constraints that limited the
second-quarter shipments were eliminated. Average sales prices were lower as a result of an increased mix of lower price exports. Input costs were favorable due to lower energystrong domestic market demand for cut size papers and wood costs. Manufacturing operations costs were higher dueincreased sales to planned maintenance outages. Earnings improved versus the 2005 third quarter as higher average price realizations and higher sales volumes were only partially offset by increased input costs for energy and wood.
Entering the 2006 fourth quarter, European Papers’ earnings are expected to improve, primarily as a result of higher sales volumes for pulp and paper and higher average sales price realizations. Some increases in manufacturing costs are anticipated due to seasonally higher energy usage plus higher input costs for wood.
Brazilian Paperearnings for the third quarter of 2006 were lower than the 2006 second quarter, which had benefited from an $8 million favorable settlement of a Brazilian tax matter. Sales volumes increased due to higher uncoated freesheet paper and chip shipments. Average sales price realizations for wood chips and exported uncoated freesheet paper also increased, and input costs were favorable due to lower natural gas prices. Compared to the third quarter of 2005, earnings declined in the third quarter of 2006. Sales volumes were lower, reflecting the absence of a large bulk timber sale that occurred in the third quarter of 2005 and lower wood chip shipments, partially offset by higher uncoated freesheet paper sales.export markets. Average sales price realizations for uncoated freesheet paper and wood chips were higher.flat compared to the prior quarter despite competitive pressures. Manufacturing operations and raw material costs were slightly favorable.
With the completion of the sale of the Brazilian Coated Papers business in the 2006 third quarter, the operating results of this business are now included in discontinued operations for all periods presented.
Looking ahead tohigher compared with the fourth quarter earnings are expected to be lower reflecting costs associated with a planned recovery boiler outage. Excluding these costs, earnings would be higher than in the third quarter of 2006. Sales volumes and average sales price realizations are expected to improve, primarily for uncoated freesheet paper, while input costs should be about flat.
Market Pulpearnings in the U.S. in the third quarter of 2006 due primarily to an $8 million increase in planned maintenance shutdown expenses. Input costs were higher than in the second quarter of 2006. Sales volumes decreased slightly asfavorable, reflecting lower fluff pulp volume was
average costs for gas and oil, partially offset by higher paperstarch and tissue pulp shipments. However, average price realizations were up over the prior quarter, reflecting an increase in both softwood and hardwood pulp priceswood costs. The business took 41,000 tons of downtime in the second quarter and an additional increase in softwood pulp prices in the third quarter. Raw material costs were slightly favorable, but were offset by higher freight costs. Compared with the thirdfirst quarter of 2005, earnings in the third quarter2007 of 2006 improved due largely to higher average sales price realizations. Sales volumes declinedwhich 19,000 tons were due to lower paper and tissue pulp shipments, partially offset by higher fluff pulp shipments. Input costs for wood increased. Earnings are expected to be essentially flatlack of orders. This compares with 71,000 tons of downtime in the fourth quarter of 2006 asof which 41,000 were due to lack of orders.
In the benefits from further realizationsfirst quarter of 2006, net sales and earnings included the softwood pulp price increase announced in September are offset by higher wood costs.
The U.S. Coated and Supercalendered Papersbusiness which was sold in the third quarter of 2006. Earnings forExcluding the quarter include the operating results forimpact of this business, sales volumes were lower in the first quarter of 2007 compared with the first quarter of 2006, which benefited from increased customer purchases in advance of announced price increases. In addition, declines occurred in coated bristols papers and coated kraft papers sales volumes as the result of competitive pressures from imports. Average sales price realizations were up significantly in the first quarter of 2007 as price increases implemented in 2006 have been fully realized. Freight costs were higher as the result of an increase in rail rates during 2006 and increased export shipments. Manufacturing operating expenses were slightly unfavorable as the impact of improved operating performance only partially offset an increase of $11 million in maintenance shutdown expenses. Higher raw material costs for starch and wood were more than offset by favorable energy and caustic soda costs. Total downtime taken by the monthbusiness in the first quarter of July. Earnings for2006 was 15,000 tons, none of which was due to lack of orders.
Looking ahead to the second quarter, earnings are expected to be comparable to the first quarter. Sales volumes are forecasted to increase primarily due to strong demand for imaging papers and a seasonal increase in demand for bleached kraft papers. Average sales price realizations are expected to improve as recently announced price increases for imaging papers and several specialty grades will be partially realized during the quarter. Manufacturing operating expenses will reflect an additional $14 million for planned maintenance shutdown expenses. These negative factors should be partially offset by the impact of improved operations at the mills. Raw material costs for wood are expected to decline, but should be more than offset by higher costs for natural gas and starch.
European Printing Papers net sales were $355 million in the first quarter of 2007 compared with $345 million in the fourth quarter of 2006 and $305 million in the first quarter of 2006. Operating earnings in the first quarter of 2007 were a first-quarter record $50 million compared with a loss of $86 million in the fourth quarter of 2006 and earnings of $13 million in the first quarter of 2006.
Sales volumes in the first quarter of 2007 were down from the fourth quarter of 2006 reflecting the seasonal impact of the Russian New Year holiday period. Average sales price realizations improved in the first quarter as prices increased in Russia toward the end of the quarter and rose steadily throughout the quarter in Western Europe. Manufacturing costs were favorable due to strong operating performance. Raw material costs for wood were higher throughout Europe, and were further impacted by supply availability issues in Russia which caused an increased use of purchased pulp at the Svetogorsk mill. The fourth quarter of 2006 also included a $128 million special charge to reduce the carrying value of the assets of our Saillat mill in France to their estimated fair value.
Compared with the first quarter of 2006, sales volumes in the first quarter of 2007 improved largely due to higher market pulp sales. Sales volumes of uncoated freesheet paper were lower than the first quarter of 2006 as the impact of the closure of the Marasquel mill in France more than offset higher sales in Russia and Eastern Europe. Average sales price realizations were significantly higher due to the realization of price increases implemented in the latter part of 2006 and during the first quarter of 2007. Manufacturing costs were favorable as the result of strong operating performance and a reduction in planned maintenance shutdown expenses. Input costs were unfavorable due to higher wood costs, partially offset by lower energy costs in Western Europe and lower energy usage due to milder winter weather.
In the second quarter, earnings are expected to continue to be equally strong. Sales volumes will be down slightly reflecting planned production outages, but average sales price realizations will be higher as price increases in Russia and Western Europe are realized. Maintenance shutdown expenses will be higher and raw material costs will continue to be impacted by high wood costs.
Brazilian Printing Papersnet sales were $140 million in the first quarter of 2007 compared with $130 million in both the fourth and first quarters of 2006. Operating earnings in the first quarter of 2007 were $36 million compared with $18 million in the fourth quarter of 2006 and $36 million in the first quarter of 2006. The Company completed the previously announced asset exchange to acquire the Luiz Antonio mill on February 1, 2007.
Excluding the impact of the Luiz Antonio exchange, sales volumes in the first quarter of 2007 declined slightly compared with the fourth quarter of 2006, principally for uncoated freesheet paper reflecting normal seasonality and accelerated purchases by customers in the fourth quarter in anticipation of higher prices. Average sales price realizations were higher as the price increases for cutsize paper and offset paper that were announced in December were realized. In the fourth quarter of 2006, a mill optimization project outage had negatively impacted manufacturing costs by $11 million compared with the current quarter. Shipments from the Luiz Antonio mill were in line with expectations. Earnings from Luiz Antonio were $8 million for the thirdquarter as income recognition was delayed for in-transit shipments to Europe and the United States.
Compared with the first quarter of 2005 reflected full three-month operations.2006, excluding the impact from the Luiz Antonio exchange, sales volumes were essentially flat. Average sales price realizations improved reflecting the price increases for uncoated freesheet paper realized during 2006. Manufacturing costs were favorable, but were partially offset by higher input and transportation costs. In the first quarter of 2006, earnings also included the favorable impact from tax credits.
Looking ahead to the second quarter, earnings are expected to increase significantly. Sales volumes will reflect an additional month of sales from the Luiz Antonio mill. Average sales price realizations should be higher as price increases for domestic cutsize and offset paper begin to be realized. Manufacturing costs should also be favorable, more than offsetting the impact of a small planned maintenance outage at the Luiz Antonio mill.
Asian Printing Papers net sales were $5 million in the first quarter of 2007 compared with $5 million in the fourth quarter of 2006 and $2 million in the first quarter of 2006. Operating earnings were close to breakeven for all periods presented.
U.S. Market Pulpnet sales of $155 million in the first quarter of 2007 were higher than the net sales of $125 million in both the fourth and first quarters of 2006. Operating earnings were $21 million in the first quarter of 2007 compared with $16 million in the fourth quarter of 2006 and a loss of $2 million in the first quarter of 2006.
Sales volumes in the first quarter of 2007 improved compared with the fourth quarter of 2006 due to increased paper and tissue pulp shipments resulting from improved production at the Riegelwood mill. Shipments of fluff pulp were essentially unchanged. Average sales price realizations increased for softwood pulp in both North American and European markets. Average price realizations for fluff pulp were flat. Manufacturing operating expenses were unfavorable despite improvements at Riegelwood, although maintenance shutdown costs were $2 million lower than in the 2006 fourth quarter.
Compared with the first quarter of 2006, sales volumes increased slightly primarily for paper and tissue pulp and for fluff pulp. Average sales price realizations improved as prices for softwood pulp were up significantly due to supply constraints in the market. Freight costs were higher due to the impact of a rail rate increase in 2006 and increased shipments to our European warehouses to build inventories to better service customers. Maintenance shutdown expenses were $4 million favorable in the current quarter.
Entering the second quarter, earnings are expected to improve. Sales volumes for fluff pulp should increase slightly, but sales volumes for paper and tissue pulp will be flat. A previously announced price increase for softwood pulp is expected to be realized during the quarter. Maintenance shutdown expenses are expected to be lower compared with the first quarter. Raw material costs will reflect higher chemical and natural gas costs partially offset by lower wood costs.
Industrial Packaging
| 2006 | 2005 | 2007 | 2006 | ||||||||||||||||||||||||
In millions | 3rd Quarter | 2nd Quarter | Nine Months | 3rd Quarter | 2nd Quarter | Nine Months | 1st Quarter | 1st Quarter | 4th Quarter | ||||||||||||||||||
Sales | $ | 1,250 | $ | 1,240 | $ | 3,660 | $ | 1,075 | $ | 1,165 | $ | 3,455 | $ | 1,235 | $ | 1,175 | $ | 1,265 | |||||||||
Operating Profit | 138 | 100 | 277 | 29 | 84 | 215 | 103 | 29 | 130 | ||||||||||||||||||
Industrial Packaging net sales for the thirdfirst quarter of 20062007 were about even with2% lower than the secondfourth quarter of 2006, but were 16%5% higher than in the thirdfirst quarter of 2005.2006. Operating profits in the thirdfirst quarter of 2007 were 21% lower than in the fourth quarter of 2006, but more than double the first quarter of 2006.
North American Industrial Packaging net sales were 38% higher than$925 million in the secondfirst quarter of 2007 compared with $945 million in the fourth quarter of 2006 and significantly higher than$885 million in the thirdfirst quarter of 2005.
Containerboard2006. Operating earnings were $82 million compared with $114 million in the thirdfourth quarter of 2006 increased significantlyand $13 million in the first quarter of 2006.
Containerboard sales volumes decreased compared with the secondfourth quarter of 2006.2006 reflecting lower production resulting from planned maintenance outages. Average sales price realizations increased during the quarter, reflecting the full realization of previously announced price increases. Third-party sales volumes were higher due to increased availability of product resulting from higher mill production. Raw materialflat although an improved customer mix had a favorable impact on margins. Maintenance shutdown costs were favorable, reflecting lower average wood, coal and natural gas costs. Manufacturing costs were also favorably impacted by improved machine performance and fewer planned maintenance outages. However, freight costs remained high during the quarter. Earnings increased significantly$44 million higher in the 2006 thirdfirst quarter compared with the 2005 third quarter. Sales volumes were higher as no market-related downtime was taken in the 2006 third quarter versus 50,000 tons of market related downtime taken in the third quarter of 2005. Average sales prices were significantly higher, reflecting the realization of price increases in late 2005 and 2006. The impacts of higher costs for freight and energy were more than offset by lower costs for raw materials and the benefits from improved manufacturing operations.
Entering the fourth quarter, earnings are expected to decline slightly. Sales volumes and average sales price realizations for the quarter should improve. However, raw material costs are expected to be higher, and manufacturing costs are projected to rise reflecting planned maintenance outages.
U.S. Converting earnings for the 2006 third quartershutdowns at our Savannah, Mansfield and Vicksburg mills. Other costs of manufacturing operations were significantly lower than in the second quarter of 2006. Sales volumes decreasedfavorable due to softer demand in the southeasternimproved performance. Input costs were higher primarily for wood and south central markets. Improved average sales prices for container products reflected the partial realization of previously announced price increases; however, these increases lagged increases in the cost of linerboard, resulting in lower average margins. Manufacturing operationsenergy. Purchased fiber costs were unfavorable due to higher maintenance spending. Inputdemand and costs for utilities, raw materials and distributionpost-consumer old corrugated containers. The mills took 95,000 tons of downtime in the first quarter of which 16,000 tons were higher. due to lack of orders as compared with 14,000 tons of downtime in the fourth quarter, none of which was due to lack of orders.
Compared with the thirdfirst quarter of 2005,2006, sales volumes in the first quarter of 2007 were lower reflecting the oversold conditions existing in the prior-year quarter. Average sales price realizations were significantly higher, however, due to the price increases implemented during 2006. Maintenance shutdown expenses were $26 million higher in the current quarter, more than offsetting the favorable impact of improved manufacturing performance. Raw material costs were lower due to decreased costs for fuel and caustic soda, although this was more than offset by the higher cost of purchased pulp.
U.S. Converting sales volumes in the first quarter of 2007 were lower than in the fourth quarter of 2006 due to seasonally slower market conditions and reduced demand for boxes early in the quarter. Sales margins improved reflecting an improved product and customer mix. Manufacturing costs were favorable while utility and raw material costs were unfavorable, primarily due to increased costs for starch and seasonal increases in energy consumption. These costs were partially offset by the favorable impact of higher prices for sales of waste fiber. Compared with the first quarter of 2006, sales volumes in the first quarter of 2007 were lower due to softer demand. Improved manufacturing costs were largely due to improvements in operating efficiencies and better spending controls. Input costs were unfavorable due to increased costs for starch and wax, partially offset by lower energy costs.
Looking ahead to the second quarter, earnings for North American Industrial Packaging are expected to improve. Sales volumes should increase as customer demand for boxes strengthens, although this impact will be partially offset by a slightly less favorable product mix. Average sales prices for the quarter should remain essentially flat as announced price increases begin to take effect late in the quarter. Maintenance shutdown expenses are forecasted to be $29 million lower in the second quarter. However, the conversion of the Pensacola mill from the production of uncoated free sheet paper to containerboard in the second quarter as part of our previously announced Transformation Plan will negatively impact Industrial Packaging’s earnings while the mill is shut down for the transition. Raw material costs will be slightly favorable, principally for utilities.
European Industrial Packagingnet sales were $265 million for the first quarter of 2007 compared with $275 million for the fourth quarter of 2006 and $240 million for the first quarter of 2006. Operating earnings were $20 million in the first quarter of 2007 compared with $15 million in both the fourth and first quarters of 2006. The 2006 results include contributions from the box plants in the United Kingdom and Ireland which were sold at the end of the year.
Sales volumes in the first quarter of 2007 were slightly higher than in the fourth quarter of 2006 due to seasonal improvements in Morocco and a strong fruit and vegetable box season in Italy. Sales margins increased over the fourth quarter due to a favorable product mix in Morocco and fewer export sales in the first quarter of 2007. Conversion costs were favorable reflecting higher production volumes and the implementation of manufacturing improvement programs.
Compared to the first quarter of 2006, sales volumes improved in the first quarter of 2007 due to strong container demand in Italy and Spain. Sales margins were higher in the current year due to a stronger product mix in Morocco. Conversion costs were favorable, reflecting the impact of the manufacturing improvement programs as well as a reduction in energy costs. Favorable foreign exchange rates also had a positive impact on earnings in the third quarter of 2006 were also lower. Sales volumes were higher, but average margins were down as average sales prices were not sufficient to offset increased board costs. Input costs for raw materials and distribution were higher as were the costs of manufacturing operations.current quarter.
Entering the fourthsecond quarter, earnings are expected to improve slightly. Sales volumes should remain essentially flat with slightly higher averagethe first quarter, but sales margins will improve due to the realization of sales price realizationsincreases in Morocco and betterFrance as well as stronger market demand for the recycled board produced at our Etienne mill. Conversion costs should be favorable due to the continuing impact of our manufacturing operations.improvement initiatives. In addition, earnings from our operations in Turkey are expected to be stronger in the second quarter.
European ContainerAsian Industrial Packaging net sales were $45 million in the first quarter of 2007 compared with $45 million in the fourth quarter of 2006 and $50 million in the first quarter of 2006. Operating earnings forwere $1 million in the 2006 thirdfirst quarter of 2007 as well as the fourth and first quarters of 2006. The benefits from increased sales volumes in the first quarter of 2007 compared with the secondfourth quarter of 2006 due principally to a $13 million pre-tax gain on the sale of property in Spain. Sales volumes decreased, reflecting seasonal softness in the European agricultural business mainly affecting operations in Spainwere offset by higher raw material and Morocco. The impact of lower volume was softened by an increase in margins. Input costs for energy were favorable for the second quarter in a row. Compared with the third quarter of 2005, earnings increased due to the property sale in Spain. Otherwise, sales volumes were lower and containerboard cost increases were greater than the increase in container average sales prices, resulting in lower margins. Energy costs were also higher than 2005. Looking ahead to the fourth quarter, excluding the effect of the third-quarter gain in Spain, earnings are expected to improve significantly as sales volumes benefit from the European fruit and vegetable season and margins also improve. Energy costs are expected to average about the same as in the third quarter.freight costs.
Consumer Packaging
| 2006 | 2005 | 2007 | 2006 | ||||||||||||||||||||||||
In millions | 3rd Quarter | 2nd Quarter | Nine Months | 3rd Quarter | 2nd Quarter | Nine Months | 1st Quarter | 1st Quarter | 4th Quarter | ||||||||||||||||||
Sales | $ | 855 | $ | 795 | $ | 2,425 | $ | 785 | $ | 790 | $ | 2,290 | $ | 750 | $ | 615 | $ | 735 | |||||||||
Operating Profit | 64 | 41 | 140 | 43 | 53 | 128 | 61 | 47 | 27 | ||||||||||||||||||
Consumer Packaging net sales for the thirdfirst quarter of 20062007 were 8%2% higher than in the secondfourth quarter of 2006 and 9%22% higher than in the thirdfirst quarter of 2005.2006. Operating profits in the first quarter of 2007 were significantly higher than in the fourth quarter of 2006 and 30% higher than in the first quarter of 2006.
North American Consumer Packagingnet sales were $605 million in the first quarter of 2007 compared with $615 million in the fourth quarter of 2006 and $565 million in the first quarter of 2006. Operating earnings were $42 million in the first quarter of 2007 compared with $15 million in the fourth quarter of 2006 and $35 million in the first quarter of 2006.
Coated Paperboard sales volumes improved in the first quarter of 2007 compared with the fourth quarter of 2006 due to very strong market conditions for folding carton board. Average sales prices increased reflecting the partial realization of announced price increases for cupstock board and folding carton board. Compared
with the 2006 fourth quarter, maintenance shutdown costs were $20 million lower in the first quarter of 2007 due to the timing of the outages. Other manufacturing operating costs were slightly favorable due to improved operations at our Riegelwood mill. Input costs were higher, primarily for wood, but energy and freight costs were also higher. Compared with the first quarter of 2006, sales volumes were up slightly. Strong demand for folding carton board was offset by weaker demand for coated bristols and cupstock board. Average sales prices were significantly higher due to the realization of sales price increases during the latter part of 2006. Maintenance shutdown expenses were flat. Manufacturing operations were favorable. Freight costs were higher due to rail rate increases in the third quarter of 2006 and increased fuel costs. Input costs were 56%lower due to decreases in costs for energy and polyethylene, partially offset by higher thanwood costs.
Shorewood Packaging’s sales volumes in the secondfirst quarter of 2007 declined from the fourth quarter of 2006 due to seasonally slower demand and 48% higher thanadditional weakness in the third quarterhome entertainment segment. A slight increase in sales prices was realized, but this impact was offset by lower margins resulting from a decrease in sales of 2005.
Coated Paperboardhigher margin home entertainment and consumer products. Operating costs were favorable reflecting the favorable impact of personnel reductions. Raw material costs were slightly higher due to an increase in bleached board costs, while freight costs were lower due to reduced shipping volumes and lower expedited freight costs. In addition, earnings for bleached packaging board and coated bristols in the third2006 fourth quarter included a $13 million one-time non-cash charge. Compared with the first quarter of 2006, exceeded second-quarter 2006 levels. Salessales volumes increased, primarily in the folding carton board product line.first quarter of 2007 were lower due to softer demand for home entertainment and tobacco products, partially offset by stronger demand for consumer products and displays. Average sales prices were also up, mainlyslightly higher, but these benefits were offset by a decline in sales margins caused by a less profitable mix and a lower average margin for cupstock and folding carton board. Inputconsumer products. Favorable operating costs however, were unfavorable, reflecting higher wood and polyethylene costs. Manufacturing operations were favorable, due toreflect improved energy usage and significantly better system performance and reliability. Compared with the 2005 third quarter, earnings in the third quarter of 2006 were significantly higher. The favorable impacts of increased sales volumes, higher average sales prices and improved manufacturing operations more than offset the effects of higher distribution and input costs. Operating results are expected to soften in the 2006 fourth quarter. Sales volumes for bleached board products and coated bristols are expected to be seasonally lower, but average price realizations should continue to improve. Planned maintenance outages should also unfavorably impact manufacturing costs.
Foodservice Packagingearnings increased in the third quarter of 2006 compared with the second quarter of 2006. Sales volumes were seasonally lower, but average sales prices increased slightly as price increases were implemented in certain annual contracts.operating performance. Raw material costs were slightly higher due to cost increases for bleached board.
The Foodservice business’s sales volumes in the first quarter of 2007 were lower than in the fourth quarter of 2006 due to seasonally lighter demand. Average price realizations and margins increased, reflecting resin and uncoated bleached board cost increases. Operatingthe impact of contract price renegotiations as well as lower rebates. Converting operating costs were favorable.favorable as a result of higher production volumes in anticipation of upcoming seasonal sales volume increases. Lower raw material costs reflected decreases in polyethylene and polystyrene costs, while board costs were flat. Compared with the thirdfirst quarter of 2005,2006, sales volumes were down, but averageslightly higher. Average sales prices were higher as a resultreflecting price increases realized throughout 2006 and in the first quarter of the realization of announced price increases.2007. Converting operation costs improved due to increased efficiencies and higher production volumes. Raw material costs were unfavorable due to higher bleached board and resin costs. Enteringcost increases.
Looking ahead to the 2006 fourthsecond quarter, sales volumescoated paperboard earnings are expected to decline primarily due to a $15 million increase in maintenance costs associated with planned maintenance shutdowns at our Texarkana and Augusta mills. These higher costs will be flat. Averagesomewhat mitigated by increased sales volumes and the continued realization of previously announced price realizations shouldincreases. In addition, operations at the Riegelwood mill are expected to continue to increase, as willimprove. However, raw material costs with a full-quarter impact of a September increaseshould be higher due to increases in coated bleached boardenergy, starch and polyethylene costs. As a result, overallShorewood earnings are expected to improve due to increased market demand for consumer products. Foodservice earnings are expected to be slightly lower thanflat with the first quarter. Sales volumes should be seasonally higher, but sales margins will decline with an increase in lower-margin cold cup sales. Raw material costs will be higher due to increases in polyethylene and polystyrene costs and a March cost increase in coated cupstock.
European Consumer Packagingnet sales were $70 million in the third quarter.
Shorewood Packaging earnings forfirst quarter of 2007 compared with $70 million in the thirdfourth quarter of 2006 improvedand $50 million in the first quarter of 2006. Operating earnings were $16 million in the first quarter of 2007 compared with $10 million in the secondfourth quarter of 2006 which had included a write-off of equipment that was removed from production. Sales volumes increasedand $12 million in the tobacco, consumer products and home entertainment segments; however, this benefit was partially offset by lower demand in the display segment. A weaker mix in the home entertainment segment resulted in lower margins. Manufacturing operating costs were favorable due to efficiency gains and performance improvements at the home entertainment plants. Compared with the third quarter of 2005, the benefits from stronger tobacco and consumer products demand were partially offset by the effects of weaker display and home entertainment sales. Operating costs were flat, while raw material costs were unfavorable due to bleached board cost increases. As the 2006 fourth quarter begins, earnings are expected to increase, although seasonal improvement in sales volumes in the home entertainment segment are anticipated to be weaker than in previous years.
Beverage Packagingearnings increased in the third quarter of 2006 compared with the secondfirst quarter of 2006. Sales volumes for converted productsin the first quarter of 2007 were flat, however third-party sales volumes improved with increases in liquid packaging board and coated groundwood papers shipmentsdown from the Pine Bluff, Arkansasfourth quarter of 2006 due to wood supply availability issues in Russia which led to some production downtime at the Svetogorsk mill. InputAverage sales price realizations improved in the first quarter due to a better geographic mix of sales. Manufacturing costs were slightly higher, primarily due to higher polyethylene prices. Manufacturing operations were favorable reflecting reduced maintenance spending and improved energy usage. Converting plant operations were unfavorable in both North America and Asia.as a result of strong operating performance. Compared with the thirdfirst quarter of 2005, earnings for2006, sales volumes in the 2006 thirdfirst quarter of 2007 improved significantly reflecting the
increased market share achieved following the capacity expansion of both coated paperboard machines. Average sales price realizations were higher largelylower due to higher average prices for liquid packaging board and coated groundwood papers. Sales volumes were lower acrossincreased sales to export markets. In the business. Mill manufacturing costs were favorable due to improved productivity and energy efficiency improvements. Raw material costs for polyethylene and board were higher. Looking forward to the 2006 fourth2007 second quarter, earnings are expected to decrease principallybe lower due to seasonally lower shipmentsa seasonal decline in demand and the annual planned maintenance shutdown at the Svetogorsk mill.
Asian Consumer Packaging net sales were $75 million in the first quarter of coated groundwood papers.2007. International Paper acquired a 50% ownership interest in Shandong International Paper & Sun Cartonboard Ltd. during the fourth quarter of 2006. Net sales for the two-month period of ownership in 2006 were $50 million. Operating earnings in the first quarter of 2007 were $3 million compared with $2 million for the fourth quarter of 2006.
Distribution
| 2006 | 2005 | |||||||||||||||||
In millions | 3rd Quarter | 2nd Quarter | Nine Months | 3rd Quarter | 2nd Quarter | Nine Months | ||||||||||||
Sales | $ | 1,730 | $ | 1,690 | $ | 5,070 | $ | 1,645 | $ | 1,570 | $ | 4,745 | ||||||
Operating Profit | 34 | 36 | 97 | 23 | 18 | 59 | ||||||||||||
In millions Sales Operating Profit 2007 2006 1st Quarter 1st Quarter 4th Quarter $ 1,675 $ 1,650 $ 1,715 29 27 31
Distribution’s 2006 third-quarter2007 first quarter sales were up 2% below the fourth quarter of 2006 while operating profits were down 6%. Compared to the 2006 first quarter, sales rose 1% while operating profits increased 7% to record first quarter levels.
Sales of printing papers and graphic arts supplies and equipment were $1.07 billion in the first quarter of 2007 compared with $1.06 billion in both the secondfourth quarter of 2006 and up 5% compared with the thirdfirst quarter of 2005. Operating profits2006. Revenues were down 6%slightly higher in the thirdfirst quarter of 2007 than the fourth quarter of 2006 reflecting two additional shipping days. Adjusting for this factor, revenues were down about 1% versus the fourth quarter. Trade margins for printing papers were down slightly in the first quarter of 2007 compared with both the secondfourth quarter of 2006 and 48% higherthe first quarter of 2006 as the result of an increase in lower-margin direct shipments. Compared to the fourth quarter of 2006, trade margins for the first quarter of 2007 declined because of mix, reflecting an increase in lower-margin mill direct shipments. Compared to the first quarter of 2006, margins declined slightly as increases in resale prices trailed cost increases.
Revenue from packaging products was $358 million in the first quarter of 2007 compared to $384 million in the fourth quarter of 2006 and $355 million in the first quarter of 2006. Revenues were seasonally lower than the fourth quarter of 2006 as activity with customers in retail and related segments peak in the fourth quarter. Trade margins for packaging products increased in the first quarter of 2007 compared with both the thirdfourth quarter of 2005.2006 and the first quarter of 2006 reflecting a more favorable product and service mix.
Compared with the very strong 2006 second quarter, earningsFacility supplies revenues were only slightly lower$245 million in the 2006 third quarter. Sales volumes were flat overall as volume increasesfirst quarter of 2007 compared to $273 million in the packaging segmentfourth quarter of 2006 and $235 million in the first quarter of 2006. Revenues were offset by declinesseasonally lower than the fourth quarter of 2006 as activity with customers in other segments. Average sales prices were higherretail and related segments peak in all segments, howeverthe fourth quarter. Trade margins were slightly lower. Operating expensesfor facility supplies products in the first quarter of 2007 were essentially flat. Compared withunchanged from the thirdfourth quarter of 2005, earnings2006 and the first quarter of 2006.
Operating profit was $29 million in the first quarter of 2007 compared to $31 million in the fourth quarter of 2006 and $27 million in the first quarter of 2006. The seasonal decline in revenues was the primary cause for the 2006 thirdlower operating profit compared to the fourth quarter were much higher. Sales volumes were up with increasesof 2006. However, lower administrative costs in the packaging segment only partially offset by decreasesfirst quarter helped mitigate the earnings effect of lower revenues. Compared to the first quarter of 2006, the increase in the printingrevenues combined with lower operating expenses, reflecting lower personnel costs and facility supplies segments. Average sales prices increased approximately 5% across all segments. Operating expenses were favorable, reflecting lower current period labor costs as a result of restructuring activities, the absence of the prior year charges incurredrationalizations, to accomplish this restructuring, and lower legal expenses.increase operating profits.
Looking forward, operating results in the fourthsecond quarter are expected to declineimprove due to seasonally weaker sales volume.continued revenue growth.
Forest Products
| 2006 | 2005 | 2007 | 2006 | |||||||||||||||||||||||||||||||||
In millions | 3rd Quarter | 2nd Quarter | Nine Months | 3rd Quarter | 2nd Quarter | Nine Months | 1st Quarter | 1st Quarter | 4th Quarter | |||||||||||||||||||||||||||
Sales | $ | 445 | $ | 595 | $ | 1,670 | $ | 700 | $ | 605 | $ | 1,915 | $ | 85 | $ | 235 | $ | 190 | ||||||||||||||||||
Operating Profit: | ||||||||||||||||||||||||||||||||||||
Forest Resources- | ||||||||||||||||||||||||||||||||||||
Sales of Forestlands | 125 | 101 | 329 | 125 | 67 | 261 | $ | 90 | $ | 103 | $ | 118 | ||||||||||||||||||||||||
Harvest & Recreational Income | 63 | 61 | 196 | 63 | 62 | 194 | ||||||||||||||||||||||||||||||
Harvest & Recreational | ||||||||||||||||||||||||||||||||||||
Income | 12 | 72 | 26 | |||||||||||||||||||||||||||||||||
Forestland Expenses | (27 | ) | (31 | ) | (87 | ) | (43 | ) | (39 | ) | (116 | ) | (4 | ) | (30 | ) | (27 | ) | ||||||||||||||||||
Real Estate Operations | 5 | 29 | 79 | 65 | 39 | 158 | 2 | 45 | 45 | |||||||||||||||||||||||||||
Wood Products | (37 | ) | 24 | 22 | 61 | 62 | 172 | |||||||||||||||||||||||||||||
Operating Profit | $ | 129 | $ | 184 | $ | 539 | $ | 271 | $ | 191 | $ | 669 | $ | 100 | $ | 190 | $ | 162 | ||||||||||||||||||
Forest Products net sales in the thirdfirst quarter of 20062007 were 25%55% lower than in the secondfourth quarter of 2006 and 36%64% lower than in the thirdfirst quarter of 2005.2006. Operating profitsearnings in the thirdfirst quarter of 20062007 were 30%38% and 47% lower than in the secondfourth and first quarters of 2006, respectively. These reductions reflect the impact of the 5.6 million acres of forestland sold in 2006 as part of the Company’s Transformation Plan, primarily in the fourth quarter that significantly reduced the Company’s forestland acreage.
Forest Products gross margins from forestland sales in the first quarter of 2007 decreased by $28 million compared with the fourth quarter of 2006 and were 52% lower thandue to a decrease in the third quarter of 2005.
Forest Resourcesacreage sold. U.S. harvest and recreational income increased slightlydeclined $14 million versus the 2006 secondfourth quarter, reflecting a slight increase in harvest volumes. Gross margins fromthe impact of the 2006 forestland and timber lease sales in the third quarter of 2006 increased by $24 million, but this benefit was offset by a $24 million decrease in profitssales. Profits from sales of higher-and-better-usehigher and better use real estate properties.properties decreased by $43 million. Forestland operating expenses were $23 million lower due to the reduced level of business operations. Compared with the 2005 third2006 first quarter, harvest and recreational income was flat although harvest volumes were higher. Grossgross margins on forestland sales were also flat, but earnings from sales of higher-and-better use properties were downdeclined $13 million. Harvest and recreational income decreased $60 million. Forestland operating expenses in the third quarter of 2006 were $16$26 million lower than in the thirdfirst quarter of 2005, reflecting2006. In the effects of operational improvements implemented since 2005 and some non-recurring 2005 cost items. Looking ahead to the 2006 fourth2007 second quarter, the anticipated closing of the remaining announced Transformation Plan forestland salesearnings are expected to eliminate over 85% of timberland ownership during the fourth quarter. Forestland sales from remaining holdings should remain strongdecline with a further decrease in the fourth quarter, however future earnings can be expected to begin to decline due to the lower contributions from harvest and recreation income and slightly lower forestland salessales. However, the timing and lower recreational income.
In March and April of 2006, the Company announced agreements for the future sales of approximately 5.7 million acres, or over 85% of its U.S. forestlands, for proceeds of approximately $6.6 billion. A portionamount of these sales were completed in the third quarter 2006 for proceeds of $400 million, resulting in a pre-tax gain of $304 million. In the second quarter of 2006, sales totaling of $97 million were completed, resulting in a pre-tax gain of $62 million. These gains are included in Net (gains) losses on sales and impairments of businesses in the accompanying consolidated statement of operations. The remaining sales are expectedcan change due to be completed during the fourth quarter of 2006. The completion of these sales transactions can be expected to significantly reduce the future operating earnings of this segment.
Wood Productsearnings in the third quarter of 2006 decreased significantly compared with the second quarter of 2006 as sales prices for both lumber and plywood declined to the lowest levels of the current cycle. Sales volumes were also down, and manufacturing costs were unfavorably impacted by a reduced production schedule. However, input costs for wood and chips were favorable. Compared with the third quarter of 2005, earnings were also significantly lower as the result of the declines in sales prices. The impacts of lower sales volumes and higher manufacturing costs were partially offset by lower input costs for wood and chips. Entering the fourth quarter, average sales prices are expected to average lower than in the 2006 third quarter, although market prices for lumber and plywood are not expected to decline much below third-quarter levels. Manufacturing costs will continue to reflect the negative impact of reduced production levels as well as holiday scheduling. Input costs should continue to be favorable.various factors.
Specialty Businesses and Other
| 2006 | 2005 | 2007 | 2006 | |||||||||||||||||||||||||
In millions | 3rd Quarter | 2nd Quarter | Nine Months | 3rd Quarter | 2nd Quarter | Nine Months | 1st Quarter | 1st Quarter | 4th Quarter | |||||||||||||||||||
Sales | $ | 245 | $ | 235 | $ | 710 | $ | 220 | $ | 230 | $ | 725 | $ | 135 | $ | 225 | $ | 225 | ||||||||||
Operating Profit | 22 | 16 | 48 | (8 | ) | 7 | 9 | 6 | 13 | 12 | ||||||||||||||||||
The Specialty Businesses and Other segment principally includes the operating results of Arizona Chemical, as well as certain smaller businesses. The Arizona Chemical business was sold in February 2007; thus 2007 operating results reflect only two months of activity. Net sales forin the thirdfirst quarter of 20062007 were 4% higher40% lower than in both the second quarterfourth and first quarters of 2006, and 11% higher than in the third quarter of 2005.2006. Earnings in the 2006 third2007 first quarter were up 38% from the second quarter of 2006, and were up significantlydown 50% compared with the third quarter of 2005.
Earnings for Arizona Chemical for the third quarter of 2006 improved from the second quarter of 2006 as average sales price realizations increased in both the U.S. and Europe. This favorable impact was largely offset by the effects of higher input costs for energy and crude tall oil (CTO), lower sales volumes, and higher manufacturing costs in Europe. Gains from property and equipment sales in the 2006 third quarter accounted for essentially all of the improvement in earnings. Compared with the third quarter of 2005, earnings improved due to higher average sales prices and favorable manufacturing costs, and the gain on land and equipment sales, partially offset by lower sales volumes and increased costs for CTO. The third quarter of 2005 also included a $13 million special charge related to a plant shutdown in Norway. Looking ahead to the fourth quarter of 2006 earnings are expected to decrease as input costs continue to increase. However, improved average sales price realizations and better manufacturing operations should be favorable factors.54% compared with the first quarter of 2006.
LIQUIDITY AND CAPITAL RESOURCES
Cash provided by continuing operations totaled $1.6 billion$296 million for the first ninethree months of 2006,2007, up from $0.9 billion$185 million for the comparable 2005 nine-month2006 three-month period reflecting higher earnings after adjustments for non-cash charges and lower increases incharges. Cash used for working capital requirements.components was about the same for both three-month periods.
Cash proceeds from divestitures totaled approximately $1.6 billion for the 2007 first quarter, relating to the sales of the Kraft Papers, Beverage Packaging, Wood Products, and Arizona Chemical businesses closed during the quarter. Investments in capital projects totaled $802 million for the first nine months of 2006 compared with $756$178 million in the 2007 first nine months of 2005.quarter compared with $168 million in the 2006 first quarter. Full-year 20062007 capital spending is currently expected to be approximately $1.2 billion, or about equal to estimated depreciation and amortization expense. Also during the 2006 nine-month period, approximately $2.2 billion of cash was generated from divestitures compared with approximately $1.4 billion in the first nine months of 2005.
Financing activities for the first ninethree months of 20062007 included a $1.9 billion net decrease$362 million reduction in debt compared withversus a $2.3 billion net$743 million decrease induring the 2005 nine-monthcomparable 2006 three-month period. In August 2006,First quarter 2007 activity included repayment by International Paper used
approximately $320Investments (Luxembourg) S.ar.l, a wholly-owned subsidiary of International Paper, of $143 million of cash to repay its maturing 5.375% euro-denominated notes that were designated aslong-term debt with an interest rate of LIBOR plus 40 basis points and a hedge of euro functional currency net investments.maturity date in November 2010. Other debt activity in the third quarter included the repayment of $143$198 million of 7.875%7 5/8% notes and $96 million of 7% debentures, all maturingthat matured within the quarter.
In June First quarter 2006 International Paper paid approximately $1.2 billion toactivity included the repurchase substantially all of its zero-coupon convertible debentures at a price equal to their accreted principal value plus interest, using proceeds from divestitures and $730 million of third party commercial paper issued under the Company’s receivables securitization program. As of September 30, 2006, International Paper had reduced this commercial paper borrowing by a net of $30 million, reflecting repayments of second-quarter borrowings less amounts required for the “Dutch Auction” tender offer in September, and plans to repay the remainder by the end of 2006.
In February 2006, International Paper repurchased $195 million 6.4% debentures with an original maturity date of February 2026. Other reductions in the first quarter 2006 included2026, and early payment of approximately $495 million of notes with coupon rates ranging from 4% to 8.875% and original maturities from 2007 to 2029. Pre-tax early debt retirement costs of $8 million related to first quarter 2006 debt reductions are included in Restructuring and other charges in the accompanying consolidated statement of operations.
In September 2005, International Paper used some of the proceeds from the CHH sale to repay the remaining $250 million portion of a subsidiary’s $650 million long-term debt with an interest rate of LIBOR plus 62.5 basis points and a maturity date of JuneAt March 31, 2007 and $312 million of commercial paper that had been issued in the same quarter. Other reductions in the third quarter of 2005 included $662 million of notes with coupon rates ranging from 4% to 7.35% and original maturities from 2009 to 2029, and the repayment of $150 million of 7.10% notes with a maturity of September 2005.
In the second quarter of 2005, International Paper repatriated approximately $1.2 billion in cash from certain of its foreign subsidiaries, including amounts under the American Jobs Creation Act of 2004. In June 2005, International Paper used approximately $400 million of cash available after the repatriations to repay a portion of a subsidiary’s long-term debt with an interest rate of LIBOR plus 62.5 basis points and a maturity date of June 2007. First-quarter 2005 activity included the redemption in February of the outstanding $464 million of International Paper Capital Trust 5.25% convertible subordinated debentures at 100.5% of par plus accrued interest, and early payment of approximately $295 million of notes with coupon rates ranging from 4% to 7.875% and original maturities from 2006 to 2015.
At December 31, 2005,2006, International Paper classified as Long-term debt $1.25 billion$100 million of tenderable bonds, commercial paper and bank notes and current maturities of long-term debt as Long-term debt. International Paper hadhas the intent and ability, throughas evidenced by its fully committed credit facilities,facility, to renew or convert these obligations.
In July 2006, in connection with the planned usefirst three months of projected proceeds from the Company’s Transformation Plan, International Paper’s Board of Directors authorized a share repurchase program to acquire up to $3.0 billion of the Company’s stock. In a modified “Dutch Auction” tender offer completed in September 2006, International Paper2007, purchased 38,465,26011.2 million shares of its common stock at a pricethrough open market purchases for approximately $398 million, and issued approximately 2.7 million shares of $36.00 per share, plus costs to acquire the shares,treasury stock for a total costvarious incentive plans, including stock option exercises that generated approximately $30 million of approximately $1.4 billion.
Incash and restricted stock that did not generate cash. During the first ninethree months of 2006, approximately 2.82.2 million shares of common stock were issued for various incentive plans, including stock option exercises that generated $26 million of cash and restricted stock that did not generate cash. During the first nine months of 2005, approximately 3.0 million shares of common stock were issued for various incentive plans, including stock option exercises that generated $20$7 million of cash and restricted stock that did not generate cash. Common stock dividend payments totaled $372$114 million and $368$123 million for the first ninethree months of 20062007 and 2005,2006, respectively. Dividends were $.75$.25 per share for both periods.
Maintaining a strongan investment-grade credit rating is an important element of International Paper’s corporate financefinancing strategy. InAt March 31, 2007, the third quarterCompany held long-term credit ratings of 2006,BBB (stable outlook) and Baa3 (stable outlook) by Standard & Poor’s (S&P) revised the outlook on the Company’s long-termand Moody’s Investor Services (Moody’s), respectively. The Company currently has short-term credit ratings from BBB negative to stable outlookby S&P and upgraded its short-term credit rating from A-3 to A-2. At September 30, 2006, the Company also held a long-term credit ratingMoody’s of Baa3 (stable outlook)A-2 and a short-term credit rating P-3, from Moody’s Investor Services.respectively.
International Paper expects to be able to meet projected capital expenditures, service existing debt and meet working capital and dividend requirements during 20062007 through cash from operations and divestiture proceeds, supplemented as required by its various existing credit facilities.
At September 30, 2006,March 31, 2007, International Paper has approximately $3.2$2.5 billion of committed liquidity, including contractually committed bank credit agreements and a receivables securitization program. In March 2006, International Paper replaced its maturing $750 million revolving bank credit agreement with a 364-day $500 million fully committed revolving bank credit agreement that expires in March 2007 and has a facility fee of 0.08% payable quarterly, and replaced its $1.25 billion revolving bank credit agreement with a $1.5 billion fullycontractually committed revolving bank credit agreement that expires in March 2011 and has a facility fee of 0.10% payable quarterly.The new agreements generally provide for interest rates at a floating rate index plus a pre-determined margin dependent upon International Paper’s credit rating. At September 30, 2006, International Paper had $700 million of outstanding borrowings under its receivables securitization program andthat expires in October 2009. In March 2007, the Company did not renew its maturing $500 million 364-day fully committed bank credit agreement after reviewing its liquidity position. There were no outstanding borrowings under the fully committed revolving bank credit agreements. agreement or the receivables securitization program at March 31, 2007.
Additionally, International Paper Investments (Luxembourg) S.ar.l aand International Paper (Europe) S.A., both wholly-owned subsidiarysubsidiaries of International Paper, hasjointly have a $100 million revolving bank credit agreement that expiresmaturing in November 2006December 2007, with approximately $46 million in associatedno borrowings outstanding as of September 30, 2006.
On October 25, 2006, the Company amended its existing receivables securitization program that provided up to $1.2 billion of commercial paper-based financings with a facility fee of 0.20% and an expiration date in November 2007, to provide up to $1 billion of available commercial paper-based financings with a facility fee of 0.10% and an expiration date in October 2009.March 31, 2007.
The Company will continue to rely upon debt and capital markets for the majority of any necessary funding not provided by operating cash flow or divestiture proceeds. Funding decisions will be guided by our capital structure planning and liability management practices. The primary goals of the Company’s capital structure planning are to maximize financial flexibility and preserve liquidity while reducing interest expense. The majority of International Paper’s debt is accessed through global public capital markets where we have a wide base of investors.
TRANSFORMATION PLAN
In July, 2005, International Paper announced a plan to transform its business portfolio to concentrate on two key global platform businesses: Uncoated Papers (including Distribution) and Packaging. The plan also focuses on improving shareholder return through mill realignments in those two businesses, additional cost improvements and exploring strategic options for other businesses, including possible sale or spin-off.
In connection with this plan,During the first quarter of 2007, the Company completed the salesales of its 50.5% interest in Carter Holt Harvey Limited for $1.1 billion in the third quarter of 2005. In addition, in March and April of 2006, International Paper announced agreements for future sales in 2006 of approximately 5.7 million acres of U.S. forestlands for proceeds of approximately $6.6 billion. During the second and third quarters of 2006, the Company completed sales of approximately 552,000 acres of these forestlands for approximately $498 million, including an installment note receivable of $136 million, resulting in pre-tax gains of approximately $366 million. In October and November, following the end of the 2006 third quarter, International Paper completed two additional previously announced sales of approximately 5.1 million acres of forestlands for proceeds totaling approximately $6.1 billion of cash and notes. These sales will result in an estimated special fourth-quarter pre-tax gain in excess of $4 billion. With the closing of this sale, proceeds from Transformation Plan forestlands sales now total $6.6 billion.
In the 2006 second quarter, the Company announced the signing of definitive agreements to sell its Coated and Supercalendered Papers business for approximately $1.4 billion, andNorth American Beverage Packaging operations, its Kraft Papers business, forits Arizona Chemical business, and most of its Wood Products business. This substantially completes divestitures under the Company’s Transformation Plan, resulting in total proceeds of approximately $155 million plus two additional future payments of up to $60 million contingent upon business performance, with the estimated proceeds from both sales subject to certain closing and post-closing adjustments. The sale$11.3 billion. As part of the Coated and Supercalendered Papers business was completed in the 2006 third quarter, with the Kraft Papers sale expected to close in late 2006 or early 2007. Also in the third quarter, the Company completed the sale of its Brazilian Coated Papers business to Stora Enso Oyj forPlan, these proceeds have been used to: (1) reduce long-term debt by approximately $420 million, subject to certain post-closing adjustments. The Company continues to evaluate strategic options for its Beverage Packaging, Wood Products and Arizona Chemical businesses.
International Paper currently estimates that after-tax proceeds from the above announced and possible future divestitures will total approximately $11$6.2 billion and expects thatfund a $1.0 billion voluntary contribution to the proceeds from these sales plus additional free cash flow generated from operations will be used as follows:
As part of the planned debt reduction,2007 second quarter under the Company’s share repurchase program. The Company is planningcontinuing to make voluntary contributionsprogress on its three-year $1.2 billion non-price improvement program to the U.S. qualified pension fund in the range of $500 million to $1.0 billion to begin satisfying longer-term funding requirements and to lower future pension expense. Pension obligations are viewed by the ratings agencies as equivalent to debt.
During the 2006 third quarter, in connection with the planned use of the above projected proceeds, the Company purchased through a modified “Dutch Auction” tender offer, 38,465,260 shares (or approximately 6%) of its common stock at a price of $36.00 per share, plus costs to acquire the shares, for a total cost of approximately $1.4 billion. Following the completion of this tender offer, International Paper had approximately 454.8 million shares of common stock outstanding.
Also during the quarter, the Company entered into an agreement to exchange a pulp mill project being developed in the state of Mato Grosso do Sul, Brazil (together with approximately 100,000 hectares of forestlands) for the existing Luiz Antonio pulp and uncoated paper mill and approximately 60,000 hectares of forestlands located in the state of Sao Paulo, Brazil. The Company will fund the pulp mill project in the amount of U.S. $1.15 billion. This exchange transaction is expected to close by February 1, 2007.
Finally, subsequent to the end of the 2006 third quarter, International Paper and Ilim Pulp, the largest forest products enterprise in Russia, announced that a letter of intent had been signed to establish a 50-50 joint venture. If definitive agreements are reached, this joint venture would be the largest foreign-domestic alliance in the Russian forest sector. It is currently contemplated that International Paper will purchase a 50% equity interest in the joint venture for approximately $400 million in cash. The total enterprise value of the joint venture is approximately $1.3 billion. The parties currently expect to finalize the agreement in the next six months, following completion of due diligence, receipt of required regulatory approvals, and the approvals of their respective boards of directors.enhance business profitability.
CRITICAL ACCOUNTING POLICIES
The preparation of financial statements in conformity with accounting principles generally accepted in the United States requires International Paper to establish accounting policies and to make estimates that affect both the amounts and timing of the recording of assets, liabilities, revenues and expenses. Some of these estimates require judgments about matters that are inherently uncertain.
Accounting policies whose application may have a significant effect on the reported results of operations and financial position of International Paper, and that can require judgments by management that affect their
application, include SFAS No. 5, “Accounting for Contingencies,” SFAS No. 144, “Accounting for the Impairment or Disposal of Long-Lived Assets,” SFAS No. 142, “Goodwill and Other Intangible Assets,” SFAS No. 87, “Employers’ Accounting for Pensions,” SFAS No. 106, “Employers’ Accounting for Postretirement Benefits Other Than Pensions,” as amended by SFAS No. 132 and 132R,132(R), “Employers’ Disclosures About Pension and Other Postretirement Benefits,” SFAS No. 158, “Employers’ Accounting for Defined Benefit Pension and Other Postretirement Plans,” and SFAS No. 109, “Accounting for Income Taxes,” including recent accounting requirements under FASB Interpretation No. 48 (FIN 48), “Accounting for Uncertainty in Income Taxes.”
The Company has included in its Annual Report on Form 10-K for the year ended December 31, 2005,2006, a discussion of these critical accounting policies, which are important to the portrayal of the Company’s financial condition and results of operations and require management’s judgments. TheOther than the adoption of FIN 48, the Company has not made any changes in any of these critical accounting policies during the first nine monthsquarter of 2006.2007.
SIGNIFICANT ACCOUNTING ESTIMATES
Pension Accounting. Net pension expense totaled approximately $283$52 million for International Paper’s U.S. plans for the ninethree months ended September 30, 2006,March 31, 2007, or about $101$41 million higherless than the pension expense
recorded for the first ninethree months of 2005.2006. Net pension expense for non-U.S. plans was about $13$1 million and $11$4 million for the first nine monthsquarter of 20062007 and 2005,2006, respectively. The increasedecrease in U.S. plan pension expense was principally due to earnings on a change$1 billion contribution made to the plan in the mortality assumption to use the Retirement Protection Act 2000 Table, an increase in thefourth quarter of 2006, lower amortization of unrecognized actuarial losses, over a shorter average remaining service period, and a decreasean increase in the assumed discount rate to 5.75% in 2007 from 5.50% in 2006 from 5.75% in 2005.2006.
After consultation with our actuaries, International Paper determines key actuarial assumptions on December 31 of each year that are used to calculate liability information as of that date and pension expense for the following year. Key assumptions affecting pension expense include the discount rate, the expected long-term rate of return on plan assets, the expected rate of future salary increases, and various demographic assumptions including expected mortality. The discount rate assumption is determined based on a yield curve that incorporates approximately 500-550 Aa-graded bonds. The plan’s projected cash flows are then matched to the yield curve to develop the discount rate. The expected long-term rate of return on plan assets is based on projected rates of return for current and planned asset classes in the plan’s investment portfolio.
In 2006, International Paper modified its investment policy to use interest rate swap agreements to extend the duration of the Plan’s bond portfolio to better match the duration of the pension obligation, thus helping to stabilize the ratio of assets to liabilities when interest rates change. Thus, when interest rates fall, the value of the swap agreements increases directionally with increases in the pension obligation. The current portfolio is hedged at approximately 35% of the Plan’s liability, with plans to increase this ratio to 50% by no later than the end of 2008. This new strategy is not expected to alter the long-term rate of return on Plan assets. At September 30, 2006,March 31, 2007, the market value of plan assets for International Paper’s U.S. plans totaled approximately $7.1$8.4 billion, consisting of approximately 59%61% equity securities, 31%30% fixed income securities, and 10%9% real estate and other assets.
For its U.S. qualified defined benefit pension plan, International Paper makes contributions that are sufficient to fully fund its actuarially determined costs, generally equal to the minimum amounts required by the Employee Retirement Income Security Act (ERISA). While International Paper may elect to makemade voluntary contributions to its U.S. qualified plan up to the maximum deductible amount per IRS tax regulations in the coming years, it is unlikely that any contributions to the plan will be required before 2007 unless investment performance is negative or International Paper changes its funding policy. In connection with the use of projected proceeds from the Company’s Transformation Plan, International Paper is planning to make voluntary contributions to the U.S. qualified pension fund in the range of $500 million to $1.0 billion to begin satisfying longer-term funding requirementsthe qualified defined benefit plan in 2006 and does not expect to lower future pension expense.make any contributions in 2007. The U.S. nonqualified plans are only funded to the extent of benefits paid which are expected to be $31$41 million in 2006.2007.
Accounting for Share-Based Compensation Plans. The Company discontinued its stock option program in 2004 for members of executive management, and in 2005 for all other eligible U.S. and non-U.S. employees. In the United States, the stock option program was replaced with a performance-based restricted share program for approximately 1,250 employees to more closely tie long-term compensation to Company performance on two key performance drivers: return on investment (ROI) and total shareholder return (TSR). As part of this shift in focus away from stock options to performance-base restricted stock, the Company accelerated the vesting of all 14 million unvested stock options to July 12, 2005. The Company also considered the benefit to employees and the income statement impact in making its decision to accelerate vesting of these options. Based on the market value of the Company’s common stock on July 12, 2005, the exercise prices of all such stock options were above the market value and, accordingly, the Company recorded no expense as a result of this action.
The Company adopted SFAS No. 123(R), “Share-Based Payment,” effective January 1, 2006 using the modified prospective transition method. This standard requires that compensation cost related to share-based payments be recognized in the financial statements. The amount of compensation cost is measured based on the grant date fair value of the award less estimated forfeitures.award. The resulting cost is recognized over the period during which an employee is required to provide service in exchange for the award, usually the vesting period. The adoption of SFAS No. 123(R) resulted in a $1 million increase in stock-based compensation expense for the three months ended March 31, 2006, with no effect on prior periods. Prior to January 1, 2006, the Company had accounted for share-based compensation in accordance with APB Opinion No. 25, “Accounting for Stock Issued to Employees.”
Accounting for Uncertainty in Income Taxes.
The Company adopted the provisions of FIN 48 on January 1, 2007. This interpretation requires management to make judgments regarding the probability that certain income tax positions taken by the Company in filing tax returns in the various jurisdictions in which it operates will be sustained upon examination by the respective tax authorities based on the technical merits of these tax positions, and to make estimates of the amount of tax benefits that will be realized upon the settlement of these positions. The adoption of this interpretation resulted in a charge to the 2007 beginning balance of retained earnings of $94 million.
FORWARD-LOOKING STATEMENTS
Certain statements in this Quarterly Report on Form 10-Q, and in particular, statements found in Item 2, Management’s Discussion and Analysis of Financial Condition and Results of Operations, which are not historical in nature may constitute forward-looking statements. These statements are often identified by the words, “will,” “may,” “should,” “continue,” “anticipate,” “believe,” “expect,” “plan,” “appear,” “project,” “estimate,” “intend,” and words of similar import. Such statements reflect the current views of International Paper with respect to future events and are subject to risks and uncertainties that could cause actual results to differ materially from those expressed or implied in these statements. Item 1A. Risk Factors contained in the Company’s Annual Report on Form 10-K for the year ended December 31, 20052006 contains a specific list of risks and uncertainties that you should carefully read and consider. That list has been updated in Part II, Item 1A. Risk Factors contained in this Quarterly Report on Form 10-Q. We undertake no obligation to publicly update any forward-looking statements, whether as a result of new information, future events or otherwise.
ITEM 3. QUANTITATIVE AND QUALITATIVE DISCLOSURES ABOUT MARKET RISK
Information relating to quantitative and qualitative disclosures about market risk is shown on pages 34 and 35page 42 of International Paper’s Annual Report on Form 10-K for the year ended December 31, 2005,2006, which information is incorporated herein by reference. There have
been no material changes in information relating to quantitative and qualitative disclosures about market risk since the end of the 2006 fiscal year.
ITEM 4. CONTROLS AND PROCEDURES
Evaluation of Disclosure Controls and Procedures:
Disclosure controls and procedures are controls and procedures that are designed to ensure that information required to be disclosed in our reports filed or submitted under the Securities Exchange Act of 1934, as amended (Exchange Act), is recorded, processed, summarized and completely and accurately reported (and accumulated and communicated to management, including our Chief Executive Officer and Chief Financial Officer, to allow timely decisions regarding required disclosure) within the time periods specified in the Securities and Exchange Commission’s rules and forms. As of the end of the period covered by this report, we conducted an evaluation, under the supervision and with the participation of our management, including the Chief Executive Officer and Chief Financial Officer, of the effectiveness of the design and operation of our disclosure controls and procedures pursuant to Rules 13a-15(e) and 15d-15(e) of the Exchange Act. Based upon that evaluation, our Chief Executive Officer and Chief Financial Officer concluded that the Company’s disclosure controls and procedures were effective.
Changes in Internal ControlControls over Financial Reporting:
During the period covered by this report, thereThere were no changes in our internal controls over financial reporting or other factors that have materially affected or are reasonably likely to materially affect ourthese internal controlcontrols over financial reporting.reporting during the period covered by this report.
During the 2007 first quarter, the Company completed the non-cash exchange of assets for the Luiz Antonio mill in Brazil. Integration activities, including an assessment of internal controls over financial reporting, are currently in process and are expected to be completed by the end of 2007.
The Company does have ongoing initiatives to standardize and upgrade its financial, operating and supply chain systems. The system upgrades will be implemented in stages, by business, over the next several years. Management believes the necessary procedures are in place to maintain effective internal controlcontrols over financial reporting as these initiatives continue.
A discussion of material developments in the Company’s litigation and settlement matters occurring in the period covered by this report is found in Note 79 to the Financial Statements in this Form 10-Q which information is incorporated in this Item 1 by reference.10-Q.
The Company’s Annual Report on Form 10-K for the year ended December 31, 2005 (the 2005 10-K)2006 (Annual Report) contains important risk factors that could cause the Company’s actual results to differ materially from those projected in any forward-looking statement. Forward-looking statements are statements that are not historicalSince the Company has substantially completed the divestitures under its Transformation Plan, the Company no longer faces the risks described in nature and are often identified by the words, “will,” “may,” “should,” “continue,” “anticipate,” “believe,” “expect,” “plan,” “appear,” “project,” “estimate,” “intend,” and words of a similar nature.
The information presented below updates the risk factors set forth in the 2005 10-K, adding the following factorsour Annual Report under the heading “Risks Relating To The Company’s Transformation Plan”:
The ability“The Ability to successfully negotiate satisfactory sale terms for assets that are contemplated for sale but are not currently under contract. The Company may be unable to divest or spin-off businesses under evaluation on terms that are satisfactory to the Company.
The ability to successfully execute sale transactions currently under contract. The Company’s ability to successfully execute sales transactions under contract and realize the anticipated sales proceeds thereunder is dependent upon many factors, including the ability to successfully consummate the transactions without a purchase price adjustment, the successful fulfillment (or waiver) of all conditions set forth in the sale agreements, the successful closing of the transactions within the estimated timeframes and the ability to monetize the non-cash portion of the sale proceeds, if any.
The ability to invest proceeds with attractive financial returns.The Company will selectively seek attractive investment opportunities for a portion of the proceeds from the divestitures. The Company may be unable to identify and negotiate acceptable investments with attractive returns.
These risk factors do not represent a comprehensive list of factors that could cause our results to differ from those that are currently anticipated and should be read together with the risk factors set forth in the 2005 10-K and in the Company’s other filings with the Securities and Exchange Commission.Successfully Execute Sales Transactions Currently Under Contract.”
ITEM 2. UNREGISTERED SALES OF EQUITY SECURITIES AND USE OF PROCEEDS
| (c) | Purchases of Equity Securities by the Issuer and Affiliated Purchasers. |
Period | Total Number of Shares Purchased | Average Price Paid per Share | Total Number of Shares Purchased as Part of Publicly Announced Plans or Programs | Maximum Number (or Approximate Dollar Value) of Shares that May Yet Be Purchased Under the Plans or Programs | |||||||
August 1, 2006 - | 1,777 | $ | 34.31 | 0 | 0 | ||||||
September 1, 2006 - September 30, 2006 | 38,465,784 | (a) | 36.00 | (b) | 38,465,260 | 0 | |||||
Period | Total Number of Shares Purchased (a) | Average Price Paid per Share | Total Number of Shares Purchased as Part of Publicly Announced Plans or Programs | Maximum Number (or Approximate Dollar Value) of Shares that May Yet Be Purchased Under the Plans or Programs | |||||
January 1, 2007 - January 31, 2007 | 1,597,549 | 33.55 | (b) | — | — | ||||
February 1, 2007 - February 28, 2007 | 2,639,944 | 36.20 | (b) | — | — | ||||
March 1, 2007 - March 31, 2007 | 7,614,929 | 35.63 | (b) | — | — | ||||
Total | 11,852,422 | — | — | — | |||||
| (a) |
| (b) | Excludes costs to acquire the shares. |
No activity occurred in months not presented above.
| (a) | Exhibits |
| 10.1 | ||||
| ||||
| 11 | Statement of Computation of Per Share Earnings | |||
| 12 | Computation of Ratio of Earnings to Fixed Charges and Preferred Stock Dividends | |||
| 31.1 | Certification of principal executive officer pursuant to Section 302 of the Sarbanes-Oxley Act of 2002 | |||
| 31.2 | Certification of principal financial officer pursuant to Section 302 of the Sarbanes-Oxley Act of 2002 | |||
| 32 | Certification pursuant to 18 U.S.C. Section 1350, as adopted pursuant to Section 906 of the Sarbanes-Oxley Act of 2002 | |||
Pursuant to the requirements of the Securities Exchange Act of 1934, the registrant has duly caused this report to be signed on its behalf by the undersigned thereunto duly authorized.
| INTERNATIONAL PAPER COMPANY | ||||
| (Registrant) | ||||
| Date: | By | /s/ MARIANNE M. PARRS | ||
| Marianne M. Parrs | ||||
| Executive Vice President and Chief Financial Officer | ||||
| Date: | By | /s/ ROBERT J. GRILLET | ||
| Robert J. Grillet | ||||
| Vice President – Finance and Controller | ||||
4846