UNITED STATES
SECURITIES AND EXCHANGE COMMISSION
WASHINGTON, DC 20549
FORM 10-Q
| x | QUARTERLY REPORT PURSUANT TO SECTION 13 OR 15(d) OF THE SECURITIES EXCHANGE ACT OF 1934 |
For the Period Ended JuneSeptember 30, 2007
OR
| ¨ | TRANSITION REPORT PURSUANT TO SECTION 13 OR 15(d) OF THE SECURITIES EXCHANGE ACT OF 1934 |
Commission File Number 000-51274
THE FRONTIER FUND
BALANCED SERIES; GRAHAM SERIES; WINTON SERIES; CAMPBELL/GRAHAM SERIES; CURRENCY SERIES; DUNN SERIES; LONG ONLY COMMODITY SERIES;
LONG/SHORT COMMODITY SERIES; MANAGED FUTURES INDEX SERIES
(Exact Name of Registrant as specified in its Charter)
| Delaware | 36-6815533 | |
| (State of Organization) | (IRS Employer Identification No.) |
c/o Equinox Fund Management, LLC
1660 Lincoln Street, Suite 100,
Denver, Colorado 80264
(Address of Principal Executive Offices)
(303) 837-0600
(Registrant’s Telephone Number)
Securities to be registered pursuant to Section 12(b) of the Act:None
Securities registered pursuant to Section 12(g) of the Act:
Balanced Series Class 1, Class 2, Class 1a and Class 2a Units;
Winton Series Class 1 and Class 2 Units;
Campbell/Graham Series Class 1 and Class 2 Units;
Currency Series Class 1 and Class 2 Units;
Dunn Series Class 1 and Class 2 Units;
Graham Series Class 1 and Class 2 Units;
Long/Short Commodity Series Class 1 and Class 2 Units;
Long Only Commodity Series Class 1 and Class 2 Units; and
Managed Futures Index Series Class 1 and Class 2 Units
Indicate by check mark whether the registrant: (1) has filed all reports required to be filed by Section 13 or 15(d) of the Securities Exchange Act of 1934 during the preceding 12 months, and (2) has been subject to such filing requirements for the past 90 days. Yes x No ¨
Indicate by check mark whether the registrant is a large accelerated filer, an accelerated filer, or a non-accelerated filer. See definition of “accelerated filer and large accelerated filer” in Rule 12b-2 of the Exchange Act. (Check One):
Large Accelerated Filer ¨ Accelerated Filer ¨ Non –AcceleratedNon–Accelerated Filer x
Indicate by check mark whether the registrant is a shell company (as defined in Rule 12b-2 of the Exchange Act). Yes ¨ No x
Special Note About Forward-Looking Statements
THIS REPORT CONTAINS STATEMENTS WHICH CONSTITUTE FORWARD-LOOKING STATEMENTS WITHIN THE MEANING OF THE PRIVATE SECURITIES LITIGATION REFORM ACT OF 1995 AND OTHER FEDERAL SECURITIES LAWS. THESE FORWARD-LOOKING STATEMENTS REFLECT THE MANAGING OWNER’S CURRENT EXPECTATIONS ABOUT THE FUTURE RESULTS, PERFORMANCE, PROSPECTS AND OPPORTUNITIES OF THE TRUST. THE MANAGING OWNER HAS TRIED TO IDENTIFY THESE FORWARD-LOOKING STATEMENTS BY USING WORDS SUCH AS “MAY,” “WILL,” “EXPECT,” “ANTICIPATE,” “BELIEVE,” “INTEND,” “SHOULD,” “ESTIMATE” OR THE NEGATIVE OF THOSE TERMS OR SIMILAR EXPRESSIONS. THESE FORWARD-LOOKING STATEMENTS ARE BASED ON INFORMATION CURRENTLY AVAILABLE TO THE MANAGING OWNER AND ARE SUBJECT TO A NUMBER OF RISKS, UNCERTAINTIES AND OTHER FACTORS, BOTH KNOWN, SUCH AS THOSE DESCRIBED IN THE “RISK FACTORS” SECTION UNDER ITEM 1A AND ELSEWHERE IN THIS REPORT, AND UNKNOWN, THAT COULD CAUSE THE TRUST’S ACTUAL RESULTS, PERFORMANCE, PROSPECTS OR OPPORTUNITIES TO DIFFER MATERIALLY FROM THOSE EXPRESSED IN, OR IMPLIED BY, THESE FORWARD-LOOKING STATEMENTS.
YOU SHOULD NOT PLACE UNDUE RELIANCE ON ANY FORWARD-LOOKING STATEMENTS. EXCEPT AS EXPRESSLY REQUIRED BY THE FEDERAL SECURITIES LAWS, THE MANAGING OWNER UNDERTAKES NO OBLIGATION TO PUBLICLY UPDATE OR REVISE ANY FORWARD-LOOKING STATEMENTS OR THE RISKS, UNCERTAINTIES OR OTHER FACTORS DESCRIBED HEREIN, AS A RESULT OF NEW INFORMATION, FUTURE EVENTS OR CHANGED CIRCUMSTANCES OR FOR ANY OTHER REASON AFTER THE DATE OF THIS REPORT.
UNLESS EXPRESSLY STATED OTHERWISE, ALL INFORMATION IN THIS REPORT IS AS OF JUNESEPTEMBER 30, 2007, AND THE MANAGING OWNER UNDERTAKES NO OBLIGATION TO UPDATE THIS INFORMATION.
| ITEM 1. | Financial Statements |
Statements of Financial Condition
JuneSeptember 30, 2007 and December 31, 2006
| Balanced Series | Winton Series (1) | Campbell/Graham Series | ||||||||||||||||
| 6/30/2007 | 12/31/2006 | 6/30/2007 | 12/31/2006 | 6/30/2007 | 12/31/2006 | |||||||||||||
| (Unaudited) | (Unaudited) | (Unaudited) | ||||||||||||||||
| ASSETS | ||||||||||||||||||
Cash and cash equivalents | $ | 194,437,095 | $ | 85,018,542 | $ | 19,085,166 | $ | 538,923 | $ | 25,396,707 | $ | 11,941,234 | ||||||
Short-term investments | 23,118,150 | 86,826,629 | 3,973,919 | — | 6,122,686 | 21,115,260 | ||||||||||||
Cash held at futures commodity merchants | 46,847,733 | 37,877,153 | — | — | 15,170,254 | 13,938,010 | ||||||||||||
Open trade equity | 8,674,261 | 11,391,371 | — | — | 803,296 | 1,576,367 | ||||||||||||
Swap contracts | 45,093,634 | 34,603,385 | — | — | — | — | ||||||||||||
Investments in unconsolidated trading companies | — | 78,056 | 2,886,678 | 355,763 | 32,974,839 | 50,785,796 | ||||||||||||
Inter-series receivables | 12,666,231 | 65,035,889 | — | — | — | — | ||||||||||||
Prepaid service fees—Class 1 | 839,541 | 1,316,314 | 198,780 | — | 192,643 | 283,158 | ||||||||||||
Receivable from related parties | 119,207 | 1,170,502 | 17,715 | 34 | 120,572 | 6,539 | ||||||||||||
Other assets | 233,967 | 120,468 | — | 1,342 | 124,362 | 179,558 | ||||||||||||
Total Assets | 332,029,819 | $ | 323,438,309 | $ | 26,162,258 | $ | 896,062 | $ | 80,905,359 | $ | 99,825,922 | |||||||
| LIABILITIES & OWNERS' CAPITAL | ||||||||||||||||||
| LIABILITIES | ||||||||||||||||||
Inter-series payables | $ | — | $ | — | $ | — | $ | — | $ | — | $ | 26,972,529 | ||||||
Liability to unconsolidated trading company | 1,947,166 | — | — | — | — | — | ||||||||||||
Pending owner additions | 850,567 | 987,713 | 516,213 | 162,500 | — | 485,675 | ||||||||||||
Owner redemptions payable | 124,000 | 754,023 | 19,645 | — | 465,966 | 65,762 | ||||||||||||
Incentive fees payable to Managing Owner | 1,820,351 | — | 227,994 | 1,687 | 1,116,085 | 23,954 | ||||||||||||
Management fees payable to Managing Owner | 117,547 | 96,056 | 35,082 | 619 | 124,235 | 115,910 | ||||||||||||
Interest fees payable to Managing Owner | 435,965 | 324,385 | 34,711 | 775 | 97,275 | 116,626 | ||||||||||||
Trading fees payable to Managing Owner | 128,527 | 100,164 | 8,765 | 155 | 32,202 | 33,018 | ||||||||||||
Trailing service fees payable | 353,698 | 225,872 | 4,083 | 175 | 87,968 | 44,899 | ||||||||||||
Payables to related parties | 13,629 | — | 76,604 | 82,260 | 84 | 100,959 | ||||||||||||
Other liabilities | 153,096 | 53,819 | 7,377 | 246 | 32,605 | 158,732 | ||||||||||||
Total Liabilities | 5,944,546 | 2,542,032 | 930,474 | 248,417 | 1,956,420 | 28,118,064 | ||||||||||||
| MINORITY INTERESTS | 24,935,407 | 42,889,305 | — | — | 15,973,550 | 15,514,377 | ||||||||||||
| OWNERS' CAPITAL | ||||||||||||||||||
Managing Owner Units—Class 1 | 196 | 192 | 1,064 | 1,057 | — | — | ||||||||||||
Managing Owner Units—Class 2 | 2,240,691 | 760,413 | 693,435 | 228,782 | 272,710 | 2,105,062 | ||||||||||||
Limited Owner Units—Class 1 | 246,752,717 | 228,763,573 | 15,752,775 | 355,867 | 57,050,061 | 48,843,314 | ||||||||||||
Limited Owner Units—Class 2 | 52,156,262 | 48,482,794 | 8,784,510 | 61,939 | 5,652,618 | 5,245,105 | ||||||||||||
Total Owners' Capital | 301,149,866 | 278,006,972 | 25,231,784 | 647,645 | 62,975,389 | 56,193,481 | ||||||||||||
Total Liabilities, Minority Interests and Owners' Capital | 332,029,819 | $ | 323,438,309 | $ | 26,162,258 | $ | 896,062 | $ | 80,905,359 | $ | 99,825,922 | |||||||
| Units Outstanding | ||||||||||||||||||
Class 1 | 2,209,175 | 2,105,455 | 148,088 | 3,378 | 548,091 | 507,344 | ||||||||||||
Class 1a | 57,389 | 43,802 | N/A | N/A | N/A | N/A | ||||||||||||
Class 2 | 446,552 | 425,239 | 86,818 | 2,722 | 53,009 | 72,160 | ||||||||||||
Class 2a | 13,875 | 6,761 | N/A | N/A | N/A | N/A | ||||||||||||
Net Asset Value per Unit | ||||||||||||||||||
Class 1 | $ | 109.15 | $ | 106.66 | $ | 106.38 | $ | 105.65 | $ | 104.09 | $ | 96.27 | ||||||
Class 1a | $ | 98.01 | $ | 95.97 | N/A | N/A | N/A | N/A | ||||||||||
Class 2 | $ | 118.67 | $ | 114.24 | $ | 109.17 | $ | 106.81 | $ | 111.78 | $ | 101.86 | ||||||
Class 2a | $ | 101.38 | $ | 97.88 | N/A | N/A | N/A | N/A | ||||||||||
| Balanced Series | Winton Series (1) | Campbell/Graham Series | ||||||||||||||||
| 9/30/2007 | 12/31/2006 | 9/30/2007 | 12/31/2006 | 9/30/2007 | 12/31/2006 | |||||||||||||
| (Unaudited) | (Unaudited) | (Unaudited) | ||||||||||||||||
| ASSETS | ||||||||||||||||||
Cash and cash equivalents | $ | 191,594,626 | $ | 85,018,542 | $ | 31,209,681 | $ | 538,923 | $ | 32,473,002 | $ | 11,941,234 | ||||||
Short-term investments | 1,633,073 | 86,826,629 | 507,088 | — | 593,329 | 21,115,260 | ||||||||||||
Cash held at futures commodity merchants | 35,206,744 | 37,877,153 | — | — | 10,412,352 | 13,938,010 | ||||||||||||
Open trade equity | 15,659,636 | 11,391,371 | — | — | 1,219,933 | 1,576,367 | ||||||||||||
Swap contracts | 41,731,956 | 34,603,385 | — | — | — | — | ||||||||||||
Investments in unconsolidated trading companies | 41,874 | — | 2,899,910 | 355,763 | 26,045,314 | 50,785,796 | ||||||||||||
Inter-series receivables | 4,626,635 | 65,035,889 | — | — | — | — | ||||||||||||
Prepaid service fees - Class 1 | 630,680 | 1,316,314 | 290,522 | — | 172,598 | 283,158 | ||||||||||||
Receivable from related parties | 6,020,026 | 1,170,502 | 640,632 | 34 | 43,982 | 6,539 | ||||||||||||
Other assets | 159,736 | 120,468 | — | 1,342 | 100,797 | 179,558 | ||||||||||||
Total Assets | 297,304,986 | $ | 323,360,253 | $ | 35,547,833 | $ | 896,062 | $ | 71,061,307 | $ | 99,825,922 | |||||||
| LIABILITIES & OWNERS’ CAPITAL | ||||||||||||||||||
LIABILITIES | ||||||||||||||||||
Inter-series payables | $ | — | $ | — | $ | — | $ | — | $ | — | $ | 26,972,529 | ||||||
Liability to unconsolidated trading company | — | 78,056 | — | — | — | — | ||||||||||||
Pending owner additions | 370,211 | 987,713 | 222,250 | 162,500 | 65,000 | 485,675 | ||||||||||||
Owner redemptions payable | 274,517 | 754,023 | — | — | 40,379 | 65,762 | ||||||||||||
Incentive fees payable to Managing Owner | 2,473,922 | — | 204,755 | 1,687 | — | 23,954 | ||||||||||||
Management fees payable to Managing Owner | 168,214 | 96,056 | 52,765 | 619 | 118,745 | 115,910 | ||||||||||||
Interest fees payable to Managing Owner | 378,551 | 324,385 | 49,691 | 775 | 86,547 | 116,626 | ||||||||||||
Trading fees payable to Managing Owner | 143,200 | 100,164 | 13,160 | 155 | 28,209 | 33,018 | ||||||||||||
Trailing service fees payable | 364,519 | 225,872 | 6,150 | 175 | 88,033 | 44,899 | ||||||||||||
Payables to related parties | 436,808 | — | 33,307 | 82,260 | 39,423 | 100,959 | ||||||||||||
Other liabilities | 37,709 | 53,819 | 48,181 | 246 | — | 158,732 | ||||||||||||
Total Liabilities | 4,647,651 | 2,620,088 | 630,259 | 248,417 | 466,336 | 28,118,064 | ||||||||||||
MINORITY INTERESTS | 22,224,133 | 42,733,193 | — | — | 11,632,285 | 15,514,377 | ||||||||||||
OWNERS’ CAPITAL | ||||||||||||||||||
Managing Owner Units - Class 1 | 179 | 192 | 1,096 | 1,057 | — | — | ||||||||||||
Managing Owner Units - Class 2 | 2,066,058 | 760,413 | 720,001 | 228,782 | 245,335 | 2,105,062 | ||||||||||||
Limited Owner Units - Class 1 | 220,761,013 | 228,763,573 | 24,472,491 | 355,867 | 53,457,823 | 48,843,314 | ||||||||||||
Limited Owner Units - Class 2 | 47,605,952 | 48,482,794 | 9,723,986 | 61,939 | 5,259,528 | 5,245,105 | ||||||||||||
Total Owners’ Capital | 270,433,202 | 278,006,972 | 34,917,574 | 647,645 | 58,962,686 | 56,193,481 | ||||||||||||
Total Liabilities, Minority Interests and Owners’ Capital | $ | 297,304,986 | $ | 323,360,253 | $ | 35,547,833 | $ | 896,062 | $ | 71,061,307 | $ | 99,825,922 | ||||||
Units Outstanding | ||||||||||||||||||
Class 1 | 2,155,045 | 2,105,455 | 223,233 | 3,378 | 575,156 | 507,344 | ||||||||||||
Class 1a | 61,134 | 43,802 | N/A | N/A | N/A | N/A | ||||||||||||
Class 2 | 441,232 | 425,239 | 92,137 | 2,722 | 54,743 | 72,160 | ||||||||||||
Class 2a | 14,904 | 6,761 | N/A | N/A | N/A | N/A | ||||||||||||
Net Asset Value per Unit | ||||||||||||||||||
Class 1 | $ | 99.90 | $ | 106.66 | $ | 109.63 | $ | 105.65 | $ | 92.94 | $ | 96.27 | ||||||
Class 1a | $ | 89.59 | $ | 95.97 | N/A | N/A | N/A | N/A | ||||||||||
Class 2 | $ | 109.42 | $ | 114.24 | $ | 113.35 | $ | 106.81 | $ | 100.56 | $ | 101.86 | ||||||
Class 2a | $ | 93.37 | $ | 97.88 | N/A | N/A | N/A | N/A | ||||||||||
| (1) | The Beach Series was renamed the Winton Series in May, 2006. (See Note 1) |
The accompanying notes are an integral part of these statements.
The Frontier Fund
Statements of Financial Condition
JuneSeptember 30, 2007 and December 31, 2006
| Currency Series | Dunn Series | Graham Series | Currency Series | Dunn Series (1) | Graham Series | |||||||||||||||||||||||||||||||
| 6/30/2007 | 12/31/2006 | 6/30/2007 | 12/31/2006 | 6/30/2007 | 12/31/2006 | 9/30/2007 | 12/31/2006 | 9/30/2007 | 12/31/2006 | 9/30/2007 | 12/31/2006 | |||||||||||||||||||||||||
| (Unaudited) | (Unaudited) | (Unaudited) | (Unaudited) | (Unaudited) | (Unaudited) | |||||||||||||||||||||||||||||||
ASSETS | ||||||||||||||||||||||||||||||||||||
Cash and cash equivalents | $ | 11,742,372 | $ | 5,193,474 | $ | 163,453 | $ | 192,143 | $ | 2,439,885 | $ | 4,346,300 | $ | 12,738,359 | $ | 5,193,474 | $ | 155,732 | $ | 192,143 | $ | 2,841,988 | $ | 4,346,300 | ||||||||||||
Short-term investments | 2,786,517 | 10,001,777 | 35,572 | 332,290 | 585,271 | 8,875,068 | 236,542 | 10,001,777 | 2,821 | 332,290 | 50,895 | 8,875,068 | ||||||||||||||||||||||||
Cash held at futures commodity merchants | 1,481,376 | 1,495,953 | — | — | — | — | 1,466,875 | 1,495,953 | — | — | — | — | ||||||||||||||||||||||||
Open trade equity | 3,186 | 41,615 | — | — | — | — | 17,005 | 41,615 | — | — | — | — | ||||||||||||||||||||||||
Swap contracts | 1,388,477 | 1,474,958 | — | — | — | — | 1,301,609 | 1,474,958 | — | — | — | — | ||||||||||||||||||||||||
Investments in unconsolidated trading companies | — | — | — | — | 4,578,138 | 7,226,062 | — | — | — | — | 4,427,643 | 7,226,062 | ||||||||||||||||||||||||
Prepaid service fees—Class 1 | 14,898 | 39,059 | — | — | 6,121 | 13,971 | ||||||||||||||||||||||||||||||
Prepaid service fees - Class 1 | 28,489 | 39,059 | — | — | 4,999 | 13,971 | ||||||||||||||||||||||||||||||
Receivable from related parties | — | 850 | 7 | 19 | — | 937 | 17,417 | 850 | 8 | 19 | 15,117 | 937 | ||||||||||||||||||||||||
Other assets | — | — | 53 | 226 | 19,742 | 31,060 | 43 | — | 60 | 226 | 17,901 | 31,060 | ||||||||||||||||||||||||
Total Assets | $ | 17,416,826 | $ | 18,247,686 | $ | 199,085 | $ | 524,678 | $ | 7,629,157 | $ | 20,493,398 | $ | 15,806,339 | $ | 18,247,686 | $ | 158,621 | $ | 524,678 | $ | 7,358,543 | $ | 20,493,398 | ||||||||||||
LIABILITIES & OWNERS' CAPITAL | ||||||||||||||||||||||||||||||||||||
| LIABILITIES & OWNERS’ CAPITAL | ||||||||||||||||||||||||||||||||||||
LIABILITIES | ||||||||||||||||||||||||||||||||||||
Liability to unconsolidated trading company | $ | — | $ | — | $ | 90,974 | $ | 120,051 | $ | — | $ | — | $ | — | $ | — | $ | 98,296 | $ | 120,051 | $ | — | $ | — | ||||||||||||
Inter-series payables | 7,114,581 | 10,697,187 | — | — | — | 12,012,370 | 4,626,635 | 10,697,187 | — | — | — | 12,012,370 | ||||||||||||||||||||||||
Open trade equity | — | — | 15,000 | |||||||||||||||||||||||||||||||||
Pending owner additions | 57,341 | 54,500 | — | — | 49,753 | — | — | 54,500 | — | — | 42,750 | — | ||||||||||||||||||||||||
Owner redemptions payable | — | — | — | 75,653 | 148,423 | 6,473 | 13,840 | — | — | 75,653 | 3,256 | 6,473 | ||||||||||||||||||||||||
Management fees payable to Managing Owner | 8,650 | 13,338 | — | — | 18,355 | 54,921 | 8,721 | 13,338 | — | — | 13,763 | 54,921 | ||||||||||||||||||||||||
Interest fees payable to Managing Owner | 24,025 | 29,692 | 146 | 353 | 11,741 | 34,187 | 23,528 | 29,692 | 83 | 353 | 10,492 | 34,187 | ||||||||||||||||||||||||
Trading fees payable to Managing Owner | 7,696 | 10,388 | 54 | 121 | 3,671 | 10,984 | 7,556 | 10,388 | 27 | 121 | 2,753 | 10,984 | ||||||||||||||||||||||||
Trailing service fees payable | 7,068 | 1,043 | 235 | 311 | 9,065 | 8,832 | 9,038 | 1,043 | 135 | 311 | 9,241 | 8,832 | ||||||||||||||||||||||||
Payables to related parties | 6,973 | 50,899 | 12,996 | 174,901 | 69,941 | 324,799 | 9,049 | 50,899 | 1,084 | 174,901 | 29,475 | 324,799 | ||||||||||||||||||||||||
Other liabilities | 3,021 | 4,012 | 243 | 1,354 | 8,775 | — | 8,765 | 4,012 | 298 | 1,354 | 2,730 | — | ||||||||||||||||||||||||
Total Liabilities | 7,229,355 | 10,861,059 | 104,648 | 372,744 | 334,724 | 12,452,566 | 4,707,132 | 10,861,059 | 99,923 | 372,744 | 114,460 | 12,452,566 | ||||||||||||||||||||||||
OWNERS' CAPITAL | ||||||||||||||||||||||||||||||||||||
Managing Owner Units—Class 2 | 1,026,709 | 16,689 | 838 | 823 | 44,215 | 389,915 | ||||||||||||||||||||||||||||||
Limited Owner Units—Class 1 | 8,872,959 | 6,891,891 | 93,585 | 123,164 | 5,525,371 | 5,991,337 | ||||||||||||||||||||||||||||||
Limited Owner Units—Class 2 | 287,803 | 478,047 | 14 | 27,947 | 1,724,847 | 1,659,580 | ||||||||||||||||||||||||||||||
OWNERS’ CAPITAL | ||||||||||||||||||||||||||||||||||||
Managing Owner Units - Class 2 | 1,016,584 | 16,689 | 596 | 823 | 43,210 | 389,915 | ||||||||||||||||||||||||||||||
Limited Owner Units - Class 1 | 9,765,104 | 6,891,891 | 58,092 | 123,164 | 5,503,259 | 5,991,337 | ||||||||||||||||||||||||||||||
Limited Owner Units - Class 2 | 317,519 | 478,047 | 10 | 27,947 | 1,697,614 | 1,659,580 | ||||||||||||||||||||||||||||||
Total Owners' Capital | 10,187,471 | 7,386,627 | 94,437 | 151,934 | 7,294,433 | 8,040,832 | ||||||||||||||||||||||||||||||
Total Owners’ Capital | 11,099,207 | 7,386,627 | 58,698 | 151,934 | 7,244,083 | 8,040,832 | ||||||||||||||||||||||||||||||
Total Liabilities, Minority Interests and Owners' Capital | $ | 17,416,826 | $ | 18,247,686 | $ | 199,085 | $ | 524,678 | $ | 7,629,157 | $ | 20,493,398 | ||||||||||||||||||||||||
Total Liabilities, Minority Interests and Owners’ Capital | $ | 15,806,339 | $ | 18,247,686 | $ | 158,621 | $ | 524,678 | $ | 7,358,543 | $ | 20,493,398 | ||||||||||||||||||||||||
Units Outstanding | ||||||||||||||||||||||||||||||||||||
Class 1 | 84,272 | 68,126 | 1,213 | 1,601 | 57,889 | 70,733 | 94,370 | 68,126 | 1,067 | 1,601 | 59,441 | 70,733 | ||||||||||||||||||||||||
Class 2 | 11,496 | 4,571 | 10 | 350 | 17,137 | 22,709 | 11,783 | 4,571 | 10 | 350 | 17,255 | 22,709 | ||||||||||||||||||||||||
Net Asset Value per Unit | ||||||||||||||||||||||||||||||||||||
Class 1 | $ | 105.29 | $ | 101.16 | $ | 77.15 | $ | 76.91 | $ | 95.45 | $ | 84.70 | $ | 103.48 | $ | 101.16 | $ | 54.46 | $ | 76.91 | $ | 92.58 | $ | 84.70 | ||||||||||||
Class 2 | $ | 114.35 | $ | 108.23 | $ | 83.78 | $ | 82.27 | $ | 103.23 | $ | 90.25 | $ | 113.22 | $ | 108.23 | $ | 59.58 | $ | 82.27 | $ | 100.89 | $ | 90.25 | ||||||||||||
| (1) | All remaining Dunn Series investors were redeemed on October 15, 2007. |
The accompanying notes are an integral part of these statements.
The Frontier Fund
Statements of Financial Condition
JuneSeptember 30, 2007 and December 31, 2006
| Long Only Commodity Series | Long/Short Commodity Series | Managed Futures Index Series | Long Only Commodity Series | Long/Short Commodity Series | Managed Futures Index Series | ||||||||||||||||||||||||||||||||||
| 6/30/2007 | 12/31/2006 | 6/30/2007 | 12/31/2006 | 6/30/2007 | 12/31/2006 | 9/30/2007 | 12/31/2006 | 9/30/2007 | 12/31/2006 | 9/30/2007 | 12/31/2006 | ||||||||||||||||||||||||||||
| (Unaudited) | (Unaudited) | (Unaudited) | (Unaudited) | (Unaudited) | (Unaudited) | ||||||||||||||||||||||||||||||||||
ASSETS | |||||||||||||||||||||||||||||||||||||||
Cash and cash equivalents | $ | 7,284,500 | $ | 3,587,676 | $ | 22,575,565 | $ | 6,411,775 | $ | 184,210 | $ | 2,753,004 | $ | 8,818,816 | $ | 3,587,676 | $ | 25,116,861 | $ | 6,411,775 | $ | 125,796 | $ | 2,753,004 | |||||||||||||||
Short-term investments | 1,662,891 | 5,563,361 | 5,115,163 | 10,792,589 | 8,281 | 5,504,248 | 165,968 | 5,563,361 | 479,771 | 10,792,589 | 799 | 5,504,248 | |||||||||||||||||||||||||||
Cash held at futures commodity merchants | — | — | 1,690,129 | 4,485,621 | — | 1,729,868 | — | — | 16,595,638 | 4,485,621 | — | 1,729,868 | |||||||||||||||||||||||||||
Open trade equity | — | — | 320,896 | 280,503 | — | 428,995 | — | — | — | 280,503 | — | 428,995 | |||||||||||||||||||||||||||
Swap contracts | 1,041,686 | 806,473 | 1,823,118 | 806,473 | — | — | — | — | |||||||||||||||||||||||||||||||
Investments in unconsolidated trading companies | — | — | — | — | 560,276 | — | — | — | — | — | 581,847 | — | |||||||||||||||||||||||||||
Prepaid service fees—Class 1 | 21,669 | 50,792 | 169,510 | 213,218 | 3,819 | 5,074 | |||||||||||||||||||||||||||||||||
Prepaid service fees - Class 1 | 10,759 | 50,792 | 181,114 | 213,218 | 2,319 | 5,074 | |||||||||||||||||||||||||||||||||
Receivable from related parties | 163 | 2,228 | — | 9,767 | 109 | 65 | 4,240 | 2,228 | 237,453 | 9,767 | 56 | 65 | |||||||||||||||||||||||||||
Other assets | 3,017 | 1,880 | 5,876 | 41,143 | 961 | 3,723 | 2,722 | 1,880 | 2,671 | 41,143 | 2,078 | 3,723 | |||||||||||||||||||||||||||
Total Assets | $ | 10,013,926 | $ | 10,012,410 | $ | 29,877,139 | $ | 22,234,616 | $ | 757,656 | $ | 10,424,977 | $ | 10,825,623 | $ | 10,012,410 | $ | 42,613,508 | $ | 22,234,616 | $ | 712,895 | $ | 10,424,977 | |||||||||||||||
LIABILITIES & OWNERS' CAPITAL | |||||||||||||||||||||||||||||||||||||||
| LIABILITIES & OWNERS’ CAPITAL | |||||||||||||||||||||||||||||||||||||||
LIABILITIES | |||||||||||||||||||||||||||||||||||||||
Inter-series payables | $ | 5,551,650 | $ | 5,522,034 | $ | — | $ | — | $ | — | $ | 9,831,769 | $ | — | $ | 5,522,034 | $ | — | $ | — | $ | — | $ | 9,831,769 | |||||||||||||||
Open trade deficit | — | — | 7,748,656 | — | — | — | |||||||||||||||||||||||||||||||||
Pending owner additions | — | 4,604 | 258,347 | — | — | — | — | 4,604 | 118,500 | — | — | — | |||||||||||||||||||||||||||
Owner redemptions payable | 14,613 | 15,000 | 28,128 | 988 | — | — | 2,895 | 15,000 | 12,143 | 988 | — | — | |||||||||||||||||||||||||||
Incentive fees payable to Managing Owner | — | — | 87,635 | — | — | — | — | — | 313,565 | — | — | — | |||||||||||||||||||||||||||
Management fees payable to Managing Owner | 10,400 | 10,389 | 82,248 | 59,278 | 1,165 | 17,252 | 10,593 | 10,389 | 89,990 | 59,278 | 1,146 | 17,252 | |||||||||||||||||||||||||||
Interest fees payable to Managing Owner | 7,502 | 7,622 | 22,749 | 16,931 | 544 | 7,781 | 7,000 | 7,622 | 24,043 | 16,931 | 495 | 7,781 | |||||||||||||||||||||||||||
Trading fees payable to Managing Owner | 4,166 | 4,162 | 11,750 | 8,468 | 291 | 4,313 | 4,240 | 4,162 | 12,856 | 8,468 | 286 | 4,313 | |||||||||||||||||||||||||||
Trailing service fees payable | 902 | 79 | 21,327 | 3,041 | 93 | 114 | 3,282 | 79 | 36,578 | 3,041 | 217 | 114 | |||||||||||||||||||||||||||
Payables to related parties | 31,895 | 9,732 | 970 | 47,889 | 33,587 | 11,019 | 6,133,545 | 9,732 | 211,848 | 47,889 | 4,532 | 11,019 | |||||||||||||||||||||||||||
Other liabilities | — | 1,923 | 6,133 | — | 6,125 | — | 4,152 | 1,923 | 12,683 | — | 275 | — | |||||||||||||||||||||||||||
Total Liabilities | 5,621,128 | 5,575,545 | 519,287 | 136,595 | 41,805 | 9,872,248 | 6,165,707 | 5,575,545 | 8,580,862 | 136,595 | 6,951 | 9,872,248 | |||||||||||||||||||||||||||
MINORITY INTERESTS | — | — | (1,947,166 | ) | (78,056 | ) | — | — | — | — | 41,874 | (78,056 | ) | — | — | ||||||||||||||||||||||||
OWNERS’ CAPITAL | |||||||||||||||||||||||||||||||||||||||
Managing Owner Units - Class 2 | 157,280 | 47,632 | 364,709 | 249,285 | 82,990 | 50,141 | |||||||||||||||||||||||||||||||||
Limited Owner Units - Class 1 | 4,417,916 | 4,321,464 | 30,701,168 | 19,478,595 | 617,971 | 500,070 | |||||||||||||||||||||||||||||||||
Limited Owner Units - Class 2 | 84,720 | 67,769 | 2,924,895 | 2,448,197 | 4,983 | 2,518 | |||||||||||||||||||||||||||||||||
OWNERS' CAPITAL | |||||||||||||||||||||||||||||||||||||||
Managing Owner Units—Class 2 | 147,842 | 47,632 | 362,024 | 249,285 | 83,031 | 50,141 | |||||||||||||||||||||||||||||||||
Limited Owner Units—Class 1 | 4,186,383 | 4,321,464 | 28,479,912 | 19,478,595 | 630,260 | 500,070 | |||||||||||||||||||||||||||||||||
Limited Owner Units—Class 2 | 58,573 | 67,769 | 2,463,082 | 2,448,197 | 2,560 | 2,518 | |||||||||||||||||||||||||||||||||
Total Owners’ Capital | 4,659,916 | 4,436,865 | 33,990,772 | 22,176,077 | 705,944 | 552,729 | |||||||||||||||||||||||||||||||||
Total Owners' Capital | 4,392,798 | 4,436,865 | 31,305,018 | 22,176,077 | 715,851 | 552,729 | |||||||||||||||||||||||||||||||||
Total Liabilities, Minority Interests and Owners' Capital | $ | 10,013,926 | $ | 10,012,410 | $ | 29,877,139 | $ | 22,234,616 | $ | 757,656 | $ | 10,424,977 | |||||||||||||||||||||||||||
Total Liabilities, Minority Interests and Owners’ Capital | $ | 10,825,623 | $ | 10,012,410 | $ | 42,613,508 | $ | 22,234,616 | $ | 712,895 | $ | 10,424,977 | |||||||||||||||||||||||||||
Units Outstanding | |||||||||||||||||||||||||||||||||||||||
Class 1 | 43,034 | 45,276 | 284,858 | 193,966 | 6,472 | 5,169 | 42,903 | 45,276 | 307,104 | 193,966 | 6,380 | 5,169 | |||||||||||||||||||||||||||
Class 2 | 2,064 | 1,188 | 27,158 | 26,206 | 855 | 535 | 2,275 | 1,188 | 31,391 | 26,206 | 879 | 535 | |||||||||||||||||||||||||||
Net Asset Value per Unit | |||||||||||||||||||||||||||||||||||||||
Class 1 | $ | 97.28 | $ | 95.45 | $ | 99.98 | $ | 100.42 | $ | 97.39 | $ | 96.75 | $ | 102.98 | $ | 95.45 | $ | 99.97 | $ | 100.42 | $ | 96.85 | $ | 96.75 | |||||||||||||||
Class 2 | $ | 99.99 | $ | 97.13 | $ | 104.02 | $ | 102.93 | $ | 100.08 | $ | 98.43 | $ | 106.37 | $ | 97.13 | $ | 104.79 | $ | 102.93 | $ | 100.03 | $ | 98.43 | |||||||||||||||
The accompanying notes are an integral part of these statements.
Condensed Schedule of Investments
September 30, 2007
| Balanced Series | Campbell/Graham Series | Currency Series | Long Only Commodity Series | Long/Short Commodity Series | |||||||||||||||||||||||||||||
Description | Value | % of Net Asset Value | Value | % of Net Asset Value | Value | % of Net Asset Value | Value | % of Net Asset Value | Value | % of Net Asset Value | |||||||||||||||||||||||
LONG FUTURES CONTRACTS | |||||||||||||||||||||||||||||||||
Various base metals futures contracts (US) | $ | 134,331 | 0.05 | % | $ | 7,950 | 0.01 | % | $ | — | 0.00 | % | $ | — | 0.00 | % | $ | 3,298,070 | 9.70 | % | |||||||||||||
Various currency futures contracts (US) | 3,876,275 | 1.43 | % | 0.00 | % | — | 0.00 | % | — | 0.00 | % | 54,793 | 0.16 | % | |||||||||||||||||||
Various currency futures contracts (Europe) | (10,641 | ) | 0.00 | % | 0.00 | % | — | 0.00 | % | — | 0.00 | % | 0.00 | % | |||||||||||||||||||
Various currency futures contracts (Far East) | 51,349 | 0.02 | % | 0.00 | % | — | 0.00 | % | — | 0.00 | % | 0.00 | % | ||||||||||||||||||||
Various energy futures contracts (US) | 796,934 | 0.29 | % | 109,899 | 0.19 | % | — | 0.00 | % | — | 0.00 | % | 6,023,828 | 17.72 | % | ||||||||||||||||||
Various interest rates futures contracts (US) | 451,697 | 0.17 | % | (5,835 | ) | -0.01 | % | — | 0.00 | % | — | 0.00 | % | 11,883 | 0.03 | % | |||||||||||||||||
Various interest rates futures contracts (Canada) | 9,721 | 0.00 | % | 0.00 | % | — | 0.00 | % | — | 0.00 | % | 0.00 | % | ||||||||||||||||||||
Various interest rates futures contracts (Europe) | (265,878 | ) | -0.10 | % | 6,185 | 0.01 | % | — | 0.00 | % | — | 0.00 | % | 0.00 | % | ||||||||||||||||||
Various interest rates futures contracts (Far East) | 185,758 | 0.07 | % | (37,004 | ) | -0.06 | % | — | 0.00 | % | — | 0.00 | % | 0.00 | % | ||||||||||||||||||
Various precious metals futures contracts (US) | 449,263 | 0.17 | % | 24,400 | 0.04 | % | — | 0.00 | % | — | 0.00 | % | 202,060 | 0.59 | % | ||||||||||||||||||
Various soft futures contracts (US) | 6,070,011 | 2.24 | % | (3,941 | ) | -0.01 | % | — | 0.00 | % | — | 0.00 | % | 4,210,520 | 12.39 | % | |||||||||||||||||
Various soft futures contracts (Europe) | 1,365 | 0.00 | % | 0.00 | % | — | 0.00 | % | — | 0.00 | % | 0.00 | % | ||||||||||||||||||||
Various soft futures contracts (Canada) | 4,186 | 0.00 | % | 0.00 | % | — | 0.00 | % | 0.00 | % | 0.00 | % | |||||||||||||||||||||
Various stock index futures contracts (US) | 1,109,656 | 0.41 | % | (485 | ) | 0.00 | % | — | 0.00 | % | — | 0.00 | % | 180,000 | 0.53 | % | |||||||||||||||||
Various stock index futures contracts (Canada) | 85,793 | 0.03 | % | 0.00 | % | — | 0.00 | % | — | 0.00 | % | 0.00 | % | ||||||||||||||||||||
Various stock index futures contracts (Europe) | 663,649 | 0.25 | % | (122 | ) | 0.00 | % | — | 0.00 | % | — | 0.00 | % | 0.00 | % | ||||||||||||||||||
Various stock index futures contracts (Far East) | 424,471 | 0.16 | % | 13,696 | 0.02 | % | — | 0.00 | % | — | 0.00 | % | 0.00 | % | |||||||||||||||||||
Total Long Futures Contracts | 14,037,940 | 5.19 | % | 114,743 | 0.19 | % | — | 0.00 | % | — | 0.00 | % | 13,981,154 | 41.12 | % | ||||||||||||||||||
LONG CURRENCY FORWARDS | 2,481,148 | 0.92 | % | 1,063,857 | 1.80 | % | 17,005 | 0.15 | % | — | 0.00 | % | — | 0.00 | % | ||||||||||||||||||
LONG SWAPS | 41,731,956 | 20.12 | % | — | 0.00 | % | 1,301,609 | 11.73 | % | 1,823,118 | 39.12 | % | — | 0.00 | % | ||||||||||||||||||
SHORT FUTURES CONTRACTS | |||||||||||||||||||||||||||||||||
Various base metals futures contracts (US) | (655,020 | ) | -0.24 | % | (45,151 | ) | -0.08 | % | — | 0.00 | % | — | 0.00 | % | (3,251,338 | ) | -9.57 | % | |||||||||||||||
Various currency futures contracts (US) | 121,423 | 0.04 | % | 0.00 | % | — | 0.00 | % | — | 0.00 | % | (2,800 | ) | -0.01 | % | ||||||||||||||||||
Various currency futures contracts (Canada) | (8,443 | ) | 0.00 | % | 0.00 | % | — | 0.00 | % | — | 0.00 | % | 0.00 | % | |||||||||||||||||||
Various currency futures contracts (Europe) | 332,415 | 0.12 | % | 0.00 | % | 0.00 | % | — | 0.00 | % | 0.00 | % | |||||||||||||||||||||
Various energy futures contracts (US) | 43,897 | 0.02 | % | 18,750 | 0.03 | % | 0.00 | % | — | 0.00 | % | (5,583,557 | ) | -16.43 | % | ||||||||||||||||||
Various interest rates futures contracts (US) | (170,379 | ) | -0.06 | % | 0.00 | % | — | 0.00 | % | — | 0.00 | % | (258 | ) | 0.00 | % | |||||||||||||||||
Various interest rates futures contracts (Canada) | (31,096 | ) | -0.01 | % | 0.00 | % | — | 0.00 | % | — | 0.00 | % | 0.00 | % | |||||||||||||||||||
Various interest rates futures contracts (Europe) | 243,059 | 0.09 | % | (2,547 | ) | 0.00 | % | — | 0.00 | % | — | 0.00 | % | 0.00 | % | ||||||||||||||||||
Various interest rates futures contracts (Far East) | 108,327 | 0.04 | % | 0.00 | % | — | 0.00 | % | — | 0.00 | % | 0.00 | % | ||||||||||||||||||||
Various precious metals futures contracts (US) | 19,900 | 0.01 | % | 0.00 | % | — | 0.00 | % | — | 0.00 | % | 0.00 | % | ||||||||||||||||||||
Various soft futures contracts (US) | (510,465 | ) | -0.19 | % | (5,413 | ) | -0.01 | % | — | 0.00 | % | — | 0.00 | % | (12,775,007 | ) | -37.58 | % | |||||||||||||||
Various soft futures contracts (Europe) | (1,447 | ) | 0.00 | % | (10,981 | ) | -0.02 | % | — | 0.00 | % | — | 0.00 | % | 0.00 | % | |||||||||||||||||
Various stock index futures contracts (US) | (261,080 | ) | -0.10 | % | 128,145 | 0.22 | % | — | 0.00 | % | — | 0.00 | % | (116,850 | ) | -0.34 | % | ||||||||||||||||
Various stock index futures contracts (Europe) | (41,464 | ) | -0.02 | % | (3,321 | ) | -0.01 | % | — | 0.00 | % | — | 0.00 | % | 0.00 | % | |||||||||||||||||
Various stock index futures contracts (Far East) | (49,079 | ) | -0.02 | % | (38,149 | ) | -0.06 | % | — | 0.00 | % | — | 0.00 | % | 0.00 | % | |||||||||||||||||
Total Short Futures Contracts | (859,452 | ) | -0.32 | % | 41,333 | 0.07 | % | — | 0.00 | % | 0 | 0.00 | % | (21,729,810 | ) | -63.93 | % | ||||||||||||||||
Total Open Trade Equity (Deficit) | $ | 57,391,592 | (1) | 25.91 | % | $ | 1,219,933 | 2.06 | % | $ | 1,318,614 | 11.88 | % | 1,823,118 | 39.12 | % | $ | (7,748,656 | )(1) | -22.81 | % | ||||||||||||
| (1) | The Long/Short Commodity Series consolidates the assets of Frontier Trading Company VII which includes the open trade equity of two traders whose trading results are primarily allocated to the the Balanced Series. The combined open trade equity of these two traders is ($8,374,541). |
The Frontier Fund
Condensed Schedule of Investments
December 31, 2006
| Balanced Series | Campbell/Graham Series | Currency Series | Long Only Commodity Series | Long/Short Commodity Series | Managed Futures Index Series | ||||||||||||||||||||||||||||||||||||
Description | Value | % of Net Asset Value | Value | % of Net Asset Value | Value | % of Net Asset Value | Value | % of Net Asset Value | Value | % of Net Asset Value | Value | % of Net Asset Value | |||||||||||||||||||||||||||||
LONG FUTURES CONTRACTS | |||||||||||||||||||||||||||||||||||||||||
Various base metals futures contracts (US) | $ | (315,906 | ) | - 0.11 | % | $ | — | 0.00 | % | $ | — | 0.00 | % | $ | — | 0.00 | % | $ | (32,200 | ) | - 0.15 | % | $ | — | 0.00 | % | |||||||||||||||
Various base metals futures contracts (Europe) | 900,149 | 0.32 | % | (36,938 | ) | - 0.07 | % | — | 0.00 | % | — | 0.00 | % | — | 0.00 | % | 172,913 | 31.28 | % | ||||||||||||||||||||||
Various currency futures contracts (US) | (1,004,714 | ) | - 0.36 | % | — | 0.00 | % | — | 0.00 | % | — | 0.00 | % | (98,319 | ) | - 0.44 | % | — | 0.00 | % | |||||||||||||||||||||
Various currency futures contracts (Europe) | — | 0.00 | % | — | 0.00 | % | — | 0.00 | % | — | 0.00 | % | — | 0.00 | % | — | 0.00 | % | |||||||||||||||||||||||
Various currency futures contracts (Far East) | — | 0.00 | % | — | 0.00 | % | — | 0.00 | % | — | 0.00 | % | — | 0.00 | % | — | 0.00 | % | |||||||||||||||||||||||
Various energy futures contracts (US) | (25,784 | ) | - 0.01 | % | — | 0.00 | % | — | 0.00 | % | — | 0.00 | % | 285,382 | 1.29 | % | — | 0.00 | % | ||||||||||||||||||||||
Various energy futures contracts (Europe) | (35,845 | ) | - 0.01 | % | — | 0.00 | % | — | 0.00 | % | — | 0.00 | % | (20,692 | ) | - 0.09 | % | — | 0.00 | % | |||||||||||||||||||||
Various interest rates futures contracts (US) | (733,040 | ) | - 0.26 | % | (663,199 | ) | - 1.18 | % | — | 0.00 | % | — | 0.00 | % | (7,438 | ) | - 0.03 | % | — | 0.00 | % | ||||||||||||||||||||
Various interest rates futures contracts (Canada) | (15,700 | ) | - 0.01 | % | — | 0.00 | % | — | 0.00 | % | — | 0.00 | % | — | 0.00 | % | — | 0.00 | % | ||||||||||||||||||||||
Various interest rates futures contracts (Europe) | (483,319 | ) | - 0.17 | % | — | 0.00 | % | — | 0.00 | % | — | 0.00 | % | — | 0.00 | % | — | 0.00 | % | ||||||||||||||||||||||
Various interest rates futures contracts (Far East) | (24,257 | ) | - 0.01 | % | (109,292 | ) | - 0.19 | % | — | 0.00 | % | — | 0.00 | % | — | 0.00 | % | 26,512 | 4.80 | % | |||||||||||||||||||||
Various precious metals futures contracts (US) | (896,381 | ) | - 0.32 | % | (3,810 | ) | - 0.01 | % | — | 0.00 | % | — | 0.00 | % | (33,680 | ) | - 0.15 | % | 1,720 | 0.31 | % | ||||||||||||||||||||
Various soft futures contracts (US) | 637,564 | 0.23 | % | 17,215 | 0.03 | % | — | 0.00 | % | — | 0.00 | % | 283,910 | 1.28 | % | 28,408 | 5.14 | % | |||||||||||||||||||||||
Various soft futures contracts (Europe) | 5,267 | 0.00 | % | — | 0.00 | % | — | 0.00 | % | — | 0.00 | % | — | 0.00 | % | — | 0.00 | % | |||||||||||||||||||||||
Various stock index futures contracts (US) | (109,905 | ) | - 0.04 | % | (151,126 | ) | - 0.27 | % | — | 0.00 | % | — | 0.00 | % | 1,539 | 0.01 | % | (2,700 | ) | -0.49 | % | ||||||||||||||||||||
Various stock index futures contracts (Canada) | 25,177 | 0.01 | % | — | 0.00 | % | — | 0.00 | % | — | 0.00 | % | — | 0.00 | % | — | 0.00 | % | |||||||||||||||||||||||
Various stock index futures contracts (Europe) | 895,256 | 0.32 | % | 271,303 | 0.48 | % | — | 0.00 | % | — | 0.00 | % | — | 0.00 | % | 5,420 | 0.98 | % | |||||||||||||||||||||||
Various stock index futures contracts (Far East) | 1,244,428 | 0.45 | % | 337,523 | 0.60 | % | — | 0.00 | % | — | 0.00 | % | — | 0.00 | % | 46,217 | 8.36 | % | |||||||||||||||||||||||
Total Long Futures Contracts | 62,990 | 0.02 | % | (338,324 | ) | - 0.60 | % | — | 0.00 | % | — | 0.00 | % | 378,502 | 1.71 | % | 278,490 | 50.38 | % | ||||||||||||||||||||||
LONG CURRENCY FORWARDS | 2,711,184 | 0.98 | % | 1,245,757 | 2.22 | % | 35,152 | 0.48 | % | — | 0.00 | % | — | 0.00 | % | 79,612 | 14.40 | % | |||||||||||||||||||||||
LONG SWAPS | — | 0.00 | % | — | 0.00 | % | 6,463 | 0.09 | % | (605,943 | ) | -13.66 | % | — | 0.00 | % | — | 0.00 | % | ||||||||||||||||||||||
SHORT FUTURES CONTRACTS | |||||||||||||||||||||||||||||||||||||||||
Various base metals futures contracts (US) | 1,286,062 | 0.46 | % | — | 0.00 | % | — | 0.00 | % | — | 0.00 | % | 31,875 | 0.14 | % | 2,450 | 0.44 | % | |||||||||||||||||||||||
Various base metals futures contracts (Europe) | (467,572 | ) | - 0.17 | % | (5,419 | ) | - 0.01 | % | — | 0.00 | % | — | 0.00 | % | — | 0.00 | % | (154,474 | ) | -27.95 | % | ||||||||||||||||||||
Various currency futures contracts (US) | 1,030,911 | 0.37 | % | (104,580 | ) | - 0.19 | % | — | 0.00 | % | — | 0.00 | % | 11,460 | 0.05 | % | 313 | 0.06 | % | ||||||||||||||||||||||
Various energy futures contracts (US) | 774,035 | 0.28 | % | 109,801 | 0.20 | % | — | 0.00 | % | — | 0.00 | % | (90,341 | ) | - 0.41 | % | 24,629 | 4.46 | % | ||||||||||||||||||||||
Various energy futures contracts (Europe) | 94,725 | 0.03 | % | 3,830 | 0.01 | % | — | 0.00 | % | — | 0.00 | % | 116,533 | 0.53 | % | — | 0.00 | % | |||||||||||||||||||||||
Various interest rates futures contracts (US) | 1,641,151 | 0.59 | % | 39,306 | 0.07 | % | — | 0.00 | % | — | 0.00 | % | 53,781 | 0.24 | % | 5,375 | 0.97 | % | |||||||||||||||||||||||
Various interest rates futures contracts (Canada) | 206,630 | 0.07 | % | — | 0.00 | % | — | 0.00 | % | — | 0.00 | % | — | 0.00 | % | — | 0.00 | % | |||||||||||||||||||||||
Various interest rates futures contracts (Europe) | 3,465,274 | 1.25 | % | 682,466 | 1.21 | % | — | 0.00 | % | — | 0.00 | % | — | 0.00 | % | 166,794 | 30.18 | % | |||||||||||||||||||||||
Various interest rates futures contracts (Far East) | 407,369 | 0.15 | % | 4,256 | 0.01 | % | — | 0.00 | % | — | 0.00 | % | — | 0.00 | % | 33,737 | 6.10 | % | |||||||||||||||||||||||
Various precious metals futures contracts (US) | 275,610 | 0.10 | % | — | 0.00 | % | — | 0.00 | % | — | 0.00 | % | 5,160 | 0.02 | % | — | 0.00 | % | |||||||||||||||||||||||
Various soft futures contracts (US) | (291,034 | ) | - 0.10 | % | (46,126 | ) | -0.08 | % | — | 0.00 | % | — | 0.00 | % | (226,467 | ) | - 1.02 | % | (4,920 | ) | -0.89 | % | |||||||||||||||||||
Various soft futures contracts (Europe) | 38,190 | 0.01 | % | (14,600 | ) | - 0.03 | % | — | 0.00 | % | — | 0.00 | % | — | 0.00 | % | — | 0.00 | % | ||||||||||||||||||||||
Various stock index futures contracts (US) | 189,289 | 0.07 | % | — | 0.00 | % | — | 0.00 | % | — | 0.00 | % | — | 0.00 | % | (3,010 | ) | -0.54 | % | ||||||||||||||||||||||
Various stock index futures contracts (Europe) | (17,614 | ) | - 0.01 | % | — | 0.00 | % | — | 0.00 | % | — | 0.00 | % | — | 0.00 | % | — | 0.00 | % | ||||||||||||||||||||||
Various stock index futures contracts (Far East) | (15,829 | ) | - 0.01 | % | — | 0.00 | % | — | 0.00 | % | — | 0.00 | % | — | 0.00 | % | — | 0.00 | % | ||||||||||||||||||||||
Total Short Futures Contracts | 8,617,197 | 3.10 | % | 668,934 | 1.19 | % | — | 0.00 | % | — | 0.00 | % | (97,999 | ) | - 0.44 | % | 70,894 | 12.83 | % | ||||||||||||||||||||||
Total Open Trade Equity (Deficit) | $ | 11,391,371 | 4.10 | % | $ | 1,576,367 | 2.81 | % | $ | 41,615 | 0.56 | % | (605,943 | ) | - 13.66 | % | $ | 280,503 | 1.26 | % | $ | 428,996 | 77.61 | % | |||||||||||||||||
Statements of Operations
For the Three Months Ended JuneSeptember 30, 2007 and 2006
| Balanced Series | Winton Series (1) | Campbell/Graham Series | ||||||||||||||||||||||
| (Unaudited) | (Unaudited) | (Unaudited) | ||||||||||||||||||||||
| 6/30/2007 | 6/30/2006 | 6/30/2007 | 6/30/2006 | 6/30/2007 | 6/30/2006 | |||||||||||||||||||
Investment Income: | ||||||||||||||||||||||||
Interest—net | $ | 1,793,704 | $ | 980,446 | $ | 120,310 | $ | 19,017 | $ | 417,669 | $ | 298,580 | ||||||||||||
Total Income | 1,793,704 | 980,446 | 120,310 | 19,017 | 417,669 | 298,580 | ||||||||||||||||||
Expenses: | ||||||||||||||||||||||||
Incentive Fees | 3,248,851 | 921,190 | 228,956 | (852 | ) | 985,655 | 6,028 | |||||||||||||||||
Management Fees | 346,784 | 179,971 | 84,474 | (403 | ) | 352,456 | 289,279 | |||||||||||||||||
Service Fees—Class 1 | 1,792,641 | 1,271,288 | 78,666 | — | 391,345 | 269,962 | ||||||||||||||||||
Trading Fees | 366,640 | 179,749 | 21,079 | (99 | ) | 91,123 | 57,911 | |||||||||||||||||
Total Expenses | 5,754,916 | 2,552,198 | 413,175 | (1,354 | ) | 1,820,579 | 623,180 | |||||||||||||||||
Investment gain/(loss)—net | (3,961,212 | ) | (1,571,752 | ) | (292,865 | ) | 20,371 | (1,402,910 | ) | (324,600 | ) | |||||||||||||
Realized and unrealized gain (loss) on investments: | ||||||||||||||||||||||||
Net realized gain/(loss) on futures and currencies | 38,088,527 | (516,942 | ) | — | — | 1,804,293 | 167,561 | |||||||||||||||||
Net realized gain/(loss) on swap contracts | (28,552 | ) | — | — | — | — | — | |||||||||||||||||
Net change in open trade equity | 5,987,632 | (3,598,281 | ) | — | — | 70,964 | (520,585 | ) | ||||||||||||||||
Net unrealized gain/(loss) on swap contracts | 978,893 | — | — | — | — | — | ||||||||||||||||||
Trading commissions | (577,511 | ) | (322,747 | ) | — | — | (12,016 | ) | 7,532 | |||||||||||||||
Net change in inter-series receivables | (19,757 | ) | (975,645 | ) | — | — | — | 473,699 | ||||||||||||||||
Equity in earnings/(loss) from trading company | (703,866 | ) | — | 2,002,258 | 9,586 | 11,926,925 | (931,540 | ) | ||||||||||||||||
Net gain/(loss) on investments | 43,725,366 | (5,413,615 | ) | 2,002,258 | 9,586 | 13,790,166 | (803,333 | ) | ||||||||||||||||
Minority interests | (14,022,222 | ) | 916,050 | — | — | (1,863,241 | ) | (55,055 | ) | |||||||||||||||
NET INCREASE/(DECREASE) IN OWNERS' CAPITAL | ||||||||||||||||||||||||
RESULTING FROM OPERATIONS | $ | 25,741,932 | $ | (6,069,317 | ) | $ | 1,709,393 | $ | 29,957 | $ | 10,524,015 | $ | (1,182,988 | ) | ||||||||||
NET INCOME/(LOSS) PER UNIT | ||||||||||||||||||||||||
Class 1 | $ | 9.22 | $ | (3.02 | ) | $ | 11.01 | $ | 2.54 | $ | 16.83 | $ | (2.52 | ) | ||||||||||
Class 1a | $ | 8.16 | $ | (4.50 | ) | N/A | N/A | N/A | N/A | |||||||||||||||
Class 2 | $ | 10.83 | $ | (2.33 | ) | $ | 12.03 | $ | 2.66 | $ | 18.76 | $ | (1.88 | ) | ||||||||||
Class 2a | $ | 9.12 | $ | (4.05 | ) | N/A | N/A | N/A | N/A | |||||||||||||||
| Balanced Series | Winton Series (1) | Campbell/Graham Series | |||||||||||||||||||||
| (Unaudited) | (Unaudited) | (Unaudited) | |||||||||||||||||||||
| 9/30/2007 | 9/30/2006 | 9/30/2007 | 9/30/2006 | 9/30/2007 | 9/30/2006 | ||||||||||||||||||
Investment Income: | |||||||||||||||||||||||
Interest - net | $ | 1,821,062 | $ | 1,213,667 | $ | 203,189 | $ | 1,258 | $ | 401,396 | $ | 379,188 | |||||||||||
Total Income | 1,821,062 | 1,213,667 | 203,189 | 1,258 | 401,396 | 379,188 | |||||||||||||||||
Expenses: | |||||||||||||||||||||||
Incentive Fees | 2,397,504 | 54,761 | 234,690 | — | (16,407 | ) | 8,429 | ||||||||||||||||
Management Fees | 429,968 | 203,999 | 146,893 | 181 | 327,658 | 323,515 | |||||||||||||||||
Service Fees - Class 1 | 1,705,256 | 1,462,094 | 149,249 | 4 | 403,432 | 304,531 | |||||||||||||||||
Trading Fees | 409,768 | 211,881 | 36,723 | 45 | 87,394 | 64,677 | |||||||||||||||||
Total Expenses | 4,942,496 | 1,932,735 | 567,555 | 230 | 802,077 | 701,152 | |||||||||||||||||
Investment gain/(loss) - net | (3,121,434 | ) | (719,068 | ) | (364,366 | ) | 1,028 | (400,681 | ) | (321,964 | ) | ||||||||||||
Realized and unrealized gain (loss) on investments: | |||||||||||||||||||||||
Net realized gain/(loss) on futures and currencies | (30,785,165 | ) | (7,940,108 | ) | — | — | (396,977 | ) | (1,178,800 | ) | |||||||||||||
Net realized gain/(loss) on swap contracts | 1,703,250 | — | — | — | — | — | |||||||||||||||||
Net change in open trade equity | 9,893,197 | (334,745 | ) | — | — | 239,633 | 146,518 | ||||||||||||||||
Net unrealized gain/(loss) on swap contracts | (5,064,927 | ) | — | — | — | — | — | ||||||||||||||||
Trading commissions | (905,573 | ) | (277,199 | ) | — | — | (6,199 | ) | (31,919 | ) | |||||||||||||
Net change in inter-series receivables | 266,456 | (2,587,733 | ) | — | — | — | — | ||||||||||||||||
Net change in inter-series payables | — | — | — | — | — | 299,003 | |||||||||||||||||
Equity in earnings/(loss) from trading company | (2,274,150 | ) | — | 1,549,237 | 536 | (6,354,997 | ) | (2,293,289 | ) | ||||||||||||||
Net gain/(loss) on investments | (27,166,912 | ) | (11,139,785 | ) | 1,549,237 | 536 | (6,518,540 | ) | (3,058,487 | ) | |||||||||||||
Minority interests | 4,830,823 | 2,311,199 | — | — | 163,543 | 1,064,201 | |||||||||||||||||
NET INCREASE/(DECREASE) IN OWNERS’ CAPITAL RESULTING FROM OPERATIONS | $ | (25,457,523 | ) | $ | (9,547,654 | ) | $ | 1,184,871 | $ | 1,564 | $ | (6,755,678 | ) | $ | (2,316,250 | ) | |||||||
NET INCOME/(LOSS) PER UNIT | |||||||||||||||||||||||
Class 1 | $ | (9.25 | ) | $ | (4.27 | ) | $ | 3.25 | $ | 0.32 | $ | (11.15 | ) | $ | (4.65 | ) | |||||||
Class 1a | $ | (8.42 | ) | $ | (4.01 | ) | N/A | N/A | N/A | N/A | |||||||||||||
Class 2 | $ | (9.25 | ) | $ | (3.71 | ) | $ | 4.18 | $ | 0.68 | $ | (11.22 | ) | $ | (4.13 | ) | |||||||
Class 2a | $ | (8.01 | ) | $ | (3.33 | ) | N/A | N/A | N/A | N/A | |||||||||||||
| (1) | The Beach Series was renamed the Winton Series in May, 2006. (See Note 1.) |
The accompanying notes are an integral part of these statements.
The Frontier Fund
Statements of Operations
For the Three Months Ended JuneSeptember 30, 2007 and 2006
| Currency Series | Dunn Series | Graham Series | Currency Series | Dunn Series (1) | Graham Series | |||||||||||||||||||||||||||||||||||||||||||
| (Unaudited) | (Unaudited) | (Unaudited) | (Unaudited) | (Unaudited) | (Unaudited) | |||||||||||||||||||||||||||||||||||||||||||
| 6/30/2007 | 6/30/2006 | 6/30/2007 | 6/30/2006 | 6/30/2007 | 6/30/2006 | 9/30/2007 | 9/30/2006 | 9/30/2007 | 9/30/2006 | 9/30/2007 | 9/30/2006 | |||||||||||||||||||||||||||||||||||||
Investment Income: | ||||||||||||||||||||||||||||||||||||||||||||||||
Interest—net | $ | 105,559 | $ | 104,673 | $ | 585 | $ | 1,928 | $ | 49,773 | $ | 73,532 | ||||||||||||||||||||||||||||||||||||
Interest - net | $ | 116,447 | $ | 138,977 | $ | 504 | $ | 1,799 | $ | 46,816 | $ | 149,454 | ||||||||||||||||||||||||||||||||||||
Total Income | 105,559 | 104,673 | 585 | 1,928 | 49,773 | 73,532 | 116,447 | 138,977 | 504 | 1,799 | 46,816 | 149,454 | ||||||||||||||||||||||||||||||||||||
Expenses: | ||||||||||||||||||||||||||||||||||||||||||||||||
Incentive Fees | — | 11,979 | — | — | 144,237 | — | — | 300 | — | — | 4,086 | — | ||||||||||||||||||||||||||||||||||||
Management Fees | 24,171 | 40,028 | — | — | 64,719 | 75,705 | 26,435 | 28,469 | — | — | 32,102 | 140,871 | ||||||||||||||||||||||||||||||||||||
Service Fees—Class 1 | 57,634 | 28,629 | 681 | 1,276 | 38,611 | 45,391 | ||||||||||||||||||||||||||||||||||||||||||
Service Fees - Class 1 | 69,213 | 39,006 | 524 | 971 | 40,108 | 42,718 | ||||||||||||||||||||||||||||||||||||||||||
Trading Fees | 22,848 | 18,026 | 69 | 384 | 10,098 | 15,231 | 23,108 | 22,337 | 123 | 374 | 9,267 | 28,176 | ||||||||||||||||||||||||||||||||||||
Total Expenses | 104,653 | 98,662 | 750 | 1,660 | 257,665 | 136,327 | 118,756 | 90,112 | 647 | 1,345 | 85,563 | 211,765 | ||||||||||||||||||||||||||||||||||||
Investment gain/(loss)—net | 906 | 6,011 | (165 | ) | 268 | (207,892 | ) | (62,795 | ) | |||||||||||||||||||||||||||||||||||||||
Investment gain/(loss) - net | (2,309 | ) | 48,865 | (143 | ) | 454 | (38,747 | ) | (62,311 | ) | ||||||||||||||||||||||||||||||||||||||
Realized and unrealized gain (loss) on investments: | ||||||||||||||||||||||||||||||||||||||||||||||||
Net realized gain/(loss) on futures and currencies | 27,573 | 89,479 | — | — | — | — | 51,745 | (187,882 | ) | — | — | — | — | |||||||||||||||||||||||||||||||||||
Net realized gain/(loss) on swap contracts | 1,134,796 | (234,669 | ) | (322,797 | ) | 252,233 | — | — | — | — | ||||||||||||||||||||||||||||||||||||||
Net change in open trade equity | 7,459 | 21,113 | — | — | — | — | 13,828 | (34,182 | ) | — | — | — | — | |||||||||||||||||||||||||||||||||||
Net change in inter-series payables | (603,954 | ) | 64,487 | — | — | — | 206,208 | 87,947 | (82,589 | ) | — | — | — | 639,456 | ||||||||||||||||||||||||||||||||||
Equity in earnings/(loss) from trading company | — | — | 19,666 | 5,904 | 1,863,241 | 61,355 | — | — | (26,031 | ) | (18,446 | ) | (163,543 | ) | (1,064,201 | ) | ||||||||||||||||||||||||||||||||
Net gain/(loss) on investments | 565,874 | (59,590 | ) | 19,666 | 5,904 | 1,863,241 | 267,563 | (169,277 | ) | (52,420 | ) | (26,031 | ) | (18,446 | ) | (163,543 | ) | (424,745 | ) | |||||||||||||||||||||||||||||
NET INCREASE/(DECREASE) IN OWNERS' CAPITAL RESULTING FROM OPERATIONS | $ | 566,780 | $ | (53,579 | ) | $ | 19,501 | $ | 6,172 | $ | 1,655,349 | $ | 204,768 | |||||||||||||||||||||||||||||||||||
NET INCREASE/(DECREASE) IN OWNERS’ CAPITAL RESULTING FROM OPERATIONS | $ | (171,586 | ) | $ | (3,555 | ) | $ | (26,174 | ) | $ | (17,992 | ) | $ | (202,290 | ) | $ | (487,056 | ) | ||||||||||||||||||||||||||||||
NET INCOME/(LOSS) PER UNIT | ||||||||||||||||||||||||||||||||||||||||||||||||
Class 1 | $ | 7.15 | $ | (1.28 | ) | $ | 14.71 | $ | (1.57 | ) | $ | 19.72 | $ | 1.83 | $ | (1.81 | ) | $ | (0.10 | ) | $ | (22.69 | ) | $ | (6.08 | ) | $ | (2.87 | ) | $ | (5.28 | ) | ||||||||||||||||
Class 2 | $ | 8.56 | $ | (0.59 | ) | $ | 16.48 | $ | (0.98 | ) | $ | 21.94 | $ | 2.58 | $ | (1.13 | ) | $ | 0.65 | $ | (24.20 | ) | $ | (5.79 | ) | $ | (2.34 | ) | $ | (4.91 | ) | |||||||||||||||||
| (1) | All remaining Dunn Series investors were redeemed on October 15, 2007. |
The accompanying notes are an integral part of these statements.
The Frontier Fund
Statements of Operations
For the Three Months Ended JuneSeptember 30, 2007 and 2006
| Long Only Commodity Series | Long/Short Commodity Series | Managed Futures Index Series | Long Only Commodity Series | Long/Short Commodity Series | Managed Futures Index Series | |||||||||||||||||||||||||||||||||||||||||||
| (Unaudited) | (Unaudited) | (Unaudited) | (Unaudited) | (Unaudited) | (Unaudited) | |||||||||||||||||||||||||||||||||||||||||||
| 6/30/2007 | 6/30/2006 | 6/30/2007 | 6/30/2006 | 6/30/2007 | 6/30/2006 | 9/30/2007 | 9/30/2006 | 9/30/2007 | 9/30/2006 | 9/30/2007 | 9/30/2006 | |||||||||||||||||||||||||||||||||||||
Investment Income: | ||||||||||||||||||||||||||||||||||||||||||||||||
Interest—net | $ | 247,243 | $ | 56,200 | $ | 268,564 | $ | 192,244 | $ | 57,326 | $ | 93,774 | ||||||||||||||||||||||||||||||||||||
Interest - net | $ | 92,262 | $ | 73,659 | $ | 294,472 | $ | 352,326 | $ | 4,875 | $ | 97,233 | ||||||||||||||||||||||||||||||||||||
Total Income | 247,243 | 56,200 | 268,564 | 192,244 | 57,326 | 93,774 | 92,262 | 73,659 | 294,472 | 352,326 | 4,875 | 97,233 | ||||||||||||||||||||||||||||||||||||
Expenses: | ||||||||||||||||||||||||||||||||||||||||||||||||
Incentive Fees | — | — | 90,202 | 17,177 | — | — | — | — | 331,234 | 61,818 | — | — | ||||||||||||||||||||||||||||||||||||
Management Fees | 79,544 | 18,079 | 229,884 | 162,269 | 28,285 | 37,846 | 32,180 | 23,393 | 269,265 | 307,355 | 3,514 | 51,212 | ||||||||||||||||||||||||||||||||||||
Service Fees—Class 1 | 21,286 | 2,668 | 193,922 | 41,370 | 2,915 | 670 | ||||||||||||||||||||||||||||||||||||||||||
Service Fees - Class 1 | 21,674 | 7,457 | 221,818 | 112,290 | 3,027 | 948 | ||||||||||||||||||||||||||||||||||||||||||
Trading Fees | 31,992 | 7,236 | 33,411 | 23,174 | 7,069 | 9,464 | 12,759 | 9,370 | 38,190 | 43,887 | 878 | 12,803 | ||||||||||||||||||||||||||||||||||||
Total Expenses | 132,822 | 27,983 | 547,419 | 243,990 | 38,269 | 47,980 | 66,613 | 40,220 | 860,507 | 525,350 | 7,419 | 64,963 | ||||||||||||||||||||||||||||||||||||
Investment gain/(loss)—net | 114,421 | 28,217 | (278,855 | ) | (51,746 | ) | 19,057 | 45,794 | ||||||||||||||||||||||||||||||||||||||||
Investment gain/(loss) - net | 25,649 | 33,439 | (566,035 | ) | (173,024 | ) | (2,544 | ) | 32,270 | |||||||||||||||||||||||||||||||||||||||
Realized and unrealized gain (loss) on investments: | ||||||||||||||||||||||||||||||||||||||||||||||||
Net realized gain/(loss) on futures and currencies | — | — | 1,015,649 | (586,749 | ) | (21,898 | ) | (41,794 | ) | — | 24,887 | 7,037,669 | (751,290 | ) | — | (522,087 | ) | |||||||||||||||||||||||||||||||
Net realized gain/(loss) on swap contracts | (657,921 | ) | 295,990 | 593,361 | (1,097,133 | ) | — | — | — | — | ||||||||||||||||||||||||||||||||||||||
Net change in open trade equity | — | — | (1,547,542 | ) | (189,794 | ) | 131,035 | (18,944 | ) | — | — | (8,298,694 | ) | (244,236 | ) | — | 108,632 | |||||||||||||||||||||||||||||||
Trading commissions | — | — | (216,768 | ) | (45,264 | ) | (6,013 | ) | (9,437 | ) | — | — | (399,666 | ) | (75,003 | ) | — | (12,466 | ) | |||||||||||||||||||||||||||||
Net change in inter-series payables | 466,773 | (310,054 | ) | — | 527,857 | (143,062 | ) | 13,449 | (354,403 | ) | 756,585 | — | 594,191 | — | 381,087 | |||||||||||||||||||||||||||||||||
Equity in earnings/(loss) from trading company | — | — | — | — | 73,373 | — | — | — | — | — | 968 | — | ||||||||||||||||||||||||||||||||||||
Net gain/(loss) on investments | (191,148 | ) | (14,064 | ) | (748,661 | ) | (293,950 | ) | 33,435 | (56,726 | ) | 238,958 | (315,661 | ) | (1,660,691 | ) | (476,338 | ) | 968 | (44,834 | ) | |||||||||||||||||||||||||||
Minority interests | — | — | 703,866 | — | — | — | — | — | 2,274,150 | — | — | — | ||||||||||||||||||||||||||||||||||||
NET INCREASE/(DECREASE) IN OWNERS' CAPITAL RESULTING FROM OPERATIONS | $ | (76,727 | ) | $ | 14,153 | $ | (323,650 | ) | $ | (345,696 | ) | $ | 52,492 | $ | (10,932 | ) | ||||||||||||||||||||||||||||||||
NET INCREASE/(DECREASE) IN OWNERS’ CAPITAL RESULTING FROM OPERATIONS | $ | 264,607 | $ | (282,222 | ) | $ | 47,424 | $ | (649,362 | ) | $ | (1,576 | ) | $ | (12,564 | ) | ||||||||||||||||||||||||||||||||
NET INCOME/(LOSS) PER UNIT | ||||||||||||||||||||||||||||||||||||||||||||||||
Class 1 | $ | (1.59 | ) | $ | 5.64 | $ | (1.05 | ) | $ | (2.43 | ) | $ | 7.33 | $ | (0.63 | ) | $ | 5.70 | $ | (13.63 | ) | $ | (0.01 | ) | $ | (3.69 | ) | $ | (0.54 | ) | $ | (4.26 | ) | |||||||||||||||
Class 2 | $ | (1.12 | ) | $ | 6.20 | $ | (0.31 | ) | $ | (1.69 | ) | $ | 8.00 | $ | (0.13 | ) | $ | 6.38 | $ | (13.25 | ) | $ | 0.77 | $ | (3.02 | ) | $ | (0.05 | ) | $ | (3.81 | ) | ||||||||||||||||
The accompanying notes are an integral part of these statements.
Statements of Operations
For the SixNine Months Ended JuneSeptember 30, 2007 and 2006
Balanced Series (Unaudited) | Winton Series (2) (Unaudited) | Campbell/Graham Series (1) (Unaudited) | ||||||||||||||||||||||
| 6/30/2007 | 6/30/2006 | 6/30/2007 | 6/30/2006 | 6/30/2007 | 6/30/2006 | |||||||||||||||||||
Investment Income: | ||||||||||||||||||||||||
Interest—net | $ | 3,515,558 | $ | 1,742,943 | $ | 145,643 | $ | 32,511 | $ | 855,639 | $ | 451,450 | ||||||||||||
Total Income | 3,515,558 | 1,742,943 | 145,643 | 32,511 | 855,639 | 451,450 | ||||||||||||||||||
Expenses: | ||||||||||||||||||||||||
Incentive Fees | 4,739,785 | 2,814,293 | 228,956 | 67,885 | 1,018,749 | 175,818 | ||||||||||||||||||
Management Fees | 649,660 | 338,107 | 99,435 | 11,765 | 663,205 | 469,975 | ||||||||||||||||||
Service Fees—Class 1 | 3,518,422 | 2,239,088 | 98,358 | 17,798 | 755,574 | 461,041 | ||||||||||||||||||
Trading Fees | 687,741 | 337,812 | 24,817 | 2,941 | 183,989 | 94,008 | ||||||||||||||||||
Total Expenses | 9,595,608 | 5,729,300 | 451,566 | 100,389 | 2,621,517 | 1,200,842 | ||||||||||||||||||
Investment gain/(loss)—net | (6,080,050 | ) | (3,986,357 | ) | (305,923 | ) | (67,878 | ) | (1,765,878 | ) | (749,392 | ) | ||||||||||||
Realized and unrealized gain (loss) on investments: | ||||||||||||||||||||||||
Net realized gain/(loss) on futures and currencies | 27,364,902 | 10,696,477 | — | — | 1,492,963 | 234,173 | ||||||||||||||||||
Net realized gain/(loss) on swap contracts | (28,552 | ) | — | — | — | — | — | |||||||||||||||||
Net change in open trade equity | (3,451,569 | ) | (4,418,235 | ) | — | — | (242,513 | ) | 55,424 | |||||||||||||||
Net unrealized gain/(loss) on swap contracts | 490,248 | — | — | — | — | — | ||||||||||||||||||
Trading commissions | (1,140,579 | ) | (737,673 | ) | — | — | (26,920 | ) | (40,685 | ) | ||||||||||||||
Net change in inter-series receivables | 456,492 | (624,978 | ) | — | — | — | — | |||||||||||||||||
Net change in inter-series payables | — | — | — | — | 325,800 | 473,699 | ||||||||||||||||||
Equity in earnings/(loss) from trading company | (1,817,629 | ) | 22,289 | 1,410,914 | 375,464 | 6,556,796 | 32,904 | |||||||||||||||||
Net gain/(loss) on investments | 21,873,313 | 4,937,880 | 1,410,914 | 375,464 | 8,106,126 | 755,515 | ||||||||||||||||||
Minority interests | (8,035,169 | ) | (412,322 | ) | — | — | (1,223,530 | ) | (248,912 | ) | ||||||||||||||
NET INCREASE/(DECREASE) IN OWNERS' CAPITAL RESULTING FROM OPERATIONS | $ | 7,758,094 | $ | 539,201 | $ | 1,104,991 | $ | 307,586 | $ | 5,116,718 | $ | (242,789 | ) | |||||||||||
NET INCOME/(LOSS) PER UNIT | ||||||||||||||||||||||||
Class 1 | $ | 2.49 | $ | 1.21 | $ | 0.73 | $ | 15.16 | $ | 7.82 | $ | 0.08 | ||||||||||||
Class 1a | $ | 2.04 | $ | (4.50 | ) | N/A | N/A | N/A | N/A | |||||||||||||||
Class 2 | $ | 4.43 | $ | 2.90 | $ | 2.36 | $ | 16.72 | $ | 9.92 | $ | 1.52 | ||||||||||||
Class 2a | $ | 3.50 | $ | (4.05 | ) | N/A | N/A | N/A | N/A | |||||||||||||||
| Balanced Series | Winton Series (2) | Campbell/Graham Series (1) | ||||||||||||||||||||||
| (Unaudited) | (Unaudited) | (Unaudited) | ||||||||||||||||||||||
| 9/30/2007 | 9/30/2006 | 9/30/2007 | 9/30/2006 | 9/30/2007 | 9/30/2006 | |||||||||||||||||||
Investment Income: | ||||||||||||||||||||||||
Interest - net | $ | 5,336,620 | $ | 2,956,610 | $ | 348,832 | $ | 33,769 | $ | 1,257,035 | $ | 830,638 | ||||||||||||
Total Income | 5,336,620 | 2,956,610 | 348,832 | 33,769 | 1,257,035 | 830,638 | ||||||||||||||||||
Expenses: | ||||||||||||||||||||||||
Incentive Fees | 7,137,289 | 2,869,054 | 463,646 | 67,885 | 1,002,342 | 184,247 | ||||||||||||||||||
Management Fees | 1,079,628 | 542,106 | 246,328 | 11,946 | 990,863 | 793,490 | ||||||||||||||||||
Service Fees - Class 1 | 5,223,678 | 3,701,182 | 247,607 | 17,802 | 1,159,006 | 765,572 | ||||||||||||||||||
Trading Fees | 1,097,509 | 549,693 | 61,540 | 2,986 | 271,383 | 158,685 | ||||||||||||||||||
Total Expenses | 14,538,104 | 7,662,035 | 1,019,121 | 100,619 | 3,423,594 | 1,901,994 | ||||||||||||||||||
Investment gain/(loss) - net | (9,201,484 | ) | (4,705,425 | ) | (670,289 | ) | (66,850 | ) | (2,166,559 | ) | (1,071,356 | ) | ||||||||||||
Realized and unrealized gain (loss) on investments: | ||||||||||||||||||||||||
Net realized gain/(loss) on futures and currencies | (3,420,263 | ) | 2,756,369 | — | — | 1,095,986 | (944,627 | ) | ||||||||||||||||
Net realized gain/(loss) on swap contracts | 1,674,698 | — | — | — | — | — | ||||||||||||||||||
Net change in open trade equity | 6,441,628 | (4,752,980 | ) | — | — | (2,880 | ) | 201,942 | ||||||||||||||||
Net unrealized gain/(loss) on swap contracts | (4,574,679 | ) | — | — | — | — | — | |||||||||||||||||
Trading commissions | (2,046,152 | ) | (1,014,872 | ) | — | — | (33,119 | ) | (72,604 | ) | ||||||||||||||
Net change in inter-series receivables | 722,948 | (3,212,711 | ) | — | — | — | — | |||||||||||||||||
Net change in inter-series payables | — | — | — | — | 325,800 | 772,702 | ||||||||||||||||||
Equity in earnings/(loss) from trading company | (4,091,779 | ) | 22,289 | 2,960,151 | 376,000 | 201,799 | (2,260,385 | ) | ||||||||||||||||
Net gain/(loss) on investments | (5,293,599 | ) | (6,201,905 | ) | 2,960,151 | 376,000 | 1,587,586 | (2,302,972 | ) | |||||||||||||||
Minority interests | (3,204,346 | ) | 1,898,877 | — | — | (1,059,987 | ) | 815,289 | ||||||||||||||||
NET INCREASE/(DECREASE) IN OWNERS’ CAPITAL RESULTING FROM OPERATIONS | $ | (17,699,429 | ) | $ | (9,008,453 | ) | $ | 2,289,862 | $ | 309,150 | $ | (1,638,960 | ) | $ | (2,559,039 | ) | ||||||||
NET INCOME/(LOSS) PER UNIT | ||||||||||||||||||||||||
Class 1 | $ | (6.76 | ) | $ | (3.06 | ) | $ | 3.98 | $ | 0.32 | $ | (3.33 | ) | $ | (4.57 | ) | ||||||||
Class 1a | $ | (6.38 | ) | $ | (8.51 | ) | N/A | N/A | N/A | N/A | ||||||||||||||
Class 2 | $ | (4.82 | ) | $ | (0.81 | ) | $ | 6.54 | $ | 0.68 | $ | (1.30 | ) | $ | (2.61 | ) | ||||||||
Class 2a | $ | (4.51 | ) | $ | (7.38 | ) | N/A | N/A | N/A | N/A | ||||||||||||||
| (1) | The Campbell/Graham Series of the Trust commenced trading operations on February 11, 2005. |
| (2) | The Beach Series was renamed the Winton Series in May, 2006. (See Note 1.) |
The accompanying notes are an integral part of these statements.
The Frontier Fund
Statements of Operations
For the SixNine Months Ended JuneSeptember 30, 2007 and 2006
| Currency Series | Dunn Series (1) | Graham Series | ||||||||||||||||||||||||||||||||||||||||||||||
| Currency Series (Unaudited) | Dunn Series (Unaudited) | Graham Series (Unaudited) | (Unaudited) | (Unaudited) | (Unaudited) | |||||||||||||||||||||||||||||||||||||||||||
| 6/30/2007 | 6/30/2006 | 6/30/2007 | 6/30/2006 | 6/30/2007 | 6/30/2006 | 9/30/2007 | 9/30/2006 | 9/30/2007 | 9/30/2006 | 9/30/2007 | 9/30/2006 | |||||||||||||||||||||||||||||||||||||
Investment Income: | ||||||||||||||||||||||||||||||||||||||||||||||||
Interest—net | $ | 233,837 | $ | 148,096 | $ | 1,405 | $ | 3,517 | $ | 115,154 | $ | 113,252 | ||||||||||||||||||||||||||||||||||||
Interest - net | $ | 350,284 | $ | 287,073 | $ | 1,909 | $ | 5,316 | $ | 161,970 | $ | 262,706 | ||||||||||||||||||||||||||||||||||||
Total Income | 233,837 | 148,096 | 1,405 | 3,517 | 115,154 | 113,252 | 350,284 | 287,073 | 1,909 | 5,316 | 161,970 | 262,706 | ||||||||||||||||||||||||||||||||||||
Expenses: | ||||||||||||||||||||||||||||||||||||||||||||||||
Incentive Fees | — | 19,372 | — | — | 144,237 | — | — | 19,672 | — | — | 148,323 | — | ||||||||||||||||||||||||||||||||||||
Management Fees | 53,589 | 69,659 | — | — | 137,774 | 121,538 | 80,024 | 98,128 | — | — | 169,876 | 262,409 | ||||||||||||||||||||||||||||||||||||
Service Fees—Class 1 | 110,403 | 35,059 | 1,545 | 2,612 | 78,689 | 88,485 | ||||||||||||||||||||||||||||||||||||||||||
Service Fees - Class 1 | 179,616 | 74,065 | 2,069 | 3,583 | 118,797 | 131,203 | ||||||||||||||||||||||||||||||||||||||||||
Trading Fees | 48,078 | 29,493 | 378 | 752 | 24,370 | 24,401 | 71,186 | 51,830 | 501 | 1,126 | 33,637 | 52,577 | ||||||||||||||||||||||||||||||||||||
Total Expenses | 212,070 | 153,583 | 1,923 | 3,364 | 385,070 | 234,424 | 330,826 | 243,695 | 2,570 | 4,709 | 470,633 | 446,189 | ||||||||||||||||||||||||||||||||||||
Investment gain/(loss)—net | 21,767 | (5,487 | ) | (518 | ) | 153 | (269,916 | ) | (121,172 | ) | ||||||||||||||||||||||||||||||||||||||
Investment gain/(loss) - net | 19,458 | 43,378 | (661 | ) | 607 | (308,663 | ) | (183,483 | ) | |||||||||||||||||||||||||||||||||||||||
Realized and unrealized gain (loss) on investments: | ||||||||||||||||||||||||||||||||||||||||||||||||
Net realized gain/(loss) on futures and currencies | (66,383 | ) | 216,116 | — | — | — | — | (14,638 | ) | 28,234 | — | — | — | — | ||||||||||||||||||||||||||||||||||
Net realized gain/(loss) on swap contracts | 786,052 | (245,770 | ) | — | — | — | — | 463,255 | 6,463 | — | — | — | — | |||||||||||||||||||||||||||||||||||
Net change in open trade equity | (31,967 | ) | 5,779 | — | — | — | — | (18,139 | ) | (28,403 | ) | — | — | — | — | |||||||||||||||||||||||||||||||||
Net change in inter-series payables | (367,394 | ) | 35,600 | — | — | (76,140 | ) | 206,208 | (279,447 | ) | (46,989 | ) | — | — | (76,140 | ) | 845,664 | |||||||||||||||||||||||||||||||
Equity in earnings/(loss) from trading company | — | — | (5,914 | ) | 3,954 | 1,223,530 | 248,912 | — | — | (31,945 | ) | (14,492 | ) | 1,059,987 | (815,289 | ) | ||||||||||||||||||||||||||||||||
Net gain/(loss) on investments | 320,308 | 11,725 | (5,914 | ) | 3,954 | 1,147,390 | 455,120 | 151,031 | (40,695 | ) | (31,945 | ) | (14,492 | ) | 983,847 | 30,375 | ||||||||||||||||||||||||||||||||
Minority interests | — | (22,289 | ) | — | — | — | — | — | (22,289 | ) | — | — | — | — | ||||||||||||||||||||||||||||||||||
NET INCREASE/(DECREASE) IN OWNERS' CAPITAL RESULTING FROM OPERATIONS | $ | 342,075 | $ | (16,051 | ) | $ | (6,432 | ) | $ | 4,107 | $ | 877,474 | $ | 333,948 | ||||||||||||||||||||||||||||||||||
NET INCREASE/(DECREASE) IN OWNERS’ CAPITAL RESULTING FROM OPERATIONS | $ | 170,489 | $ | (19,606 | ) | $ | (32,606 | ) | $ | (13,885 | ) | $ | 675,184 | $ | (153,108 | ) | ||||||||||||||||||||||||||||||||
NET INCOME/(LOSS) PER UNIT | ||||||||||||||||||||||||||||||||||||||||||||||||
Class 1 | $ | 4.13 | $ | (0.71 | ) | $ | 0.24 | $ | (2.29 | ) | $ | 10.75 | $ | 2.98 | $ | 2.32 | $ | (0.81 | ) | $ | (22.45 | ) | $ | (8.37 | ) | $ | 7.88 | $ | (2.30 | ) | ||||||||||||||||||
Class 2 | $ | 6.12 | $ | 0.76 | $ | 1.51 | $ | (1.06 | ) | $ | 12.98 | $ | 4.41 | $ | 4.99 | $ | 1.41 | $ | (22.69 | ) | $ | (6.85 | ) | $ | 10.64 | $ | (0.50 | ) | ||||||||||||||||||||
| (1) | All remaining Dunn Series investors were redeemed on October 15, 2007. |
The accompanying notes are an integral part of these statements.
The Frontier Fund
Statements of Operations
For the SixNine Months Ended JuneSeptember 30, 2007 and 2006
Long Only Commodity Series | Long/Short Commodity Series | Managed Futures Index Series | Long Only Commodity Series | Long/Short Commodity Series | Managed Futures Index Series | |||||||||||||||||||||||||||||||||||||||||||
| (Unaudited) | (Unaudited) | (Unaudited) | (Unaudited) | (Unaudited) | (Unaudited) | |||||||||||||||||||||||||||||||||||||||||||
| 6/30/2007 | 6/30/2006 | 6/30/2007 | 6/30/2006 | 6/30/2007 | 6/30/2006 | 9/30/2007 | 9/30/2006 | 9/30/2007 | 9/30/2006 | 9/30/2007 | 9/30/2006 | |||||||||||||||||||||||||||||||||||||
Investment Income: | ||||||||||||||||||||||||||||||||||||||||||||||||
Interest—net | $ | 378,698 | $ | 72,556 | $ | 481,561 | $ | 218,594 | $ | 152,732 | $ | 95,681 | ||||||||||||||||||||||||||||||||||||
Interest - net | $ | 470,960 | $ | 146,215 | $ | 776,033 | $ | 570,920 | $ | 157,607 | $ | 192,914 | ||||||||||||||||||||||||||||||||||||
Total Income | 378,698 | 72,556 | 481,561 | 218,594 | 152,732 | 95,681 | 470,960 | 146,215 | 776,033 | 570,920 | 157,607 | 192,914 | ||||||||||||||||||||||||||||||||||||
Expenses: | ||||||||||||||||||||||||||||||||||||||||||||||||
Incentive Fees | — | — | 202,011 | 46,147 | — | — | — | — | 533,245 | 107,965 | — | — | ||||||||||||||||||||||||||||||||||||
Management Fees | 123,050 | 23,291 | 450,582 | 186,407 | 79,367 | 38,968 | 155,230 | 46,684 | 719,847 | 493,762 | 82,881 | 90,180 | ||||||||||||||||||||||||||||||||||||
Service Fees—Class 1 | 43,533 | 2,675 | 343,267 | 41,817 | 5,509 | 695 | ||||||||||||||||||||||||||||||||||||||||||
Service Fees - Class 1 | 65,207 | 10,132 | 565,085 | 154,107 | 8,536 | 1,643 | ||||||||||||||||||||||||||||||||||||||||||
Trading Fees | 49,288 | 9,321 | 58,195 | 26,616 | 19,703 | 9,745 | 62,047 | 18,691 | 96,385 | 70,503 | 20,581 | 22,548 | ||||||||||||||||||||||||||||||||||||
Total Expenses | 215,871 | 35,287 | 1,054,055 | 300,987 | 104,579 | 49,408 | 282,484 | 75,507 | 1,914,562 | 826,337 | 111,998 | 114,371 | ||||||||||||||||||||||||||||||||||||
Investment gain/(loss)—net | 162,827 | 37,269 | (572,494 | ) | (82,393 | ) | 48,153 | 46,273 | ||||||||||||||||||||||||||||||||||||||||
Investment gain/(loss) - net | 188,476 | 70,708 | (1,138,529 | ) | (255,417 | ) | 45,609 | 78,543 | ||||||||||||||||||||||||||||||||||||||||
Realized and unrealized gain (loss) on investments: | ||||||||||||||||||||||||||||||||||||||||||||||||
Net realized gain/(loss) on futures and currencies | — | — | 1,787,877 | (606,471 | ) | (353,098 | ) | (41,794 | ) | — | 24,887 | 8,825,546 | (1,357,761 | ) | (353,098 | ) | (563,881 | ) | ||||||||||||||||||||||||||||||
Net realized gain/(loss) on swap contracts | 772,930 | 491,175 | — | — | — | — | 1,366,291 | (605,958 | ) | — | — | — | — | |||||||||||||||||||||||||||||||||||
Net change in open trade equity | — | — | (2,858,642 | ) | (9,196 | ) | (224,977 | ) | (18,944 | ) | — | — | (11,157,336 | ) | (253,432 | ) | (224,977 | ) | 89,688 | |||||||||||||||||||||||||||||
Trading commissions | — | — | (323,780 | ) | (50,405 | ) | (22,129 | ) | (9,437 | ) | — | — | (723,446 | ) | (125,408 | ) | (22,129 | ) | (21,903 | ) | ||||||||||||||||||||||||||||
Net change in inter-series payables | (829,616 | ) | (514,001 | ) | — | 410,516 | 490,858 | 12,957 | (1,184,019 | ) | 242,584 | — | 1,004,707 | 490,858 | 394,043 | |||||||||||||||||||||||||||||||||
Equity in earnings/(loss) from trading company | — | — | — | — | 73,373 | — | — | — | — | — | 74,341 | — | ||||||||||||||||||||||||||||||||||||
Net gain/(loss) on investments | (56,686 | ) | (22,826 | ) | (1,394,545 | ) | (255,556 | ) | (35,973 | ) | (57,218 | ) | 182,272 | (338,487 | ) | (3,055,236 | ) | (731,894 | ) | (35,005 | ) | (102,053 | ) | |||||||||||||||||||||||||
Minority interests | — | — | 1,817,629 | — | — | — | — | — | 4,091,779 | — | — | — | ||||||||||||||||||||||||||||||||||||
NET INCREASE/(DECREASE) IN OWNERS' CAPITAL RESULTING FROM OPERATIONS | $ | 106,141 | $ | 14,443 | $ | (149,410 | ) | $ | (337,949 | ) | $ | 12,180 | $ | (10,945 | ) | |||||||||||||||||||||||||||||||||
NET INCREASE/(DECREASE) IN OWNERS’ CAPITAL RESULTING FROM OPERATIONS | $ | 370,748 | $ | (267,779 | ) | $ | (101,986 | ) | $ | (987,311 | ) | $ | 10,604 | $ | (23,510 | ) | ||||||||||||||||||||||||||||||||
NET INCOME/(LOSS) PER UNIT | ||||||||||||||||||||||||||||||||||||||||||||||||
Class 1 | $ | 1.83 | $ | 9.46 | $ | (0.44 | ) | $ | (1.49 | ) | $ | 0.64 | $ | (0.74 | ) | $ | 7.53 | $ | (4.17 | ) | $ | (0.45 | ) | $ | (5.18 | ) | $ | 0.10 | $ | (5.00 | ) | |||||||||||||||||
Class 2 | $ | 2.86 | $ | 10.28 | $ | 1.09 | $ | (0.49 | ) | $ | 1.65 | $ | (0.02 | ) | $ | 9.24 | $ | (2.97 | ) | $ | 1.86 | $ | (3.51 | ) | $ | 1.60 | $ | (3.83 | ) | |||||||||||||||||||
The accompanying notes are an integral part of these statements.
Statements of Changes in Owners'Owners’ Capital
For the SixNine Months Ended JuneSeptember 30, 2007 (Unaudited)
| Balanced Series | Balanced Series | ||||||||||||||||||||||||||||||||||||||||||||||||||||||||||
| Class 1 | Class 1a | Class 2 | Class 2a | Class 1 | Class 1a | Class 2 | Class 2a | ||||||||||||||||||||||||||||||||||||||||||||||||||||
| Managing Owner | Limited Owners | Managing Owner | Limited Owners | Managing Owner | Limited Owners | Managing Owner | Limited Owners | Managing Owner | Limited Owners | Managing Owner | Limited Owners | Managing Owner | Limited Owners | Managing Owner | Limited Owners | ||||||||||||||||||||||||||||||||||||||||||||
Owners' Capital, January 1, 2007 | $ | — | $ | 224,559,900 | $ | 192 | $ | 4,203,673 | $ | 711,471 | $ | 47,869,930 | $ | 48,942 | $ | 612,864 | |||||||||||||||||||||||||||||||||||||||||||
Owners’ Capital, January 1, 2007 | $ | — | $ | 224,559,900 | $ | 192 | $ | 4,203,673 | $ | 711,471 | $ | 47,869,930 | $ | 48,942 | $ | 612,864 | |||||||||||||||||||||||||||||||||||||||||||
Sale of Units | — | 33,844,393 | — | 1,914,242 | 1,400,000 | 6,579,095 | 30,000 | 652,760 | — | 41,472,701 | — | 2,321,287 | 1,400,000 | 9,215,337 | 30,000 | 769,760 | |||||||||||||||||||||||||||||||||||||||||||
Redemption of Units | — | (22,948,693 | ) | — | (640,665 | ) | — | (5,446,332 | ) | — | — | — | (35,727,692 | ) | — | (707,927 | ) | — | (8,632,977 | ) | — | (14,830 | ) | ||||||||||||||||||||||||||||||||||||
Net (decrease) in Owners' | |||||||||||||||||||||||||||||||||||||||||||||||||||||||||||
Capital resulting from operations | — | 5,672,667 | 4 | 147,200 | 45,701 | 1,830,459 | 4,577 | 57,486 | |||||||||||||||||||||||||||||||||||||||||||||||||||
Net (decrease) in Owners’ Capital resulting from operations | $ | — | $ | (15,020,495 | ) | $ | (13 | ) | $ | (340,434 | ) | $ | (122,331 | ) | $ | (2,160,946 | ) | $ | (2,024 | ) | $ | (53,186 | ) | ||||||||||||||||||||||||||||||||||||
Owners' Capital, June 30, 2007 | $ | — | $ | 241,128,267 | $ | 196 | $ | 5,624,450 | $ | 2,157,172 | $ | 50,833,152 | $ | 83,519 | $ | 1,323,110 | |||||||||||||||||||||||||||||||||||||||||||
Owners’ Capital, September 30, 2007 | $ | — | $ | 215,284,414 | $ | 179 | $ | 5,476,599 | $ | 1,989,140 | $ | 46,291,344 | $ | 76,918 | $ | 1,314,608 | |||||||||||||||||||||||||||||||||||||||||||
Owners' Capital—Units, January 1, 2007 | — | 2,105,455 | 2 | 43,800 | 6,228 | 419,011 | 500 | 6,261 | |||||||||||||||||||||||||||||||||||||||||||||||||||
Owners’ Capital - Units, January 1, 2007 | — | 2,105,455 | 2 | 43,800 | 6,228 | 419,011 | 500 | 6,261 | |||||||||||||||||||||||||||||||||||||||||||||||||||
Sale of Units | — | 321,658 | — | 20,174 | 11,951 | 57,380 | 324 | 6,790 | — | 396,396 | — | 24,676 | 11,951 | 81,568 | 324 | 7,987 | |||||||||||||||||||||||||||||||||||||||||||
Redemption of Units | — | (217,938 | ) | — | (6,587 | ) | — | (48,018 | ) | — | — | — | (346,806 | ) | — | (7,344 | ) | — | (77,526 | ) | — | (168 | ) | ||||||||||||||||||||||||||||||||||||
Owners' Capital—Units, June 30, 2007 | — | 2,209,175 | 2 | 57,387 | 18,179 | 428,373 | 824 | 13,051 | |||||||||||||||||||||||||||||||||||||||||||||||||||
Owners’ Capital - Units, September 30, 2007 | — | 2,155,045 | 2 | 61,132 | 18,179 | 423,053 | 824 | 14,080 | |||||||||||||||||||||||||||||||||||||||||||||||||||
Net asset value per unit at January 1, 2007 | $ | 106.66 | $ | 95.97 | $ | 114.24 | $ | 97.88 | $ | 106.66 | $ | 95.97 | $ | 114.24 | $ | 97.88 | |||||||||||||||||||||||||||||||||||||||||||
Change in net asset value per unit for three months ended March 31, 2007 | (6.73 | ) | (6.12 | ) | (6.40 | ) | (5.62 | ) | (6.73 | ) | (6.12 | ) | (6.40 | ) | (5.62 | ) | |||||||||||||||||||||||||||||||||||||||||||
Net asset value per unit at March 31, 2007 | 99.93 | 89.85 | 107.84 | 92.26 | $ | 99.93 | $ | 89.85 | $ | 107.84 | $ | 92.26 | |||||||||||||||||||||||||||||||||||||||||||||||
Change in net asset value per unit for three months ended June 30, 2007 | 9.22 | 8.16 | 10.83 | 9.12 | 9.22 | 8.16 | 10.83 | 9.12 | |||||||||||||||||||||||||||||||||||||||||||||||||||
Net asset value per unit at June 30, 2007 | $ | 109.15 | $ | 98.01 | $ | 118.67 | $ | 101.38 | $ | 109.15 | $ | 98.01 | $ | 118.67 | $ | 101.38 | |||||||||||||||||||||||||||||||||||||||||||
Change in net asset value per unit for three months ended September 30, 2007 | (9.25 | ) | (8.42 | ) | (9.25 | ) | (8.01 | ) | |||||||||||||||||||||||||||||||||||||||||||||||||||
Net asset value per unit at September 30, 2007 | $ | 99.90 | $ | 89.59 | $ | 109.42 | $ | 93.37 | |||||||||||||||||||||||||||||||||||||||||||||||||||
The accompanying notes are an integral part of these statements.
The Frontier Fund
Statements of Changes in Owners'Owners’ Capital
For the SixNine Months Ended JuneSeptember 30, 2007 (Unaudited)
| Winton Series | Campbell/Graham Series | Winton Series | Campbell/Graham Series | |||||||||||||||||||||||||||||||||||||||||||||||||||||||
| Class 1 | Class 2 | Class 1 | Class 2 | Class 1 | Class 2 | Class 1 | Class 2 | |||||||||||||||||||||||||||||||||||||||||||||||||||
| Managing Owner | Limited Owners | Managing Owner | Limited Owners | Managing Owner | Limited Owners | Managing Owner | Limited Owners | Managing Owner | Limited Owners | Managing Owner | Limited Owners | Managing Owner | Limited Owners | Managing Owner | Limited Owners | |||||||||||||||||||||||||||||||||||||||||||
Owners' Capital, January 1, 2007 | $ | 1,057 | $ | 355,867 | $ | 228,782 | $ | 61,939 | $ | — | $ | 48,843,314 | $ | 2,105,062 | $ | 5,245,105 | ||||||||||||||||||||||||||||||||||||||||||
Owners’ Capital, January 1, 2007 | $ | 1,057 | $ | 355,867 | $ | 228,782 | $ | 61,939 | $ | — | $ | 48,843,314 | $ | 2,105,062 | $ | 5,245,105 | ||||||||||||||||||||||||||||||||||||||||||
Sale of Units | — | 15,051,609 | 410,000 | 8,223,253 | — | 7,294,646 | — | 703,818 | — | 23,276,846 | 410,000 | 8,918,823 | — | 11,334,248 | — | 1,062,018 | ||||||||||||||||||||||||||||||||||||||||||
Redemption of Units | — | (161,472 | ) | — | (44,242 | ) | — | (3,529,345 | ) | (2,000,000 | ) | (803,929 | ) | — | (475,804 | ) | — | (149,798 | ) | — | (5,006,653 | ) | (2,000,000 | ) | (981,448 | ) | ||||||||||||||||||||||||||||||||
Net decrease in Owners' Capital resulting from operations | 7 | 506,771 | 54,653 | 543,560 | — | 4,441,446 | 167,648 | 507,624 | ||||||||||||||||||||||||||||||||||||||||||||||||||
Net decrease in Owners’ Capital resulting from operations | 39 | 1,315,582 | 81,219 | 893,022 | — | (1,713,086 | ) | 140,273 | (66,147 | ) | ||||||||||||||||||||||||||||||||||||||||||||||||
Owners' Capital, June 30, 2007 | $ | 1,064 | $ | 15,752,775 | $ | 693,435 | $ | 8,784,510 | $ | — | $ | 57,050,061 | $ | 272,710 | $ | 5,652,618 | ||||||||||||||||||||||||||||||||||||||||||
Owners’ Capital, September 30, 2007 | $ | 1,096 | $ | 24,472,491 | $ | 720,001 | $ | 9,723,986 | $ | — | $ | 53,457,823 | $ | 245,335 | $ | 5,259,528 | ||||||||||||||||||||||||||||||||||||||||||
Owners' Capital—Units, January 1, 2007 | 10 | 3,368 | 2,142 | 580 | — | 507,344 | 20,666 | 51,494 | ||||||||||||||||||||||||||||||||||||||||||||||||||
Owners’ Capital - Units, January 1, 2007 | 10 | 3,368 | 2,142 | 580 | — | 507,344 | 20,666 | 51,494 | ||||||||||||||||||||||||||||||||||||||||||||||||||
Sale of Units | — | 146,270 | 4,210 | 80,344 | — | 78,188 | — | 7,018 | — | 224,424 | 4,210 | 86,619 | — | 120,604 | — | 10,489 | ||||||||||||||||||||||||||||||||||||||||||
Redemption of Units | — | (1,560 | ) | — | (458 | ) | — | (37,441 | ) | (18,227 | ) | (7,942 | ) | — | (4,569 | ) | — | (1,414 | ) | — | (52,792 | ) | (18,226 | ) | (9,680 | ) | ||||||||||||||||||||||||||||||||
Owners' Capital—Units, June 30, 2007 | 10 | 148,078 | 6,352 | 80,466 | — | 548,091 | 2,439 | 50,570 | ||||||||||||||||||||||||||||||||||||||||||||||||||
Owners’ Capital - Units, September 30, 2007 | 10 | 223,223 | 6,352 | 85,785 | — | 575,156 | 2,440 | 52,303 | ||||||||||||||||||||||||||||||||||||||||||||||||||
Net asset value per unit at January 1, 2007 | $ | 105.65 | $ | 106.81 | $ | 96.27 | $ | 101.86 | $ | 105.65 | $ | 106.81 | $ | 96.27 | $ | 101.86 | ||||||||||||||||||||||||||||||||||||||||||
Change in net asset value per unit for three months ended March 31, 2007 | (10.28 | ) | (9.67 | ) | (9.01 | ) | (8.84 | ) | (10.28 | ) | (9.67 | ) | (9.01 | ) | (8.84 | ) | ||||||||||||||||||||||||||||||||||||||||||
Net asset value per unit at March 31, 2007 | 95.37 | 97.14 | 87.26 | 93.02 | $ | 95.37 | $ | 97.14 | $ | 87.26 | $ | 93.02 | ||||||||||||||||||||||||||||||||||||||||||||||
Change in net asset value per unit for three months ended June 30, 2007 | 11.01 | 12.03 | 16.83 | 18.76 | 11.01 | 12.03 | 16.83 | 18.76 | ||||||||||||||||||||||||||||||||||||||||||||||||||
Net asset value per unit at June 30, 2007 | $ | 106.38 | $ | 109.17 | $ | 104.09 | $ | 111.78 | $ | 106.38 | $ | 109.17 | $ | 104.09 | $ | 111.78 | ||||||||||||||||||||||||||||||||||||||||||
Change in net asset value per unit for three months ended September 30, 2007 | 3.25 | 4.18 | (11.15 | ) | (11.22 | ) | ||||||||||||||||||||||||||||||||||||||||||||||||||||
Net asset value per unit at September 30, 2007 | $ | 109.63 | $ | 113.35 | $ | 92.94 | $ | 100.56 | ||||||||||||||||||||||||||||||||||||||||||||||||||
The accompanying notes are an integral part of these statements.
The Frontier Fund
Statements of Changes in Owners'Owners’ Capital
For the SixNine Months Ended JuneSeptember 30, 2007 (Unaudited)
| Currency Series | Dunn Series | Currency Series | Dunn Series (1) | |||||||||||||||||||||||||||||||||||||||||||||||||||||||
| Class 1 | Class 2 | Class 1 | Class 2 | Class 1 | Class 2 | Class 1 | Class 2 | |||||||||||||||||||||||||||||||||||||||||||||||||||
| Managing Owner | Limited Owners | Managing Owner | Limited Owners | Managing Owner | Limited Owners | Managing Owner | Limited Owners | Managing Owner | Limited Owners | Managing Owner | Limited Owners | Managing Owner | Limited Owners | Managing Owner | Limited Owners | |||||||||||||||||||||||||||||||||||||||||||
Owners' Capital, January 1, 2007 | $ | — | $ | 6,891,891 | $ | 16,689 | $ | 478,047 | $ | — | $ | 123,164 | $ | 823 | $ | 27,947 | ||||||||||||||||||||||||||||||||||||||||||
Owners’ Capital, January 1, 2007 | $ | — | $ | 6,891,891 | $ | 16,689 | $ | 478,047 | $ | — | $ | 123,164 | $ | 823 | $ | 27,947 | ||||||||||||||||||||||||||||||||||||||||||
Sale of Units | — | 1,823,315 | 1,000,000 | 74,500 | — | — | — | — | — | 3,277,772 | 1,000,000 | 107,900 | — | — | — | — | ||||||||||||||||||||||||||||||||||||||||||
Redemption of Units | — | (155,616 | ) | — | (283,430 | ) | — | (25,944 | ) | — | (25,121 | ) | — | (560,151 | ) | — | (283,430 | ) | — | (35,509 | ) | — | (25,121 | ) | ||||||||||||||||||||||||||||||||||
Net decrease in Owners' | ||||||||||||||||||||||||||||||||||||||||||||||||||||||||||
Capital resulting from operations | — | 313,369 | 10,020 | 18,686 | — | (3,635 | ) | 15 | (2,812 | ) | ||||||||||||||||||||||||||||||||||||||||||||||||
Net decrease in Owners’ Capital resulting from operations | — | 155,592 | (105 | ) | 15,002 | — | (29,563 | ) | (227 | ) | (2,816 | ) | ||||||||||||||||||||||||||||||||||||||||||||||
Owners' Capital, June 30, 2007 | $ | — | $ | 8,872,959 | $ | 1,026,709 | $ | 287,803 | $ | — | $ | 93,585 | $ | 838 | $ | 14 | ||||||||||||||||||||||||||||||||||||||||||
Owners’ Capital, September 30, 2007 | $ | — | $ | 9,765,104 | $ | 1,016,584 | $ | 317,519 | $ | — | $ | 58,092 | $ | 596 | $ | 10 | ||||||||||||||||||||||||||||||||||||||||||
Owner's Capital—Units, January 1, 2007 | — | 68,126 | 154 | 4,417 | — | 1,601 | 10 | 340 | ||||||||||||||||||||||||||||||||||||||||||||||||||
Owner’s Capital - Units, January 1, 2007 | — | 68,126 | 154 | 4,417 | — | 1,601 | 10 | 340 | ||||||||||||||||||||||||||||||||||||||||||||||||||
Sale of Units | — | 17,673 | 8,825 | 673 | — | — | — | — | — | 31,683 | 8,825 | 961 | — | — | — | — | ||||||||||||||||||||||||||||||||||||||||||
Redemption of Units | — | (1,527 | ) | — | (2,573 | ) | — | (388 | ) | — | (340 | ) | — | (5,439 | ) | — | (2,574 | ) | — | (534 | ) | — | (340 | ) | ||||||||||||||||||||||||||||||||||
Owners' Capital—Units, June 30, 2007 | — | 84,272 | 8,979 | 2,517 | — | 1,213 | 10 | 0 | ||||||||||||||||||||||||||||||||||||||||||||||||||
Owners’ Capital - Units, September 30, 2007 | — | 94,370 | 8,979 | 2,804 | — | 1,067 | 10 | — | ||||||||||||||||||||||||||||||||||||||||||||||||||
Net asset value per unit at January 1, 2007 | $ | 101.16 | $ | 108.23 | $ | 76.91 | $ | 82.27 | $ | 101.16 | $ | 108.23 | $ | 76.91 | $ | 82.27 | ||||||||||||||||||||||||||||||||||||||||||
Change in net asset value per unit for three months ended March 31, 2007 | (3.02 | ) | (2.44 | ) | (14.47 | ) | (14.97 | ) | (3.02 | ) | (2.44 | ) | (14.47 | ) | (14.97 | ) | ||||||||||||||||||||||||||||||||||||||||||
Net asset value per unit at March 31, 2007 | 98.14 | 105.79 | 62.44 | 67.30 | $ | 98.14 | $ | 105.79 | $ | 62.44 | $ | 67.30 | ||||||||||||||||||||||||||||||||||||||||||||||
Change in net asset value per unit for three months ended June 30, 2007 | 7.15 | 8.56 | 14.71 | 16.48 | 7.15 | 8.56 | 14.71 | 16.48 | ||||||||||||||||||||||||||||||||||||||||||||||||||
Net asset value per unit at June 30, 2007 | $ | 105.29 | $ | 114.35 | $ | 77.15 | $ | 83.78 | $ | 105.29 | $ | 114.35 | $ | 77.15 | $ | 83.78 | ||||||||||||||||||||||||||||||||||||||||||
Change in net asset value per unit for three months ended September 30, 2007 | (1.81 | ) | (1.13 | ) | (22.69 | ) | (24.20 | ) | ||||||||||||||||||||||||||||||||||||||||||||||||||
Net asset value per unit at September 30, 2007 | $ | 103.48 | $ | 113.22 | $ | 54.46 | $ | 59.58 | ||||||||||||||||||||||||||||||||||||||||||||||||||
| (1) | All remaining Dunn Series investors were redeemed on October 15, 2007 |
The accompanying notes are an integral part of these statements.
The Frontier Fund
Statements of Changes in Owners'Owners’ Capital
For the SixNine Months Ended JuneSeptember 30, 2007 (Unaudited)
| Graham Series | Long Only Commodity Series | Graham Series | Long Only Commodity Series | |||||||||||||||||||||||||||||||||||||||||||||||||||||||
| Class 1 | Class 2 | Class 1 | Class 2 | Class 1 | Class 2 | Class 1 | Class 2 | |||||||||||||||||||||||||||||||||||||||||||||||||||
| Managing Owner | Limited Owners | Managing Owner | Limited Owners | Managing Owner | Limited Owners | Managing Owner | Limited Owners | Managing Owner | Limited Owners | Managing Owner | Limited Owners | Managing Owner | Limited Owners | Managing Owner | Limited Owners | |||||||||||||||||||||||||||||||||||||||||||
Owners' Capital, January 1, 2007 | $ | — | $ | 5,991,337 | $ | 389,915 | $ | 1,659,580 | $ | — | $ | 4,321,464 | $ | 47,632 | $ | 67,769 | ||||||||||||||||||||||||||||||||||||||||||
Owners’ Capital, January 1, 2007 | $ | — | $ | 5,991,337 | $ | 389,915 | $ | 1,659,580 | $ | — | $ | 4,321,464 | $ | 47,632 | $ | 67,769 | ||||||||||||||||||||||||||||||||||||||||||
Sale of Units | — | 224,427 | — | — | — | 882,020 | 100,000 | 23,883 | — | 565,129 | — | 16,000 | — | 1,195,438 | 100,000 | 46,183 | ||||||||||||||||||||||||||||||||||||||||||
Redemption of Units | — | (1,297,109 | ) | (400,000 | ) | (151,191 | ) | — | (1,120,823 | ) | — | (35,288 | ) | — | (1,497,728 | ) | (400,000 | ) | (155,334 | ) | — | (1,454,030 | ) | — | (35,288 | ) | ||||||||||||||||||||||||||||||||
Net increase (decrease) in Owners' Capital resulting from operations | — | 606,716 | 54,300 | 216,458 | — | 103,722 | 210 | 2,209 | ||||||||||||||||||||||||||||||||||||||||||||||||||
Net increase (decrease) in Owners’ Capital resulting from operations | — | 444,521 | 53,295 | 177,368 | — | 355,044 | 9,648 | 6,056 | ||||||||||||||||||||||||||||||||||||||||||||||||||
Owners' Capital, June 30, 2007 | $ | — | $ | 5,525,371 | $ | 44,215 | $ | 1,724,847 | $ | — | $ | 4,186,383 | $ | 147,842 | $ | 58,573 | ||||||||||||||||||||||||||||||||||||||||||
Owners’ Capital, September 30, 2007 | $ | — | $ | 5,503,259 | $ | 43,210 | $ | 1,697,614 | $ | — | $ | 4,417,916 | $ | 157,280 | $ | 84,720 | ||||||||||||||||||||||||||||||||||||||||||
Owners' Capital—Units, January 1, 2007 | — | 70,733 | 4,320 | 18,389 | — | 45,276 | 490 | 698 | ||||||||||||||||||||||||||||||||||||||||||||||||||
Owners’ Capital - Units, January 1, 2007 | — | 70,733 | 4,320 | 18,389 | — | 45,276 | 490 | 698 | ||||||||||||||||||||||||||||||||||||||||||||||||||
Sale of Units | — | 2,696 | — | — | — | 9,299 | 988 | 239 | — | 6,478 | — | 160 | — | 12,488 | 988 | 450 | ||||||||||||||||||||||||||||||||||||||||||
Redemption of Units | — | (15,540 | ) | (3,892 | ) | (1,680 | ) | — | (11,541 | ) | — | (351 | ) | — | (17,770 | ) | (3,892 | ) | (1,722 | ) | — | (14,861 | ) | — | (351 | ) | ||||||||||||||||||||||||||||||||
Owners' Capital—Units, June 30, 2007 | — | 57,889 | 428 | 16,709 | — | 43,034 | 1,478 | 586 | ||||||||||||||||||||||||||||||||||||||||||||||||||
Owners’ Capital - Units, September 30, 2007 | — | 59,441 | 428 | 16,827 | — | 42,903 | 1,478 | 797 | ||||||||||||||||||||||||||||||||||||||||||||||||||
Net asset value per unit at January 1, 2007 | $ | 84.70 | $ | 90.25 | $ | 95.45 | $ | 97.13 | $ | 84.70 | $ | 90.25 | $ | 95.45 | $ | 97.13 | ||||||||||||||||||||||||||||||||||||||||||
Change in net asset value per unit for three months ended March 31, 2007 | (8.97 | ) | (8.96 | ) | 3.42 | 3.98 | (8.97 | ) | (8.96 | ) | 3.42 | 3.98 | ||||||||||||||||||||||||||||||||||||||||||||||
Net asset value per unit at March 31, 2007 | 75.73 | 81.29 | 98.87 | 101.11 | $ | 75.73 | $ | 81.29 | $ | 98.87 | $ | 101.11 | ||||||||||||||||||||||||||||||||||||||||||||||
Change in net asset value per unit for three months ended June 30, 2007 | 19.72 | 21.94 | (1.59 | ) | (1.12 | ) | 19.72 | 21.94 | (1.59 | ) | (1.12 | ) | ||||||||||||||||||||||||||||||||||||||||||||||
Net asset value per unit at June 30, 2007 | $ | 95.45 | $ | 103.23 | $ | 97.28 | $ | 99.99 | $ | 95.45 | $ | 103.23 | $ | 97.28 | $ | 99.99 | ||||||||||||||||||||||||||||||||||||||||||
Change in net asset value per unit for three months ended September 30, 2007 | (2.87 | ) | (2.34 | ) | 5.70 | 6.38 | ||||||||||||||||||||||||||||||||||||||||||||||||||||
Net asset value per unit at September 30, 2007 | $ | 92.58 | $ | 100.89 | $ | 102.98 | $ | 106.37 | ||||||||||||||||||||||||||||||||||||||||||||||||||
The accompanying notes are an integral part of these statements.
The Frontier Fund
Statements of Changes in Owners'Owners’ Capital
For the SixNine Months Ended JuneSeptember 30, 2007 (Unaudited)
| Long/Short Commodity Series | Managed Futures Index Series | Long/Short Commodity Series | Managed Futures Index Series | |||||||||||||||||||||||||||||||||||||||||||||||||||||
| Class 1 | Class 2 | Class 1 | Class 2 | Class 1 | Class 2 | Class 1 | Class 2 | |||||||||||||||||||||||||||||||||||||||||||||||||
| Managing Owner | Limited Owners | Managing Owner | Limited Owners | Managing Owner | Limited Owners | Managing Owner | Limited Owners | Managing Owner | Limited Owners | Managing Owner | Limited Owners | Managing Owner | Limited Owners | Managing Owner | Limited Owners | |||||||||||||||||||||||||||||||||||||||||
Owners' Capital, January 1, 2007 | $ | — | $ | 19,478,595 | $ | 249,285 | $ | 2,448,197 | $ | — | $ | 500,070 | $ | 50,141 | $ | 2,518 | ||||||||||||||||||||||||||||||||||||||||
Owners’ Capital, January 1, 2007 | $ | — | $ | 19,478,595 | $ | 249,285 | $ | 2,448,197 | $ | — | $ | 500,070 | $ | 50,141 | $ | 2,518 | ||||||||||||||||||||||||||||||||||||||||
Sale of Units | — | 10,995,825 | 110,000 | 350,183 | — | 199,685 | 30,000 | — | — | 15,534,164 | 110,000 | 889,498 | — | 231,448 | 30,000 | 2,400 | ||||||||||||||||||||||||||||||||||||||||
Redemption of Units | — | (1,813,495 | ) | — | (364,162 | ) | — | (78,743 | ) | — | — | — | (4,145,451 | ) | — | (471,530 | ) | — | (121,237 | ) | — | — | ||||||||||||||||||||||||||||||||||
Net increase (decrease) in Owners' | ||||||||||||||||||||||||||||||||||||||||||||||||||||||||
Capital resulting from operations | — | (181,013 | ) | 2,739 | 28,864 | — | 9,248 | 2,890 | 42 | |||||||||||||||||||||||||||||||||||||||||||||||
Net increase (decrease) in Owners’ Capital resulting from operations | — | (166,140 | ) | 5,424 | 58,730 | — | 7,690 | 2,849 | 65 | |||||||||||||||||||||||||||||||||||||||||||||||
Owners' Capital, June 30, 2007 | $ | — | $ | 28,479,912 | $ | 362,024 | $ | 2,463,082 | $ | — | $ | 630,260 | $ | 83,031 | $ | 2,560 | ||||||||||||||||||||||||||||||||||||||||
Owners’ Capital, September 30, 2007 | $ | — | $ | 30,701,168 | $ | 364,709 | $ | 2,924,895 | $ | — | $ | 617,971 | $ | 82,990 | $ | 4,983 | ||||||||||||||||||||||||||||||||||||||||
Owners' Capital—Units, January 1, 2007 | — | 193,966 | 2,422 | 23,784 | — | 5,169 | 509 | 26 | ||||||||||||||||||||||||||||||||||||||||||||||||
Owners’ Capital - Units, January 1, 2007 | — | 193,966 | 2,422 | 23,784 | — | 5,169 | 509 | 26 | ||||||||||||||||||||||||||||||||||||||||||||||||
Sale of Units | — | 108,829 | 1,058 | 3,342 | — | 2,170 | 320 | — | — | 154,815 | 1,058 | 8,620 | — | 2,510 | 321 | 23 | ||||||||||||||||||||||||||||||||||||||||
Redemption of Units | — | (17,937 | ) | — | (3,448 | ) | — | (867 | ) | — | — | — | (41,677 | ) | — | (4,493 | ) | — | (1,299 | ) | — | |||||||||||||||||||||||||||||||||||
Owners' Capital—Units, June 30, 2007 | — | 284,858 | 3,480 | 23,678 | — | 6,472 | 829 | 26 | ||||||||||||||||||||||||||||||||||||||||||||||||
Owners’ Capital - Units, September 30, 2007 | — | 307,104 | 3,480 | 27,911 | — | 6,380 | 830 | 49 | ||||||||||||||||||||||||||||||||||||||||||||||||
Net asset value per unit at January 1, 2007 | $ | 100.42 | $ | 102.93 | $ | 96.75 | $ | 98.43 | $ | 100.42 | $ | 102.93 | $ | 96.75 | $ | 98.43 | ||||||||||||||||||||||||||||||||||||||||
Change in net asset value per unit for three months ended March 31, 2007 | 0.61 | 1.40 | (6.69 | ) | (6.35 | ) | 0.61 | 1.40 | (6.69 | ) | (6.35 | ) | ||||||||||||||||||||||||||||||||||||||||||||
Net asset value per unit at March 31, 2007 | 101.03 | 104.33 | 90.06 | 92.08 | $ | 101.03 | $ | 104.33 | $ | 90.06 | $ | 92.08 | ||||||||||||||||||||||||||||||||||||||||||||
Change in net asset value per unit for three months ended June 30, 2007 | (1.05 | ) | (0.31 | ) | 7.33 | 8.00 | (1.05 | ) | (0.31 | ) | 7.33 | 8.00 | ||||||||||||||||||||||||||||||||||||||||||||
Net asset value per unit at June 30, 2007 | $ | 99.98 | $ | 104.02 | $ | 97.39 | $ | 100.08 | $ | 99.98 | $ | 104.02 | $ | 97.39 | $ | 100.08 | ||||||||||||||||||||||||||||||||||||||||
Change in net asset value per unit for three months ended September 30, 2007 | (0.01 | ) | 0.77 | (0.54 | ) | (0.05 | ) | |||||||||||||||||||||||||||||||||||||||||||||||||
Net asset value per unit at September 30, 2007 | $ | 99.97 | $ | 104.79 | $ | 96.85 | $ | 100.03 | ||||||||||||||||||||||||||||||||||||||||||||||||
The accompanying notes are an integral part of these statements.
Notes to Financial Statements
As of JuneSeptember 30, 2007 (Unaudited)
1. Organization
The Frontier Fund, which is referred to in this report as the Trust, was formed on August 8, 2003, as a Delaware statutory trust. The Trust is a multi-advisor commodity pool, as described in Commodity Futures Trading Commission, or CFTC, Regulation § 4.10(d)(2). The Trust has authority to issue separate seriesSeries or a Series of unitsUnits of beneficial interest, or the Units, in segregated pools of assets of the Trust, pursuant to the requirements of the Delaware Statutory Trust Act, as amended, or the Trust Act. The assets of each Series are segregated from the assets of other Series. The Trust is not registered as an investment company under the Investment Company Act of 1940, as amended. It is managed by its Managing Owner, Equinox Fund Management, LLC.
Purchasers of Units are limited owners of the Trust, or Limited Owners. The Trust Act provides that, except as otherwise provided in the amended and restated declaration of trust and trust agreement of the Trust dated as of August 8, 2003, by and among the Managing Owner, Wilmington Trust Company as trustee and the unitholders from time to time, or the Trust Agreement, unitholders in a Delaware statutory trust will have the same limitation of liability as do stockholders of private corporations organized under the General Corporation Law of the State of Delaware. The Trust Agreement confers substantially the same limited liability, and contains the same limited exceptions thereto, as would a limited partnership agreement for a Delaware limited partnership engaged in like transactions as the Trust. In addition, pursuant to the Trust Agreement, the Managing Owner of the Trust is liable for obligations of a Series in excess of that Series’ assets. Limited Owners do not have any such liability.
As of JuneSeptember 30, 2007, the Trust had nine separate Series of Units issued and outstanding: Balanced Series, Winton Series (formerly Beach Series, as described below), Campbell/Graham Series, Currency Series, Dunn Series, Graham Series, Long Only Commodity Series, Long/Short Commodity Series and the Managed Futures Index Series. The Units of each Series are separated into two sub-classes of Units, except the Balanced Series which has four sub-classes of Units.
On September 24, 2004, the Trust commenced operations for Balanced Series, Winton Series (formerly Beach Series, as described below), Currency Series and Dunn Series. The Graham Series commenced operations as of November 19, 2004. The Campbell/Graham Series commenced operations on February 11, 2005. On February 24, 2006, the Trust commenced operations for the Long Only Commodity, Long/Short Commodity and the Managed Futures Index Series. On May 1, 2006, two new classes of the Balanced Series commenced operations: Balanced Series 1a, and Balanced Series 2a.
The Continuous Offering Period of the Dunn Series was terminated by the Managing Owner in February 2006. On October 15, 2007 the remaining Dunn Series investors were redeemed and the remaining net assets of the Series were distributed to these investors.
Effective as of April 13, 2006, (i) the Advisory Agreement dated as of March 1, 2004, by and among the Trust, Frontier Trading Company II LLC (the “Trading Company II”), the Managing Owner and Beach Capital Management Limited (“Beach”), which set forth the terms and conditions upon which Beach would render and implement trading advisory services on behalf of the Trading Company II and the Trust with respect to the Beach Series of the Trust and (ii) the Advisory Agreement dated as of March 1, 2004, by and among the Trust, Frontier Trading Company I LLC (the “Trading Company I”), the Managing Owner and Beach, which set forth the terms and conditions upon which Beach would render and implement trading advisory services on behalf of the Trading Company I and the Trust with respect to the assets of the Balanced Series of the Trust allocated to Beach (collectively, the “Agreements”) were terminated. The Agreements were terminated because Beach informed the Managing Owner that Beach had ceased trading pursuant to its Discretionary Program, which was the trading program Beach utilized in providing the trading advisory services under the Agreements.
As a result of the termination of the Agreements, the Trust ceased accepting new subscriptions for the Units in the Beach Series, and, effective April 1, 2006, the Trust ceased assessing all fees on the Beach Series. Upon termination of the Agreements, the Managing Owner delivered written notice to the existing investors in the Beach Series informing them of their exchange and redemption rights as disclosed in the Trust’s prospectus (the “Prospectus”). In addition, the assets of the Balanced Series which had previously been allocated to Beach were reallocated to one or more of the other trading advisors pursuant to the Managing Owner’s asset allocation discretion as disclosed in the Prospectus. On July 31, 2006, all remaining investor accounts in the Beach Series were redeemed.
In May 2006, Beach Series was renamed as Winton Series. For purposes of this report, Beach Series is referred to as Winton Series, regardless of whether the applicable time period referred to is prior or subsequent to the name change, unless explicitly set forth otherwise.
2. Significant Accounting Policies
Basis of Presentation
The interim financial statements of the Series included herein have been prepared in accordance with accounting principles generally accepted in the United States of America (“U.S.”) for interim financial information and Rule 10-01 of Regulation S-X. Accordingly, they do not include all the information and footnotes required by generally accepted accounting principles for complete financial statements. These financial statements are unaudited and should be read in conjunction with the audited financial statements and notes thereto included in the Trust’s Annual Report on Form 10-K for the year ended December 31, 2006. The Series follow the same accounting policies in the preparation of interim reports as set forth in the annual report. In the opinion of management, the financial statements reflect all adjustments, which are of a normal recurring nature, necessary for a fair presentation of the financial position, results of operation and changes in owners’ capital for the interim periods presented and are not necessarily indicative of a full year’s results. Certain prior year numbers have been reclassified to conform to current year presentation with no impact to the Statements of Financial Condition, Statements of Operations or the Statements of Changes in Owners’ Capital.
Consolidation
The Series, through investing in subsidiary limited liability trading company or companies (“Trading Company”), place assets under management ofauthorize certain Trading Advisors.Advisors to place trades and manage assets at pre-determined investment levels. The Trading Companies were organized by the Managing Owner for the purpose of investing in securities and derivative instruments, and have no operating income or expenses, except for trading income and expenses, all of which is allocated to the Series. Trading Companies in which a Series has a majority equity interest are consolidated by such Series. Investments in Trading Companies in which a Series does not have a controlling or majority interest are accounted for under the equity method and are carried in the statement of financial condition of such Series at fair value based on the interest of each Series in such Trading Company. Fair value represents the accumulated profit or loss associated with the Series investment in the Trading Company(s).
The consolidated financial statements of Balanced Series include the assets, liabilities and earnings of its wholly-owned and majority owned Trading Companies, Frontier Trading Company I, LLC, Frontier Trading Company II, LLC, Frontier Trading Company IV, LLC, Frontier Trading Company VI, LLC and Frontier Trading Company IX, LLC.
The consolidated financial statements of Currency Series include the assets, liabilities and earnings of its majority-owned trading company, Frontier Trading Company III, LLC.
The consolidated financial statements of Campbell/Graham Series include the assets, liabilities and earnings of its majority-owned trading company, Frontier Trading Company V, LLC.
The consolidated financial statements of Long/Short Commodity Series include the assets, liabilities and earnings of its majority-owned trading company, Frontier Trading Company VII, LLC.
The consolidated financial statements of Long Only Commodity Series include the assets, liabilities and earnings of its wholly-owned trading company, Frontier Trading Company VIII, LLC.
Statement of Cash Flows
The Trust has elected not to provide statements of cash flows as permitted by Statement of Financial Accounting Standards No. 102,Statements of Cash Flows – Exemption of Certain Enterprises and Classification of Cash Flows from Certain Securities Acquired for Resale.
Investments and Swaps
Transactions are recorded on a trade date basis and all investments are recorded at fair value in the financial statements, with changes in fair value reported as a component of Realized and Unrealized Gain / (Loss) on Investments in the Statements of Operations. Generally, fair values will be based on quoted market prices; however, in certain circumstances, significant judgments and estimates may be required in determining fair value in the absence of an active market closing price. At September 30, 2007 all investments in futures and forward contracts were based on quoted market prices. The valuation of investments in swap contracts (“Swaps”) involve estimates. See Note 3.
The Managing Owner may make judgments that can frequently require estimates about matters that are inherently uncertain. The Managing Owner provides a good faith estimate of the daily net asset value (“NAV”) for each Series based on such uncertain information. The Managing Owner’s good faith estimates of each Series’ NAV is published daily by the Trust and is used for subscriptions, redemptions and exchanges of all Trust Units, and such Unit transactions are final and not subject to subsequent adjustment unless the estimate of NAV varies from the actual NAV by more than one percent (1.0%) of the actual NAV as described within the Prospectus.
The Balanced Series, in order to make investments from time to time in the Campbell/Graham Series, Currency Series, Graham Series, Long Only Commodity Series, Long/Short Commodity Series and Managed Futures Index Series, advances funds to such Series for the purpose of investing in the respective Trading Company or Trading Companies for such Series on behalf of the Balanced Series. The amount of the funds advanced by the Balanced Series to each of the Campbell/Graham Series, Currency Series, Graham Series, Long Only Commodity Series, Long/Short Commodity Series and Managed Futures Index Series participates on apari passu basis with the Class 2 Units of such investee Series. The Balanced Series reflects the change in value of these investments as “Net change in inter-series receivables” in the Statement of Operations. The Balanced Series is subject to the same allocations of income and fees as the Limited Owners of such Series. As a result of fees charged by the investee Series, fees are not charged by the Balanced Series on the capital allocated to investments in affiliated Series, and the Managing Owner monitors such allocations so that aggregate fees of the investee Series on the Balanced Series investments do not exceed the allowable fees of the Balanced Series as provided in the Trust’s Prospectus.
The Balanced Series, Currency Series and Long Only Series invest in total return swap contracts with major financial institutions. A swap contract generally involves an exchange of a stream of payments between the contracting parties. Swap contracts generally are not uniform and not exchange-traded. The Series reflect the change in value of these investments as “Net realized (or unrealized) gain/(loss) on swap contracts”. Generally, swap counterparties charge ongoing fees for such contracts; the Series charge no management fees on the assets allocated to such investments. Approximately 9% of the Trust’s assets are deposited with over-the-counter counterparties in order to initiate and maintain swap contracts.Short-term Investments
Short-term investments are time deposits of 90 day to one year duration held by U.S. Federally chartered banks and offshore banks.
Income Taxes
On July 13, 2006, the FASBFinancial Accounting Standards Board (“FASB”) released FASB Interpretation No. 48 Accounting for Uncertainty in Income Taxes (“FIN 48”). FIN 48 provides guidance for how uncertain tax positions should be recognized, measured, presented and disclosed in the financial statements. FIN 48 requires the evaluation of tax positions taken or expected to be taken in the course of preparing the Trust’s tax returns to determine whether the tax positions are “more-likely-than-not” of being sustained by the applicable tax authority. Tax positions not deemed to meet the more-likely-than-not threshold would be recorded as a tax benefit or expense in the current year. The adoption of FIN 48 was effective for the Trust on January 1, 2007, and did not impact our financial position or results of operations.
Recent accounting pronouncements:Accounting Pronouncements:
In September 2006, the FASB issued SFAS No. 157, Fair Value Measurements (“SFAS 157”). SFAS 157, among other things, defines fair value, establishes a framework for measuring fair value and enhances disclosures about fair value measurements required under other accounting pronouncements, but does not change existing guidance as to whether or not an instrument is carried at fair value. SFAS 157 is effective for the Trust on January 1, 2008. Management is currently evaluating the provisions of SFAS 157 and its potential effect on its financial statements.
In February 2007, the FASB issued SFAS No. 159, The Fair Value Option for Financial Assets and Financial Liabilities (“SFAS 159”), which permits entities to choose to measure many financial instruments and certain other items at fair value that are not currently required to be measured at fair value. SFAS 159 is effective for the Trust on January 1, 2008. Management is currently evaluating the provisions of SFAS 159 and its potential effects on its financial statements.
3. Swaps
In addition to authorizing Trading Advisors to manage pre-determined investment levels of futures and forward contracts, certain Series of the Trust will strategically invest a portion or all of their assets in total return Swaps, selected at the direction of the Managing Owner. Swaps are privately negotiated contracts designed to provide investment returns linked to those produced by one or more investment products or indices. In a typical Swap, two parties agree to exchange the returns (or differentials in rates of return) earned or realized on one or more particular predetermined investments or instruments. The gross returns to be exchanged or “swapped” between the parties are calculated with respect to a “notional amount” (i.e., the amount or value of the underlying asset used in computing the particular interest rate, return, or other amount to be exchanged) in a particular investment, or in a “basket” of commodities or other instruments representing a particular index.
Each Series’ investment in Swaps will likely differ substantially over time due to cash flows, portfolio management decisions and market movements. For the Balanced Series, Campbell/Graham Series and Currency Series the Swaps serve to diversify the investment holdings of each Series, and to provide access to programs and advisors that would not be otherwise available to the Series, and are not used for hedging purposes.
The Managing Owner follows a procedure in selecting well-established financial institutions which the Managing Owner, in its sole discretion, considers to be reputable, reliable, financially responsible and well established, to act as Swap Counterparties. The procedure includes due diligence review of documentation on all new and existing financial institution counterparties prior to initiation of relationship, and quarterly ongoing review during the relationship, to ensure that counterparties meet Equinox minimum credit requirements, the counterparty average rating being no less than an investment grade rating as defined by the rating agencies. Approximately 9% of the Trust’s assets as of September 30, 2007 were deposited with over-the-counter counterparties in order to initiate and maintain Swaps. The amount of the Trust’s assets deposited with counterparties for such purposes will vary from time to time.
The Balanced Series, Campbell/Graham Series and Currency Series strategically invest assets in one or more Swaps linked to certain underlying investments or indices, at the direction of the Managing Owner. The Trading Company in which the assets of these Series will be invested will not own any of the investments or indices referenced by any Swap entered into by these Series. In addition, the swap counterparty to the Trading Company of these Series is not a Trading Advisor to these Series.
The Long Only Commodity Series, through the Trading Company in which the assets of the Long Only Commodity Series have been allocated, have entered into various Swaps with one or more swap counterparties. The Swaps enable the Long Only Commodity Series to earn returns similar to returns (less the fees and expenses of the Long Only Commodities Series, including the expenses associated with the Swaps) of the Reuters/Jefferies CRB Index, or the RJ/CRB Index, and the Jefferies Commodity Performance Index, or the JCPI. Specifically, the Trading Company, which will hold the assets allocable to the Long Only Commodity Series, will enter into Swaps linked to the RJ/CRB Index and the JCPI at the direction of the Managing Owner.
The Trust has invested in the following total return Swaps as of September 30, 2007:
| Renaissance Institutional Equities Fund International LP, Series B |
Campbell Fund, | FX Concepts Global Currency Program | Reuters/Jefferies CRB Index | Jefferies Commodity Performance Index | ||||||||||||||||
| Campbell/ | ||||||||||||||||||||
Series: | Balanced | Graham | Currency | Long Only | Long Only | |||||||||||||||
Notional Amount | $ | 28,000,000 | $ | 15,000,000 | $ | 11,200,000 | $ | 2,500,000 | $ | 2,500,000 | ||||||||||
Termination Date | June 1, 2010 | October 9, 2009 | January 31, 2008 | February 28, 2008 | February 28, 2008 | |||||||||||||||
Counterparty Fee - % annualized | 0.5 | % | 0.2 | % | 0.05 | % | 0.5 | % | 1.0 | % | ||||||||||
Realized Gain / (Loss) | $ | — | $ | 1,674,698 | $ | 463,255 | $ | 703,601 | $ | 662,690 | ||||||||||
Unrealized Gain / (Loss) | ($ | 1,556,205 | ) | ($ | 3,018,474 | ) | ||||||||||||||
Fair Value 09/30/2007 | $ | 26,443,795 | $ | 15,288,161 | $ | 1,301,609 | $ | 907,918 | $ | 915,200 | ||||||||||
3.4. Investments in Unconsolidated Trading Companies
The following table summarizes the Balanced Series, Winton Series, Campbell/Graham Series, Dunn Series, Graham Series and Managed Futures Index Series investments in unconsolidated trading companies as of JuneSeptember 30, 2007, and December 31, 2006. These investments represent cash and open trade equity invested in the trading companies by the Series and cumulative trading profits or losses allocated to the Series by the trading companies. Trading companies allocate trading profits or losses on the basis of the proportion of each Series’ capital allocated for trading to each respective trading company, including both cash and notional funds, which bears no relationship to the amount of cash invested by the Series in the trading company.
| As of June 30, 2007 | As of December 31, 2006 | |||||||||||||
| Trading Company | Percentage of Series Net Assets Invested in Trading Co. | Fair Value | Percentage of Series Net Assets Invested in Trading Co. | Fair Value | ||||||||||
Balanced Series— | ||||||||||||||
Frontier Trading Company VII, LLC | 0.59 | % | $ | 1,947,166 | 0.02 | % | $ | 78,056 | ||||||
Winton Series— | ||||||||||||||
Frontier Trading Company II, LLC | 11.44 | % | $ | 2,886,678 | 54.93 | % | $ | 355,763 | ||||||
Campbell/Graham Series | ||||||||||||||
Frontier Trading Company VI, LLC | 41.77 | % | $ | 32,974,839 | 70.82 | % | $ | 50,785,796 | ||||||
Dunn Series - | ||||||||||||||
Frontier Trading Company IV, LLC | N/M | (1) | $ | (90,974 | ) | N/M | (1) | $ | (120,051 | ) | ||||
Graham Series - | ||||||||||||||
Frontier Trading Company V, LLC | 62.76 | % | $ | 4,578,138 | 89.87 | % | $ | 7,226,062 | ||||||
Managed Futures Index Series- | ||||||||||||||
Frontier Trading Company IX, LLC | 78.27 | % | $ | 560,276 | — | $ | — | |||||||
| As of September 30, 2007 | As of December 31, 2006 | |||||||||||||
Trading Company | Percentage of Series Net Assets Invested in Trading Co. | Fair Value | Percentage of Series Net Assets Invested in Trading Co. | Fair Value | ||||||||||
Balanced Series- | ||||||||||||||
Frontier Trading Company VII, LLC | 0.02 | % | $ | 41,874 | N/M | (1) | ($ | 78,056 | ) | |||||
Winton Series - | ||||||||||||||
Frontier Trading Company II, LLC | 8.31 | % | $ | 2,899,910 | 54.93 | % | $ | 355,763 | ||||||
Campbell/Graham Series | ||||||||||||||
Frontier Trading Company VI, LLC | 44.17 | % | $ | 26,045,314 | 70.82 | % | $ | 50,785,796 | ||||||
Dunn Series - | ||||||||||||||
Frontier Trading Company IV, LLC | N/M | (1) | ($ | 98,296 | ) | N/M | (1) | ($ | 120,051 | ) | ||||
Graham Series - | ||||||||||||||
Frontier Trading Company V, LLC | 61.12 | % | $ | 4,427,643 | 89.87 | % | $ | 7,226,062 | ||||||
Managed Futures Index Series- | ||||||||||||||
Frontier Trading Company IX, LLC | 82.42 | % | $ | 581,847 | — | $ | — | |||||||
(1). | Not meaningful. (Accumulated negative trading results and fees have exceeded investment) |
The following tables summarize the Balanced Series, Winton Series, Campbell/Graham Series, Dunn Series, Graham Series and Managed Futures Index Series equity in earnings from trading companies for the sixnine months ended JuneSeptember 30, 2007, and 2006.
| Six Months Ended June 30, 2007 | Six Months Ended June 30, 2006 | |||||||||||||||||||||||||||||
| Trading Company | Trading Commissions | Realized Gain (Loss) | Change in Unrealized Gain (Loss) | Net Income (Loss) | Trading Commissions | Realized Loss | Change in Unrealized Gain (Loss) | Net Income (Loss) | ||||||||||||||||||||||
Balanced Series– Frontier Trading Company III, LLC Frontier Trading Company VII, LLC | $ | — (208,211 | ) | $ | — 952,137 | $ | — (2,561,555 | ) | $ | — (1,817,629 | ) |
| — — |
| $
| 24,411 — |
| ($
| 2,122 — | )
| $
| 22,289 — | ||||||||
| $ | (208,211 | ) | $ | 952,137 | $ | (2,561,555 | ) | $ | (1,817,629 | ) | $ | 24,411 | $ | (2,122 | ) | $ | 22,289 | |||||||||||||
Winton Series - Frontier Trading Company II, LLC | $ | (32,659 | ) | $ | 1,875,080 | $ | (431,507 | ) | $ | 1,410,914 | $ | (16,152 | ) | $ | 1,015,859 | ($ | 624,243 | ) | $ | 375,464 | ||||||||||
Campbell/Graham Frontier Trading Company VI, LLC | $ | (139,281 | ) | $ | 7,591,885 | $ | (895,808 | ) | $ | 6,556,796 | $ | (107,218 | ) | $ | (463,162 | ) | $ | 603,284 | $ | 32,904 | ||||||||||
Dunn Series - Frontier Trading Company IV, LLC | $ | (539 | ) | $ | 174 | $ | (5,549 | ) | $ | (5,914 | ) | $ | (1,161 | ) | $ | (20,862 | ) | $ | 25,977 | $ | 3,954 | |||||||||
Graham Series - Frontier Trading Company V, LLC | $ | (26,920 | ) | $ | 1,492,963 | $ | (242,513 | ) | $ | 1,223,530 | $ | (40,685 | ) | $ | 234,173 | $ | 55,424 | $ | 248,912 | |||||||||||
Managed Futures Index Series - Frontier Trading Company IX, LLC | $ | (708 | ) | $ | 45,827 | $ | 28,254 | $ | 73,373 | — | — | — | — | |||||||||||||||||
| Nine Months Ended September 30, 2007 | Nine Months Ended September 30, 2006 | |||||||||||||||||||||||||||||||
Trading Company | Trading Commissions | Realized Gain (Loss) | Change in Unrealized Gain (Loss) | Net Income (Loss) | Trading Commissions | Realized Loss | Change in Unrealized Gain (Loss) | Net Income (Loss) | ||||||||||||||||||||||||
Balanced Series – | ||||||||||||||||||||||||||||||||
Frontier Trading Company III, LLC | — | — | — | — | — | $ | 24,411 | ($ | 2,122 | ) | $ | 22,289 | ||||||||||||||||||||
Frontier Trading Company VII, LLC | ($ | 496,490 | ) | $ | 5,823,159 | ($ | 9,418,448 | ) | ($ | 4,091,779 | ) | — | — | — | — | |||||||||||||||||
| ($ | 496,490 | ) | $ | 5,823,159 | ($ | 9,418,448 | ) | ($ | 4,091,779 | ) | $ | 24,411 | ($ | 2,122 | ) | $ | 22,289 | |||||||||||||||
Winton Series - | ||||||||||||||||||||||||||||||||
Frontier Trading Company II, LLC | ($ | 61,707 | ) | $ | 1,691,719 | $ | 1,330,139 | $ | 2,960,151 | ($ | 16,229 | ) | $ | 1,012,474 | ($ | 620,245 | ) | $ | 376,000 | |||||||||||||
Campbell/Graham Series - | ||||||||||||||||||||||||||||||||
Frontier Trading Company VI, LLC | ($ | 167,556 | ) | $ | 2,994,110 | ($ | 2,624,755 | ) | $ | 201,799 | ($ | 156,039 | ) | ($ | 2,476,487 | ) | $ | 372,141 | ($ | 2,260,385 | ) | |||||||||||
Dunn Series - | ||||||||||||||||||||||||||||||||
Frontier Trading Company IV, LLC | ($ | 628 | ) | ($ | 26,601 | ) | ($ | 4,716 | ) | ($ | 31,945 | ) | ($ | 1,570 | ) | ($ | 46,746 | ) | $ | 33,824 | ($ | 14,492 | ) | |||||||||
Graham Series - | ||||||||||||||||||||||||||||||||
Frontier Trading Company V, LLC | ($ | 33,119 | ) | $ | 1,095,986 | ($ | 2,880 | ) | $ | 1,059,987 | ($ | 72,604 | ) | ($ | 944,627 | ) | $ | 201,942 | ($ | 815,289 | ) | |||||||||||
Managed Futures Index Series - | ||||||||||||||||||||||||||||||||
Frontier Trading Company IX, LLC | ($ | 1,708 | ) | $ | 29,861 | $ | 46,188 | $ | 74,341 | — | — | — | — | |||||||||||||||||||
The following tables summarize the Balanced Series, Winton Series, Campbell/Graham Series, Dunn Series, Graham Series and Managed Futures Index Series equity in earnings from trading companies for the three months ended JuneSeptember 30, 2007, and 2006.
| Three Months Ended June 30, 2007 | Three Months Ended June 30, 2006 | ||||||||||||||||||||||||||||||
| Trading Company | Trading Commissions | Realized Gain (Loss) | Change in Unrealized Gain (Loss) | Net Income (Loss) | Trading Commissions | Realized Loss | Change in Unrealized Gain (Loss) | Net Income (Loss) | |||||||||||||||||||||||
Balanced Series – Frontier Trading Company III, LLC Frontier Trading Company VII, LLC | ($ | — 143,885 | ) | $ | — 639,201 | ($ | — 1,199,182 | ) | ($ | — 703,866 | ) |
| — — |
|
| — — |
|
| — — |
|
| — — |
| ||||||||
| ($ | 143,885 | ) | $ | 639,201 | ($ | 1,199,182 | ) | ($ | 703,866 | ) | — | — | — | — | |||||||||||||||||
Winton Series - Frontier Trading Company II, LLC | ($ | 23,896 | ) | $ | 2,280,722 | ($ | 254,568 | ) | $ | 2,002,258 | ($ | 11 | ) | $ | 358,,428 | ($ | 348,831 | ) | $ | 9,586 | |||||||||||
Campbell/Graham Series - Frontier Trading Company VI, LLC | ($ | 74,984 | ) | $ | 10,629,086 | $ | 1,372,823 | $ | 11,926,925 | ($ | 97,539 | ) | ($ | 294,127 | ) | ($ | 539,874 | ) | (931,540 | ) | |||||||||||
Dunn Series - Frontier Trading Company IV, LLC | ($ | 226 | ) | $ | 15,488 | $ | 4,404 | $ | 19,666 | ($ | 550 | ) | ($ | 362 | ) | $ | 6,816 | $ | 5,904 | ||||||||||||
Graham Series - Frontier Trading Company V, LLC | ($ | 12,016 | ) | $ | 1,804,293 | $ | 70,964 | $ | 1,863,241 | ($ | 24,274 | ) | $ | 212,099 | ($ | 126,470 | ) | $ | 61,355 | ||||||||||||
Managed Futures Index Series - Frontier Trading Company IX, LLC | ($ | 708 | ) | $ | 45,827 | $ | 28,254 | $ | 73,373 | — | — | — | — | ||||||||||||||||||
| Three Months Ended September 30, 2007 | Three Months Ended September 30, 2006 | |||||||||||||||||||||||||||||||
Trading Company | Trading Commissions | Realized Gain (Loss) | Change in Unrealized Gain (Loss) | Net Income (Loss) | Trading Commissions | Realized Loss | Change in Unrealized Gain (Loss) | Net Income (Loss) | ||||||||||||||||||||||||
Balanced Series – | ||||||||||||||||||||||||||||||||
Frontier Trading Company III, LLC | — | — | — | — | — | — | — | — | ||||||||||||||||||||||||
Frontier Trading Company VII, LLC | ($ | 288,279 | ) | $ | 4,871,022 | ($ | 6,856,893 | ) | ($ | 2,274,150 | ) | — | — | — | — | |||||||||||||||||
| ($ | 288,279 | ) | $ | 4,871,022 | ($ | 6,856,893 | ) | ($ | 2,274,150 | ) | — | — | — | — | ||||||||||||||||||
Winton Series - | ||||||||||||||||||||||||||||||||
Frontier Trading Company II, LLC | ($ | 29,048 | ) | ($ | 183,361 | ) | $ | 1,761,646 | $ | 1,549,237 | ($ | 77 | ) | ($ | 3,385 | ) | $ | 3,998 | $ | 536 | ||||||||||||
Campbell/Graham Series - | ||||||||||||||||||||||||||||||||
Frontier Trading Company VI, LLC | ($ | 28,275 | ) | ($ | 4,597,775 | ) | ($ | 1,728,947 | ) | ($ | 6,354,997 | ) | ($ | 48,821 | ) | ($ | 2,013,325 | ) | ($ | 231,143 | ) | ($ | 2,293,289 | ) | ||||||||
Dunn Series - | ||||||||||||||||||||||||||||||||
Frontier Trading Company IV, LLC | ($ | 89 | ) | ($ | 26,775 | ) | $ | 833 | ($ | 26,031 | ) | ($ | 409 | ) | ($ | 25,884 | ) | $ | 7,847 | ($ | 18,446 | ) | ||||||||||
Graham Series - | ||||||||||||||||||||||||||||||||
Frontier Trading Company V, LLC | ($ | 6,199 | ) | ($ | 396,977 | ) | $ | 239,633 | ($ | 163,543 | ) | ($ | 31,919 | ) | ($ | 1,178,800 | ) | $ | 146,518 | ($ | 1,064,201 | ) | ||||||||||
Managed Futures Index Series - | ||||||||||||||||||||||||||||||||
Frontier Trading Company IX, LLC | ($ | 1,000 | ) | ($ | 15,966 | ) | $ | 17,934 | $ | 968 | — | — | — | — | ||||||||||||||||||
The statements of financial condition as of JuneSeptember 30, 2007, and December 31, 2006, for the unconsolidated trading companies are as follows:
| Statements of Financial Condition – June 30, 2007 | Frontier Trading Company II, LLC | Frontier Trading Company IV, LLC | Frontier Trading Company V, LLC | Frontier Trading Company VI, LLC | Frontier Trading Company LLC | |||||||||||||||||||||||||
Statements of Financial Condition – September 30, 2007 | Frontier Trading Company II, LLC | Frontier Trading Company IV, LLC | Frontier Trading Company V, LLC | Frontier Trading Company VI, LLC | Frontier Trading Company IX, LLC | |||||||||||||||||||||||||
Cash held at futures commodities merchants | $ | 8,187,863 | $ | 1,965,055 | $ | 15,170,254 | $ | 16,926,702 | $ | 2,118,934 | $ | 4,987,226 | $ | 988,482 | $ | 10,412,352 | $ | 10,021,254 | $ | 1,730,700 | ||||||||||
Open trade equity | 1,880,653 | 299,461 | 803,296 | 6,116,946 | 154,950 | 6,975,118 | 786,230 | 1,219,933 | 2,991,056 | 426,550 | ||||||||||||||||||||
Swap contracts | — | — | — | 18,059,825 | — | |||||||||||||||||||||||||
Swaps | — | — | — | 15,288,161 | — | |||||||||||||||||||||||||
Total Assets | $ | 10,068,516 | $ | 2,264,516 | $ | 15,973,550 | $ | 41,103,473 | $ | 2,273,884 | $ | 11,962,344 | $ | 1,774,712 | $ | 11,632,285 | $ | 28,300,471 | $ | 2,157,250 | ||||||||||
Members’ equity | $ | 10,068,516 | $ | 2,264,516 | $ | 15,973,550 | $ | 41,103,473 | $ | 2,273,884 | $ | 11,962,344 | $ | 1,774,712 | $ | 11,632,285 | $ | 28,300,471 | $ | 2,157,250 | ||||||||||
| Statements of Financial Condition – December 31, 2006 | Frontier II, LLC | Frontier IV, LLC | Frontier Company V, LLC | Frontier Company VI, LLC | Frontier II, LLC | Frontier IV, LLC | Frontier Company V, LLC | Frontier Company VI, LLC | ||||||||||||||||
Cash held at futures commodities merchants | $ | 7,018,159 | $ | 1,284,925 | $ | 13,938,010 | $ | 16,383,004 | $ | 7,018,159 | $ | 1,284,925 | $ | 13,938,010 | $ | 16,383,004 | ||||||||
Open trade equity | 1,422,913 | 235,235 | 1,576,367 | 4,882,655 | 1,422,913 | 235,235 | 1,576,367 | 4,882,655 | ||||||||||||||||
Swap contracts | — | — | — | 34,603,385 | ||||||||||||||||||||
Swaps | — | — | — | 34,603,385 | ||||||||||||||||||||
Total Assets | $ | 8,441,072 | $ | 1,520,160 | $ | 15,514,377 | $ | 55,869,044 | $ | 8,441,072 | $ | 1,520,160 | $ | 15,514,377 | $ | 55,869,044 | ||||||||
Members’ equity | $ | 8,441,072 | $ | 1,520,160 | $ | 15,514,377 | $ | 55,869,044 | $ | 8,441,072 | $ | 1,520,160 | $ | 15,514,377 | $ | 55,869,044 | ||||||||
The statements of income for the sixnine and three months ended JuneSeptember 30, 2007, for the unconsolidated trading companies are as follows:
| Statements of Income – For the Six Months Ended June 30, 2007 | Frontier II, LLC | Frontier Trading Company IV, LLC | Frontier Trading Company V, LLC | Frontier Trading Company VI, LLC | Frontier Trading Company IX, LLC | |||||||||||||||||||||||||||||||||
Statements of Income – For the Nine Months Ended September 30, | Frontier II, LLC | Frontier Trading Company IV, LLC | Frontier Trading Company V, LLC | Frontier Trading Company VI, LLC | Frontier Trading Company IX, LLC | |||||||||||||||||||||||||||||||||
Interest income | $ | 201,813 | $ | 35,424 | $ | 309,345 | $ | 438,713 | $ | 45,536 | $ | 309,031 | $ | 54,272 | $ | 528,080 | $ | 672,161 | $ | 70,630 | ||||||||||||||||||
Net realized gain (loss) on investments, less commissions | 6,416,003 | (29,241 | ) | 6,727,614 | 10,429,187 | 399,255 | 5,703,588 | (2,012,689 | ) | 5,003,689 | (8,456,839 | ) | 117,416 | |||||||||||||||||||||||||
Change in open trade equity | 457,770 | 64,232 | (773,139 | ) | 1,234,198 | (274,055 | ) | 5,891,285 | 551,028 | (356,447 | ) | (1,891,896 | ) | (2,477 | ) | |||||||||||||||||||||||
Net income (loss) | $ | 7,075,586 | ,$ | 70,415 | $ | 6,263,820 | ,$ | 12,102,098 | $ | 170,736 | $ | 11,903,904 | ($ | 1,407,389 | ) | $ | 5,175,322 | ($ | 9,676,574 | ) | $ | 185,569 | ||||||||||||||||
| Statements of Income – For the Three Months Ended June 30, 2007 | Frontier II, LLC | Frontier IV, LLC | Frontier Trading Company V, LLC | Frontier VI, LLC | Frontier Company IX, LLC | |||||||||||||||||||||||||||||||||
Statements of Income – For the Three Months Ended September 30, | Frontier II, LLC | Frontier Trading Company IV, LLC | Frontier Trading Company V, LLC | Frontier VI, LLC | Frontier Trading Company IX, LLC | |||||||||||||||||||||||||||||||||
Interest income | $ | 89,483 | $ | 16,517 | $ | 137,491 | $ | 218,376 | $ | 20,224 | $ | 107,217 | $ | 18,848 | $ | 218,735 | $ | 233,448 | $ | 25,094 | ||||||||||||||||||
Net realized gain (loss) on investments, less commissions | 8,807,624 | 728,443 | 9,326,599 | 12,731,708 | 746,570 | (712,415 | ) | (1,983,448 | ) | (1,723,925 | ) | (18,886,025 | ) | (281,839 | ) | |||||||||||||||||||||||
Change in open trade equity | 753,251 | 289,589 | 389,920 | 4,639,565 | 81,957 | 5,433,516 | 486,796 | 416,692 | (3,126,094 | ) | 271,578 | |||||||||||||||||||||||||||
| �� | ||||||||||||||||||||||||||||||||||||||
Net income (loss) | $ | 9,650,358 | $ | 1,034,549 | $ | 9,854,010 | $ | 17,589,649 | $ | 848,751 | $ | 4,828,318 | ($ | 1,477,804 | ) | ($ | 1,088,498 | ) | ($ | 21,778,671 | ) | $ | 14,833 | |||||||||||||||
4.5. Transactions with Affiliates
Equinox Fund Management LLC contributes funds to the Trust in order to have a 1% interest in the aggregate capital, profits and losses of all Series and in return will receive units designated as general units in the Series in which the Managing Owner invests such funds. The general units may only be purchased by the Managing Owner and may be subject to no advisory fees or advisory fees at reduced rates. Otherwise, the general units hold the same rights as the limited units. The Managing Owner is required to maintain at least a 1% interest (“Minimum Purchase Commitment”) in the aggregate capital, profits and losses of all Series so long as it is acting as the Managing Owner of the Trust. Such contribution was made by the Managing Owner before trading commenced for the Trust and will be maintained throughout the existence of the Trust, and the Managing Owner will make such purchases as are necessary to effect this requirement. Additionally, during 2006, the Managing Owner agreed with certain regulatory bodies to maintain a 1% interest specifically in the Balanced Series Class 1a Units and Balanced Series Class 2a
Units, aggregated, and each of the Long Only Commodity Series, Long/Short Commodity Series and Managed Futures Index Series. The 1% interest in these specific Series is included in computing the Minimum Purchase Commitment in aggregate capital. In addition to the General Units the Managing Owner receives in respect of its Minimum Purchase Commitment, the Managing Owner may purchase Limited Units in any Series as a Limited Owner. All Units purchased by the Managing Owner are held for investment purposes only and not for resale.
On March 29, 2007, the Managing Owner invested $30,000 in the Balanced Series, Class 2a, $100,000 in the Long Only Commodity Series, Class 2, $30,000 in the Long/Short Commodity Series, Class 2 and $410,000 in the Winton Series, Class 2. On April 30, 2007, the Managing Owner invested $30,000 in the Managed Futures Index Series, Class 2. On June 27, 2007, the Managing Owner invested $80,000 in the Long/Short Commodity Series, Class 2. On this same date, the Managing Owner exchanged $1.0 million from the Campbell/Graham Series, Class 2 for an identical amount in the Currency Series, Class 2, $1.0 million from Campbell/Graham Series, Class 2 for an identical amount in the Balanced Series, Class 2 and $400,000 from the Graham Series, Class 2 for an identical amount in the Balanced Series, Class 2.The2. The Managing Owner may make purchases or redemptions at any time on the same terms as any Limited Owner.
On March 29, 2007, Richard E. Bornhoft, Chairman and Chief Investment Officer of the Managing Owner, exchanged $12,658 from the Dunn Series, Class 2 and $2,594 from the Graham Series, Class 2 for the same class of units in the Long Only Commodity Series. On June 1, 2007, Mr. Bornhoft invested $2,630 in the Long Only Commodity Series, Class 2. Mr. Bornhoft may make purchases or redemptions at any time on the same terms as any Limited Owner. No other principal of the Managing Owner or affiliates own any beneficial interest in the Trust but are allowed to do so.
The Balanced Series, in order to make investments in the Campbell/Graham Series, Currency Series, Graham Series, Long Only Commodity Series, Long/Short Commodity Series and Managed Futures Index Series, advances funds to such Series, for the purpose of investing in the respective Trading Company or Trading Companies for such Series on behalf of the Balanced Series. The Balanced Series and investee Series reflect the changes in values of these investments as “Net change in inter-series receivables/payables” in the Statement of Operations. The Balanced Series is subject to the same allocations of income and fees as the Limited Owners of such Series. As a result of fees charged by the investee Series, fees are not charged by the Balanced Series on the capital allocated to investments in affiliated Series, and the Managing Owner monitors such allocations so that aggregate fees of the investee Series on the Balanced Series investments do not exceed the allowable fees of the Balanced Series as provided in the Trust’s Prospectus.
The following table summarizes the Balanced Series advances to and reductions from other Series of the Trust for the three month and six month periods ending JuneSeptember 30, 2007.
Three Months Ending JuneSeptember 30, 2007
Name of Series | Amount of Investment April 1, 2007 | Additions During Period | Reductions During Period | Amount of Investment June 30, 2007 | Earnings in Investments in Inter-Series Receivables Net P/L for the Period | Amount of Dividends or Interest | Value June 30, 2007 | |||||||||||||||
Campbell/Graham Series | $ | 0 | $ | 0 | $ | 0 | $ | 0 | $ | 0 | $ | 0 | $ | 0 | ||||||||
Currency Series | $ | 10,260,627 | $ | 0 | $ | 3,550,000 | $ | 6,710,627 | $ | 403,954 | $ | 0 | $ | 7,114,581 | ||||||||
Graham Series | $ | 0 | $ | 0 | $ | 0 | $ | 0 | $ | 0 | $ | 0 | $ | 0 | ||||||||
Long Only Commodity Series | $ | 29,518,423 | $ | 0 | $ | 23,400,000 | $ | 6,118,423 | $ | (566,773 | ) | $ | 0 | $ | 5,551,650 | |||||||
Managed Futures Index Series | $ | 9,197,849 | $ | 0 | $ | 9,340,911 | -$ | 143,062 | $ | 143,062 | $ | 0 | $ | 0 | ||||||||
| $ | 12,685,988 | $ | (19,757 | ) | $ | 0 | $ | 12,666,231 | ||||||||||||||
Six Months Ending June 30, 2007
Name of Series | Amount of Investment July 1, 2007 | Additions During Period | Reductions During Period | Amount of Investment September 30, 2007 | Earnings in Investments in Inter-Series Receivables Net P/L for the Period | Amount of Dividends or Interest | Value September 30, 2007 | ||||||||||||||||||||||||||||||||||||||
Currency Series | $ | 7,114,582 | $ | 0 | $ | 2,400,000 | 4,714,582 | (87,947 | ) | — | 4,626,635 | ||||||||||||||||||||||||||||||||||
Long Only Commodity Series | $ | 5,551,650 | $ | 0 | $ | 5,906,053 | (354,403 | ) | 354,403 | — | — | ||||||||||||||||||||||||||||||||||
| $ | 4,360,179 | $ | 266,456 | $ | 0 | $ | 4,626,635 | ||||||||||||||||||||||||||||||||||||||
Nine Months Ending September 30, 2007
|
Nine Months Ending September 30, 2007
| ||||||||||||||||||||||||||||||||||||||||||||
Name of Series | Amount of Investment January 1, 2007 | Additions During Period | Reductions During Period | Amount of Investment June 30, 2007 | Earnings in Investments in Inter-Series Receivables Net P/L for the Period | Amount of Dividends or Interest | Value June 30, 2007 | Amount of Investment January 1, 2007 | Additions During Period | Reductions During Period | Amount of Investment September 30, 2007 | Earnings in Investments in Inter-Series Receivables Net P/L for the Period | Amount of Dividends or Interest | Value September 30, 2007 | |||||||||||||||||||||||||||||||
Campbell/Graham Series | $ | 26,972,529 | $ | 0 | $ | 26,646,729 | $ | 325,800 | $ | (325,800 | ) | $ | 0 | $ | 0 | $ | 26,972,529 | $ | 0 | $ | 26,646,729 | 325,800 | (325,800 | ) | — | — | |||||||||||||||||||
Currency Series | $ | 10,697,187 | $ | 0 | $ | 3,950,000 | $ | 6,747,187 | $ | 367,394 | $ | 0 | $ | 7,114,581 | $ | 10,697,188 | $ | 0 | $ | 6,350,000 | 4,347,188 | 279,447 | — | 4,626,635 | |||||||||||||||||||||
Graham Series | $ | 12,012,370 | $ | 0 | $ | 12,088,510 | -$ | 76,140 | $ | 76,140 | $ | 0 | $ | 0 | $ | 12,012,370 | $ | 0 | $ | 12,088,510 | (76,140 | ) | 76,140 | — | — | ||||||||||||||||||||
Long Only Commodity Series | $ | 5,522,034 | $ | 25,000,000 | $ | 25,800,000 | $ | 4,722,034 | $ | 829,616 | $ | 0 | $ | 5,551,650 | $ | 5,522,034 | $ | 25,000,000 | $ | 31,706,053 | (1,184,019 | ) | 1,184,019 | — | — | ||||||||||||||||||||
Managed Futures Index Series | $ | 9,831,769 | $ | 0 | $ | 9,340,911 | $ | 490,858 | $ | (490,858 | ) | $ | 0 | $ | 0 | $ | 9,831,769 | $ | 0 | $ | 9,340,911 | 490,858 | (490,858 | ) | — | — | |||||||||||||||||||
| $ | 12,209,739 | $ | 456,492 | $ | 0 | $ | 12,666,231 | $ | 3,903,687 | $ | 722,948 | $ | 0 | $ | 4,626,635 | ||||||||||||||||||||||||||||||
Each Series of Units pays to the Managing Owner a monthly management fee equal to a certain percentage of such Series’ assets, calculated on a daily basis. The annual rate of the management fee is 0.5% for the Balanced Series,
2.0% for the Winton Series, Currency Series, Long Only Commodity Series and the Managed Futures Index Series, 2.5% for the Graham Series and Campbell/Graham Series, and 3.5% for the Long/Short Commodity Series. There is no management fee for the Dunn Series. The Managing Owner may pay all or a portion of such management fees to the Trading Advisor(s) for such Series.
Each Series pays to the Managing Owner a monthly trading fee (FCM Fee) equal to 1/12th of 0.50% of such Series’ Net Asset Value, calculated daily.
Some Series pay to the Managing Owner an incentive fee of a certain percentage of new net trading profits generated by such Series, monthly or quarterly. Because the Balanced Series and Long/Short Commodity Series each employ multiple Trading Advisors, these Series will pay the Managing Owner a monthly incentive fee calculated on a Trading Advisor by Trading Advisor basis. It is therefore possible that in any given period the Balanced Series or the Long/Short Commodity Series may pay incentive fees to the Managing Owner for one or more Trading Advisors while each of these Series as a whole experiences losses. The incentive fee is 25% for the Balanced and Dunn Series and 20% for the Winton, Currency, Graham, Campbell/Graham Series and Long/Short Commodity Series. There is no incentive fee for the Long Only Commodity Series or the Managed Futures Index Series. The Managing Owner may pay all or a portion of such incentive fees to the Trading Advisor(s) for such Series.
In addition, with respect to Class 1 of each Series, the Series pays monthly to the Managing Owner a service fee at an annualized rate of up to 3.0% (2% for the Long Only Commodity Series and Managed Futures Index Series), which the Managing Owner pays to selling agents of the Trust.
The following table summarizes fees incurred to the Managing Owner for the three months ended JuneSeptember 30, 20072007.
Series: | Management Fee | Trading (FCM) Fee | Incentive Fee | Service Fee | ||||||||
Balanced | $ | 346,784 | $ | 366,640 | $ | 3,248,851 | $ | 1,792,641 | ||||
Winton | 84,474 | 21,079 | 228,956 | 78,666 | ||||||||
Campbell/Graham | 352,456 | 91,123 | 985,655 | 391,345 | ||||||||
Currency | 24,171 | 22,848 | — | 57,634 | ||||||||
Dunn | — | 69 | — | 681 | ||||||||
Graham | 64,719 | 10,098 | 144,237 | 38,611 | ||||||||
Long Only Commodity | 79,544 | 31,992 | — | 21,286 | ||||||||
Long/Short Commodity | 229,884 | 33,411 | 90,202 | 193,922 | ||||||||
Managed Futures Index | 28,285 | 7,069 | — | 2,915 | ||||||||
Series: Balanced Winton Campbell/Graham Currency Dunn Graham Long Only Commodity Long/Short Commodity Managed Futures Index Management Fee Trading (FCM) Fee Incentive Fee Service Fee $ 429,968 $ 409,768 $ 2,397,504 $ 1,705,256 146,893 36,723 234,690 149,249 327,658 87,394 (16,407 ) 403,432 26,435 23,108 — 69,213 — �� 123 — 524 32,102 9,267 4,086 40,108 32,180 12,759 — 21,674 269,265 38,190 331,234 221,818 3,514 878 — 3,027
The following table summarizes fees incurred to the Managing Owner for the sixnine months ended JuneSeptember 30, 20072007.
Series: | Management Fee | Trading (FCM) Fee | Incentive Fee | Service Fee | Management Fee | Trading (FCM) Fee | Incentive Fee | Service Fee | ||||||||||||||||
Balanced | $ | 649,660 | $ | 687,741 | $ | 4,739,785 | $ | 3,518,422 | $ | 1,079,628 | $ | 1,097,509 | $ | 7,137,289 | $ | 5,223,678 | ||||||||
Winton | 99,435 | 24,817 | 228,956 | 98,358 | 246,328 | 61,540 | 463,646 | 247,607 | ||||||||||||||||
Campbell/Graham | 663,205 | 183,989 | 1,018,749 | 755,574 | 990,863 | 271,383 | 1,002,342 | 1,159,006 | ||||||||||||||||
Currency | 53,589 | 48,078 | — | 110,403 | 80,024 | 71,186 | — | 179,616 | ||||||||||||||||
Dunn | — | 378 | — | 1,545 | — | 501 | — | 2,069 | ||||||||||||||||
Graham | 137,774 | 24,370 | 144,237 | 78,689 | 169,876 | 33,637 | 148,323 | 118,797 | ||||||||||||||||
Long Only Commodity | 123,050 | 49,288 | — | 43,533 | 155,230 | 62,047 | — | 65,207 | ||||||||||||||||
Long/Short Commodity | 450,582 | 58,195 | 202,011 | 343,267 | 719,847 | 96,385 | 533,245 | 565,085 | ||||||||||||||||
Managed Futures Index | 79,367 | 19,703 | — | 5,509 | 82,881 | 20,581 | — | 8,536 | ||||||||||||||||
The following table summarizes fees payable to the Managing Owner as of JuneSeptember 30, 20072007.
Series: | Management Fee | Trading (FCM) Fee | Incentive Fee | Service Fee | Management Fee | Trading (FCM) Fee | Incentive Fee | Service Fee | ||||||||||||||||
Balanced | $ | 117,547 | $ | 128,527 | $ | 1,820,351 | $ | 353,698 | $ | 168,214 | $ | 143,200 | $ | 2,473,922 | $ | 364,519 | ||||||||
Winton | 35,082 | 8,765 | 227,994 | 4,083 | 52,765 | 13,160 | 204,755 | 6,150 | ||||||||||||||||
Campbell/Graham | 124,235 | 32,202 | 1,116,085 | 87,968 | 118,745 | 28,209 | — | 88,033 | ||||||||||||||||
Currency | 8,650 | 7,696 | — | 7,068 | 8,721 | 7,556 | — | 9,038 | ||||||||||||||||
Dunn | — | 54 | — | 235 | — | 27 | — | 135 | ||||||||||||||||
Graham | 18,355 | 3,671 | — | 9,065 | 13,763 | 2,753 | — | 9,241 | ||||||||||||||||
Long Only Commodity | 10,400 | 4,166 | — | 902 | 10,593 | 4,240 | — | 3,282 | ||||||||||||||||
Long/Short Commodity | 82,248 | 11,750 | 87,635 | 21,327 | 89,990 | 12,856 | 313,565 | 36,578 | ||||||||||||||||
Managed Futures Index | 1,165 | 291 | — | 93 | 1,146 | 286 | — | 217 | ||||||||||||||||
With respect to the service fees, the initial service fee (for the first 12 months) relating to a sale of the Units is prepaid to the Managing Owner by each Series, and paid to the selling agents by the Managing Owner in the month following sale. Since the Managing Owner is prepaying the initial service fee for the first year and is being reimbursed therefore by the Series monthly in arrears based upon a corresponding percentage of net asset value, it bears the risk and the upside potential of any difference between the amount of the initial service fee prepaid and the amount of the reimbursement thereof as a result of variations in net asset value. For the sixnine months ended JuneSeptember 30, 2007, due to variations in net asset values, amounts received or receivable from the Managing Owner for the difference in monthly service fees from the prepaid initial service fees was $12,075$31,176 for Balanced Series, $14,240 for Campbell Graham Series, $14,278 for Long Only Commodity Series and $137$311 for Managed Futures Index Series. For the sixnine months ended JuneSeptember 30, 2007, amounts paid or owing the Managing Owner for difference in monthly service fees from prepaid initial service fees were $7,770 for the Balanced Series, $3,807$7,767 for Currency Series, $13$9 for Dunn Series, $2,610$4,431 for Graham Series, $2,712 for Campbell/Graham Series, $37,068$29,757 for Long/Short Commodity Series and $9,097$12,246 for the Winton Series.
Aggregate interest income from all sources, including assets held at clearing brokers, up to 2% (annualized) is paid to the Managing Owner by the Balanced Series (Class 1 and Class 2 only), Winton Series, Campbell/Graham Series, Currency Series, Dunn Series and Graham Series. For the Balanced Series (Class 1a and Class 2a only), Long Only Commodity Series, Long/Short Commodity Series and Managed Futures Index Series, 20% of the total interest allocated to each Series is paid to the Managing Owner. During the sixnine months ended JuneSeptember 30, 2007, the Trust paid $3,460,214$5,287,631 of such interest income to the Managing Owner.
The Managing Owner pays to The Bornhoft Group Corporation, an affiliate of the Trust, a monthly fee of 0.25% (annualized) of the net asset value of the Trust, for services in connection with the daily valuation of each Series and Class. The amount paid under this agreement was $497,155$764,122 for the sixnine months ended JuneSeptember 30, 2007. Additionally, The Bornhoft Group Corporation provides office space to the Managing Owner, prorates office expenses, and advances certain direct expenses on behalf of the Managing Owner. Under this agreement, the Managing Owner reimbursed The Bornhoft Group Corporation $137,030$192,388 for the sixnine months ended JuneSeptember 30, 2007.
Solon Capital, LLC, an affiliate of the Trust, serves as wholesaler of the Trust by marketing to broker/dealer organizations. For these services, the Managing Owner paid Solon Capital, LLC, $1,491,465$2,292,367 for the sixnine months ended JuneSeptember 30, 2007.
5.6. Financial Highlights
The following information presents the financial highlights of the Fund for the nine months ended September 30, 2007 and 2006. This data has been derived from information presented in the financial statements.
| Balanced Series | Winton Series | Campbell/Graham Series | ||||||||||||||||||||||||||||||
| Class 1 | Class 1a | Class 2 | Class 2a | Class 1 | Class 2 | Class 1 | Class 2 | |||||||||||||||||||||||||
Per unit operating performance (1) | ||||||||||||||||||||||||||||||||
Net asset value, January 1, 2007 | $ | 106.66 | $ | 95.97 | $ | 114.24 | $ | 97.88 | $ | 105.65 | $ | 106.81 | $ | 96.27 | $ | 101.86 | ||||||||||||||||
Net operating results: | ||||||||||||||||||||||||||||||||
Interest income | 1.96 | 1.70 | 2.12 | 1.71 | 1.66 | 1.86 | 2.01 | 2.28 | ||||||||||||||||||||||||
Expenses | (5.77 | ) | (4.99 | ) | (3.70 | ) | (2.98 | ) | (5.47 | ) | (4.11 | ) | (5.73 | ) | (4.11 | ) | ||||||||||||||||
Net gain/(loss) on investments, net of minority interests | (2.95 | ) | (3.09 | ) | (3.24 | ) | (3.24 | ) | 7.79 | 8.79 | 0.39 | .53 | ||||||||||||||||||||
Net income | (6.76 | ) | (6.38 | ) | (4.82 | ) | (4.51 | ) | 3.98 | 6.54 | (3.33 | ) | (1.30 | ) | ||||||||||||||||||
Net asset value, September 30, 2007 | $ | 99.90 | $ | 89.59 | $ | 109.42 | $ | 93.37 | $ | 109.63 | $ | 113.35 | $ | 92.94 | $ | 100.56 | ||||||||||||||||
Ratios to average net assets (3) | ||||||||||||||||||||||||||||||||
Net investment gain/(loss) | (4.87 | %) | (4.87 | %) | (1.87 | %) | (1.87 | %) | (6.19 | %) | (3.26 | %) | (5.30 | %) | (2.31 | %) | ||||||||||||||||
Expenses before incentive fees | 4.03 | % | 4.03 | % | 1.03 | % | 1.03 | % | 5.31 | % | 2.38 | % | 5.89 | % | 2.89 | % | ||||||||||||||||
Expenses after incentive fees | 7.39 | % | 7.39 | % | 4.39 | % | 4.39 | % | 8.89 | % | 5.96 | % | 8.18 | % | 5.19 | % | ||||||||||||||||
Total return before incentive fees (2) | (4.08 | %) | (4.21 | %) | (2.07 | %) | (2.25 | %) | 14.33 | % | 18.85 | % | (1.60 | %) | 2.82 | % | ||||||||||||||||
Total return after incentive fees (2) | (6.60 | %) | (6.73 | %) | (4.59 | %) | (4.76 | %) | 11.65 | % | 16.17 | % | (3.31 | %) | 1.11 | % | ||||||||||||||||
| Currency Series | Dunn Series | Graham Series | ||||||||||||||||||||||||||||||
| Class 1 | Class 2 | Class 1 | Class 2 | Class 1 | Class 2 | |||||||||||||||||||||||||||
Per unit operating performance (1) | ||||||||||||||||||||||||||||||||
Net asset value, January 1, 2007 | $ | 101.16 | $ | 108.23 | $ | 76.91 | $ | 82.27 | $ | 84.70 | $ | 90.25 | ||||||||||||||||||||
Net operating results: | ||||||||||||||||||||||||||||||||
Interest income | 3.89 | 3.73 | 1.38 | 1.91 | 1.97 | 2.18 | ||||||||||||||||||||||||||
Expenses | (3.85 | ) | (1.61 | ) | (1.99 | ) | (0.50 | ) | (6.23 | ) | (4.73 | ) | ||||||||||||||||||||
Net gain/(loss) on investments, net of minority interests | 2.28 | 2.87 | (21.84 | ) | (24.10 | ) | 12.14 | 13.19 | ||||||||||||||||||||||||
Net income | 2.32 | 4.99 | (22.45 | ) | (22.69 | ) | 7.88 | 10.64 | ||||||||||||||||||||||||
Net asset value, September 30, 2007 | $ | 103.48 | $ | 113.22 | $ | 54.46 | $ | 59.58 | $ | 92.58 | $ | 100.89 | ||||||||||||||||||||
Ratios to average net assets (3) | ||||||||||||||||||||||||||||||||
Net investment gain/(loss) | 0.04 | % | 3.03 | % | (1.13 | %) | 1.90 | % | (6.55 | %) | (3.54 | %) | ||||||||||||||||||||
Expenses before incentive fees | 5.29 | % | 2.30 | % | 3.70 | % | 0.67 | % | 6.81 | % | 3.80 | % | ||||||||||||||||||||
Expenses after incentive fees | 5.29 | % | 2.30 | % | 3.70 | % | 0.67 | % | 9.57 | % | 6.57 | % | ||||||||||||||||||||
Total return before incentive fees (2) | 1.94 | % | 2.00 | % | (32.31 | %) | (39.31 | %) | 10.48 | % | 14.36 | % | ||||||||||||||||||||
Total return after incentive fees (2) | 1.94 | % | 2.00 | % | (32.31 | %) | (39.31 | %) | 8.41 | % | 12.29 | % | ||||||||||||||||||||
| Long Only Series | Long/Short Series | Managed Futures Series | ||||||||||||||||||||||||||||||
| Class 1 | Class 2 | Class 1 | Class 2 | Class 1 | Class 2 | |||||||||||||||||||||||||||
Per unit operating performance (1) | ||||||||||||||||||||||||||||||||
Net asset value, January 1, 2007 | $ | 95.45 | $ | 97.13 | $ | 100.42 | $ | 102.93 | $ | 96.75 | $ | 98.43 | ||||||||||||||||||||
Net operating results: | ||||||||||||||||||||||||||||||||
Interest income | 10.15 | 9.59 | 2.61 | 2.74 | 22.96 | 22.67 | ||||||||||||||||||||||||||
Expenses | (6.14 | ) | (4.42 | ) | (6.65 | ) | (4.77 | ) | (16.47 | ) | (14.88 | ) | ||||||||||||||||||||
Net gain/(loss) on investments, net of minority interests | 3.52 | 4.07 | 3.59 | 3.89 | (6.39 | ) | (6.19 | ) | ||||||||||||||||||||||||
Net income | 7.53 | 9.24 | (0.45 | ) | 1.86 | 0.10 | 1.60 | |||||||||||||||||||||||||
Net asset value, September 30, 2007 | $ | 102.98 | $ | 106.37 | $ | 99.97 | $ | 104.79 | $ | 96.85 | $ | 100.03 | ||||||||||||||||||||
Ratios to average net assets (3) | ||||||||||||||||||||||||||||||||
Net investment gain/(loss) | 5.48 | % | 7.48 | % | (5.69 | )% | (2.72 | %) | 9.28 | % | 11.28 | % | ||||||||||||||||||||
Expenses before incentive fees | 8.40 | % | 6.41 | % | 6.84 | % | 3.87 | % | 23.55 | % | 21.55 | % | ||||||||||||||||||||
Expenses after incentive fees | 8.40 | % | 6.41 | % | 9.37 | % | 6.40 | % | 23.55 | % | 21.55 | % | ||||||||||||||||||||
Total return before incentive fees (2) | 8.13 | % | 9.19 | % | 1.24 | % | 4.17 | % | 1.34 | % | 4.17 | % | ||||||||||||||||||||
Total return after incentive fees (2) | 8.13 | % | 9.19 | % | (0.65 | %) | 2.28 | % | 1.34 | % | 4.17 | % | ||||||||||||||||||||
| (1) | The Long Only Series, Long/Short Series and Managed Futures Series commenced operations on February 24, 2006. Interest income and expenses per unit are calculated by dividing these amounts by the weighted average number of units outstanding during the period. The net gain/(loss) on investments, net of minority interests is a balancing amount necessary to reconcile the change in net asset value per unit with the other per unit information. |
| (2) | Computed using weighted average net assets outstanding during the period. An owner’s total returns may vary from the above returns based on the timing of contributions and withdrawals. Total returns are not annualized. |
| (3) | Annualized. |
Per unit operating performance (1) Net asset value, January 1, 2006 Net operating results: Interest income Expenses Net gain/(loss) on investments, net of minority interests Net income Net asset value, September 30, 2006 Ratios to average net assets (3) Net investment gain/(loss) Expenses before incentive fees Expenses after incentive fees Total return before incentive fees (2) Total return after incentive fees (2) Per unit operating performance (1) Net asset value, January 1, 2006 Net operating results: Interest income Expenses Net gain/(loss) on investments, net of minority interests Net income Net asset value, September 30, 2006 Ratios to average net assets (3) Net investment gain/(loss) Expenses before incentive fees Expenses after incentive fees Total return before incentive fees (2) Total return after incentive fees (2) Per unit operating performance (1) Net asset value, January 1, 2006 Net operating results: Interest income Expenses Net gain/(loss) on investments, net of minority interests Net income Net asset value, September 30, 2006 Ratios to average net assets (3) Net investment gain/(loss) Expenses before incentive fees Expenses after incentive fees Total return before incentive fees (2) Total return after incentive fees (2) Balanced Series Winton Series Campbell/Graham
Series Class 1 Class 1a Class 2 Class 2a Class 1 Class 2 Class 1 Class 2 $ 104.58 $ 100.00 $ 108.73 $ 100.00 $ 100.00 $ 100.00 $ 94.30 $ 96.83 1.56 1.38 1.64 1.40 2.75 2.21 2.00 2.08 (4.43 ) (3.91 ) (2.20 ) (1.87 ) (8.38 ) (5.43 ) (4.83 ) (2.85 ) (0.19 ) (5.98 ) (0.25 ) (6.91 ) 5.95 3.90 (1.74 ) (1.84 ) (3.06 ) (8.51 ) (0.81 ) (7.38 ) 0.32 0.68 (4.57 ) (2.61 ) $ 101.52 $ 91.49 $ 107.92 $ 92.62 $ 100.32 $ 100.68 $ 89.73 $ 94.22 (3.62 %) (6.51 %) (0.67 %) (1.20 %) (4.82 %) (3.41 %) 4.02 %) (1.05 %) 3.68 % 6.61 % 0.73 % 1.31 % 2.45 % 1.04 % 6.24 % 3.26 % 5.60 % 10.05 % 2.64 % 4.74 % 7.17 % 5.76 % 6.87 % 3.90 % (3.32 %) (5.46 %) (1.63 %) (4.95 %) 20.27 % 14.84 % (6.29 %) (4.58 %)) (4.75 %) (6.89 %) (3.07 %) (6.39 %) 16.74 % 11.31 % (6.76 %) (5.05 %) Currency Series Dunn Series Graham Series Class 1 Class 2 Class 1 Class 2 Class 1 Class 2 $ 97.66 $ 101.42 $ 86.83 $ 90.15 $ 82.90 $ 85.73 5.77 6.08 1.54 1.62 2.81 2.94 (5.55 ) (3.59 ) (2.23 ) (0.34 ) (5.25 ) (3.52 ) 1.03 1.08 (7.68 ) (8.13 ) 0.14 0.08 (0.81 ) 1.41 (8.37 ) (6.85 ) (2.30 ) (0.50 ) $ 96.85 $ 102.83 $ 78.46 $ 83.30 $ 80.60 $ 85.23 0.30 % 3.24 % (1.08 %) 1.91 % (3.87 %) (0.89 %) 7.09 % 4.14 % 3.50 % 0.51 % 8.34 % 5.36 % 7.63 % 4.69 % 3.50 % .051 % 8.34 % 5.36 % (1.02 %) 2.31 % (2.52 %) (7.39 %) (2.06 %) (1.62 %) (1.42 %) 1.90 % (2.52 %) (7.39 %) (2.06 %) (1.62 %) Long Only Series Long/Short Series Managed Futures Series Class 1 Class 2 Class 1 Class 2 Class 1 Class 2 $ 100.00 $ 100.00 $ 100.00 $ 100.00 $ 100.00 $ 100.00 13.05 12.21 6.83 5.17 90.60 101.18 (6.89 ) (5.46 ) (10.09 ) (6.08 ) (53.94 ) (59.12 ) (10.33 ) 9.72 ) (1.92 ) (2.60 ) (41.66 ) (45.89 ) (4.17 ) (2.97 ) (5.18 ) (3.51 ) (5.00 ) (3.83 ) $ 95.83 $ 97.03 $ 94.82 $ 96.49 $ 95.00 $ 96.17 8.45 % 12.35 % (4.65 )% (1.64 %) 71.89 % 69.80 % 9.47 % 9.99 % 12.56 % 9.12 % 105.76 % 98.12 % 9.47 % 9.99 % 14.41 % 10.87 % 105.76 % 98.12 % (26.14 %) (15.23 %) (8.61 %) (7.79 %) (14.48 %) (4.74 %) (26.14 %) (15.23 %) (9.65 %) (8.84 %) (14.48 %) (4.74 %)
| (1) | The Long Only Series, Long/Short Series and Managed Futures Series commenced operations on February 24, 2006. The Winton Series commenced operations in May 2006. Interest income and expenses per unit are calculated by dividing these amounts by the weighted average number of units outstanding during the period. The net gain/(loss) on investments, net of minority interests is a balancing amount necessary to reconcile the change in net asset value per unit with the other per unit information. |
| (2) | Computed using weighted average net assets outstanding during the period. An owner’s total returns may vary from the above returns based on the timing of contributions and withdrawals. Total returns are not annualized. |
| (3) | Annualized. |
The following information presents the financial highlights of the Fund for the three months ended September 30, 2007 and 2006. This data has been derived from information presented in the financial statements.
| Balanced Series | Winton Series | Campbell/Graham Series | ||||||||||||||||||||||||||||||
| Class 1 | Class 1a | Class 2 | Class 2a | Class 1 | Class 2 | Class 1 | Class 2 | |||||||||||||||||||||||||
Per unit operating performance (1) | ||||||||||||||||||||||||||||||||
Net asset value, July 1, 2007 | $ | 109.15 | $ | 98.01 | $ | 118.67 | $ | 101.38 | $ | 106.38 | $ | 109.17 | $ | 104.09 | $ | 111.78 | ||||||||||||||||
Net operating results: | ||||||||||||||||||||||||||||||||
Interest income | 0.66 | 0.59 | 0.72 | 0.62 | 0.71 | 0.73 | 0.65 | 0.70 | ||||||||||||||||||||||||
Expenses | (1.93 | ) | (1.73 | ) | (1.28 | ) | (1.09 | ) | (2.24 | ) | (1.51 | ) | (1.36 | ) | (0.69 | ) | ||||||||||||||||
Net gain/(loss) on investments, net of minority interests | (7.98 | ) | (7.28 | ) | (8.69 | ) | (7.54 | ) | 4.78 | 4.96 | (10.44 | ) | (11.23 | ) | ||||||||||||||||||
Net income | (9.25 | ) | (8.42 | ) | (9.25 | ) | (8.01 | ) | 3.25 | 4.18 | (11.15 | ) | (11.22 | ) | ||||||||||||||||||
Net asset value, September 30, 2007 | $ | 99.90 | $ | 89.59 | $ | 109.42 | $ | 93.37 | $ | 109.63 | $ | 113.35 | $ | 92.94 | $ | 100.56 | ||||||||||||||||
Ratios to average net assets (3) | ||||||||||||||||||||||||||||||||
Net investment gain/(loss) | (4.99 | %) | (4.99 | %) | (2.02 | %) | (2.02 | %) | (5.77 | %) | (2.84 | %) | (2.95 | %) | 0.02 | % | ||||||||||||||||
Expenses before incentive fees | 4.17 | % | 4.17 | % | 1.20 | % | 1.20 | % | 5.36 | % | 2.42 | % | 5.74 | % | 2.77 | % | ||||||||||||||||
Expenses after incentive fees | 7.59 | % | 7.59 | % | 4.62 | % | 4.62 | % | 8.45 | % | 5.52 | % | 5.63 | % | 2.66 | % | ||||||||||||||||
Total return before incentive fees (2) | (8.45 | %) | (8.12 | %) | (7.60 | %) | (7.69 | %) | 4.79 | % | 4.57 | % | (11.44 | %) | (10.81 | %) | ||||||||||||||||
Total return after incentive fees (2) | (9.31 | %) | (8.99 | %) | (8.46 | %) | (8.55 | %) | 4.01 | % | 3.79 | % | (11.42 | %) | (10.79 | %) | ||||||||||||||||
| Currency Series | Dunn Series | Graham Series | ||||||||||||||||||||||||||||||
| Class 1 | Class 2 | Class 1 | Class 2 | Class 1 | Class 2 | |||||||||||||||||||||||||||
Per unit operating performance (1) | ||||||||||||||||||||||||||||||||
Net asset value, July 1, 2007 | $ | 105.29 | $ | 114.35 | $ | 77.15 | $ | 83.78 | $ | 95.45 | $ | 103.23 | ||||||||||||||||||||
Net operating results: | ||||||||||||||||||||||||||||||||
Interest income | 1.14 | 1.24 | 0.44 | 0.48 | 0.61 | 0.66 | ||||||||||||||||||||||||||
Expenses | (1.26 | ) | (0.53 | ) | (0.57 | ) | (0.12 | ) | (1.28 | ) | (0.64 | ) | ||||||||||||||||||||
Net gain/(loss) on investments, net of minority interests | (1.69 | ) | (1.84 | ) | (22.56 | ) | (24.56 | ) | (2.20 | ) | (2.36 | ) | ||||||||||||||||||||
Net income | (1.81 | ) | (1.13 | ) | (22.69 | ) | (24.20 | ) | (2.87 | ) | (2.34 | ) | ||||||||||||||||||||
Net asset value, September 30, 2007 | $ | 103.48 | $ | 113.22 | $ | 54.46 | $ | 59.58 | $ | 92.58 | $ | 100.89 | ||||||||||||||||||||
Ratios to average net assets (3) | ||||||||||||||||||||||||||||||||
Net investment gain/(loss) | (0.46 | %) | 2.50 | % | (0.84 | %) | 2.16 | % | (2.89 | %) | 0.08 | % | ||||||||||||||||||||
Expenses before incentive fees | 4.81 | % | 1.85 | % | 3.69 | % | 0.70 | % | 5.29 | % | 2.32 | % | ||||||||||||||||||||
Expenses after incentive fees | 4.81 | % | 1.85 | % | 3.69 | % | 0.70 | % | 5.29 | % | 2.55 | % | ||||||||||||||||||||
Total return before incentive fees (2) | (1.70 | %) | (1.04 | %) | (37.35 | %) | (37.10 | %) | (2.97 | %) | (2.28 | %) | ||||||||||||||||||||
Total return after incentive fees (2) | (1.70 | %) | (1.04 | %) | (37.35 | %) | (37.10 | %) | (3.02 | %) | (2.34 | %) | ||||||||||||||||||||
| Long Only Series | Long/Short Series | Managed Futures Series | ||||||||||||||||||||||||||||||
| Class 1 | Class 2 | Class 1 | Class 2 | Class 1 | Class 2 | |||||||||||||||||||||||||||
Per unit operating performance (1) | ||||||||||||||||||||||||||||||||
Net asset value, July 1, 2007 | $ | 97.28 | $ | 99.99 | $ | 99.98 | $ | 104.02 | $ | 97.39 | $ | 100.08 | ||||||||||||||||||||
Net operating results: | ||||||||||||||||||||||||||||||||
Interest income | 1.98 | 2.04 | 0.88 | 0.92 | 0.68 | 0.70 | ||||||||||||||||||||||||||
Expenses | (1.45 | ) | (0.99 | ) | (2.63 | ) | (1.99 | ) | (1.10 | ) | (0.63 | ) | ||||||||||||||||||||
Net gain/(loss) on investments, net of minority interests | 5.17 | 5.33 | 1.74 | 1.84 | (0.12 | ) | (0.12 | ) | ||||||||||||||||||||||||
Net income | 5.70 | 6.38 | (0.01 | ) | 0.77 | (0.54 | ) | (0.05 | ) | |||||||||||||||||||||||
Net asset value, September 30, 2007 | $ | 102.98 | $ | 106.37 | $ | 99.97 | $ | 104.79 | $ | 96.85 | $ | 100.03 | ||||||||||||||||||||
Ratios to average net assets (3) | ||||||||||||||||||||||||||||||||
Net investment gain/(loss) | 2.14 | % | 4.12 | % | (7.07 | )% | (4.13 | %) | (1.70 | %) | 0.28 | % | ||||||||||||||||||||
Expenses before incentive fees | 5.89 | % | 3.91 | % | 6.63 | % | 3.69 | % | 4.49 | % | 2.51 | % | ||||||||||||||||||||
Expenses after incentive fees | 5.89 | % | 3.91 | % | 10.60 | % | 7.67 | % | 4.49 | % | 2.51 | % | ||||||||||||||||||||
Total return before incentive fees (2) | 5.78 | % | 6.35 | % | 1.05 | % | 2.06 | % | (0.26 | %) | (0.02 | %) | ||||||||||||||||||||
Total return after incentive fees (2) | 5.78 | % | 6.35 | % | 0.05 | % | 1.06 | % | (0.26 | %) | (0.02 | %) | ||||||||||||||||||||
| (1) | The Long Only Series, Long/Short Series and Managed Futures Series commenced operations on February 24, 2006. Interest income and expenses per unit are calculated by dividing these amounts by the weighted average number of units outstanding during the period. The net gain/(loss) on investments, net of minority interests is a balancing amount necessary to reconcile the change in net asset value per unit with the other per unit information. |
| (2) | Computed using weighted average net assets outstanding during the period. An owner’s total returns may vary from the above returns based on the timing of contributions and withdrawals. Total returns are not annualized. |
| (3) | Annualized. |
Per unit operating performance (1) Net asset value, July 1, 2006 Net operating results: Interest income Expenses Net gain/(loss) on investments, net of minority interests Net income Net asset value, September 30, 2006 Ratios to average net assets (3) Net investment gain/(loss) Expenses before incentive fees Expenses after incentive fees Total return before incentive fees (2) Total return after incentive fees (2) Per unit operating performance (1) Net asset value, July 1, 2006 Net operating results: Interest income Expenses Net gain/(loss) on investments, net of minority interests Net income Net asset value, September 30, 2006 Ratios to average net assets (3) Net investment gain/(loss) Expenses before incentive fees Expenses after incentive fees Total return before incentive fees (2) Total return after incentive fees (2) Per unit operating performance (1) Net asset value, July 1, 2007 Net operating results: Interest income Expenses Net gain/(loss) on investments, net of minority interests Net income Net asset value, September 30, 2006 Ratios to average net assets (3) Net investment gain/(loss) Expenses before incentive fees Expenses after incentive fees Total return before incentive fees (2) Total return after incentive fees (2) Balanced Series Winton Series Campbell/Graham
Series Class 1 Class 1a Class 2 Class 2a Class 1 Class 2 Class 1 Class 2 $ 105.79 $ 95.50 $ 111.63 $ 95.95 $ 100.00 $ 100.00 $ 94.38 $ 98.35 0.53 0.47 0.56 0.48 1.53 0.48 0.74 0.78 (0.97 ) (0.87 ) (0.22 ) (0.19 ) (0.28 ) (0.09 ) (1.46 ) (0.81 ) (3.83 ) (3.61 ) (4.05 ) (3.62 ) (0.93 ) 0.29 (3.93 ) (4.10 ) (4.27 ) (4.01 ) (3.71 ) (3.33 ) 0.32 0.68 (4.65 ) (4.13 ) $ 101.52 $ 91.49 $ 107.92 $ 92.62 $ 100.32 $ 100.68 $ 89.73 $ 94.22 (1.69 %) (1.69 %) 1.24 % 1.24 % 2.33 % 1.30 % (3.08 %) (0.15 %) 3.62 % 3.62 % 0.69 % 0.69 % 0.53 % 0.28 % 6.23 % 3.30 % 3.71 % 3.71 % 0.78 % 0.78 % 0.53 % 0.28 % 6.30 % 3.37 % (4.10 %) (4.28 %) (3.38 %) (3.43 %) 1.30 % 0.59 % 5.03 %) (4.25 %) (4.13 %) (4.30 %) (3.40 %) (3.46 %) 1.30 % 0.59 % (5.05 %) (4.27 %) Currency Series Dunn Series Graham Series Class 1 Class 2 Class 1 Class 2 Class 1 Class 2 $ 96.95 $ 102.18 $ 84.54 $ 89.09 $ 85.88 $ 90.14 2.07 2.19 0.57 0.61 1.56 1.65 (1.48 ) (0.81 ) (0.73 ) (0.13 ) (2.38 ) (1.86 ) (0.69 ) (0.73 ) (5.92 ) (6.27 ) (4.46 ) (4.70 ) (0.10 ) 0.65 (6.08 ) (5.79 ) (5.28 ) (4.91 ) $ 96.85 $ 102.83 $ 78.46 $ 83.30 $ 80.60 $ 85.23 2.42 % 5.34 % (0.73 %) 2.20 % (3.92 %) (0.99 %) 6.02 % 3.09 % 3.51 % 0.58 % 11.46 % 8.52 % 6.04 % 3.11 % 3.51 % 0.58 % 11.46 % 8.52 % (0.19 %) 0.56 % (7.43 %) (6.58 %) (6.38 %) (5.66 %) (0.20 %) 0.56 % (7.43 %) (6.58 %) (6.38 %) (5.66 %) Long Only Series Long/Short Series Managed Futures Series Class 1 Class 2 Class 1 Class 2 Class 1 Class 2 $ 109.46 $ 110.28 $ 98.51 $ 99.51 $ 99.26 $ 99.98 4.28 4.43 2.78 2.02 34.29 39.12 (2.40 ) (1.97 ) (4.24 ) (2.36 ) (23.00 ) (25.76 ) (15.51 ) (15.71 ) (2.23 ) (2.68 ) (15.55 ) (17.17 ) (13.63 ) (13.25 ) (3.69 ) (3.02 ) (4.26 ) (3.81 ) $ 95.83 $ 97.03 $ 94.82 $ 96.49 $ 95.00 $ 96.17 7.18 % 9.08 % (4.31 )% (1.41 %) 52.17 % 54.12 % 9.18 % 7.28 % 11.05 % 8.14 % 106.24 % 104.29 % 9.18 % 7.28 % 12.48 % 9.57 % 106.24 % 104.29 % (16.48 %) (11.22 %) (3.49 %) (2.90 %) (5.48 %) (3.95 %) (16.48 %) (11.22 %) (3.86 %) (3.26 %) (5.48 %) (3.95 %)
| (1) | The Long Only Series, Long/Short Series and Managed Futures Series commenced operations on February 24, 2006. Interest income and expenses per unit are calculated by dividing these amounts by the weighted average number of units outstanding during the period. The net gain/(loss) on investments, net of minority interests is a balancing amount necessary to reconcile the change in net asset value per unit with the other per unit information. |
| (2) | Computed using weighted average net assets outstanding during the period. An owner’s total returns may vary from the above returns based on the timing of contributions and withdrawals. Total returns are not annualized. |
| (3) | Annualized |
7. Off-Balance Sheet Risk
The term “off-balance sheet risk” refers to an unrecorded potential liability that, even though it does not appear on the balance sheet, may result in future obligation or loss. Each Trading Company trades in futures, forward and swap contractsSwaps and is therefore a party to financial instruments with elements of off-balance sheet market and credit risk. In entering into these contracts there exists a market risk that such contracts may be significantly influenced by market conditions, such as interest rate volatility, resulting in such contracts being less valuable. If the markets should move against all of the futures interests positions held by a Trading Company in respect of any Series at the same time, and if the Trading Advisor(s) of such Trading Company are unable to offset such futures interests positions, such Trading Company could lose all of its assets and the holders of Units of such Series would realize a 100% loss. The Managing Owner seeks to minimize market risk through real-time monitoring of open positions and the level of diversification of each Trading Advisor’s portfolio. It is anticipated that any Trading Advisor’s margin-to-equity ratio will typically not exceed approximately 35% although the actual ratio could be higher or lower from time to time.
In addition to market risk, trading futures, forward and swap contracts entailsSwaps entail credit risk in that a counterparty will not be able to meet its obligations to a Trading Company. The counterparty for futures contracts traded in the U.S. and on most foreign exchanges is the clearinghouse associated with such exchange. In general, clearinghouses are backed by the corporate members of the clearinghouse who are required to share any financial burden resulting from the non-performance by one of their members and, as such, should significantly reduce this credit risk. In cases where the clearinghouse is not backed by the clearing members, like some foreign exchanges, it is normally backed by a consortium of banks or other financial institutions. Some non-U.S. exchanges, in contrast to U.S. exchanges are principals’ markets in which performance is the responsibility only of the individual counterparty with whom the Trading Company has entered into the transaction with and not of the exchange or clearing corporation. In these kinds of markets, there is risk of bankruptcy or other failure or refusal to perform by the counterparty.
In the case of forward contracts traded on the interbank market and swaps, neither is traded on an exchange. The counterparty is generally a single bank or other financial institution, rather than a group of financial institutions; thus there may be a greater counterparty credit risk. The Managing Owner expects the Trading Advisors to trade only with those counterparties which it believes to be creditworthy. All positions of each Trading Company are valued each day on a mark-to-market basis. There can be no assurance that any clearing member, clearinghouse or other counterparty will be able to meet its obligations to any Trading Company.
To manage the counterparty credit risk associated with all cash management and trading counterparties with whom the Trust does business, the Managing Owner follows a procedure in selecting well-established financial institutions which the Managing Owner, in its sole discretion, considers to be reputable, reliable, financially responsible and well established. The procedure includes due diligence review of documentation on all new and existing financial institution counterparties prior to initiation of relationship, and quarterly ongoing review during the relationship, to ensure that counterparties meet Equinox minimum credit requirements, the counterparty average rating being no less than an investment grade rating as defined by the rating agencies. SeeItem 2, Management’s Discussion And Analysis of Financial Condition and Results of Operations, Off-Balance Sheet Risk.
6.8. Subsequent Events
None.On October 15, 2007, the remaining investors in the Dunn Series were redeemed and all remaining net assets of this Series were distributed to these investors.
As of November 9, 2007, the Frontier Trading Company I, LLC, entered into a swap transaction structured as a call option that is initially valued at $18,000,000 (the option premium paid by such Trading Company), to be priced as of November 13, 2007, for the benefit of the Balanced Series. The swap option relates to a basket, initially consisting of a single investment fund, and provides such Trading Company the right to receive the net income (including unrealized gain or loss) from changes in the notional value of the basket, for an option premium of 40% of the notional value, and provides the Trading Company with the weekly capability to increase or decrease the notional value of the transaction until November 2, 2012 expiration.
| Item 2. | MANAGEMENT’S DISCUSSION AND ANALYSIS OF FINANCIAL CONDITION AND RESULTS OF OPERATIONS |
Introduction
The following discussion and tables should be read in conjunction with our consolidated financial statements and notes thereto included in this quarterly report and our 2006 Annual Report on Form 10-K for the year ended December 31, 2006.
The Frontier Fund, or the Trust, is a Delaware statutory trust formed August 8, 2003. The Trust is a multi-advisor commodity pool, as described in CFTC Regulation § 4.10(d)(2). The Trust is authorized to issue multiple Series of Units in segregated pools of assets of the Trust, pursuant to the requirements of the Trust Act. The assets of each Series are segregated from the assets of other Series. The Trust is managed by the Managing Owner, and its term will expire on December 31, 2053 (unless terminated earlier in certain circumstances).
As of JuneSeptember 30, 2007, the Trust had nine separate and distinct Series of Units issued and outstanding: Balanced Series, Winton Series, Campbell/Graham Series, Currency Series, Dunn Series, Graham Series, Long Only Commodity Series, Long/Short Commodity Series and the Managed Futures Index Series. Each Series of Units, except for the Balanced Series have two separate sub-classes issued and outstanding—Class 1 and Class 2. The Balanced Series has four separate sub-classes of Units issued and outstanding—Class 1, Class 1a, Class 2 and Class 2a. The Trust, with respect to each Series:
engages in the speculative trading of a diversified portfolio of futures, forward (including interbank foreign currencies) and options contracts and other derivative instruments and may, from time to time, engage in cash and spot transactions;
allocates funds to a subsidiary limited liability Trading Company or Companies. Each Trading Company has one-year renewable contracts with its own independent commodity trading advisor(s), or each, a Trading Advisor, that will manage all or a portion of such Trading Company’s assets, make the trading decisions for the assets of each Series vested in such Trading Company, segregate its assets from any other Trading Company and maintain separate, distinct records for each Series, and account for its assets separately from the other Series and the other Trust assets;
calculates the net assets, or the Net Asset Value, of its Units separately from the other Series;
has an investment objective of increasing the value of the Units over the long term (capital appreciation), while controlling risk and volatility, and to offer exposure to the investment programs of individual Trading Advisors and to specific instruments (currencies); and
aggregates all cash and equivalents for purposes of maximizing returns at an equal rate for all Series.
The assets of any particular Series include only those funds and other assets that are paid to, held by or distributed to the Trust on account of and for the benefit of that Series. Under the “Inter-Series Limitation on Liability” expressly provided for under Section 3804(a) of the Trust Act, strict segregation of the cash and equivalents, though pooled for maximizing returns, is maintained in the books and records of each Series.
The Balanced Series, in order to make investments in the Campbell/Graham Series, Currency Series, Graham Series, Long Only Commodity Series, Long/Short Commodity Series and Managed Futures Index Series, advances funds to such Series, for the purpose of investing in the respective Trading Company or Trading Companies for such Series on behalf of the Balanced Series.
The Initial Offering Period for the Balanced Series, Winton Series, Currency Series and Dunn Series closed in September 2004. The Initial Offering Period for the Graham Series closed in November 2004. The Initial Offering Period for the Campbell/Graham Series closed in February 2005. The Initial Offering Period for the Long Only Commodity Series, Long/Short Commodity Series and the Managed Futures Index Series closed in February 2006. Currently, Units in the Balanced Series, Campbell/Graham Series, Currency Series, Graham Series, Long Only
Commodity Series, Long/Short Commodity Series and the Managed Futures Index Series are being offered as of each day of each week and will continue to be offered until the maximum amount of each such Series’ Units which are registered are sold. The Managing Owner may terminate the Continuous Offering Period, as defined in the Prospectus, of any Series at any time.
The Continuous Offering Period of the Dunn Series was terminated by the Managing Owner in February 2006.
Effective as of April 13, 2006, (i) the Advisory Agreement dated as of March 1, 2004, by and among the Trust, Frontier Trading Company II LLC (the “Trading Company II”), the “Managing Owner and Beach Capital Management Limited (“Beach”), which set forth the terms and conditions upon which Beach would render and implement trading advisory services on behalf of the Trading Company II and the Trust with respect to the Beach Series of the Trust and (ii) the Advisory Agreement dated as of March 1, 2004, by and among the Trust, Frontier Trading Company I LLC (the “Trading Company I”), the Managing Owner and Beach, which set forth the terms and conditions upon which Beach would render and implement trading advisory services on behalf of the Trading Company I and the Trust with respect to the assets of the Balanced Series of the Trust allocated to Beach (collectively, the “Agreements”) were terminated. The Agreements were terminated because Beach informed the Managing Owner that Beach had ceased trading pursuant to its Discretionary Program, which was the trading program Beach utilized in providing the trading advisory services under the Agreements.
As a result of the termination of the Agreements, the Trust ceased accepting new subscriptions for the Units in the Beach Series, and the Trust ceased assessing all fees on the Beach Series. Upon termination of the Agreements, the Managing Owner delivered written notice to the existing investors in the Beach Series informing them of their exchange and redemption rights as disclosed in the Trust’s prospectus (the “Prospectus”). In addition, the assets of the Balanced Series which had previously been allocated to Beach were reallocated to one or more of the other trading advisors pursuant to the Managing Owner’s asset allocation discretion as disclosed in the Prospectus. On July 31, 2006, all remaining investor accounts in the Beach Series were redeemed.
On January 26, 2007, the Trust filed a registration statement on Form S-1 (File No. 333-140240), which was declared effective on February 12, 2006. The Trust registered a total of 2,200,000 Units in such registration statement, including 1,000,000 Units in Balanced Series (Class 2), 1,000,000 Units in Long/Short Commodity Series (Class 1) and 200,000 Units in Long/Short Commodity Series (Class 2).
Liquidity and Capital Resources
The Trust will raise additional capital only through the sale of Units offered pursuant to the continuing offering, and does not intend to raise any capital through borrowing. Due to the nature of the Trust’s business, it makes no capital expenditures and has no capital assets which are not operating capital or assets.
The Managing Owner is responsible for the payment of all of the ordinary expenses associated with the organization of the Trust and the offering of each Series of Units, except for the initial and ongoing service fee, if any, and no Series will be required to reimburse these expenses. As a result, 100% of each Series’ offering proceeds are initially available for that Series’ trading activities.
A portion of each Trading Company’s assets is used as margin to maintain that Trading Company’s forward currency contract positions, and another portion is deposited in cash in segregated accounts in the name of each Trading Company maintained for each Trading Company at the futures commodity merchants in accordance with CFTC segregation requirements. At JuneSeptember 30, 2007, cash deposited at the clearing brokers was $46,847,733$35,206,744 for the Balanced Series, $15,170,254$10,412,352 for the Campbell/Graham Series, $1,481,376$1,466,875 for the Currency Series, $1,690,129$16,595,638 for the Long/Short Commodity Series and $0 for the Long Only Commodity Series. The clearing brokers are expected to credit each Trading Company with approximately 80%-100% of the interest earned on its average net assets on deposit with the clearing brokers each week. In an attempt to increase interest income earned, the Managing Owner also may invest the non-margin assets in U.S. government securities which include any security issued or guaranteed as to principal or interest by the U.S., or by a person controlled by or supervised by and acting as an instrumentality of the government of the U.S. pursuant to authority granted by Congress of the U.S. or any certificate of deposit for any of the foregoing, including U.S. treasury bonds, U.S. treasury bills and issues of agencies of the U.S. government, and certain cash items such as money market funds, certificates of deposit (under nine months) and time deposits. Aggregate interest income from all sources, including assets held at clearing
brokers, up to 2% (annualized) is paid to the Managing Owner by the Balanced Series (Class 1 and Class 2 only), Winton Series, Campbell/Graham Series, Currency Series, Dunn Series and Graham Series. For the Balanced Series (Class 1a and Class 2a only), Long Only Commodity Series, Long/Short Commodity Series and Managed Futures Index Series, 20% of the total interest allocated to each Series is paid to the Managing Owner.
Approximately 10% to 20% of the Trust’s assets are expected to be committed as required margin for futures contracts and forward and options trading and held by the respective broker, although the amount committed may vary significantly. Such assets are maintained in the form of cash or U.S. Treasury bills in segregated accounts with the futures broker pursuant to the Commodity Exchange Act and regulations thereunder. Approximately 2% to 6% of the Trust’s assets are expected to be deposited with over-the-counter counterparties in order to initiate and maintain forward and swap contracts.Swaps. Such assets are not held in segregation or otherwise regulated under the Commodity Exchange Act, unless such over-the-counter counterparty is registered as a futures commission merchant. These assets may be held either in U.S. government securities or short-term time deposits with U.S.-regulated bank affiliates of the over-the-counter counterparties. The remaining approximately 74% to 88% of the Trust’s assets will normally be invested in cash equivalents and short term investments, such as money market funds, certificates of deposit (under nine months) and time deposits and held by the futures commodity merchants, the over-the-counter counterparties and by U.S. Federally chartered banks. As of JuneSeptember 30, 2007, such cash equivalents and short term investments included time deposits at Merrill Lynch Bank USA, and money market funds held at Merrill Lynch Investment Managers. Including cash held at US Bank, total cash and cash equivalents and short term investments held at these institutions were $217,555,245$193,227,699 for the Balanced Series, $23,059,085$31,716,769 for the Winton Series, $31,519,393$33,066,331 for the Campbell/Graham Series, $14,528,889$12,974,901 for the Currency Series, $199,025$158,553 for the Dunn Series, $3,025,156$2,892,883 for the Graham Series, $8,947,391$8,894,784 for the Long Only Commodity Series, $27,690,728$25,596,632 for the Long/Short Commodity Series and $192,491$126,595 for the Managed Futures Index Series.
Results of Operations
Three Months Ended JuneSeptember 30, 2007 Compared to Three Months Ended JuneSeptember 30, 2006
Balanced Series
The Balanced Series – Class 1 Net Asset Value gained 9.2% and lost 2.8%, respectively, for the three months ended June 30, 2007 and 2006, net of fees and expenses; the Balanced Series – Class 1a Net Asset Value gained 9.1% and lost 4.5%, respectively, for the three months ended June 30, 2007 and 2006, net of fees and expenses; the Balanced Series – Class 2 Net Asset Value gained 10.0% and lost 2.0%, respectively, for the three months ended June 30, 2007 and 2006, net of fees and expenses; the Balanced Series – Class 2a Net Asset Value gained 9.9% and lost 4.1%, respectively, for the three months ended June 30, 2007 and 2006, net of fees and expenses.
For the three months ended June 30, 2007 the Balanced Series recorded net gain on investments of $43,725,366, net interest of $1,793,704, and total expenses of $5,754,916, resulting in a net increase in Owners’ capital from operations of $25,741,932 after minority interests of ($14,022,222). For the three months ended June 30, 2006, the Balanced Series recorded net loss on investments of $5,413,615, net interest of $980,446, and total expenses of $2,552,198, resulting in a net decrease in Owners’ capital from operations of $6,069,317 after minority interests of $916,050.
Winton Series
The Winton Series – Class 1 Net Asset Value gained 11.5% and 2.0%, respectively, for the three months ended June 30, 2007 and 2006, net of fees and expenses; the Winton Series – Class 2 Net Asset Value gained 12.4% and 2.0%, respectively, for the three months ended June 30, 2007 and 2006, net of fees and expenses.
For the three months ended June 30, 2007, the Winton Series recorded net gain on investments of $2,002,258, net interest of $120,310, and total expenses of 413,175, resulting in a net increase in Owners’ capital from operations of $1,709,393. For the three months ended June 30, 2006, the Winton Series recorded net gain on investments of $9,586, net interest of $19,017, and total expenses of ($1,354) (the result of corrections after trading ended as of March 31, 2006), resulting in a net increase in Owners’ capital from operations of $29,957.
Campbell Graham Series
The Campbell/Graham Series – Class 1 Net Asset Value gained 19.3% and lost 2.6%, respectively, for the three months ended June 30, 2007 and 2006, net of fees and expenses; the Campbell/Graham Series – Class 2 Net Asset Value gained 20.2% and lost 1.9%, respectively for the three months ended June 30, 2007 and 2006, net of fees and expenses.
For the three months ended June 30, 2007, the Campbell/Graham Series recorded net gain on investments of $13,790,166, net interest of $417,669, and total expenses of $1,820,579, resulting in a net increase in Owners’ capital from operations of $10,524,015 after minority interests of ($1,863,241). For the three months ended June 30, 2006, the Campbell/Graham Series recorded net loss on investments of $803,333, net interest of $298,580, and total expenses of $623,180, resulting in a net increase in Owners’ capital from operations of $1,182,988 after minority interests of ($55,055).
Currency Series
The Currency Series – Class 1 Net Asset Value gained 7.3% and lost 1.3%,respectively, for the three months ended June 30, 2007 and 2006, net of fees and expenses; the Currency Series – Class 2 Net Asset Value gained 8.1% and lost 0.6%, respectively for the three months ended June 30, 2007 and 2006, net of fees and expenses.
For the three months ended June 30, 2007, the Currency Series recorded net gain on investments of $565,874, net interest of $105,559, and total expenses of $104,653, resulting in a net increase in Owners’ capital from operations of $566,780. For the three months ended June 30, 2006, the Currency Series recorded net loss on investments of $59,590, net interest of $104,673, and total expenses of $98,662, resulting in a net decrease in Owners’ capital from operations of $53,579.
Dunn Series
The Dunn Series – Class 1 Net Asset Value gained 23.6% and lost 1.8%,respectively, for the three months ended June 30, 2007 and 2006, net of fees and expenses; the Dunn Series – Class 2 Net Asset Value gained 24.5% and lost 1.1%, respectively for the three months ended June 30, 2007 and 2006, net of fees and expenses.
For the three months ended June 30, 2007, the Dunn Series recorded net gain on investments of $19,666, net interest of $585, and total expenses of $750, resulting in a net increase in Owners’ capital from operations of $19,501. For the three months ended June 30, 2006, the Dunn Series recorded net gain on investments of $5,904, net interest of $1,928, and total expenses of $1,660, resulting in a net increase in Owners’ capital from operations of $6,172.
Graham Series
The Graham Series – Class 1 Net Asset Value gained 26.0% and 2.2%,respectively, for the three months ended June 30, 2007 and 2006, net of fees and expenses; the Graham Series – Class 2 Net Asset Value gained 27.0% and 2.9%, respectively for the three months ended June 30, 2007 and 2006, net of fees and expenses.
For the three months ended June 30, 2007, the Graham Series recorded net gain on investments of $1,863,241, net interest of $49,773, and total expenses of $257,665, resulting in a net increase in Owners’ capital from operations of $1,655,349. For the three months ended June 30, 2006, the Graham Series recorded net gain on investments of $267,563, net interest of $73,532, and total expenses of $136,327, resulting in a net increase in Owners’ capital from operations of $204,768.
Long Only Commodity Series
The Long Only Commodity Series – Class 1 Net Asset Value lost 1.6% and gained 5.4%, respectively, for the three months ended June 30, 2007 and 2006, net of fees and expenses; the Long Only Commodity Series – Class 2 Net Asset Value lost 1.1% and gained 6.0% respectively, for the three months ended June 30, 2007 and 2006, net of fees and expenses.
For the three months ended June 30, 2007, the Long Only Commodity Series recorded net loss on investments of $191,148, net interest of $247,243, and total expenses of $132,822, resulting in a net decrease in Owners’ capital from operations of $76,727. For the three months ended June 30, 2006, the Long Only Commodity Series recorded net loss on investments of $14,064, net interest of $56,200, and total expenses of $27,983, resulting in a net increase in Owners’ capital from operations of $14,153.
Long/Short Commodity Series
The Long/Short Commodity Series – Class 1 Net Asset Value lost 1.0% and 2.4%, respectively, for the three months ended June 30, 2007 and 2006, net of fees and expenses; the Long/Short Commodity Series – Class 2 Net Asset Value lost 0.3% and 1.7%, respectively, for the three months ended June 30, 2007 and 2006, net of fees and expenses.
For the three months ended June 30, 2007, the Long/Short Commodity Series recorded net loss on investments of $748,661, net interest of $268,564, and total expenses of $547,419, resulting in a net decrease in Owners’ capital from operations of $323,650 after minority interests of $703,866. For the three months ended June 30, 2006, the Long/Short Commodity Series recorded net loss on investments of $293,950, net interest of $192,244, and total expenses of $243,990, resulting in a net decrease in Owners’ capital from operations of $345,696.
Managed Futures Index Series
The Managed Futures Index Series – Class 1 Net Asset Value gained 8.1% and lost 0.6%, respectively, for the three months ended June 30, 2007 and 2006, net of fees and expenses; the Managed Futures Index Series – Class 2 Net Asset Value gained 8.7% and lost 0.1%, respectively, for the three months ended June 30, 2007 and 2006, net of fees and expenses.
For the three months ended June 30, 2007, the Managed Futures Index Series recorded a net gain on investments of $33,435, net interest of $57,326, and total expenses of $38,269, resulting in a net increase in Owners’ capital from operations of $52,492. For the three months ended June 30, 2006, the Managed Futures Index Series recorded a net loss on investments of $56,726, net interest of $93,774, and total expenses of $47,980, resulting in a net decrease in Owners’ capital from operations of $10,392.
Six Months Ended June 30, 2007 Compared to Six Months Ended June 30, 2006
Market Conditions for Six Months Ended June 30, 2007
January 2007
Interest Rates
U.S. interest rate futures continued to slide in January and reached five-month lows by the end of the month. Strong economic data roiled the markets, extending a bearish move that began early in December. Although European interest rate futures also fell, data hinted at weaker-than-expected economic conditions and the possibility that the European Central Bank may act later rather than sooner in any additional rate increases. The result was that European futures at the short end of the curve declined more slowly than their American counterparts.
Currencies
The U.S. Dollar started the month strongly, but then fell into a narrow trading range for the remainder of January. The British Pound gained 0.3%, the Japanese Yen was down 1.3%, and the Euro decreased 1.3% against the U.S. Dollar. The Canadian Dollar fell by 1.0% against the U.S. Dollar and gained 0.3% against the Euro.
Stock Indices
Stock markets continued the upward trend that began last June. The S&P 500 finished the month up 1.4% and the NASDAQ Composite was higher by 2%. The blue-chip Dow Jones Industrial Index continued to set new all-time highs during January, culminating with an intraday high of 12,657.0 and finishing the month up 1.3% at 12,621.7. In Europe, futures on the German DAX finished the month up just over 3% while French CAC-40 futures were up 0.6%. Japanese Nikkei 225 futures finished the month higher by nearly 1%.
Energy
The petroleum markets went into a tailspin the first half of the month and finished lower despite a sharp recovery in the second half of January. After being down nearly 18% in the middle of the month, crude oil finished the month lower by 6.8% at $58.14. Heating oil was little changed, but gasoline blendstock lost 6.5%. Colder weather swept though much of the U.S., driving natural gas futures higher by 17.9%.
Metals
After a three-day rout to begin the month, April gold recovered and finished January at $657.90/oz, up 2.1%. March silver behaved similarly, up 4.9% by the end of the month. March copper fell by 7.7% in the first trading session before spending the rest of the month in a trading range, finishing lower by 9.6%.
Commodities
A bullish government report drove corn to lock limit up on the Friday before the long Martin Luther King weekend, but that was nearly all the bulls could muster and the market meandered downward for the rest of the month to finish with a gain of only 3.5%. Wheat was unaffected and finished the month down 6.7%. Sugar broke out of a three-month trading range and began another leg down, finishing the month lower by 9.8%.
February 2007
Interest Rates
Longer-term U.S. interest rate futures reversed course and moved haltingly upward through most of February. Everything changed on February 27th, as a sharp world-wide stock market decline drove futures strongly higher. A flight-to-quality and fears of an oncoming U.S. recession on that day combined to create an explosive move upward in shorter-term rate futures, further inverting the U.S. yield curve. Although European interest rate futures spent most of the month in a trading range, the events of the 27th affected markets around the world, including Europe, and futures of all maturities moved up in concert with the American markets.
Currencies
The U.S. Dollar moved steadily downward against most major currencies in February, with the sole exception being the British Pound, which was only slightly lower. The Japanese Yen was up 1.8% and the Euro increased 1.5% against the U.S. Dollar. The Canadian Dollar climbed 0.6% against the U.S Dollar and fell 0.9% against the Euro.
Stock Indices
The big story of the month was the world-wide stock sell-off on February 27th. After what appeared to be another up month in most of the global stock markets, the Chinese market sold off sharply amongst fears the government would move to curb rampant speculation. The near-panic selling continued in the European markets and then crossed the pond to the U.S. markets, with the Dow Jones Industrial Average finishing the day down 3.3% and the month off by 2.8%. The S&P 500 finished the month down 2.2% and the NASDAQ Composite was lower by 1.9%. In Europe, futures on the German DAX fell more than 5% on the 27th and finished the month down 1.8% while French CAC-40 futures were down 2.1%. Japanese Nikkei 225 futures finished the month higher by 0.4%.
Energy
With the exception of gasoline, the energy markets were relatively quiet in February, with crude oil finishing the month higher by 5% at $61.79/bbl. Heating oil was up 5.6%, but natural gas fell by 4.6%. Gasoline blendstock gained 10.7% with a powerful late-month upward thrust.
Metals
After moving upward throughout the month, April gold fell along with inflation expectations on February 27th and finished February at $672.50/oz, up 2.2%. May silver behaved similarly, up 3.9% by the end of the month. May copper reversed its three-month long downtrend, gaining 5.7% during February.
Commodities
Soybeans led the grains complex with a mid-month rise of nearly 10%, but then fell back to finish the month up 7.2%. Orange juice shook off the sharp drop of the month before and climbed steadily to a positive 9.1% performance.
March 2007
Interest Rates
While short-term U.S. interest rate futures remained range-bound and volatile throughout the month, the longer-term contracts reversed course and headed downward in March. European rate futures fell precipitously in the second half of the month, signaling an expectation of higher rates to come.
Currencies
The U.S. Dollar continued to fall in March, finishing down 0.8% as measured by the U.S. Dollar Index (a benchmark that measures the Dollar’s value against a basket of foreign currencies). The Japanese Yen was up 0.6% and the Euro increased nearly 1% against the U.S. Dollar. The Canadian Dollar climbed 1.4% against the U.S. Dollar and 0.4% against the Euro.
Stock Indices
After testing the March 5th lows in the middle of the month, most of the world’s stock markets took off to the upside and recovered a significant portion of the heavy losses that were incurred in late February and early March. The S&P 500 finished the month up 1% and the NASDAQ Composite was higher by 0.2%. European markets were particularly strong, with futures on the German DAX finishing 2.7% while French CAC-40 futures climbed 2.1%. The Japanese Nikkei 225 finished the month slightly down.
Energy
After a lackluster first half of March, the energy complex rallied strongly on fears of increased Middle East instability when Iran took prisoner fifteen British sailors and Marines. Crude oil finished the month higher by 4.5% at $65.87/bbl. Heating oil was up 5.7% and gasoline blendstock continued an upward trend, gaining 9.0% by the end of March. While remaining range-bound, natural gas also went up, finishing the month higher by 4.4%.
Metals
June gold took a pounding along with stocks in the first few trading sessions of the month, but then recovered to finish down 1.4% at $669/oz. May silver fell even harder, down more than 10% early in the month and finishing March lower by 5.5%. Copper continued to streak upward, with the May contract up 14.3% at the end of the month.
Commodities
After moving steadily lower through the month, corn was hit hard and locked limit down in the last trading session of March to finish down 14%. Wheat moved down in sympathy, but soybeans remained range-bound and finished the month off 3.3%. In response to the housing slowdown in the U.S., lumber continued trending downward, losing 8% by the end of the month.
April 2007
Interest Rates
After falling sharply in the first week of the month, longer-term U.S. interest rate futures were able to recover and finish April slightly higher. Futures at the short end of the curve finished significantly down, however, in recognition that the U.S. economy may not be as weak as the housing sector would indicate. Interest rate futures in Europe fell across the board, narrowing the spread with the U.S. Since the “flight to quality” at the end of February and the first few days of March, European rate futures have fallen steadily, even as European stock indices have climbed to one new record after another.
Currencies
The U.S. Dollar continued to drop in April, finishing lower by 1.8% as measured by the U.S. Dollar Index. The Japanese Yen was down 1.5% and the Euro climbed nearly 2.2% against the U.S. Dollar, driving the Euro/Yen cross rate to a new record high, up 3.6%. The Canadian Dollar skyrocketed nearly 4% against the U.S. Dollar and 1.8% against the Euro.
Stock Indices
European and U.S. stock markets shot past the February highs into new record territory in April. The Dow Jones Industrial Average jumped by 5.7%, its biggest monthly percentage gain since October 2002. Both the S&P 500 and the NASDAQ Composite finished the month up 4.3%. European markets also had stellar months, as DAX futures were up 6.3% and French CAC-40 futures rose nearly 6%.
Energy
While crude oil remained in a tight range and finished the month lower by 2.6% at $65.71/bbl, tight supplies and the oncoming summer driving season drove gasoline prices higher by 10.8%. Heating oil was up slightly, and natural gas remained range-bound and finished the month nearly unchanged.
Metals
July copper continued to move sharply higher, adding another 13.3% in April. June gold closed above $695/oz for the first time since late February, but then pulled back to finish the month up 2.2% at $683.50/oz. Silver behaved similarly. After pulling back in March, zinc moved steadily higher.
Commodities
While corn remained in a volatile trading range, soybeans moved steadily downward and finished the month off 4.5%. Wheat went its own way and moved sharply higher, up 9.2% for the month at $4.95/bu. Cotton dropped precipitously and ended the month down 10.5%.
May 2007
Interest Rates
In the face of a steadily climbing stock market and fears of inflation, U.S. interest rate futures across the entire curve fell significantly in May, giving traders plenty of opportunities from which to profit. European interest rate futures also dropped, as strong economic data reinforced expectations of ECB rate raises in the future.
Currencies
After flirting with all-time lows in April, the U.S. Dollar Index recovered slightly in May, gaining 1% during the month. The Japanese Yen continued to fall, down an additional 1.8% against the U.S. Dollar, and the Euro fell 1.4%, driving the Euro/Yen cross rate to another new record high, up 0.4%. While the Australian Dollar was little changed, the Canadian Dollar continued its meteoric rise, climbing nearly 4% against the U.S. Dollar for the second month in a row and 5.3% against the Euro.
Stock Indices
Stock buyers didn’t miss a beat as the spectacular gains seen in April continued into May. Both U.S. and European stock markets continued to set one new record close after another. The Dow Jones Industrial Average jumped by 4.3% in May to close at a record 13,627. After a nearly seven year long drawdown, the S&P 500 eclipsed its previous highest monthly close set in August 2000, climbing 3.3% to finish the month at 1530.6. European markets also had excellent months, as DAX futures rose 6.3% (duplicating its April performance) and French CAC-40 futures rose nearly 2.6%.
Energy
Gasoline prices fell immediately following the long U.S. Memorial Day weekend, finishing the month little changed. Crude oil continued to be volatile and range-bound, finishing the month lower by 4.8% at $64.01/bbl. Heating oil was down slightly, and natural gas showed no directional movement, finishing May nearly unchanged.
Metals
July copper corrected against the uptrend, shedding 5.4% in May. Gold and silver followed, with June gold down 3.3% to $661/oz and July silver finishing little changed.
Commodities
While corn remained in a trading range, the soy complex moved strongly higher, with July soybeans finishing up 8.5%. Soybean oil and soybean meal move higher, as well. Coffee reversed a four-month downtrend to settle higher by 5.4%. Lumber reversed a downtrend that had been in place since the first of the year, climbing 13.4%.
June 2007
Interest Rates
After falling precipitously the previous month, interest rate futures on both sides of the Atlantic bottomed-out in the middle of the June and even strengthened going into the end of the month. The recovery was most apparent at the longer end of the curve, although shorter U.S. rate futures, such as Eurodollars, participated as well.
Currencies
The U.S. Dollar showed remarkable strength in the beginning of June, but then retreated along with interest rates to finish the month off by 0.5%. The Japanese Yen continued its long decline, down an additional 1.1% against the U.S. Dollar. The Euro, however, climbed 0.7%, driving the Euro/Yen cross-rate to another new record high, up 1.8%. After pausing for six weeks, the Australian Dollar resumed its upward trend, up 2.5% against the U.S. currency. It was the Canadian Dollar’s turn to pause, climbing only 0.4% against the U.S. Dollar and falling slightly against the Euro.
Stock Indices
Reflecting climbing oil prices and uncertainty in interest rates, the world’s stock markets remained within a trading range during June. The Dow Jones Industrial Average fell by 1.6% to finish at 13,408. After setting a new record monthly close in May, the S&P 500 retreated by 1.8%. German DAX futures rose 0.6% and French CAC-40 futures fell nearly 1%.
Energy
Crude oil broke out of a trading range and climbed throughout the month in June, finishing higher by 8.8% at $70.68/bbl. Gasoline blendstock was relatively quiet, closing 4% higher. Heating oil followed crude oil higher, up 7.6% by the end of the month. Natural gas prices fell sharply, off 14%.
Metals
August gold lurched unsteadily downward in June, finishing the month lower by 2.4% at $650.90/oz. September silver fell dramatically in the second half of the month to shed 8.3%. September copper remained range-bound, closing up 1.8%.
Commodities
After a steep run-up earlier in the month, a bearish U.S. government report claiming a 19% increase in planted corn acreage accelerated a sharp decline in corn prices, which closed out the month down 8.8%. The same report was bullish for the soy complex, with November soybeans finishing up 5.4%. Soybean oil and soybean meal move higher, as well. Cotton gapped up and never looked back, up nearly 12% on the month.
Balanced Series
The Balanced Series – Class 1 Net Asset Value lost 8.5% and 4.0%, respectively, for the three months ended September 30, 2007 and 2006, net of fees and expenses; the Balanced Series – Class 1a Net Asset Value lost 8.6% and 4.2%, respectively, for the three months ended September 30, 2007 and 2006, net of fees and expenses; the Balanced Series – Class 2 Net Asset Value lost 7.8% and 3.3%, respectively, for the three months ended September 30, 2007 and 2006, net of fees and expenses; the Balanced Series – Class 2a Net Asset Value lost 7.9% and 3.5%, respectively, for the three months ended September 30, 2007 and 2006, net of fees and expenses.
For the three months ended September 30, 2007, the Balanced Series recorded net loss on investments of $27,166,912, net interest of $1,821,062, and total expenses of $4,942,496, resulting in a net decrease in Owners’ capital from operations of $25,457,523 after minority interests of $4,830,823. For the three months ended September 30, 2006, the Balanced Series recorded net loss on investments of $11,139,785, net interest of $1,213,667, and total expenses of $1,932,735, resulting in a net decrease in Owners’ capital from operations of $9,547,654 after minority interests of $2,311,199.
Please see additional discussion under “Nine Months Ended September 30, 2007 Compared to Nine Months Ended September 30, 2006 – Balanced Series.”
Winton Series
The Winton Series – Class 1 Net Asset Value gained 3.1% and 0.3%, respectively, for the three months ended September 30, 2007 and 2006, net of fees and expenses; the Winton Series – Class 2 Net Asset Value gained 3.8% and 0.7%, respectively, for the three months ended September 30, 2007 and 2006, net of fees and expenses.
For the three months ended September 30, 2007, the Winton Series recorded net gain on investments of $1,549,237, net interest of $203,189, and total expenses of $567,555, resulting in a net increase in Owners’ capital from operations of $1,184,871. For the three months ended September 30, 2006, the Winton Series recorded net gain on investments of $536, net interest of $1,258, and total expenses of $230, resulting in a net increase in Owners’ capital from operations of $1,564.
Please see additional discussion under “Nine Months Ended September 30, 2007 Compared to Nine Months Ended September 30, 2006 – Winton Series.”
Campbell Graham Series
The Campbell/Graham Series – Class 1 Net Asset Value lost 10.7% and 4.9%, respectively, for the three months ended September 30, 2007 and 2006, net of fees and expenses; the Campbell/Graham Series – Class 2 Net Asset Value lost 10.0% and 4.2%, respectively for the three months ended September 30, 2007 and 2006, net of fees and expenses.
For the three months ended September 30, 2007, the Campbell/Graham Series recorded net loss on investments of $6,518,540, net interest of $401,396, and total expenses of $802,077, resulting in a net decrease in Owners’ capital from operations of $6,755,678 after minority interests of $163,543. For the three months ended September 30, 2006, the Campbell/Graham Series recorded net loss on investments of $3,058,487, net interest of $379,188, and total expenses of $701,152, resulting in a net decrease in Owners’ capital from operations of $2,316,250 after minority interests of $1,064,201.
Please see additional discussion under “Nine Months Ended September 30, 2007 Compared to Nine Months Ended September 30, 2006 – Campbell Graham Series.”
Currency Series
The Currency Series – Class 1 Net Asset Value lost 1.7% and 0.1%,respectively, for the three months ended September 30, 2007 and 2006, net of fees and expenses; the Currency Series – Class 2 Net Asset Value lost 1.0% and gained 0.6%, respectively for the three months ended September 30, 2007 and 2006, net of fees and expenses.
For the three months ended September 30, 2007, the Currency Series recorded net loss on investments of $169,277, net interest of $116,447, and total expenses of $118,756, resulting in a net decrease in Owners’ capital from operations of $171,586. For the three months ended September 30, 2006, the Currency Series recorded net loss on investments of $52,420, net interest of $138,977, and total expenses of $90,112, resulting in a net decrease in Owners’ capital from operations of $3,555.
Please see additional discussion under “Nine Months Ended September 30, 2007 Compared to Nine Months Ended September 30, 2006 – Currency Series.”
Dunn Series
The Dunn Series – Class 1 Net Asset Value lost 29.4% and 7.2%,respectively, for the three months ended September 30, 2007 and 2006, net of fees and expenses; the Dunn Series – Class 2 Net Asset Value lost 28.9% and lost 6.5%, respectively for the three months ended September 30, 2007 and 2006, net of fees and expenses.
For the three months ended September 30, 2007, the Dunn Series recorded net loss on investments of $26,031, net interest of $504, and total expenses of $647, resulting in a net decrease in Owners’ capital from operations of $26,174. For the three months ended September 30, 2006, the Dunn Series recorded net loss on investments of $18,446, net interest of $1,799, and total expenses of $1,345, resulting in a net decrease in Owners’ capital from operations of $17,992.
Please see additional discussion under “Nine Months Ended September 30, 2007 Compared to Nine Months Ended September 30, 2006 – Dunn Series.”
Graham Series
The Graham Series – Class 1 Net Asset Value lost 3.0% and 6.1%,respectively, for the three months ended September 30, 2007 and 2006, net of fees and expenses; the Graham Series – Class 2 Net Asset Value lost 2.3% and 5.4%, respectively for the three months ended September 30, 2007 and 2006, net of fees and expenses.
For the three months ended September 30, 2007, the Graham Series recorded net loss on investments of $163,543, net interest of $46,816, and total expenses of $85,563, resulting in a net decrease in Owners’ capital from operations of $202,290. For the three months ended September 30, 2006, the Graham Series recorded net loss on investments of $424,745, net interest of $149,454, and total expenses of $211,765, resulting in a net decrease in Owners’ capital from operations of $487,056.
Please see additional discussion under “Nine Months Ended September 30, 2007 Compared to Nine Months Ended September 30, 2006 – Graham Series.”
Long Only Commodity Series
The Long Only Commodity Series – Class 1 Net Asset Value gained 5.9% and lost 12.5%, respectively, for the three months ended September 30, 2007 and 2006, net of fees and expenses; the Long Only Commodity Series – Class 2 Net Asset Value gained 6.4% and lost 12.0% respectively, for the three months ended September 30, 2007 and 2006, net of fees and expenses.
For the three months ended September 30, 2007, the Long Only Commodity Series recorded net gain on investments of $238,958, net interest of $92,262, and total expenses of $66,613, resulting in a net increase in Owners’ capital from operations of $264,607. For the three months ended September 30, 2006, the Long Only Commodity Series recorded net loss on investments of $315,661, net interest of $73,659, and total expenses of $40,220, resulting in a net decrease in Owners’ capital from operations of $282,222.
Please see additional discussion under “Nine Months Ended September 30, 2007 Compared to Nine Months Ended September 30, 2006 – Long Only Commodity Series.”
Long/Short Commodity Series
The Long/Short Commodity Series – Class 1 Net Asset Value remained constant and lost 3.7%, respectively, for the three months ended September 30, 2007 and 2006, net of fees and expenses; the Long/Short Commodity Series – Class 2 Net Asset Value gained 0.7% and lost 3.0%, respectively, for the three months ended September 30, 2007 and 2006, net of fees and expenses.
For the three months ended September 30, 2007, the Long/Short Commodity Series recorded net loss on investments of $1,660,691, net interest of $294,472, and total expenses of $860,507, resulting in a net increase in Owners’ capital from operations of $47,424 after minority interests of $2,274,150. For the three months ended September 30, 2006, the Long/Short Commodity Series recorded net loss on investments of $476,338, net interest of $352,326, and total expenses of $525,350, resulting in a net decrease in Owners’ capital from operations of $649,362.
Please see additional discussion under “Nine Months Ended September 30, 2007 Compared to Nine Months Ended September 30, 2006 – Long/Short Commodity Series.”
Managed Futures Index Series
The Managed Futures Index Series – Class 1 Net Asset Value lost 0.6% and 4.3%, respectively, for the three months ended September 30, 2007 and 2006, net of fees and expenses; the Managed Futures Index Series – Class 2 Net Asset Value remained constant and lost 3.8%, respectively, for the three months ended September 30, 2007 and 2006, net of fees and expenses.
For the three months ended September 30, 2007, the Managed Futures Index Series recorded a net gain on investments of $968, net interest of $4,875, and total expenses of $7,419, resulting in a net decrease in Owners’ capital from operations of $1,576. For the three months ended September 30, 2006, the Managed Futures Index Series recorded a net loss on investments of $44,834, net interest of $97,233, and total expenses of $64,963, resulting in a net decrease in Owners’ capital from operations of $12,564
Please see additional discussion under “Nine Months Ended September 30, 2007 Compared to Nine Months Ended September 30, 2006 – Managed Futures Index Series.”
Nine Months Ended September 30, 2007 Compared to Nine Months Ended September 30, 2006
Market Conditions for Nine Months Ended September 30, 2007
January 2007
Interest Rates
U.S. interest rate futures continued to slide in January and reached five-month lows by the end of the month. Strong economic data roiled the markets, extending a bearish move that began early in December. Although European interest rate futures also fell, data hinted at weaker-than-expected economic conditions and the possibility that the European Central Bank may act later rather than sooner in any additional rate increases. The result was that European futures at the short end of the curve declined more slowly than their American counterparts.
Currencies
The U.S. Dollar (the “Dollar”) started the month strongly, but then fell into a narrow trading range for the remainder of January. The British Pound gained 0.3%, the Japanese Yen was down 1.3%, and the Euro decreased 1.3% against the Dollar. The Canadian Dollar fell by 1.0% against the Dollar and gained 0.3% against the Euro.
Stock Indices
Stock markets continued the upward trend that began last June. The S&P 500 finished the month up 1.4% and the NASDAQ Composite was higher by 2%. The blue-chip Dow Jones Industrial Index continued to set new all-time highs during January, culminating with an intraday high of 12,657 and finishing the month up 1.3% at 12,621. In Europe, futures on the German DAX finished the month up just over 3% while French CAC-40 futures were up 0.6%. Japanese Nikkei 225 futures finished the month higher by nearly 1%.
Energy
The petroleum markets went into a tailspin the first half of the month and finished lower despite a sharp recovery in the second half of January. After being down nearly 18% in the middle of the month, crude oil finished the month lower by 6.8% at $58.14. Heating oil was little changed, but gasoline blendstock lost 6.5%. Colder weather swept through much of the U.S., driving natural gas futures higher by 17.9%.
Metals
After a three-day rout to begin the month, April gold recovered and finished January at $657.90/oz, up 2.1%. March silver behaved similarly, up 4.9% by the end of the month. March copper fell by 7.7% in the first trading session before spending the rest of the month in a trading range, finishing lower by 9.6%.
Commodities
A bullish government report drove corn to lock limit up on the Friday before the long Martin Luther King weekend, but that was nearly all the bulls could muster and the market meandered downward for the rest of the month to finish with a gain of only 3.5%. Wheat was unaffected and finished the month down 6.7%. Sugar broke out of a three-month trading range and began another leg down, finishing the month lower by 9.8%.
February 2007
Interest Rates
Longer-term U.S. interest rate futures reversed course and moved haltingly upward through most of February. Everything changed on February 27th, as a sharp world-wide stock market decline drove futures strongly higher. A flight-to-quality and fears of an oncoming U.S. recession on that day combined to create an explosive move upward in shorter-term rate futures, further inverting the U.S. yield curve. Although European interest rate futures spent most of the month in a trading range, the events of the 27th affected markets around the world, including Europe, and futures of all maturities moved up in concert with the American markets.
Currencies
The Dollar moved steadily downward against most major currencies in February, with the sole exception being the British Pound, which was only slightly lower. The Japanese Yen was up 1.8% and the Euro increased 1.5% against the Dollar. The Canadian Dollar climbed 0.6% against the U.S Dollar and fell 0.9% against the Euro.
Stock Indices
The big story of the month was the world-wide stock sell-off on February 27th. After what appeared to be another up month in most of the global stock markets, the Chinese market sold off sharply amongst fears the government would move to curb rampant speculation. The near-panic selling continued in the European markets and then crossed the pond to the U.S. markets, with the Dow Jones Industrial Average finishing the day down 3.3% and the month off by 2.8%. The S&P 500 finished the month down 2.2% and the NASDAQ Composite was lower by 1.9%. In Europe, futures on the German DAX fell more than 5% on the 27th and finished the month down 1.8% while French CAC-40 futures were down 2.1%. Japanese Nikkei 225 futures finished the month higher by 0.4%.
Energy
With the exception of gasoline, the energy markets were relatively quiet in February, with crude oil finishing the month higher by 5% at $61.79/bbl. Heating oil was up 5.6%, but natural gas fell by 4.6%. Gasoline blendstock gained 10.7% with a powerful late-month upward thrust.
Metals
After moving upward throughout the month, April gold fell along with inflation expectations on February 27th and finished February at $672.50/oz, up 2.2%. May silver behaved similarly, up 3.9% by the end of the month. May copper reversed its three-month long downtrend, gaining 5.7% during February.
Commodities
Soybeans led the grains complex with a mid-month rise of nearly 10%, but then fell back to finish the month up 7.2%. Orange juice shook off the sharp drop of the month before and climbed steadily to a positive 9.1% performance.
March 2007
Interest Rates
While short-term U.S. interest rate futures remained range-bound and volatile throughout the month, the longer-term contracts reversed course and headed downward in March. European rate futures fell precipitously in the second half of the month, signaling an expectation of higher rates to come.
Currencies
The U.S. Dollar continued to fall in March, finishing down 0.8% as measured by the Dollar Index (a benchmark that measures the Dollar’s value against a basket of foreign currencies). The Japanese Yen was up 0.6% and the Euro increased nearly 1% against the Dollar. The Canadian Dollar climbed 1.4% against the Dollar and 0.4% against the Euro.
Stock Indices
After testing the March 5th lows in the middle of the month, most of the world’s stock markets took off to the upside and recovered a significant portion of the heavy losses that were incurred in late February and early March. The S&P 500 finished the month up 1% and the NASDAQ Composite was higher by 0.2%. European markets were particularly strong, with futures on the German DAX finishing 2.7% while French CAC-40 futures climbed 2.1%. The Japanese Nikkei 225 finished the month slightly down.
Energy
After a lackluster first half of March, the energy complex rallied strongly on fears of increased Middle East instability when Iran took prisoner fifteen British sailors and Marines. Crude oil finished the month higher by 4.5% at $65.87/bbl. Heating oil was up 5.7% and gasoline blendstock continued an upward trend, gaining 9.0% by the end of March. While remaining range-bound, natural gas also went up, finishing the month higher by 4.4%.
Metals
June gold took a pounding along with stocks in the first few trading sessions of the month, but then recovered to finish down 1.4% at $669/oz. May silver fell even harder, down more than 10% early in the month and finishing March lower by 5.5%. Copper continued to streak upward, with the May contract up 14.3% at the end of the month.
Commodities
After moving steadily lower through the month, corn was hit hard and locked limit down in the last trading session of March to finish down 14%. Wheat moved down in sympathy, but soybeans remained range-bound and finished the month off 3.3%. In response to the housing slowdown in the U.S., lumber continued trending downward, losing 8% by the end of the month.
April 2007
Interest Rates
After falling sharply in the first week of the month, longer-term U.S. interest rate futures were able to recover and finish April slightly higher. Futures at the short end of the curve finished significantly down, however, in recognition that the U.S. economy may not be as weak as the housing sector would indicate. Interest rate futures in Europe fell across the board, narrowing the spread with the U.S. Since the “flight to quality” at the end of February and the first few days of March, European rate futures have fallen steadily, even as European stock indices have climbed to one new record after another.
Currencies
The Dollar continued to drop in April, finishing lower by 1.8% as measured by the U.S. Dollar Index. The Japanese Yen was down 1.5% and the Euro climbed nearly 2.2% against the Dollar, driving the Euro/Yen cross rate to a new record high, up 3.6%. The Canadian Dollar skyrocketed nearly 4% against the Dollar and 1.8% against the Euro.
Stock Indices
European and U.S. stock markets shot past the February highs into new record territory in April. The Dow Jones Industrial Average jumped by 5.7%, its biggest monthly percentage gain since October 2002. Both the S&P 500 and the NASDAQ Composite finished the month up 4.3%. European markets also had stellar months, as DAX futures were up 6.3% and French CAC-40 futures rose nearly 6%.
Energy
While crude oil remained in a tight range and finished the month lower by 2.6% at $65.71/bbl, tight supplies and the oncoming summer driving season drove gasoline prices higher by 10.8%. Heating oil was up slightly, and natural gas remained range-bound and finished the month nearly unchanged.
Metals
July copper continued to move sharply higher, adding another 13.3% in April. June gold closed above $695/oz for the first time since late February, but then pulled back to finish the month up 2.2% at $683.50/oz. Silver behaved similarly. After pulling back in March, zinc moved steadily higher.
Commodities
While corn remained in a volatile trading range, soybeans moved steadily downward and finished the month off 4.5%. Wheat went its own way and moved sharply higher, up 9.2% for the month at $4.95/bu. Cotton dropped precipitously and ended the month down 10.5%.
May 2007
Interest Rates
In the face of a steadily climbing stock market and fears of inflation, U.S. interest rate futures across the entire curve fell significantly in May, giving traders plenty of opportunities from which to profit. European interest rate futures also dropped, as strong economic data reinforced expectations of ECB rate raises in the future.
Currencies
After flirting with all-time lows in April, the U.S. Dollar Index recovered slightly in May, gaining 1% during the month. The Japanese Yen continued to fall, down an additional 1.8% against the Dollar, and the Euro fell 1.4%, driving the Euro/Yen cross rate to another new record high, up 0.4%. While the Australian Dollar was little changed, the Canadian Dollar continued its meteoric rise, climbing nearly 4% against the Dollar for the second month in a row and 5.3% against the Euro.
Stock Indices
Stock buyers didn’t miss a beat as the spectacular gains seen in April continued into May. Both U.S. and European stock markets continued to set one new record close after another. The Dow Jones Industrial Average jumped by 4.3% in May to close at a record 13,627. After a nearly seven year long drawdown, the S&P 500 eclipsed its previous highest monthly close set in August 2000, climbing 3.3% to finish the month at 1530.6. European markets also had excellent months, as DAX futures rose 6.3% (duplicating its April performance) and French CAC-40 futures rose nearly 2.6%.
Energy
Gasoline prices fell immediately following the long U.S. Memorial Day weekend, finishing the month little changed. Crude oil continued to be volatile and range-bound, finishing the month lower by 4.8% at $64.01/bbl. Heating oil was down slightly, and natural gas showed no directional movement, finishing May nearly unchanged.
Metals
July copper corrected against the uptrend, shedding 5.4% in May. Gold and silver followed, with June gold down 3.3% to $661/oz and July silver finishing little changed.
Commodities
While corn remained in a trading range, the soy complex moved strongly higher, with July soybeans finishing up 8.5%. Soybean oil and soybean meal move higher, as well. Coffee reversed a four-month downtrend to settle higher by 5.4%. Lumber reversed a downtrend that had been in place since the first of the year, climbing 13.4%.
June 2007
Interest Rates
After falling precipitously the previous month, interest rate futures on both sides of the Atlantic bottomed-out in the middle of the June and even strengthened going into the end of the month. The recovery was most apparent at the longer end of the curve, although shorter U.S. rate futures, such as Eurodollars, participated as well.
Currencies
The Dollar showed remarkable strength in the beginning of June, but then retreated along with interest rates to finish the month off by 0.5%. The Japanese Yen continued its long decline, down an additional 1.1% against the Dollar. The Euro, however, climbed 0.7%, driving the Euro/Yen cross-rate to another new record high, up 1.8%. After pausing for six weeks, the Australian Dollar resumed its upward trend, up 2.5% against the U.S. currency. It was the Canadian Dollar’s turn to pause, climbing only 0.4% against the Dollar and falling slightly against the Euro.
Stock Indices
Reflecting climbing oil prices and uncertainty in interest rates, the world’s stock markets remained within a trading range during June. The Dow Jones Industrial Average fell by 1.6% to finish at 13,408. After setting a new record monthly close in May, the S&P 500 retreated by 1.8%. German DAX futures rose 0.6% and French CAC-40 futures fell nearly 1%.
Energy
Crude oil broke out of a trading range and climbed throughout the month in June, finishing higher by 8.8% at $70.68/bbl. Gasoline blendstock was relatively quiet, closing 4% higher. Heating oil followed crude oil higher, up 7.6% by the end of the month. Natural gas prices fell sharply, off 14%.
Metals
August gold lurched unsteadily downward in June, finishing the month lower by 2.4% at $650.90/oz. September silver fell dramatically in the second half of the month to shed 8.3%. September copper remained range-bound, closing up 1.8%.
Commodities
After a steep run-up earlier in the month, a bearish U.S. government report claiming a 19% increase in planted corn acreage accelerated a sharp decline in corn prices, which closed out the month down 8.8%. The same report was bullish for the soy complex, with November soybeans finishing up 5.4%. Soybean oil and soybean meal move higher, as well. Cotton gapped up and never looked back, up nearly 12% on the month.
July 2007
Interest Rates
As problems related to the U.S. sub-prime mortgage market continued to spread, interest rate futures on both sides of the Atlantic climbed steadily higher in July. Stock markets around the world fell dramatically on July 26, triggering a corresponding flight-to-quality which accelerated the increase in bond prices. This was particularly notable at the short end of the curve, as traders anticipated a Fed rate cut in response to a tightening credit market.
Currencies
The U.S. Dollar Index fell steadily through most of July, but gained strength with the flight-to-quality later in the month to finish down 1.4%. Many commentators attributed the sharp Japanese Yen increase of 3.8% to an unwinding of the “carry” trade, in which low-yielding currencies are borrowed to invest in high-yielding currencies. For several years the Japanese Yen has been a favorite of carry traders due to the low yield of Japanese bonds. The Euro finished the month up 1.1% against the Dollar, and down 2.7% against the Yen, ending the string of record highs in the Euro-Yen cross rate. After showing strength earlier in the month, both the Australian Dollar and Canadian Dollar fell in the last few trading sessions to finish little changed.
Stock Indices
The U.S. sub-prime mortgage problems spread and threw a chill into stock markets around the world in July. The Dow Jones Industrial Average fell 2.3% on July 26, it’s biggest one-day drop since the debacle of February 27th when it fell just over 3%. For the month, the DJIA was down 1.5%, the S&P 500 was down 3.2%, and the NASDAQ Composite fell 2.2%. European markets also had declining months, as DAX futures fell 6% and French CAC-40 futures finished down 5.2%.
Energy
Higher energy prices also contributed to the stock market decline as crude oil climbed 10.2% to $78.21/bbl, a record high daily and monthly closing price. Gasoline fell by 4% and heating oil rose 3.2%. The natural gas market continued to fall, declining 9.9%.
Metals
December gold climbed and then fell to finish the month up 2.3% at $679.20/oz. September silver followed suit to finish up 4.4%, and September copper closed July up 5.7% in a relatively quiet and directionless month.
Commodities
Soybeans fell back in July, declining 2.7% for the month and 10.3% from the mid-month high of $9.50/bu. The livestock sector scored gains, as lean hogs climbed more than 17% and live cattle finished up 5.5%.
August 2007
Interest Rates
The flight-to-quality that started in the late days of July became a full-scale exodus in August, as risk-averse investors flooded into U.S. treasuries. The increase in bond and note prices happened across the entire curve. Traders of 30-day Fed Funds futures, expecting lower short-term rates ahead, drove the contract up to its largest single-month gain in nearly four years. European rate futures were also up across the board, although not to the extent of their American cousins.
Currencies
The important story in August was the dramatic unwinding of the carry trade. Massive carry trade positions that were short Japanese Yen and long higher-yielding currencies were closed out in the first half of the month as traders tried to limit losses and raise capital to cover other losing positions. The culmination was a full-scale rout on August 16th, when the Australian Dollar had its largest single-day move ever, losing 3.5% against the Dollar and 5.8% against the Japanese Yen. Against the Dollar, the Yen gained 2.5% during the month and the Euro was off by 0.4%. The Canadian Dollar was up 1% against the greenback and 1.4% against the Euro.
Stock Indices
Although bedlam in the financial markets continued through much of August, U.S. stock markets recovered from early losses to finish slightly up on the month. The S&P 500 was down nearly 6% intraday on August 16th, but recovered to finish the day higher and the month higher by 1.3%. Similarly, the Dow Jones Industrial Average was up 1.1% and the NASDAQ Composite gained 2%. While DAX futures were higher by 1.9%, French CAC-40 futures finished lower by 1.3%.
Energy
In the face of financial market gridlock and possible recession ahead, crude oil futures finished off 4.6%, although even this was a strong recovery from the mid-month losses of nearly 11%. Heating oil was down 3.9%, and natural gas fell by 14.8%.
Metals
Gold was nearly unchanged in August at $681.90/oz. Silver fell by 7.3%, and copper was off 6.2%.
Commodities
Wheat set a new all-time record high in August, rising nearly 20% to $7.67/bu. In spite of a strong downward move in the middle of the month, soybeans recovered to finish the month up 2.9%. Orange juice continued to fall, down another 15.9% for the month.
September 2007
Interest Rates
The financial market chaos of July and August abated somewhat in September, as major problems appeared to be isolated and liquidity returned. The meteoric rise in short-term rate futures of the previous month gave way to range-bound, albeit volatile trading in September. After continuing to rise early in the month, longer-term rate futures on both sides of the Atlantic retreated before month-end to finish mixed.
Currencies
The dominant theme of September was the general decline of the Dollar. The U.S. Dollar Index finished down 3.8%, setting a new all-time record low. Recovering from a devastating pullback in August, the Australian Dollar rose 8.4% against the Dollar, it’s largest single-month gain of the last 30 years. Also against the Dollar, the Euro was up 4.7%, the British Pound gained 1.5%, and the Japanese Yen picked up 0.8%. The Canadian Dollar was up 6.4% against its U.S. counterpart and 1.6% against the Euro.
Stock Indices
After the Fed’s surprise 0.5% lowering of the Fed Funds rate on September 18, stock indices in the U.S. and Europe strengthened, shaking off the fears of the earlier two months. The Dow Jones Industrial Average gained nearly 538 points, or 4%, during the month to finish at 13,896, a new record high monthly close. The S&P 500 tacked on 3.6%, and the NASDAQ Composite was up 4.1%. DAX futures gained 2.2% and CAC-40 futures were up 0.5%.
Energy
In the face of a declining Dollar, crude oil futures climbed steadily throughout September to finish up 11.4% to $81.66/bbl. Heating oil was up 7.3%, and natural gas gained 6.3%, its first positive month since April.
Metals
In another move related to the falling Dollar, gold futures broke convincingly out of a trading range and gained 9.9% to finish at $742.80/oz, another all-time high monthly close. Silver gained 13.8%, and copper finished higher by 7.2%.
Commodities
Wheat set another new all-time record high in September, rising 21.1% to $9.39/bu. Soybeans also strengthened, gaining 12.3%. Coffee picked up 11% while lean hogs were down 9.6%.
Balanced Series
2007
The Balanced Series – Class 1 Net Asset Value gained 2.3%lost 6.3% for the sixnine months ended JuneSeptember 30, 2007, net of fees and expenses; the Balanced Series – Class 1a Net Asset Value gained 2.1%lost 6.6% for the sixnine months ended JuneSeptember 30, 2007, net of fees and expenses; the Balanced Series – Class 2 Net Asset Value gained 3.9%lost 4.2% for the sixnine months ended JuneSeptember 30, 2007, net of fees and expenses; the Balanced Series – Class 2a Net Asset Value gained 3.6%lost 4.6% for the sixnine months ended JuneSeptember 30, 2007, net of fees and expenses.
For the sixnine months ended JuneSeptember 30, 2007, the Balanced Series recorded net gainloss on investments of $21,873,313,$5,293,599, net interest of $3,515,558,$5,336,620, and total expenses of $9,595,608,$14,538,104, resulting in a net increasedecrease in Owners’ capital from operations of $7,758,094$17,699,429 after minority interests of ($8,035,169)3,204,346). The Net Asset Value per Unit, Class 1, increaseddecreased from $106.66 at December 31, 2006, to $109.15$99.90 at JuneSeptember 30, 2007. For Class 1a, the Net Asset Value per Unit increaseddecreased from $95.97 at December 31, 2006, to $98.01$89.59 at JuneSeptember 30, 2007. The Net Asset Value per Unit, Class 2, increaseddecreased from $114.24 at December 31, 2006, to $118.67 June$109.42 at September 30, 2007. For Class 2a, the Net Asset Value per Unit increaseddecreased from $97.88 at December 31, 2006, to $101.38$93.37 at JuneSeptember 30, 2007. Total Class 1 subscriptions and redemptions for the sixnine months were $33,844,393$41,472,701 and $22,948,693,$35,727,692, respectively. Total Class 1a subscriptions and redemptions for the sixnine month period were $1,914,242$2,321,287 and $640,665,$707,927, respectively. Total Class 2 subscriptions and redemptions for the sixnine months were $7,979,095$10,615,337 and $5,446,332,$8,632,977, respectively. Total Class 2a subscriptions and redemptions for the sixnine month period were $682,760$799,760 and $0,$14,830, respectively. Ending capital at JuneSeptember 30, 2007, was $241,128,267$215,284,414 for Class 1, $5,624,646$5,476,778 for Class 1a, $52,990,324$48,280,484 for Class 2 and $1,406,629$1,391,526 for Class 2a. At December 31, 2006, ending capital was $224,559,900 for Class 1, $4,203,865 for Class 1a, $48,581,401 for Class 2 and $661,806 for Class 2a.
The Balanced Series may have both long and short exposure to the Interest Rates, Currencies, Stock Indices, Energies, Metals, and Commodities sectors. See comments above underMarket Conditions for SixNine Months Ended JuneSeptember 30, 2007 for additional information.
Sector Attribution for the Balanced Series
| |
2006
The Balanced Series – Class 1 Net Asset Value gained 1.2%lost 2.9% for the sixnine months ended JuneSeptember 30, 2006, net of fees and expenses; the Balanced Series – Class 1a Net Asset Value lost 4.5%8.5% from the beginning of operations through JuneSeptember 30, 2006, net of fees and expenses; the Balanced Series – Class 2 Net Asset Value gained 2.7%lost 0.7% for the sixnine months ended JuneSeptember 30, 2006, net of fees and expenses; the Balanced Series – Class 2a Net Asset Value lost 4.1%7.4% from the beginning of operations through JuneSeptember 30, 2006, net of fees and expenses.expenses .
For the sixnine months ended JuneSeptember 30, 2006, the Balanced Series recorded net gainloss on investments of $4,937,880,$6,201,905, net interest of $1,742,943,$2,956,610, and total expenses of $5,729,300,$7,662,035, resulting in a net increasedecrease in Owners’ capital from operations of $539,201$9,008,453 after minority interests of $412,322.$1,898,877. The Net Asset Value per Unit, Class 1, increaseddecreased from $104.58 at December 31, 2005, to $105.79$101.52 at JuneSeptember 30, 2006 and the Class 1a Net Asset Value per Unit decreased from $100.00 at the beginning of operations to $95.50$91.49 at JuneSeptember 30, 2006. For Class 2, the Net Asset Value per Unit increaseddecreased from $108.73 at December 31, 2005, to $111.63$107.92 at JuneSeptember 30, 2006 and the Class 2a Net Asset Value per Unit decreased from $100.00 at the beginning of operations to $95.95$92.62 at JuneSeptember 30, 2006. Total Class 1 subscriptions and redemptions for the sixnine months ended September 30, 2006 were $78,576,088$107,861,997 and $7,225,339,$11,025,507, respectively. Total Class 1a subscriptions from the beginning of operations to JuneSeptember 30, 2006 were $1,065,224.$2,988,642. There were no redemptions. Total Class 2 subscriptions and redemptions for the sixnine month period were $16,400,768$23,480,503 and $700,810,$1,089,633, respectively. Total Class 2a subscriptions from the beginning of operations to JuneSeptember 30, 2006 were $235,000.$495,000. There were no redemptions. Ending capital at JuneSeptember 30, 2006, was $186,293,165$203,694,617 for Class 1, $1,053,536$2,883,492 for Class 1a, $37,279,620$42,612,305 for Class 2 and $230,039$478,363 for Class 2a. At December 31, 2005, ending capital was $114,741,316 for Class 1 and $21,224,912 for Class 2.
Strong January and March performances outweighed February losses to give investors a positive first quarter of 2006. Metals continued to be the most profitable sector, followed by interest rates and stock indices. Copper continued to extend the uptrend that began November 2001, while the gold market took a breather and traded in a range of approximately $540—$580 during the quarter (June delivery).quarter. Worldwide bond prices continued to slide, and European and Japanese equity markets rallied, giving traders plenty of opportunity to profit.
Losses in May and June outweighed a profitable April to bring second quarter performance into the red for the Balanced Series. Metals continued to be the most profitable sector year-to-date, closely followed by interest rates. The currency sector has been the most difficult. While global markets in nearly all sectors were difficult to trade in June, losses were kept small.
Net performance in the third quarter was negative, as losses in the energy and interest rate sectors dominated performance. Sharp reversals in energy prices in August adversely affected many of the Balanced Series’ Trading Advisors, and those losses continued in September. After small keepinglosses in each of July and August, the year-to-datecurrency sector began to recover in September. It remains, however, the worst-performing sector for the year. Range-bound trading limited performance positive.in precious metals, although losses were kept small. Metals remained the most profitable sector for the year, followed by interest rates.
Winton Series (Formerly the Beach Series)
2007
The Winton Series – Class 1 Net Asset Value gained 0.7%3.8% for the sixnine months ended JuneSeptember 30, 2007, net of fees and expenses; the Winton Series – Class 2 Net Asset Value gained 2.2%6.1% for the sixnine months ended JuneSeptember 30, 2007, net of fees and expenses.
For the sixnine months ended JuneSeptember 30, 2007, the Winton Series recorded net gain on investments of $1,410,914,$2,960,151, net interest of $145,643,$348,832, and total expenses of $451,566,$1,019,121, resulting in a net increase in Owners’ capital from operations of $1,104,991.$2,289,862. The Net Asset Value per Unit, Class 1, increased from $105.65 at December 31, 2006, to $106.38$109.63 as of JuneSeptember 30, 2007. The Net Asset Value per Unit, Class 2, increased from $106.81 at December 31, 2006, to $109.17$113.35 as of JuneSeptember 30, 2007. Total Class 1 subscriptions for the sixnine months were $15,051,609$23,276,846 and redemptions were $161,472.$475,804. Total Class 2 subscriptions and redemptions for the sixnine month period were $8,633,253,$9,328,823, and $44,242,$149,798, respectively. Ending capital at JuneSeptember 30, 2007, was $15,753,839$24,473,587 for Class 1 and $9,477,945$10,443,987 for Class 2. Ending capital at December 31, 2006, was $356,924 for Class 1 and $290,721 for Class 2.
The Winton Series may have both long and short exposure to the Interest Rates, Currencies, Stock Indices, Energies, Metals, and Commodities sectors. See comments above underMarket Conditions for SixNine Months Ended JuneSeptember 30, 2007 for additional information.
Sector Attribution for the Winton Series
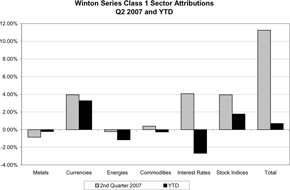 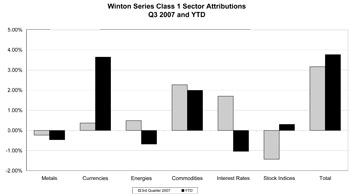 | 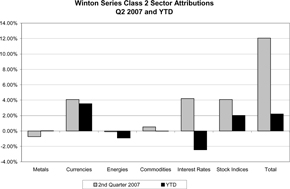 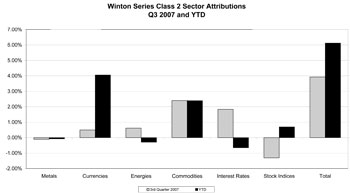 |
2006
The Winton Series – Class 1 Net Asset Value gained 13.5%0.3% for the sixnine months ended JuneSeptember 30, 2006, net of fees and expenses; the Winton Series – Class 2 Net Asset Value gained 14.4%0.7% for the threenine months ended JuneSeptember 30, 2006, net of fees and expenses.
For the sixnine months ended JuneSeptember 30, 2006, the Winton Series recorded net gain on investments of $375,464,$376,000, net interest of $32,511,$33,769, and total expenses of $100,389,$100,619, resulting in a net increase in Owners’ capital from operations of $307,586.$309,150. The Net Asset Value per Unit, Class 1, increased from $111.93$100.00 at December 31, 2005,August 11, 2006 (the date when Winton began trading activities on behalf of the Winton Series), to $127.09$100.32 as of JuneSeptember 30, 2006. The Net Asset Value per Unit, Class 2, increased from $116.27$100.00 at December 31, 2005,August 11, 2006, to $132.99$100.68 as of JuneSeptember 30, 2006. Total Class 1 subscriptions for the sixnine months were $771,916,$772,916, and redemptions were $2,889,464.$3,102,189. Total Class 2 subscriptions and redemptions for the sixnine month period were $30,200,$340,200, and $167,222,$233,946, respectively. Ending capital at JuneSeptember 30, 2006, was $211,976$1,003 for Class 1 and $66,593$310,681 for Class 2. Ending capital at December 31, 2005, was $2,047,247 for Class 1 and $178,306 for Class 2.
January saw a positive start for the Winton Series. The upward trends in both the precious and base metals continued from the last quarter and the portfolio was well positioned to take advantage of these moves; making metals the best performing sector of the month. Currencies remain difficult to trade and after ending 2005 with a 12.6% rise, the dollar index declined sharply in January. Market participants remained highly sensitive to relative economic data and the prospects for shifts in interest rate differentials, central bankCentral Bank policy and leadership changes and global political developments. Global equity markets continued to perform well with North American stock indices amongst the strongest performers. Energy had a mixed month with crude oil moving higher but natural gas fell sharply on the month. Sugar climbed to a 25 year high in January as Brazil, the world’s largest producer of cane sugar, diverted roughly 50% of cane to the production of ethanol on the back of high energy prices.
Some of the trends consolidated in February. While in Europe the stock indices continued to perform well, Japan was a slightly different story with the Topix and Nikkei indices falling nearly 3% on the month. The U.S. markets also ended the month in negative territory. The interest rate sector had a positive month as global interest rates continued to rise in February. The largest percentage yield increase took place in Japan where 2-year Japan Government Bonds (“JGB’s”) went from 0.3% to 0.475% on the back of the Cabinet OfficeJapanese government’s upgrading its economic
assessment, characterizing the recovery as under way and broadening. The U.S. dollarDollar performed well, erasing most of its January decline. The Japanese Yen was the only major currency to appreciate vs.versus the U.S. Dollar. A combination of warmer than normal temperatures and a continued restoration of hurricane damaged refining and distribution capacity saw a fall in energy prices. Both base metals, with the exception of zinc, and precious metals fell in February; giving back some of the gains of last month. Sugar, one of the best performing commodities this year, also gave back some of its recent gains.
On March 31, 2006, Beach Capital Management Limited (“Beach”) ceased trading pursuant to its discretionary program, which was the trading program used by the Beach Series. David Beach has made a decision to engage in other pursuits. Therefore, Beach is no longer engaged in trading for the Beach Series.
There was no trading in the Winton Series in April, May, or June 2006 other than for cash management purposes pursuant to the Managing Owner’s cash management strategies employed for the Trust.
In May 2006, Beach Series was renamed as Winton Series. The Trust has not commenced accepting subscriptions or conducting investment activities for the Winton Series (other than for cash management purposes pursuant to the Managing Owner’s cash management strategies employed for the Trust).on November 1, 2006.
For purposes of this report, Beach Series is referred to as Winton Series, regardless of whether the applicable time period referred to is prior or subsequent to the name change, unless explicitly set forth otherwise.
The Winton Series began trading again on August 23, 2006. Trading in the last week of August was profitable.
The growing perception that the interest rate cycle has turned in the U.S. was the dominant theme within the global fixed income markets in September. This was driven by the slowing of the U.S. housing market and the ensuing drag on consumer spending that resulted in a solid performance from the bond portfolio which was up over 1% over the course of the month, producing the highest sector return. This was followed by the equities, which rallied across much of Europe and the Far East. The expectation of lower U.S. interest rates was the main cause of this optimism over stock valuations. A combination of factors, including the calming of the situation in the Middle East and growing levels of inventories, led to a strong decline in the price of oil. This briefly led to crude trading below the $60 level for the first time since March. As a result, the energy portfolio was the worst performing sector for the month. Precious metals also declined across the board, with gold down 5% and silver falling by over 12%. Currency markets were tentatively range bound. The continuing strength of sterling has led to some questioning of its current levels. The ongoing backdrop of the Chinese stance towards its currency bands came to the forefront at the end of the month and led to some short term volatility in Yen valuations.
Campbell Graham Series
2007
The Campbell/Graham Series – Class 1 Net Asset Value gained 8.1%lost 3.5% for the sixnine months ended JuneSeptember 30, 2007, net of fees and expenses; the Campbell/Graham Series – Class 2 Net Asset Value gained 9.7%lost 1.3% for the sixnine months ended JuneSeptember 30, 2007, net of fees and expenses.
For the sixnine months ended JuneSeptember 30, 2007, the Campbell/Graham Series recorded net gain on investments of $8,106,126,$1,587,586, net interest of $855,639,$1,257,035, and total expenses of $2,621,517,$3,423,594, resulting in a net increasedecrease in Owners’ capital from operations of $5,116,718$1,638,960 after minority interests of ($1,223,530)1,059,987). The Net Asset Value per Unit, Class 1, increaseddecreased from $96.27 at December 31, 2006, to $104.09$92.94 as of JuneSeptember 30, 2007. The Net Asset Value per Unit, Class 2, increaseddecreased from $101.86 at December 31, 2006, to $111.78$100.56 as of JuneSeptember 30, 2007. Total Class 1 subscriptions for the sixnine months ended JuneSeptember 30, 2007, were $7,294,646$11,334,248 and redemptions were $3,529,345.$5,006,653. Total Class 2 subscriptions and redemptions for the sixnine months ended JuneSeptember 30, 2007, were $703,818,$1,062,018, and $2,803,929,$2,981,448, respectively. Ending capital at September 30, 2007, was $53,457,823 for Class 1 and $5,504,863 for Class 2. Ending capital at December 31, 2006, was $57,050,061$48,843,314 for Class 1 and $5,925,328$7,350,167 for Class 2.
The Campbell/Graham Series may have both long and short exposure to the Interest Rates, Currencies, Stock Indices, Energies, Metals, and Commodities sectors. See comments above underMarket Conditions for SixNine Months Ended JuneSeptember 30, 2007 for additional information.
Sector Attribution for the Campbell/Graham Series
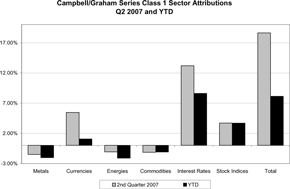 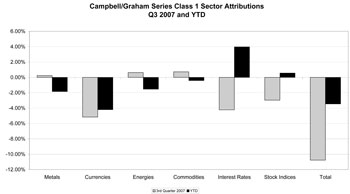 | 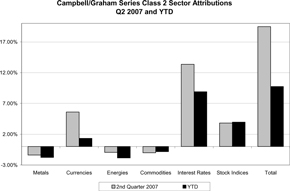 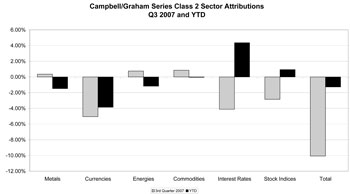 |
2006
The Campbell/Graham Series – Class 1 Net Asset Value gained 0.1%lost 4.8% for the sixnine months ended JuneSeptember 30, 2006, net of fees and expenses; the Campbell/Graham Series – Class 2 Net Asset Value gained 1.6%lost 2.7% for the sixnine months ended JuneSeptember 30, 2006, net of fees and expenses.
For the sixnine months ended JuneSeptember 30, 2006, the Campbell/Graham Series recorded net gainloss on investments of $755,515,$2,302,972, net interest of $451,450,$830,638, and total expenses of $1,200,842,$1,901,994, resulting in a net decrease in Owners’ capital from operations of $242,789$2,559,039 after minority interests of ($248,912).$815,289. The Net Asset Value per Unit, Class 1, increaseddecreased from $94.30 at December 31, 2005, to $94.38$89.73 as of JuneSeptember 30, 2006. The Net Asset Value per Unit, Class 2, increaseddecreased from $96.83 at December 31, 2005, to $98.35$94.22 as of JuneSeptember 30, 2006. Total Class 1 subscriptions for the threenine months ended JuneSeptember 30, 2006 were $19,493,953,$25,088,298, and redemptions were $893,156.$2,133,217. Total Class 2 subscriptions and redemptions for the sixnine months ended JuneSeptember 30, 2006 were $2,852,872,$3,714,172, and $234,960,
$315,053, respectively. Ending capital at JuneSeptember 30, 2006 was $39,916,013$42,189,229 for Class 1 and $5,467,953$6,013,978 for Class 2. Ending capital at December 31, 2005, was $21,561,490 for Class 1 and $2,846,556 for Class 2.
2006 began on a positive note, as good performance in the energy and stock index sectors in January was the primary driver in a profitable month. The U.S. Dollar experienced significant volatility during the month and moved sharply lower versus the major European currencies. The global bond markets also experienced short-term price volatility, as global bond prices declined sharply amid ongoing inflationary concerns. Global equity prices, however, continued to rally, as European and Japanese equity indices continued to trend higher despite significant mid-month price volatility resulting from a broad sell-off in Japan, a flurry of weak earnings reports, and higher energy prices.
Performance was negative in February, although returns remained slightly positive overall for 2006. Prices for crude oil and natural gas fell sharply in February as inventory build-ups weighed on the market in the midst of one of the mildest winters on record in the northeastern U.S. Concern over geopolitical tensions also eased somewhat. While this brought welcome relief at the gas pumps, the trend reversal caused energy sector performance to suffer. Ben Bernanke’s first official appearances as Chairman of the Fed and the reintroduction of the U.S. 30 year bond were digested by the bond markets, as interest rate sector performance was slightly positive. February was a volatile month for U.S. equities, but Euro stocks enjoyed another strong month and contributed solid gains to the portfolio. February’s returns highlighted the downside of trading in energy, which is one of the most volatile market sectors.
Strong performance from several sectors contributed to a strong March and a solid finish to the first quarter. The biggest gains in March were in the interest rate sector, as U.S. and Euro fixed income instruments had their worst quarter in several years, which benefited short futures positions. Energy prices rebounded profitably from February’s sell-off on renewed production and supply concerns, but this was not enough to restrain equity prices, and the equity indices sector also finished higher. Many of the base and precious metals again made new highs, and contributed positively to our returns.
A strong performance from Graham Capital Management in April outweighed losses in the Campbell & Co. portion of the portfolio to result in a positive month for the Campbell/Graham Series. Major global bond markets continued to move lower amid ongoing speculation that the U.S. Federal Reserve, the European Central Bank and the Bank of Japan will continue to tighten global interest rates throughout the remainder of 2006. The decline in global bond prices continued to result in higher yields throughout the U.S., Europe and Japan. Major U.S. equity indices finished the month relatively mixed as the specter of higher interest rates and soaring energy prices ultimately weighed on U.S. equity markets. Elsewhere, European equity prices declined modestly amid sagging investor confidence in Germany, while the Nikkei posted 16-year highs before selling off in response to China’s decision to raise its benchmark interest rate. The U.S. Dollar declined sharply versus the major global currencies. The U.S. Dollar posted 11-month lows versus the Euro and 3-month lows versus Japanese Yen amid ongoing speculation concerning higher global interest rates and renewed concerns regarding the long-term outlook for the U.S. Dollar. Crude oil prices posted record highs during the month amid continuing global unrest, increased demand among China and India, and reports of declining U.S. inventories. Natural gas prices, however, turned bearish, as mild weather and ample inventories led to a major sell off. In the metals markets, gold soared to 25-year highs, as investors sought refuge from a weakening U.S. Dollar,dollar, and base metals surged to multi-year highs amid increased industrial demand worldwide.
The favorable market conditions experienced throughout the first four months of 2006 abruptly gave way to a volatile and choppy environment during May, as renewed doubts concerning the U.S. economy and rising geopolitical tensions led to extremely difficult trading conditions during the latter half of the month. Losses for the month were primarily attributable to unexpected volatility within the global fixed income sector and a sharp and sudden decline in global equity prices. Major global bond markets experienced significant volatility during the latter half of the month, as the release of weaker-than-expected economic data triggered renewed uncertainty concerning the strength of the U.S. economy and the pace of U.S. Federal Reserve policy. Global bond yields finished the month relatively mixed, as yields in the U.S. rose slightly while those in Japan and Europe declined. Major global equity indices finished the month markedly lower amid growing economic uncertainty and rising geopolitical tensions. In the U.S., the NASDAQ declined 6%, the S&P 500 fell 3%, and the Dow Jones Industrial Average lost nearly 2%. Elsewhere, the EuroStoxx 50 declined more than 5% while the Nikkei plunged 8.5%. The U.S. dollarDollar continued to decline versus the major global currencies. The U.S. Dollar posted 12-month lows versus the Euro and 8-month lows versus the Japanese yen,Yen, as recent economic data continued to foster a sense of pessimism concerning the long-term outlook for the U.S. Dollar. Energy prices retreated slightly from record highs amid rising U.S. inventories and easing demand forecasts. In the metals markets, the price of gold posted 26-year highs as investors continued to seek solace from a weakening U.S. Dollar and rising global tensions, while the price of copper, nickel and zinc surged between 12% and 17%, respectively, amid increased industrial demand worldwide.
Volatile markets across the globe resulted in modest losses for the month of June. Losses for the month were primarily attributable to an increase in volatility across the global equity, fixed income, currency and commodities markets, as growing economic uncertainty and rising geopolitical tensions roiled global markets. Major global bond markets continued to experience significant volatility during the month. The release of stronger-than-expected economic data contributed to a sharp mid-month sell-off in the U.S. Treasury market, only to be followed by a late-month rally amid renewed optimism concerning a temporary pause in the U.S. rate tightening cycle following the Federal Open Market Committee’s (“FOMC”) decision to raise interest rates to 5.25%. Global bond yields generally finished the month higher throughout Europe and Japan. Major global equity indices extended losses early in the month amid inflationary fears and lingering concerns regarding the potential for higher global interest rates. Prices soon reversed, however, as the prospect of a temporary pause in the U.S. rate tightening cycle spurred prices higher late in the month. The U.S. Dollar rallied versus many of the major global currencies, rebounding from 12-month lows versus the Euro and 8-month lows versus the Japanese Yen. The U.S. Dollar’s rally proved to be rather short-lived, however, as renewed speculation concerning U.S. interest rate policy led to a modest decline from its intra-month highs. The commodities markets experienced significant volatility during the month. Metals prices declined precipitously for most of the month, only to subsequently rally amid rising geopolitical tensions and renewed global demand concerns. The energy markets experienced similar volatility, as seasonal demand concerns and continued unrest in the Middle East at times spurred prices higher, while increased inventories and renewed diplomatic initiatives often dragged prices lower. Many of the agricultural markets also experienced significant volatility during the month.
Unusually difficult trading conditions continued throughout July. The specter of economic uncertainty in the U.S. and expanding hostilities globally continued to plague many global markets, resulting in excessive price volatility across nearly all market sectors. North Korean missile tests, continuing Iranian nuclear defiance, renewed turbulence in Nigeria and the Israel/Lebanon tinderbox all pushed energy prices higher before finding resistance and finishing virtually unchanged for the month. Equity indices were also volatile but ended the month largely unchanged, leading to flat performance.
The economic and geopolitical uncertainty which clouded the global landscape for much of the summer continued into August, and the trading systems used in the Campbell/Graham Series continued to experience mediocre performance. Losses during August were primarily attributable to trading in the global fixed income markets, with smaller losses experienced across the global equity index, currency, soft commodities, and agricultural markets. The Energy sector was dominated by perceptions of an easing in global geopolitical tensions, a mild hurricane season, and steadily rising inventories. These factors led to a sharp sell-off in natural gas (down by 30%) and crude oil (fell below $70 per barrel). Unleaded gasoline traded down more than 40 cents in August alone. Profits from Graham in the energy markets were offset by Campbell’s losses in the same sector.
Energy losses overshadowed equity gains in September. The biggest losses occurred in the energy complex where crude prices fell over 11% and heating oil and unleaded gasoline both fell around 14%. The drop in prices was driven by the lack of hurricane activity, a further easing of geopolitical tensions, and adequate physical supplies amid the warmer-than-normal autumn season. Trading in equity indices was positive as economic data (with the exception of housing related figures) continued to show moderate growth with restrained inflation. Small gains were also recorded in currency markets, where losses on cross rates exposures were more than offset by gains on outright positions, despite the historically low volatilities in many of these markets. Small losses were recorded in fixed income as the market continued to believe that the U.S. Federal Reserve will not raise rates again in the foreseeable future.
Currency Series
2007
The Currency Series – Class 1 Net Asset Value gained 4.1%2.3% for the sixnine months ended JuneSeptember 30, 2007, net of fees and expenses; the Currency Series – Class 2 Net Asset Value gained 5.7%4.6% for the sixnine months ended JuneSeptember 30, 2007, net of fees and expenses.
For the sixnine months ended JuneSeptember 30, 2007, the Currency Series recorded net gain on investments of $320,308,$151,031, net interest of $233,837,$350,284, and total expenses of $212,070,$330,826, resulting in a net increase in Owners’ capital from operations of $342,075.$170,489. The Net Asset Value per Unit, Class 1, increased from $101.16 at December 31, 2006, to $105.29$103.48 as of JuneSeptember 30, 2007. The Net Asset Value per Unit, Class 2, increased from $108.23 at December 31, 2006, to $114.35$113.22 as of JuneSeptember 30, 2007. Total Class 1 subscriptions and redemptions for the threenine months ending JuneSeptember 30, 2007 were $1,823,315,$3,277,772, and $155,616,$560,151, respectively. Total Class 2 subscriptions and redemptions for the sixnine months ending JuneSeptember 30, 2007, were $1,074,500$1,107,900 and $283,430, respectively. Ending capital at JuneSeptember 30, 2007, was $8,872,959$9,765,104 for Class 1 and $1,314,512$1,334,103 for Class 2. Ending capital at December 31, 2006, was $6,891,891 for Class 1 and $494,736 for Class 2.
The Currency Series may have both long and short exposure to the Currencies sector only. See comments above underMarket Conditions for SixNine Months Ended JuneSeptember 30, 2007 for additional information.
Because all returns are from the Currencies sector, there are no Sector Attribution charts for the Currency Series.
2006
The Currency Series – Class 1 Net Asset Value lost 0.7%0.1% for the sixnine months ended JuneSeptember 30, 2006, net of fees and expenses; the Currency Series – Class 2 Net Asset Value gained 0.7%0.6% for the sixnine months ended JuneSeptember 30, 2006, net of fees and expenses.
For the sixnine months ended JuneSeptember 30, 2006, the Currency Series recorded net gainloss on investments of $11,725,$40,695, net interest of $148,096,$287,073, and total expenses of $153,583,$243,695, resulting in a net decrease in Owners’ capital from operations of $16,051,$19,606, after minority interests of ($22,289). The Net Asset Value per Unit, Class 1, decreased from $97.66 at December 31, 2005, to $96.95$96.85 as of JuneSeptember 30, 2006. The Net Asset Value per Unit, Class 2, increased from $101.42 at December 31, 2005, to $102.18$102.83 as of JuneSeptember 30, 2006. Total Class 1 subscriptions and redemptions for the sixnine months ending JuneSeptember 30, 2006 were $4,581,397,$5,762,247, and $132,843,$134,626, respectively. Total Class 2 subscriptions and redemptions for the sixnine months ending JuneSeptember 30, 2006 were $68,500$331,000 and $1,000,000,$0, respectively. Ending capital at JuneSeptember 30, 2006, was $4,687,954$5,856,564 for Class 1 and $1,155,725$425,127 for Class 2. Ending capital at December 31, 2005 was $276,762 for Class 1 and $2,065,914 for Class 2.
The New Year saw a resurgence of old themes as the market moved once more in the direction of yield hunting, and interest rate differentials continued to dominate even short term trading within the foreign exchange markets. Traders remained preoccupied with the path of Federal Reserve interest rate policy with the U.S. Dollar experiencing a sizeable drop in the first few days of the year as the Fed minutes from December suggested that they were closer to the end of the tightening cycle. The U.S. unit weakened further towards the middle of the month to a four month low against the Euro on the further belief that the ECBEuropean Central Bank would tighten to combat inflationary pressures. Overall the signals from U.S. economic output remained mixed, , and the surprising strength shown in fourth quarter new home sales reversed the U.S. Dollar fortunes by prompting a strong U.S. Dollar rally. Asian currencies continued to display resilience and gave up little ground despite U.S. Dollar strength elsewhere, and the Brazilian realReal continued to attract buying interest as the appetite for yield continued.
Reversing its January weakness, the U.S. Dollar showed strength in the first half of February and held onto its gains, with the dollar indexDollar Index finishing the month up nearly 1.3%. The Euro was down approximately 2% against the U.S. Dollar, while the British Pound fell by 1.4% and the Swiss Franc lost 2.6% during the month. The Japanese Yen rallied against the U.S. Dollar, gaining 1.2%. The Canadian Dollar, while little changed relative to its U.S. cousin, gained nearly 2.2% against the Euro but lost 1% against the Yen.
Currency trading was more difficult in March, with the U.S. Dollar characterized by high volatility and little directional movement throughout the month. The Euro was up 1.7% during the month, the British Pound fell by 0.9%, and the Swiss Franc gained 0.6% against the U.S.US Dollar. The Japanese Yen lost 1.7% against the U.S. Dollar in a volatile, range-bound month. The Canadian Dollar had a more difficult time of it, losing 2.7% against the U.S. Dollar and losing 4.3% against the Euro.
The U.S. Dollar broke from a trading range and plunged in the second half of April, with the dollar index losing 4% of its value by the end of the month. The British Pound gained 5.1% against the greenback,Dollar, the Euro was up 4.3%, and the Japanese Yen finished the month ahead by 3.5%. The Canadian Dollar was up 4.7% against U.S. Dollar and up 0.3% against the Euro.
The U.S. Dollar continued to weaken during the first half of May and then remained in a narrow range for rest of the month, with the dollar indexDollar Index losing 1.6% of it’s value by the end of the month. The British Pound gained 2.4% against the U.S. Dollar, the Euro was up 1.4%, and the Japanese Yen finished the month ahead by 1.1%. The Canadian Dollar was up 1.3% against the U.S. Dollar and nearly unchanged against the Euro.
With currency movements closely related to interest rates, the uncertainty in the interest rate outlook in June spilled over into the global currency markets. The U.S. Dollar broke out of a trading range and strengthened through most of June, but gave much of those gains back in the last three trading sessions of the month. The British Pound lost 1.1% against the U.S. Dollar, the Euro was off 0.1%, and the Japanese Yen finished the month down by 2.0%. The Canadian Dollar was down 1.3% against both the U.S. Dollar and the Euro.
In spite of considerable volatility in the middle of the month that led to small losses in the Currency Series, currencies ended July mixed and little changed. While the British Pound increased 1% against the US Dollar, both the Euro and Japanese Yen were down 0.2%. The Canadian Dollar was down 1.3% against Dollar and down 1.1% against the Euro.
The Currency Series recovered strongly in August with profits in Class 2 of 2.29% and Class 1 of 2.03%. While the British Pound climbed by 2% and the Japanese Yen fell by 2.3%, the Euro was little changed against the Dollar during August. In spite of a dramatic decline in crude oil prices, the Canadian Dollar displayed real strength as it was up 2.5% against the Dollar and 2.1% against the Euro.
The Dollar shirked off continuing structural imbalances and a cooling of the U.S. housing market to show surprising strength in September, gaining 1.1% for the month. The British Pound fell 1.7%, the Japanese Yen was down by 0.7%, and the Euro declined by 1.1% against the Dollar. With a continuing drop in energy prices, the Canadian Dollar was down 1.3% against the Dollar and 0.2% against the Euro. The unexpected strength in the Dollar led to Class 1 and Class 2 losses of 1.51% and 1.29%, respectively.
Dunn Series
2007
The Dunn Series – Class 1 Net Asset Value gained 0.3%lost 29.2% for the sixnine months ended JuneSeptember 30, 2007, net of fees and expenses; the Dunn Series – Class 2 Net Asset Value gained 1.8%lost 27.6% for the sixnine months ended JuneSeptember 30, 2007, net of fees and expenses.
For the sixnine months ended JuneSeptember 30, 2007, the Dunn Series recorded net loss on investments of $5,914,$31,945, net interest of $1,405,$1,909, and total expenses of $1,923,$2,570, resulting in a net decrease in Owners’ capital from operations of $6,432.$32,606. The Net Asset Value per Unit, Class 1, increaseddecreased from $76.91 at December 31, 2006, to $77.15$54.46 as of JuneSeptember 30, 2007. The Net Asset Value per Unit, Class 2, increaseddecreased from $82.27 at December 31, 2006, to $83.78$59.58 as of JuneSeptember 30, 2007. There were no Class 1 subscriptions for the sixnine months. Total Class 1 redemptions were $25,944$35,509 for the sixnine month period. There were no Class 2 subscriptions for the sixnine month period ending JuneSeptember 30, 2007. Class 2 redemptions for the sixnine month period were $25,121. Ending Capital at JuneSeptember 30, 2007, was $93,585$58,092 for Class 1 and $852$606 for Class 2. Ending capital at December 31, 2006, was $123,164 for Class 1 and $28,770 for Class 2.
The Dunn Series may have both long and short exposure to the Interest Rates, Currencies, Stock Indices, Energies, Metals, and Commodities sectors. See comments above underMarket Conditions for SixNine Months Ended JuneSeptember 30, 2007 for additional information.
Sector Attribution for the Dunn Series
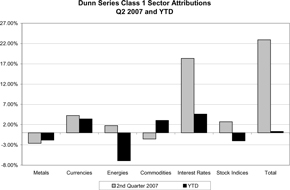 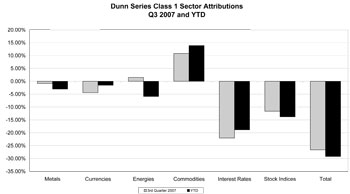 | 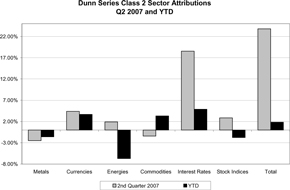 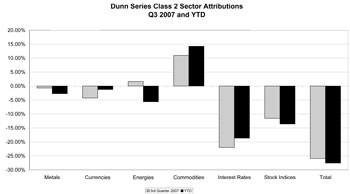 |
2006
The Dunn Series – Class 1 Net Asset Value lost 2.6%9.6% for the sixnine months ended JuneSeptember 30, 2006, net of fees and expenses; the Dunn Series – Class 2 Net Asset Value lost 1.2%7.6% for the sixnine months ended JuneSeptember 30, 2006, net of fees and expenses.
For the sixnine months ended JuneSeptember 30, 2006, the Dunn Series recorded net gainloss on investments of $3,954,$14,492, net interest of $3,517,$5,316, and total expenses of $3,364,$4,709, resulting in a net increasedecrease in Owners’ capital from operations of $4,107.$13,885. The Net Asset Value per Unit, Class 1, decreased from $86.83 at December 31, 2005, to $84.54$78.46 as of JuneSeptember 30, 2006. The Net Asset Value per Unit, Class 2, decreased from $90.15 at December 31, 2005, to $89.09$83.30 as of JuneSeptember 30, 2006. There were no Class 1 subscriptions for the sixnine months. Total Class 1 redemptions were $63,624 for the sixnine month period. There were no Class 2 subscriptions or redemptions for the sixnine month period ending JuneSeptember 30, 2006. Redemptions for this period were $10,000. Ending Capital at JuneSeptember 30, 2006, was $135,506$125,754 for Class 1 and $134,418$116,178 for Class 2. Ending capital at December 31, 2005, was $193,425 for Class 1 and $136,016 for Class 2.
Dunn Series performance was negative in January. The strength in Global bond markets subsided in January as economic strength and a resurgence in energy prices dampened demand for fixed income investments. Concern about instability in Nigeria and the escalation of nuclear tension in Iran drove energy prices higher in January. The U.S. Federal Reserve (“Fed”) raised its Fed Funds rate to 4.5% at Chairman Alan Greenspan’s last Fed meeting. Subtle changes in its accompanying statement after the rate hike suggest that the Fed may not be finished raising rates, but will likely be reactive going forward.
Dunn Series performance was negative again in February. Global fixed income prices continued to move lower during February benefiting predominately short fixed income positions. Several Fed Governorsgovernors cited continued strength in the U.S. economy, suggesting that the Fed will continue its tightening bias, with the goal of preemptively suppressing even the intimation of inflation. Short dollarDollar positions suffered from expectations that still higher U.S. interest rates would strengthen the U.S. Dollar against most currencies.
Excellent performance in the interest rate sector in March led to Dunn Series gains in March, as Central Banks interest rate increases were the driving force for fixed income markets. The European Central Bank, Bank of Canada, Swiss National Bank, Norges Bank (Norway) and the U.S. Federal Reserve all raised their respective overnight rates 25 basis points in March. Also, the Bank of Japan (BOJ) officially ended its quantitative easing program which has been in place since March of 2001. Since that time, the BOJ has altered its basic monetary approach by targeting the base of money supply instead of short term interest rates. Although this does not necessarily imply there will be higher interest rates in Japan, it removes a significant obstacle in the path toward them.
The Dunn Series gained in April, as short fixed income positions benefited from increasing yields. Participants expected the normalization of global monetary policy to continue, particularly outside the U.S. These same positions benefited from strong U.S. economic data in the form of March’s Producer Price Index and retail sales figures, pushing the long end of the U.S. yield curve above 5%. The Federal Open Market Committee (“FOMC”) minutes from the Fed’s March meeting suggested the Fed would possibly take a pause in their rate hike cycle. This news was viewed as dollarDollar bearish, thus producing gains in predominantly long foreign currency positions. New all time highs in copper and crude oil led the metal and energy sectors gains.
The Dunn Series had negative performance in May. The FOMC raised its fed funds rate for the 16th time, as expected, to 5.0%. In its accompanying statement, the FOMC suggested future rate increases may yet be needed to address inflation risks, depending on economic outlook. Equity markets surrendered early month gains as inflation concerns gained steam after a strong U.S. Consumer Price Index (CPI) was released. This along with comments by several FOMC members expressing concern over levels of inflation in the U.S. brushed aside any notion of a FOMC pause in raising rates.
The Dunn Series had negative performance in June. Weaker than expected economic data, in the form of a sub-par U.S. unemployment report, boosted fixed income prices which, in turn led to losses in short U.S. bond positions. The program’s short U.S. Dollar positions suffered when, despite a 25 basis point increase in Refi rate by the European Central Bank (ECB), analysts interpreted ECB President Trichet’s post-ECB meeting comments as more of a wait-and-see approach to inflation-quenching rate hikes, in contrast to the Federal Open Market Committee’s (FOMC)FOMC’s more aggressive policy as reflected by now 17 consecutive rate hikes. The US PPIU.S. Producer Price Index and CPI numbers brought attention to the warnings of several FOMC members that inflation should be a concern, as both core numbers were again above the perceived Fed comfort level. This brought back into the spotlight the end of the month FOMC meeting, as expectations of another Fed rate hike gained momentum. The FOMC did not disappoint and raised the Fed Funds rate 25 bps to 5.25% on June 29th.
The Dunn Series was down in July. No single contract experienced a significant gain or loss but losing contracts outnumbered winning contracts 2 to 1. The Bank of Japan (BOJ) raised its overnight rate by 25 basis points to 0.25% (from zero); this was the first rate hike in Japan in six years. The BOJ’s accompanying statement said further rate hikes would be gradual. Bernard Bernanke, the relatively new chairman of the Federal Reserve System, testified that he expects core inflation and growth to moderate in coming quarters. Also the Peoples Bank of China raised its reserve requirement ratio to 0.5 percentage points, for the stated purpose of decelerating its economy, as days earlier China reported an annual GDP growth of 11.3%, year to year.
Losses continued in the Dunn Series in August. Small gains in interest rates, currencies and metals were offset by losses in agriculturals, stock indices and, in particular, energies. Currencies gains were mainly attributable to long British Pound and short Japanese Yen positions. The Bank of England surprised the market with a rate hike while the Yen weakened on no rate hike from the BOJ. Interest rate gains were helped by our long 10-Year Japanese government bonds positions as Japan’s consumer price index (CPI) was rebased (reformulated) and the predicted change in the CPI due to the rebasing was larger than expected. Losses experienced by the energy sector were primarily due to the sell off of natural gas after prices had peaked earlier this summer due to increased demand for electricity caused by a widespread heat wave. Strength early in the month in crude oil and related products caused by Middle East conflict and the partial shut down of Prudhoe Bay oil field in Alaska gave way to weakness later in the month as cooler heads prevailed in the Middle East and the initial concerns regarding the Prudhoe Bay situation turned out to be overestimated, leading to net losses in long energy positions.
The return for the Dunn Series was negative in September. Energy prices continued to weaken this month, benefiting short positions. Bearish news of a substantial new oil field in the Gulf of Mexico and a mid-month OPEC meeting with no change in output quotas left crude prices $8 Dollars a barrel lower on the month. The FOMC left rates unchanged for a second meeting in a row, but continued to have a tightening bias on the basis that some inflation risk remain. This coupled with weaker than expected economic data, produced losses in our fixed income positions. The Philadelphia Federal Reserve Bank business outlook survey showed manufacturing had slowed to 3-year lows in that region, and the August U.S. housing starts report was weaker than expected.
Graham Series
2007
The Graham Series – Class 1 Net Asset Value gained 12.7%9.3% for the sixnine months ended JuneSeptember 30, 2007, net of fees and expenses; the Graham Series – Class 2 Net Asset Value gained 14.4%11.8% for the sixnine months ended JuneSeptember 30, 2007, net of fees and expenses.
For the sixnine months ended JuneSeptember 30, 2007, the Graham Series recorded net gain on investments of $1,147,390,$983,847, net interest of $115,154,$161,970, and total expenses of $385,070,$470,633, resulting in a net increase in Owners’ capital from operations of $877,474.$675,184. The Net Asset Value per Unit, Class 1, increased from $84.70 at December 31, 2006, to $95.45$92.58 as of JuneSeptember 30, 2007. The Net Asset Value per Unit, Class 2, increased from $90.25 at December 31, 2006, to $103.23$100.89 as of JuneSeptember 30, 2007. Total Class 1 subscriptions and redemptions for the sixnine months were $224,427$565,129 and $1,297,109,$1,497,728, respectively. There were noTotal Class 2 subscriptions and redemptions for the sixnine months ended JuneSeptember 30, 2007. Class 2 redemptions2007 were $551,191 for the six month period.$16,000 and $555,334, respectively. Ending capital at JuneSeptember 30, 2007, was $5,525,371$5,503,259 for Class 1 and $1,769,062$1,740,824 for Class 2. Ending capital at December 31, 2006, was $5,991,337 for Class 1 and $2,049,495 for Class 2.
The Graham Series may have both long and short exposure to the Interest Rates, Currencies, Stock Indices, Energies, Metals, and Commodities sectors. See comments above underMarket Conditions for SixNine Months Ended JuneSeptember 30, 2007 for additional information.
Sector Attribution for the Graham Series
 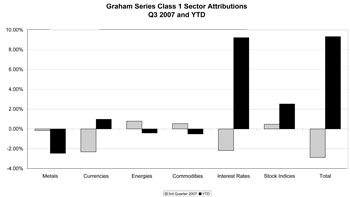 | 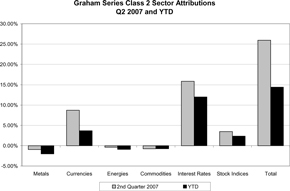 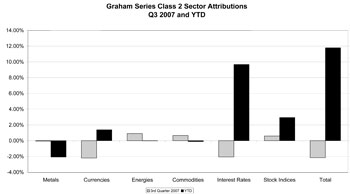 |
2006
The Graham Series – Class 1 Net Asset Value gained 3.6%lost 2.8% for the sixnine months ended JuneSeptember 30, 2006, net of fees and expenses; the Graham Series – Class 2 Net Asset Value gained 5.1%lost 0.6% for the sixnine months ended JuneSeptember 30, 2006, net of fees and expenses.
For the sixnine months ended JuneSeptember 30, 2006, the Graham Series recorded net gain on investments of $455,120,$30,375, net interest of $113,252,$262,706, and total expenses of $234,424,$446,189, resulting in a net increasedecrease in Owners’ capital from operations of $333,948.$153,108. The Net Asset Value per Unit, Class 1, increaseddecreased from $82.90 at December 31, 2005, to $85.88$80.60 as of JuneSeptember 30, 2006. The Net Asset Value per Unit, Class 2, increaseddecreased from $85.73 at December 31, 2005, to $90.14$85.23 as of JuneSeptember 30, 2006. Total Class 1 subscriptions and redemptions for the sixnine months were $1,160,009$1,621,285 and $1,183,925,$1,442,411, respectively. Total Class 2 subscriptions and redemptions for the sixnine months were $1,521,506$1,559,006 and $1,156,944,$1,227,114, respectively. Ending capital at JuneSeptember 30, 2006 was $5,865,130$5,699,664 for Class 1 and $2,224,148$2,072,678 for Class 2. Ending capital at December 31, 2005, was $5,642,080 for Class 1 and $1,772,604 for Class 2.
2006 began on a positive note, as the Graham Series recorded gains during the month of January. The U.S. Dollar experienced significant volatility during the month and moved sharply lower versus the major European currencies. The U.S. Dollar fell to a 4-month low versus the Euro amid continuing speculation concerning the direction of interest rates in the U.S.United States. The global bond markets also experienced short-term price volatility, as global bond prices declined sharply amid ongoing inflationary concerns. The decline in prices led to rising yields, as the German bund
Bund and U.S. 10-Year Treasury note yields advanced 15 basis points and 12 basis points, respectively, during the month. Global equity prices continued to rally, as European and Japanese equity indices continued to trend higher despite significant mid-month price volatility resulting from a broad sell-off in Japan, a flurry of weak earnings reports, and higher energy prices. Commodities prices, particularly those in the energy and metals sectors, continued to rally amid lingering supply concerns linked to severe weather disruptions, labor unrest, and renewed inflationary fears. Most notably, copper and zinc posted record highs, gold rallied to a 25-year high, and coffee and sugar prices rose 10% and 23%, respectively.
In February, global bond markets experienced short-term volatility as prices were marginally lower amid ongoing speculation concerning global interest rates. The modest decline in prices led to higher yields, as the Japanese 10-Year Government bond and U.S. 10-Year Treasury note yield advanced 7 basis points and 5 basis points, respectively, during the month. European equity indices continued to rally following the release of better-than-expected earnings reports, while Japanese equity indices generally declined amid speculation that the Bank of Japan may soon shift away from a long standing policy of extreme accommodation. Major equity indices in the U.S. were mixed as questions remain concerning the direction of U.S. interest rates. The U.S. Dollar experienced significant volatility during the month amid continuing uncertainty with respect to U.S. interest rates. Ultimately, the U.S. Dollar rebounded from last month’s 4-month low to finish February at a 7-week high versus the Euro. Energy prices declined sharply amid unseasonably warm weather in the U.S. and reports of ample inventories for the remainder of the winter season. Metals prices experienced significant volatility amid concerns that the bullish trends experienced in January may ultimately translate to increased supplies.
The first quarter of 2006 was positive for the Graham Series as strong gains in the interest rate sector led to a profitable March. Major global bond markets finished the month significantly lower amid ongoing speculation concerning higher global interest rates following the 15th consecutive rate increase by the U.S.United States FOMC. The decline in global bond prices resulted in higher yields throughout Europe, Japan and the U.S. Major global equity indices in the U.S.United States and Europe finished the month higher as equity prices rallied following the release of positive economic data in the U.S. In Japan, the Nikkei index surged more than 5% amid renewed optimism concerning the pace of Japanese economic growth. The U.S. Dollar experienced significant volatility and moved in a trading range versus major global currencies amid lingering concerns regarding higher global interest rates. The U.S. Dollar finished the month gaining 1% to 2% versus the Japanese Yen and the sterling,British Sterling, while declining versus the Euro and the Swiss Franc. Energy prices finished the month higher amid weather-related concerns, declining inventories and continuing geopolitical unrest in the Middle East. Precious metals prices generally rallied as the price of gold approached $600 an ounce. Base metals also continued to rally as the price of zinc and copper again posted record highs, rising 13% and 11.5%, respectively.
April proved to be a strong month for the Graham Series, largely due to significant profits from trends in the fixed income and metals markets. Major global bond markets continued to move lower amid ongoing speculation that the U.S. Federal Reserve, the European Central Bank and the Bank of Japan would continue to tighten global interest rates throughout the remainder of 2006. The decline in global bond prices continued to result in higher yields throughout the U.S., Europe and Japan. Major U.S. equity indices finished the month relatively mixed as the specter of higher interest rates and soaring energy prices ultimately weighed on U.S. equity markets. Elsewhere, European equity prices declined modestly amid sagging investor confidence in Germany, while the Nikkei posted 16-year highs before selling off in response to China’s decision to raise its benchmark interest rate. The U.S. Dollar declined sharply versus the major global currencies. The U.S Dollar posted 11-month lows versus the Euro and 3-month lows versus the Japanese Yen amid ongoing speculation concerning higher global interest rates and renewed concerns regarding the long-term outlook for the U. S. Dollar. Crude oil prices posted record highs during the month amid continuing global unrest, increased demand among China and India, and reports of declining U.S. inventories. Natural gas prices, however, turned bearish, as mild weather and ample inventories led to a major sell off. In the metals markets, gold soared to 25-year highs, as investors sought refuge from a weakening U.S. Dollar, and base metals surged to multi-year highs amid increased industrial demand worldwide.
The favorable market conditions experienced throughout the first four months of 2006 abruptly gave way to a volatile and choppy environment during May, as renewed doubts concerning the U.S. economy and rising geopolitical tensions led to extremely difficult trading conditions during the latter half of the month. Losses for the month were primarily attributable to unexpected volatility within the global fixed income sector and a sharp and sudden decline in global equity prices. Major global bond markets experienced significant volatility during the latter half of the month, as the release of weaker-than-expected economic data triggered renewed uncertainty concerning the strength of the U.S. economy and the pace of U.S. Federal Reserve policy. Global bond yields finished the
month relatively mixed, as yields in the U.S. rose slightly while those in Japan and Europe declined. Major global equity indices finished the month markedly lower amid growing economic uncertainty and rising geopolitical tensions. In the U.S., the NASDAQ declined 6%, the S&P 500 fell 3%, and the Dow Jones Industrial Average lost nearly 2%. Elsewhere, the EuroStoxx 50 declined more than 5% while the Nikkei plunged 8.5%. The U.S. Dollar continued to decline versus the major global currencies. The U.S. Dollar posted 12-month lows versus the Euro and 8-month lows versus the Japanese Yen, as recent economic data continued to foster a sense of pessimism concerning the long-term outlook for the U.S. Dollar. Energy prices retreated slightly from record highs amid rising U.S. inventories and easing demand forecasts. In the metals markets, the price of gold posted 26-year highs as investors continued to seek solace from a weakening U.S. Dollar and rising global tensions, while the price of copper, nickel and zinc surged between 12% and 17%, respectively, amid increased industrial demand worldwide.
The considerable uncertainty which plagued the global markets during June resulted in difficult trading conditions. Losses for the month were primarily attributable to an increase in volatility across the global equity, fixed income, currency and commodities markets, as growing economic uncertainty and rising geopolitical tensions roiled global markets. Major global bond markets continued to experience significant volatility during the month. The release of stronger-than-expected economic data contributed to a sharp mid-month sell-off in the U.S. Treasury market, only to be followed by a late-month rally amid renewed optimism concerning a temporary pause in the U.S. rate tightening cycle following the FOMC’s decision to raise interest rates to 5.25%. Global bond yields generally finished the month higher throughout Europe and Japan. Major global equity indices extended losses early in the month amid inflationary fears and lingering concerns regarding the potential for higher global interest rates. Prices soon reversed, however, as the prospect of a temporary pause in the U.S. rate tightening cycle spurred prices higher late in the
month. The U.S. Dollar rallied versus many of the major global currencies, rebounding from 12-month lows versus the Euro and 8-month lows versus the Japanese Yen. The U.S. Dollar’s rally proved to be rather short-lived, however, as renewed speculation concerning U.S. interest rate policy led to a modest decline from its intra-month highs. The commodities markets experienced significant volatility during the month. Metals prices declined precipitously for most of the month, only to subsequently rally amid rising geopolitical tensions and renewed global demand concerns. The energy markets experienced similar volatility, as seasonal demand concerns and continued unrest in the Middle East at times spurred prices higher, while increased inventories and renewed diplomatic initiatives often dragged prices lower. Many of the agricultural markets also experienced significant volatility during the month.
The unusually difficult trading conditions encountered since May continued throughout July, as the Graham Series experienced losses for the month. The specter of economic uncertainty in the U.S. and expanding hostilities globally continued to plague many global markets, resulting in excessive price volatility across nearly all market sectors. Major global bond markets experienced significant volatility during the latter half of the month, as the release of weaker-than-expected economic data triggered renewed uncertainty concerning the strength of the U.S. economy and the pace of U.S. Federal Reserve policy. Global bond yields finished the month relatively mixed, as yields in the U.S. rose slightly while those in Japan and Europe declined. Major global equity indices continued to experience significant volatility during the month. Although many global equity markets declined sharply mid-month amid growing inflationary fears and widening global conflict, equity prices generally rallied later in the month as weaker-than-expected second quarter economic data calmed interest rates concerns. The Dollar finished the month mixed versus many of the major global currencies. The Dollar experienced a decidedly turbulent month in the wake of conflicting economic data and shifting global tensions, initially posting near 3-month highs versus the Euro, the Japanese Yen and the Swiss Franc, only to reverse sharply lower. The Dollar finished the month with only modest gains versus the Euro, the Yen and the Franc, and experienced fairly significant declines versus the Mexican Peso, the South African Rand, the Australian Dollar and the British Pound. Weather-related concerns, global unrest and economic uncertainty wreaked havoc on the commodity markets, resulting in excessive volatility across the energy, metals and agricultural sectors. Natural gas prices surged nearly 35% as temperatures throughout much of the U.S. soared to triple-digit heights, while crude oil prices posted record highs amid the outbreak of fighting in Lebanon. Metals prices proved exceedingly volatile in response to changing demand forecasts, while many of the agricultural markets ebbed and flowed in response to seasonal factors.
The economic and geopolitical uncertainty which clouded the global landscape for much of the previous three months continued into August. Losses during August were primarily attributable to trading in the global fixed income markets, with smaller losses experienced across the global equity index, currency, soft commodities, and agricultural markets. A portion of the portfolios’ overall losses for the month was offset by gains attributable to emerging trends across the energy markets as prices declined sharply.
The economic and geopolitical uncertainty gave way to a more favorable climate during September. Profitable trading opportunities re-emerged across the equity, global fixed income, and commodity markets, as market participants began to forego rumor and conjecture in favor of a renewed emphasis on existing fundamentals. Major global bond markets generally advanced during the month amid ongoing speculation concerning the relative strength of the world’s major industrial economies and the future direction of global interest rates. The U.S. Treasury market continued to march higher, as relatively mild inflation readings and a deepening slump in the housing sector reinforced the prevailing notion that U.S. monetary policy will remain unchanged through the end of the year. European and Japanese bonds generally moved higher, despite indications from both the European Central Bank and the BOJ that further rate hikes may be imminent. Global bond yields generally moved lower, as the yield of the benchmark 10-year U.S. Treasury note shed 9 basis points to finish the month at the lowest levels since late-February, while the yields of the Euro Bund and the Japanese government bond shed 6 basis points and 2 basis points, respectively. Major global equity indices finished the month decidedly higher as declining bond yields and falling energy prices spawned the rebirth of investor optimism. In the U.S., the NASDAQ, Dow Jones Industrial Average, and S&P 500 recorded gains of 3.4%, 2.6%, and 2.5%, respectively, as investors generally ignored signs of a cooling U.S. economy and focused on the potential for a more favorable interest rate environment in the months ahead. Elsewhere, the EuroStoxx 50 advanced in line with U.S. equity markets, gaining 2.4%, while the Nikkei concluded the month essentially unchanged. The Dollar strengthened versus many of the major global currencies during September, although the currency markets continued to be characterized by a relatively low volatility trading environment. Conflicting U.S. economic data and cautionary statements from both the European Central Bank and the BOJ led many market participants to speculate concerning the future of interest rate differentials among the world’s leading industrial nations. The Dollar recorded its largest monthly gain versus the Euro since February, and advanced versus each of the Japanese Yen, Swiss Franc, British Pound, and Australian Dollar. Relative to other currencies, the Dollar also experienced gains versus the Mexican Peso, the Canadian Dollar, and the South African Rand. The commodity markets continued to experience significant volatility throughout the month. Energy prices continued to fall amid improving supply and demand fundamentals and severe price dislocations. Natural gas prices tumbled in excess of 30%, while crude oil prices declined approximately 10%. Gold prices shed nearly 5% in the wake of a stronger Dollar and a rally in global equity prices, and base metal prices generally declined amid waning global demand. Soft commodities and agricultural markets similarly experienced a significant degree of short-term price volatility during the month in response to a variety of seasonal factors.
Long Only Commodity Series
2007
The Long Only Commodity Series – Class 1 Net Asset Value gained 1.9%7.9% for the sixnine months ended JuneSeptember 30, 2007, net of fees and expenses; the Long Only Commodity Series – Class 2 Net Asset Value gained 2.9%9.5% for the sixnine months ended JuneSeptember 30, 2007, net of fees and expenses.
For the sixnine months ended JuneSeptember 30, 2007, the Long Only Commodity Series recorded net lossgain on investments of $56,686,$182,272, net interest of $378,698,$470,960, and total expenses of $215,871,$282,484, resulting in a net increase in Owners’ capital from operations of $106,141.$370,748. The Net Asset Value per Unit, Class 1, increased from $95.45 at December 31, 2006 to $97.28$102.98 as of JuneSeptember 30, 2007. The Net Asset Value per Unit, Class 2, increased from $97.13 at December 31, 2006, to $99.99$106.37 as of JuneSeptember 30, 2007. Total Class 1 subscriptions and redemptions for the sixnine months were $882,020$1,195,438 and $1,120,823,$1,454,030, respectively. Total Class 2 subscriptions and redemptions for the sixnine months were $123,883$146,183 and $35,288, respectively. Ending capital at JuneSeptember 30, 2007, was $4,186,383$4,417,916 for Class 1 and $206,415$242,000 for Class 2. Ending capital at December 31, 2006, was $4,321,464 for Class 1 and $115,401 for Class 22.
The Long Only Commodity Series may have long-only exposure in the Energies, Metals, and Commodities sectors. See comments above underMarket Conditions for SixNine Months Ended JuneSeptember 30, 2007 for additional information.
The Long Only Commodity Series invests approximately equally in the Jefferies Commodity Performance Index and the Reuters/Jefferies CRB Index. There are no Sector Attribution charts for the Long Only Commodity Series.
2006
The Long Only Commodity Series commenced operations on February 24, 2006. The Long Only Commodity Series – Class 1 Net Asset Value gained 9.5%lost 4.2% from the start of operations through JuneSeptember 30, 2006, net of fees and expenses; the Long Only Commodity Series – Class 2 Net Asset Value gained 10.3%lost 3.0% from the start of operations through JuneSeptember 30, 2006, net of fees and expenses.
For the sixnine months ended JuneSeptember 30, 2006, the Long Only Commodity Series recorded net loss on investments of $22,826,$338,487, net interest of $72,556,$146,215, and total expenses of $35,287,$75,507, resulting in a net increasedecrease in Owners’ capital from operations of $14,443.$267,779. The Net Asset Value per Unit, Class 1, increaseddecreased from $100.00 at the beginning of operations to $109.46$95.83 as of JuneSeptember 30, 2006. The Net Asset Value per Unit, Class 2, increaseddecreased from $100.00 at the beginning of operations to $110.28$97.03 as of JuneSeptember 30, 2006. Total Class 1 subscriptions and redemptions for the sixnine months were $908,293$3,095,483 and $38,189,$93,536, respectively. Total Class 2 subscriptions and redemptions for the sixnine months were $201,000$250,250 and $0, respectively. Ending capital at JuneSeptember 30, 2006 was $882,947$2,758,433 for Class 1 and $202,600$225,985 for Class 2.
Both the Reuters/Jefferies-CRB and Jefferies-CPI indices were up strongly in March, leading to a positive month and first quarter for the Long-Only Series.
Gains in metals and energy resulted in a strong performance in April. Crude oil futures followed through on the previous month’s breakout, peaking at more than $75/bbl before pulling back to finish the month at $71.88/bbl, up 5.8%. Heating oil and gasoline continued trending upward, with the latter peaking just above $2.20/gal and closing the month at $2.09/gal. Lack of demand continued to push natural gas lower, falling more than 11% during April.
(All contracts June delivery, prices in U.S. Dollars.) Copper continued its meteoric rise in April, with the July contract gaining more than 31% to close the month at $3.22/lb. Most other base metals moved higher in April, as well. In precious metals, the June gold contract tacked on 11.5% to finish at $654/oz. Silver prices plunged on April 20, losing more than 17% in a single day and causing many to wonder if the party was over. It recovered toward the end of the month, however, and finished higher by 17.4% to $13.63/oz. While most soft commodities were range-bound and directionless during April, cotton prices continued a downtrend begun in February and dropped another 5.3%.
Performance was mixed in May. Crude oil futures were volatile, and difficult to trade, finishing the month at $71.29/bbl, down $5 from the intraday high on May 2. Heating oil and gasoline were both range-bound with high volatility, finishing the month little changed from April’s close. Natural gas futures prices continued to fall, losing more than 6% during the month. (All contracts July delivery.) The metals markets have been overheated for weeks, and prices peaked on May 11 and beat a hasty retreat after that. In spite of the reversal and a drop of 10% from the intraday high, copper finished the month 12% higher. In precious metals, the August gold contract lost $87 from the May 11 high to finish at $649/oz. Silver prices ended at $12.45/oz., down 8.6% from the April close. Grains were mixed in April, with Wheatwheat breaking out of a trading range, but unable to follow through. Cattle heated up, reversing a downtrend and moving impressively upward through the month. Coffeemonth, while coffee lost ground, finishing the month down 9.4%.
Energy futures continued to be volatile and difficult to trade in June, with crude oil finishing the month at $73.93/bbl, up $1.64 from May’s close. Heating oil was nearly unchanged, and gasoline was up $0.14/gal to $2.22/gal. Natural gas futures prices continued to fall, losing nearly 8% during the month. (All contracts August delivery.) Precious metals prices continued to fall in the first days of the month, with longs apparently capitulating on June 13.month. Prices moved up after that, although not enough to recover the earlier losses. Copper finished the month -6.5%6.5% lower. The August gold contract was lower by 5.1% to finish at $616/oz. September Silversilver prices ended at $10.92/oz., down 13.1% from the May close and off 27.2% from the May 11 high. The grain complex was just as difficult as every other sector in June, with wheat, corn, and soybeans all displayingdisplayed volatile prices with little directional movement from which to profit.movement. Cattle futures continued to move upward in June, providing one of very few directional opportunities during the month.June. Cocoa futures broke out of a trading range and moved sharply upward.
Energy futures continued to be volatile in July, with tropical weather concerns and Middle East conflict pushing crude oil to an intraday high of nearly $80/bbl in the middle of the month. Prices then retreated sharply to finish July little changed at $74.40/bbl. Heating oil was down just over 2% and gasoline was up slightly to $2.21/gal. With a midsummer heat wave gripping most of the U.S., demand for electricity to drive air conditioners drove natural gas futures sharply higher, up nearly 29% by the end of the month. Metals prices began to recover in July. Copper finished the month 6.4% higher. The December gold contract was higher by 2.8% to finish at $646.80/oz. September silver prices ended at $11.37/oz., up 4.1%. After streaking upward in June, cattle futures took a breather and consolidated their gains in July. The grains complex was uneventful during the month, with the exception of soybean meal, which broke sharply out of a trading range and continued down. Following a sharp run-up in the previous four weeks, cocoa prices collapsed on July 17, losing 9% in one day.
Energy futures fell across the board in August, coming off all-time highs in crude oil prices in July. The apparent end to the most recent Middle East war combined with a milder-than-expected hurricane season through August allowed crude oil prices to fall more than 7.1% to $70.26/bbl. Heating oil was down just over 4.6% and gasoline fell by 15% to $1.78/gal. With the summer heat wave abating, natural gas futures fell sharply, down 28% by the end of the month. Although gold prices fell slightly to $634/oz, silver futures were higher by 13% to $13.03/oz. Copper futures were range-bound, finishing the month off 1.6%. Feeder cattle were up only slightly, but live cattle futures climbed steadily and finished the month higher by nearly 5%. Lean hogs climbed by more than 8% during August. Corn and the soybean complex declined steadily during the month, while wheat finished up slightly to $4.22/bu. Orange juice prices hit a 14-year high, topping out at $1.85/lb.
Energy futures continued to fall sharply in September. Crude oil fell nearly 12% to $62.91/bbl. Heating oil was down just over 15.2% and gasoline fell by 13.6% to $1.55/gal. Natural gas futures set new two-year lows, down 31.7% by the end of the month. Precious metals prices fell in September, with gold down 4.7% to $604/oz and silver lower by 11.4% to $11.54/oz. Copper futures continued to be range-bound, finishing the month little changed. After setting new contract highs early in the month, cattle futures fell in September. While corn and wheat broke out to the upside, soybeans continued to exhibit range-bound trading. Sugar and cotton prices continued to fall, while orange juice prices also backed off from the 14-year highs set in the previous month, falling 6.3%.
Long/Short Commodity Series
2007
The Long/Short Commodity Series – Class 1 Net Asset Value lost 0.4% for the sixnine months ended JuneSeptember 30, 2007, net of fees and expenses; the Long/Short Commodity Series – Class 2 Net Asset Value gained 1.1%1.8% for the sixnine months ended JuneSeptember 30, 2007, net of fees and expenses.
For the sixnine months ended JuneSeptember 30, 2007, the Long/Short Commodity Series recorded net loss on investments of $1,394,545,$3,055,236, net interest of $481,561,$776,033, and total expenses of $1,054,055,$1,914,562, resulting in a net decrease in Owners’ capital from operations of $149,410$101,986 after minority interests of $1,817,629.$4,091,779. The Net Asset Value per Unit, Class 1, decreased from $100.42 at December 31, 2006, to $99.98$99.97 as of JuneSeptember 30, 2007. The Net Asset Value per Unit, Class 2, increased from $102.93 at December 31, 2006, to $104.02$104.79 as of JuneSeptember 30, 2007. Total Class 1 subscriptions and redemptions for the sixnine months were $10,995,825$15,534,164 and $1,813,495,$4,145,451, respectively. Total Class 2 subscriptions and redemptions for the sixnine months were $460,183$999,498 and $364,162,$471,530, respectively. Ending capital at JuneSeptember 30, 2007, was $28,479,912$30,701,168 for Class 1 and $2,825,106$3,289,604 for Class 2. Ending capital at December 31, 2006, was $19,478,595 for Class 1 and $2,697,482 for Class 2.
The Long/Short Commodity Series may have both long and short exposure to the Interest Rates, Currencies, Stock Indices, Energies, Metals, and Commodities sectors, although the majority of the exposure will typically be in the Energies, Metals, and Commodities sectors. See comments above underMarket Conditions for SixNine Months Ended JuneSeptember 30, 2007 for additional information.
Sector Attribution for the Long/Short Commodity Series
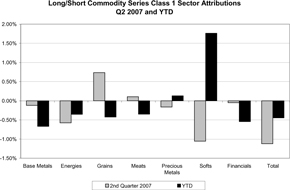 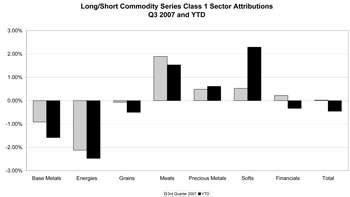 | 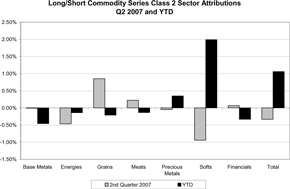 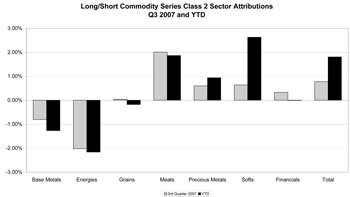 |
2006
The Long/Short Commodity Series commenced operations on February 24, 2006. The Long/Short Commodity Series – Class 1 Net Asset Value lost 1.5%5.2% from the start of operations through JuneSeptember 30, 2006, net of fees and expenses; the Long/Short Commodity Series – Class 2 Net Asset Value lost 0.5%3.5% from the start of operations through JuneSeptember 30, 2006, net of fees and expenses.
For the sixnine months ended JuneSeptember 30, 2006, the Long/Short Commodity Series recorded net loss on investments of $255,556,$731,894, net interest of $218,594,$570,920, and total expenses of $300,987,$826,337, resulting in a net decrease in Owners’ capital from operations of $337,949.$987,311. The Net Asset Value per Unit, Class 1, decreased from $100.00 at the beginning of operations to $98.51$94.82 as of JuneSeptember 30, 2006. The Net Asset Value per Unit, Class 2, decreased from $100.00 at the beginning of operations to $99.51$96.49 as of JuneSeptember 30, 2006. Total Class 1 subscriptions and redemptions for the sixnine months were $11,526,738$20,042,399 and $14,626,$202,083, respectively. Total Class 2 subscriptions and redemptions for the sixnine months were $1,241,397$2,445,225 and $0,$40,000, respectively. Ending capital at JuneSeptember 30, 2006 was $11,202,814$18,939,882 for Class 1 and $1,212,746$2,318,348 for Class 2.
The Energyenergy and Commoditiescommodities sectors led the way in March as the Long-Short Commodity Series got off to a strong start.
In April, crude oil futures followed through on the previous month’s breakout, peaking at more than $75/bbl before pulling back to finish the month at $71.88/bbl, up 5.8%. Heating oil and gasoline continued trending upward, with the latter peaking just above $2.20/gal and closing the month at $2.09/gal. Lack of demand continued to push natural gas lower, falling more than 11% during April. (All contracts June delivery, prices in U.S. Dollars.) Copper continued its meteoric rise in April, with the July contract gaining more than 31% to close the month at $3.22/lb. Most other base metals moved higher in April as well. In precious metals, the June gold contract tacked on 11.5% to finish at $654/oz. Silver prices plunged on April 20, losing more than 17% in a single day. It recovered toward the end of the month, however, and finished higher by 17.4% to $13.63/oz. While most soft commodities were range-bound and directionless during April, cotton prices continued a downtrend begunwhich began in February and dropped another 5.3%.
Performance was negative in May. Crude oil futures were volatile and difficult to trade, finishing the month at $71.29/bbl, down $5 from the intraday high on May 2. Heating oil and gasoline were both range-bound with high volatility, finishing the month little changed from April’s close. Natural gas futures prices continued to fall, losing more than 6% during the month. (All contracts July delivery.) The metals markets have been overheated for weeks, and prices peaked on May 11 and beat a hasty retreat after that. In spite of the reversal and a drop of 10% from the intraday high, Copper finished the month 12% higher. In precious metals, the August gold contract lost $87 from the May 11 high to finish at $649/oz. Silver prices ended at $12.45/oz., down 8.6% from the April close. Grains were mixed in April, with wheat breaking out of a trading range, but unable to follow through. Cattle heated up, reversing a downtrend and moving impressively upward through the month. Coffee lost ground, finishing the month -9.4%down 9.4%.
Energy futures continued to be volatile and difficult to trade in June, with crude oil finishing the month at $73.93/bbl, up $1.64 from May’s close. Heating oil was nearly unchanged, and gasoline was up $0.14/gal to $2.22/gal. Natural gas futures prices continued to fall, losing nearly 8% during the month. (All contracts August delivery.) Precious metals prices continued to fall in the first days of the month, with longs apparently capitulating on June 13. Prices moved up after that, although not enough to recover the earlier losses. Copper finished the month 6.5% lower. The August gold contract was lower by 5.1% to finish at $616/oz. September silver prices ended at $10.92/oz., down 13.1% from the May close and off 27.2% from the May 11 high. The grain complex was just as difficult as every other sector in June, with wheat, corn, and soybeans all displaying volatile prices with little directional movement from which to profit. Cattle futures continued to move upward in June, providing one of very few directional opportunities during the month. Cocoa futures broke out of a trading range and moved sharply upward.
Energy futures continued to be volatile and difficult to trade in July, with tropical weather concerns and Middle East conflict pushing crude oil to an intraday high of nearly $80/bbl in the middle of the month. Prices then retreated sharply to finish July little changed at $74.40/bbl. Heating oil was down just over 2% and gasoline was up slightly to $2.21/gal. With a midsummer heat wave gripping most of the US, demand for electricity to drive air conditioners drove natural gas futures sharply higher, up nearly 29% by the end of the month. Metals prices began to recover in July, although elevated volatility continued to provide a difficult environment for traders. Copper finished the month 6.4% higher. The December gold contract was higher by 2.8% to finish at $646.80/oz. September silver prices ended at $11.37/oz., up 4.1%. After streaking upward in June, cattle futures took a breather and consolidated their gains in July. The grains complex was uneventful during the month, with the exception of soybean meal, which broke sharply out of a trading range and continued down. Following a sharp run-up in the previous four weeks, cocoa prices collapsed on July 17, losing 9% in one day.
Energy futures fell across the board in August, coming off all-time highs in crude oil prices in July. The apparent end to the most recent Middle East war combined with a milder-than-expected hurricane season through August allowed crude oil prices to fall more than 7.1% to $70.26/bbl. Heating oil was down just over 4.6% and gasoline fell by 15% to $1.78/gal. With the summer heat wave abating, natural gas futures fell sharply, down 28% by the end of the month. Although gold prices fell slightly to $634/oz, silver futures were higher by 13% to $13.03/oz. Copper futures were range-bound, finishing the month off 1.6%. ) Feeder cattle was up only slightly, but live cattle futures climbed steadily and finished the month higher by nearly 5%. Lean hogs climbed by more than 8% during August. Corn and the soybean complex declined steadily during the month, while wheat finished up slightly to $4.22/bu. Orange juice prices hit a 14-year high, topping out at $1.85/lb.
Energy futures continued to fall sharply in September. Crude oil fell nearly 12% to $62.91/bbl. Heating oil was down just over 15.2% and gasoline fell by 13.6% to $1.55/gal. Natural gas futures set new two-year lows, down 31.7% by the end of the month. Precious metals prices fell in September, with gold down 4.7% to $604/oz and silver lower by 11.4% to $11.54/oz. Copper futures continued to be range-bound, finishing the month little changed. After setting new contract highs early in the month, cattle futures fell in September. While corn and wheat broke out to the upside, soybeans continued to exhibit range-bound trading. Sugar and cotton prices continued to fall, while orange juice prices also backed off from the 14-year highs set in the previous month, falling 6.3%.
Managed Futures Index Series
2007
The Managed Futures Index Series – Class 1 Net Asset Value gained 0.7%0.1% for the sixnine months ended JuneSeptember 30, 2007, net of fees and expenses; the Managed Futures Index Series – Class 2 Net Asset Value gained 1.7%1.6% for the sixnine months ended JuneSeptember 30, 2007, net of fees and expenses.
For the sixnine months ended JuneSeptember 30, 2007 the Managed Futures Index Series recorded a net loss on investments of $35,973,$35,005, net interest of $152,732,$157,607, and total expenses of $104,579,$111,998, resulting in a net increase in Owners’ capital from operations of $12,180.$10,604. The Net Asset Value per Unit, Class 1, increased from $96.75 at December 31, 2006, to $97.39$96.85 as of JuneSeptember 30, 2007. The Net Asset Value per Unit, Class 2, increased from $98.43 at December 31, 2006, to $100.08$100.03 as of JuneSeptember 30, 2007. Total Class 1 subscriptions and redemptions for the sixnine months were $199,685$231,448 and $78,743,$121,237, respectively. Total Class 2 subscriptions for the sixnine months ended JuneSeptember 30, 2007 were $30,000.$32,400. There were no redemptions. Ending capital at JuneSeptember 30, 2007, was $630,260$617,971 for Class 1 and $85,591$87,973 for Class 2. Ending capital at December 31, 2006, was $500,070 for Class 1 and $52,659 for Class 2.
The Managed Futures Index Series may have both long and short exposure to the Interest Rates, Currencies, Stock Indices, Energies, Metals, and Commodities sectors. See comments above underMarket Conditions for SixNine Months Ended JuneSeptember 30, 2007 for additional information.
Sector Attribution for the Managed Futures Index Series
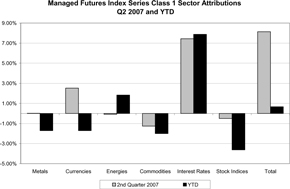 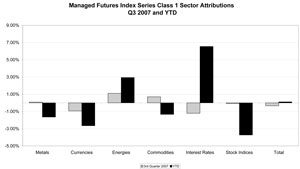 | 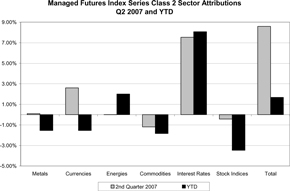 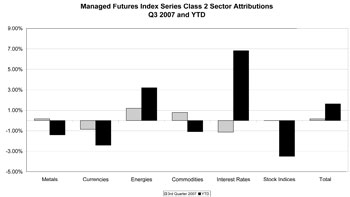 |
2006
The Managed Futures Index Series commenced operations on February 24, 2006. The Managed Futures Index Series – Class 1 Net Asset Value lost 0.7%5.0% from the start of operations through JuneSeptember 30, 2006, net of fees and expenses; the Managed Futures Index Series – Class 2 Net Asset Value remained virtually unchangedlost 3.8% from the start of operations through JuneSeptember 30, 2006, net of fees and expenses.
For the sixnine months ended JuneSeptember 30, 2006, the Managed Futures Index Series recorded net loss on investments of $57,218,$102,053, net interest of $95,681,$192,914, and total expenses of $49,408,$114,371, resulting in a net decrease in Owners’ capital from operations of $10,945.$23,510. The Net Asset Value per Unit, Class 1, decreased from $100.00 at the beginning of operations to $99.26$95.00 as of JuneSeptember 30, 2006. The Net Asset Value per Unit, Class 2, decreased from $100.00 at the beginning of operations to $99.98$96.17 as of JuneSeptember 30, 2006. Total Class 1 subscriptions and redemptions for the sixnine months were $234,327$375,679 and $81,$91,015, respectively. Total Class 2 subscriptions and redemptions for the sixnine months were $51,000$53,500 and $0, respectively. Ending capital at JuneSeptember 30, 2006 was $223,368$263,205 for Class 1 and $50,933$51,449 for Class 2.
Trading activity in the Managed Futures Index Series began in late April 2006. Performance in April and May was positive. June performance, as expected, reflected the performance of the industry as a whole and was down for the monthmonth.
Net performance in the third quarter was negative, as losses in the currency and interest rate sectors dominated performance. As has been the case all year, the currency sector was negatively affected by range-bound trading during the third quarter. A strong performance in the energy sector in September made it the most profitable since the Series began trading in April. Currencies is the most negative sector, reflecting the difficult trading conditions that have affected many trading advisors since before the beginning of the year.
Critical Accounting Policies and Estimates
The preparation of financial statements in conformity with accounting principles generally accepted in the U.S. requires the Managing Owner to adopt accounting policies and make estimates and assumptions that affect amounts reported in the Trust’s financial statements. The Trust’s critical accounting policies and related estimates and judgments underlying the financial statements are as identified below.
Investment and Swap Transactions and Valuation—The Trust records investment transactions on a trade date basis and all investments are recorded at fair value in its financial statements, with changes in fair value reported as a component of Trading Profits (Losses) and unrealized equity in earnings on investments in affiliated Series in the Statements of Operations. Generally, fair values are based on quoted market prices; however, in certain circumstances, significant judgments and estimates may be required in determining fair value in the absence of an active market closing price.
Allocation of Trading Profits or Losses—–Each Series of the Trust offers two sub-classes of Units – Class 1 and Class 2. All classes have identical voting, dividend, liquidation and other rights and the same terms and conditions, except that Class 1 Units of each Series bear certain expenses related to the servicing of such Units. Revenues, expenses (other than expenses attributable to a specific class), and realized and unrealized trading profits and losses of each Series are allocated daily to Class 1 and Class 2 Units based on each Class’ relative owners’ capital balance.
Each Series allocates funds to a subsidiary Trading Company, or Trading Companies, of the Trust. Each Trading Company allocates all of its daily trading profits or losses to the Series in proportion to each Series’ funds allocated to the Trading Company, adjusted on a daily basis. As of JuneSeptember 30, 2007, the value of all open contracts and cash held at clearing brokers is similarly allocated to the Series in proportion to each Series’ funds allocated to the Trading Company, or Companies.
Interest Income—Interest income from all sources, including assets held at clearing brokers and cash and cash equivalents held at banks, is aggregated and allocated across all Series in proportion to their daily NAV.
In applying these policies, the Managing Owner may make judgments that can frequently require estimates about matters that are inherently uncertain.
Off-Balance Sheet Risk
The term “off-balance sheet risk” refers to an unrecorded potential liability that, even though it does not appear on the balance sheet, may result in future obligation or loss. Each Trading Company trades in futures, forward and swap contractsSwaps and is therefore a party to financial instruments with elements of off-balance sheet market and credit risk. In entering into these contracts there exists a market risk that such contracts may be significantly influenced by market conditions, such as interest rate volatility, resulting in such contracts being less valuable. If the markets should move against all of the futures interests positions held by a Trading Company in respect of any Series at the same time, and if the Trading Advisor(s) of such Trading Company are unable to offset such futures interests positions, such Trading Company could lose all of its assets and the holders of Units of such Series would realize a 100% loss. The Managing Owner seeks to minimize market risk through real-time monitoring of open positions and the level of diversification of each Trading Advisor’s portfolio. It is anticipated that any Trading Advisor’s margin-to-equity ratio will typically not exceed approximately 35% although the actual ratio could be higher or lower from time to time.
In addition to market risk, trading futures, forward and swap contractsSwaps entails credit risk in that a counterparty will not be able to meet its obligations to a Trading Company. The counterparty for futures contracts traded in the U.S. and on most foreign exchanges is the clearinghouse associated with such exchange. In general, clearinghouses are backed by the corporate members of the clearinghouse who are required to share any financial burden resulting from the non-performance by one of their members and, as such, should significantly reduce this credit risk. In cases where the clearinghouse is not backed by the clearing members, like some foreign exchanges, it is normally backed by a consortium of banks or other financial institutions. Some non-U.S. exchanges, in contrast to U.S. exchanges are principals’ markets in which performance is the responsibility only of the individual counterparty with whom the Trading Company has entered into the transaction with and not of the exchange or clearing corporation. In these kinds of markets, there is risk of bankruptcy or other failure or refusal to perform by the counterparty.
In the case of forward contracts traded on the interbank market and swaps, neither are traded on exchanges. The counterparty is generally a single bank or other financial institution, rather than a group of financial institutions; thus there may be a greater counterparty credit risk. The Managing Owner expects the Trading Advisors to trade only with those counterparties which it believes to be creditworthy. All positions of each Trading Company are valued each day on a mark-to-market basis. There can be no assurance that any clearing member, clearinghouse or other counterparty will be able to meet its obligations to any Trading Company. See Part I, Item 1, Notes to Financial Statements as of JuneSeptember 30, 2007, Off-Balance Sheet Risk.
| ITEM 3. | QUANTITATIVE AND QUALITATIVE DISCLOSURES ABOUT MARKET RISK |
The Series are speculative commodity pools. The market sensitive instruments which are held by the Trading Companies in which the Series are invested are acquired for speculative trading purposes, and all or a substantial amount of the Series’ assets are subject to the risk of trading loss. Unlike an operating company, the risk of market sensitive instruments is integral, not incidental, to the Series’ main line of business.
Market movements result in frequent changes in the fair market value of each Trading Company’s open positions and, consequently, in each Series of the Trust’s earnings and cash flow. The Trading Companies’ and consequently the Series’ market risk is influenced by a wide variety of factors, including the level and volatility of exchange rates, interest rates, equity price levels, the market value of financial instruments and contracts, the diversification effects among the open positions and the liquidity of the markets in which trades are made.
Each Trading Company rapidly acquires and liquidates both long and short positions in a wide range of different markets. Consequently, it is not possible to predict how a particular future market scenario will affect performance, and the past performance for any Series is not necessarily indicative of the future results of such Series.
The Trading Companies’ and consequently the Series’ primary market risk exposures as well as the strategies used and to be used by the Trading Advisors for managing such exposures are subject to numerous uncertainties, contingencies and risks, any one of which could cause the actual results of the Trust’s and the Managing Owner’s risk controls to differ materially from the objectives of such strategies. Government interventions, defaults and expropriations, illiquid markets, the emergence of dominant fundamental factors, political upheavals, changes in historical price relationships, an influx of new market participants, increased regulation and many other factors could result in material losses as well as in material changes to the risk exposures and the risk management strategies of the Trading Companies and consequently the Trust. There can be no assurance that the Trading Companies’ current market exposure and/or risk management strategies will not change materially or that any such strategies will be effective in either the short- or long-term. Investors must be prepared to lose all or substantially all of their investment in a Series.
Quantitative Market Risk
Trading Risk
The Series’ approximate risk exposure in the various market sectors traded by its trading advisors is quantified below in terms of value at risk. Due to the Series’ mark-to-market accounting, any loss in the fair value of the Series’ (through the Trading Companies) open positions is directly reflected in the Series’ earnings, realized or unrealized.
Exchange maintenanceinitial margin requirements have been used by the Trust as the measure of its value at risk. MaintenanceInitial margin requirements are set by exchanges to equal or exceed the maximum losses reasonably expected to be incurred in the fair value of any given contract in 95% to 99% of any one-day interval. The maintenanceinitial margin levels are established by brokers, dealers and exchanges using historical price studies as well as an assessment of current market volatility and economic fundamentals to provide a probabilistic estimate of the maximum expected near-term one-day price fluctuation. Maintenance margin has been used rather than the more generally available initial margin, because initial margin includes a credit risk component that is not relevant to value at risk.
In the case of market sensitive instruments that are not exchange-traded, including currencies and some energy products and metals, the margin requirements for the equivalent futures positions have been used as value at risk. In those cases in which a futures-equivalent margin is not available, dealers’ margins have been used.
In the case of contracts denominated in foreign currencies, the value at risk figures include foreign currency margin amounts converted into U.S. Dollars with an incremental adjustment to reflect the exchange rate risk inherent to the Series, which is valued in U.S. Dollars, in expressing value at risk in a functional currency other than U.S. Dollars.
In quantifying each Series’ value at risk, 100% positive correlation in the different positions held in each market risk category has been assumed. Consequently, the margin requirements applicable to the open contracts have simply been aggregated to determine each trading category’s aggregate value at risk. The diversification effects resulting from the fact that the Series’ positions held through the Trading Companies are rarely, if ever, 100% positively correlated have not been reflected.
Value at Risk by Market Sectors
The following table presents the trading value at risk associated with the each Series’ exposure to open positions (as held by the Trading Companies) by market sector as of JuneSeptember 30, 2007. All open position trading risk exposures of the Series have been included in calculating the figures set forth below.
Balanced Series: (1), (2)
MARKET SECTOR | VALUE AT RISK | % OF TOTAL CAPITALIZATION | VALUE AT RISK | % OF TOTAL CAPITALIZATION | ||||||||
Interest Rates | $ | 12,454,037 | 4.1 | % | $ | 2,684,702 | 1.0 | % | ||||
Currencies | $ | 10,997,064 | 3.7 | % | $ | 9,088,383 | 3.4 | % | ||||
Stocks / Stock Indices | $ | 11,716,035 | 3.9 | % | $ | 11,538,796 | 4.3 | % | ||||
Metals | $ | 2,485,583 | 0.8 | % | $ | 1,941,816 | 0.7 | % | ||||
Agriculturals/Softs | $ | 4,579,969 | 1.5 | % | $ | 4,719,052 | 1.7 | % | ||||
Energy | $ | 2,395,851 | 0.8 | % | $ | 2,251,780 | 0.8 | % | ||||
Total: | $ | 44,628,539 | 14.8 | % | $ | 32,224,529 | 11.9 | % | ||||
Winton Series:
MARKET SECTOR | VALUE AT RISK | % OF TOTAL CAPITALIZATION | VALUE AT RISK | % OF TOTAL CAPITALIZATION | ||||||||
Interest Rates | $ | 641,228 | 2.5 | % | $ | 476,770 | 1.4 | % | ||||
Currencies | $ | 370,839 | 1.5 | % | $ | 526,679 | 1.5 | % | ||||
Stocks / Stock Indices | $ | 709,002 | 2.8 | % | $ | 558,963 | 1.6 | % | ||||
Metals | $ | 182,643 | 0.7 | % | $ | 225,194 | 0.6 | % | ||||
Agriculturals/Softs | $ | 252,269 | 1.0 | % | $ | 377,027 | 1.1 | % | ||||
Energy | $ | 109,634 | 0.4 | % | $ | 242,778 | 0.7 | % | ||||
Total: | $ | 2,265,615 | 8.9 | % | $ | 2,407,411 | 6.9 | % | ||||
Currency Series:
MARKET SECTOR | VALUE AT RISK | % OF TOTAL CAPITALIZATION | ||||
Interest Rates | $ | 0 | 0 | % | ||
Currencies | $ | 1,316,875 | 12.9 | % | ||
Stocks / Stock Indices | $ | 0 | 0 | % | ||
Metals | $ | 0 | 0 | % | ||
Agriculturals/Softs | $ | 0 | 0 | % | ||
Energy | $ | 0 | 0 | % | ||
Total: | $ | 1,316,875 | 12.9 | % | ||
MARKET SECTOR Interest Rates Currencies Stocks / Stock Indices Metals Agriculturals/Softs Energy Total: VALUE AT RISK % OF TOTAL
CAPITALIZATION $ 0 0 % $ 1,425,943 12.9 % $ 0 0 % $ 0 0 % $ 0 0 % $ 0 0 % $ 1,425,943 12.9 %
Dunn Series:
MARKET SECTOR | VALUE AT RISK | % OF TOTAL CAPITALIZATION | VALUE AT RISK | % OF TOTAL CAPITALIZATION | ||||||||
Interest Rates | $ | 15,062 | 15.9 | % | $ | 1,308 | 2.2 | % | ||||
Currencies | $ | 3,788 | 4.0 | % | $ | 952 | 1.6 | % | ||||
Stocks / Stock Indices | $ | 11,811 | 12.5 | % | $ | 6,966 | 11.9 | % | ||||
Metals | $ | 1,207 | 1.3 | % | $ | 421 | 0.7 | % | ||||
Agriculturals/Softs | $ | 6,264 | 6.6 | % | $ | 2,151 | 3.7 | % | ||||
Energy | $ | 1,368 | 1.4 | % | $ | 989 | 1.7 | % | ||||
Total: | $ | 39,500 | 41.7 | % | $ | 12,787 | 21.8 | % | ||||
Graham Series:
MARKET SECTOR | VALUE AT RISK | % OF TOTAL CAPITALIZATION | VALUE AT RISK | % OF TOTAL CAPITALIZATION | ||||||||
Interest Rates | $ | 213,557 | 2.9 | % | $ | 25,047 | 0.3 | % | ||||
Currencies | $ | 847,160 | 11.6 | % | $ | 998,043 | 13.8 | % | ||||
Stocks / Stock Indices | $ | 263,607 | 3.6 | % | $ | 49,990 | 0.7 | % | ||||
Metals | $ | 0 | 0 | % | $ | 29,269 | 0.4 | % | ||||
Agriculturals/Softs | $ | 23,905 | 0.3 | % | $ | 17,233 | 0.2 | % | ||||
Energy | $ | 22,185 | 0.3 | % | $ | 96,881 | 1.3 | % | ||||
Total: | $ | 1,370,414 | 18.7 | % | $ | 1,216,463 | 16.7 | % | ||||
Campbell/Graham Series:
MARKET SECTOR | VALUE AT RISK | % OF TOTAL CAPITALIZATION | ||||
Interest Rates | $ | 2,217,920 | 3.5 | % | ||
Currencies | $ | 5,674,268 | 9.0 | % | ||
Stocks / Stock Indices | $ | 1,811,210 | 2.9 | % | ||
Metals | $ | 169,824 | 0.3 | % | ||
Agriculturals/Softs | $ | 105,744 | 0.2 | % | ||
Energy | $ | 206,866 | 0.3 | % | ||
Total: | $ | 10,185,832 | 16.2 | % | ||
MARKET SECTOR Interest Rates Currencies Stocks / Stock Indices Metals Agriculturals/Softs Energy Total: VALUE AT RISK % OF TOTAL
CAPITALIZATION $ 345,722 0.6 % $ 5,320,238 9.0 % $ 1,276,752 2.2 % $ 320,288 0.5 % $ 53,016 0.1 % $ 374,596 0.6 % $ 7,690,612 13.0 %
Long Only Commodity Series:
MARKET SECTOR | VALUE AT RISK | % OF TOTAL CAPITALIZATION | VALUE AT RISK | % OF TOTAL CAPITALIZATION | ||||||||
Interest Rates | $ | 0 | 0 | % | — | — | ||||||
Currencies | $ | 0 | 0 | % | — | — | ||||||
Stocks / Stock Indices | $ | 0 | 0 | % | — | — | ||||||
Metals | $ | 249,992 | 5.7 | % | $ | 120,000 | 1.1 | % | ||||
Agriculturals/Softs | $ | 354,156 | 8.1 | % | $ | 170,000 | 1.6 | % | ||||
Energy | $ | 437,486 | 10.0 | % | $ | 210,000 | 2.0 | % | ||||
Total: | $ | 1,041,634 | 23.8 | % | $ | 500,000 | 4.7 | % | ||||
Long/Short Commodity Series:
MARKET SECTOR | VALUE AT RISK | % OF TOTAL CAPITALIZATION | VALUE AT RISK | % OF TOTAL CAPITALIZATION | ||||||||
Interest Rates | $ | 2,577 | 0.0 | % | $ | 21,247 | 0.1 | % | ||||
Currencies | $ | 42,557 | 0.1 | % | $ | 55,214 | 0.2 | % | ||||
Stocks / Stock Indices | $ | 68,687 | 0.2 | % | $ | 76,255 | 0.2 | % | ||||
Metals | $ | 255,530 | 0.8 | % | $ | 356,598 | 1.1 | % | ||||
Agriculturals/Softs | $ | 613,111 | 2.0 | % | $ | 1,566,725 | 4.6 | % | ||||
Energy | $ | 279,402 | 0.9 | % | $ | 973,258 | 2.9 | % | ||||
Total: | $ | 1,261,864 | 4.0 | % | $ | 3,049,297 | 9.1 | % | ||||
Managed Futures Index Series:
MARKET SECTOR | VALUE AT RISK | % OF TOTAL CAPITALIZATION | ||||
Interest Rates | $ | 20,068 | 2.8 | % | ||
Currencies | $ | 50,037 | 7.0 | % | ||
Stocks / Stock Indices | $ | 10,224 | 1.4 | % | ||
Metals | $ | 7,349 | 1.0 | % | ||
Agriculturals/Softs | $ | 2,660 | 0.4 | % | ||
Energy | $ | 9,927 | 1.4 | % | ||
Total: | $ | 100,265 | 14.0 | % | ||
(1) As of September 30, 2007, the Balanced Series was invested in the Currency Series. The Balanced Series effective ownership in this Series as of September 30, 2007, was 29.4%. Including its investment in this Series, total value at risk for the Balanced Series would be $32,612,154, or 12.1% of capitalization as of September 30, 2007. | ||||||||||||||||||||||||||||||||||||||||||||||||||||||||||||||||
(2) As of September 30, 2007, the Balanced Series was invested in a Swap with a notional value of $28,000,000. Margin information is not available for this contract therefore no value at risk calculations were included in the table for this investment.
Material Limitations on Value at Risk as an Assessment of Market Risk
The face value of the market sector instruments held on behalf of the Series is typically many times the applicable maintenance margin requirement, which generally ranges between approximately 1% and 10% of contract face value, as well as many times the capitalization of the Series. The magnitude of each Series’ open positions creates a risk of loss not typically found in most other investment vehicles. Because of the size of their positions, certain market conditions, although unusual, but historically recurring from time to time, could cause a Series to incur severe losses over a short period of time. The value at risk tables above, as well as the past performance of the Series, gives no indication of this risk of loss.
Non-Trading Risk
The Series have non-trading market risk on their foreign cash balances not needed for margin. However, these balances, as well as the market risk they represent, are immaterial. The Series also have non-trading market risk as a result of investing a portion of their available assets in time deposits. The market risk represented by these investments is also immaterial.
Qualitative Market Risk
The following are the primary trading risk exposures of the Series of the Trust as of JuneSeptember 30, 2007, by market sector.
Interest rates
Interest rate risk is one of the principal market exposures of each Series. Interest rate movements directly affect the price of interest rate futures positions held and indirectly the value of a Trading Company’s stock index and currency positions. Interest rate movements in one country as well as relative interest rate movements between countries materially impact profitability. The primary interest rate exposure is to interest rate fluctuations in the
U.S. and the other G-8 countries. However, the Trading Companies also may take futures positions on the government debt of smaller nations. The Managing Owner anticipates that G-8 interest rates will remain the primary market exposure of each Trading Company and accordingly each Series for the foreseeable future. The changes in interest rates which are expected to have the most effect on the Series are changes in long-term, as opposed to short-term rates. Most of the speculative positions to be held by the Trading Companies will be in medium- to long-term instruments. Consequently, even a material change in short-term rates is expected to have little effect on the Series if the medium- to long-term rates remain steady. The first two percent (2.0%) of interest income per annum earned by the Trust for the Balanced Series (Class 1 and Class 2 only), Winton Series, Campbell Graham Series, Currency Series, Dunn Series and Graham Series is paid to the Managing Owner. In addition, if interest rates fall below 0.75%, the Managing Owner is paid the difference between the Trust’s annualized income interest and 0.75%. Interest income above 2.0% per these Series is retained by the Series. Interest income earned by the Trust for the Balanced Series (Class 1a and 2a), Long Only Commodity Series, Long/Short Commodity Series and the Managed Futures Index Series is allocated twenty percent (20.0%) being paid to the Managing Owner and eighty percent (80.0%) retained by these Series.
Currencies
Exchange rate risk is a significant market exposure of each Series of the Trust in general and the Currency Series in particular. For each Series of the Trust in general and the Currency Series in particular currency exposure is to exchange rate fluctuations, primarily fluctuations that disrupt the historical pricing relationships between different currencies and currency pairs. These fluctuations are influenced by interest rate changes as well as political and general economic conditions. The Trading Advisors on behalf of a Series trade in a large number of currencies, including cross-rates, which are positions between two currencies other than the U.S. Dollar. The Managing Owner does not anticipate that the risk profile of the Series’ currency sector will change significantly in the future.
Stock Indices
For each Series (other than the Currency Series), its primary equity exposure is equity price risk in the G-8 countries as well as other smaller jurisdictions. Each Series of the Trust (other than the Currency Series) is primarily exposed to the risk of adverse price trends or static markets in the major U.S., European and Japanese indices.
Metals
For each Series (other than the Currency Series), its metals market exposure is fluctuations in the price of both precious metals, including gold and silver, as well as base metals including aluminum, copper, nickel and zinc. Some metals, such as gold, are used as surrogate stores of value, in place of hard currency, and thus have an associated currency or interest rate risk associated with them relative to their price in a specific currency. Other metals, such as silver, platinum, copper and steel, have substantial industrial applications, and may be subject to forces affecting industrial production and demand.
Agriculturals/SoftsSofts
Each Series (other than the Currency Series) may also invest in raw commodities and may thus have exposure to agricultural price movements, which are often directly affected by severe or unexpected weather conditions or by political events in countries that comprise significant sources of commodity supply.
Energy
For each Series (other than the Currency Series), its primary energy market exposure is in oil, gas and other energy product price movements, often resulting from political developments and ongoing conflicts in the Middle East. Oil and gas prices can be volatile and substantial profits and losses have been and are expected to continue to be experienced in this market.
Other Trading Risks
As a result of leverage, small changes in the price of a Trading Company’s positions may result in substantial losses for a Series. Futures, forwards and options are typically traded on margin. This means that a small amount of capital can be used to invest in contracts of much greater total value. The resulting leverage means that a relatively small change in the market price of a contract can produce a substantial loss. Like other leveraged investments, any purchase or sale of a contract may result in losses in excess of the amount invested in that contract. The Trading Companies may lose more than their initial margin deposits on a trade.
The Trading Companies’ trading is subject to execution risks. Market conditions may make it impossible for the Trading Advisors to execute a buy or sell order at the desired price, or to close out an open position. Daily price fluctuation limits are established by the exchanges and approved by the Commodity Futures Trading Commission. When the market price of a contract reaches its daily price fluctuation limit, no trades can be executed at prices outside the limit. The holder of a contract may therefore be locked into an adverse price movement for several days or more and lose considerably more than the initial margin put up to establish the position. Thinly traded or illiquid markets also can make it difficult or impossible to execute trades.
The Trading Advisor’s positions are subject to speculative limits. The Commodity Futures Trading Commission and domestic exchanges have established speculative position limits on the maximum futures position which any person, or group of persons acting in concert, may hold or control in particular futures contracts or options on futures contracts traded on U.S. commodity exchanges. Under current regulations, other accounts of the Trading Advisors are combined with the positions held by them on behalf of the applicable Trading Company for position limit purposes. This trading could preclude additional trading in these commodities by the Trading Advisors for the accounts of the Series.
Systematic strategies do not consider fundamental types of data and do not have the benefit of discretionary decision making. The assets of the Series are allocated to Trading Advisors that rely on technical, systematic strategies that do not take into account factors external to the market itself (although certain of these strategies may have minor
discretionary elements incorporated into their systematic strategy). The widespread use of technical trading systems frequently results in numerous trading advisors attempting to execute similar trades at or about the same time, altering trading patterns and affecting market liquidity. Furthermore, the profit potential of trend-following systems may be diminished by the changing character of the markets, which may make historical price data (on which technical programs are based) only marginally relevant to future market patterns. Systematic strategies are developed on the basis of a statistical analysis of market prices. Consequently, any factor external to the market itself that dominates prices that a discretionary decision maker may take into account may cause major losses for a systematic strategy. For example, a pending political or economic event may be very likely to cause a major price movement, but a systematic strategy may continue to maintain positions indicated by its trading method that might incur major losses if the event proved to be adverse.
However, because certain of the Trading Advisors’ strategies involve some discretionary aspects in addition to their technical factors, certain of the Trading Advisors may occasionally use discretion in investing the assets of a Series. For example, the Trading Advisors often use discretion in selecting contracts and markets to be followed. In exercising such discretion, such Trading Advisor may take positions opposite to those recommended by the Trading Advisor’s trading system or signals. Discretionary decision making may also result in a Trading Advisor failing to capitalize on certain price trends or making unprofitable trades in a situation where another trader relying solely on a systematic approach might not have done so. Furthermore, such use of discretion may not enable the relevant Series of the Trust to avoid losses, and in fact, such use of discretion may cause such Series to forego profits which it may have otherwise earned had such discretion not been used.
| ITEM 4. | CONTROLS AND PROCEDURES |
Evaluation of disclosure controls and procedures
Under the supervision and with the participation of the management of the Managing Owner, including its Chief Executive Officer and Chief Financial Officer, the Trust evaluated the effectiveness of the design and operation of our disclosure controls and procedures (as defined in Rule 13(a)-15(e) under the Securities Exchange Act of 1934) as of June September
30, 2007 (the “Evaluation Date”). Any control system, no matter how well designed and operated, can provide only reasonable (not absolute) assurance that its objectives will be met. Furthermore, no evaluation of controls can provide absolute assurance that all control issues and instances of fraud, if any, have been detected. Based upon our evaluation, the Chief Executive Officer and Chief Financial Officer of the Managing Owner concluded that, as of the Evaluation Date, our disclosure controls and procedures were effective to provide reasonable assurance that they are timely alerted to the material information relating to the Trust required to be included in the Trust’s periodic SEC filings.
Changes in Internal Control Over Financial Reporting
There were no changes made in our internal controls during the firstthird quarter that have materially affected or are reasonably likely to materially affect the Trust’s internal controls or financial reporting.
| ITEM 1. | LEGAL PROCEEDINGS. |
None
There have been no material changes to the risk factors relating to The Frontier Fund from those previously disclosed in the Trust’s Annual Report on Form 10-K for its fiscal year ended December 31, 2006, under the caption “Item 1A. Risk Factors.”
| ITEM 2. | UNREGISTERED SALES OF EQUITY SECURITIES AND USE OF PROCEEDS. |
None
| ITEM 3. | DEFAULTS UPON SENIOR SECURITIES. |
None
| ITEM 4. | SUBMISSION OF MATTERS TO A VOTE OF SECURITY HOLDERS. |
None
| ITEM 5. | OTHER INFORMATION. |
None
| ITEM 6. | EXHIBITS. |
Exhibits (numbered in accordance with Item 601 of Regulation S-K)
| 1.1 | Form of Selling Agent Agreement among the Registrant, Equinox Fund Management, LLC and the Selling | |
| 1.2 | Form of Amendment Agreement among the Registrant, Equinox Fund Management, LLC and the Selling Agents** | |
| 1.3 | Form of Amendment Agreement among the Registrant, Equinox Fund Management, LLC and the Selling Agents*** | |
| 1.4 | Form of Amendment Agreement among the Registrant, Equinox Fund Management, LLC and the Selling Agents*** | |
| 1.5 | Form of Amendment Agreement among the Registrant, Equinox Fund Management, LLC and the Selling | |
| 1.6 | Form of Amendment among the Registrant, Equinox Fund Management, LLC and the Selling Agents**** | |
| 4.1 | Declaration of Trust and Amended and Restated Trust Agreement of the Registrant (annexed to the Prospectus as Exhibit A) | |
| 4.2 | Form of Subscription Agreement (annexed to the Prospectus as Exhibit B) | |
| 4.3 | Form of Exchange Request (annexed to the Prospectus as Exhibit C) | |
| 4.4 | Form of Request for Redemption (annexed to the Prospectus as Exhibit D) | |
| 4.5 | Form of Request for Additional Subscription (annexed to the Prospectus as Exhibit E) | |
| 4.6 | Form of Application for Transfer of Ownership / Re-registration Form (annexed to the Prospectus as Exhibit F) | |
| 4.7 | Form of Privacy Notice (annexed to the Prospectus as Exhibit G) | |
| 10.1 | Form of Amended and Restated Escrow Agreement among the Registrant, Equinox Fund Management, LLC, Bornhoft Group Securities Corporation and the U.S. Bank National Association, Denver Colorado*** | |
| 10.2 | Form of Brokerage Agreement between each Trading Company and UBS Securities, LLC* | |
| 10.21 | Form of Brokerage Agreement between each Trading Company and Banc of America Futures Incorporated* | |
| 10.22 | Form of Brokerage Agreement between the Managing Owner, acting as agent on behalf of certain Trading Companies, and Deutsche Bank AG London** | |
| 10.23 | Form of Brokerage Agreement between each Trading Company and Man Financial Inc. *** | |
| 10.24 | Form of Amendment Agreement between the Managing Owner, acting as agent on behalf of certain Trading Companies, and Deutsche Bank AG London*** | |
| 10.25 | Form of Brokerage Agreement between each Trading Company and Fimat USA, LLC | |
| 10.3 | Form of Advisory Agreement among the Registrant, the Trading Company, Equinox Fund Management, LLC, and each Trading | |
| 10.31 | Form of International Swaps and Derivatives Association Master Agreement, including all Schedules thereto and the Credit Support Annex thereto entered into for the Long Only Commodity Series of the Registrant*** | |
| 10.32 | Form of License Agreement among Jefferies Financial Products, LLC, Reuters America LLC, the Registrant and Equinox Fund Management, LLC*** | |
| 10.33 | Form of License Agreement among Jefferies Financial Products, the Registrant and Equinox Fund Management, LLC*** | |
| 10.34 | Form of Guaranty made by Jefferies Group, Inc. in favor of Frontier Trading Company VIII, LLC*** | |
| 10.35 | Form of International Swaps and Derivatives Association Master Agreement, including all Schedules thereto and the Credit Support Annex thereto entered into for the Currency Series of the Registrant*** | |
| 10.36 | Form of International Swaps and Derivatives Association Master Agreement, including all Schedules thereto and the Credit Support Annex thereto entered into for the Managed Futures Index Series of the Registrant*** | |
| 10.4 | Form of Cash Management Agreement between Equinox Fund Management, LLC and Merrill Lynch** | |
| 10.41 | Form of Cash Management Agreement between Equinox Fund Management, LLC and STW Fixed Income Management Ltd.*** | |
| 10.5 | Form of single-member limited liability company operating agreement governing each Trading Company*** |
| 31.1 | Certification of Principal Executive Officer of the Managing Owner pursuant to Rules 13a-14(a) and 15d-14(a) of the Securities Exchange Act of 1934. (filed herewith) | ||
| 31.2 | Certification of Principal Executive Officer of the Managing Owner pursuant to Rules 13a-14(a) and 15d-14(a) of the Securities Exchange Act of 1934. (filed herewith) | ||
| 31.3 | Certification of Principal Executive Officer of the Managing Owner pursuant to Rules 13a-14(a) and 15d-14(a) of the Securities Exchange Act of 1934. (filed herewith) | ||
| 31.4 | Certification of Principal Executive Officer of the Managing Owner pursuant to Rules 13a-14(a) and 15d-14(a) of the Securities Exchange Act of 1934. (filed herewith) | ||
| 31.5 | Certification of Principal Executive Officer of the Managing Owner pursuant to Rules 13a-14(a) and 15d-14(a) of the Securities Exchange Act of 1934. (filed herewith) | ||
| 31.6 | Certification of Principal Executive Officer of the Managing Owner pursuant to Rules 13a-14(a) and 15d-14(a) of the Securities Exchange Act of 1934. (filed herewith) | ||
| 31.7 | Certification of Principal Executive Officer of the Managing Owner pursuant to Rules 13a-14(a) and 15d-14(a) of the Securities Exchange Act of 1934. (filed herewith) | ||
| 31.8 | Certification of Principal Executive Officer of the Managing Owner pursuant to Rules 13a-14(a) and 15d-14(a) of the Securities Exchange Act of 1934. (filed herewith) | ||
| 31.9 | Certification of Principal Executive Officer of the Managing Owner pursuant to Rules 13a-14(a) and 15d-14(a) of the Securities Exchange Act of 1934. (filed herewith) | ||
| 31.10 | Certification of Principal Executive Officer of the Managing Owner pursuant to Rules 13a-14(a) and 15d-14(a) of the Securities Exchange Act of 1934. (filed herewith) | ||
| 31.11 | Certification of Principal Financial Officer of the Managing Owner pursuant to Rules 13a-14(a) and 15d-14(a) of the Securities Exchange Act of 1934. (filed herewith) | ||
| 31.12 | Certification of Principal Financial Officer of the Managing Owner pursuant to Rules 13a-14(a) and 15d-14(a) of the Securities Exchange Act of 1934. (filed herewith) | ||
| 31.13 | Certification of Principal Financial Officer of the Managing Owner pursuant to Rules 13a-14(a) and 15d-14(a) of the Securities Exchange Act of 1934. (filed herewith) | ||
| 31.14 | Certification of Principal Financial Officer of the Managing Owner pursuant to Rules 13a-14(a) and 15d-14(a) of the Securities Exchange Act of 1934. (filed herewith) | ||
| 31.15 | Certification of Principal Financial Officer of the Managing Owner pursuant to Rules 13a-14(a) and 15d-14(a) of the Securities Exchange Act of 1934. (filed herewith) | ||
| 31.16 | Certification of Principal Financial Officer of the Managing Owner pursuant to Rules 13a-14(a) and 15d-14(a) of the Securities Exchange Act of 1934. (filed herewith) | ||
| 31.17 | Certification of Principal Financial Officer of the Managing Owner pursuant to Rules 13a-14(a) and 15d-14(a) of the Securities Exchange Act of 1934. (filed herewith) | ||
| 31.18 | Certification of Principal Financial Officer of the Managing Owner pursuant to Rules 13a-14(a) and 15d-14(a) of the Securities Exchange Act of 1934. (filed herewith) | ||
| 31.19 | Certification of Principal Financial Officer of the Managing Owner pursuant to Rules 13a-14(a) and 15d-14(a) of the Securities Exchange Act of 1934. (filed herewith) | |
| 31.20 | Certification of Principal Financial Officer of the Managing Owner pursuant to Rules 13a-14(a) and 15d-14(a) of the Securities Exchange Act of 1934. (filed herewith) | ||
| 32.1 | Certification pursuant to 18 U.S.C. Section 1350, as enacted by Section 906 of The Sarbanes-Oxley Act of 2002. (furnished herewith) | ||
| 32.2 | Certification pursuant to 18 U.S.C. Section 1350, as enacted by Section 906 of The Sarbanes-Oxley Act of 2002. (furnished herewith) | ||
| 32.3 | Certification pursuant to 18 U.S.C. Section 1350, as enacted by Section 906 of The Sarbanes-Oxley Act of 2002. (furnished herewith) | ||
| 32.4 | Certification pursuant to 18 U.S.C. Section 1350, as enacted by Section 906 of The Sarbanes-Oxley Act of 2002. (furnished herewith) | ||
| 32.5 | Certification pursuant to 18 U.S.C. Section 1350, as enacted by Section 906 of The Sarbanes-Oxley Act of 2002. (furnished herewith) | ||
| 32.6 | Certification pursuant to 18 U.S.C. Section 1350, as enacted by Section 906 of The Sarbanes-Oxley Act of 2002. (furnished herewith) | ||
| 32.7 | Certification pursuant to 18 U.S.C. Section 1350, as enacted by Section 906 of The Sarbanes-Oxley Act of 2002. (furnished herewith) | ||
| 32.8 | Certification pursuant to 18 U.S.C. Section 1350, as enacted by Section 906 of The Sarbanes-Oxley Act of 2002. (furnished herewith) | ||
| 32.9 | Certification pursuant to 18 U.S.C. Section 1350, as enacted by Section 906 of The Sarbanes-Oxley Act of 2002. (furnished herewith) | ||
| 32.10 | Certification pursuant to 18 U.S.C. Section 1350, as enacted by Section 906 of The Sarbanes-Oxley Act of 2002. (furnished herewith) | ||
| * | Previously filed as like-numbered exhibit to the initial filing or the first, second, third or fourth pre-effective amendment or the first or second post-effective amendment to Registration Statement No. 333-108397 and incorporated by reference herein. |
| ** | Previously filed as like-numbered exhibit to the initial filing or the first pre-effective amendment or the first or second post-effective amendment to Registration Statement No. 333-119596 and incorporated by reference herein. |
| *** | Previously filed as like-numbered exhibit to the initial filing or the first pre-effective amendment or the first post-effective amendment to Registration Statement No. 333-129701 and incorporated by reference herein. |
| Previously filed as like-numbered exhibit to the initial filing or the first pre-effective amendment or the first post-effective amendment to Registration Statement No. 333-140240 and incorporated by reference herein. |
Pursuant to the requirements of the Securities Exchange Act of 1934, the registrant has duly caused this report to be signed on its behalf by the undersigned thereunto duly authorized.
| ||||||||
|
|
| ||||||
| Date: November 13, 2007 | By: | /s/ Brent Bales | ||||||
| Brent Bales | ||||||||
| Chief of Equinox Fund Management, LLC, the Managing Owner of The Frontier Fund | ||||||||
SIGNATURES
Pursuant to the requirements of the Securities Exchange Act of 1934, the registrant has duly caused this report to be signed on its behalf by the undersigned thereunto duly authorized.
| ||||||||
|
|
| ||||||
| (Registrant) | ||||||||
| Date: November 13, 2007 | By: | /s/ Brent Bales | ||||||
| Brent Bales | ||||||||
| Chief Equinox Fund Management, LLC, the Managing Owner of The Frontier Fund | ||||||||
��
84
SIGNATURES
Pursuant to the requirements of the Securities Exchange Act of 1934, the registrant has duly caused this report to be signed on its behalf by the undersigned thereunto duly authorized.
| Campbell/Graham Series, | ||||||||
| a Series of The Frontier Fund | ||||||||
| (Registrant) | ||||||||
| Date: November 13, 2007 | By: | /s/ Brent Bales | ||||||
| Brent Bales | ||||||||
| Chief Financial Officer of Equinox Fund Management, LLC, the Managing Owner of The Frontier Fund | ||||||||
SIGNATURES
Pursuant to the requirements of the Securities Exchange Act of 1934, the registrant has duly caused this report to be signed on its behalf by the undersigned thereunto duly authorized.
| ||||||||
|
|
| ||||||
| (Registrant) | ||||||||
| Date: November 13, 2007 | By: | /s/ Brent Bales | ||||||
| Brent Bales | ||||||||
| Chief Equinox Fund Management, LLC, the Managing Owner of The Frontier Fund | ||||||||
SIGNATURES
Pursuant to the requirements of the Securities Exchange Act of 1934, the registrant has duly caused this report to be signed on its behalf by the undersigned thereunto duly authorized.
| ||||||||
| ||||||||
SIGNATURES
Pursuant to the requirements of the Securities Exchange Act of 1934, the registrant has duly caused this report to be signed on its behalf by the undersigned thereunto duly authorized.
a Series of The Frontier Fund
| ||||||||
| ||||||||
| Date: November 13, 2007 | By: | /s/ Brent Bales | ||||||
| Brent Bales | ||||||||
| Chief Equinox Fund Management, LLC, the Managing Owner of The Frontier Fund | ||||||||
7789