UNITED STATES
SECURITIES AND EXCHANGE COMMISSION
WASHINGTON, D.C. 20549
FORM 10-Q
| x | QUARTERLY REPORT PURSUANT TO SECTION 13 OR 15(d) OF THE SECURITIES EXCHANGE ACT OF 1934 |
For the Quarterly Period Ended September 30, 2007March 31, 2008
| ¨ | TRANSITION REPORT PURSUANT TO SECTION 13 OR 15(d) OF THE SECURITIES EXCHANGE ACT OF 1934 |
For the Transition Period From to
Commission File Number 1-3157
INTERNATIONAL PAPER COMPANY
(Exact name of registrant as specified in its charter)
| New York | 13-0872805 | |
(State or other jurisdiction of incorporation of organization) | (I.R.S. Employer Identification No.) | |
| 6400 Poplar Avenue, Memphis, TN | 38197 | |
| (Address of principal executive offices) | (Zip Code) | |
Registrant’s telephone number, including area code: (901) 419-7000
Indicate by check mark whether the registrant (1) has filed all reports required to be filed by Section 13 or 15(d) of the Securities Exchange Act of 1934 during the preceding 12 months (or for such shorter period that the registrant was required to file such reports), and (2) has been subject to such filing requirements for the past 90 days.
Yes x No ¨
Indicate by check mark whether the registrant is a large accelerated filer, an accelerated filer, a non-accelerated filer or a non-accelerated filer.smaller reporting company. See definitiondefinitions of “accelerated filer,” “large accelerated filer” and large accelerated filer”“smaller reporting company” in Rule 12b-2 of the Exchange Act. (Check one):
Large accelerated filer x Accelerated filer ¨ Non-accelerated filer ¨
| Large accelerated filer x | Accelerated filer ¨ | |
| Non-accelerated filer ¨ | Smaller company ¨ | |
| (Do not check if a smaller reporting company) |
Indicate by check mark whether the registrant is a shell company (as defined in Rule 12b-2 of the Exchange Act).
Yes ¨ No x
The number of shares outstanding of the registrant’s common stock as of November 6, 2007May 7, 2008 was 428,137,645.
427,625,220.
INTERNATIONAL PAPER COMPANYINDEX
INDEX
| PAGE NO. | ||||||
PART I. | FINANCIAL INFORMATION | |||||
Item 1. | ||||||
| 1 | ||||||
Consolidated Balance Sheet - | 2 | |||||
| 3 | ||||||
| 4 | ||||||
| 5 | ||||||
Item 2. | Management’s Discussion and Analysis of Financial Condition and Results of Operations | |||||
Item 3. | ||||||
Item 4. | ||||||
PART II. | OTHER INFORMATION | |||||
Item 1. | ||||||
Item 1A. | Risk Factors | |||||
Item 2. | ||||||
Item 3. | Defaults upon Senior Securities | * | ||||
Item 4. | Submission of Matters to a Vote of Security Holders | * | ||||
Item 5. |
| |||||
Item 6. | ||||||
| * | Omitted since no answer is called for, answer is in the negative or inapplicable. |
| ITEM 1. | FINANCIAL STATEMENTS |
Consolidated Statement of Operations
(Unaudited)
(In millions, except per share amounts)
Three Months Ended September 30, | Nine Months Ended September 30, | Three Months Ended March 31, | ||||||||||||||||||||||
| 2007 | 2006 | 2007 | 2006 | 2008 | 2007 | |||||||||||||||||||
Net Sales | $ | 5,541 | $ | 5,429 | $ | 16,049 | $ | 16,671 | $ | 5,668 | $ | 5,217 | ||||||||||||
Costs and Expenses | ||||||||||||||||||||||||
Cost of products sold | 4,086 | 3,906 | 11,818 | 12,345 | 4,261 | 3,851 | ||||||||||||||||||
Selling and administrative expenses | 455 | 465 | 1,331 | 1,394 | 472 | 435 | ||||||||||||||||||
Depreciation, amortization and cost of timber harvested | 277 | 287 | 808 | 883 | 286 | 262 | ||||||||||||||||||
Distribution expenses | 255 | 267 | 765 | 828 | 285 | 256 | ||||||||||||||||||
Taxes other than payroll and income taxes | 42 | 52 | 131 | 160 | 44 | 42 | ||||||||||||||||||
Restructuring and other charges | 42 | 92 | 86 | 189 | 42 | 18 | ||||||||||||||||||
Insurance recoveries | — | — | — | (19 | ) | |||||||||||||||||||
Forestland sales | (9 | ) | (304 | ) | (9 | ) | (366 | ) | ||||||||||||||||
Net losses (gains) on sales and impairments of businesses | 1 | (74 | ) | (314 | ) | 1,346 | ||||||||||||||||||
Net gains on sales and impairments of businesses | (1 | ) | (314 | ) | ||||||||||||||||||||
Interest expense, net | 77 | 144 | 218 | 441 | 81 | 61 | ||||||||||||||||||
Earnings (Loss) From Continuing Operations Before Income Taxes and Minority Interest | 315 | 594 | 1,215 | (530 | ) | |||||||||||||||||||
Earnings From Continuing Operations Before Income Taxes, Equity Earnings and Minority Interest | 198 | 606 | ||||||||||||||||||||||
Income tax provision | 89 | 204 | 321 | 221 | 59 | 143 | ||||||||||||||||||
Equity earnings, net of taxes | 16 | — | ||||||||||||||||||||||
Minority interest expense, net of taxes | 6 | 5 | 17 | 14 | 5 | 6 | ||||||||||||||||||
Earnings (Loss) From Continuing Operations | 220 | 385 | 877 | (765 | ) | |||||||||||||||||||
Earnings From Continuing Operations | 150 | 457 | ||||||||||||||||||||||
Discontinued operations, net of taxes and minority interest | (3 | ) | (161 | ) | (36 | ) | (164 | ) | (17 | ) | (23 | ) | ||||||||||||
Net Earnings (Loss) | $ | 217 | $ | 224 | $ | 841 | $ | (929 | ) | |||||||||||||||
Net Earnings | $ | 133 | $ | 434 | ||||||||||||||||||||
Basic Earnings (Loss) Per Common Share | ||||||||||||||||||||||||
Earnings (loss) from continuing operations | $ | 0.52 | $ | 0.81 | $ | 2.03 | $ | (1.57 | ) | |||||||||||||||
Basic Earnings Per Common Share | ||||||||||||||||||||||||
Earnings from continuing operations | $ | 0.36 | $ | 1.03 | ||||||||||||||||||||
Discontinued operations | (0.01 | ) | (0.34 | ) | (0.08 | ) | (0.34 | ) | (0.04 | ) | (0.05 | ) | ||||||||||||
Net earnings (loss) | $ | 0.51 | $ | 0.47 | $ | 1.95 | $ | (1.91 | ) | |||||||||||||||
Net earnings | $ | 0.32 | $ | 0.98 | ||||||||||||||||||||
Diluted Earnings (Loss) Per Common Share | ||||||||||||||||||||||||
Earnings (loss) from continuing operations | $ | 0.52 | $ | 0.80 | $ | 2.01 | $ | (1.57 | ) | |||||||||||||||
Diluted Earnings Per Common Share | ||||||||||||||||||||||||
Earnings from continuing operations | $ | 0.35 | $ | 1.02 | ||||||||||||||||||||
Discontinued operations | (0.01 | ) | (0.34 | ) | (0.08 | ) | (0.34 | ) | (0.04 | ) | (0.05 | ) | ||||||||||||
Net earnings (loss) | $ | 0.51 | $ | 0.46 | $ | 1.93 | $ | (1.91 | ) | |||||||||||||||
Net earnings | $ | 0.31 | $ | 0.97 | ||||||||||||||||||||
Average Shares of Common Stock Outstanding - assuming dilution | 425.6 | 484.9 | 435.7 | 485.2 | 423.3 | 448.4 | ||||||||||||||||||
Cash Dividends Per Common Share | $ | 0.25 | $ | 0.25 | $ | 0.75 | $ | 0.75 | $ | 0.25 | $ | 0.25 | ||||||||||||
The accompanying notes are an integral part of these financial statements.
Consolidated Balance Sheet
(In millions)
| September 30, 2007 | December 31, 2006 | March 31, 2008 | December 31, 2007 | |||||||||||||
| (Unaudited) | (Unaudited) | |||||||||||||||
Assets | ||||||||||||||||
Current Assets | ||||||||||||||||
Cash and temporary investments | $ | 1,702 | $ | 1,624 | $ | 880 | $ | 905 | ||||||||
Accounts and notes receivable, net | 3,080 | 2,704 | 3,206 | 3,152 | ||||||||||||
Inventories | 2,030 | 1,909 | 2,147 | 2,071 | ||||||||||||
Assets of businesses held for sale | 21 | 1,778 | — | 24 | ||||||||||||
Deferred income tax assets | 516 | 490 | 206 | 213 | ||||||||||||
Other current assets | 156 | 132 | 273 | 370 | ||||||||||||
Total Current Assets | 7,505 | 8,637 | 6,712 | 6,735 | ||||||||||||
Plants, Properties and Equipment, net | 9,842 | 8,993 | 10,290 | 10,141 | ||||||||||||
Forestlands | 735 | 259 | 778 | 770 | ||||||||||||
Investments | 608 | 641 | 1,317 | 1,276 | ||||||||||||
Goodwill | 3,652 | 2,929 | 3,658 | 3,650 | ||||||||||||
Assets Held for Exchange | — | 1,324 | ||||||||||||||
Deferred Charges and Other Assets | 1,373 | 1,251 | 1,600 | 1,587 | ||||||||||||
Total Assets | $ | 23,715 | $ | 24,034 | $ | 24,355 | $ | 24,159 | ||||||||
Liabilities and Common Shareholders’ Equity | ||||||||||||||||
Current Liabilities | ||||||||||||||||
Notes payable and current maturities of long-term debt | $ | 586 | $ | 692 | $ | 727 | $ | 267 | ||||||||
Accounts payable | 2,070 | 1,907 | 2,184 | 2,145 | ||||||||||||
Accrued payroll and benefits | 347 | 466 | 279 | 400 | ||||||||||||
Liabilities of businesses held for sale | 5 | 333 | — | 4 | ||||||||||||
Other accrued liabilities | 1,021 | 1,243 | 955 | 1,026 | ||||||||||||
Total Current Liabilities | 4,029 | 4,641 | 4,145 | 3,842 | ||||||||||||
Long-Term Debt | 6,191 | 6,531 | 6,037 | 6,353 | ||||||||||||
Deferred Income Taxes | 2,751 | 2,233 | 3,117 | 2,919 | ||||||||||||
Other Liabilities | 2,567 | 2,453 | 1,823 | 2,145 | ||||||||||||
Minority Interest | 221 | 213 | 234 | 228 | ||||||||||||
Common Shareholders’ Equity | ||||||||||||||||
Common stock, $1 par value, 493.6 shares in 2007 and 493.3 shares in 2006 | 494 | 493 | ||||||||||||||
Common stock, $1 par value, 493.6 shares in 2008 and 2007 | 494 | 494 | ||||||||||||||
Paid-in capital | 6,718 | 6,735 | 6,671 | 6,755 | ||||||||||||
Retained earnings | 4,154 | 3,737 | 4,396 | 4,375 | ||||||||||||
Accumulated other comprehensive loss | (1,030 | ) | (1,564 | ) | (179 | ) | (471 | ) | ||||||||
| 10,336 | 9,401 | 11,382 | 11,153 | |||||||||||||
Less: Common stock held in treasury, at cost, 65.4 shares in 2007 and 39.8 shares in 2006 | 2,380 | 1,438 | ||||||||||||||
Less: Common stock held in treasury, at cost, 65.9 shares in 2008 and 68.4 shares in 2007 | 2,383 | 2,481 | ||||||||||||||
Total Common Shareholders’ Equity | 7,956 | 7,963 | 8,999 | 8,672 | ||||||||||||
Total Liabilities and Common Shareholders’ Equity | $ | 23,715 | $ | 24,034 | $ | 24,355 | $ | 24,159 | ||||||||
The accompanying notes are an integral part of these financial statements.
Consolidated Statement of Cash Flows
(Unaudited)
(In millions)
Nine Months Ended September 30, | Three Months Ended March 31, | |||||||||||||||
| 2007 | 2006 | 2008 | 2007 | |||||||||||||
Operating Activities | ||||||||||||||||
Net earnings (loss) | $ | 841 | $ | (929 | ) | |||||||||||
Net earnings | $ | 133 | $ | 434 | ||||||||||||
Discontinued operations, net of taxes and minority interest | 36 | 164 | 17 | 23 | ||||||||||||
Earnings (loss) from continuing operations | 877 | (765 | ) | |||||||||||||
Earnings from continuing operations | 150 | 457 | ||||||||||||||
Depreciation, amortization and cost of timber harvested | 808 | 883 | 286 | 262 | ||||||||||||
Deferred income tax expense, net | 125 | 133 | ||||||||||||||
Deferred income tax (benefit) expense, net | (130 | ) | 74 | |||||||||||||
Restructuring and other charges | 86 | 189 | 42 | 18 | ||||||||||||
Payments related to restructuring and legal reserves | (60 | ) | (65 | ) | (22 | ) | (22 | ) | ||||||||
Insurance recoveries | — | (19 | ) | |||||||||||||
Net (gains) losses on sales and impairments of businesses | (314 | ) | 1,346 | |||||||||||||
Gain on sales of forestlands | (9 | ) | (366 | ) | ||||||||||||
Net gains on sales and impairments of businesses | (1 | ) | (314 | ) | ||||||||||||
Equity earnings, net | (16 | ) | — | |||||||||||||
Periodic pension expense, net | 158 | 283 | 28 | 52 | ||||||||||||
Other, net | 145 | 184 | 81 | 51 | ||||||||||||
Changes in current assets and liabilities | ||||||||||||||||
Accounts and notes receivable | (6 | ) | (249 | ) | 5 | (81 | ) | |||||||||
Inventories | (91 | ) | (32 | ) | (32 | ) | (129 | ) | ||||||||
Accounts payable and accrued liabilities | (313 | ) | 152 | (75 | ) | (61 | ) | |||||||||
Other | 1 | (182 | ) | 118 | (11 | ) | ||||||||||
Cash provided by operations - continuing operations | 1,407 | 1,492 | 434 | 296 | ||||||||||||
Cash (used for) provided by operations - discontinued operations | (56 | ) | 146 | |||||||||||||
Cash used for operations - discontinued operations | — | (44 | ) | |||||||||||||
Cash Provided by Operations | 1,351 | 1,638 | 434 | 252 | ||||||||||||
Investment Activities | ||||||||||||||||
Invested in capital projects | (804 | ) | (764 | ) | (215 | ) | (178 | ) | ||||||||
Acquisitions, net of cash acquired | (227 | ) | — | |||||||||||||
Proceeds from divestititures | 1,675 | 2,163 | 14 | 1,633 | ||||||||||||
Other | (135 | ) | (241 | ) | (140 | ) | (118 | ) | ||||||||
Cash provided by investment activities - continuing operations | 509 | 1,158 | ||||||||||||||
Cash (used for) provided by investment activities - continuing operations | (341 | ) | 1,337 | |||||||||||||
Cash used for investment activities - discontinued operations | (12 | ) | (57 | ) | — | (11 | ) | |||||||||
Cash Provided by Investment Activities | 497 | 1,101 | ||||||||||||||
Cash (Used for) Provided by Investment Activities | (341 | ) | 1,326 | |||||||||||||
Financing Activities | ||||||||||||||||
Repurchases of common stock | (1,124 | ) | (1,385 | ) | ||||||||||||
Repurchases of common stock and payments of restricted stock tax withholding | (47 | ) | (398 | ) | ||||||||||||
Issuance of common stock | 122 | 26 | 1 | 30 | ||||||||||||
Issuance of debt | 15 | 1,258 | 83 | — | ||||||||||||
Reduction of debt | (528 | ) | (3,156 | ) | (26 | ) | (362 | ) | ||||||||
Change in book overdrafts | (3 | ) | (50 | ) | (39 | ) | 20 | |||||||||
Dividends paid | (330 | ) | (372 | ) | (112 | ) | (114 | ) | ||||||||
Other | — | (2 | ) | — | (3 | ) | ||||||||||
Cash used for financing activities - continuing operations | (1,848 | ) | (3,681 | ) | ||||||||||||
Cash provided by financing activities - discontinued operations | — | 22 | ||||||||||||||
Cash Used for Financing Activities | (1,848 | ) | (3,659 | ) | (140 | ) | (827 | ) | ||||||||
Effect of Exchange Rate Changes on Cash - Continuing operations | 78 | 14 | ||||||||||||||
Effect of Exchange Rate Changes on Cash - Discontinued operations | — | 1 | ||||||||||||||
Effect of Exchange Rate Changes on Cash | 22 | 15 | ||||||||||||||
Change in Cash and Temporary Investments | 78 | (905 | ) | (25 | ) | 766 | ||||||||||
Cash and Temporary Investments | ||||||||||||||||
Beginning of the period | 1,624 | 1,641 | 905 | 1,624 | ||||||||||||
End of the period | $ | 1,702 | $ | 736 | $ | 880 | $ | 2,390 | ||||||||
The accompanying notes are an integral part of these financial statements.
Consolidated Statement of Changes in Common Shareholders’ Equity
(Unaudited)
(In millions, except share amounts in thousands)
NineThree Months Ended September 30, 2007March 31, 2008
| Common Stock Issued | Paid-in | Retained | Accumulated Comprehensive | Treasury Stock | Total Shareholders’ | |||||||||||||||||||||||
| Shares | Amount | Capital | Earnings | (Loss) Income | Shares | Amount | Equity | |||||||||||||||||||||
Balance, December 31, 2006 | 493,340 | $ | 493 | $ | 6,735 | $ | 3,737 | $ | (1,564 | ) | 39,844 | $ | 1,438 | $ | 7,963 | |||||||||||||
Issuance of stock for various plans, net | 216 | 1 | (17 | ) | — | — | (5,031 | ) | (182 | ) | 166 | |||||||||||||||||
Repurchase of stock | — | — | — | — | — | 30,577 | 1,124 | (1,124 | ) | |||||||||||||||||||
Cash dividends - Common stock ($0.75 per share) | — | — | — | (330 | ) | — | — | — | (330 | ) | ||||||||||||||||||
Comprehensive income (loss): | ||||||||||||||||||||||||||||
Net earnings | — | — | — | 841 | — | — | — | 841 | ||||||||||||||||||||
Pension and post retirement divestitures, amortization of prior service costs and net loss | — | — | — | — | 78 | — | — | 78 | ||||||||||||||||||||
Change in cumulative foreign currency translation adjustment (less tax of $0) | — | — | — | — | 451 | — | — | 451 | ||||||||||||||||||||
Net gains on cash flow hedging derivatives: | ||||||||||||||||||||||||||||
Net gain arising during the period (less tax of $0) | — | — | — | — | 17 | — | — | 17 | ||||||||||||||||||||
Less: Reclassification adjustment for gains included in net income (less tax of $1) | — | — | — | — | (12 | ) | — | — | (12 | ) | ||||||||||||||||||
Total comprehensive income | 1,375 | |||||||||||||||||||||||||||
Adoption of FIN 48 (Note 8) | — | — | — | (94 | ) | — | — | — | (94 | ) | ||||||||||||||||||
Balance, September 30, 2007 | 493,556 | $ | 494 | $ | 6,718 | $ | 4,154 | $ | (1,030 | ) | 65,390 | $ | 2,380 | $ | 7,956 | |||||||||||||
| Nine Months Ended September 30, 2006 | ||||||||||||||||||||||||||||
| Common Stock Issued | Paid-in | Retained | Accumulated Comprehensive | Treasury Stock | Total Shareholders’ | |||||||||||||||||||||||
| Shares | Amount | Capital | Earnings | (Loss) Income | Shares | Amount | Equity | |||||||||||||||||||||
Balance, December 31, 2005 | 490,501 | $ | 491 | $ | 6,627 | $ | 3,172 | $ | (1,935 | ) | 112 | $ | 4 | $ | 8,351 | |||||||||||||
Issuance of stock for various plans, net | 2,802 | 3 | 83 | — | — | (115 | ) | (4 | ) | 90 | ||||||||||||||||||
Repurchase of stock | — | — | — | — | — | 38,465 | 1,392 | (1,392 | ) | |||||||||||||||||||
Cash dividends - Common stock ($0.75 per share) | — | — | — | (372 | ) | — | — | — | (372 | ) | ||||||||||||||||||
Comprehensive income (loss): | ||||||||||||||||||||||||||||
Net loss | — | — | — | (929 | ) | — | — | — | (929 | ) | ||||||||||||||||||
Change in cumulative foreign currency translation adjustment (less tax of $8) | — | — | — | — | 135 | — | — | 135 | ||||||||||||||||||||
Net gains (losses) on cash flow hedging derivatives: | ||||||||||||||||||||||||||||
Net loss arising during the period (less tax of $6) | — | — | — | — | (9 | ) | — | — | (9 | ) | ||||||||||||||||||
Less: Reclassification adjustment for gains included in net income (less tax of $0) | — | — | — | — | (8 | ) | — | — | (8 | ) | ||||||||||||||||||
Total comprehensive loss | (811 | ) | ||||||||||||||||||||||||||
Balance, September 30, 2006 | 493,303 | $ | 494 | $ | 6,710 | $ | 1,871 | $ | (1,817 | ) | 38,462 | $ | 1,392 | $ | 5,866 | |||||||||||||
| Common Stock Issued | Paid-in Capital | Retained Earnings | Accumulated Other Comprehensive (Loss) Income | Treasury Stock | Total Common Shareholders’ Equity | |||||||||||||||||||||||
| Shares | Amount | Shares | Amount | |||||||||||||||||||||||||
Balance, December 31, 2007 | 493,556 | $ | 494 | $ | 6,755 | $ | 4,375 | $ | (471 | ) | 68,436 | $ | 2,481 | $ | 8,672 | |||||||||||||
Issuance of stock for various plans, net | — | — | (84 | ) | — | — | (2,501 | ) | (98 | ) | 14 | |||||||||||||||||
Cash dividends - Common stock ($0.25 per share) | — | — | — | (112 | ) | — | — | — | (112 | ) | ||||||||||||||||||
Comprehensive income (loss): | ||||||||||||||||||||||||||||
Net earnings | — | — | — | 133 | — | — | — | 133 | ||||||||||||||||||||
Amortization of pension and post retirement prior service costs and net loss: | ||||||||||||||||||||||||||||
U.S. plans (less tax of $15) | — | — | — | — | 20 | — | — | 20 | ||||||||||||||||||||
Non-U.S. plans (less tax of $0) | — | — | — | — | 3 | — | — | 3 | ||||||||||||||||||||
Change in cumulative foreign currency translation adjustment (less tax of $0) | — | — | — | — | 246 | — | — | 246 | ||||||||||||||||||||
Net gains on cash flow hedging derivatives: | ||||||||||||||||||||||||||||
Net gain arising during the period | ||||||||||||||||||||||||||||
(less tax of $17) | — | — | — | — | 36 | — | — | 36 | ||||||||||||||||||||
Less: Reclassification adjustment for gains included in net income (less tax of $4) | — | — | — | — | (13 | ) | — | — | (13 | ) | ||||||||||||||||||
Total comprehensive income | 425 | |||||||||||||||||||||||||||
Balance, March 31, 2008 | 493,556 | $ | 494 | $ | 6,671 | $ | 4,396 | $ | (179 | ) | 65,935 | $ | 2,383 | $ | 8,999 | |||||||||||||
| Three Months Ended March 31, 2007 | ||||||||||||||||||||||||||||
| Common Stock Issued | Paid-in Capital | Retained Earnings | Accumulated Other Comprehensive (Loss) Income | Treasury Stock | Total Common Shareholders’ Equity | |||||||||||||||||||||||
| Shares | Amount | Shares | Amount | |||||||||||||||||||||||||
Balance, December 31, 2006 | 493,340 | $ | 493 | $ | 6,735 | $ | 3,737 | $ | (1,564 | ) | 39,844 | $ | 1,438 | $ | 7,963 | |||||||||||||
Issuance of stock for various plans, net | 2 | — | (75 | ) | — | — | (2,681 | ) | (97 | ) | 22 | |||||||||||||||||
Repurchase of stock | — | — | — | — | — | 11,231 | 398 | (398 | ) | |||||||||||||||||||
Cash dividends - Common stock ($0.25 per share) | — | — | — | (114 | ) | — | — | — | (114 | ) | ||||||||||||||||||
Comprehensive income (loss): | ||||||||||||||||||||||||||||
Net earnings | — | — | — | 434 | — | — | — | 434 | ||||||||||||||||||||
Amortization of pension and post-retirement prior service costs and net loss (less tax of $10) | — | — | — | — | 18 | — | — | 18 | ||||||||||||||||||||
Change in cumulative foreign currency translation adjustment (less tax of $0) | — | — | — | — | 88 | — | — | 88 | ||||||||||||||||||||
Net gains on cash flow hedging derivatives: | ||||||||||||||||||||||||||||
Net gain arising during the period (less tax of $1) | — | — | — | — | 10 | — | — | 10 | ||||||||||||||||||||
Less: Reclassification adjustment for gains included in net income (less tax of $0) | — | — | — | — | (4 | ) | — | — | (4 | ) | ||||||||||||||||||
Total comprehensive income | 546 | |||||||||||||||||||||||||||
Adoption of FIN 48 (Note 8) | — | — | — | (94 | ) | — | — | — | (94 | ) | ||||||||||||||||||
Balance, March 31, 2007 | 493,342 | $ | 493 | $ | 6,660 | $ | 3,963 | $ | (1,452 | ) | 48,394 | $ | 1,739 | $ | 7,925 | |||||||||||||
The accompanying notes are an intergralintegral part of these financial statements.
Condensed Notes to Consolidated Financial Statements
(Unaudited)
NOTE 1 - BASIS OF PRESENTATION
The accompanying unaudited consolidated financial statements have been prepared in accordance with the instructions to Form 10-Q and, in the opinion of Management, include all adjustments that are necessary for the fair presentation of the Company’s financial position, results of operations, and cash flows for the interim periods presented. Except as disclosed herein, such adjustments are of a normal, recurring nature. Results for the first ninethree months of the year may not necessarily be indicative of full year results. It is suggested that these consolidated financial statements be read in conjunction with the audited financial statements and the notes thereto included in International Paper’s (the Company) Annual Report on Form 10-K for the year ended December 31, 2006, and in International Paper’s Current Report on Form 8-K filed on August 14, 2007 to update the historical financial statements included in the Company’s Form 10-K for the year ended December 31, 2006, both of which havehas previously been filed with the Securities and Exchange Commission.
Financial information by industry segment is presented on page 24. In connection with sales19. Effective January 1, 2008, the Company changed its method of businesses underallocating corporate overhead to increase the Transformation Plan and the resulting changes in the Company’s business portfolio, a review of the Company’s operatingexpense amounts allocated to its business segments was conducted during the first quarter of 2007 under the provisions of Statement of Financial Accounting Standards No. 131. While this review resulted in no changes in the Company’s reportable segments, a decision was madereports reviewed by its chief executive officer to include the Company’s European coated paperboard operations, previously reported in the Printing Papers segment,facilitate performance comparisons with other similar operations incompanies. Accordingly, the Consumer Packaging segment. Accordingly, prior periodCompany has revised its presentation of industry segment information has been revisedoperating profit to reflect this presentation.change in allocation method, and has restated all comparative prior period information on this basis, reducing reported industry segment operating profits by $127 million and $145 million for the three months ended March 31, 2007 and December 31, 2007, respectively, with no effect on reported net income.
NOTE 2 - EARNINGS PER COMMON SHARE
Basic earnings per common share from continuing operations are computed by dividing earnings from continuing operations by the weighted average number of common shares outstanding. Diluted earnings per common share from continuing operations are computed assuming that all potentially dilutive securities, including “in-the-money” stock options, are converted into common shares at the beginning of each period. A reconciliation of the amounts included in the computation of earnings per common share from continuing operations, and diluted earnings per common share from continuing operations is as follows:
| Three Months Ended March 31, | ||||||||
In millions, except per share amounts | 2008 | 2007 | ||||||
Earnings from continuing operations | $ | 150 | $ | 457 | ||||
Effect of dilutive securities | — | — | ||||||
Earnings from continuing operations - assuming dilution | $ | 150 | $ | 457 | ||||
Average common shares outstanding | 420.6 | 445.3 | ||||||
Effect of dilutive securities | ||||||||
Restricted stock performance share plan | 2.6 | 2.7 | ||||||
Stock options | (a) | 0.1 | 0.4 | |||||
Average common shares outstanding - assuming dilution | 423.3 | 448.4 | ||||||
Earnings per common share from continuing operations | $ | 0.36 | $ | 1.03 | ||||
Diluted earnings per common share from continuing operations | $ | 0.35 | $ | 1.02 | ||||
Three Months Ended September 30, Nine Months Ended September 30, In millions, except per share amounts Earnings (loss) from continuing operations Effect of dilutive securities Earnings (loss) from continuing operations - assuming dilution Average common shares outstanding Effect of dilutive securities Restricted stock performance share plan Stock options (a) Average common shares outstanding - assuming dilution Earnings (loss) per common share from continuing operations Diluted earnings (loss) per common share from continuing operations 2007 2006 2007 2006 $ 220 $ 385 $ 877 $ (765 ) — �� — — — $ 220 $ 385 $ 877 $ (765 ) 422.3 482.5 431.8 485.2 2.9 2.1 3.4 — 0.4 0.3 0.5 — 425.6 484.9 435.7 485.2 $ 0.52 $ 0.81 $ 2.03 $ (1.57 ) $ 0.52 $ 0.80 $ 2.01 $ (1.57 )
| (a) | Options to purchase |
NOTE 3 - RESTRUCTURING AND OTHER CHARGES
2007:2008:
During the thirdfirst quarter of 2007,2008, restructuring and other charges totaling $42 million before taxes ($26 million after taxes) were recorded. These charges consisted ofrecorded, including a pre-tax$40 million charge of $27 millionbefore taxes ($17 million after taxes) of accelerated depreciation charges for the Terre Haute mill, a pre-tax charge of $10 million ($625 million after taxes) for closureadjustments of legal reserves associated with the Terre Haute mill,(see Note 9), a pre-tax$5 million charge of $3 millionbefore taxes ($23 million after taxes) related to the restructuringreorganization of the Company’s BrazilShorewood operations in Canada and a pre-tax charge of $2$3 million credit before taxes ($12 million after taxes) for organizational restructuring programsadjustments to previously recorded reserves associated with the Company’s Transformation Plan. Additionally, a $3 million increase to the income tax provision was recorded related to the settlement of a prior year tax audit.
During the second quarter of 2007, restructuring and other charges totaling $26 million before taxes ($16 million after taxes) were recorded for organizational restructuring programs associated with the Company’s Transformation Plan, including $17 million ($11 million after taxes) of accelerated depreciation expense for long-lived assets being removed from service.programs.
2007:
During the first quarter of 2007, restructuring and other charges totaling $18 million before taxes ($11 million after taxes) were recorded for organizational restructuring programs associated with the Company’s Transformation Plan, including $12 million before taxes ($7 million after taxes) of accelerated depreciation charges for long-lived assets being removed from service. Additionally, a $2 million pre-tax credit ($1 million after taxes) was recorded in Interest expense, net, for interest received from the Canadian government on refunds of prior-year softwood lumber duties.
NOTE 4 - ACQUISITIONS, EXCHANGES AND JOINT VENTURES
Acquisitions:
20062008:
DuringOn March 17, 2008, International Paper announced that it had signed an agreement with Weyerhaeuser Company to purchase its Containerboard, Packaging and Recycling (CBPR) business for $6 billion in cash, subject to post-closing adjustments. International Paper expects to finance the purchase with debt financing. The business will become part of International Paper’s North American Packaging business. The transaction has been approved by United States regulators but additional pre-merger approvals are required in other jurisdictions. The acquisition is expected to close in the third quarter of 2006, restructuring2008, subject to customary closing conditions. The agreement provides that a termination fee of $100 million could become payable to Weyerhaeuser Company if International Paper were unable to obtain sufficient financing for the acquisition and certain other charges totaling $92 million before taxes ($56 million after taxes)conditions were recorded. These charges consisted of a pre-tax charge of $57 million ($35 million after taxes), including severance and other termination benefit costs of approximately $15 million, $25 million of lease termination costs and $17 million of other charges associated with the Company’s Transformation Plan, and a $35 million pre-tax charge ($21 million after taxes) for adjustments to legal reserves (see Note 9).met.
During the second quarter of 2006, restructuring and other charges totaling $53 million before taxes ($32 million after taxes) were recorded. Included in these charges were a pre-tax charge of $49 million ($29 million after taxes) for organizational restructuring programs, including severance and other termination benefits costs of approximately $31 million ($19 million after taxes) and other charges associated with the Company’s Transformation Plan, and a $4 million pre-tax charge ($3 million after taxes) for legal settlements.
During the first quarter of 2006, restructuring and other charges totaling $44 million before taxes ($27 million after taxes) were recorded. Included in these charges were a pre-tax charge of $18 million ($11 million after taxes) for organizational restructuring programs, principally severance costs associated with the Company’s Transformation Plan, a pre-tax charge of $8 million ($5 million after taxes) for losses on early extinguishment of debt, and a pre-tax charge of $18 million ($11 million after taxes) for adjustments to legal reserves. Also recorded was a pre-tax credit of $19 million ($12 million after taxes) for net insurance recoveries related to the hardboard siding and roofing litigation (see Note 9) and a charge of $3 million for tax adjustments.
NOTE 4 - ACQUISITIONS2007:
On August 24, 2007, International Paper completed the acquisition of Central Lewmar LLC, one of the largesta privately held paper and packaging distributorsdistributor in the United States, for $189 million. International Paper’s distribution business, xpedx, will operate Central Lewmar as a business unit within its multiple brand strategy.
The following table summarizesDuring the preliminaryfirst quarter of 2008, the Company finalized the allocation of the purchase price to the fair value of the assets and liabilities acquired. The final allocation is expected to be completed by March 31, 2008:acquired as follows:
In millions | ||||||
Accounts receivable | $ | 114 | $ | 116 | ||
Inventory | 31 | 31 | ||||
Other current assets | 7 | 7 | ||||
Plants, properties and equipment, net | 3 | 2 | ||||
Goodwill | 96 | 78 | ||||
Deferred tax asset | 5 | |||||
Other intangible assets | 15 | 33 | ||||
Other long-term assets | 3 | |||||
Total assets acquired | 269 | 272 | ||||
Other current liabilities | 79 | 79 | ||||
Other liabilities | 1 | 4 | ||||
Total liabilities assumed | 80 | 83 | ||||
Net assets acquired | $ | 189 | $ | 189 | ||
The identifiable intangible assets acquired in connection with the Central Lewmar acquisition included the following:
In millions | Estimated Fair Value | Average Useful Life | |||
Asset Class: | |||||
Customer lists | $ | 18 | 13 years | ||
Non-compete covenants | 7 | 5 years | |||
Trade names | 8 | 15 years | |||
Total | $ | 33 | |||
Central Lewmar’s financial position and results of operations have been included in International Paper’s consolidated financial statements since its acquisition on August 24, 2007.
In October 2005, International Paper acquired approximately 65% of Compagnie Marocaine des Cartons et des Papiers (CMCP) in Morocco. On July 31, 2007, the Company completed the purchase of the remaining shares of CMCP for approximately $40 million. The Moroccan packaging company is now wholly owned by International Paper and fully managed as part of the Company’s European Container business.Exchanges:
Total identifiable intangible assets acquired in connection with both of the CMCP acquisitions included the following:
In millions | Estimated Fair Value | Average Remaining Useful Life | |||
Asset Class: | |||||
Trademarks and trade names | $ | 2 | 3 years | ||
Customer portfolio | 22 | 23 years | |||
Total | $ | 24 | |||
On February 1, 2007, the Company completed the non-cash exchange of certain pulp and paper assets in Brazil with Votorantim Celulose e Papel S.A. (VCP) that had been announced in the fourth quarter of 2006. The Company exchanged its in-progress pulp mill project and certain forestland operations including approximately 100,000 hectares of surrounding forestlands in Tres Lagoas, Brazil, for VCP’s Luiz Antonio uncoated paper and pulp mill and approximately 55,000 hectares of forestlands in the state of Sao Paulo, Brazil. The exchange improved the Company’s competitive position by adding a globally cost-competitive paper mill, thereby expanding the Company’s uncoated freesheet capacity in Latin America and providing additional growth opportunities in the region. The exchange was accounted for based on the fair value of assets exchanged, resulting in the recognition in the 2007 first quarter of a pre-tax gain of $205 million ($164 million after taxes) representing the difference between the fair value and book value of the assets exchanged. This gain is included in Net losses (gains)gains on sales and impairments of businesses in the accompanying consolidated statement of operations. The net assets exchanged were included as Assets held for exchange in the accompanying consolidated balance sheet at December 31, 2006.
The following table summarizes the preliminaryfinal allocation of the fair value of the assets exchanged to the assets and liabilities acquired. The final allocation is expected to be completed by December 31, 2007:
In millions | |||
Accounts receivable | $ | 55 | |
Inventory | 24 | ||
Other current assets | 40 | ||
Plants, properties and equipment, net | 582 | ||
Forestlands | 414 | ||
Goodwill | 546 | ||
Other intangible assets | 154 | ||
Other long-term assets | 7 | ||
Total assets acquired | 1,822 | ||
Other current liabilities | 20 | ||
Deferred income taxes | 256 | ||
Other liabilities | 26 | ||
Total liabilities assumed | 302 | ||
Net assets acquired | $ | 1,520 | |
In millions Accounts receivable Inventory Other current assets Plants, properties and equipment, net Forestlands Goodwill Other intangible assets Other long-term assets Total assets acquired Other current liabilities Deferred income taxes Other liabilities Total liabilities assumed Net assets acquired $ 55 19 40 582 434 521 154 9 1,814 18 270 6 294 $ 1,520
Identifiable intangible assets included the following:
In millions | Estimated Fair Value | Average Remaining Useful Life | Estimated Fair Value | Average Useful Life | ||||||
Asset Class: | ||||||||||
Non-competition agreement | $ | 10 | 2 years | $ | 10 | 2 years | ||||
Customer relationships | 144 | 10-20 years | ||||||||
Customer lists | 144 | 10 - 20 years | ||||||||
Total | $ | 154 | $ | 154 | ||||||
The following unaudited pro forma information for the three and nine months ended September 30,March 31, 2007 and 2006 presents the results of operations of International Paper as if these acquisitionsthe Central Lewmar acquisition and the Luiz Antonio asset exchange had occurred on January 1, 2006.2007. This pro forma information does not purport to represent International Paper’s actual results of operations if the transactions described above would have occurred on January 1, 2006,2007, nor is it necessarily indicative of future results.
| Three Months Ended September 30, | Nine Months Ended September 30, | ||||||||||||
In millions, except per share amounts | 2007 | 2006 | 2007 | 2006 | |||||||||
Net sales | $ | 5,669 | $ | 5,775 | $ | 16,627 | $ | 17,613 | |||||
Earnings (loss) from continuing operations | 225 | 414 | 886 | (707 | ) | ||||||||
Net earnings (loss) | 222 | 253 | 851 | (871 | ) | ||||||||
Earnings (loss) from continuing operations per common share | 0.53 | 0.85 | 2.03 | (1.46 | ) | ||||||||
Net earnings (loss) per common share | 0.52 | 0.52 | 1.95 | (1.80 | ) | ||||||||
In millions, except per share amounts | Three Months Ended March 31, 2007 | ||
Net sales | $ | 5,539 | |
Earnings from continuing operations | 483 | ||
Net earnings | 460 | ||
Earnings from continuing operations per common share | 1.08 | ||
Net earnings per common share | 1.03 | ||
InJoint Ventures:
On October and November 2006,5, 2007, International Paper paidand Ilim Holding S.A. announced the completion of the formation of a 50:50 joint venture to operate in Russia as Ilim Group. To form the joint venture, International Paper purchased 50% of Ilim Holding S.A. (Ilim) for approximately $82$620 million, including $545 million in cash and $75 million of notes payable. The Company’s investment in Ilim totaled $697 million at March 31, 2008, which is approximately $350 million higher than the Company’s share of the underlying net assets of Ilim. Based on initial estimates, approximately $150 million of this basis difference, principally related to the estimated fair value write-up of Ilim plant, property and equipment, is being amortized as a reduction of reported net income over the estimated remaining useful lives of the related assets. An estimated $200 million of the difference represents estimated goodwill.
International Paper is accounting for its investment in Ilim, a 50% interestseparate reportable industry segment, using the equity method of accounting. Due to the complex organization structure of Ilim’s operations, and the extended time required for Ilim to prepare consolidated financial information in accordance with accounting principles generally accepted in the International Paper & Sun Cartonboard Co., Ltd. joint venture that currently operates two coated paperboard machines in Yanzhou City, China. In December 2006, a 50% interest withUnited States, the same partner was acquired in a second joint venture, Shandong International Paper & Sun Coated Paperboard Co., Ltd., for approximately $28 million. The operating resultsCompany is reporting its share of these consolidated joint ventures did not have a material effect on the Company’s consolidatedIlim’s results of operations inon a one-quarter lag basis. Accordingly, the accompanying consolidated statement of operations for the three months ended March 31, 2008 includes the Company’s share of Ilim’s operating results for the three-month period ended December 31, 2007 or 2006.under the caption Equity earnings, net of taxes.
NOTE 5 - BUSINESSES HELD FOR SALE AND DIVESTITURES
Discontinued Operations:
2007:2008:
During the thirdfirst quarter of 2007,2008, the Company completedrecorded a pre-tax charge of $25 million ($16 million after taxes) related to the final settlement of a post-closing adjustment to the purchase price received by the Company for the sale of the remainder of its non-U.S. Beverage Packaging business.
During the second quarter of 2007, the Company recorded pre-tax charges of $7business (see Note 9), and a $2 million charge before taxes ($41 million after taxes) and $4 million ($3 million after taxes) relatingfor operating losses related to adjustments to estimated losses on the sales of its Wood Products and Beverage Packaging businesses, respectively.certain wood products facilities.
2007:
During the first quarter of 2007, the Company recorded pre-tax credits of $21 million ($9 million after taxes) and $6 million ($4 million after taxes) relating to the sales of its Wood Products and Kraft Papers businesses, respectively. In addition, a $15 million pre-tax charge ($39 million after taxes) was recorded for adjustments to the loss on the completion of the sale of most of the Beverage Packaging business. Finally, a pre-tax credit of approximately $10 million ($6 million after taxes) was recorded for refunds received from the Canadian government of duties paid by the Company’s former Weldwood of Canada Limited business.
2006:
During the fourth quarter of 2006, the Company entered into an agreement to sell its Beverage Packaging business to Carter Holt Harvey Limited for approximately $500 million, subject to certain adjustments (see Note 9). The sale of the North American Beverage Packaging operations subsequently closed on January 31, 2007, and the sale of the remaining non-U.S. operations closed in the third quarter of 2007.
Also during the fourth quarter of 2006, the Company entered into separate agreements for the sale of 13 lumber mills for approximately $325 million, and five wood products plants for approximately $237 million, both subject to various adjustments at closing. Both of the sales were completed in March 2007.
The Company determined that the accounting requirements for both businesses under Statement of Financial Accounting Standards (SFAS) No. 144, “Accounting for the Impairment or Disposal of Long-Lived Assets,” as discontinued operations were met. Accordingly, the operating results for these businesses are included in Discontinued operations for all periods presented.
Revenues, earnings(loss) and earnings(loss) per share related to the Beverage Packaging business were as follows:
| Three Months Ended September 30, | Nine Months Ended September 30, | |||||||||||||||
In millions, except per share amounts | 2007 | 2006 | 2007 | 2006 | ||||||||||||
Revenues | $ | 1 | $ | 201 | $ | 91 | $ | 612 | ||||||||
Earnings from discontinued operation | ||||||||||||||||
Earnings from operation | $ | — | $ | 21 | $ | 15 | $ | 38 | ||||||||
Income tax expense | — | (7 | ) | (5 | ) | (12 | ) | |||||||||
Earnings from operation, net of taxes | — | 14 | 10 | 26 | ||||||||||||
Loss on sales and impairments | (2 | ) | (103 | ) | (21 | ) | (103 | ) | ||||||||
Income tax benefit (expense) | 1 | 24 | (22 | ) | 24 | |||||||||||
Loss on sales and impairments, net of taxes | (1 | ) | (79 | ) | (43 | ) | (79 | ) | ||||||||
Loss from discontinued operation, net of taxes | $ | (1 | ) | $ | (65 | ) | $ | (33 | ) | $ | (53 | ) | ||||
Earnings (loss) per common share from discontinued operation - assuming dilution | ||||||||||||||||
Earnings from operation | $ | — | $ | 0.03 | $ | 0.02 | $ | 0.05 | ||||||||
Loss on sales and impairments | — | (0.16 | ) | (0.09 | ) | (0.16 | ) | |||||||||
Loss per common share from discontinued operation, net of taxes and minority interest - assuming dilution | $ | — | $ | (0.13 | ) | $ | (0.07 | ) | $ | (0.11 | ) | |||||
Revenues, earnings(loss) and earnings(loss) per share related to the Wood Products business were as follows:
| Three Months Ended September 30, | Nine Months Ended September 30, | |||||||||||||||
In millions, except per share amounts | 2007 | 2006 | 2007 | 2006 | ||||||||||||
Revenues | $ | 34 | $ | 240 | $ | 275 | $ | 825 | ||||||||
(Loss) earnings from discontinued operation | ||||||||||||||||
(Loss) earnings from operation | $ | (6 | ) | $ | (36 | ) | $ | (32 | ) | $ | 24 | |||||
Income tax benefit (expense) | 3 | 14 | 13 | (9 | ) | |||||||||||
(Loss) earnings from operation, net of taxes | (3 | ) | (22 | ) | (19 | ) | 15 | |||||||||
Gain (loss) on sales and impairments | 2 | (165 | ) | 16 | (165 | ) | ||||||||||
Income tax expense | (1 | ) | — | (10 | ) | — | ||||||||||
Gain (loss) on sales and impairments, net of taxes | 1 | (165 | ) | 6 | (165 | ) | ||||||||||
Loss from discontinued operation, net of taxes | $ | (2 | ) | $ | (187 | ) | $ | (13 | ) | $ | (150 | ) | ||||
(Loss) earnings per common share from discontinued operation - assuming dilution | ||||||||||||||||
(Loss) earnings from operation | $ | (0.01 | ) | $ | (0.05 | ) | $ | (0.04 | ) | $ | 0.03 | |||||
(Loss) gain on sales and impairments | — | (0.34 | ) | 0.01 | (0.34 | ) | ||||||||||
Loss per common share from discontinued operation, net of taxes - assuming dilution | $ | (0.01 | ) | $ | (0.39 | ) | $ | (0.03 | ) | $ | (0.31 | ) | ||||
During the 2006 third quarter, International Paper completed the sale of its Brazilian Coated Papers business. The operating results of this business are included in Discontinued operations for all applicable periods presented.
Revenues, earnings and earnings per share related to the Brazilian Coated Papers business were as follows:
In millions, except per share amounts | Three Months Ended September 30, 2006 | Nine Months Ended September 30, 2006 | ||||||
Revenues | $ | 33 | $ | 127 | ||||
Earnings from discontinued operation | ||||||||
Earnings from operation | $ | 2 | $ | 20 | ||||
Income tax expense | — | (9 | ) | |||||
Earnings from operation, net of taxes | 2 | 11 | ||||||
Gain on sale | 101 | 101 | ||||||
Income tax expense | (21 | ) | (21 | ) | ||||
Gain on sale, net of taxes | 80 | 80 | ||||||
Earnings from discontinued operation, net of taxes | $ | 82 | $ | 91 | ||||
Earnings per common share from discontinued operation - assuming dilution | ||||||||
Earnings from operation | $ | — | $ | 0.02 | ||||
Gain on sale | 0.16 | 0.16 | ||||||
Earnings per common share from discontinued operation, net of taxes - assuming dilution | $ | 0.16 | $ | 0.18 | ||||
During the first quarter of 2006, the Company determined that the accounting requirements under SFAS No. 144 for reporting the Kraft Papers business as a discontinued operation were met. Accordingly, a $100 million pre-tax charge ($61 million after taxes) was recorded to reduce the carrying value of the net assets of this business to their estimated fair value. The sale of this business was completed in January 2007. The operating results of this business are included in Discontinued operations for all applicable periods presented.
Revenues, earnings(loss) and earnings(loss) per share related to the Kraft Papers business were as follows:
| Three Months Ended September 30, | Nine Months Ended September 30, | |||||||||||
In millions, except per share amounts | 2006 | 2007 | 2006 | |||||||||
Revenues | $ | 62 | $ | — | $ | 174 | ||||||
Earnings from discontinued operation | ||||||||||||
Earnings from operation | $ | 15 | $ | — | $ | 32 | ||||||
Income tax expense | (6 | ) | — | (12 | ) | |||||||
Earnings from operation, net of taxes | 9 | — | 20 | |||||||||
Gain (loss) on sales and impairments | — | 6 | (116 | ) | ||||||||
Income tax (expense) benefit | — | (2 | ) | 44 | ||||||||
Gain (loss) on sales and impairments, net of taxes | — | 4 | (72 | ) | ||||||||
Earnings (loss) from discontinued operation, net of taxes | $ | 9 | $ | 4 | $ | (52 | ) | |||||
Earnings (loss) per common share from discontinued operation - assuming dilution | ||||||||||||
Earnings from operation | $ | 0.02 | $ | — | $ | 0.04 | ||||||
Gain (loss) on sales and impairments | — | 0.01 | (0.15 | ) | ||||||||
Earnings (loss) per common share from discontinued operation, net of taxes - assuming dilution | $ | 0.02 | $ | 0.01 | $ | (0.11 | ) | |||||
Transformation Plan Forestland Sales:
During the third quarter of 2007, a pre-tax gain of $9 million ($5 million after taxes) was recorded to reduce estimated transaction costs accrued in connection with the 2006 Transformation Plan forestland sales.
During the third quarter of 2006, the Company completed the sales of approximately 476,000 acres of forestlands for approximately $401 million, including $265 million in cash and $136 million of installment notes, resulting in a pre-tax gain of $304 million ($185 million after taxes).
During the second quarter of 2006, the Company completed the sales of approximately 76,000 acres of forestlands for approximately $97 million, resulting in a pre-tax gain of approximately $62 million ($39 million after taxes).
Other Divestitures and Impairments:
2007:2008:
During the secondfirst quarter of 2007,2008, a $1 million net pre-tax credit (a $7($1 million charge after taxes, including a $5 million tax charge in Brazil)taxes) was recorded to adjust previously estimated gains/losses of businesses previously sold.
2007:
During the first quarter of 2007, a $103 million pre-tax gain ($96 million after taxes) was recorded upon the completion of the sale of the Company’s Arizona Chemical business. As part of the transaction, International Paper acquired a minority interest of approximately 10% in the resulting new entity. Since the interest acquired represents significant continuing involvement in the operations of the business under U.S. Generally Accepted Accounting Principles, the operating results for Arizona Chemical have been included in continuing operations in the accompanying consolidated statement of operations through the date of sale.
In addition, during the first quarter of 2007, a $6 million pre-tax credit ($4 million after taxes) was recorded to adjust previously estimated gains/losses of businesses previously sold.
These gains are included, along with the gain on the exchange for the Luiz Antonio mill in Brazil (see Note 4), in Net losses (gains)gains on sales and impairments of businesses in the accompanying consolidated statement of operations.
2006:
During the third quarter of 2006, a net pre-tax gain of $74 million ($44 million after taxes) was recorded for losses (gains) on sales and impairments of businesses. This net gain included the recognition of a previously deferred $110 million pre-tax gain ($68 million after taxes) related to a 2004 sale of forestlands in Maine, a pre-tax charge of $38 million ($23 million after taxes) to reflect the completion of the sale of the Company’s Coated and Supercalendered Papers business in the 2006 third quarter, and a net pre-tax gain of $2 million (a $1 million loss after taxes) related to other smaller sales.
During the 2006 second quarter, the Company recorded a pre-tax charge of $85 million ($53 million after taxes) to adjust the carrying value of the assets of the Company’s Coated and Supercalendered Papers business to their estimated fair value. This charge, together with a pre-tax charge of $52 million ($37 million after taxes) recorded to write down the carrying value of certain assets in Brazil to their estimated fair value, is included in Net losses (gains) on sales and impairments of businesses in the accompanying consolidated statement of operations.
During the first quarter, a pre-tax charge of $1.3 billion was recorded to write down the assets of the Company’s Coated and Supercalendered Papers business to their estimated fair value, as management had committed to a plan to sell this business. In addition, other pre-tax charges totaling $3 million ($2 million after taxes) were recorded to adjust estimated losses of certain smaller operations held for sale.
At December 31, 2006, assets and liabilities of businesses held for sale included the Kraft Papers business, the Beverage Packaging business, the Wood Products business, and the Arizona Chemical business, and consisted of:
In millions | December 31, 2006 | ||
Accounts receivable, net | $ | 298 | |
Inventories | 401 | ||
Plants, properties and equipment, net | 995 | ||
Goodwill | 10 | ||
Other assets | 74 | ||
Assets of businesses held for sale | $ | 1,778 | |
Accounts payable | $ | 184 | |
Accrued payroll and benefits | 50 | ||
Other accrued liabilities | 32 | ||
Other liabilities | 67 | ||
Liabilities of businesses held for sale | $ | 333 | |
Assets and liabilities of businesses held for sale by business were:
| December 31, 2006 | ||||||
In millions | Assets | Liabilities | ||||
Kraft | $ | 148 | $ | 16 | ||
Arizona Chemical | 496 | 159 | ||||
Beverage Packaging | 572 | 107 | ||||
Wood Products | 562 | 51 | ||||
Total | $ | 1,778 | $ | 333 | ||
NOTE 6 - SUPPLEMENTAL FINANCIAL STATEMENT INFORMATION
Temporary investments with an original maturity of three months or less are treated as cash equivalents and are stated at cost. Temporary investments totaled $961$598 million and $1.4 billion$578 million at September 30, 2007March 31, 2008 and December 31, 2006,2007, respectively.
Inventories by major category were:
In millions | September 30, 2007 | December 31, 2006 | March 31, 2008 | December 31, 2007 | ||||||||
Raw materials | $ | 315 | $ | 265 | $ | 409 | $ | 320 | ||||
Finished pulp, paper and packaging products | 1,372 | 1,341 | 1,380 | 1,413 | ||||||||
Operating supplies | 304 | 271 | 314 | 308 | ||||||||
Other | 39 | 32 | 44 | 30 | ||||||||
Total | $ | 2,030 | $ | 1,909 | $ | 2,147 | $ | 2,071 | ||||
Interest payments made during the nine-month periods ended September 30, 2007 and 2006 were $344 million and $507 million, respectively. Capitalized interest costs were $25 million and $13 million for the nine months ended September 30, 2007 and 2006, respectively. Total interest expenseAccumulated depreciation was $360 million for the first nine months of 2007 and $498 million for the first nine months of 2006. Distributions under preferred securities paid by Southeast Timber, Inc., a consolidated subsidiary of International Paper, were $10 million during the first nine months of both 2007 and 2006. The expense related to these preferred securities was included in minority interest expense in the consolidated statement of operations. Income tax payments of $243 million and $109 million were made during the first nine months of 2007 and 2006, respectively.
Accumulated depreciation was $14.7$15.3 billion at September 30, 2007March 31, 2008 and $14.0$14.9 billion at December 31, 2006.2007. Theallowance for doubtful accounts was $101$102 million at September 30, 2007March 31, 2008 and $85$95 million at December 31, 2006.2007.
The following tables present changes in the goodwill balances as allocated to each business segment for the nine-monththree-month periods ended September 30, 2007March 31, 2008 and 2006:2007:
In millions | Balance December 31, 2006 | Reclassifications and Other (a) | Additions/ (Reductions) | Balance September 30, 2007 | Balance December 31, 2007 | Reclassifications and Other (a) | Additions/ (Reductions) | Balance March 31, 2008 | ||||||||||||||||||
Printing Papers | $ | 1,441 | $ | 81 | $ | 531 | (b) | $ | 2,053 | $ | 2,043 | $ | 11 | $ | (7 | )(b) | $ | 2,047 | ||||||||
Industrial Packaging | 670 | 3 | (6 | )(c) | 667 | 683 | 3 | — | 686 | |||||||||||||||||
Consumer Packaging | 510 | 4 | 14 | (d) | 528 | 530 | 4 | — | 534 | |||||||||||||||||
Distribution | 308 | — | 96 | (e) | 404 | 394 | — | (3 | )(c) | 391 | ||||||||||||||||
Total | $ | 2,929 | $ | 88 | $ | 635 | $ | 3,652 | $ | 3,650 | $ | 18 | $ | (10 | ) | $ | 3,658 | |||||||||
| (a) | Represents the effects of foreign currency translations and reclassifications. |
| (b) |
| (c) | Reflects a |
In millions | Balance December 31, 2005 (a) | Reclassifications and Other (b) | Additions/ (Reductions) | Balance September 30, 2006 | |||||||||
Printing Papers | $ | 1,616 | $ | — | $ | — | $ | 1,616 | |||||
Industrial Packaging | 676 | 3 | 11 | (c) | 690 | ||||||||
Consumer Packaging | 1,019 | 1 | (1 | )(d) | 1,019 | ||||||||
Distribution | 299 | — | — | 299 | |||||||||
Corporate | 11 | — | — | 11 | |||||||||
Total | $ | 3,621 | $ | 4 | $ | 10 | $ | 3,635 | |||||
In millions | Balance December 31, 2006 | Reclassifications and Other (a) | Additions/ (Reductions) | Balance March 31, 2007 | |||||||||
Printing Papers | $ | 1,441 | $ | 12 | $ | 304 | (b) | $ | 1,757 | ||||
Industrial Packaging | 670 | — | (3 | )(c) | 667 | ||||||||
Consumer Packaging | 510 | 1 | 8 | (d) | 519 | ||||||||
Distribution | 308 | — | — | 308 | |||||||||
Total | $ | 2,929 | $ | 13 | $ | 309 | $ | 3,251 | |||||
| (a) |
| Represents the effects of foreign currency translations and reclassifications. |
| (b) | Reflects initial goodwill estimate from the Luiz Antonio mill transaction in February 2007. |
| (c) | Reflects a |
| (d) | Reflects |
The following table presents an analysis ofThere was no material activity related toasset retirement obligationsduring either the first quarter of 2008 or 2007.
Interest payments made during the three-month periods ended March 31, 2008 and 2007 were $86 million and $96 million, respectively. Capitalized interest costs were $4 million and $11 million for the three months ended March 31, 2008 and 2007, respectively.Total interest expense was $99 million for the first three months of 2008 and $112 million for the first three months of 2007.Interest income was $18 million and $51 million for the three months ended March 31, 2008 and 2007, respectively. Interest expense and interest income in 2008 and 2007 exclude approximately $74 million and $83 million, respectively, related to investments in and borrowings from variable interest entities for which the Company has a legal right of offset.Distributions under preferred securitiespaid by Southeast Timber, Inc., a consolidated subsidiary of International Paper, were $3 million during the first three months of both 2008 and 2007. The expense related to these preferred securities was included in Minority interest expense in the consolidated statement of operations.Income tax payments of $19 million and $33 million were made during the first three months of 2008 and 2007, respectively.
Equity earnings, net of taxes includes the Company’s asset retirement obligations:share of earnings from its investment in Ilim Holding S.A. ($17 million) and certain other smaller investments.
Nine Months Ended Septemebr 30, | ||||||||
In millions | 2007 | 2006 | ||||||
Asset retirement obligation, January 1 | $ | 29 | $ | 33 | ||||
New liabilities | — | 1 | ||||||
Liabilities settled | (3 | ) | (3 | ) | ||||
Net adjustments to existing liabilities | 1 | 1 | ||||||
Accretion expense | 1 | 1 | ||||||
Asset retirement obligation, September 30 | $ | 28 | $ | 33 | ||||
This obligation is included in Other liabilities in the accompanying consolidated balance sheet.
The components of the Company’spostretirement benefit cost were as follows:
Three Months Ended September 30, | Nine Months Ended September 30, | |||||||||||||||
In millions | 2007 | 2006 | 2007 | 2006 | ||||||||||||
Service cost | $ | — | $ | 1 | $ | 1 | $ | 2 | ||||||||
Interest cost | 9 | 8 | 26 | 24 | ||||||||||||
Actuarial loss | 6 | 6 | 17 | 17 | ||||||||||||
Amortization of prior service cost | (11 | ) | (13 | ) | (33 | ) | (37 | ) | ||||||||
Net postretirement benefit cost (a) | $ | 4 | $ | 2 | $ | 11 | $ | 6 | ||||||||
| Three Months Ended March 31, | ||||||||
In millions | 2008 | 2007 | ||||||
Service cost | $ | — | $ | — | ||||
Interest cost | 9 | 9 | ||||||
Actuarial loss | 7 | 5 | ||||||
Amortization of prior service cost | (9 | ) | (11 | ) | ||||
Net postretirement benefit cost (a) | $ | 7 | $ | 3 | ||||
| (a) | Excludes |
Fair Value Measurements
In accordance with the provisions of FASB Staff Position FAS 157-2 (see Note 7), the Company has partially applied the provisions of SFAS No. 157 only to its financial assets and liabilities recorded at fair value, which consist of derivative contracts, including interest rate swaps, foreign currency forward contracts, and other financial instruments that are used to hedge exposures to interest rate, commodity and currency risks. For these financial instruments, fair value is determined at each balance sheet date using an income approach, which consists of a discounted cash flow model that takes into account the present value of future cash flows under the terms of the contracts using current market information as of the reporting date, such as prevailing interest rates and foreign currency spot and forward rates. The following table provides a summary of the inputs used to develop these estimated fair values under the hierarchy defined in SFAS No. 157:
In millions Assets: Interest rate swaps (a) Commodity forward contracts (b) Foreign currency forward contracts (c) Total Liabilities: Foreign currency forward contracts (d) Total Fair Value Measurements at March 31, 2008 Using Total Quoted Prices in
Active Markets for
Identical Assets
(Level 1) Significant Other
Observable Inputs
(Level 2) Significant
Unobservable
Inputs
(Level 3) $ 69 $ — $ 69 $ — 32 — 32 — 126 — 126 — $ 227 $ — $ 227 $ — $ 6 $ — $ 6 $ — $ 6 $ — $ 6 $ —
| (a) | Includes $8 million recorded in Other current assets and |
| (b) | Includes $22 million recorded in Other current assets and $10 million recorded in Deferred charges and other assets in the accompanying consolidated balance sheet. |
| (c) | Includes $88 million recorded in Other current assets and $38 million recorded in Deferred charges and other assets in the accompanying consolidated balance sheet. |
| (d) | Includes $5 million recorded in Other accrued liabilities and $1 million recorded in Other liabilities in the accompanying consolidated balance sheet. |
NOTE 7 - RECENT ACCOUNTING DEVELOPMENTS
Intangible Assets:
In April 2008, the Financial Accounting Standards Board (FASB) issued FSP FAS 142-3, “Determination of the Useful Life of Intangible Assets,” which amends the factors that should be considered in developing renewal or extension assumptions used in determining the useful life of a recognized intangible asset. This FSP is effective for financial statements issued for fiscal years beginning after December 15, 2008 (calendar year 2009). The Company is currently evaluating the provisions of this FSP.
Derivative Instruments and Hedging Activities:
In March 2008, the FASB issued SFAS No. 161, “Disclosures about Derivative Instruments and Hedging Activities – An Amendment of FASB Statement No. 133.” This statement requires qualitative disclosures about objectives and strategies for using derivatives, quantitative disclosures about fair value amounts of, and gains and losses on, derivative instruments, and disclosures about credit-risk-related contingent features in derivative agreements. Statement No. 161 is effective for fiscal years and interim periods beginning after November 15, 2008 (calendar year 2009). The Company is currently evaluating the provisions of this statement.
Business Combinations:
In December 2007, the FASB issued SFAS No. 141(R), “Business Combinations.” Statement No. 141(R) establishes principles and requirements for how an acquiring entity in a business combination recognizes and measures the assets acquired and liabilities assumed in the transaction; establishes the acquisition-date fair value as the measurement objective for all assets acquired and liabilities assumed; and requires the acquirer to disclose to investors and other users all of the information needed to evaluate and understand the nature and financial effect of the business combination. This statement will be effective prospectively for business combinations for which the acquisition date is on or after the beginning of the first annual reporting period beginning on or after December 15, 2008 (calendar year 2009). The Company is currently evaluating the provisions of this statement.
Noncontrolling Interests in Consolidated Financial Statements:
In December 2007, the FASB also issued SFAS No. 160, “Noncontrolling Interests in Consolidated Financial Statements, an amendment of ARB 51.” This statement clarifies that a noncontrolling (minority) interest in a subsidiary is an ownership interest in the entity that should be reported as equity in the consolidated financial statements. It also requires consolidated net income to include the amounts attributable to both the parent and noncontrolling interest, with disclosure on the face of the consolidated income statement of the amounts attributed to the parent and to the noncontrolling interest. This statement will be effective prospectively for fiscal years beginning after December 15, 2008 (calendar year 2009), with presentation and disclosure requirements applied retrospectively to comparative financial statements. The Company is currently evaluating the provisions of this statement.
Fair Value Option for Financial Assets and Financial Liabilities:
In February 2007, the Financial Accounting Standards Board (FASB)FASB issued SFAS No. 159, “The Fair Value Option for Financial Assets and Financial Liabilities – Including an Amendment of FASB Statement No. 115.” This statement permits an entity to measure certain financial assets and financial liabilities at fair value, which would result in the reporting of unrealized gains and losses in earnings at each subsequent reporting date. The fair value option may be elected on an instrument-by-instrument basis, with few exceptions, as long as it is applied to the instrument in its entirety. The statement establishes presentation and disclosure requirements to help financial statement users understand the effect of an entity’s election on its earnings, but does not eliminate the disclosure requirements of other accounting standards. This statement will be effective as of the beginning of the first fiscal year that begins after November 15, 2007 (calendar year 2008), and is to be applied prospectively as of the beginning of the year in which it is initially applied. The Company is currently evaluatingelected not to apply the provisionsfair value option to any of this statement.its financial assets or liabilities.
Fair Value Measurements:
In September 2006, the FASB issued SFAS No. 157, “Fair Value Measurements,” which provides a single definition of fair value, together with a framework for measuring it, and requires additional disclosuredisclosures about the use of fair value to measure assets and liabilities. It also emphasizes that fair value is a market-based measurement, not an entity-specific measurement, and sets out a fair value hierarchy with the highest priority being quoted prices in active markets. This statement will beIn February 2008, the FASB issued FSP FAS 157-2 which delays the effective date of Statement No. 157 for financial statements issued forall nonrecurring fair value measurements of nonfinancial assets and liabilities until fiscal years beginning after November 15, 20072008 (calendar year 2008),2009). The Company partially adopted the provisions of SFAS No. 157 with respect to its financial assets and interim periods within those fiscal years, and is to be applied prospectively as of the beginning of the year in which it is initially applied.liabilities that are measured at fair value effective January 1, 2008 (see Note 6). The Company is currently evaluating the provisions of this statement.
Accounting for Planned Major Maintenance Activities:
In September 2006, the FASB issued FASB Staff Position (FSP) No. AUG AIR-1, “Accounting for Planned Major Maintenance Activities,” which permits the application of three alternative methods of accounting for planned major maintenance activities: the direct expense, built-in-overhaul, and deferral methods. The FSP was effective for the first fiscal year beginning after December 15, 2006. International Paper adopted the direct expense method of accounting for these costs in the first quarter of 2007 with no impact on its annual consolidated financial statements. See Note 13 for a discussioneffects of the effects of this accounting change on quarterly financial information.
Accounting for Uncertainty in Income Taxes:
In June 2006, the FASB issued FASB Interpretation No. 48 (FIN 48), “Accounting for Uncertainty in Income Taxes, an Interpretation of FASB Statement No. 109.” FIN 48 prescribes a recognition threshold and measurement attribute for the financial statement recognition and measurement of a tax position taken or expected to be taken in a tax return. This interpretation also provides guidance on classification, interest and penalties, accounting in interim periods and transition, and significantly expands income tax disclosure requirements. It applies to all tax positions accounted for in accordance with SFAS No. 109 and was effective for fiscal years beginning after December 15, 2006. International Paper applied theremaining provisions of this interpretation beginning January 1, 2007. See Note 8 for a discussion of the effects of this accounting change.
Accounting for Certain Hybrid Financial Instruments:
In February 2006, the FASB issued SFAS No. 155, “Accounting for Certain Hybrid Financial Instruments – an Amendment of FASB Statements No. 133 and 140,” which provides entities with relief from having to separately determine the fair value of an embedded derivative that would otherwise be required to be bifurcated from its host contract in accordance with SFAS No. 133. This statement allows an entity to make an irrevocable election to measure such a hybrid financial instrument at fair value in its entirety, with changes in fair value recognized in earnings. This statement was effective for International Paper for all financial instruments acquired, issued, or subject to a remeasurement event occurring after January 1, 2007. The adoption of SFAS No. 155 did not have a material impact on the Company’s consolidated financial statements.157.
NOTE 8 -– INCOME TAXES
International Paper adopted FINFASB Interpretation No. 48, “Accounting for Uncertainty in Income Taxes” (FIN 48), on January 1, 2007. The adoption of this standard resulted in a charge to the beginning balance of retained earnings of $94 million at the date of adoption. Total unrecognized tax benefits at the date of adoption including this cumulative effect charge were $919 million, including $562 million that would reducemillion. At December 31, 2007, unrecognized tax benefits totaled $794 million.
During the Company’s effective tax rate if recognized.
The major jurisdictions wherefirst quarter of 2008, the Company files income tax returns are the United States, Brazil, France, Poland and Russia. Generally, tax years 2001 through 2006 remain open and subjectsettled certain issues relating to examination by the relevant tax authorities. The Company is typically engaged in various tax examinations at any given time, both in the United States and in other countries. Currently, the Company is engaged in discussions with the U.S. Internal Revenue Service to conclude the examination of tax years 2001 –through 2003. As a result of these discussions, other pending audit settlements and the expirationother current period transactions, unrecognized tax benefits were reduced by $282 million to $512 million and accrued estimated interest and tax penalties were reduced by $19 million to $72 million at March 31, 2008 with no effect on net earnings. The Company currently estimates that, as a result of ongoing discussions, pending tax settlements and expirations of statutes of limitation, the Company currently estimates thatlimitations, the amount of unrecognized tax benefits could be reduced by up to $500$75 million during the next twelve months, with no significant impact on earnings or cash tax payments.12 months.
The Company accrues interest on unrecognized tax benefits as a component of interest expense. Penalties, if incurred, would be recognized as a component of income tax expense. As of the date of adoption of this standard, the Company had approximately $88 million of such accrued interest and penalties included in Other accrued liabilities associated with unrecognized tax benefits.
NOTE 9 - COMMITMENTS AND CONTINGENCIES
UnderAs previously disclosed, under the terms of the sale agreement for the Beverage Packaging business, the initial purchase price of approximately $500 million received by the Company iswas subject to a possible post-closing adjustment based on adjusted annualized earnings of the Beverage Packaging business for the first six months of 2007 and other
factors. In SeptemberAs of December 31, 2007, the purchaser of the business had proposed a reduction in the purchase price of $59totaling $48 million for this adjustment. While it is possible that such an adjustment could be required when this matter is finalized,and the Company believes, based on a preliminary review of the purchaser’s proposal,believed that no such adjustment iswas required under the sale agreement.
During the first quarter of 2008, representatives of the Company met with representatives of the purchaser of the business in an effort to resolve this matter. After considering many factors, including the prospect of protracted litigation, the complexity of this matter and other commercial relationships between the parties, the matter was settled for $25 million, and this amount was accrued on the balance sheet as of March 31, 2008. In April, a net payment of approximately $20 million was paid to the purchaser of the business for this adjustment, net of a separate post-closing adjustment amount owed by the purchaser to the Company.
Exterior Siding and Roofing Litigation:
International Paper has established reserves relating to the settlement, during 1998 and 1999, of three nationwide class action lawsuits against the Company and Masonite Corp., a former wholly-owned subsidiary of the Company. Those settlements relate to (1) exterior hardboard siding installed during the 1980’s (the 1980’s Hardboard Claims) and during the 1990’s (the 1990’s Hardboard Claims, and together with the 1980’s Hardboard Claims, the Hardboard Claims); (2) Omniwood siding installed during the 1990’s (the Omniwood Claims); and (3) Woodruf roofing installed during the 1980’s and 1990’s (the Woodruf Claims). Each of these settlements is discussed in detail in Note 10, Commitments and Contingent Liabilities, to the Financial Statements included in International Paper’s Annual Report on Form 10-K for the year ended December 31, 2006.2007. All Hardboard Claims mustwere required to be made by January 15, 2008, while all Omniwood and Woodruf Claims must be made by January 6, 2009.
Claims Data and Reserve Analysis
Throughout 2006 andClaims activity for the first nine months of 2007,Hardboard, Omniwood and Woodruf claims activity has beenduring 2007 was generally in line with projections. However, activity for Hardboard claimsupdated projections made in the first three quarters of 2006 was in excess of projected amounts. Accordingly, additional pre-tax charges totaling $50 million were recorded in the first three quarters of 2006 to reflect this higher claims activity pending completion of an updated projection by the Company’s third-party consultant. In the fourth quarter of 2006, this updated projection was completed, resultingalthough in connection with the January 15, 2008 filing deadline for Hardboard siding claims, the Company received a large number of claims at the end of 2007 and the beginning of 2008. During the first quarter of 2008, based on a current estimate of payments to be made for all claims received to date and projected future claim filings, an additional pre-tax charge of $40 million was recorded to increase the reserve to management’s best estimate of the amount required for future projected payments for claims and expenses that have been filed by the end of the claims period. Claims activity for Hardboard claims for the first three quarters of 2007 has been generally in line with these updated projections.payments.
The following table presents the claims activity of the Hardboard Claims for the nine-monththree-month period ended September 30, 2007:March 31, 2008:
In thousands | Single Family | Multi- Family | Total | Single Family | Multi- Family | Total | ||||||||||||
December 31, 2006 | 21.8 | 2.1 | 23.9 | |||||||||||||||
December 31, 2007 | 29.8 | 2.2 | 32.0 | |||||||||||||||
No. of Claims Filed | 18.9 | 1.0 | 19.9 | 8.7 | 1.5 | 10.2 | ||||||||||||
No. of Claims Paid | (12.8 | ) | (0.8 | ) | (13.6 | ) | (4.6 | ) | (0.2 | ) | (4.8 | ) | ||||||
No. of Claims Dismissed | (3.9 | ) | (0.2 | ) | (4.1 | ) | (2.0 | ) | (0.4 | ) | (2.4 | ) | ||||||
September 30, 2007 | 24.0 | 2.1 | 26.1 | |||||||||||||||
March 31, 2008 | 31.9 | 3.1 | 35.0 | |||||||||||||||
The average settlement cost per claim for the nine-monththree-month period ended September 30, 2007March 31, 2008 for the Hardboard settlement was $2,233.$2,164.
The following table presents the claims activity of the Omniwood Claims and the Woodruf Claims for the nine-monththree-month period ended September 30, 2007:March 31, 2008:
| Omniwood | Woodruf | Total | Total | |||||||||||||||||||||||||||||||||||||
| Omniwood | Woodruf | Total | Single | Multi- | Single | Multi- | Single | Multi- | ||||||||||||||||||||||||||||||||
In thousands | Single Family | Multi- Family | Single Family | Multi- Family | Single Family | Multi- Family | Total | Family | Family | Family | Family | Family | Family | |||||||||||||||||||||||||||
December 31, 2006 | 2.7 | 0.6 | 0.8 | 0.3 | 3.5 | 0.9 | 4.4 | |||||||||||||||||||||||||||||||||
December 31, 2007 | 3.1 | 0.6 | 1.0 | 0.3 | 4.1 | 0.9 | 5.0 | |||||||||||||||||||||||||||||||||
No. of Claims Filed | 4.5 | 0.2 | 0.3 | — | 4.8 | 0.2 | 5.0 | 1.9 | — | 0.1 | — | 2.0 | — | 2.0 | ||||||||||||||||||||||||||
No. of Claims Paid | (3.6 | ) | (0.1 | ) | (0.3 | ) | — | (3.9 | ) | (0.1 | ) | (4.0 | ) | (0.9 | ) | (0.1 | ) | (0.1 | ) | — | (1.0 | ) | (0.1 | ) | (1.1 | ) | ||||||||||||||
No. of Claims Dismissed | (0.7 | ) | — | (0.1 | ) | — | (0.8 | ) | — | (0.8 | ) | (0.3 | ) | — | (0.3 | ) | — | (0.6 | ) | — | (0.6 | ) | ||||||||||||||||||
September 30, 2007 | 2.9 | 0.7 | 0.7 | 0.3 | 3.6 | 1.0 | 4.6 | |||||||||||||||||||||||||||||||||
March 31, 2008 | 3.8 | 0.5 | 0.7 | 0.3 | 4.5 | 0.8 | 5.3 | |||||||||||||||||||||||||||||||||
The average settlement costs per claim for the nine-monththree-month period ended September 30, 2007March 31, 2008 for the Omniwood and Woodruf settlements were $4,121$3,925 and $3,783,$2,829, respectively.
The following table presents an analysis of the net reserve activity for the nine-monththree-month period ended September 30, 2007:March 31, 2008:
In millions | Hardboard | Omniwood | Woodruf | Total | Hardboard | Omniwood | Woodruf | Total | ||||||||||||||||||||||||
Balance, December 31, 2006 | $ | 72 | $ | 49 | $ | 3 | $ | 124 | ||||||||||||||||||||||||
Balance, December 31, 2007 | $ | 20 | $ | 25 | $ | 1 | $ | 46 | ||||||||||||||||||||||||
Additional Provisions | — | — | — | — | 34 | 4 | 2 | 40 | ||||||||||||||||||||||||
Payments | (41 | ) | (18 | ) | (1 | ) | (60 | ) | (16 | ) | (5 | ) | (1 | ) | (22 | ) | ||||||||||||||||
Balance, September 30, 2007 | $ | 31 | $ | 31 | $ | 2 | $ | 64 | ||||||||||||||||||||||||
Balance, March 31, 2008 | $ | 38 | $ | 24 | $ | 2 | $ | 64 | ||||||||||||||||||||||||
Other Legal Matters:
International Paper is involved in various other inquiries, administrative proceedings and litigation relating to contracts, sales of property, environmental permits,matters, taxes, personal injury, labor and employment and other matters.matters, some of which allege substantial monetary damages. While any administrative proceeding litigation or claimlitigation has the element of uncertainty, International Paperthe Company believes that the outcome of any of these mattersthe lawsuits or claims that are pending or threatened, or all of them combined, will not have a material adverse effect on its consolidated financial statements.
NOTE 10 - DEBT
Long-term debt plus Notes payable and current maturities of long-term debt totaled approximately $6.8 billion at September 30, 2007, down from approximately $7.2 billion at December 31, 2006.
In the second quarter of 2007, International Paper repurchased $35 million of 5.85% notes with an original maturity in October 2012.
In March 2007, International Paper Investments (Luxembourg) S.ar.l, a wholly-owned subsidiary of International Paper, repaid $143 million of long-term debt with an interest rate of LIBOR plus 40 basis points and a maturity date in November 2010. Other debt activity in the first quarter included the repayment of $198 million of 7.625% notes that matured in the quarter.
In August 2006, International Paper used approximately $320 million of cash to repay its maturing 5.375% euro-denominated notes that were designated as a hedge of euro functional currency net investments. Other debt activity in the third quarter included the repayment of $143 million of 7.875% notes and $96 million of 7% debentures, all maturing within the quarter.
In June 2006, International Paper paid approximately $1.2 billion to repurchase substantially all of its zero-coupon convertible debentures at a price equal to their accreted principal value plus interest, using proceeds from divestitures and $730 million of third party commercial paper issued under the Company’s receivables securitization program. At December 31, 2006, International Paper had repaid all of the commercial paper borrowed under this program.
In February 2006, International Paper repurchased $195 million of 6.4% debentures with an original maturity date of February 2026. Other reductions in the first quarter 2006 included early payment of approximately $495 million of notes with coupon rates ranging from 4% to 8.875% and original maturities from 2007 to 2029. Pre-tax early debt retirement costs of $8 million related to first quarter 2006 debt reductions are included in Restructuring and other charges in the accompanying consolidated statement of operations.
At September 30, 2007 and December 31, 2006, International Paper classified $112 million and $100 million, respectively, of Notes payable and current maturities of long-term debt as Long-term debt. International Paper has the intent and ability to renew or refinance these obligations as evidenced by its contractually committed $1.5 billion bank credit agreement.
At December 31, 2006, International Paper had unused contractually committed bank credit agreements totaling $3.0 billion. In March 2007, International Paper’s 364-day $500 million fully-committed bank credit agreement expired and was not renewed by the Company after reviewing its liquidity position. This leaves approximately $2.5 billion of committed liquidity, consisting of a $1.5 billion contractually committed bank credit agreement that expires in March 2011, and a $1.0 billion receivables securitization program that expires in October 2009.
Maintaining an investment-grade credit rating is an important element of International Paper’s financing strategy. At September 30, 2007, the Company held long-term credit ratings of BBB (stable outlook) and Baa3 (stable outlook) by Standard & Poor’s (S&P) and Moody’s Investor Services (Moody’s), respectively. The Company currently has short-term credit ratings by S&P and Moody’s of A-2 and P-3, respectively.
NOTE 11 -10 – RETIREMENT PLANS
International Paper maintains pension plans that provide retirement benefits to substantially all U.S. employees hired prior to July 1, 2004. These employees generally are eligible to participate in the plans upon completion of one year of service and attainment of age 21. Employees hired after June 30, 2004, who are not eligible for these pension plans, receive an additional company contribution to their individual savings plans.
The pension plans provide defined benefits based on years of credited service and either final average earnings (salaried employees), hourly job rates or specified benefit rates (hourly and union employees). A detailed discussion of these plans is presented in Note 15 to the Financial Statements included in International Paper’s Annual Report on Form 10-K for the year ended December 31, 2006.2007.
Net periodic pension expense for our qualified and nonqualified U.S. defined benefit plans consisted of the following:
Three Months Ended September 30, | Nine Months Ended September 30, | |||||||||||||||
In millions | 2007 | 2006 | 2007 | 2006 | ||||||||||||
Service cost | $ | 28 | $ | 35 | $ | 85 | $ | 106 | ||||||||
Interest cost | 130 | 127 | 390 | 380 | ||||||||||||
Expected return on plan assets | (158 | ) | (135 | ) | (475 | ) | (405 | ) | ||||||||
Actuarial loss | 48 | 60 | 143 | 182 | ||||||||||||
Amortization of prior service cost | 5 | 7 | 15 | 20 | ||||||||||||
Net periodic pension expense (a) | $ | 53 | $ | 94 | $ | 158 | $ | 283 | ||||||||
In millions Service cost Interest cost Expected return on plan assets Actuarial loss Amortization of prior service cost Net periodic pension expense Three Months Ended
March 31, 2008 2007 $ 25 $ 27 133 131 (167 ) (159 ) 30 48 7 5 $ 28 $ 52
For its qualified plan, International Paper makes contributions that are sufficient to fully fund its actuarially determined costs, generally equal to the minimum amounts required by the Employee Retirement Income Security Act (ERISA). International Paper made voluntaryno contributions of $1.0 billion to the qualified plan in December 2006, but does not expect2007, and none are expected to make any contributionsbe required in 2007.2008. The nonqualified defined benefit plans are funded to the extent of benefit payments, which equaled $25$5 million through September 30, 2007.March 31, 2008.
NOTE 12 -11 – STOCK-BASED COMPENSATION
International Paper has a Long-Term Incentive Compensation Plan (LTICP) that includes a performance share program, a service-based restricted stock award program, an executive continuity award program that provides for tandem grants of restricted stock and stock options, and a stock option program that has been discontinued as described below. The LTICP is administered by the Management Development and Compensation Committee of the Board of Directors (the Committee). Non-employee directors are not eligible for awards under the LTICP. A detailed discussion of these plans is presented in Note 17 to the Financial Statements included in International Paper’s Annual Report on Form 10-K for the year ended December December��31, 2006.2007. As of September 30, 2007, 26.4March 31, 2008, 26.5 million shares were available for grant under the LTICP.
Total stock-based compensation cost recognized in Selling and administrative expense in the accompanying consolidated statement of operations for the ninethree months ended September 30,March 31, 2008 and 2007 and 2006 was $94$29 million and $99$26 million, respectively. The actual tax benefit realized for stock-based compensation costs was $15 million$19,000 and $3 million for the nine-monththree-month periods ended September 30,March 31, 2008 and 2007, and 2006, respectively. At September 30, 2007, $103March 31, 2008, $139 million, net of estimated forfeitures, of compensation cost related to unvested restricted performance shares, executive continuity awards and restricted stock attributable to future performance had not yet been recognized. This amount will be recognized in expense over a weighted-average period of one year.two years.
Performance-Based Restricted Share Program:
Under the Performance Share Program (PSP), contingent awards of International Paper common stock are granted by the Committee to approximately 900 employees. Awards are earned based on the achievement of defined performance rankings of return on investment (ROI) and total shareholder return (TSR) compared to ROI and TSR peer groups of companies. Awards are weighted 75% for ROI and 25% for TSR for all participants except for certain members of senior managementofficers for whom awards are weighted 50% for ROI and 50% for TSR. The ROI component of the PSP awards is valued at the closing stock price on the day prior to the grant date. As the ROI component contains a performance condition, compensation expense, net of estimated forfeitures, is recorded over the requisite service period based on the most probable number of awards expected to vest. The TSR component of the PSP awards is valued using a Monte Carlo simulation as the TSR component contains a market condition. The Monte Carlo simulation estimates the fair value of the TSR component based on the expected term of the award, risk-free rate, expected dividends, and the expected volatility for the Company and its competitors. The expected term was estimated based on the vesting period of the awards, the risk-free rate was based on the yield on U.S. Treasury securities matching the vesting period, the expected dividends were assumed to be zero for all companies, and the volatility was based on the Company’s historical volatility over the expected term.
The
PSP awards issued to thecertain members of senior management group are liability awards, which are required to be remeasured at fair value at each balance sheet date. The valuation of these PSP liability awards is computed based on the same methodology as other PSP awards.
The following table sets forth the assumptions used to determine compensation cost for the market condition component of the PSP consistent with the requirements of SFAS No. 123(R):
| ||||||
|
Three Months Ended March 31, | ||||
2008 | 2007 | |||
Expected volatility | 19.57% - 25.46% | 20.33% - 20.46% | ||
Risk-free interest rate | 1.199% - 3.497% | 4.64% - 4.75% | ||
The following summarizes the activity for PSP for the ninethree months ended September 30, 2007:March 31, 2008:
| Nonvested Shares | Weighted Average Fair Value | |||||
Outstanding at December 31, 2006 | 5,504,458 | $ | 38.61 | |||
Granted | 2,492,194 | 33.75 | ||||
Shares Issued (a) | (1,502,910 | ) | 36.22 | |||
Forfeited | (147,726 | ) | 39.41 | |||
Outstanding at September 30, 2007 | 6,346,016 | $ | 37.25 | |||
| Nonvested Shares | Weighted Average Grant Date Fair Value | |||||
Outstanding at December 31, 2007 | 6,217,012 | $ | 35.67 | |||
Granted | 3,983,300 | 36.25 | ||||
Shares Issued (a) | (3,553,038 | ) | 41.72 | |||
Forfeited | (177,350 | ) | 34.90 | |||
Outstanding at March 31, 2008 | 6,469,924 | $ | 32.73 | |||
| (a) | Includes |
Stock Option Program:
The Company discontinued its stock option program in 2004 for members of executive management, and in 2005 for all other eligible U.S. and non-U.S. employees. Stock-based compensation expense totaling $5,300 related to a stock option reload was recorded for the nine months ended September 30, 2007. The expense was calculated under the Black-Scholes option pricing model using 20.46% expected volatility, an interest rate of 4.92%, a 2.74% expected dividend yield and a term of two years.
A summary of option activity under the plan as of September 30, 2007March 31, 2008 is presented below:
| Options | Weighted Average Exercise Price | Weighted Average Remaining Life (years) | Aggregate Intrinsic Value (thousands) | Options | Weighted Average Exercise Price | Weighted Average Remaining Life (years) | Aggregate Intrinsic Value (thousands) | |||||||||||||||
Outstanding at December 31, 2006 | 35,982,698 | $ | 39.52 | |||||||||||||||||||
Outstanding at December 31, 2007 | 28,013,735 | $ | 39.81 | |||||||||||||||||||
Granted | 1,120 | 36.54 | — | — | ||||||||||||||||||
Exercised | (3,513,671 | ) | 34.41 | (14,800 | ) | 31.55 | ||||||||||||||||
Forfeited | (410,128 | ) | 47.51 | (38,768 | ) | 43.60 | ||||||||||||||||
Expired | (3,126,869 | ) | 41.61 | (1,455,974 | ) | 40.58 | ||||||||||||||||
Outstanding at September 30, 2007 | 28,933,150 | $ | 39.80 | 4.57 | $ | 1,152 | ||||||||||||||||
Outstanding at March 31, 2008 | 26,504,193 | $ | 39.77 | 4.3316 | $ | 1,054 | ||||||||||||||||
All options were fully vested and exercisable as of September 30, 2007.March 31, 2008.
Executive Continuity and Restricted Stock Award Program:
The following summarizes the activity of the Executive Continuity and Restricted Stock Award Program for the ninethree months ended September 30, 2007:March 31, 2008:
| Nonvested Shares | Weighted Average Fair Value | |||||
Outstanding at December 31, 2006 | 177,250 | $ | 37.21 | |||
Granted | 3,000 | 33.70 | ||||
Shares Issued | (61,625 | ) | 36.26 | |||
Forfeited | — | — | ||||
Outstanding at September 30, 2007 | 118,625 | $ | 37.61 | |||
NOTE 13 - ACCOUNTING CHANGE
Effective January 1, 2007, International Paper adopted FASB Staff Position (FSP) No. AUG AIR-1, “Accounting for Planned Major Maintenance Activities.” Prior to January 1, 2007, International Paper accounted for the cost of planned major maintenance by expensing the costs ratably throughout the year. Effective January 1, 2007, International Paper adopted the direct expense method of accounting whereby all costs for repair and maintenance activities are expensed in the month that the related activity is performed. International Paper retrospectively applied the effects of the adoption of this FSP, resulting in an increase in net earnings of $22 million, or $0.04 per share and a reduction of $8 million, or $0.01 per share for the three and nine-month periods ended September 30, 2006, respectively. However, this accounting change had no effect on previously reported full-year operating results or on the December 31, 2006 balance sheet.
| Nonvested Shares | Weighted Average Grant Date Fair Value | |||||
Outstanding at December 31, 2007 | 122,625 | $ | 37.18 | |||
Granted | 1,500 | 31.70 | ||||
Shares Issued | (28,000 | ) | 38.73 | |||
Forfeited | — | — | ||||
Outstanding at March 31, 2008 | 96,125 | $ | 36.64 | |||
NOTE 14 -12 – SUBSEQUENT EVENT
On October 5, 2007,Saturday May 3, 2008, a recovery boiler at International Paper Company’s Vicksburg, Mississippi containerboard mill exploded, resulting in one fatality and Ilim Holding S.A. announcedinjuries to 17 others who were employees of contractors working on the completionsite. The mill had been undergoing its annual maintenance outage and was in the process of starting back up when the incident occurred. The situation is now contained and an investigation of the formationincident is underway.
The mill is currently not operating. While it is still too early to predict an estimated start-up date, the loss of productive capacity will tighten the Company’s supply/demand balance. However, all efforts will be made to meet customer needs on a 50:50 joint venturecase-by-case basis. The Company has both business interruption insurance and property damage insurance that will operate in Russia as Ilim Group (Ilim). To form the joint venture, International Paper purchased 50% of Ilim Holding, S.A., for approximately $620are subject to deductibles and retention amounts up to $20 million. A key element of the proposed joint venture strategyHowever, it is a long-term investment program in which the joint venture will invest, through cash from operations and additional borrowings by the joint venture, approximately $1.5 billion in Ilim’s four mills over approximately five years. This planned investmentstill too early in the Russian pulp and paper industry will be usedinvestigation to upgrade equipment, increase production capacity and allow for new high-value uncoated paper, pulp and corrugated packaging product development.determine the amount of any loss potentially not covered by insurance.
Financial Information by Industry Segment
(Unaudited)
(In millions)
Sales by Industry Segment
| Three Months Ended September 30, | Nine Months Ended September 30, | Three Months Ended March 31, | ||||||||||||||||||||||
| 2007 | 2006 | 2007 | 2006 | 2008 | 2007 | |||||||||||||||||||
Printing Papers | $ | 1,660 | $ | 1,610 | (3) | $ | 4,810 | $ | 5,225 | (3) | $ | 1,715 | $ | 1,540 | ||||||||||
Industrial Packaging | 1,305 | 1,250 | 3,855 | 3,665 | 1,445 | 1,235 | ||||||||||||||||||
Consumer Packaging | 775 | 705 | 2,315 | 1,950 | 770 | 715 | ||||||||||||||||||
Distribution | 1,880 | 1,730 | 5,275 | 5,070 | 1,985 | 1,675 | ||||||||||||||||||
Forest Products | 120 | 135 | 295 | 575 | 25 | 85 | ||||||||||||||||||
Other Businesses | — | 245 | 135 | 705 | — | 135 | ||||||||||||||||||
Corporate and Inter-segment Sales | (199 | ) | (246 | ) | (636 | ) | (519 | ) | (272 | ) | (168 | ) | ||||||||||||
Net Sales | $ | 5,541 | $ | 5,429 | $ | 16,049 | $ | 16,671 | $ | 5,668 | $ | 5,217 | ||||||||||||
Operating Profit by Industry Segment
Three Months Ended September 30, | Nine Months Ended September 30, | |||||||||||||||
| 2007 | 2006 (1) | 2007 | 2006 (1) | |||||||||||||
Printing Papers (2) | $ | 307 | $ | 251 | $ | 787 | $ | 573 | (5) | |||||||
Industrial Packaging | 115 | 152 | (4) | 357 | 267 | (4) | ||||||||||
Consumer Packaging (2) | 49 | 62 | 158 | 145 | (5) | |||||||||||
Distribution | 40 | 34 | 107 | 97 | ||||||||||||
Forest Products | 99 | 166 | 297 | 516 | ||||||||||||
Other Businesses (6) | — | 21 | 6 | 51 | ||||||||||||
Operating Profit | 610 | 686 | 1,712 | 1,649 | ||||||||||||
Interest expense, net | (77 | ) | (144 | ) | (218 | ) | (441 | ) | ||||||||
Minority interest (7) | 4 | — | 15 | 5 | ||||||||||||
Corporate items, net | (188 | ) | (221 | ) | (531 | ) | (580 | ) | ||||||||
Restructuring and other charges | (42 | ) | (92 | ) | (86 | ) | (189 | ) | ||||||||
Insurance recoveries | — | — | — | 19 | ||||||||||||
Gains on forestland sales | 9 | 304 | 9 | 366 | ||||||||||||
Net (losses) gains on sales and impairments of businesses | (1 | ) | 61 | 314 | (1,359 | ) | ||||||||||
Earnings (loss) from continuing operations before income taxes and minority interest | $ | 315 | $ | 594 | $ | 1,215 | $ | (530 | ) | |||||||
| Three Months Ended March 31, | ||||||||
| 2008 | 2007 (2) | |||||||
Printing Papers | $ | 185 | $ | 167 | ||||
Industrial Packaging | 97 | 73 | ||||||
Consumer Packaging | 9 | (3) | 40 | |||||
Distribution | 16 | 20 | ||||||
Forest Products | 25 | 97 | ||||||
Other Businesses (4) | — | 6 | ||||||
Operating Profit (1) | 332 | 403 | ||||||
Interest expense, net | (81 | ) | (61 | ) | ||||
Minority interest/equity earnings adjustment (5) | 4 | 5 | ||||||
Corporate items, net | (21 | ) | (37 | ) | ||||
Restructuring and other charges | (37 | ) | (18 | ) | ||||
Net gains on sales and impairments of businesses | 1 | 314 | ||||||
Earnings from continuing operations before income taxes, equity earnings and minority interest | $ | 198 | $ | 606 | ||||
Equity earnings, net of taxes - Ilim Holding S.A. (1) | $ | 17 | $ | — | ||||
| (1) | In addition to the operating profits shown above, International Paper recorded $17 million of equity earnings, net of taxes, for the three months ended March 31, 2008, related to its 50% equity investment in Ilim Holding S.A., a separate reportable industry segment. |
| (2) | Prior-year information has been revised to reflect |
| (3) | Includes |
| (4) |
| Includes Arizona Chemical, European Distribution and certain smaller businesses. |
| Operating profits for industry segments include each segment’s percentage share of the profits of subsidiaries included in that segment that are less than wholly owned. The pre-tax minority interest / equity earnings for these subsidiaries |
INTERNATIONAL PAPER COMPANY
Sales Volumes By Product (1) (2)
(Unaudited)
| Three Months Ended September 30, | Nine Months Ended September 30, | |||||||||
| 2007 | 2006 | 2007 | 2006 | |||||||
Printing Papers (In thousands of short tons) | ||||||||||
U.S. Uncoated Papers | 940 | 1,002 | 2,871 | 3,019 | ||||||
European & Russian Uncoated Papers | 351 | 353 | 1,081 | 1,072 | ||||||
Brazilian Uncoated Papers | 225 | (4) | 121 | 567 | (4) | 353 | ||||
Asian Uncoated Papers | 6 | 4 | 18 | 12 | ||||||
Uncoated Papers | 1,522 | 1,480 | 4,537 | 4,456 | ||||||
Coated Papers | — | 175 | — | 1,168 | ||||||
Market Pulp (3) | 348 | 282 | 1,020 | 856 | ||||||
Packaging (In thousands of short tons) | ||||||||||
Container of the Americas | 896 | 902 | 2,683 | 2,733 | ||||||
European Container (Boxes) | 274 | 293 | 879 | 939 | ||||||
Other Industrial and Consumer Packaging | 158 | 124 | 454 | 401 | ||||||
Industrial and Consumer Packaging | 1,328 | 1,319 | 4,016 | 4,073 | ||||||
Containerboard | 466 | 451 | 1,315 | 1,385 | ||||||
Bleached Packaging Board | 514 | (5) | 369 | 1,501 | (5) | 1,065 | ||||
Coated Bristols | 105 | 101 | 308 | 311 | ||||||
Saturated and Bleached Kraft Papers | 61 | 62 | 177 | 196 | ||||||
| Three Months Ended March 31, | ||||
| 2008 | 2007 | |||
Printing Papers (In thousands of short tons) | ||||
U.S. Uncoated Papers | 910 | 982 | ||
European & Russian Uncoated Papers | 373 | 376 | ||
Brazilian Uncoated Papers | 210 | 144 | ||
Asian Uncoated Papers | 8 | 5 | ||
Uncoated Papers | 1,501 | 1,507 | ||
Market Pulp (3) | 354 | 335 | ||
Packaging (In thousands of short tons) | ||||
Container of the Americas | 882 | 882 | ||
European Container (Boxes) | 295 | 307 | ||
Other Industrial and Consumer Packaging | 179 | 131 | ||
Industrial and Consumer Packaging | 1,356 | 1,320 | ||
Containerboard | 506 | 392 | ||
Coated Paperboard | 606 | 591 | ||
Saturated and Bleached Kraft Papers | 65 | 53 | ||
| (1) | Sales volumes include third party and inter-segment |
| (2) | Sales volumes for divested businesses are included through the date of sale, except for discontinued operations. |
| (3) | Includes internal sales to mills. |
Sales Volumes represent supplemental information that is not included in Part I, Item 1. Financial Information.
ITEM 2. MANAGEMENT’S DISCUSSION AND ANALYSIS OF FINANCIAL CONDITION AND RESULTS OF OPERATIONS
| ITEM 2. | MANAGEMENT’S DISCUSSION AND ANALYSIS OF FINANCIAL CONDITION AND RESULTS OF OPERATIONS |
EXECUTIVE SUMMARY
International Paper reported solid operating results for the 2008 first quarter, excluding land sales, despite a significant increase in raw material, energy and freight input costs during the quarter. Compared with the first quarter of 2007, thirdoperating results reflect improved average price realizations and margins and lower operating costs, but these improvements were largely offset by the rapid rise in input costs. Operating profits for the quarter reflecting the best quarterlyalso reflect an expected decline in earnings since 2000. from Forest Products land sales.
Compared with the 2007 secondfirst quarter, product pricinghigher operating profits for uncoated paper, pulp and packaging grades improved during the quarter. Mill operations continued to be strong, and we began the production of lightweight linerboard at our Pensacola, Florida mill in September. Raw material costs were somewhat higher driven by increases for wood and chemicals, partially offset by favorable energy costs. Sales volumes and earnings from land sales were about flat.
Our North American Printing Papers business posted its best quarterly earnings since 1995, benefiting fromin the 2008 first quarter reflected higher average pricessales price realizations, largely offset by lower U.S. Market Pulp profits. Profits for the quarter increased in Brazil, reflecting improved price realizations and reduced planned maintenance outage costs. Brazilian Printing Papers earnings improved significantly driven by higher average pricescontributions from the Luiz Antonio mill acquired in February 2007. Industrial Packaging operating profits increased in both North America and improvedEurope, as improvements in price realizations, sales volumes and product mix. Our xpedx distribution businessoperating costs offset higher wood, energy and chemical costs. Consumer Packaging profits declined versus the 2007 first quarter as higher input costs and unfavorable manufacturing operations offset the benefits of higher average price realizations. Shorewood’s earnings also reported solid quarterlydeclined. Operating results also reflected an expected decline in Forest Products earnings benefiting from increased sales volumes andfor the addition of one month’s earnings from the newly acquired Central Lewmar LLC.quarter.
Looking ahead to the fourthsecond quarter of 2008, we expect slightly higher earnings from continuing operations and before special items than in the 2007 third quarter, including higher earnings from land sales. Averageaverage paper price realizations to improve as announced increases are realized, while containerboard prices should improve moderately as we continuebe similar to implement announced North American price increases in paper, pulp, containerboard and corrugated boxes. Sales volumesfirst-quarter levels. Demand for containerboardprinting papers is expected to decline slightly in North America, with some improvement in Europe and Brazil, while market pulp sales volumes should increase. Containerboard sales volumes should decline slightly due to increased planned maintenance outage production limitations in the second quarter. Maintenance costs should be about $60 million higher reflecting these outages, although improvements in operations should largely offset this increase. Raw material, energy, chemical and freight input costs are expected to benefit fromremain high. Overall, despite an expected weak U.S. economy, if input costs remain similar to the additional capacity at our Pensacola mill, and European paper and packaging volumes should increase from a seasonally weak third quarter. However, sales volumeshigh first-quarter levels, operating profits in other business segmentsthe second quarter are expected to slow seasonally toward year end. Forest Products earnings are expected to increase due to the timing of land sale transactions. Costs for wood, energy and transportation are expected to continue to rise, and we expect that interest expense and income taxes will both be higher. Corporate expenses are expected to reflect increased LIFO inventory and incentive compensation costs, although these charges are dependent upon factors that cannot be accurately determined until year end.higher than first-quarter totals.
RESULTS OF OPERATIONS
For the thirdfirst quarter of 2007,2008, International Paper reported net sales of $5.5$5.7 billion, compared with $5.4$5.2 billion in the thirdfirst quarter of 20062007 and $5.3$5.8 billion in the secondfourth quarter of 2007.
Net earnings totaled $217$133 million, or $0.51$0.31 per share, in the 2007 third2008 first quarter. This compared with earnings of $224$434 million, or $0.46$0.97 per share, in the thirdfirst quarter of 20062007 and earnings of $190$327 million, or $0.44$0.78 per share, in the secondfourth quarter of 2007.
Earnings From Continuing Operations
(after tax, in millions)
Earnings from continuing operations were $220$150 million in the thirdfirst quarter of 2008 compared with $457 million in the first quarter of 2007 compared with earnings of $385 million in the third quarter of 2006 and earnings of $200$338 million in the 2007 secondfourth quarter. Compared with the thirdfirst quarter of 2006,2007, earnings in the 2007 third2008 first quarter benefited from higher average price realizations ($4789 million), slightly higher sales volumes ($3 million), lower operating costs and a more favorable mix of products sold ($3215 million), lower mill production outages costs ($17 million), and a lower freight costsincome tax provision ($32 million). reflecting a slightly lower estimated effective tax rate in 2008. These benefits were offset by the net effect of slightly lower sales volumes and decreased market-related downtime ($4 million),significantly higher raw material and freight costs ($43107 million), lower gains from land sales ($2049 million), and higher costs for planned mill production outagesnet interest expense ($2112 million). Costs associated with the shutdownramp-up of the paper machine at the Pensacola mill for conversionconverted to the production of linerboardcontainerboard also reduced earnings ($183 million). Corporate items and other costs decreased ($30 million), principally due to lower pension costs. Net interest expense also decreased ($49 million) reflecting lower average debt balances and interest rates due to debt refinancings and repayments. The net impact of acquisitions and divestitures resulted in lower2008 first quarter benefited from equity earnings, ($27 million). Income taxes were $1 million higher in the 2007 third quarter. Special items, net of taxes, resultedrelating to International Paper’s investment in Ilim Holding S.A. ($17 million). Additionally, net special items were a loss of $23$25 million in the 2007 third2008 first quarter versus a gain of $169$254 million in the 2006 third quarter.first quarter of 2007.
Compared with the secondfourth quarter of 2007, earnings from continuing operations benefited from higher average price realizations ($1719 million), and lower costs associated with the ramp-up of the converted paper machine at the Pensacola mill outage costs ($24 million), and higher gains from land sales ($26 million). These benefits were offset by higher raw material and freight costs ($1264 million), lower sales volumes and increased market-related downtime ($112 million), higher manufacturing costs ($109 million), higher mill outage costs ($5 million), lower gains from land sales ($102 million), and costs associated with the conversion of the paper machine at the Pensacola milla slightly higher income tax provision ($71 million). Corporate items and other costs decreased ($533 million), while net interest expense increased slightly ($1 million). Net interest expense decreased ($2 million). Special items,Equity earnings, net of taxes, resulted infor Ilim Holding, S.A. increased earnings $17 million. Net special items were a loss of $23$25 million in the both2008 first quarter versus a gain of $44 million in the 2007 secondfourth quarter and the 2007 third quarter.of 2007.
To measure the performance of the Company’s business segments from period to period without variations caused by special or unusual items, International Paper’s management focuses on business segment operating
profit. This is defined as earnings before taxes, equity earnings and minority interest, excluding interest expense, corporate charges and special items that include restructuring charges, early debt extinguishment costs, legal reserves, insurance recoveries, (losses) gains on sales and impairments of businesses, and the reversal of reserves no longer required. Prior-period information has been revised to reflect the retrospective application of a change in accounting for planned major maintenance activities.
The following table presents a reconciliation of International Paper’s net earnings to its operating profit:
| Three Months Ended | Three Months Ended | |||||||||||||||||||||||
| September 30, | June 30, 2007 | March 31, | December 31, | |||||||||||||||||||||
In millions | 2007 | 2006 | 2008 | 2007 | 2007 | |||||||||||||||||||
Net Earnings | $ | 217 | $ | 224 | $ | 190 | $ | 133 | $ | 434 | $ | 327 | ||||||||||||
Deduct - Discontinued operations: | ||||||||||||||||||||||||
Losses (earnings) from operations | 3 | (4 | ) | 3 | 1 | (3 | ) | 8 | ||||||||||||||||
Loss on sales or impairments | — | 165 | 7 | 16 | 26 | 3 | ||||||||||||||||||
Earnings From Continuing Operations | 220 | 385 | 200 | 150 | 457 | 338 | ||||||||||||||||||
Add back: | ||||||||||||||||||||||||
Income tax provision | 89 | 204 | 89 | 59 | 143 | 94 | ||||||||||||||||||
Equity earnings, net of taxes | (16 | ) | — | — | ||||||||||||||||||||
Minority interest expense, net of taxes | 6 | 5 | 5 | 5 | 6 | 7 | ||||||||||||||||||
Earnings From Continuing Operations | ||||||||||||||||||||||||
Before Income Taxes and Minority Interest | 315 | 594 | 294 | |||||||||||||||||||||
Before Income Taxes, Equity Earnings and Minority Interest | 198 | 606 | 439 | |||||||||||||||||||||
Interest expense, net | 77 | 144 | 80 | 81 | 61 | 79 | ||||||||||||||||||
Minority interest included in operations | (4 | ) | — | (6 | ) | |||||||||||||||||||
Minority interest/equity earnings included in operations | (4 | ) | (5 | ) | (4 | ) | ||||||||||||||||||
Corporate items | 188 | 221 | 179 | 21 | 37 | 56 | ||||||||||||||||||
Special items: | ||||||||||||||||||||||||
Restructuring and other charges | 42 | 92 | 26 | 37 | 18 | 9 | ||||||||||||||||||
Gains on forestland sales | (9 | ) | (304 | ) | — | |||||||||||||||||||
Net losses (gains) on sales and impairments of businesses | 1 | (61 | ) | (1 | ) | |||||||||||||||||||
Net gains on sales and impairments of businesses | (1 | ) | (314 | ) | (13 | ) | ||||||||||||||||||
| $ | 610 | $ | 686 | $ | 572 | $ | 332 | $ | 403 | $ | 566 | |||||||||||||
Industry Segment Operating Profit | ||||||||||||||||||||||||
Printing Papers | $ | 307 | $ | 251 | $ | 249 | $ | 185 | $ | 167 | $ | 243 | ||||||||||||
Industrial Packaging | 115 | 152 | 139 | 97 | 73 | 109 | ||||||||||||||||||
Consumer Packaging | 49 | 62 | 48 | 9 | 40 | 15 | ||||||||||||||||||
Distribution | 40 | 34 | 38 | 16 | 20 | 28 | ||||||||||||||||||
Forest Products | 99 | 166 | 98 | 25 | 97 | 171 | ||||||||||||||||||
Specialty Businesses and Other | — | 21 | — | |||||||||||||||||||||
Other Businesses | — | 6 | — | |||||||||||||||||||||
Total Industry Segment Operating Profit | $ | 610 | $ | 686 | $ | 572 | $ | 332 | $ | 403 | $ | 566 | ||||||||||||
| (1) | Amounts for 2007 have been restated to reflect a change in the method of allocating corporate overhead expense to business segments (see Note 1). |
| (2) | In addition to operating profit shown above, International Paper recorded $17 million of equity earnings, net of taxes, for the three months ended March 31, 2008, related to its investment in Ilim Holding S.A., a separate reportable industry segment. |
Industry Segment Operating Profit
Segment Operating Profit
(in millions)

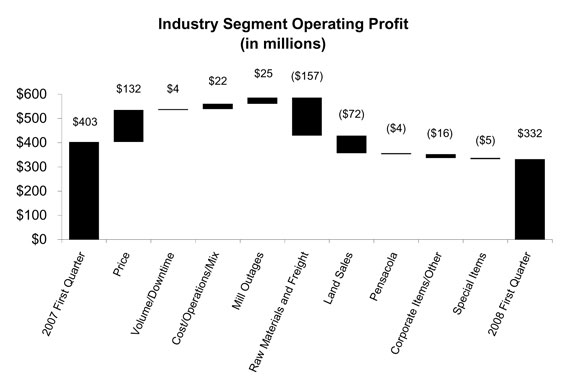
Industry segment operating profits of $332 million in the 2008 first quarter were $610lower than both $403 million in the 2007 third quarter compared with $686 million in the 2006 thirdfirst quarter and $572$566 million in the 2007 secondfourth quarter. Compared with the thirdfirst quarter of 2006,2007, earnings in the current quarter benefited from significantly higher average pricesprice realizations ($65132 million), higher sales volumes ($4 million), lower manufacturing operating costs and a more profitablefavorable mix of products sold ($44 million), lower freight costs ($422 million), and other itemslower costs due to mill production outages ($1025 million). These benefits were more than offset by significantly higher raw material and freight costs ($60 million), the net impact of lower sales volumes and decreased market-related downtime ($6 million), higher costs due to mill outages ($30157 million), lower gains from land sales ($2872 million), and higher corporate items and other costs ($16 million). Costs associated with the ramp-up of the paper machine at the Pensacola mill converted to the production of containerboard also reduced earnings ($4 million). Special items consisted of a loss of $5 million in the 2008 first quarter.
Compared with the 2007 fourth quarter, operating profits benefited from higher average price realizations ($28 million) and lower costs associated with the conversion of the paper machine at the Pensacola mill ($25 million). The net impact of acquisitions and divestitures resulted in lower earnings ($37 million). Net special items consisted of a gain of $13 million in the 2006 third quarter.
Compared with the 2007 second quarter, operating profits benefited from higher average prices ($24 million), lower costs due to mill outages ($34 million), higher gains from land sales ($3 million), and other items ($128 million). These benefits were partially offset by higher raw material costs ($8 million), higherand freight costs ($292 million), the impact of lower sales volumes and increased market-related downtime ($118 million), higher manufacturing operating costs and a less profitable mix of products sold ($1413 million), higher mill outage costs ($7 million), and significantly lower gains from land sales ($147 million). Other costs associated withdecreased ($12 million). Special items consisted of a loss of $5 million in the conversion of the paper machine at the Pensacola mill ($10 million).2008 first quarter.
During the 2007 third2008 first quarter, International Paper took approximately 105,000120,000 tons of downtime, including 7,000 tons fornone of which was market-related, downtime, compared with approximately 110,000180,000 tons of downtime in the thirdfirst quarter of 2006,2007, which included 28,00035,000 tons of market-related downtime. During the 2007 secondfourth quarter, International Paper had takentook approximately 145,000110,000 tons of downtime, including 4,0007,000 tons for market-related downtime. Market-related downtime is taken to balance internal supply with our customer demand to help manage inventory levels, while maintenance downtime, which makes up the majority of the difference between total downtime and market-related downtime, is taken periodically during the year.
Discontinued Operations
2007:2008:
During the secondfirst quarter of 2008, the Company recorded a pre-tax charge of $25 million ($16 million after taxes) related to the final settlement of a post-closing adjustment of the purchase price received by the Company for the sale of its Beverage Packaging business.
2007:
During the first quarter of 2007, the Company recorded pre-tax chargescredits of $7$21 million ($9 million after taxes) and $6 million ($4 million after taxes) and $4 million ($3 million after taxes) relating to adjustments to estimated losses on the sales of its Wood Products and Kraft Papers businesses, respectively. In addition, a $15 million pre-tax charge ($39 million after taxes) was recorded for adjustments to the loss on the completion of the sale of most of the Beverage Packaging businesses, respectively.
2006:
During the third quarter of 2006, the Company recordedbusiness. Finally, a pre-tax credit of $101approximately $10 million ($806 million after taxes) was recorded for refunds received from the gain onCanadian government of duties paid by the saleCompany’s former Weldwood of the Brazilian coated papers business, pre-tax losses of $115 million and $165 million ($82 million and $165 million after taxes) to adjust the carrying values of the Beverage Packaging and Wood Products businesses, respectively, to estimated fair values, and a net $11 million pre-tax gain ($2 million after taxes) related to other smaller items.Canada Limited business.
Income Taxes
The income tax provision was $89$59 million for the 2007 third2008 first quarter. Excluding an $11a $16 million benefit relating to the tax effects of special items, the effective income tax rate for continuing operations was 29%31.5% for the quarter.
In the 2007 secondfourth quarter the income tax provision was also $89$94 million. Excluding a $2$40 million benefit relating to the tax effects of special items, the effective income tax rate for continuing operations was 29%31% for the quarter.
The income tax provision totaled $204$143 million in the 2006 third2007 first quarter. Excluding a $117$44 million expense related to the tax effects of special items, the effective income tax rate for continuing operations before special items for the 2006 third quarter was 28%32%.
Interest Expense and Corporate Items
Net interest expense for the 2007 third2008 first quarter was $77$81 million compared with $80$79 million for the 2007 secondfourth quarter and $144$61 million for the 2006 third2007 first quarter. The lowerhigher net expense compared with the prior year reflects lower average debt balances and interest rates due to debt repayments and refinancings.income from investment of available cash balances.
Corporate items, net, of $188$21 million in the 2007 third2008 first quarter were higherlower than both the 2007 second-quarterfourth-quarter and 2007 first-quarter net expenses of $179$56 million but were lower than the net expenses of $221and $37 million, in the third quarter of 2006. The $9 million increase in the 2007 third quarter compared with the second quarter reflects small increases in various expense categories. Compared with the third quarter of 2006, the benefits fromrespectively, due to lower pension expenses and benefit-related costs were partially offset by higher supply chain project costs.expenses.
Special Items
Restructuring and Other Charges
2007:2008:
During the thirdfirst quarter of 2007,2008, restructuring and other charges totaling $42 million before taxes ($26 million after taxes) were recorded. These charges consisted ofrecorded, including a pre-tax$40 million charge of $2 million before taxes ($125 million after taxes) for organizational restructuring programs associated with the Company’s Transformation Plan,legal reserves, a pre-tax$5 million charge of $27 millionbefore taxes ($17 million after taxes) of accelerated depreciation charges for the
Terre Haute mill, a pre-tax charge of $10 million ($6 million after taxes) for estimated environmental closure costs associated with the Terre Haute mill, and a pre-tax charge of $3 million ($23 million after taxes) related to the restructuringreorganization of the Company’s Brazil operations.Shorewood operations in Canada and a $3 million credit before taxes ($2 million after taxes) for adjustments to reserves associated with the Company’s organizational restructuring programs.
2007:
During the secondfirst quarter of 2007, restructuring and other charges totaling $26$18 million before taxes ($1611 million after taxes) were recorded for organizational restructuring programs associated with the Company’s Transformation Plan, including $17 million ($11 million after taxes) of accelerated depreciation expense for long-lived assets being removed from service.
2006:
During the third quarter of 2006, restructuring and other charges totaling $92 million before taxes ($56 million after taxes) were recorded. These charges consisted ofPlan. Additionally, a pre-tax charge of $57 million ($35 million after taxes), including severance and other termination benefit costs of approximately $15 million, $25 million of lease termination costs and $17 million of other charges associated with the Company’s Transformation Plan, and a $35$2 million pre-tax chargecredit ($21 million after taxes) for adjustments to legal reserves.
Gains on Forestland Sales
During the third quarter of 2007, a pre-tax gain of $9 million ($51 million after taxes) was recorded to reduce estimated transaction costs accrued in connection withInterest expense for interest received from the Transformation Plan forestland sales in 2006.
During the third quarterCanadian government on refunds of 2006, the Company completed the sales of approximately 476,000 acres of forestlands for approximately $401 million, including $265 million in cash and $136 million of installment notes, resulting in a pre-tax gain of $304 million ($185 million after taxes).prior-year softwood lumber duties.
Net Losses (Gains)Gains on Sales and Impairments of Businesses
2007:2008:
During the secondfirst quarter of 2007,2008, a $1 million pre-tax credit (a $7($1 million charge after taxes, including a $5 million tax adjustment in Brazil)taxes) was recorded to adjust previously estimated gains/losses of businesses previously sold.
2006:2007:
During the thirdfirst quarter of 2006,2007, a net$103 million pre-tax gain of $74 million ($4496 million after taxes) was recorded upon the sale of the Company’s Arizona Chemical business. As part of the transaction, International Paper acquired a minority interest of approximately 10% in the resulting new entity.
In addition, a $6 million pre-tax credit ($4 million after taxes) was recorded to adjust previously estimated gains/losses of businesses previously sold.
These gains are included, along with the $205 million pre-tax gain ($164 million after taxes) on the exchange for losses (gains)the Luiz Antonio mill in Brazil (see Note 4), in Net gains on sales and impairments of businesses including a $13 million pre-tax gain on a sale of property in Spain recorded in the Industrial Packaging business. This net gain also included the recognitionaccompanying consolidated statement of a previously deferred $110 million pre-tax gain ($68 million after taxes) related to a 2004 sale of forestlands in Maine, a pre-tax charge of $38 million ($23 million after taxes) to reflect the completion of the sale of the Company’s Coated and Supercalendered Papers business in the 2006 third quarter, and a net pre-tax gain of $2 million (a $1 million loss after taxes) related to other smaller sales.operations.
BUSINESS SEGMENT OPERATING RESULTS
The following presents business segment discussions for the thirdfirst quarter of 2007.2008.
Printing Papers
| 2007 | 2006 | 2008 | 2007 | ||||||||||||||||||||||||
In millions | 3rd Quarter | 2nd Quarter | Nine Months | 3rd Quarter | 2nd Quarter | Nine Months | 1st Quarter | 1st Quarter | 4th Quarter | ||||||||||||||||||
Sales | $ | 1,660 | $ | 1,610 | $ | 4,810 | $ | 1,610 | $ | 1,810 | $ | 5,225 | $ | 1,715 | $ | 1,540 | $ | 1,720 | |||||||||
Operating Profit | 307 | 249 | 787 | 251 | 217 | 573 | 185 | 167 | 243 | ||||||||||||||||||
Printing Papers net sales for the thirdfirst quarter of 20072008 were 3% higher than bothabout even with the secondfourth quarter of 2007 and 11% higher than the thirdfirst quarter of 2006.2007. Operating profits in the thirdfirst quarter of 2008 were 24% lower than the fourth quarter of 2007, were 23%but 11% higher than the secondfirst quarter of 2007 and 22% higher than the third quarter of 2006.2007.
North American Printing Papersnet sales were $870$885 million in the thirdfirst quarter of 20072008 compared with $875$865 million in the secondfourth quarter of 2007 and $910$885 million in the thirdfirst quarter of 2006 (excluding $140 million from the Coated and Supercalendered Papers business sold in 2006).2007. Operating earnings of $165$106 million were up slightly compared with $114$101 million in the secondfourth quarter of 2007 and slightly higher than $152$94 million (excluding $17 million from the Coated and Supercalendered Papers business) in the thirdfirst quarter of 2006.2007.
Sales volumes in the thirdfirst quarter of 20072008 were lower than inabout even with the secondfourth quarter of 2007 reflecting seasonally lower demand for cut-size paper, partially offset by stronger sales to the commercial printing market and higher export sales.2007. Average sales price realizations were higher reflecting benefits from announced first-quarter price increases for cut-size paper increased during the quarter reflecting the full realizationuncoated freesheet paper. Additionally, sales margins improved due to a smaller proportion of a $60/ton price increase announced in the second quarter.lower-margin export sales. Planned maintenance downtime costs in the first quarter were about $35 million lower ineven with the third quarter reflecting downtime at one mill in the third quarter versus maintenance outages at five mills in the secondfourth quarter. Other manufacturing costs were favorable largely due to lower energy consumption. Input costs were slightly unfavorable due to higher costs for starch and caustic soda, partially offset by lowerHowever, input costs for wood, energy and energy.chemicals were higher, and manufacturing operations reflected unfavorable operating disruptions at two of our mills.
InCompared with the thirdfirst quarter of 2006, net2007, sales and earnings included one month of the Coated and Supercalendered Papers business which was sold in the third quarter. Excluding the impact of this business, earnings in 2007 improved year over year. Sales volumes were lower in the thirdfirst quarter of 2007 compared with the third quarter of 20062008, primarily due to reduced productiona reduction of uncoated freesheet paper capacity resulting from the conversion of one of the paper machinemachines at the Pensacola mill to the production of lightweight linerboard for our Industrial Packaging segment. Sales volumes were also affected by softer market demand for uncoated freesheet paper.segment in the third quarter of 2007. Average sales price realizations were up significantly in the thirdfirst quarter of 20072008 reflecting the realization of price increases implemented during 2007 and announced price increases for cut-size paper and rolls in late 2006 andthe first quarter of 2008. Sales margins were positively impacted by a decrease in 2007.lower-margin export sales. Manufacturing costs improved with the conversion of the higher cost Pensacola machine and the beginning of the conversion of the Louisiana mill to pulp production. These benefits were favorable reflecting improved operating performance and lower maintenance spending. Raw materialpartially offset by significantly higher costs were higher for energy, caustic soda, starchwood and wood.chemicals, and the current quarter unfavorable manufacturing operating issues. Freight costs were lower as the result of the implementation of various supply chain initiatives.also unfavorable.
Looking ahead to the 2007 fourth2008 second quarter, earningssales volumes are expected to decline slightly from third-quarter levels. Sales volumes are typically seasonally lower.as a result of the capacity impact of the spring maintenance outages. Average sales price realizations are expected to improve with the full realization of price increases announced in the announced roll price increase for commercial printing and converting markets. Plannedfirst quarter. Higher planned maintenance expenses will be higher reflecting plannedincurred during the period with four mills taking downtime at our Franklin mill in October. Manufacturingduring the quarter, which should be largely offset by improved manufacturing operating costs. Input costs for energy and chemicals are expected to continue to increase, due to seasonally higher energy consumption. Woodbut wood costs are also expected to be higher reflecting the impact of wet weather conditions in certain areas of the United States.should decrease slightly.
European Printing Papersnet sales were $370 million in both the third and second quarters of 2007 compared with $310$435 million in the thirdfirst quarter of 2006.2008 compared with $415 million in the fourth quarter of 2007 and $355 million in the first quarter of 2007. Operating earnings in the thirdfirst quarter of 20072008 were $45$42 million compared with $55$53 million in the secondfourth quarter of 2007 and $28$40 million in the thirdfirst quarter of 2006.2007.
Sales volumes in the thirdfirst quarter of 2008 were higher than the fourth quarter of 2007 forreflecting increased sales from the new bleached chemical thermal mechanical pulp (BCTMP) production facility at Svetogorsk, Russia. Sales volumes of uncoated freesheet paper were essentially flat withseasonally affected by the second quarter of 2007.Russian new year holiday period, but this was more than offset by higher sales in western European markets. Average sales price realizations improved in the third quarter, principallyeastern Europe improved due to the implementation of a September price increase in Russia.Russia in February, but remained relatively flat in western Europe. Manufacturing costs were higherfavorable, reflecting expenses associated with annual outages at the Kwidzyn and Saillat mills.improved operating performance. Raw material costs for wood moderated slightly duringwere higher in Russia due to abnormally high demand in anticipation of an export tariff increase, and a seasonal increase in inventories to avoid potential supply disruptions due to weather. Energy costs were also significantly higher than in the thirdfourth quarter but energy and chemical costs increased.of 2007 across all regions.
Compared with the thirdfirst quarter of 2006,2007, sales volumes in the thirdfirst quarter of 2007 were slightly lower, although uncoated2008 improved largely due to the higher BCTMP sales. Uncoated freesheet paper volumes were in line with the 2006 third quarter.also higher. Average sales price realizations were significantly higher due to the realization of price increases implemented throughout 2007 across all regions, and in the latter part of 2006 and throughout 2007.February 2008 in Russia. Manufacturing costs were unfavorable largelyas operating performance in the first two months of the year was below the excellent performance in the first quarter of 2007. Input costs were significantly unfavorable reflecting higher wood, chemical and energy costs.
In the 2008 second quarter, sales volumes should be higher than in the first quarter due to the timing of the annual Saillat mill outage compared to 2006. Input costs werehigher BCTMP sales, and average sales price realizations should also unfavorable due to higher wood and chemical costs, partially offset by lower energy pricesimprove as price increases in Western Europe.
In the 2007 fourth quarter, earningswestern Europe are realized. Planned maintenance downtime expenses are expected to be significantly higher, than in the third quarter reflecting no scheduled planned maintenance outages during the quarter and seasonally higher sales volumes. Average sales price realizations are likelybut raw material costs should decline due to improve with a full-quarter benefit of previously announced price increaseslower wood costs in Russia and Western Europe. Higher wood costs and seasonally higher energy prices and consumption are expected.as demand returns to more normal levels.
Brazilian Printing Papersnet sales were $250$225 million in the thirdfirst quarter of 20072008 compared with $205$255 million in the secondfourth quarter of 2007 and $120$140 million in the thirdfirst quarter of 2006.2007. Operating earnings in the thirdfirst quarter of 20072008 were $72$33 million compared with $57$61 million in the secondfourth quarter of 2007 and $33$18 million in the thirdfirst quarter of 2006. Results in 2007 benefited from2007. Operating results reflect the acquisition of the Luiz Antonio mill completed in February 2007.
Sales volumes in the thirdfirst quarter of 2008 were lower than the fourth quarter of 2007 increased compared withdue to seasonal decreases in paper demand and the second quarter primarily for uncoated freesheet paper.impact of planned maintenance outages on pulp production capacity and shipments. Average sales price realizations were lower reflecting competitive pressure in Brazil for domestic cut-size paper and offset paper, but were higher for export shipments. Margins were negatively affected by an increased proportion of lower-margin export sales. Input costs were significantly higher, primarily for electricity where hydroelectric power costs peaked during the quarter due to the full-quarter impacta lack of a second-quarter price increase for domestic uncoated freesheet paper, as well as improved export pricing. Earningsrainfall in the third quarter also benefited from a $7 million gain on a bulk timber sale.late 2007.
Compared with the thirdfirst quarter of 2006, excluding the impact of2007, sales volumes were higher for both domestic cut-size paper and offset paper, including a full quarter contribution from sales for the Luiz Antonio acquisition, sales volumes were slightly higher.mill acquired in February 2007. Average sales price realizations improved, reflecting price increases for uncoated freesheet paper realized during 2007. Input costs, however, were negatively impacted by the second halfincreased cost of 2006 and the first half of 2007. Both manufacturing costs and input costs were unfavorable. Earnings contributions from the Luiz Antonio mill added $35 million to 2007 third-quarter earnings.electricity.
Looking ahead to the fourthsecond quarter, earnings are expected to decrease slightly from third-quarter levels reflecting the absence of the earnings from the third-quarter timber sale. Salessales volumes are expected toand margins should benefit from increasedseasonally higher domestic cut-size paper demand. AnAverage sales price realizations should increase in higher marginreflecting an announced price increase for domestic salescut-size paper. Input costs should have some positive impact on earnings. Operating costs are expected to be slightly higherlower as costs will be impacted by increased labor costs.the cost of electricity declines from first-quarter peak levels.
Asian Printing Papersnet sales were approximately $5 million for all periods presented. Operating earnings increased slightly in the 2007 third quarter, but were close to breakeven for all periods presented.
U.S. Market Pulpnet sales were $165 million in the thirdfirst quarter of 2008 compared with $180 million in the fourth quarter of 2007 compared withand $155 million in the secondfirst quarter of 2007. Operating earnings were $4 million in the first quarter of 2008 compared with $27 million in the fourth quarter of 2007 and $130$15 million in the thirdfirst quarter of 2006. Operating earnings were $25 million in the third quarter of 2007 compared with $24 million in the second quarter of 2007 and $21 million in the third quarter of 2006.2007.
Sales volumes in the thirdfirst quarter of 2008 were lower than in the fourth quarter of 2007, were up slightly compared with the second quarterdespite continued strong market demand, due to lower production resulting from planned maintenance outages, operational disruptions and export constraints caused by tight availability of 2007 as demand for marketshipping containers and fluff pulp remained strong.vessels. Average sales price realizations improved duringwith the quarter asfull-quarter benefit from sales price increases for paperimplemented in the fourth quarter of 2007, and tissuethe partial realization of a hardwood pulp and fluff pulpprice increase announced in Junethe 2008 first quarter. Manufacturing costs were realized.higher due to unfavorable operating performance at several mills. Planned maintenance downtime costs were about $5 million higher in the thirdfirst quarter than in the secondfourth quarter reflecting planned downtimea maintenance outage at our RiegelwoodGeorgetown mill.
Compared with the thirdfirst quarter of 2006,2007, sales volumes increased, principally due to the continuing strength in demand, particularly from Asia.were slightly lower. Average sales price realizations were significantly higher reflecting sales price increases for fluff pulp and softwood pulp in both Europe and North America. Plannedimplemented during 2007. While planned maintenance downtime costs were $6 million higher due to the third-quarter annual maintenance shutdown at the Riegelwood mill which occurred in the fourth quarter in 2006. Manufacturingabout flat, manufacturing operating costs were higherunfavorable in the current quarter reflecting effects associated withdue to the Riegelwood mill shutdown.production issues at several mills. Input costs increased for wood, energy and chemicals, as well as for freight.while freight costs also increased.
Entering the 2007 fourth2008 second quarter, earnings are expected to improve. Salessales volumes are expected to increase slightlyshould be higher as demand for pulp remains strong.strong, and with the shift in production from paper to pulp at the Louisiana mill. Average sales price realizations should
improve with the full-quarter realization of price increases implemented in the first quarter and the realization of price increases announced for the second quarter for both softwood and hardwood pulp in Europe. Planned mill maintenance downtime costs should be comparable withto the thirdfirst quarter. ThereManufacturing operations are no shutdowns planned for the fourth quarter. Wood costs arealso expected to be seasonally higher.improve.
Industrial Packaging
| 2007 | 2006 | 2008 | 2007 | ||||||||||||||||||||||||
In millions | 3rd Quarter | 2nd Quarter | Nine Months | 3rd Quarter | 2nd Quarter | Nine Months | 1st Quarter | 1st Quarter | 4th Quarter | ||||||||||||||||||
Sales | $ | 1,305 | $ | 1,315 | $ | 3,855 | $ | 1,250 | $ | 1,240 | $ | 3,665 | $ | 1,445 | $ | 1,235 | $ | 1,390 | |||||||||
Operating Profit | 115 | 139 | 357 | 152 | 86 | 267 | 97 | 73 | 109 | ||||||||||||||||||
Industrial Packaging net sales for the thirdfirst quarter of 20072008 were essentially even with4% higher than in the secondfourth quarter of 2007 and 4%17% higher than in the thirdfirst quarter of 2006.2007. Operating profits in the thirdfirst quarter of 20072008 were 17%11% lower than in the secondfourth quarter of 2007, and 24% lowerbut 33% higher than the thirdfirst quarter of 2006.2007.
North American Industrial Packagingnet sales were $975 million in both the third and second quarters of 2007 and $955 million$1.05 billion in the thirdfirst quarter of 2006. Operating earnings were $99 million2008 compared with $1.0 billion in the third quarter of 2007 compared with $109 million in the secondfourth quarter of 2007 and $128$925 million in the thirdfirst quarter of 2006.2007. Operating earnings were $79 million in the first quarter of 2008 compared with $90 million in the fourth quarter of 2007 and $57 million in the first quarter of 2007.
Containerboard shipments in the 2007 third2008 first quarter were essentially flat comparedahead of the fourth quarter of 2007 as demand remained strong. Average sales price realizations were higher due to a full-quarter benefit from sales price increases implemented in the 2007 fourth quarter and a price increase for saturated kraft board implemented in the 2008 first quarter. Planned maintenance downtime costs were about $16 million higher than in the fourth quarter reflecting outages at the Mansfield, Savannah and Vicksburg mills. Input costs continued to move higher, primarily for energy and chemicals.
Compared with the secondfirst quarter of 2007, containerboard markets were stronger. Sales volumes were higher, partially due to the increased capacity resulting from the conversion of the Pensacola mill to the production of lightweight linerboard in the third quarter of 2007. Average sales price realizations were slightlysignificantly higher with the partial realization of a $40/ton price increaseincreases implemented during the quarter. Planned maintenance2007. However, input costs were about $10significantly higher for wood, energy, chemicals, and recycled fiber, while freight costs also increased reflecting higher fuel costs. Costs associated with planned maintenance downtime were $24 million lower than in the second quarter reflecting fewer planned mill outages. Manufacturing performance was unfavorable compared with a very strong second quarter. Input costs were higher for wood, chemicals and recycled fiber. Expenses related to the conversion and start-up of the Pensacola mill linerboard machine were $10 million higher than in the second quarter. Linerboard production at the mill began late in the third quarter.
Compared with the thirdfirst quarter of 2006, domestic containerboard shipments were essentially the same, while export shipments were higher offsetting weaker shipments of boxes. Manufacturing performance improved with stronger operations, although2007 reflecting planned maintenance downtime was about $5 million higher due to the timing of mill outages. Input costs continued to be significantly higher than in the third quarter of 2006, principally for wood and recycled fiber. Costs associated with the conversion and start-up of the Pensacola mill of $25 million also affected 2007 third-quarter profits.outages at fewer mills.
U.S. Converting shipments in the thirdfirst quarter of 20072008 were slightlyseasonally lower than in the second quarter. Average boxfourth quarter of 2007. Efforts to recover previous containerboard cost increases through higher container prices resulted in higher average sales price realizations were about the same as in the second quarter although margins declined slightly due to reduced customer demand for higher margin products.and improved margins. Manufacturing costs were slightly unfavorable, andfavorable, but raw material and freight costs increased slightly.were significantly higher. Compared with the thirdfirst quarter of 2006,2007, shipments were slightly lower reflecting softer customeressentially flat as box demand for boxes.remained steady. Margins benefited from improved waste performancehigher average sales price realizations. Raw material and mix improvement initiatives. Input cost increasesfreight costs, however, were offset by improved waste fiber pricing.significantly higher.
Looking ahead to the fourth2008 second quarter, earnings for North American Industrial Packaging are expected to improve. Sales volumesoperating results will include higher costs for containerboard should increase, although box volumes should be seasonally lower. Average sales price realizations should be significantly higher with continued realization ofsignificant planned maintenance work scheduled for the previously announced containerboard price increase. Planned maintenance downtime expensessecond quarter. Containerboard shipments are expected to be higher. Distribution costs are also expected to belower reflecting decreased production associated with the maintenance downtime, but box sales volumes should increase with seasonally higher shipments, particularly in the agricultural segment. Price increases for both containerboard and boxes have been announced, while recycled fiberraw material costs are expected to remaincontinue to be high. Linerboard production at the Pensacola mill will contribute to operating results for the entire quarter.
European Industrial Packagingnet sales were $315 million for the first quarter of 2008 compared with $300 million for the fourth quarter of 2007 and $265 million for the thirdfirst quarter of 20072007. Operating earnings were $18 million in the first quarter of 2008 compared with $270$19 million forin the secondfourth quarter of 2007 and $250 million for the third quarter of 2006. Operating earnings were $15 million in the thirdfirst quarter of 2007 compared with $28 million in the second quarter of 2007 and $23 million in the third quarter of 2006.2007. The Company completed the purchase of the minority shares of its operations in Morocco during the 2007 third quarter. The 2006 results include contributions from the box plants in the United Kingdom and Ireland which were sold at the end of 2006.
Sales volumes in the thirdfirst quarter of 20072008 were lowerhigher than in the second2007 fourth quarter, reflecting a poorbenefiting from container sales for the tomato and citrus fruit and vegetable seasonseasons in France and Spain, although Italy benefited from a strong agricultural season and growth in industrial markets.Morocco. Sales margins increased slightly overwere essentially flat with the second quarter reflecting higher container prices in France, Spain and Italy. Conversion costs were slightly unfavorable.fourth quarter. Raw material costs were higher reflectingdue to increased energy costs. Second quarter earnings had benefited from a $6 million insurance recovery from a fire at a plant in Turkey.costs, while operating costs were slightly unfavorable.
Compared to the thirdfirst quarter of 2006,2007, sales volumes in the 2007 third2008 first quarter were updown slightly reflecting strong growtha weaker market for industrial products throughout Europe as well as weaker agricultural seasons in industrial markets in Italy, partially offset by weaker fruitSpain and vegetable box volumes in France and Spain.Italy. Sales margins were higher due to the realization of price increases implemented earlier in the current year. Earnings in the 2006 third quarter had included a $13 million pre-tax gain on a sale of property in Spain.and declining costs for kraft and recycled containerboard. These benefits were partially offset by higher energy and operating costs.
Entering the fourthsecond quarter, earnings are expected improve. Salessales volumes should be higher aswith the citrus season begins in Spain and Morocco. Operating results will also benefit from a full-quarter’s 100% ownershiponset of the Morocco operations. Marginssummer fruit and vegetable seasons in France and Spain. However, margins are expected to decline slightly due to some pressure on box prices following a changedecline in the geographic mix of sales. Costs for energyrecycled paper prices. Energy costs are expected to be seasonally higher.improve.
Asian Industrial Packagingnet sales were $65$80 million in the thirdfirst quarter of 20072008 compared with $70$85 million in the secondfourth quarter of 2007 and $45 million in the thirdfirst quarter of 2006.2007. Operating earnings were $1 millionclose to breakeven in the third quarter of 2007 compared with $2 million in the second quarter of 2007 and $1 million in the third quarter of 2006.all periods presented.
Consumer Packaging
| 2007 | 2006 | |||||||||||||||||
In millions | 3rd Quarter | 2nd Quarter | Nine Months | 3rd Quarter | 2nd Quarter | Nine Months | ||||||||||||
Sales | $ | 775 | $ | 790 | $ | 2,315 | $ | 705 | $ | 630 | $ | 1,950 | ||||||
Operating Profit | 49 | 48 | 158 | 62 | 36 | 145 | ||||||||||||
In millions Sales Operating Profit 2008 2007 1st Quarter 1st Quarter 4th Quarter $ 770 $ 715 $ 780 9 40 15
Consumer Packaging net sales for the thirdfirst quarter of 20072008 were 2%1% lower than in the secondfourth quarter of 2007, but 10%8% higher than in the thirdfirst quarter of 2006.2007. Operating profits in the thirdfirst quarter of 20072008 were 2% higher than in the second quarter of 2007, but 21%40% lower than in the thirdfourth quarter of 2006.2007 and 78% lower than in the first quarter of 2007.
North American Consumer Packagingnet sales were $600 million in the first quarter of 2008 compared with $620 million in the third quarter of 2007 compared with $640 million in the secondfourth quarter of 2007 and $645$570 million in the thirdfirst quarter of 2006.2007. Operating earnings were $39a loss of $3 million in the thirdfirst quarter of 20072008 compared with $37gains of $4 million in the secondfourth quarter of 2007 and $52$25 million in the thirdfirst quarter of 2006.2007.
Coated paperboard sales volumes were slightly higher in the thirdfirst quarter of 2008 were up slightly compared with the fourth quarter of 2007 compared with the second quarter of 2007 reflecting increases in folding carton board and tobacco board shipments, partially offset by decreases in cupstock shipments.as demand remained solid. Average sales prices improved with the realization of price increases for cup stock, folding carton board and coated bristols. Planned maintenance downtime costs were about $5$14 million lower than in the secondfourth quarter. Manufacturing operating costs were favorableunfavorable reflecting improved mill operations, particularlyoperational issues at the Augusta mill.and Riegelwood mills. Input costs were higher, particularly for wood. energy.
Compared with the thirdfirst quarter of 2006,2007, sales volumes were up slightly.higher, primarily due to strong demand for cup stock and bristols. Average sales prices were significantly higher with the realization of sales price increases implemented during the latter part of 2006 as well as increases announced in the first half of 2007. PlannedHowever, input costs were also significantly higher, particularly for energy and polyethylene, while planned maintenance downtime expenses were slightly higher. Freight costs were favorable, but input costs were higher, particularly for wood.
Shorewood sales volumes in the thirdfirst quarter of 2008 decreased from the fourth quarter of 2007 increased from the second quarter due to higher demandreflecting a seasonal decline in the home entertainment segment partially offset by reducedand slightly softer demand in the tobacco and consumer products segments. RawOverall, raw material costs were up slightly due toabout flat despite an increase in bleached board cost increases, and freight costs were higher reflecting increased shipping volumes. Thirdduring the quarter. First quarter results also included $4$5 million of additional costsexpenses related to the closuresreorganization of Shorewood’s Canadian operations. Compared with the Edison, N.J. and the Waterbury, CT plants. Salesfirst quarter of 2007, sales volumes in the thirdfirst quarter of 20072008 were lower than in the third quarter of 2006 due to softer demand in the tobacco, consumer products and display segments, partially
offset by improvement in the home entertainment segments. Average sales price realizationssegment. Sales margins were slightly higher, but these benefits werelower reflecting declines in both the home entertainment and consumer products segments, partially offset by a declinean increase in sales margins reflecting a less profitable mix. Raw material costs were slightly higher due to cost increases for bleached board.the display segment.
Foodservice sales volumes in the thirdfirst quarter of 20072008 were seasonallyup slightly lower than infrom the 2007 second quarter.fourth quarter of 2007. Average sales price realizations were about flat.improved reflecting price increases in January 2008. Converting operating costs were unfavorable reflecting lowerfavorable with improved efficiencies from higher production levels. Raw material costs were higher due to increases in coated board and resin costs. Compared with the thirdfirst quarter of 2006,2007, sales volumes in the 2007 third2008 first quarter increased slightly. HigherSales margins improved with the benefits of higher average sales prices andpartially offset by a moreless favorable mix of products sold. Results also benefited from higher margin hot cupsproduction levels and food containers resulted in improved margins.operational efficiencies. Raw material costs were unfavorable due to higher board and polystyreneresin costs.
Looking ahead to the fourthsecond quarter, coated paperboard earningssales volumes are expected to decline, due principally to significantly higher planned maintenance expenses and moderately higher input costs. Sales volumes should reflect seasonal declines, although averageremain at about first-quarter levels as markets remain solid. Average sales price realizations should continue to improve with further realization of a folding carton board price increase implemented in the first quarter and the announced second-quarter price increases announcedfor cup stock and coated bristols. Manufacturing operations are expected to improve, although planned maintenance costs will be higher with major outages at the Texarkana and Augusta mills. Despite some expected improvements in the third quarter.sales volumes and costs, Shorewood’s operating results should improve slightly in the fourth quarter. Foodservice earnings are expected to continue strong, but showing a slight seasonal decline.be slightly lower in the second quarter due to additional expenses related to the reorganization of the Canadian operations. Foodservice operating results should benefit from seasonally higher sales volumes and operating efficiency cost improvements.
European Consumer Packagingnet sales were $75 million in the first quarter of 2008 compared with $75 million in the fourth quarter of 2007 and $70 million in the thirdfirst quarter of 2007 compared with $652007. Operating earnings were $9 million in the secondfirst quarter of 2007 and $60 million in the third quarter of 2006. Operating earnings were $5 million in the third quarter of 20072008 compared with $7 million in the secondfourth quarter of 2007 and $10$14 million in the thirdfirst quarter of 2006.2007.
Sales volumes in the thirdfirst quarter of 2008 were about even with the fourth quarter of 2007, while average sales price realizations improved. Manufacturing costs were higher thanfavorable, reflecting strong operating performance. Compared with the secondfirst quarter of 2007, reflecting higher sales from the Svetogorsk mill following a maintenance outage in the second quarter. Sales volumes from the Kwidzyn mill were not impacted by an annual outage in the third quarter due to available inventory, but a seasonal improvement in domestic demand was balanced by a reduction in export sales. Average sales price
realizations improved in the third quarter due to a better geographic mix of sales. Manufacturing costs were higher as annual maintenance costs for the third quarter outage at the Kwidzyn mill were higher than for the Svetogorsk mill outage in the 2007 second quarter. Compared with the third quarter of 2006, sales volumes in the 2007 thirdfirst quarter of 2008 were lower with a decline in export market sales versus 2007. Average sales price realizations improved, due in part to increasedthe decline in sales to the lower-margin export market, share followingbut also due to higher prices realized in European domestic markets. Operating results in the capacity expansion at2008 second quarter will reflect costs associated with the Kwidzynannual planned maintenance shutdown of the Svetogorsk mill. Average price realizations were higher. In the fourth quarter, earnings are expected to improve reflecting a seasonal increase in demand and no scheduled annual maintenance outages.
Asian Consumer Packagingnet sales were $95 million in the first quarter of 2008 compared with $85 million in both the thirdfourth quarter of 2007 and $75 million in the secondfirst quarter of 2007. International Paper acquired a 50% ownership interest in International Paper & Sun Cartonboard Ltd. during the fourth quarter of 2006. Operating earnings in the thirdfirst quarter of 20072008 were $5$3 million compared with $4 million in the secondfourth quarter of 2007 and $1 million in the first quarter of 2007.
Distribution
| 2007 | 2006 | 2008 | 2007 | ||||||||||||||||||||||||
In millions | 3rd Quarter | 2nd Quarter | Nine Months | 3rd Quarter | 2nd Quarter | Nine Months | 1st Quarter | 1st Quarter | 4th Quarter | ||||||||||||||||||
Sales | $ | 1,880 | $ | 1,720 | $ | 5,275 | $ | 1,730 | $ | 1,690 | $ | 5,070 | $ | 1,985 | $ | 1,675 | $ | 2,045 | |||||||||
Operating Profit | 40 | 38 | 107 | 34 | 36 | 97 | 16 | 20 | 28 | ||||||||||||||||||
Distribution’s2007 third2008 first quarter sales were 9% higher3% lower than in the secondfourth quarter of 2007, while operating profits increased 5%decreased 43%. Compared to the 2006 third2007 first quarter, sales rose 9%19%, while operating profits increased 18%decreased 20%.
Sales
First quarter 2008 sales of printing papers and graphic arts supplies and equipment totaled $1.2$1.3 billion compared with $1.3 billion in the fourth quarter of 2007 and $1.1 billion in the 2007 first quarter. Sales to the publishing market in the first quarter were about the same as in the fourth quarter of 2007. However, compared with the first quarter of 2007, increased sales to the book publishing and catalog markets resulted in a significant increase in mill direct sales. Stock sales were about even with 2007 fourth quarter levels, and were up from the first quarter of 2007 due to price and volume gains and acquisition of Central Lewmar in the third quarter of 2007. Compared to the fourth quarter of 2007, including $100 million from Central Lewmar acquired on August 24, 2007, compared with $1.1 billion in both the 2007 second quarter and the 2006 third quarter. Tradetrade margins for printing productspapers were unchanged, but they decreased infrom the thirdfirst quarter of 2007 compared with the second quarter of 2007 reflecting changesdue to an increase in lower-margin mill direct sales.
Packaging sales mix, and were substantially unchanged from the third quarter of 2006.
Revenues from packaging products totaled $390$400 million in the thirdfirst quarter of 2007 compared with $380 million in2008, about the second quartersame as the fourth and first quarters of 2007 and $382 million in the third quarter of 2006, principally due to increased unit volumes.2007. Trade margins for packaging products decreased inwere lower than the thirdfourth quarter of 2007, reflecting a change in product and service mix, but were about even with the first quarter of 2007.
Sales of facility supply products were $300 million in the first quarter of 2008 compared with $300 million and $200 million in the secondfourth and first quarters of 2007, respectively. Trade margins for facility supplies increased in the first quarter of 2008 compared to both the fourth quarter and first quarter of 2007 due to a more favorable product mix.
Operating profits totaled $16 million in the first quarter of 2008 compared with $28 million in the fourth quarter of 2007 and the third quarter of 2006, reflecting changes in product mix.
Facility supplies revenues totaled $269$20 million in the thirdfirst quarter of 2007. Compared with the fourth quarter of 2007, operating profits declined due to lower sales volumes and higher bad debt expenses, partially offset by lower operating costs. Profits declined slightly compared with $258 millionthe 2007 first quarter reflecting slightly higher allocated corporate overhead costs, higher bad debt expenses and start-up expenses for operations in Canada. Looking ahead to the 2008 second quarter, of 2007 and $248 million in the third quarter of 2006 reflecting increased sales volumes. Trade margins in the third quarter of 2007 were substantially unchanged from the second quarter of 2007, and decreased from the third quarter of 2006 as a result of changes in sales mix.
Operating profits were $40 million in the third quarter of 2007 compared with $38 million in the second quarter of 2007 and $34 million in the third quarter of 2006. The increase in operating profits in the third quarter of 2007 was principally due to the revenue increases. Second quarter 2007 operating results also included a $2 million gain related to a sale of real estate. Higher revenues were the primary cause for the higher operating profit versus the 2006 third quarter.
Looking ahead, operating results in the 2007 fourth quarter are expected to be strong, comparable to third-quarter levels.benefit from improved sales volumes and higher margins.
Forest Products
| 2007 | 2006 | |||||||||||||||||||||||
In millions | 3rd Quarter | 2nd Quarter | Nine Months | 3rd Quarter | 2nd Quarter | Nine Months | ||||||||||||||||||
Sales | $ | 120 | $ | 90 | $ | 295 | $ | 135 | $ | 205 | $ | 575 | ||||||||||||
Operating Profit: | ||||||||||||||||||||||||
Forest Resources- | ||||||||||||||||||||||||
Sales of Forestlands | $ | 99 | $ | 91 | $ | 281 | $ | 125 | $ | 101 | $ | 329 | ||||||||||||
Harvest & Recreational | ||||||||||||||||||||||||
Income | 3 | 5 | 19 | 63 | 61 | 196 | ||||||||||||||||||
Forestland Expenses | (6 | ) | (4 | ) | (14 | ) | (27 | ) | (31 | ) | (88 | ) | ||||||||||||
Real Estate Operations | 3 | 6 | 11 | 5 | 29 | 79 | ||||||||||||||||||
| �� | ||||||||||||||||||||||||
Operating Profit | $ | 99 | $ | 98 | $ | 297 | $ | 166 | $ | 160 | $ | 516 | ||||||||||||
| 2008 | 2007 | ||||||||
In millions | 1st Quarter | 1st Quarter | 4th Quarter | ||||||
Sales | $ | 25 | $ | 85 | $ | 190 | |||
Operating Profit | 25 | 97 | 171 | ||||||
Forest Products net sales in the thirdfirst quarter of 20072008 were 33% higher than in the second quarter of 2007, but 11%87% lower than in the thirdfourth quarter of 2006.2007 and 71% lower than in the first quarter of 2007. Operating earnings in the thirdfirst quarter of 20072008 were 1% higher than in the second quarter of 2007, but 40%85% lower than in the thirdfourth quarter of 2006. This reduction reflects the impact of the 5.6 million acres of forestland sold in 2006 as part of the Company’s Transformation Plan, primarily2007, and 74% lower than in the fourthfirst quarter that significantly reduced the Company’s forestland acreage.of 2007.
Forest Productsearnings from forestland sales in the thirdfirst quarter of 2008 were $135 million lower than in the fourth quarter of 2007 were $8 million higher than indue to the second quartertiming of 2007.the completion of forestland sale transactions. Harvest, recreational and recreationalminerals income declined $2increased $5 million versus the secondfourth quarter. Profits from sales of real estate properties decreased by $3$21 million. Forestland operating expenses were $2$5 million higherlower in the current quarter. Compared with the 2006 third2007 first quarter, earnings from forestland sales declined $26$69 million. Harvest, recreational and recreationalminerals income decreased $60 million reflecting the impact of the 2006 Transformation Plan forestland sales.$1 million. Forestland operating expenses were $21 million lower thaneven with the first quarter of 2007, while profits from sales of real estate properties decreased $2 million. Operating results in the third2008 second quarter of 2006 due to the reduced level of business operations. In the 2007 fourth quarter, earnings are expected to improve withbenefit from a plannedprojected increase in forestland sales. However, the timing and amountmix of theseforestland sales can change due to various factors, with a corresponding impact on actual operating profits.factors.
SpecialtyOther Businesses and Other
| 2007 | 2006 | 2008 | 2007 | ||||||||||||||||||||||||
In millions | 3rd Quarter | 2nd Quarter | Nine Months | 3rd Quarter | 2nd Quarter | Nine Months | 1st Quarter | 1st Quarter | 4th Quarter | ||||||||||||||||||
Sales | $ | — | $ | — | $ | 135 | $ | 245 | $ | 235 | $ | 705 | $ | — | $ | 135 | $ | — | |||||||||
Operating Profit | — | — | 6 | 21 | 17 | 51 | — | 6 | — | ||||||||||||||||||
The Specialty Businesses and Other
This segment principally includes the operating results of Arizona Chemical, as well as certain smaller businesses. The Arizona Chemical business was sold in February 2007; and thus operating results in 2007 reflect only two months of activity.
Equity Earnings, Net of Taxes – Ilim Holding S.A.
On October 5, 2007, International Paper and Ilim Holding S.A. (“Ilim”) announced the completion of a 50:50 joint venture to operate in Russia. Due to the complex organizational structure of Ilim’s operations, and the extended time required for Ilim to prepare consolidated financial information in accordance with accounting principles generally accepted in the United States, the Company is reporting its share of Ilim’s operating results on a one-quarter lag basis. Accordingly, the accompanying consolidated statement of operations for the three months ended March 31, 2008 includes the Company’s 50% share of Ilim’s operating results for the three-month period ended December 31, 2007 under the caption “Equity earnings, net of taxes.” Ilim will be reported as a separate reportable industry segment.
The Company recorded equity earnings, net of taxes, of $17 million in the first quarter of 2008. These results reflected strong market demand and strong pricing for both pulp and containerboard export shipments. Average sales price realizations for Russian domestic pulp, containerboard and wall paper all increased during the fourth quarter of 2007. Manufacturing operations were near capacity, with some impacts from a wood supply shortage in November at the Kotlas mill.
International Paper’s share of after-tax equity earnings also reflected a $4 million foreign exchange gain on the remeasurement of U.S. dollar-denominated debt into Russian rubles and a one-time $6 million charge reflecting the write-up of finished goods and work-in-process inventory to fair value as of the acquisition date.
In the second quarter of 2008, market conditions are expected to continue to be strong, allowing operations to run at full production capacity. Sales prices to export markets should continue to be strong; however, input costs, including wood, are also expected to remain high.
LIQUIDITY AND CAPITAL RESOURCES
Cash provided by continuing operations totaled $1.4 billion$434 million for the first ninethree months of 2007, down2008, up from $1.5 billion$296 million for the comparable 2006 nine-month2007 three-month period, reflecting an increase in cash used forimproved working capital items.management. Earnings adjusted for non-cash charges were $1.8 billion$418 million for both the 2007 and 2006 nine-month periods.first three months of 2008 compared to $578 million for the first three months of 2007. Cash used forprovided by working capital components totaled $409$16 million for the first ninethree months of 2007,2008, up from $311a use of $282 million for the comparable 2006 nine-month2007 three-month period. However, in the 2007 third quarter, cash used for working capital components decreased by $168 million compared with the six months ended June 30, 2007.
Cash proceeds from divestitures totaled approximately $1.7 billion$14 million for the first ninethree months of 2007,2008, relating to the sales of the Kraft Papers, Beverage Packaging,certain remaining Wood Products and Arizona Chemical businesses. Approximately $2.2 billion of cash had been generated from divestitures infacilities during the first nine months of 2006. The Company used $227 million of cash in the first nine months of 2007 for the acquisition of Central Lewmar LLC and the purchase of the remaining interests in Compagnie Marocaine des Cartons et des Papiers (CMCP) in Morocco.quarter. Investments in capital projects totaled $804$215 million in the 2008 first nine months of
2007, slightly above $764quarter compared with $178 million in the 2007 first nine months of 2006.quarter. The increase in the 2008 first quarter reflects spending for a new uncoated paperboard machine at our joint venture in China and spending associated with the new uncoated paper machine in Brazil. Full-year 20072008 capital spending is currently expected to be approximately $1.3$1.1 billion, or about $200 million above estimatedequal to depreciation and amortization expense.
Financing activities for the first ninethree months of 20072008 included a $513$57 million net reductionincrease in debt versus a $1.9 billion$362 million decrease during the comparable 2006 nine-month2007 three-month period. Activity for the second quarter of 2007 included the repurchase of $35 million of 5.85% notes with an original maturity in October 2012. First quarter 2007 activity included the repayment by International Paper Investments (Luxembourg) S.ar.l, a wholly-owned subsidiary of International Paper, of $143 million of long-term debt with an interest rate of LIBOR plus 40 basis points and a maturity date in November 2010. Other debt activity in the first quarter included the repayment of $198 million of 7.625% notes that matured within the quarter.
In August 2006, International Paper used approximately $320 million of cash to repay its maturing 5.375% euro-denominated notes that were designated as a hedge of euro functional currency net investments. Other debt activity in the 2006 third quarter included the repayment of $143 million of 7.875% notes and $96 million of 7% debentures, all maturing within the quarter.
In June 2006, International Paper had paid approximately $1.2 billion to repurchase substantially all of its zero-coupon convertible debentures at a price equal to their accreted principal value plus interest, using proceeds from divestitures and $730 million of third party commercial paper issued under the Company’s receivables securitization program. At December 31, 2006, International Paper had repaid all of the commercial paper borrowed under this program. First quarter 2006 activity had included the repurchase of $195 million 6.4% debentures with an original maturity date of February 2026, and early payment of approximately $495 million of notes with coupon rates ranging from 4% to 8.875% and original maturities from 2007 to 2029.
At September 30, 2007March 31, 2008 and December 31, 2006,2007, International Paper classified $112$108 million and $100$112 million, respectively, of Notes payablecommercial paper and current maturities of long-term debtbank notes as Long-term debt. International Paper has the intent and ability, as evidenced by its fully committed credit facility, to renew or convert these obligations.
Also duringDuring the first ninethree months of 2007, the Company purchased 30.6 million shares of its common stock through open market purchases for approximately $1.1 billion, and2008, International Paper issued approximately 5.02.5 million shares of treasury stock for various incentive plans, including stock option exercises that generated approximately $122$1 million of cash and restricted stock that did not generate cash. Payments of restricted stock tax withholding totaled $47 million. During the first ninethree months of 2006, approximately 2.82007, the Company purchased 11.2 million shares of its common stock had beenthrough open market purchases for approximately $398 million, and issued approximately 2.7 million shares of treasury stock for various incentive plans, including stock option exercises that generated $26approximately $30 million of cash and restricted stock that did not generate cash. Common stock dividend payments totaled $330$112 million and $372$114 million for the first ninethree months of 20072008 and 2006,2007, respectively. Quarterly dividends were $.25 per share in both years.
Maintaining an investment-grade credit rating is an important element of International Paper’s financing strategy. At September 30, 2007,March 31, 2008, the Company held long-term credit ratings of BBB (stable outlook) and Baa3 (stable outlook) by Standard & Poor’s (S&P) and Moody’s Investor Services (Moody’s), respectively. In the first quarter of 2008, in conjunction with the announcement of International Paper’s intent to purchase Weyerhaeuser Company’s packaging business for $6 billion, S&P revised the outlook on the Company’s long-term credit rating from stable to credit watch with negative implications and Moody’s revised the outlook from stable to negative. The Company currently has short-term credit ratings by S&P and Moody’s of A-2A-3 and P-3, respectively. During the first quarter of 2008, S&P downgraded the Company’s short-term credit rating from A-2 to A-3 while the Company’s short-term ratings by Moody’s were affirmed.
International Paper expects to be able to meet projected capital expenditures, service existing debt and meet working capital and dividend requirements through 2008 using existing cash balances plus cash from operations, supplemented as required by its existing credit facilities.
At September 30, 2007,March 31, 2008, International Paper has approximately $2.5 billion of committed liquidity, including a $1.5 billion contractually committed bank credit agreement that expires in March 2011 and a receivables securitization program that expires in October 2009. There were no outstanding borrowings under the fully committed bank credit agreement or the receivables securitization program at September 30, 2007.
Additionally, International Paper Investments (Luxembourg) S.ar.l and International Paper (Europe) S.A., both wholly-owned subsidiaries of International Paper, jointly have a $100 million bank credit agreement maturing in December 2007, with no borrowings outstanding as of September 30, 2007.March 31, 2008.
The Company will continue to rely upon debt and capital markets for the majority of any necessary funding not provided by existing cash balances, operating cash flow or divestiture proceeds. The Company expects to finance the $6 billion purchase price for Weyerhaeuser Company’s containerboard, packaging and recycling business (expected to close in the third quarter of 2008) with debt financing. Funding decisions will be guided by our capital structure planning and liabilitydebt management practices. The primary goals of the Company’s capital structure planning are to maximize financial flexibility and preserve liquidity while reducing interest expense. The majority of International Paper’s debt is accessed through global public capital markets where we have a wide base of investors.
TRANSFORMATION PLAN
During the first quarter of 2007, the Company completed the sales of its North American Beverage Packaging operations, its Kraft Papers business, its Arizona Chemical business, and most of its Wood Products business. This substantially completed divestitures under the Company’s Transformation Plan. As reported in the first quarter, these proceeds have been used to: (1) reduce long-term debt and fund a voluntary contribution to the Company’s U.S. qualified pension plan, (2) return value to shareholders through the purchase of its common stock, and (3) for identified selective reinvestments. During the 2007 second quarter, the Company purchased an additional 17.9 million shares of its common stock for approximately $675 million. During the 2007 third quarter, the Company purchased an additional 1.5 million shares of its common stock for approximately $50 million, and additional share repurchases may be made in the 2007 fourth quarter. Additionally, the Company is continuing to make progress on improving its key platform businesses. For the first nine months of 2007, excluding Forest Products, operating profits as a percent of sales improved by 190 basis points. Given declining demand for paper and packaging in North America during 2007, we managed our capacity to meet our customers’ demand, and achieved improved profit margins through higher prices and non-price improvements. Going forward, the Company intends to continue to focus on all factors affecting margin expansion, including price.
CRITICAL ACCOUNTING POLICIES
The preparation of financial statements in conformity with accounting principles generally accepted in the United States requires International Paper to establish accounting policies and to make estimates that affect both the amounts and timing of the recording of assets, liabilities, revenues and expenses. Some of these estimates require judgments about matters that are inherently uncertain.
Accounting policies whose application may have a significant effect on the reported results of operations and financial position of International Paper, and that can require judgments by management that affect their application, include SFAS No. 5, “Accounting for Contingencies,” SFAS No. 144, “Accounting for the Impairment or Disposal of Long-Lived Assets,” SFAS No. 142, “Goodwill and Other Intangible Assets,” SFAS No. 87, “Employers’ Accounting for Pensions,” SFAS No. 106, “Employers’ Accounting for Postretirement Benefits Other Than Pensions,” as amended by SFAS No. 132 and 132(R), “Employers’
Disclosures About Pension and Other Postretirement Benefits,” SFAS No. 158, “Employers’ Accounting for Defined Benefit Pension and Other Postretirement Plans,” and SFAS No. 109, “Accounting for Income Taxes,” including recent accounting requirements under FASB Interpretation No. 48 (FIN 48), “Accounting for Uncertainty in Income Taxes.”
The Company has included in its Annual Report on Form 10-K for the year ended December 31, 2006,2007, a discussion of these critical accounting policies, which are important to the portrayal of the Company’s financial condition and results of operations and require management’s judgments. Other than the adoption of FIN 48, theThe Company has not made any changes in any of these critical accounting policies during the first ninethree months of 2007.2008.
SIGNIFICANT ACCOUNTING ESTIMATES
Pension Accounting. Net pension expense totaled approximately $158$28 million for International Paper’s U.S. plans for the ninethree months ended September 30, 2007,March 31, 2008, or about $125$24 million less than the pension expense recorded for the first ninethree months of 2006.2007. Net pension expense for non-U.S. plans was about $3$2 million and $13$1 million for the first ninethree months of 20072008 and 2006,2007, respectively. The decrease in U.S. plan pension expense was principally due to earnings on a $1 billion contribution made to the plan in the fourth quarter of 2006, lower amortization of unrecognized actuarial losses, an increase in the assumed discount rate to 6.20% in 2008 from 5.75% in 2007 from 5.50% in 2006, and a decrease in active plan participants due to divestitures. The decrease in non-U.S. expense is related to the saleslower amortization of Arizona Chemical and Beverage Packaging.unrecognized actuarial losses.
After consultation with our actuaries, International Paper determines key actuarial assumptions on December 31 of each year that are used to calculate liability information as of that date and pension expense for the following year. Key assumptions affecting pension expense include the discount rate, the expected long-term rate of return on plan assets, the expected rate of future salary increases, and various demographic assumptions including expected mortality. The discount rate assumption is determined based on a yield curve that incorporates approximately 500-550 Aa-graded bonds. The plan’s projected cash flows are then matched to the yield curve to develop the discount rate. The expected long-term rate of return on plan assets is based on projected rates of return for current and planned asset classes in the plan’s investment portfolio. At September 30, 2007,March 31, 2008, the market value of plan assets for International Paper’s U.S. plans totaled approximately $8.6$8.0 billion, consisting of approximately 60%55% equity securities, 31%34% fixed income securities, and 9%11% real estate and other assets.
For its U.S. qualified defined benefit pension plan, International Paper makes contributions that are sufficient to fully fund its actuarially determined costs, generally equal to the minimum amounts required by the Employee Retirement Income Security Act (ERISA). International Paper made voluntaryno contributions of $1.0 billion to the qualified defined benefit plan in 20062007 and does not expect to make any contributions in 2007.2008. The U.S. nonqualified plans are only funded to the extent of benefits paid which are expected to be $37$27 million in 2007.2008.
Accounting for Share-Based Compensation Plans. The Company discontinued its stock option program in 2004 for members of executive management, and in 2005 for all other eligible U.S. and non-U.S. employees. In the United States, the stock option program was replaced with a performance-based restricted share program for approximately 1,250 employees to more closely tie long-term compensation to Company performance on two key performance drivers: return on investment (ROI) and total shareholder return (TSR). As part of this shift in focus away from stock options to performance-base restricted stock, the Company accelerated the vesting of all 14 million unvested stock options to July 12, 2005.
The Company adopted SFAS No. 123(R), “Share-Based Payment,” effective January 1, 2006 using the modified prospective transition method. This standard requires that compensation cost related to share-based payments be recognized in the financial statements. The amount of compensation cost is measured based on the grant date fair value of the award. The resulting cost is recognized over the period during which an employee is required to provide service in exchange for the award, usually the vesting period. The adoption of SFAS No. 123(R) resulted in a $1 million increase in stock-based compensation expense for the three months ended March 31, 2006, with no effect on prior periods. Prior to January 1, 2006, the Company had accounted for share-based compensation in accordance with APB Opinion No. 25, “Accounting for Stock Issued to Employees.”
Accounting for Uncertainty in Income Taxes.
The Company adopted the provisions of FIN 48 on January 1, 2007. This interpretation requires management to make judgments regarding the probability that certain income tax positions taken by the Company in filing tax returns in the various jurisdictions in which it operates will be sustained upon examination by the respective tax authorities based on the technical merits of these tax positions, and to make estimates of the amount of tax benefits that will be realized upon the settlement of these positions. The adoption of this interpretation resulted in a charge to the 2007 beginning balance of retained earnings of $94 million.
FORWARD-LOOKING STATEMENTS
Certain statements in this Quarterly Report on Form 10-Q, and in particular, statements found in Item 2, Management’s Discussion and Analysis of Financial Condition and Results of Operations, which are not historical in nature may constitute forward-looking statements. These statements are often identified by the words, “will,” “may,” “should,” “continue,” “anticipate,” “believe,” “expect,” “plan,” “appear,” “project,” “estimate,” “intend,” and words of similar import. Such statements reflect the current views of International Paper with respect to future events and are subject to risks and uncertainties that could cause actual results to differ materially from those expressed or implied in these statements. Item 1A. Risk Factors containedthat could cause actual results to differ include, among other things, the following: changes in the Company’s Annual Report on Form 10-Kcost or availability of raw materials and energy; changes in transportation availability or costs; the effects of competition from foreign and domestic producers; changes in our product mix; delays in implementing previously announced price increases; the strength of demand for our product and changes in overall demand; changes in credit ratings issued by nationally recognized statistical rating organizations; the year ended December 31, 2006 (as updated by subsequent Quarterly Reports on Form 10-Q) containsavailability of credit; pension and health care costs; changes related to international economic conditions; changes in currency exchange rates, particularly the relative value of the U.S. dollar to the euro; unanticipated expenditures relating to the cost of compliance with environmental and other governmental regulations; results of legal proceedings; whether we experience a specific listmaterial disruption at one of risksour manufacturing facilities; whether expected non-price improvements can be realized; increases in interest rates; our substantial indebtedness and uncertainties that you should carefully read and consider.our ability to meet our debt service obligations. We undertake no obligation to publicly update any forward-looking statements, whether as a result of new information, future events or otherwise.
ITEM 3.QUANTITATIVE AND QUALITATIVE DISCLOSURES ABOUT MARKET RISK
| ITEM 3. | QUANTITATIVE AND QUALITATIVE DISCLOSURES ABOUT MARKET RISK |
Information relating to quantitative and qualitative disclosures about market risk is shown on page 42 of International Paper’s Annual Report on Form 10-K for the year ended December 31, 2006,2007, which information is incorporated herein by reference. There have not been any material changes in the Company’s exposure to market risk since December 31, 2006.2007.
ITEM 4.CONTROLS AND PROCEDURES
| ITEM 4. | CONTROLS AND PROCEDURES |
Evaluation of Disclosure Controls and Procedures:
Disclosure controls and procedures are controls and procedures that are designed to ensure that information required to be disclosed in our reports filed or submitted under the Securities Exchange Act of 1934, as amended (Exchange Act), is recorded, processed, summarized and completely and accurately reported (and accumulated and communicated to management, including our Chief Executive Officer and Chief Financial Officer, to allow timely decisions regarding required disclosure) within the time periods specified in the Securities and Exchange Commission’s rules and forms. As of the end of the period covered by this report, we conducted an evaluation, under the supervision and with the participation of our management, including the Chief Executive Officer and Chief Financial Officer, of the effectiveness of the design and operation of our disclosure controls and procedures pursuant to Rules 13a-15(e) and 15d-15(e) of the Exchange Act. Based upon that evaluation, our Chief Executive Officer and Chief Financial Officer concluded that the Company’s disclosure controls and procedures were effective.
Changes in Internal Controls over Financial Reporting:
There werehave been no changes in our internal controlscontrol over financial reporting or other factorsduring the quarter ended March 31, 2008 that have materially affected, or are reasonably likely to materially affect, theseour internal controlscontrol over financial reporting during the period covered by this report.reporting.
During the 2007 first quarter, the Company completed the non-cash exchange of assets for the Luiz Antonio mill in Brazil. Integration activities, including anThe integration of financial business systems is continuing. We are in the process of conducting our annual assessment of internal controls over financial reporting are currently in process and are expected to be completed in early 2008.
over the course of our normal 2008 assessment cycle. During the 2007 third quarter, the Company completed the acquisition of Central Lewmar LLC. Integration activities, including anThe integration of financial processes and business systems is continuing. We are in the process of conducting our annual assessment of internal controls over financial reporting are currently in processover the course of our normal 2008 assessment cycle. These two operations contributed approximately 3% of net sales for the year ended December 31, 2007, and are expected to be completed in early 2008.approximately 4% of total assets as of December 31, 2007.
The Company does havehas ongoing initiatives to standardize and upgrade certain of its financial, operating and supply chain systems. The system upgrades will be implemented in stages, by business, over the next several years. Management believes the necessary procedures are in place to maintain effective internal controls over financial reporting as these initiatives continue.
| ITEM 1. | LEGAL PROCEEDINGS |
A discussion of material developments in the Company’s litigation and settlement matters occurring in the period covered by this report is found in Note 9 to the Financial Statements in this Form 10-Q.
The Company’s Annual Report on Form 10-K for the year ended December 31, 2006 (Annual Report) contains important risk factors that could cause the Company’s actual results to differ materially from those projected in any forward-looking statement. Since the Company has substantially completed the divestitures under its Transformation Plan, the Company no longer faces the risks described in the Annual Report under the heading “The Ability to Successfully Execute Sales Transactions Currently Under Contract.” Second, the risk factor “Risks Relating to Industry Conditions – Demand for our Products” has been amended and restated in its entirety as follows:
Demand For Our Products. Demand for our products is affected by general economic conditions globally. Changes in industrial non-durable goods production, consumer spending, commercial printing and advertising activity, white-collar employment levels, interest rates, the availability of credit (particularly as it may affect our land sales) and currency exchange rates may adversely affect our businesses and our financial results.
There are no other significant changes to the risk factors described in the Annual Report.
ITEM 2.UNREGISTERED SALES OF EQUITY SECURITIES AND USE OF PROCEEDS
| ITEM 2. | UNREGISTERED SALES OF EQUITY SECURITIES AND USE OF PROCEEDS |
| (c) | Purchases of Equity Securities by the Issuer and Affiliated Purchasers. |
Period | Total Number of Shares Purchased (a) | Average Price Paid per Share | Total Number of Shares Purchased as Part of Publicly Announced Plans or Programs | Maximum Number (or Approximate Dollar Value) of Shares that May Yet Be Purchased Under the Plans or Programs | |||||
July 1, 2007 - July 31, 2007 | 15,384 | $ | 38.72 | — | — | ||||
August 1, 2007 - August 31, 2007 | 1,476,200 | $ | 33.98 | — | — | ||||
September 1, 2007 - September 30, 2007 | 6,000 | $ | 33.96 | — | — | ||||
Total | 1,497,584 | — | — | — | |||||
Period | Total Number of Shares Purchased (a) | Average Price Paid per Share | Total Number of Shares Purchased as Part of Publicly Announced Plans or Programs | Maximum Number (or Approximate Dollar Value) of Shares that May Yet Be Purchased Under the Plans or Programs | |||||
January 1, 2008 - January 31, 2008 | 838 | $ | 31.02 | — | — | ||||
February 1, 2008 - February 29, 2008 | 1,458,246 | 31.85 | — | — | |||||
Total | 1,459,084 | — | — | — | |||||
| (a) |
No activity occurred in months not presented above.
| ITEM 5. | OTHER INFORMATION |
On March 13, 2008, the Company entered into a series of agreements to make immaterial modifications to its securitization facility, including removing International Paper Financial Services, Inc. from the structure. The changes were reflected in the following agreements:
Fourth Amendment to the Amended and Restated Credit and Security Agreement, by and among Red Bird Receivables, LLC (formerly known as Red Bird Receivables, Inc.), as Borrower, International Paper Financial Services, Inc., as withdrawing Servicer, and the Company, as successor Servicer, filed as Exhibit 10.3 to this Quarterly Report on Form 10-Q
Second Amended and Restated Credit and Security Agreement by and among Red Bird Receivables, LLC, as Borrower and the Company, as Servicer, filed as Exhibit 10.4 to this Quarterly Report on Form 10-Q
Receivables Sale and Contribution Agreement between the Company and Red Bird Receivables, LLC, filed as Exhibit 10.5 to this Quarterly Report on Form 10-Q
Two termination agreements to terminate the Receivables Sale Agreement dated as of December 26, 2001 and the Receivables Sale and Contribution Agreement dated as of December 31, 2001.
| ITEM 6. | EXHIBITS |
| (a) | Exhibits |
| 10.1 | ||
| 10.2 | ||
| 10.3 | Fourth Amendment, dated as of March 13, 2008, to the Amended and Restated Credit and Security Agreement, by and among Red Bird Receivables, LLC (formerly known as Red Bird Receivables, Inc.), as Borrower, International Paper Financial Services, Inc., as withdrawing Servicer, International Paper Company, | |
| 10.4 | Second Amended and Restated Credit and Security Agreement, dated as of March 13, 2008, among Red Bird Receivables, LLC, as Borrower, International Paper Company, as Servicer, the Conduits and Liquidity Banks from time to time a party thereto, The Bank of Tokyo-Mitsubishi, Ltd., New York Branch, as Gotham Agent, JPMorgan Chase Bank, N.A., as PARCO Agent, BNP Paribas, acting through its New York Branch, as Starbird Agent, Citicorp North America, Inc., as CAFCO Agent and as Administrative Agent. Certain confidential portions have been omitted and filed separately with the Securities and Exchange Commission pursuant to a request for confidential treatment. | |
| 10.5 | Receivables Sale and Contribution Agreement, dated as of March 13, 2008, between International Paper Company and Red Bird Receivables, LLC. | |
| 10.6 | 2008 Management Incentive Plan, amended and restated as of January 1, 2008. | |
| 10.7 | Amendment, effective April 1, 2008, to the International Paper Company Long-Term Incentive Compensation plan, as amended and restated February 7, 2005. | |
| 11 | Statement of Computation of Per Share Earnings | |
| 12 | Computation of Ratio of Earnings to Fixed Charges and Preferred Stock Dividends | |
| 31.1 | Certification of principal executive officer pursuant to Section 302 of the Sarbanes-Oxley Act of 2002 | |
| 31.2 | Certification of principal financial officer pursuant to Section 302 of the Sarbanes-Oxley Act of 2002 | |
| 32 | Certification pursuant to 18 U.S.C. Section 1350, as adopted pursuant to Section 906 of the Sarbanes-Oxley Act of 2002 | |
Pursuant to the requirements of the Securities Exchange Act of 1934, the registrant has duly caused this report to be signed on its behalf by the undersigned thereunto duly authorized.
INTERNATIONAL PAPER COMPANY | ||||||||
(Registrant) | ||||||||
| Date: | By | /s/ | ||||||
Senior Vice President and Chief Financial Officer | ||||||||
| Date: | By | /s/ ROBERT J. GRILLET | ||||||
| Robert J. Grillet | ||||||||
| Vice President – Finance and Controller | ||||||||
4841