Table of Contents
UNITED STATES SECURITIES AND EXCHANGE COMMISSION
Washington, D.C. 20549
FORM 10-Q
| | | | |
x | | QUARTERLY REPORT PURSUANT TO SECTION 13 OR 15(d) | |
| OF THE SECURITIES EXCHANGE ACT OF 1934 | |
| For the quarterly period ended June 30, 20122013 | | |
OR
| | | | |
¨
| OR | |
| | |
o | TRANSITION REPORT PURSUANT TO SECTION 13 OR 15(d) | |
| OF THE SECURITIES EXCHANGE ACT OF 1934 | |
| For the transition period fromtofrom_____to_____ | | |
| | | | |
Commission | | Registrant; State of Incorporation; | | IRS Employer |
File Number | | Address; and Telephone Number | | Identification No. |
1-9513 | | CMS ENERGY CORPORATION | | 38-2726431 |
(A Michigan Corporation)
One Energy Plaza, Jackson, Michigan 49201
(517) 788-0550
| | | | 38-2726431 |
| | (A Michigan Corporation) | | |
| | One Energy Plaza, Jackson, Michigan 49201 | | |
| | (517) 788-0550 | | |
| | | | |
1-5611 | | CONSUMERS ENERGY COMPANY | | 38-0442310 |
| | (A Michigan Corporation) | | |
| | One Energy Plaza, Jackson, Michigan 49201 | | |
| | (517) 788-0550 | | |
Indicate by check mark whether the Registrant (1) has filed all reports required to be filed by Section 13 or 15(d) of the Securities Exchange Act of 1934 during the preceding 12 months (or for such shorter period that the Registrant was required to file such reports), and (2) has been subject to such filing requirements for the past 90 days.
CMS Energy Corporation: YesxT No¨o Consumers Energy Company: YesxT No¨o
Indicate by check mark whether the Registrant has submitted electronically and posted on its corporate Web site, if any, every Interactive Data file required to be submitted and posted pursuant to Rule 405 of Regulation S-T (§232.405 of this chapter) during the preceding 12 months (or for such shorter period that the Registrant was required to submit and post such files).
CMS Energy Corporation: YesxT No¨o Consumers Energy Company: YesxT No¨o
Indicate by check mark whether the Registrant is a large accelerated filer, an accelerated filer, a non-accelerated filer, or a smaller reporting company. See the definitions of “large accelerated filer,” “accelerated filer” and “smaller reporting company” in Rule 12b-2 of the Exchange Act.
CMS Energy Corporation:
Large accelerated filerxT Accelerated filer¨o Non-Accelerated filer¨o Smaller reporting company¨o
(Do not check if a smaller reporting company)
Consumers Energy Company:
Large accelerated filer¨o Accelerated filer¨o Non-Accelerated filerxT Smaller reporting company¨o
(Do not check if a smaller reporting company)
Indicate by check mark whether the Registrant is a shell company (as defined in Rule 12b-2 of the Exchange Act).
CMS Energy Corporation: Yes¨o NoxTConsumers Energy Company: Yes¨o NoxT
Indicate the number of shares outstanding of each of the issuer’s classes of common stock at July 13, 2012:5, 2013:
CMS Energy Corporation:
| | |
CMS Energy Common Stock, $0.01 par value | | |
(including 1,296,406(including 1,091,320 shares owned by Consumers Energy Company) | | 264,986,880266,959,461 |
Consumers Energy Company:
| | |
Consumers Energy Common Stock, $10 par value, privately held by CMS Energy Corporation | | 84,108,789 |
Table of Contents
CMS Energy Corporation
Consumers Energy Company
Quarterly Reports on Form 10-Q to the Securities and Exchange Commission for the Period Ended
June 30, 20122013
TABLE OF CONTENTS
1
Table of Contents
GLOSSARYGLOSSARY
Certain terms used in the text and financial statements are defined below.
| | |
2008 Energy Law | | Comprehensive energy reform package enacted in Michigan in October 2008 |
| |
2011
| | |
2012 Form 10-K | | Each of CMS Energy’s and Consumers’ Annual Report on Form 10-K for the year ended December 31, 20112012 |
| | |
ABATE | | Association of Businesses Advocating Tariff Equity |
| |
ASU
| | Financial Accounting Standards Board Accounting Standards Update |
| |
Bay Harbor | | A residential/commercial real estate area located near Petoskey, Michigan, in which CMS Energy sold its interest in 2002 |
| | |
bcf | | Billion cubic feet of gas |
| | |
Big Rock | | Big Rock Point nuclear power plant, formerly owned by Consumers |
| | |
CAIR | | The Clean Air Interstate Rule |
| | |
Cantera Gas Company | | Cantera Gas Company LLC, a non-affiliated company, formerly known as CMS Field Services |
| | |
Cantera Natural Gas, Inc. | | Cantera Natural Gas, Inc., a non-affiliated company that purchased CMS Field Services |
| |
CCB
| | |
CCR | | Coal combustion by-productresidual |
| | |
CEO | | Chief Executive Officer |
| | |
CFO | | Chief Financial Officer |
| |
CKD
| | Cement kiln dust |
| |
Clean Air Act | | Federal Clean Air Act of 1963, as amended |
| | |
Clean Water Act | | Federal Water Pollution Control Act of 1972, as amended |
| | |
CMS Capital | | CMS Capital, L.L.C., a wholly owned subsidiary of CMS Energy |
| | |
CMS Energy | | CMS Energy Corporation, the parent of Consumers and CMS Enterprises |
| | |
CMS Enterprises | | CMS Enterprises Company, a wholly owned subsidiary of CMS Energy |
| | |
CMS ERM | | CMS Energy Resource Management Company, formerly CMS MST, a wholly owned subsidiary of CMS Enterprises |
| | |
| | |
CMS Field Services | | CMS Field Services, Inc., a former wholly owned subsidiary of CMS Gas Transmission |
| |
3
Table of Contents
CMS Gas Transmission | | CMS Gas Transmission Company, a wholly owned subsidiary of CMS Enterprises |
| | |
CMS Land | | CMS Land Company, a wholly owned subsidiary of CMS Capital |
| | |
CMS MST | | CMS Marketing, Services and Trading Company, a wholly owned subsidiary of CMS Enterprises, whose name was changed to CMS ERM effective Januaryin 2004 |
| | |
Consumers | | Consumers Energy Company, a wholly owned subsidiary of CMS Energy |
| | |
CSAPR | | The Cross-State Air Pollution Rule which would supersede the EPA’s proposed Clean Air Transport Rule and replace CAIR, was finalized in July 2011 and was stayed in December 2011 pending judicial review |
| | |
Customer Choice Act | | Customer Choice and Electricity Reliability Act, a Michigan statute |
| |
D.C.
| | District of Columbia |
| |
Detroit EdisonDB SERP
| | The Detroit Edison Company, a non-affiliated companyDefined Benefit Supplemental Executive Retirement Plan |
| | |
Dodd-Frank Act | | Dodd-Frank Wall Street Reform and Consumer Protection Act enacted inof 2010 |
| | |
DOE | | U.S. Department of Energy |
| | |
DOJ | | U.S. Department of Justice |
| | |
DTE Electric | | DTE Electric Company, a non-affiliated company |
| | |
EBITDA | | Earnings before interest, taxes, depreciation, and amortization |
| | |
EGWP | | Employer Group Waiver Plan |
| | |
EnerBank | | EnerBank USA, a wholly owned subsidiary of CMS Capital |
| | |
Entergy | | Entergy Corporation, a non-affiliated company |
| | |
Environmental Mitigation Projects | | Environmentally beneficial projects that a party agrees to undertake as part of the settlement of an enforcement action, but which the party is not otherwise legally required to perform |
| | |
EPA | | U.S. Environmental Protection Agency |
| | |
EPS | | Earnings per share |
| | |
Exchange Act | | Securities Exchange Act of 1934, as amended |
| | |
FDIC | | Federal Deposit Insurance Corporation |
| | |
FERC | | The Federal Energy Regulatory Commission |
| | |
fine particulate matter | | Particulate matter that is 2.5 microns or less in diameter |
4
Table of Contents
FLI Liquidating Trust | | Trust formed in Missouri bankruptcy court to accomplish the liquidation of Farmland Industries, Inc., a non-affiliated entity |
| | |
| | |
FMB | | First mortgage bond |
| | |
FOV | | Finding of Violation |
| | |
FTR | | Financial transmission right |
| | |
GAAP | | U.S. Generally Accepted Accounting Principles |
| | |
GCR | | Gas cost recovery |
| | |
Health Care Acts | | Comprehensive health care reform enacted in March 2010, comprising the Patient Protection and Affordable Care Act and the related Health Care and Education Reconciliation Act |
| | |
ISFSI | | Independent spent fuel storage installation |
| | |
kWh | | Kilowatt-hour, a unit of energy equal to one thousand watt-hours |
| |
LIBOR
| | The London Interbank Offered Rate |
| |
Ludington | | Ludington pumped-storage plant, jointly owned by Consumers and Detroit EdisonDTE Electric |
| | |
MACT | | Maximum Achievable Control Technology, which is the emission control that is achieved in practice by the best-controlled similar source; for existing sources, MACT is the average emission limitation achieved by the best performing 12 percent of existing sources or the average limitation achieved by the best performing five sources, depending on the number of sources in the categorysource |
| | |
MATS | | Mercury and Air ToxicToxics Standards, which limit mercury, acid gases, and other toxic pollution from coal-fueled and oil-fueled power plants |
| |
MCIT
| | Michigan Corporate Income Tax |
| |
MD&A | | Management’s Discussion and Analysis of Financial Condition and Results of Operations |
| | |
MDEQ | | Michigan Department of Environmental Quality |
| | |
MDL | | A pending multi-district litigation case in Nevada |
| | |
MGP | | Manufactured gas plant |
| | |
Michigan Business Corporation Act | | Michigan Business Corporation Act of 1972, as amended |
| | |
Michigan Mercury Rule | | Michigan Air Pollution Control Rules, Part 15, Emission Limitations and Prohibitions – Mercury, addressing mercury emissions from coal-fueled electric generating units |
| | |
Midwest Energy Market | | An energy market developed by MISO to provide day-ahead and real-time market information and centralized dispatch for market participants |
| | |
MISO | | The MidwestMidcontinent Independent Transmission System Operator, Inc. |
5
Table of Contents
| | |
| |
mothball | | To place a generating unit into a state of extended reserve shutdown in which the unit is inactive and unavailable for service for a specified period, during which the unit can be brought back into service after receiving appropriate notification and completing any necessary maintenance or other work; generation owners in MISO must request approval to mothball a unit, and MISO then evaluates the request for reliability impacts |
| | |
MPSC | | Michigan Public Service Commission |
| | |
MW | | Megawatt, a unit of power equal to one million watts |
| |
MWh
| | Megawatt-hour, a unit of energy equal to one million watt-hours |
NAV | | Net asset value |
| | |
NERC | | The North American Electric Reliability Corporation, a non-affiliated company responsible for developing and enforcing reliability standards, monitoring the bulk power system, and educating and certifying industry personnel |
| | |
NOV | | Notice of Violation |
| | |
NPDES | | National Pollutant Discharge Elimination System, a permit system for regulating point sources of pollution under the Clean Water Act |
| | |
NREPA | | Part 201 of Michigan Natural Resources and Environmental Protection Act, a statute that covers environmental activities including remediation |
| | |
NSR | | New Source Review, a construction-permitting program under the Clean Air Act |
| | |
NYMEX | | The New York Mercantile Exchange |
| | |
OPEB | | Postretirement benefit plans other than pensionsOther Post-Employment Benefits |
| | |
OPEB Plan | | Defined benefit postretirement health-care and life insurance plans of CMS Energy, Consumers, and Panhandle |
| | |
Palisades | | Palisades nuclear power plant, sold by Consumers to Entergy in 2007 |
| | |
Panhandle | | Panhandle Eastern Pipe Line Company, including its wholly owned subsidiaries Trunkline Gas Company, LLC, Pan Gas Storage Company, Panhandle Storage Company, and Panhandle Holding Company, a former wholly owned subsidiary of CMS Gas Transmission |
| | |
PCB | | Polychlorinated biphenyl |
| | |
Pension Plan | | Trusteed, non-contributory, defined benefit pension plan of CMS Energy, Consumers, and Panhandle |
| | |
PSCR | | Power supply cost recovery |
| | |
PSD | | Prevention of Significant Deterioration |
| | |
REC | | Renewable energy credit established under the 2008 Energy Law |
6
Table of Contents
ReliabilityFirst Corporation | | ReliabilityFirst Corporation, a non-affiliated company responsible for the preservation and enhancement of bulk power system reliability and security |
| | |
Renewable Operating Permit | | Michigan’s Title V permitting program under the Clean Air Act |
| | |
RMRR | | Routine maintenance, repair, and replacement |
| | |
| | |
ROA | | Retail Open Access, which allows electric generation customers to choose alternative electric suppliers pursuant to the Customer Choice Act |
| | |
SEC | | U.S. Securities and Exchange Commission |
| |
SERP
| | Supplemental Executive Retirement Plan |
| |
Sherman Act | | Sherman Antitrust Act enacted inof 1890 |
| | |
Smart GridEnergy | | Consumers’ Smart Energy grid modernization project, which includes the installation of smart meters that transmit and receive data, a two-way communications network, and modifications to Consumers’ existing information technology system to manage the data and enable changes to key business processes |
| | |
Superfund | | Comprehensive Environmental Response, Compensation, and Liability Act |
| of 1980 |
Supplemental Environmental Projects
| | Environmentally beneficial projects that a party agrees to undertake as part of the settlement of an enforcement action, but which the party is not otherwise legally required to perform |
| |
Title V | | A federal program under the Clean Air Act designed to standardize air quality permits and the permitting process for major sources of emissions across the U.S. |
| |
Trust Preferred Securities
| | Securities representing an undivided beneficial interest in the assets of statutory business trusts, the interests of which have a preference with respect to certain trust distributions over the interests of either CMS Energy or Consumers, as applicable, as owner of the common beneficial interests of the trusts |
| |
U.S.Trunkline
| | United States |
| |
XBRL
| | eXtensible Business Reporting LanguageTrunkline Gas Company, LLC, a non-affiliated company and wholly owned subsidiary of Panhandle |
7
Table of Contents
FILING FORMAT
This combined Form 10-Q is separately filed by CMS Energy and Consumers. Information in this combined Form 10-Q relating to each individual registrant is filed by such registrant on its own behalf. Consumers makes no representation regarding information relating to any other companies affiliated with CMS Energy other than its own subsidiaries. None of CMS Energy, CMS Enterprises, nor any of CMS Energy’s other subsidiaries (other than Consumers) has any obligation in respect of Consumers’ debt securities and holders of such debt securities should not consider the financial resources or results of operations of CMS Energy, CMS Enterprises, nor any of CMS Energy’s other subsidiaries (other than Consumers and its own subsidiaries (in relevant circumstances)) in making a decision with respect to Consumers’ debt securities. Similarly, none of Consumers nor any other subsidiary of CMS Energy has any obligation in respect of debt securities of CMS Energy.
This report should be read in its entirety. No one section of this report deals with all aspects of the subject matter of this report. This report should be read in conjunction with the consolidated financial statements and related notes and with MD&A included in the 20112012 Form 10-K.
FORWARD-LOOKING STATEMENTS AND INFORMATION
This Form 10-Q and other written and oral statements that CMS Energy and Consumers make may contain forward-looking statements as defined by the Private Securities Litigation Reform Act of 1995. The use of “might,” “may,” “could,” “should,” “anticipates,” “believes,” “estimates,” “expects,” “intends,” “plans,” “projects,” “forecasts,” “predicts,” “assumes,” and other similar words is intended to identify forward-looking statements that involve risk and uncertainty. This discussion of potential risks and uncertainties is designed to highlight important factors that may impact CMS Energy’s and Consumers’ businesses and financial outlook. CMS Energy and Consumers have no obligation to update or revise forward-looking statements regardless of whether new information, future events, or any other factors affect the information contained in the statements. These forward-looking statements are subject to various factors that could cause CMS Energy’s and Consumers’ actual results to differ materially from the results anticipated in these statements. These factors include, but are not limited to, the following, all of which are potentially significant:
·the impact of regulation by the MPSC or FERC and other applicable governmental proceedings and regulations, including any associated impact on electric or gas rates or rate structures;
·potentially adverse regulatory treatment or failure to receive timely regulatory orders affecting Consumers that are or could come before the MPSC, FERC, MISO, or other governmental authorities, including the treatment of Consumers’ pilot gas revenue decoupling mechanism;authorities;
·the adoption of federal or state laws or regulations or changes in applicable laws, rules, regulations, principles, or practices, or in their interpretation, including those related to energy policy and ROA, the environment, regulation or deregulation, health care reforms (including the Health Care Acts), taxes, accounting matters, and other business issues that could have an impact on CMS Energy’s or Consumers’ businesses or financial results, including laws or regulations regarding climate change and air emissions and potential effects of the Dodd-Frank Act and related regulations on CMS Energy, Consumers, or any of their affiliates;
·potentially adverse regulatory or legal interpretations or decisions regarding environmental matters, or delayed regulatory treatment or permitting decisions that are or could come before the MDEQ, EPA, and/or EPA,U.S. Army Corps of Engineers, and potential environmental remediation costs associated with these interpretations or decisions, including those that may affect Bay Harbor or Consumers’ RMRR classification under NSR regulations;
8
Table of Contents
·changes in energy markets, including availability and price of electric capacity and the timing and extent of changes in commodity prices and availability of coal, natural gas, natural gas liquids, electricity, oil, and certain related products;
·the price of CMS Energy common stock, the credit ratings of CMS Energy and Consumers, capital and financial market conditions, and the effect of these market conditions on CMS Energy’s and Consumers’ interest costs and access to the capital markets, including availability of financing to CMS Energy, Consumers, or any of their affiliates;
·the investment performance of the assets of CMS Energy’s and Consumers’ pension and benefit plans and the discount rates applicable to their planused in calculating the plans’ obligations, and the resulting impact on future funding requirements;
·the impact of the economy, particularly in Michigan, and potential future volatility in the financial and credit markets on CMS Energy’s, Consumers’, or any of their affiliates’ revenues, ability to collect accounts receivable from customers, or cost and availability of capital;
·changes in the economic and financial viability of CMS Energy’s and Consumers’ suppliers, customers, and other counterparties and the continued ability of these third parties, including third parties in bankruptcy, to meet their obligations to CMS Energy and Consumers;
·population changes in the geographic areas where CMS Energy and Consumers conduct business;
·national, regional, and local economic, competitive, and regulatory policies, conditions, and developments;developments, including municipal bankruptcy filings such as the recent filing by the City of Detroit;
·loss of customer demand for electric generation supply to alternative energy suppliers;
·federal regulation of electric sales and transmission of electricity, including periodic re-examination by federal regulators of CMS Energy’s and Consumers’ market-based sales authorizations in wholesale power markets without price restrictions;
·the impact of credit markets, economic conditions, and any new banking regulations on EnerBank;
·the availability, cost, coverage, and terms of insurance, the stability of insurance providers, and the ability of Consumers to recover the costs of any insurance from customers;
·the effectiveness of CMS Energy’s and Consumers’ risk management policies, procedures, and strategies, including their strategies to hedge risk related to future prices of electricity, natural gas, and other energy-related commodities;
·factors affecting development of electric generation projects and distribution infrastructure replacement and expansion projects, including those related to project site identification, construction material pricing, availability of qualified construction personnel, permitting, and government approvals;
·factors affecting operations, such as costs and availability of personnel, equipment, and materials, unusual weather conditions, catastrophic weather-related damage, scheduled or unscheduled equipment outages, maintenance or repairs, environmental incidents, and electric transmission and distribution or gas pipeline system constraints;
9
Table of Contents
·potential disruption to, interruption of, or other impacts on facilities, utility infrastructure, or operations due to accidents, explosions, physical disasters, war, or terrorism, and the ability to obtain or maintain insurance coverage for these events;
·changes or disruption in fuel supply, including but not limited to rail or vessel transport of coal and pipeline transport of natural gas;
·potential costs, lost revenues, or other consequences resulting from misappropriation of assets or sensitive information, corruption of data, or operational disruption in connection with a cyber attack or other cyber incident;
·technological developments in energy production, storage, delivery, usage, and storage;metering, including Smart Energy and the success of its implementation;
·the impact of CMS Energy’s and Consumers’ integrated business software system and its operation on their activities, including utility customer billing and collections;
·adverse consequences resulting from any past or future assertion of indemnity or warranty claims associated with assets and businesses previously owned by CMS Energy or Consumers, including claims resulting from attempts by foreign or domestic governments to assess taxes on past operations or transactions;
·the outcome, cost, and other effects of legal or administrative proceedings, settlements, investigations, or claims;
·restrictions imposed by various financing arrangements and regulatory requirements on the ability of Consumers and other subsidiaries of CMS Energy to transfer funds to CMS Energy in the form of cash dividends, loans, or advances;
·earnings volatility resulting from the application of fair value accounting to certain energy commodity contracts such as electricity sales agreements andor interest rate and foreign currency contracts;
·changes in financial or regulatory accounting principles or policies, including a possible future requirement to comply with International Financial Reporting Standards, which differ from GAAP in various ways, including the present lack of special accounting treatment for regulated activities; and
·other matters that may be disclosed from time to time in CMS Energy’s and Consumers’ SEC filings, or in other publicly issued documents.
All forward-looking statements should be considered in the context of the risk and other factors described above and as detailed from time to time in CMS Energy’s and Consumers’ SEC filings. For additional details regarding these and other uncertainties, see Part I – Item 1. Consolidated Financial Statements (Unaudited) – Notes to the Unaudited Consolidated Financial Statements – Note 3:1, Regulatory Matters and Note 2, Contingencies and Commitments and Note 4: Regulatory Matters;Commitments; Part I – Item 2. MD&A – Outlook; and Part II – Item 1A. Risk Factors.
10
Table of Contents
CMS Energy Corporation
Consumers Energy Company
MANAGEMENT’S DISCUSSION AND ANALYSIS
OF FINANCIAL CONDITION AND RESULTS OF OPERATIONS
This MD&A is a combined report of CMS Energy and Consumers.
EXECUTIVE OVERVIEW
CMS Energy is an energy company operating primarily in Michigan. It is the parent holding company of several subsidiaries, including Consumers, an electric and gas utility, and CMS Enterprises, primarily a domestic independent power producer. Consumers’ electric utility operations include the generation, purchase, distribution, and sale of electricity, and Consumers’ gas utility operations include the purchase, transmission, storage, distribution, and sale of natural gas. Consumers’ customer base consists of a mix of residential, commercial, and diversified industrial customers. CMS Enterprises, through its subsidiaries and equity investments, owns and operates power generation facilities.
CMS Energy and Consumers manage their businesses by the nature of services each provides. CMS Energy operates principally in three business segments: electric utility; gas utility; and enterprises, its non-utility investments and operations. Consumers operates principally in two business segments: electric utility and gas utility.
CMS Energy and Consumers earn revenue and generate cash from operations by providing electric and natural gas utility services; electric distribution and generation; gas transmission, storage, and distribution; and other energy-related services. Their businesses are affected primarily by:
·regulation and regulatory matters;
·energy commodity prices;
·CMS Energy’s and Consumers’ securities’ credit ratings.
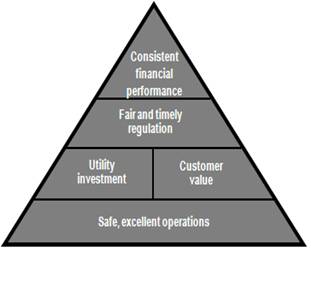
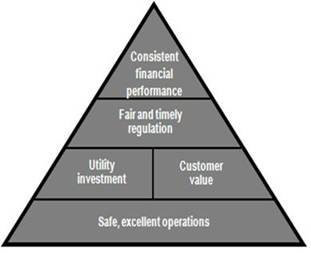
CMS Energy’s business strategy has emphasizedemphasizes the key elements depicted below:
11
Table of Contents
SAFE,, EXCELLENTOPERATIONS
The safety of employees, customers, and the general public remains a priority of CMS Energy and Consumers. Accordingly, CMS Energy and Consumers have worked to integrate a set of safety principles into their business operations and culture. These principles include complying with applicable safety, health, and security regulations and implementing programs and processes aimed at continually improving safety and security conditions. From 20072006 to 2011,2012, Consumers achieved a 7376 percent reduction in the annual number of recordable safety incidents.
CCUSTOMERVALUE
Consumers is undertaking a number of initiatives that reflect its intensified customer focus. Consumers’ planned investments in reliability are aimed at improving safety, reducing customer outage frequency, reducing repetitive outages, and increasing customer satisfaction. Also, in order to minimize increases in customer rates, Consumers considers thesehas undertaken several initiatives to reduce costs through a voluntary separation plan in 2012, accelerated pension funding, employee and other aspectsretiree health-care cost sharing, negotiated labor agreements, information system efficiencies, and productivity improvement programs. These initiatives, together with Consumers’ plans to accelerate further cost reductions, should allow Consumers to avoid increasing electric and gas base rates through 2014. Consumers’ ability to avoid base rate increases is dependent on MPSC approval of its customer value initiativecertain applications yet to be important tofiled. Consumers may also reconsider this expectation should its success.assumptions change regarding the economy or other matters.
UUTILITYINVESTMENT
Consumers expects to make capital investments of $6.6about $7 billion from 20122013 through 2016.2017. Consumers has limited its capital investment program to those investments it believes are needed to provide safe, reliable, and efficient service to its customers. Consumers’ capital investment program is expected to result in annual rate base growth of five to seven percent while allowing Consumers to maintain sustainable customer base rate increases (excluding PSCR and GCR charges) at or below the rate of inflation.
Among the key components of Consumers’ investment program are projects that will enhance customer value. Consumers’ planned distributionbase capital investments of $1.7$3.2 billion comprise $1.0$2.1 billion of electric utility projects to improve reliability and increase capacity and $0.7$1.1 billion of gas utility projects to increase capacity and deliverability and enhance pipeline integrity. Consumers also expects to spend $1.5 billion on environmental investments needed to comply with state and federal laws and regulations. An additional $1.2$1.4 billion of planned reliability investments at Consumers are aimed at reducing outages and improving customer satisfaction; these investments comprise $0.8$0.7 billion at the electric utility to strengthen circuits and substations, replace poles, and upgrade the Ludington pumped-storage plant, and $0.4$0.7 billion at the gas utility to replace mains and enhance transmission and storage systems. Consumers also expects to spend $1.1 billion on environmental investments needed to comply with state and federal laws and regulations.
In December 2012, Consumers announced plans to build a 700-MW gas-fueled electric generating plant at its Thetford complex in Genesee County, Michigan and filed an air permit application with the MDEQ for the proposed plant. In July 2013, Consumers filed for approval of a certificate of necessity with the MPSC, as allowed under the 2008 Energy Law. Construction of the plant, at an estimated cost of $750 million, is contingent upon obtaining the certificate of necessity and environmental permits. Consumers expects the plant to be operational in 2017.
Renewable energy projects are another major component of Consumers’ planned capital investments. Consumers expects to spend $0.5$0.3 billion on renewable energy investments, under an MPSC-approved renewable energy plan, from 20122013 through 2016.2017. The 2008 Energy Law requires that at least ten percent of Consumers’ electric sales volume come from renewable energy sources by 2015, and it includes requirements for specific capacity additions. Consumers has historically included renewable resources as part of its portfolio, with about fiveeight percent of its present power supply coming from such renewable sources as hydroelectric,hydropower, landfill gas, biomass, wind, anaerobic digestion, and wind.solar.
12
Table of Contents
Consumers’ Smart GridEnergy program, with an estimated total project capital cost of $750 million,$0.8 billion, also represents a major capital investment. The full-scale deployment of advanced metering infrastructure began in August 2012 and is planned to begin in the second half of 2012 and to continue through 2019. Consumers has spent $140 million$0.2 billion through 20112012 on its Smart GridEnergy program, and expects to spend an additional $260 million,$0.3 billion, following a phased approach, from 20122013 through 2016.
2017.RREGULATION
Regulatory matters are a key aspect of CMS Energy’s and Consumers’ businesses, particularly Consumers’ rate cases and regulatory proceedings before the MPSC. ImportantMichigan Governor Rick Snyder has appointed Sally Talberg to serve on the three-member MPSC for a six-year term starting July 3, 2013 replacing Orjiakor Isiogu. Talberg has served in various energy-related consulting, management, and public service roles during her career. She will represent political independents on the Commission. Her appointment is subject to the advice and consent of the Michigan Senate. Other important regulatory events and developments are summarized below.
| • | | Electric Rate Case: In June 2011, Consumers filed a general electric rate case seeking an annual rate increase of $195 million, based on a 10.7·Electric Rate Cases: Consumers filed a general electric rate case with the MPSC in September 2012, seeking an annual rate increase of $148 million, based on a 10.5 percent authorized return on equity. Consumers self-implemented an annual rate increase of $118 million in December 2011, subject to refund with interest. In June 2012, the MPSC authorized an annual rate increase of $118 million, based on a 10.3 percent return on equity. In January 2013, Consumers supplemented its electric rate case application to reflect changes to its environmental compliance and generation outage plans, which reduced its requested annual rate increase to $145 million.
|
| • | | Gas Rate Case: In September 2011, Consumers filed a general gas rate case seeking an annual rate increase of $49 million, based on a 10.7 percent authorized return on equity. Consumers self-implemented an annual rate increase of $23In March 2013, Consumers self-implemented an annual rate increase of $110 million out of its requested $145 million, subject to refund with interest. Consumers’ self-implementation required no order by the MSPC, and no intervenors in Consumers’ electric rate case opposed Consumers’ self-implementation amount. The MPSC approved a partial settlement agreement in May 2013, authorizing an annual rate increase of $89 million, based on a 10.3 percent authorized rate of return on equity. In July 2013, Consumers filed a reconciliation of total revenues collected during self-implementation to those that would have been collected under final rates. Consumers’ reconciliation indicated that no refund would be required. ·Gas Rate Case: In February 2013, Consumers filed an application with the MPSC seeking an annual rate increase of $49 million, based on a 10.5 percent authorized return on equity. The filing requested authority to recover new investments in customer reliability, deliverability, safety, and system enhancements, and sought approval of several rate adjustment mechanisms. Subsequent to this filing, Consumers’ projection of non-fuel costs decreased. As a result, in March 2012, subject to refund with interest. In June 2013, Consumers filed a petition with the MPSC to close the docket or, alternatively, to suspend and extend indefinitely the schedule in this case. The MPSC approved Consumers’ petition to suspend and indefinitely extend the schedule. ·Gas Revenue Decoupling Mechanism: The gas revenue decoupling mechanism, authorized by the MPSC in its 2009 order in Consumers’ gas rate case and extended through April 2012, allowed Consumers to adjust future gas rates to the degree that actual average weather-adjusted 13
Table of Contents sales per customer differed from the rate order. In December 2012, the MPSC approved Consumers’ settlement agreement and authorized an annual rate increase of $16 million, based on a 10.3 percent return on equity. |
| • | | Revenue Decoupling Mechanisms:Consumers has two electric revenue decoupling mechanism reconciliations pending with the MPSC, covering the period December 2009 through November 2011 and requesting, in total, recovery of $59 million.
|
In April 2012, the Michigan Court of Appeals ruled in an appeal filed by ABATE that disputed the MPSC’s decision to authorize an electric revenue decoupling mechanism for Detroit Edison. The Court concluded that the MPSC lacks statutory authority to approve or direct the use of a revenue decoupling mechanism for electric providers. Consumers cannot predict whether this decision will be appealed to the Michigan Supreme Court or the timing or outcome of any such appeal. As a result, Consumers determined that it no longer met the accounting criteria for recognition of a regulatory asset under an alternative revenue program, and wrote off its $59 million electric revenue decoupling mechanism regulatory asset at March 31, 2012. Although the case before the Court of Appeals related specifically to Detroit Edison, Consumers will continue to pursue all of its legal and regulatory avenues to recover its decoupling revenues.
As a result of the Court of Appeals decision in the Detroit Edison case, the MPSC requested all interested parties to submit comments regarding the future use of electric revenue decoupling mechanisms in Michigan. In May 2012, Consumers filed its comments with the MPSC. Consumers is unable to predict the outcome of this matter.
In September 2011, Consumers filed its first reconciliation of the gas revenue decoupling mechanism, requestingin which Consumers requested recovery of $16 million from customers for the period June 2010 through May 2011. ThisThe MPSC authorized recovery of the full amount over a three-month period that began in February 2013.
Consumers filed its final reconciliation of the gas revenue decoupling mechanism which was extendedin August 2012, requesting recovery of $17 million from customers for the period June 2011 through April 2012 and was not affected by the Court of Appeals decision on electric decoupling, allowed Consumers to adjust future gas rates to compensate for changes in sales volumes resulting from the difference between the level of average sales per customer adopted in the order and actual average weather-adjusted sales per customer, subject to certain conditions. Certain parties have filed in opposition to the reconciliation.2012. At June 30, 2012,2013, Consumers had a $33$17 million non-current regulatory asset recorded for gas revenue decoupling.
decoupling for that period. | • | | DOE Settlement: In July 2011, Consumers entered into an agreement with the DOE to settle for $120 million its claims related to the DOE’s failure to accept spent nuclear fuel. In September 2011, Consumers filed an application with the MPSC regarding the allocation of the $120 million settlement amount.
|
The 2008 Energy Law limits alternative electric supply to ten percent of Consumers’ weather-adjusted retail sales of the preceding calendar year. At June 30, 2012,2013, Consumers’ electric deliveries under the ROA program were at the ten percent limit.
In March 2012,February 2013, a bill was introduced to the Michigan Senate and House of Representatives that, upon enactment,if enacted, would revise the 2008 Energy Law and allow customers then on the ROA program waiting list to switch their service to an alternative electric supplier. Presently, the proportion of Consumers’ electric deliveries under the ROA program and on the ROA waiting list is 2325 percent. The revisionbill also proposes an increase in the cap of six percentage points per year from 20132014 through 2015.
In June 2012, a bill was introduced to the Michigan Senate and House of Representatives that would likely phase out electric choice and return the state’s electric industry to full regulation. This legislation was meant to counterpoint the bill introduced in March 2012.2016. Consumers is unable to predict the outcome of these twothis legislative proposals.proposal.
In January 2012, a ballot initiative was filed proposing to amend the Michigan Constitution to require Michigan utilities to obtain at least 25 percent of their electric energy from clean renewable energy sources such as wind, solar, biomass, and hydropower by 2025. The proposed amendment would also limit how much utilities could charge customers for the cost of complying with this requirement. If this ballot initiative is certified by the State Board of Canvassers, Michigan voters will vote on the proposal in the November 2012 general election.
Environmental regulation is another area of importance for CMS Energy and Consumers, and they are monitoring numerous legislative and regulatory initiatives, including initiatives to regulate greenhouse gases, and related litigation.
In July 2011, the EPA finalized CSAPR, which replaces CAIR. In December 2011, due to litigation surrounding CSAPR, the U.S. Court of Appeals for the D.C. Circuit issued a stay of CSAPR, stating that CAIR would remain in place while the court considers the issues.
Additionally, in FebruaryIn 2012, the EPA published its final MACT emission standards for electric generating units, based on Section 112 of the Clean Air Act, calling the final rule MATS. Although numerous parties, including the State of Michigan, have sought to extend the deadline of MATS, it is expected to take effect in 2015. Consumers has received from the MDEQ a one-year extension for MATS and the Michigan Mercury Rule for ten of its coal-fueled units, allowing them to run as presently configured until April 2016. CMS Energy and Consumers are continuing to assess the impact and cost associated with these standards.
In June 2013, President Obama directed the EPA to issue a revised proposal addressing greenhouse gas emissions of complyingnew fossil-fuel-fired steam electric generating units by September 20, 2013, and to finalize the rule in a timely fashion. The EPA was further directed to address existing, modified, and reconstructed fossil-fuel-fired steam electric generating units with CSAPRproposed standards, regulations, or guidelines to be completed by June 1, 2014, and MATS.final standards, regulations, or guidelines to be completed by June 1, 2015. Subsequent state implementation plans are due by June 30, 2016. Consumers believes that its balanced energy initiative, its present carbon reduction target, and its emphasis on supply diversity will position it favorably to deal with the impact of carbon regulation, but cannot predict the nature or outcome of these proposals. Consumers will continue to monitor regulatory activity regarding greenhouse gas emissions standards that may affect electric generating units.
FFINANCIALPERFORMANCEIN 2012AND BEYOND
For the six months ended June 30, 2012,2013, CMS Energy’s net income available to common stockholders was $167$224 million, and diluted EPS were $0.62.$0.83. This compares with net income available to common stockholders of $235$167 million and diluted EPS of $0.90$0.62 for the six months ended June 30, 2011.2012. The main factors contributing to CMS Energy’s improved performance in 2013 were increased gas deliveries and the declineabsence, in earnings in 2012 were2013, of the write-off of Consumers’ electric revenue decoupling mechanism regulatory asset as discussed above,in 2012.
Consumers’ utility operations are seasonal. The consumption of electric energy typically increases in the summer months, due primarily to the use of air conditioners and other cooling equipment, while peak
14
Table of Contents
demand for natural gas occurs in the winter due to colder temperatures and the absenceresulting use of a tax benefit recognized in 2011 related to the enactment of the MCIT.
natural gas as heating fuel. A more detailed discussion of the factors affecting CMS Energy’s and Consumers’ performance can be found in the Results of Operations section that follows this Executive Overview.
CMS Energy and Consumers believe that economic conditions in Michigan are improving. Although Michigan’s economy continuesConsumers expects its electric sales to be affectedincrease annually by about 0.5 to 1.0 percent on average through 2017, driven largely by the recession and its impact oncontinued rise in industrial production. Excluding the state’s automotive industry and by high unemployment rates, there are indications that the recession has eased in Michigan.impacts of energy efficiency programs, Consumers expects its electric sales to increase by about one1.0 to 1.5 percent annually through 2016, driven largely by the continued rise in industrial production.2017. Consumers is projecting that its gas sales will remain stable through 2016.2017. This outlook reflects growth in gas demand offset by energy efficiency and conservation.
As Consumers seeks to continue to receive fair and timely regulatory treatment, delivering customer value will remain a key strategic priority. To keep costs down for its utility customers, Consumers has set goals to achieve further annual productivity improvements. Additionally, Consumers will strive to give priority to capital investments that increase customer value or lower costs.
Consumers expects to continue to have sufficient capacity to fund its investment-based growth plans. CMS Energy also expects its sources of liquidity to remain sufficient to meet its cash requirements. CMS Energy and Consumers will continue to monitor developments in the financial and credit markets, as well as government policy responses to those developments, for potential implications for their businesses and their future financial needs.
15
Table of Contents
RESULTS OF OPERATIONS
CMS ENERGY CONSOLIDATED RESULTSOF OPERATIONS
| | | | | | | | | | | | | | | | | | | | | | | | |
| In Millions, Except Per Share Amounts | |
| | | Three Months Ended | | | Six Months Ended | |
| June 30 | | 2012 | | | 2011 | | | Change | | | 2012 | | | 2011 | | | Change | |
Net Income Available to Common Stockholders | | $ | 100 | | | $ | 100 | | | $ | - | | | $ | 167 | | | $ | 235 | | | $ | (68 | ) |
Basic Earnings Per Share | | $ | 0.38 | | | $ | 0.40 | | | $ | (0.02 | ) | | $ | 0.64 | | | $ | 0.94 | | | $ | (0.30 | ) |
Diluted Earnings Per Share | | $ | 0.37 | | | $ | 0.38 | | | $ | (0.01 | ) | | $ | 0.62 | | | $ | 0.90 | | | $ | (0.28 | ) |
| | |
|
| In Millions | |
| | | Three Months Ended | | | Six Months Ended | |
| June 30 | | 2012 | | | 2011 | | | Change | | | 2012 | | | 2011 | | | Change | |
Electric utility | | $ | 111 | | | $ | 85 | | | $ | 26 | | | $ | 132 | | | $ | 150 | | | $ | (18 | ) |
Gas utility | | | 9 | | | | 5 | | | | 4 | | | | 64 | | | | 93 | | | | (29 | ) |
Enterprises | | | (1 | ) | | | 29 | | | | (30 | ) | | | 4 | | | | 32 | | | | (28 | ) |
Corporate interest and other | | | (19 | ) | | | (19 | ) | | | - | | | | (40 | ) | | | (42 | ) | | | 2 | |
Discontinued operations | | | - | | | | - | | | | - | | | | 7 | | | | 2 | | | | 5 | |
Net Income Available to Common Stockholders | | $ | 100 | | | $ | 100 | | | $ | - | | | $ | 167 | | | $ | 235 | | | $ | (68 | ) |
| | |
CMS ENERGY CONSOLIDATED RESULTSOF OPERATIONS
| | | | In Millions, Except Per Share Amounts | |
| | Three Months Ended | | Six Months Ended |
June 30 | | 2013 | | 2012 | | Change | | 2013 | | 2012 | | Change | |
Net Income Available to Common Stockholders | | $ | 80 | | $ | 100 | | $ | (20 | ) | $ | 224 | | $ | 167 | | $ | 57 | |
Basic Earnings Per Share | | $ | 0.30 | | $ | 0.38 | | $ | (0.08 | ) | $ | 0.85 | | $ | 0.64 | | $ | 0.21 | |
Diluted Earnings Per Share | | $ | 0.29 | | $ | 0.37 | | $ | (0.08 | ) | $ | 0.83 | | $ | 0.62 | | $ | 0.21 | |
| | | | | | | | | | | | | |
| | | | | | In Millions | |
| | Three Months Ended | | Six Months Ended |
June 30 | | 2013 | | 2012 | | Change | | 2013 | | 2012 | | Change | |
Electric utility | | $ | 93 | | $ | 111 | | $ | (18 | ) | $ | 159 | | $ | 132 | | $ | 27 | |
Gas utility | | 5 | | 9 | | (4 | ) | 101 | | 64 | | 37 | |
Enterprises | | 1 | | (1 | ) | 2 | | 5 | | 4 | | 1 | |
Corporate interest and other | | (19 | ) | (19 | ) | - | | (41 | ) | (40 | ) | (1 | ) |
Discontinued operations | | - | | - | | - | | - | | 7 | | (7 | ) |
Net Income Available to Common Stockholders | | $ | 80 | | $ | 100 | | $ | (20 | ) | $ | 224 | | $ | 167 | | $ | 57 | |
Presented in the following table are specific after-tax changes to net income available to common stockholders for 20122013 versus 2011:2012:
| | | | | | | | | | | | | | | | |
| In Millions | |
| | | June 30, 2012 better/(worse) than 2011 | |
| Reasons for the change | | Three Months Ended | | | Six Months Ended | |
Gas sales | | $ | (5 | ) | | | | | | $ | (41 | ) | | | | |
Electric sales | | | 7 | | | | | | | | (13 | ) | | | | |
Electric and gas rate orders | | | 23 | | | | | | | | 50 | | | | | |
Recovery of development costs related to canceled coal-fueled plant | | | 9 | | | | | | | | 9 | | | | | |
Distribution and service restoration cost | | | 9 | | | | | | | | 9 | | | | | |
Other, including depreciation and property tax | | | (7 | ) | | $ | 36 | | | | (18 | ) | | $ | (4 | ) |
| | | | | | | | | | | | | | | | |
| | | | |
Subsidiary earnings of enterprises segment | | | | | | | (2 | ) | | | | | | | 2 | |
Lower corporate fixed charges, EnerBank earnings, and other | | | | | | | 5 | | | | | | | | 6 | |
Charge to write off electric decoupling regulatory asset | | | | | | | - | | | | | | | | (36 | ) |
Absence of MCIT enactment in 2011 | | | | | | | (32 | ) | | | | | | | (32 | ) |
Other, mainly voluntary separation program cost | | | | | | | (7 | ) | | | | | | | (4 | ) |
| | |
Total change | | | | | | $ | - | | | | | | | $ | (68 | ) |
| | |
| | | | | | In Millions | |
| | June 30, 2013 better/(worse) than 2012 | |
Reasons for the change | | Three Months Ended | | Six Months Ended | |
Gas sales | | $ | 5 | | | | $ | 46 | | | |
Electric sales | | (10) | | | | 1 | | | |
Electric and gas rate orders | | 17 | | | | 30 | | | |
Depreciation and property tax | | (10) | | | | (20) | | | |
Distribution and restoration cost | | (20) | | | | (21) | | | |
Absence of recovery of development costs related to
canceled coal-fueled plant in 2012 | | (9) | | | | (9) | | | |
Subsidiary earnings of enterprises segment | | 1 | | | | (1) | | | |
Higher corporate fixed charges and other,
offset by higher EnerBank earnings | | - | | | | (1) | | | |
Other | | (2) | | $ | (28 | ) | (6) | | $ | 19 | |
| | | | | | | | | |
Absence of 2012 charge to write off electric decoupling
regulatory asset | | | | - | | | | 36 | |
Absence of voluntary separation plan cost in 2012 | | | | 7 | | | | 7 | |
Other, including the absence of the elimination, in 2012, of
a liability associated with a prior asset sale | | | | 1 | | | | (5 | ) |
Total change | | | | $ | (20 | ) | | | $ | 57 | |
| | | | | | | | | | | | | |
16
CONSUMERS ELECTRIC UTILITY RESULTSOF OPERATIONSTable of Contents
| | | | | | | | | | | | |
| In Millions | |
| June 30 | | 2012 | | | 2011 | | | Change | |
Net Income Available to Common Stockholders | | | | | | | | | | | | |
Three months ended | | $ | 111 | | | $ | 85 | | | $ | 26 | |
Six months ended | | | 132 | | | | 150 | | | | (18 | ) |
| | |
CONSUMERS ELECTRIC UTILITY RESULTS OF OPERATIONS
| | | | | | | | | | | | | | In Millions | |
| In Millions | | |
| | | June 30, 2012 better/(worse) than 2011 | | | Three Months Ended | | Six Months Ended | |
June 30 | | | 2013 | | 2012 | | Change | | 2013 | | 2012 | | Change | |
Net Income Available to Common Stockholders | | | $ | 93 | | $ | 111 | | $ | (18 | ) | $ | 159 | | $ | 132 | | $ | 27 | |
| Reasons for the change | | Three Months Ended | | Six Months Ended | | | | | | | | | | | | | | |
Electric deliveries and rate increases | | | $ 45 | | | | $ (12 | ) | | | | | | $ | (2 | ) | | | | | $ | 78 | |
Power supply costs and related revenue | | | 2 | | | | 2 | | | | | | | (1 | ) | | | | | (1 | ) |
Other income, net of expenses | | | (2 | ) | | | (2 | ) | | | | | | (1 | ) | | | | | (2 | ) |
Maintenance and other operating expenses | | | 7 | | | | 4 | | | | | | | (17 | ) | | | | | (13 | ) |
Depreciation and amortization | | | (7 | ) | | | (13 | ) | | | | | | (8 | ) | | | | | (19 | ) |
General taxes | | | 3 | | | | 2 | | | | | | | (1 | ) | | | | | (2 | ) |
Interest charges | | | 3 | | | | 4 | | | | | | | - | | | | | | 1 | |
Income taxes | | | (25 | ) | | | (3 | ) | | | | | | 12 | | | | | | (15 | ) |
| | | |
Total change | | | $ 26 | | | | $ (18 | ) | | | | | | $ | (18 | ) | | | | | $ | 27 | |
| | | | | | | | | | | | | | | | | | | | | | |
Electric deliveries and rate increases: For the three months ended June 30, 2012,2013, electric delivery revenues increased $45decreased $2 million compared with 2011.2012. This variance wasdecrease reflected $19 million of lower deliveries, due partially to additional revenues of $25milder weather in 2013, and a $2 million resultingdecrease in other revenues. These decreases were offset largely by a $19 million benefit from a December 2011 self-implementedMay 2013 rate increase and $26 million resulting from higher deliveries, reflecting warmer weather and increased usagethat Consumers self-implemented in 2012. Additionally, other miscellaneous revenue increased $3 million. These increases were offset partially by the absence, in 2012, of $9 million of electric decoupling revenues recognized in 2011.March 2013. Deliveries to end-use customers, excluding deliveries to Consumers’ largest customer, which is on an economic development rate, were 9.58.6 billion kWh in 2012, an increase2013, a decrease of 0.60.1 billion kWh, or 6.7one percent, compared with 2011.2012.
For the six months ended June 30, 2012,2013, electric delivery revenues decreased $12increased $78 million compared with 2011.2012. This decreaseincrease reflected the absence, in 2013, of a $59 million charge to write off Consumers’ electric decoupling mechanism regulatory asset, and the absence,a $23 million benefit from a May 2013 rate increase that Consumers self-implemented in 2012, of $30 million of electric decoupling revenues recognized in 2011.March 2013. These decreasesincreases were offset largelypartially by additional revenues of $51a $4 million resulting from a December 2011 self-implemented rate increase, $11 million resulting from higher deliveriesdecrease in 2012, and a $15 million increase in surcharges and other miscellaneous revenues. Deliveries to end-use customers, excluding deliveries to Consumers’ largest customer, which is on an economic development rate, were 18.717.3 billion kWh in 2012,2013, an increase of 0.40.1 billion kWh, or 2.2one percent, compared with 2011.2012.
Maintenance and other operating expenses: For the three months ended June 30, 2012,2013, maintenance and other operating expenses decreased $7increased $17 million compared with 2011.2012. This decreaseincrease reflected the $14 millionabsence, in 2013, of the authorized recovery of costs$14 million associated with Consumers’ proposedcancelled coal-fueled plant and a $7an $11 million reductionincrease in service restoration costs.expenses. These decreasesincreases were offset partially by the absence, in 2013, of $8 million of voluntary separation program expenses, $5 million of higher energy optimization program costs, and a $1 million increase in other operatingprograms expenses.
For the six months ended June 30, 2012,2013, maintenance and other operating expenses decreased $4increased $13 million compared with 2011.2012. This decreaseincrease reflected the $14 millionabsence, in 2013, of the authorized recovery of costs$14 million associated with Consumers’ proposedcancelled coal-fueled plant, and a $9an $8 million reductionincrease in service restoration costs.expenses. These decreasesincreases were offset partially by the absence, in 2013, of $8 million of voluntary separation program expenses, $9 million of higher energy optimization program costs, and a $2$1 million increasedecrease in other operating expenses.
Depreciation and amortization: For the three months ended June 30, 2012,2013, depreciation and amortization expense increased $7$8 million compared with 2011,2012, and for the six months ended June 30, 2012,2013, depreciation and amortization expense increased $13$19 million compared with 2011.2012. These
17
Table of Contents
increases were due primarily to higher depreciation expense from increased plant in service.service during 2013 and an increase in depreciation rates that took effect in June 2012.
Income taxes: For the three months ended June 30, 2012,2013, income taxes increased $25decreased $12 million compared with 2011,2012, reflecting higherlower electric utility earnings in 2012.
CONSUMERS GAS UTILITY RESULTSOF OPERATIONS
| | | | | | | | | | | | |
| In Millions | |
| June 30 | | 2012 | | | 2011 | | | Change | |
Net Income Available to Common Stockholders | | | | | | | | | | | | |
Three months ended | | $ | 9 | | | $ | 5 | | | $ | 4 | |
Six months ended | | | 64 | | | | 93 | | | | (29 | ) |
| | |
| | | | | | | | |
| In Millions | |
| | | June 30, 2012 better/(worse) than 2011 | |
| Reasons for the change | | Three Months Ended | | | Six Months Ended | |
Gas deliveries and rate increases | | | $ 3 | | | | $ (32 | ) |
Other income, net of expenses | | | (1 | ) | | | (1 | ) |
Maintenance and other operating expenses | | | 1 | | | | (8 | ) |
Depreciation and amortization | | | - | | | | (5 | ) |
General taxes | | | - | | | | (1 | ) |
Interest charges | | | 2 | | | | 3 | |
Income taxes | | | (1 | ) | | | 15 | |
Total change | | | $ 4 | | | | $ (29 | ) |
| | |
Gas deliveries and rate increases: Forfor the three months ended June 30, 2012, gas delivery revenues increased $3 million compared with 2011. This increase reflected $5 million in additional revenues from March 2012 and May 2011 rate increases and a $5 million increase in surcharges and other miscellaneous revenues. These increases were offset partially by a $7 million reduction resulting from lower customer deliveries, due primarily to warmer weather in 2012. Gas deliveries, including transportation to end-use customers, were 40 bcf in 2012, a decrease of 6 bcf, or 13 percent, compared with 2011.2013.
For the six months ended June 30, 2013, income taxes increased $15 million compared with 2012, reflecting higher electric utility earnings for the first six months of 2013.
CONSUMERS GAS UTILITY RESULTS OF OPERATIONS
| | | | | | | | | | In Millions | |
| | Three Months Ended | | Six Months Ended | |
June 30 | | 2013 | | 2012 | | Change | | 2013 | | 2012 | | Change | |
Net Income Available to Common Stockholders | | $ | 5 | | $ | 9 | | $ | (4 | ) | $ | 101 | | $ | 64 | | $ | 37 | |
Reasons for the change | | | | | | | | | | | | | |
Gas deliveries and rate increases | | | | | | $ | 2 | | | | | | $ | 57 | |
Maintenance and other operating expenses | | | | | | (6 | ) | | | | | 1 | |
Depreciation and amortization | | | | | | - | | | | | | 3 | |
General taxes | | | | | | - | | | | | | (1 | ) |
Interest charges | | | | | | (1 | ) | | | | | - | |
Income taxes | | | | | | 1 | | | | | | (23 | ) |
Total change | | | | | | $ | (4 | ) | | | | | $ | 37 | |
| | | | | | | | | | | | | | | | | | | |
Gas deliveries and rate increases: For the three months ended June 30, 2013, gas delivery revenues decreased $32increased $2 million compared with 2011.2012. This decrease reflected a $67 million reduction resulting from lower customer deliveries,increase was due primarily to warmer weather in 2012. The decrease washigher customer deliveries, offset partially by $19 millionthe absence of additional revenues from March 2012 and May 2011 rate increases, an $8 million increase related to the energy optimization program, and an $8 million increasegas revenue decoupling mechanism in other miscellaneous revenues. Gas deliveries, including transportation2013. Deliveries to end-use customers were 14647 bcf in 2012, a decrease2013, an increase of 337 bcf, or 18 percent, compared with 2011.2012.
Maintenance and other operating expenses:
For the six months ended June 30, 2013, gas delivery revenues increased $57 million compared with 2012. This increase reflected $51 million of higher customer deliveries, due primarily to colder weather in 2013, offset partially by the absence of the gas revenue decoupling mechanism in 2013, and a $6 million benefit from a June 2012 rate increase that Consumers self-implemented in March 2012. Deliveries to end-use customers were 179 bcf in 2013, an increase of 33 bcf, or 23 percent, compared with 2012.
Maintenance and other operating expenses: For the three months ended June 30, 2013, maintenance and other operating expenses increased $8$6 million compared with 20112012. This increase was due to $8a $10 million increase in pipeline integrity and gas distribution operating expenses, offset partially by the absence, in 2013, of $4 million of higher energy optimizationvoluntary separation program costsexpenses.
For the six months ended June 30, 2013, maintenance and other operating expenses decreased $1 million compared with 2012. This decrease was due to the absence, in 2013, of $4 million of voluntary separation program expenses, offset partially by $4a $3 million of lowerincrease in gas distribution operating expenses.
Depreciation and amortization: For the six months ended June 30, 2012,2013, depreciation and amortization expense increased $5decreased $3 million compared with 2011,2012, due primarily to higherdecreased depreciation expense from increased plantrates that took effect in service.January 2013.
Income taxes: For the six months ended June 30, 2012,2013, income taxes decreased $15increased $23 million compared with 2011, reflecting lower2012, due to higher gas utility earnings in 2012.
ENTERPRISES RESULTSOF OPERATIONS2013.
| | | | | | | | | | | | |
| In Millions | |
| June 30 | | 2012 | | | 2011 | | | Change | |
Net Income (Loss) Available to Common Stockholders | | | | | | | | | | | | |
Three months ended | | $ | (1 | ) | | $ | 29 | | | $ | (30 | ) |
Six months ended | | | 4 | | | | 32 | | | | (28 | ) |
| | |
18
Table of Contents
ENTERPRISES RESULTS OF OPERATIONS
| | | | | | | | | | In Millions | |
| | Three Months Ended | | Six Months Ended |
June 30 | | 2013 | | 2012 | | Change | | 2013 | | 2012 | | Change | |
Net Income Available to Common Stockholders | | $ | 1 | | $ | (1 | ) | $ | 2 | | $ | 5 | | $ | 4 | | $ | 1 | |
| | | | | | | | | | | | | | | | | | | |
For the three months ended June 30, 2012, the enterprises segment recorded a net loss of $1 million, compared with net income of $29 million for the three months ended June 30, 2011, and for the six months ended June 30, 2012,2013, net income of the enterprises segment decreased $28increased $2 million compared with 2011. These changes were2012, due primarily to the absence, in 2012, of a $28 million income tax benefit resulting from the enactment of the MCIT in May 2011.
CORPORATE INTERESTAND OTHER RESULTSOF OPERATIONSimproved gross margins.
| | | | | | | | | | | | |
| In Millions | |
| June 30 | | 2012 | | | 2011 | | | Change | |
Net Loss Available to Common Stockholders | | | | | | | | | | | | |
Three months ended | | | $ (19 | ) | | | $ (19 | ) | | | $ - | |
Six months ended | | | (40 | ) | | | (42 | ) | | | 2 | |
| | |
For the six months ended June 30, 2013, net income of the enterprises segment increased $1 million compared with 2012, due primarily to lower expenses, offset partially by the absence of a $2 million 2012 Michigan tax benefit.
CORPORATE INTEREST AND OTHER RESULTS OF OPERATIONS
| | | | | | | | | | In Millions | |
| | Three Months Ended | | Six Months Ended |
June 30 | | 2013 | | 2012 | | Change | | 2013 | | 2012 | | Change | |
Net Income (Reduction) Available to Common Stockholders | | $ | (19 | ) | $ | (19 | ) | $ | - | | $ | (41 | ) | $ | (40 | ) | $ | (1 | ) |
| | | | | | | | | | | | | | | | | | | |
For the six months ended June 30, 2013, corporate interest and other net expenses decreased $2increased $1 million compared with 2011,2012, due primarily to higher net earnings at EnerBank.an increase in interest expense, reflecting increased borrowings.
DDISCONTINUEDOPERATIONS
For each of the three-month periodsthree months ended June 30, 2012 and 2011,2013, the net loss recorded from discontinued operations was less than $1 million.
For the six months ended June 30, 2012,2013, the net loss from discontinued operations was less than $1 million, compared with income from discontinued operations wasof $7 million in 2012, reflecting the elimination of a liability related to a prior asset sale, compared with income from discontinued operationssale.
19
Table of $2 million in 2011 as a result of a favorable legal settlement related to a previously sold business.Contents
CASH POSITION, INVESTING, AND FINANCING
At June 30, 2012,2013, CMS Energy had $215$566 million of consolidated cash and cash equivalents, which included $29 million of restricted cash and cash equivalents. At June 30, 2013, Consumers had $314 million of consolidated cash and cash equivalents, which included $28 million of restricted cash and cash equivalents. Consumers had $181 million of consolidated cash and cash equivalents, which included $27 million of restricted cash and cash equivalents.
OOPERATINGACTIVITIES
Presented in the following table are specific components of net cash provided by operating activities for the six months ended June 30, 20122013 and 2011:2012:
| | | | | | | | | | | | In Millions | |
| In Millions | | |
| Six Months Ended June 30 | | 2012 | | 2011 | | Change | | | 2013 | | 2012 | | Change | |
CMS Energy, including Consumers | | | | | | | | | | | | | |
Net income | | $ | 168 | | | $ | 236 | | | $ | (68 | ) | | $ | 225 | | $ | 168 | | $ | 57 | |
Non-cash transactions1 | | | 533 | | | | 480 | | | | 53 | | | 580 | | 533 | | 47 | |
| | | | | | 805 | | 701 | | 104 | |
| | | 701 | | | | 716 | | | | (15 | ) | |
Postretirement benefits contributions | | | (37 | ) | | | (39 | ) | | | 2 | | | (88 | ) | (37 | ) | (51 | ) |
Decrease in core working capital2 | | | 291 | | | | 453 | | | | (162 | ) | |
Other changes in assets and liabilities, net | | | (12 | ) | | | 86 | | | | (98 | ) | |
Proceeds from government grant | | | 69 | | - | | 69 | |
Changes in core working capital2 | | | 357 | | 291 | | 66 | |
Changes in other assets and liabilities, net | | | (48 | ) | (12 | ) | (36 | ) |
Net cash provided by operating activities | | $ | 943 | | | $ | 1,216 | | | $ | (273 | ) | | $ | 1,095 | | $ | 943 | | $ | 152 | |
| | | |
Consumers | | | | | | | | | | | | | |
Net income | | $ | 198 | | | $ | 245 | | | $ | (47 | ) | | $ | 262 | | $ | 198 | | $ | 64 | |
Non-cash transactions1 | | | 461 | | | | 473 | | | | (12 | ) | | 527 | | 461 | | 66 | |
| | | | | | 789 | | 659 | | 130 | |
| | | 659 | | | | 718 | | | | (59 | ) | |
Postretirement benefits contributions | | | (34 | ) | | | (37 | ) | | | 3 | | | (86 | ) | (34 | ) | (52 | ) |
Decrease in core working capital2 | | | 294 | | | | 451 | | | | (157 | ) | |
Other changes in assets and liabilities, net | | | 94 | | | | 113 | | | | (19 | ) | |
Proceeds from government grant | | | 69 | | - | | 69 | |
Changes in core working capital2 | | | 357 | | 294 | | 63 | |
Changes in other assets and liabilities, net | | | (44 | ) | 94 | | (138 | ) |
Net cash provided by operating activities | | $ | 1,013 | | | $ | 1,245 | | | $ | (232 | ) | | $ | 1,085 | | $ | 1,013 | | $ | 72 | |
| | | |
1Non-cash transactions comprise depreciation and amortization, changes in deferred income taxes, postretirement benefits
expense, and other non-cash items.
2Core working capital comprises accounts receivable and accrued revenues, inventories, and accounts payable.
For the six months ended June 30, 2012,2013, net cash provided by operating activities at CMS Energy decreased $273increased $152 million compared with 2011,2012, and net cash provided by operating activities at Consumers decreased $232increased $72 million compared with 2011.2012. The decreasesincreases were due primarily to lower gas saleshigher net income, net of non-cash transactions, the receipt of a $69 million renewable energy grant for Lake Winds® Energy Park, an increase in refunds to customers, and a smallerlarger reduction in core working capital, reflecting lowerhigher usage of gas inventory. These changes were offset partially by higher pension contributions. At Consumers, these changes were also offset partially by an increase in tax payments to CMS Energy.
20
Table of Contents
INVESTINGACTIVITIES
Presented in the following table are specific components of net cash used in investing activities for the six months ended June 30, 20122013 and 2011:2012:
| | | | | | | | | | | | In Millions | |
| In Millions | | |
| Six Months Ended June 30 | | 2012 | | 2011 | | Change | | | 2013 | | 2012 | | Change | |
CMS Energy, including Consumers | | | | | | | | | | | | | |
Capital expenditures | | $ | (575 | ) | | $ | (399 | ) | | $ | (176 | ) | | $ | (580 | ) | $ | (575 | ) | $ | (5 | ) |
Costs to retire property and other | | | (35 | ) | | | (72 | ) | | | 37 | | | (36 | ) | (35 | ) | (1 | ) |
Net cash used in investing activities | | $ | (610 | ) | | $ | (471 | ) | | $ | (139 | ) | | $ | (616 | ) | $ | (610 | ) | $ | (6 | ) |
| | | |
Consumers | | | | | | | | | | | | | |
Capital expenditures | | $ | (572 | ) | | $ | (394 | ) | | $ | (178 | ) | | $ | (579 | ) | $ | (572 | ) | $ | (7 | ) |
Costs to retire property and other | | | (29 | ) | | | (51 | ) | | | 22 | | | (34 | ) | (29 | ) | (5 | ) |
Net cash used in investing activities | | $ | (601 | ) | | $ | (445 | ) | | $ | (156 | ) | | $ | (613 | ) | $ | (601 | ) | $ | (12 | ) |
| | | |
For the six months ended June 30, 2012,2013, net cash used in investing activities at CMS Energy increased $139$6 million compared with 2011,2012, and net cash used in investing activities at Consumers increased $156$12 million compared with 2011.2012. The increases were due primarily to increasesa slight increase in capital expenditures.expenditures under Consumers’ capital investment program.
FFINANCINGACTIVITIES
Presented in the following table are specific components of net cash used in financing activities for the six months ended June 30, 20122013 and 2011:2012:
| | | | | | | | | | | | In Millions | |
| In Millions | | |
| Six Months Ended June 30 | | 2012 | | 2011 | | Change | | | 2013 | | 2012 | | Change | |
CMS Energy, including Consumers | | | | | | | | | | | | | |
Issuance of FMBs, senior notes, and other debt | | $ | 914 | | | $ | 396 | | | $ | 518 | | |
Retirement of debt and other debt maturity payments | | | (1,100 | ) | | | (292 | ) | | | (808 | ) | |
Common stock issued | | | 23 | | | | 22 | | | | 1 | | |
Payments of common stock dividends | | | (125 | ) | | | (106 | ) | | | (19 | ) | |
Issuance of debt | | | $ | 788 | | $ | 914 | | $ | (126 | ) |
Retirement of debt | | | (586 | ) | (1,100 | ) | 514 | |
Payment of common stock dividends | | | (135 | ) | (125 | ) | (10 | ) |
Decrease in notes payable | | | (110 | ) | - | | (110 | ) |
Other financing activities | | | (19 | ) | | | (20 | ) | | | 1 | | | 8 | | 4 | | 4 | |
Net cash used in financing activities | | $ | (307 | ) | | $ | - | | | $ | (307 | ) | | $ | (35 | ) | $ | (307 | ) | $ | 272 | |
| | | |
Consumers | | | | | | | | | | | | | |
Issuance of FMBs | | $ | 375 | | | $ | - | | | $ | 375 | | |
Retirement of debt and other debt maturity payments | | | (694 | ) | | | (18 | ) | | | (676 | ) | |
Payments of common stock dividends | | | (158 | ) | | | (196 | ) | | | 38 | | |
Issuance of debt | | | $ | 425 | | $ | 375 | | $ | 50 | |
Retirement of debt | | | (445 | ) | (694 | ) | 249 | |
Payment of common and preferred stock dividends | | | (195 | ) | (159 | ) | (36 | ) |
Stockholder contribution from CMS Energy | | | 150 | | | | 125 | | | | 25 | | | 150 | | 150 | | - | |
Decrease in notes payable | | | (110 | ) | - | | (110 | ) |
Other financing activities | | | (16 | ) | | | (16 | ) | | | - | | | (16 | ) | (15 | ) | (1 | ) |
Net cash used in financing activities | | $ | (343 | ) | | $ | (105 | ) | | $ | (238 | ) | | $ | (191 | ) | $ | (343 | ) | $ | 152 | |
| | | |
For the six months ended June 30, 2012,2013, net cash used in financing activities at CMS Energy increased $307decreased $272 million compared with 2011,2012 and net cash used in financing activities at Consumers increased $238decreased $152 million compared with 2011.2012. These increaseschanges were due primarily to an increasea decrease in net debt retirements.retirements, offset partially by repayments by Consumers under its revolving accounts receivable sales program.
21
Table of Contents
RETIREMENT BENEFITS
Effective July 1, 2013, CMS Energy and Consumers approved a change to the Medicare drug program provided through their OPEB Plan from an employer-sponsored prescription drug plan with a retiree drug subsidy to an EGWP, to begin on January 1, 2015. As a result of changes stemming from the Health Care Acts, the EGWP structure can result in reduced costs for employers, without impacting plan participants’ benefit coverage or costs. Also effective July 1, 2013, CMS Energy and Consumers approved certain benefit changes to the OPEB Plan, to begin on January 1, 2016. Accordingly, CMS Energy and Consumers performed a remeasurement of the OPEB Plan as of July 1, 2013. In addition, with the plan remeasurement, the discount rate used to measure the OPEB liability was increased from 4.4 percent at December 31, 2012 to 5.1 percent at July 1, 2013. Assumptions regarding the expected long-term rate of return on plan assets and the health-care cost trend rate did not change from December 31, 2012 levels.
As a result of these changes, CMS Energy’s (including Consumers’) OPEB liability decreased by $613 million and its OPEB regulatory asset decreased by $599 million as of July 1, 2013. CMS Energy’s accumulated other comprehensive loss decreased by $14 million. CMS Energy’s (including Consumers’) OPEB cost is expected to decrease by $46 million in 2013. Consumers’ OPEB liability decreased by $599 million and its OPEB regulatory asset decreased by $599 million as of July 1, 2013. Consumers’ OPEB cost is expected to decrease by $45 million in 2013.
The decrease in CMS Energy’s and Consumers’ OPEB liabilities was due primarily to the change in the discount rate used to measure the liabilities and other changes in actuarial assumptions, the benefit changes, and the change in the OPEB Plan’s Medicare drug program to the EGWP structure. Presented in the following table are the components of the decrease in CMS Energy’s and Consumers’ OPEB liabilities at July 1, 2013.
| | In Millions | |
| | OPEB Liability | |
CMS Energy, including Consumers | | | |
Discount rate and other actuarial assumptions | | $ | 250 | |
Benefit changes | | 208 | |
Medicare drug program structure | | 155 | |
Total decrease | | $ | 613 | |
Consumers | | | |
Discount rate and other actuarial assumptions | | $ | 245 | |
Benefit changes | | 203 | |
Medicare drug program structure | | 151 | |
Total decrease | | $ | 599 | |
22
Table of Contents
Presented in the following table are the most recent estimates of CMS Energy’s and Consumers’ pension cost, OPEB cost, and cash contributions through 2014:2015. These updated estimates incorporate the OPEB Plan changes that became effective July 1, 2013.
| | | | | | | | | | | | | | | | In Millions | |
| In Millions | | |
| | | Pension | | OPEB | | Pension | | OPEB | |
| | | Pension Cost | | | OPEB Cost | | | Pension
Contribution | | | OPEB
Contribution | | | Cost | | Cost (Credit | ) | Contribution | | Contribution | |
CMS Energy, including Consumers | | | | | | | | | | | | | | | | | |
2012 | | | $ 103 | | | | $ 75 | | | | $ - | | | | $ 65 | | |
2013 | | | 115 | | | | 73 | | | | - | | | | 74 | | | $ | 119 | | $ | 14 | | $ | 50 | | $ | 72 | |
2014 | | | 112 | | | | 90 | | | | 111 | | | | 73 | | | 102 | | (24 | ) | 4 | | 57 | |
| | | |
2015 | | | 104 | | (17 | ) | 145 | | 25 | |
Consumers | | | | | | | | | | | | | | | | | |
2012 | | | $ 100 | | | | $ 77 | | | | $ - | | | | $ 64 | | |
2013 | | | 112 | | | | 75 | | | | - | | | | 73 | | | $ | 116 | | $ | 17 | | $ | 49 | | $ | 71 | |
2014 | | | 109 | | | | 92 | | | | 108 | | | | 72 | | | 100 | | (20 | ) | 4 | | 56 | |
| | | |
2015 | | | 101 | | (13 | ) | 141 | | 25 | |
Contribution estimates comprise amounts required for pensionamounts and discretionary contributions for OPEB.contributions. Consumers’ pension and OPEB costs are recoverable through its general ratemaking process. Actual future costs and contributions will depend on future investment performance, changes in discount rates, and various other factors related to the Pension Plan and OPEB participants.
For additional details on retirement benefits, see Note 10: Retirement Benefits.
CAPITAL RESOURCES AND LIQUIDITY
CMS Energy uses dividends from its subsidiaries and external financing and capital transactions to invest in its utility and non-utility businesses, retire debt, pay dividends, and fund its other obligations. The ability of CMS Energy’s subsidiaries, including Consumers, to pay dividends to CMS Energy depends upon each subsidiary’s revenues, earnings, cash needs, and other factors. In addition, Consumers’ ability to pay dividends is restricted by certain terms included in its debt covenants and articles of incorporation, and potentially by provisions under the Federal Power Act and the Natural Gas Act and FERC requirements. For additional details on Consumers’ dividend restrictions, see Note 5:3, Financings and Capitalization – Dividend Restrictions. For the six months ended June 30, 2012,2013, Consumers paid $158$194 million in dividends on common stock dividends to CMS Energy.
In June 2011,
CMS Energy has entered into atwo continuous equity offering program under which CMS Energy mayprograms permitting it to sell, from time to time in “at the market” offerings, common stock having an aggregate sales price of up to $50 million. In June 2012, under thismillion per program. Under the first program, entered into in 2011, CMS Energy issued 650,235 shares of common stock at an average price of $23.07 per share, resulting inand received net proceeds of $20 million in March 2013 and $15 million.million in each of 2012 and 2011. In June 2011,April 2013, CMS Energy entered into the second continuous equity offering program, but has not yet issued any equity under this program, CMS Energy issued 762,925 shares of common stock at an average price of $19.66 per share, resulting in net proceeds of $15 million.program.
Consumers uses cash flows generated from operations and external financing transactions, as well as stockholder contributions from CMS Energy, to fund capital expenditures, retire debt, pay dividends, contribute to its employee benefit plans, and fund its other obligations.
23
Table of Contents
CMS Energy’s and Consumers’ access to the financial and capital markets depends on their credit ratings and on market conditions. As evidenced by past financing transactions, CMS Energy and Consumers have had ready access to these markets and, barring major market dislocations or disruptions, they expect to continue to have such access. If access to these markets were to become diminisheddiminish or otherwise become restricted, however, CMS Energy and Consumers would implement contingency plans to address debt maturities, which could include reduced capital spending. CMS Energy and Consumers had the following secured revolving credit facilities available at June 30, 2012:2013:
| | In Millions | | |
| | | | | | | | | | | | In Millions | |
| | | Amount of Facility | | | Amount Borrowed | | | Letters of Credit Outstanding | | | Amount Available | | | Expiration Date | | | Amount of | | Amount | | Letters of Credit | | Amount | | | |
| | | | Facility | | Borrowed | | Outstanding | | Available | | Expiration Date | |
CMS Energy | | | | | | | | | | | | | | | | | | | | | |
Revolving credit facility1 | | | $ 550 | | | | $ 25 | | | | $ 2 | | | | $ 523 | | | | March 2016 | | | $ | 550 | | $ | - | | $ | 2 | | $ | 548 | | December 2017 | |
| | |
Consumers | | | | | | | | | | | | | | | | | | | | | |
Revolving credit facility2 | | | $ 500 | | | | $ - | | | | $ 3 | | | | $ 497 | | | | March 2016 | | | $ | 500 | | $ | - | | $ | 2 | | $ | 498 | | December 2017 | |
Revolving credit facility2 | | | 150 | | | | - | | | | - | | | | 150 | | | | April 2017 | | | 150 | | - | | - | | 150 | | April 2017 | |
Revolving credit facility2 | | | 30 | | | | - | | | | 30 | | | | - | | | | September 2014 | | | 30 | | - | | 30 | | - | | September 2014 | |
| | |
1Obligations under this facility are secured by Consumers common stock.
2Obligations under this facility are secured by FMBs of Consumers.
CMS Energy and Consumers use these credit facilities for general working capital purposes and to issue letters of credit. An additional source of liquidity is Consumers’ revolving accounts receivable sales program, which allows it to transfer up to $250 million of accounts receivable as a secured borrowing. At June 30, 2012,2013, $250 million of accounts receivable were eligible for transfer under this program.
Certain of CMS Energy’s and Consumers’ credit agreements, and debt indentures, and other facilities contain covenants that require CMS Energy and Consumers to maintain certain financial ratios, as defined therein. At June 30, 2012,2013, no events of default had occurred with respect to any financial covenants contained in CMS Energy’s and Consumers’ credit agreements, debt indentures, or debt indentures.other facilities. CMS Energy and Consumers were each in compliance with these limitscovenants as of June 30, 2012,2013, as presented in the following table:
| | | | | | | | | | | | | | | | |
| | | | June 30, 2013 |
Credit Agreement, Indenture, or Facility | | Description | | | Limit | | | Ratio at
June 30, 2012 | |
| Description | | Limit | | Actual | |
CMS Energy | | | | | | | | | | | | | | | | |
$550 million revolving credit agreement and $180 million term loan credit agreement | | | Debt to EBITDA | | | | < | | | | 6.0 to 1.0 | | | | 4.7 to 1.0 | |
Senior notes indenture
| | | Interest Coverage | | | | > | | | | 1.6 to 1.0 | | | | 3.8 to 1.0 | |
$180 million term loan credit agreement | | | Interest Coverage | | | | > | | | | 2.0Debt to 1.0EBITDA | | | | 3.8 to 1.0 | |
| < | 6.0 to 1.0 | | 4.4 to 1.0 | |
$180 million term loan credit agreement | | Interest Coverage | | > | 2.0 to 1.0 | | 4.4 to 1.0 | |
Consumers | | | | | | | | | | | | | | | | |
$500 million, $150 million, and $30 million revolving credit | | | | | | | |
agreements, $375 million term loan credit agreement, and $35 million and $68 million reimbursement agreements | | | Debt to Capital | | | | < | | | | 0.65 to 1.0 | | | | 0.46 to 1.0 | |
$250agreements, and $250 million accounts receivable
| | | | | | | |
purchase agreement | | | Debt to Capital | | | | < | | | | 0.70 to 1.0 | | | | 0.46 to 1.0 | |
| < | 0.65 to 1.0 | | 0.47 to 1.0 | |
Components of CMS Energy’s and Consumers’ cash management plan include controlling operating expenses and capital expenditures and evaluating market conditions for financing and refinancing opportunities. CMS Energy and Consumers believe that their present level of cash and their expected cash flows from operating activities, together with their access to sources of liquidity, will be sufficient to fund their contractual obligations for 20122013 and beyond.
24
Table of Contents
OFF-BALANCE-SFF-BALANCE-SHEETARRANGEMENTS
CMS Energy, Consumers, and certain of their subsidiaries also enter into various arrangements in the normal course of business to facilitate commercial transactions with third parties. These arrangements include indemnities, surety bonds, letters of credit, and financial and performance guarantees. Indemnities are usually agreements to reimburse a counterparty that may incur losses due to outside claims or breach of contract terms. The maximum payment that could be required under a number of these indemnity obligations is not estimable; the maximum obligation under indemnities for which such amounts were estimable was $512$482 million at June 30, 2012.2013. While CMS Energy and Consumers believe it is unlikely that they will incur any material losses related to indemnities they have not recorded as liabilities, they cannot predict the impact of these contingent obligations on their liquidity and financial condition. For additional details on these and other guarantee arrangements, see Note 3:2, Contingencies and Commitments – Guarantees.
OUTLOOK
Several business trends and uncertainties may affect CMS Energy’s and Consumers’ financial condition and results of operations. These trends and uncertainties could have a material impact on CMS Energy’s and Consumers’ consolidated income, cash flows, or financial position. For additional details regarding these and other uncertainties, see Forward-Looking Statements and Information; Note 3:2, Contingencies and Commitments; and Part II – Item 1A. Risk Factors.
CCONSUMERSELECTRICUTILITYBUSINESSOUTLOOKANDUNCERTAINTIES
Balanced Energy Initiative: Consumers’ balanced Consumers continues to experience increasing demand for electricity due to Michigan’s recovering economy and increased use of air conditioning, consumer electronics, and other electric devices, offset partially by the predicted effects of energy initiative isefficiency and conservation. In July 2012, customers set a comprehensive energy resource plan designed to meet the short-term and long-term electricity needsnew all-time peak demand record of its customers through:9,006 MW.
expanded use of renewable energy;
development of new power plants;
power or generating asset purchases to complement existing generating sources;
continued operation or upgrade of existing units; and
potential retirement or mothballing of older generating units.
In December 2011, Consumers formally canceled its plans to build an 830-MW coal-fueled plant at its Karn/Weadock generating complex. This decision reflects present and anticipated market conditions, new environmental standards, and Consumers’ expectations of the generation sources that will provide the best energy value to customers. Consumers also plans to mothball seven of its smaller coal-fueled units in 2015.for a period of three years. In June 2013, MISO approved Consumers’ applications to delay the mothballing of the units by one year, to 2016. Consumers will continue to evaluate its options for the plants, which include:
·installing more environmental equipment on the units to reduce emissions further in order to meet new environmental standards and continue to operate the units;
·seeking a further extension of compliance deadlines for new environmental standards;
·converting the units to natural gas instead of coal;
·decommissioning the units; andor
·a combination of these three options, depending on customer needs and market conditions.
With the potential suspension of these plants’ operations and the potential tightening of the MISO capacity market, Consumers could experience a shortfall in generation capacity of up to 1,500 MW in 2016. In order to address future capacity requirements and growing electric demand in Michigan, Consumers updated its balanced energy initiative, a comprehensive energy resource plan designed to meet the short-term and long-term electricity needs of its customers through:
·energy efficiency;
·demand management;
·expanded use of renewable energy;
·development of new power plants;
·power or generating asset purchases to complement existing generating sources; and
·continued operation or upgrade of existing units.
25
Table of Contents
In December 2012, Consumers announced plans to build a 700-MW gas-fueled electric generating plant at its Thetford complex in Genesee County, Michigan and filed an air permit application with the MDEQ for the proposed plant. In July 2013, Consumers filed for approval of a certificate of necessity with the MPSC, as allowed under the 2008 Energy Law. Construction of the plant, at an estimated cost of $750 million, is contingent upon obtaining the certificate of necessity and environmental permits. Consumers expects the plant to be operational in 2017.
Renewable Energy Plan: Consumers’ renewable energy plan details how Consumers will meet REC and capacity standards prescribed by the 2008 Energy Law. This law requires Consumers to obtainuse RECs in an amount equal to at least ten percent of its electric sales volume (estimated to be 3.53.3 million RECs annually) by 2015.in 2015 and each year thereafter. RECs represent proof that the associated electricity was generated from a renewable energy resource. Under its renewable energy plan, Consumers expects to meet its renewable energy requirement each year with a combination of newly generated RECs and previously generated RECs carried over from prior years.
The 2008 Energy Law also requires Consumers to obtain 500 MW of new capacity from renewable energy resources by the end of 2015, either through generation resources owned by Consumers or through agreements to purchase capacity from other parties. To meet its renewable capacity requirements, Consumers expects to add more than 500 MW of owned or contracted renewable capacity by 2015.capacity. Through June 2012,2013, Consumers has contracted for the purchase of 297302 MW of nameplate capacity from renewable energy suppliers whichand owns 100 MW of nameplate capacity at its recently constructed Lake Winds® Energy Park. The combination of the contracted and owned capacity represents 5981 percent of the 2015 renewable capacity requirement.
In November 2011, Consumers began constructionexpects to meet the balance of Lakethe requirement through the completion of its Cross Winds® Energy Park, a 100-MW wind park in Mason County, Michigan. Consumers expects the wind park to be operational in late 2012. Consumers will continue development of Cross Winds® Energy Park, its 150-MW105-MW wind park in Tuscola County, Michigan, scheduledwhich is expected to begin operations in late 2014. In June 2013, Consumers entered into a contract to purchase wind turbine generators for operation by late 2015, as well as seek other opportunitiesthe construction of the Cross Winds® Energy Park.
The extension of federal tax credits for wind generation development in supportprojects for which construction begins prior to December 31, 2013 could reduce significantly the cost of meeting the renewable requirements of the renewable capacity standards.2008 Energy Law. As a result, Consumers has accelerated the construction of Cross Winds® Energy Park and plans to begin construction in late 2013. Consumers expects to meetqualify for $100 million to $120 million of federal production tax credits associated with the Cross Winds® Energy Park. These cost savings, which will be based on the wind project’s production over its 2015first ten years of operation, will be passed on to customers through a reduced renewable capacity requirement withenergy surcharge or through a combination of owned and contracted renewable capacity.reduction in PSCR costs.
In January 2012, a ballot initiative was filed proposingEnergy Optimization Plan: The 2008 Energy Law requires Consumers to amend the Michigan Constitutionachieve energy savings equivalent to require Michigan utilities to obtainannual sales reduction targets through at least 252015. The targets increase annually, with the goal of achieving a six percent reduction in customers’ electricity use and a four percent reduction in customers’ natural gas use by December 31, 2015. Under its energy optimization plan, Consumers provides its customers with incentives to reduce usage by offering energy audits, rebates and discounts on purchases of theirhighly efficient appliances, and other incentives and programs. Consumers estimates that, through its gas and electric energy from clean renewableoptimization programs, its customers realized $184 million in energy sources such as wind, solar, biomass, and hydropower by 2025. The proposed amendment would also limit how much utilities could charge customers for the cost of complying with this requirement. If this ballot initiative is certified by the State Board of Canvassers, Michigan voters will vote on the proposal in the November 2012 general election.savings during 2012.
Electric Customer Deliveries and Revenue: Consumers’ electric customer deliveries are largely dependent on Michigan’s economy, which has suffered from economic and financial instability in the automotive and real estate sectors. sectors in recent years.
Consumers believesexpects weather-adjusted electric deliveries to decrease in 2013 by three percent compared with 2012. Consumers’ outlook for 2013 includes reduced deliveries to its largest customer, which produces energy-related and computer components. Consumers has a long-term contract with this customer to provide electricity at a discounted rate for economic development purposes. Excluding this
26
Table of Contents
customer, Consumers expects weather-adjusted electric deliveries in 2013 to remain stable compared with 2012. This outlook reflects Consumers’ belief that economic conditions in Michigan are improving, and expects weather-adjusted electric deliveries to increase in 2012 by two percent compared with 2011.improving.
Over the next five years, Consumers expects average electric delivery growth of about one0.5 to 1.0 percent annually over the next five years.annually. This increase reflects growth in electric demand, offset partially by the predicted effects of energy efficiency programs and appliance efficiency standards. Actual deliveriesdelivery levels will depend on:
·energy conservation measures and results of energy efficiency programs;
·fluctuations in weather; and
changes in·Michigan economic conditions, including utilization, expansion, or contraction of manufacturing facilities, population trends, and housing activity.
Electric ROA: The Customer Choice Act allows all of Consumers’ electric customers to buy electric generation service from Consumers or from an alternative electric supplier. The 2008 Energy Law revised the Customer Choice Act by limiting alternative electric supply to ten percent of Consumers’ weather-adjusted retail sales of the preceding calendar year. At June 30, 2012,2013, electric deliveries under the ROA program were at the ten percent limit and alternative electric suppliers were providing 787789 MW of generation service to ROA customers. Based on 2011 weather-adjusted retail sales,Of Consumers’ 1.8 million electric customers, 308 customers purchased electric generation service under the ROA program. Consumers expects 20122013 electric deliveries under the ROA program to be at a similar level to 2011.2012.
In March 2012,February 2013, a bill was introduced to the Michigan Senate and House of Representatives that, upon enactment,if enacted, would revise the 2008 Energy Law and allow customers then on the ROA program waiting list to switch their service to an alternative electric supplier. Presently, the proportion of Consumers’ electric deliveries under the ROA program and on the ROA waiting list is 2325 percent. The revisionbill also proposes an increase in the cap of six percentage points per year from 20132014 through 2015.
In June 2012, a bill was introduced to the Michigan Senate and House of Representatives that would likely phase out electric choice and return the state’s electric industry to full regulation. This legislation was meant to counterpoint the bill introduced in March 2012.2016. Consumers is unable to predict the outcome of these twothis legislative proposals.proposal. The Michigan legislature also has conducted hearings on the subject of energy competition. If a proposal to deregulate electric generation in Michigan were enacted, it could have a material adverse effect on Consumers’ financial results and operations.
Electric Transmission:In July 2011, FERC issued an order in a rulemaking proceeding concerning regional electric transmission planning and cost allocations. In August 2011, Consumers and several other electric utilities filed a joint petition seeking clarification/rehearing of FERC’s July order and opposing the allocation methodology. In May 2012, FERC issued an order denying the utilities’following FERC’s denial of their requests for clarification/rehearing, requests on this order. Following this denial, Consumers and several other electric utilities filed a petition for review of FERC’s order with the U. S.U.S. Court of Appeals. In May 2013, Consumers, along with other electric utilities, filed briefs in this matter.
In a related matter, in 2010, MISO filed and FERC approved a tariff revision proposing a cost allocation methodology for a new category of transmission projects. Under this tariff revision, the cost of these new transmission projects will be spread proportionally across the Midwest Energy Market. Consumers believes that Michigan customers will bear additional costs under MISO’s tariff without receiving comparable benefits from these projects. In December 2011, Consumers, along with the Michigan Attorney General, ABATE, Detroit Edison, the Michigan MunicipalDTE Electric, Association, and the Michigan Public Power Agency,other parties, filed a petition for review of FERC’s order with the U.S. Court of Appeals for the Seventh Circuit following FERC’s denial of their request for rehearing opposing the allocation methodology in the MISO tariff revision. In June 2013, the Court of Appeals issued an opinion largely affirming FERC’s orders regarding the cost allocation methodology. Consumers is reviewing this opinion. Regardless of the final outcome of this appeal,these appeals, Consumers expects to continue to recover transmission expenses, including those associated with the MISO tariff revision, through the PSCR process.
In 2012, ReliabilityFirst Corporation informed Consumers that Consumers may not be properly registered to meet certain NERC electric reliability standards. Consumers is assessing its registration status, taking into consideration FERC’s December 2012 order on the definition of a bulk electric system. In light of
27
Table of Contents
this order, Consumers is reviewing the status of its electric distribution assets under FERC’s modified test and also reviewing prior correspondence from ReliabilityFirst Corporation as to the potential classification of its assets as within a bulk electric system for reliability purposes. Consumers believes that it would recover any incremental costs that it might incur in connection with the resolution of any issues in this area.
Governor’s Energy Initiative: Michigan’s governor has instituted a process pursuant to which a series of reports are to be completed in December 2013 addressing energy efficiency, renewable energy, the electricity market and customer choice, and other subjects. The process is designed to help the governor and other lawmakers determine the state’s next steps regarding energy policies. A series of public hearings took place in 2013 to gather input. Consumers has participated actively in this process but cannot predict its outcome.
Electric Rate Matters:Rate matters are critical to Consumers’ electric utility business. For additional details on Consumers’ electric rate matters, see Note 4:1, Regulatory Matters.
Future Electric Rate Case: Consumers has undertaken several initiatives to reduce costs through a voluntary separation plan in 2012, accelerated pension funding, employee and retiree health-care cost sharing, negotiated labor agreements, information system efficiencies, and productivity improvement programs. These initiatives, together with Consumers’ plans to accelerate further cost reductions, should allow Consumers to avoid increasing electric base rates through 2014. Consumers’ ability to avoid a base rate increase is dependent on MPSC approval of certain applications yet to be filed. Consumers may also reconsider this expectation should its assumptions change regarding the economy or other matters.
Electric Environmental Estimates: Consumers’ operations are subject to various state and federal environmental laws and regulations. Consumers estimates that it will incur expenditures of $1.5$1.1 billion from 20122013 through 2018 to continue to comply with the Clean Air Act, Clean Water Act, and numerous state and federal environmental regulations. Consumers expects to recover these costs in customer rates, but cannot guarantee this result. Consumers’ primary environmental compliance focus includes, but is not limited to, the following matters:
Air Quality: In July 2011, the EPA released CSAPR, a final replacement rule for CAIR, which requires Michigan and 27 other states to improve air quality by reducing power plant emissions that, according to EPA computer models, contribute to ground-level ozone and fine particle pollution in other downwind states. This rule had mandated emission reductions beginning inIn 2012, which CMS Energy and Consumers were prepared to meet through fuel blend changes. In December 2011, due to litigation surrounding CSAPR, the U.S. Court of Appeals for the D.C. Circuit issued a stay ofvoided CSAPR statingand held that CAIR would remain in place whileuntil the court considersEPA promulgated a new rule. After a request by the issues. The court heard oral arguments in April 2012, but there is no timelineEPA for a rehearing was denied, the EPA and other parties sought an appeal to the U.S. Supreme Court, which was granted in June 2013. A decision or order fromby the court.Supreme Court is not expected until 2014.
In February 2012, the EPA published its final MACT emission standards for electric generating units, based on Section 112 of the Clean Air Act, calling the final rule MATS. Under MATS, all of Consumers’ existing coal-fueled electric generating units are required to add additional controls for hazardous air pollutants. Generally, existingExisting units, unless granted extensions, must meet the standards within threeby mid-April 2015. Consumers has received from the MDEQ a one-year extension for MATS and the Michigan Mercury Rule for ten of its coal-fueled units, allowing them to four years of issuance of the final rule.run as presently configured until April 2016.
Presently, Consumers’ strategy to comply with air quality regulations, including CAIR CSAPR, and MATS, involves the installation of emission control equipment at some facilities and the suspension of operations at others; however, Consumers continues to evaluate CSAPR and MATSthese rules in conjunction with other EPA rulemakings, litigation, and congressional action. This evaluation could result in:
additional or accelerated·changes in environmental compliance costs related to Consumers’ coal-fueled power plants;
·a change in the fuel mix at coal-fueled and oil-fueled power plants;
28
·the retirement, mothballing, or repowering with an alternative fuel of some or all of Consumers’ older, smaller generating units.
The MDEQ renewed and issued the B.C. Cobb Renewable Operating Permit for the B.C. Cobb plant in August 2011 after an extensive review and a public comment period. In October 2011, the Sierra Club and the Natural Resources Defense Council filed a petition with the EPA to object to the MDEQ’s issuance of the state Renewable Operating Permit, alleging that the facility is not in compliance with certain provisions of the Clean Air Act, including NSR and Title V. Consumers responded to these allegations in December 2011. The EPA could either deny the petition outright or grant the petition and remand the matter to the MDEQ for further action. The Sierra Club or the Natural Resources Defense Council could also file suit in federal district court seeking EPA action on the petition. Consumers believes these claims are baseless, but is unable to predict the outcome of this petition.
Fine Particulate Matter: In December 2012, the EPA finalized a rule that strengthens the air quality standard for fine particulate matter. Consumers expects short-term impacts to be limited, but this new standard could give rise to air quality concerns in states downwind of Michigan and put pressure on Michigan and other Midwestern states to reduce emissions further. Given its present strategy for CAIR and MATS compliance, however, Consumers will already be achieving significant reductions in emissions that contribute to the formation of fine particulate matter.
Greenhouse Gases: In the recent past, there have been numerous legislative and regulatory initiatives at the state, regional, and national levels that involve the regulation of greenhouse gases. Consumers continues to monitor and comment on these initiatives and also followsto follow litigation involving greenhouse gases. Consumers believes Congress may eventually pass greenhouse gas legislation, but is unable to predict the form and timing of any final legislation.
In 2010, the EPA released its Prevention of Significant Deterioration and Title V Greenhouse Gas Tailoring Rule, which sets greenhouse gas emissions limits that define when permits are required for new and existing industrial facilities under NSR PSD and Title V Renewable Operating Permit programs. Numerous parties have challenged this rule in the U.S. Court of Appeals for the D.C. Circuit. In June 2012, the U.S. Court of Appeals for the D.C. Circuit upheld the Tailoring Rule and dismissed challenges to it and to three other greenhouse gas rules. Consumers does not expect to incur significant expenditures to comply with this rule.
In March 2012, the EPA released its proposed “Standards of Performance for Greenhouse Gas Emissions for New Stationary Sources: Electric Utility Generating Units” pursuant to Section 111 of the Clean Air Act. This proposed rule appliesapplied only to new fossil-fuel-fired steam electric generating units. The standardstandards would requirehave required that carbon dioxide emissions not exceed those of a modern, efficient natural gasgas-fueled combined-cycle electric generating plant, regardless of fuel type. Consumers submitted comments onIn June 2013, President Obama directed the proposedEPA to issue a revised proposal addressing new fossil-fuel-fired steam electric generating units by September 20, 2013, and to finalize the rule in June 2012.a timely fashion. The EPA is also expectedwas further directed to propose emissions guidelines within the next year for states to regulate greenhouse gas emissions fromaddress existing, modified, and reconstructed fossil-fuel-fired steam electric generating units under Section 111(d)with proposed standards, regulations, or guidelines to be completed by June 1, 2014, and final standards, regulations, or guidelines to be completed by June 1, 2015. Subsequent state implementation plans are due by June 30, 2016. Consumers believes that its balanced energy initiative, its present carbon reduction target, and its emphasis on supply diversity will position it favorably to deal with the impact of carbon regulation, but cannot predict the Clean Air Act. Under the expected schedule, states will be required to submit plans to the EPA within nine monthsnature or outcome of issuance of the final rule and guidelines.these proposals. Consumers will continue to monitor regulatory activity regarding any proposed regulations involving new source performance standards.greenhouse gas emissions standards that may affect electric generating units.
Litigation, as well as federal laws, EPA regulations regarding greenhouse gases, or similar treaties, state laws, or rules, if enacted or ratified, could require Consumers to replace equipment, install additional emission control equipment, purchase emission allowances, curtail operations, arrange for alternative sources of supply, or take other steps to manage or lower the emission of greenhouse gases. Although associated capital or operating costs relating to greenhouse gas regulation or legislation could be material and cost recovery cannot be assured, Consumers expects to recover these costs and capital expenditures in rates consistent with the recovery of other reasonable costs of complying with environmental laws and regulations.
29
Table of Contents
CCBs:CCRs: In June 2010, the EPA proposed rules regulating CCBs,CCRs, such as coal ash, under the Resource Conservation and Recovery Act. Recent communications from the EPA stress the need to coordinate CCR rulemaking guidelines for steam electric generating plants under the Clean Water Act. A final CCR rule could be issued in 2014. Michigan already regulates CCBsCCRs as low-hazard industrial waste. The EPA proposed a range of alternatives for regulating CCBs,CCRs, including regulation as either a nonhazardousnon-hazardous waste or a hazardous waste. If coal ash were regulated as a hazardous waste, Consumers would likely cease the beneficial reuse of this product, which would result in a significant increase in the amount of coal ash requiring costly disposal. Additionally, if the cost of upgrading existing coal ash disposal areas to meet hazardous waste landfill standards were to become economically prohibitive, existing coal ash disposal areas could close, requiring Consumers to find costly alternative arrangements for disposal. Consumers is unable to predict the impacts from this wide range of possible outcomes, but significant expenditures are likely.
Water:In March 2011, the EPA issued a proposed rule to regulate existing electric generating plant cooling water intake systems under Section 316(b) of the Clean Water Act aimed at reducing alleged harmful impacts on fish and shellfish. Consumers continues to evaluate this proposed rule and its potential impacts on Consumers’ electric generating plants. A final rule is expected in late 2012. ConsumersNovember 2013. The EPA also expects the EPA to proposeproposed new regulations in November 2012 for wastewater discharges from electric generating plantsJune 2013 that willmay require physical and/or chemical treatment facilities for all wastewater.wastewater discharges from electric generating plants. A final rule is expected in 2014.
PCBs:In April 2010, the EPA issued an Advance Notice of Proposed Rulemaking, indicating that it is considering a variety of regulatory actions with respect to PCBs. One proposal aimsapproach would aim to phase out equipment containing PCBs by 2025. Another proposal eliminatesapproach would eliminate an exemption for small equipment containing PCBs. To comply with this proposed rule,any such regulatory actions, Consumers could incur substantial costs associated with existing electrical equipment potentially containing PCBs. A proposalproposed rule is expected in late 2012.2013.
Other electric environmental matters could have a major impact on Consumers’ outlook. For additional details on other electric environmental matters, see Note 3:2, Contingencies and Commitments – Consumers Electric Utility Contingencies – Electric Environmental Matters.
CCONSUMERSGASUTILITYBUSINESSOUTLOOKANDUNCERTAINTIES
Gas Deliveries: Consumers expects weather-adjusted gas deliveries in 20122013 to declinegrow by oneabout three percent compared with 2011.2012. Over the next five years, Consumers expects average gas deliveries to remain stable. This outlook reflects modest growth in gas demand offset by the predicted effects of energy efficiency and conservation. Actual delivery levels from year to year may vary from this trend due to:
·fluctuations in weather;
·use by independent power producers;
·availability and development of renewable energy sources;
·Michigan economic conditions, including population trends and housing activity;
·the price of competing energy sources or fuels; and
·energy efficiency and conservation impacts.
Gas Transmission: In May 2013, the MPSC approved Consumers’ application to build a 24-mile, 36-inch natural gas pipeline in St. Joseph and Branch Counties, Michigan. Consumers expects to spend about $120 million for this project. Construction of the pipeline is contingent upon obtaining environmental permits. Consumers expects the pipeline to be operational by the end of 2014.
Gas Transportation: In July 2012, Trunkline filed a proposal with FERC to cease transporting natural gas through one of its two main transmission pipelines serving Michigan. More than 60 percent of the
30
Table of Contents
natural gas supplied to Consumers’ gas customers is delivered by Trunkline’s two main transmission pipelines. In August 2012, Consumers filed a motion with FERC to protest against the proposed abandonment on the grounds that it would negatively impact customers and that it could hamper the development of gas-fueled electric generation in Michigan. Michigan’s governor, the MPSC, and various other parties have also filed protests with FERC. If Trunkline’s proposal is granted, the abandonment could result in higher gas prices and reduced availability for Michigan gas customers.
Gas Rate Matters: Rate matters are critical to Consumers’ gas utility business. For additional details on Consumers’ gas rate matters, see Note 4:1, Regulatory Matters.
Pending Gas Rate Case: In February 2013, Consumers filed an application with the MPSC seeking an annual rate increase of $49 million, based on a 10.5 percent authorized return on equity. The filing requested authority to recover new investments in customer reliability, deliverability, safety, and system enhancements, and sought approval of several rate adjustment mechanisms. Subsequent to this filing, Consumers’ projection of non-fuel costs decreased. As a result, in June 2013, Consumers filed a petition with the MPSC to close the docket or, alternatively, to suspend and extend indefinitely the schedule in this case. The MPSC approved Consumers’ petition to suspend and indefinitely extend the schedule. Consumers plans to file a new and amended case containing more recent historical data and an updated projected test year, primarily for rate relief associated with projected capital expenditures.
Future Gas Rate Case:Consumers has undertaken several initiatives to reduce costs through a voluntary separation plan in 2012, accelerated pension funding, employee and retiree health-care cost sharing, negotiated labor agreements, information system efficiencies, and productivity improvement programs. These initiatives, together with Consumers’ plans to accelerate further cost reductions, should allow Consumers to avoid increasing gas base rates through 2014. Consumers’ ability to avoid a base rate increase is dependent on MPSC approval of certain applications yet to be filed. Consumers may also reconsider this expectation should its assumptions change regarding the economy or other matters.
Gas Pipeline Safety: In January 2012, President Obama signed the Pipeline Safety, Regulatory Certainty, and Job Creation Act of 2011. The law reauthorizes existing federal pipeline safety programs of the Pipeline and Hazardous Materials Safety Administration through 2015 and it contains provisions mandating:
·an increase in the maximum fine for safety violations to $2 million;
·an increase in the number of pipeline inspectors;
·a study regarding application of integrity management requirements outside of “high consequence areas;”
·a survey regarding existing plans for safe management and replacement of cast iron pipelines;
·prescribed notification and on-site incident response times;
·installation of automatic or remotely controlled shut-off valves on new or replaced pipelines where feasible;
verification of·historical design and construction documentation to verify maximum allowable operating pressurepressures; and
·establishment of pipelines in populated areas; and
pressurenew regulations for testing (or equivalent)(pressure tests or equivalent methods) of previously untested pipelines.pipelines in high-consequence areas.
Consumers continues to comply with laws and regulations governing natural gas pipeline safety. These laws and regulations could cause Consumers to incur significant additional costs related to its natural gas pipeline safety programs. Consumers expects that it would be able to recover the costs in rates, consistent with the recovery of other reasonable costs of complying with laws and regulations.
MPSC Investigations: The MPSC is presently conducting investigations into two natural gas explosions that occurred in Consumers’ gas service territory, in Wayne, Michigan and Royal Oak, Michigan. Consumers does not expect the outcome of these investigations to have a material adverse impact on its liquidity, financial condition, or results of operations, but cannot predict the financial impact or outcome.
Gas Environmental Estimates: Consumers expects to incur response activity costs at a number of sites, including 23 former MGP sites. For additional details, see Note 3:2, Contingencies and Commitments – Consumers Gas Utility Contingencies – Gas Environmental Matters.
CONSUMERS OTHER OUTLOOKAND UNCERTAINTIES31
Table of Contents
CONSUMERS OTHER OUTLOOK AND UNCERTAINTIES
Smart Grid:Energy: Consumers’ grid modernization effort continues, withcontinues. In August 2012, Consumers began installing smart meters in Muskegon County, Michigan. One of the selectionfunctions of a vendor that will provide smart electric meters and a cellular communications network to allow Consumers to transmit and receive electric usage information from customers’ homes and businesses. Smart meters are designedis to allow customers to monitor and manage their energy usage, which should help reduce demand during critical peak times, resulting in lower peak capacity requirements. The installation of smart meters should also provide for both operational benefitsand customer benefits. As of June 30, 2013, Consumers had upgraded over 90,000 electric residential and small business customers in western Michigan to Consumers.smart meters. Consumers intendsis able to use a phased implementation approach, beginning deployment inread these smart meters remotely; further functionality will continue to be added through mid-2015. Consumers expects to have installed about 400,000 smart meters throughout western Michigan by the second halfend of 2012 and continuing through 2019.2014. Consumers also plans to install communication modules on gas meters in areas where Consumers provides both electricity and natural gas to customers.
ENTERPRISES OUTLOOK AND UNCERTAINTIES
ENTERPRISES OUTLOOKAND UNCERTAINTIES
The primary focus with respect to CMS Energy’s remaining non-utility businesses is to optimize cash flow and maximize the value of their assets.
Trends, uncertainties, and other matters that could have a material impact on CMS Energy’s consolidated income, cash flows, or financial position include:
·indemnity and environmental remediation obligations at Bay Harbor;
·obligations related to a tax claim from the government of Equatorial Guinea;
·the outcome of certain legal proceedings;
·impacts of declines in electricity prices on the profitability of the enterprises segment’s generating units;
·representations, warranties, and indemnities provided by CMS Energy or its subsidiaries in connection with previous sales of assets;
·changes in commodity prices and interest rates on certain derivative contracts that do not qualify for hedge accounting and must be marked to market through earnings;
·changes in various environmental laws, regulations, principles, or practices, or in their interpretation; and
·economic conditions in Michigan, including population trends and housing activity.
For additional details regarding the enterprises segment’s uncertainties, see Note 3:2, Contingencies and Commitments.
OTHER OTHER OUTLOOKANDUNCERTAINTIES
EnerBank:EnerBank, a wholly owned subsidiary of CMS Capital, is a Utah state-chartered, FDIC-insured industrial bank providing unsecured home improvement loans. EnerBank represented two percent of CMS Energy’s net assets at June 30, 2012,2013, and fivefour percent of CMS Energy’s net income available to common stockholders for the six months ended June 30, 2012.2013. The carrying value of EnerBank’s loan portfolio was $486$543 million at June 30, 2012.2013. Its loan portfolio was funded primarily by deposit liabilities of $458$499 million. Twelve-monthThe twelve-month rolling average default ratesrate on loans held by EnerBank have declined from 1.1has remained stable at 0.7 percent at June 30, 2011 to 0.8 percent at June 30, 2012.2013. CMS Energy is required both by law and by contract to provide financial support, including infusing additional capital, to ensure that EnerBank satisfies mandated capital requirements and has sufficient liquidity to operate. Presently,With its self-funding plan, EnerBank meets or exceeds allhas exceeded these requirements historically and exceeded them as of its capital requirements.
Voluntary Separation Program: In April 2012, CMS Energy announced a voluntary separation program for its salaried employees. The separation date for the majority of employees who participated in the program was July 1, 2012. Management approved 232 employees for early separation and CMS Energy recorded a charge of $12 million related to this program during the three months ended June 30, 2012.2013.
32
Table of Contents
Litigation: CMS Energy, Consumers, and certain of their subsidiaries are named as parties in various litigation matters, as well as in administrative proceedings before various courts and governmental agencies, arising in the ordinary course of business. For additional details regarding these and other legal matters, see Note 3:1, Regulatory Matters and Note 2, Contingencies and Commitments and Note 4: Regulatory Matters.Commitments.
NEW ACCOUNTING STANDARDS
For details regarding the implementation of
There are no new accounting standards during the six months ended June 30, 2012, see Note 1: New Accounting Standards.
issued but not yet effective that are expected to have a material impact on CMS Energy’s or Consumers’ consolidated financial statements.(This page intentionally left blank)
33
Table of Contents
CMS Energy Corporation
Consolidated Statements of Income
(Unaudited)
| | | | | | In Millions |
| | Three Months Ended | | Six Months Ended |
June 30 | | 2013 | | 2012 | | 2013 | | 2012 |
| | | | | | | | |
Operating Revenue | | $ | 1,406 | | $ | 1,333 | | $ | 3,385 | | $ | 3,076 |
| | | | | | | | |
Operating Expenses | | | | | | | | |
Fuel for electric generation | | 147 | | 126 | | 301 | | 256 |
Purchased and interchange power | | 347 | | 334 | | 680 | | 651 |
Purchased power – related parties | | 23 | | 20 | | 46 | | 42 |
Cost of gas sold | | 166 | | 133 | | 773 | | 683 |
Maintenance and other operating expenses | | 304 | | 282 | | 586 | | 577 |
Depreciation and amortization | | 137 | | 130 | | 318 | | 302 |
General taxes | | 50 | | 48 | | 120 | | 117 |
Total operating expenses | | 1,174 | | 1,073 | | 2,824 | | 2,628 |
| | | | | | | | |
Operating Income | | 232 | | 260 | | 561 | | 448 |
| | | | | | | | |
Other Income (Expense) | | | | | | | | |
Interest income | | 2 | | 1 | | 2 | | 2 |
Allowance for equity funds used during construction | | 1 | | 2 | | 4 | | 4 |
Income from equity method investees | | 3 | | 3 | | 8 | | 8 |
Other income | | 2 | | 3 | | 5 | | 6 |
Other expense | | (3) | | (3) | | (6) | | (5) |
Total other income | | 5 | | 6 | | 13 | | 15 |
| | | | | | | | |
Interest Charges | | | | | | | | |
Interest on long-term debt | | 99 | | 94 | | 193 | | 188 |
Other interest expense | | 4 | | 5 | | 9 | | 11 |
Allowance for borrowed funds used during construction | | (1) | | (1) | | (2) | | (2) |
Total interest charges | | 102 | | 98 | | 200 | | 197 |
| | | | | | | | |
Income Before Income Taxes | | 135 | | 168 | | 374 | | 266 |
Income Tax Expense | | 54 | | 67 | | 149 | | 105 |
| | | | | | | | |
Income From Continuing Operations | | 81 | | 101 | | 225 | | 161 |
Income From Discontinued Operations, Net
of Tax of $-, $-, $-, and $4 | | - | | - | | - | | 7 |
| | | | | | | | |
Net Income | | 81 | | 101 | | 225 | | 168 |
Income Attributable to Noncontrolling Interests | | 1 | | 1 | | 1 | | 1 |
| | | | | | | | |
Net Income Available to Common Stockholders | | $ | 80 | | $ | 100 | | $ | 224 | | $ | 167 |
(Unaudited)34
Table of Contents
| | | | | | | | | | | | | | | | | | |
| | | | | | | | | | | | | | In Millions | |
| | | Three Months Ended | | | | | Six Months Ended | |
| June 30 | | 2012 | | | 2011 | | | | | 2012 | | | 2011 | |
| | | | | |
Operating Revenue | | | $ 1,333 | | | | $ 1,364 | | | | | | $ 3,076 | | | | $ 3,419 | |
| | | | | |
Operating Expenses | | | | | | | | | | | | | | | | | | |
Fuel for electric generation | | | 126 | | | | 153 | | | | | | 256 | | | | 305 | |
Purchased and interchange power | | | 334 | | | | 303 | | | | | | 651 | | | | 603 | |
Purchased power – related parties | | | 20 | | | | 20 | | | | | | 42 | | | | 41 | |
Cost of gas sold | | | 133 | | | | 220 | | | | | | 683 | | | | 988 | |
Maintenance and other operating expenses | | | 282 | | | | 288 | | | | | | 577 | | | | 567 | |
Depreciation and amortization | | | 130 | | | | 122 | | | | | | 302 | | | | 284 | |
General taxes | | | 48 | | | | 51 | | | | | | 117 | | | | 118 | |
Total operating expenses | | | 1,073 | | | | 1,157 | | | | | | 2,628 | | | | 2,906 | |
| | | | | |
Operating Income | | | 260 | | | | 207 | | | | | | 448 | | | | 513 | |
| | | | | |
Other Income (Expense) | | | | | | | | | | | | | | | | | | |
Interest income | | | 1 | | | | 2 | | | | | | 2 | | | | 4 | |
Allowance for equity funds used during construction | | | 2 | | | | 2 | | | | | | 4 | | | | 3 | |
Income from equity method investees | | | 3 | | | | 2 | | | | | | 8 | | | | 6 | |
Other income | | | 3 | | | | 5 | | | | | | 6 | | | | 9 | |
Other expense | | | (3 | ) | | | (3 | ) | | | | | (5 | ) | | | (5 | ) |
Total other income | | | 6 | | | | 8 | | | | | | 15 | | | | 17 | |
| | | | | |
Interest Charges | | | | | | | | | | | | | | | | | | |
Interest on long-term debt | | | 94 | | | | 99 | | | | | | 188 | | | | 199 | |
Other interest expense | | | 5 | | | | 6 | | | | | | 11 | | | | 12 | |
Allowance for borrowed funds used during construction | | | (1 | ) | | | (1 | ) | | | | | (2 | ) | | | (2 | ) |
Total interest charges | | | 98 | | | | 104 | | | | | | 197 | | | | 209 | |
| | | | | |
Income Before Income Taxes | | | 168 | | | | 111 | | | | | | 266 | | | | 321 | |
Income Tax Expense | | | 67 | | | | 10 | | | | | | 105 | | | | 87 | |
| | | | | |
Income From Continuing Operations | | | 101 | | | | 101 | | | | | | 161 | | | | 234 | |
Income From Discontinued Operations, Net of Tax of $-, $-, $4, and $1 | | | - | | | | - | | | | | | 7 | | | | 2 | |
| | | | | |
Net Income | | | 101 | | | | 101 | | | | | | 168 | | | | 236 | |
Income Attributable to Noncontrolling Interests | | | 1 | | | | 1 | | | | | | 1 | | | | 1 | |
| | | | | |
Net Income Available to Common Stockholders | | | $ 100 | | | | $ 100 | | | | | | $ 167 | | | | $ 235 | |
| | |
| | | | In Millions, Except Per Share Amounts |
| | Three Months Ended | | Six Months Ended |
June 30 | | 2013 | | 2012 | | 2013 | | 2012 |
| | | | | | | | |
Net Income Attributable to Common Stockholders | | | | | | | | |
Amounts attributable to continuing operations | | $ | 80 | | $ | 100 | | $ | 224 | | $ | 160 |
Amounts attributable to discontinued operations | | - | | - | | - | | 7 |
Net income available to common stockholders | | $ | 80 | | $ | 100 | | $ | 224 | | $ | 167 |
| | | | | | | | |
Income Attributable to Noncontrolling Interests | | | | | | | | |
Amounts attributable to continuing operations | | $ | 1 | | $ | 1 | | $ | 1 | | $ | 1 |
Amounts attributable to discontinued operations | | - | | - | | - | | - |
Income attributable to noncontrolling interests | | $ | 1 | | $ | 1 | | $ | 1 | | $ | 1 |
| | | | | | | | |
Basic Earnings Per Average Common Share | | | | | | | | |
Basic earnings from continuing operations | | $ | 0.30 | | $ | 0.38 | | $ | 0.85 | | $ | 0.61 |
Basic earnings from discontinued operations | | - | | - | | - | | 0.03 |
Basic earnings attributable to common stock | | $ | 0.30 | | $ | 0.38 | | $ | 0.85 | | $ | 0.64 |
| | | | | | | | |
Diluted Earnings Per Average Common Share | | | | | | | | |
Diluted earnings from continuing operations | | $ | 0.29 | | $ | 0.37 | | $ | 0.83 | | $ | 0.59 |
Diluted earnings from discontinued operations | | - | | - | | - | | 0.03 |
Diluted earnings attributable to common stock | | $ | 0.29 | | $ | 0.37 | | $ | 0.83 | | $ | 0.62 |
| | | | | | | | |
Dividends Declared Per Common Share | | $ | 0.255 | | $ | 0.24 | | $ | 0.51 | | $ | 0.48 |
| | | | | | | | | | | | | | | | |
| | | In Millions, Except Per Share Amounts | |
| |
| | | Three Months Ended | | | Six Months Ended | |
| June 30 | | 2012 | | | 2011 | | | 2012 | | | 2011 | |
| |
| | | | |
Net Income Attributable to Common Stockholders | | | | | | | | | | | | | | | | |
Amounts attributable to continuing operations | | | $ 100 | | | | $ 100 | | | | $ 160 | | | | $ 233 | |
Amounts attributable to discontinued operations | | | - | | | | - | | | | 7 | | | | 2 | |
| | | | |
Net income available to common stockholders | | | $ 100 | | | | $ 100 | | | | $ 167 | | | | $ 235 | |
| | | | |
| | | | |
Income Attributable to Noncontrolling Interests | | | | | | | | | | | | | | | | |
Amounts attributable to continuing operations | | | $ 1 | | | | $ 1 | | | | $ 1 | | | | $ 1 | |
Amounts attributable to discontinued operations | | | - | | | | - | | | | - | | | | - | |
| | | | |
Income attributable to noncontrolling interests | | | $ 1 | | | | $ 1 | | | | $ 1 | | | | $ 1 | |
| | | | |
| | | | |
Basic Earnings Per Average Common Share | | | | | | | | | | | | | | | | |
Basic earnings from continuing operations | | | $ 0.38 | | | | $ 0.40 | | | | $ 0.61 | | | | $ 0.93 | |
Basic earnings from discontinued operations | | | - | | | | - | | | | 0.03 | | | | 0.01 | |
| | | | |
Basic earnings attributable to common stock | | | $ 0.38 | | | | $ 0.40 | | | | $ 0.64 | | | | $ 0.94 | |
| | | | |
| | | | |
Diluted Earnings Per Average Common Share | | | | | | | | | | | | | | | | |
Diluted earnings from continuing operations | | | $ 0.37 | | | | $ 0.38 | | | | $ 0.59 | | | | $ 0.89 | |
Diluted earnings from discontinued operations | | | - | | | | - | | | | 0.03 | | | | 0.01 | |
| | | | |
Diluted earnings attributable to common stock | | | $ 0.37 | | | | $ 0.38 | | | | $ 0.62 | | | | $ 0.90 | |
| | | | |
| | | | |
Dividends Declared Per Common Share | | | $ 0.24 | | | | $ 0.21 | | | | $ 0.48 | | | | $ 0.42 | |
| |
The accompanying notes are an integral part of these statements.
35
Table of Contents
CMS Energy Corporation
Consolidated Statements of Comprehensive Income
(Unaudited)
| | | | | | | | | | | | | | | | | | | | |
| | | | | | | | | | | | | | | | In Millions | |
| | | | | Three Months Ended | | | | | Six Months Ended | |
| June 30 | | | | 2012 | | | 2011 | | | | | 2012 | | | 2011 | |
| | | | | | |
Net Income Attributable to CMS Energy | | | | | | | | | | | | | | | | | | | | |
Net income | | | | | $ 101 | | | | $ 101 | | | | | | $ 168 | | | | $ 236 | |
Income attributable to noncontrolling interests | | | | | 1 | | | | 1 | | | | | | 1 | | | | 1 | |
Net income attributable to CMS Energy | | | | | 100 | | | | 100 | | | | | | 167 | | | | 235 | |
| | | | | | |
Retirement Benefits Liability | | | | | | | | | | | | | | | | | | | | |
Retirement benefits liability adjustments, net of tax of $- for all periods presented | | | | | 1 | | | | 1 | | | | | | 2 | | | | 1 | |
| | | | | | |
Investments | | | | | | | | | | | | | | | | | | | | |
Unrealized gain on investments, net of tax of $- for all periods presented | | | | | 1 | | | | 1 | | | | | | 2 | | | | 1 | |
| | | | | | |
Other Comprehensive Income | | | | | 2 | | | | 2 | | | | | | 4 | | | | 2 | |
| | | | | | |
Total Comprehensive Income | | | | | $ 102 | | | | $ 102 | | | | | | $ 171 | | | | $ 237 | |
| | | | | | | | | |
| | In Millions |
| | Three Months Ended | | Six Months Ended |
June 30 | | 2013 | | 2012 | | 2013 | | 2012 |
| | | | | | | | |
Net Income | | $ | 81 | | $ | 101 | | $ | 225 | | $ | 168 |
| | | | | | | | |
Retirement Benefits Liability | | | | | | | | |
Retirement benefits liability adjustments, net
of tax of $1, $-, $1, and $- | | 1 | | 1 | | 2 | | 2 |
| | | | | | | | |
Investments | | | | | | | | |
Unrealized gain (loss) on investments, net of tax
of $- for all periods | | (3) | | 1 | | (3) | | 2 |
| | | | | | | | |
Other Comprehensive Income (Loss) | | (2) | | 2 | | (1) | | 4 |
| | | | | | | | |
Comprehensive Income | | | 79 | | | 103 | | | 224 | | | 172 |
| | | | | | | | |
Comprehensive Income Attributable to Noncontrolling Interests | | 1 | | 1 | | 1 | | 1 |
| | | | | | | | |
Comprehensive Income Attributable to CMS Energy | | $ | 78 | | $ | 102 | | $ | 223 | | $ | 171 |
The accompanying notes are an integral part of these statements.
36
Table of Contents
CMS Energy Corporation
Consolidated Statements of Cash Flows
(Unaudited)
| | | | | | | | | | | | In Millions |
| In Millions | | |
| Six Months Ended June 30 | | 2012 | | 2011 | | | 2013 | | 2012 |
| | | | | | |
Cash Flows from Operating Activities | | | | | | | | |
Net income | | $ | 168 | | | $ | 236 | | | $ | 225 | | $ | 168 |
Adjustments to reconcile net income to net cash provided by operating activities | | | | | | | | |
Depreciation and amortization | | | 302 | | | | 284 | | | 318 | | 302 |
Deferred income taxes and investment tax credit | | | 102 | | | | 74 | | | 135 | | 102 |
Postretirement benefits expense | | | 94 | | | | 83 | | | 95 | | 94 |
Other non-cash operating activities | | | 35 | | | | 39 | | | 32 | | 35 |
Postretirement benefits contributions | | | (37 | ) | | | (39 | ) | | (88) | | (37) |
Changes in other assets and liabilities | | | | | |
Decrease in accounts receivable, notes receivable, and accrued revenue | | | 146 | | | | 215 | | |
Decrease in accrued power supply revenue | | | - | | | | 15 | | |
Decrease in inventories | | | 135 | | | | 204 | | |
Increase in accounts payable | | | 10 | | | | 34 | | |
Decrease in accrued expenses | | | (82 | ) | | | (36 | ) | |
Decrease in other current and non-current assets | | | 100 | | | | 71 | | |
Increase (decrease) in other current and non-current liabilities | | | (30 | ) | | | 36 | | |
Proceeds from government grant | | | 69 | | - |
Cash provided by (used in) changes in assets and liabilities | | | | | |
Accounts receivable, notes receivable, and accrued revenue | | | 85 | | 146 |
Inventories | | | 253 | | 135 |
Accounts payable | | | 19 | | 10 |
Accrued expenses | | | (82) | | (82) |
Other current and non-current assets and liabilities | | | 34 | | 70 |
Net cash provided by operating activities | | | 943 | | | | 1,216 | | | 1,095 | | 943 |
| | | | | |
Cash Flows from Investing Activities | | | | | | | | |
Capital expenditures (excludes assets placed under capital lease) | | | (575 | ) | | | (399 | ) | | (580) | | (575) |
Cost to retire property | | | (20 | ) | | | (28 | ) | | (23) | | (20) |
Other investing activities | | | (15 | ) | | | (44 | ) | | (13) | | (15) |
Net cash used in investing activities | | | (610 | ) | | | (471 | ) | | (616) | | (610) |
| | | | | |
Cash Flows from Financing Activities | | | | | | | | |
Proceeds from issuance of long-term debt | | | 790 | | | | 375 | | | 675 | | 790 |
Proceeds from (retirements of) EnerBank notes, net | | | (4 | ) | | | 21 | | |
Retirements of EnerBank notes, net | | | (28) | | (4) |
Issuance of common stock | | | 23 | | | | 22 | | | 28 | | 23 |
Retirement of long-term debt | | | (972 | ) | | | (292 | ) | | (445) | | (972) |
Payment of common stock dividends | | | (125 | ) | | | (106 | ) | | (135) | | (125) |
Payment of capital and finance lease obligations | | | (12 | ) | | | (12 | ) | |
Other financing costs | | | (7 | ) | | | (8 | ) | |
Decrease in notes payable | | | (110) | | - |
Payment of capital lease obligations and other financing costs | | | (20) | | (19) |
Net cash used in financing activities | | | (307 | ) | | | - | | | (35) | | (307) |
| | | | | |
Net Increase in Cash and Cash Equivalents, Including Assets Held for Sale | | | 26 | | | | 745 | | |
Decrease in Cash and Cash Equivalents Included in Assets Held for Sale | | | - | | | | 2 | | |
Net Increase in Cash and Cash Equivalents | | | 444 | | 26 |
| | | | | |
Net Increase in Cash and Cash Equivalents | | | 26 | | | | 747 | | |
Cash and Cash Equivalents, Beginning of Period | | | 161 | | | | 247 | | | 93 | | 161 |
| | | | | |
Cash and Cash Equivalents, End of Period | | $ | 187 | | | $ | 994 | | | $ | 537 | | $ | 187 |
| | | |
The accompanying notes are an integral part of these statements.
37
Table of Contents
CMS Energy Corporation
Consolidated Balance Sheets
(Unaudited)
ASSETS | | | | |
| | | | In Millions |
| | June 30 | | December 31 |
| | 2013 | | 2012 |
| | | | |
Current Assets | | | | |
Cash and cash equivalents | | $ | 537 | | $ | 93 |
Restricted cash and cash equivalents | | 29 | | 29 |
Accounts receivable and accrued revenue, less allowances of $31 in 2013 and $32 in 2012 | | 728 | | 855 |
Notes receivable | | 76 | | 41 |
Accounts receivable – related parties | | 10 | | 10 |
Accrued power supply and gas revenue | | 20 | | 32 |
Inventories at average cost | | | | |
Gas in underground storage | | 568 | | 820 |
Materials and supplies | | 103 | | 96 |
Generating plant fuel stock | | 159 | | 168 |
Deferred property taxes | | 140 | | 190 |
Regulatory assets | | 36 | | 35 |
Prepayments and other current assets | | 79 | | 53 |
Total current assets | | 2,485 | | 2,422 |
| | | | |
Plant, Property, and Equipment | | | | |
Plant, property, and equipment, gross | | 16,086 | | 15,592 |
Less accumulated depreciation and amortization | | 5,278 | | 5,121 |
Plant, property, and equipment, net | | 10,808 | | 10,471 |
Construction work in progress | | 1,108 | | 1,080 |
Total plant, property, and equipment | | 11,916 | | 11,551 |
| | | | |
Other Non-current Assets | | | | |
Regulatory assets | | 2,202 | | 2,287 |
Accounts and notes receivable, less allowances of $5 in 2013 and 2012 | | 504 | | 521 |
Investments | | 63 | | 57 |
Other | | 259 | | 293 |
Total other non-current assets | | 3,028 | | 3,158 |
| | | | |
Total Assets | | $ | 17,429 | | $ | 17,131 |
(Unaudited)38
Table of Contents
| | | | | | | | |
ASSETS | | | | | | | | |
| | | | | | In Millions | |
| | | June 30 | | | December 31 | |
| | | 2012 | | | 2011 | |
| | |
Current Assets | | | | | | | | |
Cash and cash equivalents | | $ | 187 | | | $ | 161 | |
Restricted cash and cash equivalents | | | 28 | | | | 27 | |
Accounts receivable and accrued revenue, less allowances of $35 in 2012 and 2011 | | | 670 | | | | 869 | |
Notes receivable | | | 40 | | | | 49 | |
Accounts receivable – related parties | | | 10 | | | | 10 | |
Inventories at average cost | | | | | | | | |
Gas in underground storage | | | 760 | | | | 929 | |
Materials and supplies | | | 96 | | | | 92 | |
Generating plant fuel stock | | | 196 | | | | 166 | |
Deferred income taxes | | | - | | | | 24 | |
Deferred property taxes | | | 136 | | | | 187 | |
Regulatory assets | | | 13 | | | | 1 | |
Prepayments and other current assets | | | 70 | | | | 50 | |
Total current assets | | | 2,206 | | | | 2,565 | |
| | |
Plant, Property, and Equipment | | | | | | | | |
Plant, property, and equipment, gross | | | 14,959 | | | | 14,751 | |
Less accumulated depreciation and amortization | | | 4,973 | | | | 4,901 | |
Plant, property, and equipment, net | | | 9,986 | | | | 9,850 | |
Construction work in progress | | | 1,011 | | | | 783 | |
Total plant, property, and equipment | | | 10,997 | | | | 10,633 | |
| | |
Other Non-current Assets | | | | | | | | |
Regulatory assets | | | 2,335 | | | | 2,466 | |
Accounts and notes receivable, less allowances of $5 in 2012 and 2011 | | | 461 | | | | 462 | |
Investments | | | 54 | | | | 50 | |
Other | | | 240 | | | | 276 | |
Total other non-current assets | | | 3,090 | | | | 3,254 | |
| | |
Total Assets | | $ | 16,293 | | | $ | 16,452 | |
| | |
LIABILITIES AND EQUITY | | | | |
| | | | In Millions |
| | June 30 | | December 31 |
| | 2013 | | 2012 |
| | | | |
Current Liabilities | | | | |
Current portion of long-term debt, capital and finance lease obligations | | $ | 758 | | $ | 541 |
Notes payable | | - | | 110 |
Accounts payable | | 512 | | 512 |
Accounts payable – related parties | | 9 | | 9 |
Accrued rate refunds | | - | | 6 |
Accrued interest | | 93 | | 95 |
Accrued taxes | | 206 | | 279 |
Deferred income taxes | | 77 | | 68 |
Regulatory liabilities | | 8 | | 25 |
Other current liabilities | | 139 | | 152 |
Total current liabilities | | 1,802 | | 1,797 |
| | | | |
Non-current Liabilities | | | | |
Long-term debt | | 6,695 | | 6,710 |
Non-current portion of capital and finance lease obligations | | 144 | | 153 |
Regulatory liabilities | | 2,243 | | 2,101 |
Postretirement benefits | | 1,393 | | 1,451 |
Asset retirement obligations | | 319 | | 312 |
Deferred investment tax credit | | 41 | | 43 |
Deferred income taxes | | 1,116 | | 1,015 |
Other non-current liabilities | | 316 | | 311 |
Total non-current liabilities | | 12,267 | | 12,096 |
| | | | |
Commitments and Contingencies (Notes 1 and 2) | | | | |
| | | | |
Equity | | | | |
Common stockholders equity | | | | |
Common stock, authorized 350.0 shares; outstanding 265.9 shares in 2013 and 264.1 shares in 2012 | | 3 | | 3 |
Other paid-in capital | | 4,710 | | 4,669 |
Accumulated other comprehensive loss | | (56) | | (55) |
Accumulated deficit | | (1,334) | | (1,423) |
Total common stockholders equity | | 3,323 | | 3,194 |
Noncontrolling interests | | 37 | | 44 |
Total equity | | 3,360 | | 3,238 |
| | | | |
Total Liabilities and Equity | | $ | 17,429 | | $ | 17,131 |
| | | | | | | | |
LIABILITIES AND EQUITY | | | | | | | | |
| | | | | | In Millions | |
| | | June 30 | | | December 31 | |
| | | 2012 | | | 2011 | |
| | |
Current Liabilities | | | | | | | | |
Current portion of long-term debt, capital and finance lease obligations | | $ | 653 | | | $ | 1,057 | |
Accounts payable | | | 527 | | | | 575 | |
Accounts payable – related parties | | | 9 | | | | 9 | |
Accrued rate refunds | | | 37 | | | | 30 | |
Accrued interest | | | 96 | | | | 101 | |
Accrued taxes | | | 199 | | | | 282 | |
Deferred income taxes | | | 28 | | | | - | |
Regulatory liabilities | | | 122 | | | | 125 | |
Other current liabilities | | | 136 | | | | 159 | |
Total current liabilities | | | 1,807 | | | | 2,338 | |
| | |
Non-current Liabilities | | | | | | | | |
Long-term debt | | | 6,221 | | | | 6,040 | |
Non-current portion of capital and finance lease obligations | | | 157 | | | | 167 | |
Regulatory liabilities | | | 1,933 | | | | 1,875 | |
Postretirement benefits | | | 1,289 | | | | 1,289 | |
Asset retirement obligations | | | 261 | | | | 254 | |
Deferred investment tax credit | | | 44 | | | | 46 | |
Deferred income taxes | | | 1,090 | | | | 1,035 | |
Other non-current liabilities | | | 336 | | | | 336 | |
Total non-current liabilities | | | 11,331 | | | | 11,042 | |
| | |
Commitments and Contingencies (Notes 3, 4, 5, 7, and 8) | | | | | | | | |
| | |
Equity | | | | | | | | |
Common stockholders equity | | | | | | | | |
Common stock, authorized 350.0 shares; outstanding 263.7 shares in 2012 and 254.1 shares in 2011 | | | 3 | | | | 3 | |
Other paid-in capital | | | 4,664 | | | | 4,627 | |
Accumulated other comprehensive loss | | | (45 | ) | | | (49 | ) |
Accumulated deficit | | | (1,511 | ) | | | (1,553 | ) |
Total common stockholders equity | | | 3,111 | | | | 3,028 | |
Noncontrolling interests | | | 44 | | | | 44 | |
Total equity | | | 3,155 | | | | 3,072 | |
| | |
Total Liabilities and Equity | | $ | 16,293 | | | $ | 16,452 | |
| | |
The accompanying notes are an integral part of these statements.
39
Table of Contents
CMS Energy Corporation
Consolidated Statements of Changes in Equity
(Unaudited)
| | | | | | | | | | | In Millions | | | | | | | | | In Millions |
| | | Three Months Ended | | | | Six Months Ended | | | Three Months Ended | | Six Months Ended |
| June 30 | | 2012 | | 2011 | | | 2012 | | 2011 | | | 2013 | | 2012 | | 2013 | | 2012 |
| | | | | | | | | | | | |
Total Equity at Beginning of Period | | | $ | 3,350 | | $ | 3,093 | | $ | 3,238 | | $ | 3,072 |
| | | | | | | | | |
Common Stock | | | | | | | | | | | | | | | | | | | | |
At beginning of period | | | | $ | 3 | | | $ | 3 | | | | | $ | 3 | | | $ | 2 | | |
Common stock issued | | | | | - | | | | - | | | | | - | | | | 1 | | |
At end of period | | | | | 3 | | | | 3 | | | | | 3 | | | | 3 | | |
At beginning and end of period | | | 3 | | 3 | | 3 | | 3 |
| | | | | | | | | | | | |
Other Paid-in Capital | | | | | | | | | | | | | | | | | | | | |
At beginning of period | | | | | 4,641 | | | | 4,599 | | | | | | 4,627 | | | | 4,588 | | | 4,703 | | 4,641 | | 4,669 | | 4,627 |
Common stock issued | | | | | 23 | | | | 22 | | | | | | 31 | | | | 28 | | | 8 | | 23 | | 37 | | 31 |
Common stock reissued | | | | | - | | | | - | | | | | 6 | | | | 5 | | | - | | - | | 5 | | 6 |
Common stock repurchased | | | (1) | | - | | (1) | | - |
At end of period | | | | | 4,664 | | | | 4,621 | | | | | 4,664 | | | | 4,621 | | | 4,710 | | 4,664 | | 4,710 | | 4,664 |
| | | | | | | | | | | | |
Accumulated Other Comprehensive Loss | | | | | | | | | | | | | | | | | | | | |
At beginning of period | | | (54) | | (47) | | (55) | | (49) |
Retirement benefits liability | | | | | | | | | | | | | | | | | | | | |
At beginning of period | | | | | (47 | ) | | | (39 | ) | | | | | (48 | ) | | | (39 | ) | | (55) | | (47) | | (56) | | (48) |
Retirement benefits liability adjustments | | | | | 1 | | | | 1 | | | | | 2 | | | | 1 | | | 1 | | 1 | | 2 | | 2 |
At end of period | | | | | (46 | ) | | | (38 | ) | | | | (46 | ) | | | (38 | ) | | (54) | | (46) | | (54) | | (46) |
| Investments | | | | | | | | | | | | | | | | | | | | |
At beginning of period | | | | | 1 | | | | - | | | | | | - | | | | - | | | 2 | | 1 | | 2 | | - |
Unrealized gain on investments | | | | | 1 | | | | 1 | | | | | 2 | | | | 1 | | |
Unrealized gain (loss) on investments | | | (3) | | 1 | | (3) | | 2 |
At end of period | | | | | 2 | | | | 1 | | | | | 2 | | | | 1 | | | (1) | | 2 | | (1) | | 2 |
| Derivative instruments | | | | | | | | | | | | | | | | | | | | |
At beginning and end of period | | | | | (1 | ) | | | (1 | ) | | | | (1 | ) | | | (1 | ) | | (1) | | (1) | | (1) | | (1) |
| At end of period | | | | | (45 | ) | | | (38 | ) | | | | (45 | ) | | | (38 | ) | | (56) | | (45) | | (56) | | (45) |
| | | | | | | | | | | | |
Accumulated Deficit | | | | | | | | | | | | | | | | | | | | |
At beginning of period | | | | | (1,548 | ) | | | (1,675 | ) | | | | | (1,553 | ) | | | (1,757 | ) | | (1,346) | | (1,548) | | (1,423) | | (1,553) |
Net income attributable to CMS Energy | | | | | 100 | | | | 100 | | | | | | 167 | | | | 235 | | | 80 | | 100 | | 224 | | 167 |
Common stock dividends declared | | | | | (63 | ) | | | (53 | ) | | | | (125 | ) | | | (106 | ) | | (68) | | (63) | | (135) | | (125) |
At end of period | | | | | (1,511 | ) | | | (1,628 | ) | | | | (1,511 | ) | | | (1,628 | ) | | (1,334) | | (1,511) | | (1,334) | | (1,511) |
| | | | | | | | | | | | |
Noncontrolling Interests | | | | | | | | | | | | | | | | | | | | |
At beginning of period | | | | | 44 | | | | 44 | | | | | | 44 | | | | 44 | | | 44 | | 44 | | 44 | | 44 |
Income attributable to noncontrolling interests | | | | | 1 | | | | 1 | | | | | | 1 | | | | 1 | | | 1 | | 1 | | 1 | | 1 |
Distributions and other changes in noncontrolling interests | | | | | (1 | ) | | | (1 | ) | | | | (1 | ) | | | (1 | ) | |
Distributions, redemptions, and other changes in noncontrolling interests | | | (8) | | (1) | | (8) | | (1) |
At end of period | | | | | 44 | | | | 44 | | | | | 44 | | | | 44 | | | 37 | | 44 | | 37 | | 44 |
| | | | | | | | | | | | |
Total Equity | | | | $ | 3,155 | | | $ | 3,002 | | | | | $ | 3,155 | | | $ | 3,002 | | |
| | | |
Total Equity at End of Period | | | $ | 3,360 | | $ | 3,155 | | $ | 3,360 | | $ | 3,155 |
The accompanying notes are an integral part of these statements.
40
Table of Contents
Consumers Energy Company
Consolidated Statements of Income
(Unaudited)
| | | | | | | | | | | In Millions | | | | | | | In Millions |
| | | Three Months Ended | | | | Six Months Ended | | | Three Months Ended | | Six Months Ended |
| June 30 | | 2012 | | 2011 | | | 2012 | | 2011 | | | 2013 | | 2012 | | 2013 | | 2012 |
| | | | | | | | | | | |
Operating Revenue | | $ | 1,282 | | | $ | 1,303 | | | | | $ | 2,957 | | | $ | 3,291 | | | $ | 1,342 | | $ | 1,282 | | $ | 3,261 | | $ | 2,957 |
| | | | | | | | | | | |
Operating Expenses | | | | | | | | | | | | | | | | | | |
Fuel for electric generation | | | 110 | | | | 138 | | | | | | 216 | | | | 267 | | | 125 | | 110 | | 258 | | 216 |
Purchased and interchange power | | | 327 | | | | 299 | | | | | | 640 | | | | 592 | | | 340 | | 327 | | 669 | | 640 |
Purchased power – related parties | | | 21 | | | | 19 | | | | | | 42 | | | | 40 | | | 23 | | 21 | | 46 | | 42 |
Cost of gas sold | | | 124 | | | | 197 | | | | | | 660 | | | | 950 | | | 154 | | 124 | | 754 | | 660 |
Maintenance and other operating expenses | | | 266 | | | | 273 | | | | | | 543 | | | | 538 | | | 289 | | 266 | | 555 | | 543 |
Depreciation and amortization | | | 128 | | | | 121 | | | | | | 299 | | | | 282 | | | 136 | | 128 | | 316 | | 299 |
General taxes | | | 46 | | | | 49 | | | | | 114 | | | | 115 | | | 48 | | 46 | | 117 | | 114 |
Total operating expenses | | | 1,022 | | | | 1,096 | | | | | 2,514 | | | | 2,784 | | | 1,115 | | 1,022 | | 2,715 | | 2,514 |
| | | | | | | | | | | |
Operating Income | | | 260 | | | | 207 | | | | | | 443 | | | | 507 | | | 227 | | 260 | | 546 | | 443 |
| | | | | | | | | | | |
Other Income (Expense) | | | | | | | | | | | | | | | | | | |
Interest income | | | 1 | | | | 2 | | | | | | 2 | | | | 4 | | | 2 | | 1 | | 2 | | 2 |
Allowance for equity funds used during construction | | | 2 | | | | 2 | | | | | | 4 | | | | 3 | | | 1 | | 2 | | 4 | | 4 |
Other income | | | 3 | | | | 5 | | | | | | 11 | | | | 13 | | | 2 | | 3 | | 9 | | 11 |
Other expense | | | (3 | ) | | | (3 | ) | | | | (5 | ) | | | (5 | ) | | (3 | ) | (3) | | (6 | ) | (5) |
Total other income | | | 3 | | | | 6 | | | | | 12 | | | | 15 | | | 2 | | 3 | | 9 | | 12 |
| | | | | | | | | | | |
Interest Charges | | | | | | | | | | | | | | | | | | |
Interest on long-term debt | | | 58 | | | | 63 | | | | | | 119 | | | | 126 | | | 60 | | 58 | | 119 | | 119 |
Other interest expense | | | 4 | | | | 5 | | | | | | 8 | | | | 9 | | | 3 | | 4 | | 6 | | 8 |
Allowance for borrowed funds used during construction | | | (1 | ) | | | (1 | ) | | | | (2 | ) | | | (2 | ) | | (1 | ) | (1) | | (2 | ) | (2) |
Total interest charges | | | 61 | | | | 67 | | | | | 125 | | | | 133 | | | 62 | | 61 | | 123 | | 125 |
| | | | | | | | | | | |
Income Before Income Taxes | | | 202 | | | | 146 | | | | | | 330 | | | | 389 | | | 167 | | 202 | | 432 | | 330 |
Income Tax Expense | | | 80 | | | | 54 | | | | | 132 | | | | 144 | | | 67 | | 80 | | 170 | | 132 |
| | | | | | | | | | | |
Net Income | | | 122 | | | | 92 | | | | | | 198 | | | | 245 | | | 100 | | 122 | | 262 | | 198 |
Preferred Stock Dividends | | | 1 | | | | 1 | | | | | 1 | | | | 1 | | |
Preferred Stock Dividends and Distribution | | | 1 | | 1 | | 1 | | 1 |
| | | | | | | | | | | |
Net Income Available to Common Stockholder | | $ | 121 | | | $ | 91 | | | | | $ | 197 | | | $ | 244 | | | $ | 99 | | $ | 121 | | $ | 261 | | $ | 197 |
| | | |
The accompanying notes are an integral part of these statements.
42
Table of Contents
Consumers Energy Company
Consolidated Statements of Comprehensive Income
(Unaudited)
| | | | | | | | | | | | | | | | | | |
| In Millions | |
| | | Three Months Ended | | | | | Six Months Ended | |
| June 30 | | 2012 | | | 2011 | | | | | 2012 | | | 2011 | |
| | | | | |
Net Income | | | $ 122 | | | | $ 92 | | | | | | $ 198 | | | | $ 245 | |
| | | | | |
Retirement Benefits Liability | | | | | | | | | | | | | | | | | | |
Retirement benefits liability adjustments, net of tax of $- for all periods presented | | | - | | | | - | | | | | | 1 | | | | 1 | |
| | | | | |
Investments | | | | | | | | | | | | | | | | | | |
Unrealized gain (loss) on investments, net of tax benefit of $-, $-, $(2), and $(1) | | | 3 | | | | - | | | | | | - | | | | (1 | ) |
Other Comprehensive Income | | | 3 | | | | - | | | | | | 1 | | | | - | |
| | | | | |
Total Comprehensive Income | | | $ 125 | | | | $ 92 | | | | | | $ 199 | | | | $ 245 | |
| | |
| | | | | | In Millions |
| | Three Months Ended | | Six Months Ended |
June 30 | | 2013 | | 2012 | | 2013 | | 2012 |
| | | | | | | | |
Net Income | | $ | 100 | | $ | 122 | | $ | 262 | | $ | 198 |
| | | | | | | | |
Retirement Benefits Liability | | | | | | | | |
Retirement benefits liability adjustments, net of tax of $1, $-, $1, and $- | | 1 | | - | | 2 | | 1 |
| | | | | | | | |
Investments | | | | | | | | |
Unrealized gain (loss) on investments, net of tax (tax benefit) of $1, $-, $1, and $(2) | | (4 | ) | 3 | | - | | - |
Reclassification adjustments included in net income, net of tax benefit of $-, $-, $(1), and $- | | - | | - | | (3 | ) | - |
| | | | | | | | |
Other Comprehensive Income (Loss) | | (3 | ) | 3 | | (1 | ) | 1 |
| | | | | | | | |
Comprehensive Income | | $ | 97 | | $ | 125 | | $ | 261 | | $ | 199 |
The accompanying notes are an integral part of these statements.
43
Table of Contents
Consumers Energy Company
Consolidated Statements of Cash Flows
(Unaudited)
| | | | In Millions | |
Six Months Ended June 30 | | 2013 | | 2012 | |
| | | | | |
Cash Flows from Operating Activities | | | | | |
Net income | | $ | 262 | | $ | 198 | |
Adjustments to reconcile net income to net cash provided by operating activities | | | | | |
Depreciation and amortization | | 316 | | 299 | |
Deferred income taxes and investment tax credit | | 87 | | 39 | |
Postretirement benefits expense | | 93 | | 92 | |
Other non-cash operating activities | | 31 | | 31 | |
Postretirement benefits contributions | | (86 | ) | (34 | ) |
Proceeds from government grant | | 69 | | - | |
Cash provided by (used in) changes in assets and liabilities | | | | | |
Accounts receivable, notes receivable, and accrued revenue | | 85 | | 146 | |
Inventories | | 249 | | 137 | |
Accounts payable | | 23 | | 11 | |
Accrued expenses | | (73 | ) | (19 | ) |
Other current and non-current assets and liabilities | | 29 | | 113 | |
Net cash provided by operating activities | | 1,085 | | 1,013 | |
| | | | | |
Cash Flows from Investing Activities | | | | | |
Capital expenditures (excludes assets placed under capital lease) | | (579 | ) | (572 | ) |
Cost to retire property | | (23 | ) | (20 | ) |
Other investing activities | | (11 | ) | (9 | ) |
Net cash used in investing activities | | (613 | ) | (601 | ) |
| | | | | |
Cash Flows from Financing Activities | | | | | |
Proceeds from issuance of long-term debt | | 425 | | 375 | |
Retirement of long-term debt | | (445 | ) | (694 | ) |
Payment of common and preferred stock dividends | | (195 | ) | (159 | ) |
Stockholder contribution | | 150 | | 150 | |
Decrease in notes payable | | (110 | ) | - | |
Payment of capital lease obligations and other financing costs | | (16 | ) | (15 | ) |
Net cash used in financing activities | | (191 | ) | (343 | ) |
| | | | | |
Net Increase in Cash and Cash Equivalents | | 281 | | 69 | |
| | | | | |
Cash and Cash Equivalents, Beginning of Period | | 5 | | 85 | |
| | | | | |
Cash and Cash Equivalents, End of Period | | $ | 286 | | $ | 154 | |
| | | | | | | | |
| In Millions | |
| Six Months Ended June 30 | | 2012 | | | 2011 | |
| | |
Cash Flows from Operating Activities | | | | | | | | |
Net income | | $ | 198 | | | $ | 245 | |
Adjustments to reconcile net income to net cash provided by operating activities | | | | | | | | |
Depreciation and amortization | | | 299 | | | | 282 | |
Deferred income taxes and investment tax credit | | | 39 | | | | 82 | |
Postretirement benefits expense | | | 92 | | | | 78 | |
Other non-cash operating activities | | | 31 | | | | 31 | |
Postretirement benefits contributions | | | (34 | ) | | | (37 | ) |
Changes in other assets and liabilities | | | | | | | | |
Decrease in accounts receivable, notes receivable, and accrued revenue | | | 146 | | | | 207 | |
Decrease in accrued power supply revenue | | | - | | | | 15 | |
Decrease in inventories | | | 137 | | | | 202 | |
Increase in accounts payable | | | 11 | | | | 42 | |
Decrease in accrued expenses | | | (19 | ) | | | (12 | ) |
Decrease in other current and non-current assets | | | 103 | | | | 68 | |
Increase in other current and non-current liabilities | | | 10 | | | | 42 | |
Net cash provided by operating activities | | | 1,013 | | | | 1,245 | |
| | |
Cash Flows from Investing Activities | | | | | | | | |
Capital expenditures (excludes assets placed under capital lease) | | | (572 | ) | | | (394 | ) |
Cost to retire property | | | (20 | ) | | | (28 | ) |
Other investing activities | | | (9 | ) | | | (23 | ) |
Net cash used in investing activities | | | (601 | ) | | | (445 | ) |
| | |
Cash Flows from Financing Activities | | | | | | | | |
Proceeds from issuance of long-term debt | | | 375 | | | | - | |
Retirement of long-term debt | | | (694 | ) | | | (18 | ) |
Payment of common stock dividends | | | (158 | ) | | | (196 | ) |
Payment of preferred stock dividends | | | (1 | ) | | | (1 | ) |
Stockholder contribution | | | 150 | | | | 125 | |
Payment of capital and finance lease obligations | | | (12 | ) | | | (12 | ) |
Other financing costs | | | (3 | ) | | | (3 | ) |
Net cash used in financing activities | | | (343 | ) | | | (105 | ) |
| | |
Net Increase in Cash and Cash Equivalents | | | 69 | | | | 695 | |
| | |
Cash and Cash Equivalents, Beginning of Period | | | 85 | | | | 71 | |
| | |
Cash and Cash Equivalents, End of Period | | $ | 154 | | | $ | 766 | |
| | |
| | | | | | | | |
The accompanying notes are an integral part of these statements.
(This page intentionally left blank)
45
Table of Contents
Consumers Energy Company
Consolidated Balance Sheets
(Unaudited)
ASSETS | | | | | |
| | | | In Millions | |
| | June 30 | | December 31 | |
| | 2013 | | 2012 | |
| | | | | |
Current Assets | | | | | |
Cash and cash equivalents | | $ | 286 | | $ | 5 | |
Restricted cash and cash equivalents | | 28 | | 28 | |
Accounts receivable and accrued revenue, less allowances of $29 in 2013 and $30 in 2012 | | 719 | | 844 | |
Notes receivable | | 25 | | - | |
Accounts receivable – related parties | | 1 | | 1 | |
Accrued power supply and gas revenue | | 20 | | 32 | |
Inventories at average cost | | | | | |
Gas in underground storage | | 568 | | 816 | |
Materials and supplies | | 99 | | 92 | |
Generating plant fuel stock | | 159 | | 167 | |
Deferred property taxes | | 140 | | 190 | |
Regulatory assets | | 36 | | 35 | |
Prepayments and other current assets | | 72 | | 45 | |
Total current assets | | 2,153 | | 2,255 | |
| | | | | |
Plant, Property, and Equipment | | | | | |
Plant, property, and equipment, gross | | 15,951 | | 15,456 | |
Less accumulated depreciation and amortization | | 5,216 | | 5,061 | |
Plant, property, and equipment, net | | 10,735 | | 10,395 | |
Construction work in progress | | 1,106 | | 1,080 | |
Total plant, property, and equipment | | 11,841 | | 11,475 | |
| | | | | |
Other Non-current Assets | | | | | |
Regulatory assets | | 2,202 | | 2,287 | |
Accounts and notes receivable | | 11 | | 17 | |
Investments | | 30 | | 32 | |
Other | | 172 | | 209 | |
Total other non-current assets | | 2,415 | | 2,545 | |
| | | | | |
Total Assets | | $ | 16,409 | | $ | 16,275 | |
(Unaudited)46
Table of Contents
ASSETS
| | | | | | | | |
| | | In Millions | |
| | | June 30 | | | December 31 | |
| | | 2012 | | | 2011 | |
| | |
Current Assets | | | | | | | | |
Cash and cash equivalents | | $ | 154 | | | $ | 85 | |
Restricted cash and cash equivalents | | | 27 | | | | 26 | |
Accounts receivable and accrued revenue, less allowances of $33 in 2012 and 2011 | | | 659 | | | | 860 | |
Notes receivable | | | 13 | | | | 23 | |
Accounts receivable – related parties | | | 1 | | | | 1 | |
Inventories at average cost | | | | | | | | |
Gas in underground storage | | | 756 | | | | 929 | |
Materials and supplies | | | 92 | | | | 88 | |
Generating plant fuel stock | | | 196 | | | | 164 | |
Deferred property taxes | | | 136 | | | | 187 | |
Regulatory assets | | | 13 | | | | 1 | |
Prepayments and other current assets | | | 63 | | | | 43 | |
Total current assets | | | 2,110 | | | | 2,407 | |
| | |
Plant, Property, and Equipment | | | | | | | | |
Plant, property, and equipment, gross | | | 14,825 | | | | 14,621 | |
Less accumulated depreciation and amortization | | | 4,915 | | | | 4,846 | |
Plant, property, and equipment, net | | | 9,910 | | | | 9,775 | |
Construction work in progress | | | 1,010 | | | | 782 | |
Total plant, property, and equipment | | | 10,920 | | | | 10,557 | |
| | |
Other Non-current Assets | | | | | | | | |
Regulatory assets | | | 2,335 | | | | 2,466 | |
Accounts and notes receivable | | | 1 | | | | 1 | |
Investments | | | 31 | | | | 35 | |
Other | | | 157 | | | | 196 | |
Total other non-current assets | | | 2,524 | | | | 2,698 | |
| | |
Total Assets | | $ | 15,554 | | | $ | 15,662 | |
| | | | | | | | | |
LIABILITIES AND EQUITY | | | | | |
| | | | In Millions | |
| | June 30 | | December 31 | |
| | 2013 | | 2012 | |
| | | | | |
Current Liabilities | | | | | |
Current portion of long-term debt, capital and finance lease obligations | | $ | 63 | | $ | 63 | |
Notes payable | | - | | 110 | |
Accounts payable | | 502 | | 501 | |
Accounts payable – related parties | | 13 | | 11 | |
Accrued rate refunds | | - | | 6 | |
Accrued interest | | 59 | | 65 | |
Accrued taxes | | 316 | | 376 | |
Deferred income taxes | | 127 | | 144 | |
Regulatory liabilities | | 8 | | 25 | |
Other current liabilities | | 100 | | 109 | |
Total current liabilities | | 1,188 | | 1,410 | |
| | | | | |
Non-current Liabilities | | | | | |
Long-term debt | | 4,276 | | 4,297 | |
Non-current portion of capital and finance lease obligations | | 144 | | 153 | |
Regulatory liabilities | | 2,243 | | 2,101 | |
Postretirement benefits | | 1,329 | | 1,385 | |
Asset retirement obligations | | 318 | | 311 | |
Deferred investment tax credit | | 41 | | 43 | |
Deferred income taxes | | 1,820 | | 1,741 | |
Other non-current liabilities | | 259 | | 252 | |
Total non-current liabilities | | 10,430 | | 10,283 | |
| | | | | |
Commitments and Contingencies (Notes 1 and 2) | | | | | |
| | | | | |
Equity | | | | | |
Common stockholder equity | | | | | |
Common stock, authorized 125.0 shares; outstanding 84.1 shares for both periods | | 841 | | 841 | |
Other paid-in capital | | 3,257 | | 3,107 | |
Accumulated other comprehensive loss | | (9 | ) | (8 | ) |
Retained earnings | | 665 | | 598 | |
Total common stockholder equity | | 4,754 | | 4,538 | |
Preferred stock | | 37 | | 44 | |
Total equity | | 4,791 | | 4,582 | |
| | | | | |
Total Liabilities and Equity | | $ | 16,409 | | $ | 16,275 | |
| | | | | | | | |
LIABILITIES AND EQUITY | | | | | | | | |
| In Millions | |
| | | June 30 | | | December 31 | |
| | | 2012 | | | 2011 | |
| | |
Current Liabilities | | | | | | | | |
Current portion of long-term debt, capital and finance lease obligations | | $ | 62 | | | $ | 363 | |
Accounts payable | | | 512 | | | | 561 | |
Accounts payable – related parties | | | 12 | | | | 11 | |
Accrued rate refunds | | | 37 | | | | 30 | |
Accrued interest | | | 65 | | | | 73 | |
Accrued taxes | | | 271 | | | | 287 | |
Deferred income taxes | | | 85 | | | | 73 | |
Regulatory liabilities | | | 122 | | | | 125 | |
Other current liabilities | | | 108 | | | | 119 | |
Total current liabilities | | | 1,274 | | | | 1,642 | |
| | |
Non-current Liabilities | | | | | | | | |
Long-term debt | | | 3,967 | | | | 3,987 | |
Non-current portion of capital and finance lease obligations | | | 157 | | | | 167 | |
Regulatory liabilities | | | 1,933 | | | | 1,875 | |
Postretirement benefits | | | 1,227 | | | | 1,225 | |
Asset retirement obligations | | | 260 | | | | 253 | |
Deferred investment tax credit | | | 44 | | | | 46 | |
Deferred income taxes | | | 1,846 | | | | 1,817 | |
Other non-current liabilities | | | 262 | | | | 256 | |
Total non-current liabilities | | | 9,696 | | | | 9,626 | |
| | |
Commitments and Contingencies (Notes 3, 4, 5, 7, and 8) | | | | | | | | |
| | |
Equity | | | | | | | | |
Common stockholder equity | | | | | | | | |
Common stock, authorized 125.0 shares; outstanding 84.1 shares for both periods | | | 841 | | | | 841 | |
Other paid-in capital | | | 3,107 | | | | 2,957 | |
Accumulated other comprehensive loss | | | (1 | ) | | | (2 | ) |
Retained earnings | | | 593 | | | | 554 | |
Total common stockholder equity | | | 4,540 | | | | 4,350 | |
Preferred stock | | | 44 | | | | 44 | |
Total equity | | | 4,584 | | | | 4,394 | |
| | |
Total Liabilities and Equity | | $ | 15,554 | | | $ | 15,662 | |
| | | | | | | | | |
The accompanying notes are an integral part of these statements.
47
Table of Contents
Consumers Energy Company
Consolidated Statements of Changes in Equity
(Unaudited)
| | | | | | | | | | | | | | | | | | In Millions | |
| In Millions | | |
| | | Three Months Ended | | | | Six Months Ended | | | Three Months Ended | | Six Months Ended | |
| June 30 | | 2012 | | | 2011 | | | | 2012 | | | 2011 | | | 2013 | | 2012 | | 2013 | | 2012 | |
| | | | | | | | | | |
Total Equity at Beginning of Period | | | $ | 4,803 | | $ | 4,503 | | $ | 4,582 | | $ | 4,394 | |
| | | | | | | | | | | | |
Common Stock | | | | | | | | | | | | | | | | | | | |
At beginning and end of period | | $ | 841 | | | $ | 841 | | | | $ | 841 | | | $ | 841 | | | 841 | | 841 | | 841 | | 841 | |
| | | | | | | | | | | | |
Other Paid-in Capital | | | | | | | | | | | | | | | | | | | |
At beginning of period | | | 3,107 | | | | 2,957 | | | | | | 2,957 | | | | 2,832 | | | 3,257 | | 3,107 | | 3,107 | | 2,957 | |
Stockholder contribution | | | - | | | | - | | | | | 150 | | | | 125 | | | - | | - | | 150 | | 150 | |
At end of period | | | 3,107 | | | | 2,957 | | | | | 3,107 | | | | 2,957 | | | 3,257 | | 3,107 | | 3,257 | | 3,107 | |
| | | | | | | | | | | | |
Accumulated Other Comprehensive Loss | | | | | | | | | | | | | | | | | | | |
At beginning of period | | | (6 | ) | (4) | | (8 | ) | (2 | ) |
Retirement benefits liability | | | | | | | | | | | | | | | | | | | |
At beginning of period | | | (18 | ) | | | (15 | ) | | | | | (19 | ) | | | (16 | ) | | (24 | ) | (18) | | (25 | ) | (19 | ) |
Retirement benefits liability adjustments | | | - | | | | - | | | | | 1 | | | | 1 | | | 1 | | - | | 2 | | 1 | |
At end of period | | | (18 | ) | | | (15 | ) | | | | (18 | ) | | | (15 | ) | | (23 | ) | (18) | | (23 | ) | (18 | ) |
| Investments | | | | | | | | | | | | | | | | | | | |
At beginning of period | | | 14 | | | | 15 | | | | | | 17 | | | | 16 | | | 18 | | 14 | | 17 | | 17 | |
Unrealized gain (loss) on investments | | | 3 | | | | - | | | | | - | | | | (1 | ) | | (4 | ) | 3 | | - | | - | |
Reclassification adjustments included in net income | | | - | | - | | (3 | ) | - | |
At end of period | | | 17 | | | | 15 | | | | | 17 | | | | 15 | | | 14 | | 17 | | 14 | | 17 | |
| At end of period | | | (1 | ) | | | - | | | | | (1 | ) | | | - | | | (9 | ) | (1) | | (9 | ) | (1 | ) |
| | | | | | | | | | | | |
Retained Earnings | | | | | | | | | | | | | | | | | | | |
At beginning of period | | | 515 | | | | 512 | | | | | | 554 | | | | 463 | | | 667 | | 515 | | 598 | | 554 | |
Net income | | | 122 | | | | 92 | | | | | | 198 | | | | 245 | | | 100 | | 122 | | 262 | | 198 | |
Common stock dividends declared | | | (43 | ) | | | (92 | ) | | | | | (158 | ) | | | (196 | ) | | (101 | ) | (43) | | (194 | ) | (158 | ) |
Preferred stock dividends declared | | | (1 | ) | | | (1 | ) | | | | (1 | ) | | | (1 | ) | |
Preferred stock dividends and distribution declared | | | (1 | ) | (1) | | (1 | ) | (1 | ) |
At end of period | | | 593 | | | | 511 | | | | | 593 | | | | 511 | | | 665 | | 593 | | 665 | | 593 | |
| | | | | | | | | | | | |
Preferred Stock | | | | | | | | | | | | | | | | | | | |
At beginning and end of period | | | 44 | | | | 44 | | | | | 44 | | | | 44 | | |
At beginning of period | | | 44 | | 44 | | 44 | | 44 | |
Preferred stock redeemed | | | (7 | ) | - | | (7 | ) | - | |
At end of period | | | 37 | | 44 | | 37 | | 44 | |
| | | | | | | | | | | | |
Total Equity | | $ | 4,584 | | | $ | 4,353 | | | | | $ | 4,584 | | | $ | 4,353 | | |
| | | | | |
Total Equity at End of Period | | | $ | 4,791 | | $ | 4,584 | | $ | 4,791 | | $ | 4,584 | |
The accompanying notes are an integral part of these statements.
48
Table of Contents
CMS Energy Corporation
Consumers Energy Company
NOTES TO THE UNAUDITED CONSOLIDATED FINANCIAL STATEMENTS
These interim consolidated financial statements have been prepared by CMS Energy and Consumers in accordance with GAAP for interim financial information and with the instructions to Form 10-Q and Article 10 of Regulation S-X. As a result, CMS Energy and Consumers have condensed or omitted certain information and note disclosures normally included in consolidated financial statements prepared in accordance with GAAP. CMS Energy and Consumers have reclassified certain prior period amounts to conform to the presentation in the current period. In management’s opinion, the unaudited information contained in this report reflects all adjustments of a normal recurring nature necessary to ensure the fair presentation of financial position, results of operations, and cash flows for the periods presented. The notes to the unaudited consolidated financial statements and the related unaudited consolidated financial statements should be read in conjunction with the consolidated financial statements and related notes contained in the 20112012 Form 10-K. Due to the seasonal nature of CMS Energy’s and Consumers’ operations, the results presented for this interim period are not necessarily indicative of results to be achieved for the fiscal year.
1: NEW ACCOUNTING STANDARDSREGULATORY MATTERS
IMPLEMENTATIONOF NEW ACCOUNTING STANDARDS
ASU 2011-05, PresentationRegulatory matters are critical to Consumers. The Michigan Attorney General, ABATE, the MPSC Staff, and certain other parties typically participate in MPSC proceedings concerning Consumers, such as Consumers’ rate cases and PSCR and GCR processes. These parties often challenge various aspects of Comprehensive Income: This standard, which became effective January 1, 2012 for CMS Energythose proceedings, including the prudence of Consumers’ policies and Consumers, eliminatespractices, and seek cost disallowances and other relief. The parties also have appealed significant MPSC orders. Depending upon the optionspecific issues, the outcomes of reportingrate cases and proceedings, including judicial proceedings challenging MPSC orders or other comprehensive income and its components on the statement of changes in equity. Prior to the implementation of this standard, both CMS Energy and Consumers used this option for their consolidated financial statements. Under the standard, entities are required to present eitheractions, could have a single continuous statement of comprehensive income, containing both net income and components of other comprehensive income, or two separate consecutive statements. CMS Energy and Consumers have chosen to present two separate consecutive statements. This standard affects only the presentation of comprehensive incomematerial adverse effect on CMS Energy’s and Consumers’ consolidatedliquidity, financial statements.condition, and results of operations. Consumers cannot predict the outcome of these proceedings.
There are multiple appeals pending that involve various issues concerning cost allocation among customers, the allocation of refunds among customer groups, the adequacy of the record evidence supporting the recovery of Smart Energy investments, and other matters. Consumers is unable to predict the outcome of these appeals.
CONSUMERS ELECTRIC UTILITY
Electric Rate Cases: In June 2012, the MPSC authorized an annual rate increase of $118 million, based on a 10.3 percent authorized return on equity. Consumers filed an application in September 2012 requesting that the MPSC find that the total revenues collected during self-implementation did not exceed those that would have been collected under final rates. In March 2013, the MPSC approved a settlement agreement finding that no refund was required.
ASU 2011-04, Amendments
In September 2012, Consumers filed an application with the MPSC seeking an annual rate increase of $148 million, based on a 10.5 percent authorized return on equity, in order to Achieve Common Fair Value Measurementrecover new investment in system reliability, environmental compliance, and Disclosure Requirementstechnology enhancements. In January 2013, Consumers supplemented its electric rate case application to reflect changes to its environmental compliance and generation outage plans, which reduced its requested annual rate increase to $145 million. In this filing, Consumers also sought approval of several rate adjustment mechanisms.
In March 2013, Consumers self-implemented an annual rate increase of $110 million out of its requested $145 million, subject to refund with interest. Consumers’ self-implementation required no order by the
49
Table of Contents
MSPC, and no intervenors in U.S. GAAPConsumers’ electric rate case opposed Consumers’ self-implementation amount. The MPSC approved a partial settlement agreement in May 2013, authorizing an annual rate increase of $89 million, based on a 10.3 percent authorized rate of return on equity. The rate adjustment mechanisms requested by Consumers were not approved. In June 2013, in connection with this electric rate case, the MPSC approved Consumers’ application for authority to continue the advance metering infrastructure program and IFRSs:implement a non-transmitting meter provision.
In July 2013, Consumers filed a reconciliation of total revenues collected during self-implementation to those that would have been collected under final rates. Consumers’ reconciliation indicated that no refund would be required.
Electric Revenue Decoupling Mechanism: The MPSC’s 2009 order in Consumers’ electric rate case authorized Consumers to implement an electric revenue decoupling mechanism. This standard, which became effective January 1,decoupling mechanism allowed Consumers to adjust future electric rates to the degree that actual average sales per customer differed from the rate order. The MPSC extended the electric revenue decoupling mechanism for a second year in its 2010 order in Consumers’ electric rate case.
In April 2012, the Michigan Court of Appeals ruled that the MPSC lacks statutory authority to approve or direct the use of a revenue decoupling mechanism for CMS Energyelectric providers. Subsequently, in November 2012, the Michigan Court of Appeals ruled in an appeal of the MPSC’s 2010 order in Consumers’ electric rate case. The Court reversed the portion of the 2010 order related to Consumers’ electric revenue decoupling mechanism and remanded the case to the MPSC for further proceedings related to the revenue decoupling mechanism. In March 2013, the MSPC issued an order in the remand proceedings, stating that, with the exception of the authorization of the revenue decoupling mechanism, its 2010 order in Consumers’ electric rate case stands as issued.
Big Rock Nuclear Decommissioning: Consumers had recorded an $85 million regulatory asset for $30 million it paid to Entergy to assume ownership responsibility for the Big Rock ISFSI and for $55 million of nuclear fuel storage costs it incurred as a result of the DOE’s failure to accept nuclear fuel. Consumers filed a complaint against the DOE in 2002 for this failure.
In 2011, Consumers entered into an agreement with the DOE to settle its claims for $120 million. Consumers subsequently filed an application with the MPSC requesting authority to utilize $85 million of the settlement amount as recovery of its regulatory asset, and to refund to customers $23 million previously collected through rates for spent nuclear fuel costs. In December 2012, the MPSC approved this treatment, and Consumers isrefunded $23 million to customers over a six-month period that began in January 2013. Consumers recognized the result of a joint projectremaining $12 million of the Financial Accounting Standards Board and the International Accounting Standards Board. The primary objective of the standard is to ensure that fair value has the same meaning under GAAP and International Financial Reporting Standards and to establish common fair value measurement guidance in the two sets of standards. The standard does not change the overall fair value model in GAAP, but it amends various fair value principles and establishes additional disclosure requirements. This standard did not impact CMS Energy’s or Consumers’ consolidated income, cash flows, or financial position, but did require additional disclosures.
2: FAIR VALUE MEASUREMENTS
Accounting standards define fair value as the price that would be received to sell an asset or paid to transfer a liability in an orderly transaction between market participants. When measuring fair value, CMS Energy and Consumers are required to incorporate all assumptions that market participants would use in pricing an asset or liability, including assumptions about risk. A fair value hierarchy prioritizes inputs used to measure fair value according to their observability in the market. The three levels of the fair value hierarchy are as follows:
Level 1 inputs are unadjusted quoted prices in active markets for identical assets or liabilities.
Level 2 inputs are observable, market-based inputs, other than Level 1 prices. Level 2 inputs may include quoted prices for similar assets or liabilities in active markets, quoted prices in inactive markets, interest rates and yield curves observable at commonly quoted intervals, forward prices, credit risks, default rates, and inputs derived from or corroborated by observable market data.
Level 3 inputs are unobservable inputs that reflect CMS Energy’s or Consumers’ own assumptions about how market participants would value their assets and liabilities.
To the extent possible, CMS Energy and Consumers use quoted market prices or other observable market pricing data in valuing assets and liabilities measured at fair value. If this information is unavailable, they use market-corroborated data or reasonable estimates about market participant assumptions. CMS Energy and Consumers classify fair value measurements within the fair value hierarchy based on the lowest level of input that is significant to the fair value measurement in its entirety.
ASSETSAND LIABILITIES MEASUREDAT FAIR VALUEONA RECURRING BASIS
Presented in the following tables are CMS Energy’s and Consumers’ assets and liabilities, by level within the fair value hierarchy, reported at fair value on a recurring basis:
| | | | | | | | | | | | | | | | |
| In Millions | |
| June 30, 2012 | | Total | | | Level 1 | | | Level 2 | | | Level 3 | |
CMS Energy, including Consumers | | | | | | | | | | | | | | | | |
Assets | | | | | | | | | | | | | | | | |
Cash equivalents | | | $ 141 | | | | $ 141 | | | | $ - | | | | $ - | |
Restricted cash equivalents | | | 14 | | | | 14 | | | | - | | | | - | |
Nonqualified deferred compensation plan assets | | | 5 | | | | 5 | | | | - | | | | - | |
SERP | | | | | | | | | | | | | | | | |
Mutual funds | | | 127 | | | | 127 | | | | - | | | | - | |
Derivative instruments | | | | | | | | | | | | | | | | |
Commodity contracts | | | 7 | | | | 1 | | | | 1 | | | | 5 | |
Total | | | $ 294 | | | | $ 288 | | | | $ 1 | | | | $ 5 | |
| | |
Liabilities | | | | | | | | | | | | | | | | |
Nonqualified deferred compensation plan liabilities | | | $ 5 | | | | $ 5 | | | | $ - | | | | $ - | |
Derivative instruments | | | | | | | | | | | | | | | | |
Commodity contracts | | | 6 | | | | - | | | | 4 | | | | 2 | |
Total | | | $ 11 | | | | $ 5 | | | | $ 4 | | | | $ 2 | |
| | |
Consumers | | | | | | | | | | | | | | | | |
Assets | | | | | | | | | | | | | | | | |
Cash equivalents | | | $ 122 | | | | $ 122 | | | | $ - | | | | $ - | |
Restricted cash equivalents | | | 14 | | | | 14 | | | | - | | | | - | |
CMS Energy common stock | | | 30 | | | | 30 | | | | - | | | | - | |
Nonqualified deferred compensation plan assets | | | 3 | | | | 3 | | | | - | | | | - | |
SERP | | | | | | | | | | | | | | | | |
Mutual funds | | | 86 | | | | 86 | | | | - | | | | - | |
Derivative instruments | | | | | | | | | | | | | | | | |
Commodity contracts | | | 5 | | | | - | | | | - | | | | 5 | |
Total | | | $ 260 | | | | $ 255 | | | | $ - | | | | $ 5 | |
| | |
Liabilities | | | | | | | | | | | | | | | | |
Nonqualified deferred compensation plan liabilities | | | $ 3 | | | | $ 3 | | | | $ - | | | | $ - | |
Total | | | $ 3 | | | | $ 3 | | | | $ - | | | | $ - | |
| | |
| | | | | | | | | | | | | | | | |
| In Millions | |
| December 31, 2011 | | Total | | | Level 1 | | | Level 2 | | | Level 3 | |
CMS Energy, including Consumers | | | | | | | | | | | | | | | | |
Assets | | | | | | | | | | | | | | | | |
Cash equivalents | | $ | 109 | | | $ | 109 | | | $ | - | | | $ | - | |
Restricted cash equivalents | | | 15 | | | | 15 | | | | - | | | | - | |
Nonqualified deferred compensation plan assets | | | 4 | | | | 4 | | | | - | | | | - | |
SERP | | | | | | | | | | | | | | | | |
Cash equivalents | | | 1 | | | | 1 | | | | - | | | | - | |
Mutual funds | | | 113 | | | | 113 | | | | - | | | | - | |
Derivative instruments | | | | | | | | | | | | | | | | |
Commodity contracts | | | 3 | | | | 1 | | | | - | | | | 2 | |
Total | | $ | 245 | | | $ | 243 | | | $ | - | | | $ | 2 | |
| | |
Liabilities | | | | | | | | | | | | | | | | |
Nonqualified deferred compensation plan liabilities | | $ | 4 | | | $ | 4 | | | $ | - | | | $ | - | |
Derivative instruments | | | | | | | | | | | | | | | | |
Commodity contracts | | | 7 | | | | - | | | | 3 | | | | 4 | |
Total | | $ | 11 | | | $ | 4 | | | $ | 3 | | | $ | 4 | |
| | |
Consumers | | | | | | | | | | | | | | | | |
Assets | | | | | | | | | | | | | | | | |
Cash equivalents | | $ | 56 | | | $ | 56 | | | $ | - | | | $ | - | |
Restricted cash equivalents | | | 14 | | | | 14 | | | | - | | | | - | |
CMS Energy common stock | | | 35 | | | | 35 | | | | - | | | | - | |
Nonqualified deferred compensation plan assets | | | 3 | | | | 3 | | | | - | | | | - | |
SERP | | | | | | | | | | | | | | | | |
Cash equivalents | | | 1 | | | | 1 | | | | - | | | | - | |
Mutual funds | | | 74 | | | | 74 | | | | - | | | | - | |
Derivative instruments | | | | | | | | | | | | | | | | |
Commodity contracts | | | 2 | | | | - | | | | - | | | | 2 | |
Total | | $ | 185 | | | $ | 183 | | | $ | - | | | $ | 2 | |
| | |
Liabilities | | | | | | | | | | | | | | | | |
Nonqualified deferred compensation plan liabilities | | $ | 3 | | | $ | 3 | | | $ | - | | | $ | - | |
Total | | $ | 3 | | | $ | 3 | | | $ | - | | | $ | - | |
| | |
Cash Equivalents: Cash equivalents and restricted cash equivalents consist of money market funds with daily liquidity.
Nonqualified Deferred Compensation Plan Assets: The nonqualified deferred compensation plan assets consist of various mutual funds that are valued using a market approach. CMS Energy and Consumers value these assets using the daily quoted net asset values that are the basis for transactions to buy or sell shares in each fund. CMS Energy and Consumers report these assets in other non-current assets on their consolidated balance sheets.
SERP Assets: CMS Energy and Consumers value their SERP assets using a market approach, incorporating prices and other relevant information from market transactions. The SERP invests in mutual funds that hold primarily fixed-income instruments of varying maturities. In order to meet their investment objectives, the funds hold investment-grade debt securities, and may invest a portion of their assets in high-yield securities, foreign debt, and derivative instruments. CMS Energy and Consumers value these funds using the daily quoted net asset values that are the basis for transactions to buy or sell shares in each fund. The SERP cash equivalents at December 31, 2011 consisted of a money market fund with daily liquidity. CMS Energy and Consumers report their SERP assets in other non-current assets on their consolidated balance sheets. For additional details about SERP securities, see Note 7: Financial Instruments.
Nonqualified Deferred Compensation Plan Liabilities:CMS Energy and Consumers value their nonqualified deferred compensation plan liabilities based on the fair values of the plan assets, as they reflect what is owed to the plan participants in accordance with their investment elections. CMS Energy and Consumers report these liabilities in other non-current liabilities on their consolidated balance sheets.
Derivative Instruments:CMS Energy and Consumers value their derivative instruments using either a market approach that incorporates information from market transactions, or an income approach that discounts future expected cash flows to a present value amount. CMS Energy has exchange-traded derivative contracts that are valued based on Level 1 quoted prices, as well as derivatives valued using Level 2 inputs, including commodity forward prices, interest rates, credit ratings, default rates, and market-based seasonality factors. CMS Energy and Consumers have classified certain derivatives as Level 3 since the fair value measurements incorporate assumptions that cannot be observed or confirmed through market transactions.
The most significant derivatives classified as Level 3 are a power option sold by CMS ERM and FTRs held by Consumers. The power option sold by CMS ERM is valued using unobservable assumptions about price volatility and the pricing differential between the delivery point and the nearest active market. Due to the lack of quoted pricing information, Consumers determines the fair value of its FTRs based on Consumers’ average historical settlements. Under regulatory accounting, all changes in fair value associated with FTRs are deferred as regulatory assets or liabilities until the instruments are settled. In valuing their derivative instruments not classified as Level 1, CMS Energy and Consumers may incorporate adjustments for credit risk, or the risk of nonperformance, as deemed appropriate. CMS Energy and Consumers apply credit risk adjustments, where appropriate, to the net receivable from or payable to each counterparty. For additional details about derivative contracts, see Note 8: Derivative Instruments.
ASSETSAND LIABILITIES MEASUREDAT FAIR VALUEONA RECURRING BASISUSING SIGNIFICANT LEVEL 3 INPUTS
Presented in the following tables are reconciliations of changes in the fair values of Level 3 assets and liabilities at CMS Energy and Consumers:
| | | | | | | | | | | | | | | | |
| In Millions | |
| | | Three Months Ended | | | Six Months Ended | |
| June 30 | | 2012 | | | 2011 | | | 2012 | | | 2011 | |
CMS Energy, including Consumers | | | | | | | | | | | | | | | | |
Balance at beginning of period | | | $ (1 | ) | | | $ (2 | ) | | | $ (2 | ) | | | $ (3 | ) |
Total gains included in earnings1 | | | - | | | | - | | | | 2 | | | | - | |
Total gains offset through regulatory accounting | | | 9 | | | | 2 | | | | 7 | | | | 2 | |
Purchases | | | - | | | | - | | | | - | | | | 1 | |
Settlements | | | (5 | ) | | | - | | | | (4 | ) | | | - | |
Balance at end of period | | | $ 3 | | | | $ - | | | | $ 3 | | | | $ - | |
| | |
Unrealized gains included in earnings relating to assets and liabilities still held at end of period1 | | | $ - | | | | $ - | | | | $ 2 | | | | $ 1 | |
| | |
Consumers | | | | | | | | | | | | | | | | |
Balance at beginning of period | | | $ 1 | | | | $ - | | | | $ 2 | | | | $ 1 | |
Total gains offset through regulatory accounting | | | 9 | | | | 2 | | | | 7 | | | | 2 | |
Purchases | | | - | | | | 1 | | | | - | | | | 1 | |
Settlements | | | (5 | ) | | | - | | | | (4 | ) | | | (1 | ) |
Balance at end of period | | | $ 5 | | | | $ 3 | | | | $ 5 | | | | $ 3 | |
| | |
1 CMS Energy records realized and unrealized gains and losses for Level 3 recurring fair value measurements in earningssettlement as a
component reduction of operating revenue or maintenance and other operating expensesexpenses. In March 2013, a party filed an appeal with the Michigan Court of Appeals to dispute the MPSC’s December 2012 order.
Renewable Energy Plan: In January 2013, Consumers received a $69 million renewable energy grant for Lake Winds® Energy Park, which began operations in November 2012. The grant was received from the U.S. Department of Treasury under Section 1603 of the American Recovery and Reinvestment Tax Act of 2009.
As reflected in Consumers’ 2011 biennial renewable energy plan, which the MPSC approved in 2012, this grant reduces Consumers’ cost of complying with the renewable standards prescribed by the 2008 Energy Law and, accordingly, reduces the overall renewable energy surcharge to be collected from customers. At June 30, 2013, Consumers had a $68 million regulatory liability recorded for the grant. The regulatory liability will be amortized over the life of Lake Winds® Energy Park.
In May 2013, Consumers filed a revised renewable energy plan that reduced the size and cost of the Cross Winds® Energy Park. In June 2013, the MPSC issued an order approving Consumers’ 2011 renewable
50
Table of Contents
cost reconciliation filing. In July 2013, Consumers filed its 2012 renewable cost reconciliation and annual report.
Energy Optimization Plan: In May 2013, Consumers filed its fourth annual report and reconciliation for its energy optimization plan, requesting approval of its energy optimization plan costs for 2012. Consumers also requested approval to collect $17 million from customers as an incentive payment for exceeding statutory targets under both its gas and electric energy optimization plans during 2012.
CONSUMERS GAS UTILITY
Gas Revenue Decoupling Mechanism: The MPSC’s 2009 order in Consumers’ gas rate case authorized Consumers to implement a gas revenue decoupling mechanism. This mechanism, which the MPSC extended through April 2012 in its 2010 order in Consumers’ gas rate case, allowed Consumers to adjust future gas rates to the degree that actual average weather-adjusted sales per customer differed from the rate order. This mechanism was not affected by a separate Michigan Court of Appeals decision on electric revenue decoupling.
In December 2012, the MPSC approved Consumers’ reconciliation of the gas revenue decoupling mechanism for the period June 2010 through May 2011 and authorized recovery of $16 million over a three-month period that began in February 2013. Due to high customer deliveries during this three-month period, Consumers collected more than the amount authorized and, at June 30, 2013, had a regulatory liability of $5 million recorded for the amount to be refunded to customers. In January 2013, ABATE filed an appeal with the Michigan Court of Appeals to dispute the MPSC’s conclusion that Consumers is eligible to recover the portion of the authorized recovery amount allocated to transport customers.
Consumers filed its consolidated statementsfinal reconciliation of income.
the gas revenue decoupling mechanism in August 2012, requesting recovery of $17 million from customers for the period June 2011 through April 2012. At June 30, 2013, Consumers had a $17 million regulatory asset recorded for gas revenue decoupling for that period.3:2: CONTINGENCIES AND COMMITMENTS
CMS Energy and Consumers are involved in various matters that give rise to contingent liabilities. Depending on the specific issues, the resolution of these contingencies could have a material effect on CMS Energy’s and Consumers’ liquidity, financial condition, and results of operations. In their disclosures of these matters, CMS Energy and Consumers provide an estimate of the possible loss or range of loss when such an estimate can be made. Disclosures that state that CMS Energy or Consumers cannot predict the outcome of a matter indicate that they are unable to estimate a possible loss or range of loss for the matter.
CMS ENERGY CONTINGENCIES
CMS ENERGY CONTINGENCIES
Gas Index Price Reporting Investigation: In 2002, CMS Energy notified appropriate regulatory and governmental agencies that some employees at CMS MST and CMS Field Services appeared to have provided inaccurate information regarding natural gas trades to various energy industry publications which compile and report index prices. Although CMS Energy has not received any formal notification that the DOJ has completed its investigation, the DOJ’s last request for information occurred in 2003, and CMS Energy completed its response to this request in 2004. CMS Energy is unable to predict the outcome of the DOJ investigation and what effect, if any, the investigation will have on CMS Energy.
Gas Index Price Reporting Litigation: CMS Energy, along with CMS MST, CMS Field Services, Cantera Natural Gas, Inc., and Cantera Gas Company, arehave been named as defendants in various lawsuits arising as a result of alleged inaccurate natural gas price reporting to publications that report trade
51
Table of Contents
information. Allegations include manipulation of NYMEX natural gas futures and options prices, price-fixing conspiracies, restraint of trade, and artificial inflation of natural gas retail prices in Colorado, Kansas, Missouri, and Wisconsin. The following provides more detail on these proceedings:the cases in which CMS Energy affiliates remain as parties:
·In 2005, CMS Energy, CMS MST, and CMS Field Services were named as defendants in a putative class action filed in Kansas state court, Learjet, Inc., et al. v. Oneok, Inc., et al. The complaint alleges that during the putative class period, January 1, 2000 through October 31, 2002, the defendants engaged in a scheme to violate the Kansas Restraint of Trade Act. The plaintiffs are seeking statutory full consideration damages consisting of the full consideration paid by plaintiffs for natural gas allegedly purchased from defendants.
·In 2007, a class action complaint, Heartland Regional Medical Center, et al. v. Oneok, Inc. et al., was filed as a putative class action in Missouri state court alleging violations of Missouri antitrust laws. Defendants, including CMS Energy, CMS Field Services, and CMS MST, are alleged to have violated the Missouri antitrust law in connection with their natural gas reporting activities.
Breckenridge Brewery of Colorado, LLC and BBD Acquisition Co. v. Oneok, Inc., et al., a class action complaint brought on behalf of retail direct purchasers of natural gas in Colorado, was filed in Colorado state court in 2006. Defendants, including CMS Energy, CMS Field Services, and CMS MST, are alleged to have violated the Colorado Antitrust Act of 1992 in connection with their natural gas reporting activities. Plaintiffs are seeking full refundconsideration damages and treble damages.
·A class action complaint, Arandell Corp., et al. v. XCEL Energy Inc., et al., was filed in 2006 in Wisconsin state court on behalf of Wisconsin commercial entities that purchased natural gas between January 1, 2000 and October 31, 2002. The defendants, including CMS Energy, CMS ERM, and Cantera Gas Company, are alleged to have violated Wisconsin’s antitrust statute. The plaintiffs are seeking full consideration damages, plus exemplary damages and attorneys’ fees.
| The plaintiffs are seeking full consideration damages, plus exemplary damages and attorneys’ fees. After dismissal on jurisdictional grounds in 2009, plaintiffs filed a new complaint in the U.S. District Court for the Eastern District of Michigan. In 2010, the MDL judge issued an opinion and order granting the CMS Energy defendants’ motion to dismiss the Michigan complaint on statute-of-limitations grounds and all CMS Energy defendants have been dismissed from the Arandell (Michigan) action. |
·Another class action complaint, Newpage Wisconsin System v. CMS ERM, et al., was filed in 2009 in circuit court in Wood County, Wisconsin, against CMS Energy, CMS ERM, Cantera Gas Company, and others. The plaintiff is seeking full consideration damages, treble damages, costs, interest, and attorneys’ fees.
·In 2005, J.P. Morgan Trust Company, in its capacity as Trustee of the FLI Liquidating Trust, filed an action in Kansas state court against CMS Energy, CMS MST, CMS Field Services, and others. The complaint alleges various claims under the Kansas Restraint of Trade Act. The plaintiff is seeking statutory full consideration damages for its purchases of natural gas in 2000 and 2001.
After removal to federal court, all of the cases described above were transferred to the MDL. CMS Energy was dismissed from the Learjet, Heartland, and J.P. Morgan cases in 2009, but other CMS Energy defendants remained parties. All CMS Energy defendants were dismissed from the Breckenridge case in 2009. In 2010, CMS Energy and Cantera Gas Company were dismissed from the Newpage case and the Arandell (Wisconsin) case was reinstated against CMS ERM.case. In July 2011, all claims against remaining CMS Energy defendants in the MDL cases were dismissed based on FERC preemption. Plaintiffs have filed appeals in all of the cases. The issues on appeal arewere whether the district court erred in dismissing the cases based on FERC preemption and denying the plaintiffs’ motions for leave to amend their complaints to add a federal Sherman Act antitrust claim. The plaintiffs did not appeal the dismissal of CMS Energy as a defendant in these cases, but other CMS Energy entities remain as defendants.
In April 2013, the U.S. Court of Appeals for the Ninth Circuit reversed the MDL decision and remanded the case to the MDL judge for further proceedings. The appellate court found that FERC preemption does not apply under the facts of these cases. The Court affirmed the MDL court’s denial of leave to amend to add federal antitrust claims.
The joint defense group in these cases, of which CMS Energy defendants are members, plans to file a petition with the U.S. Supreme Court in an attempt to overturn the decision of the U.S. Court of Appeals for the Ninth Circuit. The petition is due in August 2013.
52
Table of Contents
These cases involve complex facts, a large number of similarly situated defendants with different factual positions, and multiple jurisdictions. Presently, any estimate of liability would be highly speculative; the amount of CMS Energy’s possible loss would be based on widely varying models previously untested in this context. If the outcome after appeals is unfavorable, these cases could have a material adverse impact on CMS Energy’s liquidity, financial condition, and results of operations.
Bay Harbor: As part CMS Energy retained environmental remediation obligations for the collection and treatment of leachate, a liquid consisting of water and other substances, at Bay Harbor after selling its interests in the development of Bay Harbor by certain subsidiaries of CMS Energy, and under an agreement with the MDEQ, third parties constructed a golf course and park over several abandoned CKD piles left over from the former cement plant operations on the Bay Harbor site. The third parties also undertook a series of response activities, including constructing a leachate collection system in one area where CKD-impacted groundwater was entering Little Traverse Bay.2002. Leachate is produced when water enters into the CKD piles. In 2002, CMS Energy sold its interest in Bay Harbor, but retained its obligations under environmental indemnities entered into at the start of the project.
In 2005, the EPA, along with CMS Land and CMS Capital, voluntarily executed an Administrative Order on Consent under Superfund, and the EPA approved a Removal Action Work Plan to address contamination issues. Collection systems required under the plan have been installed and effectiveness monitoring of the systems at the shoreline is ongoing. CMS Land, CMS Capital, and the EPA agreed upon augmentation measures to address areas where pH measurements were not satisfactory. Several augmentation measures were implemented and completed in 2009, with the remaining measure completed in 2010.
In May 2011, CMS Energy received approvalcement kiln dust piles left over from the EPA on a revised scope of remedies that CMS Energy had submitted in December 2010. CMS Energy reached a tentative agreement with the MDEQ in December 2011 that identifies the final remediesformer cement plant operations at the site. The EPA notified the MDEQ in March 2012 that it had no objections to this tentative agreement, and in JuneIn 2012, CMS Energy and the MDEQ finalized an agreement that established the agreement. Followingfinal remedies and the executionfuture release criteria at the site. CMS Energy is in the process of this agreement, a change in Michigan law was enacted that included additional provisions regarding monitoring and compliance requirements for certain contaminants. As a consequence, and as allowedcompleting all construction necessary to implement the remedies required by the agreement with the MDEQ, CMS Energy eliminated certain remedies from its remediation plan that were previously required under the agreement. CMS Energy also agreedand will continue to perform additional monitoringmaintain and to modify certain areas of the collection systems.
In 2010, the MDEQ issued an NPDES permit that authorizes CMS Landoperate a system to discharge treated leachate into Little Traverse Bay.Bay under an NPDES permit issued in 2010. This permit requires renewal every five years. Discharge of treated leachate under the permit has commenced. In 2010, CMS Land also committed to investigate the potential for a deep injection well on the Bay Harbor site as an alternative long-term method of leachate disposal. The agreement requiring this investigation was amended in June 2012 to require that CMS Land perform this investigation only if CMS Land is unable to meet the requirements of its NPDES discharge permit. In 2008, the MDEQ and the EPA granted permits for CMS Land or its wholly owned subsidiary, Beeland Group LLC, to construct and operate an off-site deep injection well in Antrim County, Michigan, to dispose of leachate from Bay Harbor. Certain environmental groups, a local township, and a local county filed lawsuits appealing the permits and seeking an injunction. A temporary restraining order was issued by the trial court. The legal proceeding was stayed in 2009 and can be renewed by either party at any time. CMS Land no longer expects to incur costs related to these proposed deep injection wells at either the Bay Harbor site or in Antrim County.
Following these developments, CMS Energy reassessed its remediation strategy and anticipated costs, and determined that no adjustment was required to the liability recorded for CMS Energy’s remaining obligations at the site.
Various claims have been brought against CMS Land or its affiliates, including CMS Energy, alleging environmental damage to property, loss of property value, insufficient disclosure of environmental matters, breach of agreement relating to access, or other matters. In October 2010, CMS Land and other parties received a demand for payment from the EPA in the amount of $7 million, plus interest, whereby the EPA is seeking recovery, as allowed under Superfund, of the EPA’s response costs incurred at the Bay Harbor site. CMS Land has communicated to the EPA in November 2010 that it does not believe that this is a valid claim.
CMS Energy has recorded a cumulative charge related to Bay Harbor of $225$228 million, which includes accretion expense. At June 30, 2012,2013, CMS Energy had a recorded liability of $68$58 million for its remaining obligations. CMS Energy calculated this liability based on discounted projected costs, using a discount rate of 4.34 percent and an inflation rate of one percent on annual operating and maintenance costs. CMS Energy based the discount rate on the interest rate for 30-year U.S. Treasury securities at December 31, 2010. The undiscounted amount of the remaining obligation is $89$77 million. CMS Energy expects to pay $11 million during the remainder of 2012, $8$12 million in 2013, $5 million in 2014, $4 million in each of 2014, 2015, $4 million in 2016, and 2017, and the remaining amount thereafter on long-term liquid disposal and operating and maintenance costs.
CMS Energy’s estimate of response activity costs and the timing of expenditures could change if there are additional major changes in circumstances or assumptions, including but not limited to:
inability to complete·a significant increase in the cost of the present long-term water disposal strategy at a reasonable cost;strategy;
·requirements to alter the present long-term water disposal strategy upon expiration of the NPDES permit if the MDEQ or EPA identify a more suitable alternative;
·an increase in the number of contamination areas;
different remediation techniques;
·the nature and extent of contamination;
·delays in the receipt of requested permits;
·delays following the receipt of any requested permits due to legal appeals of third parties;
·unanticipated difficulties in meeting the technical commitments in the agreement with the MDEQ;
·additional or new legal or regulatory requirements; or
·new or different landowner claims.
Depending on the size of any indemnity obligation or liability under environmental laws, an adverse outcome of this matter could have a material adverse effect on CMS Energy’s liquidity and financial condition and could negatively affect CMS Energy’s financial results. Although a liability for its present estimate of remaining response activity costs has been recorded, CMS Energy cannot predict the ultimate financial impact or outcome of this matter.
53
Table of Contents
Equatorial Guinea Tax Claim: In January 2002, CMS Energy sold its oil, gas, and methanol investments in Equatorial Guinea. The government of Equatorial Guinea claims that CMS Energy owes $142 million in taxes, plus penalties and interest, in connection with the sale. CMS Energy has concluded that the government’s tax claim is without merit. The government of Equatorial Guinea indicated through a request for arbitration in October 2011 that it still intends to pursue its claim. CMS Energy is vigorously contesting the claim, and cannot predict the financial impact or outcome of this matter.
CONSUMERS ELECTRIC UTILITY CONTINGENCIES
Panhandle Tax Indemnification: CMS Energy recorded a liability in 2003 for an indemnification provided in conjunction with the sale of Panhandle. As of March 31, 2012 the statute of limitations had expired for this indemnification. Accordingly, CMS Energy eliminated the liability during the three months ended March 31, 2012 and recognized an after-tax benefit of $7 million in discontinued operations.
CONSUMERS ELECTRIC UTILITY CONTINGENCIES
Electric Environmental Matters: Consumers’ operations are subject to environmental laws and regulations. Historically, Consumers has generally been able to recover, in customer rates, the costs to operate its facilities in compliance with these laws and regulations.
Cleanup and Solid Waste: Consumers expects to incur remediation and other response activity costs at a number of sites under NREPA. Consumers believes that these costs should be recoverable in rates, but cannot guarantee that outcome. Consumers estimates that its liability for NREPA sites will be between $4 million and $7$6 million. At June 30, 2012,2013, Consumers had a recorded liability of $4 million, the minimum amount in the range of its estimated probable NREPA liability.
Consumers is a potentially responsible party at a number of contaminated sites administered under the Superfund. Superfund liability is joint and several. In addition to Consumers, many other creditworthy parties with substantial assets are potentially responsible with respect to the individual sites. In 2010, Consumers received official notification from the EPA that identified Consumers as a potentially responsible party for cleanup of PCBs at the Kalamazoo River Superfund site. The notification claimed that the EPA has reason to believe that Consumers disposed of PCBs and arranged for the disposal and treatment of PCB-containing materials at portions of the site. Consumers responded to the EPA in 2010, stating that it has no information showing that it disposed of PCBs or arranged for disposal or treatment of PCB-containing material at portions of the site and requesting further information from the EPA before Consumers would commit to perform or finance cleanup activities at the site. In April 2011, Consumers received a follow-up letter from the EPA requesting that Consumers as a potentially responsible party at the Kalamazoo River Superfund site, agree to participate in a removal action plan along with several other companies for an area of lower Portage Creek. The letter also indicated that under Sections 106 and 107 of Superfund, Consumers may be liable for reimbursement ofCreek, which is connected to the EPA’s costs and potential penalties for noncompliance with any unilateral order that the EPA may issue requiring performance under the removal action plan.Kalamazoo River. All parties, including Consumers, that were asked to participate in the removal action plan
declined to accept liability. In August 2011, the EPA announced that it would proceed with the removal action plan and would continue to pursue potentially responsible parties to perform or pay for some or all of the work. The EPA has provided limited information regarding Consumers’ potential responsibility for contamination at the site and has not yet given an indication of the share of any cleanup costs for which Consumers could be held responsible. Consumers continues to investigate the EPA’s claim that it disposed of PCBs or arranged for disposal or treatment of PCB-containing material at portions of the site. Until further information is received from the EPA, Consumers is unable to estimate a range of potential liability for cleanup of the river.
Based on its experience, Consumers estimates that its share of the total liability for other known Superfund sites will be between $2 million and $8 million. Various factors, including the number of potentially responsible parties involved with each site, affect Consumers’ share of the total liability. At June 30, 2012,2013, Consumers had a recorded liability of $2 million for its share of the total liability at these sites, the minimum amount in the range of its estimated probable Superfund liability.
The timing of payments related to Consumers’ remediation and other response activities at its Superfund and NREPA sites is uncertain. Consumers periodically reviews these cost estimates. Any significant change in the underlying assumptions, such as an increase in the number of sites, different remediation techniques, the nature and extent of contamination, and legal and regulatory requirements, could affect its estimates of NREPA and Superfund liability.
Ludington PCB: In 1998, during routine maintenance activities, Consumers identified PCB as a component in certain paint, grout, and sealant materials at Ludington. Consumers removed and replaced part of the PCB material with non-PCB material. Since proposing a plan to take action with respect to the remaining materials, Consumers has had several communications with the EPA.EPA regarding this matter. Consumers is not able to predict when the EPA will issue a final ruling and cannot predict the financial impact or outcome of this matter.
Electric Utility Plant Air Permit Issues and Notices of Violation: In 2007, Consumers received an NOV/FOV from the EPA alleging that fourteen utility boilers exceeded the visible emission limits in their associated air permits. Consumers has responded formally to the NOV/FOV denying the allegations. In
54
Table of Contents
addition, in 2008, Consumers received an NOV for three of its coal-fueled facilities alleging, among other things, violations of NSR PSD regulations relating to ten projects from 1986 to 1998 allegedly subject to review under the NSR. The EPA has alleged that some utilities have classified incorrectly major plant modifications as RMRR rather than seeking permits from the EPA or state regulatory agencies to modify their plants. Consumers responded to the information requests from the EPA on this subject in the past. Consumers believes that it has properly interpreted the requirements of RMRR.
Consumers is engaged in discussions with the EPA on all of these matters. Depending upon the outcome of these discussions, the EPA could bring legal action against Consumers and/or Consumers could be required to install additional pollution control equipment at some or all of its coal-fueled electric generating plants, surrender emission allowances, engage in Supplemental Environmental Mitigation Projects, and/or pay fines. Additionally, Consumers would need to assess the viability of continuing operations at certain plants. The potential costs relating to these matters could be material and the extent of cost recovery cannot be reasonably estimated. Although Consumers cannot predict the financial impact or outcome of these matters,material. Consumers expects that it would be able to recover some or all of the costs in rates, consistent with the recovery of other reasonable costs of complying with environmental laws and regulations.
regulations, but cannot reasonably estimate the extent of cost recovery. Although Consumers cannot predict the financial impact or outcome of the entirety of these discussions, it does not expect any future loss from civil penalties and/or Environmental Mitigation Projects to be material.Nuclear Matters:Matters: The matters discussed in this section relate to Consumers’ previously owned nuclear generating plants. Consumers no longer owns or operates any nuclear generating facilities.
In 1997,
Consumers filed a U.S. Court of Appeals decision confirmed that the DOE was to begin accepting deliveries of spent nuclear fuelcomplaint in 2002 for disposal by January 1998. Subsequent U.S. Court of Appeals litigation, in which Consumers and other utilities participated, had not been successful in producing more specific relief fordamages resulting from the DOE’s failure to accept the spent nuclear fuel. A number of court decisions have supported the right of utilities to pursue damage claims in the U.S. Court of Claims against the DOE for failure to take delivery of spent nuclear fuel. Consumers filed a complaint in 2002.
fuel from Palisades and Big Rock. In July 2011, Consumers entered into an agreement with the DOE to settle its claims for $120 million. In September 2011, Consumers filed an application with the MPSC regarding the regulatory treatment of the settlement amount. For further information, see Note 4: Regulatory Matters.
As part of thethis agreement, with the DOE, Consumers also settled its liability to the DOE to fund the disposal of spent nuclear fuel used at Palisades and Big Rock before 1983. This liability, which totaled $163 million, comprised $44 million collected from customers for spent nuclear fuel disposal fees and $119 millionIn December 2012, the MPSC issued an order establishing the regulatory treatment of interest accrued on those fees, and was to be paid no later than when the DOE began accepting delivery of spent nuclear fuel. CMS Energy and Consumers classified the liability as long-term debt on their consolidated balance sheets.
Following the settlement Consumers terminated its letter of credit to Entergy, which Consumers had provided as security for its retained obligation to the DOE in connection with its sale of Palisades and the Big Rock ISFSI to Entergy in 2007.
amount. In its November 2010 electric rate casethis order, the MPSC had directedalso relieved Consumers of its obligation to establish an independent trust fund for the amount that was payable to the DOE. Following its settlementDOE prior to the settlement. In March 2013, a party in this case filed an appeal with the DOE, Consumers petitionedMichigan Court of Appeals to dispute the December 2012 MPSC to relieve itorder. For further information, see Note 1, Regulatory Matters.
Renewable Energy Matters: In April 2013, a group of landowners filed a lawsuit alleging, among other things, personal injury and loss of property value and land use as a result of the obligation to fundoperations of Lake Winds® Energy Park. Consumers cannot predict the trust.
CONSUMERS GAS UTILITY CONTINGENCIESultimate financial impact or outcome of this matter.
CONSUMERS GAS UTILITY CONTINGENCIES
Gas Environmental Matters:Consumers expects to incur remediation and other response activity costs at a number of sites under the NREPA. These sites include 23 former MGP facilities. Consumers operated the facilities on these sites for some part of their operating lives. For some of these sites, Consumers has no present ownership interest or may own only a portion of the original site.
55
Table of Contents
At June 30, 2012,2013, Consumers had a recorded liability of $128$121 million for its remaining obligations for these sites. This amount represents the present value of long-term projected costs, using a discount rate of 2.57 percent and an inflation rate of 2.5 percent. Consumers based the discount rate on the interest rate for 20-year U.S. Treasury securities at December 31, 2011. The undiscounted amount of the remaining obligation is $140$130 million. Consumers expects to incur remediation and other response activity costs during the remainder of 2012in 2013 and in each of the next four years as follows:
| | | | | | | | | | | | | | | | In Millions | | | | | | | | | In Millions | |
| | | 2012 | | | 2013 | | | 2014 | | | 2015 | | | 2016 | | | 2013 | | 2014 | | 2015 | | 2016 | | 2017 | |
Consumers | | | | | | | | | | | | | | | | | | | | | |
Remediation and other response activity costs | | | $ 10 | | | | $ 11 | | | | $ 11 | | | | $ 20 | | | | $ 11 | | | $ | 9 | | $ | 9 | | $ | 16 | | $ | 10 | | $ | 9 | |
| | | | | | | | | | | | | | | | | | |
Consumers periodically reviews these cost estimates. Any significant change in the underlying assumptions, such as an increase in the number of sites, changes in remediation techniques, or legal and regulatory requirements, could affect Consumers’ estimates of annual response activity costs and the MGP liability.
Pursuant to orders issued by the MPSC, Consumers defers its MGP-related remediation costs and recovers them from its customers over a ten-year period. At June 30, 2012,2013, Consumers had a regulatory asset of $154$151 million related to the MGP sites.
CONSUMERS OTHER CONSUMERS OTHER CONTINGENCIES
Other Environmental Matters: Consumers is initiatinginitiated preliminary investigations during 2012 at a number of potentially contaminated sites it presently owns with the intention of determining whether any contamination exists and the extent of any identified contamination. The sites to bebeing investigated include combustion turbine sites, generating sites, compressor stations, and remoteabove-ground fuel storage tanks. At June 30, 2012, evidence of contamination led Consumers to plan remedial investigations and certain interim response measures at some of these sites. The cost of these activities has been incorporated into Consumers’ estimated liability for NREPA sites. Consumers will continue its preliminary investigations at other potentially contaminated sites through the remainder of 2012.2013. Consumers cannot predict an outcome at this stage of the investigations.
GGUARANTEES
Presented in the following table are CMS Energy’s and Consumers’ guarantees at June 30, 2012:2013:
| | | | | | | | | | | | | | | | In Millions | |
| | | | | | | | | | | In Millions | | | | | | | Maximum | | Carrying | |
| Guarantee Description | | Issue Date | | | Expiration Date | | | Maximum
Obligation | | Carrying
Amount | | | Issue Date | | Expiration Date | | Obligation | | Amount | |
CMS Energy, including Consumers | | | | | | | | | | | | | | | | | |
Indemnity obligations from asset sales and
other agreements | | | Various | | |
| Various through
September 2029 |
| | | $ 512 | 1 | | | $ 16 | | | Various | | Various through September 2029 | | $ | 482 | 1 | $ | 15 | |
Guarantees and put options2 | | | Various | | |
| Various through
March 2021 |
| | | 60 | | | | 1 | | |
| | | |
Guarantees | | | Various | | Various through March 2021 | | 57 | | 1 | |
Consumers | | | | | | | | | | | | | | | | | |
Indemnity obligations and other guarantees | | | Various | | |
| Various through
September 2029 |
| | | $ 30 | | | | $ 1 | | | Various | | Various through September 2029 | | $ | 30 | | $ | 1 | |
| | | |
| 11 | The majority of this amount arises from stock and asset sale agreements under which CMS Energy or a subsidiary of CMS Energy, other than Consumers, indemnified the purchaser for losses resulting from various matters, including claims related to tax disputes, claims related to power purchase agreements, and defects in title to the assets or stock sold to the purchaser by CMS Energy subsidiaries. Except for items described elsewhere in this Note, CMS Energy believes the likelihood of material loss to be remote for the indemnity obligations not recorded as liabilities. |
| 256
| At June 30, 2012, the carrying amount of CMS Land’s put option agreements with certain Bay Harbor property owners was less than $1 million. If CMS Land is required to purchase a Bay Harbor property under a put option agreement, it may sell the property to recover the amount paid under the put option agreement.
|
Presented in the following table is additional information regarding CMS Energy’s and Consumers’ guarantees:
| | | | |
Guarantee Description | | How Guarantee Arose | | Events That Would Require Performance |
CMS Energy, including Consumers | | | | |
Indemnity obligations from asset sales and other | | Stock and asset sale | | Findings of misrepresentation, |
sales and other agreements
| | agreements | | breach of warranties, tax claims, and |
| | | | other specific events or |
| | | | circumstances |
| | | | |
Guarantees | | Normal operating | | Nonperformance or non-payment by a |
| | activity | | subsidiary under a related contract |
| | |
Put optionsConsumers
| | Bay Harbor | | Owners exercising put options requiring |
| | remediation efforts | | CMS Land to purchase property |
|
ConsumersIndemnity obligations and other guarantees
| | | | |
Guarantees and indemnity
| | Normal operating | | Nonperformance or claims made by a third |
obligations
| | activity | | party under a related contract |
|
CMS Energy, Consumers, and certain other subsidiaries of CMS Energy also enter into various agreements containing tax and other indemnity provisions for which they are unable to estimate the maximum potential obligation. These factors include unspecified exposure under certain agreements. CMS Energy and Consumers consider the likelihood that they would be required to perform or incur substantial losses related to these indemnities to be remote.
OTHER CONTINGENCIES
OTHER CONTINGENCIES
Other: In addition to the matters disclosed in this Note and Note 4:1, Regulatory Matters, there are certain other lawsuits and administrative proceedings before various courts and governmental agencies arising in the ordinary course of business to which CMS Energy, Consumers, and certain other subsidiaries of CMS Energy are parties. These other lawsuits and proceedings may involve personal injury, property damage, contracts, environmental matters, federal and state taxes, rates, licensing, employment, and other matters. Further, CMS Energy and Consumers occasionally self-report certain regulatory non-compliance matters that may or may not eventually result in administrative proceedings. CMS Energy and Consumers believe that the outcome of any one of these proceedings will not have a material adverse effect on their consolidated results of operations, financial condition, or liquidity.
4: REGULATORY MATTERS57
Table of Contents
Rate matters are critical to Consumers. The Michigan Attorney General, ABATE, the MPSC Staff, and certain other parties typically participate in MPSC proceedings concerning Consumers and often appeal significant MPSC orders. Depending upon the specific issues, the outcomes of rate cases and proceedings, including judicial proceedings challenging MPSC orders or other actions, could have a material adverse effect on CMS Energy’s and Consumers’ liquidity, financial condition, and results of operations. Consumers cannot predict the outcome of these proceedings.
3:CONSUMERS’ ELECTRIC UTILITY
Electric Rate Case:In June 2011, Consumers filed an application with the MPSC seeking an annual rate increase of $195 million, based on a 10.7 percent authorized return on equity, in order to recover new investment in system reliability, environmental compliance, and technology enhancements. Consumers self-implemented an annual rate increase of $118 million in December 2011, subject to refund with
interest. In June 2012, the MPSC authorized an annual rate increase of $118 million, based on a 10.3 percent return on equity. Consumers has until September 2012 to file a reconciliation of total revenues collected during self-implementation to those that would have been collected under final rates. While it cannot predict the outcome of this case, Consumers does not consider it probable that a refund of its self-implemented rates will be required.
The annual rate increase authorized by the MPSC included a $20 million increase in annual depreciation expense resulting from the new depreciation rates that the MPSC approved in June 2011 in Consumers’ electric depreciation case. These new depreciation rates went into effect with the June 2012 electric rate case order.
Also included in the authorized annual rate increase was the recovery of $14 million of development costs associated with Consumers’ proposed 830-MW coal-fueled plant. The MPSC authorized Consumers to recover these costs over a three-year period. Consumers canceled its plans to build this plant in December 2011, after having written off its development costs of $22 million in 2010. At June 30, 2012, Consumers recorded a $14 million regulatory asset for the recovery of these costs with a corresponding benefit recognized in earnings.
Big Rock Nuclear Decommissioning:The MPSC and FERC regulate the recovery of Consumers’ costs to decommission Big Rock. Subsequent to 2000, Consumers stopped funding a Big Rock decommissioning trust fund because the collection period for an MPSC-authorized decommissioning surcharge expired.
In 2010, the MPSC concluded that certain revenues collected during a statutory rate freeze from 2001 through 2003 should have been deposited in the Big Rock decommissioning trust fund and ordered Consumers to refund $85 million of revenue collected in excess of decommissioning costs plus interest. Consumers completed this refund in 2011. Consumers filed an appeal with the Michigan Court of Appeals in 2010 to dispute the MPSC’s conclusion that the collections received during the rate freeze should be subject to refund. In January 2012, the Michigan Court of Appeals rejected Consumers’ appeal. In March 2012, Consumers filed an appeal with the Michigan Supreme Court to dispute this decision. The Michigan Supreme Court denied Consumers’ appeal in June 2012.
Consumers has an $85 million regulatory asset recorded for $30 million it paid to Entergy to assume ownership responsibility for the Big Rock ISFSI and for $55 million of nuclear fuel storage costs it incurred as a result of the DOE’s failure to accept nuclear fuel. Consumers filed a complaint against the DOE in 2002 for this failure. In July 2011, Consumers entered into an agreement with the DOE to settle its claims for $120 million; Consumers recorded a $120 million regulatory liability related to this settlement. In September 2011, Consumers filed an application with the MPSC requesting authority to utilize $85 million of the settlement amount as recovery of its regulatory asset, and to refund to customers $23 million previously collected through rates for spent nuclear fuel costs. Various parties are opposing this request, seeking additional refunds, or seeking other relief. If the MPSC concludes that Consumers may retain any portion of the remaining $12 million of the settlement amount, Consumers will recognize that amount in earnings. For further information, see Note 3: Contingencies and Commitments – Consumers Electric Utility Contingencies – Nuclear Matters.
Electric Revenue Decoupling Mechanism:The MPSC’s 2009 electric rate case order authorized Consumers to implement an electric revenue decoupling mechanism, subject to certain conditions. This decoupling mechanism, which was extended through November 2011 in the 2010 electric rate case order, allowed Consumers to adjust future electric rates to compensate for changes in sales volumes resulting from the difference between the level of average sales per customer adopted in the order and actual average sales per customer. Various parties have filed appeals concerning Consumers’ electric revenue decoupling mechanism.
In March 2011, Consumers filed its first reconciliation of the electric revenue decoupling mechanism with the MPSC, requesting recovery of $27 million from customers for the period December 2009 through November 2010. In February 2012, the administrative law judge recommended that the MPSC approve Consumers’ reconciliation of the electric revenue decoupling mechanism for the full amount of its request. Consumers filed its second reconciliation of the electric revenue decoupling mechanism in March 2012, requesting recovery of $32 million from customers for the period December 2010 through November 2011.
In April 2012, the Michigan Court of Appeals ruled in an appeal filed by ABATE that disputed the MPSC’s decision to authorize an electric revenue decoupling mechanism for Detroit Edison. The Court concluded that the MPSC lacks statutory authority to approve or direct the use of a revenue decoupling mechanism for electric providers. Consumers cannot predict whether this decision will be appealed to the Michigan Supreme Court or the timing or outcome of any such appeal. As a result, Consumers determined that it no longer met the accounting criteria for recognition of a regulatory asset under an alternative revenue program, and wrote off its $59 million electric revenue decoupling mechanism regulatory asset at March 31, 2012. Although the case before the Court of Appeals related specifically to Detroit Edison, Consumers will continue to pursue all of its legal and regulatory avenues to recover its decoupling revenues.
As a result of the Court of Appeals decision in the Detroit Edison case, the MPSC requested all interested parties to submit comments regarding the future use of electric revenue decoupling mechanisms in Michigan. In May 2012, Consumers filed its comments with the MPSC. Consumers is unable to predict the outcome of this matter.
Renewable Energy Plan:In June 2011, Consumers filed with the MPSC its second annual report and reconciliation for its renewable energy plan, requesting approval of its plan costs for 2010. In March 2012, the MPSC approved Consumers’ renewable energy plan reconciliation.
Consumers filed its third annual report and reconciliation with the MPSC in June 2012, requesting approval of its reconciliation of renewable energy plan costs for 2011.
In October 2011, Consumers filed an application for the biennial review and approval of its renewable energy plan. In May 2012, the MPSC approved Consumers’ settlement agreement in this case, reducing the renewable energy surcharge by an annual amount of $3 million, to $20 million.
Energy Optimization Plan:In August 2011, Consumers filed an amended energy optimization plan with the MPSC, requesting approval of the additional spending necessary to exceed the statutory savings targets for 2012 through 2015 specified in the 2008 Energy Law. The MPSC approved Consumers’ amended energy optimization plan in April 2012.
In May 2012, Consumers filed its third annual report and reconciliation for its energy optimization plan, requesting approval of Consumers’ reconciliation of energy optimization plan costs for 2011. Consumers also requested approval to collect $15 million from customers as an incentive payment for exceeding statutory savings targets under both its gas and electric energy optimization plans during 2011. Consumers estimates that, through its gas and electric energy optimization programs, its customers realized $115 million in energy savings during 2011.
CONSUMERS’ GAS UTILITY
Gas Rate Case:In September 2011, Consumers filed an application with the MPSC seeking an annual rate increase of $49 million, based on a 10.7 percent authorized return on equity, in order to recover investments made to enhance safety, system reliability, and operational efficiencies that improve service to customers. Consumers self-implemented an annual rate increase of $23 million in March 2012, subject to refund with interest.
In June 2012, the MPSC approved Consumers’ settlement agreement and authorized an annual rate increase of $16 million, based on a 10.3 percent return on equity. The MPSC directed Consumers to refund to customers the difference between the rates it self-implemented in March 2012 and the rates authorized in the June 2012 order, plus interest, subject to a reconciliation proceeding. At June 30, 2012, CMS Energy and Consumers had a $1 million regulatory liability recorded for this refund.
Gas Revenue Decoupling Mechanism:The MPSC’s 2009 gas rate case order authorized Consumers to implement a gas revenue decoupling mechanism, subject to certain conditions. This decoupling mechanism, which was extended through April 2012, allowed Consumers to adjust future gas rates to compensate for changes in sales volumes resulting from the difference between the level of average sales per customer adopted in the order and actual average weather-adjusted sales per customer. This mechanism was not affected by the Court of Appeals decision on electric decoupling.
In September 2011, Consumers filed its first reconciliation of the gas revenue decoupling mechanism with the MPSC, requesting recovery of $16 million from customers for the period June 2010 through May 2011. The matter remains pending before the MPSC. Certain parties have filed in opposition to this reconciliation.
At June 30, 2012, Consumers had a $33 million non-current regulatory asset recorded for gas revenue decoupling. If the MPSC were to reject all or a major portion of Consumers’ requested recovery from its gas revenue decoupling mechanism or if the recovery period were to be substantially delayed, Consumers could be required to write off all or portions of the related regulatory asset.
5: FINANCINGS AND CAPITALIZATION
Presented in the following table is a summary of major long-term debt transactions during the six months ended June 30, 2012:2013:
| | | | | | | | | | | | | | | | |
| | | Principal (In Millions) | | | Interest Rate | | | Issue/Retirement
Date | | | Maturity Date | |
Debt Issuances | | | | | | | | | | | | | | | | |
CMS Energy | | | | | | | | | | | | | | | | |
Senior notes | | | $ 300 | | | | 5.05 | % | | | March 2012 | | | | March 2022 | |
Term loan facility1,2 | | | 30 | | | | variable | | | | February 2012 | | | | December 2016 | |
Consumers | | | | | | | | | | | | | | | | |
FMB | | | 375 | | | | 2.85 | % | | | May 2012 | | | | May 2022 | |
Total | | | $ 705 | | | | | | | | | | | | | |
| | |
Debt Retirements | | | | | | | | | | | | | | | | |
CMS Energy | | | | | | | | | | | | | | | | |
Contingently convertible senior notes3 | | | $ 226 | | | | 2.88 | % | |
| January 2012
and
April 2012 |
| | | December 2024 | |
Trust Preferred Securities | | | 29 | | | | 7.75 | % | | | February 2012 | | | | July 2027 | |
Consumers | | | | | | | | | | | | | | | | |
FMB | | | 300 | | | | 5.00 | % | | | February 2012 | | | | February 2012 | |
FMB | | | 375 | | | | 5.38 | % | | | May 2012 | | | | April 2013 | |
Total | | | $ 930 | | | | | | | | | | | | | |
| | |
| Principal | | | Issue/Retirement | |
| (In Millions) | Interest Rate | | Date | Maturity Date |
Debt issuances | | | | | | |
CMS Energy | | | | | | |
Senior notes1 | $ | 250 | 4.70 | % | March 2013 | March 2043 |
Total CMS Energy parent | $ | 250 | | | | |
Consumers | | | | | | |
FMB | $ | 425 | 3.95 | % | May 2013 | May 2043 |
Total Consumers | $ | 425 | | | | |
Total debt issuances | $ | 675 | | | | |
Debt retirements | | | | | | |
Consumers | | | | | | |
FMB | $ | 200 | 6.00 | % | June 2013 | February 2014 |
FMB | | 225 | 5.00 | | June 2013 | March 2015 |
Total Consumers | $ | 425 | | | | |
Total debt retirements | $ | 425 | | | | |
| 11 | In December 2011, CMS Energy entered into a $180 million term loan credit agreement that provides for delayed draws through July 20, 2012. Outstanding borrowings bear interest at an annual interest rate of LIBOR plus 2.5 percent.
|
| 2 | CMS Energy used these proceeds to retire the 7.75 percent Trust Preferred Securities.
|
| 3 | CMS Energy’s contingently convertible notes. See the “Contingently Convertible Securities” section in this Note for further discussion of the conversions.
|
In May 2012, CMS Energy called for redemption its $150plans to use these proceeds to retire all $250 million floating-rateof CMS Energy’s 2.75 percent senior notes due January 2013. The notes were redeemed in July 2012 using proceeds from the $180 million term loan facility entered into in December 2011.May 2014.
In June 2012, Consumers entered into a short-term credit agreement permitting Consumers to borrow up to $375 million. Consumers borrowed $350 million under this agreement in July 2012. This facility will mature in March 2013.
In July 2012, Consumers executed a bond purchase agreement under which it will issue, in a December 2012 private placement, $52 million of 3.19 percent FMBs due 2024, $35 million of 3.39 percent FMBs due 2027, and $263 million of 4.31 percent FMBs due 2042.
Revolving Credit Facilities: The following secured revolving credit facilities with banks were available at June 30, 2012:2013:
| | | | | | | | | | | | | | | | In Millions |
| In Millions | | |
| Expiration Date | | Amount of Facility | | Amount Borrowed | | Letters of Credit
Outstanding | | Amount Available | | | Amount of Facility | | Amount Borrowed | | Letters of Credit
Outstanding | | Amount Available |
CMS Energy | | | | | | | | | | | | | | | | |
March 31, 20161 | | | $ 550 | | | | $ 25 | | | | $ 2 | | | | $ 523 | | |
| | | |
December 21, 20171 | | | $ | 550 | | $ | - | | $ | 2 | | $ | 548 |
Consumers | | | | | | | | | | | | | | | | | | | | |
March 31, 20162 | | | $ 500 | | | | $ - | | | | $ 3 | | | | $ 497 | | |
December 21, 20172 | | | $ | 500 | | $ | - | | $ | 2 | | $ | 498 |
April 18, 20172 | | | 150 | | | | - | | | | - | | | | 150 | | | | 150 | | | - | | | - | | | 150 |
September 9, 20142 | | | 30 | | | | - | | | | 30 | | | | - | | | | 30 | | | - | | | 30 | | | - |
| | | |
| 11 Obligations under this facility are secured by Consumers common stock. | Obligations under this facility are secured by Consumers common stock. CMS Energy’s average borrowings during the six months ended June 30, 2012 totaled $13 million, with a weighted-average annual interest rate of 2.27 percent, representing LIBOR plus 2.00 percent.
|
| 22 Obligations under this facility are secured by FMBs of Consumers. | Obligations under this facility are secured by FMBs of Consumers.
|
Short-term Borrowings: Under Consumers’ revolving accounts receivable sales program, Consumers may transfer up to $250 million of accounts receivable, subject to certain eligibility requirements. These transactions are accounted for as short-term secured borrowings. At June 30, 2012,2013, $250 million of accounts receivable were eligible for transfer, and no accounts receivable had been transferred under the program.transfer. During the six months ended June 30, 2012,2013, Consumers’ average short-term borrowings totaled $16$10 million, with a weighted averageweighted-average annual interest rate of 0.90.94 percent.
58
Table of Contents
Contingently Convertible Securities: Presented in the following table are the significant terms of CMS Energy’s contingently convertible securities at June 30, 2012:2013:
| | | | | | | | | | | | | | | | | | | | | | | |
| Security | | Maturity | | | Outstanding (In Millions) | | | Adjusted Conversion Price | | | Adjusted Trigger Price | | | Maturity | | Outstanding
(In Millions) | | Adjusted
Conversion Price | | Adjusted
Trigger Price |
5.50% senior notes | | | 2029 | | | | | $ | 172 | | | | | | 13.94 | | | | | | 18.12 | | | 2029 | | $ 172 | | $ 13.74 | | $ 17.86 |
| | | | | | | | |
During 20 of the last 30 trading days ended June 30, 2012,2013, the adjusted trigger-price contingencies were met for the contingently convertible senior notes, and as a result, the senior notes are convertible at the option of the note holders for the three months ending September 30, 2012.
Presented2013. The senior notes, if converted, require CMS Energy to pay cash up to the principal amount of the securities. Any conversion value in excess of the following table are details about conversionsprincipal amount can be paid in cash or in shares of contingently convertible securities duringCMS Energy’s common stock, at the six months ended June 30, 2012:election of CMS Energy.
| | | | | | | | | | | | | | | | | | | | |
| | | Conversion
Date | | | Principal
Converted (In Millions) | | | Conversion Value
per $1,000 of
principal | | | Shares of Common
Stock Issued on
Settlement | | | Cash Paid on
Settlement (In Millions) | |
2.875% senior notes due 2024 | | | January 2012 | | | | $ 73 | | | | $ 1,738.99 | | | | 2,464,138 | | | | $ 73 | |
| | | April 2012 | | | | 153 | | | | 1,774.98 | | | | 5,381,349 | | | | 153 | |
| | | | | | |
Dividend Restrictions: Under provisions of CMS Energy’s senior notes indenture,the Michigan Business Corporation Act, at June 30, 2012,2013, payment of common stock dividends by CMS Energy was limited to $1.3$3.3 billion.
Under the provisions of its articles of incorporation, at June 30, 2012,2013, Consumers had $532$603 million of unrestricted retained earnings available to pay common stock dividends to CMS Energy. Provisions of the Federal Power Act and the Natural Gas Act appear to restrict dividends payable by Consumers to the amount of Consumers’ retained earnings. Several decisions from FERC suggest that under a variety of circumstances common stock dividends from Consumers would not be limited to amounts in Consumers’ retained earnings. Any decision by Consumers to pay common stock dividends in excess of retained earnings would be based on specific facts and circumstances and would result only after a formal regulatory filing process.
For the six months ended June 30, 2012,2013, CMS Energy received $158$194 million of common stock dividends from Consumers.
Issuance of Common Stock: In June 2011, CMS Energy has entered into atwo continuous equity offering program under which CMS Energy mayprograms permitting it to sell, from time to time in “at the market” offerings, common stock having an aggregate sales price of up to $50 million. million per program.
Presented in the following table are the transactions that CMS Energy entered into under the first program:
| | | | | | | |
| | Number of | | Average | | Proceeds | |
| | Shares Issued | | Price per Share | | (In Millions) | |
June 2011 | | 762,925 | | $ 19.66 | | $ 15 | |
June 2012 | | 650,235 | | 23.07 | | 15 | |
March 2013 | | 735,873 | | 27.18 | | 20 | |
Total | | 2,149,033 | | $ 23.27 | | $ 50 | |
In June 2012,April 2013, CMS Energy entered into the second continuous equity offering program, but has not yet issued any equity under this program,program.
Preferred Stock: In May 2013, Consumers gave notice of the mandatory redemption of all of its $4.16 preferred stock. Holders of record as of June 3, 2013 received a redemption price of $103.25 per share, payable July 1, 2013, which represented an aggregate redemption price of $7 million paid to redeem the 68,451 outstanding shares.
59
Table of Contents
4:FAIR VALUE MEASUREMENTS
Accounting standards define fair value as the price that would be received to sell an asset or paid to transfer a liability in an orderly transaction between market participants. When measuring fair value, CMS Energy issued 650,235and Consumers are required to incorporate all assumptions that market participants would use in pricing an asset or liability, including assumptions about risk. A fair value hierarchy prioritizes inputs used to measure fair value according to their observability in the market. The three levels of the fair value hierarchy are as follows:
·Level 1 inputs are unadjusted quoted prices in active markets for identical assets or liabilities.
·Level 2 inputs are observable, market-based inputs, other than Level 1 prices. Level 2 inputs may include quoted prices for similar assets or liabilities in active markets, quoted prices in inactive markets, and inputs derived from or corroborated by observable market data.
·Level 3 inputs are unobservable inputs that reflect CMS Energy’s or Consumers’ own assumptions about how market participants would value their assets and liabilities.
To the extent possible, CMS Energy and Consumers use quoted market prices or other observable market pricing data in valuing assets and liabilities measured at fair value. If this information is unavailable, they use market-corroborated data or reasonable estimates about market participant assumptions. CMS Energy and Consumers classify fair value measurements within the fair value hierarchy based on the lowest level of input that is significant to the fair value measurement in its entirety.
60
Table of Contents
ASSETS AND LIABILITIES MEASURED AT FAIR VALUE ON A RECURRING BASIS
Presented in the following table are CMS Energy’s and Consumers’ assets and liabilities, by level within the fair value hierarchy, recorded at fair value on a recurring basis:
| | | | | | | | | | | | | | | | | | |
| | | In Millions |
| June 30, 2013 | | December 31, 2012 |
| | | Level | | | | Level |
| | Total | | 1 | | 2 | | 3 | | | Total | | 1 | | 2 | | 3 | |
CMS Energy, including Consumers | | | | | | | | | | | | | | | | | | |
Assets | | | | | | | | | | | | | | | | | | |
Cash equivalents | | $ | 339 | | $ | 339 | | $ | - | | $ | - | | | $ | 53 | | $ | 53 | | $ | - | | $ | - | |
Restricted cash equivalents | | 13 | | 13 | | - | | - | | | 14 | | 14 | | - | | - | |
Nonqualified deferred compensation plan assets | | 5 | | 5 | | - | | - | | | 5 | | 5 | | - | | - | |
DB SERP | | | | | | | | | | | | | | | | | | |
Cash equivalents | | 1 | | 1 | | - | | - | | | 2 | | 2 | | - | | - | |
Mutual funds | | 137 | | 137 | | - | | - | | | 126 | | 126 | | - | | - | |
Derivative instruments | | | | | | | | | | | | | | | | | | |
Commodity contracts | | 12 | | - | | 2 | | 10 | | | 3 | | - | | - | | 3 | |
Total | | $ | 507 | | $ | 495 | | $ | 2 | | $ | 10 | | | $ | 203 | | $ | 200 | | $ | - | | $ | 3 | |
Liabilities | | | | | | | | | | | | | | | | | | |
Nonqualified deferred compensation plan liabilities | | $ | 5 | | $ | 5 | | $ | - | | $ | - | | | $ | 5 | | $ | 5 | | $ | - | | $ | - | |
Derivative instruments | | | | | | | | | | | | | | | | | | |
Commodity contracts | | 4 | | - | | 2 | | 2 | | | 4 | | - | | 3 | | 1 | |
Total | | $ | 9 | | $ | 5 | | $ | 2 | | $ | 2 | | | $ | 9 | | $ | 5 | | $ | 3 | | $ | 1 | |
Consumers | | | | | | | | | | | | | | | | | | |
Assets | | | | | | | | | | | | | | | | | | |
Cash equivalents | | $ | 186 | | $ | 186 | | $ | - | | $ | - | | | $ | - | | $ | - | | $ | - | | $ | - | |
Restricted cash equivalents | | 13 | | 13 | | - | | - | | | 13 | | 13 | | - | | - | |
CMS Energy common stock | | 30 | | 30 | | - | | - | | | 32 | | 32 | | - | | - | |
Nonqualified deferred compensation plan assets | | 4 | | 4 | | - | | - | | | 4 | | 4 | | - | | - | |
DB SERP | | | | | | | | | | | | | | | | | | |
Cash equivalents | | 1 | | 1 | | - | | - | | | 1 | | 1 | | - | | - | |
Mutual funds | | 96 | | 96 | | - | | - | | | 85 | | 85 | | - | | - | |
Derivative instruments | | | | | | | | | | | | | | | | | | |
Commodity contracts | | 10 | | - | | - | | 10 | | | 2 | | - | | - | | 2 | |
Total | | $ | 340 | | $ | 330 | | $ | - | | $ | 10 | | | $ | 137 | | $ | 135 | | $ | - | | $ | 2 | |
Liabilities | | | | | | | | | | | | | | | | | | |
Nonqualified deferred compensation plan liabilities | | $ | 4 | | $ | 4 | | $ | - | | $ | - | | | $ | 4 | | $ | 4 | | $ | - | | $ | - | |
Total | | $ | 4 | | $ | 4 | | $ | - | | $ | - | | | $ | 4 | | $ | 4 | | $ | - | | $ | - | |
| | | | | | | | | | | | | | | | | | | | | | | | | | | | | | |
Cash Equivalents: Cash equivalents and restricted cash equivalents consist of money market funds with daily liquidity. Short-term debt instruments classified as cash equivalents or restricted cash equivalents on the consolidated balance sheets are not included since they are recorded at amortized cost.
Nonqualified Deferred Compensation Plan Assets and Liabilities: The nonqualified deferred compensation plan assets consist of mutual funds, which are valued using the daily quoted NAVs that are publicly available and are the basis for transactions to buy or sell shares in each fund. CMS Energy and Consumers value their nonqualified deferred compensation plan liabilities based on the fair values of the
61
Table of Contents
plan assets, as they reflect what is owed to the plan participants in accordance with their investment elections. CMS Energy and Consumers report the assets in other non-current assets and the liabilities in other non-current liabilities on their consolidated balance sheets.
DB SERP Assets: CMS Energy and Consumers value their DB SERP assets using a market approach that incorporates quoted market prices. The DB SERP cash equivalents consist of a money market fund with daily liquidity. The DB SERP invests in mutual funds that hold primarily fixed-income instruments of varying maturities. In order to meet their investment objectives, the funds hold investment-grade debt securities, and may invest a portion of their assets in high-yield securities, foreign debt, and derivative instruments. CMS Energy and Consumers value these funds using the daily quoted NAVs that are publicly available and are the basis for transactions to buy or sell shares in each fund. CMS Energy and Consumers report their DB SERP assets in other non-current assets on their consolidated balance sheets. For additional details about DB SERP securities, see Note 5, Financial Instruments.
Derivative Instruments: CMS Energy and Consumers value their derivative instruments using either a market approach that incorporates information from market transactions, or an income approach that discounts future expected cash flows to a present value amount. CMS Energy values its exchange-traded derivative contracts based on Level 1 quoted prices and values other derivatives using Level 2 inputs, including commodity forward prices and credit risk factors. CMS Energy and Consumers have classified certain derivatives as Level 3 since the fair value measurements incorporate assumptions that cannot be observed or confirmed through market transactions.
The most significant derivatives classified as Level 3 are FTRs held by Consumers. Consumers uses FTRs to manage price risk related to electricity transmission congestion. An FTR is a financial instrument that entitles its holder to receive compensation or requires its holder to remit payment for congestion-related transmission charges. FTRs are accounted for as derivatives. Under regulatory accounting, all changes in fair value associated with FTRs are deferred as regulatory assets or liabilities until the instruments are settled. Due to the lack of quoted pricing information, Consumers determines the fair value of its FTRs based on Consumers’ average historical settlements.
ASSETS AND LIABILITIES MEASURED AT FAIR VALUE ON A RECURRING BASIS USING SIGNIFICANT LEVEL 3INPUTS
The largest change in the fair values of Level 3 assets and liabilities at CMS Energy and Consumers during the three and six months ended June 30, 2013 and 2012 was attributable to the FTRs.
62
Table of Contents
5:FINANCIAL INSTRUMENTS
Presented in the following table are the carrying amounts and fair values, by level within the fair value hierarchy, of CMS Energy’s and Consumers’ financial instruments that are not recorded at fair value. The table does not include information on cash, cash equivalents, short-term accounts and notes receivable, short-term investments, and current liabilities since the carrying amounts of these items approximate their fair values because of their short-term nature. For information about assets and liabilities recorded at fair value and for additional details regarding the fair value hierarchy, see Note 4, Fair Value Measurements.
| | | | | | | | In Millions |
| | | | |
| | June 30, 2013 | | December 31, 2012 |
| | | | Fair Value | | | | Fair Value |
| | Carrying | | | | Level | | Carrying | | | | Level | |
| | Amount | | Total | | 1 | | 2 | | 3 | | Amount | | Total | | 1 | | 2 | | 3 | |
CMS Energy, including Consumers | | | | | | | | | | | | | | | | | | | |
| | | | | | | | | | | | | | | | | | | |
Securities held to maturity | | $ | 10 | | $ | 10 | | $ | - | | $ | 10 | | $ | - | | $ | 9 | | $ | 10 | | $ | - | | $ | 10 | | $ | - | |
Notes receivable1 | | 543 | | 582 | | - | | - | | 582 | | 544 | | 581 | | - | | - | | 581 | |
Long-term debt2 | | 7,432 | | 8,278 | | - | | 7,295 | | 983 | | 7,229 | | 8,347 | | - | | 7,321 | | 1,026 | |
Consumers | | | | | | | | | | | | | | | | | | | | | |
Long-term debt3 | | $ | 4,318 | | $ | 4,731 | | $ | - | | $ | 3,748 | | $ | 983 | | $ | 4,338 | | $ | 5,015 | | $ | - | | $ | 3,989 | | $ | 1,026 | |
| | | | | | | | | | | | | | | | | | | | | | | | | | | | | | | | | | | | | | | |
1 Includes current portion of notes receivable of $50 million at June 30, 2013 and $40 million at December 31, 2012.
2 Includes current portion of long-term debt of $737 million at June 30, 2013 and $519 million at December 31, 2012.
3 Includes current portion of long-term debt of $42 million at June 30, 2013 and $41 million at December 31, 2012.
Notes receivable consist of EnerBank’s fixed-rate installment loans. EnerBank estimates the fair value of these loans using a discounted cash flows technique that incorporates market interest rates as well as assumptions about the remaining life of the loans and credit risk.
CMS Energy and Consumers estimate the fair value of their long-term debt using quoted prices from market trades of the debt, if available. In the absence of quoted prices, CMS Energy and Consumers calculate market yields and prices for the debt using a matrix method that incorporates market data for similarly rated debt. Depending on the information available, other valuation techniques and models may be used that rely on assumptions that cannot be observed or confirmed through market transactions. CMS Energy includes the value of the conversion features in estimating the fair value of its convertible debt, and incorporates, as appropriate, information on the market prices of CMS Energy common stock.
The effects of third-party credit enhancements are excluded from the fair value measurements of long-term debt. At June 30, 2013 and December 31, 2012, CMS Energy’s long-term debt included $103 million principal amount that was supported by third-party credit enhancements. This entire principal amount was at Consumers.
63
Table of Contents
Presented in the following table are CMS Energy’s and Consumers’ investment securities classified as available for sale or held to maturity:
|
In Millions |
| June 30, 2013 | | December 31, 2012 |
| | Unrealized | Unrealized | Fair | | | Unrealized | Unrealized | Fair |
| Cost | Gains | Losses | Value | | Cost | Gains | Losses | Value |
CMS Energy, including Consumers | | | | | | | | | | | | | |
Available for sale | | | | | | | | | | | | | | | | | |
DB SERP | | | | | | | | | | | | | | | | | |
Mutual funds | | $ | 138 | | $ | - | | $ | 1 | | $ | 137 | | | $ | 123 | | $ | 3 | | $ | - | | $ | 126 |
Held to maturity | | | | | | | | | | | | | | | | | |
Debt securities | | 10 | | - | | - | | 10 | | | 9 | | 1 | | - | | 10 |
Consumers | | | | | | | | | | | | | | | | | |
Available for sale | | | | | | | | | | | | | | | | | |
DB SERP | | | | | | | | | | | | | | | | | |
Mutual funds | | $ | 96 | | $ | - | | $ | - | | $ | 96 | | | $ | 83 | | $ | 2 | | $ | - | | $ | 85 |
CMS Energy common stock | | 5 | | 25 | | - | | 30 | | | 6 | | 26 | | - | | 32 |
The mutual funds classified as available for sale hold primarily fixed-income instruments of varying maturities. During the six months ended June 30, 2013, CMS Energy contributed $16 million to the DB SERP, which included a contribution of $13 million by Consumers. The contributions were used to acquire additional shares in the mutual funds. Debt securities classified as held to maturity consist primarily of mortgage-backed securities held by EnerBank.
Consumers recognized gains of $4 million in January 2013 and $5 million in January 2012 from transferring shares of CMS Energy common stock to a related charitable foundation. The gains reflected the excess of fair value over cost of the stock donated and were included in income.
64
Table of Contents
6:NOTES RECEIVABLE
Presented in the following table are details of CMS Energy’s and Consumers’ current and non-current notes receivable:
| | | | | | |
In Millions | |
| June 30, 2013 | December 31, 2012 | |
CMS Energy, including Consumers | | | | | |
Current | | | | | |
EnerBank notes receivable, net of allowance for loan losses | $ | 50 | $ | 40 | |
Other | | 26 | | 1 | |
Non-current | | | | | |
EnerBank notes receivable, net of allowance for loan losses | | 493 | | 504 | |
Other | | - | | 16 | |
Total notes receivable | $ | 569 | $ | 561 | |
Consumers | | | | | |
Current | | | | | |
Other | $ | 25 | $ | - | |
Non-current | | | | | |
Other | | - | | 16 | |
Total notes receivable | $ | 25 | $ | 16 | |
| | | | | | | | | |
EnerBank notes receivable are unsecured consumer installment loans for financing home improvements.
The allowance for loan losses is a valuation allowance to reflect estimated credit losses. The allowance is increased by the provision for loan losses and decreased by loan charge-offs net of recoveries. Management estimates the allowance balance required by taking into consideration historical loan loss experience, the nature and volume of the portfolio, economic conditions, and other factors. Loan losses are charged against the allowance when the loss is confirmed, but no later than the point at an average pricewhich a loan becomes 120 days past due.
Presented in the following table are the changes in the allowance for loan losses:
| | | | | | | | In Millions |
| Three Months Ended | | Six Months Ended | |
June 30 | 2013 | 2012 | | 2013 | 2012 | |
Balance at beginning of period | $ | 5 | $ | 5 | | $ | 5 | $ | 5 | |
Charge-offs | | (2 | ) | (1 | ) | | (3 | ) | (2 | ) |
Recoveries | | 1 | | - | | | 1 | | - | |
Provision for loan losses | | 1 | | 1 | | | 2 | | 2 | |
Balance at end of period | $ | 5 | $ | 5 | | $ | 5 | $ | 5 | |
Loans that are 30 days or more past due are considered delinquent. The balance of $23.07 per share, resulting in net proceedsEnerBank’s delinquent consumer loans was $2 million at June 30, 2013 and $3 million at December 31, 2012.
At June 30, 2013 and December 31, 2012, $1 million of $15 million. In June 2011, under this program, EnerBank’s loans had been modified as troubled debt restructurings.
65
Table of Contents
7:RETIREMENT BENEFITS
CMS Energy issued 762,925 sharesand Consumers provide pension, OPEB, and other retirement benefits to employees under a number of common stockdifferent plans.
Presented in the following tables are the costs incurred in CMS Energy’s and Consumers’ retirement benefits plans:
| | | | | | | In Millions | |
| Pension |
| Three Months Ended | | Six Months Ended |
June 30 | | 2013 | | 2012 | | | 2013 | | 2012 | |
CMS Energy, including Consumers | | | | | | | | | | |
Net periodic pension cost | | | | | | | | | | |
Service cost | | $ | 14 | | $ | 12 | | | $ | 27 | | $ | 24 | |
Interest expense | | | 23 | | | 25 | | | | 47 | | | 50 | |
Expected return on plan assets | | | (32 | ) | | (32 | ) | | | (64 | ) | | (63 | ) |
Amortization of: | | | | | | | | | | | | | | |
Net loss | | | 24 | | | 19 | | | | 48 | | | 38 | |
Prior service cost | | | 1 | | | 2 | | | | 2 | | | 3 | |
Net periodic pension cost | | $ | 30 | | $ | 26 | | | $ | 60 | | $ | 52 | |
Consumers | | | | | | | | | | | | | | |
Net periodic pension cost | | | | | | | | | | | | | | |
Service cost | | $ | 13 | | $ | 11 | | | $ | 26 | | $ | 23 | |
Interest expense | | | 23 | | | 24 | | | | 46 | | | 48 | |
Expected return on plan assets | | | (32 | ) | | (31 | ) | | | (63 | ) | | (61 | ) |
Amortization of: | | | | | | | | | | | | | | |
Net loss | | | 24 | | | 19 | | | | 47 | | | 37 | |
Prior service cost | | | 1 | | | 2 | | | | 2 | | | 3 | |
Net periodic pension cost | | $ | 29 | | $ | 25 | | | $ | 58 | | $ | 50 | |
66
Table of Contents
| | | | | | | In Millions | |
| OPEB |
| Three Months Ended | | Six Months Ended |
June 30 | | 2013 | | 2012 | | | 2013 | | 2012 | |
CMS Energy, including Consumers | | | | | | | | | | |
Net periodic OPEB cost | | | | | | | | | | |
Service cost | | $ | 9 | | $ | 8 | | | $ | 18 | | $ | 16 | |
Interest expense | | | 19 | | | 20 | | | | 38 | | | 41 | |
Expected return on plan assets | | | (19 | ) | | (16 | ) | | | (38 | ) | | (33 | ) |
Amortization of: | | | | | | | | | | | | | | |
Net loss | | | 10 | | | 12 | | | | 21 | | | 23 | |
Prior service credit | | | (5 | ) | | (5 | ) | | | (10 | ) | | (10 | ) |
Net periodic OPEB cost | | $ | 14 | | $ | 19 | | | $ | 29 | | $ | 37 | |
Consumers | | | | | | | | | | | | | | |
Net periodic OPEB cost | | | | | | | | | | | | | | |
Service cost | | $ | 9 | | $ | 8 | | | $ | 18 | | $ | 16 | |
Interest expense | | | 18 | | | 20 | | | | 36 | | | 40 | |
Expected return on plan assets | | | (17 | ) | | (16 | ) | | | (35 | ) | | (31 | ) |
Amortization of: | | | | | | | | | | | | | | |
Net loss | | | 10 | | | 12 | | | | 21 | | | 23 | |
Prior service credit | | | (5 | ) | | (5 | ) | | | (10 | ) | | (10 | ) |
Net periodic OPEB cost | | $ | 15 | | $ | 19 | | | $ | 30 | | $ | 38 | |
Effective July 1, 2013, CMS Energy and Consumers changed the Medicare drug program provided through their OPEB Plan from an employer-sponsored prescription drug plan with a retiree drug subsidy to an EGWP to begin on January 1, 2015. Also effective July 1, 2013, the OPEB Plan incorporated certain benefit changes to begin on January 1, 2016. Accordingly, CMS Energy and Consumers performed a remeasurement of the OPEB Plan as of July 1, 2013. In addition, with the plan remeasurement, the discount rate used to measure the liability was increased from 4.4 percent at an average priceDecember 31, 2012 to 5.1 percent at July 1, 2013. Assumptions regarding the expected long-term rate of $19.66 per share, resulting in net proceedsreturn on plan assets and the health-care cost trend rate did not change from December 31, 2012 levels.
67
Table of $15 million.Contents
6: 8:EARNINGS PER SHARE – CMS ENERGY
Presented in the following table are CMS Energy’s basic and diluted EPS computations based on income from continuing operations:
| | | | | | | | | | | | | | | | | | |
| In Millions, Except Per Share Amounts | |
| | | Three Months Ended | | | | | Six Months Ended | |
| June 30 | | 2012 | | | 2011 | | | | | 2012 | | | 2011 | |
Income Available to Common Stockholders | | | | | | | | | | | | | | | | | | |
Income from continuing operations | | $ | 101 | | | $ | 101 | | | | | $ | 161 | | | $ | 234 | |
Less income attributable to noncontrolling interest | | | 1 | | | | 1 | | | | | | 1 | | | | 1 | |
| | | | | | |
Income from Continuing Operations Available to Common Stockholders – Basic and Diluted | | $ | 100 | | | $ | 100 | | | | | $ | 160 | | | $ | 233 | |
| | | | | | |
Average Common Shares Outstanding | | | | | | | | | | | | | | | | | | |
Weighted average shares – basic | | | 261.2 | | | | 250.3 | | | | | | 258.4 | | | | 250.2 | |
Add dilutive contingently convertible securities | | | 5.9 | | | | 11.3 | | | | | | 8.3 | | | | 11.0 | |
Add dilutive non-vested stock awards and options | | | 1.1 | | | | 0.3 | | | | | | 1.0 | | | | 0.3 | |
Weighted average shares – diluted | | | 268.2 | | | | 261.9 | | | | | | 267.7 | | | | 261.5 | |
| | | | | | |
Income from Continuing Operations per Average Common Share Available to Common Stockholders | | | | | | | | | | | | | | | | | | |
Basic | | $ | 0.38 | | | $ | 0.40 | | | | | $ | 0.61 | | | $ | 0.93 | |
Diluted | | | 0.37 | | | | 0.38 | | | | | | 0.59 | | | | 0.89 | |
| | | | | | |
| | | | In Millions, Except Per Share Amounts | |
| | Three Months Ended | | | Six Months Ended | |
June 30 | | 2013 | | 2012 | | | 2013 | | 2012 | |
Income available to common stockholders | | | | | | | | | | |
Income from continuing operations | | $ | 81 | | $ | 101 | | | $ | 225 | | $ | 161 | |
Less income attributable to noncontrolling interests | | 1 | | 1 | | | 1 | | 1 | |
Income from continuing operations available to common stockholders – basic and diluted | | $ | 80 | | $ | 100 | | | $ | 224 | | $ | 160 | |
Average common shares outstanding | | | | | | | | | | |
Weighted-average shares – basic | | 264.5 | | 261.2 | | | 264.1 | | 258.4 | |
Add dilutive contingently convertible securities | | 6.4 | | 5.9 | | | 6.2 | | 8.3 | |
Add dilutive non-vested stock awards | | 1.3 | | 1.1 | | | 1.2 | | 1.0 | |
Weighted-average shares – diluted | | 272.2 | | 268.2 | | | 271.5 | | 267.7 | |
Income from continuing operations per average common share available to common stockholders | | | | | | | | | | |
Basic | | $ | 0.30 | | $ | 0.38 | | | $ | 0.85 | | $ | 0.61 | |
Diluted | | 0.29 | | 0.37 | | | 0.83 | | 0.59 | |
CONTINGENTLY CONTINGENTLY CONVERTIBLESECURITIES
When CMS Energy has earnings from continuing operations, its contingently convertible securities dilute EPS to the extent that the conversion value of a security, which is based on the average market price of CMS Energy common stock, exceeds the principal value of that security.
NNON-VESTEDON-VESTED STOCKAWARDS
CMS Energy’s non-vested stock awards are composed of participating and non-participating securities. The participating securities accrue cash dividends when common stockholders receive dividends. Since the recipient is not required to return the dividends to CMS Energy if the recipient forfeits the award, the non-vested stock awards are considered participating securities. As such, the participating non-vested stock awards were included in the computation of basic EPS. The non-participating securities accrue stock dividends that vest concurrently with the stock award. If the recipient forfeits the award, the stock dividends accrued on the non-participating securities are also forfeited. Accordingly, the non-participating awards and stock dividends were included in the computation of diluted EPS, but not basic EPS.
CONVERTIBLE DEBENTURES
CMS Energy redeemed all of its outstanding 7.75 percent Trust Preferred Securities in February 2012. For the six-month period ended June 30, 2012 and for each of the three-month and six-month periods ended June 30, 2011, the Trust Preferred Securities would have increased diluted EPS had they been included in the calculation. Using the if-converted method, the debentures would have had the following impacts on the calculation of diluted EPS:
| | | | | | | | | | | | | | | | | | |
| In Millions | |
| | | Three Months Ended | | | | | Six Months Ended | |
| June 30 | | 2012 | | | 2011 | | | | | 2012 | | | 2011 | |
Increase to numerator from assumed reduction in interest expense | | | $ - | | | | $ - | | | | | | $ - | | | | $ 1 | |
Increase to denominator from assumed conversion of debentures into common shares | | | - | | | | 0.7 | | | | | | 0.2 | | | | 0.7 | |
| | | | | | |
7: FINANCIAL INSTRUMENTS68
The carrying amountsTable of CMS Energy’s and Consumers’ cash, cash equivalents, current accounts and notes receivable, short-term investments, and current liabilities approximate their fair values because of their short-term nature. Presented in the following table are the cost or carrying amounts and fair values, by level within the fair value hierarchy, of CMS Energy’s and Consumers’ long-term financial instruments. For additional details regarding the fair value hierarchy, see Note 2: Fair Value Measurements.
| | | | | | | | | | | | | | | | | | | | | | | | | | | | | | |
| In Millions | |
| | | June 30, 2012 | | | | | December 31, 2011 | |
| | | Cost or | | | | | | | | | | | | | | | | | Cost or | | | | |
| | | Carrying | | | Fair Value | | | | | Carrying | | | | |
| | | Amount | | | Total | | | Level 1 | | | Level 2 | | | Level 3 | | | | | Amount | | | Fair Value | |
CMS Energy, including Consumers | | | | | | | | | | | | | | | | | | | | | | | | | | | |
Securities held to maturity | | $ | 8 | | | $ | 9 | | | $ | - | | | $ | 9 | | | $ | - | | | | | $ | 7 | | | $ | 7 | |
Securities available for sale | | | 125 | | | | 127 | | | | 127 | | | | - | | | | - | | | | | | 113 | | | | 113 | |
Notes receivable1 | | | 486 | | | | 513 | | | | - | | | | - | | | | 513 | | | | | | 480 | | | | 504 | |
Long-term debt2 | | | 6,852 | | | | 7,812 | | | | - | | | | 7,812 | | | | - | | | | | | 7,073 | | | | 8,025 | |
| | | | | | | | | | | | | | | | |
Consumers | | | | | | | | | | | | | | | | | | | | | | | | | | | | | | |
Securities available for sale | | $ | 90 | | | $ | 116 | | | $ | 116 | | | $ | - | | | $ | - | | | | | $ | 81 | | | $ | 109 | |
Long-term debt3 | | | 4,007 | | | | 4,625 | | | | - | | | | 4,625 | | | | - | | | | | | 4,326 | | | | 4,882 | |
| | | | | | | | | | | | | | | | |
| 1 | Includes current portion of notes receivable of $26 million at June 30, 2012 and $19 million at December 31, 2011.
|
| 2 | Includes current portion of long-term debt of $631 million at June 30, 2012 and $1,033 million at December 31, 2011.
|
| 3 | Includes current portion of long-term debt of $40 million at June 30, 2012 and $339 million at December 31, 2011.
|
Notes receivable consist of EnerBank’s fixed-rate installment loans. EnerBank estimates the fair value of these loans using a discounted cash flows technique that incorporates market interest rates as well as assumptions about the remaining life of the loans and credit risk.
CMS Energy and Consumers estimate the fair value of their long-term debt using quoted prices from market trades of the debt, if available. In the absence of quoted prices, CMS Energy and Consumers calculate market yields and prices for the debt using a matrix method that incorporates market data for similarly rated debt. Depending on the information available, other valuation techniques may be used that rely on internal assumptions and models. CMS Energy includes the value of the conversion features in estimating the fair value of its convertible debt, and incorporates, as appropriate, information on the market prices of CMS Energy common stock.
The effects of third-party credit enhancements are excluded from the fair value measurements of long-term debt. At June 30, 2012 and December 31, 2011, CMS Energy’s long-term debt included $103 million principal amount that was supported by third-party credit enhancements. This entire principal amount was at Consumers.
Presented in the following table are CMS Energy’s and Consumers’ investment securities:
| | | | | | | | | | | | | | | | | | | | | | | | | | | | | | | | | | |
| In Millions | |
| | | June 30, 2012 | | | | | December 31, 2011 | |
| | | Cost | | | Unrealized
Gains | | | Unrealized
Losses | | | Fair Value | | | | | Cost | | | Unrealized
Gains | | | Unrealized
Losses | | | Fair Value | |
CMS Energy, including Consumers | | | | | | | | | | | | | | | | |
Available for sale | | | | | | | | | | | | | | | | | | | | | | | | | | | | | | | | | | |
SERP | | | | | | | | | | | | | | | | | | | | | | | | | | | | | | | | | | |
Mutual funds | | | $ 125 | | | | $ 2 | | | | $ - | | | | $ 127 | | | | | | $ 113 | | | | $ - | | | | $ - | | | | $ 113 | |
Held to maturity | | | | | | | | | | | | | | | | | | | | | | | | | | | | | | | | | | |
Debt securities | | | 8 | | | | 1 | | | | - | | | | 9 | | | | | | 7 | | | | - | | | | - | | | | 7 | |
| | | | | | | | | | | | | | | | | | | | |
Consumers | | | | | | | | | | | | | | | | |
Available for sale | | | | | | | | | | | | | | | | | | | | | | | | | | | | | | | | | | |
SERP | | | | | | | | | | | | | | | | | | | | | | | | | | | | | | | | | | |
Mutual funds | | | $ 84 | | | | $ 2 | | | | $ - | | | | $ 86 | | | | | | $ 74 | | | | $ - | | | | $ - | | | | $ 74 | |
CMS Energy common stock | | | 6 | | | | 24 | | | | - | | | | 30 | | | | | | 7 | | | | 28 | | | | - | | | | 35 | |
| | | | | | | | | | | | | | | | | | | | |
The mutual funds classified as available for sale hold primarily fixed-income instruments of varying maturities. During the six months ended June 30, 2012, CMS Energy contributed $13 million to the SERP, which included a contribution of $9 million by Consumers. The contributions were used to acquire additional shares in the mutual funds. Debt securities classified as held to maturity consist primarily of mortgage-backed securities held by EnerBank, as well as state and municipal bonds held by EnerBank.
Sales activity for CMS Energy’s and Consumers’ investment securities was insignificant for each of the three-month and six-month periods ended June 30, 2012 and 2011. In January 2012, based on a donation commitment made in 2011, Consumers transferred shares of CMS Energy common stock to a related charitable foundation and recognized a gain of $5 million in income to reflect the excess of fair value over cost of the stock donated. In January 2011, based on a donation commitment made in 2010, Consumers transferred shares of CMS Energy common stock to a related charitable foundation and recognized a gain of $4 million in income to reflect the excess of fair value over cost of the stock donated.
8: DERIVATIVE INSTRUMENTS
In order to limit exposure to certain market risks, primarily changes in commodity prices, interest rates, and foreign exchange rates, CMS Energy and Consumers may enter into various risk management contracts, such as forward contracts, futures, options, and swaps. The contracts used to manage market risks may qualify as derivative instruments. Neither CMS Energy nor Consumers enters into any derivatives for trading purposes.
Commodity Price Risk: In order to support ongoing operations, CMS Energy and Consumers enter into contracts for the future purchase and sale of various commodities, such as electricity, natural gas, and coal. These forward contracts are generally long-term in nature and result in physical delivery of the commodity at a contracted price. Most of these contracts are not subject to derivative accounting because:Contents
they do not have a notional amount (that is, a number of units specified in a derivative instrument, such as MWh of electricity or bcf of natural gas);
they qualify for the normal purchases and sales exception; or
there is not an active market for the commodity.
Consumers’ coal purchase contracts are not derivatives because there is not an active market for the coal it purchases. If an active market for coal develops in the future, some of these contracts may qualify as derivatives. Since Consumers is subject to regulatory accounting, the resulting fair value gains and losses would be deferred as regulatory assets or liabilities and would not affect net income.
Consumers also uses FTRs to manage price risk related to electricity transmission congestion. An FTR is a financial instrument that entitles its holder to receive compensation or requires its holder to remit payment for congestion-related transmission charges. FTRs are accounted for as derivatives. Under regulatory accounting, all changes in fair value associated with these instruments are deferred as regulatory assets or liabilities until the instruments are settled.
CMS ERM has not designated its contracts to purchase and sell electricity and natural gas as normal purchases and sales and, therefore, CMS Energy accounts for those contracts as derivatives.
The fair value of CMS Energy’s commodity contracts not designated as hedging instruments and recorded in other assets was $7 million at June 30, 2012 and $3 million at December 31, 2011. The fair value of Consumers’ commodity contracts not designated as hedging instruments and recorded in other assets was $5 million at June 30, 2012 and $2 million at December 31, 2011. The fair value of CMS Energy’s commodity contracts not designated as hedging instruments and recorded in other liabilities was $6 million at June 30, 2012 and $7 million at December 31, 2011. The fair value of Consumers’ commodity contracts not designated as hedging instruments and recorded in other liabilities was less than $1 million at June 30, 2012. Consumers did not have any contracts recorded as liabilities at December 31, 2011.
Presented in the following table are the location and amount of the gains (losses) on derivatives recognized in CMS Energy’s consolidated statements of income for its derivatives not designated as hedging instruments:
| | | | | | | | | | | | | | | | |
| In Millions | |
| | | Three Months Ended | | | Six Months Ended | |
| June 30 | | 2012 | | | 2011 | | | 2012 | | | 2011 | |
CMS Energy | | | | | | | | | | | | | | | | |
Commodity contracts | | | | | | | | | | | | | | | | |
Operating revenue | | | $ (1) | | | | $ (1) | | | | $ 3 | | | | $ - | |
Fuel for electric generation | | | - | | | | - | | | | (2) | | | | - | |
Purchased and interchange power | | | - | | | | - | | | | (1) | | | | - | |
Total CMS Energy | | | $ (1) | | | | $ (1) | | | | $ - | | | | $ - | |
| | |
Consumers’ gains on FTRs deferred as regulatory liabilities were $9 million for the three months ended June 30, 2012 and $7 million for the six months ended June 30, 2012. Consumers’ gains on FTRs deferred as regulatory liabilities were $2 million for the three and six months ended June 30, 2011.
CMS Energy’s derivative liabilities subject to credit-risk-related contingent features were $3 million at June 30, 2012 and $4 million at December 31, 2011.
9: NOTES RECEIVABLE
Presented in the following table are details of CMS Energy’s and Consumers’ current and non-current notes receivable:
| | | | | | | | |
| In Millions | |
| | | June 30, 2012 | | | December 31, 2011 | |
CMS Energy, including Consumers | | | | | | | | |
Current | | | | | | | | |
EnerBank notes receivable, net of allowance for loan losses | | | $ 26 | | | | $ 19 | |
Other | | | 14 | | | | 30 | |
Non-current | | | | | | | | |
EnerBank notes receivable, net of allowance for loan losses | | | 460 | | | | 461 | |
Other | | | 1 | | | | 1 | |
Total notes receivable | | | $ 501 | | | | $ 511 | |
| | |
Consumers | | | | | | | | |
Current | | | | | | | | |
Other | | | $ 13 | | | | $ 23 | |
Non-current | | | | | | | | |
Other | | | 1 | | | | 1 | |
Total notes receivable | | | $ 14 | | | | $ 24 | |
| | |
EnerBank notes receivable are unsecured consumer installment loans for financing home improvements.
The allowance for loan losses is a valuation allowance to reflect estimated credit losses. The allowance is increased by the provision for loan losses and decreased by loan charge-offs net of recoveries. Management estimates the allowance balance required by taking into consideration historical loan loss experience, the nature and volume of the portfolio, economic conditions, and other factors. Loan losses are charged against the allowance when the loss is confirmed, but no later than the point at which a loan becomes 120 days past due.
Presented in the following table are the changes in the allowance for loan losses:
| | | | | | | | | | | | | | | | |
| In Millions | |
| | | Three Months Ended | | | Six Months Ended | |
| June 30 | | 2012 | | | 2011 | | | 2012 | | | 2011 | |
Balance at beginning of period | | | $ 5 | | | | $ 5 | | | | $ 5 | | | | $ 5 | |
Charge-offs | | | (1) | | | | (1) | | | | (2) | | | | (2) | |
Recoveries | | | - | | | | - | | | | - | | | | - | |
Provision for loan losses | | | 1 | | | | 1 | | | | 2 | | | | 2 | |
Balance at end of period | | | $ 5 | | | | $ 5 | | | | $ 5 | | | | $ 5 | |
| | |
Loans that are 30 days or more past due are considered delinquent. Presented in the following table is the delinquency status of EnerBank’s consumer loans:
| | | | | | | | | | | | | | | | | | | | | | | | |
| In Millions | |
| | | Past Due 30-59 Days | | | Past Due 60-89 Days | | | Past Due Over 90 Days | | | Total Delinquent | | | Current | | | Total Outstanding | |
June 30, 2012 | | | $ 1 | | | | $ 1 | | | | $ - | | | | $ 2 | | | | $ 484 | | | | $ 486 | |
December 31, 2011 | | | 1 | | | | - | | | | 1 | | | | 2 | | | | 478 | | | | 480 | |
| | |
At June 30, 2012 and December 31, 2011, $1 million of EnerBank’s loans had been modified as troubled debt restructurings.
10: RETIREMENT BENEFITS
CMS Energy and Consumers provide pension, OPEB, and other retirement benefits to employees under a number of different plans.
Presented in the following tables are the costs and other changes in plan assets and benefit obligations incurred in CMS Energy’s and Consumers’ retirement benefits plans:
| | | | | | | | | | | | | | | | | | |
| | | | | | | | | | | In Millions | |
| | | Pension | |
| | | Three Months Ended | | | | | Six Months Ended | |
| June 30 | | 2012 | | | 2011 | | | | | 2012 | | | 2011 | |
CMS Energy, including Consumers | | | | | | | | | | | | | | | | | | |
Net periodic pension cost | | | | | | | | | | | | | | | | | | |
Service cost | | | $ 12 | | | | $ 12 | | | | | | $ 24 | | | | $ 24 | |
Interest expense | | | 25 | | | | 25 | | | | | | 50 | | | | 50 | |
Expected return on plan assets | | | (32 | ) | | | (28 | ) | | | | | (63 | ) | | | (56 | ) |
Amortization of: | | | | | | | | | | | | | | | | | | |
Net loss | | | 19 | | | | 15 | | | | | | 38 | | | | 31 | |
Prior service cost | | | 2 | | | | 2 | | | | | | 3 | | | | 3 | |
Net periodic pension cost | | | $ 26 | | | | $ 26 | | | | | | $ 52 | | | | $ 52 | |
| | |
Consumers | | | | | | | | | | | | | | | | | | |
Net periodic pension cost | | | | | | | | | | | | | | | | | | |
Service cost | | | $ 11 | | | | $ 11 | | | | | | $ 23 | | | | $ 23 | |
Interest expense | | | 24 | | | | 25 | | | | | | 48 | | | | 49 | |
Expected return on plan assets | | | (31 | ) | | | (28 | ) | | | | | (61 | ) | | | (55 | ) |
Amortization of: | | | | | | | | | | | | | | | | | | |
Net loss | | | 19 | | | | 16 | | | | | | 37 | | | | 31 | |
Prior service cost | | | 2 | | | | 2 | | | | | | 3 | | | | 3 | |
Net periodic pension cost | | | $ 25 | | | | $ 26 | | | | | | $ 50 | | | | $ 51 | |
| | |
CMS Energy’s and Consumers’ expected long-term rate of return on Pension Plan assets is 7.75 percent. For the twelve months ended June 30, 2012, the actual return on Pension Plan assets was 4.7 percent, and for the twelve months ended June 30, 2011, the actual return was 19.5 percent. The expected rate of return is an assumption about long-term asset performance that CMS Energy and Consumers review annually for reasonableness and appropriateness.
| | | | | | | | | | | | | | | | | | |
| | | | | | | | | | | In Millions | |
| | | OPEB | |
| | | Three Months Ended | | | | | Six Months Ended | |
| June 30 | | 2012 | | | 2011 | | | | | 2012 | | | 2011 | |
CMS Energy, including Consumers | | | | | | | | | | | | | | | | | | |
Net periodic OPEB cost | | | | | | | | | | | | | | | | | | |
Service cost | | | $ 8 | | | | $ 6 | | | | | | $ 16 | | | | $ 13 | |
Interest expense | | | 20 | | | | 19 | | | | | | 41 | | | | 38 | |
Expected return on plan assets | | | (16 | ) | | | (16 | ) | | | | | (33 | ) | | | (33 | ) |
Amortization of: | | | | | | | | | | | | | | | | | | |
Net loss | | | 12 | | | | 8 | | | | | | 23 | | | | 16 | |
Prior service credit | | | (5 | ) | | | (5 | ) | | | | | (10 | ) | | | (10 | ) |
Net periodic OPEB cost | | | $ 19 | | | | $ 12 | | | | | | $ 37 | | | | $ 24 | |
| | |
Consumers | | | | | | | | | | | | | | | | | | |
Net periodic OPEB cost | | | | | | | | | | | | | | | | | | |
Service cost | | | $ 8 | | | | $ 7 | | | | | | $ 16 | | | | $ 13 | �� |
Interest expense | | | 20 | | | | 19 | | | | | | 40 | | | | 37 | |
Expected return on plan assets | | | (16 | ) | | | (16 | ) | | | | | (31 | ) | | | (31 | ) |
Amortization of: | | | | | | | | | | | | | | | | | | |
Net loss | | | 12 | | | | 8 | | | | | | 23 | | | | 16 | |
Prior service credit | | | (5 | ) | | | (5 | ) | | | | | (10 | ) | | | (10 | ) |
Net periodic OPEB cost | | | $ 19 | | | | $ 13 | | | | | | $ 38 | | | | $ 25 | |
| | |
11: INCOME TAXES
Presented in the following table is a reconciliation of the statutory U.S. federal income tax rate to the effective income tax rate from continuing operations, excluding noncontrolling interests:
| | | | | | | | |
| Six Months Ended June 30 | | 2012 | | | 2011 | |
CMS Energy, including Consumers | | | | | | | | |
U.S. federal income tax rate | | | 35.0 | % | | | 35.0 | % |
Increase (decrease) in income taxes from: | | | | | | | | |
MCIT law change, net of federal expense | | | - | | | | (9.9 | ) |
Other state and local income taxes, net of federal benefit | | | 4.7 | | | | 3.5 | |
Other, net | | | (0.2 | ) | | | (1.4 | ) |
Effective income tax rate | | | 39.5 | % | | | 27.2 | % |
| | |
Consumers | | | | | | | | |
U.S. federal income tax rate | | | 35.0 | % | | | 35.0 | % |
Increase (decrease) in income taxes from: | | | | | | | | |
State and local income taxes, net of federal benefit | | | 5.3 | | | | 3.4 | |
Other, net | | | (0.3 | ) | | | (1.4 | ) |
Effective income tax rate | | | 40.0 | % | | | 37.0 | % |
| | |
In May 2012, the Internal Revenue Service completed its audit of CMS Energy and its subsidiaries for 2008 and 2009, as well as its audit of research and development tax credit claims for 2001 through 2009. The audits resulted in a $45 million increase in the net operating loss carryforward. The impact to net income as a result of the completion of the audits was $1 million.
12: REPORTABLE SEGMENTS
Reportable segments consist of business units defined by the products and services they offer. CMS Energy and Consumers evaluate the performance of each segment based on its contribution to net income available to CMS Energy’s common stockholders. The reportable segments for CMS Energy and Consumers are:
CMS Energy:
·electric utility, consisting of regulated activities associated with the generation and distribution of electricity in Michigan;
·gas utility, consisting of regulated activities associated with the transportation, storage, and distribution of natural gas in Michigan;
·enterprises, consisting of various subsidiaries engaging primarily in domestic independent power production; and
·other, including EnerBank, corporate interest and other expenses, and discontinued operations.
Consumers:
·electric utility, consisting of regulated activities associated with the generation and distribution of electricity in Michigan;
·gas utility, consisting of regulated activities associated with the transportation, storage, and distribution of natural gas in Michigan; and
·other, including a consolidated special-purpose entity for the sale of accounts receivable.
69
Table of Contents
Presented in the following tables is financial information by reportable segment:
| | | | | | | | | In Millions | | | | | | | | | | In Millions | |
| | | Three Months Ended | | | | Six Months Ended | | | Three Months Ended | | | Six Months Ended | |
| June 30 | | 2012 | | 2011 | | | 2012 | | 2011 | | | 2013 | | 2012 | | | 2013 | | 2012 | |
CMS Energy, including Consumers | | | | | | | | | | | | | | | | | | | | |
Operating Revenue | | | | | | | | | | | |
Operating revenue | | | | | | | | | | | |
Electric utility | | $ | 998 | | | $ | 949 | | | | | $ | 1,834 | | | $ | 1,846 | | | $ | 1,026 | | $ | 998 | | | $ | 1,987 | | $ | 1,834 | |
Gas utility | | | 284 | | | | 354 | | | | | | 1,123 | | | | 1,445 | | | 316 | | 284 | | | 1,274 | | 1,123 | |
Enterprises | | | 38 | | | | 50 | | | | | | 92 | | | | 105 | | | 48 | | 38 | | | 92 | | 92 | |
Other | | | 13 | | | | 11 | | | | | 27 | | | | 23 | | | 16 | | 13 | | | 32 | | 27 | |
Total Operating Revenue – CMS Energy | | $ | 1,333 | | | $ | 1,364 | | | | | $ | 3,076 | | | $ | 3,419 | | |
| | | |
Total operating revenue – CMS Energy | | | $ | 1,406 | | $ | 1,333 | | | $ | 3,385 | | $ | 3,076 | |
Consumers | | | | | | | | | | | | | | | | | | | | |
Operating Revenue | | | | | | | | | | | |
Operating revenue | | | | | | | | | | | |
Electric utility | | $ | 998 | | | $ | 949 | | | | | $ | 1,834 | | | $ | 1,846 | | | $ | 1,026 | | $ | 998 | | | $ | 1,987 | | $ | 1,834 | |
Gas utility | | | 284 | | | | 354 | | | | | 1,123 | | | | 1,445 | | | 316 | | 284 | | | 1,274 | | 1,123 | |
Total Operating Revenue – Consumers | | $ | 1,282 | | | $ | 1,303 | | | | | $ | 2,957 | | | $ | 3,291 | | |
| | | |
Total operating revenue – Consumers | | | $ | 1,342 | | $ | 1,282 | | | $ | 3,261 | | $ | 2,957 | |
CMS Energy, including Consumers | | | | | | | | | | | | | | | | | | | | |
Net Income (Loss) Available to Common Stockholders | | | | | | | | | | | |
Net income (loss) available to common stockholders | | | | | | | | | | | |
Electric utility | | $ | 111 | | | $ | 85 | | | | | $ | 132 | | | $ | 150 | | | $ | 93 | | $ | 111 | | | $ | 159 | | $ | 132 | |
Gas utility | | | 9 | | | | 5 | | | | | | 64 | | | | 93 | | | 5 | | 9 | | | 101 | | 64 | |
Enterprises | | | (1 | ) | | | 29 | | | | | | 4 | | | | 32 | | | 1 | | (1 | ) | | 5 | | 4 | |
Other | | | (19 | ) | | | (19 | ) | | | | (33 | ) | | | (40 | ) | | (19 | ) | (19 | ) | | (41 | ) | (33 | ) |
Total Net Income Available to Common Stockholders –
CMS Energy | | $ | 100 | | | $ | 100 | | | | | $ | 167 | | | $ | 235 | | |
| | | |
Total net income available to common stockholders – CMS Energy | | | $ | 80 | | $ | 100 | | | $ | 224 | | $ | 167 | |
Consumers | | | | | | | | | | | | | | | | | | | | |
Net Income Available to Common Stockholder | | | | | | | | | | | |
Net income available to common stockholder | | | | | | | | | | | |
Electric utility | | $ | 111 | | | $ | 85 | | | | | $ | 132 | | | $ | 150 | | | $ | 93 | | $ | 111 | | | $ | 159 | | $ | 132 | |
Gas utility | | | 9 | | | | 5 | | | | | | 64 | | | | 93 | | | 5 | | 9 | | | 101 | | 64 | |
Other | | | 1 | | | | 1 | | | | | 1 | | | | 1 | | | 1 | | 1 | | | 1 | | 1 | |
Total Net Income Available to Common Stockholder –
Consumers | | $ | 121 | | | $ | 91 | | | | | $ | 197 | | | $ | 244 | | |
| | | |
Total net income available to common stockholder – Consumers | | | $ | 99 | | $ | 121 | | | $ | 261 | | $ | 197 | |
| | | | | | | | |
| | | In Millions | |
| | | June 30, 2012 | | | December 31, 2011 | |
CMS Energy, including Consumers | | | | | | | | |
Plant, Property, and Equipment, Gross | | | | | | | | |
Electric utility | | | $ 10,549 | | | | $ 10,400 | |
Gas utility | | | 4,261 | | | | 4,206 | |
Enterprises | | | 112 | | | | 109 | |
Other | | | 37 | | | | 36 | |
Total Plant, Property, and Equipment, Gross – CMS Energy | | | $ 14,959 | | | | $ 14,751 | |
| | |
Consumers | | | | | | | | |
Plant, Property, and Equipment, Gross | | | | | | | | |
Electric utility | | | $ 10,549 | | | | $ 10,400 | |
Gas utility | | | 4,261 | | | | 4,206 | |
Other | | | 15 | | | | 15 | |
Total Plant, Property, and Equipment, Gross – Consumers | | | $ 14,825 | | | | $ 14,621 | |
| | |
CMS Energy, including Consumers | | | | | | | | |
Total Assets | | | | | | | | |
Electric utility1 | | | $ 10,157 | | | | $ 9,938 | |
Gas utility1 | | | 4,770 | | | | 4,956 | |
Enterprises | | | 177 | | | | 242 | |
Other | | | 1,189 | | | | 1,316 | |
Total Assets – CMS Energy | | | $�� 16,293 | | | | $ 16,452 | |
| | |
Consumers | | | | | | | | |
Total Assets | | | | | | | | |
Electric utility1 | | | $ 10,157 | | | | $ 9,938 | |
Gas utility1 | | | 4,770 | | | | 4,956 | |
Other | | | 627 | | | | 768 | |
Total Assets – Consumers | | | $ 15,554 | | | | $ 15,662 | |
| | |
Table of Contents
| | | | In Millions | |
| | June 30, 2013 | | December 31, 2012 | |
CMS Energy, including Consumers | | | | | |
Plant, property, and equipment, gross | | | | | |
Electric utility | | $ | 11,275 | | $ | 11,041 | |
Gas utility | | 4,661 | | 4,400 | |
Enterprises | | 112 | | 113 | |
Other | | 38 | | 38 | |
Total plant, property, and equipment, gross – CMS Energy | | $ | 16,086 | | $ | 15,592 | |
Consumers | | | | | |
Plant, property, and equipment, gross | | | | | |
Electric utility | | $ | 11,275 | | $ | 11,041 | |
Gas utility | | 4,661 | | 4,400 | |
Other | | 15 | | 15 | |
Total plant, property, and equipment, gross – Consumers | | $ | 15,951 | | $ | 15,456 | |
CMS Energy, including Consumers | | | | | |
Total assets | | | | | |
Electric utility1 | | $ | 10,769 | | $ | 10,423 | |
Gas utility1 | | 4,922 | | 5,016 | |
Enterprises | | 180 | | 181 | |
Other | | 1,558 | | 1,511 | |
Total assets – CMS Energy | | $ | 17,429 | | $ | 17,131 | |
Consumers | | | | | |
Total assets | | | | | |
Electric utility1 | | $ | 10,769 | | $ | 10,423 | |
Gas utility1 | | 4,922 | | 5,016 | |
Other | | 718 | | 836 | |
Total assets – Consumers | | $ | 16,409 | | $ | 16,275 | |
1Amounts include a portion of Consumers’ other common assets attributable to both the electric and gas utility businesses.
71
Table of Contents
ITEM 3. QUANTITATIVE AND QUALITATIVE DISCLOSURES ABOUT
MARKET RISK
There have been no material changes to market risk as previously disclosed in Part II – Item 7A. Quantitative and Qualitative Disclosures About Market Risk, in the 20112012 Form 10-K.
ITEM 4. CONTROLS AND PROCEDURES
CMS ENERGY
Disclosure Controls and Procedures: CMS Energy’s management, with the participation of its CEO and CFO, has evaluated the effectiveness of its disclosure controls and procedures (as such term is defined in Rules 13a-15(e) and 15d-15(e) under the Exchange Act) as of the end of the period covered by this report. Based on such evaluation, CMS Energy’s CEO and CFO have concluded that, as of the end of such period, its disclosure controls and procedures are effective.
Internal Control Over Financial Reporting: There have not been any changes in CMS Energy’s internal control over financial reporting (as such term is defined in Rules 13a-15(f) and 15d-15(f) under the Exchange Act) during the last fiscal quarter that have materially affected, or are reasonably likely to materially affect, its internal control over financial reporting.
CONSUMERS
CONSUMERS
Disclosure Controls and Procedures: Consumers’ management, with the participation of its CEO and CFO, has evaluated the effectiveness of its disclosure controls and procedures (as such term is defined in Rules 13a-15(e) and 15d-15(e) under the Exchange Act) as of the end of the period covered by this report. Based on such evaluation, Consumers’ CEO and CFO have concluded that, as of the end of such period, its disclosure controls and procedures are effective.
Internal Control Over Financial Reporting: There have not been any changes in Consumers’ internal control over financial reporting (as such term is defined in Rules 13a-15(f) and 15d-15(f) under the Exchange Act) during the last fiscal quarter that have materially affected, or are reasonably likely to materially affect, its internal control over financial reporting.
PART II. OTHER INFORMATION
ITEM 1. LEGAL PROCEEDINGS
CMS Energy and Consumers are parties to various lawsuits and regulatory matters in the ordinary course of business. For information regarding material legal proceedings, including updates to information reported under Part I – Item 3. Legal Proceedings, inof the 20112012 Form 10-K, see Part I – Item 11. Consolidated Financial Statements (Unaudited) – Notes to the Unaudited Consolidated Financial Statements – Note 3:1, Regulatory Matters and Note 2, Contingencies and Commitments, and Note 4: Regulatory Matters.Commitments.
72
Table of Contents
ITEM 1A. RISK FACTORS
There have been no material changes to the Risk Factors as previously disclosed in Part I – Item 1A. Risk Factors, in the 20112012 Form 10-K.
10-K, which Risk Factors are incorporated herein by reference.ITEM 2. UNREGISTERED SALES OF EQUITY SECURITIES AND USE OF
PROCEEDS
(a) Unregistered Sales of Equity Securities | Unregistered Sales of Equity Securities |
Between April 19, 2012 and April 30, 2012, CMS Energy issued 2,514,373 shares of its common stock and paid $71,353,291 in cash in exchange for $71,353,000 aggregate principal amount of its 2.875 percent Convertible Senior Notes Due 2024. These convertible notes were tendered for conversion between March 30, 2012 and April 11, 2012, in accordance with the terms and provisions of the Indenture of CMS Energy dated as of September 15, 1992, as supplemented by the Seventeenth Supplemental Indenture dated as of December 13, 2004. Such shares of common stock were issued based on the weighted-average conversion value of $1,776.09 per $1,000 principal amount of convertible note. The issuance of these shares of common stock was an exchange of securities with existing shareholders and was exempt from registration pursuant to Section 3(a)(9) of the Securities Act of 1933, as amended.
(c) | Issuer Repurchases of Equity Securities |
None.
(c) Issuer Repurchases of Equity Securities
Presented in the following table are CMS Energy’s repurchases of equity securities for the three months ended June 30, 2012:2013:
| | | | | | | | | | | | | | | | |
| Period | | Total Number of
Shares
Purchased1 | | | Average Price
Paid per Share | | | Total Number of
Shares Purchased as
Part of Publicly
Announced Plans or
Programs | | | Maximum Number of
Shares that May Yet Be
Purchased Under Publicly
Announced Plans or
Programs | |
April 1, 2012 to April 30, 2012 | | | - | | | | $ - | | | | - | | | | - | |
May 1, 2012 to May 31, 2012 | | | - | | | | - | | | | - | | | | - | |
June 1, 2012 to June 30, 2012 | | | 700 | | | | 23.50 | | | | - | | | | - | |
Total | | | 700 | | | | $ 23.50 | | | | - | | | | - | |
| | |
| | | Total Number of | Maximum Number of | |
| | | Shares Purchased as | Shares That May Yet Be | |
| Total Number | Average | Part of Publicly | Purchased Under Publicly | |
| of Shares | Price Paid | Announced Plans or | Announced Plans or | |
Period | Purchased1 | per Share | Programs | Programs | |
April 1, 2013 to | 1 | | $ | 27.80 | - | - | |
April 30, 2013 | | | | | | | |
May 1, 2013 to | | | | | | | |
May 31, 2013 | 55,050 | | | 28.81 | - | - | |
June 1, 2013 to | | | | | | | |
June 30, 2013 | - | | | - | - | - | |
Total | 55,051 | | $ | 28.81 | - | - | |
1Common shares were purchased to satisfy CMS Energy’sthe minimum statutory income tax withholding obligation for common
shares that have vested under the Performance Incentive Stock Plan. SharesThe value of shares repurchased have a valueis based on the market price on the vesting date.
ITEM 3. DEFAULTS UPON SENIOR SECURITIES
None.
ITEM 4. MINE SAFETY DISCLOSURES
Not applicable.
ITEM 5. OTHER INFORMATION
None.
73
Table of Contents
ITEM 6. EXHIBITS
The agreements included as exhibits to this Form 10-Q filing are included solely to provide information regarding the terms of the agreements and are not intended to provide any other factual or disclosure information about CMS Energy, Consumers, or other parties to the agreements. The agreements may contain representations and warranties made by each of the parties to each of the agreements that were made exclusively for the benefit of the parties involved in each of the agreements and should not be treated as statements of fact. The representations and warranties were made as a way to allocate risk if one or more of those statements prove to be incorrect. The statements were qualified by disclosures of the parties to each of the agreements that may not be reflected in each of the agreements. The agreements may apply standards of materiality that are different than standards applied to other investors. Additionally, the statements were made as of the date of the agreements or as specified in the agreements and have not been updated. The representations and warranties may not describe the actual state of affairs of the parties to each agreement.
Additional information about CMS Energy and Consumers may be found in this filing, at www.cmsenergy.com, at www.consumersenergy.com, and through the SEC’s website at www.sec.gov.
Exhibits |
| | | Description |
Exhibits4.1
| | | — | Description
|
4.1 | | — | | 117121thst Supplemental Indenture dated as of May 8, 201217, 2013 between Consumers and The Bank of New York Mellon, as Trustee (Exhibit 4.1 to Form 8-K filed May 8, 201217, 2013 and incorporated herein by reference) |
4.210.1 | — | — | | 118th Supplemental Indenture dated as of June 13, 2012 between Consumers$500 million Second Amended and The Bank of New York Mellon, as Trustee (Exhibit 4.1 to Form 8-K filed June 19, 2012 and incorporated herein by reference) |
10.1 | | — | | $375,000,000 Term LoanRestated Revolving Credit Agreement dated as of June 13, 2012May 23, 2013 among Consumers, the financial institutions namedBanks, as defined therein, and JPMorgan Chase Bank, N.A., as Agent (Exhibit 10.1 to Form 8-K filed June 19, 2012 and incorporated herein by reference) |
10.212.1 | — | — | | Bond Purchase Agreement between Consumers and each of the Purchasers named therein, dated as of July 10, 2012 (Exhibit 10.1 to Form 8-K filed July 13, 2012 and incorporated herein by reference) |
12.1 | | — | | Statement regarding computation of CMS Energy’s Ratios of Earnings to Fixed Charges and Combined Fixed Charges and Preferred Dividends |
12.2 | — | — | | Statement regarding computation of Consumers’ Ratios of Earnings to Fixed Charges and Combined Fixed Charges and Preferred Dividends |
31.1 | — | — | | CMS Energy’s certification of the CEO pursuant to Section 302 of the Sarbanes-Oxley Act of 2002 |
31.2 | — | — | | CMS Energy’s certification of the CFO pursuant to Section 302 of the Sarbanes-Oxley Act of 2002 |
31.3 | — | — | | Consumers’ certification of the CEO pursuant to Section 302 of the Sarbanes-Oxley Act of 2002 |
31.4 | — | — | | Consumers’ certification of the CFO pursuant to Section 302 of the Sarbanes-Oxley Act of 2002 |
32.1 | — | — | | CMS Energy’s certifications pursuant to Section 906 of the Sarbanes-Oxley Act of 2002 |
32.2 | — | — | | Consumers’ certifications pursuant to Section 906 of the Sarbanes-Oxley Act of 2002 |
101.INS11 | — | — | | XBRL Instance Document |
101.SCH11 | — | — | | XBRL Taxonomy Extension Schema |
101.CAL11 | — | — | | XBRL Taxonomy Extension Calculation Linkbase |
101.DEF11 | — | — | | XBRL Taxonomy Extension Definition Linkbase |
101.LAB11 | — | — | | XBRL Taxonomy Extension Labels Linkbase |
101.PRE11 | — | — | | XBRL Taxonomy Extension Presentation Linkbase |
1In accordance with Regulation S-T, the XBRL-related information in Exhibit 101 shall be deemed to be “furnished” and not
“filed.” The financial information contained in the XBRL-related information is “unaudited” and “unreviewed.”
74
Table of Contents
SIGNATURES
Pursuant to the requirements of the Securities Exchange Act of 1934, each registrant has duly caused this report to be signed on its behalf by the undersigned thereunto duly authorized. The signature for each undersigned company shall be deemed to relate only to matters having reference to such company or its subsidiary.
| | | | | | |
| | | | CMS ENERGY CORPORATION |
| | (Registrant) |
| | |
| | | |
| | |
Dated: July 26, 201225, 2013 | By: | | | By: | | /s/ Thomas J. Webb |
| | | | | | | |
| | Thomas J. Webb |
| | | | | | Executive Vice President and |
| | Chief Financial Officer |
| | |
| | |
| | |
| | CONSUMERS ENERGY COMPANY |
| | (Registrant) |
| | |
| | | |
| | |
Dated: July 26, 201225, 2013 | By: | | | By: | | /s/ Thomas J. Webb |
| | | | | | | |
| | Thomas J. Webb |
| | | | | | Executive Vice President and |
| | Chief Financial Officer |
75
Table of Contents
CMS ENERGY’S AND CONSUMERS’ EXHIBIT INDEX
Exhibits |
| | | Description |
Exhibits10.1
| | | — | Description$500 million Second Amended and Restated Revolving Credit Agreement dated as of May 23, 2013 among Consumers, the Banks, as defined therein, and JPMorgan Chase Bank, N.A., as Agent
|
12.1 | — | — | | Statement regarding computation of CMS Energy’s Ratios of Earnings to Fixed Charges and Combined Fixed Charges and Preferred Dividends |
12.2 | — | — | | Statement regarding computation of Consumers’ Ratios of Earnings to Fixed Charges and Combined Fixed Charges and Preferred Dividends |
31.1 | — | — | | CMS Energy’s certification of the CEO pursuant to Section 302 of the Sarbanes-Oxley Act of 2002 |
31.2 | — | — | | CMS Energy’s certification of the CFO pursuant to Section 302 of the Sarbanes-Oxley Act of 2002 |
31.3 | — | — | | Consumers’ certification of the CEO pursuant to Section 302 of the Sarbanes-Oxley Act of 2002 |
31.4 | — | — | | Consumers’ certification of the CFO pursuant to Section 302 of the Sarbanes-Oxley Act of 2002 |
32.1 | — | — | | CMS Energy’s certifications pursuant to Section 906 of the Sarbanes-Oxley Act of 2002 |
32.2 | — | — | | Consumers’ certifications pursuant to Section 906 of the Sarbanes-Oxley Act of 2002 |
101.INS11 | — | — | | XBRL Instance Document |
101.SCH11 | — | — | | XBRL Taxonomy Extension Schema |
101.CAL11 | — | — | | XBRL Taxonomy Extension Calculation Linkbase |
101.DEF11 | — | — | | XBRL Taxonomy Extension Definition Linkbase |
101.LAB11 | — | — | | XBRL Taxonomy Extension Labels Linkbase |
101.PRE11 | — | — | | XBRL Taxonomy Extension Presentation Linkbase |
| 11 The financial information contained in the XBRL-related information is “unaudited” and “unreviewed.” | In accordance with Regulation S-T, the XBRL-related information in Exhibit 101 shall be deemed to be “furnished” and not “filed.” The financial information contained in the XBRL-related information is “unaudited” and “unreviewed.”
|