UNITED STATES SECURITIES AND EXCHANGE COMMISSION
Washington, D.C. 20549
FORM 10-Q
(Mark One)
| (Mark One) | ||
| þ | QUARTERLY REPORT PURSUANT TO SECTION 13 OR 15(d) OF THE SECURITIES EXCHANGE ACT OF 1934 |
For the quarterly period ended March 31, 2013
OR
| For the quarterly period ended June 30, 2013 | ||
| OR | ||
| ¨ | TRANSITION REPORT PURSUANT TO SECTION 13 OR 15(d) OF THE SECURITIES EXCHANGE ACT OF 1934 | |
| For the transition period fromto | ||
For the transition period fromto
Commission file number 1-32599
WILLIAMS PARTNERS L.P.
(Exact name of registrant as specified in its charter)
| WILLIAMS PARTNERS L.P. | ||||
| (Exact name of registrant as specified in its charter) |
DELAWARE | 20-2485124 | |||
| (State or other jurisdiction of incorporation or organization) | (I.R.S. Employer Identification No.) | |||
| ONE WILLIAMS CENTER | ||||
TULSA, OKLAHOMA | 74172-0172 | |||
| (Address of principal executive offices) | (Zip Code) | |||
Registrant’s telephone number, including area code: (918) 573-2000
NO CHANGE
(Former name, former address and former fiscal year, if changed since last report)
Indicate by check mark whether the registrant (1) has filed all reports required to be filed by Section 13 or 15(d) of the Securities Exchange Act of 1934 during the preceding 12 months (or for such shorter period that the registrant was required to file such reports), and (2) has been subject to such filing requirements for the past 90 days. Yesþ No¨
Indicate by check mark whether the registrant has submitted electronically and posted on its corporate Web site, if any, every Interactive Data File required to be submitted and posted pursuant to Rule 405 of Regulation S-T (§232.405 of this chapter) during the preceding 12 months (or for such shorter period that the registrant was required to submit and post such files). Yesþ No¨
Indicate by check mark whether the registrant is a large accelerated filer, an accelerated filer, a non-accelerated filer or a smaller reporting company. See the definitions of “large accelerated filer,” “accelerated filer” and “smaller reporting company” in Rule 12b-2 of the Exchange Act. (Check one):
Large accelerated filerþ | Accelerated filer¨ | Non-accelerated filer¨ | Smaller reporting company¨ | |||
| (Do not check if a smaller reporting company) |
Indicate by check mark whether the registrant is a shell company (as defined in Rule 12b-2 of the Exchange Act). Yes¨ Noþ
The registrant had 413,900,699 common units outstanding as of May 7,July 31, 2013.
Williams Partners L.P.
Certain matters contained in this report include “forward-looking statements” within the meaning of Section 27A of the Securities Act of 1933, as amended, and Section 21E of the Securities Exchange Act of 1934, as amended. These forward-looking statements relate to anticipated financial performance, management’s plans and objectives for future operations, business prospects, outcome of regulatory proceedings, market conditions and other matters.
All statements, other than statements of historical facts, included in this report that address activities, events or developments that we expect, believe or anticipate will exist or may occur in the future are forward-looking statements. Forward-looking statements can be identified by various forms of words such as “anticipates,” “believes,” “seeks,” “could,” “may,” “should,” “continues,” “estimates,” “expects,” “assumes,” “forecasts,” “intends,” “might,” “goals,” “objectives,” “targets,” “planned,” “potential,” “projects,” “scheduled,” “will,” “guidance,” “outlook,” “in service date” or other similar expressions. These statements are based on management’s beliefs and assumptions and on information currently available to management and include, among others, statements regarding:
Amounts and nature of future capital expenditures;
Expansion and growth of our business and operations;
Financial condition and liquidity;
Business strategy;
Cash flow from operations or results of operations;
The levels of cash distributions to unitholders;
Seasonality of certain business components;
Natural gas, natural gas liquids and olefins prices, supply and demand; and
Demand for our services.
Forward-looking statements are based on numerous assumptions, uncertainties, and risks that could cause future events or results to be materially different from those stated or implied in this report. Limited partner units are inherently different from the capital stock of a corporation, although many of the business risks to which we are subject are similar to those that would be faced by a corporation engaged in a similar business. You should carefully consider the risk factors discussed below in addition to the other information in this report. If any of the following risks were actually to occur, our business, results of operations, and financial condition could be materially adversely affected. In that case, we might not be able to pay distributions on our common units, the trading price of our common units could decline, and unitholders could lose all or part of their investment. Many of the factors that will determine these results are beyond our ability to control or predict. Specific factors that could cause actual results to differ from results contemplated by the forward-looking statements include, among others, the following:
Whether we have sufficient cash from operations to enable us to pay current and expected levels of cash distributions, if any, following establishment of cash reserves and payment of fees and expenses, including payments to our general partner;
Availability of supplies, market demand, and volatility of prices;
Inflation, interest rates, and general economic conditions (including future disruptions and volatility in the global credit markets and the impact of these events on our customers and suppliers);
The strength and financial resources of our competitors and the effects of competition;
Ability to acquire new businesses and assets and integrate those operations and assets into our existing businesses, as well as successfully expand our facilities;
Development of alternative energy sources;
The impact of operational and development hazards and unforeseen interruptions;
Costs of, changes in, or the results of laws, government regulations (including safety and environmental regulations), environmental liabilities, litigation and rate proceedings;
Our allocated costs for defined benefit pension plans and other postretirement benefit plans sponsored by our affiliates;
Changes in maintenance and construction costs;
Changes in the current geopolitical situation;
Our exposure to the credit risks of our customers and counterparties;
Risks related to strategy and financing, including restrictions stemming from our debt agreements, future changes in our credit ratings, and the availability and cost of capital;
The amount of cash distributions from and capital requirements of our investments and joint ventures in which we participate;
Risks associated with weather conditions and natural phenomena, including climate conditions;
Acts of terrorism, including cybersecurity threats and related disruptions; and
Additional risks described in our filings with the Securities and Exchange Commission.
Given the uncertainties and risk factors that could cause our actual results to differ materially from those contained in any forward-looking statement, we caution investors not to unduly rely on our forward-looking statements. We disclaim any obligations to and do not intend to update the above list or to announce publicly the result of any revisions to any of the forward-looking statements to reflect future events or developments.
In addition to causing our actual results to differ, the factors listed above and referred to below may cause our intentions to change from those statements of intention set forth in this report. Such changes in our intentions may also cause our results to differ. We may change our intentions, at any time and without notice, based upon changes in such factors, our assumptions, or otherwise.
Because forward-looking statements involve risks and uncertainties, we caution that there are important factors, in addition to those listed above, that may cause actual results to differ materially from those contained in the forward-looking statements. For a detailed discussion of those factors, see Part I, Item 1A. Risk Factors in our Annual Report on Form10-K for the year ended December 31, 2012.2012, and Part II, Item 1A. Risk Factors of this Form 10-Q.
PART I – FINANCIAL INFORMATION
Consolidated Statement of Comprehensive Income
(Unaudited)
| Three months ended March 31, | Three months ended June 30, | Six months ended June 30, | ||||||||||||||||||||||
| 2013 | 2012 | 2013 | 2012 | 2013 | 2012 | |||||||||||||||||||
| (Millions, except per-unit amounts) | (Millions, except per-unit amounts) | |||||||||||||||||||||||
Revenues: | ||||||||||||||||||||||||
Service revenues | $ | 701 | $ | 673 | $ | 715 | $ | 664 | $ | 1,416 | $ | 1,337 | ||||||||||||
Product sales | 1,055 | 1,295 | 1,012 | 1,153 | 2,067 | 2,448 | ||||||||||||||||||
|
|
|
|
|
| |||||||||||||||||||
Total revenues | 1,756 | 1,968 | 1,727 | 1,817 | 3,483 | 3,785 | ||||||||||||||||||
|
|
|
|
|
| |||||||||||||||||||
Costs and expenses: | ||||||||||||||||||||||||
Product costs | 798 | 974 | 810 | 907 | 1,608 | 1,881 | ||||||||||||||||||
Operating and maintenance expenses | 246 | 220 | 279 | 264 | 525 | 484 | ||||||||||||||||||
Depreciation and amortization expenses | 199 | 159 | 185 | 171 | 375 | 330 | ||||||||||||||||||
Selling, general, and administrative expenses | 123 | 126 | 125 | 148 | 248 | 274 | ||||||||||||||||||
Other (income) expense – net | (6 | ) | 6 | 4 | 12 | 7 | 18 | |||||||||||||||||
|
|
|
|
|
| |||||||||||||||||||
Total costs and expenses | 1,360 | 1,485 | 1,403 | 1,502 | 2,763 | 2,987 | ||||||||||||||||||
|
|
|
|
|
| |||||||||||||||||||
Operating income | 396 | 483 | 324 | 315 | 720 | 798 | ||||||||||||||||||
|
|
|
|
|
| |||||||||||||||||||
Equity earnings (losses) | 18 | 30 | 35 | 27 | 53 | 57 | ||||||||||||||||||
Interest incurred | (113 | ) | (110 | ) | (113) | (110) | (226) | (220) | ||||||||||||||||
Interest capitalized | 17 | 3 | 16 | 5 | 33 | 8 | ||||||||||||||||||
Interest income | 1 | 1 | - | - | 1 | 1 | ||||||||||||||||||
Other income (expense) – net | 2 | 1 | (5) | 6 | (3) | 7 | ||||||||||||||||||
|
|
|
|
|
| |||||||||||||||||||
Net income | $ | 321 | $ | 408 | 257 | 243 | 578 | 651 | ||||||||||||||||
Less: Net income attributable to noncontrolling interests | 1 | - | 1 | - | ||||||||||||||||||||
|
|
|
| |||||||||||||||||||||
Net income attributable to controlling interests | $ | 256 | $ | 243 | $ | 577 | $ | 651 | ||||||||||||||||
|
|
|
|
|
| |||||||||||||||||||
Allocation of net income for calculation of earnings per common unit: | ||||||||||||||||||||||||
Net income | $ | 321 | $ | 408 | ||||||||||||||||||||
Net income attributable to controlling interests | $ | 256 | $ | 243 | $ | 577 | $ | 651 | ||||||||||||||||
Allocation of net income to general partner | 119 | 154 | 126 | 146 | 245 | 300 | ||||||||||||||||||
|
|
|
|
|
| |||||||||||||||||||
Allocation of net income to common units | $ | 202 | $ | 254 | $ | 130 | $ | 97 | $ | 332 | $ | 351 | ||||||||||||
|
|
|
|
|
| |||||||||||||||||||
Basic and diluted net income per common unit | $ | 0.50 | $ | 0.85 | $ | 0.31 | $ | 0.29 | $ | 0.81 | $ | 1.11 | ||||||||||||
Weighted average number of common units outstanding (thousands) | 401,969 | 299,269 | 413,901 | 335,920 | 407,968 | 317,594 | ||||||||||||||||||
Cash distributions per common unit | $ | 0.8475 | $ | 0.7775 | $ | 0.8625 | $ | 0.7925 | $ | 1.7100 | $ | 1.5700 | ||||||||||||
Other comprehensive income (loss): | Other comprehensive income (loss): |
| ||||||||||||||||||||||
Net unrealized gain (loss) from derivative instruments | $ | - | $ | (8 | ) | $ | 1 | $ | 53 | $ | 1 | $ | 45 | |||||||||||
Reclassifications into earnings of net derivative instruments (gain) loss | - | 2 | - | (8) | - | (6) | ||||||||||||||||||
|
|
|
|
|
| |||||||||||||||||||
Other comprehensive income (loss) | - | (6 | ) | 1 | 45 | 1 | 39 | |||||||||||||||||
|
|
|
|
|
| |||||||||||||||||||
Comprehensive income | $ | 321 | $ | 402 | 258 | 288 | 579 | 690 | ||||||||||||||||
Less: Comprehensive income attributable to noncontrolling interests | 1 | - | 1 | - | ||||||||||||||||||||
|
|
|
|
|
| |||||||||||||||||||
Comprehensive income attributable to controlling interests | $ | 257 | $ | 288 | $ | 578 | $ | 690 | ||||||||||||||||
|
|
|
| |||||||||||||||||||||
See accompanying notes.
(Unaudited)
| March 31, | December 31, | |||||||||||||||
| 2013 | 2012 | June 30, 2013 | December 31, 2012 | |||||||||||||
| (Millions) | (Millions) | |||||||||||||||
ASSETS | ||||||||||||||||
Current assets: | ||||||||||||||||
Cash and cash equivalents | $ | 79 | $ | 20 | $ | 118 | $ | 20 | ||||||||
Trade accounts and notes receivable | 600 | 562 | 521 | 562 | ||||||||||||
Inventories | 188 | 173 | 174 | 173 | ||||||||||||
Regulatory assets | 50 | 39 | 45 | 39 | ||||||||||||
Other current assets | 35 | 56 | 71 | 56 | ||||||||||||
|
|
|
| |||||||||||||
Total current assets | 952 | 850 | 929 | 850 | ||||||||||||
Investments | 1,871 | 1,800 | 1,955 | 1,800 | ||||||||||||
Property, plant, and equipment, at cost | 21,623 | 21,062 | 22,236 | 21,062 | ||||||||||||
Accumulated depreciation | (6,891 | ) | (6,775 | ) | (7,020) | (6,775) | ||||||||||
|
|
|
| |||||||||||||
Property, plant, and equipment – net | 14,732 | 14,287 | 15,216 | 14,287 | ||||||||||||
Goodwill | 646 | 649 | 646 | 649 | ||||||||||||
Other intangibles | 1,687 | 1,702 | 1,672 | 1,702 | ||||||||||||
Regulatory assets, deferred charges, and other | 404 | 421 | 472 | 421 | ||||||||||||
|
|
|
| |||||||||||||
Total assets | $ | 20,292 | $ | 19,709 | $ | 20,890 | $ | 19,709 | ||||||||
|
|
|
| |||||||||||||
LIABILITIES AND EQUITY | ||||||||||||||||
Current liabilities: | ||||||||||||||||
Accounts payable: | ||||||||||||||||
Trade | $ | 862 | $ | 851 | $ | 856 | $ | 851 | ||||||||
Affiliate | 94 | 117 | 118 | 117 | ||||||||||||
Accrued interest | 108 | 110 | 109 | 110 | ||||||||||||
Asset retirement obligations | 80 | 68 | 73 | 68 | ||||||||||||
Other accrued liabilities | 229 | 203 | 278 | 203 | ||||||||||||
Commercial paper | 710 | - | ||||||||||||||
|
|
|
| |||||||||||||
Total current liabilities | 1,373 | 1,349 | 2,144 | 1,349 | ||||||||||||
Long-term debt | 8,312 | 8,437 | 8,063 | 8,437 | ||||||||||||
Asset retirement obligations | 502 | 508 | 518 | 508 | ||||||||||||
Regulatory liabilities, deferred income, and other | 523 | 518 | 546 | 518 | ||||||||||||
Contingent liabilities (Note 8) | ||||||||||||||||
Contingent liabilities (Note 9) | ||||||||||||||||
Equity: | ||||||||||||||||
Partners’ equity: | ||||||||||||||||
Common units (413,900,699 units outstanding at March 31, 2013 and 397,963,199 units outstanding at December 31, 2012) | 11,038 | 10,372 | ||||||||||||||
Common units (413,900,699 units outstanding at June 30, 2013 and 397,963,199 units outstanding at December 31, 2012) | 10,825 | 10,372 | ||||||||||||||
General partner | (1,470 | ) | (1,487 | ) | (1,471) | (1,487) | ||||||||||
Accumulated other comprehensive income (loss) | (2 | ) | (2 | ) | (1) | (2) | ||||||||||
|
|
|
| |||||||||||||
Total partners’ equity | 9,566 | 8,883 | 9,353 | 8,883 | ||||||||||||
Noncontrolling interests in consolidated subsidiaries | 16 | 14 | 266 | 14 | ||||||||||||
|
|
|
| |||||||||||||
Total equity | 9,582 | 8,897 | 9,619 | 8,897 | ||||||||||||
|
|
|
| |||||||||||||
Total liabilities and equity | $ | 20,292 | $ | 19,709 | $ | 20,890 | $ | 19,709 | ||||||||
|
|
|
| |||||||||||||
See accompanying notes.
Consolidated Statement of Changes in Equity
(Unaudited)
| Williams Partners L.P. | ||||||||||||||||||||||||||||||||||||||||
| Accumulated Other | ||||||||||||||||||||||||||||||||||||||||
| Common | General | Comprehensive | Noncontrolling | Total | Williams Partners L.P. | |||||||||||||||||||||||||||||||||||
| Units | Partner | Income (Loss) | Interests | Equity | Common Units | General Partner | Accumulated Other Comprehensive Income (Loss) | Noncontrolling Interests | Total Equity | |||||||||||||||||||||||||||||||
| (Millions) | (Millions) | |||||||||||||||||||||||||||||||||||||||
Balance – December 31, 2012 | $ | 10,372 | $ | (1,487 | ) | $ | (2 | ) | $ | 14 | $ | 8,897 | $ | 10,372 | $ | (1,487) | $ | (2) | $ | 14 | $ | 8,897 | ||||||||||||||||||
Net income | 211 | 110 | - | - | 321 | 350 | 227 | - | 1 | 578 | ||||||||||||||||||||||||||||||
Other comprehensive income (loss) | - | - | 1 | - | 1 | |||||||||||||||||||||||||||||||||||
Cash distributions (Note 3) | (329 | ) | (113 | ) | - | - | (442 | ) | (680) | (235) | - | - | (915) | |||||||||||||||||||||||||||
Sales of common units | 760 | - | - | - | 760 | 760 | - | - | - | 760 | ||||||||||||||||||||||||||||||
Contributions from general partner | - | 45 | - | - | 45 | - | 49 | - | - | 49 | ||||||||||||||||||||||||||||||
Contributions from noncontrolling interests | - | - | - | 2 | 2 | - | - | - | 251 | 251 | ||||||||||||||||||||||||||||||
Other | 24 | (25 | ) | - | - | (1 | ) | 23 | (25) | - | - | (2) | ||||||||||||||||||||||||||||
|
|
|
|
|
|
|
|
|
| |||||||||||||||||||||||||||||||
Balance – March 31, 2013 | $ | 11,038 | $ | (1,470 | ) | $ | (2 | ) | $ | 16 | $ | 9,582 | ||||||||||||||||||||||||||||
Balance – June 30, 2013 | $ | 10,825 | $ | (1,471) | $ | (1) | $ | 266 | $ | 9,619 | ||||||||||||||||||||||||||||||
|
|
|
|
|
|
|
|
|
| |||||||||||||||||||||||||||||||
See accompanying notes.
Consolidated Statement of Cash Flows
(Unaudited)
| Three months ended March 31, | Six months ended June 30, | |||||||||||||||
| 2013 | 2012 | 2013 | 2012 | |||||||||||||
| (Millions) | (Millions) | |||||||||||||||
OPERATING ACTIVITIES: | ||||||||||||||||
Net income | $ | 321 | $ | 408 | $ | 578 | $ | 651 | ||||||||
Adjustments to reconcile to net cash provided by operations: | ||||||||||||||||
Depreciation and amortization | 199 | 159 | 375 | 330 | ||||||||||||
Cash provided (used) by changes in current assets and liabilities: | ||||||||||||||||
Accounts and notes receivable | (37 | ) | - | 41 | 39 | |||||||||||
Inventories | (15 | ) | (15 | ) | 1 | 14 | ||||||||||
Other current assets and deferred charges | 13 | 9 | (7) | 29 | ||||||||||||
Accounts payable | 2 | (40 | ) | (21) | (139) | |||||||||||
Accrued liabilities | 19 | (17 | ) | 63 | 4 | |||||||||||
Affiliate accounts receivable and payable – net | (23 | ) | 23 | 1 | 74 | |||||||||||
Other, including changes in noncurrent assets and liabilities | 32 | 25 | 78 | 54 | ||||||||||||
|
|
|
| |||||||||||||
Net cash provided by operating activities | $ | 511 | $ | 552 | 1,109 | 1,056 | ||||||||||
|
|
|
| |||||||||||||
FINANCING ACTIVITIES: | ||||||||||||||||
Proceeds from (payments of) commercial paper – net | 710 | - | ||||||||||||||
Proceeds from long-term debt | 770 | - | 1,705 | 500 | ||||||||||||
Payments of long-term debt | (895 | ) | - | (2,080) | (155) | |||||||||||
Proceeds from sales of common units | 760 | 490 | 760 | 2,071 | ||||||||||||
General partner contributions | 20 | 26 | 24 | 74 | ||||||||||||
Distributions to limited partners and general partner | (442 | ) | (311 | ) | (915) | (673) | ||||||||||
Contributions from noncontrolling interests | 251 | 2 | ||||||||||||||
Other – net | 7 | (37 | ) | 12 | (41) | |||||||||||
|
|
|
| |||||||||||||
Net cash provided by financing activities | $ | 220 | $ | 168 | 467 | 1,778 | ||||||||||
|
|
|
| |||||||||||||
INVESTING ACTIVITIES: | ||||||||||||||||
Property, plant and equipment: | ||||||||||||||||
Capital expenditures | (608 | ) | (260 | ) | (1,318) | (784) | ||||||||||
Net proceeds from dispositions | 3 | 9 | 2 | 22 | ||||||||||||
Purchases of businesses | - | (325 | ) | - | (2,049) | |||||||||||
Purchase of business from affiliates | 25 | - | 25 | - | ||||||||||||
Purchases of and contributions to equity method investments | (93 | ) | (48 | ) | (182) | (184) | ||||||||||
Other – net | 1 | 4 | (5) | 32 | ||||||||||||
|
|
|
| |||||||||||||
Net cash used by investing activities | $ | (672 | ) | $ | (620 | ) | (1,478) | (2,963) | ||||||||
|
|
|
| |||||||||||||
Increase in cash and cash equivalents | 59 | 100 | ||||||||||||||
Increase (decrease) in cash and cash equivalents | 98 | (129) | ||||||||||||||
Cash and cash equivalents at beginning of period | 20 | 163 | 20 | 163 | ||||||||||||
|
|
|
| |||||||||||||
Cash and cash equivalents at end of period | $ | 79 | $ | 263 | $ | 118 | $ | 34 | ||||||||
|
|
|
| |||||||||||||
See accompanying notes.
Notes to Consolidated Financial Statements
(Unaudited)
Note 1. General and Basis of Presentation
General
Our accompanying interim consolidated financial statements do not include all the notes in our annual financial statements and, therefore, should be read in conjunction with the consolidated financial statements and notes thereto for the year ended December 31, 2012 in Exhibit 99.1 of our Form 8-K dated May 13, 2013 (2012 Annual Report on Form 10-K.Financial Statements). The accompanying unaudited financial statements include all normal recurring adjustments that, in the opinion of management, are necessary to present fairly our interim financial statements.
The preparation of financial statements in conformity with accounting principles generally accepted in the United States requires management to make estimates and assumptions that affect the amounts reported in the consolidated financial statements and accompanying notes. Actual results could differ from those estimates.
Unless the context clearly indicates otherwise, references in this report to “we,” “our,” “us,” or similar language refer to Williams Partners L.P. and its subsidiaries.
We are a publicly traded Delaware limited partnership. Williams Partners GP LLC, a Delaware limited liability company wholly owned by The Williams Companies, Inc. (Williams), serves as our general partner. As of March 31,June 30, 2013, Williams owns an approximate 66 percent limited partner interest, a 2 percent general partner interest and incentive distribution rights (IDRs) in us. All of our activities are conducted through Williams Partners Operating LLC, an operating limited liability company (wholly owned by us).
Basis of Presentation
Organizational restructuring
Following Williams’ spin-off of WPX Energy, Inc. (WPX) at the end of 2011 and in consideration of the growth plans of the ongoing business, Williams initiated an organizational restructuring evaluation to better align resources to support an overall business strategy to provide large-scale energy infrastructure designed to maximize the opportunities created by the vast supply of natural gas, natural gas products, and crude oil that exists in North America. As a result of this review, a new structure was implemented effective January 1, 2013, that generally organizes our businesses into geographically based operating areas. We have changed our segment reporting structure to align with the new operating areas resulting from the organizational restructuring, as this is consistent with the manner in which our Chief Operating Decision Maker evaluates performance and makes resource allocation decisions. Beginning in the first quarter of 2013, our reportable segments are Northeast G&P, Atlantic-Gulf, West, and NGL & Petchem Services.
Northeast G&P is comprised of our midstream gathering and processing businesses in the Marcellus and Utica shale regions, as well as a 51 percent equity investment in Laurel Mountain Midstream, LLC (Laurel Mountain) and a 47.5 percent equity investment in Caiman Energy II, LLC (Caiman).
Atlantic-Gulf is comprised of our interstate natural gas pipeline, Transcontinental Gas Pipe Line Company, LLC (Transco), and significant natural gas gathering and processing and crude production handling and transportation in the Gulf Coast region, as well as a 50 percent equity investment in Gulfstream Natural Gas System, L.L.C. (Gulfstream), a 5141 percent consolidated interest in Constitution Pipeline Company, LLC (Constitution), and a 60 percent equity investment in Discovery Producer Services LLC (Discovery).
West is comprised of our gathering, processing and treating operations in New Mexico, Colorado, and Wyoming and our interstate natural gas pipeline, Northwest Pipeline GP (which was changed to Northwest Pipeline LLC on July 1, 2013) (Northwest Pipeline).
Notes (Continued)
NGL & Petchem Services is comprised of our natural gas liquid (NGL) and natural gas marketing business, an NGL fractionator and storage facilities near Conway, Kansas, a 50 percent equity investment in Overland Pass Pipeline, LLC (OPPL), and an 83.3 percent undivided interest in an olefins production facility in Geismar, Louisiana, along with a refinery grade propylene splitter and pipelines in the Gulf Coast region.
Other
As disclosed in our 2012 Annual Report on Form 10-K, in November 2012Financial Statements, we acquired an entity in November 2012 that holds an 83.3 percent undivided interest in an olefins-production facility in Geismar, Louisiana and associated assets from Williams. As a result, prior period financial statement amounts and disclosures have been recast for this transaction. The effect of recasting our financial statements to account for this transaction increased net income $60 million for the three months ended March 31, 2012. This acquisition does not impact historical earnings per unit as pre-acquisition earnings were allocated to our general partner. In March 2013, we received $25 million in cash from Williams and Williams waived $4 million in payments on its IDRs with respect to our next quarterly distribution related to a working capital adjustment associated with the acquisition.
The entity acquired in the Geismar Acquisition was an affiliate of Williams at the time of the acquisition; therefore, the acquisition was accounted for as a common control transaction, similar to a pooling of interests, whereby the assets and liabilities of the acquired entity waswere combined with ours at their historical amounts. As a result, prior period financial statement amounts and disclosures have been recast for this transaction. The effect of recasting our financial statements to account for this transaction increased net income $50 million and $110 million for the three and six months ended June 30, 2012, respectively. This acquisition does not impact historical earnings per common unit as pre-acquisition earnings were allocated to our general partner. In March 2013, we received $25 million in cash from Williams and Williams waived $4 million in payments on its historical amount.IDRs with respect to our May 2013 distribution related to a working capital adjustment associated with the acquisition.
Also as disclosed in our 2012 Annual Report on Form 10-K,Financial Statements, we have revised the overall presentation of our Consolidated Statement of Comprehensive Income, including the separate presentation ofservice revenues,product sales,product costs, anddepreciation and amortization expenses. All prior periods presented have been recast, along with corresponding information presented in the Notes to Consolidated Financial Statements, to reflect this change.
Note 2. Variable Interest Entities
Consolidated VIEs
We consolidate the activities of variable interest entities (VIEs) of which we are the primary beneficiary. The primary beneficiary of a VIE is the entity that has both (1) the power to direct the activities of the VIE that most significantly impact the VIE’s economic performance and (2) the obligation to absorb losses or the right to receive benefits that could be significant to the VIE. As of March 31,June 30, 2013, we have the following consolidated VIEs:
| • | During the second quarter of 2013, a third party contributed $187 million to Gulfstar One LLC (Gulfstar) |
Notes (Continued)
WeDuring the second quarter of 2013, a third party contributed $4 million to Constitution in exchange for a 10 percent ownership interest in Constitution. This contribution was based on 10 percent of Constitution’s contributed capital to date. The $4 million was then distributed to us. As a result of this transaction, we now own a 5141 percent interest in Constitution, a subsidiary that, due to shipper fixed-payment commitments under its firm transportation contracts, is a VIE. We are the primary beneficiary because we have the power overto direct the decisionsactivities that most significantly impact Constitution’s economic performance. We, as construction agent for Constitution, will buildare building a pipeline connecting our gathering system in Susquehanna County, Pennsylvania, to the Iroquois Gas Transmission and the Tennessee Gas Pipeline systems. We plan to place the project in service in March 2015 and estimate the total remaining construction costs of the project to be less than $650 million, which will be funded with capital contributions from us, along with the other equity partners, proportional to ownership interest.
Notes (Continued)
|
The following table presents amounts included in our Consolidated Balance Sheet that are for the use or obligation of these VIEs:VIEs, which are joint projects in the development and construction phase:
| March 31, | December 31, | |||||||||
| 2013 | 2012 | Classification | ||||||||
| (Millions) | ||||||||||
Gulfstar: | ||||||||||
Construction work in process | $ | 572 | $ | 532 | Property, plant, and equipment, at cost | |||||
Accounts payable | 88 | 124 | Accounts payable - trade | |||||||
Construction retainage | 1 | - | Other accrued liabilities | |||||||
Deferred revenue associated with customer advance payments | 109 | 109 | Regulatory liabilities, deferred income, and other | |||||||
Constitution: | ||||||||||
Cash and cash equivalents | 7 | 8 | Cash and cash equivalents | |||||||
Construction work in process | 31 | 24 | Property, plant, and equipment, at cost | |||||||
Accounts payable | 5 | 4 | Accounts payable - trade | |||||||
| June 30, 2013 | December 31, 2012 | Classification | ||||||||
| (Millions) | ||||||||||
Assets (liabilities): | ||||||||||
Cash and cash equivalents | $ | 31 | $ | 8 | Cash and cash equivalents | |||||
Accounts receivable | 1 | - | Trade accounts and notes receivable | |||||||
Construction in progress | 707 | 556 | Property, plant, and equipment, at cost | |||||||
Accounts payable | (98 | ) | (128 | ) | Accounts payable - trade | |||||
Construction retainage | (1 | ) | - | Other accrued liabilities | ||||||
Deferred revenue associated with | (110 | ) | (109 | ) | Regulatory liabilities, deferred income, and other | |||||
Nonconsolidated VIEs
We have also identified certain interests in VIEs where we are not the primary beneficiary. These include our equity method investmentsinclude:
Our equity-method investment in Laurel Mountain and Discovery. These entities areis considered to be VIEsa VIE generally due to contractual provisions that transfer certain risks to customers. As certain significant decisions inabout the managementactivities that most significantly impact the economic performance of these entitiesthis entity require a unanimous vote of all members, we are not the primary beneficiary. Our maximum exposure to loss is limited to the carrying value of our investments,this investment, which are $483is $491 million at June 30, 2013.
Our 47.5 percent-owned equity-method investment in Caiman has been determined to be a VIE because it has insufficient equity to finance activities during the construction stage of the Blue Racer Midstream joint project, which is an expansion to gathering and $357 million for Laurel Mountainprocessing and Discovery, respectively, at March 31, 2013.the
Notes (Continued)
associated liquids infrastructure serving oil and gas producers in the Utica shale, primarily in Ohio and northwest Pennsylvania. We are not the primary beneficiary because we do not have the power to direct the activities of Caiman that most significantly impact its economic performance. Our maximum exposure to loss is limited to $380 million of total contributions that we have committed to make. At June 30, 2013, the carrying value of our investment in Caiman was $132 million, which substantially reflects our contributions to date. |
Note 3. Allocation of Net Income and Distributions
The allocation of net income between our general partner and limited partners is as follows:
| Three months ended | ||||||||
| March 31, | ||||||||
| 2013 | 2012 | |||||||
| (Millions) | ||||||||
Allocation of net income to general partner: | ||||||||
Net income | $ | 321 | $ | 408 | ||||
Net income applicable to pre-partnership operations allocated to general partner | - | (60 | ) | |||||
|
|
|
| |||||
Income subject to 2% allocation of general partner interest | 321 | 348 | ||||||
General partner’s share of net income | 2% | 2% | ||||||
|
|
|
| |||||
General partner’s allocated share of net income before items directly allocable to general partner interest | 6 | 7 | ||||||
Incentive distributions paid to general partner (a) | 104 | 78 | ||||||
Pre-partnership net income allocated to general partner interest | - | 60 | ||||||
|
|
|
| |||||
Net income allocated to general partner | $ | 110 | $ | 145 | ||||
|
|
|
| |||||
Net income | $ | 321 | $ | 408 | ||||
Net income allocated to general partner | 110 | 145 | ||||||
|
|
|
| |||||
Net income allocated to common limited partners | $ | 211 | $ | 263 | ||||
|
|
|
| |||||
Notes (Continued)
| Three months ended June 30, | Six months ended June 30, | |||||||||||||||
| 2013 | 2012 | 2013 | 2012 | |||||||||||||
| (Millions) | ||||||||||||||||
Allocation of net income to general partner: | ||||||||||||||||
Net income | $ | 257 | $ | 243 | $ | 578 | $ | 651 | ||||||||
Net income applicable to pre-partnership operations allocated to general partner | - | (50) | - | (110) | ||||||||||||
Net income applicable to noncontrolling interests | (1) | - | (1) | - | ||||||||||||
|
|
|
|
|
|
|
| |||||||||
Income subject to 2% allocation of general partner interest | 256 | 193 | 577 | 541 | ||||||||||||
General partner’s share of net income | 2 % | 2 % | 2 % | 2 % | ||||||||||||
|
|
|
|
|
|
|
| |||||||||
General partner’s allocated share of net income before items directly allocable to general partner interest | 5 | 4 | 11 | 11 | ||||||||||||
Incentive distributions paid to general partner (a) | 112 | 86 | 216 | 164 | ||||||||||||
Pre-partnership net income allocated to general partner interest | - | 50 | - | 110 | ||||||||||||
|
|
|
|
|
|
|
| |||||||||
Net income allocated to general partner | $ | 117 | $ | 140 | $ | 227 | $ | 285 | ||||||||
|
|
|
|
|
|
|
| |||||||||
Net income | $ | 257 | $ | 243 | $ | 578 | $ | 651 | ||||||||
Net income allocated to general partner | 117 | 140 | 227 | 285 | ||||||||||||
Net income allocated to noncontrolling interests | 1 | - | 1 | - | ||||||||||||
|
|
|
|
|
|
|
| |||||||||
Net income allocated to common limited partners | $ | 139 | $ | 103 | $ | 350 | $ | 366 | ||||||||
|
|
|
|
|
|
|
| |||||||||
| (a) | The net income allocated to the general partner’s capital account reflects IDRs paid during the current reporting period. In the calculation of basic and diluted net income per common unit, the net income allocated to the general partner includes IDRs pertaining to the current reporting period but paid in the subsequent period. |
We paid or have authorized payment of the following partnership cash distributions during 2012 and 2013 (in millions, except for per unit amounts):
| General Partner | ||||||||||||||||||||||||||||||||||||||||
| Incentive | ||||||||||||||||||||||||||||||||||||||||
| Per Unit | Common | Distribution | Total Cash | General Partner | ||||||||||||||||||||||||||||||||||||
Payment Date | Distribution | Units | 2% | Rights | Distribution | Per Unit Distribution | Common Units | 2% | Incentive Distribution Rights | Total Cash Distribution | ||||||||||||||||||||||||||||||
2/10/2012 | $ | 0.7625 | $ | 227 | $ | 6 | $ | 78 | $ | 311 | $ | 0.7625 | $ | 227 | $ | 6 | $ | 78 | $ | 311 | ||||||||||||||||||||
5/11/2012 | $ | 0.7775 | $ | 268 | $ | 8 | $ | 86 | $ | 362 | $ | 0.7775 | $ | 268 | $ | 8 | $ | 86 | $ | 362 | ||||||||||||||||||||
8/10/2012 | $ | 0.7925 | $ | 274 | $ | 7 | $ | 92 | $ | 373 | $ | 0.7925 | $ | 274 | $ | 7 | $ | 92 | $ | 373 | ||||||||||||||||||||
11/09/2012 | $ | 0.8075 | $ | 287 | $ | 8 | $ | 99 | $ | 394 | $ | 0.8075 | $ | 287 | $ | 8 | $ | 99 | $ | 394 | ||||||||||||||||||||
2/08/2013 | $ | 0.8275 | $ | 329 | $ | 9 | $ | 104 | $ | 442 | $ | 0.8275 | $ | 329 | $ | 9 | $ | 104 | $ | 442 | ||||||||||||||||||||
5/10/2013 (a) | $ | 0.8475 | $ | 351 | $ | 10 | $ | 112 | $ | 473 | ||||||||||||||||||||||||||||||
5/10/2013 | $ | 0.8475 | $ | 351 | $ | 10 | $ | 112 | $ | 473 | ||||||||||||||||||||||||||||||
8/09/2013 (a) | $ | 0.8625 | $ | 357 | $ | 11 | $ | 121 | $ | 489 | ||||||||||||||||||||||||||||||
| (a) | The Board of Directors of our general partner declared this |
Notes (Continued)
The 2012 and 2013 cash distributions paid to our general partner in the table above have been reduced by a total of $79$105 million resulting from the temporary waiver of IDRs associated with certain assets acquired in 2012.
Note 4. Other Accruals
On June 13, 2013, an explosion and fire occurred at our Geismar olefins plant located south of Baton Rouge, in a remote industrial complex, that resulted in the tragic deaths of two affiliate employees and injuries of additional affiliate employees and contractors. The fire was extinguished on the day of the incident. The incident (Geismar Incident) rendered the facility temporarily inoperable and resulted in significant human, financial and operational effects.
We have substantial insurance coverage for repair and replacement costs, lost production and additional expenses related to the incident as follows:
Property damage and business interruption coverage with a combined per-occurrence limit of $500 million and retentions (deductibles) of $10 million per occurrence for property damage and a 60-day waiting period per occurrence for business interruption;
General liability coverage with per-occurrence and aggregate annual limits of $610 million and retentions (deductibles) of $2 million per occurrence;
Workers’ compensation coverage with statutory limits and retentions (deductibles) of $1 million total per occurrence.
We are in the early stages of determining the full extent of property damage and developing claims information for business interruption coverage. Through June 30, 2013, we have expensed $6 million of insurance deductibles inoperating and maintenance expenses in the Consolidated Statement of Comprehensive Income, based on our initial evaluation. Recoveries under our business interruption policy will be recognized upon resolution of any contingencies with the insurer associated with the claim. Such recoveries, when recognized, will be recorded as a gain toother (income) expense – net withincosts and expenses in our Consolidated Statement of Comprehensive Income.
During the second quarter of 2012, we incurred acquisition transaction costs of $16 million related to the acquisition of 100 percent of the ownership interests in Caiman Eastern Midstream, LLC. These costs are included inselling, general, and administrative expenses.
Other (income) expense – net withincosts and expenses for the three and six months ended June 30, 2013 includes a $6 million expense related to the portion of the Eminence abandonment regulatory asset that will not be recovered through rates, pursuant to Transco’s agreement in principle associated with its general rate case filing. (See Note 9.) We also recognized income of $12 million related to insurance recoveries associated with this event that we consider probable of collection. Additionally, we recorded charges of $2 million during the three and six months ended June 30, 2013 and $9 million and $15 million during the three and six months ended June 30, 2012, respectively, related to project development costs associated with natural gas pipeline expansion projects.
Other income (expense) – net belowoperating income for the three and six months ended June 30, 2013, includes a charge of $14 million associated with the impact of a second quarter Texas franchise tax law change.
Notes (Continued)
Note 5. Inventories
| March 31, | December 31, | |||||||||||||||
| 2013 | 2012 | June 30, 2013 | December 31, 2012 | |||||||||||||
| (Millions) | (Millions) | |||||||||||||||
Natural gas liquids, olefins, and natural gas in underground storage | $ | 108 | $ | 96 | $ | 93 | $ | 96 | ||||||||
Materials, supplies, and other | 80 | 77 | 81 | 77 | ||||||||||||
|
|
|
| |||||||||||||
| $ | 188 | $ | 173 | $ | 174 | $ | 173 | |||||||||
|
|
|
| |||||||||||||
Note 5.6. Debt and Banking Arrangements
Credit Facility
Letter of credit capacity under our $2.4 billion credit facility is $1.3 billion. At March 31,June 30, 2013, no letters of credit have been issued and $250 million ofno loans are outstanding under our credit facility.
On July 31, 2013, we amended our $2.4 billion credit facility to increase the aggregate commitments to $2.5 billion and extend the maturity date to July 31, 2018. Additionally, Transco and Northwest Pipeline are each able to borrow up to $500 million under the amended credit facility to the extent not otherwise utilized by the other co-borrowers. Our credit facility may also, under certain conditions, be increased up to an additional $500 million.
Commercial Paper Program
In March 2013, we initiated a commercial paper program. The program allows a maximum outstanding amount at any time of $2 billion of unsecured commercial paper notes. The maturities of the commercial paper notes will vary but may not exceed 397 days from the date of issuance. The commercial paper notes will beare sold under customary terms in the commercial paper market and will beare issued at a discount from par, or, alternatively, will beare sold at par and bear varying interest rates on a fixed or floating basis. Proceeds from these notes are expected to be used to fund plannedfor general partnership purposes, including funding capital expenditures, working capital, and for other general partnership purposes. We have not yet issued any notes under thisdistributions. At June 30, 2013, $710 million of commercial paper program.is outstanding at a weighted average interest rate of 0.42 percent.
Note 6.7. Partners’ Capital
Notes (Continued)
In March 2013, we completed an equity issuance of 14,250,000 common units, including 3,000,000 common units sold to Williams in a private placement. Subsequently, the underwriters exercised their option to purchase 1,687,500 common units. The net proceeds of approximately $760 million were used to repay amounts outstanding under our revolver.
Note 7.8. Fair Value Measurements
The following table presents, by level within the fair value hierarchy, certain of our financial assets and liabilities. The carrying values of cash and cash equivalents, accounts receivable, commercial paper, and accounts payable approximate fair value because of the short-term nature of these instruments. Therefore, these assets and liabilities are not presented in the following table.
Notes (Continued)
| Fair Value Measurements Using | Fair Value Measurements Using | |||||||||||||||||||||||||||||||||||||||
| Quoted | Carrying Amount | Fair Value | Quoted Prices In Active Markets for Identical Assets (Level 1) | Significant Other Observable Inputs (Level 2) | Significant Unobservable Inputs (Level 3) | |||||||||||||||||||||||||||||||||||
| Prices In | (Millions) | |||||||||||||||||||||||||||||||||||||||
| Active | Significant | |||||||||||||||||||||||||||||||||||||||
Assets (liabilities) at June 30, 2013: | ||||||||||||||||||||||||||||||||||||||||
| Markets for | Other | Significant | ||||||||||||||||||||||||||||||||||||||
| Identical | Observable | Unobservable | ||||||||||||||||||||||||||||||||||||||
| Carrying | Fair | Assets | Inputs | Inputs | ||||||||||||||||||||||||||||||||||||
| Amount | Value | (Level 1) | (Level 2) | (Level 3) | ||||||||||||||||||||||||||||||||||||
| (Millions) | ||||||||||||||||||||||||||||||||||||||||
Assets (liabilities) at March 31, 2013: | ||||||||||||||||||||||||||||||||||||||||
Measured on a recurring basis: | ||||||||||||||||||||||||||||||||||||||||
ARO Trust investments | $ | 19 | $ | 19 | $ | 19 | $ | - | $ | - | $ | 28 | $ | 28 | $ | 28 | $ | - | $ | - | ||||||||||||||||||||
Energy derivatives assets designated as hedging instruments | 1 | 1 | - | 1 | - | |||||||||||||||||||||||||||||||||||
Energy derivatives assets not designated as hedging instruments | 5 | 5 | - | - | 5 | 5 | 5 | - | - | 5 | ||||||||||||||||||||||||||||||
Energy derivatives liabilities not designated as hedging instruments | (1 | ) | (1 | ) | - | - | (1 | ) | (2) | (2) | - | - | (2) | |||||||||||||||||||||||||||
Additional disclosures: | ||||||||||||||||||||||||||||||||||||||||
Notes receivable and other | 8 | 8 | - | 8 | - | 9 | 8 | 1 | 7 | - | ||||||||||||||||||||||||||||||
Long-term debt, including current portion | (8,312 | ) | (9,397 | ) | - | (9,397 | ) | - | (8,063) | (8,591) | - | (8,591) | - | |||||||||||||||||||||||||||
Assets (liabilities) at December 31, 2012: | ||||||||||||||||||||||||||||||||||||||||
Measured on a recurring basis: | ||||||||||||||||||||||||||||||||||||||||
ARO Trust investments | $ | 18 | $ | 18 | $ | 18 | $ | - | $ | - | $ | 18 | $ | 18 | $ | 18 | $ | - | $ | - | ||||||||||||||||||||
Energy derivatives assets not designated as hedging instruments | 5 | 5 | - | - | 5 | 5 | 5 | - | - | 5 | ||||||||||||||||||||||||||||||
Energy derivatives liabilities not designated as hedging instruments | (1 | ) | (1 | ) | - | - | (1 | ) | (1) | (1) | - | - | (1) | |||||||||||||||||||||||||||
Additional disclosures: | ||||||||||||||||||||||||||||||||||||||||
Notes receivable and other | 11 | 10 | 2 | 8 | - | 11 | 10 | 2 | 8 | - | ||||||||||||||||||||||||||||||
Long-term debt, including current portion | (8,437 | ) | (9,624 | ) | - | (9,624 | ) | - | (8,437) | (9,624) | - | (9,624) | - | |||||||||||||||||||||||||||
Fair Value Methods
We use the following methods and assumptions in estimating the fair value of our financial instruments:
Assets and liabilities measured at fair value on a recurring basis
ARO Trust investments: Transco deposits a portion of its collected rates, pursuant to its 2008 rate case settlement, into an external trust (ARO Trust) that is specifically designated to fund future asset retirement
Notes (Continued)
obligations. The ARO Trust invests in a portfolio of actively traded mutual funds that are measured at fair value on a recurring basis based on quoted prices in an active market, is classified as available-for-sale, and is reported inregulatory assets, deferred charges, and other in the Consolidated Balance Sheet. Both realized and unrealized gains and losses are ultimately recorded as regulatory assets or liabilities.
Energy derivatives: Energy derivatives include commodity based exchange-traded contracts and over-the-counter (OTC) contracts, which consist of physical forwards, futures, and swaps that are measured at fair value on a recurring basis. The fair value amounts are presented on a gross basis and do not reflect the netting of asset and liability positions permitted under the terms of our master netting arrangements. Further, the amounts do not include cash held on deposit in margin accounts that we have received or remitted to collateralize certain derivative positions. Energy derivatives assets are reported inother current assetsandregulatory assets, deferred charges, and otherin the Consolidated Balance Sheet. Energy derivatives liabilities are reported inother accrued liabilities andregulatory liabilities, deferred income, and otherin the Consolidated Balance Sheet.
Reclassifications of fair value between Level 1, Level 2, and Level 3 of the fair value hierarchy, if applicable, are made at the end of each quarter. No transfers between Level 1 and Level 2 occurred during the threesix months ended March 31,June 30, 2013 or 2012.
Additional fair value disclosures
Notes receivable and other: The disclosed fair value of our notes receivable is primarily determined by an income approach which considers the underlying contract amounts and our assessment of our ability to recover these
Notes (Continued)
amounts. The current portion is reported intrade accounts and notes receivable, and the noncurrent portion is reported inregulatory assets, deferred charges, and other in the Consolidated Balance Sheet.
Long-term debt: The disclosed fair value of our long-term debt is determined by a market approach using broker quoted indicative period-end bond prices. The quoted prices are based on observable transactions in less active markets for our debt or similar instruments.
Guarantees
We are required by our revolving credit agreement to indemnify lenders for certain taxes required to be withheld from payments due to the lenders and for certain tax payments made by the lenders. The maximum potential amount of future payments under these indemnifications is based on the related borrowings and such future payments cannot currently be determined. These indemnifications generally continue indefinitely unless limited by the underlying tax regulations and have no carrying value. We have never been called upon to perform under these indemnifications and have no current expectation of a future claim.
Note 8.9. Contingent Liabilities
Environmental Matters
We are a participant in certain environmental activities in various stages including assessment studies, cleanup operations and remedial processes at certain sites, some of which we currently do not own. We are monitoring these sites in a coordinated effort with other potentially responsible parties, the U.S. Environmental Protection Agency (EPA), and other governmental authorities. We are jointly and severally liable along with unrelated third parties in some of these activities and solely responsible in others. Certain of our subsidiaries have been identified as potentially responsible parties at various Superfund and state waste sites. In addition, these subsidiaries have incurred, or are alleged to have incurred, various other hazardous materials removal or remediation obligations under environmental laws. As of March 31,June 30, 2013, we have accrued liabilities totaling $20 million for these matters, as discussed below. Our accrual reflects the most likely costs of cleanup, which are generally based on completed assessment studies, preliminary results of studies or our experience with other similar cleanup operations. Certain
Notes (Continued)
assessment studies are still in process for which the ultimate outcome may yield significantly different estimates of most likely costs. Any incremental amount in excess of amounts currently accrued cannot be reasonably estimated at this time due to uncertainty about the actual number of contaminated sites ultimately identified, the actual amount and extent of contamination discovered and the final cleanup standards mandated by the EPA and other governmental authorities.
The EPA and various state regulatory agencies routinely promulgate and propose new rules, and issue updated guidance to existing rules. More recent rules and rulemakings include, but are not limited to, rules for reciprocating internal combustion engine maximum achievable control technology, new air quality standards for ground level ozone, and one hour nitrogen dioxide emission limits. We are unable to estimate the costs of asset additions or modifications necessary to comply with these new regulations due to uncertainty created by the various legal challenges to these regulations and the need for further specific regulatory guidance.
Our interstate gas pipelines are involved in remediation activities related to certain facilities and locations for polychlorinated biphenyls, mercury, and other hazardous substances. These activities have involved the EPA and various state environmental authorities, resulting in our identification as a potentially responsible party at various Superfund waste sites. At March 31,June 30, 2013, we have accrued liabilities of $9$11 million for these costs. We expect that these costs will be recoverable through rates.
We also accrue environmental remediation costs for natural gas underground storage facilities, primarily related to soil and groundwater contamination. At March 31,June 30, 2013, we have accrued liabilities totaling $11$9 million for these costs.
Notes (Continued) Geismar Incident As a result of the previously discussed Geismar Incident, there were two fatalities and numerous individuals (including affiliate employees and contractors) reported injuries, which varied from minor to serious. We are cooperating with the Occupational Safety and Health Administration, the Chemical Safety Board, and the EPA to conduct investigations to determine the cause of the incident. Also, on June 28, 2013, the Louisiana Department of Environmental Quality issued a Consolidated Compliance Order & Notice of Potential Penalty to Williams Olefins, L.L.C. that consolidates claims of unpermitted emissions and other deviations under the Clean Air Act that the parties had been negotiating since 2010 and alleged unpermitted emissions arising from the Geismar Incident. Any potential fines and penalties from these agencies would not be covered by our insurance policy. Additionally, multiple lawsuits, including class actions for alleged offsite impacts, property damage, and personal injury, have been filed against various of our subsidiaries. Due to the recent nature of the incident, the preliminary and ongoing investigation into its cause, and the limited information available associated with the filed lawsuits, which do not specify any amounts for claimed damages, we cannot reasonably estimate a range of potential loss related to these lawsuits at this time. Rate Matters
On August 31, 2012, Transco submitted to the Federal Energy Regulatory Commission (FERC)FERC a general rate filing principally designed to recover increased costs and to comply with the terms of the settlement in its prior rate proceeding. The new rates became effective March 1, 2013, subject to refund and the outcome of a hearing. We have reached an agreement in principle with the participants that would resolve all issues in this proceeding without the need for a hearing. Final resolution of the rate case is subject to the filing of a formal stipulation and agreement and subsequent approval by the FERC. We have provided a reserve for rate refunds which we believe is adequate for any refunds that may be required.
On August 31, 2006, Transco submitted to the FERC a general rate filing principally designed to recover increased costs. The rates became effective March 1, 2007, subject to refund and the outcome of a hearing. All issues in this proceeding except one have been resolved by settlement.
The one issue reserved for litigation or further settlement relates to Transco’s proposal to change the design of the rates for service under one of its storage rate schedules, which was implemented subject to refund on March 1, 2007. A hearing on that issue was held before a FERC Administrative Law Judge (ALJ) in July 2008. In November 2008, the ALJ issued an initial decision in which he determined that Transco’s proposed incremental rate design is unjust and unreasonable. On January 21, 2010, the FERC reversed the ALJ’s initial decision, and approved our proposed incremental rate design. Certain parties sought rehearing of the FERC’s order and, on April 2, 2012, the FERC denied the rehearing request. On June 1, 2012, one party filed an appeal in the U.S. Court of Appeals for the D.C. Circuit challenging the FERC’s orders approving our rate design proposal.
Other
In addition to the foregoing, various other proceedings are pending against us which are incidental to our operations.
Summary
We estimate that for all matters for which we are able to reasonably estimate a range of loss, including those noted above and others that are not individually significant, our aggregate reasonably possible losses beyond amounts accrued for all of our contingent liabilities are immaterial to our expected future annual results of
Notes (Continued)
operations, liquidity, and financial position. These calculations have been made without consideration of any potential recovery from third parties. We disclose all significant matters for which we are unable to reasonably
Notes (Continued)
estimate a range of possible loss.
Note 9.10. Segment disclosuresDisclosures
Our reportable segments are Northeast G&P, Atlantic-Gulf, West, and NGL & Petchem Services. (See Note 1.)
Performance Measurement
We currently evaluate segment operating performance based onsegment profit (loss)from operations, which includessegment revenuesfrom external and internal customers, segment costs and expenses,and equity earnings (losses).General corporate expenses representselling, general, and administrative expenses that are not allocated to our segments. Intersegment revenues primarily represent the sale of NGLs from our natural gas processing plants to our marketing business and are generally accounted for at current market prices as if the sales were to unaffiliated third parties.
The following table reflects the reconciliation ofsegment revenues andsegment profit (loss)torevenues andoperating incomeas reported in the Consolidated Statement of Comprehensive Income.
| NGL & | Northeast G&P | Atlantic- Gulf | West | NGL & Petchem Services | Eliminations | Total | ||||||||||||||||||||||||||||||||||||||||||
| Northeast | Atlantic- | Petchem | (Millions) | |||||||||||||||||||||||||||||||||||||||||||||
| G&P | Gulf | West | Services | Eliminations | Total | |||||||||||||||||||||||||||||||||||||||||||
| (Millions) | ||||||||||||||||||||||||||||||||||||||||||||||||
Three months ended March 31, 2013 | ||||||||||||||||||||||||||||||||||||||||||||||||
Three months ended June 30, 2013 | Three months ended June 30, 2013 |
| ||||||||||||||||||||||||||||||||||||||||||||||
Segment revenues: | ||||||||||||||||||||||||||||||||||||||||||||||||
Service revenues | ||||||||||||||||||||||||||||||||||||||||||||||||
External | $ | 63 | $ | 354 | $ | 258 | $ | 26 | $ | - | $ | 701 | $ | 78 | $ | 349 | $ | 260 | $ | 28 | $ | - | $ | 715 | ||||||||||||||||||||||||
Internal | - | 4 | - | - | (4 | ) | - | - | 4 | - | - | (4) | - | |||||||||||||||||||||||||||||||||||
|
|
|
|
|
|
|
|
|
|
|
| |||||||||||||||||||||||||||||||||||||
Total service revenues | 63 | 358 | 258 | 26 | (4 | ) | 701 | 78 | 353 | 260 | 28 | (4) | 715 | |||||||||||||||||||||||||||||||||||
Product sales | ||||||||||||||||||||||||||||||||||||||||||||||||
External | 20 | 205 | 26 | 804 | - | 1,055 | 35 | 220 | 11 | 746 | - | 1,012 | ||||||||||||||||||||||||||||||||||||
Internal | - | 26 | 173 | 78 | (277 | ) | - | - | 29 | 180 | 83 | (292) | - | |||||||||||||||||||||||||||||||||||
|
|
|
|
|
|
|
|
|
|
|
| |||||||||||||||||||||||||||||||||||||
Total product sales | 20 | 231 | 199 | 882 | (277 | ) | 1,055 | 35 | 249 | 191 | 829 | (292) | 1,012 | |||||||||||||||||||||||||||||||||||
|
|
|
|
|
|
|
|
|
|
|
| |||||||||||||||||||||||||||||||||||||
Total revenues | $ | 83 | $ | 589 | $ | 457 | $ | 908 | $ | (281 | ) | $ | 1,756 | $ | 113 | $ | 602 | $ | 451 | $ | 857 | $ | (296) | $ | 1,727 | |||||||||||||||||||||||
|
|
|
|
|
|
|
|
|
|
|
| |||||||||||||||||||||||||||||||||||||
Segment profit (loss) | $ | (9 | ) | $ | 159 | $ | 186 | $ | 120 | $ | - | $ | 456 | $ | 12 | $ | 152 | $ | 162 | $ | 77 | $ | 403 | |||||||||||||||||||||||||
Less equity earnings (losses) | (3 | ) | 16 | - | 5 | - | 18 | 7 | 20 | - | 8 | 35 | ||||||||||||||||||||||||||||||||||||
|
|
|
|
|
|
|
|
|
|
| ||||||||||||||||||||||||||||||||||||||
Segment operating income (loss) | $ | (6 | ) | $ | 143 | $ | 186 | $ | 115 | $ | - | 438 | $ | 5 | $ | 132 | $ | 162 | $ | 69 | 368 | |||||||||||||||||||||||||||
|
|
|
|
|
|
|
|
| ||||||||||||||||||||||||||||||||||||||||
General corporate expenses | (42 | ) | (44) | |||||||||||||||||||||||||||||||||||||||||||||
|
| |||||||||||||||||||||||||||||||||||||||||||||||
Operating income | $ | 396 | $ | 324 | ||||||||||||||||||||||||||||||||||||||||||||
|
| |||||||||||||||||||||||||||||||||||||||||||||||
Three months ended March 31, 2012 | ||||||||||||||||||||||||||||||||||||||||||||||||
Three months ended June 30, 2012 | Three months ended June 30, 2012 |
| ||||||||||||||||||||||||||||||||||||||||||||||
Segment revenues: | ||||||||||||||||||||||||||||||||||||||||||||||||
Service revenues | ||||||||||||||||||||||||||||||||||||||||||||||||
External | $ | 24 | $ | 354 | $ | 271 | $ | 24 | $ | - | $ | 673 | $ | 37 | $ | 338 | $ | 265 | $ | 24 | $ | - | $ | 664 | ||||||||||||||||||||||||
Internal | - | - | 1 | - | (1 | ) | - | - | 1 | - | - | (1) | - | |||||||||||||||||||||||||||||||||||
|
|
|
|
|
|
|
|
|
|
|
| |||||||||||||||||||||||||||||||||||||
Total service revenues | 24 | 354 | 272 | 24 | (1 | ) | 673 | 37 | 339 | 265 | 24 | (1) | 664 | |||||||||||||||||||||||||||||||||||
Product sales | ||||||||||||||||||||||||||||||||||||||||||||||||
External | - | 154 | 8 | 1,133 | - | 1,295 | - | 187 | 13 | 953 | - | 1,153 | ||||||||||||||||||||||||||||||||||||
Internal | - | 136 | 343 | 28 | (507 | ) | - | - | 97 | 258 | 57 | (412) | - | |||||||||||||||||||||||||||||||||||
|
|
|
|
|
|
|
|
|
|
|
| |||||||||||||||||||||||||||||||||||||
Total product sales | - | 290 | 351 | 1,161 | (507 | ) | 1,295 | - | 284 | 271 | 1,010 | (412) | 1,153 | |||||||||||||||||||||||||||||||||||
|
|
|
|
|
|
|
|
|
|
|
| |||||||||||||||||||||||||||||||||||||
Total revenues | $ | 24 | $ | 644 | $ | 623 | $ | 1,185 | $ | (508 | ) | $ | 1,968 | $ | 37 | $ | 623 | $ | 536 | $ | 1,034 | $ | (413) | $ | 1,817 | |||||||||||||||||||||||
|
|
|
|
|
|
|
|
|
|
|
| |||||||||||||||||||||||||||||||||||||
Segment profit (loss) | $ | 4 | $ | 165 | $ | 311 | $ | 71 | $ | - | $ | 551 | $ | (20) | $ | 127 | $ | 239 | $ | 45 | $ | 391 | ||||||||||||||||||||||||||
Less equity earnings (losses) | (3 | ) | 24 | - | 9 | - | 30 | (6) | 20 | - | 13 | 27 | ||||||||||||||||||||||||||||||||||||
|
|
|
|
|
|
|
|
|
|
| ||||||||||||||||||||||||||||||||||||||
Segment operating income (loss) | $ | 7 | $ | 141 | $ | 311 | $ | 62 | $ | - | 521 | $ | (14) | $ | 107 | $ | 239 | $ | 32 | 364 | ||||||||||||||||||||||||||||
|
|
|
|
|
|
|
|
| ||||||||||||||||||||||||||||||||||||||||
General corporate expenses | (38 | ) | (49) | |||||||||||||||||||||||||||||||||||||||||||||
|
| |||||||||||||||||||||||||||||||||||||||||||||||
Operating income | $ | 483 | $ | 315 | ||||||||||||||||||||||||||||||||||||||||||||
|
| |||||||||||||||||||||||||||||||||||||||||||||||
Notes (Continued)
Six months ended June 30, 2013 | ||||||||||||||||||||||||
Segment revenues: | ||||||||||||||||||||||||
Service revenues | ||||||||||||||||||||||||
External | $ | 141 | $ | 703 | $ | 518 | $ | 54 | $ | - | $ | 1,416 | ||||||||||||
Internal | - | 8 | - | - | (8) | - | ||||||||||||||||||
|
|
|
|
|
|
|
|
|
|
|
| |||||||||||||
Total service revenues | 141 | 711 | 518 | 54 | (8) | 1,416 | ||||||||||||||||||
Product sales | ||||||||||||||||||||||||
External | 55 | 425 | 37 | 1,550 | - | 2,067 | ||||||||||||||||||
Internal | - | 55 | 353 | 161 | (569) | - | ||||||||||||||||||
|
|
|
|
|
|
|
|
|
|
|
| |||||||||||||
Total product sales | 55 | 480 | 390 | 1,711 | (569) | 2,067 | ||||||||||||||||||
|
|
|
|
|
|
|
|
|
|
|
| |||||||||||||
Total revenues | $ | 196 | $ | 1,191 | $ | 908 | $ | 1,765 | $ | (577) | $ | 3,483 | ||||||||||||
|
|
|
|
|
|
|
|
|
|
|
| |||||||||||||
Segment profit (loss) | $ | 3 | $ | 311 | $ | 348 | $ | 197 | $ | 859 | ||||||||||||||
Less equity earnings (losses) | 4 | 36 | - | 13 | 53 | |||||||||||||||||||
|
|
|
|
|
|
|
|
|
| |||||||||||||||
Segment operating income (loss) | $ | (1) | $ | 275 | $ | 348 | $ | 184 | 806 | |||||||||||||||
|
|
|
|
|
|
|
| |||||||||||||||||
General corporate expenses | (86) | |||||||||||||||||||||||
|
| |||||||||||||||||||||||
Operating income | $ | 720 | ||||||||||||||||||||||
|
| |||||||||||||||||||||||
Six months ended June 30, 2012 | ||||||||||||||||||||||||
Segment revenues: | ||||||||||||||||||||||||
Service revenues | ||||||||||||||||||||||||
External | $ | 61 | $ | 692 | $ | 536 | $ | 48 | $ | - | $ | 1,337 | ||||||||||||
Internal | - | 1 | 1 | - | (2) | - | ||||||||||||||||||
|
|
|
|
|
|
|
|
|
|
|
| |||||||||||||
Total service revenues | 61 | 693 | 537 | 48 | (2) | 1,337 | ||||||||||||||||||
Product sales | ||||||||||||||||||||||||
External | - | 341 | 21 | 2,086 | - | 2,448 | ||||||||||||||||||
Internal | - | 233 | 601 | 85 | (919) | - | ||||||||||||||||||
|
|
|
|
|
|
|
|
|
|
|
| |||||||||||||
Total product sales | - | 574 | 622 | 2,171 | (919) | 2,448 | ||||||||||||||||||
|
|
|
|
|
|
|
|
|
|
|
| |||||||||||||
Total revenues | $ | 61 | $ | 1,267 | $ | 1,159 | $ | 2,219 | $ | (921) | $ | 3,785 | ||||||||||||
|
|
|
|
|
|
|
|
|
|
|
| |||||||||||||
Segment profit (loss) | $ | (16) | $ | 292 | $ | 550 | $ | 116 | $ | 942 | ||||||||||||||
Less equity earnings (losses) | (9) | 44 | - | 22 | 57 | |||||||||||||||||||
|
|
|
|
|
|
|
|
|
| |||||||||||||||
Segment operating income (loss) | $ | (7) | $ | 248 | $ | 550 | $ | 94 | 885 | |||||||||||||||
|
|
|
|
|
|
|
| |||||||||||||||||
General corporate expenses | (87) | |||||||||||||||||||||||
|
| |||||||||||||||||||||||
Operating income | $ | 798 | ||||||||||||||||||||||
|
| |||||||||||||||||||||||
Notes (Continued)
The following table reflectstotal assets by reportingreportable segment.
| Total Assets | ||||||||||||||||
| Total Assets | June 30, 2013 | December 31, 2012 | ||||||||||||||
| March 31, 2013 | December 31, 2012 | (Millions) | ||||||||||||||
| (Millions) | ||||||||||||||||
Northeast G&P | $ | 5,126 | $ | 4,745 | $ | 5,426 | $ | 4,745 | ||||||||
Atlantic-Gulf | 8,915 | 8,734 | 9,284 | 8,734 | ||||||||||||
West | 4,662 | 4,688 | 4,660 | 4,688 | ||||||||||||
NGL & Petchem Services | 1,635 | 1,500 | 1,692 | 1,500 | ||||||||||||
Other corporate assets | 382 | 409 | 384 | 409 | ||||||||||||
Eliminations (1) | (428 | ) | (367 | ) | (556) | (367) | ||||||||||
|
|
|
| |||||||||||||
Total | $ | 20,292 | $ | 19,709 | $ | 20,890 | $ | 19,709 | ||||||||
|
|
|
| |||||||||||||
| (1) | Eliminations primarily relate to the intercompany accounts receivable generated by our cash management program. |
Management’s Discussion and Analysis of
Financial Condition and Results of Operations
General
We are an energy infrastructure company focused on connecting North America’s significant hydrocarbon resource plays to growing markets for natural gas, natural gas liquids (NGLs), and olefins through our gas pipeline and midstream businesses.
Our gas pipeline strategy is to create value by maximizing the utilization of our pipeline capacity by providing high quality, low cost transportation of natural gas to large and growing markets. Our gas pipeline businesses’ interstate transmission and storage activities are subject to regulation by the Federal Energy Regulatory Commission (FERC) and as such, our rates and charges for the transportation of natural gas in interstate commerce, and the extension, expansion or abandonment of jurisdictional facilities and accounting, among other things, are subject to regulation. The rates are established through the FERC’s ratemaking process. Changes in commodity prices and volumes transported have little near-term impact on revenues because the majority of cost of service is recovered through firm capacity reservation charges in transportation rates.
The ongoing strategy of our midstream business is to safely and reliably operate large-scale midstream infrastructure where our assets can be fully utilized and drive low per-unit costs. We focus on consistently attracting new business by providing highly reliable service to our customers. These services include natural gas gathering, processing and treating, NGL fractionation and transportation, crude oil production handling and transportation, olefin production, marketing services for NGL, oil and natural gas, as well as storage facilities.
Following Williams’ spin-off of WPX Energy, Inc. (WPX) at the end of 2011 and in consideration of the growth plans of the ongoing business, Williams initiated an organizational restructuring evaluation to better align resources to support an ongoing business strategy to provide large-scale energy infrastructure designed to maximize the opportunities created by the vast supply of natural gas, natural gas products, and crude oil that exists in North America. As a result of this review, a new structure was implemented effective January 1, 2013, that generally organizes our businesses into geographically based operating areas. Beginning in the first quarter of 2013, we have changed our segment reporting structure to align with the new operating areas resulting from the organizational restructuring, as this is consistent with the manner in which our Chief Operating Decision Maker evaluates performance and makes resource allocation decisions. Our reportable segments are Northeast G&P, Atlantic-Gulf, West, and NGL & Petchem Services.
Northeast G&P is comprised of our midstream gathering and processing businesses in the Marcellus and Utica shale regions, as well as a 51 percent equity investment in Laurel Mountain Midstream, LLC (Laurel Mountain) and a 47.5 percent equity investment in Caiman Energy II, LLC (Caiman).
Atlantic-Gulf is comprised of our interstate natural gas pipeline, Transcontinental Gas Pipe Line Company, LLC (Transco), and significant natural gas gathering and processing and crude production handling and transportation in the Gulf Coast region, as well as a 50 percent equity investment in Gulfstream Natural Gas System L.L.C. (Gulfstream), a 60 percent equity investment in Discovery Producer Services LLC (Discovery), and a 5141 percent consolidated interest in Constitution Pipeline Company, LLC (Constitution).
West is comprised of our gathering, processing and treating operations in New Mexico, Colorado, and Wyoming and our interstate natural gas pipeline, Northwest Pipeline GPLLC (Northwest Pipeline).
NGL & Petchem Services is comprised of our NGL and natural gas marketing business, an NGL fractionator and storage facilities near Conway, Kansas, a 50 percent equity investment in Overland Pass Pipeline Company LLC (OPPL), and an interest in an olefins production facility in Geismar, Louisiana, along with a refinery grade propylene splitter and pipelines in the Gulf Coast region.
Management’s Discussion and Analysis (Continued) |
Williams currently holds an approximate 68 percent interest in us, comprised of an approximate 66 percent limited partner interest and all of our 2 percent general partner interest.interest and incentive distribution rights.
The following discussion and analysis of our results of operations and financial condition and liquidity should be read in conjunction with the consolidated financial statements and notes thereto of thisForm 10-Q and in Exhibit 99.1 of our Current Report on Form 8-K dated May 13, 2013.
Distributions
In AprilJuly 2013, our general partner’s Board of Directors approved a quarterly distribution to unitholders of $0.8475$0.8625 per unit, an increase of approximately 2 percent over the prior quarter and 9 percent over the same period in the prior year. We expect to increase total limited partner cash distributions by approximately 8 percent to 9 percent in 2013 and 6 percent to 8 percent in 2014 and 2015.
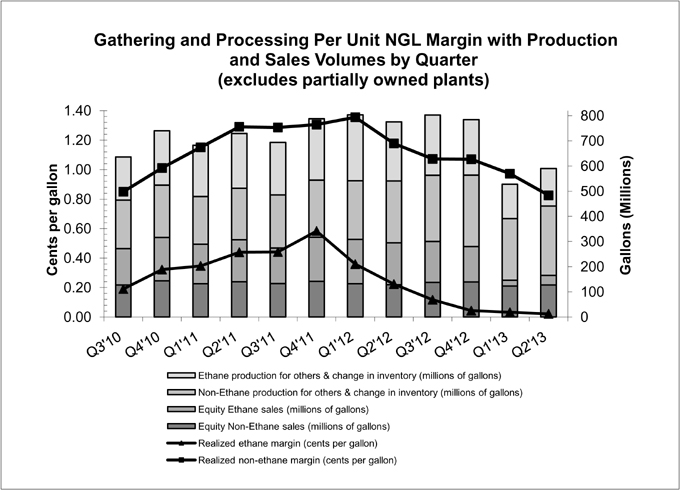
Overview of ThreeSix Months Ended March 31,June 30, 2013
Our results for the first quartersix months of 2013, as compared to the same period of the prior year, have declinedwere unfavorable primarily due to lower NGL margins. This decline wasmargins driven by lower NGL volumes resulting from reduced ethane recoveries due to unfavorable ethane economics. Lowerand decreases in average NGL per-unit sales prices, along with higher operating costs associated with ongoing growth in our Northeast G&P operations. Partially offsetting these unfavorable changes were an unfavorable changeincrease in natural gas prices, also contributed to the decline in NGL margins. Improved olefins production margins partially offset this decline, primarily resulting from lower ethane feedstock pricesfee revenues and higher ethylene sales prices. Increased fee-based revenues were largely offset by increased depreciation and other operating costs.olefins margins. See additional discussion in Results of Operations.
Abundant and low-cost natural gas reserves in the United States continue to drive strong demand for midstream and pipeline infrastructure. We believe that we have successfully positioned our energy infrastructure businesses for significant future growth,growth.
Geismar Incident
On June 13, 2013, an explosion and fire occurred at our Geismar olefins plant located south of Baton Rouge, in a remote industrial complex, which resulted in the tragic deaths of two affiliate employees and injuries of additional affiliate employees and contractors. The fire was extinguished on the day of the incident. The incident (Geismar Incident) rendered the facility temporarily inoperable and resulted in significant human, financial, and operational effects. This facility is part of our NGL & Petchem Services segment.
We have substantial insurance coverage for repair and replacement costs, lost production and additional expenses related to the incident as highlightedfollows:
Property damage and business interruption coverage with a combined per-occurrence limit of $500 million and retentions (deductibles) of $10 million per occurrence for property damage and a 60-day waiting period per occurrence for business interruption;
General liability coverage with per-occurrence and aggregate annual limits of $610 million and retentions (deductibles) of $2 million per occurrence;
Workers’ compensation coverage with statutory limits and retentions (deductibles) of $1 million total per occurrence.
We are in the early stages of determining the full extent of property damage and developing claims information for business interruption coverage. These early weeks of work have been focused on conducting the causal investigations with the Occupational Safety and Health Administration and the Chemical Safety Board. Through June 30, 2013, we have expensed $6 million of insurance deductibles inoperating and maintenance expenses in the
Management’s Discussion and Analysis (Continued)
Consolidated Statement of Comprehensive Income, based on our initial evaluation. Recoveries under our business interruption policy will be recognized upon resolution of any contingencies with the insurer associated with the claim. Such recoveries, when recognized, will be recorded as a gain toother (income) expense – net withincosts and expenses in our Consolidated Statement of Comprehensive Income.
In all scenarios examined, the repair of the Geismar plant will take longer than the expansion project. As a result, we currently forecast the repaired Geismar facility, including the expansion project, to return to operation in April 2014. We expect our insurance coverage will significantly mitigate our financial loss. We currently estimate $384 million of cash recoveries from insurers related to business interruption losses. Our preliminary damage assessment and preliminary repair plan indicates an estimated cost of $102 million to repair the plant. We will be impacted by certain uninsured losses, including amounts associated with the following accomplishments during 2013:60-day waiting period for business interruption, as well as other deductibles. Our assumptions and estimates, including the timing for the expanded plant return to operation, repair cost estimates, and insurance proceeds associated with our property damage and business interruption coverage are subject to various risks and uncertainties that could cause the actual results to be materially different.
Northeast G&P
Three Rivers Midstream
In April 2013, we announced an agreement to launch a new midstream joint project to provide gas gathering and gas processing services for production located in Northwestnorthwest Pennsylvania. The project will invest in both wet-gas handling infrastructure and dry-gas infrastructure serving the Marcellus and Utica Shale wells in the area. We will initially own substantially all of the new project, Three Rivers Midstream, and operate the assets. Our partner has the right to invest capital and increase its ownership to a maximum of 50 percent by July 2015. Our portionThe current estimate of initial capital expenditures on the Three Rivers Midstream plant,total cost of the project is expected to be approximately $150 million. This does not include the cost of the gathering system, which will be determined in the future based upon the producers’ needs. Subsequent capital investment is expected as the business and scale increases.
Three Rivers Midstream has signed a long-term fee-based dedicated gathering and processing agreement for our partner’s production in the area, including approximately 275,000 dedicated acres. Three Rivers Midstream plans to construct a 200 million cubic feet per day (MMcf/d) cryogenic gas processing plant and related facilities at a location to be determined. The initial plant is expected to be placed into service by second quarter 2015. The system is expected to be connected to two major proposed developments in Pennsylvania – our partner’s proposed ethylene cracker (feasibility study is in progress) in Beaver County and the proposed WilliamsWilliams’ joint project to develop the Bluegrass Pipeline system that would deliver Marcellus and Utica liquids to the Gulf Coast and export markets.
Marcellus Shale
In the second quarter of 2013, we completed an expansion to our natural gas gathering system, processing facilities, and fractionator in our Ohio Valley Midstream business of the Marcellus Shale including a third turbo-expander at our Fort Beeler facility, which added 200 MMcf/d of processing capacity. By the end of 2013, we expect to add fractionation capacity at our Moundsville fractionators bringing the NGL handling capacity to approximately 43 thousand barrels of oil per day (Mbbls/d). In the first quarter of 2014, we expect our first turbo-expander at our Oak Grove facility to add 200 MMcf/d of processing capacity. We also expect to finalize the construction of our first deethanizer with a capacity of 40 Mbbls/d and the associated 50-mile ethane line to Houston, Pennsylvania.
Atlantic-Gulf
Mid-South
The Mid-South expansion project involves an expansion of Transco’s mainline from Station 85 in Choctaw County, Alabama to markets as far downstream as North Carolina. In August 2011, we received approval from the FERC for the project. We placed the first phase of the project into service in the third quarter of 2012, which increased capacity by 95 thousand dekatherms per day (Mdth/d). The second phase was placed into service in the second quarter of 2013, which increased capacity by an additional 130 Mdth/d.
Management’s Discussion and Analysis (Continued)
Gulfstar FPSTMPartner
Effective April 1, 2013, we sold a 49 percent interest in our first Gulfstar FPSTMprojectOne LLC (Gulfstar) to a third party for $187 million, representing their proportionate share of estimated capital expenditures to date.date for the construction of Gulfstar FPSTM, which is oura proprietary floating production system and has been under construction since late 2011. It is supported by multiple
Management’s Discussion and Analysis (Continued)
agreements with two major producers to provide production handling, export pipeline, oil and gas gathering and gas processing services for the Tubular Bells field development located in the eastern deepwater Gulf of Mexico. The Gulfstar FPSTM will tie into our wholly owned oil and gas gathering and gas processing systems in the eastern Gulf of Mexico. Gulfstar FPSTM is expected to have an initial capacity of 60 thousand barrels of oil per day (Mbbls/d),Mbbls/d, up to 200 MMcf/d of natural gas and the capability to provide seawater injection services. We expect Gulfstar FPS™ to be capable of serving as a central host facility for other deepwater prospects in the area. Construction is underway and theThe project is expected to be in service in 2014.mid-2014.
Mid-Atlantic Connector
The Mid-Atlantic Connector Project involves an expansion of ourTransco’s mainline from an existing interconnection with East Tennessee Natural Gas in North Carolina to markets as far downstream as Maryland. In July 2011, we received approval from the FERC for the project. The capital cost of the project is estimated to be approximately $60 million. We placed the project into service in the first quarter of 2013, and it increased capacity by 142 thousand dekatherms per day (Mdth/d).Mdth/d.
NGL & Petchem Services
Overland Pass Pipeline
Through our equity investment in OPPL, we completed the construction of a pipeline connection in the second quarter of 2013, which increased the pipeline’s capacity to 255 Mbbls/d. In addition, new volumes coming from the Bakken Shale in the Williston basin began to flow in April 2013.
Volume Impacts in 2013
Due to unfavorable ethane economics, we reduced our recoveries of ethane in our onshore plants during most of the first quartersix months of 2013, which resulted in 5329 percent lower NGL production volumes and 48 percent lower NGL equity sales volumes and 34 percent lower NGL production volumes in the first quartersix months of 2013 compared to the same period of 2012. In addition, to the impact from reduced ethane recoveries, lower equity ethanenon-ethane production and sales volumes were impacted byincreased from first quarter 2013 levels with the third turbo-expander at Fort Beeler in the Ohio Valley Midstream area coming on line in early May 2013 and after severe winter weather conditions in the West whichfirst quarter of 2013 prevented producers from delivering gas and a change in a customer’s contract from percent-of-liquids to fee-based processing, partially offset by favorable impacts from higher concentrations of liquid-rich gas processed from deliveries on our Perdido pipeline.the West.
Volatile Commodity Prices
NGL margins were approximately 2148 percent lower in the first quartersix months of 2013 compared to the fourth quartersame period of 2012 driven by reduced ethane recoveries, as previously mentioned coupled with a continued decline inlower NGL prices and higher natural gas prices. However, our average per-unit composite NGL margin in the first quartersix months of 2013 has increased slightly compared to the fourth quartersame period of 2012 as the relative mix of NGL products produced has shifted to a greater proportion of higher-margin non-ethane products. Key factors in the NGL market weakness have been high propane inventories caused by the extremely warm winter and the effect of the propane oversupply on ethane inventories and pricing.
NGL margins are defined as NGL revenues less any applicable British thermal unit (Btu) replacement cost, plant fuel, and third-party transportation and fractionation. Per-unit NGL margins are calculated based on sales of our own
Management’s Discussion and Analysis (Continued)
equity volumes at the processing plants. Our equity volumes include NGLs where we own the rights to the value from NGLs recovered at our plants under both “keep-whole” processing agreements, where we have the obligation to replace the lost heating value with natural gas, and “percent-of-liquids” agreements whereby we receive a portion of the extracted liquids with no obligation to replace the lost heating value.
Management’s Discussion and Analysis (Continued)
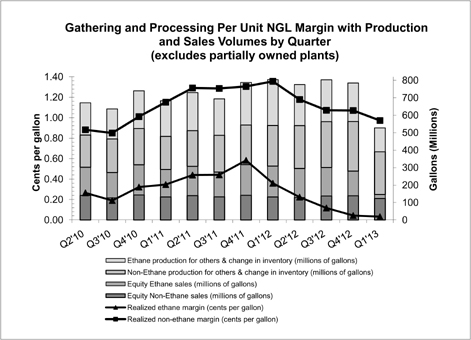
Company Outlook
Our strategy is to provide large-scale energy infrastructure designed to maximize the opportunities created by the vast supply of natural gas, natural gas products, and crude oil that exists in North America. We seek to accomplish this through further developing our scale positions in current key markets and basins and entering new growth markets and basins where we can become the large-scale service provider. We will maintain a strong commitment to operational excellence and customer satisfaction. We believe that accomplishing these goals will position us to deliver an attractive return to our unitholders.
Fee-based businesses are a significant component of our portfolio. As we continue to transition to an overall business mix that is increasingly fee-based, the influence of commodity price fluctuations on our operating results and cash flows is expected to become somewhat less significant.
As previously noted, we expect the financial impact of the Geismar Incident will be significantly mitigated by our insurance policies. However, the timing of recognizing recoveries under our business interruption policy, as well as the effect of the 60-day waiting period, will likely cause a significant negative impact to our 2013 results.
Management’s Discussion and Analysis (Continued)
In light of all of the above, our business plan for 2013 continues to reflect both significant capital investment and growth in distributions. Our planned capital investments for 2013 total approximately $3.7 billion which we expect to fund a significant portion through debt and equity issuances. We also expect an 8 percent to 9 percent growth in total 2013 distributions. We expect to maintain an attractive cost of capital and reliable access to capital markets, both of which will allow us to pursue development projects and acquisitions.
Potential risks and obstacles that could impact the execution of our plan include:
General economic, financial markets, or industry downturn;
Management’s Discussion and Analysis (Continued)
Availability of capital;
Lower than expected levels of cash flow from operations;
Counterparty credit and performance risk;
Decreased volumes from third parties served by our midstream business;
Unexpected significant increases in capital expenditures or delays in capital project execution;
Lower than anticipated energy commodity prices and margins;
Changes in the political and regulatory environments;
Physical damages to facilities, especially damage to offshore facilities by named windstorms.
We continue to address these risks through maintaining a strong financial position and ample liquidity, as well as through commodity hedging strategies and managing a diversified portfolio of energy infrastructure assets.
The following factors, among others, could impact our businesses in 2013.
Commodity price changes
We expect a decline in ethane prices to a level thatremain at current levels, which will result in reducedcontinued ethane recoveriesrejection across much of our systems. We further expect that the combination of lower propaneNGL prices and higher natural gas prices will result in overall total NGL margins being lower than the previous year. NGL price changes have historically tracked somewhat with changes in the price of crude oil, although NGL, crude, and natural gas prices are highly volatile, difficult to predict, and are often not highly correlated. NGL margins are highly dependent upon continued demand within the global economy. However, NGL products are currently the preferred feedstock for ethylene and propylene production, which has been shifting away from the more expensive crude-based feedstocks.
While per-unit ethylene margins are volatile and highly dependent upon continued demand within the global economy, we believe that our average per-unit ethylene margins in 2013 will exceed 2012 levels, benefiting from continued higher ethylene prices and lower ethane and propane feedstock costs. Bolstered by abundant long-term domestic natural gas supplies, we expect to benefit from these dynamics in the broader global petrochemical markets because of our NGL-based olefins production.
Gathering, processing, and NGL sales volumes
The growth of natural gas production supporting our gathering and processing volumes are impacted by producer drilling activities, which are influenced by commodity prices including natural gas, ethane and propane prices. In addition, the natural decline rates in producing areas impact the amount of gas available for gathering and processing.
We anticipate significant growth compared to the prior year in our natural gas gathering volumes in our Northeast G&P segment as our infrastructure grows to support drilling activities in the region. Based on less favorable producer economics in the West segment, we expect a decrease in production and thus a lower supply of natural gas available to gather and process in 2013.
Management’s Discussion and Analysis (Continued)
We anticipate equity NGL volumes in 2013 to be lower than 2012 primarily due to periods when we expect it will not be economical to recover ethane. In addition, our equity NGL volumes will also be impacted by a change in a customer’s contract in the West segment from percent-of-liquids to fee-based processing, with a portion of the fee representing a share of the associated NGL margins.
Management’s Discussion and Analysis (Continued)
In our Atlantic-Gulf segment, we expect lower production handling and crude transportation volumes compared to 2012, as production flowing through our Devils Tower facility declines.
We anticipate higher general and administrative, operating, and depreciation expense related to our growing operations in our Northeast G&P segment.
Olefin production volumes
We expect lower ethylene volumes in 2013 as compared to 2012 primarily due to major maintenance planned for 2013. With the completion of our Geismar expansion in the latter part of 2013, as discussed below, we expect growth in production volumes in the fourth quarter of 2013.
Filing of rate cases
On August 31, 2012, Transco filed a general rate case with the FERC principally designed to recover increased costs and to comply with the terms of the settlement in its prior proceeding. The new rates became effective March 1, 2013, subject to refund and the outcome of a hearing. We expect that our new rates, although still subject to refund until the rate case is resolved, will contribute to a modest increase in revenue in 2013.
During the first quarter of 2012, Northwest Pipeline filed a Stipulation and Settlement Agreement with the FERC for an increase in their rates. Northwest Pipeline received FERC approval during the second quarter of 2012. The new rates, which as filed are 7.4 percent higher than the formerly applicable rates, became effective January 1, 2013.
Expansion Projects
We expect to invest total capital in 2013 among our business segments as follows:
| ||||
| ||||
| ||||
| ||||
| ||||
Our ongoing major expansion projects include the following:
Northeast G&P
Expansion of our gathering infrastructure including compression and gathering pipelines in the Susquehanna Supply Hub in northeastern Pennsylvania as production in the Marcellus increases. The Susquehanna Supply Hub is expected to reach a natural gas take away capacity of 3 billion cubic feet per day (Bcf/d) by 2015, including capacity contributions from the Constitution Pipeline.
Expansions currently under construction to our natural gas gathering system, processing facilities and fractionator in our Ohio Valley Midstream business of the Marcellus Shale including a third turbo-expander at our Fort Beeler facility which is expected to add 200 MMcf/d of processing capacity in the second quarter of 2013. By the end of 2013, we expect our first turbo-expander at our Oak Grove facility to add 200 MMcf/d of processing capacity and additional fractionation capacity at our Moundsville fractionators bringing the NGL handling capacity to approximately 43 Mbbls/d.
Management’s Discussion and Analysis (Continued)
Expansions to Laurel Mountain’s gathering system infrastructure to increase the capacity to 830 MMcf/d by the end of 2015 through capital to be invested within this equity investment, also in the Marcellus Shale region.
Construction of the Blue Racer Midstream joint project, an expansion to gathering and processing and the associated liquids infrastructure serving oil and gas producers in the Utica shale, primarily in Ohio and Northwest Pennsylvania through capital to be invested within our Caiman Energy II equity investment.
Atlantic-Gulf
|
Our equity investee which we operate, Discovery, plans to construct, own, and operate a new 215-mile, 20-inch deepwater lateral pipeline from a third-party floating production facility located in the Keathley Canyon production area in the central deepwater Gulf of Mexico. Discovery has signed long-term agreements with anchor customers for natural gas gathering and processing services for production from the Keathley Canyon and Green Canyon areas. The Keathley Canyon Connector™ lateral will originate from a third-party floating production facility in the southeast portion of the Keathley Canyon area and will connect to Discovery’s existing 30-inch offshore natural gas transmission system. The gas will be processed at Discovery’s Larose Plant and the NGLs will be further fractionated at Discovery’s Paradis Fractionator. The lateral pipeline is estimated to have the capacity to flow more than 400 MMcf/d and will accommodate the tie-in of other deepwater prospects. Pre-construction activities have begun; the pipeline is expected to be laid in 2013 and in service in mid-2014.
In April 2013, we filed an application with the FERC for our Northeast Connector project to expand our existing natural gas transmission system from southeastern Pennsylvania to the proposed Rockaway Delivery Lateral. We plan to place the project into service during the second half of 2014, and expect to increase capacity by 100 Mdth/d.
In January 2013, we filed an application with the FERC for our Rockaway Delivery Lateral project to construct a three-mile offshore lateral to a distribution system in New York. We plan to place the project into service during the second half of 2014, with an expected capacity of 647 Mdth/d.
In December 2012, we filed an application with the FERC for our Virginia Southside project to expand our existing natural gas transmission system from New Jersey to a proposed power station in Virginia and a delivery point in North Carolina. We plan to place the project into service in September 2015, which is expected to increase capacity by 270 Mdth/d.
In November 2012, we received approval from the FERC for our Northeast Supply Link project to expand our existing natural gas transmission system from the Marcellus Shale production region on the Leidy Line to various delivery points in New York and New Jersey. We plan to place the project into service in November 2013, which is expected to increase capacity by an additional 250 Mdth/d.
In April 2012, we began the FERC pre-filing process for a new interstate gas pipeline project for our Constitution Pipeline. We currently own 51 percent of Constitution Pipeline with two other parties holding 25 percent and 24 percent, respectively. We will be the operator of Constitution Pipeline. The new 120-mile Constitution Pipeline will connect our gathering system in Susquehanna County, Pennsylvania, to the Iroquois Gas Transmission and Tennessee Gas Pipeline systems. We plan to place the project into service in March 2015, with an expected capacity of 650 Mdth/d. The pipeline is fully subscribed with two shippers. We expect to file a FERC application during the second quarter of 2013.
Management’s Discussion and Analysis (Continued)
In August 2011, we received approval from the FERC for our Mid-South project to upgrade compressor facilities and expand our existing natural gas transmission system from Alabama to markets as far north as North Carolina. We placed the first phase of the project into service in September 2012, which increased capacity by 95 Mdth/d. We plan to place the second phase of the project into service in June 2013, which is expected to increase capacity by an additional 130 Mdth/d.
West
Due to a reduction in drilling in the Piceance basin during 2012 and early 2013, we have decided to delay the in-service date of our 350 MMcf/d cryogenic natural gas processing plant in Parachute that was planned for service in 2014. We are currently planning an in-service date in mid-2016. With the recent increase in natural gas prices, we will continue to monitor the situation to determine whether an earlier in-service date is warranted.
NGL & Petchem Services
An expansion of our Geismar olefins production facility is under way which is expected to increase the facility’s ethylene production capacity by 600 million pounds per year to a new annual capacity of 1.95 billion pounds. The additional capacity will be wholly owned by us and is expected to increase our share of the Geismar production facility to over 88 percent. We expect to complete the expansion in the latter part of 2013.
Through our equity investment in OPPL, we expect to complete the construction of a pipeline connection and capacity expansions to increase the pipeline’s capacity to the maximum of 255 Mbbls/d in the second quarter of 2013. New volumes coming from the Bakken Shale in the Williston basin began to flow in April 2013.
Eminence Storage Field Leak
On December 28, 2010, we detected a leak in one of the seven underground natural gas storage caverns at our Eminence Storage Field in Mississippi. Due to the leak and related damage to the well at an adjacent cavern, both caverns are out of service. In addition, two other caverns at the field, which were constructed at or about the same time as those caverns, have experienced operating problems, and we have determined that they should also be retired. The event has not affected the performance of our obligations under our service agreements with our customers.
In September 2011, we filed an application with the FERC seeking authorization to abandon these four caverns. In February 2013, the FERC issued an order approving the abandonment. We estimate the total abandonment costs, which will be capital in nature, will be approximately $93$95 million, which is expected to be spent through the endfirst half of 2013.2014. As of March 31,June 30, 2013, we have incurred approximately $71$76 million in cumulative abandonment costs. This estimate is subject to change as work progresses and additional information becomes known. Management considers these costs to be prudent costs incurred in the abandonment of these caverns and expectscaverns. Pursuant to our agreement in principle associated with our general rate case filing, we expensed $6 million in the second quarter of 2013 related to the portion of the Eminence abandonment regulatory asset that will not be recovered in rates. We have also recognized income of $12 million in the second quarter of 2013 related to insurance recoveries associated with this event that we consider probable of collection.
Filing of rate cases
On August 31, 2012, Transco filed a general rate case with the FERC principally designed to recover theseincreased costs netand to comply with the terms of any insurance proceeds,the settlement in futureits prior proceeding. Transco has reached an agreement in principle with the participants that would resolve all issues in this proceeding without the need for a hearing. Final resolution of the rate filings. Tocase is subject to the extent available,filing of a formal stipulation and agreement and subsequent approval by the abandonment costsFERC. Transco plans to file the formal stipulation and agreement with the FERC in the third quarter. The new rates became effective March 1, 2013 and will be funded fromcontribute to a modest increase in revenue in 2013.
During the ARO Trust. (See Note 7first quarter of Notes2012, Northwest Pipeline filed a Stipulation and Settlement Agreement with the FERC for an increase in their rates. Northwest Pipeline received FERC approval during the second quarter of 2012. The new rates, which as filed are 7.4 percent higher than the formerly applicable rates, became effective January 1, 2013.
Expansion Projects
We expect to Consolidated Financial Statements.)invest total capital in 2013 among our business segments as follows:
| Expansion Capital | ||||
| Segment: | (Millions) | |||
Northeast G&P | $ | 1,685 | ||
Atlantic-Gulf | $ | 1,120 | ||
Management’s Discussion and Analysis (Continued)
West | $ | 150 | ||
NGL & Petchem Services | $ | 430 |
Our ongoing major expansion projects include the following:
Northeast G&P
Expansion of our gathering infrastructure including compression and gathering pipelines in the Susquehanna Supply Hub in northeastern Pennsylvania as production in the Marcellus increases. The Susquehanna Supply Hub is expected to reach a natural gas take away capacity of 3 billion cubic feet per day (Bcf/d) by 2015, including capacity contributions from the Constitution Pipeline.
As previously discussed, we completed construction at our Fort Beeler facility in the Marcellus Shale, which added 200 MMcf/d of processing capacity in the second quarter of 2013. By the end of 2013, we expect to add fractionation capacity at our Moundsville fractionators bringing the NGL handling capacity to approximately 43 Mbbls/d. In the first quarter of 2014, we expect our first turbo-expander at our Oak Grove facility to add 200 MMcf/d of processing capacity. We also expect to finalize the construction of our first deethanizer with a capacity of 40 Mbbls/d and the associated 50-mile ethane line to Houston, Pennsylvania.
Expansions to Laurel Mountain’s gathering system infrastructure to increase the capacity to 800 MMcf/d by the end of 2015 through capital to be invested within this equity investment, also in the Marcellus Shale region.
Construction of the Blue Racer Midstream joint project, an expansion to gathering and processing and the associated liquids infrastructure serving oil and gas producers in the Utica shale, primarily in Ohio and Northwest Pennsylvania through capital to be invested within our Caiman Energy II equity investment.
Atlantic-Gulf
| • | We will design, construct, and install our Gulfstar FPS™, a spar-based floating production system that utilizes a standard design approach with a capacity of 60 Mbbls/d of oil, up to 200 MMcf/d of natural gas, and the capability to provide seawater injection services, as previously discussed. Construction is under way and the project is expected to be in service in mid-2014. |
Our equity investee which we operate, Discovery, plans to construct, own, and operate a new 215-mile, 20-inch deepwater lateral pipeline in the central deepwater Gulf of Mexico. Discovery has signed long-term agreements with anchor customers for natural gas gathering and processing services for production from the Keathley Canyon and Green Canyon areas. The Keathley Canyon Connector™ lateral will originate from a third-party floating production facility in the southeast portion of the Keathley Canyon area and will connect to Discovery’s existing 30-inch offshore natural gas transmission system. The gas will be processed at Discovery’s Larose Plant and the NGLs will be fractionated at Discovery’s Paradis Fractionator. The lateral pipeline is estimated to have the capacity to flow more than 400 MMcf/d and will accommodate the tie-in of other deepwater prospects. The pipeline is expected to be in service in the third quarter of 2014.
In July 2013, we filed an application with the FERC for an expansion of Transco’s Mobile Bay line south from Station 85 in west central Alabama to delivery points along the line. We plan to place the project into service in April 2015 and it is expected to increase capacity on the line by 225 Mdth/d.
In June 2013, we filed an application with the FERC for authorization to construct and operate the new jointly-owned Constitution Pipeline. As of May 2013, we own 41 percent of Constitution Pipeline with three other parties holding 25 percent, 24 percent, and 10 percent, respectively. We will be the operator of Constitution Pipeline. The new 120-mile Constitution Pipeline will connect our gathering system in
Management’s Discussion and Analysis (Continued)
Susquehanna County, Pennsylvania, to the Iroquois Gas Transmission and Tennessee Gas Pipeline systems in New York. We plan to place the project into service in March 2015, with an expected capacity of 650 Mdth/d. The pipeline is fully subscribed with two shippers. |
In April 2013, we filed an application with the FERC for Transco’s Northeast Connector project to expand our existing natural gas transmission system from southeastern Pennsylvania to the proposed Rockaway Delivery Lateral. We plan to place the project into service during the second half of 2014, and expect to increase capacity by 100 Mdth/d.
In January 2013, we filed an application with the FERC for Transco’s Rockaway Delivery Lateral project to construct a three-mile offshore lateral to a distribution system in New York. We plan to place the project into service during the second half of 2014, with an expected capacity of 647 Mdth/d.
In December 2012, we filed an application with the FERC for Transco’s Virginia Southside project to expand our existing natural gas transmission system from New Jersey to a proposed power station in Virginia and a delivery point in North Carolina. We plan to place the project into service in September 2015, and expect to increase capacity by 270 Mdth/d.
In November 2012, we received approval from the FERC for Transco’s Northeast Supply Link project to expand our existing natural gas transmission system from the Marcellus Shale production region on the Leidy Line to various delivery points in New York and New Jersey. We plan to place the project into service in November 2013, and expect to increase capacity by an additional 250 Mdth/d.
West
Due to a reduction in drilling in the Piceance basin during 2012 and early 2013, we have decided to delay the in-service date of our 350 MMcf/d cryogenic natural gas processing plant in Parachute that was planned for service in 2014. We are currently planning an in-service date in mid-2016. We will continue to monitor the situation to determine whether an earlier in-service date is warranted.
NGL & Petchem Services
As a result of the Geismar Incident, the expansion of our Geismar olefins production facility is expected to be completed when the Geismar plant returns to operation, which is expected to occur in April 2014. The expansion is expected to increase the facility’s ethylene production capacity by 600 million pounds per year to a new annual capacity of 1.95 billion pounds. The additional capacity will be wholly owned by us and is expected to increase our share of the Geismar production facility from the current 83.3 percent.
Management’s Discussion and Analysis (Continued)
Results of Operations
Consolidated Overview
The following table and discussion is a summary of our consolidated results of operations for the three and six months ended March 31,June 30, 2013, compared to the three and six months ended March 31,June 30, 2012. The results of operations by segment are discussed in further detail following this consolidated overview discussion.
| Three months ended March 31, | ||||||||||||||||||||||||||||||||||||||||||||||||
| 2013 | 2012 | $ Change* | % Change* | Three months ended June 30, | Six months ended June 30, | |||||||||||||||||||||||||||||||||||||||||||
| (Millions) | 2013 | 2012 | $ Change* | % Change* | 2013 | 2012 | $ Change* | % Change* | ||||||||||||||||||||||||||||||||||||||||
| (Millions) | (Millions) | |||||||||||||||||||||||||||||||||||||||||||||||
Revenues: | ||||||||||||||||||||||||||||||||||||||||||||||||
Service revenues | $ | 701 | $ | 673 | +28 | +4% | $ | 715 | $ | 664 | +51 | +8% | $ | 1,416 | $ | 1,337 | +79 | +6% | ||||||||||||||||||||||||||||||
Product sales | 1,055 | 1,295 | -240 | -19% | 1,012 | 1,153 | -141 | -12% | 2,067 | 2,448 | -381 | -16% | ||||||||||||||||||||||||||||||||||||
|
|
|
|
|
| |||||||||||||||||||||||||||||||||||||||||||
Total revenues | 1,756 | 1,968 | 1,727 | 1,817 | -90 | -5% | 3,483 | 3,785 | -302 | -8% | ||||||||||||||||||||||||||||||||||||||
|
|
|
|
|
| |||||||||||||||||||||||||||||||||||||||||||
Costs and expenses: | ||||||||||||||||||||||||||||||||||||||||||||||||
Product costs | 798 | 974 | +176 | +18% | 810 | 907 | +97 | +11% | 1,608 | 1,881 | +273 | +15% | ||||||||||||||||||||||||||||||||||||
Operating and maintenance expenses | 246 | 220 | -26 | -12% | 279 | 264 | -15 | -6% | 525 | 484 | -41 | -8% | ||||||||||||||||||||||||||||||||||||
Depreciation and amortization expenses | 199 | 159 | -40 | -25% | 185 | 171 | -14 | -8% | 375 | 330 | -45 | -14% | ||||||||||||||||||||||||||||||||||||
Selling, general, and administrative expenses | 123 | 126 | +3 | +2% | 125 | 148 | +23 | +16% | 248 | 274 | +26 | +9% | ||||||||||||||||||||||||||||||||||||
Other (income) expense — net | (6 | ) | 6 | +12 | NM | |||||||||||||||||||||||||||||||||||||||||||
Other (income) expense – net | 4 | 12 | +8 | +67% | 7 | 18 | +11 | +61% | ||||||||||||||||||||||||||||||||||||||||
|
|
|
|
|
| |||||||||||||||||||||||||||||||||||||||||||
Total costs and expenses | 1,360 | 1,485 | 1,403 | 1,502 | +99 | +7% | 2,763 | 2,987 | +224 | +7% | ||||||||||||||||||||||||||||||||||||||
|
|
|
|
|
| |||||||||||||||||||||||||||||||||||||||||||
Operating income | 396 | 483 | 324 | 315 | 720 | 798 | ||||||||||||||||||||||||||||||||||||||||||
Equity earnings (losses) | 18 | 30 | -12 | -40% | 35 | 27 | +8 | +30% | 53 | 57 | -4 | -7% | ||||||||||||||||||||||||||||||||||||
Interest expense | (96 | ) | (107 | ) | +11 | +10% | (97) | (105) | +8 | +8% | (193) | (212) | +19 | +9% | ||||||||||||||||||||||||||||||||||
Interest income | 1 | 1 | - | - | - | - | - | - | 1 | 1 | - | - | ||||||||||||||||||||||||||||||||||||
Other income (expense) — net | 2 | 1 | +1 | +100% | ||||||||||||||||||||||||||||||||||||||||||||
Other income (expense) – net | (5) | 6 | -11 | NM | (3) | 7 | -10 | NM | ||||||||||||||||||||||||||||||||||||||||
|
|
|
|
|
| |||||||||||||||||||||||||||||||||||||||||||
Net income | $ | 321 | $ | 408 | 257 | $ | 243 | 578 | $ | 651 | ||||||||||||||||||||||||||||||||||||||
Less: Net income attributable to noncontrolling interests | 1 | - | -1 | NM | 1 | - | -1 | NM | ||||||||||||||||||||||||||||||||||||||||
|
|
|
|
|
| |||||||||||||||||||||||||||||||||||||||||||
Net income attributable to controlling interests | $ | 256 | $ | 243 | $ | 577 | $ | 651 | ||||||||||||||||||||||||||||||||||||||||
|
|
|
| |||||||||||||||||||||||||||||||||||||||||||||
| * | + = Favorable change; |
Three months ended March 31,June 30, 2013 vs. three months ended March 31,June 30, 2012
The increase inservice revenues is primarily due to higher fee revenues driven by higher gathering volumes associated withfrom new well connections and the businesses acquired in the LaserCaiman Acquisition, including contributions from the processing and fractionation facilities placed in Februaryservice in the latter half of 2012 and the Caiman Acquisition in April 2012.2013. Additionally, natural gas transportation fee revenues increased from expansion projects placed into service in 2012 and 2013 and new rates effective during first-quarter 2013. Partially offsetting these increases are decreased gathering and processing fee revenues primarily in the Piceance basin due to severe winter weather conditions which prevented producers from delivering gas and resulted in lower production.
The decrease inproduct sales is primarily due to lower NGL, natural gas, and crude oil marketing revenues resulting from lower NGL volumes and decreases in energy commodityprices and lower crude oil volumes, partially offset by higher natural gas volumes and prices. In addition, NGL production revenues decreased due to lower volumes primarily driven by reduced ethane recoveries and decreases in average NGL per-unit sales prices. Olefin production revenues also decreased primarily due to lower volumes, partially offset by higher per-unit sales prices.
Management’s Discussion and Analysis (Continued) The decrease inproduct costsis primarily due to lower The increase inoperating and maintenance expenses is primarily associated with the businesses acquired in 2012 at Northeast G&P and the subsequent growth in these operations. The increase indepreciation and amortization expensesreflects a full quarter of depreciation expense in 2013 at Northeast G&P associated with the businesses acquired in 2012 and depreciation on subsequent infrastructure additions. The decrease inselling, general, and administrative expenses (SG&A) is primarily due to the absence of acquisition and transition costs incurred in the second quarter of 2012 related to the Caiman Acquisition. The favorable changes inother (income) expense – net withinoperating income primarily include $12 million of expected insurance recoveries considered probable of collection related to the abandonment of Eminence storage assets and $7 million lower project development costs. Partially offsetting these changes are a $6 million expense recognized in second-quarter 2013 related to the portion of the Eminence abandonment regulatory asset that will not be recovered in rates and the absence of a $6 million gain on the sale of equipment in the second quarter of 2012. The increase inoperating incomegenerally reflects increased fee revenues, higher olefin production margins, higher NGL marketing margins, and the favorable changes inother (income) expense – net as described above, substantially offset by lower NGL production margins and higher operating costs. The favorable change inequity earnings (losses) is primarily due to higher equity earnings from Laurel Mountain driven by its higher operating results, partially offset by lower equity earnings from Aux Sable Liquid Products LP (Aux Sable) driven by lower NGL margins. Interest expensedecreased due to an increase ininterest capitalized related to construction projects primarily at Northeast G&P and Atlantic-Gulf, partially offset by an increase ininterest incurred primarily due to an increase in borrowings. The unfavorable change inother income (expense) – net belowoperating income is primarily due to a $14 million charge associated with the impact of a Texas franchise tax law change in the second-quarter 2013. Six months ended June 30, 2013 vs. six months ended June 30, 2012 The increase inservice revenues is primarily due to higher fee revenues driven by higher gathering volumes from new well connections and the businesses acquired in 2012. Additionally, natural gas transportation fee revenues increased from expansion projects placed into service in 2012 and 2013 and new rates effective during first-quarter 2013. Partially offsetting these increases are decreased gathering and processing fee revenues primarily in the Piceance basin due to severe winter weather conditions in the first quarter of 2013 which prevented producers from delivering gas and resulted in lower production as well as a natural decline in production volumes. The decrease inproduct sales is primarily due to lower marketing revenues resulting from lower NGL volumes and prices and lower crude oil volumes, partially offset by higher natural gas volumes and prices. In addition, NGL production revenues decreased due to lower volumes primarily driven by reduced ethane recoveries and decreases in The decrease inproduct costsis primarily due to lower marketing purchases resulting from lower NGL volumes and prices and lower crude oil volumes, partially offset by higher natural gas volumes and prices. In addition, olefin feedstock costs decreased reflecting lower average per-unit feedstock costs and lower sales volumes. CostsNGL, natural gas, and crude oil marketing purchases resulting from lower NGL volumes and prices and lower crude oil volumes, partially offset by higher natural gas volumes and prices. In addition, olefin feedstock costs decreased reflecting lower sales volumes and lower average per-unit feedstock costs.energy commodityaverage NGL per-unit sales prices. Olefin production revenues also decreased primarily due to lower volumes, partially offset by higher per-unit sales prices. associated with the
Management’s Discussion and Analysis (Continued)
associated with the production of NGLs also decreased primarily resulting from lower volumes, partially offset by an increase in average natural gas prices.
The increase inoperating and maintenance expenses is primarily associated with the businesses acquired in 2012 at Northeast G&P and the subsequent growth in these operations.
The increase indepreciation and amortization expensesreflects a full quartersix months of depreciation expense in 2013 at Northeast G&P associated with the businesses acquired in 2012 and an increasedepreciation on subsequent infrastructure additions.
The decrease in depreciation for certainSG&A is primarily due to the absence of Transco’s Eminence storage assets as approved by the FERCacquisition and transition costs incurred in the second quarter of 2012 related abandonment filing.to the Caiman Acquisition.
The favorable change inother (income) expense – net withinoperating income includes an increase in regulatory creditsprimarily include $13 million lower project development costs and $12 million of expected insurance recoveries considered probable of collection related to defer ARO costs associated with the previously described increased depreciationabandonment of Transco’s Eminence storage assets. Partially offsetting these changes are a $6 million expense recognized in second-quarter 2013 related to the portion of the Eminence abandonment regulatory asset that will not be recovered in rates and the absence of a $6 million gain on the sale of equipment in the second quarter of 2012.
The decrease inoperating incomegenerally reflects lower NGL production margins primarily due to lower NGL volumes and unfavorable energy commodity price changes and higher operating costs, partially offset by increased fee revenues, higher olefin production margins, higher NGL marketing margins, and increased fee revenues.the favorable changes inother (income) expense – net as described above.
The unfavorable changechanges inequity earnings (losses) isare primarily due to lower equity earnings from Discovery and Aux Sable, both driven by lower NGL margins.margins, partially offset by higher equity earnings from Laurel Mountain driven by its higher operating results.
Interest expensedecreased due to an increase ininterest capitalized related to construction projects primarily at Northeast G&P and Atlantic-Gulf, partially offset by an increase ininterest incurred primarily due to an increase in borrowings.
The unfavorable change inother income (expense) – net belowoperating income is primarily due to a $14 million charge associated with the impact of a Texas franchise tax law change in the second-quarter 2013.
Period-Over-Period Operating Results – Segments
Northeast G&P
| Three months ended June 30, | Six months ended June 30, | |||||||||||||||
|
|
|
|
|
| |||||||||||
| 2013 | 2012 | 2013 | 2012 | |||||||||||||
| (Millions) | ||||||||||||||||
Service revenues | $ | 78 | $ | 37 | $ | 141 | $ | 61 | ||||||||
Product sales | 35 | - | 55 | - | ||||||||||||
|
|
|
|
|
|
|
| |||||||||
Segment revenues | 113 | 37 | 196 | 61 | ||||||||||||
Product costs | 33 | - | 53 | - | ||||||||||||
Depreciation and amortization expenses | 32 | 17 | 61 | 22 | ||||||||||||
Other segment costs and expenses | 43 | 34 | 83 | 46 | ||||||||||||
Equity (earnings) losses | (7) | 6 | (4) | 9 | ||||||||||||
|
|
|
|
|
|
|
| |||||||||
Segment profit (loss) | $ | 12 | $ | (20) | $ | 3 | $ | (16) | ||||||||
|
|
|
|
|
|
|
| |||||||||
Management’s Discussion and Analysis (Continued)
Period-Over-Period Operating Results – Segments
Northeast G&P
| Three months ended March 31, | ||||||||
| 2013 | 2012 | |||||||
| (Millions) | ||||||||
Service revenues | $ | 63 | $ | 24 | ||||
Product sales | 20 | - | ||||||
|
|
|
| |||||
Segment revenues | 83 | 24 | ||||||
Product costs | 20 | - | ||||||
Depreciation and amortization expenses | 29 | 5 | ||||||
Other segment costs and expenses | 40 | 12 | ||||||
Equity (earnings) losses | 3 | 3 | ||||||
|
|
|
| |||||
Segment profit (loss) | $ | (9 | ) | $ | 4 | |||
|
|
|
| |||||
Three months ended March 31, 2013 vs. three months ended March 31, 2012
Our Northeast G&P segment includes our Susquehanna Supply Hub (primarily resulting from the acquisition of certain assets in 2010 and the Laser Acquisition in February 2012), our Ohio Valley Midstream business (primarily resulting from the Caiman Acquisition in April 2012), and our equity-method investments in Laurel Mountain and Caiman Energy II.
Three months ended June 30, 2013 vs. three months ended June 30, 2012
Service revenues increased due to higher gathering volumes driven by new well connections and a full quarter of operations from the acquired businesses.Caiman Acquisition, including contributions from the processing and fractionation facilities placed in service in the latter half of 2012 and in 2013.
Product sales in 2013 represent new NGL marketing revenues attributable to the Ohio Valley Midstream business. The changes in marketing revenues are offset by similar changes in marketing purchases, reflected above asproduct costs.
Depreciation and amortization expenses reflect a full quarter of depreciation expense in 2013 associated with the acquired businesses.businesses and depreciation on subsequent infrastructure additions.
Other segment costs and expenses increased primarily due to higheroperating and maintenance andselling, general and administrative expenses associated with the acquired businesses and the subsequent growth in these operations. This increase includes approximately $7$8 million in higher employee-related costs, as well as increases in other operating costs such asincluding outside services, operating taxes, materials and supplies, operating taxes, and compression rental. Selling, general, and administrative expensesdecreased primarily due to the absence of acquisition and transition costs incurred in the second quarter of 2012 related to the Caiman Acquisition.
Equity earnings increased primarily due to higher Laurel Mountain equity earnings primarily driven by 80 percent higher gathering volumes and the receipt of an annual minimum volume commitment fee.
The unfavorablefavorable change insegment profit (loss) is primarily due to an increase in fee revenues in the Susquehanna Supply Hub and Ohio Valley Midstream businesses and higher Laurel Mountain equity earnings. These increases are partially offset by higher costs in the Ohio Valley Midstream business in advance of the benefit of associated revenues as we continue to invest in these operations for future growth.growth, partially offset by the absence of acquisition and transition costs incurred in the second quarter of 2012.
Six months ended June 30, 2013 vs. six months ended June 30, 2012
Service revenues increased due to higher gathering volumes driven by new well connections and a full six months of operations from the acquired businesses.
Product sales in 2013 represent new NGL marketing revenues attributable to the Ohio Valley Midstream business. The changes in marketing revenues are offset by similar changes in marketing purchases, reflected above asproduct costs.
Depreciation and amortization expenses reflect a full six months of depreciation expense in 2013 associated with the acquired businesses and depreciation on subsequent infrastructure additions.
Other segment costs and expenses increased primarily due to higher expenses associated with the acquired businesses and the subsequent growth in these operations. This increase includes approximately $15 million in higher employee-related costs, as well as increases in other operating costs including outside services, materials and supplies, operating taxes and compression rental. Selling, general, and administrative expenses decreased primarily due to the absence of acquisition and transition costs incurred in the second quarter of 2012 related to the Caiman Acquisition.
Management’s Discussion and Analysis (Continued)
Equity earnings increased primarily due to higher Laurel Mountain equity earnings driven primarily by 81 percent higher gathering volumes and the receipt of an annual minimum volume commitment fee in the second quarter of 2013.
The favorable change insegment profit (loss) is primarily due to an increase in fee revenues in the Susquehanna Supply Hub and Ohio Valley Midstream businesses and higher Laurel Mountain equity earnings. These increases are partially offset by higher costs in advance of the benefit of associated revenues as we continue to invest in these operations for future growth, partially offset by the absence of acquisition and transition costs incurred in the second quarter of 2012.
Atlantic-Gulf
| Three months ended June 30, | Six months ended June 30, | |||||||||||||||
| 2013 | 2012 | 2013 | 2012 | |||||||||||||
| (Millions) | ||||||||||||||||
Service revenues | $ | 353 | $ | 339 | $ | 711 | $ | 693 | ||||||||
Product sales | 249 | 284 | 480 | 574 | ||||||||||||
|
|
|
|
|
|
|
| |||||||||
Segment revenues | 602 | 623 | 1,191 | 1,267 | ||||||||||||
Product costs | 229 | 256 | 437 | 513 | ||||||||||||
Depreciation and amortization expenses | 87 | 92 | 180 | 184 | ||||||||||||
Other segment costs and expenses | 154 | 168 | 299 | 322 | ||||||||||||
Equity (earnings) losses | (20) | (20) | (36) | (44) | ||||||||||||
|
|
|
|
|
|
|
| |||||||||
Segment profit | $ | 152 | $ | 127 | $ | 311 | $ | 292 | ||||||||
|
|
|
|
|
|
|
| |||||||||
NGL margin | $ | 19 | $ | 26 | $ | 41 | $ | 60 | ||||||||
Atlantic-Gulf
| Three months ended March 31, | ||||||||
| 2013 | 2012 | |||||||
| (Millions) | ||||||||
Service revenues | $ | 358 | $ | 354 | ||||
Product sales | 231 | 290 | ||||||
|
|
|
| |||||
Segment revenues | 589 | 644 | ||||||
Product costs | 208 | 257 | ||||||
Depreciation and amortization expenses | 102 | 92 | ||||||
Other segment costs and expenses | 136 | 154 | ||||||
Equity (earnings) losses | (16 | ) | (24 | ) | ||||
|
|
|
| |||||
Segment profit | $ | 159 | $ | 165 | ||||
|
|
|
| |||||
NGL margin | $ | 22 | $ | 34 | ||||
Three months ended March 31,June 30, 2013 vs. three months ended June 30, 2012
Service revenues increased primarily due to a $22 million increase in natural gas transportation fee revenues primarily associated with expansion projects placed in service in 2012 and 2013 and to the implementation of new rates for Transco in March 31, 20122013, partially offset by $8 million lower production handling and crude transportation fees from our Devils Tower deep-water platform in the Eastern Gulf Coast driven by a natural decline in production volumes.
Product salesdecreased primarily due to:
| • | A |
A $12$6 million decrease in revenues from our equity NGLs primarily reflecting a decrease of $10$6 million associated with an overall 9 percent decrease in average realized NGL per-unit sales prices. Average ethane and non-ethane per-unit prices decreased by 6631 percent and 2218 percent, respectively. Equity NGL sales volumes are 22 percent lower driven by 56 percent lower ethane volumes due primarily to lower ethane recoveries, as previously mentioned, partially offset by 12 percent higher non-ethane volumes due primarily to a higher concentration of liquid-rich gas processed from deliveries on our Perdido pipeline.
| • | A |
Product costsdecreased primarily due to:
Management’s Discussion and Analysis (Continued)
| • | A |
| • | A |
Depreciation and amortization expenses increased primarily due to an increase in depreciation for certain of Transco’s Eminence storage assets as approved by the FERC in the related abandonment filing.
Other segment costs and expenses decreased primarily due to an increaseexpected insurance recoveries considered probable of collection recognized by Transco in regulatory credits2013 related to defer ARO costs associated with the previously described increased depreciationabandonment of Transco’scertain of its Eminence storage assets as well as slightlower project development costs and pipeline maintenance expenses. These decreases are partially offset by expense recognized in bothsecond-quarter 2013 related to the portion of the Eminence abandonment regulatory asset that will not be recovered in rates and the absence of gains on the sale of equipment in the second quarter of 2012.
operatingSegment profit increased primarily due to higher service revenues, expected insurance recoveries recognized related to the abandonment of the Eminence storage assets as well as lower project development costs and pipeline maintenance expenses,andselling, general, partially offset by lower NGL margins, expense recognized in second-quarter 2013 related to the portion of the Eminence abandonment regulatory asset that will not be recovered in rates, and administrativethe absence of gains on equipment sales, as previously discussed.
Six months ended June 30, 2013 vs. six months ended June 30, 2012
Service revenues increased primarily due to a $30 million increase in natural gas transportation fee revenues primarily associated with expansion projects placed in service in 2012 and 2013 and to the implementation of new rates for Transco in March 2013, partially offset by $11 million lower production handling and crude transportation fees from our Devils Tower deep-water platform in the Eastern Gulf Coast driven by a natural decline in production volumes.
Product sales decreased primarily due to:
| • | A $121 million decrease in crude and NGL marketing revenues due primarily to lower crude volumes and lower NGL prices, partially offset by higher non-ethane volumes (offset inproduct costs). |
An $18 million decrease in revenues from our equity NGLs primarily reflecting a decrease of $16 million associated with an overall decrease in average realized NGL per-unit sales prices. Average ethane and non-ethane per-unit prices decreased by 55 percent and 20 percent, respectively. Equity NGL sales volumes are 23 percent lower driven by 57 percent lower ethane volumes due primarily to lower ethane recoveries, as previously mentioned, partially offset by 8 percent higher non-ethane volumes due primarily to a higher concentration of liquid-rich gas processed from deliveries on our Perdido Norte pipeline.
| • | A $44 million increase in other product sales primarily due to higher system management gas sales from Transco. System management gas sales are offset inproduct costs and, therefore, have no impact onsegment profit. |
Product costs decreased primarily due to:
| • | A $121 million decrease in crude and NGL marketing purchases (offset inproduct sales). |
| • | A $41 million increase in other product costs primarily due to higher system management gas costs (offset inproduct sales). |
Other segment costs and expenses decreased primarily due to lower project development costs, expected insurance recoveries considered probable of collection recognized by Transco in 2013 related to the abandonment of certain of its Eminence storage assets, and lower pipeline maintenance expenses. These decreases are partially offset by expense recognized in 2013 related to the portion of the Eminence abandonment regulatory asset that is not expected to be recovered in rates.
Equity earnings decreased primarily due to lower equity earnings from Discovery driven by lower NGL margins.
Management’s Discussion and Analysis (Continued) Segment profit decreasedincreased primarily due to higher service revenues, lower project development costs, expected insurance recoveries recognized related to the abandonment of the Eminence storage assets, and lower pipeline maintenance expenses, partially offset by lower NGL margins reflecting lower average NGL prices higher depreciation and amortization expenses, and lower equity earnings. These decreases are partially offset by a favorable change inother segment costs and expenses.
Management’s Discussion and Analysis (Continued)
| Three months ended June 30, | Six months ended June 30, | |||||||||||||||
| 2013 | 2012 | 2013 | 2012 | |||||||||||||
| (Millions) | ||||||||||||||||
Service revenues | $ | 260 | $ | 265 | $ | 518 | $ | 537 | ||||||||
Product sales | 191 | 271 | 390 | 622 | ||||||||||||
|
|
|
|
|
|
|
| |||||||||
Segment revenues | 451 | 536 | 908 | 1,159 | ||||||||||||
Product costs | 99 | 103 | 193 | 238 | ||||||||||||
Depreciation and amortization expenses | 58 | 57 | 119 | 115 | ||||||||||||
Other segment costs and expenses | 132 | 137 | 248 | 256 | ||||||||||||
|
|
|
|
|
|
|
| |||||||||
Segment profit | $ | 162 | $ | 239 | $ | 348 | $ | 550 | ||||||||
|
|
|
|
|
|
|
| |||||||||
NGL margin | $ | 86 | $ | 163 | $ | 184 | $ | 371 | ||||||||
West
| Three months ended March 31, | ||||||||
| 2013 | 2012 | |||||||
| (Millions) | ||||||||
Service revenues | $ | 258 | $ | 272 | ||||
Product sales | 199 | 351 | ||||||
|
|
|
| |||||
Segment revenues | 457 | 623 | ||||||
Product costs | 94 | 135 | ||||||
Depreciation and amortization expenses | 61 | 58 | ||||||
Other segment costs and expenses | 116 | 119 | ||||||
|
|
|
| |||||
Segment profit | $ | 186 | $ | 311 | ||||
|
|
|
| |||||
NGL margin | $ | 98 | $ | 208 | ||||
Three months ended March 31,June 30, 2013 vs. three months ended March 31,June 30, 2012
Product sales decreased primarily due to:
A $73 million decrease in revenues from our equity NGLs primarily reflecting a decrease of $48 million due to reduced ethane recoveries, as previously mentioned, which decreased equity ethane sales volumes by 79 percent, and a $25 million decrease associated with lower average realized per-unit sales prices.
| • | A $7 million decrease in NGL marketing revenues due primarily to lower ethane volumes (offset inproduct costs). |
Product costs decreased primarily due to:
| • | A $7 million decrease in NGL marketing purchases (offset inproduct sales). |
A $4 million increase in costs associated with our equity NGLs reflecting an increase of $21 million associated with 66 percent higher average natural gas prices, partially offset by a $17 million decrease related to lower volumes.
Segment profit decreased primarily due to $77 million lower NGL margins reflecting lower NGL volumes, lower average NGL prices, and higher natural gas prices.
Six months ended June 30, 2013 vs. six months ended June 30, 2012
Service revenuesdecreased primarily due to a $20$31 million decrease in gathering and processing fee revenues primarily due to severe winter weather conditions in the first quarter of 2013 which prevented producers from delivering gas and resulteda natural decline in lower production volumes, primarily in the Piceance basin,basin. This decrease was partially offset by a $7$16 million increase in natural gas transportation fee revenues at Northwest Pipeline related to new rates effective January 1, 2013.
Product salesdecreased primarily due to:
Management’s Discussion and Analysis (Continued)
A $131$204 million decrease in revenues from our equity NGLs primarily reflecting a decrease of $95$141 million due to lower volumes and a $36$63 million decrease associated with 1816 percent lower average realized non-ethane per-unit sales prices and 6953 percent lower average ethane per-unit sales prices. Equity ethane sales volumes are 9185 percent lower driven by reduced ethane recoveries, as previously mentioned, and equity non-ethane volumes are 117 percent lower due primarily to periods of local severe winter weather conditions in the first quarter of 2013 which prevented producers from delivering gas and a change in a customer’s contract from percent-of-liquids to fee-based processing.
| • | A |
Product costsdecreased primarily due to:
| • | A |
A $21$17 million decrease in costs associated with our equity NGLs primarily reflecting a $44 million decrease due to lower volumes, partially offset by a 19$27 million increase related to a 40 percent increase in average natural gas prices.
Segment profit decreased primarily due to $187 million lower NGL margins reflecting lower NGL volumes, and lower average NGL prices, and higher average natural gas prices, as well as the decrease in gathering and processing fee revenues, partially offset by increased natural gas transportation revenues.
Management’s Discussion and Analysis (Continued)
NGL & Petchem Services
| Three months ended March 31, | ||||||||||||||||||||||||
| 2013 | 2012 | Three months ended June 30, | Six months ended June 30, | |||||||||||||||||||||
| (Millions) | 2013 | 2012 | 2013 | 2012 | ||||||||||||||||||||
| (Millions) | ||||||||||||||||||||||||
Service revenues | $ | 26 | $ | 24 | $ | 28 | $ | 24 | $ | 54 | $ | 48 | ||||||||||||
Product sales | 882 | 1,161 | 829 | 1,010 | 1,711 | 2,171 | ||||||||||||||||||
|
|
|
|
|
| |||||||||||||||||||
Segment revenues | 908 | 1,185 | 857 | 1,034 | 1,765 | 2,219 | ||||||||||||||||||
Product costs | 759 | 1,091 | 743 | 961 | 1,502 | 2,052 | ||||||||||||||||||
Depreciation and amortization expenses | 7 | 4 | 8 | 5 | 15 | 9 | ||||||||||||||||||
Other segment costs and expenses | 27 | 28 | 37 | 36 | 64 | 64 | ||||||||||||||||||
Equity (earnings) losses | (5 | ) | (9 | ) | (8) | (13) | (13) | (22) | ||||||||||||||||
|
|
|
|
|
| |||||||||||||||||||
Segment profit | $ | 120 | $ | 71 | $ | 77 | $ | 45 | $ | 197 | $ | 116 | ||||||||||||
|
|
|
|
|
| |||||||||||||||||||
Olefins margin | $ | 118 | $ | 74 | $ | 88 | $ | 70 | $ | 206 | $ | 144 | ||||||||||||
Marketing margin | $ | 6 | $ | (7 | ) | $ | (6) | $ | (24) | $ | - | $ | (31) | |||||||||||
Three months ended March 31,June 30, 2013 vs. three months ended March 31,June 30, 2012
Product salesdecreased primarily due to:
| • | A $171 million decrease in marketing revenues due primarily to lower NGL volumes and prices, partially offset by higher natural gas volumes and prices. These changes are more than offset inproduct costs. |
A $267 million decrease in NGL and natural gas marketing revenues due primarily to lower NGL volumes and prices. The changes in marketing revenues are more than offset by similar changes in marketing purchases.
An $8$10 million decrease in olefin sales primarily due to $25 million lower ethylene volumes, related to changes in inventory management, partially offset by higher ethylene prices.$15
Management’s Discussion and Analysis (Continued) million higher per-unit sales prices. Ethylene and propylene volumes are lower primarily due to the loss of production as a result of the Geismar Incident, as previously discussed, and to a reduction in third-party refinery grade propylene feedstock to the RGP splitter. Ethylene prices averaged 25 percent higher, partially offset by 39 percent lower butadiene prices. Product costsdecreased primarily due to:
| • | A $189 million decrease in NGL and natural gas marketing purchases (substantially offset inproduct sales). |
A $278 million decrease in NGL and natural gas marketing purchases. The changes in marketing purchases are substantially offset by similar changes in marketing revenues.
A $52$28 million decrease in feedstock costs due primarily to $16 million of lower volumes, primarily 15 percent lower ethylene and 13 percent lower propylene volumes primarily due to the loss of production as a result of the Geismar Incident and to a reduction in third-party refinery grade propylene feedstock costs, including $31to the RGP splitter, and $12 million associated with 46lower feedstock prices, reflecting 15 percent lower average per-unit ethylene feedstock costs and $11 million associated with 13 percent lower sales volumes, and $10 million lower feedstock costs for other products and plant fuel.prices.
Equity earningsdecreased primarily due to lower equity earnings from Aux Sable driven by lower NGL margins.
Segment profitincreased primarily due to a $44 million increase inhigher olefin product and marketing margins, partially offset by lower equity earnings. Olefin product margins are $18 million higher including $39$20 million higher ethylene product margins primarily due to 4625 percent higher per-unit ethylene prices and 15 percent lower average per-unit feedstock prices, partially offset by 15 percent lower volumes sold. Marketing margins are $18 million higher primarily due to the absence of losses in the second quarter of 2012 which were driven by significant declines in NGL prices while product was in transit.
Six months ended June 30, 2013 vs. Six months ended June 30, 2012
Product salesdecreased primarily due to:
| • | A $438 million decrease in marketing revenues due primarily to lower NGL volumes and prices, partially offset by higher natural gas volumes and prices. These changes are more than offset inproduct costs. |
An $18 million decrease in olefin sales primarily due to $45 million lower volumes, partially offset by $27 million higher per-unit sales prices. Ethylene and propylene volumes are lower primarily due to the loss of production as a result of the Geismar Incident, a reduction in third-party refinery grade propylene feedstock to the RGP splitter, and changes in inventory management. Ethylene prices averaged 18 percent higher, partially offset by 38 percent lower butadiene prices.
Product costs decreased primarily due to:
| • | A $469 million decrease in NGL and natural gas marketing purchases (substantially offset inproduct sales). |
An $80 million decrease in feedstock costs due primarily to $51 million lower feedstock costs, reflecting 34 percent lower average per-unit ethylene feedstock prices and $29 million of lower volumes, primarily due to the loss of production as a result of the Geismar Incident.
Equity earningsdecreased primarily due to lower equity earnings from Aux Sable driven by lower NGL margins.
Segment profitincreased primarily due to higher olefin product margins and higher marketing margins, partially offset by lower equity earnings. Olefin margins are $62 million higher including $59 million higher ethylene product margins primarily due to 34 percent lower average per-unit feedstock prices and 1218 percent higher per-unit ethylene prices, partially offset by 13 percent lower volumes sold.
Management’s Discussion and Analysis (Continued)
ethylene prices, partially offset by 14 percent lower volumes sold. In addition, marketing margins are $31 million higher primarily due to the absence of losses recognized in the second quarter of 2012 which were driven by significant declines in NGL prices while product was in transit.
Management’s Discussion and Analysis (Continued)
Management’s Discussion and Analysis of Financial Condition and Liquidity
Outlook
We seek to manage our businesses with a focus on applying conservative financial policy and maintaining investment-grade credit metrics. Our plan for 2013 reflects our ongoing transition to an overall business mix that is increasingly fee-based. Although our cash flows are impacted by fluctuations in energy commodity prices, that impact is somewhat mitigated by certain of our cash flow streams that are not directly impacted by short-term commodity price movements, including:
Firm demand and capacity reservation transportation revenues under long-term contracts;
Fee-based revenues from certain gathering and processing services.
We also note that the November 2012 addition of the Geismar olefins-production facility is expected to result in a favorable shift in our commodity exposure from ethane to ethylene.
We believe we have, or have access to, the financial resources and liquidity necessary to meet our requirements for working capital, capital and investment expenditures, unitholder distributions, and debt service payments while maintaining a sufficient level of liquidity. In particular, we note the following for 2013:
We increased our per-unit quarterly distribution with respect to the firstsecond quarter of 2013 from $0.8275$0.8475 to $0.8475.$0.8625. We expect to increase quarterly limited partner cash distributions in total by approximately 8 percent to 9 percent in 2013 and 6 percent to 8 percent in 2014 and 2015.
In May 2013, Williams agreed to waive incentive distributions of up to $200 million over the next four quarters to support our cash distribution metrics as our large platform of growth projects moves toward completion. We expect to begin realizing the benefit of the waived incentive distributions beginning with our distribution with respect to the third quarter.
We expect to fund working capital requirements, capital and investment expenditures, debt service payments, and distributions to unitholders primarily through cash flow from operations, cash and cash equivalents on hand, issuances of debt and/or equity securities, and utilization of our revolver and/or commercial paper.paper program. Based on a range of market assumptions, we currently estimate our cash flow from operations will be between $1.95$1.825 billion and $2.05$1.85 billion in 2013. In addition, we retain the flexibility to adjust our planned levels of capital and investment expenditures in response to changes in economic conditions or business opportunities.
Liquidity
Based on our forecasted levels of cash flow from operations and other sources of liquidity, we expect to have sufficient liquidity to manage our businesses in 2013. Our internal and external sources of liquidity include:
Cash and cash equivalents on hand;
Cash generated from operations, including cash distributions from our equity method investees;
Cash proceeds from issuances of debt and/or equity securities;
Use of our revolver and/or commercial paper.paper program.
We anticipate our more significant uses of cash to be:
Maintenance and expansion capital expenditures;
Contributions to our equity method investees to fund their expansion capital expenditures;
Management’s Discussion and Analysis (Continued)
Interest on our long-term debt;
Management’s Discussion and Analysis (Continued)
Quarterly distributions to our unitholders and/or general partner.
Potential risks associated with our planned levels of liquidity and the planned capital and investment expenditures discussed above include:
Lower than expected levels of cash flow from operations;
Limited availability of capital due to a change in our financial condition, interest rates, market or industry conditions;
Sustained reductions in energy commodity prices and margins from the range of current expectations;
Significant physical damage to facilities, especially damage to offshore facilities by named windstorms;
Unexpected significant increases in capital expenditures or delays in capital project execution.
As of March 31,June 30, 2013, we had a working capital deficit (current liabilities, inclusive of commercial paper borrowings, in excess of current assets) of $421 million.$1.2 billion. However, we note the following about our available liquidity.
| Available Liquidity | March 31, 2013 | |||
| (Millions) | ||||
Cash and cash equivalents | $ | 79 | ||
Capacity available under our $2.4 billion five-year revolver (expires June 3, 2016) (1) | 2,150 | |||
|
| |||
| $ | 2,229 | |||
|
| |||
| Available Liquidity | June 30, 2013 | |||
| (Millions) | ||||
Cash and cash equivalents | $ | 118 | ||
Capacity available under our $2.4 billion five-year revolver | 1,690 | |||
| $ | 1,808 | |||
| (1) | The full amount of the revolver is available to us, to the extent not otherwise utilized by Transco and Northwest Pipeline, and may, under certain conditions, be increased by up to an additional $400 million. Transco and Northwest Pipeline are each able to borrow up to $400 million under the revolver to the extent not otherwise utilized by the other co-borrowers. At |
On July 31, 2013, we amended our $2.4 billion revolver to increase the aggregate commitments to $2.5 billion and extend the maturity date to July 31, 2018. The amended revolver may, under certain conditions, be increased by up to an additional $500 million. Additionally, Transco and Northwest Pipeline are each able to borrow up to $500 million under the amended revolver to the extent not otherwise utilized by other co-borrowers. |
Commercial Paper
In March 2013, we initiated a commercial paper program. The program allows a maximum outstanding amount at any time of $2 billion of unsecured commercial paper notes. The maturities of the commercial paper notes vary but may not exceed 397 days from the date of issuance. The commercial paper notes are sold under customary terms in the commercial paper market and are issued at a discount from par, or, alternatively, are sold at par and bear varying interest rates on a fixed or floating basis. Proceeds from these notes are used for general partnership
Management’s Discussion and Analysis (Continued)
purposes, including funding capital expenditures, working capital, and partnership distributions. At June 30, 2013, we had $710 million in commercial paper outstanding.
Distributions from Equity Method Investees
Our equity method investees’ organizational documents require distribution of their available cash to their members on a quarterly basis. In each case, available cash is reduced, in part, by reserves appropriate for operating their respective businesses. Our more significant equity method investees include: Aux Sable, Liquid Products L.P., Discovery, Gulfstream, Laurel Mountain, and OPPL.
Shelf Registration
In April 2013, we filed a shelf registration statement for the offer and sale from time to time of common units representing limited partner interests in us having an aggregate offering price of up to $600 million. These sales will be made over a period of time and from time to time in transactions at prices which are market prices prevailing at the time of sale, prices related to market price or at negotiated prices. Such sales will be made pursuant to an equity distribution agreement between us and certain banks who may act as sales agents or purchase for their own accounts as principals.
Commercial Paper
Management’s Discussion and Analysis (Continued)
In March As of June 30, 2013, we initiated a commercial paper program. The program allows a maximum outstanding amount at any time of $2 billion of unsecured commercial paper notes. The maturities of the commercial paper notes will vary but may not exceed 397 days from the date of issuance. The commercial paper notes will be sold under customary terms in the commercial paper market and will beno common units have been issued at a discount from par, or, alternatively, will be sold at par and bear varying interest rates on a fixed or floating basis. Proceeds from these notes are expected to be used to fund planned capital expenditures and for other general partnership purposes. We have not yet issued any notes under this commercial paper program. In managing our available liquidity, we do not expect a maximum outstanding amount under this program in excess of the capacity available under our revolver.registration.
Equity Offering
In March 2013, we completed an equity issuance of 14,250,000 common units, including 3,000,000 common units sold to Williams in a private placement. Subsequently, the underwriters exercised their option to purchase 1,687,500 common units. The net proceeds of approximately $760 million were used to repay amounts outstanding under our revolver.
Credit Ratings
The table below presents our current credit ratings and outlook on our senior unsecured long-term debt.
Rating Agency | Outlook | Senior Unsecured Debt Rating | ||
Standard & Poor’s | Stable | BBB | ||
Moody’s Investors Service | Stable | Baa2 | ||
Fitch Ratings | Positive | BBB- | ||
With respect to Standard and Poor’s, a rating of “BBB” or above indicates an investment grade rating. A rating below “BBB” indicates that the security has significant speculative characteristics. A “BB” rating indicates that Standard and Poor’s believes the issuer has the capacity to meet its financial commitment on the obligation, but adverse business conditions could lead to insufficient ability to meet financial commitments. Standard and Poor’s may modify its ratings with a “+” or a “-” sign to show the obligor’s relative standing within a major rating category.
With respect to Moody’s, a rating of “Baa” or above indicates an investment grade rating. A rating below “Baa” is considered to have speculative elements. The “1”, “2”, and “3” modifiers show the relative standing within a major category. A “1” indicates that an obligation ranks in the higher end of the broad rating category, “2” indicates a mid-range ranking, and “3” indicates a ranking at the lower end of the category.
With respect to Fitch, a rating of “BBB” or above indicates an investment grade rating. A rating below “BBB” is considered speculative grade. Fitch may add a “+” or a “-” sign to show the obligor’s relative standing within a major rating category.
Management’s Discussion and Analysis (Continued)
Credit rating agencies perform independent analyses when assigning credit ratings. No assurance can be given that the credit rating agencies will continue to assign us investment grade ratings even if we meet or exceed their current criteria for investment grade ratios. A downgrade of our credit rating might increase our future cost of borrowing and would require us to post additional collateral with third parties, negatively impacting our available liquidity. As of March 31,June 30, 2013, we estimate that a downgrade to a rating below investment grade could require us to post up to $335$292 million in additional collateral with third parties.
Capital and Investment Expenditures
Management’s Discussion and Analysis (Continued)
Each of our businesses is capital-intensive, requiring investment to upgrade or enhance existing operations and comply with safety and environmental regulations. The capital requirements of these businesses consist primarily of:
Maintenance capital expenditures, which are generally not discretionary, including (1) capital expenditures made to replace partially or fully depreciated assets in order to maintain the existing operating capacity of our assets and to extend their useful lives, (2) expenditures which are mandatory and/or essential to comply with laws and regulations and maintain the reliability of our operations, and (3) certain well connection expenditures.
Expansion capital expenditures, which are generally more discretionary than maintenance capital expenditures, including (1) expenditures to acquire additional assets to grow our business, to expand and upgrade plant or pipeline capacity and to construct new plants, pipelines and storage facilities and (2) well connection expenditures which are not classified as maintenance expenditures.
The following table provides summary information related to our actual and expected capital expenditures, purchases of businesses, and contributions to equity method investments for 2013. Included are gross increases to our property, plant, and equipment, including changes related to accounts payable and accrued liabilities:
| Maintenance | Expansion | Total | ||||||||||||||||||||||||||||||||||||||||||||||
| Three Months | Three Months | Three Months | ||||||||||||||||||||||||||||||||||||||||||||||
| 2013 | Ended | 2013 | Ended | 2013 | Ended | Maintenance | Expansion | Total | ||||||||||||||||||||||||||||||||||||||||
Segment | Estimate | March 31, 2013 | Estimate | March 31, 2013 | Estimate | March 31, 2013 | 2013 Estimate | Six Months Ended June 30, 2013 | 2013 Estimate | Six Months Ended June 30, 2013 | 2013 Estimate | Six Months Ended June 30, 2013 | ||||||||||||||||||||||||||||||||||||
| (Millions) | (Millions) | |||||||||||||||||||||||||||||||||||||||||||||||
Northeast G&P | $ | 10 | $ | - | $ | 1,680 | $ | 408 | $ | 1,690 | $ | 408 | $ | 10 | $ | 4 | $ | 1,685 | $ | 715 | $ | 1,695 | $ | 719 | ||||||||||||||||||||||||
Atlantic-Gulf | 165 | 26 | 1,175 | 150 | 1,340 | 176 | 170 | 67 | 1,120 | 460 | 1,290 | 527 | ||||||||||||||||||||||||||||||||||||
West | 135 | 11 | 135 | 44 | 270 | 55 | 135 | 36 | 150 | 73 | 285 | 109 | ||||||||||||||||||||||||||||||||||||
NGL & Petchem Services | 20 | 4 | 425 | 40 | 445 | 44 | 20 | 8 | 430 | 125 | 450 | 133 | ||||||||||||||||||||||||||||||||||||
Other | - | 2 | - | - | - | 2 | - | 3 | - | - | - | 3 | ||||||||||||||||||||||||||||||||||||
|
|
|
|
|
|
|
|
|
|
|
| |||||||||||||||||||||||||||||||||||||
Total | $ | 330 | $ | 43 | $ | 3,415 | $ | 642 | $ | 3,745 | $ | 685 | $ | 335 | $ | 118 | $ | 3,385 | $ | 1,373 | $ | 3,720 | $ | 1,491 | ||||||||||||||||||||||||
|
|
|
|
|
|
|
|
|
|
|
| |||||||||||||||||||||||||||||||||||||
Cash Distributions to Unitholders
We have paid quarterly distributions to unitholders and our general partner after every quarter since our initial public offering on August 23, 2005. We have increased our quarterly distribution from $0.8275$0.8475 with respect to $0.8475the first quarter of 2013 to $0.8625 per unit, which resulted in a firstsecond quarter 2013 distribution of approximately $473$489 million that will be paid on May 10,August 9, 2013, to the general and limited partners of record at the close of business on May 3,August 2, 2013. (See Note 3 of Notes to Consolidated Financial Statements).
Management’s Discussion and Analysis (Continued) Sources (Uses) of Cash
| Three months ended March 31, | Six months ended June 30, | |||||||||||||||
| 2013 | 2012 | 2013 | 2012 | |||||||||||||
| (Millions) | (Millions) | |||||||||||||||
Net cash provided (used) by: | ||||||||||||||||
Operating activities | $ | 511 | $ | 552 | $ | 1,109 | $ | 1,056 | ||||||||
Financing activities | 220 | 168 | 467 | 1,778 | ||||||||||||
Investing activities | (672 | ) | (620 | ) | (1,478) | (2,963) | ||||||||||
|
|
|
| |||||||||||||
Increase (decrease) in cash and cash equivalents | $ | 59 | $ | 100 | $ | 98 | $ | (129) | ||||||||
|
|
|
| |||||||||||||
Operating activities
The decreaseincrease innet cash provided by operating activities is primarily due to lower operating results.net favorable changes in working capital.
Management’s Discussion and Analysis (Continued)
Financing activities
Significant transactions include:
$7601.7 billion in 2013 and $500 million including $143 millionin 2012 received from Williams,revolver borrowings;
$2.1 billion in 2013 and $155 million in 2012 paid on revolver borrowings;
$710 million net proceeds received in 2013 from commercial paper issuances;
$760 million received from our equity offering in 2013, andincluding $143 million received from Williams, which was used to repay revolver borrowings;
$490 million received from our equity offering in 2012 and used to fund capital expenditures and for general partnership purposes;
$770 million received in 2013 from revolver borrowings;
$895 million paid on revolver borrowings in 2013;
$442915 million and $311$673 million related to quarterly cash distributions paid to limited partner unitholders and our general partner in 2013 and 2012, respectively.respectively;
$251 million received in contributions from noncontrolling interests in 2013;
$1.1 billion received from our equity offerings in 2012 which was used to fund a portion of the cash purchase price of the Caiman Acquisition, for capital expenditures and for general partnership purposes;
$1 billion received from Williams in 2012 for common units issued, used for the funding of a portion of the cash purchase price of the Caiman Acquisition.
Investing activities
Significant transactions include:
Capital expenditures of $608 million$1.3 billion and $260$784 million for 2013 and 2012, respectively;
$1.72 billion paid, net of purchase price adjustments, for the Caiman Acquisition in 2012;
$325 million paid, net of cash acquired in the transaction, for entities acquired in the Laser Acquisition in February 2012.
Off-Balance Sheet Arrangements and Guarantees of Debt or Other Commitments
We have various other guarantees and commitments which are disclosed in Note 78 and Note 89 of Notes to Consolidated Financial Statements. We do not believe these guarantees or the possible fulfillment of them will prevent us from meeting our liquidity needs.
Quantitative and Qualitative Disclosures About Market Risk
Interest Rate Risk
Our current interest rate risk exposure is related primarily to our debt portfolio and has not materially changed during the first threesix months of 2013.
Controls and Procedures
Our management, including our general partner’s Chief Executive Officer and Chief Financial Officer, does not expect that our disclosure controls and procedures (as defined in Rules 13a-15(e) and 15d-15(e) of the Securities Exchange Act) (Disclosure Controls) or our internal controls over financial reporting (Internal Controls) will prevent all errors and all fraud. A control system, no matter how well conceived and operated, can provide only reasonable, not absolute, assurance that the objectives of the control system are met. Further, the design of a control system must reflect the fact that there are resource constraints, and the benefits of controls must be considered relative to their costs. Because of the inherent limitations in all control systems, no evaluation of controls can provide absolute assurance that all control issues and instances of fraud, if any, within Williams Partners L.P. have been detected. These inherent limitations include the realities that judgments in decision-making can be faulty, and that breakdowns can occur because of simple error or mistake. Additionally, controls can be circumvented by the individual acts of some persons, by collusion of two or more people, or by management override of the control. The design of any system of controls is also based in part upon certain assumptions about the likelihood of future events, and there can be no assurance that any design will succeed in achieving its stated goals under all potential future conditions. Because of the inherent limitations in a cost-effective control system, misstatements due to error or fraud may occur and not be detected. We monitor our Disclosure Controls and Internal Controls and make modifications as necessary; our intent in this regard is that the Disclosure Controls and Internal Controls will be modified as systems change and conditions warrant.
Evaluation of Disclosure Controls and Procedures
An evaluation of the effectiveness of the design and operation of our Disclosure Controls was performed as of the end of the period covered by this report. This evaluation was performed under the supervision and with the participation of our management, including our general partner’s Chief Executive Officer and Chief Financial Officer. Based upon that evaluation, our general partner’s Chief Executive Officer and Chief Financial Officer concluded that these Disclosure Controls are effective at a reasonable assurance level.
First-QuarterSecond-Quarter 2013 Changes in Internal Controls
There have been no changes during the firstsecond quarter of 2013 that have materially affected, or are reasonably likely to materially affect, our Internal Controls.
Environmental
Certain reportable legal proceedings involving governmental authorities under federal, state and local laws regulating the discharge of materials into the environment are described below. While it is not possible for us to predict the final outcome of the proceedings which are still pending, we do not anticipate a material effect on our consolidated financial position if we receive an unfavorable outcome in any one or more of such proceedings.
In September 2007, the EPA requested, and our Transco subsidiary later provided, information regarding natural gas compressor stations in the states of Mississippi and Alabama as part of the EPA’s investigation of Transco’s compliance with the Clean Air Act. On March 28, 2008, the EPA issued notices of violation alleging violations of Clean Air Act requirements at these compressor stations. Transco met with the EPA in May 2008 and submitted a response denying the allegations in June 2008. In May 2011, Transco provided additional information to the EPA pertaining to these compressor stations in response to a request they had made in February 2011. In August 2010, the EPA requested, and Transco provided, similar information for a compressor station in Maryland.
The New Mexico Environment Department’s Air Quality Bureau (NMED) issued a Notice of Violation to Williams Four Corners LLC (Four Corners) on October 23, 2012, as revised on February 7, 2013, for the El Cedro Gas Treating Plant related to the plant’s use of a standby generator and the timing of periodic testing. Settlement negotiations with the BureauNMED to resolve the alleged violations are ongoing, with the NMED offering on April 5, 2013, to settle for $162,711.
On January 18, 2013, the NMED issued a Notice of Violation to Four Corners relating to permitting issues for condensate storage tanks at the La Jara Compressor Station. WilliamsFour Corners has been in discussions with the NMED about such permitting issues since early 2011. Settlement negotiations to resolve the issues are ongoing, with the NMED offering on April 18, 2013, to settle for $129,978.
On February 12, 2013, the NMED issued a Notice of Violation to Four Corners related to the alleged modification of turbine units and a separator tank and alleged failure to conduct performance tests on certain facilities at the La Jara Compressor Station. Four Corners has been in discussions with the NMED since 2012 regarding the separator tank and other permitting issues. Settlement negotiations to resolve the issues are ongoing, with the NMED offering on June 10, 2013 to settle for $1,336,564.
Other
The additional information called for by this item is provided in Note 89 of Notes to Consolidated Financial Statements included under Part I, Item 1. Financial Statements of this report, which information is incorporated by reference into this item.
Part I, Item 1A. Risk Factors in our Annual Report on Form 10-K for the year ended December 31, 2012, includes certain risk factors that could materially affect our business, financial condition or future results. Those Risk Factors have not materially changed, except as set forth below:
The time required to return our Geismar olefins plant to operation following the explosion and fire at the facility on June 13, 2013 and the extent and timing of costs and insurance recoveries related to the incident could be materially different than we anticipate and could cause our financial results and levels of cash distributions to be materially different than we project.
Our projections of financial results and expected levels of cash distributions are based on numerous assumptions and estimates, including but not limited to the time required to return our Geismar, Louisiana olefins plant to operation and complete the expansion project at the facility following the explosion and fire at the plant on June 13, 2013 and the extent and timing of costs and insurance recoveries related to the incident. Our financial results and levels of cash distributions could be materially different than we project if our assumptions and estimates related to the incident are materially different than actual outcomes.
Entry Into a Material Definitive Agreement & Creation of a Direct Financial Obligation or an Obligation under an Off-Balance Sheet Arrangement of a Registrant.
First Amended & Restated Credit Agreement
On July 31, 2013, Williams Partners L.P. (“WPZ”), Northwest Pipeline LLC (“Northwest”) and Transcontinental Gas Pipe Line Company, LLC (“Transco” and, together with WPZ and Northwest, collectively the “Borrowers”) entered into a First Amended & Restated Credit Agreement (the “Restated Credit Agreement”), with Citibank, N.A. (“Citi”), as administrative agent, and the lenders named therein. The Restated Credit Agreement amends and restates that certain Credit Agreement, dated as of June 3, 2011 (as amended prior to July 31, 2013, the “Existing Credit Agreement”), among the Borrowers, Citi, as administrative agent and the lenders named therein.
Capitalized terms used in this Item 5 and not otherwise defined herein have the meaning given to them in the Restated Credit Agreement.
The Restated Credit Agreement increases the Aggregate Commitments available to the Borrowers by $100 million (the “Incremental Commitments”) and extends the Maturity Date to July 31, 2018. Additionally, the Restated Credit Agreement lowers, in certain cases, the applicable margin and commitment fees payable by each Borrower based on such Borrower’s senior unsecured debt ratings. The Incremental Commitments are increased Commitments from lenders named in the Existing Credit Agreement as well as a new Commitment from an institution party to the Restated Credit Agreement. After giving effect to the Restated Credit Amendment, the Borrowers may borrow, in the aggregate, up to $2.5 billion under the Restated Credit Agreement. Northwest and Transco are each subject to a $500 million borrowing sublimit. In addition, WPZ may request an increase of up to an additional $500 million in Commitments from either new lenders or increased Commitments from existing lenders named in the Restated Credit Agreement. However, at no time may the Aggregate Commitments under the Restated Credit Agreement exceed $3.0 billion.
The foregoing description of the Restated Credit Amendment does not purport to be complete and is qualified in its entirety by reference to the Restated Credit Amendment, a copy of which is attached as Exhibit 10 to this Quarterly Report on Form 10-Q and incorporated into this Item 5 by reference.
Exhibit No. | Description | |||
Exhibit 3.1 | — | Certificate of Limited Partnership of Williams Partners L.P. (filed on May 2, 2005 as Exhibit 3.1 to Williams Partners L.P.’s registration statement on Form S-1 (File No. 333-124517)) and incorporated herein by reference. | ||
Exhibit 3.2 | — | Certificate of Formation of Williams Partners GP LLC (filed on May 2, 2005 as Exhibit 3.3 to Williams Partners L.P.’s registration statement on Form S-1 (File No. 333-124517)) and incorporated herein by reference. | ||
Exhibit 3.3 | — | Amended and Restated Agreement of Limited Partnership of Williams Partners L.P. (including form of common unit certificate), as amended by Amendments Nos. 1, 2, 3, 4, 5, 6, 7, 8, and 9 (filed on February 27, 2013 as Exhibit 3.3 to Williams Partners L.P.’s annual report on Form 10-K (File No. 001-32599)) and incorporated herein by reference. | ||
Exhibit 3.4 | — | Amended and Restated Limited Liability Company Agreement of Williams Partners GP LLC (filed on August 26, 2005 as Exhibit 3.2 to Williams Partners L.P.’s current report on Form 8-K (File No. 001-32599)) and incorporated herein by reference. | ||
*Exhibit | — |
| ||
|
|
| ||
|
|
| ||
|
|
| ||
*Exhibit 12 | — | Computation of Ratio of Earnings to Fixed Charges. | ||
*Exhibit 31.1 | — | Certification of Chief Executive Officer pursuant to Rules 13a-14(a) and 15d-14(a) promulgated under the Securities Exchange Act of 1934, as amended, and Item 601(b)(31) of Regulation S-K, as adopted pursuant to Section 302 of the Sarbanes-Oxley Act of 2002. | ||
*Exhibit 31.2 | — | Certification of Chief Financial Officer pursuant to Rules 13a-14(a) and 15d-14(a) promulgated under the Securities Exchange Act of 1934, as amended, and Item 601(b)(31) of Regulation S-K, as adopted pursuant to Section 302 of the Sarbanes-Oxley Act of 2002. | ||
**Exhibit 32 | — | Certification of Chief Executive Officer and Chief Financial Officer pursuant to 18 U.S.C. Section 1350, as adopted pursuant to Section 906 of the Sarbanes-Oxley Act of 2002. | ||
*Exhibit 101.INS | — | XBRL Instance Document. | ||
*Exhibit 101.SCH | — | XBRL Taxonomy Extension Schema. | ||
*Exhibit 101.CAL | — | XBRL Taxonomy Extension Calculation Linkbase. | ||
*Exhibit 101.DEF | — | XBRL Taxonomy Extension Definition Linkbase. | ||
*Exhibit 101.LAB | — | XBRL Taxonomy Extension Label Linkbase. | ||
*Exhibit 101.PRE | — | XBRL Taxonomy Extension Presentation Linkbase. | ||
* Filed herewith.
** Furnished herewith.
| * | Filed herewith. | |
| ** | Furnished herewith. |
SIGNATURE
Pursuant to the requirements of the Securities Exchange Act of 1934, the registrant has duly caused this report to be signed on its behalf by the undersigned thereunto duly authorized.
WILLIAMS PARTNERS L.P. | ||
(Registrant) | ||
By: | Williams Partners GP LLC, its general partner | |
/s/ Ted T. Timmermans | ||
Ted T. Timmermans | ||
Vice President, Controller, and Chief Accounting Officer (Duly Authorized Officer and Principal Accounting Officer) |
May 8,July 31, 2013
EXHIBIT INDEX
Exhibit No. | Description | |||
Exhibit 3.1 | — | Certificate of Limited Partnership of Williams Partners L.P. (filed on May 2, 2005 as Exhibit 3.1 to Williams Partners L.P.’s registration statement on Form S-1 (File No. 333-124517)) and incorporated herein by reference. | ||
Exhibit 3.2 | — | Certificate of Formation of Williams Partners GP LLC (filed on May 2, 2005 as Exhibit 3.3 to Williams Partners L.P.’s registration statement on Form S-1 (File No. 333-124517)) and incorporated herein by reference. | ||
Exhibit 3.3 | — | Amended and Restated Agreement of Limited Partnership of Williams Partners L.P. (including form of common unit certificate), as amended by Amendments Nos. 1, 2, 3, 4, 5, 6, 7, 8, and 9 (filed on February 27, 2013 as Exhibit 3.3 to Williams Partners L.P.’s annual report on Form 10-K (File No. 001-32599)) and incorporated herein by reference. | ||
Exhibit 3.4 | — | Amended and Restated Limited Liability Company Agreement of Williams Partners GP LLC (filed on August 26, 2005 as Exhibit 3.2 to Williams Partners L.P.’s current report on Form 8-K (File No. 001-32599)) and incorporated herein by reference. | ||
*Exhibit | — |
| ||
|
|
| ||
|
|
| ||
|
|
| ||
*Exhibit 12 | — | Computation of Ratio of Earnings to Fixed Charges | ||
*Exhibit 31.1 | — | Certification of Chief Executive Officer pursuant to Rules 13a-14(a) and 15d-14(a) promulgated under the Securities Exchange Act of 1934, as amended, and Item 601(b)(31) of Regulation S-K, as adopted pursuant to Section 302 of the Sarbanes-Oxley Act of 2002. | ||
|
| |||
*Exhibit 31.2 | — | Certification of Chief Financial Officer pursuant to Rules 13a-14(a) and 15d-14(a) promulgated under the Securities Exchange Act of 1934, as amended, and Item 601(b)(31) of Regulation S-K, as adopted pursuant to Section 302 of the Sarbanes-Oxley Act of 2002. | ||
**Exhibit 32 | — | Certifications of Chief Executive Officer and Chief Financial Officer pursuant to 18 U.S.C. Section 1350, as adopted pursuant to Section 906 of the Sarbanes-Oxley Act of 2002. | ||
*Exhibit 101.INS | — | XBRL Instance Document | ||
*Exhibit 101.SCH | — | XBRL Taxonomy Extension Schema | ||
*Exhibit 101.CAL | — | XBRL Taxonomy Extension Calculation Linkbase | ||
*Exhibit 101.DEF | — | XBRL Taxonomy Extension Definition Linkbase | ||
*Exhibit 101.LAB | — | XBRL Taxonomy Extension Label Linkbase | ||
Exhibit No. | Description | |||
*Exhibit 101.PRE | — | XBRL Taxonomy Extension Presentation Linkbase | ||
*
| * | Filed herewith. | |
| ** | Furnished herewith. |
** Furnished herewith.