UNITED STATES
SECURITIES AND EXCHANGE COMMISSION
Washington, DC 20549
FORM 10-Q
| x | QUARTERLY REPORT PURSUANT TO SECTION 13 OR 15(d) OF THE SECURITIES EXCHANGE ACT OF 1934 |
For the quarterly period ended March 31,June 30, 2013
or
| ¨ | TRANSITION REPORT PURSUANT TO SECTION 13 OR 15(d) OF THE SECURITIES EXCHANGE ACT OF 1934 |
For the transition period from to
Commission file number 001-09718
The PNC Financial Services Group, Inc.
(Exact name of registrant as specified in its charter)
| | |
| Pennsylvania | | 25-1435979 |
(State or other jurisdiction of incorporation or organization) | | (I.R.S. Employer Identification No.) |
One PNC Plaza, 249 Fifth Avenue, Pittsburgh, Pennsylvania 15222-2707
(Address of principal executive offices, including zip code)
(412) 762-2000
(Registrant’s telephone number, including area code)
(Former name, former address and former fiscal year, if changed since last report)
Indicate by check mark whether the registrant: (1) has filed all reports required to be filed by Section 13 or 15(d) of the Securities Exchange Act of 1934 during the preceding 12 months (or for such shorter period that the registrant was required to file such reports), and (2) has been subject to such filing requirements for the past 90 days. Yes x No ¨
Indicate by check mark whether the registrant has submitted electronically and posted on its corporate Web site, if any, every Interactive Data File required to be submitted and posted pursuant to Rule 405 of RegulationS-T (§232.405 of this chapter) during the preceding 12 months (or for such shorter period that the registrant was required to submit and post such files). Yes x No ¨
Indicate by check mark whether the registrant is a large accelerated filer, an accelerated filer, a non-accelerated filer, or a smaller reporting company. See the definitions of “large accelerated filer”, “accelerated filer” and “smaller reporting company” in Rule 12b-2 of the Exchange Act.
| | | | | | |
| Large accelerated filer | | x | | Accelerated filer | | ¨ |
| | | |
| Non-accelerated filer | | ¨ | | Smaller reporting company | | ¨ |
Indicate by check mark whether the registrant is a shell company (as defined in Rule 12b-2 of the Exchange Act). Yes ¨ No x
As of April 30,July 31, 2013, there were 529,423,740531,511,981 shares of the registrant’s common stock ($5 par value) outstanding.
THE PNC FINANCIAL SERVICES GROUP, INC.
Cross-Reference Index to FirstSecond Quarter 2013 Form 10-Q
THE PNC FINANCIAL SERVICES GROUP, INC.
Cross-Reference Index to FirstSecond Quarter 2013 Form10-Q (continued)
MD&A TABLE REFERENCE
THE PNC FINANCIAL SERVICES GROUP, INC.
Cross-Reference Index to FirstSecond Quarter 2013 Form10-Q (continued)
NOTES TO CONSOLIDATED FINANCIAL STATEMENTS TABLE REFERENCE
THE PNC FINANCIAL SERVICES GROUP, INC.
Cross-Reference Index to FirstSecond Quarter 2013 Form10-Q (continued)
NOTES TO CONSOLIDATED FINANCIAL STATEMENTS TABLE REFERENCE (Continued)(continued)
FINANCIAL REVIEW
THE PNC FINANCIAL SERVICES GROUP, INC.
TTABLE 1: CONSOLIDATED FINANCIAL HIGHLIGHTS
| Dollars in millions, except per share data Unaudited | | Three months ended
March 31 | | | Three months ended
June 30 | | | Six months ended
June 30 | |
| | 2013 | | 2012 | | | 2013 | | 2012 | | | 2013 | | | 2012 | |
Financial Results (a) | | | | | | | | | | | | | | |
Revenue | | | | | | | | | | | | | | |
Net interest income | | $ | 2,389 | | | $ | 2,291 | | | $ | 2,258 | | | $ | 2,526 | | | $ | 4,647 | | | $ | 4,817 | |
Noninterest income | | | 1,566 | | | | 1,441 | | | | 1,806 | | | | 1,097 | | | | 3,372 | | | | 2,538 | |
Total revenue | | | 3,955 | | | | 3,732 | | | | 4,064 | | | | 3,623 | | | | 8,019 | | | | 7,355 | |
Noninterest expense | | | 2,395 | | | | 2,455 | | | | 2,435 | | | | 2,648 | | | | 4,830 | | | | 5,103 | |
Pretax, pre-provision earnings (b) | | | 1,560 | | | | 1,277 | | | | 1,629 | | | | 975 | | | | 3,189 | | | | 2,252 | |
Provision for credit losses | | | 236 | | | | 185 | | | | 157 | | | | 256 | | | | 393 | | | | 441 | |
Income before income taxes and noncontrolling interests | | $ | 1,324 | | | $ | 1,092 | | | $ | 1,472 | | | $ | 719 | | | $ | 2,796 | | | $ | 1,811 | |
Net income | | $ | 1,004 | | | $ | 811 | | | $ | 1,123 | | | $ | 546 | | | $ | 2,127 | | | $ | 1,357 | |
Less: | | | | | | | | | | | | | | |
Net income (loss) attributable to noncontrolling interests | | | (9 | ) | | | 6 | | | | 1 | | | | (5 | ) | | | (8 | ) | | | 1 | |
Preferred stock dividends and discount accretion | | | 75 | | | | 39 | | | | 53 | | | | 25 | | | | 128 | | | | 64 | |
Net income attributable to common shareholders | | $ | 938 | | | $ | 766 | | | $ | 1,069 | | | $ | 526 | | | $ | 2,007 | | | $ | 1,292 | |
Diluted earnings per common share | | $ | 1.76 | | | $ | 1.44 | | | $ | 1.99 | | | $ | .98 | | | $ | 3.76 | | | $ | 2.42 | |
Cash dividends declared per common share | | $ | .40 | | | $ | .35 | | | $ | .44 | | | $ | .40 | | | $ | .84 | | | $ | .75 | |
Performance Ratios | | | | | | | | | | | | | | |
Net interest margin (c) | | | 3.81 | % | | | 3.90 | % | | | 3.58 | % | | | 4.08 | % | | | 3.69 | % | | | 3.99 | % |
Noninterest income to total revenue | | | 40 | | | | 39 | | | | 44 | | | | 30 | | | | 42 | | | | 35 | |
Efficiency | | | 61 | | | | 66 | | | | 60 | | | | 73 | | | | 60 | | | | 69 | |
Return on: | | | | | | | | | | | | | | |
Average common shareholders’ equity | | | 10.68 | | | | 9.41 | | | | 11.81 | | | | 6.23 | | | | 11.25 | | | | 7.80 | |
Average assets | | | 1.34 | | | | 1.16 | | | | 1.49 | | | | .74 | | | | 1.42 | | | | .94 | |
See page 6670 for a glossary of certain terms used in this Report.
Certain prior period amounts have been reclassified to conform with the current period presentation, which we believe is more meaningful to readers of our consolidated financial statements.
| (a) | The Executive Summary and Consolidated Income Statement Review portions of the Financial Review section of this Report provide information regarding items impacting the comparability of the periods presented. |
| (b) | We believe that pretax, pre-provision earnings, a non-GAAP measure, is useful as a tool to help evaluate the ability to provide for credit costs through operations. |
| (c) | Calculated as annualized taxable-equivalent net interest income divided by average earning assets. The interest income earned on certain earning assets is completely or partially exempt from federal income tax. As such, these tax-exempt instruments typically yield lower returns than taxable investments. To provide more meaningful comparisons of net interest margins for all earning assets, we use net interest income on a taxable-equivalent basis in calculating net interest margin by increasing the interest income earned on tax-exempt assets to make it fully equivalent to interest income earned on taxable investments. This adjustment is not permitted under generally accepted accounting principles (GAAP) in the Consolidated Income Statement. The taxable-equivalent adjustments to net interest income for the three months ended March 31,June 30, 2013 and March 31,June 30, 2012 were $40 million and $31$35 million, respectively. The taxable-equivalent adjustments to net interest income for the six months ended June 30, 2013 and June 30, 2012 were $80 million and $66 million, respectively. |
The PNC Financial Services Group, Inc. –Form 10-Q 1
TABLE 1: CONSOLIDATED FINANCIAL HIGHLIGHTS (CONTINUED) (a)
| | Unaudited | | March 31
2013 | | December 31
2012 | | March 31
2012 | | | June 30
2013 | | December 31
2012 | | June 30
2012 | |
Balance Sheet Data (dollars in millions, except per share data) | | | | | | | | | | | | | | |
Assets | | $ | 300,812 | | | $ | 305,107 | | | $ | 295,883 | | | $ | 304,415 | | | $ | 305,107 | | | $ | 299,575 | |
Loans (b) (c) | | | 186,504 | | | | 185,856 | | | | 176,214 | | | | 189,775 | | | | 185,856 | | | | 180,425 | |
Allowance for loan and lease losses (b) | | | 3,828 | | | | 4,036 | | | | 4,196 | | | | 3,772 | | | | 4,036 | | | | 4,156 | |
Interest-earning deposits with banks (b) | | | 1,541 | | | | 3,984 | | | | 2,084 | | | | 3,797 | | | | 3,984 | | | | 3,995 | |
Investment securities (b) | | | 59,361 | | | | 61,406 | | | | 64,554 | | | | 57,449 | | | | 61,406 | | | | 61,937 | |
Loans held for sale (c) | | | 3,295 | | | | 3,693 | | | | 2,456 | | | | 3,814 | | | | 3,693 | | | | 3,333 | |
Goodwill and other intangible assets | | | 10,996 | | | | 10,869 | | | | 11,188 | | | | 11,228 | | | | 10,869 | | | | 10,962 | |
Equity investments (b) (d) | | | 11,008 | | | | 10,877 | | | | 10,352 | | | | 10,054 | | | | 10,877 | | | | 10,617 | |
Other assets (b) (c) | | | | 24,297 | | | | 23,679 | | | | 24,559 | |
| | | | |
Noninterest-bearing deposits | | | 64,652 | | | | 69,980 | | | | 62,463 | | | | 66,708 | | | | 69,980 | | | | 64,476 | |
Interest-bearing deposits | | | 146,968 | | | | 143,162 | | | | 143,664 | | | | 145,571 | | | | 143,162 | | | | 142,447 | |
Total deposits | | | 211,620 | | | | 213,142 | | | | 206,127 | | | | 212,279 | | | | 213,142 | | | | 206,923 | |
Transaction deposits | | | 175,407 | | | | 176,705 | | | | 164,575 | | | | 175,564 | | | | 176,705 | | | | 166,043 | |
Borrowed funds (b) (c) | | | 37,647 | | | | 40,907 | | | | 42,539 | | | | 39,864 | | | | 40,907 | | | | 43,689 | |
Shareholders’ equity | | | 39,663 | | | | 39,003 | | | | 35,045 | | | | 40,286 | | | | 39,003 | | | | 37,005 | |
Common shareholders’ equity | | | 36,072 | | | | 35,413 | | | | 33,408 | | | | 36,347 | | | | 35,413 | | | | 33,884 | |
Accumulated other comprehensive income | | | 767 | | | | 834 | | | | 281 | | | | 45 | | | | 834 | | | | 402 | |
| | | | |
Book value per common share | | | 68.23 | | | | 67.05 | | | | 63.26 | | | $ | 68.46 | | | $ | 67.05 | | | $ | 64.00 | |
Common shares outstanding (millions) | | | 529 | | | | 528 | | | | 528 | | | | 531 | | | | 528 | | | | 529 | |
Loans to deposits | | | 88 | % | | | 87 | % | | | 85 | % | | | 89 | % | | | 87 | % | | | 87 | % |
| | | | |
Client Assets(billions) | | | | | | | | | | | | | | |
Discretionary assets under management | | $ | 118 | | | $ | 112 | | | $ | 112 | | | $ | 117 | | | $ | 112 | | | $ | 109 | |
Nondiscretionary assets under administration | | | 118 | | | | 112 | | | | 107 | | | | 116 | | | | 112 | | | | 105 | |
Total assets under administration | | | 236 | | | | 224 | | | | 219 | | | | 233 | | | | 224 | | | | 214 | |
Brokerage account assets | | | 39 | | | | 38 | | | | 37 | | | | 39 | | | | 38 | | | | 36 | |
Total client assets | | $ | 275 | | | $ | 262 | | | $ | 256 | | | $ | 272 | | | $ | 262 | | | $ | 250 | |
| | | | |
Capital Ratios | | | | | | | | | | | | | | |
Basel I ratios | | | | | | | | |
Basel I capital ratios | | | | | | | | |
Tier 1 common | | | 9.8 | % | | | 9.6 | % | | | 9.3 | % | | | 10.1 | % | | | 9.6 | % | | | 9.3 | % |
Tier 1 risk-based (e) | | | 11.6 | | | | 11.6 | | | | 11.4 | | | | 12.0 | | | | 11.6 | | | | 11.4 | |
Total risk-based (e) | | | 14.9 | | | | 14.7 | | | | 14.4 | | | | 15.2 | | | | 14.7 | | | | 14.2 | |
Leverage (e) | | | 10.4 | | | | 10.4 | | | | 10.5 | | | | 10.9 | | | | 10.4 | | | | 10.1 | |
| | | |
Common shareholders’ equity to assets | | | 12.0 | | | | 11.6 | | | | 11.3 | | | | 11.9 | | | | 11.6 | | | | 11.3 | |
| | | |
Pro forma Basel III Tier 1 common (f) | | | 8.0 | % | | | 7.5 | % | | | N/A | (g) | | | 8.2 | % | | | 7.5 | % | | | N/A | (g) |
| | | | |
Asset Quality | | | | | | | | | | | | | | |
Nonperforming loans to total loans | | | 1.83 | % | | | 1.75 | % | | | 2.03 | % | | | 1.75 | % | | | 1.75 | % | | | 1.92 | % |
Nonperforming assets to total loans, OREO and foreclosed assets | | | 2.10 | | | | 2.04 | | | | 2.46 | | | | 1.99 | | | | 2.04 | | | | 2.31 | |
Nonperforming assets to total assets | | | 1.31 | | | | 1.24 | | | | 1.47 | | | | 1.24 | | | | 1.24 | | | | 1.39 | |
Net charge-offs to average loans (for the three months ended) (annualized) (h) | | | .99 | | | | .67 | | | | .81 | | | | .44 | | | | .67 | | | | .71 | |
Allowance for loan and lease losses to total loans | | | 2.05 | | | | 2.17 | | | | 2.38 | | | | 1.99 | | | | 2.17 | | | | 2.30 | |
Allowance for loan and lease losses to nonperforming loans (i) | | | 112 | | | | 124 | | | | 117 | | | | 114 | % | | | 124 | % | | | 120 | % |
Accruing loans past due 90 days or more | | $ | 1,906 | | | $ | 2,351 | | | $ | 2,585 | | | $ | 1,762 | | | $ | 2,351 | | | $ | 2,483 | |
| (a) | The Executive Summary and Consolidated Balance Sheet Review portions of the Financial Review section of this Report provide information regarding items impacting the comparability of the periods presented. |
| (b) | Amounts include consolidated variable interest entities. See Consolidated Balance Sheet in Part I, Item 1 of this Report for additional information. |
| (c) | Amounts include assets and liabilities for which we have elected the fair value option. See Consolidated Balance Sheet in Part I, Item 1 of this Report for additional information. |
| (d) | Amounts include our equity interest in BlackRock. |
| (e) | The minimum U.S. regulatory capital ratios under Basel I are 4.0% for Tier 1 risk-based, 8.0% for Total risk-based, and 4.0% for Leverage. The comparable well-capitalized levels are 6.0% for Tier 1 risk-based, 10.0% for Total risk-based, and 5.0% for Leverage. |
| (f) | PNC’s pro forma Basel III Tier 1 common capital ratio was estimated without the benefit of phase-ins and is based on our current understanding of the prior Basel III proposed rules.rule proposals issued by the U.S. banking agencies in June 2012. See Table 21: Basel I Risk-Based Capital and Table 22: Estimated Pro forma Basel III Tier 1 Common Capital Ratio and related information for further detail on how this pro forma ratio differs from the Basel I Tier 1 common capital ratio. We expect theThe Basel III ratio towill replace the current Basel I ratio for this regulatory metric when the applicable rules are finalized and fully implemented and PNC exits the parallel run.run qualification phase. |
| (g) | Pro forma Basel III Tier 1 common capital ratio not disclosed in our firstsecond quarter 2012 Form 10-Q. |
| (h) | Pursuant to alignment with interagency guidance on practices for loans and lines of credit related to consumer lending in the first quarter of 2013, additional charge-offs of $134 million have beenwere taken. Excluding the impact of these additional charge-offs, annualized net charge-offs to average loans for the first quarter 2013 was 0.70%. |
| (i) | The allowance for loan and lease losses includes impairment reserves attributable to purchased impaired loans. Nonperforming loans exclude certain government insured or guaranteed loans, loans held for sale, loans accounted for under the fair value option and purchased impaired loans. |
2 The PNC Financial Services Group, Inc. –Form 10-Q
This Financial Review, including the Consolidated Financial Highlights, should be read together with our unaudited Consolidated Financial Statements and unaudited Statistical Information included elsewhere in this Report and with Items 6, 7, 8 and 9A of our 2012 Annual Report on Form 10-K (2012 Form 10-K). We have reclassified certain prior period amounts to conform with the current period presentation, which we believe is more meaningful to readers of our consolidated financial statements. For information regarding certain business, regulatory and legal risks, see the following sections as they appear in this Report and in our 2012 Form 10-K:10-K and our First Quarter 2013 Form 10-Q: the Risk Management And Recourse and Repurchase Obligation sections of the Financial Review portion of the respective report; Item 1A Risk Factors included in our 2012 Form 10-K; and the Legal Proceedings and Commitments and Guarantees Notes of the Notes To Consolidated Financial Statements included in the respective report. Also, see the Cautionary Statement Regarding Forward-Looking Information section in this Financial Review and the Critical Accounting Estimates And Judgments section in this Financial Review and in our 2012 Form 10-K for certain other factors that could cause actual results or future events to differ, perhaps materially, from historical performance and from those anticipated in the forward-looking statements included in this Report. See Note 19 Segment Reporting in the Notes To Consolidated Financial Statements included in Part I, Item 1 of this Report for a reconciliation of total business segment earnings to total PNC consolidated net income as reported on a GAAP basis.
EXECUTIVE SUMMARY
PNC is one of the largest diversified financial services companies in the United States and is headquartered in Pittsburgh, Pennsylvania.
PNC has businesses engaged in retail banking, corporate and institutional banking, asset management and residential mortgage banking, providing many of its products and services nationally, as well as other products and services in PNC’s primary geographic markets located in Pennsylvania, Ohio, New Jersey, Michigan, Illinois, Maryland, Indiana, North Carolina, Florida, Kentucky, Washington, D.C., Delaware, Alabama, Virginia, Georgia, Missouri, Wisconsin and South Carolina. PNC also provides certain products and services internationally.
KEY STRATEGIC GOALS
At PNC we manage our company for the long term. We are focused on the fundamentals of growing customers, loans, deposits and fee revenue and improving profitability, while investing for the future and managing risk and capital. We continue to invest in our products, markets and brand, and embrace our corporate responsibility to the communities where we do business.
We strive to expand and deepen customer relationships by offering convenient banking options and innovative technology solutions, providing a broad range of fee-based and credit products and services, focusing on customer service and enhancing our brand. Our approach is focused on organically growing and deepening client relationships that meet our risk/return measures. Our strategies for growing fee income across our lines of business will beare focused on achieving deeper market penetration and cross selling our diverse product mix. A key priority is to drive growth in newly acquired and underpenetrated markets, including in the Southeast. We may also grow revenue through appropriate and targeted acquisitions and, in certain businesses, by expanding into new geographical markets.
Our capital priorities for 2013 are to support client growth and business investment, maintain appropriate capital in light of economic uncertainty and the Basel III framework and return excess capital to shareholders through dividends, subjectin accordance with our capital plan included in our 2013 Comprehensive Capital Analysis and Review (CCAR) submission to regulatory approval.the Board of Governors of the Federal Reserve System (Federal Reserve). We continue to improve our capital levels and ratios through retention of quarterly earnings and expect to build capital through retainedretention of future earnings. During 2013, PNC does not expect to repurchase common stock through a share buyback program. PNC continues to maintain a strong bank and bank holding company liquidity position. For more detail, see the 2013 Capital and Liquidity Actions portion of this Executive Summary, the Funding and Capital Sources portion of the Consolidated Balance Sheet Review section and the Liquidity Risk Management section of this Financial Review and the Supervision and Regulation section in Item 1 Business of our 2012 Form 10-K.
PNC faces a variety of risks that may impact various aspects of our risk profile from time to time. The extent of such impacts may vary depending on factors such as the current economic, political and regulatory environment, merger and acquisition activity and operational challenges. Many of these risks and our risk management strategies are described in more detail in our 2012 Form 10-K and elsewhere in this Report.
RBC BANK (USA) ACQUISITION
On March 2, 2012, we acquired 100% of the issued and outstanding common stock of RBC Bank (USA), the U.S. retail banking subsidiary of Royal Bank of Canada. As part of the acquisition, PNC also purchased a credit card portfolio from RBC Bank (Georgia), National Association. PNC paid $3.6 billion in cash as the consideration for the acquisition of both RBC Bank (USA) and the credit card portfolio. The transaction added approximately $18.1 billion in deposits, $14.5 billion of loans, $1.0 billion of goodwill and $.2 billion of other intangible assets to PNC’s Consolidated Balance Sheet. Our Consolidated Income Statement includes the impact of business activity associated with the RBC Bank (USA) acquisition subsequent to March 2, 2012. See Note 2 Acquisition and Divestiture Activity in the Notes To Consolidated Financial Statements in this Report for additional information regarding this acquisition.
The PNC Financial Services Group, Inc. –Form 10-Q3
SALEOF SMARTSTREET
Effective October 26, 2012, PNC divested certain deposits and assets of the Smartstreet business unit, which was acquired by PNC as part of the RBC Bank (USA) acquisition, to Union Bank, N.A. Smartstreet is a nationwide business focused on homeowner or community association managers and had approximately $1 billion of assets and deposits as of September 30, 2012. The gain on sale was immaterial and resulted in a reduction of goodwill and core deposit intangibles of $46 million and $13 million, respectively.
2013 CAPITALAND LIQUIDITY ACTIONS
Our ability to take certain capital actions, including plans to pay or increase common stock dividends or to repurchase shares under current or future programs, is subject to the results of the supervisory assessment of capital adequacy undertaken by the Board of Governors of the Federal Reserve System (Federal Reserve) and our primary bank regulators as part of the Comprehensive Capital Analysis and Review (CCAR)CCAR process. This capital adequacy assessment is based on a review of a comprehensive capital plan submitted to the Federal Reserve.
In connection with the 2013 CCAR, PNC submitted its capital plan, approved by its board of directors, to the Federal Reserve and our primary bank regulators in January 2013. As
The PNC Financial Services Group, Inc. –Form 10-Q3
we announced on March 14, 2013, the Federal Reserve accepted the capital plan that we submitted for their review and did not object to our proposed capital actions, which included a recommendation to increase the quarterly common stock dividend in the second quarter of 2013. A share repurchase program for 2013 was not included in the capital plan primarily as a result of PNC’s 2012 acquisition of RBC Bank (USA) and expansion into Southeastern markets. For additional information concerning the CCAR process and the factors the Federal Reserve takes into consideration in evaluating capital plans, see Item 1 Business – Supervision and Regulation included in our 2012 Form 10-K.
See the Liquidity Risk Management portion of the Risk Management section of this Financial Review, as well as Note 20 Subsequent Events in the Notes To Consolidated Financial Statements in this Report, for more detail on our 2013 capital and liquidity actions.
On April 4, 2013, consistent with our capital plan submitted to the Federal Reserve in 2013, our board of directors approved an increase to PNC’s quarterly common stock dividend from 40 cents per common share to 44 cents per common share. Forshare with a payment date of May 5, 2013, payable the second quarter of 2013, the increased dividend was payablenext business day, to shareholders of record at the close of business on April 16, 2013. On July 3, 2013, and was paid on the next business day after theour board of directors declared a quarterly common stock cash dividend of 44 cents per share with a payment date of MayAugust 5, 2013 to shareholders of record at the close of business on July 15, 2013.
RECENT MARKETAND INDUSTRY DEVELOPMENTS
There have been numerous legislative and regulatory developments and dramatic changes in the competitive landscape of our industry over the last several years.
The United States and other governments have undertaken major reform of the regulation of the financial services industry, including engaging in new efforts to impose requirements designed to strengthen the stability of the financial system and protect consumers and investors. We expect to face further increased regulation of our industry as a result of current and future initiatives intended to provide economic stimulus, financial market stability and enhanced regulation of financial services companies and to enhance the liquidity and solvency of financial institutions and markets. We also expect in many cases more intense scrutiny from our bank supervisors in the examination process and more aggressive enforcement of regulations on both the federal and state levels. Compliance with new regulations will increase our costs and reduce our revenue. Some new regulations may limit our ability to pursue certain desirable business opportunities.
The Dodd-Frank Wall Street Reform and Consumer Protection Act (Dodd-Frank), enacted in July 2010, mandates the most wide-ranging overhaul of financial industry regulation in decades. Many parts of the law are now in effect,
and others are now in the implementation stage, which is likely to continue for several years.
New and evolving capital and liquidity standards will have a significant effect on banks and bank holding companies, including PNC. In July 2013, the U.S. banking agencies issued final rules to implement the Basel III capital framework in the United States. In addition, the banking agencies issued final rules to revise the framework for the risk-weighting of assets under Basel I and Basel II (referred to as the standardized approach and the advanced approaches, respectively). For banking organizations subject to Basel II (such as PNC), the Basel III final rules become effective on January 1, 2014, although many provisions are phased-in over a period of years, with the rules generally fully phased-in as of January 1, 2019. The changes made to the Basel I risk-weighting framework by the standardized approach rules become effective on January 1, 2015, and the changes made to the Basel II risk-weighting framework by the advanced approaches rules become effective on January 1, 2014.
The Basel III final rules, among other things, narrow the definition of regulatory capital, require banking organizations with $15 billion or more in assets to phase-out trust preferred securities from Tier 1 regulatory capital, establish a new Tier 1 common capital requirement for banking organizations and revise the capital levels at which a bank would be subject to prompt corrective action. As of June 30, 2013, PNC had $216 million of trust preferred securities included in Tier 1 capital which, under these rules and Dodd-Frank, will no longer qualify as Tier 1 capital over time to the extent they remain outstanding. The final rules also would require that significant common stock investments in unconsolidated financial institutions (as defined in the final rules), as well as mortgage servicing rights and deferred tax assets, be deducted from regulatory capital to the extent such items individually exceed 10%, or in the aggregate exceed 15%, of the organization’s adjusted Tier 1 common capital. The Basel III final rules also significantly limit the extent to which minority interests in consolidated subsidiaries (including minority interests in the form of REIT preferred securities) may be included in regulatory capital. As of June 30, 2013, PNC had approximately $1 billion of REIT preferred securities outstanding that will be providingsubject to these limitations over time to the extent they remain outstanding. In addition, for Basel II banking organizations, like PNC, the final rules remove the filter that currently excludes unrealized gains and losses (other than those resulting from other-than-temporary impairments) on available for sale debt securities from affecting regulatory capital, which could increase the volatility of regulatory capital of Basel II banking organizations in response to changes in interest rates.
When fully phased-in on January 1, 2019, the Basel III rules require that banking organizations maintain a minimum Tier 1 common ratio of 4.5%, a Tier 1 capital ratio of 6.0%, a total capital ratio of 8.0% and a leverage ratio of 4.0%. Moreover,
4 The PNC Financial Services Group, Inc. –Form 10-Q
the final rules, when fully phased-in, will also require banking organizations to maintain a Tier 1 common ratio of at least 7.0%, a Tier 1 capital ratio of at least 8.5%, and a total capital ratio of at least 10.5% to avoid limitations on capital distributions (including common stock dividends and share repurchases) and certain discretionary incentive compensation payments. For Basel II banking organizations (such as PNC), these higher buffer levels above the regulatory minimums could be supplemented by a countercyclical capital buffer of up to an additional 2.5% during periods of excessive credit growth, although this buffer is initially set at zero in the United States. After a Basel II banking organization exits its first market-risk related disclosures“parallel run” qualification phase under the final market riskBasel II framework, its compliance with these minimum and buffer ratio levels will be determined using the lower of the organization’s capital rules adopted byratios calculated under the Federalstandardized or the advanced approach. For additional information concerning PNC’s estimated fully phased-in pro forma Basel III Tier 1 common ratio as well as the Basel II “parallel run” process, please see Balance Sheet Highlights in this Executive Summary section, and Capital and Table 22: Estimated Pro Forma Basel III Tier 1 Common Capital in the Consolidated Balance Sheet Review section, of this Report.
Basel II banking organizations also are subject to a new minimum 3% supplementary leverage ratio that becomes effective on January 1, 2018, with public reporting of the ratio beginning in 2015. Unlike the existing leverage ratio, the denominator of the supplementary leverage ratio takes into account certain off-balance sheet items, including loan commitments and potential future exposure under derivative contracts. We estimate that our supplementary leverage ratio currently exceeds the new minimum ratio requirement applicable to PNC that goes into effect in 2018. In July 2013, the U.S. banking agencies in June 2012 (commonly referred to as “Basel II.5”) with respect to the quarter ended March 31, 2013. PNC is able to satisfy the requirement to make this disclosure through postings on its website, and PNC expects to do so without also providing disclosure of this information through filings with the SEC.
In April 2013, the Federal Reserveseparately requested comment on a proposed rule that would requireraise the supplemental leverage ratio for U.S. bank holding companies with $50that have $700 billion or more in total consolidated assets includingor $10 trillion or more in assets under custody and for the insured depository institution subsidiaries of these bank holding companies. Based on the asset and custody thresholds included in the proposed rule, PNC and systemically designated nonbank financial companiesPNC Bank, National Association would not be subject to this higher proposed supplemental leverage ratio.
As noted above, the final rules adopted by the U.S. banking agencies in July 2013 revise both the Basel I and Basel II risk-weighting framework. Both the standardized approach rules (which will replace the Basel I risk-weighting framework as of January 1, 2015) and the advanced approaches modifications to the Basel II risk-weighting framework replace the use of credit ratings with alternative methodologies for assessing creditworthiness and establish a new framework (referred to as the Simplified Supervisory Framework Approach) for risk-weighting securitization exposures (such as privately issued mortgage-backed securities and asset-backed securities). The standardized approach also would, among other things, increase the risk weight applicable to high volatility commercial real estate exposures and past due exposures,
establish a new framework for cleared derivatives and securities financing transactions, and require that equity exposures (other than those that are deducted from capital) be risk-weighted in a manner similar to the existing Basel II rules for equity exposures. In addition, Basel II banks that have not exited the parallel run qualification phase by the first quarter of 2015 are required to make certain public disclosures after that date under the standardized approach until the bank exits parallel run (after which it would make the public disclosures required by the advanced approaches rule). The advanced approaches rule would, among other things, significantly alter the methodology for determining counterparty credit risk weights, including the establishment of a credit valuation adjustment for counterparty risk in over-the-counter (OTC) derivative transactions, under Basel II.
The need to maintain more and higher quality capital could limit PNC’s business activities, including lending, and its ability to expand, either organically or through acquisitions. It could also result in PNC taking steps to increase its capital that may be dilutive to shareholders or being limited in its ability to pay beginningdividends or otherwise return capital to shareholders, or selling or refraining from acquiring assets, the capital requirements for which are inconsistent with the assets’ underlying risks. Moreover, although these new requirements are being phased in over time, U.S. federal banking agencies have been taking into account expectations regarding the ability of banks to meet these new requirements, including under stressed conditions, in approving actions that represent uses of capital, such as dividend increases, share repurchases and acquisitions.
On July 31, 2013, an annual assessmentthe United States District Court for the District of Columbia granted summary judgment to reimbursethe plaintiffs inNACS, et al. v. Board of Governors of the Federal Reserve System.The decision vacated the debit card interchange and network processing rules that went into effect in October 2011 and that were adopted by the Federal Reserve to implement provisions of the Dodd-Frank Act. The court found among other things that the debit card interchange fees permitted under the rules allowed card issuers to recover costs that were not permitted by the statute. The court has temporarily stayed its decision. We do not now know the ultimate impact of this ruling, nor the timing of any such impact, but if the ruling were to take effect it could have a materially adverse impact on our debit card interchange revenues. Debit card interchange revenue for the costs of supervising and regulating such companies. While the assessment formula remains subject to change until a final rule is adopted, PNC’s annual assessment would not be material based on the formula contained in the proposal.year ended December 31, 2012 was approximately $305 million.
For additional information concerning recent legislative and regulatory developments, including developments related to the implementation of the Basel III capital framework, as well as certain governmental, legislative and regulatory inquiries and investigations that may affect PNC, please see Item 1 Business – Supervision and Regulation, Item 1A Risk Factors and Note 23 Legal Proceedings in Item 8 of our 2012 Form 10-K and Note 17 Legal Proceedings and Note 18 Commitments and Guarantees in the Notes To Consolidated Financial Statements in Part I, Item 1 of this Report.
4The PNC Financial Services Group, Inc. –Form 10-Q5
KEY FACTORS AFFECTING FINANCIAL PERFORMANCE
Our financial performance is substantially affected by a number of external factors outside of our control, including the following:
General economic conditions, including the continuity, speed and stamina of the moderate U.S. economic recovery in general and on our customers in particular,
The level of, and direction, timing and magnitude of movement in, interest rates and the shape of the interest rate yield curve,
The functioning and other performance of, and availability of liquidity in, the capital and other financial markets,
Loan demand, utilization of credit commitments and standby letters of credit, and asset quality,
Customer demand for non-loan products and services,
Changes in the competitive and regulatory landscape and in counterparty creditworthiness and performance as the financial services industry restructures in the current environment,
The impact of the extensive reforms enacted in the Dodd-Frank legislation and other legislative, regulatory and administrative initiatives, including those outlined elsewhere in this Report, in our 2012 Form 10-K and in our other SEC filings, and
The impact of market credit spreads on asset valuations.
In addition, our success will depend upon, among other things:
Further success in growing profitability through the acquisition and retention of customers,
Continued development of the geographic markets related to our recent acquisitions, including full deployment of our product offerings into our Southeast markets,
Our ability to effectively manage PNC’s balance sheet and generate net interest income,
Revenue growth and our ability to provide innovative and valued products to our customers,
Our ability to utilize technology to develop and deliver products and services to our customers and protect PNC’s systems and customer information,
Our ability to manage and implement strategic business objectives within the changing regulatory environment,
A sustained focus on expense management,
Managing the non-strategic assets portfolio and impaired assets,
Improving our overall asset quality,
Continuing to maintain and grow our deposit base as a low-cost funding source,
Prudent risk and capital management related to our efforts to manage risk in keeping with a moderate risk philosophy,to acceptable levels and to meet evolving regulatory capital standards,
Actions we take within the capital and other financial markets,
The impact of legal and regulatory-related contingencies, and
The appropriateness of reserves needed for critical estimates and related contingencies.
For additional information, please see the Cautionary Statement Regarding Forward-Looking Information section in this Financial Review and Item 1A Risk Factors in our 2012 Form 10-K.
INCOME STATEMENT HIGHLIGHTS
Net income for the firstsecond quarter of 2013 of $1.0$1.1 billion increased 24%$.6 billion compared to the firstsecond quarter of 2012, driven by revenue growth of 6% and12%, a decline in noninterest expense of 2%, partially offset by an increase8% and a decrease in the provision for credit losses. For additional detail, please see the Consolidated Income Statement Review section in this Financial Review.
Net interest income of $2.4$2.3 billion for the firstsecond quarter of 2013 increased 4%decreased 11% compared with the firstsecond quarter of 2012, driven by organic loan growth andreflecting the full quarter impact of the RBC Bank (USA) acquisition.lower purchase accounting accretion and lower yields on loans and securities, partially offset by lower rates paid on borrowed funds.
Net interest margin decreased to 3.81%3.58% for the firstsecond quarter of 2013 compared to 3.90%4.08% for the firstsecond quarter of 2012 due to2012. Consistent with the decline in net interest income, the decrease in net interest margin reflected lower purchase accounting accretion.accretion and lower yields on loans and securities, partially offset by lower rates paid on borrowed funds.
Noninterest income of $1.6$1.8 billion for the firstsecond quarter of 2013 increased 9%by $.7 billion compared to the firstsecond quarter of 2012. The increase reflected higherwas attributable to lower provision for residential mortgage repurchase obligations, strong customer fee income from corporate services, consumer services and higher gains on asset management.sales and valuations.
The provision for credit losses increaseddecreased to $236$157 million for the firstsecond quarter of 2013 compared to $185$256 million for the firstsecond quarter of 2012. The increase in the comparison primarily reflected a larger loan portfolio.2012 driven by overall credit quality improvement.
Noninterest expense of $2.4 billion for the firstsecond quarter of 2013 decreased 2%8% compared with the firstsecond quarter of 2012, primarily driven bydue to lower noncash charges related to redemption of trust preferred securities, the impact of second quarter 2012 integration costs, partially offset by the impact in the first quarter 2013 of a full quarter of operating expense for the RBC Bank (USA) acquisition. The decline also reflected our continued commitment to disciplined expense management.and lower residential mortgage foreclosure-related expenses.
CREDIT QUALITY HIGHLIGHTS
Overall credit quality improved during the firstsecond quarter of 2013. While credit quality metrics for the first quarter of 2013The following comparisons to December 31, 2012 were impacted by alignment with interagency guidance underlying credit quality continued to improve. Alignment with interagency guidance on practices for loans and lines of credit related to consumer lending in the first quarter of 2013 had the overall effect of accelerating charge-offs and nonaccrual classification while reducing delinquencies.on
6The PNC Financial Services Group, Inc. –Form 10-Q5
| practices for loans and lines of credit related to consumer lending. This had the overall effect of (i) accelerating charge-offs, (ii) increasing nonperforming loans and (iii), in the case of loans accounted for under the fair value option, increasing nonaccrual loans. In addition, commercial real estate delinquencies declined due to improved performance. See the Credit Risk Management section of this Financial Review for further detail. |
Nonperforming assets of $3.9$3.8 billion at March 31,June 30, 2013 increased by $.1 billion, or 4%,remained relatively flat compared to December 31, 2012. The increase was mainly duecomparison includes the addition of $426 million of consumer loans to thenonperforming pursuant to alignment with interagency guidance for loans and lines of credit related to consumer loansthat occurred in the first quarter of $426 million. Commercial lending2013, substantially offset by a reduction in total commercial nonperforming loans decreased $115 million, or 8%, as a result of improvingdue to credit quality.quality improvement and lower consumer nonperforming loans largely due to principal activity. Nonperforming assets to total assets were 1.31%1.24% at March 31,both June 30, 2013 compared with 1.24% atand December 31, 2012 and 1.47%compared with 1.39% at March 31,June 30, 2012.
Overall delinquencies of $3.2$2.8 billion decreased $.6$.9 billion as of March 31,June 30, 2013 compared with December 31, 2012. The reduction was partially due to a decline was due in part tototal consumer loan delinquencies of $395 million forpursuant to alignment with interagency guidance. A substantial portionguidance in which loans were moved from various delinquency categories to either nonperforming or, in the case of this decrease was reflected inloans accounted for under the fair value option, nonaccruing. In addition, during the first six months of 2013, government insured residential real estate accruing loans past due 90 days or more.more declined $324 million, the majority of which were transferred to OREO. Finally, commercial real estate delinquencies decreased $84 million due to improved performance.
Net charge-offs of $456$208 million increased $123decreased $107 million compared to the firstsecond quarter of 2012. First quarter 2013 included2012, reflecting a decrease in home equity, commercial and commercial real estate net charge-offs of $134 million primarily related to home equity and residential real estate loans to align with interagency guidance.$97 million. On an annualized basis, net charge-offs were 0.99%0.44% of average loans for the second quarter of 2013 and 0.71% of average loans for the second quarter of 2012. Net charge-offs for the first six months were $664 million, up slightly compared to $648 million of net charge-offs for the first six months of 2012, due to the impact of alignment with interagency guidance in first quarter 2013, partially offset by improving credit quality in the second quarter of 2013. On an annualized basis, net charge-offs for the first half of 2013 were 0.71% of average loans and 0.76% of average loans for the first quarterhalf of 2013 and 0.81% of average loans for the first quarter of 2012. Excluding the impact of these $134 million additional charge-offs, annualized net charge-offs to average loans for the first quarter 2013 was 0.70%.
The allowance for loan and lease losses was 2.05%1.99% of total loans and 112%114% of nonperforming loans at March 31,June 30, 2013, compared with 2.17% and 124% at December 31, 2012, respectively. The decrease in the allowance compared with year end resulted from improved overall credit quality and the impact of alignment with interagency guidance.
| | allowance compared with year end resulted from improved overall credit quality and the impact of alignment with interagency guidance. |
BALANCE SHEET HIGHLIGHTS
Total loans increased by $.6$3.9 billion to $187$190 billion at March 31,June 30, 2013 compared to December 31, 2012.
Total commercial lending increased by $1.3$4.3 billion, or 1%4%, from December 31, 2012, as a result of growth in commercial loans primarily fromto new relationships.and existing customers.
Total consumer lending decreased $.7$.4 billion from December 31, 2012 primarily from pay downs of residential real estate, education and credit card loans, partially offset by increases in home equity and educationautomobile loans.
Total deposits decreased by $1.5$0.9 billion to $212 billion at March 31,June 30, 2013 compared with December 31, 2012.
Runoff of year-end seasonally higher transaction deposits resulted in a decrease of $1.3 billion to $175 billion at March 31, 2013 compared with December 31, 2012.
Average transaction deposits grew $3.1 billion to $173.2 billion in the first quarter of 2013 compared with average transaction deposits in the fourth quarter of 2012.
PNC’s well-positioned balance sheet remained core funded with a loans to deposits ratio of 88%89% at March 31,June 30, 2013.
PNC had a strong capital position at March 31,June 30, 2013.
The Basel I Tier 1 common capital ratio increased to 9.8%10.1% compared with 9.6% at December 31, 2012.
The estimated pro forma Basel III Tier 1 common capital ratio was 8.0%an estimated 8.2% at MarchJune 30, 2013 compared with 7.5% at December 31, 2013,2012 without benefit of phase-ins. See Table 22: Estimated Pro forma Basel III Tier 1 Common Capital in the Consolidated Balance Sheet Review section of this Financial Review for more detail.
| – | | PNC continues to evaluate the Basel III final rules adopted in July 2013. Pending completion of that evaluation this estimate is based on our understanding of the prior U.S. Basel III rule proposals issued in 2012. We do not believe the changes in the final rules from the proposals will negatively impact our common capital ratio. |
| – | | See the Capital discussion and Table 22: Estimated Pro forma Basel III Tier 1 Common Capital Ratio in the Consolidated Balance Sheet Review section of this Financial Review for more detail. |
In April 2013, the PNC board of directors raised the quarterly cash dividend on common stock to 44 cents per share, an increase of 4 cents per share, or 10 %,10%, effective with the May dividend.
Our Consolidated Income Statement and Consolidated Balance Sheet Review sections of this Financial Review describe in greater detail the various items that impacted our results for the first threesix months of 2013 and 2012 and balances at March 31,June 30, 2013 and December 31, 2012, respectively.
The PNC Financial Services Group, Inc. –Form 10-Q7
2012 ACQUISITIONAND DIVESTITURE ACTIVITY
On March 2, 2012, we acquired 100% of the issued and outstanding common stock of RBC Bank (USA), the U.S. retail banking subsidiary of Royal Bank of Canada. As part of the acquisition, PNC also purchased a credit card portfolio from RBC Bank (Georgia), National Association.
Effective October 26, 2012, PNC divested certain deposits and assets of the Smartstreet business unit, which was acquired by PNC as part of the RBC Bank (USA) acquisition, to Union Bank, N.A.
See Note 2 Acquisition and Divestiture Activity in the Notes To Consolidated Financial Statements in this Report for additional information regarding this 2012 acquisition and divestiture activity.
AVERAGE CONSOLIDATED BALANCE SHEET HIGHLIGHTS
Table 2: Summarized Average Balance Sheet
| Three months ended March 31 Dollars in millions | | 2013 | | | 2012 | | |
Six months ended June 30 Dollars in millions | | | 2013 | | | 2012 | |
Average assets | | | | | | | | | | |
Interest-earning assets | | | | | | | | | | |
Investment securities | | $ | 58,531 | | | $ | 61,583 | | | $ | 57,683 | | | $ | 61,469 | |
Loans | | | 186,099 | | | | 164,556 | | | | 187,359 | | | | 171,239 | |
Other | | | 11,550 | | | | 11,595 | | | | 11,099 | | | | 11,225 | |
Total interest-earning assets | | | 256,180 | | | | 237,734 | | | | 256,141 | | | | 243,933 | |
Other | | | 47,265 | | | | 43,808 | | | | 46,591 | | | | 44,914 | |
Total average assets | | $ | 303,445 | | | $ | 281,542 | | | $ | 302,732 | | | $ | 288,847 | |
Average liabilities and equity | | | | | | | | | | |
Interest-bearing liabilities | | | | | | | | | | |
Interest-bearing deposits | | $ | 144,801 | | | $ | 134,193 | | | $ | 145,014 | | | $ | 138,220 | |
Borrowed funds | | | 39,727 | | | | 40,212 | | | | 39,161 | | | | 41,668 | |
Total interest-bearing liabilities | | | 184,528 | | | | 174,405 | | | | 184,175 | | | | 179,888 | |
Noninterest-bearing deposits | | | 64,850 | | | | 57,900 | | | | 64,800 | | | | 59,189 | |
Other liabilities | | | 12,140 | | | | 11,426 | | | | 11,650 | | | | 11,023 | |
Equity | | | 41,927 | | | | 37,811 | | | | 42,107 | | | | 38,747 | |
Total average liabilities and equity | | $ | 303,445 | | | $ | 281,542 | | | $ | 302,732 | | | $ | 288,847 | |
Various seasonal and other factors impact our period-end balances, whereas average balances are generally more indicative of underlying business trends apart from the impact of acquisitions and divestitures. The Consolidated Balance Sheet Review section of this Financial Review provides
6 The PNC Financial Services Group, Inc. –Form 10-Q
information on changes in selected Consolidated Balance Sheet categories at March 31,June 30, 2013 compared with December 31, 2012.
Total average assets increased to $303.4$302.7 billion for the first quartersix months of 2013 compared with $281.5$288.8 billion for the first quartersix months of 2012, primarily due to an increase of $18.4$12.2 billion in average interest-earning assets driven by an increase in average total loans, including the full quarter impact of loans added in the RBC Bank (USA) acquisition, which closed March 2, 2012.
Total assets were $300.8$304.4 billion at March 31,June 30, 2013 compared with $305.1 billion at December 31, 2012.
Average total loans increased by $21.5$16.1 billion to $186.1$187.4 billion for the first quartersix months of 2013 compared with the first quartersix months of 2012, including increases in average commercial loans of $14.2$11.5 billion and average consumer loans of $4.3$3.0 billion. The overall increase in loans reflected organic loan growth, primarily in corporate banking and real estate,our Corporate & Institutional Banking segment, as well as the full quarter impact of loans added in the RBC Bank (USA) acquisition.
Loans represented 73% of average interest-earning assets for the first quartersix months of 2013 and 69%70% of average interest-earning assets for the first quartersix months of 2012.
Average investment securities decreased $3.1$3.8 billion to $58.5$57.7 billion in the first quartersix months of 2013 compared with the first quartersix months of 2012, primarily as a result of principal payments.payments, including prepayments and maturities, partially offset by net purchase activity. During the second quarter of 2013, we entered into certain transactions to purchase securities that will be delivered in the third and fourth quarters of 2013. Total investment securities comprised 23% of average interest-earning assets for the first quartersix months of 2013 and 26%25% for the first quartersix months of 2012.
Average noninterest-earning assets increased $3.5$1.7 billion to $47.3$46.6 billion in the first quartersix months of 2013 compared with the first quartersix months of 2012. The increase included the impact of higher adjustments for net unrealized gains on securities, which are included in noninterest-earningsnoninterest-earning assets for average balance sheet purposes, the six month impact of the RBC Bank (USA) acquisition, including goodwill, and an increase in equity investments. These increases were partially offset by decreased unsettled securities sales, which are included in noninterest-earning assets for average balance sheet purposes.
Average total deposits were $209.7$209.8 billion for the first quartersix months of 2013 compared with $192.1$197.4 billion for the first quartersix months of 2012. The increase of $17.6$12.4 billion primarily resulted from an increase of $17.4 billion in average transaction deposits which grew to $173.6 billion for the first six months of $22.62013 compared with $156.2 billion partially offset by a decreasefor the first six months of $5.5 billion in average retail
certificates of deposit attributable to runoff of maturing accounts.2012. Growth in average money market deposits, average interest-bearing demand deposits, average noninterest-bearing deposits and average noninterest-bearingmoney market deposits drove the increase in average transaction deposits, which resulted from deposits added inthe six month impact of the RBC Bank (USA) acquisitionacquired deposits and organic growth. Average transaction depositsThese increases were $173.2partially offset by a decrease of $5.1 billion for the first quarterin average retail certificates of 2013 compared with $150.7 billion for the first quarterdeposit attributable to runoff of 2012.maturing accounts. Total deposits at March 31,June 30, 2013 were $211.6$212.3 billion compared with $213.1 billion at December 31, 2012 and are further discussed within the Consolidated Balance Sheet Review section of this Financial Review.
Average total deposits represented 69% of average total assets for the first quartersix months of 2013 and 68% for the first quartersix months of 2012.
8 The PNC Financial Services Group, Inc. –Form 10-Q
Average borrowed funds remained relatively flat with a balance of $39.7decreased by $2.5 billion to $39.2 billion for the first quartersix months of 2013 compared with $40.2 billion for the first quartersix months of 2012. Lower average Federal Home Loan Bank (FHLB) borrowings and net redemptions and maturities of subordinated debt and bank notes and senior debt, were mostlypartially offset by an increase in average commercial paper. Total borrowed funds at March 31,June 30, 2013 were $37.6$39.9 billion compared with $40.9 billion at December 31, 2012 and are further discussed within the Consolidated Balance Sheet Review section of this Financial Review. The Liquidity Risk Management portion of the Risk Management section of this Financial Review includes additional information regarding our sources and uses of borrowed funds.
BUSINESS SEGMENT HIGHLIGHTS
Total business segment earnings were $936 million$1.9 billion for the first threesix months of 2013 and $900 million$1.6 billion for the first threesix months of 2012. Highlights of results for the first quarterssix months and the second quarter of 2013 and 2012 are included below. The Business Segments Review section of this Financial Review includes further analysis of our business segment results over the first threesix months of 2013 and 2012, including presentation differences from Note 19 Segment Reporting in our Notes To Consolidated Financial Statements in Part I, Item 1 of this Report.
We provide a reconciliation of total business segment earnings to PNC total consolidated net income as reported on a GAAP basis in Note 19 Segment Reporting in our Notes To Consolidated Financial Statements of this Report.
The PNC Financial Services Group, Inc. –Form 10-Q7
Table 3: Results Of Businesses – Summary
(Unaudited)
| | | | Net Income | | Revenue | | | Average Assets (a) | | | Net Income | | Revenue | | | Average Assets (a) | |
| Three months ended March 31 – in millions | | 2013 | | | 2012 | | 2013 | | | 2012 | | | 2013 | | | 2012 | | |
| Six months ended June 30-in millions | | | 2013 | | | 2012 | | 2013 | | | 2012 | | | 2013 | | | 2012 | |
Retail Banking | | $ | 120 | | | $ | 147 | | | $ | 1,483 | | | $ | 1,436 | | | $ | 74,116 | | | $ | 69,709 | | | $ | 278 | | | $ | 283 | | | $ | 3,037 | | | $ | 2,987 | | | $ | 74,317 | | | $ | 71,420 | |
Corporate & Institutional Banking | | | 541 | | | | 495 | | | | 1,341 | | | | 1,266 | | | | 111,671 | | | | 92,896 | | | | 1,153 | | | | 1,072 | | | | 2,761 | | | | 2,705 | | | | 111,941 | | | | 97,866 | |
Asset Management Group | | | 43 | | | | 36 | | | | 255 | | | | 243 | | | | 7,131 | | | | 6,566 | | | | 79 | | | | 74 | | | | 509 | | | | 483 | | | | 7,210 | | | | 6,613 | |
Residential Mortgage Banking | | | 45 | | | | 61 | | | | 291 | | | | 293 | | | | 10,803 | | | | 11,989 | | | | 65 | | | | (152 | ) | | | 519 | | | | 184 | | | | 10,604 | | | | 11,745 | |
BlackRock | | | 108 | | | | 90 | | | | 138 | | | | 116 | | | | 5,859 | | | | 5,565 | | | | 220 | | | | 178 | | | | 287 | | | | 227 | | | | 5,982 | | | | 5,597 | |
Non-Strategic Assets Portfolio | | | 79 | | | | 71 | | | | 219 | | | | 198 | | | | 10,735 | | | | 12,124 | | | | 139 | | | | 138 | | | | 394 | | | | 421 | | | | 10,511 | | | | 12,407 | |
Total business segments | | | 936 | | | | 900 | | | | 3,727 | | | | 3,552 | | | | 220,315 | | | | 198,849 | | | | 1,934 | | | | 1,593 | | | | 7,507 | | | | 7,007 | | | | 220,565 | | | | 205,648 | |
Other (b) (c) | | | 68 | | | | (89 | ) | | | 228 | | | | 180 | | | | 83,130 | | | | 82,693 | | | | 193 | | | | (236 | ) | | | 512 | | | | 348 | | | | 82,167 | | | | 83,199 | |
Total | | $ | 1,004 | | | $ | 811 | | | $ | 3,955 | | | $ | 3,732 | | | $ | 303,445 | | | $ | 281,542 | | | $ | 2,127 | | | $ | 1,357 | | | $ | 8,019 | | | $ | 7,355 | | | $ | 302,732 | | | $ | 288,847 | |
| (a) | Period-end balances for BlackRock. |
| (b) | “Other” average assets include securities available for sale associated with asset and liability management activities. |
| (c) | “Other” includes differences between the total business segment financial results and our total consolidated net income. Additional detail is included in the Business Segments Review section of this Financial Review and in Note 19 Segment Reporting in the Notes toTo Consolidated Financial Statements in this Report. |
Retail Banking
Retail Banking earned $120$278 million in the first threesix months of 2013 compared with $147$283 million for the same period a year ago. Earnings were essentially flat compared to a year ago as higher noninterest income was offset by lower net interest income and higher noninterest expense. Retail Banking’s core strategy is to efficiently grow customers by providing an experience that builds customer loyalty and expands loan, investment product, and money management share of wallet. Net checking relationships grew 114,000 in the first six months of 2013. The decreasegrowth reflects strong results and gains in all of our markets, as well as strong customer retention in the overall network.
In the second quarter of 2013, Retail Banking earned $158 million compared with earnings of $136 million for the second quarter of 2012. The increase in earnings resulted fromwas primarily due to the gain on sale of 2 million Visa Class B common shares, higher noninterest expense andfee income, lower provision for credit losses both attributableand lower additions to the full quarter impact of the RBC Bank (USA) acquisition. Noninterest income was also higher compared with the first quarter of 2012 primarily due to increased debit and credit card transactions, brokerage activity and the RBC Bank (USA) acquisition.legal reserves. These increases were partially offset by a decline in net interest income.
Corporate & Institutional Banking
Corporate & Institutional Banking earned $1.2 billion in the first six months of 2013 as compared with $1.1 billion in the first six months of 2012. The increase in earnings was primarily due to an increase in noninterest income and improved credit quality, partially offset by lower net interest income. We continued to focus on building client relationships, including increasing cross sales and adding new clients where the risk-return profile was attractive.
In the firstsecond quarter of 2013, Corporate & Institutional Banking earned $541$612 million compared with $495earnings of $577 million in the firstsecond quarter of 2012. Earnings increased for the first quarter of 2013 primarily due to the full quarter impact of the RBC Bank (USA) acquisition and organic growth. The increase in revenue in the comparison reflected higher noninterest income and a benefit on the provision for credit losses, which were partially offset by a decrease in net interest income from higher average loans and deposits, as well as growth in corporate service fees primarily due to higher commercial mortgage servicing revenue. The increase in noninterest expense reflected a full quarter impact of the RBC Bank (USA) acquisition.income.
Asset Management Group
Asset Management Group earned $43$79 million inthrough the first threesix months of 2013 compared with $36$74 million in the first three monthssame period of 2012. Assets under administration reached a record high for Asset Management Group of $236 billion as of March 31, 2013 and were $219 billion as of March 31, 2012. Revenue increased $12 million, or 5%,The increase in the year over year comparisonearnings was due to stronger average equity markets and increased sales volume. higher
The PNC Financial Services Group, Inc. –Form 10-Q9
revenue increase wasof $26 million partially offset by higher noninterest expense. Assets under administration were $233 billion as of June 30, 2013 compared to $214 billion as of June 30, 2012. The core growth strategies for the business continue to include: investing in higher growth geographies, increasing internal referral sales and adding new front line sales staff.
In the second quarter of 2013, Asset Management Group earned $36 million compared with $38 million in the second quarter of 2012. The decrease is primarily due to an increase in noninterest expense from strategic business investments.investments and an increase in the provision for credit losses.
Residential Mortgage Banking
Residential Mortgage Banking reported net incomeearnings of $45$65 million in the first threesix months of 2013 compared with $61losses of $152 million in the first threesix months of 2012. Earnings declinedincreased from the prior year six month period primarily as a result of higher provision for credit losses. Noninterest income was stable in the comparison, as decreases in net hedging gains on mortgage servicing rights and servicing fees were offset by increased loan sales revenue and lowerdecreased provision for residential mortgage repurchase obligations. The increase
In the second quarter of 2013, Residential Mortgage Banking reported earnings of $20 million compared with a loss of $213 million in the second quarter of 2012 due to noninterest expense from higher loan origination volume was more than offset by lowera decrease in provision for residential mortgage foreclosure-related expenserepurchase obligations and legala decrease in the noninterest expense.
BlackRock
Our BlackRock business segment earned $108$220 million in the first threesix months of 2013 and $90$178 million in the first threesix months of 2012. The higherIn the second quarter of 2013, business segment earnings from BlackRock forwere $112 million compared with $88 million in the firstsecond quarter of 2013 compared to the first quarter of 2012 was primarily due to PNC’s higher equity earnings from BlackRock.2012.
Non-Strategic Assets Portfolio
This business segment consists primarily of acquired non-strategic assets. Non-Strategic Assets Portfolio had earnings of $139 million for the first six months of 2013 compared with $138 million in the first six months of 2012. Earnings were relatively flat year-over-year as higher noninterest income and lower noninterest expense were offset by lower net interest income and a higher provision for credit losses.
In the firstsecond quarter of 2013, Non-Strategic Assets Portfolio had earnings of $79$60 million compared with $71$67 million for the firstsecond quarter of 2012, primarily attributable2012. The decrease was due to higher noninteresta decrease in net interest income partially offset by higher provision for credit losses. The increase in noninterest income reflected a lower provision for estimated losses on home equity repurchase obligations. The increase in provision for credit losses in the comparison was driven by reductions in expected cash flows on purchased impaired home equity loans.lower purchase accounting accretion and lower loan balances.
Other
“Other” reported earnings of $68$193 million for the threesix months of 2013 compared with a loss of $89$236 million for the first threesix months of 2012. IncreasedIn the second quarter of 2013, “Other” reported earnings forof $125 million compared with a loss of $147 million in the 2013 period was primarily due to lower integration costs.second quarter of 2012.
810 The PNC Financial Services Group, Inc. –Form 10-Q
CONSOLIDATED INCOME STATEMENT REVIEW
Our Consolidated Income Statement is presented in Part I, Item 1 of this Report.
Net income for the first threesix months of 2013 was $1.0$2.1 billion, an increase of 24% compared with $.8net income of $1.4 billion for the first threesix months of 2012. The increase in year-over-year net income was driven by revenue growth of 6% and9%, a decline in noninterest expense of 2%, partially offset by an increase5% and a decrease in the provision for credit losses. Revenue growth inHigher revenue for the comparisonfirst six months of 2013 reflected lower provision for residential mortgage repurchase obligations, strong customer fee income and higher gains on asset sales and valuations and was drivenpartially offset by higherlower net interest income.
Net income higher corporate and consumer services fees and higher asset management revenue.for the second quarter of 2013 was $1.1 billion compared with $.5 billion for the second quarter of 2012. The increase in net income was due to revenue growth of 12%, a decline in noninterest expense of 8% and a decrease in provision for credit losses. Higher revenue for the comparisonsecond quarter of 2013 reflected lower integration costsprovision for residential mortgage repurchase obligations, strong customer fee income and continued commitment to disciplined expense management,higher gains on asset sales and valuations, partially offset by the impact of a full quarter of operating expense for the RBC Bank (USA) acquisition.lower net interest income.
NET INTEREST INCOME
Table 4: Net Interest Income and Net Interest Margin
| | | | Three months ended
March 31 | | | Six months ended June 30 | | | Three months ended June 30 | |
| Dollars in millions | | 2013 | | | 2012 | | | 2013 | | | 2012 | | | 2013 | | | 2012 | |
Net interest income | | $ | 2,389 | | | $ | 2,291 | | | $ | 4,647 | | | $ | 4,817 | | | $ | 2,258 | | | $ | 2,526 | |
Net interest margin | | | 3.81 | % | | | 3.90 | % | | | 3.69 | % | | | 3.99 | % | | | 3.58 | % | | | 4.08 | % |
Changes in net interest income and margin result from the interaction of the volume and composition of interest-earning assets and related yields, interest-bearing liabilities and related rates paid, and noninterest-bearing sources of funding. See the Statistical Information (Unaudited) – Average Consolidated Balance Sheet And Net Interest Analysis section of this Report and the discussion of purchase accounting accretion of purchased impaired loans in the Consolidated Balance Sheet review of this Report for additional information.
Net interest income increaseddecreased by $98$170 million, or 4%, in the first half of 2013 compared with the first half of 2012. Net interest income decreased by $268 million, or 11%, in the
second quarter of 2013 compared with the firstsecond quarter of 2012, driven2012. The decline in both comparisons reflected lower purchase accounting accretion, the impact of lower yields on loans and securities, as well as the impact of lower securities balances during the quarter as a result of portfolio management activities. The impact of the decline in earning asset yields and lower security balances was partially offset by organicincreases in loan balances, reflecting commercial and consumer loan growth over the period, and lower rates paid on borrowed funds. The six months period comparison was also impacted by the full quarter impact of theMarch 2012 RBC Bank (USA) acquisition.
The declineDuring the second quarter of 2013, we entered into transactions to purchase securities that will be delivered in the third and fourth quarters of 2013. As a result, we expect interest income from securities to improve in the third quarter versus second quarter.
The declines in net interest margin for both the first six months and second quarter of 2013 compared with the first quarter of 2012 was due toperiods reflected lower purchase accounting accretion.accretion and lower yields on earning assets.
Net interest marginThe decrease for the first quartersix months of 2013 also reflectedincluded a 2643 basis point decrease in the yield on total interest-earning assets, partially offset by a decrease in the weighted-average rate accrued on total interest-bearing liabilities of 2217 basis points. In the second quarter comparison, the yield on total interest-earning assets decreased 60 basis points, partially offset by a decrease in the weighted-average rate accrued on total interest-bearing liabilities of 12 basis points.
The decreasedecreases in the yield on interest-earning assets was
were primarily due to lower rates on new loans and purchased securities in the ongoing low rate environment. The decreasedecreases in the rate accrued on interest-bearing liabilities waswere primarily due to net redemptions and maturities of bank notes and senior debt and subordinated debt, including the redemption of trust preferred and hybrid capital securities, and the runoff of maturing retail certificates of deposit during 2012.securities.
With respect to the secondthird quarter of 2013, we expect net interest income to be modestly lower as we expect the continuing impact of lower loan and security yields and a decline in purchase accounting accretion to be partially offset by two to three percent compared to first quarter 2013 net interest income.loan growth and the impact of our securities portfolio management activities.
For the full year 2013, we expect net interest income to decrease compared with 2012, assuming an expected decline in the purchase accounting accretion component of net interest income of approximately $350 million.
The PNC Financial Services Group, Inc. –Form 10-Q11
NONINTEREST INCOME
Table 5: Noninterest Income
| Three months ended March 31 Dollars in millions | | 2013 | | | 2012 | | |
| | | | Six months ended June 30 | | Three months ended June 30 | |
| Dollars in millions | | | 2013 | | 2012 | | 2013 | | 2012 | |
Noninterest income | | | | | | | | | | | | | | |
Asset management | | $ | 308 | | | $ | 284 | | | $ | 648 | | | $ | 562 | | | $ | 340 | | | $ | 278 | |
Consumer services | | | 296 | | | | 264 | | | | 610 | | | | 554 | | | | 314 | | | | 290 | |
Corporate services | | | 277 | | | | 232 | | | | 603 | | | | 522 | | | | 326 | | | | 290 | |
Residential mortgage | | | 234 | | | | 230 | | | | 401 | | | | 57 | | | | 167 | | | | (173 | ) |
Service charges on deposits | | | 136 | | | | 127 | | | | 283 | | | | 271 | | | | 147 | | | | 144 | |
Net gains on sales of securities | | | 14 | | | | 57 | | | | 75 | | | | 119 | | | | 61 | | | | 62 | |
Net other-than-temporary impairments | | | (10 | ) | | | (38 | ) | | | (14 | ) | | | (72 | ) | | | (4 | ) | | | (34 | ) |
Other | | | 311 | | | | 285 | | | | 766 | | | | 525 | | | | 455 | | | | 240 | |
Total noninterest income | | $ | 1,566 | | | $ | 1,441 | | | $ | 3,372 | | | $ | 2,538 | | | $ | 1,806 | | | $ | 1,097 | |
Noninterest income increased by $125$834 million, or 9%33%, during the first three monthshalf of 2013 compared to the first three monthshalf of 2012. The overall increase reflected higherNoninterest income for the second quarter increased by $709 million, or 65%, compared to the second quarter of 2012. Both increases were driven by lower provision for residential mortgage repurchase obligations in the 2013 periods, strong customer fee income from corporate services, consumer services and higher gains on asset management.sales and valuations.
Asset management revenue, including BlackRock, increased $24$86 million, or 15% in the first threesix months of 2013 to $308 million compared with $284 million into the first threesix months of 2012. The comparison included an increase wasof $62 million, or 22%, in the second quarter compared to the prior year quarter. Both increases were due to stronger equity markets, growth in customers and higher earnings from our BlackRock investment.investment, stronger equity markets and growth in customers. Discretionary assets under management increased to $118$117 billion at March 31,June 30, 2013 compared with $112$109 billion at March 31,June 30, 2012 driven by higherstronger average equity markets strong sales performance and successful client retention.positive net flows.
Consumer service fees were $296 million for the first three months of 2013, which reflected an increase of $32 million, or 12%, compared with $264increased $56 million in the first threesix months of 2013 compared to the first six months of 2012 dueand increased $24 million in the second quarter of 2013 compared to the second quarter of 2012. Both increases reflected growth in customersdebit card, brokerage, credit card and transaction volume.
merchant services revenue. The PNC Financial Services Group, Inc. –Form 10-Q9six month comparison was also impacted by the March 2012 RBC Bank (USA) acquisition.
Corporate services revenue increased by $45 million, or 19%, in the first quarter of 2013 to $277 million compared to $232$603 million in the first six months of 2013 compared with $522 million in the first six months of 2012, including $326 million in the second quarter of 2012, primarily as a result2013 compared with $290 million in the second quarter of higher2012. Corporate services revenue for the first six months of 2013 included $55 million related to valuation gains from the impact of rising interest rates on commercial
mortgage servicing rights valuations, including $44 million in the second quarter. These amounts contributed to increases in commercial mortgage servicing revenue.revenue, as the comparable amounts for the 2012 periods were not significant. In addition, the increase in the six months comparison also reflected higher treasury management fees. The increases in both comparisons were partially offset by lower merger and acquisition advisory fees.
Residential mortgage revenue increased to $234$401 million in the first threesix months of 2013 from $230compared with $57 million in the first threesix months of 2012, which includes2012. The second quarter comparables were revenue of $167 million in the impactsecond quarter of 2013 and a loss of $173 million for the decline insecond quarter of 2012. Residential mortgage revenue for the first six months of 2013 included provision for residential mortgage repurchase obligations of $77 million compared to $4$470 million infor the first three months of 2013, compared to $32 million in the first threesix months of 2012. ExcludingThe comparable amounts for the second quarters of 2013 and 2012 were $73 million and $438 million, respectively. See the Recourse and Repurchase Obligations section of this provision impact,Financial Review for further detail. These increases to both 2013 periods in residential mortgage revenue decreasedwere partially offset by $24 million due to the impact of lower net hedging gains on mortgage servicing rights, which was partially offset by higher loan sales revenue.rights.
Service charges on deposits grew to $136Other noninterest income totaled $766 million for the first quarter of 2013 from $127 million for the first quarter of 2012. The increase reflected customer growth, including the RBC Bank (USA) acquisition.
Other noninterest income increased by $26 million, or 9%, to $311 million for the first threesix months of 2013 compared with $285$525 million for the first threesix months of 2012. Other noninterest income totaled $455 million for the second quarter of 2013 and $240 million for the second quarter of 2012. The increases in both 2013 periods included the $83 million gain on the sale of 2 million Visa Class B common shares during the second quarter of 2013. Other noninterest income for the first six months of 2013 also included $41 million of revenue from credit valuations related to customer-initiated hedging activities as higher market interest rates reduced the fair value of PNC’s credit exposure on these activities. The comparable amount for the first six months of 2012 which was primarily attributablea loss of $28 million. The impacts to the second quarters of 2013 and 2012 were revenue of $39 million and a loss of $35 million, respectively. In addition, the increase in other noninterest income in the year-to-date comparison also reflected higher revenue associated with commercial mortgage banking activity.
We continue to hold approximately 12 million Visa Class B common shares with an estimated fair value of approximately $950 million and recorded investment of approximately $204 million as of June 30, 2013.
Other noninterest income typically fluctuates from period to period depending on the nature and magnitude of transactions completed. Further details regarding our trading activities are included in the Market Risk Management – Trading Risk portion of the Risk Management section of this Financial Review. Further details regarding private and other equity investments are included in the Market Risk Management – Equity And Other Investment Risk section, and further details
12 The PNC Financial Services Group, Inc. –Form 10-Q
regarding gains or losses related to our equity investment in BlackRock are included in the Business Segments Review section.
For 2013, we continue to expect both full year 2013 noninterest income and total revenue to increase compared with 2012.
PROVISION FFOROR CREDIT LOSSES
The provision for credit losses totaled $236$393 million for the first three monthshalf of 2013 compared with $185$441 million for the first three monthshalf of 2012. The increaseprovision for credit losses was $157 million for the second quarter of 2013 compared with $256 million for the second quarter of 2012. The declines in the comparisoncomparisons were driven primarily reflected a larger loan portfolio.by overall commercial credit quality improvement.
We currently expect our provision for credit losses infor the secondthird quarter of 2013 to be between $200$170 million and $300 million.$250 million as we expect the pace of commercial credit improvement to ease and net credit exposure to increase.
The Credit Risk Management portion of the Risk Management section of this Financial Review includes additional information regarding factors impacting the provision for credit losses.
NONINTEREST EXPENSE
Noninterest expense was $2.4$4.8 billion for the first three monthshalf of 2013, and $2.5a decrease of $.3 billion, or 5%, from $5.1 billion for the first three monthshalf of 2012. The decline in the comparison reflected residential mortgage foreclosure-related expenses of $15 million for the first three months of 2013, while noninterestNoninterest expense for the first threesix months of 2013 included $30 million of noncash charges related to redemption of trust preferred securities and $18 million of residential mortgage foreclosure-related expenses. The first half of 2012 included $197 million of integration costs, noncash charges of $145$130 million related to redemption of trust preferred securities and $81 million of residential mortgage foreclosure-related expenses of $38 million.expenses. These declinesdecreases to noninterest expense were partially offset by the impact in the first quarter 2013 of a full quarter ofhigher operating expense for the RBC Bank (USA) acquisition.acquisition during the first half of 2013 compared to the first six months of 2012.
Noninterest expense decreased $.2 billion, or 8%, to $2.4 billion for the second quarter of 2013 compared with $2.6 billion for the second quarter of 2012. The second quarter of 2013 included $30 million of noncash charges related to redemption of trust preferred securities, while the second quarter of 2012 included $130 million of noncash charges related to redemption of trust preferred securities, $52 million of integration costs and $43 million of residential mortgage foreclosure-related expenses. The impact of residential mortgage foreclosure-related expenses in second quarter 2013 was not significant.
The decline in noninterest expense in the comparison also reflected our continued commitment to disciplined expense management, and we currently expect to achieveexceed our $700 million continuous improvement savings goal for 2013. Through the endfirst half of the first quarter,year, we have captured approximately $500$600 million of annualized savings. Cost savings are expected to offset investments we are making in our businesses and infrastructure.
For the secondthird quarter of 2013, we currently expect noninterest expenses to be twomodestly up compared to three percent higher than the firstsecond quarter of 2013.
We continue to expect noninterest expense for 2013 to decline by mid-single digits on a percentage basisat least five percent compared with 2012. We expect noninterest expense, excluding integration costs and trust preferred securities redemption related charges, to be flat to down in 2013 versus 2012.
EFFECTIVE INCOME TAX RATE
The effective income tax rate was 24.2%23.9% in the first threesix months of 2013 compared with 25.7%25.1% in the first threesix months of 2012. For the second quarter of 2013, our effective income tax rate was 23.7% compared with 24.1% for the second quarter of 2012. The effective tax rate is generally lower than the statutory rate primarily due to increased tax credits PNC receives from our investments in low income housing and new markets investments, as well as increased earnings in other tax exempt investments.
The lowerdecrease in the effective income tax rate infor the second quarter and the first quartersix months of 2013 compared to the prior year quarter was primarily attributable to the impact of higher tax-exempt income2012 periods resulted from increased tax exempt investments and tax credits,benefits from tax audit settlements, partially offset by higher levels of pretax income.
10The PNC Financial Services Group, Inc. –Form 10-Q13
CCONSOLIDATED BALANCE SHEET REVIEW
Table 6: Summarized Balance Sheet Data
| | In millions | | March 31
2013 | | December 31
2012 | | | June 30
2013 | | December 31
2012 | |
Assets | | | | | | | | | | |
Loans held for sale | | $ | 3,295 | | | $ | 3,693 | | | $ | 3,814 | | | $ | 3,693 | |
Investment securities | | | 59,361 | | | | 61,406 | | | | 57,449 | | | | 61,406 | |
Loans | | | 186,504 | | | | 185,856 | | | | 189,775 | | | | 185,856 | |
Allowance for loan and lease losses | | | (3,828 | ) | | | (4,036 | ) | | | (3,772 | ) | | | (4,036 | ) |
Goodwill | | | 9,075 | | | | 9,072 | | | | 9,075 | | | | 9,072 | |
Other intangible assets | | | 1,921 | | | | 1,797 | | | | 2,153 | | | | 1,797 | |
Other, net | | | 44,484 | | | | 47,319 | | | | 45,921 | | | | 47,319 | |
Total assets | | $ | 300,812 | | | $ | 305,107 | | | $ | 304,415 | | | $ | 305,107 | |
Liabilities | | | | | | | | | | |
Deposits | | $ | 211,620 | | | $ | 213,142 | | | $ | 212,279 | | | $ | 213,142 | |
Borrowed funds | | | 37,647 | | | | 40,907 | | | | 39,864 | | | | 40,907 | |
Other | | | 9,467 | | | | 9,293 | | | | 10,331 | | | | 9,293 | |
Total liabilities | | | 258,734 | | | | 263,342 | | | | 262,474 | | | | 263,342 | |
Equity | | | | | | | | | | |
Total shareholders’ equity | | | 39,663 | | | | 39,003 | | | | 40,286 | | | | 39,003 | |
Noncontrolling interests | | | 2,415 | | | | 2,762 | | | | 1,655 | | | | 2,762 | |
Total equity | | | 42,078 | | | | 41,765 | | | | 41,941 | | | | 41,765 | |
Total liabilities and equity | | $ | 300,812 | | | $ | 305,107 | | | $ | 304,415 | | | $ | 305,107 | |
The summarized balance sheet data above is based upon our Consolidated Balance Sheet in this Report.
The decrease in totalTotal assets of $4.3 billiondecreased $692 million, or less than 1%, at March 31,June 30, 2013 compared with December 31, 2012 was primarily due to lower interest-earning deposits with banks (which is included in Other, net2012. Total liabilities declined $868 million, or less than 1%, in the preceding table) and investment securities. The decline in investment securities was primarily due to principal payments. The decline in interest-earning deposits with banks was primarily driven by the impact of decreased borrowed funds and decreased deposits, partially offset by the impact of decreased investment securities. Total liabilities decreased $4.6 billion at March 31, 2013 compared with December 31, 2012 primarily due to the runoff of year end seasonally higher deposits and lower FHLB borrowings.
same comparison. An analysis of changes in selected balance sheet categories follows.
LOANS
A summary of the major categories of loans outstanding follows. Outstanding loan balances of $186.5$189.8 billion at March 31,June 30, 2013 and $185.9 billion at December 31, 2012 were net of unearned income, net deferred loan fees, unamortized discounts and premiums, and purchase discounts and premiums of $2.5$2.3 billion at March 31,June 30, 2013 and $2.7 billion at December 31, 2012, respectively. The balances
include purchased impaired loans but do not include future accretable net interest (i.e., the difference between the undiscounted expected cash flows and the carrying value of the loan) on those loans.
Table 7: Details Of Loans
| | In millions | | March 31
2013 | | | December 31
2012 | | | June 30
2013 | | | December 31
2012 | |
Commercial Lending | | | | | | |
Commercial lending | | | | | | |
Commercial | | | | | | | | | | |
Retail/wholesale trade | | $ | 14,109 | | | $ | 13,801 | | | $ | 14,466 | | | $ | 13,801 | |
Manufacturing | | | 14,139 | | | | 13,856 | | | | 14,270 | | | | 13,856 | |
Service providers | | | 12,568 | | | | 12,095 | | | | 12,758 | | | | 12,095 | |
Real estate related (a) | | | 10,274 | | | | 10,616 | | | | 10,248 | | | | 10,616 | |
Financial services (b) | | | 9,679 | | | | 9,026 | | | | 10,834 | | | | 9,026 | |
Health care | | | 7,392 | | | | 7,267 | | | | 7,618 | | | | 7,267 | |
Other industries | | | 16,124 | | | | 16,379 | | | | 16,736 | | | | 16,379 | |
Total commercial | | | 84,285 | | | | 83,040 | | | | 86,930 | | | | 83,040 | |
Commercial real estate | | | | | | | | | | |
Real estate projects (c) | | | 12,596 | | | | 12,347 | | | | 12,636 | | | | 12,347 | |
Commercial mortgage | | | 6,183 | | | | 6,308 | | | | 6,355 | | | | 6,308 | |
Total commercial real estate | | | 18,779 | | | | 18,655 | | | | 18,991 | | | | 18,655 | |
Equipment lease financing | | | 7,240 | | | | 7,247 | | | | 7,349 | | | | 7,247 | |
Total Commercial Lending (d) | | | 110,304 | | | | 108,942 | | |
Consumer Lending | | | | | | |
Total commercial lending (d) | | | | 113,270 | | | | 108,942 | |
Consumer lending | | | | | | |
Home equity | | | | | | | | | | |
Lines of credit | | | 23,029 | | | | 23,576 | | | | 22,559 | | | | 23,576 | |
Installment | | | 13,001 | | | | 12,344 | | | | 13,857 | | | | 12,344 | |
Total home equity | | | 36,030 | | | | 35,920 | | | | 36,416 | | | | 35,920 | |
Residential real estate | | | | | | | | | | |
Residential mortgage | | | 14,217 | | | | 14,430 | | | | 14,051 | | | | 14,430 | |
Residential construction | | | 768 | | | | 810 | | | | 726 | | | | 810 | |
Total residential real estate | | | 14,985 | | | | 15,240 | | | | 14,777 | | | | 15,240 | |
Credit card | | | 4,081 | | | | 4,303 | | | | 4,135 | | | | 4,303 | |
Other consumer | | | | | | | | | | |
Education | | | 8,048 | | | | 8,238 | | | | 7,814 | | | | 8,238 | |
Automobile | | | 8,716 | | | | 8,708 | | | | 9,066 | | | | 8,708 | |
Other | | | 4,340 | | | | 4,505 | | | | 4,297 | | | | 4,505 | |
Total Consumer Lending | | | 76,200 | | | | 76,914 | | |
Total consumer lending | | | | 76,505 | | | | 76,914 | |
Total loans | | $ | 186,504 | | | $ | 185,856 | | | $ | 189,775 | | | $ | 185,856 | |
| (a) | Includes loans to customers in the real estate and construction industries. |
| (b) | Includes loans issued to a Financing Special Purpose Entity which holds receivables from the other industries within Commercial Lending. |
| (c) | Includes both construction loans and intermediate financing for projects. |
| (d) | Construction loans with interest reserves and A/B Note restructurings are not significant to PNC. |
The increase in loans of $.6$3.9 billion from December 31, 2012 included an increase in commercial lending of $1.3$4.3 billion and a decrease in consumer lending of $.7$.4 billion. The increase in commercial lending was the result of growth in commercial loans primarily from new relationships. The decline in consumer lending resulted primarily from pay downs of residential real estate, credit card and education loans.
14The PNC Financial Services Group, Inc. –Form 10-Q11
loans, primarily from an increase in loan commitments to new and existing customers. The decline in consumer lending resulted from pay downs of residential real estate, education, credit card and other loans, along with the movement of residential real estate loans to OREO and charge-offs taken in the first quarter of 2013 related to the alignment with interagency supervisory guidance, partially offset by net growth in home equity and increases in indirect auto loans.
Loans represented 62% of total assets at March 31,June 30, 2013 and 61% of total assets at December 31, 2012. Commercial lending represented 59%60% of the loan portfolio at both March 31,June 30, 2013 and 59% at December 31, 2012. Consumer lending represented 41%40% of the loan portfolio at both March 31,June 30, 2013 and 41% at December 31, 2012.
Commercial real estate loans represented 10% of total loans and 6% of total assets at both March 31,June 30, 2013 and December 31, 2012. See the Credit Risk Management portion of the Risk Management section of this Financial Review for additional details of loans.
Total loans above include purchased impaired loans of $7.1$6.8 billion, or 4% of total loans, at March 31,June 30, 2013, and $7.4 billion, or 4% of total loans, at December 31, 2012.
Our loan portfolio continued to be diversified among numerous industries, types of businesses and consumers across our principal geographic markets.
The Allowance for Loan and Lease Losses (ALLL) and the Allowance for Unfunded Loan Commitments and Letters of Credit are sensitive to changes in assumptions and judgments and are inherently subjective as they require material estimates, all of which may be susceptible to significant change, including, among others:
Exposure at date of default,
Movement through delinquency stages,
Amounts and timing of expected cash flows,
Value of collateral, which may be obtained from third parties, and
Qualitative factors, such as changes in current economic conditions, that may not be reflected in historical results.
HIGHER RISK LOANS
Our total ALLL of $3.8 billion at March 31,June 30, 2013 consisted of $1.7 billion and $2.1 billion established for the commercial lending and consumer lending categories, respectively. The ALLL included what we believe to be appropriate loss coverage on higher risk loans in the commercial and consumer
portfolios. We do not consider government insured or guaranteed loans to be higher risk as defaults have historically been materially mitigated by payments of insurance or guarantee amounts for approved claims. Additional information regarding our higher risk loans is included in the
Credit Risk Management portion of the Risk Management section of this Financial Review and in Note 5 Asset Quality and Note 7 Allowances for Loan and Lease Losses and Unfunded Loan Commitments and Letters of Credit in our Notes To Consolidated Financial Statements included in Part I, Item 1 of this Report.
PURCHASE ACCOUNTING ACCRETIONAND VALUATIONOF PURCHASED IMPAIRED LOANS
Information related to purchase accounting accretion and accretable yield for the second quarter and first threesix months of 2013 and 2012 follows. Additional information is provided in Note 6 Purchased Loans in the Notes To Consolidated Financial Statements in this Report.
Table 8: Accretion – Purchased Impaired Loans
| | | | Three months ended March 31 | | | Three months ended
June 30 | | Six months ended
June 30 | |
| In millions | | 2013 | | 2012 | | | 2013 | | 2012 | | 2013 | | 2012 | |
Accretion on purchased impaired loans | | | | | | | | | | | | | | |
Scheduled accretion | | $ | 157 | | | $ | 158 | | | $ | 150 | | | $ | 178 | | | $ | 307 | | | $ | 336 | |
Reversal of contractual interest on impaired loans | | | (85 | ) | | | (97 | ) | | | (83 | ) | | | (111 | ) | | | (168 | ) | | | (208 | ) |
Scheduled accretion net of contractual interest | | | 72 | | | | 61 | | | | 67 | | | | 67 | | | | 139 | | | | 128 | |
Excess cash recoveries | | | 50 | | | | 40 | | | | 11 | | | | 51 | | | | 61 | | | | 91 | |
Total | | $ | 122 | | | $ | 101 | | | $ | 78 | | | $ | 118 | | | $ | 200 | | | $ | 219 | |
Table 9: Purchased Impaired Loans – Accretable Yield
| | In millions | | 2013 | | 2012 | | | 2013 | | 2012 | |
January 1 | | $ | 2,166 | | | $ | 2,109 | | | $ | 2,166 | | | $ | 2,109 | |
Addition of accretable yield due to RBC Bank (USA) acquisition on March 2, 2012 | | | | | 587 | | | | | | 587 | |
Scheduled accretion | | | (157 | ) | | | (158 | ) | | | (307 | ) | | | (336 | ) |
Excess cash recoveries | | | (50 | ) | | | (40 | ) | | | (61 | ) | | | (91 | ) |
Net reclassifications to accretable from non-accretable and other activity (a) | | | 213 | | | | (29 | ) | | | 366 | | | | 134 | |
March 31 (b) | | $ | 2,172 | | | $ | 2,469 | | |
June 30 (b) | | | $ | 2,164 | | | $ | 2,403 | |
| (a) | Over 48%Approximately 58% of the net reclassifications for the first six months of 2013 were driven by the commercial portfolio. Approximately half of the commercialconsumer portfolio impact related to excess cash recoveries recognized during the period, with the remainingand were due to improvements of cash expected to be collected on both RBC Bank (USA) and National City loans in future periods. The remaining net reclassifications were predominantly due to future cash flow changes in the consumercommercial portfolio. |
| (b) | As of March 31,June 30, 2013, we estimate that the reversal of contractual interest on purchased impaired loans will total approximately $1.2 billion in future periods. This will offset the total net accretable interest in future interest income of $2.2 billion on purchased impaired loans. |
12The PNC Financial Services Group, Inc. –Form 10-Q15
Information related to the valuation of purchased impaired loans at March 31,June 30, 2013 and December 31, 2012 follows.
Table 10: Valuation of Purchased Impaired Loans
| | | | March 31, 2013 | | December 31, 2012 | | | June 30, 2013 | | December 31, 2012 | |
| Dollars in millions | | Balance | | Net Investment | | Balance | | Net Investment | | | Balance | | | Net Investment | | Balance | | | Net Investment | |
Commercial and commercial real estate loans: | | | | | | | | | | | | | | | | | | |
Unpaid principal balance | | $ | 1,465 | | | | | $ | 1,680 | | | | | | $ | 1,299 | | | | | $ | 1,680 | | | | |
Purchased impaired mark | | | (386 | ) | | | (431 | ) | | | | | (331 | ) | | | | (431 | ) | | | |
Recorded investment | | | 1,079 | | | | | | 1,249 | | | | | | | 968 | | | | | | 1,249 | | | | |
Allowance for loan losses | | | (198 | ) | | | (239 | ) | | | | | (183 | ) | | | | (239 | ) | | | |
Net investment | | | 881 | | | | 60 | % | | | 1,010 | | | | 60 | % | | | 785 | | | | 60 | % | | | 1,010 | | | | 60 | % |
Consumer and residential mortgage loans: | | | | | | | | | | | | | | | | | | |
Unpaid principal balance | | | 6,359 | | | | | | 6,639 | | | | | | | 6,095 | | | | | | 6,639 | | | | |
Purchased impaired mark | | | (365 | ) | | | (482 | ) | | | | | (285 | ) | | | | (482 | ) | | | |
Recorded investment | | | 5,994 | | | | | | 6,157 | | | | | | | 5,810 | | | | | | 6,157 | | | | |
Allowance for loan losses | | | (911 | ) | | | (858 | ) | | | | | (934 | ) | | | | (858 | ) | | | |
Net investment | | | 5,083 | | | | 80 | % | | | 5,299 | | | | 80 | % | | | 4,876 | | | | 80 | % | | | 5,299 | | | | 80 | % |
Total purchased impaired loans: | | | | | | | | | | | | | | | | | | |
Unpaid principal balance | | | 7,824 | | | | | | 8,319 | | | | | | | 7,394 | | | | | | 8,319 | | | | |
Purchased impaired mark | | | (751 | ) | | | (913 | ) | | | | | (616 | ) | | | | (913 | ) | | | |
Recorded investment | | | 7,073 | | | | | | 7,406 | | | | | | | 6,778 | | | | | | 7,406 | | | | |
Allowance for loan losses | | | (1,109 | ) | | | (1,097 | ) | | | | | (1,117 | ) | | | | (1,097 | ) | | | |
Net investment | | $ | 5,964 | | | | 76 | % | | $ | 6,309 | | | | 76 | % | | $ | 5,661 | | | | 77 | % | | $ | 6,309 | | | | 76 | % |
The unpaid principal balance of purchased impaired loans decreased to $7.8$7.4 billion at March 31,June 30, 2013 from $8.3 billion at December 31, 2012 due to payments, disposals and charge-offs of amounts determined to be uncollectible. The remaining purchased impaired mark at March 31,June 30, 2013 was $751$616 million, which was a decrease from $913 million at December 31, 2012. The associated allowance for loan losses remained relatively flat at $1.1 billion. The net investment of $6.0$5.7 billion at March 31,June 30, 2013 decreased 5%10% from $6.3 billion at December 31, 2012. At March 31,June 30, 2013, our largest individual purchased impaired loan had a recorded investment of $19 million.
We currently expect to collect total cash flows of $8.2$7.9 billion on purchased impaired loans, representing the $6.0$5.7 billion net investment at March 31,June 30, 2013 and the accretable net interest of $2.2 billion shown in Table 9: Purchased Impaired Loans – Accretable Yield.
The PNC Financial Services Group, Inc. –Form 10-Q13
WEIGHTED AVERAGE LIFEOFTHE PURCHASED IMPAIRED PORTFOLIOS
The table below provides the weighted average life (WAL) for each of the purchased impaired portfolios as of the firstsecond quarter of 2013.
Table 11: Weighted Average Life of the Purchased Impaired Portfolios
| | As of March 31, 2013 | | | | | | | |
| In millions | | Recorded Investment | | | WAL (a) | | |
As of June 30, 2013 In millions | | | Recorded Investment | | | WAL (a) | |
Commercial | | $ | 270 | | | | 2.1 years | | | $ | 231 | | | | 2.0 years | |
Commercial real estate | | | 809 | | | | 2.0 years | | | | 737 | | | | 1.8 years | |
Consumer (b) | | | 2,557 | | | | 4.5 years | | | | 2,474 | | | | 4.7 years | |
Residential real estate | | | 3,437 | | | | 4.6 years | | | | 3,336 | | | | 4.8 years | |
Total | | $ | 7,073 | | | | 4.1 years | | | $ | 6,778 | | | | 4.3 years | |
| (a) | Weighted average life represents the average number of years for which each dollar of unpaid principal remains outstanding. |
| (b) | Portfolio primarily consists of nonrevolving home equity products. |
16 The PNC Financial Services Group, Inc. –Form 10-Q
PURCHASED IMPAIRED LOANS – ACCRETABLE DIFFERENCE SENSITIVITY ANALYSIS
The following table provides a sensitivity analysis on the Purchased Impaired Loans portfolio. The analysis reflects hypothetical changes in key drivers for expected cash flows over the life of the loans under declining and improving conditions at a point in time. Any unusual significant economic events or changes, as well as other variables not considered below (e.g., natural or widespread disasters), could result in impacts outside of the ranges represented below. Additionally, commercial and commercial real estate loan settlements or sales proceeds can vary widely from appraised values due to a number of factors including, but not limited to, special use considerations, liquidity premiums and improvements/deterioration in other income sources.
Table 12: Accretable Difference Sensitivity – Total Purchased Impaired Loans
| | In billions | In billions | | March 31,
2013 | | Declining
Scenario (a) | | Improving
Scenario (b) | | | June 30, 2013 | | Declining Scenario (a) | | Improving Scenario (b) | |
Expected Cash Flows | Expected Cash Flows | | $ | 8.2 | | | $ | (.4 | ) | | $ | .4 | | | $ | 7.9 | | | $ | (.3 | ) | | $ | .4 | |
Accretable Difference | Accretable Difference | | | 2.2 | | | | (.1 | ) | | | .2 | | | | 2.2 | | | | (.1 | ) | | | .2 | |
Allowance for Loan and Lease Losses | Allowance for Loan and Lease Losses | | | (1.1 | ) | | | (.4 | ) | | | .2 | | | | (1.1 | ) | | | (.3 | ) | | | .2 | |
| (a) | Declining Scenario – Reflects hypothetical changes that would decrease future cash flow expectations. For consumer loans we assume home price forecast decreases by ten percent and unemployment rate forecast increases by two percentage points; for commercial loans, we assume that collateral values decrease by ten percent. |
| (b) | Improving Scenario – Reflects hypothetical changes that would increase future cash flow expectations. For consumer loans, we assume home price forecast increases by ten percent, unemployment rate forecast decreases by two percentage points and interest rate forecast increases by two percentage points; for commercial loans, we assume that collateral values increase by ten percent. |
The impact of declining cash flows is primarily reflected as immediate impairment (allowance for loan losses). The impact of increased cash flows is first recognized as a reversal of the allowance with any additional cash flow increases reflected as an increase in accretable yield over the life of the loan.
NET UNFUNDED CREDIT COMMITMENTS
Net unfunded credit commitments are comprised of the following:
Table 13: Net Unfunded Credit Commitments
| | In millions | | March 31
2013 | | | December 31
2012 | | | June 30
2013 | | December 31
2012 | |
Commercial / commercial real estate (a) | | $ | 79,953 | | | $ | 78,703 | | |
Commercial and commercial real estate (a) | | | $ | 82,790 | | | $ | 78,703 | |
Home equity lines of credit | | | 19,696 | | | | 19,814 | | | | 19,325 | | | | 19,814 | |
Credit card | | | 17,356 | | | | 17,381 | | | | 17,101 | | | | 17,381 | |
Other | | | 4,807 | | | | 4,694 | | | | 4,926 | | | | 4,694 | |
Total | | $ | 121,812 | | | $ | 120,592 | | | $ | 124,142 | | | $ | 120,592 | |
| (a) | Less than 5% of these amounts at each datetotal net unfunded credit commitments relate to commercial real estate.estate at each date. |
Commitments to extend credit represent arrangements to lend funds or provide liquidity subject to specified contractual conditions. Commercial commitments reported above exclude syndications, assignments and participations, primarily to financial institutions, totaling $22.9$23.5 billion at March 31,June 30, 2013 and $22.5 billion at December 31, 2012.
Unfunded liquidity facility commitments and standby bond purchase agreements totaled $713$701 million at March 31,June 30, 2013 and $732 million at December 31, 2012 and are included in the preceding table primarily within the Commercial /and commercial real estate category.
In addition to the credit commitments set forth in the table above, our net outstanding standby letters of credit totaled $10.9 billion at June 30, 2013 and $11.5 billion at both March 31, 2013 and December 31, 2012. Standby letters of credit commit us to make payments on behalf of our customers if specified future events occur.
Information regarding our Allowance for unfunded loan commitments and letters of credit is included in Note 7 Allowance for Loan and Lease Losses and Unfunded Loan Commitments and Letters of Credit in the Notes To Consolidated Financial Statements in Part I, Item 1 of this Report.
14The PNC Financial Services Group, Inc. –Form 10-Q17
INVESTMENT SECURITIES
Table 14: Investment Securities
| | | | March 31, 2013 | | December 31, 2012 | | | June 30, 2013 | | December 31, 2012 | |
| In millions | | Amortized
Cost | | Fair
Value | | Amortized
Cost | | Fair
Value | | | Amortized Cost | | Fair Value | | Amortized Cost | | Fair Value | |
Total securities available for sale (a) | | $ | 47,950 | | | $ | 49,536 | | | $ | 49,447 | | | $ | 51,052 | | | $ | 47,176 | | | $ | 47,899 | | | $ | 49,447 | | | $ | 51,052 | |
Total securities held to maturity | | | 9,825 | | | | 10,272 | | | | 10,354 | | | | 10,860 | | | | 9,550 | | | | 9,749 | | | | 10,354 | | | | 10,860 | |
Total securities | | $ | 57,775 | | | $ | 59,808 | | | $ | 59,801 | | | $ | 61,912 | | | $ | 56,726 | | | $ | 57,648 | | | $ | 59,801 | | | $ | 61,912 | |
| (a) | Includes $288$297 million of both amortized cost and fair value of securities classified as corporate stocks and other at March 31,June 30, 2013. Comparably, at December 31, 2012, amortized cost and fair value of these corporate stocks and other was $367 million. The remainder of securities available for sale are debt securities. |
The carrying amount of investment securities totaled $59.4$57.4 billion at March 31,June 30, 2013, which was made up of $49.6$47.9 billion of securities available for sale carried at fair value and $9.8$9.5 billion of securities held to maturity carried at amortized cost. Comparably, at December 31, 2012, the carrying value of investment securities totaled $61.4 billion of which $51.0 billion represented securities available for sale carried at fair value and $10.4 billion of securities held to maturity carried at amortized cost.
The decrease in the carrying amount of investment securities of $2.0$4.0 billion since December 31, 2012 resulted primarily from a decline in agency residential mortgage-backed securities due to principal payments.payments partially offset by net purchase activity. Investment securities represented 20%19% of total assets at both March 31,June 30, 2013 and 20% at December 31, 2012.
We evaluate our portfolio of investment securities in light of changing market conditions and other factors and, where appropriate, take steps to improve our overall positioning. We consider the portfolio to be well-diversified and of high quality. U.S. Treasury and government agencies, agency residential mortgage-backed and agency commercial mortgage-backed securities collectively represented 57%56% of the investment securities portfolio at March 31,June 30, 2013.
At both March 31,June 30, 2013, and December 31, 2012, the securities available for sale portfolio included a net unrealized gain of $1.6$.7 billion, which
represented the difference between fair value and amortized cost. The comparable balance at December 31, 2012 was $1.6 billion. The decrease in the net unrealized gain since December 31, 2012 resulted from an increase in market interest rates and widening asset spreads. The fair value of investment securities is impacted by interest rates, credit spreads, market volatility and liquidity conditions. The fair value of investment securities generally decreases when interest rates increase and vice versa. In addition, the fair value generally
decreases when credit spreads widen and vice versa. Net unrealized gains and losses in the securities available for sale portfolio are included in Shareholders’ equity as Accumulated other comprehensive income or loss, net of tax, on our Consolidated Balance Sheet.
Additional information regarding our investment securities is included in Note 8 Investment Securities and Note 9 Fair Value in our Notes To Consolidated Financial Statements included in Part I, Item 1 of this Report.
Unrealized gains and losses on available for sale securities do not impact liquidity or risk-based capital under currently effective capital rules. However, reductions in the credit ratings of these securities could have an impact on the liquidity of the securities or the determination of risk-weighted assets, which could reduce our regulatory capital ratios under currently effective capital rules. In addition, the amount representing the credit-related portion of other-than- temporaryother-than-temporary impairment (OTTI) on available for sale securities would reduce our earnings and regulatory capital ratios.
The weighted-average expected life of investment securities (excluding corporate stocks and other) was 4.24.5 years at March 31,June 30, 2013 and 4.0 years at December 31, 2012.
The duration of investment securities was 2.42.8 years at March 31,June 30, 2013. We estimate that, at March 31,June 30, 2013, the effective duration of investment securities was 2.62.9 years for an immediate 50 basis points parallel increase in interest rates and 2.22.6 years for an immediate 50 basis points parallel decrease in interest rates. Comparable amounts at December 31, 2012 were 2.3 years and 2.2 years, respectively.
18The PNC Financial Services Group, Inc. –Form 10-Q15
The following table provides details regarding the vintage, current credit rating and FICO score of the underlying collateral at origination, where available, for residential mortgage-backed, commercial mortgage-backed and other asset-backed securities held in the available for sale and held to maturity portfolios:
Table 15: Vintage, Current Credit Rating and FICO Score for Asset-Backed Securities
| | | | Agency | | | Non-agency | | | | | | Agency | | | Non-agency | | | | |
As of March 31, 2013 Dollars in millions | | Residential
Mortgage-
Backed
Securities | | Commercial
Mortgage-
Backed
Securities | | | Residential
Mortgage-
Backed
Securities | | Commercial
Mortgage-
Backed
Securities | | | Asset-
Backed
Securities (a) | | |
As of June 30, 2013 Dollars in millions | | | Residential
Mortgage- Backed
Securities | | Commercial
Mortgage- Backed
Securities | | | Residential
Mortgage- Backed
Securities | | | Commercial
Mortgage- Backed
Securities | | | Asset- Backed
Securities (a) | |
Fair Value – Available for Sale | | $ | 25,272 | | | $ | 615 | | | $ | 6,038 | | | $ | 3,477 | | | $ | 6,015 | | | $ | 24,248 | | | $ | 595 | | | $ | 5,852 | | | $ | 3,679 | | | $ | 6,034 | |
Fair Value – Held to Maturity | | | 4,178 | | | | 1,357 | | | | | 2,400 | | | | 997 | | | | 3,825 | | | | 1,319 | | | | | | 2,231 | | | | 1,100 | |
Total Fair Value | | $ | 29,450 | | | $ | 1,972 | | | $ | 6,038 | | | $ | 5,877 | | | $ | 7,012 | | | $ | 28,073 | | | $ | 1,914 | | | $ | 5,852 | | | $ | 5,910 | | | $ | 7,134 | |
% of Fair Value: | | | | | | | | | | | | | | | | | | | | | | | | | | |
By Vintage | | | | | | | | | | | | | | | | | | | | | | | | | | |
2013 | | | 1 | % | | | | | | | | | | | | | | 4 | % | | | | | | 1 | % | | | 4 | % | | | |
2012 | | | 20 | % | | | 1 | % | | | | | 12 | % | | | | | | 18 | % | | | 1 | % | | | 1 | % | | | 12 | % | | | |
2011 | | | 26 | % | | | 49 | % | | | | | 6 | % | | | | | | 25 | % | | | 49 | % | | | | | 6 | % | | | |
2010 | | | 24 | % | | | 11 | % | | | 1 | % | | | 4 | % | | | 3 | % | | | 24 | % | | | 11 | % | | | 1 | % | | | 5 | % | | | 2 | % |
2009 | | | 9 | % | | | 19 | % | | | | | 2 | % | | | 1 | % | | | 9 | % | | | 19 | % | | | | | 2 | % | | | 1 | % |
2008 | | | 2 | % | | | 3 | % | | | | | | | | 1 | % | | | 2 | % | | | 3 | % | | | | | | | | 1 | % |
2007 | | | 3 | % | | | 2 | % | | | 25 | % | | | 11 | % | | | 2 | % | | | 5 | % | | | 2 | % | | | 25 | % | | | 11 | % | | | 2 | % |
2006 | | | 1 | % | | | 3 | % | | | 21 | % | | | 20 | % | | | 6 | % | | | 1 | % | | | 4 | % | | | 20 | % | | | 19 | % | | | 6 | % |
2005 and earlier | | | 6 | % | | | 12 | % | | | 52 | % | | | 44 | % | | | 6 | % | | | 6 | % | | | 11 | % | | | 51 | % | | | 41 | % | | | 5 | % |
Not Available | | | 8 | % | | | | | 1 | % | | | 1 | % | | | 81 | % | | | 6 | % | | | | | 1 | % | | | | | | 83 | % |
Total | | | 100 | % | | | 100 | % | | | 100 | % | | | 100 | % | | | 100 | % | | | 100 | % | | | 100 | % | | | 100 | % | | | 100 | % | | | 100 | % |
By Credit Rating (at March 31, 2013) | | | | | | | | | | | | | | |
By Credit Rating (at June 30, 2013) | | | | | | | | | | | | | | |
Agency | | | 100 | % | | | 100 | % | | | | | | | | | | | 100 | % | | | 100 | % | | | | | | | | |
AAA | | | | | | | | | | 71 | % | | | 65 | % | | | | | | | | 3 | % | | | 69 | % | | | 66 | % |
AA | | | | | | | | 1 | % | | | 8 | % | | | 25 | % | | | | | | | | 1 | % | | | 9 | % | | | 25 | % |
A | | | | | | | | 1 | % | | | 12 | % | | | 1 | % | | | | | | | | 1 | % | | | 10 | % | | | 1 | % |
BBB | | | | | | | | 4 | % | | | 4 | % | | | | | | | | | | | 4 | % | | | 4 | % | | | |
BB | | | | | | | | 12 | % | | | 2 | % | | | | | | | | | | | 11 | % | | | 2 | % | | | |
B | | | | | | | | 7 | % | | | 1 | % | | | 1 | % | | | | | | | | 7 | % | | | 1 | % | | | 1 | % |
Lower than B | | | | | | | | 73 | % | | | | | | 8 | % | | | | | | | | 71 | % | | | | | | 7 | % |
No rating | | | | | | 2 | % | | | 2 | % | | | | | | | | | 2 | % | | | 5 | % | | | |
Total | | | 100 | % | | | 100 | % | | | 100 | % | | | 100 | % | | | 100 | % | | | 100 | % | | | 100 | % | | | 100 | % | | | 100 | % | | | 100 | % |
By FICO Score (at origination) | | | | | | | | | | | | | | | | | | | | | | | | | | |
>720 | | | | | | | | 56 | % | | | | | | 2 | % | | | | | | | | 51 | % | | | | | | |
<720 and >660 | | | | | | | | 31 | % | | | | | | 5 | % | | | | | | | | 36 | % | | | | | | 7 | % |
<660 | | | | | | | | | | | | | 2 | % | | | | | | | | | | | | | 2 | % |
No FICO score | | | | | | 13 | % | | | | | 91 | % | | | | | | 13 | % | | | | | | 91 | % |
Total | | | | | | 100 | % | | | | | 100 | % | | | | | | 100 | % | | | | | | 100 | % |
| (a) | Available for sale asset-backed securities include $2 million of available for sale agency asset-backed securities. |
16 The PNC Financial Services Group, Inc. –Form 10-Q
We conduct a comprehensive security-level impairment assessment quarterly on all securities. For those securities in an unrealized loss position, towe determine whether the loss represents OTTI. Our assessment considers the security structure, recent security collateral performance metrics, external credit ratings, failure of the issuer to make scheduled interest or principal payments, our judgment and expectations of future performance, and relevant independent industry research, analysis and forecasts.
We also consider the severity of the impairment and the length of time that the security has been impaired in our assessment. Results of the periodic assessment are reviewed by a cross-functional senior management team representing Asset & Liability
The PNC Financial Services Group, Inc. –Form 10-Q19
Management, Finance and Market Risk Management. The senior management team considers the results of the assessments, as well as other factors, in determining whether the impairment is other-than-temporary.
For those debt securities where we do not intend to sell and believe we will not be required to sell the securities prior to expected recovery, we recognize the credit portion of OTTI charges in current earnings and the noncredit portion of OTTI is included in Net unrealized gains (losses) on OTTI securities on our Consolidated Statement of Comprehensive Income and in Accumulated other comprehensive income (loss), net of tax, on our Consolidated Balance Sheet.
We recognized OTTI for the first threesix months of 2013 and 2012 as follows:
Table 16: Other-Than-Temporary Impairments
| | | | Three months ended March 31 | | | Three months ended June 30 | | | Six months ended June 30 | |
| In millions | | 2013 | | 2012 | | | 2013 | | | 2012 | | | 2013 | | 2012 | |
Credit portion of OTTI losses (a) | | | | | | | | | | | | | | | |
Non-agency residential mortgage-backed | | $ | 7 | | | $ | 32 | | | $ | 3 | | | $ | 31 | | | $ | 10 | | | $ | 63 | |
Asset-backed | | | 3 | | | | 5 | | | | 1 | | | | 3 | | | | 4 | | | | 8 | |
Other debt | | | | 1 | | | | | | | | | | 1 | |
Total credit portion of OTTI losses | | | 10 | | | | 38 | | | | 4 | | | | 34 | | | | 14 | | | | 72 | |
Noncredit portion of OTTI (recoveries) (b) | | | (9 | ) | | | (22 | ) | |
Noncredit portion of OTTI losses (recoveries) (b) | | | | 6 | | | | (2 | ) | | | (3 | ) | | | (24 | ) |
Total OTTI losses | | $ | 1 | | | $ | 16 | | | $ | 10 | | | $ | 32 | | | $ | 11 | | | $ | 48 | |
| (a) | Reduction of Noninterest income on our Consolidated Income Statement. |
| (b) | Included in Accumulated other comprehensive income (loss), net of tax, on our Consolidated Balance Sheet and in Net unrealized gains (losses) on OTTI securities on our Consolidated Statement of Comprehensive Income. |
20The PNC Financial Services Group, Inc. –Form 10-Q17
The following table summarizes net unrealized gains and losses recorded on non-agency residential and commercial mortgage-backed securities and other asset-backed securities, which represent our most significant categories of securities not backed by the U.S. government or its agencies. A summary of all OTTI credit losses recognized for the first threesix months of 2013 by investment type is included in Note 8 Investment Securities in the Notes To Consolidated Financial Statements in Part I, Item 1 of this Report.
Table 17: Net Unrealized Gains and Losses on Non-Agency Securities
| As of March 31, 2013 In millions | | Residential Mortgage-
Backed Securities | | | Commercial Mortgage-
Backed Securities | | | Asset-Backed
Securities (a) | | |
| | | Fair
Value | | | Net Unrealized
Gain (Loss) | | | Fair
Value | | | Net Unrealized
Gain | | | Fair
Value | | | Net Unrealized
Gain (Loss) | | | Residential Mortgage- Backed Securities | | | Commercial Mortgage- Backed Securities | | | Asset-Backed Securities (a) | |
As of June 30, 2013 In millions | | | Fair Value | | Net Unrealized
Gain (Loss) | | | Fair Value | | Net Unrealized
Gain | | | Fair Value | | Net Unrealized
Gain (Loss) | |
Available for Sale Securities (Non-Agency) | | | | | | | | | | | | | | | | | | | | | | | | | | | | |
Credit Rating Analysis | | | | | | | | | | | | | | | | | | | | | | | | | | | | | | |
AAA | | $ | 20 | | | | | | $ | 2,015 | | | $ | 81 | | | $ | 3,814 | | | $ | 32 | | | $ | 159 | | | $ | (8 | ) | | $ | 2,031 | | | $ | 43 | | | $ | 3,814 | | | $ | 12 | |
Other Investment Grade (AA, A, BBB) | | | 369 | | | $ | 31 | | | | 1,179 | | | | 91 | | | | 1,567 | | | | 19 | | | | 334 | | | | 25 | | | | 1,170 | | | | 64 | | | | 1,609 | | | | 13 | |
Total Investment Grade | | | 389 | | | | 31 | | | | 3,194 | | | | 172 | | | | 5,381 | | | | 51 | | | | 493 | | | | 17 | | | | 3,201 | | | | 107 | | | | 5,423 | | | | 25 | |
BB | | | 702 | | | | (50 | ) | | | 113 | | | | 8 | | | | 5 | | | | | | | 671 | | | | (66 | ) | | | 139 | | | | 5 | | | | 4 | | | | |
B | | | 427 | | | | (8 | ) | | | 58 | | | | 4 | | | | 31 | | | | | | | 393 | | | | (13 | ) | | | 57 | | | | 3 | | | | 46 | | | | |
Lower than B | | | 4,395 | | | | 160 | | | | | | | | | 570 | | | | (20 | ) | | | 4,181 | | | | 92 | | | | | | 534 | | | | (15 | ) |
Total Sub-Investment Grade | | | 5,524 | | | | 102 | | | | 171 | | | | 12 | | | | 606 | | | | (20 | ) | | | 5,245 | | | | 13 | | | | 196 | | | | 8 | | | | 584 | | | | (15 | ) |
Total No Rating | | | 125 | | | | 10 | | | �� | 112 | | | | 7 | | | | 26 | | | | (11 | ) | | | 114 | | | | 6 | | | | 282 | | | | 4 | | | | 25 | | | | (12 | ) |
Total | | $ | 6,038 | | | $ | 143 | | | $ | 3,477 | | | $ | 191 | | | $ | 6,013 | | | $ | 20 | | | $ | 5,852 | | | $ | 36 | | | $ | 3,679 | | | $ | 119 | | | $ | 6,032 | | | $ | (2 | ) |
OTTI Analysis | | | | | | | | | | | | | | | | | | | | | | | | | | | | | | |
Investment Grade: | | | | | | | | | | | | | | | | | | | | | | | | | | | | | | |
OTTI has been recognized | | | | | | | | | | | | | | | | | | | | | | | | | | | | | | |
No OTTI recognized to date | | $ | 389 | | | $ | 31 | | | $ | 3,194 | | | $ | 172 | | | $ | 5,381 | | | $ | 51 | | | $ | 493 | | | $ | 17 | | | $ | 3,201 | | | $ | 107 | | | $ | 5,423 | | | $ | 25 | |
Total Investment Grade | | | 389 | | | | 31 | | | | 3,194 | | | | 172 | | | | 5,381 | | | | 51 | | | | 493 | | | | 17 | | | | 3,201 | | | | 107 | | | | 5,423 | | | | 25 | |
Sub-Investment Grade: | | | | | | | | | | | | | | | | | | | | | | | | | | | | | | |
OTTI has been recognized | | | 3,679 | | | | (35 | ) | | | | | | | | 573 | | | | (18 | ) | | | 3,490 | | | | (82 | ) | | | | | | | | 551 | | | | (15 | ) |
No OTTI recognized to date | | | 1,845 | | | | 137 | | | | 171 | | | | 12 | | | | 33 | | | | (2 | ) | | | 1,755 | | | | 95 | | | | 196 | | | | 8 | | | | 33 | | | |
Total Sub-Investment Grade | | | 5,524 | | | | 102 | | | | 171 | | | | 12 | | | | 606 | | | | (20 | ) | | | 5,245 | | | | 13 | | | | 196 | | | | 8 | | | | 584 | | | | (15 | ) |
No Rating: | | | | | | | | | | | | | | | | | | | | | | | | | | | | | | |
OTTI has been recognized | | | 80 | | | | 3 | | | | | | | | | 26 | | | | (11 | ) | | | 74 | | | | 2 | | | | | | | | | 25 | | | | (12 | ) |
No OTTI recognized to date | | | 45 | | | | 7 | | | | 112 | | | | 7 | | | | | | | | | 40 | | | | 4 | | | | 282 | | | | 4 | | | |
Total No Rating | | | 125 | | | | 10 | | | | 112 | | | | 7 | | | | 26 | | | | (11 | ) | | | 114 | | | | 6 | | | | 282 | | | | 4 | | | | 25 | | | | (12 | ) |
Total | | $ | 6,038 | | | $ | 143 | | | $ | 3,477 | | | $ | 191 | | | $ | 6,013 | | | $ | 20 | | | $ | 5,852 | | | $ | 36 | | | $ | 3,679 | | | $ | 119 | | | $ | 6,032 | | | $ | (2 | ) |
Securities Held to Maturity (Non-Agency) | | | | | | | | | | | | | | | | | | | | | | | | | | | | | | |
Credit Rating Analysis | | | | | | | | | | | | | | | | | | | | | | | | | | | | | | |
AAA | | | | | | | $ | 2,179 | | | $ | 53 | | | $ | 746 | | | $ | 4 | | | | | | | | $ | 2,015 | | | $ | 30 | | | $ | 857 | | | $ | (1 | ) |
Other Investment Grade (AA, A, BBB) | | | | | | | | 221 | | | | 12 | | | | 241 | | | | 3 | | | | | | 216 | | | | 8 | | | | 233 | | | | 1 | |
Total Investment Grade | | | | | | | | 2,400 | | | | 65 | | | | 987 | | | | 7 | | | | | | 2,231 | | | | 38 | | | | 1,090 | | | |
BB | | | | | | | | | | | | | 10 | | | | 1 | | | | | | | | | | | | | | 10 | | | | |
B | | | | | | | | | | | | | | | | | | | | | | | | | | | | | | |
Lower than B | | | | | | | | | | | | | | | | | | | | | |
Total Sub-Investment Grade | | | | | | | | | | | | | 10 | | | | 1 | | | | | | | | 10 | | | |
Total No Rating | | | | | | | | | | | | | | | | | | | | | |
Total | | | | | | | $ | 2,400 | | | $ | 65 | | | $ | 997 | | | $ | 8 | | | | | $ | 2,231 | | | $ | 38 | | | $ | 1,100 | | | $ | – | |
| (a) | Excludes $2 million of available for sale agency asset-backed securities. |
18The PNC Financial Services Group, Inc. –Form 10-Q21
Residential Mortgage-Backed Securities
At March 31,June 30, 2013, our residential mortgage-backed securities portfolio was comprised of $29.5$28.1 billion fair value of U.S. government agency-backed securities and $6.0$5.9 billion fair value of non-agency (private issuer) securities. The agency securities are generally collateralized by 1-4 family, conforming, fixed-rate residential mortgages.The non-agency securities are also generally collateralized by 1-4 family residential mortgages. The mortgage loans underlying the non-agency securities are generally non-conforming (i.e., original balances in excess of the amount qualifying for agency securities) and predominately have interest rates that are fixed for a period of time, after which the rate adjusts to a floating rate based upon a contractual spread that is indexed to a market rate (i.e., a “hybrid ARM”), or interest rates that are fixed for the term of the loan.
Substantially all of the non-agency securities are senior tranches in the securitization structure and at origination had credit protection in the form of credit enhancement, over-collateralization and/or excess spread accounts.
During the first threesix months of 2013, we recorded OTTI credit losses of $7$10 million on non-agency residential mortgage-backed securities. All of the losses were associated with securities rated below investment grade. As of March 31,June 30, 2013, the net unrealized loss recorded in Accumulated other comprehensive income for non-agency residential mortgage-backed securities for which we have recorded an OTTI credit loss totaled $32$80 million and the related securities had a fair value of $3.8$3.6 billion.
The fair value of sub-investment grade investment securities for which we have not recorded an OTTI credit loss as of March 31,June 30, 2013 totaled $1.8 billion, with unrealized net gains of $137$95 million. Based on the results of our security-level assessments, we anticipate recovering the cost basis of these securities.
Commercial Mortgage-Backed Securities
The fair value of the non-agency commercial mortgage-backed securities portfolio was $5.9 billion at March 31,June 30, 2013 and consisted of fixed-rate, private-issuer securities collateralized by non-residential properties, primarily retail properties, office buildings and multi-family housing. The agency commercial mortgage-backed securities portfolio had a fair value of $2.0$1.9 billion at March 31,June 30, 2013 consisting of multi-family housing. Substantially all of the securities are the most senior tranches in the subordination structure.
There were no OTTI credit losses on commercial mortgage-backed securities during the first threesix months of 2013.
Asset-Backed Securities
The fair value of the asset-backed securities portfolio was $7.0$7.1 billion at March 31,June 30, 2013. The portfolio consisted of fixed-rate
and floating-rate securities collateralized by various consumer credit products, primarily student loans and residential mortgage loans, as well as securities backed by corporate debt. Substantially all of the securities are senior tranches in the securitization structure and have credit protection in the form of credit enhancement, over-collateralization and/or excess spread accounts. Substantially all of the student loans in the securitizations are guaranteed by an agency of the U.S. government.
We recorded OTTI credit losses of $3$4 million on asset-backed securities during the first threesix months of 2013. All of the securities are collateralized by first and second lien residential mortgage loans and are rated below investment grade. As of March 31,June 30, 2013, the net unrealized loss recorded in Accumulated other comprehensive income for asset-backed securities for which we have recorded an OTTI credit loss totaled $29$27 million and the related securities had a fair value of $599$576 million.
For the sub-investment grade investment securities (available for sale and held to maturity) for which we have not recorded an OTTI loss through March 31,June 30, 2013, the fair value was $43 million, with no unrealized net losses of $1 million. Therecorded. Based on the results of our security-level assessments, indicate that we will recoveranticipate recovering the cost basis of these securities.
Note 8 Investment Securities in the Notes To Consolidated Financial Statements in Part I, Item 1 of this Report provides additional information on OTTI losses and further detail regarding our process for assessing OTTI.
If current housing and economic conditions were to worsen,deteriorate from current levels, and if market volatility and illiquidity were to worsen,deteriorate from current levels, or if market interest rates were to increase or credit spreads were to widen appreciably, the valuation of our investment securities portfolio could be adversely affected and we could incur additional OTTI credit losses that would impact our Consolidated Income Statement.
The PNC Financial Services Group, Inc. –Form 10-Q19
LOANS HELDFOR SALE
Table 18: Loans Held For Sale
| | In millions | | March 31
2013 | | | December 31
2012 | | | June 30 2013 | | December 31
2012 | |
Commercial mortgages at fair value | | $ | 769 | | | $ | 772 | | | $ | 635 | | | $ | 772 | |
Commercial mortgages at lower of cost or market | | | 126 | | | | 620 | | | | 437 | | | | 620 | |
Total commercial mortgages | | | 895 | | | | 1,392 | | | | 1,072 | | | | 1,392 | |
Residential mortgages at fair value | | | 2,204 | | | | 2,096 | | | | 2,246 | | | | 2,096 | |
Residential mortgages at lower of cost or market | | | 127 | | | | 124 | | | | 107 | | | | 124 | |
Total residential mortgages | | | 2,331 | | | | 2,220 | | | | 2,353 | | | | 2,220 | |
Other | | | 69 | | | | 81 | | | | 389 | | | | 81 | |
Total | | $ | 3,295 | | | $ | 3,693 | | | $ | 3,814 | | | $ | 3,693 | |
22 The PNC Financial Services Group, Inc. –Form 10-Q
We stopped originating certain commercial mortgage loans held for sale designated at fair value and continue pursuing opportunities to reduce these positions at appropriate prices. At March 31,June 30, 2013, the balance relating to these loans was $769$635 million, compared to $772 million at December 31, 2012.
We sold $926 million$1.4 billion of commercial mortgages held for sale carried at lower of cost or market during the first threesix months of 2013 compared to $481 million$.9 billion during the first threesix months of 2012, due to an increase in2012. All of these loan sales were to government agencies. Gains on sale, net of hedges, were immaterial.$43 million during the first six months of 2013, including $20 million in the second quarter. Comparable amounts for 2012 were $15 million and $18 million, respectively.
Residential mortgage loan origination volume was $4.2$8.9 billion in the first threesix months of 2013 compared to $3.4$7.0 billion for the first threesix months of 2012. Substantially all such loans were originated under agency or Federal Housing Administration (FHA) standards. We sold $3.8$8.0 billion of loans and recognized related gains of $172$362 million during the first threesix months of 2013.2013, of which $190 million occurred in the second quarter. The comparable amounts for the first threesix months of 2012 were $3.5$6.4 billion and $141$318 million, respectively.respectively, including $177 million in the second quarter.
Interest income on loans held for sale was $53$85 million in the first threesix months of 2013, and $50including $32 million in the first three months of 2012.second quarter. Comparable amounts for 2012 were $95 million and $45 million, respectively. These amounts are included in Other interest income on our Consolidated Income Statement.
Additional information regarding our loan sale and servicing activities is included in Note 3 Loan Sales and Servicing Activities and Variable Interest Entities and Note 9 Fair Value in our Notes To Consolidated Financial Statements included in Part I, Item 1 of this Report.
GOODWILLAND OTHER INTANGIBLE ASSETS
Goodwill and other intangible assets totaled $11.0$11.2 billion at March 31,June 30, 2013 and $10.9 billion at December 31, 2012. The increase of $.3 billion was primarily due to mortgage and other loan servicing rights. See additional information regarding our goodwill and intangible assets in Note 10 Goodwill and Other Intangible Assets included in the Notes To Consolidated Financial Statements in Part I, Item 1 of this Report.
20 The PNC Financial Services Group, Inc. –Form 10-Q
FUNDINGAND CAPITAL SOURCES
Table 19: Details Of Funding Sources
| | In millions | | March 31
2013 | | | December 31
2012 | | | June 30 2013 | | | December 31
2012 | |
Deposits | | | | | | | | | | |
Money market | | $ | 103,429 | | | $ | 102,706 | | | $ | 103,480 | | | $ | 102,706 | |
Demand | | | 71,975 | | | | 73,995 | | | | 72,080 | | | | 73,995 | |
Retail certificates of deposit | | | 23,097 | | | | 23,837 | | | | 22,265 | | | | 23,837 | |
Savings | | | 11,137 | | | | 10,350 | | | | 11,085 | | | | 10,350 | |
Time deposits in foreign offices and other time | | | 1,982 | | | | 2,254 | | | | 3,369 | | | | 2,254 | |
Total deposits | | | 211,620 | | | | 213,142 | | | | 212,279 | | | | 213,142 | |
Borrowed funds | | | | | | | | | | |
Federal funds purchased and repurchase agreements | | | 4,000 | | | | 3,327 | | | | 4,303 | | | | 3,327 | |
Federal Home Loan Bank borrowings | | | 5,483 | | | | 9,437 | | | | 8,481 | | | | 9,437 | |
Bank notes and senior debt | | | 10,918 | | | | 10,429 | | | | 11,177 | | | | 10,429 | |
Subordinated debt | | | 7,996 | | | | 7,299 | | | | 7,113 | | | | 7,299 | |
Commercial paper | | | 6,953 | | | | 8,453 | | | | 6,400 | | | | 8,453 | |
Other | | | 2,297 | | | | 1,962 | | | | 2,390 | | | | 1,962 | |
Total borrowed funds | | | 37,647 | | | | 40,907 | | | | 39,864 | | | | 40,907 | |
Total funding sources | | $ | 249,267 | | | $ | 254,049 | | | $ | 252,143 | | | $ | 254,049 | |
See the Liquidity Risk Management portion of the Risk Management section of this Financial Review and Note 20 Subsequent Events in the Notes To Consolidated Financial Statements of this Report for additional information regarding our 2013 capital and liquidity activities.
Total funding sources decreased $4.8$1.9 billion at March 31,June 30, 2013 compared with December 31, 2012.
Total deposits decreased $1.5$.9 billion at March 31,June 30, 2013 compared with December 31, 2012 primarily due to a decreasedecreases in demand deposits and retail certificates of deposit, partially offset by increases in time deposits in foreign offices and other time, money market and savings deposits. Interest-bearing deposits represented 69% of total deposits at March 31,June 30, 2013 compared to 67% at December 31, 2012. Total borrowed funds decreased $3.3$1.0 billion since December 31, 2012. 2012 as a result of declines in commercial paper and FHLB borrowings, partially offset by higher federal funds purchased and repurchase agreements and bank notes and senior debt.
The change from December 31, 2012 was largely due to redemptions and maturities of FHLB borrowings.PNC Financial Services Group, Inc. –Form 10-Q�� 23
CAPITAL
Table 20: Shareholders’ Equity
| | In millions | | March 31
2013 | | December 31
2012 | | | June 30
2013 | | December 31
2012 | |
Shareholders’ equity | | | | | | | | | | |
Preferred stock | | | | | | | | | | |
Common stock | | $ | 2,690 | | | $ | 2,690 | | | $ | 2,693 | | | $ | 2,690 | |
Capital surplus – preferred stock | | | 3,591 | | | | 3,590 | | | | 3,939 | | | | 3,590 | |
Capital surplus – common stock and other | | | 12,174 | | | | 12,193 | | | | 12,234 | | | | 12,193 | |
Retained earnings | | | 20,993 | | | | 20,265 | | | | 21,828 | | | | 20,265 | |
Accumulated other comprehensive income (loss) | | | 767 | | | | 834 | | | | 45 | | | | 834 | |
Common stock held in treasury at cost | | | (552 | ) | | | (569 | ) | | | (453 | ) | | | (569 | ) |
Total shareholders’ equity | | $ | 39,663 | | | $ | 39,003 | | | $ | 40,286 | | | $ | 39,003 | |
| (a) | Par value less than $.5 million at each date. |
We manage our funding and capital positions by making adjustments to our balance sheet size and composition, issuing debt, equity or other capital instruments, executing treasury stock transactions and capital redemptions, managing dividend policies and retaining earnings.
Total shareholders’ equity increased $.7$1.3 billion, to $39.7$40.3 billion at March 31,June 30, 2013, compared with December 31, 2012 primarily reflecting an increase in retained earnings of $.7 billion. Accumulated$1.6 billion (driven by net income of $2.1 billion and the impact of $.6 billion of dividends declared) and an increase of $.3
billion in capital surplus-preferred stock due to the net issuances of preferred stock. These increases were partially offset by the decline of accumulated other comprehensive income remained relatively flat atof $.8 billion.billion primarily due to the impact of an increase in market interest rates and widening asset spreads on securities available for sale and derivatives that are part of cash flow hedging strategies. Common shares outstanding were 529531 million at March 31,June 30, 2013 and 528 million at December 31, 2012.
See the Liquidity Risk Management portion of the Risk Management section of this Financial Review and Note 20 Subsequent Events in the Notes To Consolidated Financial Statements in Part I, Item 1 of this Report for additional information regarding our March 2013 announcement of our April 2013 redemption of our Series L Preferred Stock and our May 2013 issuance of our Series R Preferred Stock.
Our current common stock repurchase program permits us to purchase up to 25 million shares of PNC common stock on the open market or in privately negotiated transactions. This program will remain in effect until fully utilized or until modified, superseded or terminated. The extent and timing of share repurchases under this program will depend on a number of factors including, among others, market and general economic conditions, economic and regulatory capital considerations, alternative uses of capital and the potential impact on our credit ratings. We do not expect to repurchase any shares under this program in 2013. We did not include any such share repurchases in our 2013 capital plan submitted to the Federal Reserve, primarily as a result of PNC’s 2012 acquisition of RBC Bank (USA) and expansion into Southeastern markets.
24The PNC Financial Services Group, Inc. –Form 10-Q21
Table 21: Basel I Risk-Based Capital
| | Dollars in millions | | March 31
2013 | | | December 31
2012 | | | June 30
2013 | | December 31
2012 | |
Capital components | | | | | | | | | | |
Shareholders’ equity | | | | | | | | | | |
Common | | $ | 36,072 | | | $ | 35,413 | | | $ | 36,347 | | | $ | 35,413 | |
Preferred | | | 3,591 | | | | 3,590 | | | | 3,939 | | | | 3,590 | |
Trust preferred capital securities | | | 317 | | | | 331 | | | | 216 | | | | 331 | |
Noncontrolling interests | | | 983 | | | | 1,354 | | | | 985 | | | | 1,354 | |
Goodwill and other intangible assets | | | (9,763 | ) | | | (9,798 | ) | | | (9,727 | ) | | | (9,798 | ) |
Eligible deferred income taxes on goodwill and other intangible assets | | | 351 | | | | 354 | | | | 346 | | | | 354 | |
Pension and other postretirement benefit plan adjustments | | | 748 | | | | 777 | | | | 743 | | | | 777 | |
Net unrealized securities (gains)/losses, after-tax | | | (1,037 | ) | | | (1,052 | ) | | | (502 | ) | | | (1,052 | ) |
Net unrealized gains on cash flow hedge derivatives, after-tax | | | (510 | ) | | | (578 | ) | |
Net unrealized (gains)/losses on cash flow hedge derivatives, after-tax | | | | (332 | ) | | | (578 | ) |
Other | | | (331 | ) | | | (165 | ) | | | (207 | ) | | | (165 | ) |
Tier 1 risk-based capital | | | 30,421 | | | | 30,226 | | | | 31,808 | | | | 30,226 | |
Subordinated debt | | | 5,276 | | | | 4,735 | | | | 5,081 | | | | 4,735 | |
Eligible allowance for credit losses | | | 3,278 | | | | 3,276 | | | | 3,318 | | | | 3,276 | |
Total risk-based capital | | $ | 38,975 | | | $ | 38,237 | | | $ | 40,207 | | | $ | 38,237 | |
Tier 1 common capital | | | | | | | | | | |
Tier 1 risk-based capital | | $ | 30,421 | | | $ | 30,226 | | | $ | 31,808 | | | $ | 30,226 | |
Preferred equity | | | (3,441 | ) | | | (3,590 | ) | | | (3,939 | ) | | | (3,590 | ) |
Trust preferred capital securities | | | (317 | ) | | | (331 | ) | | | (216 | ) | | | (331 | ) |
Noncontrolling interests | | | (983 | ) | | | (1,354 | ) | | | (985 | ) | | | (1,354 | ) |
Tier 1 common capital | | $ | 25,680 | | | $ | 24,951 | | | $ | 26,668 | | | $ | 24,951 | |
Assets | | | | | | | | | | |
Risk-weighted assets, including off-balance sheet instruments and market risk equivalent assets | | $ | 261,491 | | | $ | 260,847 | | | $ | 264,750 | | | $ | 260,847 | |
Adjusted average total assets | | | 292,911 | | | | 291,426 | | | | 291,605 | | | | 291,426 | |
Basel I capital ratios | | | | | | | | | | |
Tier 1 common | | | 9.8 | % | | | 9.6 | % | | | 10.1 | % | | | 9.6 | % |
Tier 1 risk-based | | | 11.6 | | | | 11.6 | | | | 12.0 | | | | 11.6 | |
Total risk-based | | | 14.9 | | | | 14.7 | | | | 15.2 | | | | 14.7 | |
Leverage | | | 10.4 | | | | 10.4 | | | | 10.9 | | | | 10.4 | |
Federal banking regulators have stated that they expect all bank holding companies to have a level and composition of Tier 1 capital well in excess of the 4% Basel I regulatory minimum, and they have required the largest U.S. bank holding companies, including PNC, to have a capital buffer sufficient to withstand losses and allow them to meet the credit needs of their customers through estimated stress scenarios. They have also stated their view that common equity should be the dominant form of Tier 1 capital. As a result, regulators are now emphasizing the Tier 1 common capital ratio in their evaluation of bank holding company capital levels. We seek to manage our capital consistent with these regulatory principles, and believe that our March 31,June 30, 2013 capital levels were aligned with them.
Dodd-Frank requires the Federal Reserve Board to establish capital requirements that would, among other things, eliminate the Tier 1 treatment of trust preferred securities for bank holding companies with $15 billion or more in assets following a phase-in period expected to begin later this year.that begins in 2014. Accordingly, PNC has redeemed trust preferred securities and will consider redeeming others on or after their first call date, based on such considerations as dividend rates, future capital requirements, capital market conditions and other factors. See Note 14 Capital Securities of Subsidiary Trusts and Perpetual Trust Securities in Item 8 of our 2012 Form 10-K and Note 11 Capital Securities of Subsidiary Trusts and Perpetual Trust Securities and Note 20 Subsequent Events in the Notes To Consolidated Financial Statements in this Report for additional discussion of our trust preferred securities and completed or upcoming redemptions.
22The PNC Financial Services Group, Inc. –Form 10-Q25
Our Basel I Tier 1 common capital ratio was 9.8%10.1% at March 31,June 30, 2013, compared with 9.6% at December 31, 2012. Our Basel I Tier 1 risk-based capital ratio remained consistentincreased 40 basis points to 12.0% at June 30, 2013 from 11.6% for both March 31, 2013 andat December 31, 2012. Our Basel I total risk-based capital ratio increased 2050 basis points to 14.9%15.2% at March 31,June 30, 2013 from 14.7% at December 31, 2012. TheseBasel I capital ratios were positively impacted by a net increaseincreased in all comparisons primarily due to growth in retained earnings. The positive impacts onnet issuance of preferred stock during the Tier 1 risk-based capital and total risk-based capital ratios weresix months ended June 30, 2013 partially offset by the redemption of trust preferred securities favorably impacted the June 30, 2013 Basel I Tier 1 risk-based and announced call of the Series L preferred stock.Basel I total risk-based capital ratios. Basel I risk-weighted assets increased $.7$3.9 billion from $260.8to $264.8 billion at December 31, 2012 to $261.5 billion at March 31,June 30, 2013.
At March 31,June 30, 2013, PNC and PNC Bank, National Association (PNC Bank, N.A.), our domestic bank subsidiary, were both considered “well capitalized” based on USU.S. regulatory capital ratio requirements under Basel I. To qualify as “well-capitalized”, regulators currently require bank holding companies and banks to maintain Basel I capital ratios of at least 6% for Tier 1 risk-based, 10% for total risk-based, and 5% for leverage. We believe PNC and PNC Bank, N.A. will continue to meet these requirements during the remainder of 2013.
PNC and PNC Bank, N.A. entered the “parallel run” qualification phase under the Basel II capital framework on January 1, 2013. The Basel II framework, which was adopted by the Basel Committee on Banking Supervision in 2004, seeks to provide more risk-sensitive regulatory capital calculations and promote enhanced risk management practices among large, internationally active banking organizations. The U.S. banking agencies initially adopted final rules to implement the Basel II capital framework in December 2007 and in June 2012 requested comment on proposed modifications to these2004. In July 2013, the U.S. banking agencies adopted final rules (collectively referred(referred to as the “advanced approaches”).advanced approaches) that modify the Basel II risk-weighting framework. See Recent Market and Industry Developments in the Executive Summary section of this Financial Review and Item 1 Business – Supervision and Regulation and Item 1A Risk Factors in our 2012 Form 10-K. Prior to fully implementing the advanced approaches established by these rules to calculate risk-weighted assets, PNC and PNC Bank, N.A. must successfully complete a “parallel run” qualification phase. This phase must last at least four consecutive quarters, although, consistent with the experience of other U.S. banks, we currently anticipate a multi-year parallel run period.
We provide information below regarding PNC’s pro forma fully phased-in Basel III Tier 1 common capital ratio using PNC’s estimated Basel III advanced approaches risk-weighted assets and how it differs from the Basel I Tier 1 common capital ratio as we expect theratio. The Basel III ratio towill replace the current Basel I ratio for this regulatory metric when the applicable rules are finalized and fully implemented and PNC exits the parallel run.run qualification phase.
The Federal Reserve announced final rules implementing Basel III on July 2, 2013. PNC continues its evaluation of these rules. Pending completion of that evaluation, we have estimated our Basel III capital information set forth below based on our understanding of the prior U.S. Basel III rule proposals issued in 2012.
Table 22: Estimated Pro forma Basel III Tier 1 Common Capital Ratio
| | Dollars in millions | | March 31
2013 | | | December 31
2012 | | | June 30
2013 | | December 31
2012 | |
Basel I Tier 1 common capital | | $ | 25,680 | | | $ | 24,951 | | | $ | 26,668 | | | $ | 24,951 | |
Less regulatory capital adjustments: | | | | | | | | | | |
Basel III quantitative limits | | | (2,076 | ) | | | (2,330 | ) | | | (2,224 | ) | | | (2,330 | ) |
Accumulated other comprehensive income (a) | | | 289 | | | | 276 | | | | (241 | ) | | | 276 | |
All other adjustments | | | (367 | ) | | | (396 | ) | | | (283 | ) | | | (396 | ) |
Estimated Basel III Tier 1 common capital | | $ | 23,526 | | | $ | 22,501 | | | $ | 23,920 | | | $ | 22,501 | |
Estimated Basel III risk-weighted assets | | | 293,810 | | | | 301,006 | | | | 290,838 | | | | 301,006 | |
Pro forma Basel III Tier 1 common capital ratio | | | 8.0 | % | | | 7.5 | % | | | 8.2 | % | | | 7.5 | % |
| (a) | Represents net adjustments related to accumulated other comprehensive income for available for sale securities and pension and other postretirement benefit plans. |
PNC’s pro forma Basel III Tier 1 common capital ratio was estimated without the benefit of phase-ins and is based on our current understanding of Basel III proposed rules. PNC utilizes this estimate to assess its Basel III capital position, including comparison to similar estimates made by other financial institutions. Tier 1 common capital as defined under the proposed Basel III rules differs materially from Basel I. UnderFor example, under Basel III, unconsolidatedsignificant common stock investments in unconsolidated financial institutions, mortgage servicing rights and deferred tax assets must be deducted from capital to the extent they individually exceed 10%, or in the aggregate exceed 15%, of the institution’s adjusted Tier 1 common capital. Also, Basel I regulatory capital excludes certain other comprehensive income related to both available for sale securities and pension and other postretirement plans, whereas under Basel III these items are a component of PNC’s capital. Basel III risk-weighted assets were estimated under Basel II (including the modifications to the advanced approaches proposed underincluded in the Basel III)III rules and application of Basel II.5, and reflect credit, market and operational risk.
PNC utilizes this capital ratio estimate to assess its Basel III capital position (without the benefit of phase-ins), including comparison to similar estimates made by other financial institutions. This Basel III capital estimate is likely to be impacted by the finalizationPNC’s ongoing analysis of the recently issued Basel III rules, further regulatory clarity relating to the capitalfinal rules and the ongoing evolution, validation and regulatory approval of PNC’s models integral to the calculation of Basel IIadvanced approaches risk-weighted assets.
The access to and cost of funding for new business initiatives, the ability to undertake new business initiatives including acquisitions, the ability to engage in expanded business activities, the ability to pay dividends or repurchase shares or other capital instruments, the level of deposit insurance costs, and the level and nature of regulatory oversight depend, in large part, on a financial institution’s capital strength.
26 The PNC Financial Services Group, Inc. –Form 10-Q
We provide additional information regarding enhanced capital requirements and some of their potential impacts on PNC in Item 1A Risk Factors included in our 2012 Form 10-K.
The PNC Financial Services Group, Inc. –Form 10-Q23
OFF-BALANCE SHEET ARRANGEMENTS AANDND VARIABLE INTEREST ENTITIES
We engage in a variety of activities that involve unconsolidated entities or that are otherwise not reflected in our Consolidated Balance Sheet that are generally referred to as “off-balance sheet arrangements.” Additional information on these types of activities is included in our 2012 Form 10-K and in the following sections of this Report:
Commitments, including contractual obligations and other commitments, included within the Risk Management section of this Financial Review,
Note 3 Loan Sale and Servicing Activities and Variable Interest Entities in the Notes To Consolidated Financial Statements,
Note 11 Capital Securities of Subsidiary Trusts and Perpetual Trust Securities in the Notes To Consolidated Financial Statements, and
Note 18 Commitments and Guarantees in the Notes To Consolidated Financial Statements.
PNC consolidates variable interest entities (VIEs) when we are deemed to be the primary beneficiary. The primary beneficiary of a VIE is determined to be the party that meets both of the following criteria: (i) has the power to make decisions that most significantly affect the economic performance of the VIE and (ii) has the obligation to absorb losses or the right to receive benefits that in either case could potentially be significant to the VIE.
A summary of VIEs, including those that we have consolidated and those in which we hold variable interests but have not consolidated into our financial statements, as of March 31,June 30, 2013 and December 31, 2012 is included in Note 3 of this Report.
TRUST PREFERRED SECURITIESAND REIT PREFERRED SECURITIES
We are subject to certain restrictions, including restrictions on dividend payments, in connection with $402$265 million in principal amount of outstanding junior subordinated debentures associated with $390$257 million of trust preferred securities that were issued by various subsidiary statutory trusts (both amounts as of March 31,June 30, 2013). Generally, if there is (i) an event of default under the debentures, (ii) PNC elects to defer interest on the debentures, (iii) PNC exercises its right to defer payments on the related trust preferred securities issued by the statutory trusts or (iv) there is a default under PNC’s guarantee of such payment obligations, as specified in the applicable governing documents, then PNC would be subject during the period of such default or deferral to restrictions on dividends and other provisions protecting the status of the debenture holders similar to or in some ways more restrictive than those potentially imposed under the Exchange Agreement with PNC Preferred Funding Trust II, as described in Note 14 Capital Securities of Subsidiary Trusts and Perpetual Trust Securities in our 2012 Form 10-K. See the Liquidity Risk Management portion of the Risk Management section of this Financial Review for additional information regarding our first quarter 2013 redemption of the REIT Preferred Securities issued by PNC Preferred Funding Trust III and additional discussion of redemptions of trust preferred securities.
FAIR VALUE MEASUREMENTS
In addition to the following, see Note 9 Fair Value in the Notes To Consolidated Financial Statements in Part I, Item 1 of this Report and in our 2012 Form 10-K for further information regarding fair value.
The following table summarizes the assets and liabilities measured at fair value at March 31,June 30, 2013 and December 31, 2012, respectively, and the portionportions of such assets and liabilities that are classified within Level 3 of the valuation hierarchy.
Table 23: Fair Value Measurements – Summary
| | | | March 31, 2013 | | | December 31, 2012 | | | June 30, 2013 | | | | December 31, 2012 | |
| In millions | | Total Fair Value | | | Level 3 | | | Total Fair Value | | | Level 3 | | | Total Fair Value | | | Level 3 | | | | Total Fair Value | | | Level 3 | |
Total assets | | $ | 66,769 | | | $ | 11,206 | | | $ | 68,352 | | | $ | 10,988 | | | $ | 64,026 | | | $ | 10,812 | | | | | $ | 68,352 | | | $ | 10,988 | |
Total assets at fair value as a percentage of consolidated assets | | | 22 | % | | | | | | 22 | % | | | | | | 21 | % | | | | | | | 22 | % | | | |
Level 3 assets as a percentage of total assets at fair value | | | | | 17 | % | | | | | 16 | % | | | | | 17 | % | | | | | | | 16 | % |
Level 3 assets as a percentage of consolidated assets | | | | | 4 | % | | | | | 4 | % | | | | | 4 | % | | | | | | | 4 | % |
Total liabilities | | $ | 6,966 | | | $ | 530 | | | $ | 7,356 | | | $ | 376 | | | $ | 6,457 | | | $ | 578 | | | | | $ | 7,356 | | | $ | 376 | |
Total liabilities at fair value as a percentage of consolidated liabilities | | | 3 | % | | | | | | 3 | % | | | | | | 2 | % | | | | | | | 3 | % | | | |
Level 3 liabilities as a percentage of total liabilities at fair value | | | | | 8 | % | | | | | 5 | % | | | | | 9 | % | | | | | | | 5 | % |
Level 3 liabilities as a percentage of consolidated liabilities | | | | | <1 | % | | | | | <1 | % | | | | | <1 | % | | | | | | | <1 | % |
The PNC Financial Services Group, Inc. –Form 10-Q27
The majority of assets recorded at fair value are included in the securities available for sale portfolio. The majority of Level 3 assets represent non-agency residential mortgage-backed and asset-backed securities in the securities available for sale portfolio for which there was limited market activity.
24 The PNC Financial Services Group, Inc. –Form 10-Q
An instrument’s categorization within the hierarchy is based on the lowest level of input that is significant to the fair value measurement. PNC reviews and updates fair value hierarchy classifications quarterly. Changes from one quarter to the next related to the observability of inputs to a fair value measurement may result in a reclassification (transfer) of assets or liabilities between hierarchy levels. PNC’s policy is to recognize transfers in and transfers out as of the end of the reporting period. During the first threesix months of 2013, there were transfers of residential mortgage loans held for sale and loans from Level 2 to Level 3 of $3$6 million and $1$11 million, respectively, as a result of reduced market activity in the
nonperforming residential mortgage sales market which reduced the observability of valuation inputs. Also during 2013, there were transfers out of Level 3 residential mortgage
loans held for sale and loans of $4$7 million and $4$16 million, respectively, primarily due to the transfer of residential mortgage loans held for sale and loans to OREO. In addition, there was approximately $11$46 million of Level 3 residential mortgage loans held for sale reclassified to Level 3 loans during the first threesix months of 2013 due to the loans being reclassified from held for sale loans to held in portfolio loans. This amount was included in Transfers out of Level 3 residential mortgage loans held for sale and Transfers into Level 3 loans within Table 90: Reconciliation of Level 3 Assets and Liabilities. In the comparable period of 2012, there were transfers of assets and liabilities from Level 2 to Level 3 of $460 million consisting of mortgage-backed available for sale securities transferred as a result of a ratings downgrade which reduced the observability of valuation inputs.
EUROPEAN EXPOSURE
Table 24: Summary of European Exposure
June 30, 2013
| | March 31, 2013 | | Direct Exposure | | | | | | | | |
| | | | Direct Exposure | | | | | | Total
Exposure | |
| | | Funded | | | Unfunded | | | | | | | | | | | | Funded | | | Unfunded | | | | | | | | |
| In millions | | Loans | | | Leases | | | Securities | | | Total | | | Other (a) | | | Total
Direct
Exposure | | | Total
Indirect
Exposure | | | Total
Exposure | | | Loans | | | Leases | | | Securities | | | Total | | | Other (a) | | | Total Direct
Exposure | | | Total Indirect
Exposure | | |
Greece, Ireland, Italy, Portugal and Spain (GIIPS) | | $ | 85 | | | $ | 123 | | | | | $ | 208 | | | $ | 3 | | | $ | 211 | | | $ | 37 | | | $ | 248 | | | $ | 84 | | | $ | 124 | | | | | $ | 208 | | | $ | 3 | | | $ | 211 | | | $ | 36 | | | $ | 247 | |
Belgium and France | | | | | 72 | | | $ | 30 | | | | 102 | | | | 35 | | | | 137 | | | | 927 | | | | 1,064 | | | | | | 72 | | | | | | 72 | | | | 35 | | | | 107 | | | | 919 | | | | 1,026 | |
United Kingdom | | | 680 | | | | 32 | | | | | | 712 | | | | 360 | | | | 1,072 | | | | 587 | | | | 1,659 | | | | 747 | | | | 71 | | | | | | 818 | | | | 332 | | | | 1,150 | | | | 612 | | | | 1,762 | |
Europe – Other (b) | | | 237 | | | | 531 | | | | 244 | | | | 1,012 | | | | 93 | | | | 1,105 | | | | 713 | | | | 1,818 | | | | 107 | | | | 532 | | | $ | 324 | | | | 963 | | | | 49 | | | | 1,012 | | | | 703 | | | | 1,715 | |
Total Europe (c) | | $ | 1,002 | | | $ | 758 | | | $ | 274 | | | $ | 2,034 | | | $ | 491 | | | $ | 2,525 | | | $ | 2,264 | | | $ | 4,789 | | | $ | 938 | | | $ | 799 | | | $ | 324 | | | $ | 2,061 | | | $ | 419 | | | $ | 2,480 | | | $ | 2,270 | | | $ | 4,750 | |
| | | | | | | | | | | | | | | | | | |
| December 31, 2012 | | Direct Exposure | | | | | | | | |
| | | Funded | | | Unfunded | | | | | | | | | | | |
| In millions | | Loans | | | Leases | | | Securities | | | Total | | | Other (a) | | | Total
Direct
Exposure | | | Total
Indirect
Exposure | | | Total
Exposure | | |
Greece, Ireland, Italy, Portugal and Spain (GIIPS) | | $ | 85 | | | $ | 122 | | | | | $ | 207 | | | $ | 3 | | | $ | 210 | | | $ | 31 | | | $ | 241 | | |
Belgium and France | | | | | 73 | | | $ | 30 | | | | 103 | | | | 35 | | | | 138 | | | | 1,083 | | | | 1,221 | | |
United Kingdom | | | 698 | | | | 32 | | | | | | 730 | | | | 449 | | | | 1,179 | | | | 525 | | | | 1,704 | | |
Europe – Other (b) | | | 113 | | | | 529 | | | | 168 | | | | 810 | | | | 63 | | | | 873 | | | | 838 | | | | 1,711 | | |
Total Europe (c) | | $ | 896 | | | $ | 756 | | | $ | 198 | | | $ | 1,850 | | | $ | 550 | | | $ | 2,400 | | | $ | 2,477 | | | $ | 4,877 | | |
December 31, 2012
| | | | | | | | | | | | | | | | | | | | | | | | | | | | | | | | |
| | | Direct Exposure | | | | | | | |
| | | Funded | | | Unfunded | | | | | | | | |
| In millions | | Loans | | | Leases | | | Securities | | | Total | | | Other (a) | | | Total Direct
Exposure | | | Total Indirect
Exposure | | | Total
Exposure | |
Greece, Ireland, Italy, Portugal and Spain (GIIPS) | | $ | 85 | | | $ | 122 | �� | | | | | | $ | 207 | | | $ | 3 | | | $ | 210 | | | $ | 31 | | | $ | 241 | |
Belgium and France | | | | | | | 73 | | | $ | 30 | | | | 103 | | | | 35 | | | | 138 | | | | 1,083 | | | | 1,221 | |
United Kingdom | | | 698 | | | | 32 | | | | | | | | 730 | | | | 449 | | | | 1,179 | | | | 525 | | | | 1,704 | |
Europe – Other (b) | | | 113 | | | | 529 | | | | 168 | | | | 810 | | | | 63 | | | | 873 | | | | 838 | | | | 1,711 | |
Total Europe (c) | | $ | 896 | | | $ | 756 | | | $ | 198 | | | $ | 1,850 | | | $ | 550 | | | $ | 2,400 | | | $ | 2,477 | | | $ | 4,877 | |
| (a) | Includes unfunded commitments, guarantees, standby letters of credit and sold protection credit derivatives. |
| (b) | Europe – Other primarily consists of Denmark, Germany, Netherlands, Sweden and Switzerland. For the period ended June 30, 2013, Europe – Other also included Norway. |
| (c) | Included within Europe – Other is funded direct exposure of $68 million and $168 million consisting of AAA-rated sovereign debt securities at March 31,June 30, 2013 and December 31, 2012, respectively. There was no other direct or indirect exposure to European sovereigns as of March 31,June 30, 2013 and December 31, 2012. |
European entities are defined as supranational, sovereign, financial institutions and non-financial entities within the countries that comprise the European Union, European Union candidate countries and other European countries. Foreign exposure underwriting and approvals are centralized. PNC currently underwrites new foreignEuropean activities if the credit is generally associated with activities of its United States commercial customers, and, in the case of PNC Business Credit’s United Kingdom operations, transactions thatloans with moderate risk as they are predominantly well collateralizedsecured by self liquidatingshort-term assets such as receivables, inventories or, in limited situations, the borrower’s appraised value of certain fixed assets, such that
PNC is at minimal risk of loss.assets. Formerly, PNC had underwritten foreign infrastructure leases supported by highly rated bank letters of credit and other collateral, U.S. Treasury securities and the underlying assets of the lease. Country exposures are monitored and reported on a regular basis. We actively monitor sovereign risk, banking system health, and market conditions and adjust limits as appropriate. We rely on information from internal and external sources, including international financial institutions, economists and analysts, industry trade organizations, rating agencies, econometric data analytical service providers and geopolitical news analysis services.
28The PNC Financial Services Group, Inc. –Form 10-Q25
Among the regions and nations that PNC monitors, we have identified seven countries for which we are more closely monitoring their economic and financial situation. The basis for the increased monitoring includes, but is not limited to, sovereign debt burden, near term financing risk, political instability, GDP trends, balance of payments, market confidence, banking system distress and/or holdings of stressed sovereign debt. The countries identified are: Greece, Ireland, Italy, Portugal, Spain (collectively “GIIPS”), Belgium and France.
Direct exposure primarily consists of loans, leases, securities, derivatives, letters of credit and unfunded contractual commitments with European entities. As of March 31,June, 30, 2013, the $2.0$2.1 billion of funded direct exposure (.67%(.68% of PNC’s total assets) primarily represented $650$655 million for cross-border leases in support of national infrastructure, which were supported by letters of credit and other collateral having trigger mechanisms that require replacement or collateral in the form of cash or United States Treasury or government securities, $586$598 million for United Kingdom foreign office loans and $68 million of securities issued by AAA-rated sovereigns. The comparable level of direct exposure outstanding at December 31, 2012 was $1.9 billion (.61% of PNC’s total assets), which primarily included $645 million for cross-border leases in support of national infrastructure, $600 million for United Kingdom foreign office loans and $168 million of securities issued by AAA-rated sovereigns.
The $491$419 million of unfunded direct exposure as of March 31,June 30, 2013 was largely comprised of $360$332 million for unfunded contractual commitments primarily for United Kingdom local office commitments to PNC Business Credit corporate customers on a secured basis or activities supporting our domestic customers export activities through the confirmation of trade letters of credit. Comparably, the $550 million of unfunded direct exposure as of December 31, 2012 was largely comprised of $449 million for unfunded contractual commitments primarily for United Kingdom local office commitments to PNC Business Credit corporate customers on a secured basis or activities supporting our domestic customers export activities through the confirmation of trade letters of credit.
We also track European financial exposures where our clients, primarily U.S. entities, appoint PNC as a letter of credit
issuing bank and we elect to assume the joint probability of default risk. As of March 31,June 30, 2013 and December 31, 2012, PNC had $2.3 billion and $2.5 billion, respectively, of indirect exposure. For PNC to incur a loss in these indirect exposures, both the obligor and the financial counterparty participating bank would need to default. PNC assesses both the corporate customers and the participating banks for counterparty risk and where PNC has found that a participating bank exposes PNC to unacceptable risk, PNC will reject the participating bank as an acceptable counterparty and will ask the corporate customer to find an acceptable participating bank.
Direct and indirect exposure to entities in the GIIPS countries totaled $248$247 million as of March 31,June 30, 2013, of which $123$124 million was direct exposure for cross-border leases within Portugal, $67 million represented direct exposure for loans outstanding within Ireland and $37$36 million represented indirect exposure for letters of credit with strong underlying obligors, primarily U.S. entities, with participating banks in Ireland, Italy and Spain. The comparable amounts as of December 31, 2012 were total direct and indirect exposure of $241 million, consisting of $122 million of direct exposure for cross-border leases within Portugal, $67 million represented direct exposure for loans outstanding within Ireland and $31 million represented indirect exposure for letters of credit with strong underlying obligors, primarily U.S. entities, with participating banks in Ireland, Italy and Spain.
Direct and indirect exposure to entities in Belgium and France totaled $1.1$1.0 billion as of March 31,June 30, 2013. Direct exposure of $137$107 million primarily consisted of $69$70 million for cross-border leases within Belgium and $35 million for unfunded contractual commitments in France and $30 million of covered bonds issued by a financial institution in France. Indirect exposure was $927$919 million for letters of credit with strong underlying obligors, primarily U.S. entities, with creditworthy participant banks in France and Belgium. The comparable amounts as of December 31, 2012 were total direct and indirect exposure of $1.2 billion of which there was $138 million of direct exposure primarily consisting of $69 million for cross-border leases within Belgium, $35 million for unfunded contractual commitments in France and $30 million of covered bonds issued by a financial institution in France. Indirect exposure at December 31, 2012 was $1.1 billion for letters of credit with strong underlying obligors and creditworthy participant banks in France and Belgium.
26The PNC Financial Services Group, Inc. –Form 10-Q29
BUSINESS SEGMENTS REVIEW
We have six reportable business segments:
Corporate & Institutional Banking
Residential Mortgage Banking
Non-Strategic Assets Portfolio
Business segment results, including inter-segment revenues, and a description of each business are included in Note 19 Segment Reporting included in the Notes To Consolidated Financial Statements in Part I, Item 1 of this Report. Certain amounts included in this Financial Review differ from those amounts shown in Note 19 primarily due to the presentation in this Financial Review of business net interest revenue on a taxable-equivalent basis.
Results of individual businesses are presented based on our internal management reporting practices. There is no comprehensive, authoritative body of guidance for management accounting equivalent to GAAP; therefore, the financial results of our individual businesses are not necessarily comparable with similar information for any other company. We periodically refine our internal methodologies as management reporting practices are enhanced. To the extent practicable, retrospective application of new methodologies is made to prior period reportable business segment results and disclosures to create comparability to the current period presentation to reflect any such refinements.
Financial results are presented, to the extent practicable, as if each business operated on a stand-alone basis. Additionally, we have aggregated the results for corporate support functions within “Other” for financial reporting purposes.
Assets receive a funding charge and liabilities and capital receive a funding credit based on a transfer pricing
methodology that incorporates product maturities, duration and other factors. A portion of capital is intended to cover unexpected losses and is assigned to our business segments using our risk-based economic capital model, including consideration of the goodwill and other intangible assets at those business segments, as well as the diversification of risk among the business segments.
We have allocated the allowances for loan and lease losses and for unfunded loan commitments and letters of credit based on our assessment of risk in each business segment’s loan portfolio. Key reserve assumptions and estimation processes react to and are influenced by observed changes in loan portfolio performance experience, the financial strength of the borrower, and economic conditions. Key reserve assumptions are periodically updated. Our allocation of the costs incurred by operations and other shared support areas not directly aligned with the businesses is primarily based on the use of services.
Total business segment financial results differ from total consolidated net income. The impact of these differences is reflected in the “Other” category. “Other” for purposes of this Business Segments Review and the Business Segment Highlights in the Executive Summary section of this Financial Review includes residual activities that do not meet the criteria for disclosure as a separate reportable business, such as gains or losses related to BlackRock transactions, integration costs, asset and liability management activities including net securities gains or losses, other-than-temporary impairment of investment securities and certain trading activities, exited businesses, private equity investments, intercompany eliminations, most corporate overhead, tax adjustments that are not allocated to business segments and differences between business segment performance reporting and financial statement reporting (GAAP), including the presentation of net income attributable to noncontrolling interests as the segments’ results exclude their portion of net income attributable to noncontrolling interests.
30The PNC Financial Services Group, Inc. –Form 10-Q27
RETAIL BANKING
(Unaudited)
Table 25: Retail Banking Table
| Three months ended March 31 Dollars in millions, except as noted | | 2013 | | 2012 | | |
Six months ended June 30 Dollars in millions, except as noted | | | 2013 | | 2012 | |
Income Statement | | | | | | | | | | |
Net interest income | | $ | 1,049 | | | $ | 1,045 | | | $ | 2,061 | | | $ | 2,159 | |
Noninterest income | | | | | | | | | | |
Service charges on deposits | | | 129 | | | | 121 | | | | 270 | | | | 258 | |
Brokerage | | | 52 | | | | 45 | | | | 110 | | | | 94 | |
Consumer services | | | 216 | | | | 191 | | | | 445 | | | | 404 | |
Other | | | 37 | | | | 34 | | | | 151 | | | | 72 | |
Total noninterest income | | | 434 | | | | 391 | | | | 976 | | | | 828 | |
Total revenue | | | 1,483 | | | | 1,436 | | | | 3,037 | | | | 2,987 | |
Provision for credit losses | | | 162 | | | | 135 | | | | 310 | | | | 300 | |
Noninterest expense | | | 1,131 | | | | 1,069 | | | | 2,287 | | | | 2,240 | |
Pretax earnings | | | 190 | | | | 232 | | | | 440 | | | | 447 | |
Income taxes | | | 70 | | | | 85 | | | | 162 | | | | 164 | |
Earnings | | $ | 120 | | | $ | 147 | | | $ | 278 | | | $ | 283 | |
Average Balance Sheet | | | | | | | | | | |
Loans | | | | | | | | | | |
Consumer | | | | | | | | | | |
Home equity | | $ | 28,913 | | | $ | 26,759 | | | $ | 29,063 | | | $ | 27,499 | |
Indirect auto | | | 7,006 | | | | 4,439 | | | | 7,161 | | | | 4,735 | |
Indirect other | | | 1,000 | | | | 1,292 | | | | 969 | | | | 1,242 | |
Education | | | 8,220 | | | | 9,440 | | | | 8,101 | | | | 9,270 | |
Credit cards | | | 4,108 | | | | 3,928 | | | | 4,085 | | | | 4,001 | |
Other | | | 2,141 | | | | 1,888 | | | | 2,141 | | | | 2,222 | |
Total consumer | | | 51,388 | | | | 47,746 | | | | 51,520 | | | | 48,969 | |
Commercial and commercial real estate | | | 11,290 | | | | 10,682 | | | | 11,318 | | | | 11,083 | |
Floor plan | | | 2,014 | | | | 1,663 | | | | 2,031 | | | | 1,733 | |
Residential mortgage | | | 811 | | | | 1,031 | | | | 788 | | | | 1,002 | |
Total loans | | | 65,503 | | | | 61,122 | | | | 65,657 | | | | 62,787 | |
Goodwill and other intangible assets | | | 6,148 | | | | 5,888 | | | | 6,138 | | | | 6,058 | |
Other assets | | | 2,465 | | | | 2,699 | | | | 2,522 | | | | 2,575 | |
Total assets | | $ | 74,116 | | | $ | 69,709 | | | $ | 74,317 | | | $ | 71,420 | |
Deposits | | | | | | | | | | |
Noninterest-bearing demand | | $ | 20,744 | | | $ | 18,764 | | | $ | 20,967 | | | $ | 19,572 | |
Interest-bearing demand | | | 31,183 | | | | 25,707 | | | | 31,595 | | | | 26,986 | |
Money market | | | 48,291 | | | | 43,601 | | | | 48,469 | | | | 45,436 | |
Total transaction deposits | | | 100,218 | | | | 88,072 | | | | 101,031 | | | | 91,994 | |
Savings | | | 10,537 | | | | 9,077 | | | | 10,768 | | | | 9,489 | |
Certificates of deposit | | | 22,683 | | | | 28,150 | | | | 22,251 | | | | 27,309 | |
Total deposits | | | 133,438 | | | | 125,299 | | | | 134,050 | | | | 128,792 | |
Other liabilities | | | 273 | | | | 629 | | | | 308 | | | | 410 | |
Capital | | | 9,058 | | | | 8,328 | | | | 8,967 | | | | 8,391 | |
Total liabilities and equity | | $ | 142,769 | | | $ | 134,256 | | | $ | 143,325 | | | $ | 137,593 | |
Performance Ratios | | | | | | | | | | |
Return on average capital | | | 5 | % | | | 7 | % | | | 6 | % | | | 7 | % |
Return on average assets | | | .66 | | | | .85 | | | | .75 | | | | .80 | |
Noninterest income to total revenue | | | 29 | | | | 27 | | | | 32 | | | | 28 | |
Efficiency | | | 76 | | | | 74 | | | | 75 | | | | 75 | |
Other Information (a) | | | | | | |
Credit-related statistics: | | | | | | |
Commercial nonperforming assets | | | $ | 222 | | | $ | 275 | |
Consumer nonperforming assets | | | | 1,068 | | | | 685 | |
Total nonperforming assets (b) | | | $ | 1,290 | | | $ | 960 | |
Purchased impaired loans (c) | | | $ | 750 | | | $ | 886 | |
Commercial lending net charge-offs | | | $ | 59 | | | $ | 66 | |
Credit card lending net charge-offs | | | | 84 | | | | 99 | |
Consumer lending (excluding credit card) net charge-offs | | | | 259 | | | | 213 | |
Total net charge-offs | | | $ | 402 | | | $ | 378 | |
Commercial lending annualized net charge-off ratio | | | | .89 | % | | | 1.04 | % |
Credit card lending annualized net charge-off ratio | | | | 4.15 | % | | | 4.98 | % |
Consumer lending (excluding credit card) annualized net charge-off ratio (h) | | | | 1.08 | % | | | .93 | % |
Total annualized net charge-off ratio (h) | | | | 1.23 | % | | | 1.21 | % |
| Three months ended March 31 Dollars in millions, except as noted | | 2013 | | 2012 | | |
Other Information (a) | | | | | | |
Credit-related statistics: | | | | | | |
Commercial nonperforming assets | | $ | 230 | | | $ | 315 | | |
Consumer nonperforming assets | | | 1,050 | | | | 650 | | |
Total nonperforming assets (b) | | $ | 1,280 | | | $ | 965 | | |
Purchased impaired loans (c) | | $ | 788 | | | $ | 903 | | |
Commercial lending net charge-offs | | $ | 37 | | | $ | 28 | | |
Credit card lending net charge-offs | | | 45 | | | | 50 | | |
Consumer lending (excluding credit card) net charge-offs | | | 168 | | | | 113 | | |
Total net charge-offs | | $ | 250 | | | $ | 191 | | |
Commercial lending annualized net charge-off ratio | | | 1.13 | % | | | .91 | % | |
Credit card lending annualized net charge-off ratio | | | 4.44 | % | | | 5.12 | % | |
Consumer lending (excluding credit card) annualized net charge-off ratio | | | 1.42 | % | | | 1.01 | % | |
Total annualized net charge-off ratio | | | 1.55 | % | | | 1.26 | % | |
At June 30 Dollars in millions, except as noted | | | 2013 | | | 2012 | |
Other Information (Continued) (a) | | | | | | |
Home equity portfolio credit statistics: (d) | Home equity portfolio credit statistics: (d) | | | | | | |
% of first lien positions at origination (e) | | | 48 | % | | | 37 | % | | | 50 | % | | | 39 | % |
Weighted-average loan-to-value ratios (LTVs) (e) (f) | | | 85 | % | | | 81 | % | | | 85 | % | | | 78 | % |
Weighted-average updated FICO scores (g) | | | 743 | | | | 739 | | | | 745 | | | | 742 | |
Annualized net charge-off ratio (h) | | | 1.97 | % | | | 1.11 | % | | | 1.39 | % | | | 1.01 | % |
Delinquency data: (i) | | | | | | | | | | |
Loans 30 – 59 days past due | | | .44 | % | | | .56 | % | | | .20 | % | | | .32 | % |
Loans 60 – 89 days past due | | | .24 | % | | | .35 | % | | | .08 | % | | | .18 | % |
Loans 90 days past due | | | .99 | % | | | 1.24 | % | |
Total accruing loans past due | | | | .28 | % | | | .50 | % |
Nonperforming loans | | | | 3.12 | % | | | 1.98 | % |
Other statistics: | | | | | | | | | | |
ATMs | | | 7,303 | | | | 7,220 | | | | 7,335 | | | | 7,206 | |
Branches (j) | | | 2,856 | | | | 2,900 | | | | 2,780 | | | | 2,888 | |
Full service brokerage offices | | | 39 | | | | 38 | | | | 37 | | | | 40 | |
Brokerage account assets (billions) | | $ | 39 | | | $ | 37 | | | $ | 39 | | | $ | 36 | |
Customer-related statistics: (in thousands) | Customer-related statistics: (in thousands) | | | | | | | | | |
Retail Banking checking relationships | | | 6,534 | | | | 6,278 | | | | 6,589 | | | | 6,349 | |
Retail online banking active customers | | | 4,234 | | | | 3,823 | | | | 4,271 | | | | 3,953 | |
Retail online bill payment active customers | | | 1,260 | | | | 1,161 | | | | 1,270 | | | | 1,189 | |
| (a) | Presented as of March 31,June 30, except for net charge-offs and annualized net charge-off ratios, which are for the threesix months ended. |
| (b) | Includes nonperforming loans of $1.2 billion at March 31,June 30, 2013 and $.9$0.9 billion at March 31,June 30, 2012. |
| (c) | Recorded investment of purchased impaired loans related to acquisitions. |
| (d) | Lien position, LTV and FICO statistics are based upon customer balances. |
| (e) | Lien position and LTV calculation at March 31,June 30, 2013 reflect the use of revised assumptions where data is missing. |
| (f) | LTV statistics are based upon current information. |
| (g) | Represents FICO scores that are updated at least quarterly. |
| (h) | RatioRatios for the threesix months ended March 31,June 30, 2013 includesinclude additional consumer charge-offs taken as a result of alignment with interagency guidance on practices for loans and lines of credit we implemented in the first quarter of 2013. |
| (i) | Delinquency data includes nonaccrual loans. Amounts as of March 31, 2013 areData based upon recorded investment; previous quarters’investment. Past due amounts exclude purchased impaired loans, even if contractually past due as we are based upon unpaid principal balances.currently accreting interest income over the expected life of the loans. In the first quarter of 2012, we adopted a policy stating that Home equity loans past due 90 days or more would be placed on nonaccrual status. |
| (j) | Excludes satellite offices (e.g., drive-ups, electronic branches and retirement centers) that provide limited products and/or services. |
28 The PNC Financial Services Group, Inc. –Form 10-Q
Retail Banking earned $120$278 million in the first quartersix months of 2013 compared with earnings of $147$283 million for the same period a year ago. The decrease in earnings resulted fromEarnings were essentially flat compared to a year ago as higher noninterest expense and provision for credit losses, both attributable to the full quarter impact of the RBC Bank (USA) acquisition. Noninterest income was alsooffset by lower net interest income and higher compared with the first quarter of 2012 primarily due to increased debit and credit card transactions, brokerage activity and the RBC Bank (USA) acquisition.noninterest expense.
Retail Banking’s core strategy is to efficiently grow consumer and small business checking householdscustomers by providing an experience that builds customer loyalty and creates opportunities to sell our savings, loans,expands loan, investment productsproduct, and money management services.share of wallet. Net checking relationships grew 59,000114,000 in the first threesix months of 2013. The growth reflects strong results and gains in allthe majority of our markets, as well as strong customer retention in the overall network. As customer preferences for convenience evolve, we continue to provide more cost effective alternate servicing channels. Non-branch
The PNC Financial Services Group, Inc. –Form 10-Q31
deposits via ATM and mobile channels increased from 14%14 percent a year ago to 20%23 percent of the total deposits in the first quarterhalf of 2013. Active online banking customers and active online bill payment customers increased by 11%8% and 9%7%, respectively, from a year ago.
Retail Banking’s footprint extends across 17 states and Washington, D.C., covering nearly half the U.S. population and serving 5,784,0005.8 million consumers and 750,000757 thousand small businesses with 2,8562,780 branches and 7,3037,335 ATMs. PNC consolidated 30108 branches in the first quarter and hassix months of 2013 with plans to close aan approximate total of approximately 200 branches in 2013.this year. We will continue to invest selectively in new branches. This quarter five branches were opened.and we opened seven branches in the first half of 2013.
Total revenue for the first threesix months of 2013 was $1.5$3.0 billion, compared with $1.4 billion for$50 million higher than the same period of 2012. Net interest income increased $4of $2.1 billion decreased $98 million compared with the first threesix months of 2012. The increasedecrease resulted from higher organic loanspread compression on both loans and transaction deposit balances, lower rates paid on deposits, and the impact of the RBC Bank (USA) acquisition.deposits.
Noninterest income increased $43$148 million compared to the first three monthshalf of 2012. The increase was driven by higher volumesthe second quarter pretax gain of customer debit card and credit card transactions, brokerage activity$83 million on the sale of Visa Class B common shares and the RBC Bank (USA) acquisition.impact of higher customer-initiated fee based transactions.
The provision for credit losses was $162$310 million and net charge-offs were $402 million in the first quartersix months of 2013 and net charge-offs were $250 million compared with $135$300 million and $191$378 million, respectively, for the same period in 2012. The increase in the provision for credit losses year over year is attributablenet charge-offs year-over-year was due to the impact of the RBC Bank (USA) acquisition. The increase in net charge-offs was due to the alignment with interagency guidance.regulatory guidance in the first quarter of 2013.
Noninterest expense increased $62$47 million in the first threesix months of 2013 compared to the same period of 2012. The increase was primarily attributable to the first three monthsa greater number of 2013 including a full quarter ofmonths’ operating expenses in 2013 associated with the RBC Bank (USA) acquisition.acquisition, partially offset by lower additions to legal reserves.
Growing core checking deposits is key to Retail Banking’s growth and to providing a source of low-cost funding to PNC. The deposit product strategy of Retail Banking is to remain disciplined on pricing, target specific products and markets for growth, and focus on the retention and growth of balances for relationship customers. In the first threesix months of 2013, average total deposits of $133.4$134.1 billion increased $8.1$5.3 billion, or 6%4%, compared with the same period in 2012.
Average transaction deposits grew $12.1$9.0 billion, or 14%,10% and average savings deposit balances grew $1.5$1.3 billion or 16%, compared with the first three months of 201213% year-over-year as a result of organic deposit growth, continued customer preference for liquidity and the RBC Bank (USA) acquisition. In the first threesix months of 2013, compared with the same period a year ago, average demand deposits increased $7.5$6.0 billion, or 17%13%, to $51.9$52.6 billion and average money market deposits increased $4.7 billion, or 11%, to $48.3 billion.
| | money market deposits increased $3.0 billion, or 7%, to $48.5 billion. |
Total average certificates of deposit decreased $5.5$5.1 billion or 19%, compared to the same period in 2012. The decline in average certificates of deposit was due to the run-off of maturing accounts partially offset by the impact of the RBC Bank (USA) acquisition.accounts.
The PNC Financial Services Group, Inc. –Form 10-Q29
Retail Banking continues to focus on a relationship-based lending strategy that targets specific products and markets for growth, small businessesbusiness and auto dealerships. In the first threesix months of 2013, average total loans were $65.5$65.7 billion, an increase of $4.4$2.9 billion, or 7%5%, over the same period in 2012.
Average indirect auto loans increased $2.6$2.4 billion, or 58%51%, over the first threesix months of 2012. The increase was primarily due to the expansion of our indirect sales force and product introduction to acquired markets, as well as overall increases in auto sales.
Average home equity loans increased $2.2$1.6 billion, or 8%6%, compared with the same period in 2012. The increase was due todriven by the RBC Bank (USA) acquisition. The remainder of the portfolio was relatively flatgrew modestly as increases in term loans were offset by declines in lines of credit. Retail Banking’s home equity loan portfolio is relationship based, with 97% of the portfolio attributable to borrowers in our primary geographic footprint.
Average auto dealer floor plan loans grew $298 million, or 17%, compared with the first six months of 2012, primarily resulting from dealer line utilization and additional dealer relationships.
Average commercial and commercial real estate loans increased $608$235 million, or 6%2%, compared with the same period in 2012. The increase was due to the acquisition of RBC Bank (USA). The remainder of the portfolio showed a decline as loan demand was outpaced by paydowns, refinancings, and charge-offs.
Average auto dealer floor plan loans grew $351 million, or 21%, compared with the first three months of 2012, primarily resulting from dealer line utilization and additional dealer relationships.
Average credit card balances increased $180$84 million, or 5%2%, compared with the same period of 2012 as a result of the portfolio purchase from RBC Bank (Georgia), National Association in March 2012.
Average education loans for the first threesix months of 2013 declined $1.2 billion or 13%, compared with the same period in 2012. The decline was a result of run-off of the discontinued government guaranteed portfolio.
Average indirect other and residential mortgages in this segment are primarily run-off portfolios and declined $292$273 million and $220$214 million, respectively, compared with the same period in 2012. The indirect other portfolio is comprised of marine, RV, and other indirect loan products.
Nonperforming assets totaled $1.3 billion in the first quarter ofat June 30, 2013, a 33%34% increase from a year ago. The increase was in consumer assets and was due to the alignment with interagency guidance.guidance on practices for loans and lines of credit related to consumer loans that we implemented in the first quarter of 2013.
3032 The PNC Financial Services Group, Inc. –Form 10-Q
CORPORATE & INSTITUTIONAL BANKING
(Unaudited)
Table 26: Corporate & Institutional Banking Table
| Three months ended March 31 Dollars in millions, except as noted | | 2013 | | | 2012 | | |
Six months ended June 30 Dollars in millions, except as noted | | | 2013 | | | 2012 | |
Income Statement | | | | | | | | | | |
Net interest income | | $ | 956 | | | $ | 938 | | | $ | 1,899 | | | $ | 2,023 | |
Noninterest income | | | | | | | | | | |
Corporate service fees | | | 246 | | | | 200 | | | | 543 | | | | 448 | |
Other | | | 139 | | | | 128 | | | | 319 | | | | 234 | |
Noninterest income | | | 385 | | | | 328 | | | | 862 | | | | 682 | |
Total revenue | | | 1,341 | | | | 1,266 | | | | 2,761 | | | | 2,705 | |
Provision for credit losses | | | 14 | | | | 19 | | |
Provision for credit losses (benefit) | | | | (26 | ) | | | 52 | |
Noninterest expense | | | 480 | | | | 463 | | | | 979 | | | | 959 | |
Pretax earnings | | | 847 | | | | 784 | | | | 1,808 | | | | 1,694 | |
Income taxes | | | 306 | | | | 289 | | | | 655 | | | | 622 | |
Earnings | | $ | 541 | | | $ | 495 | | | $ | 1,153 | | | $ | 1,072 | |
Average Balance Sheet | | | | | | | | | | |
Loans | | | | | | | | | | |
Commercial | | $ | 52,893 | | | $ | 42,919 | | | $ | 53,696 | | | $ | 46,004 | |
Commercial real estate | | | 16,876 | | | | 14,388 | | | | 16,939 | | | | 15,158 | |
Commercial – real estate related | | | 6,826 | | | | 4,971 | | | | 6,902 | | | | 5,258 | |
Asset-based lending | | | 11,181 | | | | 9,266 | | | | 11,397 | | | | 9,510 | |
Equipment lease financing | | | 6,552 | | | | 5,706 | | | | 6,604 | | | | 5,808 | |
Total loans | | | 94,328 | | | | 77,250 | | | | 95,538 | | | | 81,738 | |
Goodwill and other intangible assets | | | 3,752 | | | | 3,442 | | | | 3,763 | | | | 3,595 | |
Loans held for sale | | | 1,236 | | | | 1,244 | | | | 1,101 | | | | 1,217 | |
Other assets | | | 12,355 | | | | 10,960 | | | | 11,539 | | | | 11,316 | |
Total assets | | $ | 111,671 | | | $ | 92,896 | | | $ | 111,941 | | | $ | 97,866 | |
Deposits | | | | | | | | | | |
Noninterest-bearing demand | | $ | 40,572 | | | $ | 37,225 | | | $ | 40,239 | | | $ | 37,519 | |
Money market | | | 17,023 | | | | 13,872 | | | | 16,977 | | | | 14,803 | |
Other | | | 6,979 | | | | 5,372 | | | | 6,947 | | | | 5,653 | |
Total deposits | | | 64,574 | | | | 56,469 | | | | 64,163 | | | | 57,975 | |
Other liabilities | | | 18,779 | | | | 15,987 | | | | 17,914 | | | | 16,769 | |
Capital | | | 9,588 | | | | 8,537 | | | | 9,541 | | | | 8,676 | |
Total liabilities and equity | | $ | 92,941 | | | $ | 80,993 | | | $ | 91,618 | | | $ | 83,420 | |
Performance Ratios | | | | | | | | | | |
Return on average capital | | | 23 | % | | | 23 | % | | | 24 | % | | | 25 | % |
Return on average assets | | | 1.96 | | | | 2.14 | | | | 2.08 | | | | 2.20 | |
Noninterest income to total revenue | | | 29 | | | | 26 | | | | 31 | | | | 25 | |
Efficiency | | | 36 | | | | 37 | | | | 35 | | | | 35 | |
| Three months ended March 31 Dollars in millions, except as noted | | 2013 | | | 2012 | | |
Six months ended June 30 Dollars in millions, except as noted | | | 2013 | | | 2012 | |
Commercial Mortgage Servicing Portfolio(in billions) | | | | | | | | | | |
Beginning of period | | $ | 282 | | | $ | 267 | | | $ | 282 | | | $ | 267 | |
Acquisitions/additions | | | 21 | | | | 10 | | | | 39 | | | | 17 | |
Repayments/transfers | | | (13 | ) | | | (9 | ) | | | (27 | ) | | | (20 | ) |
End of period | | $ | 290 | | | $ | 268 | | | $ | 294 | | | $ | 264 | |
Other Information | | | | | | | | | | |
Consolidated revenue from: (a) | | | | | | | | | | |
Treasury Management (b) | | $ | 329 | | | $ | 343 | | | $ | 642 | | | $ | 697 | |
Capital Markets (c) | | $ | 131 | | | $ | 156 | | | $ | 327 | | | $ | 307 | |
Commercial mortgage loans held for sale (d) | | $ | 38 | | | $ | 13 | | | $ | 69 | | | $ | 47 | |
Commercial mortgage loan servicing income, net of amortization (e) | | | 53 | | | | 30 | | | | 106 | | | | 83 | |
Commercial mortgage servicing rights recovery/(impairment), net of economic hedge (f) | | | 11 | | | | 5 | | | | 55 | | | | (1 | ) |
Total commercial mortgage banking activities | | $ | 102 | | | $ | 48 | | | $ | 230 | | | $ | 129 | |
Total loans (g) | | $ | 94,843 | | | $ | 84,329 | | | $ | 97,708 | | | $ | 88,810 | |
Net carrying amount of commercial mortgage servicing rights (g) | | $ | 452 | | | $ | 428 | | | $ | 525 | | | $ | 398 | |
Credit-related statistics: | | | | | | | | | | |
Nonperforming assets (g) (h) | | $ | 1,082 | | | $ | 1,776 | | | $ | 999 | | | $ | 1,686 | |
Purchased impaired loans (g) (i) | | $ | 768 | | | $ | 1,177 | | | $ | 708 | | | $ | 1,088 | |
Net charge-offs | | $ | 58 | | | $ | 43 | | | $ | 39 | | | $ | 73 | |
| (a) | Represents consolidated PNC amounts. See the additional revenue discussion regarding treasury management, capital markets-related products and services, and commercial mortgage banking activities in the Product Revenue section of the Consolidated Income StatementCorporate & Institutional Banking Review. |
| (b) | Includes amounts reported in net interest income and corporate service fees. |
| (c) | Includes amounts reported in net interest income, corporate service fees and other noninterest income. |
| (d) | Includes valuations on commercial mortgage loans held for sale and related commitments, derivative valuations, origination fees, gains on sale of loans held for sale and net interest income on loans held for sale. |
| (e) | Includes net interest income and noninterest income from loan servicing and ancillary services, net of commercial mortgage servicing rights amortization and a direct write-down of commercial mortgage servicing rights of $24 million recognized in the first quarter of 2012. Commercial mortgage servicing rights (impairment)/recovery, net of economic hedge is shown separately. |
| (f) | Includes amounts reported in corporate services fees. |
| (g) | As of March 31.June 30. |
| (h) | Includes nonperforming loans of $.9 billion at March 31,June 30, 2013 and $1.6 billion at March 31,June 30, 2012. |
| (i) | Recorded investment of purchased impaired loans related to acquisitions. |
The PNC Financial Services Group, Inc. –Form 10-Q 3133
Corporate & Institutional Banking earned $541 million$1.2 billion in the first threesix months of 2013, an increase of $81 million compared with $495 million in the first threesix months of 2012. The increase in earnings was primarily due to the full quarter impact of the RBC Bank (USA) acquisitionan increase in noninterest income and organic growth.improved credit quality, partially offset by lower net interest income. We continued to focus on building client relationships, including increasing cross sales and adding new clients where the risk-return profile was attractive.
Results infor the first threesix months of 2013 include the impact of the RBC Bank (USA) acquisition, which added approximately $7.5 billion of loans and $4.8 billion of deposits as of March 2, 2012.
Highlights of Corporate & Institutional Banking’s performance in the first three months of 2013 include the following:
Corporate & Institutional Banking continued to execute on strategic initiatives, including in the Southeast, by organically growing and deepening client relationships that meet our risk/return measures. Approximately 140345 new primary Corporate Banking clients were added in the first threesix months of 2013.
Loan commitments increased 12%10% to $183$186 billion at March 31,June 30, 2013 compared to March 31,June 30, 2012, primarily due to the RBC Bank (USA) acquisition and growth in our Corporate Banking, Real Estate and Business Credit and Corporate Banking businesses.
Period-end loan balances have increased for the tentheleventh consecutive quarter, including an increase of 1.2%3.0% at June 30, 2013 compared with March 31, 2013 and 10.0% compared with December 31, 2012 and 12.5% compared with March 31,June 30, 2012.
Our Treasury Management business, which ranks among the top providers in the country, continued to invest in markets, products and infrastructure as well as major initiatives such as healthcare.
Midland Loan Services was the number one servicer of Fannie Mae and Freddie Mac multifamily and healthcare loans and was the second leading servicer of commercial and multifamily loans by volume as of December 31, 2012 according to Mortgage Bankers Association. Midland is the only U.S. commercial mortgage servicer to receive the highest primary, master and special servicer ratings from Fitch Ratings, Standard & Poor’s and Morningstar.
Mergers and Acquisitions Journal named Harris Williams & Co. its 2012 Mid-Market Investment Bank of the Year. This is the second time in three years that Harris Williams & Co. has earned the title.
Net interest income was $956 million$1.9 billion in the first threesix months of 2013, an increasea decrease of $18$124 million from the first threesix months of 2012, reflecting higher averagelower spreads on loans and deposits and lower purchase accounting accretion, partially offset by lower spreads onhigher average loans and deposits.
Corporate service fees were $246$543 million in the first threesix months of 2013, an increase of $46$95 million from the first three six
months of 2012, primarily due to higher commercial mortgage servicing revenue primarily driven by the impact of higher market interest rates on commercial mortgage servicing rights valuations, and higher treasury management fees, partially offset by lower merger and acquisition advisory fees. The major components of corporate service fees are treasury management revenue, corporate finance fees, including revenue from certain capital markets-related products and services, and commercial mortgage servicing revenue.
Other noninterest income was $139$319 million in the first threesix months of 2013 compared with $128$234 million in the first threesix months of 2012. The increase of $11$85 million was primarily duedriven by the impact of higher market interest rates on credit valuations related to higher revenue fromcustomer-initiated hedging activities and an increase in commercial mortgage loans held for sale, net of valuations, partiallywhich more than offset by lower customer driven derivatives revenue.
The provision for credit losses was $14a benefit of $26 million in the first threesix months of 2013 compared with $19a provision of $52 million in the first threesix months of 2012. Positive2012, primarily due to positive credit migration offset the impact of higher loan and commitment levels.migration. Overall strong credit quality remains.remains strong. Net charge-offs were $58$39 million in the first threesix months of 2013, which increased $15decreased $34 million, or 35%47%, compared with 2012. Thethe 2012 period primarily attributable to lower levels of commercial real estate and commercial charge-offs and an increase was attributable primarily to thein commercial portfolio.real estate recoveries.
Nonperforming assets declined for the twelfththirteenth consecutive quarter, and at $1.1$1.0 billion, represented a 39%41% decrease from March 31,June 30, 2012 as a result of improving credit quality.
Noninterest expense was $480$979 million in the first threesix months of 2013, an increase of $17$20 million or 2% from 2012. Higher compensation-related costs were driven by improved performancethe comparable period of 2012, and higher staffing, including a full quarterincluded the impact of the RBC Bank (USA) acquisition.acquisition and higher asset impairments.
32 The PNC Financial Services Group, Inc. –Form 10-Q
Average loans were $94.3$95.5 billion in the first threesix months of 2013 compared with $77.3$81.7 billion in the first threesix months of 2012, an increase of 22%17%. Organically, average loans grew 18% inThis increase includes 16% organic growth, excluding the comparison.impact of the RBC Bank (USA) acquisition.
The Corporate Banking business provides lending, treasury management and capital markets-related products and services to mid-sized corporations, government and not-for-profit entities, and selectively to large corporations. Average loans for this business increased $9.4$7.4 billion, or 24%17%, in the first threesix months of 2013 compared with the first threesix months of 2012, primarily due to an increase in loan commitments from new customers. Organically, average loans for this business grew 17%15% in the comparison.
PNC Real Estate provides commercial real estate and real estate-related lending and is one of the industry’s top providers of both conventional and affordable multifamily financing. Average loans for this business increased $3.7$3.6 billion, or 21%20%, in the first three months of 2013 compared with the first three months of 2012 due to increased originations.
34 The PNC Financial Services Group, Inc. –Form 10-Q
| | six months of 2013 compared with the first six months of 2012 due to increased originations. |
PNC Business Credit is one of the top three asset-based lenders in the country, as of year-end 2012, with increasing market share according to the Commercial Finance Association. The loan portfolio is relatively high yielding, with moderate risk as the loans are mainly secured by short-term assets. Average loans increased $1.9 billion, or 21%20%, in the first threesix months of 2013 compared with the first threesix months of 2012 due to customers seeking stable lending sources, loan usage rates and market share expansion.
PNC Equipment Finance is the 4th largest bank-affiliated leasing company with over $11 billion in equipment finance assets.
Average deposits were $64.6$64.2 billion in the first threesix months of 2013, an increase of $8.1$6.2 billion, or 14%11%, compared with the first threesix months of 2012 due to deposits added in the RBC Bank (USA) acquisition and inflows into noninterest-bearing deposits.
The commercial mortgage servicing portfolio was $290$294 billion at March 31,June 30, 2013 compared with $268$264 billion at March 31,June 30, 2012 as servicing additions exceeded portfolio run-off.
Product Revenue
In addition to credit and deposit products for commercial customers, Corporate & Institutional Banking offers other services, including treasury management, capital markets-related products and services, and commercial mortgage banking activities, for customers of all our business segments. The revenue from these other services is included in net interest income, corporate service fees and other noninterest income. The majority of the revenue and expense related to these services is reflected in the Corporate & Institutional Banking segment results and the remainder is reflected in the results of other businesses. The Other Information section in Table 26: Corporate & Institutional Banking Table in this Business Segments Review section includes the consolidated revenue to PNC for these services. A discussion of the consolidated revenue from these services follows.
Treasury management revenue, comprised of fees and net interest income from customer deposit balances, totaled $329$642 million for the first threesix months of 2013 and $343$697 million for the first threesix months of 2012. Lower spreads on deposits drove the decline in revenue in the first threesix months of 2013 compared to the first threesix months of 2012. Growth in deposit balances and core businesses such as commercial card, account services, wire and ACH was strong.
Capital markets revenue includes merger and acquisition advisory fees, loan syndications, derivatives, foreign exchange, fees on the asset-backed commercial paper conduit and fixed income activities. Revenue from capital markets-related products and services totaled $131$327 million in the first threesix months of 2013 compared with $156$307 million in the first threesix months of 2012. The increase in the comparison reflects lower customerwas driven capital markets activity andby the impact of higher market interest rates on credit valuations related to customer-initiated hedging activities, mostly offset by lower merger and acquisition advisory fees.fees and lower customer driven derivatives revenue.
Commercial mortgage banking activities include revenue derived from commercial mortgage servicing (including net interest income and noninterest income from loan servicing and ancillary services, net of commercial mortgage servicing rights amortization, and commercial mortgage servicing rights valuations net of economic hedge), and revenue derived from commercial mortgage loans intended for sale and related hedges (including loan origination fees, net interest income, valuation adjustments and gains or losses on sales).
Commercial mortgage banking activities resulted in revenue of $102$230 million in the first threesix months of 2013 compared with $48$129 million in the first threesix months of 2012. The increase in the comparison was mainly due to higher net revenue from commercial mortgage servicing, whichprimarily driven by the impact of higher market interest rates on commercial mortgage servicing rights valuations and higher loan originations. The first six months of 2012 included a direct write-down of commercial mortgage servicing rights of $24 million in the first three months of 2012, and higher loan originations.million.
The PNC Financial Services Group, Inc. –Form 10-Q 3335
ASSET MANAGEMENT GROUP
(Unaudited)
Table 27: Asset Management Group Table
| | Three months ended March 31 | | | | | | | |
| Dollars in millions, except as noted | | 2013 | | | 2012 | | |
Six months ended June 30 Dollars in millions, except as noted | | | 2013 | | | 2012 | |
Income Statement | | | | | | | | | | |
Net interest income | | $ | 73 | | | $ | 75 | | | $ | 143 | | | $ | 150 | |
Noninterest income | | | 182 | | | | 168 | | | | 366 | | | | 333 | |
Total revenue | | | 255 | | | | 243 | | | | 509 | | | | 483 | |
Provision for credit losses | | | 5 | | | | 10 | | | | 6 | | | | 9 | |
Noninterest expense | | | 183 | | | | 176 | | | | 378 | | | | 357 | |
Pretax earnings | | | 67 | | | | 57 | | | | 125 | | | | 117 | |
Income taxes | | | 24 | | | | 21 | | | | 46 | | | | 43 | |
Earnings | | $ | 43 | | | $ | 36 | | | $ | 79 | | | $ | 74 | |
Average Balance Sheet | | | | | | | | | | |
Loans | | | | | | | | | | |
Consumer | | $ | 4,793 | | | $ | 4,183 | | | $ | 4,870 | | | $ | 4,252 | |
Commercial and commercial real estate | | | 1,037 | | | | 1,126 | | | | 1,040 | | | | 1,112 | |
Residential mortgage | | | 772 | | | | 692 | | | | 772 | | | | 692 | |
Total loans | | | 6,602 | | | | 6,001 | | | | 6,682 | | | | 6,056 | |
Goodwill and other intangible assets | | | 306 | | | | 345 | | | | 302 | | | | 339 | |
Other assets | | | 223 | | | | 220 | | | | 226 | | | | 218 | |
Total assets | | $ | 7,131 | | | $ | 6,566 | | | $ | 7,210 | | | $ | 6,613 | |
Deposits | | | | | | | | | | |
Noninterest-bearing demand | | $ | 1,331 | | | $ | 1,575 | | | $ | 1,290 | | | $ | 1,468 | |
Interest-bearing demand | | | 3,616 | | | | 2,637 | | | | 3,545 | | | | 2,656 | |
Money market | | | 3,841 | | | | 3,651 | | | | 3,781 | | | | 3,593 | |
Total transaction deposits | | | 8,788 | | | | 7,863 | | | | 8,616 | | | | 7,717 | |
CDs/IRAs/savings deposits | | | 454 | | | | 549 | | | | 448 | | | | 519 | |
Total deposits | | | 9,242 | | | | 8,412 | | | | 9,064 | | | | 8,236 | |
Other liabilities | | | 60 | | | | 71 | | | | 59 | | | | 70 | |
Capital | | | 474 | | | | 347 | | | | 465 | | | | 405 | |
Total liabilities and equity | | $ | 9,776 | | | $ | 8,830 | | | $ | 9,588 | | | $ | 8,711 | |
Performance Ratios | | | | | | | | | | |
Return on average capital | | | 37 | % | | | 42 | % | | | 34 | % | | | 37 | % |
Return on average assets | | | 2.45 | | | | 2.21 | | | | 2.21 | | | | 2.25 | |
Noninterest income to total revenue | | | 71 | | | | 69 | | | | 72 | | | | 69 | |
Efficiency | | | 72 | | | | 72 | | | | 74 | | | | 74 | |
| | Three months ended March 31 | | | | | | | |
| Dollars in millions, except as noted | | 2013 | | | 2012 | | |
Six months ended June 30 Dollars in millions, except as noted | | | 2013 | | | 2012 | |
Other Information | | | | | | | | | | |
Total nonperforming assets (a) (b) | | $ | 65 | | | $ | 73 | | | $ | 69 | | | $ | 67 | |
Purchased impaired loans (a) (c) | | $ | 105 | | | $ | 126 | | | $ | 102 | | | $ | 122 | |
Total net charge-offs | | $ | 3 | | | $ | 2 | | | $ | 5 | | | $ | 5 | |
Assets Under Administration (in billions) (a) (d) | | | | | | | | | | |
Personal | | $ | 112 | | | $ | 104 | | | $ | 112 | | | $ | 102 | |
Institutional | | | 124 | | | | 115 | | | | 121 | | | | 112 | |
Total | | $ | 236 | | | $ | 219 | | | $ | 233 | | | $ | 214 | |
Asset Type | | | | | | | | | | |
Equity | | $ | 130 | | | $ | 119 | | | $ | 130 | | | $ | 116 | |
Fixed Income | | | 70 | | | | 66 | | | | 70 | | | | 66 | |
Liquidity/Other | | | 36 | | | | 34 | | | | 33 | | | | 32 | |
Total | | $ | 236 | | | $ | 219 | | | $ | 233 | | | $ | 214 | |
Discretionary assets under management | | | | | | | | | | |
Personal | | $ | 77 | | | $ | 73 | | | $ | 78 | | | $ | 71 | |
Institutional | | | 41 | | | | 39 | | | | 39 | | | | 38 | |
Total | | $ | 118 | | | $ | 112 | | | $ | 117 | | | $ | 109 | |
Asset Type | | | | | | | | | | |
Equity | | $ | 62 | | | $ | 58 | | | $ | 62 | | | $ | 56 | |
Fixed Income | | | 39 | | | | 38 | | | | 39 | | | | 38 | |
Liquidity/Other | | | 17 | | | | 16 | | | | 16 | | | | 15 | |
Total | | $ | 118 | | | $ | 112 | | | $ | 117 | | | $ | 109 | |
Nondiscretionary assets under administration | | | | | | | | | | |
Personal | | $ | 35 | | | $ | 31 | | | $ | 34 | | | $ | 31 | |
Institutional | | | 83 | | | | 76 | | | | 82 | | | | 74 | |
Total | | $ | 118 | | | $ | 107 | | | $ | 116 | | | $ | 105 | |
Asset Type | | | | | | | | | | |
Equity | | $ | 68 | | | $ | 61 | | | $ | 68 | | | $ | 60 | |
Fixed Income | | | 31 | | | | 28 | | | | 31 | | | | 28 | |
Liquidity/Other | | | 19 | | | | 18 | | | | 17 | | | | 17 | |
Total | | $ | 118 | | | $ | 107 | | | $ | 116 | | | $ | 105 | |
| (a) | As of March 31.June 30. |
| (b) | Includes nonperforming loans of $62$64 million at March 31,June 30, 2013 and $69$63 million at March 31,June 30, 2012. |
| (c) | Recorded investment of purchased impaired loans related to acquisitions. |
| (d) | Excludes brokerage account assets. |
3436 The PNC Financial Services Group, Inc. –Form 10-Q
Asset Management Group earned $43$79 million inthrough the first quartersix months of 2013 compared with $36$74 million in the first quartersame period of 2012. Assets under administration reached a record high for Asset Management Group of $236 billion as of March 31, 2013 compared to $219 billion as of March 31, 2012. Revenue increased $12 million, or 5%,The increase in the year over year comparisonearnings was due to stronger average equity markets and increased sales volume. Thehigher revenue increase wasof $26 million partially offset by higher noninterest expense from strategic business investments.expense. Assets under administration were $233 billion as of June 30, 2013 compared to $214 billion as of June 30, 2012.
The core growth strategies for the business continue to include: investing in higher growth geographies, increasing internal referral sales and adding new front line sales staff. Through the first quartersix months of 2013, the business delivered strong sales production and benefited from significant referrals from other PNC lines of business. Over time, the successful execution of these strategies and the accumulation of our strong sales performance are expected to create meaningful growth in assets under management and noninterest income.
Highlights of Asset Management Group’s performance during the first threesix months of 2013 include the following:
Positive net flows of approximately $1.2$2.1 billion in discretionary assets under management after adjustments to total net flows for cyclical client activities,
New primary client acquisition increased 53%36% over the prior year first quarter,six months of 2012,
Strong sales production, up nearly 50%24% over the prior year first quarter,six months of 2012,
Significant referrals from other PNC lines of business, an increase of 70%51% over the first quartersix months of 2012, and
Continuing levels of new business investment and focused hiring to drive growth with nearly 90 external new hires.resulting in a 6% increase in personnel at June 30, 2013 versus June 30, 2012.
Assets under administration were $236$233 billion at March 31,June 30, 2013, an increase of $17$19 billion compared to March 31June 30 of the
prior year. Discretionary assets under management also reached a record high of $118were $117 billion at March 31,June 30, 2013 compared with $112$109 billion at March 31,June 30, 2012. The increase was driven by higher equity markets and positive net flows due to strong sales performance and successful client retention. Nondiscretionary assets under administration were $118 billion, an increase of $11 billion from March 31, 2012.
Total revenue for the first quarterhalf of 2013 was $255$509 million compared with $243$483 million for the same period in 2012. Net interest income was $73$143 million for the first quartersix months of 2013 compared with $75$150 million for the same period in the first quarter 2012.2012 due to narrower spreads partially offset by balance sheet growth. Noninterest income was $182$366 million for the first threesix months of 2013, an increase of $14$33 million, or 8%10%, from the prior year period due to stronger average equity markets and positive net flows.
Provision for credit losses was $5$6 million for the first quartersix months of 2013 compared to $10$9 million for the same period of 2012. Noninterest expense was $378 million in the first quarter of 2012.
Noninterest expense was $183 million in the first quarterhalf of 2013, an increase of $7$21 million, or 4%6%, from the prior year period. The increase was primarily attributable to compensation expense. Over the last 12 months, total full-time headcount has increased by approximately 221195 positions, or 7%6%. Asset Management Group remains focused on disciplined expense management as it invests in these strategic growth opportunities.
Average deposits for the first quarterhalf of 2013 increased $830$828 million, or 10%, over the prior year period. Average transaction deposits grew 12% compared with the first quarterhalf of 2012 and waswere partially offset by the run-off of maturing certificates of deposit. Average loan balances of $6.6$6.7 billion increased $.6 billion, or 10%, from the prior year quarterperiod due to continued growth in the consumer loan portfolio, primarily home equity installment loans due to a favorable rate environment.
The PNC Financial Services Group, Inc. –Form 10-Q 3537
RESIDENTIAL MORTGAGE BANKING
(Unaudited)
Table 28: Residential Mortgage Banking Table
| | Three months ended March 31 | | | | |
| Dollars in millions, except as noted | | 2013 | | 2012 | | |
Six months ended June 30 Dollars in millions, except as noted | | | 2013 | | 2012 | |
Income Statement | | | | | | | | | | |
Net interest income | | $ | 48 | | | $ | 51 | | | $ | 99 | | | $ | 104 | |
Noninterest income | | | | | | | | | | |
Loan servicing revenue | | | | | | | | | | |
Servicing fees | | | 41 | | | | 56 | | | | 78 | | | | 108 | |
Net MSR hedging gains | | | 37 | | | | 71 | | | | 63 | | | | 110 | |
Loan sales revenue | | | | | | | | | | |
Provision for residential mortgage repurchase obligations | | | (4 | ) | | | (32 | ) | | | (77 | ) | | | (470 | ) |
Loan sales revenue | | | 172 | | | | 141 | | | | 362 | | | | 318 | |
Other | | | (3 | ) | | | 6 | | | | (6 | ) | | | 14 | |
Total noninterest income | | | 243 | | | | 242 | | | | 420 | | | | 80 | |
Total revenue | | | 291 | | | | 293 | | | | 519 | | | | 184 | |
Provision for credit losses (benefit) | | | 20 | | | | (7 | ) | | | 24 | | | | (9 | ) |
Noninterest expense | | | 200 | | | | 203 | | | | 392 | | | | 433 | |
Pretax earnings | | | 71 | | | | 97 | | | | 103 | | | | (240 | ) |
Income taxes | | | 26 | | | | 36 | | |
Earnings | | $ | 45 | | | $ | 61 | | |
Income taxes (benefit) | | | | 38 | | | | (88 | ) |
Earnings (loss) | | | $ | 65 | | | $ | (152 | ) |
Average Balance Sheet | | | | | | | | | | |
Portfolio loans | | $ | 2,553 | | | $ | 2,922 | | | $ | 2,478 | | | $ | 2,836 | |
Loans held for sale | | | 2,038 | | | | 1,675 | | | | 2,072 | | | | 1,753 | |
Mortgage servicing rights (MSR) | | | 764 | | | | 645 | | | | 807 | | | | 655 | |
Other assets | | | 5,448 | | | | 6,747 | | | | 5,247 | | | | 6,501 | |
Total assets | | $ | 10,803 | | | $ | 11,989 | | | $ | 10,604 | | | $ | 11,745 | |
Deposits | | $ | 3,106 | | | $ | 1,662 | | | $ | 3,183 | | | $ | 1,723 | |
Borrowings and other liabilities | | | 3,487 | | | | 4,353 | | | | 3,351 | | | | 4,209 | |
Capital | | | 1,752 | | | | 832 | | | | 1,622 | | | | 995 | |
Total liabilities and equity | | $ | 8,345 | | | $ | 6,847 | | | $ | 8,156 | | | $ | 6,927 | |
Performance Ratios | | | | | | | | | | |
Return on average capital | | | 10 | % | | | 29 | % | | | 8 | % | | | (31 | )% |
Return on average assets | | | 1.69 | | | | 2.05 | | | | 1.24 | | | | (2.60 | ) |
Noninterest income to total revenue | | | 84 | | | | 83 | | | | 81 | | | | 43 | |
Efficiency | | | 69 | | | | 69 | | | | 76 | | | | 235 | |
| | Three months ended March 31 | | | | |
| Dollars in millions, except as noted | | 2013 | | 2012 | | |
Six months ended June 30 Dollars in millions, except as noted | | | 2013 | | 2012 | |
Residential Mortgage Servicing Portfolio – Third-Party (in billions) | | | | | | | | | | |
Beginning of period | | $ | 119 | | | $ | 118 | | | $ | 119 | | | $ | 118 | |
Acquisitions | | | 6 | | | | 7 | | | | 6 | | | | 7 | |
Additions | | | 4 | | | | 4 | | | | 8 | | | | 6 | |
Repayments/transfers | | | (9 | ) | | | (8 | ) | | | (17 | ) | | | (15 | ) |
End of period | | $ | 120 | | | $ | 121 | | | $ | 116 | | | $ | 116 | |
Servicing portfolio – third-party statistics: (a) | Servicing portfolio – third-party statistics: (a) | | | | | | | | | |
Fixed rate | | | 92 | % | | | 91 | % | | | 92 | % | | | 91 | % |
Adjustable rate/balloon | | | 8 | % | | | 9 | % | | | 8 | % | | | 9 | % |
Weighted-average interest rate | | | 4.80 | % | | | 5.26 | % | | | 4.72 | % | | | 5.21 | % |
MSR capitalized value (in billions) | | $ | .8 | | | $ | .7 | | | $ | 1.0 | | | $ | .6 | |
MSR capitalization value (in basis points) | | | 65 | | | | 60 | | | | 84 | | | | 50 | |
Weighted-average servicing fee (in basis points) | | | 28 | | | | 29 | | | | 28 | | | | 29 | |
Residential Mortgage Repurchase Reserve | | | | | | | | | | |
Beginning of period | | $ | 614 | | | $ | 83 | | | $ | 614 | | | $ | 83 | |
Provision | | | 4 | | | | 32 | | | | 77 | | | | 470 | |
RBC Bank (USA) acquisition | | | | | 26 | | | | | | 26 | |
Losses – loan repurchases and settlements | | | (96 | ) | | | (40 | ) | | | (168 | ) | | | (117 | ) |
End of Period | | $ | 522 | | | $ | 101 | | | $ | 523 | | | $ | 462 | |
Other Information | | | | | | | | | | |
Loan origination volume (in billions) | | $ | 4.2 | | | $ | 3.4 | | | $ | 8.9 | | | $ | 7.0 | |
Loan sale margin percentage | | | 4.07 | % | | | 4.17 | % | | | 4.05 | % | | | 4.54 | % |
Percentage of originations represented by: | | | | | | | | | | |
Agency and government programs | | | 100 | % | | | 100 | % | | | 100 | % | | | 100 | % |
Refinance volume | | | 81 | % | | | 82 | % | | | 76 | % | | | 77 | % |
Total nonperforming assets (a) (b) | | $ | 236 | | | $ | 80 | | | $ | 220 | | | $ | 78 | |
Purchased impaired loans (a) (c) | | $ | 24 | | | $ | 100 | | | $ | 8 | | | $ | 84 | |
| (a) | As of March 31.June 30. |
| (b) | Includes nonperforming loans of $192$177 million at March 31,June 30, 2013 and $39$37 million at March 31,June 30, 2012. |
| (c) | Recorded investment of purchased impaired loans related to acquisitions. |
38 The PNC Financial Services Group, Inc. –Form 10-Q
Residential Mortgage Banking reported net income of $45$65 million in the first threesix months of 2013 compared with $61a net loss of $152 million in the first threesix months of 2012. Earnings declinedincreased from the prior year threesix month period primarily as a result of increaseddecreased provision for credit losses.residential mortgage repurchase obligations.
The strategic focus of the business is the acquisition of new customers through a retail loan officer sales force with an emphasis on home purchase transactions. Two key aspects of this strategy are: (i)(1) competing on the basis of superior service to new and existing customers in serving their home purchase and refinancing needs,needs; and (ii) pursuing(2) operating strategic partnerships with reputable residential real estate franchises to acquire new customers. A key consideration in pursuing this approach is the cross-sell opportunity, especially in the bank footprint markets.
36 The PNC Financial Services Group, Inc. –Form 10-Q
Residential Mortgage Banking overview:
Total loan originations were $4.2$8.9 billion for the first threesix months of 2013 compared with $3.4$7.0 billion in the comparable period of 2012. Loans continue to be originated primarily through direct channels under Federal National Mortgage Association (FNMA), Federal Home Loan Mortgage Corporation (FHLMC) and Federal Housing Administration (FHA)/Department of Veterans Affairs (VA) agency guidelines. Refinancings were 81%76% of originations for the first threesix months of 2013 and 82%77% in the first threesix months of 2012. During the first threesix months of 2013, 33% of loan originations were under the original or revised Home Affordable Refinance Program (HARP or HARP 2). The Home Affordable Refinance Program has been recently extended until December 31, 2015.
Investors having purchased mortgage loans may request PNC to indemnify them against losses on certain loans or to repurchase loans that they believe do not comply with applicable contractual loan origination covenants and representations and warranties we have made. At March 31,June 30, 2013, the liability for estimated losses on repurchase and indemnification claims for the Residential Mortgage Banking business segment was $522 million, compared with $101 million at March 31,
| | liability for estimated losses on repurchase and indemnification claims for the Residential Mortgage Banking business segment was $523 million compared with $462 million at June 30, 2012. Consistent with the year ended December 31, 2012, PNC has and continues to experience elevated levels of residential mortgage loan repurchase demands reflecting changes in behavior and demand patterns
of two government-sponsored enterprises, FHLMC and FNMA, primarily related to loans sold in 2004 through 2008 in agency securitizations. See the Recourse And Repurchase Obligations section of this Financial Review and Note 18 Commitments and Guarantees in the Notes To Consolidated Financial Statements in Part I, Item 1 of this Report for additional information.
|
| – | | PNC has and expects to experience elevated levels of residential mortgage loan repurchase demands reflecting a change in behavior and demand patterns of two government-sponsored enterprises, FNMA and FHLMC, primarily related to loans sold in 2008 and prior in agency securitizations. |
Residential mortgage loans serviced for others totaled $120$116 billion at March 31,both June 30, 2013 compared with $121 billion at March 31,and June 30, 2012 as in the aggregate, payoffs since March 31, 2012 have exceededcontinued to approximate new direct loan origination volume and acquisitions.
Noninterest income was $243$420 million in the first threesix months of 2013 compared with $242$80 million in the first threesix months of 2012. The decreases in MSR hedging gains and servicing fees were more than offset by lower recourse provision in the 2013 period and increased loan sales revenue and lower provision for residential mortgage repurchase obligations.revenue.
Net interest income was $48$99 million in the first threesix months of 2013 compared with $51$104 million in the first threesix months of 2012.
Noninterest expense was $200$392 million in the first threesix months of 2013 compared with $203$433 million in the first threesix months of 2012. Increased expensesexpense on higher loan origination volumes werewas more than offset by lower residential mortgage foreclosure-related expenses and legal expenses.
The fair value of mortgage servicing rights was $.8$1.0 billion at March 31,June 30, 2013 compared with $.7$0.6 billion at March 31,June 30, 2012. The increase in fair value was primarily due to rising residential mortgage interest rates at June 30, 2013.
The PNC Financial Services Group, Inc. –Form 10-Q 3739
BLACKROCK
(Unaudited)
Table 29: BlackRock Table
Information related to our equity investment in BlackRock follows:
| | Three months ended March 31 | | | | | | | |
| Dollars in millions | | 2013 | | | 2012 | | |
Six months ended June 30 Dollars in millions | | | 2013 | | | 2012 | |
Business segment earnings (a) | | $ | 108 | | | $ | 90 | | | $ | 220 | | | $ | 178 | |
PNC’s economic interest in BlackRock (b) | | | 22 | % | | | 21 | % | | | 22 | % | | | 22 | % |
| (a) | Includes PNC’s share of BlackRock’s reported GAAP earnings and additional income taxes on those earnings incurred by PNC. |
| | | | March 31 | | | December 31 | | | | | | |
| In billions | | 2013 | | | 2012 | | | June 30
2013 | | | December 31
2012 | |
Carrying value of PNC’s investment in BlackRock (c) | | $ | 5.6 | | | $ | 5.6 | | | $ | 5.8 | | | $ | 5.6 | |
Market value of PNC’s investment in BlackRock (d) | | | 9.2 | | | | 7.4 | | | | 9.2 | | | | 7.4 | |
| (c) | PNC accounts for its investment in BlackRock under the equity method of accounting, exclusive of a related deferred tax liability of $1.9 billion at both March 31,June 30, 2013 and December 31, 2012. Our voting interest in BlackRock common stock was approximately 21% at March 31,June 30, 2013. |
| (d) | Does not include liquidity discount. |
PNC accounts for its BlackRock Series C Preferred Stock at fair value, which offsets the impact of marking-to-market the obligation to deliver these shares to BlackRock to partially fund BlackRock long-term incentive plan (LTIP) programs. The fair value amount of the BlackRock Series C Preferred Stock is included on our Consolidated Balance Sheet in the caption Other assets. Additional information regarding the valuation of the BlackRock Series C Preferred Stock is included in Note 9 Fair Value in the Notes To Consolidated Financial Statements in Part I, Item 1 of this Report and in Note 9 in our 2012 Form 10-K.
On January 31, 2013, we transferred 205,350 shares of BlackRock Series C Preferred Stock to BlackRock to satisfy a portion of our LTIP obligation. The transfer reduced Other assets and Other liabilities on our Consolidated Balance Sheet by $33 million. At March 31,June 30, 2013, we hold approximately 1.3 million shares of BlackRock Series C Preferred Stock which are available to fund our obligation in connection with the BlackRock LTIP programs.
Our 2012 Form 10-K includes additional information about our investment in BlackRock.
38 The PNC Financial Services Group, Inc. –Form 10-Q
NON-STRATEGIC ASSETS PORTFOLIO
(Unaudited)
Table 30: Non-Strategic Assets Portfolio Table
| | | | | | | | |
Three months ended March 31 Dollars in millions | | 2013 | | | 2012 | |
Income Statement | | | | | | | | |
Net interest income | | $ | 203 | | | $ | 217 | |
Noninterest income | | | 16 | | | | (19 | ) |
Total revenue | | | 219 | | | | 198 | |
Provision for credit losses | | | 42 | | | | 18 | |
Noninterest expense | | | 52 | | | | 68 | |
Pretax earnings | | | 125 | | | | 112 | |
Income taxes | | | 46 | | | | 41 | |
Earnings | | $ | 79 | | | $ | 71 | |
Average Balance Sheet | | | | | | | | |
Commercial Lending: | | | | | | | | |
Commercial/Commercial real estate | | $ | 537 | | | $ | 1,004 | |
Lease financing | | | 688 | | | | 670 | |
Total commercial lending | | | 1,225 | | | | 1,674 | |
Consumer Lending: | | | | | | | | |
Home equity | | | 4,158 | | | | 4,849 | |
Residential real estate | | | 5,938 | | | | 6,046 | |
Total consumer lending | | | 10,096 | | | | 10,895 | |
Total portfolio loans | | | 11,321 | | | | 12,569 | |
Other assets (a) | | | (586 | ) | | | (445 | ) |
Total assets | | $ | 10,735 | | | $ | 12,124 | |
Deposits and other liabilities | | $ | 168 | | | $ | 177 | |
Capital | | | 1,094 | | | | 1,176 | |
Total liabilities and equity | | $ | 1,262 | | | $ | 1,353 | |
Performance Ratios | | | | | | | | |
Return on average capital | | | 29 | % | | | 24 | % |
Return on average assets | | | 2.98 | | | | 2.36 | |
Noninterest income to total revenue | | | 7 | | | | (10 | ) |
Efficiency | | | 24 | | | | 34 | |
Other Information | | | | | | | | |
Nonperforming assets (b) (c) | | $ | 999 | | | $ | 1,192 | |
Purchased impaired loans (b) (d) | | $ | 5,372 | | | $ | 6,097 | |
Net charge-offs (e) | | $ | 87 | | | $ | 91 | |
Annualized net charge-off ratio (e) | | | 3.12 | % | | | 2.91 | % |
Loans (b) | | | | | | | | |
Commercial Lending | | | | | | | | |
Commercial/Commercial real estate | | $ | 493 | | | $ | 1,104 | |
Lease financing | | | 690 | | | | 671 | |
Total commercial lending | | | 1,183 | | | | 1,775 | |
Consumer Lending | | | | | | | | |
Home equity | | | 4,209 | | | | 4,751 | |
Residential real estate | | | 5,880 | | | | 6,693 | |
Total consumer lending | | | 10,089 | | | | 11,444 | |
Total loans | | $ | 11,272 | | | $ | 13,219 | |
| | | | | | | | |
Six months ended June 30 Dollars in millions | | 2013 | | | 2012 | |
Income Statement | | | | | | | | |
Net interest income | | $ | 367 | | | $ | 438 | |
Noninterest income | | | 27 | | | | (17 | ) |
Total revenue | | | 394 | | | | 421 | |
Provision for credit losses | | | 81 | | | | 68 | |
Noninterest expense | | | 93 | | | | 135 | |
Pretax earnings | | | 220 | | | | 218 | |
Income taxes | | | 81 | | | | 80 | |
Earnings | | $ | 139 | | | $ | 138 | |
Average Balance Sheet | | | | | | | | |
Commercial Lending: | | | | | | | | |
Commercial/Commercial real estate | | $ | 487 | | | $ | 1,006 | |
Lease financing | | | 691 | | | | 672 | |
Total commercial lending | | | 1,178 | | | | 1,678 | |
Consumer Lending: | | | | | | | | |
Home equity | | | 4,139 | | | | 4,758 | |
Residential real estate | | | 5,823 | | | | 6,291 | |
Total consumer lending | | | 9,962 | | | | 11,049 | |
Total portfolio loans | | | 11,140 | | | | 12,727 | |
Other assets (a) | | | (629 | ) | | | (320 | ) |
Total assets | | $ | 10,511 | | | $ | 12,407 | |
Deposits and other liabilities | | $ | 222 | | | $ | 179 | |
Capital | | | 1,104 | | | | 1,244 | |
Total liabilities and equity | | $ | 1,326 | | | $ | 1,423 | |
Performance Ratios | | | | | | | | |
Return on average capital | | | 25 | % | | | 22 | % |
Return on average assets | | | 2.67 | | | | 2.24 | |
Noninterest income to total revenue | | | 7 | | | | (4 | ) |
Efficiency | | | 24 | | | | 32 | |
Other Information | | | | | | | | |
Nonperforming assets (b)(c) | | $ | 935 | | | $ | 1,120 | |
Purchased impaired loans (b)(d) | | $ | 5,193 | | | $ | 5,889 | |
Net charge-offs (e) | | $ | 140 | | | $ | 174 | |
Annualized net charge-off ratio (e) | | | 2.53 | % | | | 2.75 | % |
Loans (b) | | | | | | | | |
Commercial Lending | | | | | | | | |
Commercial/Commercial real estate | | $ | 388 | | | $ | 945 | |
Lease financing | | | 696 | | | | 677 | |
Total commercial lending | | | 1,084 | | | | 1,622 | |
Consumer Lending | | | | | | | | |
Home equity | | | 4,029 | | | | 4,575 | |
Residential real estate | | | 5,659 | | | | 6,475 | |
Total consumer lending | | | 9,688 | | | | 11,050 | |
Total loans | | $ | 10,772 | | | $ | 12,672 | |
| (a) | Other assets includes deferred taxes, ALLL and other real estate owned (OREO).OREO. Other assets were negative in both periods due to the ALLL. |
| (b) | As of March 31.June 30. |
| (c) | Includes nonperforming loans of $.7 billion at both March 31,June 30, 2013 and March 31,June 30, 2012 respectively. |
| (d) | Recorded investment of purchased impaired loans related to acquisitions. At March 31,June 30, 2013, this segment contained 76%77% of PNC’s purchased impaired loans. |
| (e) | For the threesix months ended March 31.June 30. |
40 The PNC Financial Services Group, Inc. –Form 10-Q
This business segment consists primarily of non-strategic assets obtained through acquisitions of other companies. Non-Strategic Assets Portfolio had earnings of $79$139 million in the first threesix months of 2013 compared with $71$138 million in the first threesix months of 2012. The increase was primarily attributable toEarnings were relatively flat year-over-year as higher noninterest income due toand lower noninterest expense were offset by lower net interest income and a higher provision for estimated losses on home equity repurchase obligations.credit losses.
The first threesix months of 2013 included the impact of the March 2012 RBC Bank (USA) acquisition, which added approximately $1.0 billion of residential real estate loans, $.2 billion of commercial/commercial real estate loans and $.2 billion of OREO assets. Of these assets, $1.0 billion were deemed purchased impaired loans.
Non-Strategic Assets Portfolio overview:
Net interest income was $203$367 million in the first threesix months of 2013 compared with $217$438 million in the first threesix months of 2012. The decrease was driven by lower purchase accounting accretion as well as lower average loan balances and lower interest due to declining average yield, as high yield commercial real estate loans declined faster than the remainder of the portfolio.balances.
Noninterest income was $16$27 million in the first threesix months of 2013 compared with a loss of $19$17 million in the first threesix months of 2012. The increase was driven by lower provision for estimated losses on home equity repurchase obligations.
The provision for credit losses was $42$81 million in the first threesix months of 2013 compared with $18$68 million in the first threesix months of 2012 driven by reductionsa decrease in expected cash flows on purchased impaired home equity loans.
Noninterest expense in the first threesix months of 2013 was $52$93 million compared with $68$135 million in the first threesix months of 2012. The decrease was driven by lower commercial OREO write-downs.
Average portfolio loans declined to $11.3$11.1 billion in the first threesix months of 2013 compared with $12.6$12.7 billion in the first threesix months of 2012. The overall decline was driven by customer payment activity and portfolio management activities to reduce under-performing assets, partially offset by the addition of loans from the March 2012 RBC Bank (USA) acquisition.
Nonperforming loans were at $.7 billion at March 31,June 30, 2013 and March 31,June 30, 2012. The consumer lending portfolio comprised 81%86% of the nonperforming loans in this segment at March 31,June 30, 2013. Nonperforming consumer loans increased $122 million from March 31, 2012, due to alignment with interagency guidance in the first quarter of 2013. The commercial lending portfolio comprised 19% of the nonperforming loans as of March 31, 2013. Nonperforming commercial loans decreased $79 million from March 31, 2012.
The PNC Financial Services Group, Inc. –Form 10-Q39
| | consumer loans increased $128 million from June 30, 2012, due to alignment with interagency guidance in the first quarter of 2013. The commercial lending portfolio comprised 14% of the nonperforming loans as of June 30, 2013. Nonperforming commercial loans decreased $99 million from June 30, 2012. |
Net charge-offs were $87$140 million in the first threesix months of 2013 and $91$174 million in the first threesix months of 2012. The first three months of 2013 included additional2012 primarily due to lower charge-offs related to alignment with interagency guidance.on home equity loans.
The business activity of this segment is to manage the wind-down of the portfolio while maximizing the value and mitigating risk. The fair value marks taken upon acquisition of the assets, the team we have in place and targeted asset resolution strategies help us to manage these assets.
The Commercial Lending portfolio declined 33% since March 31,June 30, 2012. Commercial and commercial real estate loans declined 55%59% to $.5$.4 billion while the lease financing portfolio remained relatively flat at $.7 billion. The leases are long-term with relatively low credit risk.
The Consumer Lending portfolio declined $1.4 billion, or 12%, when compared to March 31June 30 of last year. The portfolio’s credit quality has stabilized through actions taken by management. We have implemented various refinance programs, line management programs and loss mitigation programs to mitigate risks within this portfolio while assisting borrowers to maintain home ownership when possible.
| | implemented various refinance programs, line management programs and loss mitigation programs to mitigate risks within this portfolio while assisting borrowers to maintain homeownership when possible.
|
When loans are sold, we may assume certain loan repurchase obligations to indemnify investors against losses or to repurchase loans that they believe do not comply with applicable contractual loan origination covenants and representations and warranties we have made. From 2005 to 2007, home equity loans were sold with such contractual provisions. At March 31,June 30, 2013, the liability for estimated losses on repurchase and indemnification claims for the Non-Strategic Assets Portfolio was $25$24 million compared to $51$61 million at March 31,June 30, 2012. See the Recourse And Repurchase Obligations section of this Financial Review and Note 18 Commitments and Guarantees in the Notes To Consolidated Financial Statements included in Part I, Item 1 of this Report for additional information.
40The PNC Financial Services Group, Inc. –Form 10-Q41
CRITICAL ACCOUNTING ESTIMATES AANDND JUDGMENTS
Note 1 Accounting Policies in Item 8 of our 2012 Form 10-K and in the Notes To Consolidated Financial Statements included in Part I, Item 1 of this Report describe the most significant accounting policies that we use. Certain of these policies require us to make estimates or economic assumptions that may prove inaccurate or be subject to variations that may significantly affect our reported results and financial position for the period or in future periods.
We must use estimates, assumptions and judgments when assets and liabilities are required to be recorded at, or adjusted to reflect, fair value.
Assets and liabilities carried at fair value inherently result in a higher degree of financial statement volatility. Fair values and the information used to record valuation adjustments for certain assets and liabilities are based on either quoted market prices or are provided by independent third-party sources, including appraisers and valuation specialists, when available. When such third-party information is not available, we estimate fair value primarily by using cash flow and other financial modeling techniques. Changes in underlying factors, assumptions or estimates could materially impact our future financial condition and results of operations.
We discuss the following critical accounting policies and judgments under this same heading in Item 7 of our 2012 Form 10-K:
Allowances For Loan And Lease Losses And Unfunded Loan Commitments And Letters of Credit
Estimated Cash Flows On Purchased Impaired Loans
Residential And Commercial Mortgage Servicing Rights
Proposed Accounting Standards
We provide additional information about many of these items in the Notes To Consolidated Financial Statements included in Part I, Item l of this Report.
The following critical accounting estimate and judgment has been updated during the first threesix months of 2013.
ALLOWANCES FFOROR LOAN AANDND LEASE LOSSES AANDND UNFUNDED LOAN COMMITMENTS AANDND LETTERS OOFF CREDIT
We maintain the ALLL and the Allowance For Unfunded Loan Commitments And Letters Of Credit at levels that we believe to be appropriate to absorb estimated probable credit losses incurred in the loan and lease portfolio and on these
unfunded credit facilities as of the balance sheet date. Our determination of these allowances is based on periodic evaluations of the loan and lease portfolios and unfunded credit facilities and other relevant factors. These critical estimates include the use of significant amounts of PNC’s own historical data and complex methods to interpret them. We have an ongoing process to evaluate and enhance the quality, quantity and timeliness of our data and interpretation methods used in the determination of these allowances. These evaluations are inherently subjective as they require material estimates, all of which may be susceptible to significant change, including, among others:
Probability of default (PD),
Loss given default (LGD),
Exposure at date of default,
Movement through delinquency stages,
Amounts and timing of expected future cash flows,
Value of collateral, which may be obtained from third parties, and
Qualitative factors, such as changes in current economic conditions, that may not be reflected in historical results.
In determining the appropriateness of the ALLL, we make specific allocations to impaired loans and allocations to portfolios of commercial and consumer loans. We also allocate reserves to provide coverage for probable losses incurred in the portfolio at the balance sheet date based upon current market conditions, which may not be reflected in historical loss data. Commercial lending is the largest category of credits and is sensitive to changes in assumptions and judgments underlying the determination of the ALLL. We have allocated approximately $1.7 billion, or 45%44%, of the ALLL at March 31,June 30, 2013 to the commercial lending category. Consumer lending allocations are made based on historical loss experience adjusted for recent activity. Approximately $2.1 billion, or 55%56%, of the ALLL at March 31,June 30, 2013 has been allocated to these consumer lending categories.
The PNC Financial Services Group, Inc. –Form 10-Q41
RECENTLYPROPOSED ACCOUNTING STANDARDS
In February 2013, the Financial Accounting Standards Board (FASB) issued Proposed Accounting Standards Update (ASU)Financial Instruments – Overall (Subtopic 825-10): Recognition and Measurement of Financial Assets and Financial Liabilities. This exposure draft would change the determination of the classification and measurement of financial instruments. Under the proposal, loans and securities would be classified and measured based on both the contractual cash flow characteristics of the assets and the business model for managing the assets. Financial assets would be included in one of three categories: (i) amortized cost, (ii) fair value through other comprehensive income, and (iii) fair value through net income, while financial liabilities would generally be measured at amortized cost. In April 2013, the FASB issued a related document which proposes amendments to the FASB Accounting Standards Codification as a result of the proposed classification and measurement
42 The PNC Financial Services Group, Inc. –Form 10-Q
model. The effective date of the proposals has not yet been determined. We are evaluating the impact of these proposals on our financial statements.
In FebruaryApril 2013, the FASB issued Proposed ASU,DerivativesInvestments – Equity Method and HedgingJoint Ventures (Topic 815)323): InclusionAccounting for Investments in Qualified Affordable Housing Projects. This exposure draft addresses the accounting for an investment in a Low Income Housing Tax Credit (LIHTC) partnership through a limited partnership investment. If certain criteria are met, the allocated tax credits, net of amortization of the Fed Funds Effective Swap Rate (or Overnight Index Swap Rate) as a Benchmark Interest Rate for Hedge Accounting Purposes.investment, could be recognized in income taxes attributable to continuing operations under the effective yield method. The exposure draft would amend existing guidance to includealso requires disclosure of information regarding the fed fundsnature of LIHTC investments and whether they are accounted for under the effective swap rate (OIS) as a U.S. benchmark interest rate for hedge accounting purposes. Current guidance considers only interest rates on direct Treasury obligations of the U.S. government (UST) and the London Interbank Offered Rate (LIBOR) swap rate as benchmark interest rates.yield or equity method. The effective date has not yet been determined. We are evaluating the impact of this proposal on our financial statements.
In May 2013, the FASB issued Proposed ASU,Leases (Topic 842),a revision of the 2010 proposed FASB Accounting Standards Update,Leases (Topic 840). The Proposed ASU would require lessees to recognize right of use assets and lease liabilities for most leases. Depending on the significance of the present value of minimum lease payments to the fair value of the underlying asset or its useful life to the lease term, leases are classified as “Type A” or “Type B” leases. As per the Proposed ASU, most leases of assets other than property (i.e. land and/or building or part of a building) would be classified as Type A leases, while most property leases would be classified as Type B leases. For Type A leases, lessees would generally recognize amortization of the right of use asset on a straight-line basis and interest expense on the lease liability under the effective interest method, whereas, for Type B leases, lessees would generally recognize the total lease expense on a straight-line basis. Lessors would account for a Type A lease similar to a finance lease and a Type B lease similar to an operating lease. The effective date has not been determined. We are evaluating the impact of the proposal on our financial statements.
In June 2013, the FASB issued Proposed ASU,Insurance Contracts (Topic 834). This exposure draft would change the accounting and financial reporting for insurance and reinsurance contracts issued and reinsurance contracts held, regardless of the type of entity issuing or holding these contracts. Certain financial guarantee contracts would also meet the definition of an insurance contract. The exposure draft introduces a building-block approach (based on a discounted estimate of future cash flows under the contract and a margin to remove any gain at inception) to account for most life, annuity, and long-term health contracts and a
premium allocation approach (comprising a liability for the remaining coverage under the contract and a liability for incurred claims) for most property and casualty and short-term health contracts. The effective date has not yet been determined. We are evaluating the impact of the proposal on our financial statements.
In July 2013, the FASB issued Proposed ASU,Receivables – Troubled Debt Restructurings by Creditors (Subtopic 310-40): Reclassification of Collateralized Mortgage Loans upon a Troubled Debt Restructuring. This exposure draft would clarify that an in substance repossession or foreclosure occurs, and a creditor is considered to have received physical possession of residential real estate property collateralizing a consumer mortgage loan, upon (1) the creditor obtaining legal title to the residential real estate property or (2) completion of a deed in lieu of foreclosure or similar legal agreement under which the borrower conveys all interest in the residential real estate property to the creditor to satisfy that loan, even though the legal title may not yet have passed. The exposure draft would also require additional disclosures, including: (1) a rollforward schedule reconciling the change from the beginning to the ending balance of foreclosed properties at every reporting period and (2) the recorded investment in consumer mortgage loans secured by residential real estate properties that are in the process of foreclosure. The effective date has not yet been determined. We are evaluating the impact of the proposal on our financial statements.
In July 2013, the FASB issued Proposed ASU,Consolidation (Topic 810): Measuring the Financial Liabilities of a Consolidated Collateralized Financing Entity.This Proposed ASU would define “collateralized financing entity” and allow a reporting entity that consolidates a collateralized financing entity and recognizes the associated financial assets at fair value, to measure the financial liabilities based on the fair value of the financial assets. The reporting entity would allocate this value to individual liabilities on a reasonable and consistent basis. The Proposed ASU would allow for a modified retrospective transition approach which includes a cumulative-effect adjustment to equity as of the beginning of the period of adoption. Early adoption would be permitted. The effective date has not yet been determined. We are evaluating the impact of the proposal on our financial statements.
RECENTECENTLY ISSUED ACCOUNTING PRONOUNCEMENTS
For information on RecentRecently Issued Accounting Pronouncements, see Note 1 Accounting Policies in the Notes To Consolidated Financial Statements included in Part I, Item I of this Report regarding the impact of the adoption of new accounting guidance issued by the FASB.
The PNC Financial Services Group, Inc. –Form 10-Q43
STATUS OOFF QUALIFIED DEFINED BENEFIT PENSION PLAN
We have a noncontributory, qualified defined benefit pension plan (plan or pension plan) covering eligible employees. Benefits are determined using a cash balance formula where earnings credits are applied as a percentage of eligible compensation. We calculate the expense associated with the pension plan, and the assumptions and methods that we use include a policy of reflecting trust assets at their fair market value. On an annual basis, we review the actuarial assumptions related to the pension plan.
We currently estimate a pretax pension expense of $73$74 million in 2013 compared with pretax expense of $89 million in 2012. This year-over-year expected decrease reflects the impact of favorable returns on plan assets experienced in 2012, as well as the effects of the lower discount rate required to be used in 2013.
The following table reflects the estimated effects on pension expense of certain changes in annual assumptions, using 2013 estimated expense as a baseline.
Table 31: Pension Expense – Sensitivity Analysis
| | | | |
Change in Assumption (a) | | Estimated Increase to 2013
Pension Expense (In millions) | |
.5% decrease in discount rate
| | | $21 | |
.5% decrease in expected long-term return on assets
| | | $19 | |
.5% increase in compensation rate
| | | $ 2 | |
| | | | |
| Change in Assumption (a) | | Estimated Increase to 2013
Pension Expense (In millions) | |
.5% decrease in discount rate | | $ | 21 | |
.5% decrease in expected long-term return on assets | | $ | 19 | |
.5% increase in compensation rate | | $ | 2 | |
| (a) | The impact is the effect of changing the specified assumption while holding all other assumptions constant. |
We provide additional information on our pension plan in Note 15 Employee Benefit Plans in our 2012 Form 10-K.
42 The PNC Financial Services Group, Inc. –Form 10-Q
RECOURSE AANDND REPURCHASE OBLIGATIONS
As discussed in Note 3 Loan Sale and Servicing Activities and Variable Interest Entities in our 2012 Form 10-K, PNC has sold commercial mortgage, residential mortgage and home equity loans directly or indirectly through securitization and loan sale transactions in which we have continuing involvement. One form of continuing involvement includes certain recourse and loan repurchase obligations associated with the transferred assets.
COMMERCIAL MORTGAGE LOAN RECOURSE OBLIGATIONS
We originate, close and service certain multi-family commercial mortgage loans which are sold to FNMA under FNMA’s Delegated Underwriting and Servicing (DUS) program. We participated in a similar program with the FHLMC. For more information regarding our Commercial Mortgage Loan Recourse Obligations, see the Recourse and
Under these programs, we generally assume up to a one-third pari passu riskRepurchase Obligations section of loss on unpaid principal balances through a loss share arrangement. At March 31, 2013Note 18 Commitments and December 31, 2012, the unpaid principal balance outstanding of loans sold as a participant in these programs was $13.0 billion and $12.8 billion, respectively. The potential maximum exposure under the loss share arrangements was $4.0 billion at March 31, 2013 and $3.9 billion at December 31, 2012. We maintain a reserve for estimated losses based on our exposure. The reserve for losses under these programs totaled $42 million and $43 million as of March 31, 2013 and December 31, 2012, respectively, and isGuarantees included in Other liabilities on ourthe Notes To Consolidated Balance Sheet. If payment is required under these programs, we would not have a contractual interestFinancial Statements in the collateral underlying the mortgage loans on which losses occurred, although the valuePart 1, Item 1 of the collateral is taken into account in determining our share of such losses. Our exposure and activity associated with these recourse obligations are reported in the Corporate & Institutional Banking segment.this Report.
RESIDENTIAL MORTGAGE REPURCHASE OBLIGATIONS
While residential mortgage loans are sold on a non-recourse basis, we assume certain loan repurchase obligations associated with mortgage loans we have sold to investors. These loan repurchase obligations primarily relate to situations where PNC is alleged to have breached certain origination covenants and representations and warranties made to purchasers of the loans in the respective purchase and sale agreements. Residential mortgage loans covered by these loan repurchase obligations include first and second-lien mortgage loans we have sold through Agency securitizations, Non-Agency securitizations, and loan sale transactions. As discussed in Note 3 in our 2012 Form 10-K, Agency securitizations consist of mortgage loan sale transactions with FNMA, FHLMC and the Government National Mortgage Association (GNMA) program,, while Non-Agency
securitizations consist of mortgage loan sale transactions with private investors. Mortgage loan sale transactions that are not part of a securitization may involve FNMA, FHLMC or private investors. Our historical exposure and activity associated with Agency securitization repurchase obligations has primarily been related to transactions with FNMA and FHLMC, as indemnification and repurchase losses associated with FHA and VA-insured and uninsured loans pooled in GNMA securitizations historically have been minimal. Repurchase obligation activity associated with residential mortgages is reported in the Residential Mortgage Banking segment.
Loan covenants and representations and warranties are established through loan sale agreements with various investors to provide assurance that PNC has sold loans that are of sufficient investment quality. Key aspects of such covenants and representations and warranties include the loan’s compliance with any applicable loan criteria established for the transaction, including underwriting standards, delivery of all required loan documents to the investor or its designated party, sufficient collateral valuation and the validity of the lien securing the loan. As a result of alleged breaches of these contractual obligations, investors may request PNC to indemnify them against losses on certain loans or to repurchase loans.
We investigate every investor claim on a loan by loan basis to determine the existence of a legitimate claim, and that all other conditions for indemnification or repurchase have been met prior to the settlement with that investor. Indemnifications for loss or loan repurchases typically occur when, after review of the claim, we agree insufficient evidence exists to dispute the investor’s claim that a breach of a loan covenant and representation and warranty has occurred, such breach has not been cured and the effect of such breach is deemed to have had a material and adverse effect on the value of the transferred loan. Depending on the sale agreement and upon
44 The PNC Financial Services Group, Inc. –Form 10-Q
proper notice from the investor, we typically respond to such indemnification and repurchase requests within 9060 days, although final resolution of the claim may take a longer period of time. With the exception of the sales agreements associated with the Agency securitizations, most sale agreements do not provide for penalties or other remedies if we do not respond timely to investor indemnification or repurchase requests.
Indemnification and repurchase claims are typically settled on an individual loan basis through make-whole payments or loan repurchases; however, on occasion we may negotiate pooled settlements with investors. In connection with pooled settlements, we typically do not repurchase loans and the consummation of such transactions generally results in us no longer having indemnification and repurchase exposure with the investor in the transaction.
The PNC Financial Services Group, Inc. –Form 10-Q43
For the first and second-lien mortgage balances of unresolved and settled claims contained in the tables below, a significant amount of these claims were associated with sold loans originated through correspondent lender and broker origination channels. In certain instances when indemnification or repurchase claims are settled for these types of sold loans, we have recourse back to the correspondent lenders, brokers and other third-parties (e.g., contract underwriting companies, closing agents, appraisers, etc.). Depending on the underlying reason for the investor claim, we determine our ability to pursue recourse with these parties and file claims with them accordingly. Our historical recourse recovery rate has been insignificant as our efforts have been impacted by the inability of such parties to reimburse us for their recourse obligations (e.g., their capital availability or whether they remain in business) or factors that
limit our ability to pursue recourse from these parties (e.g., contractual loss caps, statutes of limitations).
Origination and sale of residential mortgages is an ongoing business activity and, accordingly, management continually assesses the need to recognize indemnification and repurchase liabilities pursuant to the associated investor sale agreements. We establish indemnification and repurchase liabilities for estimated losses on sold first and second-lien
mortgages for which indemnification is expected to be provided or for loans that are expected to be repurchased. For the first and second-lien mortgage sold portfolio, we have established an indemnification and repurchase liability pursuant to investor sale agreements based on claims made and our estimate of future claims on a loan by loan basis. To estimate the mortgage repurchase liability arising from breaches of representations and warranties, we consider the following factors: (i) borrower performance in our historically sold portfolio (both actual and estimated future defaults), (ii) the level of outstanding unresolved repurchase claims, (iii) estimated probable future repurchase claims, considering information about file requests, delinquent and liquidated loans, resolved and unresolved mortgage insurance rescission notices and our historical experience with claim rescissions, (iv) the potential ability to cure the defects identified in the repurchase claims (“rescission rate”) and (v) the estimated severity of loss upon repurchase of the loan or collateral, make-whole settlement or indemnification.
See Note 18 Commitments and Guarantees in the Notes To Consolidated Financial Statements in Part I, Item 1 of this Report for additional information.
The following tables present the unpaid principal balance of repurchase claims by vintage and total unresolved repurchase claims for the past five quarters.
Table 32: Analysis of Quarterly Residential Mortgage Repurchase Claims by Vintage
| | Dollars in millions | | March 31
2013 | | | December 31
2012 | | | September 30
2012 | | | June 30
2012 | | | March 31
2012 | | | June 30
2013 | | | March 31
2013 | | | December 31
2012 | | | September 30
2012 | | | June 30
2012 | |
2004 & Prior | | $ | 12 | | | $ | 11 | | | $ | 15 | | | $ | 31 | | | $ | 10 | | | $ | 51 | | | $ | 12 | | | $ | 11 | | | $ | 15 | | | $ | 31 | |
2005 | | | 10 | | | | 8 | | | | 10 | | | | 19 | | | | 12 | | | | 7 | | | | 10 | | | | 8 | | | | 10 | | | | 19 | |
2006 | | | 28 | | | | 23 | | | | 30 | | | | 56 | | | | 41 | | | | 19 | | | | 28 | | | | 23 | | | | 30 | | | | 56 | |
2007 | | | 108 | | | | 45 | | | | 137 | | | | 182 | | | | 100 | | | | 36 | | | | 108 | | | | 45 | | | | 137 | | | | 182 | |
2008 | | | 15 | | | | 7 | | | | 23 | | | | 49 | | | | 17 | | | | 9 | | | | 15 | | | | 7 | | | | 23 | | | | 49 | |
2008 & Prior | | | 173 | | | | 94 | | | | 215 | | | | 337 | | | | 180 | | | | 122 | | | | 173 | | | | 94 | | | | 215 | | | | 337 | |
2009 – 2012 | | | 50 | | | | 38 | | | | 52 | | | | 42 | | | | 33 | | |
2009 – 2013 | | | | 14 | | | | 50 | | | | 38 | | | | 52 | | | | 42 | |
Total | | $ | 223 | | | $ | 132 | | | $ | 267 | | | $ | 379 | | | $ | 213 | | | $ | 136 | | | $ | 223 | | | $ | 132 | | | $ | 267 | | | $ | 379 | |
FNMA, FHLMC and GNMA % | | | 95 | % | | | 94 | % | | | 87 | % | | | 86 | % | | | 88 | % | | | 92 | % | | | 95 | % | | | 94 | % | | | 87 | % | | | 86 | % |
The PNC Financial Services Group, Inc. –Form 10-Q45
Table 33: Analysis of Quarterly Residential Mortgage Unresolved Asserted Indemnification and Repurchase Claims
| | Dollars in millions | | March 31
2013 | | | December 31
2012 | | | September 30
2012 | | | June 30
2012 | | March 31
2012 | | | June 30
2013 | | | March 31
2013 | | | December 31
2012 | | | September 30
2012 | | | June 30
2012 | |
FNMA, FHLMC and GNMA Securitizations | | $ | 165 | | | $ | 290 | | | $ | 430 | | | $ | 419 | | | $ | 337 | | | $ | 96 | | | $ | 165 | | | $ | 290 | | | $ | 430 | | | $ | 419 | |
Private Investors (a) | | | 45 | | | | 47 | | | | 82 | | | | 83 | | | | 69 | | | | 37 | | | | 45 | | | | 47 | | | | 82 | | | | 83 | |
Total unresolved claims | | $ | 210 | | | $ | 337 | | | $ | 512 | | | $ | 502 | | | $ | 406 | | | $ | 133 | | | $ | 210 | | | $ | 337 | | | $ | 512 | | | $ | 502 | |
FNMA, FHLMC and GNMA % | | | 79 | % | | | 86 | % | | | 84 | % | | | 83 | % | | | 83 | % | | | 72 | % | | | 79 | % | | | 86 | % | | | 84 | % | | | 83 | % |
| (a) | Activity relates to loans sold through Non-Agency securitization and loan sale transactions. |
44 The PNC Financial Services Group, Inc. –Form 10-Q
The table below details our indemnification and repurchase claim settlement activity during the first threesix months and the second quarter of 2013 and 2012.
Table 34: Analysis of Residential Mortgage Indemnification and Repurchase Claim Settlement Activity
| | | | 2013 | | | 2012 | | | 2013 | | | 2012 | |
| Three months ended March 31 – In millions | | Unpaid
Principal
Balance (a) | | | Losses
Incurred (b) | | | Fair Value of
Repurchased
Loans (c) | | | Unpaid
Principal
Balance (a) | | | Losses
Incurred (b) | | | Fair Value of
Repurchased
Loans (c) | | |
| Six months ended June 30 – In millions | | | Unpaid
Principal
Balance (a) | | | Losses
Incurred (b) | | | Fair Value of
Repurchased
Loans (c) | | | Unpaid
Principal
Balance (a) | | | Losses
Incurred (b) | | | Fair Value of
Repurchased
Loans (c) | |
Residential mortgages (d): | | | | | | | | | | | | | | | | | | | | | | | | | | | |
FNMA, FHLMC and GNMA securitizations | | $ | 155 | | | $ | 91 | | | $ | 34 | | | $ | 50 | | | $ | 29 | | | $ | 13 | | | $ | 263 | | | $ | 153 | | | $ | 67 | | | $ | 153 | | | $ | 89 | | | $ | 38 | |
Private investors (e) | | | 10 | | | | 5 | | | | 2 | | | | 21 | | | | 11 | | | | 3 | | | | 23 | | | | 15 | | | | 3 | | | | 46 | | | | 28 | | | | 4 | |
Total indemnification and repurchase settlements | | $ | 165 | | | $ | 96 | | | $ | 36 | | | $ | 71 | | | $ | 40 | | | $ | 16 | | | $ | 286 | | | $ | 168 | | | $ | 70 | | | $ | 199 | | | $ | 117 | | | $ | 42 | |
| | | | | | | | | | | | | | | | | | | | | | | | |
| | | 2013 | | | 2012 | |
| Three months ended June 30 – In millions | | Unpaid
Principal
Balance (a) | | | Losses
Incurred (b) | | | Fair Value of
Repurchased
Loans (c) | | | Unpaid
Principal
Balance (a) | | | Losses
Incurred (b) | | | Fair Value of
Repurchased
Loans (c) | |
Residential mortgages (d): | | | | | | | | | | | | | | | | | | | | | | | | |
FNMA, FHLMC, and GNMA securitizations | | $ | 109 | | | $ | 62 | | | $ | 33 | | | $ | 103 | | | $ | 60 | | | $ | 25 | |
Private investors (e) | | | 13 | | | | 10 | | | | 1 | | | | 25 | | | | 17 | | | | 1 | |
Total indemnification and repurchase settlements | | $ | 122 | | | $ | 72 | | | $ | 34 | | | $ | 128 | | | $ | 77 | | | $ | 26 | |
| (a) | Represents unpaid principal balance of loans at the indemnification or repurchase date. Excluded from these balances are amounts associated with pooled settlement payments as loans are typically not repurchased in these transactions. |
| (b) | Represents both i) amounts paid for indemnification/settlement payments and ii) the difference between loan repurchase price and fair value of the loan at the repurchase date. These losses are charged to the indemnification and repurchase liability. |
| (c) | Represents fair value of loans repurchased only as we have no exposure to changes in the fair value of loans or underlying collateral when indemnification/settlement payments are made to investors. |
| (d) | Repurchase activity associated with insured loans, government-guaranteed loans and loans repurchased through the exercise of our removal of account provision (ROAP) option are excluded from this table. Refer to Note 3 in the Notes To Consolidated Financial Statements in this Report for further discussion of ROAPs. |
| (e) | Activity relates to loans sold through Non-Agency securitizations and loan sale transactions. |
During 2012 and the first threesix months of 2013, unresolved and settled investor indemnification and repurchase claims were primarily related to one of the following alleged breaches in representations and warranties: (i) misrepresentation of income, assets or employment; (ii) property evaluation or status issues (e.g., appraisal, title, etc.); (iii) underwriting guideline violations; or (iv) mortgage insurance rescissions. During 2012, FNMA and FHLMC expanded their efforts to reduce their exposure to losses on purchased loans resulting in a dramatic increase in second and third quarter 2012 repurchase claims, primarily on the 2006-2008 vintages, but also on other vintages. Included in this higher volume were repurchase claims made on loans in later stages of default than had previously been observed. For example, in the second quarter of 2012, we experienced repurchase claims on loans which had defaulted more than two years prior to the claim date, which was inconsistent with historical activity. In
December 2012, PNC discussed with FNMA and FHLMC their intentions to further expand their purchased loan review activities in 2013 with a focus on 2004 and 2005 vintages, as well as certain loan modifications and aged default loans not previously reviewed. Based on those discussions, we expected an increase in repurchase claims in 2013 and increased the liability for estimated losses on indemnification and repurchase claims accordingly during the fourth quarter of 2012. TheAdditional discussions with FNMA and FHLMC during the second quarter of 2013 resulted in further refinements to incremental file request expectations, primarily relating to older vintages. As a result, the liability for estimated losses on indemnification and repurchase claims was increased in June 2013 to reflect this expected additional claim activity, despite the fact that the volume of government-sponsored enterprise (GSE) claims in the second quarter of 2013 dropped compared to first quarter of 2013 was consistent with2013.
46 The PNC Financial Services Group, Inc. –Form 10-Q
In addition to the expectations establisheddecline in the fourth quarter.
The ongoing elevated repurchase claim activity in 2012 contributed to the higher balancessecond quarter of 2013, the level of unresolved claims for residential mortgages and the increase in residential mortgage indemnification and repurchase settlement activity in 2012. In the first quarter of 2013, consistent with our expectations, repurchase claim activity remained high. Despite the high level of new claims, unresolved claims for residential mortgages decreasedis also continuing to decline. This decline is due to an acceleration inof settlement
activity and a continued high level of claim rescissions. The increase in settlements during the first quarter of 2013 was driven by the high volume of claims in 2012 as well as increased efforts to resolve outstanding claims. Because the volume of claims in the first quarter 2013 was consistent with expectations, the first quarter 2013 provision for our indemnification and repurchase liability represents only additions for new production.
At March 31,June 30, 2013 and December 31, 2012, the liability for estimated losses on indemnification and repurchase claims for residential mortgages totaled $522$523 million and $614 million, respectively. We believe our indemnification and repurchase liability appropriately reflects the estimated probable losses on indemnification and repurchase claims for all residential mortgage loans sold and outstanding as of March 31,June 30, 2013 and December 31, 2012. In making these estimates, we consider the losses that we expect to incur over the life of the sold loans. See Note 18 Commitments and Guarantees in the Notes To Consolidated Financial Statements in Part I, Item 1 of this Report for additional information.
Indemnification and repurchase liabilities, which are included in Other liabilities on the Consolidated Balance Sheet, are initially recognized when loans are sold to investors and are subsequently evaluated by management. Initial recognition and subsequent adjustments to the indemnification and repurchase liability for the sold residential mortgage portfolio are recognized in Residential mortgage revenue on the Consolidated Income Statement.
HOME EQUITY REPURCHASE OBLIGATIONS
PNC’s repurchase obligations include obligations with respect to certain brokered home equity loans/lines that were sold to a limited number of private investors in the financial services industry by National City prior to our acquisition of National City. PNC is no longer engaged in the brokered home equity lending business, and our exposure under these loan
The PNC Financial Services Group, Inc. –Form 10-Q45
repurchase obligations is limited to repurchases of the loans sold in these transactions. Repurchase activity associated with brokered home equity lines/loans is reported in the Non-Strategic Assets Portfolio segment.
Loan covenants For more information regarding our Home Equity Repurchase Obligations, see the Recourse and representations and warranties were established through loan sale agreements with various investors to provide assurance that loans PNC sold to the investors are of sufficient investment quality. Key aspects of such covenants and representations and warranties include the loan’s compliance with any applicable loan criteria established for the transaction, including underwriting standards, delivery of all required loan documents to the investor or its designated party, sufficient collateral valuation and the validityRepurchase Obligations portion of the lien securing the loan. As a result of alleged breaches of these contractual obligations, investors may request PNC to indemnify them against losses on certain loans or to repurchase loans.
We investigate every investor claim on a loan by loan basis to determine the existence of a legitimate claim, and that all other conditions for indemnification or repurchase have been met prior to settlement with that investor. Indemnifications for loss or loan repurchases typically occur when, after reviewRisk Management section of the claim, we agree insufficient evidence exists to dispute the investor’s claim that a breachFinancial Review under Item 7 of a loan covenant and representation and warranty has occurred, such breach has not been cured and the effect of such breach is deemed to have had a material and adverse effect on the value of the
transferred loan. Depending on the sale agreement and upon proper notice from the investor, we typically respond to home equity indemnification and repurchase requests within 60 days, although final resolution of the claim may take a longer period of time. Most home equity sale agreements do not provide for penalties or other remedies if we do not respond timely to investor indemnification or repurchase requests.
Investor indemnification or repurchase claims are typically settled on an individual loan basis through make-whole payments or loan repurchases; however, on occasion we may negotiate pooled settlements with investors. In connection with pooled settlements, we typically do not repurchase loans and the consummation of such transactions generally results in us no longer having indemnification and repurchase exposure with the investor in the transaction.our 2012 Form 10-K.
The following table details the unpaid principal balance of our unresolved home equity indemnification and repurchase claims at March 31,June 30, 2013 and December 31, 2012.
Table 35: Analysis of Home Equity Unresolved Asserted Indemnification and Repurchase Claims
| | In millions | | Mar. 31
2013 | | | Dec. 31
2012 | | | June 30
2013 | | | Dec. 31
2012 | |
Home equity loans/lines: | Home equity loans/lines: | | | | | Home equity loans/lines: | | | | |
Private investors(a) | | $ | 20 | | | $ | 74 | | |
Private investors (a) | | | $ | 18 | | | $ | 74 | |
| (a) | Activity relates to brokered home equity loans/lines sold through loan sale transactions which occurred during 2005-2007. |
The table below details our home equity indemnification and repurchase claim settlement activity during the first threesix months and the second quarter of 2013 and 2012.
Table 36: Analysis of Home Equity Indemnification and Repurchase Claim Settlement Activity
| | | | 2013 | | 2012 | | | 2013 | | 2012 | |
| Three months ended March 31 – In millions | | Unpaid
Principal
Balance (a) | | | Losses
Incurred (b) | | | Fair Value of
Repurchased
Loans (c) (d) | | Unpaid
Principal
Balance (a) | | | Losses
Incurred (b) | | | Fair Value of
Repurchased
Loans (c) | | |
| Six months ended June 30 – In millions | | | Unpaid
Principal
Balance (a) | | | Losses
Incurred (b) | | | Fair Value of
Repurchased
Loans (c)(d) | | Unpaid
Principal
Balance (a) | | | Losses
Incurred (b) | | | Fair Value of
Repurchased
Loans (c) | |
Home equity loans/lines: | | | | | | | | | | | | | | | | | | | | | | | | | | |
Private investors – Repurchases (e) | | $ | 2 | | | $ | 30 | | | | | $ | 10 | | | $ | 8 | | | $ | 2 | | | $ | 4 | | | $ | 32 | | | | | $ | 16 | | | $ | 13 | | | $ | 3 | |
| | | | | | | | | | | | | | | | | | | | | | |
| | | 2013 | | 2012 | |
| Three months ended June 30 – In millions | | Unpaid
Principal
Balance (a) | | | Losses
Incurred (b) | | | Fair Value of
Repurchased
Loans (c)(d) | | Unpaid
Principal
Balance (a) | | | Losses
Incurred (b) | | | Fair Value of
Repurchased
Loans (c) | |
Home equity loans/lines: | | | | | | | | | | | | | | | | | | | | | | |
Private investors – Repurchases (e) | | $ | 2 | | | $ | 2 | | | | | $ | 6 | | | $ | 5 | | | $ | 1 | |
| (a) | Represents unpaid principal balance of loans at the indemnification or repurchase date. Excluded from these balances are amounts associated with pooled settlement payments as loans are typically not repurchased in these transactions. |
| (b) | Represents the difference between loan repurchase price and fair value of the loan at the repurchase date. These losses are charged to the indemnification and repurchase liability. Losses incurred in the first threesix months of 2013 also includes amounts for settlement payments. |
| (c) | Represents fair value of loans repurchased only as we have no exposure to changes in the fair value of loans or underlying collateral when indemnification/settlement payments are made to investors. |
| (d) | Activity was less than $.5 million for both the first quarter ofsix months and three months ended June 30, 2013. |
| (e) | Activity relates to brokered home equity loans/lines sold through loan sale transactions which occurred during 2005-2007. |
46 The PNC Financial Services Group, Inc. –Form 10-Q
During 2012 and the first threesix months of 2013, unresolved and settled investor indemnification and repurchase claims were primarily related to one of the following alleged breaches in representations and warranties: (i) misrepresentation of income, assets or employment, (ii) property evaluation or status issues (e.g., appraisal, title, etc.) or (iii) underwriting guideline violations. The lower balance of unresolved indemnification and repurchase claims at March 31,June 30, 2013 is attributed to settlement activity in 2013. The lower first threesix months of 2013 repurchase activity was affected by lower claim activity and lower inventory of claims.
The PNC Financial Services Group, Inc. –Form 10-Q47
An indemnification and repurchase liability for estimated losses for which indemnification is expected to be provided or for loans that are expected to be repurchased was established at the acquisition of National City. Management’s evaluation of these indemnification and repurchase liabilities is based upon trends in indemnification and repurchase claims, actual loss experience, risks in the underlying serviced loan portfolios, current economic conditions and the periodic negotiations that management may enter into with investors to settle existing and potential future claims.
At March 31,June 30, 2013 and December 31, 2012, the liability for estimated losses on indemnification and repurchase claims for home equity loans/lines was $25$24 million and $58 million, respectively. We believe our indemnification and repurchase liability appropriately reflects the estimated probable losses on indemnification and repurchase claims for all home equity loans/lines sold and outstanding as of March 31,June 30, 2013 and December 31, 2012. In making these estimates, we consider the losses that we expect to incur over the life of the sold loans. See Note 18 Commitments and Guarantees in the Notes To Consolidated Financial Statements in Part I, Item 1 of this Report for additional information.
Indemnification and repurchase liabilities, which are included in Other liabilities on the Consolidated Balance Sheet, are evaluated by management on a quarterly basis. Initial recognition and subsequent adjustments to the indemnification and repurchase liability for home equity loans/lines are recognized in Other noninterest income on the Consolidated Income Statement.
RISK MANAGEMENT
PNC encounters risk as part of the normal course of operating our business. Accordingly, we design risk management processes to help manage these risks.
The Risk Management section included in Item 7 of our 2012 Form 10-K describes our risk management philosophy, appetite, culture, governance, risk identification, controls and monitoring and reporting. Additionally, our 2012 Form 10-K provides an analysis of our key areas of risk: credit, operational, liquidity, market and model, as well as amodel. The discussion of ourmarket risk is further subdivided into interest rate, trading and equity and other investment risk areas. Our use of financial derivatives as part of our overall asset and liability risk management process.process is also addressed within the Risk Management section of this Item 7.
The following information updates our 2012 Form 10-K risk management disclosures.
CREDIT RISK MANAGEMENT
Credit risk represents the possibility that a customer, counterparty or issuer may not perform in accordance with contractual terms. Credit risk is inherent in the financial services business and results from extending credit to customers, purchasing securities, and entering into financial derivative transactions and certain guarantee contracts. Credit risk is one of our most significant risks. Our processes for managing credit risk are embedded in PNC’s risk culture and in our decision-making processes using a systematic approach whereby credit risks and related exposures are: identified and assessed, managed through specific policies and processes, measured and evaluated against our risk tolerance limits, and reported, along with specific mitigation activities, to management and the board through our governance structure.
The PNC Financial Services Group, Inc. –Form 10-Q47
ASSET QUALITY OVERVIEW
While credit quality metrics for the first quarter of 2013 were impacted by alignment with interagency supervisory guidance, underlying assetAsset quality trends for the first threesix months of 2013 improved from both December 31, 2012 and March 31,June 30, 2012, including the impact of alignment with interagency supervisory guidance during the first quarter of 2013, and included the following:
Nonperforming loans increased $.2 billion, or 5%,remained flat from December 31, 2012 to $3.4at $3.3 billion as of March 31, 2013. This increase was mainly due toJune 30, 2013 and included the impact from the alignment with interagency supervisory guidance for loans and lines of credit related to consumer loans of $426 million. Thismillion that occurred in the first quarter of 2013. The increase in nonperforming loans from this alignment was partiallysubstantially offset by a reduction in total commercial nonperforming loans, mainly related to commercial real estate, in addition to principal activity within consumer loans.
Overall loan delinquencies decreased $588$944 million, or 16%25%, from year-end 2012 levels. The reduction was mainlypartially due to a decline in total consumer loansloan delinquencies of $395 million duepursuant to the alignment with interagency supervisory guidance as discussed above.in which loans were moved from various delinquency categories to either nonperforming or, in the case of loans accounted for under the fair value option, nonaccruing. In addition, government insured residential real estate accruing loans past due 90 days or more declined $324 million, the majority of which were transferred to OREO. Finally, commercial real estate delinquencies decreased $84 million due to improved performance.
FirstSecond quarter 2013 net charge-offs were $456$208 million, up 37%down 34% from firstsecond quarter 2012 net charge-offs of $333$315 million primarily due to the $134improving credit quality. Six months ending June 30, 2013 net charge-offs were $664 million, up slightly from six months ending June 30, 2012 net charge-offs of charge-offs recognized in the first quarter of 2013$648 million, due to the impact of alignment with interagency supervisory guidance as mentioned above.in the first
48 The PNC Financial Services Group, Inc. –Form 10-Q
| | quarter of 2013 as discussed above partially offset by improving credit quality in the second quarter of 2013. |
Provision for credit losses increaseddecreased to $236$157 million in the firstsecond quarter of 2013 compared with $185$256 million for the firstsecond quarter of 2012 due2012. Provision for credit losses for the six months ending June 30, 2013 declined to a larger loan portfolio.$393 million compared with $441 million for the six months ending June 30, 2012. The declines in the comparisons were driven primarily by overall commercial credit quality improvement.
The level of ALLL has decreased to $3.8 billion at March 31,June 30, 2013 from $4.0 billion at December 31, 2012 and $4.2 billion at March 31,June 30, 2012.
NONPERFORMING ASSETSAND LOAN DELINQUENCIES
Nonperforming Assets, including OREO and Foreclosed Assets
Nonperforming assets include nonaccrualnonperforming loans and leases for which ultimate collectability of the full amount of contractual principal and interest is not probable and include troubled debt restructurings (TDRs), OREO and foreclosed assets. Loans held for sale, certain government insured or guaranteed loans, purchased impaired loans and loans accounted for under the fair value option are excluded from nonperforming loans. Additional information regarding our nonperforming loans and nonaccrual policies is included in Note 1 Accounting Policies in the Notes toTo Consolidated Financial Statements in Part I, Item 1 of this Report. The major categories of nonperforming assets are presented in Table 37: Nonperforming Assets By Type.
Nonperforming assets increased $.1stayed flat at $3.8 billion frombetween June 30, 2013 and December 31, 2012, to $3.9 billion at March 31, 2013, due to the increase in nonperforming loans as discussed above.2012. Nonperforming loans increased $.2 billion$67 million to $3.4$3.3 billion while OREO and foreclosed assets decreased $35$83 million to
$505 $457 million. The ratio of nonperforming loans to total loans increased to 1.83%stayed constant at March 31,1.75 % at June 30, 2013 compared to 1.75% at December 31, 2012. The ratio of nonperforming assets to total loans, OREO and foreclosed assets increaseddecreased to 2.10%1.99% at March 31,June 30, 2013 from 2.04% at December 31, 2012.
In the first quarter of 2013, we completed our alignment of certain nonaccrual and charge-off policies consistent with interagency supervisory guidance on practices for loans and lines of credit related to consumer lending. This alignment primarily related to (i) subordinate consumer loans (home
equity loans and lines and residential mortgages) where the first-lien loan was 90 days or more past due, (ii) government guaranteed loans where the guarantee may not result in collection of substantially all contractual principal and interest and (iii) loans with borrowers in bankruptcy. In the first quarter of 2013, nonperforming loans increased by $426 million and net charge-offs increased by $134 million as a result of completing the alignment of the aforementioned policies. Additionally, overall delinquencies decreased $395 million due to loans now being reported as either nonperforming or, in the case of loans accounted for under the fair value option, nonaccruing or having been charged-off.charged off. The impact of the alignment of the policies was considered in our reserving process in the determination of our ALLL at December 31, 2012. See Table 37: Nonperforming Assets By Type, Table 39: Change in Nonperforming Assets, Table 40: Accruing Loans Past Due 30 To 59 Days, Table 41: Accruing Loans Past Due 60 To 89 Days and Table 42: Accruing Loans Past Due 90 Days Or More for additional information.
At March 31,June 30, 2013, TDRs included in nonperforming loans were $1.5 billion, or 44%46%, of total nonperforming loans compared to $1.6 billion, or 49%, of nonperforming loans as of December 31, 2012. Within consumer nonperforming loans, residential real estate TDRs comprise 51%53% of total residential real estate nonperforming loans at March 31,June 30, 2013, down from 64% at December 31, 2012. Home equity TDRs comprise 59% of home equity nonperforming loans at March 31,June 30, 2013, down from 70% at December 31, 2012. The level of TDRs in these portfolios is expected to result in elevated nonperforming loan levels for longer periods because TDRs generally remain in nonperforming status until a borrower has made at least six consecutive months of payments under the modified terms or ultimate resolution occurs. Loans where borrowers have been discharged from personal liability through Chapter 7 bankruptcy and have not formally reaffirmed their loan obligation withto PNC are not returned to accrual status.
At March 31,June 30, 2013, our largest nonperforming asset was $37 million in the Real Estate, Rental and Leasing Industry and our average nonperforming loans associated with commercial lending were under $1 million. Nine of our ten largest outstanding nonperforming assets are from the commercial lending portfolio and represent 13%14% and 4% of total commercial lending nonperforming loans and total nonperforming assets, respectively, as of March 31,June 30, 2013.
48The PNC Financial Services Group, Inc. –Form 10-Q49
Table 37: Nonperforming Assets By Type
| | | | | | | | |
| In millions | | March 31
2013 | | | December 31
2012 | |
Nonperforming loans | | | | | | | | |
Commercial lending | | | | | | | | |
Commercial | | | | | | | | |
Retail/wholesale trade | | $ | 62 | | | $ | 61 | |
Manufacturing | | | 75 | | | | 73 | |
Service providers | | | 112 | | | | 124 | |
Real estate related (a) | | | 161 | | | | 178 | |
Financial services | | | 13 | | | | 9 | |
Health care | | | 21 | | | | 25 | |
Other industries | | | 98 | | | | 120 | |
Total commercial | | | 542 | | | | 590 | |
Commercial real estate | | | | | | | | |
Real estate projects (b) | | | 606 | | | | 654 | |
Commercial mortgage | | | 138 | | | | 153 | |
Total commercial real estate | | | 744 | | | | 807 | |
Equipment lease financing | | | 9 | | | | 13 | |
Total commercial lending | | | 1,295 | | | | 1,410 | |
Consumer lending (c) | | | | | | | | |
Home equity (d) | | | 1,088 | | | | 951 | |
Residential real estate | | | | | | | | |
Residential mortgage (d) | | | 952 | | | | 824 | |
Residential construction | | | 13 | | | | 21 | |
Credit card | | | 6 | | | | 5 | |
Other consumer (d) | | | 68 | | | | 43 | |
Total consumer lending | | | 2,127 | | | | 1,844 | |
Total nonperforming loans (e) | | | 3,422 | | | | 3,254 | |
OREO and foreclosed assets | | | | | | | | |
Other real estate owned (OREO) (f) | | | 472 | | | | 507 | |
Foreclosed and other assets | | | 33 | | | | 33 | |
Total OREO and foreclosed assets | | | 505 | | | | 540 | |
Total nonperforming assets | | $ | 3,927 | | | $ | 3,794 | |
Amount of commercial lending nonperforming loans contractually current as to remaining principal and interest | | $ | 364 | | | $ | 342 | |
Percentage of total commercial lending nonperforming loans | | | 28 | % | | | 24 | % |
Amount of TDRs included in nonperforming loans | | $ | 1,517 | | | $ | 1,589 | |
Percentage of total nonperforming loans | | | 44 | % | | | 49 | % |
Nonperforming loans to total loans | | | 1.83 | % | | | 1.75 | % |
Nonperforming assets to total loans, OREO and foreclosed assets | | | 2.10 | | | | 2.04 | |
Nonperforming assets to total assets | | | 1.31 | | | | 1.24 | |
Allowance for loan and lease losses to total nonperforming loans (g) | | | 112 | | | | 124 | |
| | | | | | | | |
| In millions | | June 30
2013 | | | December 31
2012 | |
Nonperforming loans | | | | | | | | |
Commercial lending | | | | | | | | |
Commercial | | | | | | | | |
Retail/wholesale trade | | $ | 63 | | | $ | 61 | |
Manufacturing | | | 62 | | | | 73 | |
Service providers | | | 110 | | | | 124 | |
Real estate related (a) | | | 163 | | | | 178 | |
Financial services | | | 14 | | | | 9 | |
Health care | | | 24 | | | | 25 | |
Other industries | | | 85 | | | | 120 | |
Total commercial | | | 521 | | | | 590 | |
Commercial real estate | | | | | | | | |
Real estate projects (b) | | | 516 | | | | 654 | |
Commercial mortgage | | | 123 | | | | 153 | |
Total commercial real estate | | | 639 | | | | 807 | |
Equipment lease financing | | | 7 | | | | 13 | |
Total commercial lending | | | 1,167 | | | | 1,410 | |
Consumer lending (c) | | | | | | | | |
Home equity (d) | | | 1,131 | | | | 951 | |
Residential real estate | | | | | | | | |
Residential mortgage (d) | | | 947 | | | | 824 | |
Residential construction | | | 15 | | | | 21 | |
Credit card | | | 4 | | | | 5 | |
Other consumer (d) | | | 57 | | | | 43 | |
Total consumer lending | | | 2,154 | | | | 1,844 | |
Total nonperforming loans (e) | | | 3,321 | | | | 3,254 | |
OREO and foreclosed assets | | | | | | | | |
Other real estate owned (OREO) (f) | | | 432 | | | | 507 | |
Foreclosed and other assets | | | 25 | | | | 33 | |
Total OREO and foreclosed assets | | | 457 | | | | 540 | |
Total nonperforming assets | | $ | 3,778 | | | $ | 3,794 | |
Amount of commercial lending nonperforming loans contractually current as to remaining principal and interest | | $ | 319 | | | $ | 342 | |
Percentage of total commercial lending nonperforming loans | | | 27 | % | | | 24 | % |
Amount of TDRs included in nonperforming loans | | $ | 1,531 | | | $ | 1,589 | |
Percentage of total nonperforming loans | | | 46 | % | | | 49 | % |
Nonperforming loans to total loans | | | 1.75 | % | | | 1.75 | % |
Nonperforming assets to total loans, OREO and foreclosed assets | | | 1.99 | | | | 2.04 | |
Nonperforming assets to total assets | | | 1.24 | | | | 1.24 | |
Allowance for loan and lease losses to total nonperforming loans (g) | | | 114 | | | | 124 | |
| (a) | Includes loans related to customers in the real estate and construction industries. |
| (b) | Includes both construction loans and intermediate financing for projects. |
| (c) | Excludes most consumer loans and lines of credit, not secured by residential real estate, which are charged off after 120 to 180 days past due and are not placed on nonperforming status. |
| (d) | Pursuant to alignment with interagency supervisory guidance on practices for loans and lines of credit related to consumer lending in the first quarter of 2013, nonperforming home equity loans increased $214 million, nonperforming residential mortgage loans increased $187 million and nonperforming other consumer loans increased $25 million. Charge-offs have been taken on these loans where the fair value less costs to sell the collateral was less than the recorded investment of the loan and were $134 million. |
| (e) | Nonperforming loans exclude certain government insured or guaranteed loans, loans held for sale, loans accounted for under the fair value option and purchased impaired loans. |
| (f) | OREO excludes $383$311 million and $380 million at March 31,June 30, 2013 and December 31, 2012, respectively, related to residential real estate that was acquired by us upon foreclosure of serviced loans because they are insured by the FHA or guaranteed by the VA. |
| (g) | The allowance for loan and lease losses includes impairment reserves attributable to purchased impaired loans. See Note 7 Allowances for Loan and Lease Losses and Unfunded Loan Commitments and Letters of Credit in the Notes To Consolidated Financial Statements in this Report for additional information. |
50 The PNC Financial Services Group, Inc. –Form 10-Q
Table 38 : OREO and Foreclosed Assets
| | In millions | | March 31
2013 | | | December 31
2012 | | | June 30
2013 | | | December 31
2012 | |
Other real estate owned (OREO): | | | | | | | | | | |
Residential properties | | $ | 166 | | | $ | 167 | | | $ | 149 | | | $ | 167 | |
Residential development properties | | | 116 | | | | 135 | | | | 100 | | | | 135 | |
Commercial properties | | | 190 | | | | 205 | | | | 183 | | | | 205 | |
Total OREO | | | 472 | | | | 507 | | | | 432 | | | | 507 | |
Foreclosed and other assets | | | 33 | | | | 33 | | | | 25 | | | | 33 | |
Total OREO and foreclosed assets | | $ | 505 | | | $ | 540 | | | $ | 457 | | | $ | 540 | |
Total OREO and foreclosed assets decreased $35$83 million during the first threesix months of 2013 from $540 million at December 31, 2012, to $505$457 million, or 13%12% of total nonperforming assets, at March 31,June 30, 2013. As of March 31,June 30, 2013 and December 31, 2012, 33% and 31%, respectively, of our OREO and foreclosed assets were comprised of 1-4 family residential properties. The lower level of OREO and foreclosed assets was driven mainly by continued strong sales activity along with valuation losses offset slightly by an increase in residential foreclosures. Excluded from OREO at March 31,June 30, 2013 and December 31, 2012, respectively, was $383$311 million and $380 million of residential real estate that was acquired by us upon foreclosure of serviced loans because they are insured by the FHA or guaranteed by the VA.
The PNC Financial Services Group, Inc. –Form 10-Q49
Table 39: Change in Nonperforming Assets
| | In millions | | 2013 | | 2012 | | | 2013 | | 2012 | |
January 1 | | $ | 3,794 | | | $ | 4,156 | | | $ | 3,794 | | | $ | 4,156 | |
New nonperforming assets (a) | | | 1,032 | | | | 1,186 | | | | 1,805 | | | | 1,983 | |
Charge-offs and valuation adjustments (b) | | | (343 | ) | | | (236 | ) | | | (559 | ) | | | (529 | ) |
Principal activity, including paydowns and payoffs | | | (258 | ) | | | (414 | ) | | | (586 | ) | | | (842 | ) |
Asset sales and transfers to loans held for sale | | | (114 | ) | | | (146 | ) | | | (260 | ) | | | (314 | ) |
Returned to performing status | | | (184 | ) | | | (185 | ) | | | (416 | ) | | | (278 | ) |
March 31 | | $ | 3,927 | | | $ | 4,361 | | |
June 30 | | | $ | 3,778 | | | $ | 4,176 | |
| (a) | New nonperforming assets include $560 million of loans added in the first quarter of 2013 due to the alignment with interagency supervisory guidance on practices for loans and lines of credit related to consumer lending. |
| (b) | Charge-offs and valuation adjustments include $134 million of charge-offs added in the first quarter of 2013 due to the alignment with interagency supervisory guidance discussed in footnote (a) above. |
The table above presents nonperforming asset activity for the threesix months ended March 31,June 30, 2013 and 2012. For the threesix months ended March 31,June 30, 2013, nonperforming assets increased $.1 billiondecreased $16 million from $3.8 billion at December 31, 2012, to $3.9 billion at March 31, 2013, driven primarily by a decrease in commercial lending nonperforming loans and principal activity within consumer, partially offset by increases in consumer lending nonperforming loans due to alignment with interagency supervisory guidance in the first quarter of 2013, partially offset by a decrease in commercial lending nonperforming loans and principal activity.2013. Approximately 87%86% of total nonperforming loans are secured by collateral which would be expected to reduce credit losses and require less reserve in the event of default, and 28%27% of commercial lending nonperforming loans
are contractually current as to both principal and interest obligations. As of March 31,June 30, 2013, commercial nonperforming loans are carried at approximately 55%61% of their unpaid principal balance, due to charge-offs recorded to date, before consideration of the ALLL. See Note 5 Asset Quality in the Notes To Consolidated Financial Statements in Part I, Item 1 of this Report for additional information on these loans.
Purchased impaired loans are considered performing, even if contractually past due (or if we do not expect to receive payment in full based on the original contractual terms), as we are currently accreting interest income over the expected life of the loans. The accretable yield represents the excess of the expected cash flows on the loans at the measurement date over the carrying value. Generally decreases, other than interest rate decreases for variable rate notes, in the net present value of expected cash flows of individual commercial or pooled purchased impaired loans would result in an impairment charge to the provision for loan losses in the period in which
the change is deemed probable. Generally increases in the net present value of expected cash flows of purchased impaired loans would first result in a recovery of previously recorded allowance for loan losses, to the extent applicable, and then an increase to accretable yield for the remaining life of the purchased impaired loans. Total nonperforming loans and assets in the tables above are significantly lower than they would have been due to this accounting treatment for purchased impaired loans. This treatment also results in a lower ratio of nonperforming loans to total loans and a higher ratio of ALLL to nonperforming loans. See Note 6 Purchased Loans in the Notes To Consolidated Financial Statements in this Report for additional information on these loans.
Loan Delinquencies
We regularly monitor the level of loan delinquencies and believe these levels may be a key indicator of loan portfolio asset quality. Measurement of delinquency status is based on the contractual terms of each loan. Loans that are 30 days or more past due in terms of payment are considered delinquent. Loan delinquencies exclude loans held for sale and purchased impaired loans, but include government insured or guaranteed loans and loans accounted for under the fair value option.
Total early stage loan delinquencies (accruing loans past due 30 to 89 days) decreased from $1.4 billion at December 31, 2012, to $1.2$1.0 billion at March 31,June 30, 2013. ConsumerThe reduction in consumer lending early stage delinquencies decreased by $.2 billion. This reduction was mainly due to the alignment with interagency supervisory guidance in the first quarter of 2013 which was partially offset by increaseswhereby such loans were classified as either nonperforming or, in commercialthe case of loans accounted for under the fair value option, nonaccruing. See Note 1 Accounting Policies in the Notes To Consolidated Financial Statements in Part I, Item 1 of this Report for additional information regarding our nonperforming loan and nonaccrual policies. Commercial lending delinquencies.early stage delinquencies decreased primarily due to improving credit quality.
The PNC Financial Services Group, Inc. –Form 10-Q51
Accruing loans past due 90 days or more are referred to as late stage delinquencies. These loans are not included in nonperforming loans and continue to accrue interest because they are well secured by collateral, and/or are in the process of collection, and are reasonably expected to result in repayment and/or restoration to current status, or are managed in homogenous portfolios with specified charge-off timeframes adhering to regulatory guidelines. These loans decreased $.4$.6 billion, or 19%25%, from $2.4 billion at December 31, 2012, to $1.9$1.8 billion at March 31,June 30, 2013, mainly due to the alignment with interagency supervisory guidance in the first quarter of 2013.2013 in which loans were moved to either nonperforming or, in the case of loans accounted for under the fair value option, nonaccruing. In addition, government insured residential real estate loans declined $324 million, the majority of which were transferred to OREO. The following tables display the delinquency status of our loans at March 31,June 30, 2013 and December 31, 2012. Additional information regarding accruing loans past due is included in Note 5 Asset Quality in the Notes To Consolidated Financial Statements in Part I, Item 1 of this Report.
50 The PNC Financial Services Group, Inc. –Form 10-Q
Table 40: Accruing Loans Past Due 30 To 59 Days (a)(b)
| | | | Amount | | | Percentage of Total Outstandings | | | Amount | | | Percentage of Total Outstandings | |
| Dollars in millions | | March 31
2013 | | | December 31
2012 | | | March 31
2013 | | December 31
2012 | | | June 30
2013 | | | December 31
2012 | | | June 30
2013 | | | December 31
2012 | |
Commercial | | $ | 163 | | | $ | 115 | | | | .19 | % | | | .14 | % | | $ | 85 | | | $ | 115 | | | | .10 | % | | | .14 | % |
Commercial real estate | | | 111 | | | | 100 | | | | .59 | | | | .54 | | | | 66 | | | | 100 | | | | .35 | | | | .54 | |
Equipment lease financing | | | 34 | | | | 17 | | | | .47 | | | | .23 | | | | 2 | | | | 17 | | | | .03 | | | | .23 | |
Home equity | | | 86 | | | | 117 | | | | .24 | | | | .33 | | | | 76 | | | | 117 | | | | .21 | | | | .33 | |
Residential real estate | | | | | | | | | | | | | | | | | | |
Non government insured | | | 145 | | | | 151 | | | | .97 | | | | .99 | | | | 120 | | | | 151 | | | | .81 | | | | .99 | |
Government insured | | | 114 | | | | 127 | | | | .76 | | | | .83 | | | | 110 | | | | 127 | | | | .74 | | | | .83 | |
Credit card | | | 30 | | | | 34 | | | | .74 | | | | .79 | | | | 27 | | | | 34 | | | | .65 | | | | .79 | |
Other consumer | | | | | | | | | | | | | | | | | | |
Non government insured | | | 49 | | | | 65 | | | | .23 | | | | .30 | | | | 52 | | | | 65 | | | | .25 | | | | .30 | |
Government insured | | | 162 | | | | 193 | | | | .77 | | | | .90 | | | | 148 | | | | 193 | | | | .70 | | | | .90 | |
Total | | $ | 894 | | | $ | 919 | | | | .48 | | | | .49 | | | $ | 686 | | | $ | 919 | | | | .36 | | | | .49 | |
| (a) | See note (a) at Table 42: Accruing Loans Past Due 90 Days Or More. |
| (b) | See note (b) at Table 42: Accruing Loans Past Due 90 Days Or More. |
Table 41: Accruing Loans Past Due 60 To 89 Days (a)(b)
| | | | Amount | | | Percentage of Total Outstandings | | | Amount | | | Percentage of Total Outstandings | |
| Dollars in millions | | March 31
2013 | | | December 31
2012 | | | March 31
2013 | | December 31
2012 | | | June 30
2013 | | | December 31
2012 | | | June 30
2013 | | | December 31
2012 | |
Commercial | | $ | 35 | | | $ | 55 | | | | .04 | % | | | .07 | % | | $ | 53 | | | $ | 55 | | | | .06 | % | | | .07 | % |
Commercial real estate | | | 36 | | | | 57 | | | | .19 | | | | .31 | | | | 22 | | | | 57 | | | | .12 | | | | .31 | |
Equipment lease financing | | | 1 | | | | 1 | | | | .01 | | | | .01 | | | | 4 | | | | 1 | | | | .05 | | | | .01 | |
Home equity | | | 33 | | | | 58 | | | | .09 | | | | .16 | | | | 29 | | | | 58 | | | | .08 | | | | .16 | |
Residential real estate | | | | | | | | | | | | | | | | | | |
Non government insured | | | 41 | | | | 49 | | | | .27 | | | | .32 | | | | 29 | | | | 49 | | | | .20 | | | | .32 | |
Government insured | | | 86 | | | | 97 | | | | .57 | | | | .64 | | | | 79 | | | | 97 | | | | .53 | | | | .64 | |
Credit card | | | 20 | | | | 23 | | | | .49 | | | | .53 | | | | 19 | | | | 23 | | | | .46 | | | | .53 | |
Other consumer | | | | | | | | | | | | | | | | | | |
Non government insured | | | 15 | | | | 21 | | | | .07 | | | | .10 | | | | 14 | | | | 21 | | | | .07 | | | | .10 | |
Government insured | | | 86 | | | | 110 | | | | .41 | | | | .51 | | | | 100 | | | | 110 | | | | .47 | | | | .51 | |
Total | | $ | 353 | | | $ | 471 | | | | .19 | | | | .25 | | | $ | 349 | | | $ | 471 | | | | .18 | | | | .25 | |
| (a) | See note (a) at Table 42: Accruing Loans Past Due 90 Days Or More. |
| (b) | See note (b) at Table 42: Accruing Loans Past Due 90 Days Or More. |
52The PNC Financial Services Group, Inc. –Form 10-Q51
Table 42: Accruing Loans Past Due 90 Days Or More (a)(b)
| | | | Amount | | | Percentage of Total Outstandings | | | Amount | | | Percentage of Total Outstandings | |
| Dollars in millions | | March 31
2013 | | | December 31
2012 | | | March 31
2013 | | December 31
2012 | | | June 30
2013 | | | December 31
2012 | | | June 30
2013 | | | December 31
2012 | |
Commercial | | $ | 27 | | | $ | 42 | | | | .03 | % | | | .05 | % | | $ | 31 | | | $ | 42 | | | | .04 | % | | | .05 | % |
Commercial real estate | | | 3 | | | | 15 | | | | .02 | | | | .08 | | | | | | 15 | | | | | | .08 | |
Equipment lease financing | | | | | 2 | | | | | | .03 | | | | | | 2 | | | | | | .03 | |
Residential real estate | | | | | | | | | | | | | | | | | | |
Non government insured | | | 59 | | | | 46 | | | | .39 | | | | .30 | | | | 50 | | | | 46 | | | | .34 | | | | .30 | |
Government insured | | | 1,458 | | | | 1,855 | | | | 9.73 | | | | 12.17 | | | | 1,326 | | | | 1,855 | | | | 8.97 | | | | 12.17 | |
Credit card | | | 35 | | | | 36 | | | | .86 | | | | .84 | | | | 33 | | | | 36 | | | | .80 | | | | .84 | |
Other consumer | | | | | | | | | | | | | | | | | | |
Non government insured | | | 13 | | | | 18 | | | | .06 | | | | .08 | | | | 12 | | | | 18 | | | | .06 | | | | .08 | |
Government insured | | | 311 | | | | 337 | | | | 1.47 | | | | 1.57 | | | | 310 | | | | 337 | | | | 1.46 | | | | 1.57 | |
Total | | $ | 1,906 | | | $ | 2,351 | | | | 1.02 | | | | 1.26 | | | $ | 1,762 | | | $ | 2,351 | | | | .93 | | | | 1.26 | |
| (a) | Amounts in table represent recorded investment. |
| (b) | Pursuant to alignment with interagency supervisory guidance on practices for loans and lines of credit related to consumer lending in the first quarter of 2013, accruing consumer loans past due 30 – 59 days decreased $44 million, accruing consumer loans past due 60 – 89 days decreased $36 million and accruing consumer loans past due 90 days or more decreased $315 million, of which $295 million related to residential real estate government insured loans. As part of this alignment, these loans were moved into nonaccrual status. |
On a regular basis our Special Asset Committee closely monitors loans, primarily commercial loans, that are not included in the nonperforming or accruing past due categories and for which we are uncertain about the borrower’s ability to comply with existing repayment terms over the next six months. These loans totaled $.2 billion at both March 31,June 30, 2013 and December 31, 2012.
Home Equity Loan Portfolio
Our home equity loan portfolio totaled $36$36.4 billion as of March 31,June 30, 2013, or 19% of the total loan portfolio. Of that total, $23$22.5 billion, or 64%62%, was outstanding under primarily variable-rate home equity lines of credit and $13$13.9 billion, or 36%38%, consisted of closed-end home equity installment loans. Approximately 3% of the home equity portfolio was on nonperforming status as of March 31,June 30, 2013.
As of March 31,June 30, 2013, we are in an originated first lien position for approximately 44%46% of the total portfolio and, where originated as a second lien, we currently hold or service the first lien position for approximately an additional 2% of the portfolio. Historically, we have originated and sold first lien residential real estate mortgages which resulted in a low percentage of home equity loans where we hold the first lien
mortgage position. The remaining 54%52% of the portfolio was secured by second liens where we do not hold the first lien position. For the majority of the home equity portfolio where we are in, hold or service the first lien position, the credit performance of this portion of the portfolio is superior to the portion of the portfolio where we hold the second lien position but do not hold the first lien.
Lien position information is generally based upon original LTV at the time of origination. However, after origination PNC is not typically notified when a senior lien position that is not held by PNC is satisfied. Therefore, information about
the current lien status of junior lien loans is less readily available in cases where PNC does not also hold the senior lien. Additionally, PNC is not typically notified when a junior lien position is added after origination of a PNC first lien. This updated information for both junior and senior liens must be obtained from external sources and therefore PNC has contracted with an industry leading third-party service provider to obtain updated loan, lien and collateral data that is aggregated from public and private sources. In the first quarter of 2013, PNC further refined our process to include additional validation efforts around the use of third-party data.
The PNC Financial Services Group, Inc. –Form 10-Q53
We track borrower performance monthly, including obtaining original LTVs, updated FICO scores at least quarterly, updated LTVs semi-annually, and other credit metrics at least quarterly, including the historical performance of any mortgage loans regardless of lien position that we may or may not hold. This information is used for internal reporting and risk management. For internal reporting and risk management we also segment the population into pools based on product type (e.g., home equity loans, brokered home equity loans, home equity lines of credit, brokered home equity lines of credit). As part of our overall risk analyticsanalysis and monitoring, we segment the home equity portfolio based upon the delinquency, modification status and bankruptcy status of these loans, as well as the delinquency, modification status and bankruptcy status of any mortgage loan with the same borrower (regardless of whether it is a first lien senior to our second lien).
In establishing our ALLL for non-impaired loans, we utilize a delinquency roll-rate methodology for pools of loans. In accordance with accounting principles, under this methodology, we establish our allowance based upon incurred losses and not lifetime expected losses. We also consider the incremental impact to ALLL when home equity lines of credit transition from interest only product to principal and interest product. The roll-rate methodology estimates transition/roll of loan balances from
52 The PNC Financial Services Group, Inc. –Form 10-Q
one delinquency state (e.g., 30-59 days past due) to another delinquency state (e.g., 60-89 days past due) and ultimately to charge-off. The roll through to charge-off is based on PNC’s actual loss experience for each type of pool. Since a pool may consist of first and second liens, the charge-off amounts for the pool are proportionate to the composition of first and second liens in the pool. Our experience has been that the ratio of first to second lien loans has been consistent over time and is appropriately represented in our pools used for roll-rate calculations.
Generally, our variable-rate home equity lines of credit have either a seven or ten year draw period, followed by a 20 year amortization term. During the draw period, we have home equity lines of credit where borrowers pay interest only and home equity lines of credit where borrowers pay principal and interest. The risk associated with our home equity lines of credit end of period draw dates is considered in establishing our ALLL. Based upon outstanding balances at March 31,June 30, 2013, the following table presents the periods when home equity lines of credit draw periods are scheduled to end.
Table 43: Home Equity Lines of Credit – Draw Period End Dates
| | In millions | | Interest Only
Product | | | Principal and
Interest Product | | | Interest Only
Product | | | Principal and
Interest Product | |
Remainder of 2013 | | $ | 1,332 | | | $ | 178 | | | $ | 1,191 | | | $ | 132 | |
2014 | | | 1,972 | | | | 459 | | | | 1,906 | | | | 448 | |
2015 | | | 1,941 | | | | 636 | | | | 1,878 | | | | 620 | |
2016 | | | 1,512 | | | | 489 | | | | 1,469 | | | | 477 | |
2017 | | | 2,949 | | | | 674 | | | | 2,832 | | | | 659 | |
2018 and thereafter | | | 5,413 | | | | 4,898 | | | | 5,378 | | | | 5,031 | |
Total (a) | | $ | 15,119 | | | $ | 7,334 | | | $ | 14,654 | | | $ | 7,367 | |
| (a) | Includes approximately $257$218 million, $206$199 million, $211$203 million, $60$57 million, $70$65 million and $602$597 million of home equity lines of credit with balloon payments with draw periods scheduled to end in the remainder of 2013, 2014, 2015, 2016, 2017 and 2018 and thereafter, respectively. |
We view home equity lines of credit where borrowers are paying principal and interest under the draw period as less risky than those where the borrowers are paying interest only, as these borrowers have a demonstrated ability to make some level of principal and interest payments.
Based upon outstanding balances, and excluding purchased impaired loans, at March 31,June 30, 2013, for home equity lines of credit for which the borrower can no longer draw (e.g., draw period has ended or borrowing privileges have been terminated), approximately 3.59%3.53% were 30-89 days past due and approximately 6.14%5.64% were greater than or equal to 90 days past due. Generally, when a borrower becomes 60 days past due we terminate borrowing privileges and those privileges are not subsequently reinstated. At that point, we continue our collection/recovery processes, which may include a loss mitigation loan modification resulting in a loan that is classified as a TDR.
See Note 5 Asset Quality in the Notes To Consolidated Financial Statements in Part I, Item 1 of this Report for additional information.
54 The PNC Financial Services Group, Inc. –Form 10-Q
LOAN MODIFICATIONSAND TROUBLED DEBT RESTRUCTURINGS
Consumer Loan Modifications
We modify loans under government and PNC-developed programs based upon our commitment to help eligible homeowners and borrowers avoid foreclosure, where appropriate. Initially, a borrower is evaluated for a modification under a government program. If a borrower does not qualify under a government program, the borrower is then evaluated under a PNC program. Our programs utilize both temporary and permanent modifications and typically reduce the interest rate, extend the term and/or defer principal. Temporary and permanent modifications under programs involving a change to loan terms are generally classified as TDRs. Further, certain payment plans and trial payment arrangements which do not include a contractual change to loan terms may be classified as TDRs. Additional detail on TDRs is discussed below as well as in Note 5 Asset Quality in the Notes To Consolidated Financial Statements in Part I, Item 1 of this Report.
A temporary modification, with a term between 3 and 60 months, involves a change in original loan terms for a period of time and reverts to a calculated exit rate for the remaining term of the loan as of a specific date. A permanent modification, with a term greater than 60 months, is a modification in which the terms of the original loan are
changed. Permanent modifications primarily include the government-created Home Affordable Modification Program (HAMP) or PNC-developed HAMP-like modification programs.
For consumer loan programs, such as residential mortgages and home equity lines of credit we will enter into a temporary modification when the borrower has indicated a temporary hardship and a willingness to bring current the delinquent loan balance. Examples of this situation often include delinquency due to illness or death in the family or loss of employment. The majority of these modifications involve periods of three to 24 months. Permanent modifications are entered into when it is confirmed that the borrower does not possess the income necessary to continue making loan payments at the current amount, but our expectation is that payments at lower amounts can be made. Residential mortgages and home equity loans and lines of credit have been modified with changes in terms for up to 60 months, although the majority involve periods of three to 24 months.
We also monitor the success rates and delinquency status of our loan modification programs to assess their effectiveness in serving our customers’ needs while mitigating credit losses. The following tables provideTable 44: Consumer Real Estate Related Loan Modifications provides the number of accounts and unpaid principal balance of modified consumer real estate related loans as well asand Table 45: Consumer Real Estate Related Loan Modifications Re-Default by Vintage provides the number of accounts and unpaid principal balance of modified loans that were 60 days or more past due as of six months, nine months, twelve months and fifteen months after the modification date.
The PNC Financial Services Group, Inc. –Form 10-Q53
Table 44: Consumer Real Estate Related Loan Modifications
| | | | March 31, 2013 | | | December 31, 2012 | | | June 30, 2013 | | | December 31, 2012 | |
| Dollars in millions | | Number of
Accounts | | | Unpaid
Principal
Balance | | | Number of
Accounts | | | Unpaid
Principal
Balance | | | Number of
Accounts | | | Unpaid Principal Balance | | | Number of Accounts | | | Unpaid
Principal
Balance | |
Home equity | | | | | | | | | | | | | | | | | | |
Temporary Modifications | | | 8,434 | | | $ | 714 | | | | 9,187 | | | $ | 785 | | | | 7,744 | | | $ | 646 | | | | 9,187 | | | $ | 785 | |
Permanent Modifications | | | 8,589 | | | | 631 | | | | 7,457 | | | | 535 | | | | 9,716 | | | | 730 | | | | 7,457 | | | | 535 | |
Total home equity | | | 17,023 | | | | 1,345 | | | | 16,644 | | | | 1,320 | | | | 17,460 | | | | 1,376 | | | | 16,644 | | | | 1,320 | |
Residential Mortgages | | | | | | | | | | | | | | | | | | |
Permanent Modifications | | | 8,647 | | | | 1,618 | | | | 9,151 | | | | 1,676 | | | | 8,933 | | | | 1,652 | | | | 9,151 | | | | 1,676 | |
Non-Prime Mortgages | | | | | | | | | | | | | | | | | | |
Permanent Modifications | | | 4,401 | | | | 625 | | | | 4,449 | | | | 629 | | | | 4,390 | | | | 622 | | | | 4,449 | | | | 629 | |
Residential Construction | | | | | | | | | | | | | | | | | | |
Permanent Modifications | | | 1,894 | | | | 618 | | | | 1,735 | | | | 609 | | | | 2,053 | | | | 630 | | | | 1,735 | | | | 609 | |
Total Consumer Real Estate Related Loan Modifications | | | 31,965 | | | $ | 4,206 | | | | 31,979 | | | $ | 4,234 | | | | 32,836 | | | $ | 4,280 | | | | 31,979 | | | $ | 4,234 | |
The PNC Financial Services Group, Inc. –Form 10-Q55
Table 45: Consumer Real Estate Related Loan Modifications Re-Default by Vintage (a) (b)
| | | | | | | | | | | | | | | | | | | | | | | | | | | | | | | | | | | | |
| | | Six Months | | | Nine Months | | | Twelve Months | | | Fifteen Months | |
March 31, 2013 Dollars in thousands | | Number of
Accounts
Re-defaulted | | | % of
Vintage
Re-defaulted | | | Number of
Accounts
Re-defaulted | | | % of
Vintage
Re-defaulted | | | Number of
Accounts
Re-defaulted | | | % of
Vintage
Re-defaulted | | | Number of
Accounts
Re-defaulted | | | % of
Vintage
Re-defaulted | | | Unpaid
Principal
Balance (c) | |
Permanent Modifications | | | | | | | | | | | | | | | | | | | | | | | | | | | | | | | | | | | | |
Home Equity | | | | | | | | | | | | | | | | | | | | | | | | | | | | | | | | | | | | |
Third Quarter 2012 | | | 48 | | | | 3.0 | % | | | | | | | | | | | | | | | | | | | | | | | | | | $ | 4,733 | |
Second Quarter 2012 | | | 36 | | | | 2.0 | | | | 60 | | | | 3.3 | % | | | | | | | | | | | | | | | | | | | 4,461 | |
First Quarter 2012 | | | 24 | | | | 2.2 | | | | 42 | | | | 3.8 | | | | 47 | | | | 4.2 | % | | | | | | | | | | | 3,059 | |
Fourth Quarter 2011 | | | 9 | | | | 2.0 | | | | 17 | | | | 3.7 | | | | 24 | | | | 5.3 | | | | 25 | | | | 5.5 | % | | | 1,901 | |
Third Quarter 2011 | | | 23 | | | | 4.0 | | | | 31 | | | | 5.4 | | | | 37 | | | | 6.5 | | | | 49 | | | | 8.6 | | | | 3,252 | |
Residential Mortgages | | | | | | | | | | | | | | | | | | | | | | | | | | | | | | | | | | | | |
Third Quarter 2012 | | | 220 | | | | 22.6 | | | | | | | | | | | | | | | | | | | | | | | | | | | | 37,165 | |
Second Quarter 2012 | | | 190 | | | | 18.0 | | | | 320 | | | | 30.3 | | | | | | | | | | | | | | | | | | | | 53,843 | |
First Quarter 2012 | | | 175 | | | | 16.9 | | | | 230 | | | | 22.3 | | | | 305 | | | | 29.5 | | | | | | | | | | | | 50,093 | |
Fourth Quarter 2011 | | | 196 | | | | 21.0 | | | | 268 | | | | 28.7 | | | | 303 | | | | 32.4 | | | | 379 | | | | 40.5 | | | | 64,071 | |
Third Quarter 2011 | | | 243 | | | | 20.7 | | | | 327 | | | | 27.9 | | | | 415 | | | | 35.4 | | | | 442 | | | | 37.7 | | | | 66,648 | |
Non-Prime Mortgages | | | | | | | | | | | | | | | | | | | | | | | | | | | | | | | | | | | | |
Third Quarter 2012 | | | 30 | | | | 21.0 | | | | | | | | | | | | | | | | | | | | | | | | | | | | 4,447 | |
Second Quarter 2012 | | | 39 | | | | 20.1 | | | | 56 | | | | 28.9 | | | | | | | | | | | | | | | | | | | | 6,613 | |
First Quarter 2012 | | | 44 | | | | 20.0 | | | | 55 | | | | 25.0 | | | | 72 | | | | 32.7 | | | | | | | | | | | | 10,061 | |
Fourth Quarter 2011 | | | 38 | | | | 14.6 | | | | 58 | | | | 22.2 | | | | 80 | | | | 30.7 | | | | 93 | | | | 35.6 | | | | 13,219 | |
Third Quarter 2011 | | | 83 | | | | 22.6 | | | | 100 | | | | 27.3 | | | | 130 | | | | 35.4 | | | | 141 | | | | 38.4 | | | | 18,440 | |
Residential Construction | | | | | | | | | | | | | | | | | | | | | | | | | | | | | | | | | | | | |
Third Quarter 2012 | | | 3 | | | | 1.3 | | | | | | | | | | | | | | | | | | | | | | | | | | | | 1,062 | |
Second Quarter 2012 (d) | | | | | | | | | | | 1 | | | | 0.8 | | | | | | | | | | | | | | | | | | | | 193 | |
First Quarter 2012 | | | 2 | | | | 1.6 | | | | 5 | | | | 3.9 | | | | 6 | | | | 4.7 | | | | | | | | | | | | 2,162 | |
Fourth Quarter 2011 | | | 5 | | | | 5.5 | | | | 7 | | | | 7.7 | | | | 14 | | | | 15.4 | | | | 13 | | | | 14.3 | | | | 3,951 | |
Third Quarter 2011 | | | 2 | | | | 1.8 | | | | 2 | | | | 1.8 | | | | 6 | | | | 5.5 | | | | 14 | | | | 12.7 | | | | 1,988 | |
Temporary Modifications | | | | | | | | | | | | | | | | | | | | | | | | | | | | | | | | | | | | |
Home Equity | | | | | | | | | | | | | | | | | | | | | | | | | | | | | | | | | | | | |
Third Quarter 2012 | | | 17 | | | | 10.3 | % | | | | | | | | | | | | | | | | | | | | | | | | | | $ | 963 | |
Second Quarter 2012 | | | 29 | | | | 9.9 | | | | 36 | | | | 12.3 | % | | | | | | | | | | | | | | | | | | | 3,044 | |
First Quarter 2012 | | | 32 | | | | 7.0 | | | | 43 | | | | 9.4 | | | | 59 | | | | 12.9 | % | | | | | | | | | | | 4,508 | |
Fourth Quarter 2011 | | | 26 | | | | 5.2 | | | | 39 | | | | 7.8 | | | | 53 | | | | 10.7 | | | | 59 | | | | 11.9 | % | | | 5,219 | |
Third Quarter 2011 | | | 41 | | | | 9.8 | | | | 49 | | | | 11.7 | | | | 64 | | | | 15.2 | | | | 73 | | | | 17.4 | | | | 7,627 | |
54 The PNC Financial Services Group, Inc. –Form 10-Q
| | | | | | | | | | | | | | | | | | | | | | | | | | | | | | | | | | | | |
| | | Six Months | | | Nine Months | | | Twelve Months | | | Fifteen Months | | | | |
June 30, 2013 Dollars in thousands | | Number of
Accounts
Re-defaulted | | | % of Vintage Re-defaulted | | | Number of Accounts Re-defaulted | | | % of Vintage Re-defaulted | | | Number of Accounts Re-defaulted | | | % of Vintage Re-defaulted | | | Number of Accounts Re-defaulted | | | % of Vintage Re-defaulted | | | Unpaid Principal Balance (c) | |
Permanent Modifications | | | | | | | | | | | | | | | | | | | | | | | | | | | | | | | | | |
Home Equity | | | | | | | | | | | | | | | | | | | | | | | | | | | | | | | | | | | | |
Fourth Quarter 2012 | | | 38 | | | | 3.0 | % | | | | | | | | | | | | | | | | | | | | | | | | | | $ | 4,114 | |
Third Quarter 2012 | | | 48 | | | | 3.0 | | | | 75 | | | | 4.6 | % | | | | | | | | | | | | | | | | | | | 7,293 | |
Second Quarter 2012 | | | 35 | | | | 2.0 | | | | 59 | | | | 3.3 | | | | 73 | | | | 4.1 | % | | | | | | | | | | | 5,262 | |
First Quarter 2012 | | | 24 | | | | 2.2 | | | | 42 | | | | 3.8 | | | | 47 | | | | 4.2 | | | | 52 | | | | 4.7 | % | | | 3,371 | |
Fourth Quarter 2011 | | | 9 | | | | 2.0 | | | | 17 | | | | 3.8 | | | | 24 | | | | 5.3 | | | | 25 | | | | 5.5 | | | | 1,797 | |
Residential Mortgages | | | | | | | | | | | | | | | | | | | | | | | | | | | | | | | | | | | | |
Fourth Quarter 2012 | | | 127 | | | | 17.5 | | | | | | | | | | | | | | | | | | | | | | | | | | | | 22,350 | |
Third Quarter 2012 | | | 219 | | | | 22.5 | | | | 260 | | | | 26.7 | | | | | | | | | | | | | | | | | | | | 43,799 | |
Second Quarter 2012 | | | 182 | | | | 17.4 | | | | 310 | | | | 29.6 | | | | 319 | | | | 30.5 | | | | | | | | | | | | 52,455 | |
First Quarter 2012 | | | 166 | | | | 16.3 | | | | 218 | | | | 21.4 | | | | 293 | | | | 28.7 | | | | 319 | | | | 31.2 | | | | 51,617 | |
Fourth Quarter 2011 | | | 183 | | | | 20.3 | | | | 245 | | | | 27.2 | | | | 275 | | | | 30.5 | | | | 346 | | | | 38.4 | | | | 51,456 | |
Non-Prime Mortgages | | | | | | | | | | | | | | | | | | | | | | | | | | | | | | | | | | | | |
Fourth Quarter 2012 | | | 25 | | | | 21.4 | | | | | | | | | | | | | | | | | | | | | | | | | | | | 3,498 | |
Third Quarter 2012 | | | 30 | | | | 21.0 | | | | 36 | | | | 25.2 | | | | | | | | | | | | | | | | | | | | 5,534 | |
Second Quarter 2012 | | | 37 | | | | 19.3 | | | | 55 | | | | 28.7 | | | | 66 | | | | 34.4 | | | | | | | | | | | | 7,935 | |
First Quarter 2012 | | | 41 | | | | 18.9 | | | | 52 | | | | 24.0 | | | | 69 | | | | 31.8 | | | | 71 | | | | 32.7 | | | | 9,912 | |
Fourth Quarter 2011 | | | 36 | | | | 14.0 | | | | 56 | | | | 21.7 | | | | 78 | | | | 30.2 | | | | 90 | | | | 34.9 | | | | 11,642 | |
Residential Construction | | | | | | | | | | | | | | | | | | | | | | | | | | | | | | | | | |
Fourth Quarter 2012 | | | 3 | | | | 1.7 | | | | | | | | | | | | | | | | | | | | | | | | | | | | 418 | |
Third Quarter 2012 | | | 3 | | | | 1.3 | | | | 1 | | | | 0.4 | | | | | | | | | | | | | | | | | | | | 405 | |
Second Quarter 2012 (d) | | | — | | | | — | | | | 1 | | | | 0.8 | | | | 2 | | | | 1.7 | | | | | | | | | | | | 170 | |
First Quarter 2012 | | | 2 | | | | 1.6 | | | | 5 | | | | 3.9 | | | | 6 | | | | 4.7 | | | | 6 | | | | 4.7 | | | | 2,141 | |
Fourth Quarter 2011 | | | 5 | | | | 5.6 | | | | 7 | | | | 7.8 | | | | 13 | | | | 14.4 | | | | 12 | | | | 13.3 | | | | 3,000 | |
Temporary Modifications | | | | | | | | | | | | | | | | | | | | | | | | | | | | | | | | | |
Home Equity | | | | | | | | | | | | | | | | | | | | | | | | | | | | | | | | | | | | |
Fourth Quarter 2012 | | | 6 | | | | 5.7 | % | | | | | | | | | | | | | | | | | | | | | | | | | | $ | 574 | |
Third Quarter 2012 | | | 17 | | | | 10.4 | | | | 24 | | | | 14.7 | % | | | | | | | | | | | | | | | | | | | 1,745 | |
Second Quarter 2012 | | | 29 | | | | 10.1 | | | | 35 | | | | 12.2 | | | | 46 | | | | 16.0 | % | | | | | | | | | | | 3,788 | |
First Quarter 2012 | | | 32 | | | | 7.0 | | | | 43 | | | | 9.5 | | | | 57 | | | | 12.5 | | | | 62 | | | | 13.6 | % | | | 4,632 | |
Fourth Quarter 2011 | | | 26 | | | | 5.3 | | | | 39 | | | | 7.9 | | | | 51 | | | | 10.4 | | | | 55 | | | | 11.2 | | | | 4,498 | |
| (a) | An account is considered in re-default if it is 60 days or more delinquent after modification. The data in this table represents loan modifications completed during the quarters ending September 30,December 31, 2011 through September 30,December 31, 2012 and represents a vintage look at all quarterly accounts and the number of those modified accounts (for each quarterly vintage) 60 days or more delinquent at six, nine, twelve, and fifteen months after modification. Account totals include active and inactive accounts that were delinquent when they achieved inactive status. Accounts that are no longer 60 days or more delinquent, or were re-modified since prior period, are removed from re-default status in the period they are cured or re-modified. |
| (b) | Vintage refers to the quarter in which the modification occurred. |
| (c) | Reflects March 31,June 30, 2013 unpaid principal balances of the re-defaulted accounts for the ThirdFourth Quarter 2012 Vintage at Six Months, Secondfor the Third Quarter 2012 Vintage at Nine Months, for the FirstSecond Quarter 2012 Vintage at Twelve Months, and for the FourthFirst Quarter 20112012 and prior Vintages at Fifteen Months. |
| (d) | There were no Residential Construction modified loans which became six months past due in the second quarter of 2012. |
56 The PNC Financial Services Group, Inc. –Form 10-Q
In addition to temporary loan modifications, we may make available to a borrower a payment plan or a HAMP trial payment period. Under a payment plan or a HAMP trial payment period, there is no change to the loan’s contractual terms so the borrower remains legally responsible for payment of the loan under its original terms.
Payment plans may include extensions, re-ages and/or forbearance plans. All payment plans bring an account current once certain requirements are achieved and are primarily intended to demonstrate a borrower’s renewed willingness and ability to re-pay. Due to the short term nature of the payment plan there is a minimal impact to the ALLL.
Under a HAMP trial payment period, we establish an alternate payment, generally at an amount less than the contractual payment amount, for the borrower during this short time period. This allows a borrower to demonstrate successful payment performance before permanently restructuring the loan into a HAMP modification. Subsequent to successful borrower performance under the trial payment period, we will capitalize the original contractual amount past due and restructure the loan’s contractual terms, along with bringing the restructured account to current. As the borrower is often already delinquent at the time of participation in the HAMP trial payment period, there is not a significant increase in the ALLL. If the trial payment period is unsuccessful, the loan will be evaluated for further action based upon our existing policies.
Residential conforming and certain residential construction loans have been permanently modified under HAMP or, if they do not qualify for a HAMP modification, under PNC-developed programs, which in some cases may operate similarly to HAMP. These programs first require a reduction of the interest rate followed by an extension of term and, if appropriate, deferral of principal payments. As of March 31,June 30, 2013 and December 31, 2012, 4,6115,125 accounts with a balance of $.7$.8 billion and 4,188 accounts with a balance of $.6 billion, respectively, of residential real estate loans had been modified under HAMP and were still outstanding on our balance sheet.
We do not re-modify a defaulted modified loan except for subsequent significant life events, as defined by the OCC.
A re-modified loan continues to be classified as a TDR for the remainder of its term regardless of subsequent payment performance.
Commercial Loan Modifications and Payment Plans
Modifications of terms for commercial loans are based on individual facts and circumstances. Commercial loan modifications may involve reduction of the interest rate, extension of the term of the loan and/or forgiveness of principal. Modified commercial loans are usually already nonperforming prior to modification. We evaluate these modifications for TDR classification based upon whether we granted a concession to a borrower experiencing financial
difficulties. Additional detail on TDRs is discussed below as well as in Note 5 Asset Quality in the Notes To Consolidated Financial Statements in this Report.
Beginning in 2010, we established certain commercial loan modification and payment programs for small business loans, Small Business Administration loans, and investment real estate loans. As of March 31,June 30, 2013 and December 31, 2012, $63$57 million and $68 million, respectively, in loan balances were covered under these modification and payment plan programs. Of these loan balances, $21$19 million and $24 million have been determined to be TDRs as of March 31,June 30, 2013 and December 31, 2012.
Troubled Debt Restructurings
A TDR is a loan whose terms have been restructured in a manner that grants a concession to a borrower experiencing financial difficulties. TDRs typically result from bankruptcy dischargesborrowers that have been discharged from personal liability through Chapter 7 bankruptcy and have not formally reaffirmed their loan obligations to PNC. Additionally, TDRs result from our loss mitigation activities and include rate reductions, principal forgiveness, postponement/reduction of scheduled amortization and extensions, which are intended to minimize economic loss and to avoid foreclosure or repossession of collateral. For the threesix months ended March 31,June 30, 2013, $.7$1.7 billion of loans held for sale, loans accounted for under the fair value option and pooled purchased impaired loans, as well as certain consumer government insured or guaranteed loans, which were evaluated forexcluded from the TDR consideration, are not classified as TDRs.population. The comparable amount for the threesix months ended March 31,June 30, 2012 was $.7$1.6 billion.
The PNC Financial Services Group, Inc. –Form 10-Q55
Table 46: Summary of Troubled Debt Restructurings
| | In millions | | March 31
2013 | | | December 31
2012 | | | June 30 2013 | | | December 31 2012 | |
Consumer lending: | | | | | | | | | | |
Real estate-related | | $ | 1,956 | | | $ | 2,028 | | | $ | 1,982 | | | $ | 2,028 | |
Credit card (a) | | | 221 | | | | 233 | | | | 208 | | | | 233 | |
Other consumer | | | 54 | | | | 57 | | | | 53 | | | | 57 | |
Total consumer lending | | | 2,231 | | | | 2,318 | | | | 2,243 | | | | 2,318 | |
Total commercial lending | | | 610 | | | | 541 | | | | 599 | | | | 541 | |
Total TDRs | | $ | 2,841 | | | $ | 2,859 | | | $ | 2,842 | | | $ | 2,859 | |
Nonperforming | | $ | 1,517 | | | $ | 1,589 | | | $ | 1,531 | | | $ | 1,589 | |
Accruing (b) | | | 1,103 | | | | 1,037 | | | | 1,103 | | | | 1,037 | |
Credit card (a) | | | 221 | | | | 233 | | | | 208 | | | | 233 | |
Total TDRs | | $ | 2,841 | | | $ | 2,859 | | | $ | 2,842 | | | $ | 2,859 | |
| (a) | Includes credit cards and certain small business and consumer credit agreements whose terms have been restructured and are TDRs. However, since our policy is to exempt these loans from being placed on nonaccrual status as permitted by regulatory guidance as generally these loans are directly charged off in the period that they become 180 days past due, these loans are excluded from nonperforming loans. |
| (b) | Accruing loans have demonstrated a period of at least six months of performance under the restructured terms and are excluded from nonperforming loans. Loans where borrowers have been discharged from personal liability through Chapter 7 bankruptcy and have not formally reaffirmed their loan obligation to PNC are not returned to accrual status. |
The PNC Financial Services Group, Inc. –Form 10-Q57
Total TDRs decreased $18$17 million, or 1%, during the first threesix months of 2013. Nonperforming TDRs totaled $1.5 billion, which represents approximately 44%46% of total nonperforming loans.
TDRs that have returned to performing (accruing) status are excluded from nonperforming loans. Generally, these loans have been returned to performing status as the borrowers have demonstratedare performing under the restructured terms for a period of at least six consecutive months that they can perform under the restructured terms.months. These TDRs increased $66 million, or 6%, during the first threesix months of 2013 to $1.1 billion as of March 31,June 30, 2013. This increase reflects the further seasoning and performance of the TDRs. Loans where borrowers have been discharged from personal liability through Chapter 7 bankruptcy and have not formally reaffirmed their loan obligation to PNC are not returned to accrual status. See Note 5 Asset Quality in the Notes toTo Consolidated Financial Statements in this Report for additional information.
ALLOWANCES FFOROR LOAN AANDND LEASE LOSSES AANDND UNFUNDED LOAN COMMITMENTS AANDND LETTERS OOFF CREDIT
We recorded $456$664 million in net charge-offs for the first threesix months of 2013, compared to $333$648 million in the first threesix months of 2012. Commercial lending net charge-offs increaseddecreased from $96$189 million in the first threesix months of 2012 to $121$151 million in the first threesix months of 2013. Consumer lending net charge-offs increased from $237$459 million in the first threesix months of 2012 to $335$513 million in the first threesix months of 2013.
Table 47: Loan Charge-Offs And Recoveries
| Three months ended March 31 Dollars in millions | | Charge-offs | | | Recoveries | | Net Charge-offs /
(Recoveries) | | Percent of Average Loans
(annualized) | | |
Six months ended June 30 Dollars in millions | | | Charge-offs | | | Recoveries | | | Net Charge-offs /
(Recoveries) | | Percent of Average Loans (annualized) | |
2013 | | | | | | | | | | | | | | | | | | |
Commercial | | $ | 114 | | | $ | 63 | | | $ | 51 | | | | .25 | % | | $ | 195 | | | $ | 129 | | | $ | 66 | | | | .16 | % |
Commercial real estate | | | 86 | | | | 13 | | | | 73 | | | | 1.57 | | | | 137 | | | | 46 | | | | 91 | | | | .97 | |
Equipment lease financing | | | 3 | | | | 6 | | | | (3 | ) | | | (.17 | ) | | | 4 | | | | 10 | | | | (6 | ) | | | (.17 | ) |
Home equity | | | 194 | | | | 13 | | | | 181 | | | | 2.05 | | | | 286 | | | | 37 | | | | 249 | | | | 1.39 | |
Residential real estate | | | 79 | | | | (1 | ) | | | 80 | | | | 2.15 | | | | 122 | | | | | | 122 | | | | 1.64 | |
Credit card | | | 50 | | | | 5 | | | | 45 | | | | 4.42 | | | | 95 | | | | 11 | | | | 84 | | | | 4.13 | |
Other consumer | | | 43 | | | | 14 | | | | 29 | | | | .55 | | | | 86 | | | | 28 | | | | 58 | | | | .55 | |
Total | | $ | 569 | | | $ | 113 | | | $ | 456 | | | | .99 | | | $ | 925 | | | $ | 261 | | | $ | 664 | | | | .71 | |
2012 | | | | | | | | | | | | | | | | | | |
Commercial | | $ | 111 | | | $ | 72 | | | $ | 39 | | | | .23 | % | | $ | 234 | | | $ | 147 | | | $ | 87 | | | | .24 | % |
Commercial real estate | | | 84 | | | | 23 | | | | 61 | | | | 1.46 | | | | 159 | | | | 52 | | | | 107 | | | | 1.22 | |
Equipment lease financing | | | 5 | | | | 9 | | | | (4 | ) | | | (.25 | ) | | | 10 | | | | 15 | | | | (5 | ) | | | (.16 | ) |
Home equity | | | 131 | | | | 13 | | | | 118 | | | | 1.40 | | | | 252 | | | | 30 | | | | 222 | | | | 1.28 | |
Residential real estate | | | 30 | | | | (1 | ) | | | 31 | | | | .84 | | | | 67 | | | | | | 67 | | | | .87 | |
Credit card | | | 55 | | | | 5 | | | | 50 | | | | 5.10 | | | | 110 | | | | 11 | | | | 99 | | | | 4.95 | |
Other consumer | | | 51 | | | | 13 | | | | 38 | | | | .79 | | | | 97 | | | | 26 | | | | 71 | | | | .73 | |
Total | | $ | 467 | | | $ | 134 | | | $ | 333 | | | | .81 | | | $ | 929 | | | $ | 281 | | | $ | 648 | | | | .76 | |
56 The PNC Financial Services Group, Inc. –Form 10-Q
For the first quartersix months of 2013, loan charge-offs were $569$925 million and annualized net charge-offs to average loans was 0.99%0.71%. Pursuant to alignment with interagency guidance on practices for loans and lines of credit related to consumer lending in the first quarter of 2013, additional charge-offs of $134 million were taken. Excluding the impact of these additional charge-offs, annualized net charge-offs to average loans for the first quarter of 2013 was 0.70%.
In addition, total net charge-offs are lower than they would have been otherwise due to the accounting treatment for purchased impaired loans. This treatment also results in a lower ratio of net charge-offs to average loans. See Note 6 Purchased Loans in the Notes To Consolidated Financial Statements in Part I, Item 1 of this Report for additional information on net charge-offs related to these loans.
We maintain an ALLL to absorb losses from the loan and lease portfolio and determine this allowance based on quarterly assessments of the estimated probable credit losses incurred in the loan and lease portfolio. We maintain the ALLL at a level that we believe to be appropriate to absorb estimated probable credit losses incurred in the loan and lease portfolio as of the balance sheet date. The reserve calculation and determination process is dependent on the use of key assumptions. Key reserve assumptions and estimation processes react to and are influenced by observed changes in loan and lease portfolio performance experience, the financial strength of the borrower, and economic conditions. Key reserve assumptions are periodically updated.
58 The PNC Financial Services Group, Inc. –Form 10-Q
We establish specific allowances for loans considered impaired using methods prescribed by GAAP. All impaired loans are subject to individual analysis, except leases and large groups of smaller-balance homogeneous loans which may include, but are not limited to, credit card, residential mortgage and consumer installment loans. Specific allowances for individual loans (including commercial and consumer TDRs) are determined based on an analysis of the present value of expected future cash flows from the loans discounted at their effective interest rate, observable market price or the fair value of the underlying collateral.
Reserves allocated to non-impaired commercial loan classes are based on PD and LGD credit risk ratings.
Our commercial pool reserve methodology is sensitive to changes in key risk parameters such as PD and LGD; the results of these parameters are then applied to the loan balance to determine the amount of the reserve. In general, a given change in any of the major risk parameters will have a corresponding change in the pool reserve allocations for non-impaired commercial loans.
The majority of the commercial portfolio is secured by collateral, including loans to asset-based lending customers that continue to show demonstrably lower LGD. Further, the
large investment grade or equivalent portion of the loan portfolio has performed well and has not been subject to significant deterioration. Additionally, guarantees on loans greater than $1 million and owner guarantees for small business loans do not significantly impact our ALLL.
Allocations to non-impaired consumer loan classes are based upon a roll-rate model which uses statistical relationships, calculated from historical data that estimate the movement of loan outstandings through the various stages of delinquency and ultimately charge-off.
A portion of the ALLL related to qualitative and measurement factors has been assigned to loan categories. These factors may include, but are not limited to, the following:
Industry concentrations and conditions,
Recent credit quality trends,
Recent loss experience in particular portfolios,
Recent macro-economic factors,
Changes in lending policies and procedures, and
Timing of available information, including the performance of first lien positions.positions, and
Limitations of available historical data.
Purchased impaired loans are initially recorded at fair value and applicable accounting guidance prohibits the carry over or creation of valuation allowances at acquisition. Because the initial fair values of these loans already reflect a credit
component, additional reserves are established when performance is expected to be worse than our expectations as of the acquisition date. At March 31,June 30, 2013, we had established reserves of $1.1 billion for purchased impaired loans. In addition, all loans (purchased impaired and non-impaired) acquired in the RBC Bank (USA) acquisition were recorded at fair value. No allowance for loan losses was carried over and no allowance was created at acquisition. See Note 6 Purchased Loans in the Notes To Consolidated Financial Statements in this Report for additional information.
In addition to the ALLL, we maintain an allowance for unfunded loan commitments and letters of credit. We report this allowance as a liability on our Consolidated Balance Sheet. We maintain the allowance for unfunded loan commitments and letters of credit at a level we believe is appropriate to absorb estimated probable losses on these unfunded credit facilities. We determine this amount using estimates of the probability of the ultimate funding and losses related to those credit exposures. Other than the estimation of the probability of funding, this methodology is very similar to the one we use for determining our ALLL.
We refer you to Note 5 Asset Quality and Note 7 Allowances for Loan and Lease Losses and Unfunded Loan Commitments and Letters of Credit in the Notes To Consolidated Financial Statements in Part I, Item 1 of this Report for further information on key asset quality indicators that we use to evaluate our portfolio and establish the allowances.
The PNC Financial Services Group, Inc. –Form 10-Q57
Table 48: Allowance for Loan and Lease Losses
| | Dollars in millions | | 2013 | | 2012 | | | 2013 | | 2012 | |
January 1 | | $ | 4,036 | | | $ | 4,347 | | | $ | 4,036 | | | $ | 4,347 | |
Total net charge-offs | | | (456 | ) | | | (333 | ) | | | (664 | ) | | | (648 | ) |
Provision for credit losses | | | 236 | | | | 185 | | | | 393 | | | | 441 | |
Net change in allowance for unfunded loan commitments and letters of credit | | | 12 | | | | (3 | ) | | | 8 | | | | 16 | |
March 31 | | $ | 3,828 | | | $ | 4,196 | | |
Net charge-offs to average loans (for the three months ended) (annualized) (a) | | | .99 | % | | | .81 | % | |
Other | | | | (1 | ) | | |
June 30 | | | $ | 3,772 | | | $ | 4,156 | |
Net charge-offs to average loans (for the six months ended) (annualized) (a) | | | | .71 | % | | | .76 | % |
Allowance for loan and lease losses to total loans | | | 2.05 | | | | 2.38 | | | | 1.99 | | | | 2.30 | |
Commercial lending net charge-offs | | $ | (121 | ) | | $ | (96 | ) | | $ | (151 | ) | | $ | (189 | ) |
Consumer lending net charge-offs | | | (335 | ) | | | (237 | ) | | | (513 | ) | | | (459 | ) |
Total net charge-offs | | $ | (456 | ) | | $ | (333 | ) | | $ | (664 | ) | | $ | (648 | ) |
Net charge-offs to average loans (for the three months ended) (annualized) | | | | | | |
Net charge-offs to average loans (for the six months ended) (annualized) | | | | | | |
Commercial lending | | | .45 | % | | | .42 | % | | | .27 | % | | | .39 | % |
Consumer lending (a) | | | 1.78 | | | | 1.32 | | | | 1.35 | | | | 1.25 | |
| (a) | Pursuant to alignment with interagency guidance on practices for loans and lines of credit related to consumer lending in the first quarter of 2013, additional charge-offs of $134 million have been taken. Excluding the impact of these additional charge-offs, annualized net charge-offs to average loans for the first quarter 2013 was 0.70%. For consumer lending, excluding the impact of these additional charge-offs, annualized net charge-offs to average loans for the first quarter 2013 was 1.07%. |
The PNC Financial Services Group, Inc. –Form 10-Q59
As further described in the Consolidated Income Statement Review section of this Report, the provision for credit losses totaled $236$393 million for the first threesix months of 2013 compared to $185$441 million for the first threesix months of 2012. For the first threesix months of 2013, the provision for commercial lending credit losses increaseddecreased by $11$60 million, or 25%68%, from the first threesix months of 2012. Similarly, theThe provision for consumer lending credit losses increased $40$12 million, or 28%3%, from the first threesix months of 2012.
At March 31,June 30, 2013, total ALLL to total nonperforming loans was 112%114%. The comparable amount for December 31, 2012 was 124%. These ratios are 70%71% and 79%, respectively, when excluding the $1.4 billion and $1.5 billion, respectively, of ALLL at March 31,June 30, 2013 and December 31, 2012 allocated to consumer loans and lines of credit not secured by residential real estate and purchased impaired loans. We have excluded consumer loans and lines of credit not secured by real estate as they are charged off after 120 to 180 days past due and not placed on nonperforming status. Additionally, we have excluded purchased impaired loans as they are considered performing regardless of their delinquency status as interest is accreted based on our estimate of expected cash flows and additional allowance is recorded when these cash flows are below recorded investment. See Table 37: Nonperforming Assets By Type within this Credit Risk Management section for additional information.
The ALLL balance increases or decreases across periods in relation to fluctuating risk factors, including asset quality trends, charge-offs and changes in aggregate portfolio balances. During the first quartersix months of 2013, improving asset quality trends, including, but not limited to, delinquency status and improving economic conditions, realization of previously estimated losses through charge-offs, including the impact of alignment with interagency guidance and overall portfolio growth, combined to result in the ALLL balance declining $.2 billion, or 5% to $3.8 billion as of March 31,June 30, 2013 compared to December 31, 2012.
See Note 7 Allowances for Loan and Lease Losses and Unfunded Loan Commitments and Letters of Credit and Note 6 Purchased Loans in the Notes To Consolidated Financial Statements in Part I, Item 1 of1of this Report regarding changes in the ALLL and in the allowance for unfunded loan commitments and letters of credit.
LIQUIDITY RISK MANAGEMENT
Liquidity risk has two fundamental components. The first is potential loss assuming we were unable to meet our funding requirements at a reasonable cost. The second is the potential inability to operate our businesses because adequate contingent liquidity is not available in a stressed environment. We manage liquidity risk at the consolidated company level (bank, parent company, and nonbank subsidiaries combined) to help ensure that we can obtain cost-effective funding to meet current and future obligations under both normal “business as usual” and stressful circumstances, and to help ensure that we maintain an appropriate level of contingent liquidity.
Spot and forward funding gap analyses are used to measure and monitor consolidated liquidity risk. Funding gaps represent the difference in projected sources of liquidity available to offset projected uses. We calculate funding gaps for the overnight, thirty-day, ninety-day, one hundred eighty-day and one-year time intervals. Management also monitors liquidity through a series of early warning indicators that may indicate a potential market, or PNC-specific, liquidity stress event. Finally, management performs a set of liquidity stress tests and maintains a contingency funding plan to address a potential liquidity crisis. In the most severe liquidity stress simulation, we assume that PNC’s liquidity position is under pressure, while the market in general is under systemic pressure. The simulation considers, among other things, the impact of restricted access to both secured and unsecured external sources of funding, accelerated run-off of customer deposits, valuation pressure on assets and heavy demand to fund contingent obligations. Risk limits are established within our Liquidity Risk Policy. Management’s Asset and Liability Committee regularly reviews compliance with the established limits.
58 The PNC Financial Services Group, Inc. –Form 10-Q
Parent company liquidity guidelines are designed to help ensure that sufficient liquidity is available to meet our parent company obligations over the succeeding 24-month period. Risk limits for parent company liquidity are established within our Enterprise Capital and Liquidity Management Policy. The Board of Directors’ Risk Committee regularly reviews compliance with the established limits.
BANK LEVEL LIQUIDITY – USES
Obligations requiring the use of liquidity can generally be characterized as either contractual or discretionary. At the bank level, primary contractual obligations include funding loan commitments, satisfying deposit withdrawal requests and maturities and debt service related to bank borrowings. As of March 31,June 30, 2013, there were approximately $12.2$13.5 billion of bank borrowings with contractual maturities of less than one year. We also maintain adequate bank liquidity to meet future potential loan demand and provide for other business needs, as necessary. See the Bank Level Liquidity – Sources section below.
60 The PNC Financial Services Group, Inc. –Form 10-Q
On March 15, 2013 we redeemed $375 million of REIT preferred securities issued by PNC Preferred Funding Trust III with a current distribution rate of 8.7%.
BANK LEVEL LIQUIDITY – SOURCES
Our largest source of bank liquidity on a consolidated basis is the deposit base that comes from our retail and commercial businesses. Total deposits decreased to $211.6$212.3 billion at March 31,June 30, 2013 from $213.1 billion at December 31, 2012, primarily due to runoff of year-end seasonally higher transactions deposits. Liquid assets and unused borrowing capacity from a number of sources are also available to maintain our liquidity position. Borrowed funds come from a diverse mix of short and long-term funding sources.
At March 31,June 30, 2013, our liquid assets consisted of short-term investments (Federal funds sold, resale agreements, trading securities and interest-earning deposits with banks) totaling $5.1$7.5 billion and securities available for sale totaling $49.5$47.9 billion. Of our total liquid assets of $54.6$55.4 billion, we had $24.9$23.1 billion pledged as collateral for borrowings, trust, and other commitments. The level of liquid assets fluctuates over time based on many factors, including market conditions, loan and deposit growth and active balance sheet management including securities purchases to manage duration.activities.
In addition to the customer deposit base, which has historically provided the single largest source of relatively stable and low-cost funding, the bank also obtains liquidity through the issuance of traditional forms of funding including long-term debt (senior notes and subordinated debt and FHLB advances) and short-term borrowings (Federal funds purchased, securities sold under repurchase agreements, commercial paper issuances and other short-term borrowings).
PNC Bank, N.A. is authorized by its board to offer up to $20 billion in senior and subordinated unsecured debt obligations with maturities of more than nine months. Through March 31,June 30, 2013, PNC Bank, N.A. had issued $13.6$15.0 billion of debt under this program including the following during the first quarter of 2013:
$750 million of fixed rate senior notes with a maturity date of January 28, 2016. Interest is payable semi-annually, at a fixed rate of .80%, on January 28 and July 28 of each year, beginning on July 28, 2013,
$250 million of floating rate senior notes with a maturity date of January 28, 2016. Interest is payable at the 3-month LIBOR rate, reset quarterly, plus a spread of .31%, on January 28, April 28, July 28, and October 28 of each year, beginning on April 28, 2013,
$750 million of subordinated notes with a maturity date of January 30, 2023. Interest is payable semi-annually, at a fixed rate of 2.950%, on January 30 and July 30 of each year, beginning on July 30, 2013, and
$1.4 billion of senior extendible floating rate bank notes issued to an affiliate with an initial maturity date of April 14, 2014, subject to the holder’s monthly option to extend, and a final maturity date of January 14, 2015. Interest is payable at the 3-month LIBOR rate, reset quarterly, plus a spread of .225%, which spread is subject to four potential one basis point increases in the event of certain extensions of maturity by the holder. Interest is payable on March 14, June 14, September 14, and December 14 of each year, beginning on June 14, 2013.
| | January 14, 2015. Interest is payable at the 3-month LIBOR rate, reset quarterly, plus a spread of .225%, which spread is subject to four potential one basis point increases in the event of certain extensions of maturity by the holder. Interest is payable on March 14, June 14, September 14, and December 14 of each year, beginning on June 14, 2013, |
On April 29, 2013 and May 9, 2013, PNC Bank, N.A. issued $525$645 million and $120 million, respectively, of floating rate senior notes with a maturity date of April 29, 2016. Interest is payable at the 3-month LIBOR rate, reset quarterly, plus a spread of .32% on January 29, April 29, July 29 and October 29 of each year, beginning on July 29, 2013, and
$800 million of senior extendible floating rate bank notes with an initial maturity date of July 18, 2014, subject to the holder’s monthly option to extend, and a final maturity date of June 18, 2015. Interest is payable at the 3-Month LIBOR rate, reset quarterly, plus a spread of .225%, which spread is subject to four potential one basis point increases in the event of certain extensions of maturity by the holder. Interest is payable on March 20, June 20, September 20 and December 20 of each year, beginning on September 20, 2013.
Total senior and subordinated debt of PNC Bank, N.A. increased to $10.3$9.4 billion at March 31,June 30, 2013 from $7.6 billion at December 31, 2012 primarily due to $3.2$4.6 billion in new borrowing less $450 million$2.6 billion in calls and maturities.
PNC Bank, N.A. is a member of the FHLB-Pittsburgh and as such has access to advances from FHLB-Pittsburgh secured generally by residential mortgage and other mortgage-related loans. At March 31,June 30, 2013, our unused secured borrowing capacity was $14.6$17.2 billion with FHLB-Pittsburgh. Total FHLB borrowings decreased to $5.5$8.5 billion at March 31,June 30, 2013 from $9.4 billion at December 31, 2012 due to $4$6 billion in calls and maturities.maturities and $5 billion of new issuance.
PNC Bank, N.A. has the ability to offer up to $10.0 billion of its commercial paper to provide additional liquidity. As of
The PNC Financial Services Group, Inc. –Form 10-Q59
March 31, June 30, 2013, there was $1.1 billion$500 million outstanding under this program. Commercial paper on our Consolidated Balance Sheet also includes $5.9 billion of commercial paper issued by Market Street Funding LLC, a consolidated VIE.
PNC Bank, N.A. can also borrow from the Federal Reserve Bank of Cleveland’s (Federal Reserve Bank) discount window to meet short-term liquidity requirements. The Federal Reserve Bank, however, is not viewed as the primary means of funding our routine business activities, but rather as a potential source of liquidity in a stressed environment or during a market disruption. These potential borrowings are secured by securities and commercial loans. At March 31,June 30, 2013, our unused secured borrowing capacity was $27.9$27.3 billion with the Federal Reserve Bank.
The PNC Financial Services Group, Inc. –Form 10-Q61
See Note 20 Subsequent Events in the Notes To Consolidated Financial Statements of this Report for information on the issuance of subordinated notes of $750 million on July 25, 2013.
PARENT COMPANY LIQUIDITY – USES
Obligations requiring the use of liquidity can generally be characterized as either contractual or discretionary. The parent company’s contractual obligations consist primarily of debt service related to parent company borrowings and funding non-bank affiliates. As of March 31,June 30, 2013, there were approximately $800 million$1.4 billion of parent company borrowings with maturities of less than one year.
Additionally, the parent company maintains adequate liquidity to fund discretionary activities such as paying dividends to PNC shareholders, share repurchases, and acquisitions. See the Parent Company Liquidity – Sources section below.
See Supervision and Regulation in Item 1 of this Report for information regarding the Federal Reserve’s CCAR process, including its impact on our ability to take certain capital actions, including plans to pay or increase common stock dividends, reinstate or increase common stock repurchase programs, or redeem preferred stock or other regulatory capital instruments.
On March 14, 2013, we used $1.4 billion of parent company cash to purchase senior extendible floating rate bank notes issued by PNC Bank, N.A.
On March 19, 2013, PNC announced the redemption completed on April 19, 2013 of depositary shares representing interests in PNC’s 9.875% Fixed-To-Floating Rate Non-Cumulative Preferred Stock, Series L. Each depositary share represents a 1/4,000th interest in a share of the Series L Preferred Stock. All 6,000,000 depositary shares outstanding were redeemed, as well as all 1,500 shares of Series L Preferred Stock underlying such depositary shares.shares, resulting in a net outflow of $150 million.
On March 22, 2013, we called for the redemption completed on April 23, 2013 of $15 million of trust preferred securities issued by Yardville Capital Trust VI.
On April 8, 2013 we called for redemption completed on May 23, 2013 of the $30 million of trust preferred securities issued by Fidelity Capital Trust III.
On May 1, 2013 we called for redemption completed on June 17, 2013 of the following trust preferred securities:
$15 million issued by Sterling Financial Statutory Trust III,
$15 million issued by Sterling Financial Statutory Trust IV,
$20 million issued by Sterling Financial Statutory Trust V,
$30 million issued by MAF Bancorp Capital Trust I, and
$8 million issued by James Monroe Statutory Trust III.
See Note 20 Subsequent Events Note in the Notes To Consolidated Financial Statements of this Report for information on the additional announcementsredemption of $22 million on July 23, 2013 and completionsa planned redemption of redemptions$35 million on September 16, 2013 of trust preferred securities.
PARENT COMPANY LIQUIDITY – SOURCES
The principal source of parent company liquidity is the dividends it receives from its subsidiary bank, which may be impacted by the following:
Bank-level capital needs,
Contractual restrictions, and
The amount available for dividend payments by PNC Bank, N.A. to the parent company without prior regulatory approval was approximately $866 million at March 31, 2013. There are statutory and regulatory limitations on the ability of national banks to pay dividends or make other capital distributions or to extend credit to the parent company or its non-bank subsidiaries. The amount available for dividend payments by PNC Bank, N.A. to the parent company without prior regulatory approval was approximately $1.1 billion at June 30, 2013. See Note 22 Regulatory Matters in the Notes To Consolidated Financial Statements in Item 8 of our 2012 Form 10-K for a further discussion of these limitations. Dividends may also be impacted by the bank’s capital needs and by contractual restrictions. We provide additional information on certain contractual restrictions under the “Trust Preferred Securities” section of the Off-Balance Sheet Arrangements And Variable Interest Entities section of this Financial Review and in Note 14 Capital Securities of Subsidiary Trusts and Perpetual Trust Securities in the Notes To Consolidated Financial Statements in Item 8 of our 2012 Form 10-K.
In addition to dividends from PNC Bank, N.A., other sources of parent company liquidity include cash and investments, as well as dividends and loan repayments from other subsidiaries and dividends or distributions from equity investments. As of March 31,June 30, 2013, the parent company had approximately $4.0$4.5 billion in funds available from its cash and investments.
We can also generate liquidity for the parent company and PNC’s non-bank subsidiaries through the issuance of debt securities and equity securities, including certain capital instruments, in public or private markets and commercial paper. We have an effective shelf registration statement pursuant to which we can issue additional debt, equity and other capital instruments. Total senior and subordinated debt and hybrid capital instruments decreased to $11.4$10.8 billion at March 31,June 30, 2013 from $11.5 billion at December 31, 2012.
The parent company, through its subsidiary PNC Funding Corp, has the ability to offer up to $3.0 billion of commercial
62 The PNC Financial Services Group, Inc. –Form 10-Q
paper to provide additional liquidity. As of March 31,June 30, 2013, there were no issuances outstanding under this program.
Note 19 Equity in Item 8 of our 2012 Form 10-K describes the 16,885,192 warrants we have outstanding, each to purchase one share of PNC common stock at an exercise price of $67.33 per share. These warrants were sold by the U.S. Treasury in a secondary public offering in May 2010 after the U.S. Treasury exchanged its TARP Warrant. These warrants will expire December 31, 2018.
60 The PNC Financial Services Group, Inc. –Form 10-Q
On May 7, 2013, we issued 500,000 depositary shares, each representing a 1/100th interest in a share of our Fixed-to-Floating Rate Non-Cumulative Perpetual Preferred Stock, Series R, in an underwritten public offering resulting in gross proceeds of $500 million to us before commissions and expenses. We issued 5,000 shares of Series R Preferred Stock to the depositary in this transaction. Non-cumulative cash dividends are payable when, as, and if declared by our board of directors, or an authorized committee of our board, semi-annually on June 1 and December 1 of each year, beginning on December 1, 2013 and ending on June 1, 2023, at a rate of 4.850%. From and including June 1, 2023, such dividends will be payable quarterly on March 1, June 1, September 1 and December 1 of each year beginning on September 1, 2023 at a rate of three-month LIBOR plus 3.04% per annum. The Series R Preferred Stock is redeemable at our option on or
after June 1, 2023 and at our option within 90 days of a regulatory capital treatment event as defined in the designations.
STATUSOF CREDIT RATINGS
The cost and availability of short-term and long-term funding, as well as collateral requirements for certain derivative instruments, is influenced by PNC’s debt ratings.
In general, rating agencies base their ratings on many quantitative and qualitative factors, including capital adequacy, liquidity, asset quality, business mix, level and quality of earnings, and the current legislative and regulatory environment, including implied government support. In
addition, rating agencies themselves have been subject to scrutiny arising from the financial crisis and could make or be required to make substantial changes to their ratings policies and practices, particularly in response to legislative and regulatory changes, including as a result of provisions in Dodd-Frank. Potential changes in the legislative and regulatory environment and the timing of those changes could impact our ratings, which as noted above, could impact our liquidity and financial condition. A decrease, or potential decrease, in credit ratings could impact access to the capital markets and/or increase the cost of debt, and thereby adversely affect liquidity and financial condition.
Table 49: Credit Ratings as of March 31,June 30, 2013 for PNC and PNC Bank, N.A.
| | | | | | | | | | | | |
| | | Moody’s | | | Standard &
Poor’s | | | Fitch | |
The PNC Financial Services Group, Inc. | | | | | | | | | | | | |
Senior debt | | | A3 | | | | A- | | | | A+ | |
Subordinated debt | | | Baa1 | | | | BBB+ | | | | A | |
Preferred stock | | | Baa3 | | | | BBB | | | | BBB- | |
| | | |
PNC Bank, N.A. | | | | | | | | | | | | |
Subordinated debt | | | A3 | | | | A- | | | | A | |
Long-term deposits | | | A2 | | | | A | | | | AA- | |
Short-term deposits | | | P-1 | | | | A-1 | | | | F1+ | |
The PNC Financial Services Group, Inc. –Form 10-Q63
Commitments
The following tables set forth contractual obligations and various other commitments as of March 31,June 30, 2013 representing required and potential cash outflows.
Table 50: Contractual Obligations
| | | | | | | Payment Due By Period | | | | | | Payment Due By Period | |
| March 31, 2013 – in millions | | Total | | | Less than one
year | | | One to three
years | | | Four to five
years | | | After five
years | | |
| June 30, 2013 – in millions | | | Total | | | Less than one year | | | One to three years | | | Four to five years | | | After five years | |
Remaining contractual maturities of time deposits (a) | | $ | 25,079 | | | $ | 17,163 | | | $ | 4,272 | | | $ | 1,379 | | | $ | 2,265 | | | $ | 25,634 | | | $ | 17,824 | | | $ | 4,328 | | | $ | 1,072 | | | $ | 2,410 | |
Borrowed funds (a) (b) | | | 37,647 | | | | 18,166 | | | | 6,069 | | | | 4,931 | | | | 8,481 | | | | 39,864 | | | | 20,308 | | | | 6,388 | | | | 5,440 | | | | 7,728 | |
Minimum annual rentals on noncancellable leases | | | 2,768 | | | | 394 | | | | 662 | | | | 470 | | | | 1,242 | | | | 2,735 | | | | 392 | | | | 652 | | | | 476 | | | | 1,215 | |
Nonqualified pension and postretirement benefits | | | 584 | | | | 96 | | | | 120 | | | | 113 | | | | 255 | | | | 584 | | | | 96 | | | | 120 | | | | 113 | | | | 255 | |
Purchase obligations (c) | | | 668 | | | | 390 | | | | 197 | | | | 51 | | | | 30 | | | | 765 | | | | 454 | | | | 237 | | | | 48 | | | | 26 | |
Total contractual cash obligations | | $ | 66,746 | | | $ | 36,209 | | | $ | 11,320 | | | $ | 6,944 | | | $ | 12,273 | | | $ | 69,582 | | �� | $ | 39,074 | | | $ | 11,725 | | | $ | 7,149 | | | $ | 11,634 | |
| (a) | Includes purchase accounting adjustments. |
| (b) | Includes basis adjustment relating to accounting hedges. |
| (c) | Includes purchase obligations for goods and services covered by noncancellable contracts and contracts including cancellation fees. |
We had unrecognized tax benefits of $133$109 million at March 31,June 30, 2013. This liability for unrecognized tax benefits represents an estimate of tax positions that we have taken in our tax returns which ultimately may not be sustained upon examination by taxing authorities. Since the ultimate amount and timing of any future cash settlements cannot be predicted with reasonable certainty, this estimated liability has been excluded from the contractual obligations table. See Note 16 Income Taxes in the Notes To Consolidated Financial Statements of this Report for additional information.
Our contractual obligations totaled $71.1 billion at December 31, 2012. The decrease in the comparison is primarily attributable to the decrease in borrowed funds and time deposits. See Funding and Capital Sources in the Consolidated Balance Sheet Review section of this Financial Review for additional information regarding our funding sources.
The PNC Financial Services Group, Inc. –Form 10-Q61
Table 51: Other Commitments (a)
| | | | | | | Amount Of Commitment Expiration By Period | | | | | | Amount Of Commitment Expiration By Period | |
| March 31, 2013 – in millions | | Total
Amounts
Committed | | | Less than one
year | | | One to three
years | | | Four to five
years | | | After five years | | |
| June 30, 2013 – in millions | | | Total Amounts Committed | | | Less than one year | | | One to three years | | | Four to five years | | | After five years | |
Net unfunded credit commitments | | $ | 121,812 | | | $ | 50,110 | | | $ | 40,074 | | | $ | 31,053 | | | $ | 575 | | | $ | 124,142 | | | $ | 51,305 | | | $ | 40,591 | | | $ | 31,707 | | | $ | 539 | |
Standby letters of credit (b) | | | 11,458 | | | | 5,137 | | | | 4,898 | | | | 1,400 | | | | 23 | | |
Net outstanding standby letters of credit (b) | | | | 10,917 | | | | 5,066 | | | | 4,566 | | | | 1,274 | | | | 11 | |
Reinsurance agreements (c) | | | 5,814 | | | | 2,919 | | | | 51 | | | | 31 | | | | 2,813 | | | | 5,731 | | | | 2,954 | | | | 43 | | | | 31 | | | | 2,703 | |
Other commitments (d) | | | 943 | | | | 615 | | | | 273 | | | | 52 | | | | 3 | | | | 909 | | | | 647 | | | | 226 | | | | 34 | | | | 2 | |
Total commitments | | $ | 140,027 | | | $ | 58,781 | | | $ | 45,296 | | | $ | 32,536 | | | $ | 3,414 | | | $ | 141,699 | | | $ | 59,972 | | | $ | 45,426 | | | $ | 33,046 | | | $ | 3,255 | |
| (a) | Other commitments are funding commitments that could potentially require performance in the event of demands by third parties or contingent events. Loan commitments are reported net of syndications, assignments and participations. |
| (b) | Includes $7.4$6.8 billion of standby letters of credit that support remarketing programs for customers’ variable rate demand notes. |
| (c) | Reinsurance agreements are with third-party insurers related to insurance sold to our customers. Balances represent estimates based on availability of financial information. |
| (d) | Includes unfunded commitments related to private equity investments of $178 million and other investments of $1$171 million that are not on our Consolidated Balance Sheet. Also includes commitments related to tax credit investments of $707 million and other direct equity investments of $57 million that are included in Other liabilities on our Consolidated Balance Sheet. |
Also includes commitments related to tax credit investments of $674 million and other direct equity investments of $64 million that are included in Other liabilities on our Consolidated Balance Sheet.
Our total commitments totaled $138.8 billion at December 31, 2012. The increase in the comparison is primarily due to an increase in commercial and commercial real estate net unfunded credit commitments.
64 The PNC Financial Services Group, Inc. –Form 10-Q
MARKET RISK MANAGEMENT
Market risk is the risk of a loss in earnings or economic value due to adverse movements in market factors such as interest rates, credit spreads, foreign exchange rates and equity prices. We are exposed to market risk primarily by our involvement in the following activities, among others:
Traditional banking activities of taking deposits and extending loans,
Equity and other investments and activities whose economic values are directly impacted by market factors, and
Fixed income equities,securities, derivatives and foreign exchange activities, as a result of customer activities and underwriting.
We have established enterprise-wide policies and methodologies to identify, measure, monitor and report market risk. Market Risk Management provides independent oversight by monitoring compliance with these limits and
guidelines, and reporting significant risks in the business to the Risk Committee of the Board.
MARKET RISK MANAGEMENT – INTEREST RATE RISK
Interest rate risk results primarily from our traditional banking activities of gathering deposits and extending loans. Many factors, including economic and financial conditions, movements in interest rates and consumer preferences, affect the difference between the interest that we earn on assets and the interest that we pay on liabilities and the level of our noninterest-bearing funding sources. Due to the repricing term mismatches and embedded options inherent in certain of these products, changes in market interest rates not only affect expected near-term earnings, but also the economic values of these assets and liabilities.
Asset and Liability Management centrally manages interest rate risk as prescribed in our risk management policies, which are approved by management’s Asset and Liability Committee and the Risk Committee of the Board.
Sensitivity results and market interest rate benchmarks for the firstsecond quarters of 2013 and 2012 follow:
Table 52: Interest Sensitivity Analysis
| | | | First
Quarter
2013 | | First
Quarter
2012 | | | Second
Quarter
2013 | | Second
Quarter
2012 | |
Net Interest Income Sensitivity Simulation | | | | | | | | | | |
Effect on net interest income in first year from gradual interest rate change over following 12 months of: | | | | | | | | | | |
100 basis point increase | | | 2.1 | % | | | 2.4 | % | | | 1.7 | % | | | 2.5 | % |
100 basis point decrease (a) | | | (1.2 | )% | | | (1.7 | )% | | | (1.0 | )% | | | (1.9 | )% |
Effect on net interest income in second year from gradual interest rate change over the preceding 12 months of: | | | | | | | | | | |
100 basis point increase | | | 8.0 | % | | | 7.1 | % | | | 6.0 | % | | | 7.9 | % |
100 basis point decrease (a) | | | (4.8 | )% | | | (4.9 | )% | | | (4.5 | )% | | | (5.1 | )% |
Duration of Equity Model (a) | | | | | | | | | | |
Base case duration of equity (in years): | | | (5.6 | ) | | | (6.0 | ) | | | (2.4 | ) | | | (8.2 | ) |
Key Period-End Interest Rates | | | | | | | | | | |
One-month LIBOR | | | .20 | % | | | .24 | % | | | .19 | % | | | .25 | % |
Three-year swap | | | .54 | % | | | .76 | % | | | .82 | % | | | .62 | % |
| (a) | Given the inherent limitations in certain of these measurement tools and techniques, results become less meaningful as interest rates approach zero. |
In addition to measuring the effect on net interest income assuming parallel changes in current interest rates, we routinely simulate the effects of a number of nonparallel interest rate environments. The following Net Interest Income Sensitivity to Alternative Rate Scenarios (First(Second Quarter 2013) table reflects the percentage change in net interest income over the next two 12-month periods assuming (i) the PNC Economist’s most likely rate forecast, (ii) implied market
62 The PNC Financial Services Group, Inc. –Form 10-Q
forward rates and (iii) Yield Curve Slope Flattening (a 100 basis point yield curve slope flattening between 1-month and ten-year rates superimposed on current base rates) scenario.
Table 53: Net Interest Income Sensitivity to Alternative Rate Scenarios (First(Second Quarter 2013)
| | | | PNC
Economist | | | Market
Forward | | | Slope
Flattening | | | PNC
Economist | | Market
Forward | | | Slope
Flattening | |
First year sensitivity | | | .09 | % | | | .52 | % | | | (.89 | )% | | | (.43 | )% | | | .99 | % | | | (.74 | )% |
Second year sensitivity | | | 1.55 | % | | | 2.50 | % | | | (3.73 | )% | | | (.17 | )% | | | 4.09 | % | | | (3.21 | )% |
The PNC Financial Services Group, Inc. –Form 10-Q65
All changes in forecasted net interest income are relative to results in a base rate scenario where current market rates are assumed to remain unchanged over the forecast horizon.
When forecasting net interest income, we make assumptions about interest rates and the shape of the yield curve, the volume and characteristics of new business and the behavior of existing on- and off-balance sheet positions. These assumptions determine the future level of simulated net interest income in the base interest rate scenario and the other interest rate scenarios presented in the above table. These simulations assume that as assets and liabilities mature, they are replaced or repriced at then current market rates. We also consider forward projections of purchase accounting accretion when forecasting net interest income.
The following graph presents the LIBOR/Swap yield curves for the base rate scenario and each of the alternate scenarios one year forward.
Table 54: Alternate Interest Rate Scenarios: One Year Forward
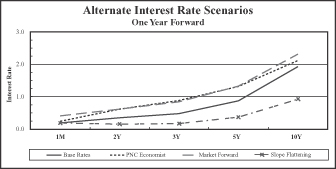
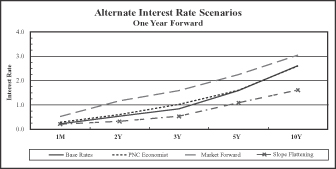
The firstsecond quarter 2013 interest sensitivity analyses indicate that our Consolidated Balance Sheet is positioned to benefit from an increase in interest rates and an upward sloping interest rate yield curve. We believe that we have the deposit funding base and balance sheet flexibility to adjust, where appropriate and permissible, to changing interest rates and market conditions.
MARKET RISK MANAGEMENT – TRADING RISK
Our trading activities are primarily customer-driven trading in fixed income securities, derivatives and foreign exchange contracts, as well as the daily mark-to-market impact from the
credit valuation adjustment (CVA) on the customer derivatives portfolio. They also include the underwriting of fixed income and equity securities.
We use value-at-risk (VaR) as the primary means to measure and monitor market risk in trading activities. We calculate a diversified VaR at a 95% confidence interval. VaR is used to estimate the probability of portfolio losses based on the statistical analysis of historical market risk factors. A diversified VaR reflects empirical correlations across different asset classes.
PNC began to include the daily mark-to-market impact from the CVA in determining the diversified VaR measure during the first quarter of 2012 due to enhancements in our models. During the first threesix months of 2013, our 95% VaR ranged between $3.2$1.9 million and $5.3$5.5 million, averaging $3.8$4.1 million. During the first threesix months of 2012, our 95% VaR ranged between $3.3$2.5 million and $4.6$5.3 million, averaging $4.0$3.9 million.
To help ensure the integrity of the models used to calculate VaR for each portfolio and enterprise-wide, we use a process known as backtesting. The backtesting process consists of comparing actual observations of trading-related gains or losses against the VaR levels that were calculated at the close of the prior day. This assumes that market exposures remain constant throughout the day and that recent historical market variability is a good predictor of future variability. Our actual trading relatedtrading-related activity includes customer revenue and intraday hedging which helps to reduce trading losses, and may reduce the number of instances of actual losses exceeding the prior day VaR measure. There were no such instances during the first threesix months of 2013 under our diversified VaR measure. In comparison, there was onetwo such instance during the first threesix months of 2012. We use a 500 day look back period for backtesting and include customer related revenue.
The following graph shows a comparison of enterprise-wide trading-related gains and losses against prior day diversified VaR for the period indicated.
Table 55: Enterprise-Wide Trading-Related Gains/Losses Versus Value at RiskValue-at-Risk
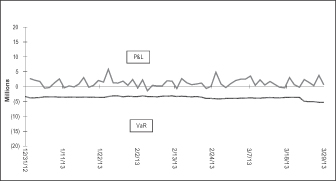
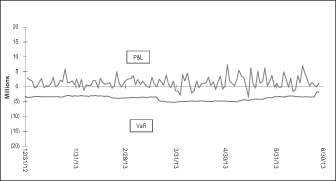
66The PNC Financial Services Group, Inc. –Form 10-Q63
Total trading revenue was as follows:
Table 56: Trading Revenue
| Three months ended March 31 In millions | | 2013 | | | 2012 | | |
Six months ended June 30 In millions | | | 2013 | | | 2012 | |
Net interest income | | $ | 9 | | | $ | 9 | | | $ | 17 | | | $ | 20 | |
Noninterest income | | | 51 | | | | 72 | | | | 144 | | | | 105 | |
Total trading revenue | | $ | 60 | | | $ | 81 | | | $ | 161 | | | $ | 125 | |
Securities underwriting and trading (a) | | $ | 25 | | | $ | 25 | | | $ | 41 | | | $ | 43 | |
Foreign exchange | | | 19 | | | | 20 | | | | 42 | | | | 47 | |
Financial derivatives and other | | | 16 | | | | 36 | | | | 78 | | | | 35 | |
Total trading revenue | | $ | 60 | | | $ | 81 | | | $ | 161 | | | $ | 125 | |
| | | | | | | | |
Three months ended June 30 In millions | | 2013 | | | 2012 | |
Net interest income | | $ | 8 | | | $ | 11 | |
Noninterest income | | | 93 | | | | 33 | |
Total trading revenue | | $ | 101 | | | $ | 44 | |
Securities underwriting and trading (a) | | $ | 16 | | | $ | 18 | |
Foreign exchange | | | 23 | | | | 27 | |
Financial derivatives and other | | | 62 | | | | (1 | ) |
Total trading revenue | | $ | 101 | | | $ | 44 | |
| (a) | Includes changes in fair value for certain loans accounted for at fair value. |
The trading revenue disclosed above includes results from providing investing, and risk management and underwriting services to our customers as well as results from hedges of customer activity. Trading revenue excludes the impact of economic hedging activities which we transact to manage risk primarily related to residential and commercial mortgage servicing rights and residential and commercial mortgage loans held-for-sale. Derivatives used for economic hedges are not designated as accounting hedges because the contracts they are hedging are typically also carried at fair value on the balance sheet, resulting in symmetrical accounting treatment for both the hedging instrument and the hedged item. Economic hedge results, along with the associated hedged items, are reported in the respective income statement line items, as appropriate.
Trading revenuerevenues for the first quartersix months of 2013 decreased $21increased $36 million compared with the first six months of 2012. Trading revenue for the second quarter of 20122013 increased $57 million compared with the second quarter of 2012. The increases in both comparisons primarily dueresult from the impact of higher market interest rates on credit valuations related to lower derivativecustomer-initiated hedging activities and improved debt underwriting results which were partially offset by reduced client related revenues.derivatives revenue.
MARKET RISK MANAGEMENT – EQUITYAND OTHER INVESTMENT RISK
Equity investment risk is the risk of potential losses associated with investing in both private and public equity markets. PNC invests primarily in private equity markets. In addition to extending credit, taking deposits, and underwriting and trading financial instruments, we make and manage direct investments in a variety of transactions, including management buyouts, recapitalizations, and growth financings in a variety of industries. We also have investments in affiliated and non-affiliated funds that make similar investments in private equity and in debt and equity-oriented hedge funds. The economic and/or book value of these investments and other assets such as loan servicing rights are directly affected by changes in market factors.
The primary risk measurement for equity and other investments is economic capital. Economic capital is a common measure of risk for credit, market and operational risk. It is an estimate of the potential value depreciation over a one year horizon commensurate with solvency expectations of an institution rated single-A by the credit rating agencies.
Given the illiquid nature of many of these types of investments, it can be a challenge to determine their fair values. See Note 9 Fair Value in the Notes To Consolidated Financial Statements in this Report and in our 2012Form 10-K for additional information.
Various PNC business units manage our equity and other investment activities. Our businesses are responsible for making investment decisions within the approved policy limits and associated guidelines.
A summary of our equity investments follows:
Table 57: Equity Investments Summary
| | In millions | | Mar. 31
2013 | | | Dec. 31
2012 | | | June 30
2013 | | | Dec. 31
2012 | |
BlackRock | | $ | 5,590 | | | $ | 5,614 | | | $ | 5,713 | | | $ | 5,614 | |
Tax credit investments | | | 3,126 | | | | 2,965 | | | | 2,175 | | | | 2,965 | |
Private equity | | | 1,811 | | | | 1,802 | | | | 1,729 | | | | 1,802 | |
Visa | | | 251 | | | | 251 | | | | 204 | | | | 251 | |
Other | | | 230 | | | | 245 | | | | 233 | | | | 245 | |
Total | | $ | 11,008 | | | $ | 10,877 | | | $ | 10,054 | | | $ | 10,877 | |
BLACKROCK
PNC owned approximately 36 million common stock equivalent shares of BlackRock equity at March 31,June 30, 2013, accounted for under the equity method. The primary risk measurement, similar to other equity investments, is economic capital. The Business Segments Review section of this Financial Review includes additional information about BlackRock.
The PNC Financial Services Group, Inc. –Form 10-Q67
TAX CREDIT INVESTMENTS
Included in our equity investments are tax credit investments which are accounted for under the equity method. These investments, as well as equity investments held by consolidated partnerships, totaled $3.1$2.2 billion at March 31,June 30, 2013 and $3.0 billion at December 31, 2012. These equity investment balances include unfunded commitments totaling $707$674 million and $685 million, respectively. These unfunded commitments are included in Other Liabilities on our Consolidated Balance Sheet.
Note 3 Loan Sale and Servicing Activities and Variable Interest Entities in the Notes To Consolidated Financial Statements in Part I, Item 1 of this Report has further information on Tax Credit Investments.
PRIVATE EQUITY
The private equity portfolio is an illiquid portfolio comprised of mezzanine and equity investments that vary by industry, stage and type of investment.
Private equity investments carried at estimated fair value totaled $1.7 billion at June 30, 2013 compared with $1.8 billion at both March 31, 2013 and December 31, 2012. As of March 31,June 30, 2013, $1.2$1.1 billion was invested directly
64 The PNC Financial Services Group, Inc. –Form 10-Q
in a variety of companies and $.6 billion was invested indirectly through various private equity funds. Included in direct investments are investment activities of two private equity funds that are consolidated for financial reporting purposes. The noncontrolling interests of these funds totaled $270$235 million as of March 31,June 30, 2013. The interests held in indirect private equity funds are not redeemable, but PNC receivesmay receive distributions over the life of the partnership from liquidation of the underlying investments by the investee.investments. See Item 1 Business – Supervision and Regulation and Item 1A Risk Factors included in our 2012 Form 10-K for discussion of potential impacts of the Volcker Rule provisions of Dodd-Frank on our holding interests in and sponsorship of private equity or hedge funds.
Our unfunded commitments related to private equity totaled $178$171 million at March 31,June 30, 2013 compared with $182 million at December 31, 2012.
VISA
In 2012,During second quarter of 2013 we sold 92 million of Visa Class B common shares, in addition to the 9 million shares sold in the second half of 2012, and entered into swap agreements with the purchaser of the shares. See Note 9 Fair Value in this Report and in our 2012 Form 10-K and Note 13 Financial Derivatives in the Notes To Consolidated Financial Statements in Part I, Item 1 of this Report for additional information. At March 31,June 30, 2013, our investment in Visa Class B common shares totaled approximately 1412 million shares and was recorded at $251$204 million. Based on the March 31,June 30, 2013 closing price of $169.84$182.75 for the Visa Class A common shares,
the fair value of our total investment was approximately $1.0 billion$950 million at the current conversion rate which reflects adjustments in respect of all litigation funding by Visa to date. The Visa Class B common shares that we own are transferable only under limited circumstances (including those applicable to the sales in the second quarter of 2013 and in the second half of 2012) until they can be converted into shares of the publicly traded class of stock, which cannot happen until the settlement of all of the specified litigation. It is expected that Visa will continue to adjust the conversion rate of Visa Class B common shares to Class A common shares in connection with any settlements of the specified litigation in excess of any amounts then in escrow for that purpose and will also reduce the conversion rate to the extent that it adds any funds to the escrow in the future.
Our 2012 Form 10-K has additional information regarding the October 2007 Visa restructuring, our involvement with judgment and loss sharing agreements with Visa and certain other banks, and the status of pending interchange litigation. See Note 17 Legal Proceedings and Note 18 Commitments and Guarantees in our Notes To Consolidated Financial Statements of this Report for additional information.
OTHER INVESTMENTS
We also make investments in affiliated and non-affiliated funds with both traditional and alternative investment strategies. The economic values could be driven by either the fixed-income market or the equity markets, or both. At March 31,June 30, 2013, other investments totaled $230$233 million compared with $245 million at December 31, 2012. We recognized net gains related to these investments of $20$25 million and $15$13 million during the first threesix months of 2013 and 2012, respectively.including net gains of $5 million during the second quarter of 2013 and $2 million loss during second quarter of 2012.
Given the nature of these investments, if market conditions affecting their valuation were to worsen, we could incur future losses.
Our unfunded commitments related to other investments totaledwere less than $1 million at March 31,June 30, 2013 and $3 million at December 31, 2012.
FINANCIAL DERIVATIVES
We use a variety of financial derivatives as part of the overall asset and liability risk management process to help manage exposure to interest rate, market and credit risk inherent in our business activities. Substantially all such instruments are used to manage risk related to changes in interest rates. Interest rate and total return swaps, interest rate caps and floors, swaptions, options, forwards and futures contracts are the primary instruments we use for interest rate risk management. We also enter into derivatives with customers to facilitate their risk management activities.
68 The PNC Financial Services Group, Inc. –Form 10-Q
Financial derivatives involve, to varying degrees, interest rate, market and credit risk. For interest rate swaps and total return swaps, options and futures contracts, only periodic cash payments and, with respect to options, premiums are exchanged. Therefore, cash requirements and exposure to credit risk are significantly less than the notional amount on these instruments.
Further information on our financial derivatives is presented in Note 1 Accounting Policies and Note 9 Fair Value in our Notes To Consolidated Financial Statements under Item 8 of our 2012 Form 10-K and in Note 9 Fair Value and Note 13 Financial Derivatives in the Notes To Consolidated Financial Statements in Part I, Item 1 of this Report, which is incorporated here by reference.
Not all elements of interest rate, market and credit risk are addressed through the use of financial or other derivatives, and such instruments may be ineffective for their intended purposes due to unanticipated market changes, among other reasons.
The PNC Financial Services Group, Inc. –Form 10-Q65
The following table summarizes the notional or contractual amounts and net fair value of financial derivatives at March 31,June 30, 2013 and December 31, 2012.
Table 58: Financial Derivatives Summary
| | | | March 31, 2013 | | | December 31, 2012 | | | June 30, 2013 | | December 31, 2012 | |
| In millions | | Notional/
Contractual
Amount | | | Net Fair
Value (a) | | | Notional/
Contractual
Amount | | | Net Fair
Value (a) | | | Notional/
Contractual
Amount | | | Net Fair
Value (a) | | Notional/
Contractual
Amount | | | Net Fair
Value (a) | |
Derivatives designated as hedging instruments under GAAP | | | | | | | | | | | | | | | | |
Total derivatives designated as hedging instruments | | $ | 30,670 | | | $ | 1,619 | | | $ | 29,270 | | | $ | 1,720 | | | $ | 33,857 | | | $ | 1,051 | | | $ | 29,270 | | | $ | 1,720 | |
Derivatives not designated as hedging instruments under GAAP | | | | | | | | | | | | | | | | | | |
Total derivatives used for residential mortgage banking activities | | $ | 169,487 | | | $ | 576 | | | $ | 166,819 | | | $ | 588 | | | $ | 160,604 | | | $ | 477 | | | $ | 166,819 | | | $ | 588 | |
Total derivatives used for commercial mortgage banking activities | | | 3,919 | | | | (21 | ) | | | 4,606 | | | | (23 | ) | | | 9,991 | | | | (16 | ) | | | 4,606 | | | | (23 | ) |
Total derivatives used for customer-related activities | | | 159,851 | | | | 57 | | | | 163,848 | | | | 30 | | | | 163,935 | | | | 74 | | | | 163,848 | | | | 30 | |
Total derivatives used for other risk management activities | | | 2,064 | | | | (383 | ) | | | 1,813 | | | | (357 | ) | | | 2,261 | | | | (331 | ) | | | 1,813 | | | | (357 | ) |
Total derivatives not designated as hedging instruments | | $ | 335,321 | | | $ | 229 | | | $ | 337,086 | | | $ | 238 | | | $ | 336,791 | | | $ | 204 | | | $ | 337,086 | | | $ | 238 | |
Total Derivatives | | $ | 365,991 | | | $ | 1,848 | | | $ | 366,356 | | | $ | 1,958 | | | $ | 370,648 | | | $ | 1,255 | | | $ | 366,356 | | | $ | 1,958 | |
| (a) | Represents the net fair value of assets and liabilities. |
INTERNAL CONTROLS AANDND DISCLOSURE CONTROLS AANDND PROCEDURES
As of March 31,June 30, 2013, we performed an evaluation under the supervision and with the participation of our management, including the Chief Executive Officer and the Executive Vice President and Chief Financial Officer, of the effectiveness of the design and operation of our disclosure controls and procedures and of changes in our internal control over financial reporting.
Based on that evaluation, our Chief Executive Officer and our Executive Vice President and Chief Financial Officer concluded that our disclosure controls and procedures (as defined in Rule 13a-15(e) under the Securities and Exchange Act of 1934, as amended) were effective as of March 31,June 30, 2013, and that there has been no change in PNC’s internal control over financial reporting that occurred during the firstsecond quarter of 2013 that has materially affected, or is reasonably likely to materially affect, our internal control over financial reporting.
The PNC Financial Services Group, Inc. –Form 10-Q69
GLOSSARY OF TERMS
Accretable net interest (Accretable yield) – The excess of cash flows expected to be collected on a purchased impaired loan over the carrying value of the loan. The accretable net interest is recognized into interest income over the remaining life of the loan using the constant effective yield method.
Adjusted average total assets – Primarily comprised of total average quarterly (or annual) assets plus (less) unrealized losses (gains) on investment securities, less goodwill and certain other intangible assets (net of eligible deferred taxes).
Annualized – Adjusted to reflect a full year of activity.
Assets under management – Assets over which we have sole or shared investment authority for our customers/clients. We do not include these assets on our Consolidated Balance Sheet.
Basel I Tier 1 common capital – Basel I Tier 1 risk-based capital, less preferred equity, less trust preferred capital securities, and less noncontrolling interests.
Basel I Tier 1 common capital ratio – Basel I Tier 1 common capital divided by period-end Basel I risk-weighted assets.
Basel I Leverage ratio – Basel I Tier 1 risk-based capital divided by adjusted average total assets.
Basel I Tier 1 risk-based capital – Total shareholders’ equity, plus trust preferred capital securities, plus certain noncontrolling interests that are held by others; less goodwill and certain other intangible assets (net of eligible deferred taxes relating to taxable and nontaxable combinations), less equity investments in nonfinancial companies less ineligible servicing assets and less net unrealized holding losses on available for sale equity securities. Net unrealized holding gains on available for sale equity securities, net unrealized holding gains (losses) on available for sale debt securities and net unrealized holding gains (losses) on cash flow hedge derivatives are excluded from total shareholders’ equity for Basel I Tier 1 risk-based capital purposes.
Basel I Tier 1 risk-based capital ratio – Basel I Tier 1 risk-based capital divided by period-end Basel I risk-weighted assets.
Basel I Total risk-based capital – Basel I Tier 1 risk-based capital plus qualifying subordinated debt and trust preferred securities, other noncontrolling interest not qualified as Basel I Tier 1, eligible gains on available for sale equity securities and the allowance for loan and lease losses, subject to certain limitations.
Basel I Total risk-based capital ratio – Basel I Total risk-based capital divided by period-end Basel I risk-weighted assets.
Basis point – One hundredth of a percentage point.
Carrying value of purchased impaired loans – The net value on the balance sheet which represents the recorded investment less any valuation allowance.
Cash recoveries – Cash recoveries used in the context of purchased impaired loans represent cash payments from customers that exceeded the recorded investment of the designated impaired loan.
66 The PNC Financial Services Group, Inc. –Form 10-Q
Charge-off – Process of removing a loan or portion of a loan from our balance sheet because it is considered uncollectible. We also record a charge-off when a loan is transferred from portfolio holdings to held for sale by reducing the loan carrying amount to the fair value of the loan, if fair value is less than carrying amount.
Combined loan-to-value ratio (CLTV) – This is the aggregate principal balance(s) of the mortgages on a property divided by its appraised value or purchase price.
Commercial mortgage banking activities – Includes commercial mortgage servicing, originating commercial mortgages for sale and related hedging activities. Commercial mortgage banking activities revenue includes revenue derived from commercial mortgage servicing (including net interest income and noninterest income from loan servicing and ancillary services, net of commercial mortgage servicing rights amortization, and commercial mortgage servicing rights valuations net of economic hedge), and revenue derived from commercial mortgage loans intended for sale and related hedges (including loan origination fees, net interest income, valuation adjustments and gains or losses on sales).
Common shareholders’ equity to total assets – Common shareholders’ equity divided by total assets. Common shareholders’ equity equals total shareholders’ equity less the liquidation value of preferred stock.
Core net interest income– Core net interest income is total net interest income less purchase accounting accretion.
Credit derivatives – Contractual agreements, primarily credit default swaps, that provide protection against a credit event of one or more referenced credits. The nature of a credit event is established by the protection buyer and protection seller at the inception of a transaction, and such events include bankruptcy, insolvency and failure to meet payment obligations when due. The buyer of the credit derivative pays a periodic fee in return for a payment by the protection seller upon the occurrence, if any, of a credit event.
Credit spread – The difference in yield between debt issues of similar maturity. The excess of yield attributable to credit spread is often used as a measure of relative creditworthiness, with a reduction in the credit spread reflecting an improvement in the borrower’s perceived creditworthiness.
70 The PNC Financial Services Group, Inc. –Form 10-Q
Derivatives – Financial contracts whose value is derived from changes in publicly traded securities, interest rates, currency exchange rates or market indices. Derivatives cover a wide assortment of financial contracts, including but not limited to forward contracts, futures, options and swaps.
Duration of equity – An estimate of the rate sensitivity of our economic value of equity. A negative duration of equity is associated with asset sensitivity (i.e., positioned for rising interest rates), while a positive value implies liability sensitivity (i.e., positioned for declining interest rates). For example, if the duration of equity is +1.5-1.5 years, the economic value of equity declinesincreases by 1.5% for each 100 basis point increase in interest rates.
Earning assets – Assets that generate income, which include: federal funds sold; resale agreements; trading securities; interest-earning deposits with banks; loans held for sale; loans; investment securities; and certain other assets.
Economic capital – Represents the amount of resources that a business or business segment should hold to guard against potentially large losses that could cause insolvency and is based on a measurement of economic risk. The economic capital measurement process involves converting a risk distribution to the capital that is required to support the risk, consistent with our target credit rating. As such, economic risk serves as a “common currency” of risk that allows us to compare different risks on a similar basis.
Effective duration – A measurement, expressed in years, that, when multiplied by a change in interest rates, would approximate the percentage change in value of on-and off-balanceon- and off- balance sheet positions.
Efficiency – Noninterest expense divided by total revenue.
Fair value – The price that would be received to sell an asset or paid to transfer a liability in an orderly transaction between market participants at the measurement date.
FICO score – A credit bureau-based industry standard score created by Fair Isaac Co. which predicts the likelihood of borrower default. We use FICO scores both in underwriting and assessing credit risk in our consumer lending portfolio. Lower FICO scores indicate likely higher risk of default, while higher FICO scores indicate likely lower risk of default. FICO scores are updated on a periodic basis.
Foreign exchange contracts – Contracts that provide for the future receipt and delivery of foreign currency at previously agreed-upon terms.
Funds transfer pricing – A management accounting methodology designed to recognize the net interest income effects of sources and uses of funds provided by the assets and liabilities of a business segment. We assign these balances
LIBOR-based funding rates at origination that represent the interest cost for us to raise/invest funds with similar maturity and repricing structures.
The PNC Financial Services Group, Inc. –Form 10-Q67
Futures and forward contracts – Contracts in which the buyer agrees to purchase and the seller agrees to deliver a specific financial instrument at a predetermined price or yield. May be settled either in cash or by delivery of the underlying financial instrument.
GAAP – Accounting principles generally accepted in the United States of America.
Home price index (HPI) – A broad measure of the movement of single-family house prices in the U.S.
Impaired loans – Loans are determined to be impaired when, based on current information and events, it is probable that all contractually required payments will not be collected. Impaired loans include commercial nonperforming loans and consumer and commercial TDRs, regardless of nonperforming status. Excluded from impaired loans are nonperforming leases, loans held for sale, loans accounted for under the fair value option, smaller balance homogenous type loans and purchased impaired loans.
Interest rate floors and caps – Interest rate protection instruments that involve payment from the protection seller to the protection buyer of an interest differential, which represents the difference between a short-term rate (e.g., three-month LIBOR) and an agreed-upon rate (the strike rate) applied to a notional principal amount.
Interest rate swap contracts – Contracts that are entered into primarily as an asset/liability management strategy to reduce interest rate risk. Interest rate swap contracts are exchanges of interest rate payments, such as fixed-rate payments for floating-rate payments, based on notional principal amounts.
Intrinsic value – The difference between the price, if any, required to be paid for stock issued pursuant to an equity compensation arrangement and the fair market value of the underlying stock.
Investment securities – Collectively, securities available for sale and securities held to maturity.
Leverage ratio – Tier 1 risk-based capital divided by adjusted average total assets.
LIBOR – Acronym for London InterBank Offered Rate. LIBOR is the average interest rate charged when banks in the London wholesale money market (or interbank market) borrow unsecured funds from each other. LIBOR rates are used as a benchmark for interest rates on a global basis. PNC’s product set includes loans priced using LIBOR as a benchmark.
Loan-to-value ratio (LTV) – A calculation of a loan’s collateral coverage that is used both in underwriting and
The PNC Financial Services Group, Inc. –Form 10-Q71
assessing credit risk in our lending portfolio. LTV is the sum total of loan obligations secured by collateral divided by the market value of that same collateral. Market values of the collateral are based on an independent valuation of the
collateral. For example, an LTV of less than 90% is better secured and has less credit risk than an LTV of greater than or equal to 90%.
Loss given default (LGD) – An estimate of loss, net of recovery based on collateral type, collateral value, loan exposure, or the guarantor(s) quality and guaranty type (full or partial). Each loan has its own LGD. The LGD risk rating measures the percentage of exposure of a specific credit obligation that we expect to lose if default occurs. LGD is net of recovery, through either liquidation of collateral or deficiency judgments rendered from foreclosure or bankruptcy proceedings.
Net interest margin – Annualized taxable-equivalent net interest income divided by average earning assets.
Nonaccretable difference – Contractually required payments receivable on a purchased impaired loan in excess of the cash flows expected to be collected.
Nonaccrual loans – Loans for which we do not accrue interest income. Nonaccrual loans include nonperforming loans, in addition to loans accounted for under fair value option and loans accounted for as held for sale for which full collection of contractual principal and/or interest is not probable.
Nondiscretionary assets under administration – Assets we hold for our customers/clients in a non-discretionary,nondiscretionary, custodial capacity. We do not include these assets on our Consolidated Balance Sheet.
Nonperforming assets – Nonperforming assets include nonperforming loans and OREO and foreclosed assets, but exclude certain government insured or guaranteed loans for which we expect to collect substantially all principal and interest, loans held for sale, loans accounted for under the fair value option and purchased impaired loans. We do not accrue interest income on assets classified as nonperforming.
Nonperforming loans – Loans accounted for at amortized cost for which we do not accrue interest income. Nonperforming loans include loans to commercial, commercial real estate, equipment lease financing, home equity, residential real estate, credit card and other consumer customers as well as TDRs which have not returned to performing status. Nonperforming loans exclude certain government insured or guaranteed loans for which we expect to collect substantially all principal and interest, loans held for sale, loans accounted for under the fair value option and purchased impaired loans. Nonperforming loans exclude purchased impaired loans as we are currently accreting interest income over the expected life of the loans.
Notional amount – A number of currency units, shares, or other units specified in a derivative contract.
68 The PNC Financial Services Group, Inc. –Form 10-Q
Operating leverage – The period to period dollar or percentage change in total revenue (GAAP basis) less the dollar or percentage change in noninterest expense. A positive variance indicates that revenue growth exceeded expense growth (i.e., positive operating leverage) while a negative variance implies expense growth exceeded revenue growth (i.e., negative operating leverage).
Options – Contracts that grant the purchaser, for a premium payment, the right, but not the obligation, to either purchase or sell the associated financial instrument at a set price during a specified period or at a specified date in the future.
Other real estate owned (OREO) and foreclosed assets – Assets taken in settlement of troubled loans primarily through deed-in-lieu of foreclosure or foreclosure. Foreclosed assets include real and personal property, equity interests in corporations, partnerships, and limited liability companies.
Other-than-temporary impairment (OTTI) – When the fair value of a security is less than its amortized cost basis, an assessment is performed to determine whether the impairment is other-than-temporary. If we intend to sell the security or more likely than not will be required to sell the security before recovery of its amortized cost basis less any current-period credit loss, an other-than-temporary impairment is considered to have occurred. In such cases, an other-than-temporary impairment is recognized in earnings equal to the entire difference between the investment’s amortized cost basis and its fair value at the balance sheet date. Further, if we do not expect to recover the entire amortized cost of the security, an other-than-temporary impairment is considered to have occurred. However for debt securities, if we do not intend to sell the security and it is not more likely than not that we will be required to sell the security before its recovery, the other-than-temporary loss is separated into (a) the amount representing the credit loss, and (b) the amount related to all other factors. The other-than-temporary impairment related to credit losses is recognized in earnings while the amount related to all other factors is recognized in other comprehensive income, net of tax.
Parent company liquidity coverage – Liquid assets divided by funding obligations within a two year period.
Pretax earnings – Income before income taxes and noncontrolling interests.
Pretax, pre-provision earnings – Total revenue less noninterest expense.
Primary client relationship – A corporate banking client relationship with annual revenue generation of $10,000 to $50,000
72 The PNC Financial Services Group, Inc. –Form 10-Q
$50,000 or more, and for Asset Management Group, a client relationship with annual revenue generation of $10,000 or more.
Probability of default (PD) – An internal risk rating that indicates the likelihood that a credit obligor will enter into default status.
Purchase accounting accretion – Accretion of the discounts and premiums on acquired assets and liabilities. The purchase accounting accretion is recognized in net interest income over the weighted-average life of the financial instruments using the constant effective yield method. Accretion for purchased impaired loans includes any cash recoveries received in excess of the recorded investment.
Purchased impaired loans – Acquired loans determined to be credit impaired under FASB ASC 310-30 (AICPA SOP 03-3). Loans are determined to be impaired if there is evidence of credit deterioration since origination and for which it is probable that all contractually required payments will not be collected.
Recorded investment (purchased impaired loans) – The initial investment of a purchased impaired loan plus interest accretion and less any cash payments and writedowns to date. The recorded investment excludes any valuation allowance which is included in our allowance for loan and lease losses.
Recovery – Cash proceeds received on a loan that we had previously charged off. We credit the amount received to the allowance for loan and lease losses.
Residential development loans – Project-specific loans to commercial customers for the construction or development of residential real estate including land, single family homes, condominiums and other residential properties.
Residential mortgage servicing rights hedge gains/(losses), net – We have elected to measure acquired or originated residential mortgage servicing rights (MSRs) at fair value under GAAP. We employ a risk management strategy designed to protect the economic value of MSRs from changes in interest rates. This strategy utilizes securities and a portfolio of derivative instruments to hedge changes in the fair value of MSRs arising from changes in interest rates. These financial instruments are expected to have changes in fair value which are negatively correlated to the change in fair value of the MSR portfolio. Net MSR hedge gains/(losses) represent the change in the fair value of MSRs, exclusive of changes due to time decay and payoffs, combined with the change in the fair value of the associated securities and derivative instruments.
Return on average assets – Annualized net income divided by average assets.
Return on average capital – Annualized net income divided by average capital.
The PNC Financial Services Group, Inc. –Form 10-Q69
Return on average common shareholders’ equity – Annualized net income attributable to common shareholders divided by average common shareholders’ equity.
Risk-weighted assets – Computed by the assignment of specific risk-weights (as defined by the Board of Governors of the Federal Reserve System) to assets and off-balance sheet instruments.
Securitization – The process of legally transforming financial assets into securities.
Servicing rights – An intangible asset or liability created by an obligation to service assets for others. Typical servicing rights include the right to receive a fee for collecting and forwarding payments on loans and related taxes and insurance premiums held in escrow.
Swaptions – Contracts that grant the purchaser, for a premium payment, the right, but not the obligation, to enter into an interest rate swap agreement during a specified period or at a specified date in the future.
Taxable-equivalent interest – The interest income earned on certain assets is completely or partially exempt from Federal income tax. As such, these tax-exempt instruments typically yield lower returns than taxable investments. To provide more meaningful comparisons of yields and margins for all interest-earning assets, we use interest income on a taxable-equivalent basis in calculating average yields and net interest margins by increasing the interest income earned on tax-exempt assets to make it fully equivalent to interest income earned on other taxable investments. This adjustment is not permitted under GAAP on the Consolidated Income Statement.
Tier 1 common capital – Tier 1 risk-based capital, less preferred equity, less trust preferred capital securities, and less noncontrolling interests.
Tier 1 common capital ratio – Tier 1 common capital divided by period-end risk-weighted assets.
Tier 1 risk-based capital – Total shareholders’ equity, plus trust preferred capital securities, plus certain noncontrolling interests that are held by others; less goodwill and certain other intangible assets (net of eligible deferred taxes relating to taxable and nontaxable combinations), less equity investments in nonfinancial companies less ineligible servicing assets and less net unrealized holding losses on available for sale equity securities. Net unrealized holding gains on available for sale equity securities, net unrealized holding gains (losses) on available for sale debt securities and net unrealized holding gains (losses) on cash flow hedge derivatives are excluded from total shareholders’ equity for Tier 1 risk-based capital purposes.
Tier 1 risk-based capital ratio – Tier 1 risk-based capital divided by period-end risk-weighted assets.
Total equity – Total shareholders’ equity plus noncontrolling interests.
Total return swap – A non-traditional swap where one party agrees to pay the other the “total return” of a defined underlying asset (e.g., a loan), usually in return for receiving a stream of LIBOR-based cash flows. The total returns of the asset, including interest and any default shortfall, are passed through to the counterparty. The counterparty is therefore assuming the credit and economic risk of the underlying asset.
Total risk-based capital – Tier 1 risk-based capital plus qualifying subordinated debt and trust preferred securities, other noncontrolling interest not qualified as Tier 1, eligible gains on available for sale equity securities and the allowance for loan and lease losses, subject to certain limitations.
Total risk-based capital ratio – Total risk-based capital divided by period-end risk-weighted assets.
Transaction deposits – The sum of interest-bearing money market deposits, interest-bearing demand deposits, and noninterest-bearing deposits.
Troubled debt restructuring (TDR) (TDR) – A loan whose terms have been restructured in a manner that grants a concession to a borrower experiencing financial difficulties.
The PNC Financial Services Group, Inc. –Form 10-Q73
Value-at-risk (VaR) – A statistically-based measure of risk that describes the amount of potential loss which may be incurred due to adverse market movements. The measure is of the maximum loss which should not be exceeded on 95 out of 100 days for a 95% VaR.
Watchlist – A list of criticized loans, credit exposure or other assets compiled for internal monitoring purposes. We define criticized exposure for this purpose as exposure with an internal risk rating of other assets especially mentioned, substandard, doubtful or loss.
Yield curve – A graph showing the relationship between the yields on financial instruments or market indices of the same credit quality with different maturities. For example, a “normal” or “positive” yield curve exists when long-term bonds have higher yields than short-term bonds. A “flat” yield curve exists when yields are the same for short-term and long-term bonds. A “steep” yield curve exists when yields on long-term bonds are significantly higher than on short-term bonds. An “inverted” or “negative” yield curve exists when short-term bonds have higher yields than long-term bonds.
70 The PNC Financial Services Group, Inc. –Form 10-Q
CAUTIONARY STATEMENT REGARDING FORWARD-LOOKING INFORMATION
We make statements in this Report, and we may from time to time make other statements, regarding our outlook for earnings, revenues, expenses, capital levels and ratios, liquidity levels, asset levels, asset quality, financial position, and other matters regarding or affecting PNC and its future business and operations that are forward-looking statements within the meaning of the Private Securities Litigation Reform Act. Forward-looking statements are typically identified by words such as “believe,” “plan,” “expect,” “anticipate,” “see,” “look,” “intend,” “outlook,” “project,” “forecast,” “estimate,” “goal,” “will,” “should” and other similar words and expressions. Forward-looking statements are subject to numerous assumptions, risks and uncertainties, which change over time.
Forward-looking statements speak only as of the date made. We do not assume any duty and do not undertake to update forward-looking statements. Actual results or future events could differ, possibly materially, from those anticipated in forward-looking statements, as well as from historical performance.
Our forward-looking statements are subject to the following principal risks and uncertainties.
Our businesses, financial results and balance sheet values are affected by business and economic conditions, including the following:
| | – | | Changes in interest rates and valuations in debt, equity and other financial markets. |
| | – | | Disruptions in the liquidity and other functioning of U.S. and global financial markets. |
| | – | | The impact on financial markets and the economy of any changes in the credit ratings of U.S. Treasury obligations and other U.S. government-backed debt, as well as issues surrounding the level of U.S. and European government debt and concerns regarding the creditworthiness of certain sovereign governments, supranationals and financial institutions in Europe. |
| | – | | Actions by Federal Reserve, U.S. Treasury and other government agencies, including those that impact money supply and market interest rates. |
| | – | | Changes in customers’, suppliers’ and other counterparties’ performance and creditworthiness. |
| | – | | Slowing or failure of the current moderate economic expansion. |
| | – | | Continued effects of aftermath of recessionary conditions and uneven spread of positive impacts of recovery on the economy and our counterparties, including adverse impacts on levels of unemployment, loan utilization rates, delinquencies, defaults and counterparty ability to meet credit and other obligations. |
| | – | | Changes in customer preferences and behavior, whether due to changing business and economic conditions, legislative and regulatory initiatives, or other factors. |
Our forward-looking financial statements are subject to the risk that economic and financial market conditions will be substantially different than we are currently expecting. These statements are based on our current view that the moderate U.S. economic expansion will persist, and interest rates will remain very low in 2013, despite drags from Federal fiscal restraint and a European recession.recession, and short-term interest rates will remain very low but bond yields will be higher in the second half of 2013. These forward-looking statements also do not, unless otherwise indicated, take into account the impact of potential legal and regulatory contingencies.
PNC’s ability to take certain capital actions, including paying dividends and any plans to increase common stock dividends, repurchase common stock under current or future programs, or issue or redeem preferred stock or other regulatory capital instruments, is subject to the review of such proposed actions by the Federal Reserve as part of PNC’s comprehensive capital plan for the applicable period in connection with the regulators’ Comprehensive Capital Analysis and Review (CCAR) process and to the acceptance of such capital plan and non-objection to such capital actions by the Federal Reserve.
PNC’s regulatory capital ratios in the future will depend on, among other things, the company’s financial performance, the scope and terms of final capital regulations then in effect (particularly those implementing the Basel Capital Accords), and management actions affecting the composition of PNC’s balance sheet. In addition, PNC’s ability to determine, evaluate and forecast regulatory capital ratios, and to take actions (such as capital distributions) based on actual or forecasted capital ratios, will be dependent on the ongoing development, validation and regulatory approval of related models.
74 The PNC Financial Services Group, Inc. –Form 10-Q
| | financial performance, the scope and terms of final capital regulations then in effect (particularly those implementing the Basel Capital Accords), and management actions affecting the composition of PNC’s balance sheet. In addition, PNC’s ability to determine, evaluate and forecast regulatory capital ratios, and to take actions (such as capital distributions) based on actual or forecasted capital ratios, will be dependent on the ongoing development, validation and regulatory approval of related models. |
Legal and regulatory developments could have an impact on our ability to operate our businesses, financial condition, results of operations, competitive position, reputation, or pursuit of attractive acquisition opportunities. Reputational impacts could affect matters such as business generation and retention, liquidity, funding, and ability to attract and retain management. These developments could include:
The PNC Financial Services Group, Inc. –Form 10-Q71
| | These developments could include:
|
| | – | | Changes resulting from legislative and regulatory reforms, including major reform of the regulatory oversight structure of the financial services industry and changes to laws and regulations involving tax, pension, bankruptcy, consumer protection, and other industry aspects, and changes in accounting policies and principles. We will be impacted by extensive reforms provided for in the Dodd-Frank Wall Street Reform and Consumer Protection Act (the “Dodd-Frank Act”) and otherwise growing out of the recent financial crisis, the precise nature, extent and timing of which, and their impact on us, remains uncertain. |
| | – | | Changes to regulations governing bank capital and liquidity standards, including due to the Dodd-Frank Act and to Basel-related initiatives. |
| | – | | Unfavorable resolution of legal proceedings or other claims and regulatory and other governmental investigations or other inquiries. In addition to matters relating to PNC’s business and activities, such matters may include proceedings, claims, investigations, or inquiries relating topre-acquisition business and activities of acquired companies, such as National City. These matters may result in monetary judgments or settlements or other remedies, including fines, penalties, restitution or alterations in our business practices, and in additional expenses and collateral costs, and may cause reputational harm to PNC. |
| | – | | Results of the regulatory examination and supervision process, including our failure to satisfy requirements of agreements with governmental agencies. |
| | – | | Impact on business and operating results of any costs associated with obtaining rights in intellectual property claimed by others and of adequacy of our intellectual property protection in general. |
Business and operating results are affected by our ability to identify and effectively manage risks inherent in our businesses, including, where appropriate, through effective use of third-party insurance, derivatives, and capital management techniques, and to meet evolving regulatory capital standards. In particular, our results currently depend on our ability to manage elevated levels of impaired assets.
Business and operating results also include impacts relating to our equity interest in BlackRock, Inc. and rely to a significant extent on information provided to us by BlackRock. Risks and uncertainties that could affect BlackRock are discussed in more detail by BlackRock in its SEC filings.
We grow our business in part by acquiring from time to time other financial services companies, financial services assets and related deposits and other liabilities. Acquisition risks and uncertainties include those presented by the nature of the business acquired, including in some cases those associated with our entry into new businesses or new geographic or other markets and risks resulting from our inexperience in those new areas, as well as risks and uncertainties related to the acquisition transactions themselves, regulatory issues, and the integration of the acquired businesses into PNC after closing.
Competition can have an impact on customer acquisition, growth and retention and on credit spreads and product pricing, which can affect market share, deposits and revenues. Industry restructuring in the current environment could also impact our business and financial performance through changes in counterparty creditworthiness and performance and in the competitive and regulatory landscape. Our ability to anticipate and respond to technological changes can also impact our ability to respond to customer needs and meet competitive demands.
Business and operating results can also be affected by widespread natural and other disasters, dislocations, terrorist activities or international hostilities through impacts on the economy and financial markets generally or on us or our counterparties specifically.
We provide greater detail regarding these as well as other factors in our 2012 Form 10-K, in our first quarter 2013 Form 10-Q, and elsewhere in this Report, including in the Risk Factors and Risk Management sections and the Legal Proceedings and Commitments and Guarantees Notes of the Notes To Consolidated Financial Statements in those reports. Our forward-looking statements may also be subject to other risks and uncertainties, including those discussed elsewhere in this Report or in our other filings with the SEC.
72The PNC Financial Services Group, Inc. –Form 10-Q75
CONSOLIDATED INCOME STATEMENT
THE PNC FINANCIAL SERVICES GROUP, INC.
| In millions, except per share data Unaudited | | Three months ended March 31 | | | Three months ended
June 30 | | Six months ended June 30 | |
| | 2013 | | 2012 | | | 2013 | | 2012 | | 2013 | | 2012 | |
Interest Income | | | | | | | | | | | | |
Loans | | $ | 2,029 | | | $ | 1,951 | | | $ | 1,955 | | | $ | 2,163 | | | $ | 3,984 | | | $ | 4,114 | |
Investment securities | | | 470 | | | | 526 | | | | 422 | | | | 527 | | | | 892 | | | | 1,053 | |
Other | | | 112 | | | | 120 | | | | 92 | | | | 106 | | | | 204 | | | | 226 | |
Total interest income | | | 2,611 | | | | 2,597 | | | | 2,469 | | | | 2,796 | | | | 5,080 | | | | 5,393 | |
Interest Expense | | | | | | | | | | | | |
Deposits | | | 93 | | | | 103 | | | | 86 | | | | 83 | | | | 179 | | | | 186 | |
Borrowed funds | | | 129 | | | | 203 | | | | 125 | | | | 187 | | | | 254 | | | | 390 | |
Total interest expense | | | 222 | | | | 306 | | | | 211 | | | | 270 | | | | 433 | | | | 576 | |
Net interest income | | | 2,389 | | | | 2,291 | | | | 2,258 | | | | 2,526 | | | | 4,647 | | | | 4,817 | |
Noninterest Income | | | | | | | | | | | | |
Asset management | | | 308 | | | | 284 | | | | 340 | | | | 278 | | | | 648 | | | | 562 | |
Consumer services | | | 296 | | | | 264 | | | | 314 | | | | 290 | | | | 610 | | | | 554 | |
Corporate services | | | 277 | | | | 232 | | | | 326 | | | | 290 | | | | 603 | | | | 522 | |
Residential mortgage | | | 234 | | | | 230 | | | | 167 | | | | (173 | ) | | | 401 | | | | 57 | |
Service charges on deposits | | | 136 | | | | 127 | | | | 147 | | | | 144 | | | | 283 | | | | 271 | |
Net gains on sales of securities | | | 14 | | | | 57 | | | | 61 | | | | 62 | | | | 75 | | | | 119 | |
Other-than-temporary impairments | | | (1 | ) | | | (16 | ) | | | (10 | ) | | | (32 | ) | | | (11 | ) | | | (48 | ) |
Less: Noncredit portion of other-than-temporary impairments (a) | | | 9 | | | | 22 | | | | (6 | ) | | | 2 | | | | 3 | | | | 24 | |
Net other-than-temporary impairments | | | (10 | ) | | | (38 | ) | | | (4 | ) | | | (34 | ) | | | (14 | ) | | | (72 | ) |
Other | | | 311 | | | | 285 | | | | 455 | | | | 240 | | | | 766 | | | | 525 | |
Total noninterest income | | | 1,566 | | | | 1,441 | | | | 1,806 | | | | 1,097 | | | | 3,372 | | | | 2,538 | |
Total revenue | | | 3,955 | | | | 3,732 | | | | 4,064 | | | | 3,623 | | | | 8,019 | | | | 7,355 | |
Provision For Credit Losses | | | 236 | | | | 185 | | | | 157 | | | | 256 | | | | 393 | | | | 441 | |
Noninterest Expense | | | | | | | | | | | | |
Personnel | | | 1,169 | | | | 1,111 | | | | 1,186 | | | | 1,119 | | | | 2,355 | | | | 2,230 | |
Occupancy | | | 211 | | | | 190 | | | | 206 | | | | 199 | | | | 417 | | | | 389 | |
Equipment | | | 183 | | | | 175 | | | | 189 | | | | 181 | | | | 372 | | | | 356 | |
Marketing | | | 45 | | | | 68 | | | | 67 | | | | 67 | | | | 112 | | | | 135 | |
Other | | | 787 | | | | 911 | | | | 787 | | | | 1,082 | | | | 1,574 | | | | 1,993 | |
Total noninterest expense | | | 2,395 | | | | 2,455 | | | | 2,435 | | | | 2,648 | | | | 4,830 | | | | 5,103 | |
Income before income taxes and noncontrolling interests | | | 1,324 | | | | 1,092 | | | | 1,472 | | | | 719 | | | | 2,796 | | | | 1,811 | |
Income taxes | | | 320 | | | | 281 | | | | 349 | | | | 173 | | | | 669 | | | | 454 | |
Net income | | | 1,004 | | | | 811 | | | | 1,123 | | | | 546 | | | | 2,127 | | | | 1,357 | |
Less: Net income (loss) attributable to noncontrolling interests | | | (9 | ) | | | 6 | | | | 1 | | | | (5 | ) | | | (8 | ) | | | 1 | |
Preferredstock dividends and discount accretion and redemptions | | | 75 | | | | 39 | | |
Preferred stock dividends and discount accretion and redemptions | | | | 53 | | | | 25 | | | | 128 | | | | 64 | |
Net income attributable to common shareholders | | $ | 938 | | | $ | 766 | | | $ | 1,069 | | | $ | 526 | | | $ | 2,007 | | | $ | 1,292 | |
Earnings Per Common Share | | | | | | | | | | | | |
Basic | | $ | 1.78 | | | $ | 1.45 | | | $ | 2.02 | | | $ | 1.00 | | | $ | 3.79 | | | $ | 2.44 | |
Diluted | | | 1.76 | | | | 1.44 | | | | 1.99 | | | | .98 | | | | 3.76 | | | | 2.42 | |
Average Common Shares Outstanding | | | | | | | | | | | | |
Basic | | | 526 | | | | 526 | | | | 528 | | | | 527 | | | | 527 | | | | 526 | |
Diluted | | | 528 | | | | 529 | | | | 531 | | | | 530 | | | | 530 | | | | 529 | |
| (a) | Included in accumulated other comprehensive income (loss). |
See accompanying Notes To Consolidated Financial Statements.
76The PNC Financial Services Group, Inc. –Form 10-Q73
CONSOLIDATED STATEMENT OF COMPREHENSIVE INCOME
THE PNC FINANCIAL SERVICES GROUP, INC.
| In millions Unaudited | | Three months ended
March 31 | | | Three months ended
June 30 | | Six months ended June 30 | |
| | 2013 | | 2012 | | | 2013 | | 2012 | | 2013 | | 2012 | |
Net income | | $ | 1,004 | | | $ | 811 | | | $ | 1,123 | | | $ | 546 | | | $ | 2,127 | | | $ | 1,357 | |
Other comprehensive income, before tax and net of reclassifications into Net income: | | | | | | | | | | | | |
Net unrealized gains (losses) on non-OTTI securities | | | (170 | ) | | | 238 | | | | (793 | ) | | | 158 | | | | (963 | ) | | | 396 | |
Net unrealized gains (losses) on OTTI securities | | | 141 | | | | 406 | | | | (45 | ) | | | 8 | | | | 96 | | | | 414 | |
Net unrealized gains (losses) on cash flow hedge derivatives | | | (107 | ) | | | (90 | ) | | | (281 | ) | | | 6 | | | | (388 | ) | | | (84 | ) |
Pension and other postretirement benefit plan adjustments | | | 46 | | | | 48 | | | | 7 | | | | 39 | | | | 53 | | | | 87 | |
Other | | | (6 | ) | | | 12 | | | | (7 | ) | | | (30 | ) | | | (13 | ) | | | (18 | ) |
Other comprehensive income, before tax and net of reclassifications into Net income | | | (96 | ) | | | 614 | | |
Income tax benefit (expense) related to items of other comprehensive income | | | 29 | | | | (228 | ) | |
Other comprehensive income, after tax and net of reclassifications into Net income | | | (67 | ) | | | 386 | | |
Other comprehensive income (loss), before tax and net of reclassifications into Net income | | | | (1,119 | ) | | | 181 | | | | (1,215 | ) | | | 795 | |
Income tax benefit (expense) related to items of Other comprehensive income | | | | 397 | | | | (60 | ) | | | 426 | | | | (288 | ) |
Other comprehensive income (loss), after tax and net of reclassifications into Net income | | | | (722 | ) | | | 121 | | | | (789 | ) | | | 507 | |
Comprehensive income | | | 937 | | | | 1,197 | | | | 401 | | | | 667 | | | | 1,338 | | | | 1,864 | |
Less: Comprehensive income (loss) attributable to noncontrolling interests | | | (9 | ) | | | 6 | | | | 1 | | | | (5 | ) | | | (8 | ) | | | 1 | |
Comprehensive income attributable to PNC | | $ | 946 | | | $ | 1,191 | | | $ | 400 | | | $ | 672 | | | $ | 1,346 | | | $ | 1,863 | |
See accompanying Notes To Consolidated Financial Statements.
74The PNC Financial Services Group, Inc. –Form 10-Q77
CONSOLIDATED BALANCE SHEET
THE PNC FINANCIAL SERVICES GROUP, INC.
| In millions, except par value Unaudited | | March 31
2013 | | December 31
2012 | | | June 30 2013 | | December 31
2012 | |
Assets | | | | | | | | |
Cash and due from banks (includes $4 and $4 for VIEs) (a) | | $ | 3,948 | | | $ | 5,220 | | | $ | 4,051 | | | $ | 5,220 | |
Federal funds sold and resale agreements (includes $213 and $256 measured at fair value) (b) | | | 1,274 | | | | 1,463 | | |
Federal funds sold and resale agreements (includes $210 and $256 measured at fair value) (b) | | | | 1,613 | | | | 1,463 | |
Trading securities | | | 2,243 | | | | 2,096 | | | | 2,109 | | | | 2,096 | |
Interest-earning deposits with banks (includes $6 and $6 for VIEs) (a) | | | 1,541 | | | | 3,984 | | | | 3,797 | | | | 3,984 | |
Loans held for sale (includes $2,973 and $2,868 measured at fair value) (b) | | | 3,295 | | | | 3,693 | | |
Investment securities (includes $8 and $9 for VIEs) (a) | | | 59,361 | | | | 61,406 | | |
Loans (includes $7,538 and $7,781 for VIEs) (a) (includes $634 and $244 measured at fair value) (b) | | | 186,504 | | | | 185,856 | | |
Allowance for loan and lease losses (includes $(67) and $(75) for VIEs) (a) | | | (3,828 | ) | | | (4,036 | ) | |
Loans held for sale (includes $2,881 and $2,868 measured at fair value) (b) | | | | 3,814 | | | | 3,693 | |
Investment securities (includes $7 and $9 for VIEs) (a) | | | | 57,449 | | | | 61,406 | |
Loans (includes $7,845 and $7,781 for VIEs) (a)
(includes $811 and $244 measured at fair value) (b) | | | | 189,775 | | | | 185,856 | |
Allowance for loan and lease losses (includes $(64) and $(75) for VIEs) (a) | | | | (3,772 | ) | | | (4,036 | ) |
Net loans | | | 182,676 | | | | 181,820 | | | | 186,003 | | | | 181,820 | |
Goodwill | | | 9,075 | | | | 9,072 | | | | 9,075 | | | | 9,072 | |
Other intangible assets | | | 1,921 | | | | 1,797 | | | | 2,153 | | | | 1,797 | |
Equity investments (includes $1,504 and $1,429 for VIEs) (a) | | | 11,008 | | | | 10,877 | | |
Other (includes $1,186 and $1,281 for VIEs) (a) (includes $298 and $319 measured at fair value) (b) | | | 24,470 | | | | 23,679 | | |
Equity investments (includes $492 and $1,429 for VIEs) (a) | | | | 10,054 | | | | 10,877 | |
Other (includes $567 and $1,281 for VIEs) (a)
(includes $291 and $319 measured at fair value) (b) | | | | 24,297 | | | | 23,679 | |
Total assets | | $ | 300,812 | | | $ | 305,107 | | | $ | 304,415 | | | $ | 305,107 | |
Liabilities | | | | | | | | |
Deposits | | | | | | | | |
Noninterest-bearing | | $ | 64,652 | | | $ | 69,980 | | | $ | 66,708 | | | $ | 69,980 | |
Interest-bearing | | | 146,968 | | | | 143,162 | | | | 145,571 | | | | 143,162 | |
Total deposits | | | 211,620 | | | | 213,142 | | | | 212,279 | | | | 213,142 | |
Borrowed funds | | | | | | | | |
Federal funds purchased and repurchase agreements | | | 4,000 | | | | 3,327 | | | | 4,303 | | | | 3,327 | |
Federal Home Loan Bank borrowings | | | 5,483 | | | | 9,437 | | | | 8,481 | | | | 9,437 | |
Bank notes and senior debt | | | 10,918 | | | | 10,429 | | | | 11,177 | | | | 10,429 | |
Subordinated debt | | | 7,996 | | | | 7,299 | | | | 7,113 | | | | 7,299 | |
Commercial paper (includes $5,848 and $6,045 for VIEs) (a) | | | 6,953 | | | | 8,453 | | |
Other (includes $379 and $257 for VIEs) (a) (includes $130 and $0 measured at fair value) (b) | | | 2,297 | | | | 1,962 | | |
Commercial paper (includes $5,900 and $6,045 for VIEs) (a) | | | | 6,400 | | | | 8,453 | |
Other (includes $434 and $257 for VIEs) (a) (includes $195 and $0 measured at fair value) (b) | | | | 2,390 | | | | 1,962 | |
Total borrowed funds | | | 37,647 | | | | 40,907 | | | | 39,864 | | | | 40,907 | |
Allowance for unfunded loan commitments and letters of credit | | | 238 | | | | 250 | | | | 242 | | | | 250 | |
Accrued expenses (includes $130 and $132 for VIEs) (a) | | | 4,181 | | | | 4,449 | | |
Other (includes $1,034 and $976 for VIEs) (a) | | | 5,048 | | | | 4,594 | | |
Accrued expenses (includes $120 and $132 for VIEs) (a) | | | | 4,057 | | | | 4,449 | |
Other (includes $378 and $976 for VIEs) (a) | | | | 6,032 | | | | 4,594 | |
Total liabilities | | | 258,734 | | | | 263,342 | | | | 262,474 | | | | 263,342 | |
Equity | | | | | | | | |
Preferred stock (c) | | | | | | | | |
Common stock ($5 par value, authorized 800 shares, issued 538 and 538 shares) | | | 2,690 | | | | 2,690 | | |
Common stock ($5 par value, authorized 800 shares, issued 539 and 538 shares) | | | | 2,693 | | | | 2,690 | |
Capital surplus – preferred stock | | | 3,591 | | | | 3,590 | | | | 3,939 | | | | 3,590 | |
Capital surplus – common stock and other | | | 12,174 | | | | 12,193 | | | | 12,234 | | | | 12,193 | |
Retained earnings | | | 20,993 | | | | 20,265 | | | | 21,828 | | | | 20,265 | |
Accumulated other comprehensive income (loss) | | | 767 | | | | 834 | | | | 45 | | | | 834 | |
Common stock held in treasury at cost: 9 and 10 shares | | | (552 | ) | | | (569 | ) | |
Common stock held in treasury at cost: 8 and 10 shares | | | | (453 | ) | | | (569 | ) |
Total shareholders’ equity | | | 39,663 | | | | 39,003 | | | | 40,286 | | | | 39,003 | |
Noncontrolling interests | | | 2,415 | | | | 2,762 | | | | 1,655 | | | | 2,762 | |
Total equity | | | 42,078 | | | | 41,765 | | | | 41,941 | | | | 41,765 | |
Total liabilities and equity | | $ | 300,812 | | | $ | 305,107 | | | $ | 304,415 | | | $ | 305,107 | |
| (a) | Amounts represent the assets or liabilities of consolidated variable interest entities (VIEs). |
| (b) | Amounts represent items for which the Corporation has elected the fair value option. |
| (c) | Par value less than $.5 million at each date. |
See accompanying Notes To Consolidated Financial Statements.
78The PNC Financial Services Group, Inc. –Form 10-Q75
CONSOLIDATED STATEMENT OF CASH FLOWS
THE PNC FINANCIAL SERVICES GROUP, INC.
| | | | | | | | |
In millions Unaudited | | Three months ended
March 31 | |
| | 2013 | | | 2012 | |
Operating Activities | | | | | | | | |
Net income | | $ | 1,004 | | | $ | 811 | |
Adjustments to reconcile net income to net cash provided (used) by operating activities | | | | | | | | |
Provision for credit losses | | | 236 | | | | 185 | |
Depreciation and amortization | | | 283 | | | | 269 | |
Deferred income taxes | | | 266 | | | | 181 | |
Net gains on sales of securities | | | (14 | ) | | | (57 | ) |
Net other-than-temporary impairments | | | 10 | | | | 38 | |
Mortgage servicing rights valuation adjustment | | | (41 | ) | | | 35 | |
Undistributed earnings of BlackRock | | | (73 | ) | | | (68 | ) |
Net change in | | | | | | | | |
Trading securities and other short-term investments | | | 112 | | | | 1,131 | |
Loans held for sale | | | 69 | | | | 493 | |
Other assets | | | 66 | | | | (97 | ) |
Accrued expenses and other liabilities | | | (852 | ) | | | (55 | ) |
Other | | | (50 | ) | | | (90 | ) |
Net cash provided (used) by operating activities | | | 1,016 | | | | 2,776 | |
Investing Activities | | | | | | | | |
Sales | | | | | | | | |
Securities available for sale | | | 1,240 | | | | 3,492 | |
Loans | | | 351 | | | | 389 | |
Repayments/maturities | | | | | | | | |
Securities available for sale | | | 2,610 | | | | 1,994 | |
Securities held to maturity | | | 708 | | | | 836 | |
Purchases | | | | | | | | |
Securities available for sale | | | (2,770 | ) | | | (6,948 | ) |
Securities held to maturity | | | (186 | ) | | | | |
Loans | | | (361 | ) | | | (388 | ) |
Net change in | | | | | | | | |
Federal funds sold and resale agreements | | | 187 | | | | 830 | |
Interest-earning deposits with banks | | | 2,443 | | | | (626 | ) |
Loans | | | (975 | ) | | | (3,346 | ) |
Net cash paid for acquisition activity | | | | | | | (3,329 | ) |
Other (a) | | | 133 | | | | (12 | ) |
Net cash provided (used) by investing activities | | | 3,380 | | | | (7,108 | ) |
(continued on following page) | | | | | | | | |
In millions Unaudited | | Six months ended June 30 | |
| | 2013 | | | 2012 | |
Operating Activities | | | | | | | | |
Net income | | $ | 2,127 | | | $ | 1,357 | |
Adjustments to reconcile net income to net cash provided (used) by operating activities | | | | | | | | |
Provision for credit losses | | | 393 | | | | 441 | |
Depreciation and amortization | | | 583 | | | | 554 | |
Deferred income taxes | | | 804 | | | | 412 | |
Net gains on sales of securities | | | (75 | ) | | | (119 | ) |
Net other-than-temporary impairments | | | 14 | | | | 72 | |
Mortgage servicing rights valuation adjustment | | | (254 | ) | | | 216 | |
Gain on sale of Visa Class B common shares | | | (83 | ) | | | | |
Noncash charges on trust preferred securities redemption | | | 30 | | | | 130 | |
Undistributed earnings of BlackRock | | | (173 | ) | | | (132 | ) |
Excess tax benefits from share-based payment arrangements | | | (18 | ) | | | (15 | ) |
Net change in | | | | | | | | |
Trading securities and other short-term investments | | | 463 | | | | 1,394 | |
Loans held for sale | | | (755 | ) | | | (521 | ) |
Other assets | | | 133 | | | | 168 | |
Accrued expenses and other liabilities | | | (1,293 | ) | | | 11 | |
Other | | | (100 | ) | | | (154 | ) |
Net cash provided (used) by operating activities | | | 1,796 | | | | 3,814 | |
Investing Activities | | | | | | | | |
Sales | | | | | | | | |
Securities available for sale | | | 3,814 | | | | 6,594 | |
Loans | | | 888 | | | | 771 | |
Repayments/maturities | | | | | | | | |
Securities available for sale | | | 5,232 | | | | 4,198 | |
Securities held to maturity | | | 1,191 | | | | 1,638 | |
Purchases | | | | | | | | |
Securities available for sale | | | (6,785 | ) | | | (10,104 | ) |
Securities held to maturity | | | (224 | ) | | | (100 | ) |
Loans | | | (603 | ) | | | (672 | ) |
Net change in | | | | | | | | |
Federal funds sold and resale agreements | | | (155 | ) | | | 553 | |
Interest-earning deposits with banks | | | 187 | | | | (2,537 | ) |
Loans | | | (4,494 | ) | | | (8,206 | ) |
Net cash paid for acquisition activity | | | | | | | (3,294 | ) |
Other (a) | | | 306 | | | | (82 | ) |
Net cash provided (used) by investing activities | | | (643 | ) | | | (11,241 | ) |
76The PNC Financial Services Group, Inc. –Form 10-Q79
CONSOLIDATED STATEMENT OF CASH FLOWS
THE PNC FINANCIAL SERVICES GROUP, INC.
(continued from previous page)
| In millions Unaudited | | Three months ended
March 31 | | | Six months ended June 30 | |
| | 2013 | | 2012 | | | 2013 | | | 2012 | |
Financing Activities | | | | | | | | |
Net change in | | | | | | | | |
Noninterest-bearing deposits | | $ | (5,307 | ) | | $ | (757 | ) | | $ | (3,226 | ) | | $ | 1,264 | |
Interest-bearing deposits | | | 3,806 | | | | 867 | | | | 2,409 | | | | (350 | ) |
Federal funds purchased and repurchase agreements | | | 674 | | | | 1,500 | | | | 978 | | | | 836 | |
Commercial paper | | | (1,090 | ) | | | 1,288 | | | | (2,170 | ) | | | 3,152 | |
Other borrowed funds | | | (242 | ) | | | (193 | ) | | | (153 | ) | | | 566 | |
Sales/issuances | | | | | | | | |
Federal Home Loan Bank borrowings | | | | | 5,000 | | | | 5,000 | | | | 7,000 | |
Bank notes and senior debt | | | 998 | | | | 1,090 | | | | 2,442 | | | | 2,089 | |
Subordinated debt | | | 744 | | | | | | 744 | | | |
Commercial paper | | | 2,372 | | | | 4,225 | | | | 5,244 | | | | 9,117 | |
Other borrowed funds | | | 275 | | | | 111 | | | | 402 | | | | 548 | |
Preferred stock | | | | 496 | | | | 1,482 | |
Common and treasury stock | | | 29 | | | | 70 | | | | 131 | | | | 112 | |
Repayments/maturities | | | | | | | | |
Federal Home Loan Bank borrowings | | | (3,954 | ) | | | (3,980 | ) | | | (5,956 | ) | | | (4,497 | ) |
Bank notes and senior debt | | | (444 | ) | | | (770 | ) | | | (1,425 | ) | | | (3,777 | ) |
Subordinated debt | | | 17 | | | | (22 | ) | | | (705 | ) | | | (829 | ) |
Commercial paper | | | (2,782 | ) | | | (2,914 | ) | | | (5,127 | ) | | | (7,071 | ) |
Other borrowed funds | | | (90 | ) | | | (878 | ) | | | (314 | ) | | | (1,689 | ) |
Preferred stock | | | | (150 | ) | | |
Excess tax benefits from share-based payment arrangements | | | | 18 | | | | 15 | |
Redemption of noncontrolling interests | | | (375 | ) | | | | | (375 | ) | | |
Acquisition of treasury stock | | | (22 | ) | | | (25 | ) | | | (23 | ) | | | (51 | ) |
Preferred stock cash dividends paid | | | (67 | ) | | | (38 | ) | | | (118 | ) | | | (63 | ) |
Common stock cash dividends paid | | | (210 | ) | | | (185 | ) | | | (444 | ) | | | (396 | ) |
Net cash provided (used) by financing activities | | | (5,668 | ) | | | 4,389 | | | | (2,322 | ) | | | 7,458 | |
Net Increase (Decrease) In Cash And Due From Banks | | | (1,272 | ) | | | 57 | | | | (1,169 | ) | | | 31 | |
Cash and due from banks at beginning of period | | | 5,220 | | | | 4,105 | | | | 5,220 | | | | 4,105 | |
Cash and due from banks at end of period | | $ | 3,948 | | | $ | 4,162 | | | $ | 4,051 | | | $ | 4,136 | |
Supplemental Disclosures | | | | | | | | |
Interest paid | | $ | 233 | | | $ | 338 | | | $ | 440 | | | $ | 633 | |
Income taxes paid | | | 32 | | | | 7 | | | | 214 | | | | 22 | |
Income taxes refunded | | | | | 4 | | | | 1 | | | | 9 | |
Non-cash Investing and Financing Items | | | | | | | | |
Transfer from (to) loans to (from) loans held for sale, net | | | (17 | ) | | | 199 | | | | 13 | | | | 356 | |
Transfer from loans to foreclosed assets | | | 201 | | | | 236 | | | | 378 | | | | 509 | |
See accompanying Notes To Consolidated Financial Statements.
| (a) | Includes the impact of the consolidation of a variable interest entity as of March 31, 2013. |
See accompanying Notes To Consolidated Financial Statements.
80The PNC Financial Services Group, Inc. –Form 10-Q77
NOTES TO CONSOLIDATED FINANCIAL STATEMENTS (UNAUDITED)
THE PNC FINANCIAL SERVICES GROUP, INC.
BUSINESS
PNC is one of the largest diversified financial services companies in the United States and is headquartered in Pittsburgh, Pennsylvania.
PNC has businesses engaged in retail banking, corporate and institutional banking, asset management, and residential mortgage banking, providing many of its products and services nationally, as well as other products and services in PNC’s primary geographic markets located in Pennsylvania, Ohio, New Jersey, Michigan, Illinois, Maryland, Indiana, North Carolina, Florida, Kentucky, Washington, D.C., Delaware, Alabama, Virginia, Georgia, Missouri, Wisconsin and South Carolina. PNC also provides certain products and services internationally.
NOTE 1 ACCOUNTING POLICIES
BASIS OOFF FINANCIAL STATEMENT PRESENTATION
Our consolidated financial statements include the accounts of the parent company and its subsidiaries, most of which are wholly owned, and certain partnership interests and variable interest entities.
We prepared these consolidated financial statements in accordance with accounting principles generally accepted in the United States of America (GAAP). We have eliminated intercompany accounts and transactions. We have also reclassified certain prior year amounts to conform to the 2013 presentation. These reclassifications did not have a material impact on our consolidated financial condition or results of operations. We evaluate the materiality of identified errors in the financial statements using both an income statement and a balance sheet approach, based on relevant quantitative and qualitative factors. Net income includes certain adjustments to correct immaterial errors related to previously reported periods.
In our opinion, the unaudited interim consolidated financial statements reflect all normal, recurring adjustments needed to present fairly our results for the interim periods. The results of operations for interim periods are not necessarily indicative of the results that may be expected for the full year or any other interim period.
When preparing these unaudited interim consolidated financial statements, we have assumed that you have read the audited consolidated financial statements included in our 2012 Annual Report on Form 10-K. Reference is made to Note 1 Accounting Policies in the 2012 Form 10-K for a detailed description of significant accounting policies. There have been no significant changes to these policies in the first threesix months of 2013 other than as disclosed herein. These interim
consolidated financial statements serve to update the 2012 Form 10-K and may not include all information and notes necessary to constitute a complete set of financial statements.
We have considered the impact on these consolidated financial statements of subsequent events.
USE OOFF ESTIMATES
We prepared these consolidated financial statements using financial information available at the time, which requires us to make estimates and assumptions that affect the amounts reported. Our most significant estimates pertain to our fair value measurements, allowances for loan and lease losses and unfunded loan commitments and letters of credit, and accretion on purchased impaired loans. Actual results may differ from the estimates and the differences may be material to the consolidated financial statements.
INVESTMENT IINN BLACKROCK, INC.
We account for our investment in the common stock and Series B Preferred Stock of BlackRock (deemed to be in-substance common stock) under the equity method of accounting. In May 2012, we exchanged 2 million shares of Series B Preferred Stock of BlackRock for an equal number of shares of BlackRock common stock. The exchange transaction had no impact on the carrying value of our investment in BlackRock or our use of the equity method of accounting. The investment in BlackRock is reflected on our Consolidated Balance Sheet in Equity investments, while our equity in earnings of BlackRock is reported on our Consolidated Income Statement in Asset management revenue.
We also hold shares of Series C Preferred Stock of BlackRock pursuant to our obligation to partially fund a portion of certain BlackRock long-term incentive plan (LTIP) programs. Since these preferred shares are not deemed to be in-substance common stock, we have elected to account for these preferred shares at fair value and the changes in fair value will offset the impact of marking-to-market the obligation to deliver these shares to BlackRock. Our investment in the BlackRock Series C Preferred Stock is included on our Consolidated Balance Sheet in Other assets. Our obligation to transfer these shares to BlackRock is classified as a derivative not designated as a hedging instrument under GAAP as disclosed in Note 13 Financial Derivatives.
On January 31, 2013, we transferred 205,350 shares to BlackRock in connection with our obligation. After this transfer, we hold approximately 1.3 million shares of BlackRock Series C Preferred Stock which are available to fund our obligation in connection with the BlackRock LTIP programs.
The PNC Financial Services Group, Inc. –Form 10-Q81
NONPERFORMING ASSETS
Nonperforming assets include nonperforming loans and leases, including nonperforming troubled debt restructurings (TDRs) and other real estate owned and foreclosed assets.
78 The PNC Financial Services Group, Inc. –Form 10-Q
Commercial Loans
We generally classify Commercial Lending (Commercial, Commercial Real Estate, and Equipment Lease Financing) loans as nonperforming and place them on nonaccrual status when we determine that the collection of interest or principal is not probable, orincluding when delinquency of interest or principal payments has existed for 90 days or more and the loans are not well-secured and/or in the process of collection. A loan is considered well-secured when the collateral in the form of liens on (or pledges of) real or personal property, including marketable securities, has a realizable value sufficient to discharge the debt in full, including accrued interest. Such factors that would lead to nonperforming status would include, but are not limited to, the following:
Deterioration in the financial position of the borrower resulting in the loan moving from accrual to cash basis accounting,
The collection of principal or interest is 90 days or more past due unless the asset is both well-secured and in the process of collection,
Reasonable doubt exists as to the certainty of the borrower’s future debt service ability, whether 90 days have passed or not,
The borrower has filed or will likely file for bankruptcy,
The bank advances additional funds to cover principal or interest,
We are in the process of liquidating a commercial borrower, or
We are pursuing remedies under a guarantee.
We charge off commercial nonaccrualnonperforming loans when we determine that a specific loan, or portion thereof, is uncollectible. This determination is based on the specific facts and circumstances of the individual loans. In making this determination, we consider the viability of the business or project as a going concern, the past due status when the asset is not well-secured, the expected cash flows to repay the loan, the value of the collateral, and the ability and willingness of any guarantors to perform.
The commercial nonaccrual policy is also applied to certain small business credit card balances, which means that they are placed on nonaccrual status when they become 90 days or more past due. Such loans are charged-off at 180 days past due.
Additionally, in general, for smaller dollar commercial loans of $1 million or less, a partial or full charge-off will occur at 120 days past due for term loans and 180 days past due for revolvers.
Certain small business credit card balances are placed on nonaccrual status when they become 90 days or more past due. Such loans are charged-off at 180 days past due.
Consumer Loans
Nonperforming loans are those loans accounted for at amortized cost that have deteriorated in credit quality to the extent that full collection of contractual principal and interest is not probable. When a loan that is accounted for at amortized cost is determined to be nonperforming, the accrual of interest is ceased and the loan isThese loans are also classified as nonaccrual. TheFor these loans, the current year accrued and
uncollected interest is reversed out ofthrough net interest income. Additionally, anyincome and prior year accrued and uncollected interest is charged-off. Additionally, these loans may be charged-off down to the fair value less costs to sell.
Loans acquired and accounted for under ASC 310-30 – Loans and Debt Securities Acquired with Deteriorated Credit Quality are reported as performing and accruing loans and performing assets due to the accretion of interest income.
Based upon the nonaccrual policies discussed below, interest income is not recognized for loansLoans accounted for under the fair value option and loans accounted for as held for sale. However, sincesale are reported as performing loans as these loans are accounted for at fair value and based uponthe lower of carrying value or fair value less costs to sell, respectively, they arerespectively. However, based upon the nonaccrual policies discussed below, interest income is not reported as nonperforming loans.accrued. Additionally, based upon the nonaccrual policies discussed below, certain government insured loans for which we do not expect to collect substantially all principal and interest are reported as nonperforming and do not accrue interest. Alternatively, certain government insured loans for which we expect to collect substantially all principal and interest are not reported as nonperforming loans and continue to accrue interest.
In the first quarter of 2013, we completed our alignment of certain nonaccrual and charge-off policies consistent with interagency supervisory guidance on practices for loans and lines of credit related to consumer lending. This alignment primarily related to (i) subordinate consumer loans (home equity loans and lines and residential mortgages) where the first-lien loan was 90 days or more past due, (ii) government guaranteed loans where the guarantee may not result in collection of substantially all contractual principal and interest and (iii) loans with borrowers in bankruptcy. In the first quarter of 2013, due to classification as either nonperforming or, in the case of loans accounted for under the fair value option, nonaccrual loans, nonperforming loans increased by $426 million and net charge-offs increased by $134 million as a result of completing the alignment of the aforementioned policies. Additionally, overall delinquencies decreased $395 million due to loans now being reported as either nonperforming or, in the case of loans accounted for under the fair value option, nonaccruing or having been charged-off. The impact of the alignment of the policies was considered in our reserving process in the determination of our ALLLAllowance for Loan and Lease Losses (ALLL) at December 31, 2012. See Note 5 Asset Quality and Note 7 Allowances for Loan and Lease Losses and Unfunded Loan Commitments and Letters of Credit for additional information.
A consumer loan is considered well-secured when the collateral in the form of liens on (or pledges of) real or
82 The PNC Financial Services Group, Inc. –Form 10-Q
personal property, including marketable securities, has a realizable value sufficient to discharge the debt in full, including accrued interest. Home equity installment loans and lines of credit, whether well-secured or not, are classified as nonaccrual at 90 days past due. Well-secured residential real estate loans are classified as nonaccrual at 180 days past due. In addition to these delinquency relateddelinquency-related policies, a consumer loan may also be placed on nonaccrual status when:
The loan has been modified and classified as a TDR, as further discussed below;
The PNC Financial Services Group, Inc. –Form 10-Q79
Notification of bankruptcy has been received and the loan is 30 days or more past due;
The bank holds a subordinate lien position in the loan and the first lien loan is seriously stressed (i.e., 90 days or more past due);
Other loans within the same borrower relationship have been placed on nonaccrual or charge-off has been taken on them;
The bank has repossessed non-real estate collateral securing the loan; or
The bank has charged-off the loan to write the loan down to the value of the collateral.
Most consumer loans and lines of credit, not secured by residential real estate, are charged off after 120 to 180 days past due. Generally, they are not placed on nonaccrual status as permitted by regulatory guidance.
Home equity installment loans, home equity lines of credit, and residential real estate loans that are not well-secured and in the process of collection are charged-off at no later than 180 days past due to the estimated fair value of the collateral less costs to sell. In addition to this policy, the bank will also recognize a charge-off on a secured consumer loan when:
The bank holds a subordinate lien position in the loan and a foreclosure notice has been received on the first lien loan;
The bank holds a subordinate lien position in the loan which is 30 days or more past due with a combined loan to value ratio of greater than or equal to 110% and the first lien loan is seriously stressed (i.e., 90 days or more past due);
It is modified or otherwise restructured in a manner that results in the loan becoming collateral dependent;
Notification of bankruptcy has been received within the last 60 days and the loan is 60 days or more past due;
The borrower has been discharged from personal liability inthrough Chapter 7 bankruptcy and has not formally reaffirmed his or her loan obligation to PNC; or
The collateral securing the loan has been repossessed and the value of the collateral is less than the recorded investment of the loan outstanding.
If payment is received on a nonaccrual loan, generally the payment is first applied to the recorded investment; once this principal obligation has been fulfilled, payments are then applied to recover any charged-off amounts related to
the loan that might exist.loan. Finally, if both principalrecorded investment and any charge-offs have been recovered, then the payment will be recorded as fee and interest income.
Nonaccrual loans are generally not returned to accrual status until the obligation is brought current and the borrower has performed in accordance with the contractual terms for a reasonable period of time (e.g., 6 months). When a nonperforming loan is returned to accrual status, it is then considered a performing loan.
A TDR is a loan whose terms have been restructured in a manner that grants a concession to a borrower experiencing financial difficulties. TDRs may include restructuring certain terms of loans, receipts of assets from debtors in partial satisfaction of loans, or a combination thereof. For TDRs, payments are applied based upon their contractual terms unless the related loan is deemed non-performing. TDRs except those loans where a borrower has been discharged from personal liability in Chapter 7 bankruptcy and has not formally reaffirmed his or her loan obligation to PNC, are generally included in nonperforming loans until returned to performing status through the fulfilling of restructured terms for a reasonable period of time (generally 6 months). Loans whereTDRs resulting from borrowers that have been discharged from personal liability through Chapter 7 bankruptcy and have not formally reaffirmed their loan obligationobligations to PNC are not returned to accrual status.
See Note 5 Asset Quality and Note 7 Allowances for Loan and Lease Losses and Unfunded Loan Commitments and Letters of Credit for additional TDR information.
Foreclosed assets are comprised of any asset seized or property acquired through a foreclosure proceeding or acceptance of a deed-in-lieu of foreclosure. Other real estate owned is comprised principally of commercial real estate and residential real estate properties obtained in partial or total satisfaction of loan obligations. After obtaining a foreclosure judgment, or in some jurisdictions the initiation of proceedings under a power of sale in the loan instruments, the property will be sold. When we are awarded title, we transfer the loan to foreclosed assets included in Other assets on our Consolidated Balance Sheet. Property obtained in satisfaction of a loan is initially recorded at estimated fair value less cost to sell. Based upon the estimated fair value less cost to sell, the recorded investment of the loan is adjusted and, typically, a charge-off/recovery is recognized to the Allowance for Loan and Lease Losses (ALLL).ALLL. We estimate fair values primarily based on appraisals, or sales agreements with third parties. Anticipated recoveriesFair value also considers the proceeds expected from government insurance and government guarantees are also considered in evaluatingupon the potential impairmentconveyance of loans at the date of transfer.other real estate owned (OREO).
Subsequently, foreclosed assets are valued at the lower of the amount recorded at acquisition date or estimated fair value less cost to sell. Valuation adjustments on these assets and gains or losses realized from disposition of such property are reflected in Other noninterest expense.
See Note 5 Asset Quality and Note 7 Allowances for Loan and Lease Losses and Unfunded Loan Commitments and Letters of Credit for additional information.
The PNC Financial Services Group, Inc. –Form 10-Q83
ALLOWANCE FFOROR LOAN AANDND LEASE LOSSES
We maintain the ALLL at a level that we believe to be appropriate to absorb estimated probable credit losses incurred in the loan and lease portfolios as of the balance sheet date.
80 The PNC Financial Services Group, Inc. –Form 10-Q
Our determination of the allowance is based on periodic evaluations of these loan and lease portfolios and other relevant factors. This critical estimate includes the use of significant amounts of PNC’s own historical data and complex methods to interpret them. We have an ongoing process to evaluate and enhance the quality, quantity and timeliness of our data and interpretation methods used in the determination of this allowance. These evaluations are inherently subjective as it requires material estimates, all of which may be susceptible to significant change, including, among others:
Probability of default (PD),
Loss given default (LGD),
Outstanding balance of the loan,
Movement through delinquency stages,
Amounts and timing of expected future cash flows,
Value of collateral, which may be obtained from third parties, and
Qualitative factors such as changes in current economic conditions that may not be reflected in historical results.
While our reserve methodologies strive to reflect all relevant risk factors, there continues to be uncertainty associated with, but not limited to, potential imprecision in the estimation process due to the inherent time lag of obtaining information and normal variations between estimates and actual outcomes. We provide additional reserves that are designed to provide coverage for losses attributable to such risks. The ALLL also includes factors which may not be directly measured in the determination of specific or pooled reserves. Such qualitative factors may include:
Industry concentrations and conditions,
Recent credit quality trends,
Recent loss experience in particular portfolios,
Recent macro-economic factors,
Changes in lending policies and procedures, and
Timing of available information, including the performance of first lien positions.positions, and
Limitations of available historical data.
In determining the appropriateness of the ALLL, we make specific allocations to impaired loans and allocations to portfolios of commercial and consumer loans.
Nonperforming loans are considered impaired under ASC 310-Receivables and are evaluated for a specific reserve. Specific reserve allocations are determined as follows:
For commercial nonperforming loans and TDRs greater than or equal to a defined dollar threshold, specific reserves are based on an analysis of the present value of the loan’s expected future cash flows, the loan’s observable market price or the fair value of the collateral.
| | flows, the loan’s observable market price or the fair value of the collateral. |
For commercial nonperforming loans and TDRs below the defined dollar threshold, the loans are aggregated for purposes of measuring specific reserve impairment using the applicable loan’s LGD percentage multiplied by the balance of the loan.
Consumer nonperforming loans are collectively reserved for unless classified as TDRs. For TDRs, for which specific reserves are based ondetermined through an analysis of the present value of the loan’s expected future cash flows. Additionally,flows, except for those instances where loans have been deemed collateral dependent, including loans where borrowers have been discharged from personal liability through Chapter 7 bankruptcy and have not formally reaffirmed their loan obligations to PNCPNC. Once that determination has been made, those TDRs are charged down to the fair value of the collateral less costs to sell.sell at each period end.
For purchased impaired loans, subsequent decreases to the net present value of expected cash flows will generally result in an impairment charge to the provision for credit losses, resulting in an increase to the ALLL.
When applicable, this process is applied across all the loan classes in a similar manner. However, as previously discussed, certain consumer loans and lines of credit, not secured by residential real estate, are charged off instead of being classified as nonperforming.
Our credit risk management policies, procedures and practices are designed to promote sound lending standards and prudent credit risk management. We have policies, procedures and practices that address financial statement requirements, collateral review and appraisal requirements, advance rates based upon collateral types, appropriate levels of exposure, cross-border risk, lending to specialized industries or borrower type, guarantor requirements, and regulatory compliance.
See Note 5 Asset Quality and Note 7 Allowances for Loan and Lease Losses and Unfunded Loan Commitments and Letters of Credit for additional information.
ALLOWANCE FFOROR UNFUNDED LOAN COMMITMENTS AANDND LETTERS OOFF CREDIT
We maintain the allowance for unfunded loan commitments and letters of credit at a level we believe is appropriate to absorb estimated probable credit losses on these unfunded credit facilities as of the balance sheet date. We determine the allowance based on periodic evaluations of the unfunded credit facilities, including an assessment of the probability of commitment usage, credit risk factors, and, solely for commercial lending, the terms and expiration dates of the unfunded credit facilities. Other than the estimation of the
84The PNC Financial Services Group, Inc. –Form 10-Q
probability of funding, the reserve for unfunded loan commitments is estimated in a manner similar to the methodology used for determining reserves for funded exposures. The allowance for unfunded loan commitments and letters of credit is recorded as a liability on the Consolidated Balance Sheet. Net adjustments to the allowance for unfunded loan commitments and letters of credit are included in the provision for credit losses.
See Note 5 Asset Quality and Note 7 Allowances for Loan and Lease Losses and Unfunded Loan Commitments and Letters of Credit for additional information.
The PNC Financial Services Group, Inc. –Form 10-Q81
EARNINGS PER COMMON SHARE
Basic earnings per common share is calculated using the two-class method to determine income attributable to common shareholders. Unvested share-based payment awards that contain nonforfeitable rights to dividends or dividend equivalents are considered participating securities under the two-class method. Income attributable to common shareholders is then divided by the weighted-average common shares outstanding for the period.
Diluted earnings per common share is calculated under the more dilutive of either the treasury method or the two-class method. For the diluted calculation, we increase the weighted-average number of shares of common stock outstanding by the assumed conversion of outstanding convertible preferred stock and debentures from the beginning of the year or date of issuance, if later, and the number of shares of common stock that would be issued assuming the exercise of stock options and warrants and the issuance of incentive shares using the treasury stock method. These adjustments to the weighted-average number of shares of common stock outstanding are made only when such adjustments will dilute earnings per common share. See Note 14 Earnings Per Share for additional information.
RECENTECENTLY ISSUED ACCOUNTING PRONOUNCEMENTS
In MarchJune 2013, the Financial Accounting Standards Board (FASB) issued Accounting Standards Update (ASU) 2013-05,2013-08,Foreign Currency Matters (Topic 830)Financial Services – Investment Companies (ASC Topic 946): Parent’s Accounting forAmendments to the Cumulative Translation Adjustment upon Derecognition of Certain Subsidiaries or Groups of Assets within a Foreign Entity or of an Investment in a Foreign Entity.Scope, Measurement and Disclosure Requirement. This ASU clarifiesmodifies the timing of release of Currency Translation Adjustments (CTA) from Accumulated Other Comprehensive Income (AOCI) upon deconsolidation or derecognition ofguidance in ASC 946 for determining whether an entity is an investment company, as well as the measurement and disclosure requirements for investment companies. The ASU does not change current accounting where a foreign entity,noninvestment company parent retains the specialized accounting applied by an investment company subsidiary or a group of assets within a foreign entity and in step acquisitions.consolidation. ASU 2013-052013-08 will be applied prospectively for all periods beginning after December 15, 2013 and early adoption is permitted.2013. We do not expect this ASU to have a material effect on our results of operations or financial position.
In July 2013, the FASB issued ASU 2013-10,Derivatives and Hedging (Topic 815): Inclusion of the Fed Funds Effective Swap Rate (or Overnight Index Swap Rate) as a Benchmark Interest Rate for Hedge Accounting Purposes. This ASU
amends existing guidance to include the Fed Funds effective swap rate (OIS) as a U.S. benchmark interest rate for hedge accounting purposes. The amendments also remove the restriction on using different benchmark interest rates for similar hedges. The effective date of ASU 2013-10 was July 17, 2013. However, since this ASU does not impact existing hedge accounting relationships, it did not have an effect on our results of operations or financial position.
In FebruaryJuly 2013, the FASB issued ASU 2013-04, Liabilities2013-11,Income Taxes (Topic 405)740): Obligations Resulting from Joint and Several Liability ArrangementsPresentation of an Unrecognized Tax Benefit When a Net Operating Loss Carryforward, a Similar Tax Loss, or a Tax Credit Carryforward Exists. This ASU clarifies current guidance to require that an unrecognized tax benefit or a portion thereof be presented in the statement of financial position as a reduction to a deferred tax asset for Whichan NOL carryforward, similar tax loss, or a tax credit carryforward except when an NOL carryforward, similar tax loss, or tax credit carryforward is not available under the Total Amounttax law of the Obligation is Fixed at the Reporting Date. This ASU requires entitiesapplicable jurisdiction to measure obligations resulting from joint and several liability arrangements for which the total amount of the obligation is fixed at the reporting date, as the sum of the following: a) the amount the reporting entity agreed to pay on the basis of its arrangement with its co-obligors and b)settle any additional amountincome taxes that would result from the reporting entity expects to pay on behalfdisallowance of its co-obligors. Requireda tax position. In such a case, the unrecognized tax benefit would be presented in the statement of financial position as a liability. No additional recurring disclosures include a description of the joint and several arrangement and the total outstanding amount of the obligation for all joint parties.are required by this ASU. This ASU 2013-04 is effective for fiscal years, and interim periods within those years, beginning after December 15, 2013 and should be applied retrospectively2013. Early adoption is permitted with prospective application to joint and several obligations existing
all unrecognized tax benefits that exist at the beginning of 2014.effective date. Retrospective application is also permitted. We do not expect this ASU to have ana material effect on our results of operations or financial position.
In February 2013,For information on Recent Accounting Pronouncements issued prior to the FASB issued ASU 2013-02,Comprehensive Income (Topic 220): Reporting of Amounts Reclassified Out of Accumulated Other Comprehensive Income. This ASU requires companies to present information about reclassification adjustments from accumulated other comprehensive incomesecond quarter, see Note 1 Accounting Policies in a single note or on the face of the financial statements. Additionally, companies are to disclose by component reclassifications out of accumulated other comprehensive income and their effects on the respective line items on net income and other disclosures currently required under U.S. GAAP. ASU 2013-02 was effective for annual and interim reporting periods beginning after December 15, 2012. These required disclosures areNotes To The Consolidated Financial Statements included in Note 15 Total Equity And Other Comprehensive Income.
In December 2011, the FASB issued ASU 2011-11,Balance Sheet (Topic 210): Disclosures about Offsetting Assets and Liabilitiesand then amended the scopePart I, Item I of ASU 2011-11 in Januaryour First Quarter 2013 through the issuance of ASU 2013-01,Balance Sheet (Topic 210): Clarifying the Scope of Disclosures about Offsetting Assets and Liabilities. This ASU applies to all entities that have derivative instruments, repurchase agreements and reverse repurchase agreements, or securities lending agreements that are (i) offset in accordance with ASC 210-20-45 or ASC 815-10-45 or (ii) subject to an enforceable master netting arrangement or similar agreement, and requires an entity to disclose information about offsetting to enable users of its financial statements to understand the effect of those arrangements on its financial position. The disclosures are required for quarterly and annual reporting periods beginning on or after January 1, 2013 and are to be applied retrospectively for all comparative periods presented. We adopted these ASUs on January 1, 2013 for our derivatives that we offset in accordance with ASC 815-10-45 and for our repurchase/resale arrangements under enforceable master netting arrangements, which we do not currently offset on our Consolidated Balance Sheet. These ASUs did not change the accounting for these arrangements or require them to be offset and thus had no impact on our statement of financial position. These disclosures are included in Note 13 Financial Derivatives and Note 18 Commitments and Guarantees.
In December 2011, the FASB issued ASU 2011-10,Property, Plant, and Equipment (Topic 360): Derecognition of in Substance Real Estate – a Scope Clarification (a consensus of the FASB Emerging Issues Task Force). This ASU clarified that the guidance in ASC 360-20 applies to a parent that ceases to have a controlling financial interest (as described in ASC 810-10) in a subsidiary that is in substance real estate as a result of default on the subsidiary’s nonrecourse debt. ASU 2011-10 should be applied on a prospective basis and is effective for fiscal years, and interim periods within those years, beginning on or after June 15, 2012. We adopted ASU 2011-10 on January 1, 2013 and there was no impact to our results of operations or financial position.
82 The PNC Financial Services Group, Inc. –Form 10-Q10-Q.
NOTE 2 ACQUISITIONAND DIVESTITURE ACTIVITY
RBC Bank (USA) Acquisition
On March 2, 2012, PNC acquired 100% of the issued and outstanding common stock of RBC Bank (USA), the U.S. retail banking subsidiary of Royal Bank of Canada. As part of the acquisition, PNC also purchased a credit card portfolio from RBC Bank (Georgia), National Association. PNC paid $3.6 billion in cash as consideration for the acquisition of both RBC Bank (USA) and the credit card portfolio. The fair value of the net assets acquired totaled approximately $2.6 billion, including $18.1 billion of deposits, $14.5 billion of loans and $.2 billion of other intangible assets. Goodwill of $1.0 billion was recorded as part of the acquisition. Refer to Note 2 Acquisition and Divestiture Activity in Item 8 of our 2012 Form 10-K for additional details related to the RBC Bank (USA) transactions.
The PNC Financial Services Group, Inc. –Form 10-Q85
Sale of Smartstreet
Effective October 26, 2012, PNC divested certain deposits and assets of the Smartstreet business unit, which was acquired by PNC as part of the RBC Bank (USA) acquisition, to Union Bank, N.A. Smartstreet is a nationwide business focused on homeowner or community association managers and had approximately $1 billion of assets and deposits as of September 30, 2012. The gain on sale was immaterial and resulted in a reduction of goodwill and core deposit intangibles of $46 million and $13 million, respectively. Results from operations of Smartstreet from March 2, 2012 through October 26, 2012 are included in our Consolidated Income Statement.
NOTE 3 LOAN SALEAND SERVICING ACTIVITIESAND VARIABLE INTEREST ENTITIES
Loan Sale and Servicing Activities
We have transferred residential and commercial mortgage loans in securitization or sales transactions in which we have continuing involvement. These transfers have occurred through Agency securitization, Non-agency securitization, and loan sale transactions. Agency securitizations consist of securitization transactions with Federal National Mortgage Association (FNMA), Federal Home Loan Mortgage Corporation (FHLMC), and Government National Mortgage Association (GNMA) (collectively the Agencies). FNMA and FHLMC generally securitize our transferred loans into mortgage-backed securities for sale into the secondary market through special purpose entities (SPEs) that they sponsor. We, as an authorized GNMA issuer/servicer, pool Federal Housing Administration (FHA) and Department of Veterans Affairs (VA) insured loans into mortgage-backed securities for sale into the secondary market. In Non-agency securitizations, we have transferred loans into securitization SPEs. In other instances, third-party investors have also purchased our loans in loan sale transactions and in certain instances have subsequently sold these loans into securitization SPEs.
Securitization SPEs utilized in the Agency and Non-agency securitization transactions are variable interest entities (VIEs).
Our continuing involvement in the FNMA, FHLMC, and GNMA securitizations, Non-agency securitizations, and loan sale transactions generally consists of servicing, repurchases of previously transferred loans under certain conditions and loss share arrangements, and, in limited circumstances, holding of mortgage-backed securities issued by the securitization SPEs.
Depending on the transaction, we may act as the master, primary, and/or special servicer to the securitization SPEs or third-party investors. Servicing responsibilities typically consist of collecting and remitting monthly borrower principal and interest payments, maintaining escrow deposits, performing loss mitigation and foreclosure activities, and, in certain instances, funding of servicing advances. Servicing advances, which are reimbursable, are recognized in Other
assets at cost and are made for principal and interest and collateral protection.
We earn servicing and other ancillary fees for our role as servicer and, depending on the contractual terms of the servicing arrangement, we can be terminated as servicer with or without cause. At the consummation date of each type of loan transfer, we recognize a servicing right at fair value. Servicing rights are recognized in Other intangible assets on our Consolidated Balance Sheet and when subsequently accounted for at fair value are classified within Level 3 of the fair value hierarchy. See Note 9 Fair Value and Note 10 Goodwill and Other Intangible Assets for further discussion of our residential and commercial servicing rights.
Certain loans transferred to the Agencies contain removal of account provisions (ROAPs). Under these ROAPs, we hold an option to repurchase at par individual delinquent loans that meet certain criteria. When we have the unilateral ability to repurchase a delinquent loan, effective control over the loan has been regained and we recognize an asset (in either Loans or Loans held for sale) and a corresponding liability (in Other borrowed funds) on the balance sheet regardless of our intent to repurchase the loan. At March 31,June 30, 2013 and December 31, 2012, the balance of our ROAP asset and liability totaled $155$149 million and $190 million, respectively.
The Agency and Non-agency mortgage-backed securities issued by the securitization SPEs that are purchased and held on our balance sheet are typically purchased in the secondary market. PNC does not retain any credit risk on its Agency mortgage-backed security positions as FNMA, FHLMC, and the USU.S. Government (for GNMA) guarantee losses of principal and interest. Substantially all of the Non-agency mortgage-backed securities acquired and held on our balance sheet are senior tranches in the securitization structure.
The PNC Financial Services Group, Inc. –Form 10-Q83
We also have involvement with certain Agency and Non-agency commercial securitization SPEs where we have not transferred commercial mortgage loans. These SPEs were sponsored by independent third-parties and the loans held by these entities were purchased exclusively from other third-parties. Generally, our involvement with these SPEs is as servicer with servicing activities consistent with those described above.
We recognize a liability for our loss exposure associated with contractual obligations to repurchase previously transferred loans due to breaches of representations and warranties and also for loss sharing arrangements (recourse obligations) with the Agencies. Other than providing temporary liquidity under servicing advances and our loss exposure associated with our repurchase and recourse obligations, we have not provided nor are we required to provide any type of credit support, guarantees, or commitments to the securitization SPEs or third-party investors in these transactions. See Note 18 Commitments and Guarantees for further discussion of our repurchase and recourse obligations.
86 The PNC Financial Services Group, Inc. –Form 10-Q
The following table provides information related to certain financial information and cash flows associated with PNC’s loan sale and servicing activities:
Table 59: Certain Financial Information and Cash Flows Associated with Loan Sale and Servicing Activities
| | In millions | | Residential
Mortgages | | | Commercial
Mortgages (a) | | | Home Equity
Loans/Lines (b) | | | Residential
Mortgages | | | Commercial
Mortgages (a) | | | Home Equity
Loans/Lines (b) | |
FINANCIAL INFORMATION – March 31, 2013 | | | | | | | | |
FINANCIAL INFORMATION – June 30, 2013 | | | | | | | | |
Servicing portfolio (c) | | $ | 120,490 | | | $ | 160,911 | | | $ | 5,274 | | | $ | 115,740 | | | $ | 166,356 | | | $ | 5,176 | |
Carrying value of servicing assets (d) | | | 779 | | | | 452 | | | | | | | 975 | | | | 525 | | | | |
Servicing advances (e) | | | 588 | | | | 509 | | | | 5 | | | | 558 | | | | 502 | | | | 5 | |
Repurchase and recourse obligations (f) | | | 522 | | | | 42 | | | | 25 | | | | 523 | | | | 37 | | | | 24 | |
Carrying value of mortgage-backed securities held (g) | | | 5,164 | | | | 1,572 | | | | | | | 4,503 | | | | 1,528 | | | | |
FINANCIAL INFORMATION – December 31, 2012 | | | | | | | | | | | | | | |
Servicing portfolio (c) | | $ | 119,262 | | | $ | 153,193 | | | $ | 5,353 | | | $ | 119,262 | | | $ | 153,193 | | | $ | 5,353 | |
Carrying value of servicing assets (d) | | | 650 | | | | 420 | | | | | | | 650 | | | | 420 | | | | |
Servicing advances (e) | | | 582 | | | | 505 | | | | 5 | | | | 582 | | | | 505 | | | | 5 | |
Repurchase and recourse obligations (f) | | | 614 | | | | 43 | | | | 58 | | | | 614 | | | | 43 | | | | 58 | |
Carrying value of mortgage-backed securities held (g) | | | 5,445 | | | | 1,533 | | | | | | | 5,445 | | | | 1,533 | | | | |
| | In millions | | Residential
Mortgages | | Commercial
Mortgages (a) | | Home Equity
Loans/Lines (b) | | | Residential
Mortgages | | Commercial
Mortgages (a) | | | Home Equity
Loans/Lines (b) | |
CASH FLOWS – Three months ended March 31, 2013 | | | | | | | | |
CASH FLOWS – Three months ended June 30, 2013 | | | | | | | | |
Sales of loans (h) | | $ | 3,804 | | | $ | 926 | | | | | | $ | 4,190 | | | $ | 489 | | | | |
Repurchases of previously transferred loans (i) | | | 372 | | | | | $ | 2 | | | | 278 | | | | | $ | 2 | |
Servicing fees (j) | | | 90 | | | | 46 | | | | 6 | | | | 89 | | | | 43 | | | | 5 | |
Servicing advances recovered/(funded), net | | | (6 | ) | | | (5 | ) | | | | | | 30 | | | | 8 | | | | (1 | ) |
Cash flows on mortgage-backed securities held (g) | | | 367 | | | | 123 | | | | | | 389 | | | | 70 | | | | |
CASH FLOWS – Three months ended March 31, 2012 | | | | | | | | |
CASH FLOWS – Three months ended June 30, 2012 | | | | | | | | |
Sales of loans (h) | | $ | 3,509 | | | $ | 481 | | | | | | $ | 2,939 | | | $ | 468 | | | | |
Repurchases of previously transferred loans (i) | | | 411 | | | | | $ | 10 | | | | 358 | | | | | $ | 6 | |
Servicing fees (j) | | | 84 | | | | 45 | | | | 5 | | | | 95 | | | | 46 | | | | 6 | |
Servicing advances recovered/(funded), net | | | (21 | ) | | | 8 | | | | | | | 20 | | | | 13 | | | | |
Cash flows on mortgage-backed securities held (g) | | | 256 | | | | 129 | | | | | | 283 | | | | 223 | | | | |
CASH FLOWS – Six months ended June 30, 2013 | | | | | | | | |
Sales of loans (h) | | | $ | 7,994 | | | $ | 1,415 | | | | |
Repurchases of previously transferred loans (i) | | | | 650 | | | | | $ | 4 | |
Servicing fees (j) | | | | 179 | | | | 89 | | | | 11 | |
Servicing advances recovered/(funded), net | | | | 24 | | | | 3 | | | | (1 | ) |
Cash flows on mortgage-backed securities held (g) | | | | 756 | | | | 193 | | | | |
CASH FLOWS – Six months ended June 30, 2012 | | | | | | | | |
Sales of loans (h) | | | $ | 6,448 | | | $ | 949 | | | | |
Repurchases of previously transferred loans (i) | | | | 769 | | | | | $ | 16 | |
Servicing fees (j) | | | | 194 | | | | 91 | | | | 11 | |
Servicing advances recovered/(funded), net | | | | (1 | ) | | | 21 | | | | |
Cash flows on mortgage-backed securities held (g) | | | | 539 | | | | 352 | | | | |
| (a) | Represents financial and cash flow information associated with both commercial mortgage loan transfer and servicing activities. |
| (b) | These activities were part of an acquired brokered home equity lending business in which PNC is no longer engaged. See Note 18 Commitments and Guarantees for further information. |
| (c) | For our continuing involvement with residential mortgage and home equity loan/line transfers, amount represents outstanding balance of loans transferred and serviced. For commercial mortgages, amount represents overall servicing portfolio in which loans have been transferred by us or third parties to VIEs. |
| (d) | See Note 9 Fair Value and Note 10 Goodwill and Other Intangible Assets for further information. |
| (e) | Pursuant to certain contractual servicing agreements, represents outstanding balance of funds advanced (i) to investors for monthly collections of borrower principal and interest, (ii) for borrower draws on unused home equity lines of credit, and (iii) for collateral protection associated with the underlying mortgage collateral. |
The PNC Financial Services Group, Inc. –Form 10-Q87
| (f) | Represents liability for our loss exposure associated with loan repurchases for breaches of representations and warranties for our Residential Mortgage Banking and Non-Strategic Assets Portfolio segments, and our commercial mortgage loss share arrangements for our Corporate & Institutional Banking segment. See Note 18 Commitments and Guarantees for further information. |
84 The PNC Financial Services Group, Inc. –Form 10-Q
| (g) | Represents securities held where PNC transferred to and/or services loans for a securitization SPE and we hold securities issued by that SPE. |
| (h) | There were no gains or losses recognized on the transaction date for sales of residential mortgage loans as these loans are recognized on the balance sheet at fair value. For transfers of commercial mortgage loans not recognized on the balance sheet at fair value, gains/losses recognized on sales of these loans were insignificant$20 million and $18 million for the periods presented.three months ended June 30, 2013 and June 30, 2012, respectively, and $43 million and $15 million for the six months ended June 30, 2013 and June 30, 2012, respectively. |
| (i) | Includes government insured or guaranteed loans repurchased through the exercise of our ROAP option and loans repurchased due to breaches of origination covenants or representations and warranties made to purchasers. |
| (j) | Includes contractually specified servicing fees, late charges and ancillary fees. |
Variable Interest Entities (VIEs)
As discussed in our 2012 Form 10-K, we are involved with various entities in the normal course of business that are deemed to be VIEs. The following provides a summary of VIEs, including those that we have consolidated and those in which we hold variable interests but have not consolidated into our financial statements as of March 31,June 30, 2013 and December 31, 2012.
Table 60: Consolidated VIEs – Carrying Value (a) (b)
| March 31, 2013 In millions | | Market
Street | | | Credit Card
and Other
Securitization
Trusts (c) | | | Tax Credit
Investments | | | Total | | |
June 30, 2013 In millions | | | Market Street | | | Credit Card and Other
Securitization Trusts (c) | | | Tax Credit
Investments | | | Total | |
Assets | | | | | | | | | | | | | | | | | | | | | |
Cash and due from banks | | | | | | | | $ | 4 | | | $ | 4 | | | | | | | $ | 4 | | | $ | 4 | |
Interest-earning deposits with banks | | | | | | | | | 6 | | | | 6 | | | | | | | | 6 | | | | 6 | |
Investment securities | | $ | 8 | | | | | | | | | | 8 | | | $ | 7 | | | | | | | | 7 | |
Loans | | | 5,788 | | | $ | 1,750 | | | | | | | 7,538 | | | | 6,116 | | | $ | 1,729 | | | | | | 7,845 | |
Allowance for loan and lease losses | | | | | | (67 | ) | | | | | | (67 | ) | | | | | (64 | ) | | | | | (64 | ) |
Equity investments | | | | | | | | | 1,504 | | | | 1,504 | | | | | | | | 492 | | | | 492 | |
Other assets | | | 526 | | | | 13 | | | | 647 | | | | 1,186 | | | | 6 | | | | 27 | | | | 534 | | | | 567 | |
Total assets | | $ | 6,322 | | | $ | 1,696 | | | $ | 2,161 | | | $ | 10,179 | | | $ | 6,129 | | | $ | 1,692 | | | $ | 1,036 | | | $ | 8,857 | |
Liabilities | | | | | | | | | | | | | | | | | | | | | |
Commercial paper | | $ | 5,848 | | | | | | | | | $ | 5,848 | | | $ | 5,900 | | | | | | | $ | 5,900 | |
Other borrowed funds | | | | | $ | 130 | | | $ | 249 | | | | 379 | | | | | $ | 195 | | | $ | 239 | | | | 434 | |
Accrued expenses | | | | | | | | | 130 | | | | 130 | | | | | | | | 120 | | | | 120 | |
Other liabilities | | | 520 | | | | 71 | | | | 443 | | | | 1,034 | | | | 223 | | | | | | 155 | | | | 378 | |
Total liabilities | | $ | 6,368 | | | $ | 201 | | | $ | 822 | | | $ | 7,391 | | | $ | 6,123 | | | $ | 195 | | | $ | 514 | | | $ | 6,832 | |
| December 31, 2012 In millions | | Market
Street | | | Credit Card
Securitization
Trust (d) | | | Tax Credit
Investments | | | Total | | | Market Street | | | Credit Card
Securitization Trust (e) | | | Tax Credit
Investments | | | Total | |
Assets | | | | | | | | | | | | | | | | | | | | | |
Cash and due from banks | | | | | | | | $ | 4 | | | $ | 4 | | | | | | | $ | 4 | | | $ | 4 | |
Interest-earning deposits with banks | | | | | | | | | 6 | | | | 6 | | | | | | | | 6 | | | | 6 | |
Investment securities | | $ | 9 | | | | | | | | | | 9 | | | $ | 9 | | | | | | | | 9 | |
Loans | | | 6,038 | | | $ | 1,743 | | | | | | | 7,781 | | | | 6,038 | | | $ | 1,743 | | | | | | 7,781 | |
Allowance for loan and lease losses | | | | | | (75 | ) | | | | | | (75 | ) | | | | | (75 | ) | | | | | (75 | ) |
Equity investments | | | | | | | | | 1,429 | | | | 1,429 | | | | | | | | 1,429 | | | | 1,429 | |
Other assets | | | 536 | | | | 31 | | | | 714 | | | | 1,281 | | | | 536 | | | | 31 | | | | 714 | | | | 1,281 | |
Total assets | | $ | 6,583 | | | $ | 1,699 | | | $ | 2,153 | | | $ | 10,435 | | | $ | 6,583 | | | $ | 1,699 | | | $ | 2,153 | | | $ | 10,435 | |
Liabilities | | | | | | | | | | | | | | | | | | | | | |
Commercial paper | | $ | 6,045 | | | | | | | | | $ | 6,045 | | | $ | 6,045 | | | | | | | $ | 6,045 | |
Other borrowed funds | | | | | | | | $ | 257 | | | | 257 | | | | | | | $ | 257 | | | | 257 | |
Accrued expenses | | | | | | | | | 132 | | | | 132 | | | | | | | | 132 | | | | 132 | |
Other liabilities | | | 529 | | | | | | | 447 | | | | 976 | | | | 529 | | | | | | 447 | | | | 976 | |
Total liabilities | | $ | 6,574 | | | | | | $ | 836 | | | $ | 7,410 | | | $ | 6,574 | | | | | $ | 836 | | | $ | 7,410 | |
| (a) | Amounts represent carrying value on PNC’s Consolidated Balance Sheet. |
| (b) | Difference between total assets and total liabilities represents the equity portion of the VIE or intercompany assets and liabilities which are eliminated in consolidation. |
| (c) | During the first quarter of 2013, PNC consolidated a Non-agency securitization trust due to modification of contractual provisions. |
| (d) | During the second quarter of 2013, certain Market Street amounts previously classified in “Other assets” were reclassified to “Loans”. |
| (e) | During the first quarter of 2012, the last securitization series issued by the SPE matured, resulting in the zero balance of liabilities at December 31, 2012. |
88The PNC Financial Services Group, Inc. –Form 10-Q85
Table 61: Assets and Liabilities of Consolidated VIEs (a)
| | | | | | | | |
| In millions | | Aggregate Assets | | | Aggregate Liabilities | |
March 31, 2013 | | | | | | | | |
Market Street | | $ | 7,623 | | | $ | 7,623 | |
Credit Card and Other Securitization Trusts | | | 1,948 | | | | 201 | |
Tax Credit Investments | | | 2,170 | | | | 840 | |
December 31, 2012 | | | | | | | | |
Market Street | | $ | 7,796 | | | $ | 7,796 | |
Credit Card Securitization Trust | | | 1,782 | | | | | |
Tax Credit Investments | | | 2,162 | | | | 853 | |
| | | | | | | | |
| In millions | | Aggregate
Assets | | | Aggregate
Liabilities | |
June 30, 2013 | | | | | | | | |
Market Street | | $ | 7,322 | | | $ | 7,322 | |
Credit Card and Other Securitization Trusts | | | 1,978 | | | | 195 | |
Tax Credit Investments | | | 1,045 | | | | 544 | |
| | |
December 31, 2012 | | | | | | | | |
Market Street | | $ | 7,796 | | | $ | 7,796 | |
Credit Card Securitization Trust | | | 1,782 | | | | | |
Tax Credit Investments | | | 2,162 | | | | 853 | |
| (a) | Amounts in this table differ from total assets and liabilities in the preceding “Consolidated VIEs – Carrying Value” table due to the elimination of intercompany assets and liabilities in the preceding table. |
Table 62: Non-Consolidated VIEs
| | | | | | | | | | | | | | | | | | | | |
| In millions | | Aggregate
Assets | | | Aggregate
Liabilities | | | PNC Risk
of Loss | | | Carrying Value
of Assets | | | Carrying Value
of Liabilities | |
March 31, 2013 | | | | | | | | | | | | | | | | | | | | |
Commercial Mortgage-Backed Securitizations (a) | | $ | 73,205 | | | $ | 73,205 | | | $ | 1,879 | | | $ | 1,879 | (c) | | | | |
Residential Mortgage-Backed Securitizations (a) | | | 37,652 | | | | 37,652 | | | | 5,175 | | | | 5,175 | (c) | | $ | 6 | (e) |
Tax Credit Investments and Other (b) | | | 5,710 | | | | 1,919 | | | | 1,351 | | | | 1,351 | (d) | | | 666 | (e) |
Total | | $ | 116,567 | | | $ | 112,776 | | | $ | 8,405 | | | $ | 8,405 | | | $ | 672 | |
| | | | | | | | | | | | | | | | | | | | |
| In millions | | Aggregate
Assets | | | Aggregate
Liabilities | | | PNC Risk
of Loss | | | Carrying Value
of Assets | | | Carrying Value
of Liabilities | |
December 31, 2012 | | | | | | | | | | | | | | | | | | | | |
Commercial Mortgage-Backed Securitizations (a) | | $ | 72,370 | | | $ | 72,370 | | | $ | 1,829 | | | $ | 1,829 | (c) | | | | |
Residential Mortgage-Backed Securitizations (a) | | | 42,719 | | | | 42,719 | | | | 5,456 | | | | 5,456 | (c) | | $ | 90 | (e) |
Tax Credit Investments and Other (b) | | | 5,960 | | | | 2,101 | | | | 1,283 | | | | 1,283 | (d) | | | 623 | (e) |
Total | | $ | 121,049 | | | $ | 117,190 | | | $ | 8,568 | | | $ | 8,568 | | | $ | 713 | |
| | | | | | | | | | | | | | | | | | | | |
| In millions | | Aggregate
Assets | | | Aggregate
Liabilities | | | PNC Risk
of Loss | | | Carrying
Value of
Assets | | | Carrying
Value of
Liabilities | |
June 30, 2013 | | | | | | | | | | | | | | | | | | | | |
Commercial Mortgage-Backed Securitizations (a) | | $ | 71,374 | | | $ | 71,374 | | | $ | 1,836 | | | $ | 1,836 | (c) | | | | |
Residential Mortgage-Backed Securitizations (a) | | | 35,798 | | | | 35,798 | | | | 4,516 | | | | 4,516 | (c) | | $ | 7 | (e) |
Tax Credit Investments and Other (b) | | | 6,564 | | | | 2,093 | | | | 1,405 | | | | 1,405 | (d) | | | 644 | (e) |
Total | | $ | 113,736 | | | $ | 109,265 | | | $ | 7,757 | | | $ | 7,757 | | | $ | 651 | |
| | | | | | | | | | | | | | | | | | | | |
| In millions | | Aggregate
Assets | | | Aggregate
Liabilities | | | PNC Risk
of Loss | | | Carrying
Value of
Assets | | | Carrying
Value of
Liabilities | |
December 31, 2012 | | | | | | | | | | | | | | | | | | | | |
Commercial Mortgage-Backed Securitizations (a) | | $ | 72,370 | | | $ | 72,370 | | | $ | 1,829 | | | $ | 1,829 | (c) | | | | |
Residential Mortgage-Backed Securitizations (a) | | | 42,719 | | | | 42,719 | | | | 5,456 | | | | 5,456 | (c) | | $ | 90 | (e) |
Tax Credit Investments and Other (b) | | | 5,960 | | | | 2,101 | | | | 1,283 | | | | 1,283 | (d) | | | 623 | (e) |
Total | | $ | 121,049 | | | $ | 117,190 | | | $ | 8,568 | | | $ | 8,568 | | | $ | 713 | |
| (a) | Amounts reflect involvement with securitization SPEs where PNC transferred to and/or services loans for an SPE and we hold securities issued by that SPE. Asset amounts equal outstanding liability amounts of the SPEs due to limited availability of SPE financial information. We also invest in other mortgage and asset-backed securities issued by third-party VIEs with which we have no continuing involvement. Further information on these securities is included in Note 8 Investment Securities and values disclosed represent our maximum exposure to loss for those securities’ holdings. |
| (b) | Aggregate assets and aggregate liabilities are based on limited availability of financial information associated with certain acquired partnerships. |
| (c) | Included in Trading securities, Investment securities, Other intangible assets, and Other assets on our Consolidated Balance Sheet. |
| (d) | Included in Equity investments on our Consolidated Balance Sheet. |
| (e) | Included in Other liabilities on our Consolidated Balance Sheet. |
The PNC Financial Services Group, Inc. –Form 10-Q89
Market Street
Market Street Funding LLC (Market Street), owned by an independent third-party, is a multi-seller asset-backed commercial paper conduit that primarily purchases assets or makes loans secured by interests in pools of receivables from U.S. corporations. Market Street funds the purchases of assets or loans by issuing commercial paper. Market Street is supported by pool-specific credit enhancements, liquidity facilities, and a program-level credit enhancement. Generally, Market Street mitigates its potential interest rate risk by entering into agreements with its borrowers that reflect interest rates based upon its weighted-average commercial paper cost of funds. During 2012 and the first threesix months of 2013, Market Street met all of its funding needs through the issuance of commercial paper.
PNC Bank, National Association, (PNC Bank, N.A.) provides certain administrative services, the program-level credit enhancement and liquidity facilities to Market Street in exchange for fees negotiated based on market rates. The program-level credit enhancement covers net losses in the amount of 10% of commitments, excluding explicitly rated AAA/Aaa facilities. Coverage is a cash collateral account funded by a loan facility. This facility expires in June 2017.2018. At March 31,June 30, 2013, $1.2 billion was outstanding on this facility.
Although the commercial paper obligations at March 31,June 30, 2013 and December 31, 2012 were supported by Market Street’s assets, PNC Bank, N.A. may be obligated to fund Market Street under the $11.9$11.4 billion of liquidity facilities for events such as commercial paper market disruptions, borrower bankruptcies, collateral deficiencies or covenant violations. Our credit risk under the liquidity facilities is secondary to the risk of first loss absorbed by Market Street borrowers through over-collateralization of assets and losses absorbed by deal-specific credit enhancement provided by a third party. The deal-specific credit enhancement is generally structured to cover a multiple of expected losses for the pool of assets and is sized to meet rating agency standards for comparably structured transactions.
86 The PNC Financial Services Group, Inc. –Form 10-Q
Through the credit enhancement and liquidity facility arrangements, PNC Bank, N.A. has the power to direct the activities of Market Street that most significantly affect its economic performance and these arrangements expose PNC Bank, N.A. to expected losses or residual returns that are potentially significant to Market Street. Therefore, PNC Bank, N.A. consolidates Market Street. PNC Bank, N.A. is not required to nor have we provided additional financial support to Market Street and Market Street creditors have no direct recourse to PNC Bank, N.A.
Credit Card Securitization Trust
We were the sponsor of several credit card securitizations facilitated through a trust. This bankruptcy-remote SPE was established to purchase credit card receivables from the sponsor and to issue and sell asset-backed securities created
by it to independent third-parties. The SPE was financed primarily through the sale of these asset-backed securities. These transactions were originally structured to provide liquidity and to afford favorable capital treatment.
Our continuing involvement in these securitization transactions consisted primarily of holding certain retained interests and acting as the primary servicer. For each securitization series that was outstanding, our retained interests held were in the form of a pro-rata undivided interest, or sellers’ interest, in the transferred receivables, subordinated tranches of asset-backed securities, interest-only strips, discount receivables, and subordinated interests in accrued interest and fees in securitized receivables. We consolidated the SPE as we were deemed the primary beneficiary of the entity based upon our level of continuing involvement. Our role as primary servicer gave us the power to direct the activities of the SPE that most significantly affect its economic performance and our holding of retained interests gave us the obligation to absorb expected losses, or the ability to receive residual returns that could be potentially significant to the SPE. The underlying assets of the consolidated SPE were restricted only for payment of the beneficial interests issued by the SPE. We were not required to nor did we provide additional financial support to the SPE. Additionally, creditors of the SPE have no direct recourse to PNC.
During the first quarter of 2012, the last series issued by the SPE, Series 2007-1, matured. At March 31,June 30, 2013, the SPE continued to exist and we consolidated the entity as we continued to be the primary beneficiary of the SPE through our holding of seller’s interest and our role as the primary servicer.
Tax Credit Investments
We make certain equity investments in various tax credit limited partnerships or limited liability companies (LLCs). The purpose of these investments is to achieve a satisfactory return on capital and to assist us in achieving goals associated with the Community Reinvestment Act.
Also, we are a national syndicator of affordable housing equity. In these syndication transactions, we create funds in
which our subsidiaries are the general partner or managing member and sell limited partnership or non-managing member interests to third parties. In some cases PNC may also purchase a limited partnership or non-managing member interest in the fund. The purpose of this business is to generate income from the syndication of these funds, generate servicing fees by managing the funds, and earn tax credits to reduce our tax liability. General partner or managing member activities include selecting, evaluating, structuring, negotiating, and closing the fund investments in operating limited partnerships or LLCs, as well as oversight of the ongoing operations of the fund portfolio.
Typically, the general partner or managing member will be the party that has the right to make decisions that will most
90 The PNC Financial Services Group, Inc. –Form 10-Q
significantly impact the economic performance of the entity. However, certain partnership or LLC agreements provide the limited partner or non-managing member the ability to remove the general partner or managing member without cause. This results in the limited partner or non-managing member being the party that has the right to make decisions that will most significantly impact the economic performance of the entity. The primary sources of losses and benefits for these investments are the tax credits and tax benefits due to passive losses on the investments. We have consolidated investments in which we have the power to direct the activities that most significantly impact the entity’s performance, and have an obligation to absorb expected losses or receive benefits that could be potentially significant. The assets are primarily included in Equity investments and Other assets on our Consolidated Balance Sheet with the liabilities classified in Other borrowed funds, Accrued expenses, and Other liabilities and the third party investors’ interests included in the Equity section as Noncontrolling interests. Neither creditors nor equity investors in these investments have any recourse to our general credit. We have not provided financial or other support to the limited partnership or LLC that we are not contractually obligated to provide. The consolidated aggregate assets and liabilities of these investments are provided in the Consolidated VIEs table and reflected in the “Other” business segment.
For tax credit investments in which we do not have the right to make decisions that will most significantly impact the economic performance of the entity, we are not the primary beneficiary and thus they are not consolidated. These investments are disclosed in Table 62: Non-Consolidated VIEs. The table also reflects our maximum exposure to loss.loss exclusive of any potential tax credit recapture. Our maximum exposure to loss is equal to our legally binding equity commitments adjusted for recorded impairment and partnership results. We use the equity method to account for our investment in these entities with the investments reflected in Equity investments on our Consolidated Balance Sheet. In addition, we increase our recognized investments and recognize a liability for all legally binding unfunded equity commitments. These liabilities are reflected in Other liabilities on our Consolidated Balance Sheet.
TheDuring the second quarter of 2013, PNC Financial Services Group, Inc. –Form 10-Q87sold limited partnership or non-managing member interests previously held in certain consolidated funds. As a result, PNC no longer met the consolidation criteria for those investments and deconsolidated approximately $675 million of net assets related to the funds.
Residential and Commercial Mortgage-Backed Securitizations
In connection with each Agency and Non-agency securitization discussed above, we evaluate each SPE utilized in these transactions for consolidation. In performing these assessments, we evaluate our level of continuing involvement in these transactions as the nature of our involvement ultimately determines whether or not we hold a variable interest and/or are the primary beneficiary of the SPE. Factors we consider in our consolidation assessment include the significance of (i) our role as servicer, (ii) our holdings of mortgage-backed securities issued by the securitization SPE, and (iii) the rights of third-party variable interest holders.
The first step in our assessment is to determine whether we hold a variable interest in the securitization SPE. We hold variable interests in Agency and Non-agency securitization SPEs through our holding of mortgage-backed securities issued by the SPEs and/or our recourse obligations. Each SPE in which we hold a variable interest is evaluated to determine whether we are the primary beneficiary of the entity. For Agency securitization transactions, our contractual role as servicer does not give us the power to direct the activities that most significantly affect the economic performance of the SPEs. Thus, we are not the primary beneficiary of these entities. For Non-agency securitization transactions, we would be the primary beneficiary to the extent our servicing activities give us the power to direct the activities that most significantly affect the economic performance of the SPE and we hold a more than insignificant variable interest in the entity.
In the first quarter 2013, contractual provisions of a Non-agency securitization were modified resulting in PNC being deemed the primary beneficiary of the securitization. As a result, we consolidated the SPE and recorded the SPE’s home equity line of credit assets and associated beneficial interest liabilities and are continuing to account for these instruments at fair value. These balances are included within the Credit Card and Other Securitization Trusts balances line in Table 60: Consolidated VIEs – Carrying Value and Table 61: Assets and Liabilities of Consolidated VIEs. We are not required to provide additional support to the SPE. Additionally, creditors of the SPE have no direct recourse to PNC.
Details about the Agency and Non-agency securitization SPEs where we hold a variable interest and are not the primary beneficiary are included in Table 62: Non-Consolidated VIEs. Our maximum exposure to loss as a result of our involvement with these SPEs is the carrying value of the mortgage-backed securities, servicing assets, servicing advances, and our liabilities associated with our recourse obligations. Creditors of the securitization SPEs have no recourse to PNC’s assets or general credit.
The PNC Financial Services Group, Inc. –Form 10-Q91
NOTE 4 LOANSAND COMMITMENTSTO EXTEND CREDIT
Loans outstanding were as follows:
Table 63: Loans Outstanding
| | In millions | | March 31
2013 | | December 31
2012 | | | June 30 2013 | | | December 31
2012 | |
Commercial lending | | | | | | | | | | |
Commercial | | $ | 84,285 | | | $ | 83,040 | | | $ | 86,930 | | | $ | 83,040 | |
Commercial real estate | | | 18,779 | | | | 18,655 | | | | 18,991 | | | | 18,655 | |
Equipment lease financing | | | 7,240 | | | | 7,247 | | | | 7,349 | | | | 7,247 | |
Total commercial lending | | | 110,304 | | | | 108,942 | | | | 113,270 | | | | 108,942 | |
Consumer lending | | | | | | | | | | |
Home equity | | | 36,030 | | | | 35,920 | | | | 36,416 | | | | 35,920 | |
Residential real estate | | | 14,985 | | | | 15,240 | | | | 14,777 | | | | 15,240 | |
Credit card | | | 4,081 | | | | 4,303 | | | | 4,135 | | | | 4,303 | |
Other consumer | | | 21,104 | | | | 21,451 | | | | 21,177 | | | | 21,451 | |
Total consumer lending | | | 76,200 | | | | 76,914 | | | | 76,505 | | | | 76,914 | |
Total loans (a) (b) | | $ | 186,504 | | | $ | 185,856 | | | $ | 189,775 | | | $ | 185,856 | |
| (a) | Net of unearned income, net deferred loan fees, unamortized discounts and premiums, and purchase discounts and premiums totaling $2.5$2.3 billion and $2.7 billion at March 31,June 30, 2013 and December 31, 2012, respectively. |
| (b) | Future accretable yield related to purchased impaired loans is not included in loans outstanding. |
At March 31,June 30, 2013, we pledged $23.1$22.9 billion of commercial loans to the Federal Reserve Bank and $34.8$45.5 billion of residential real estate and other loans to the Federal Home Loan Bank as collateral for the contingent ability to borrow, if necessary. The comparable amounts at December 31, 2012 were $23.2 billion and $37.3 billion, respectively.
Table 64: Net Unfunded Credit Commitments
| | In millions | | March 31
2013 | | December 31
2012 | | | June 30 2013 | | | December 31
2012 | |
Commercial and commercial real estate | | $ | 79,953 | | | $ | 78,703 | | | $ | 82,790 | | | $ | 78,703 | |
Home equity lines of credit | | | 19,696 | | | | 19,814 | | | | 19,325 | | | | 19,814 | |
Credit card | | | 17,356 | | | | 17,381 | | | | 17,101 | | | | 17,381 | |
Other | | | 4,807 | | | | 4,694 | | | | 4,926 | | | | 4,694 | |
Total (a) | | $ | 121,812 | | | $ | 120,592 | | | $ | 124,142 | | | $ | 120,592 | |
| (a) | Excludes standby letters of credit. See Note 18 Commitments and Guarantees for additional information on standby letters of credit. |
Commitments to extend credit represent arrangements to lend funds or provide liquidity subject to specified contractual conditions. At March 31,June 30, 2013, commercial commitments reported above exclude $22.9$23.5 billion of syndications, assignments and participations, primarily to financial institutions. The comparable amount at December 31, 2012 was $22.5 billion.
Commitments generally have fixed expiration dates, may require payment of a fee, and contain termination clauses in the event the customer’s credit quality deteriorates. Based on our historical experience, most commitments expire unfunded, and therefore cash requirements are substantially less than the total commitment.
88 The PNC Financial Services Group, Inc. –Form 10-Q
NOTE 5 ASSET QUALITY
Asset Quality
We closely monitor economic conditions and loan performance trends to manage and evaluate our exposure to credit risk. Trends in delinquency rates may be a key indicator, among other considerations, of credit risk within the loan portfolios. The measurement of delinquency status is based on the contractual terms of each loan. Loans that are 30 days or more past due in terms of payment are considered delinquent. Loan delinquencies exclude loans held for sale and purchased impaired loans, but include government insured or guaranteed loans and loans accounted for under the fair value option.
The trends in nonperforming assets represent another key indicator of the potential for future credit losses. Nonperforming assets include nonperforming loans, OREO and foreclosed assets. Nonperforming loans are those loans accounted for at amortized cost that have deteriorated in credit quality to the extent that full collection of contractual principal and other real estate owned (OREO) and foreclosed assets, but excludeinterest is not probable. Interest income is not recognized on these loans. Loans accounted for under the fair value option are reported as performing loans as these loans are accounted for at fair value. However, based upon the nonaccrual policies discussed within Note 1 Accounting Policies, interest income is not recognized. Additionally, certain government insured or guaranteed loans for which we expect to collect substantially all principal and interest are not reported as nonperforming loans held for sale,and continue to accrue interest. Purchased impaired loans accounted for underare excluded from nonperforming as we are currently accreting interest income over the fair value option and purchased impairedexpected life of the loans. See Note 6 Purchased Loans for further information.
See Note 1 Accounting Policies for additional delinquency, nonperforming, and charge-off information.
92 The PNC Financial Services Group, Inc. –Form 10-Q
The following tables display the delinquency status of our loans and our nonperforming assets at March 31,June 30, 2013 and December 31, 2012, respectively.
Table 65: Age Analysis of Past Due Accruing Loans (a)
| | | | Accruing | | | | | | | | | | | | Accruing | | | | | | | | | | |
| In millions | | Current or Less
Than 30 Days
Past Due | | 30-59 Days
Past Due | | 60-89 Days
Past Due | | 90 Days
Or More
Past Due | | | Total Past
Due (b) | | | Nonperforming
Loans | | | Fair Value
Option
Nonaccrual
Loans (c) | | | Purchased
Impaired | | | Total Loans | | | Current or Less Than 30 Days Past Due | | 30-59 Days
Past Due | | 60-89 Days
Past Due | | 90 Days
Or More
Past Due | | | Total Past
Due (b) | | | Nonperforming
Loans | | | Fair Value Option
Nonaccrual
Loans (c) | | | Purchased
Impaired | | | Total Loans | |
March 31, 2013 | | | | | | | | | | | | | | | | | | | | | | | | | |
June 30, 2013 | | | | | | | | | | | | | | | | | | | | | | | | | |
Commercial | | $ | 83,248 | | | $ | 163 | | | $ | 35 | | | $ | 27 | | | $ | 225 | | | $ | 542 | | | | | | $ | 270 | | | $ | 84,285 | | | $ | 86,009 | | | $ | 85 | | | $ | 53 | | | $ | 31 | | | $ | 169 | | | $ | 521 | | | | | | $ | 231 | | | $ | 86,930 | |
Commercial real estate | | | 17,076 | | | | 111 | | | | 36 | | | | 3 | | | | 150 | | | | 744 | | | | | | | 809 | | | | 18,779 | | | | 17,527 | | | | 66 | | | | 22 | | | | | | | 88 | | | | 639 | | | | | | | 737 | | | | 18,991 | |
Equipment lease financing | | | 7,196 | | | | 34 | | | | 1 | | | | | | | 35 | | | | 9 | | | | | | | | | | 7,240 | | | | 7,336 | | | | 2 | | | | 4 | | | | | | | 6 | | | | 7 | | | | | | | | | | 7,349 | |
Home equity (d) | | | 32,267 | | | | 86 | | | | 33 | | | | | | | 119 | | | | 1,088 | | | | | | | 2,556 | | | | 36,030 | | | | 32,707 | | | | 76 | | | | 29 | | | | | | | 105 | | | | 1,131 | | | | | | | 2,473 | | | | 36,416 | |
Residential real estate (d) (e) | | | 8,437 | | | | 259 | | | | 127 | | | | 1,517 | | | | 1,903 | | | | 965 | | | $ | 243 | | | | 3,437 | | | | 14,985 | | | | 8,464 | | | | 230 | | | | 108 | | | | 1,376 | | | | 1,714 | | | | 962 | | | $ | 301 | | | | 3,336 | | | | 14,777 | |
Credit card | | | 3,990 | | | | 30 | | | | 20 | | | | 35 | | | | 85 | | | | 6 | | | | | | | | | | 4,081 | | | | 4,052 | | | | 27 | | | | 19 | | | | 33 | | | | 79 | | | | 4 | | | | | | | | | | 4,135 | |
Other consumer (d) (f) | | | 20,399 | | | | 211 | | | | 101 | | | | 324 | | | | 636 | | | | 68 | | | | | | 1 | | | | 21,104 | | | | 20,483 | | | | 200 | | | | 114 | | | | 322 | | | | 636 | | | | 57 | | | | | | 1 | | | | 21,177 | |
Total | | $ | 172,613 | | | $ | 894 | | | $ | 353 | | | $ | 1,906 | | | $ | 3,153 | | | $ | 3,422 | | | $ | 243 | | | $ | 7,073 | | | $ | 186,504 | | | $ | 176,578 | | | $ | 686 | | | $ | 349 | | | $ | 1,762 | | | $ | 2,797 | | | $ | 3,321 | | | $ | 301 | | | $ | 6,778 | | | $ | 189,775 | |
Percentage of total loans | | | 92.56 | % | | | .48 | % | | | .19 | % | | | 1.02 | % | | | 1.69 | % | | | 1.83 | % | | | 0.13 | % | | | 3.79 | % | | | 100.00 | % | | | 93.05 | % | | | .36 | % | | | .18 | % | | | .93 | % | | | 1.47 | % | | | 1.75 | % | | | .16 | % | | | 3.57 | % | | | 100.00 | % |
December 31, 2012 | | | | | | | | | | | | | | | | | | | | | | | | | | | | | | | | | | | | | | | | | | | | | | | | |
Commercial | | $ | 81,930 | | | $ | 115 | | | $ | 55 | | | $ | 42 | | | $ | 212 | | | $ | 590 | | | | | | $ | 308 | | | $ | 83,040 | | | $ | 81,930 | | | $ | 115 | | | $ | 55 | | | $ | 42 | | | $ | 212 | | | $ | 590 | | | | | | $ | 308 | | | $ | 83,040 | |
Commercial real estate | | | 16,735 | | | | 100 | | | | 57 | | | | 15 | | | | 172 | | | | 807 | | | | | | | 941 | | | | 18,655 | | | | 16,735 | | | | 100 | | | | 57 | | | | 15 | | | | 172 | | | | 807 | | | | | | | 941 | | | | 18,655 | |
Equipment lease financing | | | 7,214 | | | | 17 | | | | 1 | | | | 2 | | | | 20 | | | | 13 | | | | | | | | | | 7,247 | | | | 7,214 | | | | 17 | | | | 1 | | | | 2 | | | | 20 | | | | 13 | | | | | | | | | | 7,247 | |
Home equity | | | 32,174 | | | | 117 | | | | 58 | | | | | | | 175 | | | | 951 | | | | | | | 2,620 | | | | 35,920 | | | | 32,174 | | | | 117 | | | | 58 | | | | | | | 175 | | | | 951 | | | | | | | 2,620 | | | | 35,920 | |
Residential real estate (e) | | | 8,464 | | | | 278 | | | | 146 | | | | 1,901 | | | | 2,325 | | | | 845 | | | $ | 70 | | | | 3,536 | | | | 15,240 | | | | 8,464 | | | | 278 | | | | 146 | | | | 1,901 | | | | 2,325 | | | | 845 | | | $ | 70 | | | | 3,536 | | | | 15,240 | |
Credit card | | | 4,205 | | | | 34 | | | | 23 | | | | 36 | | | | 93 | | | | 5 | | | | | | | | | | 4,303 | | | | 4,205 | | | | 34 | | | | 23 | | | | 36 | | | | 93 | | | | 5 | | | | | | | | | | 4,303 | |
Other consumer (f) | | | 20,663 | | | | 258 | | | | 131 | | | | 355 | | | | 744 | | | | 43 | | | | | | 1 | | | | 21,451 | | | | 20,663 | | | | 258 | | | | 131 | | | | 355 | | | | 744 | | | | 43 | | | | | | 1 | | | | 21,451 | |
Total | | $ | 171,385 | | | $ | 919 | | | $ | 471 | | | $ | 2,351 | | | $ | 3,741 | | | $ | 3,254 | | | $ | 70 | | | $ | 7,406 | | | $ | 185,856 | | | $ | 171,385 | | | $ | 919 | | | $ | 471 | | | $ | 2,351 | | | $ | 3,741 | | | $ | 3,254 | | | $ | 70 | | | $ | 7,406 | | | $ | 185,856 | |
Percentage of total loans | | | 92.21 | % | | | .49 | % | | | .25 | % | | | 1.26 | % | | | 2.00 | % | | | 1.75 | % | | | .04 | % | | | 3.99 | % | | | 100.00 | % | | | 92.21 | % | | | .49 | % | | | .25 | % | | | 1.26 | % | | | 2.00 | % | | | 1.75 | % | | | .05 | % | | | 3.99 | % | | | 100.00 | % |
| (a) | Amounts in table represent recorded investment and exclude loans held for sale. |
| (b) | Past due loan amounts exclude purchased impaired loans, even if contractually past due (or if we do not expect to receive payment in full based on the original contractual terms), as we are currently accreting interest income over the expected life of the loans. |
| (c) | Consumer loans accounted for under the fair value option which we do not expect to collect substantially all principal and interest are subject to nonaccrual accounting and classification upon meeting any of our nonaccrual policies. Given that these loans are not accounted for at amortized cost, these loans have been excluded from the nonperforming loan population. |
| (d) | Pursuant to alignment with interagency supervisory guidance on practices for loans and lines of credit related to consumer lending in the first quarter of 2013, accruing consumer loans past due 30 – 59 days decreased $44 million, accruing consumer loans past due 60 – 89 days decreased $36 million and accruing consumer loans past due 90 days or more decreased $315 million, of which $295 million related to Residential real estate government insured loans. As part of this alignment, these loans were moved into nonaccrual status. |
The PNC Financial Services Group, Inc. –Form 10-Q89
| (e) | Past due loan amounts at March 31,June 30, 2013, include government insured or guaranteed Residential real estate mortgages, totaling $.1 billion for 30 to 59 days past due, $.1 billion for 60 to 89 days past due and $1.5$1.3 billion for 90 days or more past due. Past due loan amounts at December 31, 2012, include government insured or guaranteed Residential real estate mortgages, totaling $.1 billion for 30 to 59 days past due, $.1 billion for 60 to 89 days past due and $1.9 billion for 90 days or more past due. |
| (f) | Past due loan amounts at March 31,June 30, 2013, include government insured or guaranteed Other consumer loans, totaling $.2$.1 billion for 30 to 59 days past due, $.1 billion for 60 to 89 days past due and $.3 billion for 90 days or more past due. Past due loan amounts at December 31, 2012, include government insured or guaranteed Other consumer loans, totaling $.2 billion for 30 to 59 days past due, $.1 billion for 60 to 89 days past due and $.3 billion for 90 days or more past due. |
The PNC Financial Services Group, Inc. –Form 10-Q93
Table 66: Nonperforming Assets
| | Dollars in millions | | March 31
2013 | | December 31
2012 | | | June 30
2013 | | December 31
2012 | |
Nonperforming loans | | | | | | | | | | |
Commercial lending | | | | | | | | | | |
Commercial | | $ | 542 | | | $ | 590 | | | $ | 521 | | | $ | 590 | |
Commercial real estate | | | 744 | | | | 807 | | | | 639 | | | | 807 | |
Equipment lease financing | | | 9 | | | | 13 | | | | 7 | | | | 13 | |
Total commercial lending | | | 1,295 | | | | 1,410 | | | | 1,167 | | | | 1,410 | |
Consumer lending (a) | | | | | | | | | | |
Home equity (b) | | | 1,088 | | | | 951 | | | | 1,131 | | | | 951 | |
Residential real estate (b) | | | 965 | | | | 845 | | | | 962 | | | | 845 | |
Credit card | | | 6 | | | | 5 | | | | 4 | | | | 5 | |
Other consumer (b) | | | 68 | | | | 43 | | | | 57 | | | | 43 | |
Total consumer lending | | | 2,127 | | | | 1,844 | | | | 2,154 | | | | 1,844 | |
Total nonperforming loans (c) | | | 3,422 | | | | 3,254 | | | | 3,321 | | | | 3,254 | |
OREO and foreclosed assets | | | | | | | | | | |
Other real estate owned (OREO) (d) | | | 472 | | | | 507 | | | | 432 | | | | 507 | |
Foreclosed and other assets | | | 33 | | | | 33 | | | | 25 | | | | 33 | |
Total OREO and foreclosed assets | | | 505 | | | | 540 | | | | 457 | | | | 540 | |
Total nonperforming assets | | $ | 3,927 | | | $ | 3,794 | | | $ | 3,778 | | | $ | 3,794 | |
Nonperforming loans to total loans | | | 1.83 | % | | | 1.75 | % | | | 1.75 | % | | | 1.75 | % |
Nonperforming assets to total loans, OREO and foreclosed assets | | | 2.10 | | | | 2.04 | | | | 1.99 | | | | 2.04 | |
Nonperforming assets to total assets | | | 1.31 | | | | 1.24 | | | | 1.24 | | | | 1.24 | |
| (a) | Excludes most consumer loans and lines of credit, not secured by residential real estate, which are charged off after 120 to 180 days past due and are not placed on nonperforming status. |
| (b) | Pursuant to alignment with interagency supervisory guidance on practices for loans and lines of credit related to consumer lending in the first quarter of 2013, nonperforming home equity loans increased $214 million, nonperforming residential mortgage loans increased $187 million and nonperforming other consumer loans increased $25 million. Charge-offs have been taken on these loans where the fair value less costs to sell the collateral was less than the recorded investment of the loan and were $134 million. |
| (c) | Nonperforming loans exclude certain government insured or guaranteed loans, loans held for sale, loans accounted for under the fair value option and purchased impaired loans. |
| (d) | OREO excludes $383$311 million and $380 million at March 31,June 30, 2013 and December 31, 2012, respectively, related to residential real estate that was acquired by us upon foreclosure of serviced loans because they are insured by the Federal Housing Administration (FHA) or guaranteed by the Department of Veterans Affairs (VA). |
Nonperforming loans also include certain loans whose terms have been restructured in a manner that grants a concession to a borrower experiencing financial difficulties. In accordance with applicable accounting guidance, these loans are considered TDRs. See Note 1 Accounting Policies and the TDR section of this Note 5 for additional information. For the threesix months ended March 31,June 30, 2013, $.7$1.7 billion of loans held for sale, loans accounted for under the fair value option, pooled purchased impaired loans, as well as certain consumer government insured or guaranteed loans which were evaluated for TDR consideration, are not classified as TDRs. The comparable amount for the threesix months ended March 31,June 30, 2012 was $.7$1.6 billion.
Total nonperforming loans in the nonperforming assets table above include TDRs of $1.5 billion at March 31,June 30, 2013 and $1.6 billion at December 31, 2012. TDRs returned to performing (accruing) status totaled $1.1 billion and $1.0 billion at March 31,June 30, 2013 and December 31, 2012, respectively, and are excluded from nonperforming loans. TheseGenerally, these loans have demonstrated a period of at least six months of consecutive performance under the restructured terms. Loans
where borrowers have been discharged from personal liability through Chapter 7 bankruptcy and have not formally reaffirmed their loan obligation to PNC are not returned to accrual status. At March 31,June 30, 2013 and December 31, 2012, remaining commitments to lend additional funds to debtors in a commercial or consumer TDR were immaterial.
Additional Asset Quality Indicators
We have two overall portfolio segments – Commercial Lending and Consumer Lending. Each of these two segments is comprised of multiple loan classes. Classes are characterized by similarities in initial measurement, risk attributes and the manner in which we monitor and assess credit risk. The commercial segment is comprised of the commercial, commercial real estate, equipment lease financing, and commercial purchased impaired loan classes. The consumer segment is comprised of the home equity, residential real estate, credit card, other consumer, and consumer purchased impaired loan classes. Asset quality indicators for each of these loan classes are discussed in more detail below.
9094 The PNC Financial Services Group, Inc. –Form 10-Q
COMMERCIAL LENDING ASSET CLASSES
Commercial Loan Class
For commercial loans, we monitor the performance of the borrower in a disciplined and regular manner based upon the level of credit risk inherent in the loan. To evaluate the level of credit risk, we assign an internal risk rating reflecting the borrower’s PD and LGD. This two-dimensional credit risk rating methodology provides risk granularity in the risk monitoring process on an ongoing basis. These ratings are reviewed and updated on a risk-adjusted basis, generally at least once per year. Additionally, on an annual basis, we update PD rates related to each rating grade based upon internal historical data, augmented by market data. For small balance homogenous pools of commercial loans, mortgages and leases, we apply statistical modeling to assist in determining the probability of default within these pools. Further, on a periodic basis, we update our LGD estimates associated with each rating grade based upon historical data. The combination of the PD and LGD ratings assigned to a commercial loan, capturing both the combination of expectations of default and loss severity in event of default, reflects the relative estimated likelihood of loss for that loan at the reporting date. In general, loans with better PD and LGD tend to have a lower likelihood of loss. Conversely,loss compared to loans with worse PD and LGD which tend to have a higher likelihood of loss. The loss amount also considers exposure at date of default, which we also periodically update based upon historical data.
Based upon the amount of the lending arrangement and our risk rating assessment, we follow a formal schedule of written periodic review. On a quarterly basis, we conduct formal reviews of a market’s or business unit’s entire loan portfolio, focusing on those loans which we perceive to be of higher risk, based upon PDs and LGDs, or weakeningloans for which credit quality.quality is weakening. If circumstances warrant, it is our practice to review any customer obligation and its level of credit risk more frequently. We attempt to proactively manage our loans by using various procedures that are customized to the risk of a given loan, including ongoing outreach, contact, and assessment of obligor financial conditions, collateral inspection and appraisal.
Commercial Real Estate Loan Class
We manage credit risk associated with our commercial real estate projects and commercial mortgage activities similar to commercial loans by analyzing PD and LGD. Additionally, risks connected with commercial real estate projects and commercial mortgage activities tend to be correlated to the loan structure and collateral location, project progress and business environment. As a result, these attributes are also monitored and utilized in assessing credit risk.
As with the commercial class, a formal schedule of periodic review is performed to also assess market/geographic risk and business unit/industry risk. Often as a result of these overviews, more in-depth reviews and increased scrutiny is placed on areas of higher risk, including adverse changes in risk ratings, deteriorating operating trends, and/or areas that concern management. The goal of theseThese reviews isare designed to assess risk and take actions to mitigate our exposure to such risks.
Equipment Lease Financing Loan Class
We manage credit risk associated with our equipment lease financing class similar to commercial loans by analyzing PD and LGD.
Based upon the dollar amount of the lease and of the level of credit risk, we follow a formal schedule of periodic review. Generally, this occurs on a quarterly basis, although we have established practices to review such credit risk more frequently if circumstances warrant. Our review process entails analysis of the following factors: equipment value/residual value, exposure levels, jurisdiction risk, industry risk, guarantor requirements, and regulatory compliance.
Commercial Purchased Impaired Loans Class
The credit impacts of purchased impaired loans are primarily determined through the estimation of expected cash flows. Commercial cash flow estimates are influenced by a number of credit related items, which include but are not limited to: estimated collateral value, receipt of additional collateral, secondary trading prices, circumstances of possible and/or ongoing liquidation, capital availability, business operations and payment patterns.
We attempt to proactively manage these factors by using various procedures that are customized to the risk of a given loan. These procedures include a review by our Special Asset Committee (SAC), ongoing outreach, contact, and assessment of obligor financial conditions, collateral inspection and appraisal.
See Note 6 Purchased Loans for additional information.
The PNC Financial Services Group, Inc. –Form 10-Q 9195
Table 67: Commercial Lending Asset Quality Indicators (a)
| | | | | | | Criticized Commercial Loans | | | | | | | | | Criticized Commercial Loans | | | | |
| In millions | | Pass
Rated (b) | | | Special
Mention (c) | | | Substandard (d) | | | Doubtful (e) | | | Total
Loans | | | Pass
Rated (b) | | | Special
Mention (c) | | | Substandard (d) | | | Doubtful (e) | | | Total Loans | |
March 31, 2013 | | | | | | | | | | | | |
June 30, 2013 | | | | | | | | | | | | |
Commercial | | $ | 79,662 | | | $ | 1,721 | | | $ | 2,513 | | | $ | 119 | | | $ | 84,015 | | | $ | 82,619 | | | $ | 1,607 | | | $ | 2,363 | | | $ | 110 | | | $ | 86,699 | |
Commercial real estate | | | 15,547 | | | | 627 | | | | 1,648 | | | | 148 | | | | 17,970 | | | | 16,344 | | | | 399 | | | | 1,382 | | | | 129 | | | | 18,254 | |
Equipment lease financing | | | 7,066 | | | | 85 | | | | 88 | | | | 1 | | | | 7,240 | | | | 7,169 | | | | 99 | | | | 79 | | | | 2 | | | | 7,349 | |
Purchased impaired loans | | | 14 | | | | 60 | | | | 850 | | | | 155 | | | | 1,079 | | | | 31 | | | | 42 | | | | 732 | | | | 163 | | | | 968 | |
Total commercial lending (f) | | $ | 102,289 | | | $ | 2,493 | | | $ | 5,099 | | | $ | 423 | | | $ | 110,304 | | |
Total commercial lending (f) (g) | | | $ | 106,163 | | | $ | 2,147 | | | $ | 4,556 | | | $ | 404 | | | $ | 113,270 | |
December 31, 2012 | | | | | | | | | | | | | | | | | | | | | | |
Commercial | | $ | 78,048 | | | $ | 1,939 | | | $ | 2,600 | | | $ | 145 | | | $ | 82,732 | | | $ | 78,048 | | | $ | 1,939 | | | $ | 2,600 | | | $ | 145 | | | $ | 82,732 | |
Commercial real estate | | | 14,898 | | | | 804 | | | | 1,802 | | | | 210 | | | | 17,714 | | | | 14,898 | | | | 804 | | | | 1,802 | | | | 210 | | | | 17,714 | |
Equipment lease financing | | | 7,062 | | | | 68 | | | | 112 | | | | 5 | | | | 7,247 | | | | 7,062 | | | | 68 | | | | 112 | | | | 5 | | | | 7,247 | |
Purchased impaired loans | | | 49 | | | | 60 | | | | 852 | | | | 288 | | | | 1,249 | | | | 49 | | | | 60 | | | | 852 | | | | 288 | | | | 1,249 | |
Total commercial lending (f) | | $ | 100,057 | | | $ | 2,871 | | | $ | 5,366 | | | $ | 648 | | | $ | 108,942 | | | $ | 100,057 | | | $ | 2,871 | | | $ | 5,366 | | | $ | 648 | | | $ | 108,942 | |
| (a) | Based upon PDs and LGDs. |
| (b) | Pass Rated loans include loans not classified as “Special Mention”, “Substandard”, or “Doubtful”. |
| (c) | Special Mention rated loans have a potential weakness that deserves management’s close attention. If left uncorrected, these potential weaknesses may result in deterioration of repayment prospects at some future date. These loans do not expose us to sufficient risk to warrant a more adverse classification at this time. |
| (d) | Substandard rated loans have a well-defined weakness or weaknesses that jeopardize the collection or liquidation of debt. They are characterized by the distinct possibility that we will sustain some loss if the deficiencies are not corrected. |
| (e) | Doubtful rated loans possess all the inherent weaknesses of a Substandard loan with the additional characteristics that the weakness makes collection or liquidation in full improbable due to existing facts, conditions, and values. |
| (f) | Loans are included above based on their contractual terms as “Pass”, “Special Mention”, “Substandard” or “Doubtful”. |
| (g) | We began to refine our process for categorizing commercial loans in the second quarter of 2013 in order to apply a split rating classification to certain loans meeting threshold criteria. By assigning split classifications, a loan’s exposure amount may be split into more than one classification category in the above table. This refinement is expected to be completed by the fourth quarter of 2013. |
CONSUMER LENDING ASSET CLASSES
Home Equity and Residential Real Estate Loan ClassesHOME EQUITYAND RESIDENTIAL REAL ESTATE LOAN CLASSES
We use several credit quality indicators, including delinquency information, nonperforming loan information, updated credit scores, originated and updated LTV ratios, and geography, to monitor and manage credit risk within the home equity and residential real estate loan classes. We evaluate mortgage loan performance by source originators and loan servicers. A summary of asset quality indicators follows:
Delinquency/Delinquency Rates: We monitor trending of delinquency/delinquency rates for home equity and residential real estate loans. See the Asset Quality section of this Note 5 for additional information.
Nonperforming Loans: We monitor trending of nonperforming loans for home equity and residential real estate loans. See the Asset Quality section of this Note 5 for additional information.
Credit Scores: We use a national third-party provider to update FICO credit scores for home equity loans and lines of credit and residential real estate loans on at least a quarterly basis. The updated scores are incorporated into a series of credit management reports, which are utilized to monitor the risk in the loan classes.
LTV (inclusive of combined loan-to-value (CLTV) for first and subordinate lien positions): At least semi-annually, we update the property values of real estate collateral and
calculate an updated LTV ratio. For open-end credit lines secured by real estate in regions experiencing significant declines in property values, more frequent valuations may occur. We examine LTV migration and stratify LTV into categories to monitor the risk in the loan classes.
Historically, we used, and we continue to use, a combination of original LTV and updated LTV for internal risk management reporting and risk management purposes (e.g., line management, loss mitigation strategies). In addition to the fact that estimated property values by their nature are estimates, given certain data limitations it is important to note that updated LTVs may be based upon management’s assumptions (e.g., if an updated LTV is not provided by the third-party service provider, home price index (HPI) changes will be incorporated in arriving at management’s estimate of updated LTV).
Geography: Geographic concentrations are monitored to evaluate and manage exposures. Loan purchase programs are sensitive to, and focused within, certain regions to manage geographic exposures and associated risks.
96 The PNC Financial Services Group, Inc. –Form 10-Q
A combination of updated FICO scores, originated and updated LTV ratios and geographic location assigned to home equity loans and lines of credit and residential real estate loans areis used to monitor the risk in the loan classes. Loans with higher FICO scores and lower LTVs tend to have a lower level of risk. Conversely, loans with lower FICO scores, higher LTVs, and in certain geographic locations tend to have a higher level of risk.
92 The PNC Financial Services Group, Inc. –Form 10-Q
In the first quarter of 2013, we refined our process for the ConsumerHome Equity and Residential Real Estate Secured Asset Quality Indicators shown in the following tables. These refinements include, but are not limited to, improvements in the process for determining lien position and LTV in both Table 69: ConsumerHome Equity and Residential Real Estate Secured Asset Quality Indicators – Excluding Purchased Impaired Loans and Table 70: ConsumerHome Equity and Residential Real Estate Secured Asset Quality Indicators – Purchased Impaired Loans. Additionally, we are now presenting Table 69 at recorded investment as opposed to our prior presentation of outstanding balance. Table 70 continues to be presented at outstanding balance. Both the 2013 and
2012 period end balance disclosures are presented in the below tables using this refined process.
Table 68: Home Equity and Residential Real Estate Balances
| | In millions | | March 31
2013 | | | December 31
2012 | | | June 30
2013 | | | December 31
2012 | |
Home equity and residential real estate loans – excluding purchased impaired loans (a) | | $ | 42,843 | | | $ | 42,725 | | | $ | 43,372 | | | $ | 42,725 | |
Home equity and residential real estate loans – purchased impaired loans (b) | | | 6,358 | | | | 6,638 | | | | 6,094 | | | | 6,638 | |
Government insured or guaranteed residential real estate mortgages (a) | | | 2,179 | | | | 2,279 | | | | 2,012 | | | | 2,279 | |
Purchase accounting adjustments – purchased impaired loans | | | (365 | ) | | | (482 | ) | | | (285 | ) | | | (482 | ) |
Total home equity and residential real estate loans (a) | | $ | 51,015 | | | $ | 51,160 | | | $ | 51,193 | | | $ | 51,160 | |
| (a) | Represents recorded investment. |
| (b) | Represents outstanding balance. |
Table 69: ConsumerHome Equity and Residential Real Estate Secured Asset Quality Indicators – Excluding Purchased Impaired Loans (a) (b)
| | | | Home Equity | | | Residential Real Estate | | | | | | Home Equity | | | Residential Real Estate | | | | |
| March 31, 2013 – in millions | | 1st Liens | | | 2nd Liens | | | | | | Total | | |
| June 30, 2013 – in millions | | | 1st Liens | | | 2nd Liens | | | | | | Total | |
Current estimated LTV ratios (c) (d) | | | | | | | | | | | | | | | | | | | | | | |
Greater than or equal to 125% and updated FICO scores: | | | | | | | | | | | | | | | | | | | | | | |
Greater than 660 | | $ | 452 | | | $ | 2,668 | | | $ | 631 | | | $ | 3,751 | | | $ | 455 | | | $ | 2,446 | | | $ | 778 | | | $ | 3,679 | |
Less than or equal to 660 (e) (f) | | | 76 | | | | 551 | | | | 183 | | | | 810 | | | | 74 | | | | 492 | | | | 245 | | | | 811 | |
Missing FICO | | | 1 | | | | 10 | | | | 21 | | | | 32 | | | | 1 | | | | 10 | | | | 26 | | | | 37 | |
| | | |
Greater than or equal to 100% to less than 125% and updated FICO scores: | | | | | | | | | | | | | | | | | | | | | | |
Greater than 660 | | | 966 | | | | 3,498 | | | | 1,112 | | | | 5,576 | | | | 1,057 | | | | 3,308 | | | | 1,212 | | | | 5,577 | |
Less than or equal to 660 (e) (f) | | | 161 | | | | 605 | | | | 218 | | | | 984 | | | | 162 | | | | 560 | | | | 244 | | | | 966 | |
Missing FICO | | | 2 | | | | 7 | | | | 26 | | | | 35 | | | | 2 | | | | 6 | | | | 34 | | | | 42 | |
| | | |
Greater than or equal to 90% to less than 100% and updated FICO scores: | | | | | | | | | | | | | | | | | | | | | | |
Greater than 660 | | | 966 | | | | 2,165 | | | | 818 | | | | 3,949 | | | | 1,076 | | | | 2,095 | | | | 838 | | | | 4,009 | |
Less than or equal to 660 | | | 131 | | | | 328 | | | | 140 | | | | 599 | | | | 137 | | | | 308 | | | | 148 | | | | 593 | |
Missing FICO | | | 2 | | | | 4 | | | | 20 | | | | 26 | | | | 2 | | | | 5 | | | | 25 | | | | 32 | |
| | | |
Less than 90% and updated FICO scores: | | | | | | | | | | | | | | | | | | | | | | |
Greater than 660 | | | 11,590 | | | | 7,028 | | | | 5,276 | | | | 23,894 | | | | 12,360 | | | | 7,151 | | | | 4,994 | | | | 24,505 | |
Less than or equal to 660 | | | 1,280 | | | | 945 | | | | 706 | | | | 2,931 | | | | 1,256 | | | | 942 | | | | 637 | | | | 2,835 | |
Missing FICO | | | 24 | | | | 14 | | | | 205 | | | | 243 | | | | 24 | | | | 14 | | | | 248 | | | | 286 | |
Missing LTV and updated FICO scores: | | | | | | | | | | | | |
Greater than 660 | | | | | | | | 3 | | | | 3 | | |
Less than or equal to 660 | | | | | | | | | | | – | | |
Missing FICO | | | | | | | | 10 | | | | 10 | | |
Total home equity and residential real estate loans | | $ | 15,651 | | | $ | 17,823 | | | $ | 9,369 | | | $ | 42,843 | | | $ | 16,606 | | | $ | 17,337 | | | $ | 9,429 | | | $ | 43,372 | |
The PNC Financial Services Group, Inc. –Form 10-Q 9397
| | | | Home Equity | | | Residential Real Estate | | | | | | Home Equity | | | Residential Real Estate | | | | |
| December 31, 2012 – in millions | | 1st Liens | | | 2nd Liens | | | | | | Total | | | 1st Liens | | | 2nd Liens | | | | | | Total | |
Current estimated LTV ratios (c) | | | | | | | | | | | | | | | | | | | | | | |
Greater than or equal to 125% and updated FICO scores: | | | | | | | | | | | | | | | | | | | | | | |
Greater than 660 | | $ | 454 | | | $ | 2,788 | | | $ | 477 | | | $ | 3,719 | | | $ | 470 | | | $ | 2,772 | | | $ | 667 | | | $ | 3,909 | |
Less than or equal to 660 (d) (e) | | | 74 | | | | 596 | | | | 167 | | | | 837 | | | | 84 | | | | 589 | | | | 211 | | | | 884 | |
Missing FICO | | | 1 | | | | 10 | | | | 17 | | | | 28 | | | | 1 | | | | 10 | | | | 19 | | | | 30 | |
| | | |
Greater than or equal to 100% to less than 125% and updated FICO scores: | | | | | | | | | | | | | | | | | | | | | | |
Greater than 660 | | | 971 | | | | 3,652 | | | | 908 | | | | 5,531 | | | | 1,027 | | | | 3,636 | | | | 1,290 | | | | 5,953 | |
Less than or equal to 660 (d) (e) | | | 150 | | | | 644 | | | | 216 | | | | 1,010 | | | | 159 | | | | 641 | | | | 253 | | | | 1,053 | |
Missing FICO | | | 2 | | | | 6 | | | | 37 | | | | 45 | | | | 3 | | | | 6 | | | | 45 | | | | 54 | |
| | | |
Greater than or equal to 90% to less than 100% and updated FICO scores: | | | | | | | | | | | | | | | | | | | | | | |
Greater than 660 | | | 1,002 | | | | 2,247 | | | | 1,162 | | | | 4,411 | | | | 1,056 | | | | 2,229 | | | | 1,120 | | | | 4,405 | |
Less than or equal to 660 | | | 127 | | | | 321 | | | | 170 | | | | 618 | | | | 130 | | | | 319 | | | | 164 | | | | 613 | |
Missing FICO | | | 1 | | | | 5 | | | | 26 | | | | 32 | | | | 1 | | | | 5 | | | | 23 | | | | 29 | |
| | | |
Less than 90% and updated FICO scores: | | | | | | | | | | | | | | | | | | | | | | |
Greater than 660 | | | 10,852 | | | | 7,212 | | | | 5,257 | | | | 23,321 | | | | 10,736 | | | | 7,255 | | | | 4,701 | | | | 22,692 | |
Less than or equal to 660 | | | 1,233 | | | | 915 | | | | 727 | | | | 2,875 | | | | 1,214 | | | | 921 | | | | 621 | | | | 2,756 | |
Missing FICO | | | 23 | | | | 14 | | | | 240 | | | | 277 | | | | 23 | | | | 13 | | | | 269 | | | | 305 | |
| | | |
Missing LTV and updated FICO scores: | | | | | | | | | | | | | | | | | | | | | | |
Greater than 660 | | | | | | | | 1 | | | | 1 | | |
Less than or equal to 660 | | | | | | | | | | | – | | |
Missing FICO | | | | | | | | 20 | | | | 20 | | | | | | | | | 42 | | | | 42 | |
Total home equity and residential real estate loans | | $ | 14,890 | | | $ | 18,410 | | | $ | 9,425 | | | $ | 42,725 | | | $ | 14,904 | | | $ | 18,396 | | | $ | 9,425 | | | $ | 42,725 | |
| (a) | Excludes purchased impaired loans of approximately $6.0$5.8 billion and $6.2 billion in recorded investment, certain government insured or guaranteed residential real estate mortgages of approximately $2.2$2.0 billion and $2.3 billion, and loans held for sale at March 31,June 30, 2013 and December 31, 2012, respectively. See the ConsumerHome Equity and Residential Real Estate Secured Asset Quality Indicators – Purchased Impaired Loans table below for additional information on purchased impaired loans. |
| (b) | Amounts shown represent recorded investment. |
| (c) | Based upon updated LTV (inclusive of combined loan-to-value (CLTV) for first and subordinate lien positions). Updated LTV are estimated using modeled property values. These ratios are updated at least semi-annually. The related estimates and inputs are based upon an approach that uses a combination of third-party automated valuation models (AVMs), HPI indices, property location, internal and external balance information, origination data and management assumptions. In cases where we are in an originated second lien position, we generally utilize origination balances provided by a third-party which do not include an amortization assumption when calculating updated LTV. Accordingly, the results of these calculations do not represent actual appraised loan level collateral or updated LTV based upon a current first lien balance, and as such, are necessarily imprecise and subject to change as we enhance our methodology. In the second quarter of 2013, we enhanced our CLTV determination process by further refining the data and correcting certain methodological inconsistencies. As a result, the amounts in the December 31, 2012 table above have been updated. |
| (d) | Higher risk loans are defined as loans with both an updated FICO score of less than or equal to 660 and an updated LTV greater than or equal to 100%. |
| (e) | The following states have the highest percentage of higher risk loans at March 31,June 30, 2013: Ohio 14%, New Jersey 13%, Illinois 11%12%, Pennsylvania 11%, Ohio 10%, Florida 9%, California 6%, Michigan 6%, and Maryland 5%, and California 4%6%. The remainder of the states have lower than 4% of the high risk loans individually, and collectively they represent approximately 27% of the higher risk loans. The following states had the highest percentage of higher risk loans at December 31, 2012: New Jersey 14%, Ohio 12%Illinois 11%, Pennsylvania 11%, Illinois 11%Ohio 10%, Florida 9%, MichiganCalifornia 6%, Maryland 6%, and CaliforniaMichigan 5%. The remainder of the states have lower than 4% of the high risk loans individually, and collectively they represent approximately 26%28% of the higher risk loans. |
9498 The PNC Financial Services Group, Inc. –Form 10-Q
Table 70: ConsumerHome Equity and Residential Real Estate Secured Asset Quality Indicators – Purchased Impaired Loans (a)
| | | | Home Equity (b) (c) | | | Residential Real Estate (b) (c) | | | | | | Home Equity (b) (c) | | | Residential Real Estate (b) (c) | | | | |
| March 31, 2013 – in millions | | 1st Liens | | | 2nd Liens | | | | | | Total | | |
Current estimated LTV ratios (d) (e) | | | | | | | | | | | | |
| June 30, 2013 – in millions | | | 1st Liens | | | 2nd Liens | | | | | | Total | |
Current estimated LTV ratios (d) | | | | | | | | | | | | |
Greater than or equal to 125% and updated FICO scores: | | | | | | | | | | | | | | | | | | | | | | |
Greater than 660 | | $ | 16 | | | $ | 748 | | | $ | 465 | | | $ | 1,229 | | | $ | 15 | | | $ | 673 | | | $ | 488 | | | $ | 1,176 | |
Less than or equal to 660 | | | 16 | | | | 364 | | | | 344 | | | | 724 | | | | 16 | | | | 316 | | | | 391 | | | | 723 | |
Missing FICO | | | | | 21 | | | | 35 | | | | 56 | | | | | | 17 | | | | 31 | | | | 48 | |
| | | |
Greater than or equal to 100% to less than 125% and updated FICO scores: | | | | | | | | | | | | | | | | | | | | | | |
Greater than 660 | | | 25 | | | | 544 | | | | 418 | | | | 987 | | | | 23 | | | | 550 | | | | 390 | | | | 963 | |
Less than or equal to 660 | | | 19 | | | | 257 | | | | 311 | | | | 587 | | | | 18 | | | | 246 | | | | 323 | | | | 587 | |
Missing FICO | | | | | 16 | | | | 22 | | | | 38 | | | | 1 | | | | 16 | | | | 18 | | | | 35 | |
| | | |
Greater than or equal to 90% to less than 100% and updated FICO scores: | | | | | | | | | | | | | | | | | | | | | | |
Greater than 660 | | | 14 | | | | 136 | | | | 203 | | | | 353 | | | | 12 | | | | 145 | | | | 217 | | | | 374 | |
Less than or equal to 660 | | | 12 | | | | 93 | | | | 186 | | | | 291 | | | | 13 | | | | 89 | | | | 162 | | | | 264 | |
Missing FICO | | | | | 6 | | | | 13 | | | | 19 | | | | | | 7 | | | | 11 | | | | 18 | |
| | | |
Less than 90% and updated FICO scores: | | | | | | | | | | | | | | | | | | | | | | |
Greater than 660 | | | 89 | | | | 178 | | | | 681 | | | | 948 | | | | 92 | | | | 189 | | | | 626 | | | | 907 | |
Less than or equal to 660 | | | 140 | | | | 166 | | | | 718 | | | | 1,024 | | | | 135 | | | | 169 | | | | 599 | | | | 903 | |
Missing FICO | | | 2 | | | | 7 | | | | 42 | | | | 51 | | | | 1 | | | | 8 | | | | 38 | | | | 47 | |
| | | |
Missing LTV and updated FICO scores: | | | | | | | | | | | | | | | | | | | | | | |
Greater than 660 | | | | | | | | 16 | | | | 16 | | | | 2 | | | | | | | 19 | | | | 21 | |
Less than or equal to 660 | | | | | | | | 11 | | | | 11 | | | | 1 | | | | | | | 17 | | | | 18 | |
Missing FICO | | | | | | | | 24 | | | | 24 | | | | | | 3 | | | | 7 | | | | 10 | |
Total home equity and residential real estate loans | | $ | 333 | | | $ | 2,536 | | | $ | 3,489 | | | $ | 6,358 | | | $ | 329 | | | $ | 2,428 | | | $ | 3,337 | | | $ | 6,094 | |
The PNC Financial Services Group, Inc. –Form 10-Q 9599
| | | | Home Equity (b) (c) | | | Residential Real Estate (b) (c) | | | | | | Home Equity (b) (c) | | | Residential Real Estate (b) (c) | | | | |
| December 31, 2012 – in millions | | 1st Liens | | | 2nd Liens | | | | | | Total | | | 1st Liens | | | 2nd Liens | | | | | | Total | |
Current estimated LTV ratios (d) | | | | | | | | | | | | | | | | | | | | | | |
Greater than or equal to 125% and updated FICO scores: | | | | | | | | | | | | | | | | | | | | | | |
Greater than 660 | | $ | 17 | | | $ | 796 | | | $ | 511 | | | $ | 1,324 | | | $ | 17 | | | $ | 791 | | | $ | 597 | | | $ | 1,405 | |
Less than or equal to 660 | | | 15 | | | | 408 | | | | 386 | | | | 809 | | | | 17 | | | | 405 | | | | 498 | | | | 920 | |
Missing FICO | | | | | 23 | | | | 45 | | | | 68 | | | | | | 23 | | | | 46 | | | | 69 | |
| | | |
Greater than or equal to 100% to less than 125% and updated FICO scores: | | | | | | | | | | | | | | | | | | | | | | |
Greater than 660 | | | 26 | | | | 551 | | | | 437 | | | | 1,014 | | | | 26 | | | | 552 | | | | 435 | | | | 1,013 | |
Less than or equal to 660 | | | 20 | | | | 268 | | | | 343 | | | | 631 | | | | 20 | | | | 269 | | | | 383 | | | | 672 | |
Missing FICO | | | | | 18 | | | | 22 | | | | 40 | | | | | | 18 | | | | 23 | | | | 41 | |
| | | |
Greater than or equal to 90% to less than 100% and updated FICO scores: | | | | | | | | | | | | | | | | | | | | | | |
Greater than 660 | | | 14 | | | | 140 | | | | 222 | | | | 376 | | | | 14 | | | | 140 | | | | 216 | | | | 370 | |
Less than or equal to 660 | | | 14 | | | | 99 | | | | 199 | | | | 312 | | | | 14 | | | | 99 | | | | 182 | | | | 295 | |
Missing FICO | | | | | 6 | | | | 10 | | | | 16 | | | | | | 7 | | | | 11 | | | | 18 | |
| | | |
Less than 90% and updated FICO scores: | | | | | | | | | | | | | | | | | | | | | | |
Greater than 660 | | | 87 | | | | 171 | | | | 668 | | | | 926 | | | | 86 | | | | 174 | | | | 589 | | | | 849 | |
Less than or equal to 660 | | | 143 | | | | 161 | | | | 732 | | | | 1,036 | | | | 142 | | | | 163 | | | | 598 | | | | 903 | |
Missing FICO | | | 2 | | | | 8 | | | | 41 | | | | 51 | | | | 2 | | | | 8 | | | | 39 | | | | 49 | |
| | | |
Missing LTV and updated FICO scores: | | | | | | | | | | | | | | | | | | | | | | |
Greater than 660 | | | | | | | | 18 | | | | 18 | | | | | | | | | 18 | | | | 18 | |
Less than or equal to 660 | | | | | | | | 7 | | | | 7 | | | | | | | | | 7 | �� | | | 7 | |
Missing FICO | | | | | | | | 10 | | | | 10 | | | | | | | | | 9 | | | | 9 | |
Total home equity and residential real estate loans | | $ | 338 | | | $ | 2,649 | | | $ | 3,651 | | | $ | 6,638 | | | $ | 338 | | | $ | 2,649 | | | $ | 3,651 | | | $ | 6,638 | |
| (a) | Amounts shown represent outstanding balance. See Note 6 Purchased Loans for additional information. |
| (b) | For the estimate of cash flows utilized in our purchased impaired loan accounting, other assumptions and estimates are made, including amortization of first lien balances, pre-payment rates, etc., which are not reflected in this table. |
| (c) | The following states have the highest percentage of loans at March 31,June 30, 2013: California 19%18%, Florida 16%15%, Illinois 12%11%, Ohio 7%, MichiganNorth Carolina 6%, North CarolinaMichigan 5%, and New YorkGeorgia 4%, respectively. The remainder of the states have lower than a 4% concentration of purchased impaired loans individually, and collectively they represent approximately 31%34% of the purchased impaired portfolio. The following states have the highest percentage of loans at December 31, 2012: California 19%18%, Florida 16%15%, Illinois 12%, Ohio 7%, North Carolina 5%,6% and Michigan 5%, New York 4% and Georgia 4%. The remainder of the states have lower than a 4% concentration of purchased impaired loans individually, and collectively they represent approximately 28%37% of the purchased impaired portfolio. |
| (d) | Based upon updated LTV (inclusive of combined loan-to-value (CLTV) for first and subordinate lien positions). Updated LTV are estimated using modeled property values. These ratios are updated at least semi-annually. The related estimates and inputs are based upon an approach that uses a combination of third-party automated valuation models (AVMs), HPI indices, property location, internal and external balance information, origination data and management assumptions. In cases where we are in an originated second lien position, we generally utilize origination balances provided by a third-party which do not include an amortization assumption when calculating updated LTV. Accordingly, the results of these calculations do not represent actual appraised loan level collateral or updated LTV based upon a current first lien balance, and as such, are necessarily imprecise and subject to change as we enhance our methodology. In the second quarter of 2013, we enhanced our CLTV determination process by further refining the data and correcting certain methodological inconsistencies. As a result, the amounts in the December 31, 2012 table above have been updated. |
Credit Card and Other Consumer Loan ClassesCREDIT CARDAND OTHER CONSUMER LOAN CLASSES
We monitor a variety of asset quality information in the management of the credit card and other consumer loan classes. Other consumer loan classes include education, automobile, and other secured and unsecured lines and loans. Along with the trending of delinquencies and losses for each class, FICO credit score updates are generally obtained on a monthly basis, as well as a variety of credit bureau attributes. Loans with high FICO scores tend to have a lower likelihood of loss. Conversely, loans with low FICO scores tend to have a higher likelihood of loss.
100 The PNC Financial Services Group, Inc. –Form 10-Q
Consumer Purchased Impaired Loans ClassCONSUMER PURCHASED IMPAIRED LOANS CLASS
Estimates of the expected cash flows primarily determine the credit impacts of consumer purchased impaired loans. Consumer cash flow estimates are influenced by a number of credit related items, which include, but are not limited to: estimated real estate values, payment patterns, updated FICO scores, the current economic environment, updated LTV ratios and the date of origination. These key factors are monitored to help ensure that concentrations of risk are mitigated and cash flows are maximized.
See Note 6 Purchased Loans for additional information.
96 The PNC Financial Services Group, Inc. –Form 10-Q
Table 71: Credit Card and Other Consumer Loan Classes Asset Quality Indicators
| | | | Credit Card (a) | | | Other Consumer (b) | | | Credit Card (a) | | | Other Consumer (b) | |
| Dollars in millions | | Amount | | | % of Total Loans
Using FICO
Credit Metric | | | Amount | | | % of Total Loans
Using FICO
Credit Metric | | | Amount | | | % of Total Loans
Using FICO
Credit Metric | | | Amount | | | % of Total Loans
Using FICO
Credit Metric | |
March 31, 2013 | | | | | | | | | | | |
June 30, 2013 | | | | | | | | | | | |
FICO score greater than 719 | | $ | 2,106 | | | | 52 | % | | $ | 7,420 | | | | 62 | % | | $ | 2,178 | | | | 53 | % | | $ | 7,709 | | | | 63 | % |
650 to 719 | | | 1,147 | | | | 28 | | | | 3,146 | | | | 26 | | | | 1,153 | | | | 28 | | | | 3,225 | | | | 25 | |
620 to 649 | | | 186 | | | | 5 | | | | 478 | | | | 4 | | | | 180 | | | | 4 | | | | 467 | | | | 4 | |
Less than 620 | | | 257 | | | | 6 | | | | 575 | | | | 5 | | | | 240 | | | | 6 | | | | 554 | | | | 5 | |
No FICO score available or required (c) | | | 385 | | | | 9 | | | | 326 | | | | 3 | | | | 384 | | | | 9 | | | | 351 | | | | 3 | |
Total loans using FICO credit metric | | | 4,081 | | | | 100 | % | | | 11,945 | | | | 100 | % | | | 4,135 | | | | 100 | % | | | 12,306 | | | | 100 | % |
Consumer loans using other internal credit metrics (b) | | | | | | | | 9,159 | | | | | | | | | | | | 8,871 | | | | |
Total loan balance | | $ | 4,081 | | | | | | $ | 21,104 | | | | | | $ | 4,135 | | | | | | $ | 21,177 | | | | |
Weighted-average updated FICO score (d) | | | | | 725 | | | | | | 739 | | | | | | 727 | | | | | | 741 | |
December 31, 2012 | | | | | | | | | | | | | | | | | | | | |
FICO score greater than 719 | | $ | 2,247 | | | | 52 | % | | $ | 7,006 | | | | 60 | % | | $ | 2,247 | | | | 52 | % | | $ | 7,006 | | | | 60 | % |
650 to 719 | | | 1,169 | | | | 27 | | | | 2,896 | | | | 25 | | | | 1,169 | | | | 27 | | | | 2,896 | | | | 25 | |
620 to 649 | | | 188 | | | | 5 | | | | 459 | | | | 4 | | | | 188 | | | | 5 | | | | 459 | | | | 4 | |
Less than 620 | | | 271 | | | | 6 | | | | 602 | | | | 5 | | | | 271 | | | | 6 | | | | 602 | | | | 5 | |
No FICO score available or required (c) | | | 428 | | | | 10 | | | | 741 | | | | 6 | | | | 428 | | | | 10 | | | | 741 | | | | 6 | |
Total loans using FICO credit metric | | | 4,303 | | | | 100 | % | | | 11,704 | | | | 100 | % | | | 4,303 | | | | 100 | % | | | 11,704 | | | | 100 | % |
Consumer loans using other internal credit metrics (b) | | | | | | | | 9,747 | | | | | | | | | | | | 9,747 | | | | |
Total loan balance | | $ | 4,303 | | | | | | $ | 21,451 | | | | | | $ | 4,303 | | | | | | $ | 21,451 | | | | |
Weighted-average updated FICO score (d) | | | | | 726 | | | | | | 739 | | | | | | 726 | | | | | | 739 | |
| (a) | At March 31,June 30, 2013, we had $35$33 million of credit card loans that are higher risk (i.e., loans with both updated FICO scores less than 660 and in late stage (90+ days) delinquency status). The majority of the March 31,June 30, 2013 balance related to higher risk credit card loans is geographically distributed throughout the following areas: Ohio 19%, Pennsylvania 15%, Michigan 12%, Illinois 7%, Indiana 6%, Florida 5%, New Jersey 5%, and Kentucky 4%, and North Carolina 4%5%. All other states none of which comprise morehave less than 3%,4% individually and make up the remainder of the balance. At December 31, 2012, we had $36 million of credit card loans that are higher risk. The majority of the December 31, 2012 balance related to higher risk credit card loans is geographically distributed throughout the following areas: Ohio 18%, Pennsylvania 14%, Michigan 12%, Illinois 8%, Indiana 6%, Florida 6%, New Jersey 5%, Kentucky 4% and North Carolina 4%. All other states none of which comprise morehave less than 3%, individually and make up the remainder of the balance. |
| (b) | Other consumer loans for which updated FICO scores are used as an asset quality indicator include non-government guaranteed or insured education loans, automobile loans and other secured and unsecured lines and loans. Other consumer loans for which other internal credit metrics are used as an asset quality indicator include primarily government guaranteed or insured education loans, as well as consumer loans to high net worth individuals. Other internal credit metrics may include delinquency status, geography or other factors. |
| (c) | Credit card loans and other consumer loans with no FICO score available or required refers to new accounts issued to borrowers with limited credit history, accounts for which we cannot obtain an updated FICO (e.g., recent profile changes), cards issued with a business name, and/or cards secured by collateral. Management proactively assesses the risk and size of this loan portfolio and, when necessary, takes actions to mitigate the credit risk. |
| (d) | Weighted-average updated FICO score excludes accounts with no FICO score available or required. |
The PNC Financial Services Group, Inc. –Form 10-Q101
TROUBLED DEBT RESTRUCTURINGS (TDRS)
A TDR is a loan whose terms have been restructured in a manner that grants a concession to a borrower experiencing financial difficulties. TDRs typically result from bankruptcy dischargesborrowers that have been discharged from personal liability as well asthrough Chapter 7 bankruptcy and have not formally reaffirmed their loan obligations to PNC. Additionally, TDRs result from our loss mitigation activities, and include rate reductions, principal forgiveness, postponement/reduction of scheduled amortization, and extensions, which are intended to minimize economic loss and to avoid foreclosure or repossession of collateral. In those situations where principal is forgiven, the amount of such principal forgiveness is immediately charged off.
Some TDRs may not ultimately result in the full collection of principal and interest, as restructured, and result in potential incremental losses. These potential incremental losses have been factored into our overall ALLL estimate. The level of any subsequent defaults will likely be affected by future economic conditions. Once a loan becomes a TDR, it will continue to be reported as a TDR until it is ultimately repaid in full, the collateral is foreclosed upon, or it is fully charged off. We held specific reserves in the ALLL of $.5 billion and $.6 billion at March 31,June 30, 2013 and December 31, 2012, respectively, for the total TDR portfolio.
The PNC Financial Services Group, Inc. –Form 10-Q97
Table 72: Summary of Troubled Debt Restructurings
| | In millions | | Mar. 31
2013 | | | Dec. 31
2012 | | | June 30
2013 | | | Dec. 31
2012 | |
Total consumer lending | | $ | 2,231 | | | $ | 2,318 | | | $ | 2,243 | | | $ | 2,318 | |
Total commercial lending | | | 610 | | | | 541 | | | | 599 | | | | 541 | |
Total TDRs | | $ | 2,841 | | | $ | 2,859 | | | $ | 2,842 | | | $ | 2,859 | |
Nonperforming | | $ | 1,517 | | | $ | 1,589 | | | $ | 1,531 | | | $ | 1,589 | |
Accruing (a) | | | 1,103 | | | | 1,037 | | | | 1,103 | | | | 1,037 | |
Credit card (b) | | | 221 | | | | 233 | | | | 208 | | | | 233 | |
Total TDRs | | $ | 2,841 | | | $ | 2,859 | | | $ | 2,842 | | | $ | 2,859 | |
| (a) | Accruing loans have demonstrated a period of at least six months of performance under the restructured terms and are excluded from nonperforming loans. Loans where borrowers have been discharged from personal liability through Chapter 7 bankruptcy and have not formally reaffirmed their loan obligation to PNC are not returned to accrual status. |
| (b) | Includes credit cards and certain small business and consumer credit agreements whose terms have been restructured and are TDRs. However, since our policy is to exempt these loans from being placed on nonaccrual status as permitted by regulatory guidance as generally these loans are directly charged off in the period that they become 180 days past due, these loans are excluded from nonperforming loans. |
Table 73: Financial Impact and TDRs by Concession Type quantifies the number of loans that were classified as TDRs as well as the change in the recorded investments as a result of the TDR classification during the three and six months ended March 31,June 30, 2013 and 2012. Additionally, the table provides information about the types of TDR concessions. The Principal Forgiveness TDR category includes principal forgiveness and accrued interest forgiveness. These types of TDRs result in a write down of the recorded investment and a charge-off if such action has not already taken place. The Rate
Reduction TDR category includes reduced interest rate and interest deferral. The TDRs within this category would result in reductions to future interest income. The Other TDR category primarily includes consumer borrowers that have been discharged from personal liability through Chapter 7 bankruptcy and have not formally reaffirmed their loan obligation to PNC, as well as postponement/reduction of scheduled amortization and contractual extensions for both consumer and commercial borrowers.
In some cases, there have been multiple concessions granted on one loan. This is most common within the commercial loan portfolio. When there have been multiple concessions granted in the commercial loan portfolio, the principal forgiveness TDR was prioritized for purposes of determining the inclusion in the table below. For example, if there is principal forgiveness in conjunction with lower interest rate and postponement of amortization, the type of concession will be reported as Principal Forgiveness. Second in priority would be rate reduction. For example, if there is an interest rate reduction in conjunction with postponement of amortization, the type of concession will be reported as a Rate Reduction. In the event that multiple concessions are granted on a consumer loan, concessions resulting from discharge from personal liability inthrough Chapter 7 bankruptcy without formal affirmation of the loan obligation to PNC would be prioritized and included in the Other type of concession in the table below. After that, consumer loan concessions would follow the previously discussed priority of concessions for the commercial loan portfolio.
98102 The PNC Financial Services Group, Inc. –Form 10-Q
Table 73: Financial Impact and TDRs by Concession Type (a)
| During the three months ended March 31, 2013 Dollars in millions | | Number
of Loans | | | Pre-TDR
Recorded
Investment (b) | | | Post-TDR Recorded Investment (c) | | |
| | | Principal
Forgiveness | | | Rate
Reduction | | | Other | | | Total | | |
| | | | Number
of Loans | | | Pre-TDR Recorded
Investment (b) | | | Post-TDR Recorded Investment (c) | |
During the three months ended June 30, 2013 Dollars in millions | | | Principal
Forgiveness | | | Rate
Reduction | | | Other | | | Total | |
Commercial lending | | | | | | | | | | | | | | | | | | | | | | | | | | | | | | | | |
Commercial | | | 31 | | | $ | 38 | | | | | $ | 2 | | | $ | 22 | | | $ | 24 | | | | 47 | | | $ | 48 | | | $ | 4 | | | $ | 2 | | | $ | 28 | | | $ | 34 | |
Commercial real estate | | | 35 | | | | 133 | | | $ | 6 | | | | 40 | | | | 75 | | | | 121 | | | | 30 | | | | 50 | | | | 6 | | | | 2 | | | | 27 | | | | 35 | |
Equipment lease financing | | | 2 | | | | 6 | | | | | | | | 1 | | | | 1 | | | | 5 | | | | 23 | | | | | | 11 | | | | 1 | | | | 12 | |
Total commercial lending | | | 68 | | | | 177 | | | | 6 | | | | 42 | | | | 98 | | | | 146 | | | | 82 | | | | 121 | | | | 10 | | | | 15 | | | | 56 | | | | 81 | |
Consumer lending | | | | | | | | | | | | | | | | | | | | | | | | | | | | | | �� | | |
Home equity | | | 2,305 | | | | 119 | | | | | | 39 | | | | 49 | | | | 88 | | | | 1,410 | | | | 98 | | | | | | 43 | | | | 39 | | | | 82 | |
Residential real estate | | | 324 | | | | 46 | | | | | | 12 | | | | 33 | | | | 45 | | | | 285 | | | | 32 | | | | | | 7 | | | | 25 | | | | 32 | |
Credit card | | | 2,530 | | | | 18 | | | | | | 18 | | | | | | | 18 | | | | 2,288 | | | | 18 | | | | | | 17 | | | | | | | 17 | |
Other consumer | | | 642 | | | | 10 | | | | | | | | 9 | | | | 9 | | | | 783 | | | | 9 | | | | | | 1 | | | | 6 | | | | 7 | |
Total consumer lending | | | 5,801 | | | | 193 | | | | | | 69 | | | | 91 | | | | 160 | | | | 4,766 | | | | 157 | | | | | | 68 | | | | 70 | | | | 138 | |
Total TDRs | | | 5,869 | | | $ | 370 | | | $ | 6 | | | $ | 111 | | | $ | 189 | | | $ | 306 | | | | 4,848 | | | $ | 278 | | | $ | 10 | | | $ | 83 | | | $ | 126 | | | $ | 219 | |
| | | | | | |
During the three months ended March 31, 2012 Dollars in millions | | | | | | | | | | | | | | | | | | | |
During the three months ended June 30, 2012 Dollars in millions | | | | | | | | | | | | | | | | | | | |
Commercial lending | | | | | | | | | | | | | | | | | | | | | | | | | | | | | | | | |
Commercial | | | 104 | | | $ | 26 | | | $ | 2 | | | $ | 4 | | | $ | 11 | | | $ | 17 | | | | 33 | | | $ | 102 | | | $ | 1 | | | $ | 40 | | | $ | 42 | | | $ | 83 | |
Commercial real estate | | | 21 | | | | 74 | | | | 9 | | | | 38 | | | | 20 | | | | 67 | | | | 13 | | | | 26 | | | | 8 | | | | 5 | | | | 9 | | | | 22 | |
Equipment lease financing | | | 5 | | | | 15 | | | | | | | | 11 | | | | 11 | | | | 1 | | | | 3 | | | | 1 | | | | | | | | | 1 | |
Total commercial lending | | | 130 | | | | 115 | | | | 11 | | | | 42 | | | | 42 | | | | 95 | | | | 47 | | | | 131 | | | | 10 | | | | 45 | | | | 51 | | | | 106 | |
Consumer lending | | | | | | | | | | | | | | | | | | | | | | | | | | | | | | | | |
Home equity | | | 1,103 | �� | | | 74 | | | | | | 52 | | | | 22 | | | | 74 | | | | 1,083 | | | | 69 | | | | | | 60 | | | | 8 | | | | 68 | |
Residential real estate | | | 182 | | | | 33 | | | | | | 11 | | | | 22 | | | | 33 | | | | 200 | | | | 41 | | | | | | 18 | | | | 20 | | | | 38 | |
Credit card | | | 2,501 | | | | 18 | | | | | | 17 | | | | | | | 17 | | | | 2,268 | | | | 17 | | | | | | 16 | | | | | | | 16 | |
Other consumer | | | 352 | | | | 9 | | | | | | 1 | | | | 8 | | | | 9 | | | | 61 | | | | 1 | | | | | | | | 1 | | | | 1 | |
Total consumer lending | | | 4,138 | | | | 134 | | | | | | 81 | | | | 52 | | | | 133 | | | | 3,612 | | | | 128 | | | | | | 94 | | | | 29 | | | | 123 | |
Total TDRs | | | 4,268 | | | $ | 249 | | | $ | 11 | | | $ | 123 | | | $ | 94 | | | $ | 228 | | | | 3,659 | | | $ | 259 | | | $ | 10 | | | $ | 139 | | | $ | 80 | | | $ | 229 | |
The PNC Financial Services Group, Inc. –Form 10-Q103
| | | | | | | | | | | | | | | | | | | | | | | | |
During the six months ended June 30, 2013 Dollars in millions | | Number
of Loans | | | Pre-TDR Recorded
Investment (b) | | | Post-TDR Recorded Investment (c) | |
| | | | Principal
Forgiveness | | | Rate
Reduction | | | Other | | | Total | |
Commercial lending | | | | | | | | | | | | | | | | | | | | | | | | |
Commercial | | | 78 | | | $ | 86 | | | $ | 4 | | | $ | 4 | | | $ | 50 | | | $ | 58 | |
Commercial real estate | | | 65 | | | | 183 | | | | 12 | | | | 42 | | | | 102 | | | | 156 | |
Equipment lease financing | | | 7 | | | | 29 | | | | | | | | 11 | | | | 2 | | | | 13 | |
Total commercial lending | | | 150 | | | | 298 | | | | 16 | | | | 57 | | | | 154 | | | | 227 | |
Consumer lending | | | | | | | | | | | | | | | | | | | | | | | | |
Home equity | | | 3,715 | | | | 217 | | | | | | | | 82 | | | | 88 | | | | 170 | |
Residential real estate | | | 609 | | | | 78 | | | | | | | | 19 | | | | 58 | | | | 77 | |
Credit card | | | 4,663 | | | | 35 | | | | | | | | 33 | | | | | | | | 33 | |
Other consumer | | | 1,425 | | | | 19 | | | | | | | | 1 | | | | 15 | | | | 16 | |
Total consumer lending | | | 10,412 | | | | 349 | | | | | | | | 135 | | | | 161 | | | | 296 | |
Total TDRs | | | 10,562 | | | $ | 647 | | | $ | 16 | | | $ | 192 | | | $ | 315 | | | $ | 523 | |
| | | | | | |
During the six months ended June 30, 2012 Dollars in millions | | | | | | | | | | | | | | | | | | |
Commercial lending | | | | | | | | | | | | | | | | | | | | | | | | |
Commercial | | | 137 | | | $ | 128 | | | $ | 3 | | | $ | 44 | | | $ | 53 | | | $ | 100 | |
Commercial real estate | | | 34 | | | | 100 | | | | 17 | | | | 43 | | | | 29 | | | | 89 | |
Equipment lease financing | | | 6 | | | | 18 | | | | 1 | | | | | | | | 11 | | | | 12 | |
Total commercial lending | | | 177 | | | | 246 | | | | 21 | | | | 87 | | | | 93 | | | | 201 | |
Consumer lending | | | | | | | | | | | | | | | | | | | | | | | | |
Home equity | | | 2,186 | | | | 143 | | | | | | | | 112 | | | | 30 | | | | 142 | |
Residential real estate | | | 382 | | | | 74 | | | | | | | | 29 | | | | 42 | | | | 71 | |
Credit card | | | 4,651 | | | | 35 | | | | | | | | 33 | | | | | | | | 33 | |
Other consumer | | | 413 | | | | 10 | | | | | | | | 1 | | | | 9 | | | | 10 | |
Total consumer lending | | | 7,632 | | | | 262 | | | | | | | | 175 | | | | 81 | | | | 256 | |
Total TDRs | | | 7,809 | | | $ | 508 | | | $ | 21 | | | $ | 262 | | | $ | 174 | | | $ | 457 | |
| (a) | Impact of partial charge offscharge-offs at TDR date are included in this table. |
| (b) | Represents the recorded investment of the loans as of the quarter end prior to the TDR designation, and excludes immaterial amounts of accrued interest receivable. |
| (c) | Represents the recorded investment of the TDRs as of the quarter end the TDR occurs, and excludes immaterial amounts of accrued interest receivable. |
TDRs may result in charge-offs and interest income not being recognized. At or around the time of modification, there was less than $1 million in recorded investmentthe amount of commercial TDRs, $3 million in recorded investmentprincipal balance of commercial real estate TDRs and $1 million of recorded investment of equipment lease financethe TDRs charged off during the three and six months ended March 31, 2013. Comparable amounts for the three months ended March 31, 2012 were $1 million, $2 million and $5 million respectively. For residential real estate, thereJune 30, 2013 was less than $1 million of recorded investment charged off during the three months ended both March 31, 2013 and March 31, 2012 related to modifications in which principal was partially deferred and deemed uncollectible. There were no charge-offs around the time of modification related to the home equity, credit card, and other consumer TDR portfolios for either period.
not material. A financial effect of rate reduction TDRs is that interest income is not recognized. Interest income not recognized that otherwise would have been earned in the three and six months ended March 31,June 30, 2013 and 2012, respectively, related to both commercial TDRs and consumer TDRs was not material.
After a loan is determined to be a TDR, we continue to track its performance under its most recent restructured terms. In Table 74: TDRs which have Subsequently Defaulted, we consider a TDR to have subsequently defaulted when it becomes 60 days past due after the most recent date the loan was restructured. The following table presents the recorded investment of loans that were classified as TDRs or were subsequently modified during each 12-month period prior to the reporting periods preceding April 1, 2013, January 1, 2013, April 1, 2012 and January 1, 2012, respectively, and subsequently defaulted during these reporting periods.
104The PNC Financial Services Group, Inc. –Form 10-Q99
Table 74: TDRs which have Subsequently Defaulted
| During the three months ended March 31, 2013 Dollars in millions | | Number of Contracts | | | Recorded Investment | | |
During the three months ended June 30, 2013 Dollars in millions | | | Number of Contracts | | | Recorded Investment | |
Commercial lending | | | | | | | | | | |
Commercial | | | 15 | | | $ | 10 | | | | 11 | | | $ | 8 | |
Commercial real estate | | | 6 | | | | 10 | | | | 12 | | | | 21 | |
Total commercial lending (a) | | | 21 | | | | 20 | | | | 23 | | | | 29 | |
Consumer lending | | | | | | | | | | |
Home equity | | | 152 | | | | 11 | | | | 402 | | | | 26 | |
Residential real estate | | | 94 | | | | 13 | | | | 251 | | | | 35 | |
Credit card | | | 1,427 | | | | 11 | | | | 1,225 | | | | 9 | |
Other consumer | | | 33 | | | | 1 | | | | 55 | | | | 1 | |
Total consumer lending | | | 1,706 | | | | 36 | | | | 1,933 | | | | 71 | |
Total TDRs | | | 1,727 | | | $ | 56 | | | | 1,956 | | | $ | 100 | |
| | | | |
During the three months ended March 31, 2012 Dollars in millions | | Number of Contracts | | | Recorded Investment | | |
During the three months ended June 30, 2012 Dollars in millions | | | Number of Contracts | | | Recorded Investment | |
Commercial lending | | | | | | | | | | |
Commercial | | | 31 | | | $ | 10 | | | | 27 | | | $ | 5 | |
Commercial real estate | | | 8 | | | | 5 | | | | 15 | | | | 35 | |
Total commercial lending (a) | | | 39 | | | | 15 | | |
Equipment lease financing | | | | 5 | | | | 11 | |
Total commercial lending | | | | 47 | | | | 51 | |
Consumer lending | | | | | | | | | | |
Home equity | | | 205 | | | | 19 | | | | 161 | | | | 14 | |
Residential real estate | | | 163 | | | | 24 | | | | 144 | | | | 23 | |
Credit card | | | 1,685 | | | | 12 | | | | 2,114 | | | | 15 | |
Other consumer | | | 37 | | | | 1 | | | | 39 | | | | 1 | |
Total consumer lending | | | 2,090 | | | | 56 | | | | 2,458 | | | | 53 | |
Total TDRs | | | 2,129 | | | $ | 71 | | | | 2,505 | | | $ | 104 | |
The PNC Financial Services Group, Inc. –Form 10-Q105
| | | | | | | | |
During the six months ended June 30, 2013 Dollars in millions | | Number of Contracts | | | Recorded Investment | |
Commercial lending | | | | | | | | |
Commercial | | | 26 | | | $ | 18 | |
Commercial real estate | | | 18 | | | | 31 | |
Total commercial lending (a) | | | 44 | | | | 49 | |
Consumer lending | | | | | | | | |
Home equity | | | 565 | | | | 37 | |
Residential real estate | | | 353 | | | | 49 | |
Credit card | | | 2,373 | | | | 18 | |
Other consumer | | | 88 | | | | 2 | |
Total consumer lending | | | 3,379 | | | | 106 | |
Total TDRs | | | 3,423 | | | $ | 155 | |
| | |
During the six months ended June 30, 2012 Dollars in millions | | Number of Contracts | | | Recorded Investment | |
Commercial lending | | | | | | | | |
Commercial | | | 58 | | | $ | 15 | |
Commercial real estate | | | 23 | | | | 40 | |
Equipment lease financing | | | 5 | | | | 11 | |
Total commercial lending | | | 86 | | | | 66 | |
Consumer lending | | | | | | | | |
Home equity | | | 366 | | | | 33 | |
Residential real estate | | | 307 | | | | 46 | |
Credit card | | | 2,815 | | | | 20 | |
Other consumer | | | 76 | | | | 3 | |
Total consumer lending | | | 3,564 | | | | 102 | |
Total TDRs | | | 3,650 | | | $ | 168 | |
| (a) | During the three and six months ended March 31,June 30, 2013, and 2012, there were no loans classified as TDRs in the Equipment lease financing loan class that have subsequently defaulted. |
The impact to the ALLL for commercial lending TDRs is the effect of moving to the specific reserve methodology from the quantitative reserve methodology for those loans that were not already put on nonaccrual status. There is an impact to the ALLL as a result of the concession made, which generally results in the expectation of fewer future cash flows. The decline in expected cash flows, consideration of collateral
value, and/or the application of a present value discount rate, when compared to the recorded investment, results in a charge-off or increased ALLL. As TDRs are individually evaluated under the specific reserve methodology, which builds in expectations of future performance, subsequent defaults do not generally have a significant additional impact to the ALLL.
For consumer lending TDRs, except for bankruptcy dischargesTDRs resulting from borrowers that have been discharged from personal liability through Chapter 7 bankruptcy and have not formally reaffirmed their loan obligations to PNC, the ALLL is calculated using a discounted cash flow model, which leverages subsequent default, prepayment, and severity rate assumptions based upon historically observed data. Similar to the commercial lending specific reserve methodology, the reduced expected cash flows resulting from the concessions granted impact the consumer lending ALLL. The decline in
expected cash flows due to the application of a present value discount rate or the consideration of collateral value, when compared to the recorded investment, results in increased ALLL or a charge-off. See Note 1 Accounting Policies for information on how the ALLL is determined for loans where borrowers have been discharged from personal liability through Chapter 7 bankruptcy and have not formally reaffirmed their loan obligation to PNC.
Impaired LoansIMPAIRED LOANS
Impaired loans include commercial nonperforming loans and consumer and commercial TDRs, regardless of nonperforming status. Excluded from impaired loans are nonperforming leases, loans held for sale, loans accounted for under the fair value option, smaller balance homogeneous type loans and purchased impaired loans. See Note 6 Purchased Loans for additional information. Nonperforming equipment lease financing loans of $9$7 million and $12 million at March 31,June 30, 2013, and December 31, 2012, respectively, are excluded from impaired loans pursuant to authoritative lease accounting guidance. We did not recognize any interest income on impaired loans that have not returned to performing status, while they were impaired during the threesix months ended March 31,June 30, 2013 and March 31,June 30, 2012. The following table provides further detail on impaired loans individually
106 The PNC Financial Services Group, Inc. –Form 10-Q
evaluated for impairment and the associated ALLL. Certain commercial impaired loans do not have a related ALLL as the
valuation of these impaired loans exceeded the recorded investment.
100 The PNC Financial Services Group, Inc. –Form 10-Q
Table 75: Impaired Loans
| | In millions | | Unpaid
Principal
Balance | | | Recorded
Investment (a) | | | Associated
Allowance (b) | | | Average
Recorded
Investment (a) | | | Unpaid
Principal
Balance | | | Recorded
Investment (a) | | | Associated
Allowance (b) | | | Average
Recorded
Investment (a) | |
March 31, 2013 | | | | | | | | | | |
June 30, 2013 | | | | | | | | | | |
Impaired loans with an associated allowance | | | | | | | | | | | | | | | | | | |
Commercial | | $ | 681 | | | $ | 457 | | | $ | 137 | | | $ | 490 | | | $ | 636 | | | $ | 444 | | | $ | 117 | | | $ | 475 | |
Commercial real estate | | | 834 | | | | 570 | | | | 131 | | | | 581 | | | | 702 | | | | 481 | | | | 111 | | | | 548 | |
Home equity | | | 1,101 | | | | 1,019 | | | | 334 | | | | 1,016 | | | | 1,033 | | | | 1,012 | | | | 354 | | | | 1,014 | |
Residential real estate | | | 739 | | | | 624 | | | | 100 | | | | 644 | | | | 589 | | | | 479 | | | | 86 | | | | 589 | |
Credit card | | | 193 | | | | 193 | | | | 43 | | | | 198 | | | | 209 | | | | 208 | | | | 39 | | | | 202 | |
Other consumer | | | 94 | | | | 82 | | | | 3 | | | | 84 | | | | 64 | | | | 53 | | | | 3 | | | | 73 | |
Total impaired loans with an associated allowance | | $ | 3,642 | | | $ | 2,945 | | | $ | 748 | | | $ | 3,013 | | | $ | 3,233 | | | $ | 2,677 | | | $ | 710 | | | $ | 2,901 | |
Impaired loans without an associated allowance | | | | | | | | | | | | | | | | | | |
Commercial | | $ | 261 | | | $ | 143 | | | | | $ | 135 | | | $ | 376 | | | $ | 155 | | | | | $ | 141 | |
Commercial real estate | | | 510 | | | | 376 | | | | | | 366 | | | | 531 | | | | 359 | | | | | | 363 | |
Home equity | | | 178 | | | | 81 | | | | | | 101 | | | | 292 | | | | 118 | | | | | | 107 | |
Residential real estate | | | 316 | | | | 232 | | | | | | 231 | | | | 395 | | | | 373 | | | | | | 279 | |
Total impaired loans without an associated allowance | | $ | 1,265 | | | $ | 832 | | | | | $ | 833 | | | $ | 1,594 | | | $ | 1,005 | | | | | $ | 890 | |
Total impaired loans | | $ | 4,907 | | | $ | 3,777 | | | $ | 748 | | | $ | 3,846 | | | $ | 4,827 | | | $ | 3,682 | | | $ | 710 | | | $ | 3,791 | |
December 31, 2012 | | | | | | | | | | | | | | | | | | |
Impaired loans with an associated allowance | | | | | | | | | | | | | | | | | | |
Commercial | | $ | 824 | | | $ | 523 | | | $ | 150 | | | $ | 653 | | | $ | 824 | | | $ | 523 | | | $ | 150 | | | $ | 653 | |
Commercial real estate | | | 851 | | | | 594 | | | | 143 | | | | 778 | | | | 851 | | | | 594 | | | | 143 | | | | 778 | |
Home equity | | | 1,070 | | | | 1,013 | | | | 328 | | | | 851 | | | | 1,070 | | | | 1,013 | | | | 328 | | | | 851 | |
Residential real estate | | | 778 | | | | 663 | | | | 168 | | | | 700 | | | | 778 | | | | 663 | | | | 168 | | | | 700 | |
Credit card | | | 204 | | | | 204 | | | | 48 | | | | 227 | | | | 204 | | | | 204 | | | | 48 | | | | 227 | |
Other consumer | | | 104 | | | | 86 | | | | 3 | | | | 63 | | | | 104 | | | | 86 | | | | 3 | | | | 63 | |
Total impaired loans with an associated allowance | | $ | 3,831 | | | $ | 3,083 | | | $ | 840 | | | $ | 3,272 | | | $ | 3,831 | | | $ | 3,083 | | | $ | 840 | | | $ | 3,272 | |
Impaired loans without an associated allowance | | | | | | | | | | | | | | | | | | |
Commercial | | $ | 362 | | | $ | 126 | | | | | $ | 157 | | | $ | 362 | | | $ | 126 | | | | | $ | 157 | |
Commercial real estate | | | 562 | | | | 355 | | | | | | 400 | | | | 562 | | | | 355 | | | | | | 400 | |
Home equity | | | 169 | | | | 121 | | | | | | 40 | | | | 169 | | | | 121 | | | | | | 40 | |
Residential real estate | | | 316 | | | | 231 | | | | | | 77 | | | | 316 | | | | 231 | | | | | | 77 | |
Total impaired loans without an associated allowance | | $ | 1,409 | | | $ | 833 | | | | | $ | 674 | | | $ | 1,409 | | | $ | 833 | | | | | $ | 674 | |
Total impaired loans | | $ | 5,240 | | | $ | 3,916 | | | $ | 840 | | | $ | 3,946 | | | $ | 5,240 | | | $ | 3,916 | | | $ | 840 | | | $ | 3,946 | |
| (a) | Recorded investment in a loan includes the unpaid principal balance plus accrued interest and net accounting adjustments, less any charge-offs. Recorded investment does not include any associated valuation allowance. Average recorded investment is for the threesix months ended March 31,June 30, 2013, and the year ended December 31, 2012, respectively. |
| (b) | Associated allowance amounts include $.5 billion and $.6 billion for TDRs at March 31,June 30, 2013, and December 31, 2012, respectively. |
The PNC Financial Services Group, Inc. –Form 10-Q 101107
NOTE 6 PURCHASED LOANS
Purchased Impaired LoansPURCHASED IMPAIRED LOANS
Purchased impaired loan accounting addresses differences between contractual cash flows and cash flows expected to be collected from the initial investment in loans if those differences are attributable, at least in part, to credit quality. Several factors were considered when evaluating whether a loan was considered a purchased impaired loan, including the delinquency status of the loan, updated borrower credit status, geographic information, and updated loan-to-values (LTV). GAAP allows purchasers to aggregate purchased impaired loans acquired in the same fiscal quarter into one or more pools, provided that the loans have common risk characteristics. A pool is then accounted for as a single asset with a single composite interest rate and an aggregate expectation of cash flows. Purchased impaired homogeneous consumer, residential real estate and smaller balance commercial loans with common risk characteristics are aggregated into pools where appropriate. Commercial loans with a total commitment greater than a defined threshold are accounted for individually. The excess of undiscounted cash
flows expected at acquisition over the estimated fair value is referred to as the accretable yield and is recognized as interest income over the remaining life of the loan using the constant effective yield method. The difference between contractually required payments at acquisition and the cash flows expected to be collected at acquisition is referred to as the nonaccretable difference. Subsequent changes in the expected cash flows of individual or pooled purchased impaired loans from the date of acquisition will either impact the accretable yield or result in an impairment charge to provision for credit losses in the period in which the changes become probable. Decreases to the net present value of expected cash flows will generally result in an impairment charge recorded as a provision for credit losses, resulting in an increase to the allowance for loan and lease losses, and a reclassification from accretable yield to nonaccretable difference. Prepayments and interest rate decreases for variable rate notes are treated as a reduction of expected and contractual cash flows such that the nonaccretable difference is not affected. Thus, for decreases in cash flows expected to be collected resulting from prepayments and interest rate decreases for variable rate notes, the effect will be to reduce the yield prospectively.
The following table provides purchased impaired loans at March 31,June 30, 2013 and December 31, 2012:
Table 76: Purchased Impaired Loans – Balances
| | | | | | | | | | | | | | | | |
| | | March 31, 2013 | | | December 31, 2012 | |
| In millions | | Recorded
Investment | | | Outstanding Balance | | | Recorded
Investment | | | Outstanding Balance | |
Commercial Lending | | | | | | | | | | | | | | | | |
Commercial | | $ | 270 | | | $ | 456 | | | $ | 308 | | | $ | 524 | |
Commercial real estate | | | 809 | | | | 1,009 | | | | 941 | | | | 1,156 | |
Total Commercial Lending | | | 1,079 | | | | 1,465 | | | | 1,249 | | | | 1,680 | |
Consumer Lending | | | | | | | | | | | | | | | | |
Consumer | | | 2,557 | | | | 2,870 | | | | 2,621 | | | | 2,988 | |
Residential real estate | | | 3,437 | | | | 3,489 | | | | 3,536 | | | | 3,651 | |
Total Consumer Lending | | | 5,994 | | | | 6,359 | | | | 6,157 | | | | 6,639 | |
Total | | $ | 7,073 | | | $ | 7,824 | | | $ | 7,406 | | | $ | 8,319 | |
| | | | | | | | | | | | | | | | |
| | | June 30, 2013 | | | December 31, 2012 | |
| In millions | | Recorded
Investment | | | Outstanding Balance | | | Recorded
Investment | | | Outstanding Balance | |
Commercial lending | | | | | | | | | | | | | | | | |
Commercial | | $ | 231 | | | $ | 391 | | | $ | 308 | | | $ | 524 | |
Commercial real estate | | | 737 | | | | 908 | | | | 941 | | | | 1,156 | |
Total commercial lending | | | 968 | | | | 1,299 | | | | 1,249 | | | | 1,680 | |
Consumer lending | | | | | | | | | | | | | | | | |
Consumer | | | 2,474 | | | | 2,754 | | | | 2,621 | | | | 2,988 | |
Residential real estate | | | 3,336 | | | | 3,341 | | | | 3,536 | | | | 3,651 | |
Total consumer lending | | | 5,810 | | | | 6,095 | | | | 6,157 | | | | 6,639 | |
Total | | $ | 6,778 | | | $ | 7,394 | | | $ | 7,406 | | | $ | 8,319 | |
During the first threesix months of 2013, $57$90 million of provision and $45$70 million of charge-offs were recorded on purchased impaired loans. At March 31,June 30, 2013, the allowance for loan and lease losses was $1.1 billion on $5.8$6.2 billion of purchased impaired loans while the remaining $1.3$.6 billion of purchased impaired loans required no allowance as the net present value of expected cash flows equaled or exceeded the recorded investment. As of December 31, 2012, the allowance for loan and lease losses related to purchased impaired loans was $1.1 billion. If any allowance for loan losses is recognized on a purchased impaired pool, which is accounted for as a single asset, the entire balance of that pool would be disclosed as requiring an allowance. Subsequent increases in the net present value of cash flows will result in a recovery of any previously recorded allowance for loan and lease losses, to the extent applicable, and/or a reclassification from non-accretable difference to accretable yield, which will be recognized prospectively. Disposals of loans, which may include sales of loans or foreclosures, result in removal of the
loan from the purchased impaired loan portfolio.for cash flow estimation purposes. The cash
flow re-estimation process is completed quarterly to evaluate the appropriateness of the allowance associated with the purchased impaired loans.
Activity for the accretable yield for the first threesix months of 2013 follows:
Table 77: Purchased Impaired Loans – Accretable Yield
| | In millions | | 2013 | | | 2013 | |
January 1 | | $ | 2,166 | | | $ | 2,166 | |
Accretion (including excess cash recoveries) | | | (207 | ) | | | (368 | ) |
Net reclassifications to accretable from non-accretable (a) | | | 219 | | | | 379 | |
Disposals | | | (6 | ) | | | (13 | ) |
March 31 | | $ | 2,172 | | |
June 30 | | | $ | 2,164 | |
| (a) | Over 48 %Approximately 58% of the net reclassifications were driven by the commercial portfolio. Approximately half of the commercialconsumer portfolio impact related to excess cash recoveries recognized during the period, with the remainingand were due to improvements of cash expected to be collected on both RBC Bank (USA) and National City loans in future periods. The remaining net reclassifications were predominantly due to future cash flow changes in the consumercommercial portfolio. |
102108 The PNC Financial Services Group, Inc. –Form 10-Q
NOTE 7 ALLOWANCESFOR LOANAND LEASE LOSSESAND UNFUNDED LOAN COMMITMENTSAND LETTERSOF CREDIT
We maintain the ALLL and the Allowance for Unfunded Loan Commitments and Letters of Credit at levels that we believe to be appropriate to absorb estimated probable credit losses incurred in the portfolios as of the balance sheet date. We use the two main portfolio segments – Commercial Lending and Consumer Lending – and we develop and document the ALLL under separate methodologies for each of these segments as further discussed and presented below.
Allowance for Loan and Lease Losses ComponentsALLOWANCEFOR LOANAND LEASE LOSSES COMPONENTS
For all loans, except purchased impaired loans, the ALLL is the sum of three components: (i) asset specific/individual impaired reserves, (ii) quantitative (formulaic or pooled) reserves and (iii) qualitative (judgmental) reserves. See Note 6 Purchased Loans for additional ALLL information. The reserve calculation and determination process is dependent on the use of key assumptions. Key reserve assumptions and estimation processes react to and are influenced by observed changes in loan portfolio performance experience, the financial strength of the borrower, and economic conditions. Key reserve assumptions are periodically updated.
Asset Specific/Individual ComponentASSET SPECIFIC/INDIVIDUAL COMPONENT
Commercial nonperforming loans and all TDRs are considered impaired and are evaluated for a specific reserve. See Note 1 Accounting Policies for additional information.
Commercial Lending Quantitative ComponentCOMMERCIAL LENDING QUANTITATIVE COMPONENT
The estimates of the quantitative component of ALLL for incurred losses within the commercial lending portfolio segment are determined through statistical loss modeling utilizing PD, LGD and outstanding balance of the loan. Based upon loan risk ratings, we assign PDs and LGDs. Each of these statistical parameters is determined based on internal historical data and market data. PD is influenced by such factors as liquidity, industry, obligor financial structure, access to capital and cash flow. LGD is influenced by collateral type, original and/or updated LTV and guarantees by related parties.
Consumer Lending Quantitative ComponentCONSUMER LENDING QUANTITATIVE COMPONENT
Quantitative estimates within the consumer lending portfolio segment are calculated using a roll-rate model based on statistical relationships, calculated from historical data that estimate the movement of loan outstandings through the various stages of delinquency and ultimately charge-off.
Qualitative ComponentQUALITATIVE COMPONENT
While our reserve methodologies strive to reflect all relevant risk factors, there continues to be uncertainty associated with, but not limited to, potential imprecision in the estimation process due to the inherent time lag of obtaining information and normal variations between estimates and actual outcomes. We provide additional reserves that are designed to provide coverage for losses attributable to such risks. The ALLL also includes factors that may not be directly measured in the determination of specific or pooled reserves. Such qualitative factors may include:
Industry concentrations and conditions,
Recent credit quality trends,
Recent loss experience in particular portfolios,
Recent macro-economic factors,
Changes in lending policies and procedures, and
Timing of available information, including the performance of first lien positions.positions, and
Limitations of available historical data.
Allowance forALLOWANCEFOR RBC BankBANK (USA) Purchased Non-Impaired LoansPURCHASED NON-IMPAIRED LOANS
ALLL for RBC Bank (USA) purchased non-impaired loans is determined based upon the methodologies described above compared to the remaining acquisition date fair value discount that has yet to be accreted into interest income. After making the comparison, an ALLL is recorded for the amount greater than the discount, or no ALLL is recorded if the discount is greater.
Allowance for Purchased Impaired LoansALLOWANCEFOR PURCHASED IMPAIRED LOANS
ALLL for purchased impaired loans is determined in accordance with ASC 310-30 by comparing the net present value of the cash flows expected to be collected to the Recorded Investment for a given loan (or pool of loans). In cases where the net present value of expected cash flows is lower than Recorded Investment, ALLL is established. Cash flows expected to be collected represent management’s best estimate of the cash flows expected over the life of a loan (or pool of loans). For large balance commercial loans, cash flows are separately estimated and compared to the Recorded Investment at the loan level. For smaller balance pooled loans, cash flows are estimated using cash flow models and compared at the risk pool level, which was defined at acquisition based on the risk characteristics of the loan. Our cash flow models use loan data including, but not limited to, delinquency status of the loan, updated borrower FICO credit scores, geographic information, historical loss experience, and updated LTVs, as well as best estimates for unemployment rates, home prices and other economic factors, to determine estimated cash flows.
The PNC Financial Services Group, Inc. –Form 10-Q 103109
Table 78: Rollforward of Allowance for Loan and Lease Losses and Associated Loan Data
| | In millions | | Commercial
Lending | | | Consumer
Lending | | | Total | | | Commercial
Lending | | | Consumer
Lending | | | Total | |
March 31, 2013 | | | | | | | | |
June 30, 2013 | | | | | | | | |
Allowance for Loan and Lease Losses | | | | | | | | | | | | | | |
January 1 | | $ | 1,774 | | | $ | 2,262 | | | $ | 4,036 | | | $ | 1,774 | | | $ | 2,262 | | | $ | 4,036 | |
Charge-offs | | | (203 | ) | | | (366 | ) | | | (569 | ) | | | (336 | ) | | | (589 | ) | | | (925 | ) |
Recoveries | | | 82 | | | | 31 | | | | 113 | | | | 185 | | | | 76 | | | | 261 | |
Net charge-offs | | | (121 | ) | | | (335 | ) | | | (456 | ) | | | (151 | ) | | | (513 | ) | | | (664 | ) |
Provision for credit losses | | | 55 | | | | 181 | | | | 236 | | | | 28 | | | | 365 | | | | 393 | |
Net change in allowance for unfunded loan commitments and letters of credit | | | 12 | | | | | | 12 | | | | 8 | | | | | | 8 | |
March 31 | | $ | 1,720 | | | $ | 2,108 | | | $ | 3,828 | | |
Other | | | | (1 | ) | | | | | (1 | ) |
June 30 | | | $ | 1,658 | | | $ | 2,114 | | | $ | 3,772 | |
TDRs individually evaluated for impairment | | $ | 35 | | | $ | 480 | | | $ | 515 | | | $ | 25 | | | $ | 482 | | | $ | 507 | |
Other loans individually evaluated for impairment | | | 233 | | | | | | 233 | | | | 203 | | | | | | 203 | |
Loans collectively evaluated for impairment | | | 1,254 | | | | 717 | | | | 1,971 | | | | 1,247 | | | | 698 | | | | 1,945 | |
Purchased impaired loans | | | 198 | | | | 911 | | | | 1,109 | | | | 183 | | | | 934 | | | | 1,117 | |
March 31 | | $ | 1,720 | | | $ | 2,108 | | | $ | 3,828 | | |
June 30 | | | $ | 1,658 | | | $ | 2,114 | | | $ | 3,772 | |
Loan Portfolio | | | | | | | | | | | | | | |
TDRs individually evaluated for impairment | | $ | 610 | | | $ | 2,231 | | | $ | 2,841 | | | $ | 599 | | | $ | 2,243 | | | $ | 2,842 | |
Other loans individually evaluated for impairment | | | 936 | | | | | | 936 | | | | 840 | | | | | | 840 | |
Loans collectively evaluated for impairment (a) | | | 107,679 | | | | 67,975 | | | | 175,654 | | | | 110,863 | | | | 68,452 | | | | 179,315 | |
Purchased impaired loans | | | 1,079 | | | | 5,994 | | | | 7,073 | | | | 968 | | | | 5,810 | | | | 6,778 | |
March 31 | | $ | 110,304 | | | $ | 76,200 | | | $ | 186,504 | | |
June 30 | | | $ | 113,270 | | | $ | 76,505 | | | $ | 189,775 | |
Portfolio Segment ALLL as a percentage of total ALLL | | | 45 | % | | | 55 | % | | | 100 | % | | | 44 | % | | | 56 | % | | | 100 | % |
Ratio of the allowance for loan and lease losses to total loans | | | 1.56 | % | | | 2.77 | % | | | 2.05 | % | | | 1.46 | % | | | 2.76 | % | | | 1.99 | % |
March 31, 2012 | | | | | | | | |
June 30, 2012 | | | | | | | | |
Allowance for Loan and Lease Losses | | | | | | | | | | | | | | |
January 1 | | $ | 1,995 | | | $ | 2,352 | | | $ | 4,347 | | | $ | 1,995 | | | $ | 2,352 | | | $ | 4,347 | |
Charge-offs | | | (200 | ) | | | (267 | ) | | | (467 | ) | | | (403 | ) | | | (526 | ) | | | (929 | ) |
Recoveries | | | 104 | | | | 30 | | | | 134 | | | | 214 | | | | 67 | | | | 281 | |
Net charge-offs | | | (96 | ) | | | (237 | )�� | | | (333 | ) | | | (189 | ) | | | (459 | ) | | | (648 | ) |
Provision for credit losses | | | 44 | | | | 141 | | | | 185 | | | | 88 | | | | 353 | | | | 441 | |
Net change in allowance for unfunded loan commitments and letters of credit | | | (6 | ) | | | 3 | | | | (3 | ) | | | 7 | | | | 9 | | | | 16 | |
March 31 | | $ | 1,937 | | | $ | 2,259 | | | $ | 4,196 | | |
June 30 | | | $ | 1,901 | | | $ | 2,255 | | | $ | 4,156 | |
TDRs individually evaluated for impairment | | $ | 35 | | | $ | 536 | | | $ | 571 | | | $ | 45 | | | $ | 527 | | | $ | 572 | |
Other loans individually evaluated for impairment | | | 455 | | | | | | 455 | | | | 419 | | | | | | 419 | |
Loans collectively evaluated for impairment | | | 1,211 | | | | 968 | | | | 2,179 | | | | 1,210 | | | | 920 | | | | 2,130 | |
Purchased impaired loans | | | 236 | | | | 755 | | | | 991 | | | | 227 | | | | 808 | | | | 1,035 | |
March 31 | | $ | 1,937 | | | $ | 2,259 | | | $ | 4,196 | | |
June 30 | | | $ | 1,901 | | | $ | 2,255 | | | $ | 4,156 | |
Loan Portfolio | | | | | | | | | | | | | | |
TDRs individually evaluated for impairment | | $ | 412 | | | $ | 1,821 | | | $ | 2,233 | | | $ | 483 | | | $ | 1,836 | | | $ | 2,319 | |
Other loans individually evaluated for impairment | | | 1,736 | | | | | | 1,736 | | | | 1,523 | | | | | | 1,523 | |
Loans collectively evaluated for impairment | | | 96,799 | | | | 67,025 | | | | 163,824 | | | | 100,607 | | | | 67,893 | | | | 168,500 | |
Purchased impaired loans | | | 1,696 | | | | 6,725 | | | | 8,421 | | | | 1,532 | | | | 6,551 | | | | 8,083 | |
March 31 | | $ | 100,643 | | | $ | 75,571 | | | $ | 176,214 | | |
June 30 | | | $ | 104,145 | | | $ | 76,280 | | | $ | 180,425 | |
Portfolio segment ALLL as a percentage of total ALLL | | | 46 | % | | | 54 | % | | | 100 | % | | | 46 | % | | | 54 | % | | | 100 | % |
Ratio of the allowance for loan and lease losses to total loans | | | 1.92 | % | | | 2.99 | % | | | 2.38 | % | | | 1.83 | % | | | 2.96 | % | | | 2.30 | % |
| (a) | Includes $309$291 million of loans collectively evaluated for impairment based upon collateral values and written down to the respective collateral value less costs to sell. Accordingly, there is no allowance recorded for these loans. |
104110 The PNC Financial Services Group, Inc. –Form 10-Q
Allowance for Unfunded Loan Commitments and Letters of CreditALLOWANCEFOR UNFUNDED LOAN COMMITMENTSAND LETTERSOF CREDIT
We maintain the allowance for unfunded loan commitments and letters of credit at a level we believe is appropriate to absorb estimated probable credit losses on these unfunded credit facilities as of the balance sheet date. See Note 1 Accounting Policies for additional information.
Table 79: Rollforward of Allowance for Unfunded Loan Commitments and Letters of Credit
| | In millions | | 2013 | | | 2012 | | | 2013 | | | 2012 | |
January 1 | | $ | 250 | | | $ | 240 | | | $ | 250 | | | $ | 240 | |
Net change in allowance for unfunded loan commitments and letters of credit | | | (12 | ) | | | 3 | | | | (8 | ) | | | (16 | ) |
March 31 | | $ | 238 | | | $ | 243 | | |
June 30 | | | $ | 242 | | | $ | 224 | |
The PNC Financial Services Group, Inc. –Form 10-Q 105111
NOTE 8 INVESTMENT SECURITIES
Table 80: Investment Securities Summary
| | | | Amortized Cost | | | Unrealized | | | Fair Value | | | Amortized | | | Unrealized | | | Fair | |
| In millions | | Gains | | | Losses | | | | Cost | | | Gains | | | Losses | | | Value | |
March 31, 2013 | | | | | | | | | | |
June 30, 2013 | | | | | | | | | | |
Securities Available for Sale | | | | | | | | | | | | | | | | | | |
Debt securities | | | | | | | | | | | | | | | | | | |
U.S. Treasury and government agencies | | $ | 2,406 | | | $ | 240 | | | | | $ | 2,646 | | | $ | 2,052 | | | $ | 158 | | | | | $ | 2,210 | |
Residential mortgage-backed | | | | | | | | | | | | | | | | | | |
Agency | | | 24,483 | | | | 817 | | | $ | (28 | ) | | | 25,272 | | | | 23,915 | | | | 514 | | | $ | (181 | ) | | | 24,248 | |
Non-agency | | | 5,895 | | | | 361 | | | | (218 | ) | | | 6,038 | | | | 5,816 | | | | 292 | | | | (256 | ) | | | 5,852 | |
Commercial mortgage-backed | | | | | | | | | | | | | | | | | | |
Agency | | | 588 | | | | 27 | | | | | | 615 | | | | 574 | | | | 22 | | | | (1 | ) | | | 595 | |
Non-agency | | | 3,286 | | | | 191 | | | | | | 3,477 | | | | 3,560 | | | | 135 | | | | (16 | ) | | | 3,679 | |
Asset-backed | | | 5,995 | | | | 76 | | | | (56 | ) | | | 6,015 | | | | 6,036 | | | | 57 | | | | (59 | ) | | | 6,034 | |
State and municipal | | | 2,202 | | | | 102 | | | | (20 | ) | | | 2,284 | �� | | | 2,193 | | | | 64 | | | | (40 | ) | | | 2,217 | |
Other debt | | | 2,807 | | | | 97 | | | | (3 | ) | | | 2,901 | | | | 2,733 | | | | 60 | | | | (26 | ) | | | 2,767 | |
Total debt securities | | | 47,662 | | | | 1,911 | | | | (325 | ) | | | 49,248 | | | | 46,879 | | | | 1,302 | | | | (579 | ) | | | 47,602 | |
Corporate stocks and other | | | 288 | | | | | | | | 288 | | | | 297 | | | | | | | | 297 | |
Total securities available for sale | | $ | 47,950 | | | $ | 1,911 | | | $ | (325 | ) | | $ | 49,536 | | | $ | 47,176 | | | $ | 1,302 | | | $ | (579 | ) | | $ | 47,899 | |
Securities Held to Maturity | | | | | | | | | | | | | | | | | | |
Debt securities | | | | | | | | | | | | | | | | | | |
U.S. Treasury and government agencies | | $ | 232 | | | $ | 42 | | | | | $ | 274 | | | $ | 234 | | | $ | 21 | | | | | $ | 255 | |
Residential mortgage-backed (agency) | | | 4,012 | | | | 166 | | | | | | 4,178 | | | | 3,773 | | | | 84 | | | $ | (32 | ) | | | 3,825 | |
Commercial mortgage-backed | | | | | | | | | | | | | | | | | | |
Agency | | | 1,267 | | | | 90 | | | | | | 1,357 | | | | 1,262 | | | | 57 | | | | | | 1,319 | |
Non-agency | | | 2,335 | | | | 66 | | | $ | (1 | ) | | | 2,400 | | | | 2,193 | | | | 42 | | | | (4 | ) | | | 2,231 | |
Asset-backed | | | 989 | | | | 8 | | | | | | 997 | | | | 1,100 | | | | 3 | | | | (3 | ) | | | 1,100 | |
State and municipal | | | 639 | | | | 58 | | | | | | 697 | | | | 639 | | | | 19 | | | | | | 658 | |
Other debt | | | 351 | | | | 18 | | | | | | 369 | | | | 349 | | | | 12 | | | | | | 361 | |
Total securities held to maturity | | $ | 9,825 | | | $ | 448 | | | $ | (1 | ) | | $ | 10,272 | | | $ | 9,550 | | | $ | 238 | | | $ | (39 | ) | | $ | 9,749 | |
December 31, 2012 | | | | | | | | | | | | | | | | | | |
| | | |
Securities Available for Sale | | | | | | | | | | | | | | | | | | |
Debt securities | | | | | | | | | | | | | | | | | | |
U.S. Treasury and government agencies | | $ | 2,868 | | | $ | 245 | | | | | $ | 3,113 | | | $ | 2,868 | | | $ | 245 | | | | | $ | 3,113 | |
Residential mortgage-backed | | | | | | | | | | | | | | | | | | |
Agency | | | 25,844 | | | | 952 | | | $ | (12 | ) | | | 26,784 | | | | 25,844 | | | | 952 | | | $ | (12 | ) | | | 26,784 | |
Non-agency | | | 6,102 | | | | 314 | | | | (309 | ) | | | 6,107 | | | | 6,102 | | | | 314 | | | | (309 | ) | | | 6,107 | |
Commercial mortgage-backed | | | | | | | | | | | | | | | | | | |
Agency | | | 602 | | | | 31 | | | | | | 633 | | | | 602 | | | | 31 | | | | | | 633 | |
Non-agency | | | 3,055 | | | | 210 | | | | (1 | ) | | | 3,264 | | | | 3,055 | | | | 210 | | | | (1 | ) | | | 3,264 | |
Asset-backed | | | 5,667 | | | | 65 | | | | (79 | ) | | | 5,653 | | | | 5,667 | | | | 65 | | | | (79 | ) | | | 5,653 | |
State and municipal | | | 2,197 | | | | 111 | | | | (21 | ) | | | 2,287 | | | | 2,197 | | | | 111 | | | | (21 | ) | | | 2,287 | |
Other debt | | | 2,745 | | | | 103 | | | | (4 | ) | | | 2,844 | | | | 2,745 | | | | 103 | | | | (4 | ) | | | 2,844 | |
Total debt securities | | | 49,080 | | | | 2,031 | | | | (426 | ) | | | 50,685 | | | | 49,080 | | | | 2,031 | | | | (426 | ) | | | 50,685 | |
Corporate stocks and other | | | 367 | | | | | | | | 367 | | | | 367 | | | | | | | | 367 | |
Total securities available for sale | | $ | 49,447 | | | $ | 2,031 | | | $ | (426 | ) | | $ | 51,052 | | | $ | 49,447 | | | $ | 2,031 | | | $ | (426 | ) | | $ | 51,052 | |
Securities Held to Maturity | | | | | | | | | | | | | | | | | | |
Debt securities | | | | | | | | | | | | | | | | | | |
U.S. Treasury and government agencies | | $ | 230 | | | $ | 47 | | | | | $ | 277 | | | $ | 230 | | | $ | 47 | | | | | $ | 277 | |
Residential mortgage-backed (agency) | | | 4,380 | | | | 202 | | | | | | 4,582 | | | | 4,380 | | | | 202 | | | | | | 4,582 | |
Commercial mortgage-backed | | | | | | | | | | | | | | | | | | |
Agency | | | 1,287 | | | | 87 | | | | | | 1,374 | | | | 1,287 | | | | 87 | | | | | | 1,374 | |
Non-agency | | | 2,582 | | | | 85 | | | | | | 2,667 | | | | 2,582 | | | | 85 | | | | | | 2,667 | |
Asset-backed | | | 858 | | | | 5 | | | | | | 863 | | | | 858 | | | | 5 | | | | | | 863 | |
State and municipal | | | 664 | | | | 61 | | | | | | 725 | | | | 664 | | | | 61 | | | | | | 725 | |
Other debt | | | 353 | | | | 19 | | | | | | 372 | | | | 353 | | | | 19 | | | | | | 372 | |
Total securities held to maturity | | $ | 10,354 | | | $ | 506 | | | | | $ | 10,860 | | | $ | 10,354 | | | $ | 506 | | | | | $ | 10,860 | |
106112 The PNC Financial Services Group, Inc. –Form 10-Q
The fair value of investment securities is impacted by interest rates, credit spreads, market volatility and liquidity conditions. Net unrealized gains and losses in the securities available for sale portfolio are included in shareholders’ equity as accumulated other comprehensive income or loss, net of tax, unless credit-related. Securities held to maturity are carried at amortized cost. At March 31,June 30, 2013, accumulated other comprehensive income included pretax gains of $80$73 million from derivatives used to hedgethat hedged the purchase of investment securities classified as held to maturity. The gains will be accreted into interest income as an adjustment of yield on the securities.
The gross unrealized loss on debt securities held to maturity was $1$39 million at March 31,June 30, 2013 and less than $1 million at December 31, 2012, with $10 million$1.6 billion and $73 million of positions in a continuous loss position for less than 12 months at March 31,June 30, 2013 and December 31, 2012, respectively. The fair value of debt securities held to maturity that were in a continuous loss position for 12 months or more was $42$35 million and $56 million at March 31,June 30, 2013 and December 31, 2012, respectively.
Table 81: Gross Unrealized Loss and Fair Value of Securities Available for Sale presents gross unrealized loss and fair value of securities available for sale at March 31,June 30, 2013 and December 31, 2012. The securities are segregated between investments that have been in a continuous unrealized loss position for less than twelve months and twelve months or more based on the point in time the fair value declined below the amortized cost basis. The table includes debt securities where a portion of other-than-temporary impairment (OTTI) has been recognized in accumulated other comprehensive income (loss).
Table 81: Gross Unrealized Loss and Fair Value of Securities Available for Sale
| | | | Unrealized loss position less than 12 months | | | Unrealized loss position
12 months or more | | | Total | | | | | | | | | | | | | | | | |
| In millions | | Unrealized
Loss | | | Fair
Value | | | Unrealized
Loss | | | Fair
Value | | | Unrealized
Loss | | | Fair
Value | | | Unrealized loss position less than 12 months | | | Unrealized loss position 12 months or more | | | Total | |
March 31, 2013 | | | | | | | | | | | | | | |
| | | | Unrealized
Loss | | Fair Value | | | Unrealized
Loss | | | Fair
Value | | | Unrealized
Loss | | | Fair Value | |
June 30, 2013 | | | | | | | | | | | | | | |
Debt securities | | | | | | | | | | | | | | | | | | | | | | | | | | |
Residential mortgage-backed | | | | | | | | | | | | | | | | | | | | | | | | | | |
Agency | | | $ | (176 | ) | | $ | 8,046 | | | $ | (5 | ) | | $ | 163 | | | $ | (181 | ) | | $ | 8,209 | |
Non-agency | | | | (53 | ) | | | 1,563 | | | | (203 | ) | | | 1,877 | | | | (256 | ) | | | 3,440 | |
Commercial mortgage-backed | | | | | | | | | | | | | | |
Agency | | $ | (24 | ) | | $ | 2,696 | | | $ | (4 | ) | | $ | 143 | | | $ | (28 | ) | | $ | 2,839 | | | | (1 | ) | | | 32 | | | | | | | | (1 | ) | | | 32 | |
Non-agency | | | (11 | ) | | | 412 | | | | (207 | ) | | | 2,427 | | | | (218 | ) | | | 2,839 | | | | (16 | ) | | | 1,039 | | | | | | | | (16 | ) | | | 1,039 | |
Asset-backed | | | (1 | ) | | | 669 | | | | (55 | ) | | | 379 | | | | (56 | ) | | | 1,048 | | | | (8 | ) | | | 1,055 | | | | (51 | ) | | | 228 | | | | (59 | ) | �� | | 1,283 | |
State and municipal | | | (3 | ) | | | 229 | | | | (17 | ) | | | 297 | | | | (20 | ) | | | 526 | | | | (22 | ) | | | 818 | | | | (18 | ) | | | 274 | | | | (40 | ) | | | 1,092 | |
Other debt | | | (2 | ) | | | 66 | | | | (1 | ) | | | 16 | | | | (3 | ) | | | 82 | | | | (25 | ) | | | 867 | | | | (1 | ) | | | 16 | | | | (26 | ) | | | 883 | |
Total | | $ | (41 | ) | | $ | 4,072 | | | $ | (284 | ) | | $ | 3,262 | | | $ | (325 | ) | | $ | 7,334 | | | $ | (301 | ) | | $ | 13,420 | | | $ | (278 | ) | | $ | 2,558 | | | $ | (579 | ) | | $ | 15,978 | |
December 31, 2012 | | | | | | | | | | | | | | | | | | | | | | | | | | |
Debt securities | | | | | | | | | | | | | | | | | | | | | | | | | | |
Residential mortgage-backed | | | | | | | | | | | | | | | | | | | | | | | | | | |
Agency | | $ | (9 | ) | | $ | 1,128 | | | $ | (3 | ) | | $ | 121 | | | $ | (12 | ) | | $ | 1,249 | | | $ | (9 | ) | | $ | 1,128 | | | $ | (3 | ) | | $ | 121 | | | $ | (12 | ) | | $ | 1,249 | |
Non-agency | | | (3 | ) | | | 219 | | | | (306 | ) | | | 3,185 | | | | (309 | ) | | | 3,404 | | | | (3 | ) | | | 219 | | | | (306 | ) | | | 3,185 | | | | (309 | ) | | | 3,404 | |
Commercial mortgage-backed | | | | | | | | | | | | | | | | | | | | | | | | | | |
Non-agency | | | (1 | ) | | | 60 | | | | | | | | (1 | ) | | | 60 | | | | (1 | ) | | | 60 | | | | | | | | (1 | ) | | | 60 | |
Asset-backed | | | (1 | ) | | | 370 | | | | (78 | ) | | | 625 | | | | (79 | ) | | | 995 | | | | (1 | ) | | | 370 | | | | (78 | ) | | | 625 | | | | (79 | ) | | | 995 | |
State and municipal | | | (2 | ) | | | 240 | | | | (19 | ) | | | 518 | | | | (21 | ) | | | 758 | | | | (2 | ) | | | 240 | | | | (19 | ) | | | 518 | | | | (21 | ) | | | 758 | |
Other debt | | | (2 | ) | | | 61 | | | | (2 | ) | | | 15 | | | | (4 | ) | | | 76 | | | | (2 | ) | | | 61 | | | | (2 | ) | | | 15 | | | | (4 | ) | | | 76 | |
Total | | $ | (18 | ) | | $ | 2,078 | | | $ | (408 | ) | | $ | 4,464 | | | $ | (426 | ) | | $ | 6,542 | | | $ | (18 | ) | | $ | 2,078 | | | $ | (408 | ) | | $ | 4,464 | | | $ | (426 | ) | | $ | 6,542 | |
Evaluating Investment Securities for Other-than-Temporary ImpairmentsEVALUATING INVESTMENT SECURITIESFOR OTHER-THAN-TEMPORARY IMPAIRMENTS
For the securities in the preceding table, as of March 31,June 30, 2013 we do not intend to sell and believe we will not be required to sell the securities prior to recovery of the amortized cost basis.
On at least a quarterly basis, we conduct a comprehensive security-level assessment on all securities. For those securities in an unrealized loss position towe determine if OTTI exists. An unrealized loss exists when the current fair value of an individual security is less than its amortized cost basis. An OTTI loss must be recognized for a debt security in an unrealized loss position if we intend
The PNC Financial Services Group, Inc. –Form 10-Q113
to sell the security or it is more likely than not we will be required to sell the security prior to recovery of its amortized cost basis. In this situation, the amount of loss recognized in income is equal to the difference between the fair value and the amortized cost basis of the security.
The PNC Financial Services Group, Inc. –Form 10-Q107
Even if we do not expect to sell the security, we must evaluate the expected cash flows to be received to determine if we believe a credit loss has occurred. In the event of a credit loss, only the amount of impairment associated with the credit loss is recognized in income. The portion of the unrealized loss relating to other factors, such as liquidity conditions in the market or changes in market interest rates, is recorded in accumulated other comprehensive income (loss).
The security-level assessment is performed on each security, regardless of the classification of the security as available for sale or held to maturity. Our assessment considers the security structure, recent security collateral performance metrics if applicable, external credit ratings, failure of the issuer to make scheduled interest or principal payments, our judgment and expectations of future performance, and relevant independent industry research, analysis and forecasts. Results of the periodic assessment are reviewed by a cross-functional senior management team representing Asset & Liability Management, Finance, and Market Risk Management. The senior management team considers the results of the assessments, as well as other factors, in determining whether the impairment is other-than-temporary.
For debt securities, a critical component of the evaluation for OTTI is the identification of credit-impaired securities, where management does not expect to receive cash flows sufficient to recover the entire amortized cost basis of the security. The paragraphs below describe our process for identifying credit impairment for our most significant categories of securities not backed by the U.S. government or its agencies.
Non-Agency Residential Mortgage-Backed Securities and Asset-Backed Securities Collateralized by First-Lien and Second-Lien Non-Agency Residential Mortgage LoansNON-AGENCY RESIDENTIAL MORTGAGE-BACKED SECURITIESAND ASSET-BACKED SECURITIES COLLATERALIZEDBY FIRST-LIENAND SECOND-LIEN NON-AGENCY RESIDENTIAL MORTGAGE LOANS
Potential credit losses on these securities are evaluated on a security-by-security basis. Collateral performance assumptions are developed for each security after reviewing collateral composition and collateral performance statistics. This includes analyzing recent delinquency roll rates, loss severities, voluntary prepayments, and various other collateral and performance metrics. This information is then combined with general expectations on the housing market, employment, and other economic factors to develop estimates of future performance.
Security level assumptions for prepayments, loan defaults, and loss given default are applied to every security using a third-party cash flow model. The third-party cash flow model then generates projected cash flows according to the structure of each security. Based on the results of the cash flow analysis, we determine whether we expect that we will recover the amortized cost basis of our security.
The following table provides detail on the significant assumptions used to determine credit impairment for non-agency residential mortgage-backed and asset-backed securities collateralized by first-lien and second-lien non-agency residential mortgage loans.
Table 82: Credit Impairment Assessment Assumptions – Non-Agency Residential Mortgage-Backed and Asset-Backed Securities (a)
| | | | | | | | |
March 31,June 30, 2013 | | Range | | | Weighted-
average (b) | |
Long-term prepayment rate (annual CPR) | | | | | | | | |
Prime | | | 7-20 | % | | | 14 | % |
Alt-A | | | 5-12 | | | | 6 | |
Option ARM | | | 3-6 | | | | 3 | |
Remaining collateral expected to default | | | | | | | | |
Prime | | | 1-461-45 | % | | | 1918 | % |
Alt-A | | | 3-577-57 | | | | 33 | |
Option ARM | | | 20-7016-69 | | | | 5048 | |
Loss severity | | | | | | | | |
Prime | | | 25-7025-71 | % | | | 4743 | % |
Alt-A | | | 30-85 | | | | 5956 | |
Option ARM | | | 40-6940-70 | | | | 6159 | |
| (a) | Collateralized by first and second-lien non-agency residential mortgage loans. |
| (b) | Calculated by weighting the relevant assumption for each individual security by the current outstanding cost basis of the security. |
Non-Agency Commercial Mortgage-Backed SecuritiesNON-AGENCY COMMERCIAL MORTGAGE-BACKED SECURITIES
Credit losses on these securities are measured using property-level cash flow projections and forward-looking property valuations. Cash flows are projected using a detailed analysis of net operating income (NOI) by property type which, in turn, is based on the analysis of NOI performance over the past several business cycles combined with PNC’s economic outlook for the current cycle. Loss severities are based on property price projections, which are calculated using capitalization rate projections. The capitalization rate projections are based on a combination of historical capitalization rates and expected capitalization rates implied by current market activity, our outlook and relevant independent industry research, analysis and forecasts. Securities exhibiting weaker performance within the model are subject to further analysis. This analysis is performed at the loan level, and includes assessing local market conditions, reserves, occupancy, rent rolls and master/special servicer details.
108114 The PNC Financial Services Group, Inc. –Form 10-Q
During the second quarter and first quarterssix months of 2013 and 2012, respectively, the OTTI credit losses recognized in noninterest income and the OTTI noncredit losses recognized in accumulated other comprehensive income (loss), net of tax, on securities that we do not expect to sell were as follows:
Table 83: Other-Than-Temporary Impairments
| | | | Three months ended March 31 | | | Three months ended June 30 | | | Six months ended June 30 | |
| In millions | | 2013 | | 2012 | | | 2013 | | 2012 | | | 2013 | | | 2012 | |
Credit portion of OTTI losses | | | | | | | | | | | | | | | |
Available for sale securities: | | | | | | | | | | | | | | | |
Non-agency residential mortgage-backed | | $ | (7 | ) | | $ | (32 | ) | | $ | (3 | ) | | $ | (31 | ) | | $ | (10 | ) | | $ | (63 | ) |
Asset-backed | | | (3 | ) | | | (5 | ) | | | (1 | ) | | | (3 | ) | | | (4 | ) | | | (8 | ) |
Other debt | | | | (1 | ) | | | | | | | | (1 | ) |
Total credit portion of OTTI losses | | | (10 | ) | | | (38 | ) | | | (4 | ) | | | (34 | ) | | | (14 | ) | | | (72 | ) |
Noncredit portion of OTTI losses | | | 9 | | | | 22 | | |
Noncredit portion of OTTI (losses) recoveries | | | | (6 | ) | | | 2 | | | | 3 | | | | 24 | |
Total OTTI losses | | $ | (1 | ) | | $ | (16 | ) | | $ | (10 | ) | | $ | (32 | ) | | | (11 | ) | | | (48 | ) |
The following table presents a rollforward of the cumulative OTTI credit losses recognized in earnings for all debt securities for which a portion of an OTTI loss was recognized in accumulated other comprehensive income (loss).
Table 84: Rollforward of Cumulative OTTI Credit Losses Recognized in Earnings
| | In millions | | Non-agency
residential
mortgage-backed | | Non-agency
commercial
mortgage-backed | | | Asset-backed | | | Other debt | | | Total | | | Non-agency
residential
mortgage-backed | | Non-agency
commercial
mortgage-backed | | Asset-backed | | Other debt | | Total | |
For the three months ended March 31, 2013 | | | | | | | | | | | | |
December 31, 2012 | | $ | (926 | ) | | $ | (6 | ) | | $ | (255 | ) | | $ | (14 | ) | | $ | (1,201 | ) | |
For the three months ended June 30, 2013 | | | | | | | | | | | | |
March 31, 2013 | | | $ | (887 | ) | | $ | (6 | ) | | $ | (258 | ) | | $ | (14 | ) | | $ | (1,165 | ) |
Additional loss where credit impairment was previously recognized | | | (7 | ) | | | | | (3 | ) | | | | | (10 | ) | | | (3 | ) | | | | | (1 | ) | | | | | (4 | ) |
Reduction due to credit impaired securities sold or matured | | | 46 | | | | | | | | | 46 | | | | 5 | | | | 5 | |
March 31, 2013 | | $ | (887 | ) | | $ | (6 | ) | | $ | (258 | ) | | $ | (14 | ) | | $ | (1,165 | ) | |
June 30, 2013 | | | $ | (885 | ) | | $ | (6 | ) | | $ | (259 | ) | | $ | (14 | ) | | $ | (1,164 | ) |
| | In millions | | Non-agency
residential
mortgage-backed | | Non-agency
commercial
mortgage-backed | | | Asset-backed | | | Other debt | | | Total | | | Non-agency
residential
mortgage-backed | | Non-agency
commercial
mortgage-backed | | Asset-backed | | Other debt | | Total | |
For the three months ended March 31, 2012 | | | | | | | | | | | | |
December 31, 2011 | | $ | (828 | ) | | $ | (6 | ) | | $ | (244 | ) | | $ | (13 | ) | | $ | (1,091 | ) | |
For the three months ended June 30, 2012 | | | | | | | | | | | | |
March 31, 2012 | | | $ | (859 | ) | | $ | (6 | ) | | $ | (249 | ) | | $ | (14 | ) | | $ | (1,128 | ) |
Loss where impairment was not previously recognized | | | (1 | ) | | | | | | | (1 | ) | | | (2 | ) | | | (1 | ) | | | | | | | | | (1 | ) |
Additional loss where credit impairment was previously recognized | | | (31 | ) | | | | | (5 | ) | | | | | (36 | ) | | | (30 | ) | | | (3 | ) | | | (33 | ) |
Reduction due to credit impaired securities sold or matured | | | 1 | | | | | | | | | 1 | | |
March 31, 2012 | | $ | (859 | ) | | $ | (6 | ) | | $ | (249 | ) | | $ | (14 | ) | | $ | (1,128 | ) | |
June 30, 2012 | | | $ | (890 | ) | | $ | (6 | ) | | $ | (252 | ) | | $ | (14 | ) | | $ | (1,162 | ) |
| | | | | | | | | | | | | | | | | | | | |
| In millions | | Non-agency
residential
mortgage-backed | | | Non-agency
commercial
mortgage-backed | | | Asset-backed | | | Other debt | | | Total | |
For the six months ended June 30, 2013 | | | | | | | | | | | | | | | | | | | | |
December 31, 2012 | | $ | (926 | ) | | $ | (6 | ) | | $ | (255 | ) | | $ | (14 | ) | | $ | (1,201 | ) |
Additional loss where credit impairment was previously recognized | | | (10 | ) | | | | | | | (4 | ) | | | | | | | (14 | ) |
Reduction due to credit impaired securities sold or matured | | | 51 | | | | | | | | | | | | | | | | 51 | |
June 30, 2013 | | $ | (885 | ) | | $ | (6 | ) | | $ | (259 | ) | | $ | (14 | ) | | $ | (1,164 | ) |
| | | | | | | | | | | | | | | | | | | | |
| In millions | | Non-agency
residential
mortgage-backed | | | Non-agency
commercial
mortgage-backed | | | Asset-backed | | | Other debt | | | Total | |
For the six months ended June 30, 2012 | | | | | | | | | | | | | | | | | | | | |
December 31, 2011 | | $ | (828 | ) | | $ | (6 | ) | | $ | (244 | ) | | $ | (13 | ) | | $ | (1,091 | ) |
Loss where impairment was not previously recognized | | | (2 | ) | | | | | | | | | | | (1 | ) | | | (3 | ) |
Additional loss where credit impairment was previously recognized | | | (61 | ) | | | | | | | (8 | ) | | | | | | | (69 | ) |
Reduction due to credit impaired securities sold or matured | | | 1 | | | | | | | | | | | | | | | | 1 | |
June 30, 2012 | | $ | (890 | ) | | $ | (6 | ) | | $ | (252 | ) | | $ | (14 | ) | | $ | (1,162 | ) |
The PNC Financial Services Group, Inc. –Form 10-Q115
Information relating to gross realized securities gains and losses from the sales of securities is set forth in the following table.
Table 85: Gains (Losses) on Sales of Securities Available for Sale
| | | | | | | | | | | | | | | | | | | | |
| In millions | | Proceeds | | | Gross
Gains | | | Gross
Losses | | | Net
Gains | | | Tax
Expense | |
For the three months ended March 31 | | | | | | | | | | | | | | | | | | | | |
2013 | | $ | 1,255 | | | $ | 17 | | | $ | (3 | ) | | $ | 14 | | | $ | 5 | |
2012 | | | 3,553 | | | | 67 | | | | (10 | ) | | | 57 | | | | 20 | |
The PNC Financial Services Group, Inc. –Form 10-Q109
| | | | | | | | | | | | | | | | | | | | |
| In millions | | Proceeds | | | Gross
Gains | | | Gross
Losses | | | Net
Gains | | | Tax
Expense | |
For the six months ended June 30 | | | | | | | | | | | | | | | | | | | | |
2013 | | $ | 3,877 | | | $ | 98 | | | $ | (23 | ) | | $ | 75 | | | $ | 26 | |
2012 | | | 6,607 | | | | 129 | | | | (10 | ) | | | 119 | | | | 42 | |
The following table presents, by remaining contractual maturity, the amortized cost, fair value and weighted-average yield of debt securities at March 31,June 30, 2013.
Table 86: Contractual Maturity of Debt Securities
| March 31, 2013 Dollars in millions | | 1 Year or Less | | After 1 Year
through 5 Years | | | After 5 Years
through 10 Years | | | After
10 Years | | | Total | | |
June 30, 2013 Dollars in millions | | | 1 Year or Less | | | After 1 Year
through 5 Years | | | After 5 Years
through 10 Years | | | After 10
Years | | | Total | |
Securities Available for Sale | | | | | | | | | | | | | | | | | | | | | | |
U.S. Treasury and government agencies | | $ | 2 | | | $ | 1,092 | | | $ | 869 | | | $ | 443 | | | $ | 2,406 | | | $ | 1 | | | $ | 1,082 | | | $ | 804 | | | $ | 165 | | | $ | 2,052 | |
Residential mortgage-backed | | | | | | | | | | | | | | | | | | | | | | |
Agency | | | | | 31 | | | | 466 | | | | 23,986 | | | | 24,483 | | | | 1 | | | | 33 | | | | 513 | | | | 23,368 | | | | 23,915 | |
Non-agency | | | | | 2 | | | | 15 | | | | 5,878 | | | | 5,895 | | | | | | 12 | | | | 2 | | | | 5,802 | | | | 5,816 | |
Commercial mortgage-backed | | | | | | | | | | | | | | | | | | | | | | |
Agency | | | | | 536 | | | | 52 | | | | | | 588 | | | | 10 | | | | 528 | | | | 36 | | | | | | 574 | |
Non-agency | | | 75 | | | | 58 | | | | 105 | | | | 3,048 | | | | 3,286 | | | | 75 | | | | 59 | | | | 105 | | | | 3,321 | | | | 3,560 | |
Asset-backed | | | 14 | | | | 978 | | | | 1,606 | | | | 3,397 | | | | 5,995 | | | | 5 | | | | 1,088 | | | | 2,138 | | | | 2,805 | | | | 6,036 | |
State and municipal | | | 25 | | | | 120 | | | | 381 | | | | 1,676 | | | | 2,202 | | | | 12 | | | | 116 | | | | 389 | | | | 1,676 | | | | 2,193 | |
Other debt | | | 284 | | | | 1,602 | | | | 570 | | | | 351 | | | | 2,807 | | | | 524 | | | | 1,337 | | | | 529 | | | | 343 | | | | 2,733 | |
Total debt securities available for sale | | $ | 400 | | | $ | 4,419 | | | $ | 4,064 | | | $ | 38,779 | | | $ | 47,662 | | | $ | 628 | | | $ | 4,255 | | | $ | 4,516 | | | $ | 37,480 | | | $ | 46,879 | |
Fair value | | $ | 404 | | | $ | 4,560 | | | $ | 4,264 | | | $ | 40,020 | | | $ | 49,248 | | | $ | 635 | | | $ | 4,356 | | | $ | 4,658 | | | $ | 37,953 | | | $ | 47,602 | |
Weighted-average yield, GAAP basis | | | 2.80 | % | | | 2.53 | % | | | 2.50 | % | | | 3.36 | % | | | 3.21 | % | | | 2.72 | % | | | 2.45 | % | | | 2.38 | % | | | 3.30 | % | | | 3.13 | % |
Securities Held to Maturity | | | | | | | | | | | | | | | | | | | | | | |
U.S. Treasury and government agencies | | | | | | | | $ | 232 | | | $ | 232 | | | | | | | | | $ | 234 | | | $ | 234 | |
Residential mortgage-backed (agency) | | | | | | | | | 4,012 | | | | 4,012 | | | | | | | | | | 3,773 | | | | 3,773 | |
Commercial mortgage-backed | | | | | | | | | | | | | | | | | | | | | | |
Agency | | | | $ | 318 | | | $ | 943 | | | | 6 | | | | 1,267 | | | | | $ | 423 | | | $ | 834 | | | | 5 | | | | 1,262 | |
Non-agency | | | | | 51 | | | | | | 2,284 | | | | 2,335 | | | | | | 51 | | | | | | 2,142 | | | | 2,193 | |
Asset-backed | | | | | 84 | | | | 58 | | | | 847 | | | | 989 | | | | | | 60 | | | | 80 | | | | 960 | | | | 1,100 | |
State and municipal | | | | | 25 | | | | 290 | | | | 324 | | | | 639 | | | | | | 34 | | | | 282 | | | | 323 | | | | 639 | |
Other debt | | | | 2 | | | | 349 | | | | | | 351 | | | | | | 1 | | | | 348 | | | | | | 349 | |
Total debt securities held to maturity | | | $ | 480 | | | $ | 1,640 | | | $ | 7,705 | | | $ | 9,825 | | | | | $ | 569 | | | $ | 1,544 | | | $ | 7,437 | | | $ | 9,550 | |
Fair value | | | | $ | 496 | | | $ | 1,762 | | | $ | 8,014 | | | $ | 10,272 | | | | | $ | 583 | | | $ | 1,607 | | | $ | 7,559 | | | $ | 9,749 | |
Weighted-average yield, GAAP basis | | | | 3.38 | % | | | 3.39 | % | | | 3.97 | % | | | 3.84 | % | | | | | 3.32 | % | | | 3.42 | % | | | 3.82 | % | | | 3.72 | % |
116 The PNC Financial Services Group, Inc. –Form 10-Q
Based on current interest rates and expected prepayment speeds, the weighted-average expected maturity of mortgage and other asset-backed debt securities were as follows as of March 31,June 30, 2013:
Table 87: Weighted-Average Expected Maturity of Mortgage and Other Asset-Backed Debt Securities
| | | | |
March 31,June 30, 2013 | | Years | |
Agency residential mortgage-backed securities | | | 3.94.6 | |
Non-agency residential mortgage-backed securities | | | 5.45.9 | |
Agency commercial mortgage-backed securities | | | 4.44.2 | |
Non-agency commercial mortgage-backed securities | | | 2.62.4 | |
Asset-backed securities | | | 3.8 | |
Weighted-average yields are based on historical cost with effective yields weighted for the contractual maturity of each security. At March 31,June 30, 2013, there were no securities of a
single issuer, other than FNMA, that exceeded 10% of total shareholders’ equity.
The following table presents the fair value of securities that have been either pledged to or accepted from others to collateralize outstanding borrowings.
Table 88: Fair Value of Securities Pledged and Accepted as Collateral
| | | | | | | | |
| In millions | | March 31
2013 | | | December 31
2012 | |
Pledged to others | | $ | 24,901 | | | $ | 25,648 | |
Accepted from others: | | | | | | | | |
Permitted by contract or custom to sell or repledge | | | 1,107 | | | | 1,015 | |
Permitted amount repledged to others | | | 866 | | | | 685 | |
110 The PNC Financial Services Group, Inc. –Form 10-Q
| | | | | | | | |
| In millions | | June 30
2013 | | | December 31
2012 | |
Pledged to others | | $ | 23,058 | | | $ | 25,648 | |
Accepted from others: | | | | | | | | |
Permitted by contract or custom to sell or repledge | | | 1,122 | | | | 1,015 | |
Permitted amount repledged to others | | | 888 | | | | 685 | |
The securities pledged to others include positions held in our portfolio of investment securities, trading securities, and securities accepted as collateral from others that we are permitted by contract or custom to sell or repledge, and were used to secure public and trust deposits, repurchase agreements, and for other purposes. The securities accepted from others that we are permitted by contract or custom to sell or repledge are a component of Federal funds sold and resale agreements on our Consolidated Balance Sheet.
The PNC Financial Services Group, Inc. –Form 10-Q117
NOTE 9 FAIR VALUE
FAIR VALUE MEASUREMENT
GAAP establishes a fair value reporting hierarchy to maximize the use of observable inputs when measuring fair value. There are three levels of inputs used to measure fair value. For more information regarding the fair value hierarchy and the valuation methodologies for assets and liabilities measured at fair value on a recurring basis, see Note 9 Fair Value in our Notes To Consolidated Financial Statements under Item 8 of our 2012 Form 10-K.
Valuation ProcessesVALUATION PROCESSES
We have various processes and controls in place to help ensure that fair value is reasonably estimated. Any models used to determine fair values or to validate dealer quotes are subject to review and independent testing as part of our model validation and internal control testing processes. Our Model Risk Management Committee reviews significant models at least annually. In addition, we have teams independent of the traders that verify marks and assumptions used for valuations at each period end.
Assets and liabilities measured at fair value, by their nature, result in a higher degree of financial statement volatility. Assets and liabilities classified within Level 3 inherently require the use of various assumptions, estimates and judgments when measuring their fair value. As observable market activity is commonly not available to use when estimating the fair value of Level 3 assets and liabilities, we must estimate fair value using various modeling techniques. These techniques include the use of a variety of inputs/assumptions including credit quality, liquidity, interest rates or other relevant inputs across the entire population of our Level 3 assets and liabilities. Changes in the significant underlying factors or assumptions (either an increase or a decrease) in any of these areas underlying our estimates may result in a significant increase/decrease in the Level 3 fair value measurement of a particular asset and/or liability from period to period.
FINANCIAL INSTRUMENTS ACCOUNTEDFORAT FAIR VALUEONA RECURRING BASIS
A cross-functional team comprised of representatives from Asset & Liability Management, Finance, and Market Risk Management oversees the governance of the processes and methodologies used to estimate the fair value of securities and the price validation testing that is performed. This management team reviews pricing sources and trends and the results of validation testing.
For more information regarding the fair value of financial instruments accounted for at fair value on a recurring basis, see Note 9 Fair Value in our Notes To Consolidated Financial Statements under Item 8 of our 2012 Form 10-K.
The following disclosures for financial instruments accounted for at fair value have been updated during the first threesix months of 2013:
LoansLOANS
Loans accounted for at fair value consist primarily of residential mortgage loans. These loans are generally valued similarly to residential mortgage loans held for sale and are classified as Level 2. However, similar to residential mortgage loans held for sale, if these loans are repurchased and unsalable, they are classified as Level 3. During the first quarter of 2013, we have elected to account for certain home equity lines of credit at fair value. These loans are classified as Level 3. This category also includes repurchased brokered home equity loans. These loans are repurchased due to a breach of representations or warranties in the loan sales agreements and occur typically after the loan is in default. The fair value price is based on bids and market observations of transactions of similar vintage. Because transaction details regarding the credit and underwriting quality are often unavailable, unobservable bid information from brokers and investors is heavily relied upon. Accordingly, based on the significance of unobservable inputs, these loans are classified as Level 3. The fair value of these loans is included in the Loans – Home equity line item in Table 91: Fair Value Measurement – Recurring Quantitative Information in this Note 9 for both March 31,June 30, 2013 and December 31, 2012. A significant input to the valuation includes a credit and liquidity discount that is deemed representative of current market conditions. Significant increases (decreases) in this assumption would result in a significantly lower (higher) fair value measurement.
Other Borrowed FundsOTHER BORROWED FUNDS
During the first quarter of 2013, we have elected to account for certain other borrowed funds consisting primarily of secured debt at fair value. These other borrowed funds are classified as Level 3. Significant unobservable inputs for these borrowed funds include credit and liquidity discount.discount and spread over the benchmark curve. Significant increases (decreases) in these assumptions would result in significantly lower (higher) fair value measurement.
FINANCIAL DERIVATIVES
In connection with the sales of a portion of our Visa Class B common shares in the second quarter of 2013 and the second half of 2012, we entered into swap agreements with the purchaser of the shares to account for future changes in the value of the Class B common shares resulting from changes in the settlement of certain specified litigation and its effect on the conversion rate of Class B common shares into Visa Class A common shares and to make payments calculated by reference to the market price of the Class A common shares and a fixed rate of interest. The swaps are classified as Level 3 instruments and the fair values of the liability positions totaled $61 million at June 30, 2013 and $43 million at December 31, 2012, respectively.
118The PNC Financial Services Group, Inc. –Form 10-Q111
Assets and liabilities measured at fair value on a recurring basis, including instruments for which PNC has elected the fair value option, follow.
Table 89: Fair Value Measurements – Summary
| In millions | | March 31, 2013 | | | December 31, 2012 | | |
| | June 30, 2013 | | | December 31, 2012 | |
In millions | | Level 1 | | | Level 2 | | | Level 3 | | | Total Fair
Value | | | Level 1 | | | Level 2 | | | Level 3 | | | Total Fair
Value | | | Level 1 | | Level 2 | | Level 3 | | Total
Fair Value | | | Level 1 | | Level 2 | | Level 3 | | Total
Fair Value | |
| | | | | | | | | | | | | | | | | | | | | | | | | | | | | | | | | | | |
Securities available for sale | | | | | | | | | | | | | | | | | | | | | | | | | | | | | | | | | | | |
US Treasury and government agencies | | $ | 1,848 | | | $ | 798 | | | | | $ | 2,646 | | | $ | 2,269 | | | $ | 844 | | | | | $ | 3,113 | | |
U.S. Treasury and government agencies | | | $ | 1,480 | | | $ | 730 | | | | | $ | 2,210 | | | $ | 2,269 | | | $ | 844 | | | | | $ | 3,113 | |
Residential mortgage-backed | | | | | | | | | | | | | | | | | | | | | | | | | | | | | | | | | | | |
Agency | | | | | 25,272 | | | | | | 25,272 | | | | | | 26,784 | | | | | | 26,784 | | | | | | 24,248 | | | | | | 24,248 | | | | | | 26,784 | | | | | | 26,784 | |
Non-agency | | | | | | $ | 6,038 | | | | 6,038 | | | | | | | $ | 6,107 | | | | 6,107 | | | | | | 141 | | | $ | 5,711 | | | | 5,852 | | | | | | | $ | 6,107 | | | | 6,107 | |
Commercial mortgage-backed | | | | | | | | | | | | | | | | | | | | | | | | | | | | | | | | | | | |
Agency | | | | | 615 | | | | | | 615 | | | | | | 633 | | | | | | 633 | | | | | | 595 | | | | | | 595 | | | | | | 633 | | | | | | 633 | |
Non-agency | | | | | 3,477 | | | | | | 3,477 | | | | | | 3,264 | | | | | | 3,264 | | | | | | 3,679 | | | | | | 3,679 | | | | | | 3,264 | | | | | | 3,264 | |
Asset-backed | | | | | 5,314 | | | | 701 | | | | 6,015 | | | | | | 4,945 | | | | 708 | | | | 5,653 | | | | | | 5,362 | | | | 672 | | | | 6,034 | | | | | | 4,945 | | | | 708 | | | | 5,653 | |
State and municipal | | | | | 1,954 | | | | 330 | | | | 2,284 | | | | | | 1,948 | | | | 339 | | | | 2,287 | | | | | | 1,886 | | | | 331 | | | | 2,217 | | | | | | 1,948 | | | | 339 | | | | 2,287 | |
Other debt | | | | | 2,852 | | | | 49 | | | | 2,901 | | | | | | 2,796 | | | | 48 | | | | 2,844 | | | | 2,719 | | | | 48 | | | | 2,767 | | | | | 2,796 | | | | 48 | | | | 2,844 | |
Total debt securities | | | 1,848 | | | | 40,282 | | | | 7,118 | | | | 49,248 | | | | 2,269 | | | | 41,214 | | | | 7,202 | | | | 50,685 | | | | 1,480 | | | | 39,360 | | | | 6,762 | | | | 47,602 | | | | 2,269 | | | | 41,214 | | | | 7,202 | | | | 50,685 | |
Corporate stocks and other | | | 272 | | | | 16 | | | | | | 288 | | | | 351 | | | | 16 | | | | | | 367 | | | | 281 | | | | 16 | | | | 297 | | | | 351 | | | | 16 | | | | 367 | |
Total securities available for sale | | | 2,120 | | | | 40,298 | | | | 7,118 | | | | 49,536 | | | | 2,620 | | | | 41,230 | | | | 7,202 | | | | 51,052 | | | | 1,761 | | | | 39,376 | | | | 6,762 | | | | 47,899 | | | | 2,620 | | | | 41,230 | | | | 7,202 | | | | 51,052 | |
Financial derivatives (a) (b) | | | | | | | | | | | | | | | | | | | | | | | | | | | | | | | | | | | |
Interest rate contracts | | | 8 | | | | 7,431 | | | | 88 | | | | 7,527 | | | | 5 | | | | 8,326 | | | | 101 | | | | 8,432 | | | | 27 | | | | 6,248 | | | | 50 | | | | 6,325 | | | | 5 | | | | 8,326 | | | | 101 | | | | 8,432 | |
Other contracts | | | | | 223 | | | | 5 | | | | 228 | | | | | | 131 | | | | 5 | | | | 136 | | | | 259 | | | | 1 | | | | 260 | | | | | 131 | | | | 5 | | | | 136 | |
Total financial derivatives | | | 8 | | | | 7,654 | | | | 93 | | | | 7,755 | | | | 5 | | | | 8,457 | | | | 106 | | | | 8,568 | | | | 27 | | | | 6,507 | | | | 51 | | | | 6,585 | | | | 5 | | | | 8,457 | | | | 106 | | | | 8,568 | |
Residential mortgage loans held for sale (c) | | | | | 2,160 | | | | 44 | | | | 2,204 | | | | | | 2,069 | | | | 27 | | | | 2,096 | | | | | | 2,216 | | | | 30 | | | | 2,246 | | | | | | 2,069 | | | | 27 | | | | 2,096 | |
Trading securities (d) | | | | | | | | | | | | | | | | | | | | | | | | | | | | | | | | | | | |
Debt (e) (f) | | | 1,028 | | | | 1,157 | | | | 32 | | | | 2,217 | | | | 1,062 | | | | 951 | | | | 32 | | | | 2,045 | | | | 1,277 | | | | 781 | | | | 32 | | | | 2,090 | | | | 1,062 | | | | 951 | | | | 32 | | | | 2,045 | |
Equity | | | 26 | | | | | | | | 26 | | | | 42 | | | | 9 | | | | | | 51 | | | | 19 | | | | 19 | | | | 42 | | | | 9 | | | | 51 | |
Total trading securities | | | 1,054 | | | | 1,157 | | | | 32 | | | | 2,243 | | | | 1,104 | | | | 960 | | | | 32 | | | | 2,096 | | | | 1,296 | | | | 781 | | | | 32 | | | | 2,109 | | | | 1,104 | | | | 960 | | | | 32 | | | | 2,096 | |
Trading loans | | | | | 28 | | | | | | 28 | | | | | | 76 | | | | | | 76 | | | | | | 21 | | | | | | 21 | | | | | | 76 | | | | | | 76 | |
Residential mortgage servicing rights (g) | | | | | | | 779 | | | | 779 | | | | | | | | 650 | | | | 650 | | | | | | | | 975 | | | | 975 | | | | | | | | 650 | | | | 650 | |
Commercial mortgage loans held for sale (c) | | | | | | | 769 | | | | 769 | | | | | | | | 772 | | | | 772 | | | | | | | | 635 | | | | 635 | | | | | | | | 772 | | | | 772 | |
Equity investments | | | | | | | | | | | | | | | | | | | | | | | | | | | | | | | | | | | |
Direct investments | | | | | | | 1,193 | | | | 1,193 | | | | | | | | 1,171 | | | | 1,171 | | | | | | | | 1,115 | | | | 1,115 | | | | | | | | 1,171 | | | | 1,171 | |
Indirect investments (h) | | | | | | | 627 | | | | 627 | | | | | | | | 642 | | | | 642 | | | | 623 | | | | 623 | | | | | 642 | | | | 642 | |
Total equity investments | | | | | | | 1,820 | | | | 1,820 | | | | | | | | 1,813 | | | | 1,813 | | | | 1,738 | | | | 1,738 | | | | | 1,813 | | | | 1,813 | |
Customer resale agreements (i) | | | | | 213 | | | | | | 213 | | | | | | 256 | | | | | | 256 | | | | | | 210 | | | | | | 210 | | | | | | 256 | | | | | | 256 | |
Loans (j) | | | | | 362 | | | | 272 | | | | 634 | | | | | | 110 | | | | 134 | | | | 244 | | | | | | 500 | | | | 311 | | | | 811 | | | | | | 110 | | | | 134 | | | | 244 | |
Other assets | | | | | | | | | | | | | | | | | | | | | | | | | | | | | | | | | | | |
BlackRock Series C Preferred Stock (k) | | | | | | | 270 | | | | 270 | | | | | | | | 243 | | | | 243 | | | | | | | | 270 | | | | 270 | | | | | | | | 243 | | | | 243 | |
Other | | | 307 | | | | 202 | | | | 9 | | | | 518 | | | | 283 | | | | 194 | | | | 9 | | | | 486 | | | | 330 | | | | 189 | | | | 8 | | | | 527 | | | | 283 | | | | 194 | | | | 9 | | | | 486 | |
Total other assets | | | 307 | | | | 202 | | | | 279 | | | | 788 | | | | 283 | | | | 194 | | | | 252 | | | | 729 | | | | 330 | | | | 189 | | | | 278 | | | | 797 | | | | 283 | | | | 194 | | | | 252 | | | | 729 | |
Total assets | | $ | 3,489 | | | $ | 52,074 | | | $ | 11,206 | | | $ | 66,769 | | | $ | 4,012 | | | $ | 53,352 | | | $ | 10,988 | | | $ | 68,352 | | | $ | 3,414 | | | $ | 49,800 | | | $ | 10,812 | | | $ | 64,026 | | | $ | 4,012 | | | $ | 53,352 | | | $ | 10,988 | | | $ | 68,352 | |
Liabilities | | | | | | | | | | | | | | | | | | | | | | | | | | | | | | | | | | | |
Financial derivatives (b) (l) | | | | | | | | | | | | | | | | | | | | | | | | | | | | | | | | | | | |
Interest rate contracts | | $ | 3 | | | $ | 5,364 | | | $ | 10 | | | $ | 5,377 | | | $ | 1 | | | $ | 6,105 | | | $ | 12 | | | $ | 6,118 | | | $ | 12 | | | $ | 4,771 | | | $ | 48 | | | $ | 4,831 | | | $ | 1 | | | $ | 6,105 | | | $ | 12 | | | $ | 6,118 | |
BlackRock LTIP | | | | | | | 270 | | | | 270 | | | | | | | | 243 | | | | 243 | | | | | | | | 270 | | | | 270 | | | | | | | | 243 | | | | 243 | |
Other contracts | | | | | 140 | | | | 120 | | | | 260 | | | | | | 128 | | | | 121 | | | | 249 | | | | 164 | | | | 65 | | | | 229 | | | | | 128 | | | | 121 | | | | 249 | |
Total financial derivatives | | | 3 | | | | 5,504 | | | | 400 | | | | 5,907 | | | | 1 | | | | 6,233 | | | | 376 | | | | 6,610 | | | | 12 | | | | 4,935 | | | | 383 | | | | 5,330 | | | | 1 | | | | 6,233 | | | | 376 | | | | 6,610 | |
Trading securities sold short (m) | | | | | | | | | | | | | | | | | | | | | | | | | | | | | | | | | | | |
Debt | | | 886 | | | | 42 | | | | | | 928 | | | | 731 | | | | 10 | | | | | | 741 | | | | 929 | | | | 3 | | | | 932 | | | | 731 | | | | 10 | | | | 741 | |
Total trading securities sold short | | | 886 | | | | 42 | | | | | | 928 | | | | 731 | | | | 10 | | | | | | 741 | | | | 929 | | | | 3 | | | | 932 | | | | 731 | | | | 10 | | | | 741 | |
Other Borrowed Funds | | | | | | | 130 | | | | 130 | | | | | | | | | | | |
Other borrowed funds | | | | | | | | 195 | | | | 195 | | | | | | | | | | |
Other liabilities | | | | | 1 | | | | | | 1 | | | | | | 5 | | | | | | 5 | | | | | | 5 | | | | 5 | |
Total liabilities (n) | | $ | 889 | | | $ | 5,547 | | | $ | 530 | | | $ | 6,966 | | | $ | 732 | | | $ | 6,248 | | | $ | 376 | | | $ | 7,356 | | | $ | 941 | | | $ | 4,938 | | | $ | 578 | | | $ | 6,457 | | | $ | 732 | | | $ | 6,248 | | | $ | 376 | | | $ | 7,356 | |
112The PNC Financial Services Group, Inc. –Form 10-Q119
| (a) | Included in Other assets on our Consolidated Balance Sheet. |
| (b) | Amounts at March 31,June 30, 2013 and December 31, 2012 are presented gross and are not reduced by the impact of legally enforceable master netting agreements that allow PNC to net positive and negative positions and cash collateral held or placed with the same counterparty. The net asset amounts were $2.2 billion at June 30, 2013 compared with $2.4 billion at both March 31, 2013 and December 31, 2012 and the net liability amounts were $.7$1.1 billion and $.6 billion, respectively. |
| (c) | Included in Loans held for sale on our Consolidated Balance Sheet. PNC has elected the fair value option for certain commercial and residential mortgage loans held for sale. |
| (d) | Fair value includes net unrealized gainslosses of $51$13 million at March 31,June 30, 2013 compared with net unrealized gains of $59 million at December 31, 2012. |
| (e) | Approximately 29%23% of these securities are residential mortgage-backed securities and 46%61% are USU.S. Treasury and government agencies securities at March 31,June 30, 2013. Comparable amounts at December 31, 2012 were 25% and 52%, respectively. |
| (f) | At both March 31,June 30, 2013 and December 31, 2012, the balance of residential mortgage-backed agency securities with embedded derivatives carried in Trading securities was zero. |
| (g) | Included in Other intangible assets on our Consolidated Balance Sheet. |
| (h) | The indirect equity funds are not redeemable, but PNC receives distributions over the life of the partnership from liquidation of the underlying investments by the investee, which we expect to occur over the next twelve years. The amount of unfunded contractual commitments related to indirect equity investments was $142$134 million and related to direct equity investments was $36$37 million as of March 31,June 30, 2013, respectively. |
| (i) | Included in Federal funds sold and resale agreements on our Consolidated Balance Sheet. PNC has elected the fair value option for these items. |
| (j) | Included in Loans on our Consolidated Balance Sheet. |
| (k) | PNC has elected the fair value option for these shares. |
| (l) | Included in Other liabilities on our Consolidated Balance Sheet. |
| (m) | Included in Other borrowed funds on our Consolidated Balance Sheet. |
(n) | Included in the March 31, 2013 Level 3 Total liabilities are $201 million of obligations that we have elected to account for at fair value related to a Non-agency securitization that PNC consolidated in the first quarter of 2013. |
Reconciliations of assets and liabilities measured at fair value on a recurring basis using Level 3 inputs for the three months and six months ended June 30, 2013 and 2012 follow.
Table 90: Reconciliation of Level 3 Assets and Liabilities
Three Months Ended March 31,June 30, 2013
| | | | | | | Total realized /unrealized gains
or losses for the period (a) | | | | | | | | | | | | | | | | | | Unrealized
gains (losses)
on assets and
liabilities held on
Consolidated
Balance Sheet at
Mar. 31,
2013 (c) | | |
Level 3 Instruments Only In millions | | | Fair Value
March 31,
2013 | | | Total realized / unrealized gains or losses for the period (a) | | | Purchases | | | Sales | | | Issuances | | | Settlements | | | Transfers
into
Level 3 (b) | | | Transfers
out of
Level 3 (b) | | | Fair
Value
June 30,
2013 | | | Unrealized gains (losses) on assets and
liabilities held on Consolidated
Balance Sheet at June 30, 2013 (c) | |
| | Fair Value
Dec. 31,
2012 | | Included in
Earnings | | Included
in Other
comprehensive
income | | Purchases | | Sales | | Issuances | | Settlements | | Transfers
into
Level 3 (b) | | Transfers
out of
Level 3 (b) | | Fair Value
Mar. 31,
2013 | | | Unrealized
gains (losses)
on assets and
liabilities held on
Consolidated
Balance Sheet at
Mar. 31,
2013 (c) | | | | Included in
Earnings | | Included in Other comprehensive income | | |
Assets | | | | | | | |
Securities available for sale | | | | | | | | | | | | | | | | | | | | | | | | | | | | | | | | | | | | | | | | | | | | | | | |
Residential mortgage- backed non-agency | | $ | 6,107 | | | $ | 43 | | | $ | 139 | | | | | | | | | $ | (251 | ) | | | | | | $ | 6,038 | | | $ | (7 | ) | |
Residential mortgage-backed non-agency | | | $ | 6,038 | | | $ | 47 | | | $ | (100 | ) | | | | | | | | $ | (274 | ) | | | | | | $ | 5,711 | | | $ | (3 | ) |
Commercial mortgage-backed non-agency | | | | | 1 | | | | | | | | | | | | (1 | ) | | | | | | | | | | | | | | | 2 | | | | | | | | | | | | (2 | ) | | | | | | | | | |
Asset-backed | | | 708 | | | | 3 | | | | 25 | | | | | | | | | | (35 | ) | | | | | | | 701 | | | | (3 | ) | | | 701 | | | | 1 | | | | 4 | | | | | | | | | | (34 | ) | | | | | | | 672 | | | | (1 | ) |
State and municipal | | | 339 | | | | 1 | | | | 2 | | | | | | | | | | (12 | ) | | | | | | | 330 | | | | | | | 330 | | | | | | (2 | ) | | $ | 4 | | | | | | | | (1 | ) | | | | | | | 331 | | | | |
Other debt | | | 48 | | | $ | 1 | | | | 49 | | | | | | 49 | | | | 1 | | | $ | (2 | ) | | | 48 | | | | |
Total securities available for sale | | | 7,202 | | | | 48 | | | | 166 | | | | 1 | | | | (299 | ) | | | 7,118 | | | | (10 | ) | | | 7,118 | | | | 50 | | | | (98 | ) | | | 5 | | | | (2 | ) | | | (311 | ) | | | 6,762 | | | | (4 | ) |
Financial derivatives | | | 106 | | | | 89 | | | | | | 1 | | | | | | | | (103 | ) | | | | | | | 93 | | | | 76 | | | | 93 | | | | 64 | | | | | | 1 | | | | | | | | (105 | ) | | | | $ | (2 | ) | | | 51 | | | | 50 | |
Residential mortgage loans held for sale | | | 27 | | | | 1 | | | | | | 28 | | | | | | | | | $ | 3 | | | $ | (15 | ) | | | 44 | | | | 1 | | | | 44 | | | | | | | | 21 | | | | (1 | ) | | | | | 1 | | | $ | 3 | | | | (38 | ) | | | 30 | | | | |
Trading securities – Debt | | | 32 | | | | | | | | | | | | | | | | | | | | 32 | | | | | | | 32 | | | | | | | | | | | | | | | | | | | | 32 | | | | |
Residential mortgage servicing rights | | | 650 | | | | 78 | | | | | | 64 | | | | | $ | 37 | | | | (50 | ) | | | | | | | 779 | | | | 75 | | | | 779 | | | | 208 | | | | | | | | | $ | 43 | | | | (55 | ) | | | | | | | 975 | | | | 208 | |
Commercial mortgage loans held for sale | | | 772 | | | | 1 | | | | | | | $ | (2 | ) | | | | | (2 | ) | | | | | | | 769 | | | | | | | 769 | | | | (13 | ) | | | | | | | (100 | ) | | | | | (21 | ) | | | | | | | 635 | | | | (14 | ) |
Equity investments | | | | | | | | | | | | | | | | | | | | | | | | | | | | | | | | | | | | | | | | | | | | | | | |
Direct investments | | | 1,171 | | | | 19 | | | | | | 14 | | | | (11 | ) | | | | | | | | | | | 1,193 | | | | 14 | | | | 1,193 | | | | 15 | | | | | | 49 | | | | (142 | ) | | | | | | | | | | | 1,115 | | | | |
Indirect investments | | | 642 | | | | 13 | | | | 4 | | | | (32 | ) | | | 627 | | | | 13 | | | | 627 | | | | 20 | | | | 6 | | | | (30 | ) | | | 623 | | | | 20 | |
Total equity investments | | | 1,813 | | | | 32 | | | | 18 | | | | (43 | ) | | | 1,820 | | | | 27 | | | | 1,820 | | | | 35 | | | | 55 | | | | (172 | ) | | | 1,738 | | | | 20 | |
Loans | | | 134 | | | | 5 | | | | | | | | | | | | 125 | | | | 12 | | | | (4 | ) | | | 272 | | | | 5 | | | | 272 | | | | 16 | | | | | | | | | | | | (10 | ) | | | 45 | | | | (12 | ) | | | 311 | | | | 12 | |
Other assets | | | | | | | | | | | | | | | | | | | | | | | | | | | | | | | | | | | | | | | | | | | | | | | |
BlackRock Series C | | | | | | | | | | | | | | | | | | | | | | | | | |
Preferred Stock | | | 243 | | | | 60 | | | | | | | | | | | | (33 | ) | | | | | | | 270 | | | | 60 | | |
BlackRock Series C Preferred Stock | | | | 270 | | | | | | | | | | | | | | | | | | | | 270 | | | | |
Other | | | 9 | | | | 9 | | | | | | 9 | | | | (1 | ) | | | 8 | | | | |
Total other assets | | | 252 | | | | 60 | | | | (33 | ) | | | 279 | | | | 60 | | | | 279 | | | | (1 | ) | | | 278 | | | | |
Total assets | | $ | 10,988 | | | $ | 314 | (e) | | $ | 166 | | | $ | 112 | | | $ | (45 | ) | | $ | 37 | | | $ | (362 | ) | | $ | 15 | | | $ | (19 | ) | | $ | 11,206 | | | $ | 234 | (f) | | $ | 11,206 | | | $ | 360 | (e) | | $ | (99 | ) | | $ | 82 | | | $ | (275 | ) | | $ | 43 | | | $ | (501 | ) | | $ | 48 | | | $ | (52 | ) | | $ | 10,812 | | | $ | 272 | (f) |
Liabilities | | | | | | | | | | | | | | | | | | | | | | | | | | | | | | | | | | | | | | | | | | | | | | | |
Financial derivatives | | | 376 | | | | 76 | | | | | | | | | | | | (52 | ) | | | | | | | 400 | | | | 51 | | |
Financial derivatives (d) | | | | 400 | | | | 84 | | | | | | | | 1 | | | | | | (102 | ) | | | | | | | 383 | | | | 16 | |
Other borrowed funds | | | 130 | | | | 130 | | | | | | 130 | | | | 3 | | | | 62 | | | | 195 | | | | |
Total liabilities | | $ | 376 | | | $ | 76 | (e) | | $ | 78 | | | $ | 530 | | | $ | 51 | (f) | | $ | 530 | | | $ | 87 | (e) | | $ | 1 | | | $ | (40 | ) | | $ | 578 | | | $ | 16 | (f) |
120 The PNC Financial Services Group, Inc. –Form 10-Q
Three Months Ended June 30, 2012
| | | | | | | | | | | | | | | | | | | | | | | | | | | | | | | | | | | | | | | | |
| | | | | | Total realized / unrealized gains or losses for the period (a) | | | | | | | | | | | | | | | | | | | | | Unrealized gains (losses) on assets and liabilities held on | |
Level 3 Instruments
Only
In millions | | Fair Value
March 31,
2012 | | | Included in
Earnings | | | Included
in Other
comprehensive
income | | | Purchases | | | Sales | | | Issuances | | | Settlements | | | Transfers
out of
Level 3 (b) | | | Fair
Value
June 30,
2012 | | | Consolidated
Balance
Sheet
at June 30,
2012 (c) | |
Assets | | | | | | | | | | | | | | | | | | | | | | | | | | | | | | | | | | | | | | | | |
Securities available for sale | | | | | | | | | | | | | | | | | | | | | | | | | | | | | | | | | | | | | | | | |
Residential mortgage-backed non-agency | | $ | 6,121 | | | $ | 20 | | | $ | (34 | ) | | $ | 47 | | | | | | | | | | | $ | (267 | ) | | | | | | $ | 5,887 | | | $ | (31 | ) |
Commercial mortgage-backed non-agency | | | | | | | 1 | | | | | | | | | | | | | | | | | | | | (1 | ) | | | | | | | | | | | | |
Asset-backed | | | 752 | | | | (1 | ) | | | 17 | | | | | | | $ | (47 | ) | | | | | | | (33 | ) | | | | | | | 688 | | | | (3 | ) |
State and municipal | | | 336 | | | | 1 | | | | | | | | | | | | | | | | | | | | | | | | | | | | 337 | | | | | |
Other debt | | | 55 | | | | | | | | | | | | 3 | | | | (3 | ) | | | | | | | | | | | | | | | 55 | | | | | |
Total securities available for sale | | | 7,264 | | | | 21 | | | | (17 | ) | | | 50 | | | | (50 | ) | | | | | | | (301 | ) | | | | | | | 6,967 | | | | (34 | ) |
Financial derivatives | | | 84 | | | | 115 | | | | | | | | 1 | | | | | | | | | | | | (82 | ) | | $ | (1 | ) | | | 117 | | | | 123 | |
Trading securities – Debt | | | 39 | | | | 2 | | | | | | | | | | | | | | | | | | | | | | | | | | | | 41 | | | | 1 | |
Residential mortgage servicing rights | | | 724 | | | | (126 | ) | | | | | | | | | | | | | | $ | 24 | | | | (41 | ) | | | | | | | 581 | | | | (124 | ) |
Commercial mortgage loans held for sale | | | 840 | | | | 4 | | | | | | | | | | | | | | | | | | | | (7 | ) | | | | | | | 837 | | | | (2 | ) |
Equity investments | | | | | | | | | | | | | | | | | | | | | | | | | | | | | | | | | | | | | | | | |
Direct investments | | | 865 | | | | 20 | | | | | | | | 116 | | | | (44 | ) | | | | | | | | | | | | | | | 957 | | | | 20 | |
Indirect investments | | | 657 | | | | 37 | | | | | | | | 19 | | | | (36 | ) | | | | | | | | | | | | | | | 677 | | | | 35 | |
Total equity investments | | | 1,522 | | | | 57 | | | | | | | | 135 | | | | (80 | ) | | | | | | | | | | | | | | | 1,634 | | | | 55 | |
Loans | | | 6 | | | | | | | | | | | | 1 | | | | | | | | | | | | | | | | | | | | 7 | | | | | |
Other assets | | | | | | | | | | | | | | | | | | | | | | | | | | | | | | | | | | | | | | | | |
BlackRock Series C
Preferred Stock | | | 241 | | | | (41 | ) | | | | | | | | | | | | | | | | | | | | | | | | | | | 200 | | | | (41 | ) |
Other | | | 7 | | | | | | | | | | | | | | | | | | | | | | | | | | | | | | | | 7 | | | | | |
Total other assets | | | 248 | | | | (41 | ) | | | | | | | | | | | | | | | | | | | | | | | | | | | 207 | | | | (41 | ) |
Total assets | | $ | 10,727 | | | $ | 32 | (e) | | $ | (17 | ) | | $ | 187 | | | $ | (130 | ) | | $ | 24 | | | $ | (431 | ) | | $ | (1 | ) | | $ | 10,391 | | | $ | (22 | ) (f) |
Total liabilities (d) | | $ | 334 | | | $ | (56 | ) (e) | | | | | | | | | | $ | 1 | | | | | | | $ | 10 | | | | | | | $ | 289 | | | $ | (40 | ) (f) |
The PNC Financial Services Group, Inc. –Form 10-Q 113121
ThreeSix Months Ended March 31,June 30, 2013
| | | | | | | | | | | | | | | | | | | | | | | | | | | | | | | | | | | | | | | | | | | | |
| | | | | | Total realized / unrealized gains or losses for the period (a) | | | | | | | | | | | | | | | | | | | | | | | | Unrealized
gains (losses)
on assets and
liabilities held on | |
Level 3 Instruments Only
In millions | | Fair Value
Dec. 31,
2012 | | | Included in
Earnings | | | Included in Other
comprehensive
income | | | Purchases | | | Sales | | | Issuances | | | Settlements | | | Transfers
into
Level 3 (b) | | | Transfers
out of
Level 3 (b) | | | Fair Value
June 30,
2013 | | | Consolidated Balance
Sheet
at June 30,
2013 (c) | |
Assets | | | | | | | | | | | | | | | | | | | | | | | | | | | | | | | | | | | | | | | | | | | | |
Securities available for sale | | | | | | | | | | | | | | | | | | | | | | | | | | | | | | | | | | | | | | | | | | | | |
Residential mortgage-backed non-agency | | $ | 6,107 | | | $ | 90 | | | $ | 39 | | | | | | | | | | | | | | | $ | (525 | ) | | | | | | | | | | $ | 5,711 | | | $ | (10 | ) |
Commercial mortgage-backed non-agency | | | | | | | 3 | | | | | | | | | | | | | | | | | | | | (3 | ) | | | | | | | | | | | | | | | | |
Asset-backed | | | 708 | | | | 4 | | | | 29 | | | | | | | | | | | | | | | | (69 | ) | | | | | | | | | | | 672 | | | | (4 | ) |
State and municipal | | | 339 | | | | 1 | | | | | | | $ | 4 | | | | | | | | | | | | (13 | ) | | | | | | | | | | | 331 | | | | | |
Other debt | | | 48 | | | | | | | | | | | | 2 | | | $ | (2 | ) | | | | | | | | | | | | | | | | | | | 48 | | | | | |
Total securities available for sale | | | 7,202 | | | | 98 | | | | 68 | | | | 6 | | | | (2 | ) | | | | | | | (610 | ) | | | | | | | | | | | 6,762 | | | | (14 | ) |
Financial derivatives | | | 106 | | | | 153 | | | | | | | | 2 | | | | | | | | | | | | (208 | ) | | | | | | $ | (2 | ) | | | 51 | | | | 113 | |
Residential mortgage loans held for sale | | | 27 | | | | 1 | | | | | | | | 49 | | | | (1 | ) | | | | | | | 1 | | | $ | 6 | | | | (53 | ) | | | 30 | | | | 1 | |
Trading securities – Debt | | | 32 | | | | | | | | | | | | | | | | | | | | | | | | | | | | | | | | | | | | 32 | | | | | |
Residential mortgage servicing rights | | | 650 | | | | 286 | | | | | | | | 64 | | | | | | | $ | 80 | | | | (105 | ) | | | | | | | | | | | 975 | | | | 279 | |
Commercial mortgage loans held for sale | | | 772 | | | | (12 | ) | | | | | | | | | | | (102 | ) | | | | | | | (23 | ) | | | | | | | | | | | 635 | | | | (13 | ) |
Equity investments | | | | | | | | | | | | | | | | | | | | | | | | | | | | | | | | | | | | | | | | | | | | |
Direct investments | | | 1,171 | | | | 34 | | | | | | | | 63 | | | | (153 | ) | | | | | | | | | | | | | | | | | | | 1,115 | | | | 14 | |
Indirect investments | | | 642 | | | | 33 | | | | | | | | 10 | | | | (62 | ) | | | | | | | | | | | | | | | | | | | 623 | | | | 33 | |
Total equity investments | | | 1,813 | | | | 67 | | | | | | | | 73 | | | | (215 | ) | | | | | | | | | | | | | | | | | | | 1,738 | �� | | | 47 | |
Loans | | | 134 | | | | 21 | | | | | | | | | | | | | | | | | | | | 115 | | | | 57 | | | | (16 | ) | | | 311 | | | | 17 | |
Other assets | | | | | | | | | | | | | | | | | | | | | | | | | | | | | | | | | | | | | | | | | | | | |
BlackRock Series C
Preferred Stock | | | 243 | | | | 60 | | | | | | | | | | | | | | | | | | | | (33 | ) | | | | | | | | | | | 270 | | | | 60 | |
Other | | | 9 | | | | | | | | (1 | ) | | | | | | | | | | | | | | | | | | | | | | | | | | | 8 | | | | | |
Total other assets | | | 252 | | | | 60 | | | | (1 | ) | | | | | | | | | | | | | | | (33 | ) | | | | | | | | | | | 278 | | | | 60 | |
Total assets | | $ | 10,988 | | | $ | 674 | (e) | | $ | 67 | | | $ | 194 | | | $ | (320 | ) | | $ | 80 | | | $ | (863 | ) | | $ | 63 | | | $ | (71 | ) | | $ | 10,812 | | | $ | 490 | (f) |
Liabilities | | | | | | | | | | | | | | | | | | | | | | | | | | | | | | | | | | | | | | | | | | | | |
Financial derivatives (d) | | | 376 | | | | 160 | | | | | | | | | | | | 1 | | | | | | | | (154 | ) | | | | | | | | | | | 383 | | | | 77 | |
Other borrowed funds | | | | | | | 3 | | | | | | | | | | | | | | | | | | | | 192 | | | | | | | | | | | | 195 | | | | | |
Total liabilities | | $ | 376 | | | $ | 163 | (e) | | | | | | | | | | $ | 1 | | | | | | | $ | 38 | | | | | | | | | | | $ | 578 | | | $ | 77 | (f) |
122 The PNC Financial Services Group, Inc. –Form 10-Q
Six Months Ended June 30, 2012
| | | | | | | Total realized / unrealized gains
or losses for the period (a) | | | | | | | | | | | | | | | | | | Unrealized
gains (losses) on
assets and
liabilities held on Consolidated
Balance Sheet
at Mar. 31,
2012 (c) | | | | | | Total realized / unrealized gains or losses for the period (a) | | | | | | | | | | | | | | | | | | Unrealized
gains (losses) on assets and liabilities held on Consolidated
Balance
Sheet at June 30, 2012 (c) | |
Level 3 Instruments Only In millions | | Fair Value
Dec. 31,
2011 | | Included in
Earnings | | Included
in Other
comprehensive
income | | Purchases | | Sales | | Issuances | | Settlements | | Transfers
into
Level 3 (b) | | Transfers
out of
Level 3 (b) | | Fair Value
Mar. 31,
2012 | | | | Fair Value
Dec. 31,
2011 | | Included in
Earnings | | Included
in Other
comprehensive
income | | Purchases | | Sales | | Issuances | | Settlements | | Transfers
into
Level 3 (b) | | Transfers
out of
Level 3 (b) | | Fair
Value
June 30,
2012 | | |
Assets | | | | | | | | |
Securities available for sale | | | | | | | | | | | | | | | | | | | | | | | | | | | | | | | | | | | | | | | | | | | | | | | |
Residential mortgage-backed non-agency | | $ | 5,557 | | | $ | (9 | ) | | $ | 520 | | | | | $ | (163 | ) | | | | $ | (242 | ) | | $ | 458 | | | | | $ | 6,121 | | | $ | (32 | ) | | $ | 5,557 | | | $ | 11 | | | $ | 486 | | | $ | 47 | | | $ | (163 | ) | | | | $ | (509 | ) | | $ | 458 | | | | | $ | 5,887 | | | $ | (63 | ) |
Commercial mortgage backed non-agency | | | | | 1 | | | | | | | | | | | | (1 | ) | | | | | | | | | | | | | | | 2 | | | | | | | | | | | | (2 | ) | | | | | | | | | |
Asset-backed | | | 787 | | | | (5 | ) | | | 41 | | | | | | (38 | ) | | | | | (33 | ) | | | | | | | 752 | | | | (5 | ) | | | 787 | | | | (7 | ) | | | 59 | | | | | | (87 | ) | | | | | (64 | ) | | | | | | | 688 | | | | (8 | ) |
State and municipal | | | 336 | | | | | | 2 | | | | | | | | | | (2 | ) | | | | | | | 336 | | | | | | | 336 | | | | | | 3 | | | | | | | | | | (2 | ) | | | | | | | 337 | | | | |
Other debt | | | 49 | | | | (1 | ) | | | 1 | | | $ | 6 | | | | 55 | | | | (1 | ) | | | 49 | | | | (1 | ) | | | 1 | | | | 9 | | | | (3 | ) | | | 55 | | | | (1 | ) |
Total securities available for sale | | | 6,729 | | | | (14 | ) | | | 564 | | | | 6 | | | | (201 | ) | | | (278 | ) | | | 458 | | | | – | | | | 7,264 | | | | (38 | ) | | | 6,729 | | | | 5 | | | | 549 | | | | 56 | | | | (253 | ) | | | (577 | ) | | | 458 | | | | 6,967 | | | | (72 | ) |
Financial derivatives | | | 67 | | | | 80 | | | | | | 3 | | | | | | | | (68 | ) | | | 3 | | | | (1 | ) | | | 84 | | | | 73 | | | | 67 | | | | 195 | | | | | | 4 | | | | | | | | (150 | ) | | | 3 | | | $ | (2 | ) | | | 117 | | | | 176 | |
Trading securities – Debt | | | 39 | | | | 1 | | | | | | | | | | | | (1 | ) | | | | | | | 39 | | | | 1 | | | | 39 | | | | 3 | | | | | | | | | | | | (1 | ) | | | | | | | 41 | | | | 2 | |
Residential mortgage servicing rights | | | 647 | | | | 20 | | | | | | 64 | | | | | $ | 29 | | | | (36 | ) | | | | | | | 724 | | | | 21 | | | | 647 | | | | (106 | ) | | | | | 64 | | | | | $ | 53 | | | | (77 | ) | | | | | | | 581 | | | | (104 | ) |
Commercial mortgage loans held for sale | | | 843 | | | | (6 | ) | | | | | | | (3 | ) | | | | | 6 | | | | | | | | 840 | | | | (2 | ) | | | 843 | | | | (2 | ) | | | | | | | (4 | ) | | | | | | | | | | | 837 | | | | (4 | ) |
Equity investments | | | | | | | | | | | | | | | | | | | | | | | | | | | | | | | | | | | | | | | | | | | | | | | |
Direct investments | | | 856 | | | | 22 | | | | | | 43 | | | | (56 | ) | | | | | | | | | | | 865 | | | | 21 | | | | 856 | | | | 42 | | | | | | 159 | | | | (100 | ) | | | | | | | | | | | 957 | | | | 41 | |
Indirect investments | | | 648 | | | | 31 | | | | 11 | | | | (33 | ) | | | 657 | | | | 30 | | | | 648 | | | | 68 | | | | 30 | | | | (69 | ) | | | 677 | | | | 65 | |
Total equity investments | | | 1,504 | | | | 53 | | | | 54 | | | | (89 | ) | | | 1,522 | | | | 51 | | | | 1,504 | | | | 110 | | | | 189 | | | | (169 | ) | | | 1,634 | | | | 106 | |
Loans | | | 5 | | | | | | | | 1 | | | | | | | | | | | | | | 6 | | | | | | | 5 | | | | | | | | 2 | | | | | | | | | | | | | | 7 | | | | |
Other assets | | | | | | | | | | | | | | | | | | | | | | | | | | | | | | | | | | | | | | | | | | | | | | | |
BlackRock Series C | | | | | | | | | | | | | | | | | | | | | | | | | | | | | | | | | | | | | | | | | | | | | | | |
Preferred Stock | | | 210 | | | | 31 | | | | | | | | | | | | | | | | | | 241 | | | | 31 | | | | 210 | | | | (10) | | | | | | | | | | | | | | | | | | 200 | | | | (10) | |
Other | | | 7 | | | | 7 | | | | | | 7 | | | | 7 | | | | |
Total other assets | | | 217 | | | | 31 | | | | 248 | | | | 31 | | | | 217 | | | | (10) | | | | 207 | | | | (10) | |
Total assets | | $ | 10,051 | | | $ | 165 | (e) | | $ | 564 | | | $ | 128 | | | $ | (293 | ) | | $ | 29 | | | $ | (377 | ) | | | 461 | | | $ | (1 | ) | | $ | 10,727 | | | $ | 137 | (f) | | $ | 10,051 | | | $ | 195 | (e) | | $ | 549 | | | $ | 315 | | | $ | (426 | ) | | $ | 53 | | | $ | (805 | ) | | $ | 461 | | | $ | (2 | ) | | $ | 10,391 | | | $ | 94 | (f) |
Total liabilities (d) | | $ | 308 | | | $ | 77 | (e) | | $ | (50 | ) | | | 1 | | | | (2 | ) | | $ | 334 | | | $ | 21 | (f) | | $ | 308 | | | $ | 21 | (e) | | $ | 1 | | | $ | (40 | ) | | $ | 1 | | | $ | (2 | ) | | $ | 289 | | | $ | (8) | (f) |
| (a) | Losses for assets are bracketed while losses for liabilities are not. |
| (b) | PNC’s policy is to recognize transfers in and transfers out as of the end of the reporting period. |
| (c) | The amount of the total gains or losses for the period included in earnings that is attributable to the change in unrealized gains or losses related to those assets and liabilities held at the end of the reporting period. |
| (d) | Financial derivatives, which include swaps entered into in connection with sales of certain Visa Class B common shares. |
| (e) | Net gains (realized and unrealized) included in earnings relating to Level 3 assets and liabilities were $238$273 million for the second quarter of 2013, while for the first threesix months of 2013 compared withthere were $511 million of net gains (realized and unrealized) included in earnings. The comparative amounts included net gains (realized and unrealized) of $88 million for second quarter 2012 and net gains (realized and unrealized) of $174 million for the first threesix months of 2012. These amounts also included amortization and accretion of $57$54 million for the second quarter of 2013 and $111 million for the first threesix months of 2013 compared with $332013. The comparative amounts were $54 million for the second quarter of 2012 and $86 million for the first threesix months of 2012. The amortization and accretion amounts were included in Interest income on the Consolidated Income Statement, and the remaining net gains/(losses) (realized and unrealized) were included in Noninterest income on the Consolidated Income Statement. |
| (f) | Net unrealized gains relating to those assets and liabilities held at the end of the reporting period were $183$256 million for the second quarter of 2013, while for the first six months of 2013 there were $413 million of net unrealized gains. The comparative amounts included net unrealized gains of $18 million for the second quarter of 2012 and net unrealized gains of $102 million for the first three months of 2013 compared with net unrealized gains of $116 million for the first threesix months of 2012. These amounts were included in Noninterest income on the Consolidated Income Statement. |
The PNC Financial Services Group, Inc. –Form 10-Q123
An instrument’s categorization within the hierarchy is based on the lowest level of input that is significant to the fair value measurement. PNC reviews and updates fair value hierarchy classifications quarterly. Changes from one quarter to the next related to the observability of inputs to a fair value measurement may result in a reclassification (transfer) of assets or liabilities between hierarchy levels. PNC’s policy is to recognize transfers in and transfers out as of the end of the reporting period. During the first threesix months of 2013, there were transfers of residential mortgage loans held for sale and loans from Level 2 to Level 3 of $3$6 million and $1$11 million, respectively, as a result of reduced market activity in the nonperforming residential mortgage sales market which reduced the observability of valuation inputs. Also during 2013, there were transfers out of Level 3 residential mortgage loans held for sale and loans of $4$7 million and $4$16 million, respectively, primarily due to the transfer of residential mortgage loans held for sale and loans to OREO. In addition, there was approximately $11$46 million of Level 3 residential mortgage loans held for sale reclassified to Level 3 loans during the first threesix months of 2013 due to the loans being reclassified from held for sale loans to held in portfolio loans. This amount was included in Transfers out of Level 3 residential mortgages loans held for sale and Transfers into Level 3 loans within Table 90: Reconciliation of Level 3 Assets and Liabilities. In the comparable period of 2012, there were transfers of assets and liabilities from Level 2 to Level 3 of $460 million consisting of mortgage-backed available for sale securities transferred as a result of a ratings downgrade which reduced the observability of valuation inputs.
114 The PNC Financial Services Group, Inc. –Form 10-Q
Quantitative information about the significant unobservable inputs within Level 3 recurring assets and liabilities follows.
Table 91: Fair Value Measurement – Recurring Quantitative Information
March 31,June 30, 2013
| Level 3 Instruments Only Dollars in millions | | Fair Value | | Valuation Techniques | | Unobservable Inputs | | Range (Weighted Average) | | | | Fair Value | | Valuation Techniques | | Unobservable Inputs | | Range (Weighted Average) | |
Residential mortgage-backed non-agency | | $ | 6,038 | | | Priced by a third-party vendor
using a discounted cash flow
pricing model (a) | | Constant prepayment rate (CPR)
Constant default rate (CDR)
Loss Severity
Spread over the benchmark curve (b) | | 1.0%-30.0%(5.0%)
0.0%-24.0%(7.0%)
6.0%-96.0%(52.0%)
266bps weighted average | | (a)
(a)
(a)
(a) | |
Residential mortgage-backednon-agency | | | $ | 5,711 | | | Priced by a third-party vendor | | Constant prepayment rate (CPR) | | 1.0%-27.0%(5.0%) | | | (a | ) |
| | | | | using a discounted cash flow | | Constant default rate (CDR) | | 0%-22.0%(7.0%) | | | (a | ) |
| | | | | pricing model (a) | | Loss Severity | | 6.0%-100%(51.0%) | | | (a | ) |
| | | | | | | Spread over the benchmark curve (b) | | 267bps weighted average | | | (a | ) |
Asset-backed | | | 701 | | | Priced by a third-party vendor
using a discounted cash flow
pricing model (a) | | Constant prepayment rate (CPR)
Constant default rate (CDR)
Loss Severity
Spread over the benchmark curve (b) | | 1.0%-12.0%(4.0%)
1.0%-19.0%(9.0%)
10.0%-100.0%(72.0%)
393bps weighted average | | (a)
(a)
(a)
(a) | | | 672 | | | Priced by a third-party vendor | | Constant prepayment rate (CPR) | | 1.0%-11.0%(4.0%) (a) | | | |
| | | | | using a discounted cash flow | | Constant default rate (CDR) | | 3.0%-19.0%(10.0%) (a) | | | |
| | | | | pricing model (a) | | Loss Severity | | 10.0%-100%(73.0%) (a) | | | |
| | | | | | | Spread over the benchmark curve (b) | | 358bps weighted average | | | (a | ) |
State and municipal | | | 132 | | | Discounted cash flow | | Spread over the benchmark curve (b) | | 80bps-235bps (96bps) | | | | | 130 | | | Discounted cash flow | | Spread over the benchmark curve (b) | | 85bps-240bps (101bps) | | | |
| | | 198 | | | Consensus pricing (c) | | Credit and Liquidity discount | | 0.0%-30.0%(8.0%) | | | | | 201 | | | Consensus pricing (c) | | Credit and Liquidity discount | | 0%-30.0%(8.0%) | | | |
Other debt | | | 49 | | | Consensus pricing (c) | | Credit and Liquidity discount | | 7.0%-95.0%(86.0%) | | | | | 48 | | | Consensus pricing (c) | | Credit and Liquidity discount | | 7.0%-95.0%(86.0%) | | | |
Residential mortgage loan commitments | | | 70 | | | Discounted cash flow | | Probability of funding
Embedded servicing value | | 10.5%-99.0%(71.8%)
0.5%-1.2%(0.9%) | | | |
Trading securities – Debt | | | 32 | | | Consensus pricing (c) | | Credit and Liquidity discount | | 8.0%-20.0%(12.0%) | | | |
Commercial mortgage loan commitments | | | | 37 | | | Discounted cash flow | | Spread over the benchmark curve (b) Embedded servicing value | | 80bps-500bps (153bps) .8%-3.0%(1.1%) | | | |
Trading securities - Debt | | | | 32 | | | Consensus pricing (c) | | Credit and Liquidity discount | | 0%-20.0%(8.3%) | | | |
Residential mortgage loans held for sale | | | 44 | | | Consensus pricing (c) | | Cumulative default rate
Loss Severity
Gross discount rate | | 2.6%-100.0%(67.5%)
0.0%-96.2%(52.3%)
14.0%-15.3%(14.6%) | | | | | 30 | | | Consensus pricing (c) | | Cumulative default rate | | 2.6%-100%(6.8%) | | | |
| | | | | | | Loss Severity | | 0%-86.7%(47.9%) | | | |
| | | | | | | Gross discount rate | | 13.0%-14.0%(13.3%) | | | |
Residential mortgage servicing rights | | | 779 | | | Discounted cash flow | | Constant prepayment rate (CPR)
Spread over the benchmark curve (b) | | 3.9%-51.7%(15.1%)
939bps-1,927bps
(1,101bps) | | | | | 975 | | | Discounted cash flow | | Constant prepayment rate (CPR) | | 3.8%-48.7%(10.1%) | | | |
| | | | | | | Spread over the benchmark curve (b) | | 939bps-1,918bps (1,096bps) | | | |
Commercial mortgage loans held for sale | | | 769 | | | Discounted cash flow | | Spread over the benchmark curve (b) | | 475bps-4,985bps
(1,033bps) | | | | | 635 | | | Discounted cash flow | | Spread over the benchmark curve (b) | | 460bps-5,160bps (947bps) | | | |
Equity investments – Direct investments | | | 1,193 | | | Multiple of adjusted earnings | | Multiple of earnings | | 4.5-9.5(7.1) | | | |
Equity investments – Indirect (d) | | | 627 | | | Net asset value | | Net asset value | | | | | |
Loans – Residential real estate | | | 135 | | | Consensus pricing (c) | | Cumulative default rate
Loss Severity
Gross discount rate | | 2.6%-100.0%(86.2%)
0.0%-100.0%(56.7%)
12.0%-12.5%(12.4%) | | | |
Loans – Home equity | | | 137 | | | Consensus pricing (c) | | Credit and Liquidity discount | | 37.0%-99.0%(67.0%) | | | |
Equity investments - Direct investments | | | | 1,115 | | | Multiple of adjusted earnings | | Multiple of earnings | | 4.5x-9.5x (7.1x) | | | |
Equity investments - Indirect (d) | | | | 623 | | | Net asset value | | Net asset value | | | | | |
Loans - Residential real estate | | | | 178 | | | Consensus pricing (c) | | Cumulative default rate | | 2.6%-100%(85.7%) | | | |
| | | | | | | Loss Severity | | 0%-100%(52.9%) | | | |
| | | | | | | Gross discount rate | | 12.0% | | | |
Loans - Home equity | | | | 133 | | | Consensus pricing (c) | | Credit and Liquidity discount | | 37.0%-99.0%(69.0%) | | | |
BlackRock Series C Preferred Stock | | | 270 | | | Consensus pricing (c) | | Liquidity discount | | 20.0% | | | | | 270 | | | Consensus pricing (c) | | Liquidity discount | | 20.0% | | | |
BlackRock LTIP | | | (270 | ) | | Consensus pricing (c) | | Liquidity discount | | 20.0% | | | | | (270 | ) | | Consensus pricing (c) | | Liquidity discount | | 20.0% | | | |
Other derivative contracts (e) | | | (71 | ) | | Discounted cash flow | | Credit and Liquidity discount
Spread over the benchmark curve (b) | | 37.0%-99.0%(46.0%)
69bps | | | |
Swaps related to sales of certain Visa Class B common shares | | | (43 | ) | | Discounted cash flow | | Estimated conversion factor of
Class B shares into Class A shares | | 41.5% | | | |
| | | | | | Estimated growth rate of Visa
Class A share price | | 7.6% | | | |
Swaps related to sales of certain Visa | | | | (61 | ) | | Discounted cash flow | | Estimated conversion factor of | | | | | |
Class B common shares | | | | | | | Class B shares into Class A shares | | 41.5% | | | |
| | | | | | | Estimated growth rate of Visa | | | | | |
| | | | | | | Class A share price | | 7.6% | | | |
Other borrowed funds (e) | | | (130 | ) | | Consensus pricing (c) | | Credit and Liquidity discount | | 37.0%-99.0%(63.0%) | | | | | (195 | ) | | Consensus pricing (c) | | Credit and Liquidity discount | | 0%-99.0%(43.0%) | | | |
| | | | | | | Spread over the benchmark curve (b) | | 58bps | | | |
Insignificant Level 3 assets, net of liabilities (f) | | | 16 | | | | | | | | | | | | (30 | ) | | | | | | | | | |
| | | | | | | | | | | | | | | | | | | | | | | |
Total Level 3 assets, net of liabilities (g) | | $ | 10,676 | | | | | | | | | | | $ | 10,234 | | | |
124The PNC Financial Services Group, Inc. –Form 10-Q115
December 31, 2012
| Level 3 Instruments Only Dollars in millions | | Fair Value | | Valuation Techniques | | Unobservable Inputs | | Range (Weighted Average) | | | | Fair Value | | Valuation Techniques | | Unobservable Inputs | | Range (Weighted Average) | |
Residential mortgage-backed non-agency | | $ | 6,107 | | | Priced by a third-party vendor
using a discounted cash flow
pricing model (a) | | Constant prepayment rate (CPR)
Constant default rate (CDR)
Loss Severity
Spread over the benchmark curve (b) | | 1.0%-30.0%(5.0%)
0.0%-24.0%(7.0%)
10.0%-95.0%(52.0%)
315bps weighted average | | (a)
(a)
(a)
(a) | |
Residential mortgage-backednon-agency | | | $ | 6,107 | | | Priced by a third-party vendor | | Constant prepayment rate (CPR) | | 1.0%-30.0%(5.0%) | | | (a | ) |
| | | | | using a discounted cash flow | | Constant default rate (CDR) | | 0%-24.0%(7.0%) | | | (a | ) |
| | | | | pricing model (a) | | Loss Severity | | 10.0%-95.0%(52.0%) | | | (a | ) |
| | | | | | | Spread over the benchmark curve (b) | | 315bps weighted average | | | (a | ) |
Asset-backed | | | 708 | | | Priced by a third-party vendor
using a discounted cash flow
pricing model (a) | | Constant prepayment rate (CPR)
Constant default rate (CDR)
Loss Severity
Spread over the benchmark curve (b) | | 1.0%-11.0%(3.0%)
1.0%-25.0%(9.0%)
10.0%-100.0%(70.0%)
511bps weighted average | | (a)
(a)
(a)
(a) | | | 708 | | | Priced by a third-party vendor | | Constant prepayment rate (CPR) | | 1.0%-11.0%(3.0%) | | | (a | ) |
| | | | | using a discounted cash flow | | Constant default rate (CDR) | | 1.0%-25.0%(9.0%) | | | (a | ) |
| | | | | pricing model (a) | | Loss Severity | | 10.0%-100%(70.0%) | | | (a | ) |
| | | | | | | Spread over the benchmark curve (b) | | 511bps weighted average | | | (a | ) |
State and municipal | | | 130 | | | Discounted cash flow | | Spread over the benchmark curve (b) | | 100bps-280bps (119bps) | | | | | 130 | | | Discounted cash flow | | Spread over the benchmark curve (b) | | 100bps-280bps (119bps) | | | |
| | | 209 | | | Consensus pricing (c) | | Credit and Liquidity discount | | 0.0%-30.0%(8.0%) | | | | | 209 | | | Consensus pricing (c) | | Credit and Liquidity discount | | 0%-30.0%(8.0%) | | | |
Other debt | | | 48 | | | Consensus pricing (c) | | Credit and Liquidity discount | | 7.0%-95.0%(86.0%) | | | | | 48 | | | Consensus pricing (c) | | Credit and Liquidity discount | | 7.0%-95.0%(86.0%) | | | |
Residential mortgage loan commitments | | | 85 | | | Discounted cash flow | | Probability of funding
Embedded servicing value | | 8.5%-99.0%(71.1%)
.5%-1.2%(.9%) | | | | | 85 | | | Discounted cash flow | | Probability of funding | | 8.5%-99.0%(71.1%) | | | |
Trading securities – Debt | | | 32 | | | Consensus pricing (c) | | Credit and Liquidity discount | | 8.0%-20.0%(12.0%) | | | |
Residential mortgage loans held for sale | | | 27 | | | Consensus pricing (c) | | Cumulative default rate
Loss Severity
Gross discount rate | | 2.6%-100.0%(76.1%)
0.0%-92.7%(55.8%)
14.0%-15.3%(14.9%) | | | |
| | | | | | | Embedded servicing value | | .5%-1.2%(.9%) | | | |
Trading securities - Debt | | | | 32 | | | Consensus pricing (c) | | Credit and Liquidity discount | | 8.0%-20.0%(12.0%) | | | |
Residential mortgage loans held | | | | 27 | | | Consensus pricing (c) | | Cumulative default rate | | 2.6%-100%(76.1%) | | | |
for sale | | | | | | | Loss Severity | | 0%-92.7%(55.8%) | | | |
| | | | | | | Gross discount rate | | 14.0%-15.3%(14.9%) | | | |
Residential mortgage servicing rights | | | 650 | | | Discounted cash flow | | Constant prepayment rate (CPR)
Spread over the benchmark curve (b) | | 3.9%-57.3%(18.8%)
939bps-1,929bps
(1,115bps) | | | | | 650 | | | Discounted cash flow | | Constant prepayment rate (CPR) | | 3.9%-57.3%(18.8%) | | | |
| | | | | | | Spread over the benchmark curve (b) | | 939bps-1,929bps (1,115bps) | | | |
Commercial mortgage loans held for sale | | | 772 | | | Discounted cash flow | | Spread over the benchmark curve (b) | | 485bps-4,155bps
(999bps) | | | | | 772 | | | Discounted cash flow | | Spread over the benchmark curve (b) | | 485bps-4,155bps (999bps) | | | |
Equity investments – Direct investments | | | 1,171 | | | Multiple of adjusted earnings | | Multiple of earnings | | 4.5-10.0(7.1) | | | |
Equity investments – Indirect (d) | | | 642 | | | Net asset value | | Net asset value | | | | | |
Loans – Residential real estate | | | 127 | | | Consensus pricing (c) | | Cumulative default rate
Loss Severity
Gross discount rate | | 2.6%-100.0%(76.3%)
0.0%-99.4%(61.1%)
12.0%-12.5%(12.2%) | | | |
Loans – Home equity | | | 7 | | | Consensus pricing (c) | | Credit and Liquidity discount | | 37.0%-97.0%(65.0%) | | | |
Equity investments - Direct investments | | | | 1,171 | | | Multiple of adjusted earnings | | Multiple of earnings | | 4.5x-10.0x (7.1x) | | | |
Equity investments - Indirect (d) | | | | 642 | | | Net asset value | | Net asset value | | | | | |
Loans - Residential real estate | | | | 127 | | | Consensus pricing (c) | | Cumulative default rate | | 2.6%-100%(76.3%) | | | |
| | | | | | | Loss Severity | | 0%-99.4%(61.1%) | | | |
| | | | | | | Gross discount rate | | 12.0%-12.5%(12.2%) | | | |
Loans - Home equity | | | | 7 | | | Consensus pricing (c) | | Credit and Liquidity discount | | 37.0%-97.0%(65.0%) | | | |
BlackRock Series C Preferred Stock | | | 243 | | | Consensus pricing (c) | | Liquidity discount | | 22.5% | | | | | 243 | | | Consensus pricing (c) | | Liquidity discount | | 22.5% | | | |
BlackRock LTIP | | | (243 | ) | | Consensus pricing (c) | | Liquidity discount | | 22.5% | | | | | (243 | ) | | Consensus pricing (c) | | Liquidity discount | | 22.5% | | | |
Other derivative contracts | | | (72 | ) | | Discounted cash flow | | Credit and Liquidity discount
Spread over the benchmark curve (b) | | 37.0%-99.0%(46.0%)
79bps | | | | | (72 | ) | | Discounted cash flow | | Credit and Liquidity discount | | 37.0%-99.0%(46.0%) | | | |
Swaps related to sales of certain Visa Class B common shares | | | (43 | ) | | Discounted cash flow | | Estimated conversion factor of
Class B shares into Class A shares | | 41.5% | | | |
| | | | | | Estimated growth rate of Visa
Class A share price | | 12.6% | | | |
| | | | | | | Spread over the benchmark curve (b) | | 79bps | | | |
Swaps related to sales of certain | | | | (43 | ) | | Discounted cash flow | | Estimated conversion factor of | | | | | |
Visa Class B common shares | | | | | | | Class B shares into Class A shares | | 41.5% | | | |
| | | | | | | Estimated growth rate of Visa Class | | | | | |
| | | | | | | A share price | | 12.6% | | | |
Insignificant Level 3 assets, net of liabilities (f) | | | 12 | | | | | | | | | | | | 12 | | | | | | | | | | |
| | | | | | | | | | | | | | | | | | | | | | | |
Total Level 3 assets, net of liabilities (g) | | $ | 10,612 | | | | | | | | | $ | 10,612 | | | |
| (a) | Level 3 residential mortgage-backed non-agency and asset-backed securities with fair values as of March 31,June 30, 2013 totaled $5,310totaling $5,013 million and $670$642 million, respectively, were priced by a third-party vendor using a discounted cash flow pricing model, that incorporates consensus pricing, where available. The comparable amounts as of December 31, 2012 were $5,363 million and $677 million, respectively. The significant unobservable inputs for these securities were provided by the third-party vendor and are disclosed in the table. Our procedures to validate the prices provided by the third-party vendor related to these securities are discussed further in the Fair Value Measurement section of Note 9 Fair Value in our Notes To Consolidated Financial Statements under Item 8 of our 2012 Form 10-K. Certain Level 3 residential mortgage-backed non-agency and asset-backed securities with fair values as of March 31,June 30, 2013 of $728$698 million and $31$30 million, respectively, were valued using a pricing source, such as a dealer quote or comparable security price, for which the significant unobservable inputs used to determine the price were not reasonably available. The comparable amounts as of December 31, 2012 were $744 million and $31 million, respectively. |
| (b) | The assumed yield spread over the benchmark curve for each instrument is generally intended to incorporate non-interest-rate risks such as credit and liquidity risks. |
| (c) | Consensus pricing refers to fair value estimates that are generally internally developed using information such as dealer quotes or other third-party provided valuations or comparable asset prices. |
| (d) | The range on these indirect equity investments has not been disclosed since these investments are recorded at their net asset redemption values. |
| (e) | Relates to a Non-agency securitization that PNC consolidated in the first quarter of 2013. |
| (f) | Represents the aggregate amount of Level 3 assets and liabilities measured at fair value on a recurring basis that are individually and in the aggregate insignificant. The amount includes loans and certain financial derivative assets and liabilities and other assets. |
| (g) | Consisted of total Level 3 assets of $11,206$10,812 million and total Level 3 liabilities of $530$578 million as of March 31,June 30, 2013 and $10,988 million and $376 million as of December 31, 2012, respectively. |
116The PNC Financial Services Group, Inc. –Form 10-Q125
OTHER FINANCIAL ASSETS ACCOUNTEDFORAT FAIR VALUEONA NONRECURRING BASIS
We may be required to measure certain other financial assets at fair value on a nonrecurring basis. These adjustments to fair value usually result from the application of lower-of-cost-or-fair value accounting or write-downs of individual assets due to impairment and are included in Table 92: Fair Value Measurements – Nonrecurring and Table 93: Fair Value Measurements – Nonrecurring Quantitative Information. For more information regarding the valuation methodologies for assets measured at fair value on a nonrecurring basis, see Note 9 Fair Value in our Notes To Consolidated Financial Statements under item 8 of our 2012 Form 10-K.
Table 92: Fair Value Measurements – Nonrecurring (a)
| | | | Fair Value | | | Gains (Losses) Three
months ended | | | Fair Value | | | Gains (Losses)
Three months ended | | | Gains (Losses)
Six months ended | |
| In millions | | March 31
2013 | | | December 31
2012 | | | March 31
2013 | | | March 31
2012 | | | June 30
2013 | | | December 31
2012 | | | June 30
2013 | | | June 30
2012 | | | June 30
2013 | | | June 30
2012 | |
Assets | | | | | | | | | | | | | | | | | | | | | | |
Nonaccrual loans | | $ | 106 | | | $ | 158 | | | $ | (10 | ) | | $ | (86 | ) | | $ | 83 | | | $ | 158 | | | $ | (9 | ) | | $ | (42 | ) | | $ | (10 | ) | | $ | (96 | ) |
Loans held for sale | | | 66 | | | | 315 | | | | (3 | ) | | | (10 | ) | | | 209 | | | | 315 | | | | (11 | ) | | | (1 | ) | | | (11 | ) | | | (1 | ) |
Equity investments | | | | | 12 | | | | | | | | | 6 | | | | 12 | | | | (3 | ) | | | | | (3 | ) | | | |
Commercial mortgage servicing rights | | | 445 | | | | 191 | | | | 13 | | | | 5 | | | | 519 | | | | 191 | | | | 60 | | | | (14 | ) | | | 73 | | | | (9 | ) |
OREO and foreclosed assets | | | 224 | | | | 207 | | | | (19 | ) | | | (26 | ) | | | 199 | | | | 207 | | | | (19 | ) | | | (32 | ) | | | (33 | ) | | | (59 | ) |
Long-lived assets held for sale | | | 42 | | | | 24 | | | | (16 | ) | | | (7 | ) | | | 52 | | | | 24 | | | | (12 | ) | | | (6 | ) | | | (27 | ) | | | (13 | ) |
Total assets | | $ | 883 | | | $ | 907 | | | $ | (35 | ) | | $ | (124 | ) | | $ | 1,068 | | | $ | 907 | | | $ | 6 | | | $ | (95 | ) | | $ | (11 | ) | | $ | (178 | ) |
| (a) | All Level 3 as of March 31,June 30, 2013 and December 31, 2012. |
Quantitative information about the significant unobservable inputs within Level 3 nonrecurring assets follows.
Table 93: Fair Value Measurements – Nonrecurring Quantitative Information
| Level 3 Instruments Only Dollars in millions | | Fair Value | | | Valuation Techniques | | Unobservable Inputs | | Range (Weighted Average) | | Fair Value | | Valuation Techniques | | Unobservable Inputs | | Range (Weighted Average) |
March 31, 2013 | | | | | | | | | |
June 30, 2013 | | | | | | | | | |
Assets | | | | | | | | | | | | | | | | |
Nonaccrual loans (a) | | $ | 75 | | | Fair value of collateral | | Loss severity | | 6.3%-98.7%(50.6%) | | $ | 64 | | | Fair value of collateral | | Loss severity | | 6.3%-85.2%(35.1%) |
Loans held for sale | | | 66 | | | Discounted cash flow | | Spread over the benchmark curve (b) | | 58bps-550bps (196bps) | | | 209 | | | Discounted cash flow | | Spread over the benchmark curve (b) | | 80bps-247bps (109bps) |
| | | | | | Embedded servicing value | | 0.8%-3.0%(1.2%) | | | | | | Embedded servicing value | | .8%-3.0%(2.8%) |
Equity Investments | | | | 6 | | | Discounted cash flow | | Market rate of return | | 6.5% |
Commercial mortgage servicing rights | | | 445 | | | Discounted cash flow | | Constant prepayment rate (CPR) | | 7.5%-16.8%(8.2%) | | | 519 | | | Discounted cash flow | | Constant prepayment rate (CPR) Discount rate | | 6.2%-11.7%(6.9%) 6.2%-7.5%(7.1%) |
| | | | | | Discount rate | | 5.6%-7.4%(7.3%) | |
Other (c) | | | 297 | | | Fair value of property or collateral | | Appraised value/sales price | | Not meaningful | | | 270 | | | Fair value of property or collateral | | Appraised value/sales price | | Not meaningful |
| | | | | | | | | | | | | | | | | | |
Total Assets | | $ | 883 | | | | | | | | | $ | 1,068 | | | |
December 31, 2012 | | | | | | | | | | | | | | | | |
Assets | | | | | | | | | | | | | | | | |
Nonaccrual loans (a) | | $ | 90 | | | Fair value of collateral | | Loss severity | | 4.6%-97.2%(58.1%) | | $ | 90 | | | Fair value of collateral | | Loss severity | | 4.6%-97.2%(58.1%) |
Loans held for sale | | | 315 | | | Discounted cash flow | | Spread over the benchmark curve (b) | | 40bps-233bps (86bps) | | | 315 | | | Discounted cash flow | | Spread over the benchmark curve (b) Embedded servicing value | | 40bps-233bps (86bps) .8%-2.6%(2.0%) |
| | | | | | Embedded servicing value | | 0.8%-2.6%(2.0%) | |
Equity Investments | | | 12 | | | Discounted cash flow | | Market rate of return | | 4.6%-6.5%(5.4%) | | | 12 | | | Discounted cash flow | | Market rate of return | | 4.6%-6.5%(5.4%) |
Commercial mortgage servicing rights | | | 191 | | | Discounted cash flow | | Constant prepayment rate (CPR) | | 7.1%-20.1%(7.8%) | | | 191 | | | Discounted cash flow | | Constant prepayment rate (CPR) Discount rate | | 7.1%-20.1%(7.8%) 5.6%-7.8%(7.7%) |
| | | | | | Discount rate | | 5.6%-7.8%(7.7%) | |
Other (c) | | | 299 | | | Fair value of property or collateral | | Appraised value/sales price | | Not meaningful | | | 299 | | | Fair value of property or collateral | | Appraised value/sales price | | Not meaningful |
| | | | | | | | | | | | | | | | | | |
Total Assets | | $ | 907 | | | | | | | | | $ | 907 | | | |
| (a) | The fair value of nonaccrual loans included in this line item is determined based on internal loss rates. The fair value of nonaccrual loans where the fair value is determined based on the appraised value or sales price is included within Other, below. |
| (b) | The assumed yield spread over benchmark curve for each instrument is generally intended to incorporate non-interest-rate risks such as credit and liquidity risks. |
| (c) | Other included nonaccrual loans of $31$19 million, OREO and foreclosed assets of $224$199 million and Long-lived assets held for sale of $42$52 million as of March 31,June 30, 2013. Comparably, as of December 31, 2012, Other included nonaccrual loans of $68 million, OREO and foreclosed assets of $207 million and Long-lived assets held for sale of $24 million. The fair value of these assets are determined based on appraised value or sales price, the range of which is not meaningful to disclose. |
126The PNC Financial Services Group, Inc. –Form 10-Q117
FINANCIAL ASSETS ACCOUNTEDFOR UNDER FAIR VALUE OPTION
For more information regarding assets we elected to measure at fair value under fair value option on our Consolidated Balance Sheet, see Note 9 Fair Value in our Notes To Consolidated Financial Statements under Item 8 of our 2012 Form 10-K.
The following disclosures for financial instruments accounted for at fair value under fair value option have been updated duringfor the first threesix months of 2013 as PNC consolidated a Non-agency securitization resulting in an incremental $130$125 million of home equity lines of credit and $130$195 million of other borrowed funds:funds, of which $70 million had previously been recorded in our financial statements.
Residential Mortgage Loans – Portfolio
Interest income on the Home Equity Lines of Credit for which we have elected the fair value option during first quarter 2013 will beis reported on the Consolidated Income Statement in Loan interest income.
Other Borrowed Funds
Interest expense on the Other borrowed funds for which we have elected the fair value option during first quarter 2013 will beis reported on the Consolidated Income Statement in Borrowed funds interest expense.
The changes in fair value included in Noninterest income for items for which we elected the fair value option follow.are included in the table below.
Table 94: Fair Value Option – Changes in Fair Value (a)
| | | | Gains (Losses) Three months ended | | | Gains (Losses)
Three months ended | | | Gains (Losses)
Six months ended | |
| In millions | | March 31
2013 | | | March 31
2012 | | | June 30
2013 | | | June 30
2012 | | | June 30
2013 | | | June 30
2012 | |
Assets | | | | | | | | | | | | | | |
Customer resale agreements | | $ | (2 | ) | | $ | (4 | ) | | $ | (3 | ) | | $ | (2 | ) | | $ | (5 | ) | | $ | (6 | ) |
Residential mortgage-backed agency securities with embedded derivatives (b) | | | | | | (1 | ) | | | | | 13 | |
Trading loans | | | 1 | | | | | | | 1 | | | | | | 2 | | | | |
Residential mortgage-backed agency securities with embedded derivatives (b) | | | | | 14 | | |
Commercial mortgage loans held for sale | | | 1 | | | | (6 | ) | | | (13 | ) | | | 4 | | | | (12 | ) | | | (2 | ) |
Residential mortgage loans held for sale | | | 114 | | | | 87 | | | | (48 | ) | | | (287 | ) | | | 66 | | | | (200 | ) |
Residential mortgage loans – portfolio | | | 6 | | | | (17 | ) | | | 13 | | | | (9 | ) | | | 19 | | | | (26 | ) |
BlackRock Series C Preferred Stock | | | 60 | | | | 31 | | | | | | (41 | ) | | | 60 | | | | (10 | ) |
Liabilities | | | | | | | | | | |
Other borrowed funds | | | | (3 | ) | | | | | (3 | ) | | | |
| (a) | The impact on earnings of offsetting hedged items or hedging instruments is not reflected in these amounts. |
| (b) | These residential mortgage-backed agency securities with embedded derivatives were carried as Trading securities. |
118The PNC Financial Services Group, Inc. –Form 10-Q127
Fair values and aggregate unpaid principal balances of items for which we elected the fair value option follow.
Table 95: Fair Value Option – Fair Value and Principal Balances
| | In millions | | Fair Value | | | Aggregate Unpaid
Principal Balance | | | Difference | | | Fair Value | | | Aggregate Unpaid
Principal Balance | | | Difference | |
March 31, 2013 | | | | | | | | |
June 30, 2013 | | | | | | | | |
Assets | | | | | | | | | | | | | | |
Customer resale agreements | | $ | 213 | | | $ | 196 | | | $ | 17 | | | $ | 210 | | | $ | 196 | | | $ | 14 | |
Trading loans | | | 28 | | | | 27 | | | | 1 | | | | 21 | | | | 22 | | | | (1 | ) |
Residential mortgage loans held for sale | | | | | | | | | | | | | | |
Performing loans | | | 2,141 | | | | 2,052 | | | | 89 | | | | 2,200 | | | | 2,196 | | | | 4 | |
Accruing loans 90 days or more past due | | | 8 | | | | 8 | | | | – | | | | 5 | | | | 4 | | | | 1 | |
Nonaccrual loans | | | 55 | | | | 103 | | | | (48 | ) | | | 41 | | | | 67 | | | | (26 | ) |
Total | | | 2,204 | | | | 2,163 | | | | 41 | | | | 2,246 | | | | 2,267 | | | | (21 | ) |
Commercial mortgage loans held for sale (a) | | | | | | | | | | | | | | |
Performing loans | | | 766 | | | | 889 | | | | (123 | ) | | | 632 | | | | 739 | | | | (107 | ) |
Nonaccrual loans | | | 3 | | | | 7 | | | | (4 | ) | | | 3 | | | | 7 | | | | (4 | ) |
Total | | | 769 | | | | 896 | | | | (127 | ) | | | 635 | | | | 746 | | | | (111 | ) |
Residential mortgage loans – portfolio | | | | | | | | | | | | | | |
Performing loans | | | 382 | | | | 491 | | | | (109 | ) | | | 179 | | | | 282 | | | | (103 | ) |
Accruing loans 90 days or more past due (b) | | | 9 | | | | 200 | | | | (191 | ) | | | 331 | | | | 535 | | | | (204 | ) |
Nonaccrual loans | | | 243 | | | | 445 | | | | (202 | ) | | | 301 | | | | 530 | | | | (229 | ) |
Total | | | 634 | | | | 1,136 | | | | (502 | ) | | | 811 | | | | 1,347 | | | | (536 | ) |
Liabilities | | | | | | | | | | | | | | |
Other borrowed funds (c) | | $ | 130 | | | $ | 351 | | | $ | (221 | ) | | $ | 195 | | | $ | 344 | | | $ | (149 | ) |
December 31, 2012 | | | | | | | | | | | | | | |
Assets | | | | | | | | | | | | | | |
Customer resale agreements | | $ | 256 | | | $ | 237 | | | $ | 19 | | | $ | 256 | | | $ | 237 | | | $ | 19 | |
Trading loans | | | 76 | | | | 76 | | | | – | | | | 76 | | | | 76 | | | | |
Residential mortgage loans held for sale | | | | | | | | | | | | | | |
Performing loans | | | 2,072 | | | | 1,971 | | | | 101 | | | | 2,072 | | | | 1,971 | | | | 101 | |
Accruing loans 90 days or more past due | | | 8 | | | | 14 | | | | (6 | ) | | | 8 | | | | 14 | | | | (6 | ) |
Nonaccrual loans | | | 16 | | | | 36 | | | | (20 | ) | | | 16 | | | | 36 | | | | (20 | ) |
Total | | | 2,096 | | | | 2,021 | | | | 75 | | | | 2,096 | | | | 2,021 | | | | 75 | |
Commercial mortgage loans held for sale (a) | | | | | | | | | | | | | | |
Performing loans | | | 766 | | | | 889 | | | | (123 | ) | | | 766 | | | | 889 | | | | (123 | ) |
Nonaccrual loans | | | 6 | | | | 12 | | | | (6 | ) | | | 6 | | | | 12 | | | | (6 | ) |
Total | | | 772 | | | | 901 | | | | (129 | ) | | | 772 | | | | 901 | | | | (129 | ) |
Residential mortgage loans – portfolio | | | | | | | | | | | | | | |
Performing loans | | | 58 | | | | 116 | | | | (58 | ) | | | 58 | | | | 116 | | | | (58 | ) |
Accruing loans 90 days or more past due (b) | | | 116 | | | | 141 | | | | (25 | ) | | | 116 | | | | 141 | | | | (25 | ) |
Nonaccrual loans | | | 70 | | | | 207 | | | | (137 | ) | | | 70 | | | | 207 | | | | (137 | ) |
Total | | $ | 244 | | | $ | 464 | | | $ | (220 | ) | | $ | 244 | | | $ | 464 | | | $ | (220 | ) |
| (a) | There were no accruing loans 90 days or more past due within this category at March 31,June 30, 2013 or December 31, 2012. |
| (b) | The majority of these loans are government insured loans, which positively impacts the fair value. |
| (c) | Related to a Non-agency securitization that PNC consolidated in the first quarter of 2013. See Tables 89: Fair Value Measurement—Summary and 111: Derivatives Total Notional or Contractual Amounts and Fair Values for additional information. |
128The PNC Financial Services Group, Inc. –Form 10-Q119
The following table provides additional information regarding the fair value and classification within the fair value hierarchy of financial instruments.
Table 96: Additional Fair Value Information Related to Financial Instruments
| | | | | | | | | | Fair Value | | | | | | | | | | | | | | | | |
| In millions | | Carrying
Amount | | | Total | | | Level 1 | | | Level 2 | | | Level 3 | | | Carrying Amount | | | Fair Value | |
March 31, 2013 | | | | | | | | | | | | |
In millions | | | Carrying Amount | | | Total | | | Level 1 | | | Level 2 | | | Level 3 | |
| | | | | | | | | |
Assets | | | | | | | | | | | | | | | | | | | | | | |
Cash and due from banks | | $ | 3,948 | | | $ | 3,948 | | | $ | 3,948 | | | | | | | | $ | 4,051 | | | $ | 4,051 | | | $ | 4,051 | | | | | | |
Short-term assets | | | 3,881 | | | | 3,881 | | | | | $ | 3,881 | | | | | | | 6,454 | | | | 6,454 | | | | | $ | 6,454 | | | | |
Trading securities | | | 2,243 | | | | 2,243 | | | | 1,054 | | | | 1,157 | | | $ | 32 | | | | 2,109 | | | | 2,109 | | | | 1,296 | | | | 781 | | | $ | 32 | |
Investment securities | | | 59,361 | | | | 59,808 | | | | 2,394 | | | | 50,273 | | | | 7,141 | | | | 57,449 | | | | 57,648 | | | | 2,016 | | | | 48,848 | | | | 6,784 | |
Trading loans | | | 28 | | | | 28 | | | | | | 28 | | | | | | | 21 | | | | 21 | | | | | | 21 | | | | |
Loans held for sale | | | 3,295 | | | | 3,295 | | | | | | 2,160 | | | | 1,135 | | | | 3,814 | | | | 3,819 | | | | | | 2,216 | | | | 1,603 | |
Net loans (excludes leases) | | | 175,438 | | | | 177,123 | | | | | | 362 | | | | 176,761 | | | | 178,656 | | | | 180,811 | | | | | | 500 | | | | 180,311 | |
Other assets | | | 4,197 | | | | 4,197 | | | | 307 | | | | 1,791 | | | | 2,099 | | | | 4,168 | | | | 4,168 | | | | 330 | | | | 1,822 | | | | 2,016 | |
Mortgage servicing rights | | | 1,231 | | | | 1,236 | | | | | | | | 1,236 | | | | 1,500 | | | | 1,505 | | | | | | | | 1,505 | |
Financial derivatives | | | | | | | | | | | | | | | | | | | | | | |
Designated as hedging instruments under GAAP | | | 1,743 | | | | 1,743 | | | | | | 1,743 | | | | | | | 1,380 | | | | 1,380 | | | | | | 1,380 | | | | |
Not designated as hedging instruments under GAAP | | | 6,012 | | | | 6,012 | | | | 8 | | | | 5,911 | | | | 93 | | | | 5,205 | | | | 5,205 | | | | 27 | | | | 5,127 | | | | 51 | |
Total Assets | | $ | 261,377 | | | $ | 263,514 | | | $ | 7,711 | | | $ | 67,306 | | | $ | 188,497 | | | $ | 264,807 | | | $ | 267,171 | | | $ | 7,720 | | | $ | 67,149 | | | $ | 192,302 | |
Liabilities | | | | | | | | | | | | | | | | | | | | | | |
Demand, savings and money market deposits | | $ | 186,541 | | | $ | 186,541 | | | | | $ | 186,541 | | | | | | $ | 186,645 | | | $ | 186,645 | | | | | $ | 186,645 | | | | |
Time deposits | | | 25,079 | | | | 25,279 | | | | | | 25,279 | | | | | | | 25,634 | | | | 25,694 | | | | | | 25,694 | | | | |
Borrowed funds | | | 37,894 | | | | 39,081 | | | $ | 886 | | | | 36,914 | | | $ | 1,281 | | | | 40,109 | | | | 40,855 | | | $ | 929 | | | | 38,695 | | | $ | 1,231 | |
Financial derivatives | | | | | | | | | | | | | | | | | | | | | | |
Designated as hedging instruments under GAAP | | | 124 | | | | 124 | | | | | | 124 | | | | | | | 329 | | | | 329 | | | | | | 329 | | | | |
Not designated as hedging instruments under GAAP | | | 5,783 | | | | 5,783 | | | | 3 | | | | 5,380 | | | | 400 | | | | 5,001 | | | | 5,001 | | | | 12 | | | | 4,606 | | | | 383 | |
Unfunded loan commitments and letters of credit | | | 219 | | | | 219 | | | | | | | | 219 | | | | 225 | | | | 225 | | | | | | | | 225 | |
Total Liabilities | | $ | 255,640 | | | $ | 257,027 | | | $ | 889 | | | $ | 254,238 | | | $ | 1,900 | | | $ | 257,943 | | | $ | 258,749 | | | $ | 941 | | | $ | 255,969 | | | $ | 1,839 | |
December 31, 2012 | | | | | | | | | | | | | | | | | | | | | | |
Assets | | | | | | | | | | | | | | | | | | | | | | |
Cash and due from banks | | $ | 5,220 | | | $ | 5,220 | | | $ | 5,220 | | | | | | | | $ | 5,220 | | | $ | 5,220 | | | $ | 5,220 | | | | | | |
Short-term assets | | | 6,495 | | | | 6,495 | | | | | $ | 6,495 | | | | | | | 6,495 | | | | 6,495 | | | | | $ | 6,495 | | | | |
Trading securities | | | 2,096 | | | | 2,096 | | | | 1,104 | | | | 960 | | | $ | 32 | | | | 2,096 | | | | 2,096 | | | | 1,104 | | | | 960 | | | $ | 32 | |
Investment securities | | | 61,406 | | | | 61,912 | | | | 2,897 | | | | 51,789 | | | | 7,226 | | | | 61,406 | | | | 61,912 | | | | 2,897 | | | | 51,789 | | | | 7,226 | |
Trading loans | | | 76 | | | | 76 | | | | | | 76 | | | | | | | 76 | | | | 76 | | | | | | 76 | | | | |
Loans held for sale | | | 3,693 | | | | 3,697 | | | | | | 2,069 | | | | 1,628 | | | | 3,693 | | | | 3,697 | | | | | | 2,069 | | | | 1,628 | |
Net loans (excludes leases) | | | 174,575 | | | | 177,215 | | | | | | 110 | | | | 177,105 | | | | 174,575 | | | | 177,215 | | | | | | 110 | | | | 177,105 | |
Other assets | | | 4,265 | | | | 4,265 | | | | 283 | | | | 1,917 | | | | 2,065 | | | | 4,265 | | | | 4,265 | | | | 283 | | | | 1,917 | | | | 2,065 | |
Mortgage servicing rights | | | 1,070 | | | | 1,077 | | | | | | | | 1,077 | | | | 1,070 | | | | 1,077 | | | | | | | | 1,077 | |
Financial derivatives | | | | | | | | | | | | | | | | | | | | | | |
Designated as hedging instruments under GAAP | | | 1,872 | | | | 1,872 | | | | | | 1,872 | | | | | | | 1,872 | | | | 1,872 | | | | | | 1,872 | | | | |
Not designated as hedging instruments under GAAP | | | 6,696 | | | | 6,696 | | | | 5 | | | | 6,585 | | | | 106 | | | | 6,696 | | | | 6,696 | | | | 5 | | | | 6,585 | | | | 106 | |
Total Assets | | $ | 267,464 | | | $ | 270,621 | | | $ | 9,509 | | | $ | 71,873 | | | $ | 189,239 | | | $ | 267,464 | | | $ | 270,621 | | | $ | 9,509 | | | $ | 71,873 | | | $ | 189,239 | |
Liabilities | | | | | | | | | | | | | | | | | | | | | | |
Demand, savings and money market deposits | | $ | 187,051 | | | $ | 187,051 | | | | | $ | 187,051 | | | | | | $ | 187,051 | | | $ | 187,051 | | | | | $ | 187,051 | | | | |
Time deposits | | | 26,091 | | | | 26,347 | | | | | | 26,347 | | | | | | | 26,091 | | | | 26,347 | | | | | | 26,347 | | | | |
Borrowed funds | | | 40,907 | | | | 42,329 | | | $ | 731 | | | | 40,505 | | | $ | 1,093 | | | | 40,907 | | | | 42,329 | | | $ | 731 | | | | 40,505 | | | $ | 1,093 | |
Financial derivatives | | | | | | | | | | | | | | | | | | | | | | |
Designated as hedging instruments under GAAP | | | 152 | | | | 152 | | | | | | 152 | | | | | | | 152 | | | | 152 | | | | | | 152 | | | | |
Not designated as hedging instruments under GAAP | | | 6,458 | | | | 6,458 | | | | 1 | | | | 6,081 | | | | 376 | | | | 6,458 | | | | 6,458 | | | | 1 | | | | 6,081 | | | | 376 | |
Unfunded loan commitments and letters of credit | | | 231 | | | | 231 | | | | | | | | 231 | | | | 231 | | | | 231 | | | | | | | | 231 | |
Total Liabilities | | $ | 260,890 | | | $ | 262,568 | | | $ | 732 | | | $ | 260,136 | | | $ | 1,700 | | | $ | 260,890 | | | $ | 262,568 | | | $ | 732 | | | $ | 260,136 | | | $ | 1,700 | |
120The PNC Financial Services Group, Inc. –Form 10-Q129
The aggregate fair value of financial instruments in Table 96: Additional Fair Value Information Related to Financial Instruments does not represent the total market value of PNC’s assets and liabilities as the table excludes the following:
real and personal property,
loan customer relationships,
deposit customer intangibles,
fee-based businesses, such as asset management and brokerage, and
trademarks and brand names.
For more information regarding the fair value amounts for financial instruments and their classifications within the fair value hierarchy, see Note 9 Fair Value in our Notes To Consolidated Financial Statements under Item 8 of our 2012 Form 10-K.
The aggregate carrying value of our investments that are carried at cost and FHLB and FRB stock was $1.6 billion at March 31,June 30, 2013 and $1.7 billion at December 31, 2012, which approximates fair value at each date.
NOTE 10 GOODWILLAND OTHER INTANGIBLE ASSETS
Changes in goodwill by business segment during the first threesix months of 2013 follow:
Table 97: Changes in Goodwill by Business Segment (a)
| | In millions | | Retail
Banking | | Corporate &
Institutional
Banking | | Asset
Management
Group | | Total | | | Retail
Banking | | | Corporate &
Institutional
Banking | | | Asset
Management
Group | | | Total | |
December 31, 2012 | | $ | 5,794 | | | $ | 3,214 | | | $ | 64 | | | $ | 9,072 | | | $ | 5,794 | | | $ | 3,214 | | | $ | 64 | | | $ | 9,072 | |
Other | | | 2 | | | | 1 | | | | 3 | | | | 2 | | | | 1 | | | | | | 3 | |
March 31, 2013 | | $ | 5,796 | | | $ | 3,215 | | | $ | 64 | | | $ | 9,075 | | |
June 30, 2013 | | | $ | 5,796 | | | $ | 3,215 | | | $ | 64 | | | $ | 9,075 | |
| (a) | The Residential Mortgage Banking and Non-Strategic Assets Portfolio business segments do not have any goodwill allocated to them as of March 31,June 30, 2013 and December 31, 2012. |
Assets and liabilities of acquired entities are recorded at estimated fair value as of the acquisition date.
The gross carrying amount, accumulated amortization and net carrying amount of other intangible assets by major category consisted of the following:
Table 98: Other Intangible Assets
| | In millions | | March 31
2013 | | December 31
2012 | | | June 30
2013 | | December 31
2012 | |
Customer-related and other intangibles | | | | | | | | | | |
Gross carrying amount | | $ | 1,676 | | | $ | 1,676 | | | $ | 1,676 | | | $ | 1,676 | |
Accumulated amortization | | | (987 | ) | | | (950 | ) | | | (1,024 | ) | | | (950 | ) |
Net carrying amount | | $ | 689 | | | $ | 726 | | | $ | 652 | | | $ | 726 | |
Mortgage and other loan servicing rights | | | | | | | | | | |
Gross carrying amount | | $ | 2,222 | | | $ | 2,071 | | | $ | 2,456 | | | $ | 2,071 | |
Valuation allowance | | | (163 | ) | | | (176 | ) | | | (103 | ) | | | (176 | ) |
Accumulated amortization | | | (827 | ) | | | (824 | ) | | | (852 | ) | | | (824 | ) |
Net carrying amount (a) | | $ | 1,232 | | | $ | 1,071 | | | $ | 1,501 | | | $ | 1,071 | |
Total | | $ | 1,921 | | | $ | 1,797 | | | $ | 2,153 | | | $ | 1,797 | |
| (a) | Included mortgage servicing rights for other loan portfolios of $1 million at both March 31,June 30, 2013 and December 31, 2012, respectively. |
Our other intangible assets have finite lives and are amortized primarily on a straight-line basis. Core deposit intangibles are amortized on an accelerated basis.
For customer-related and other intangibles, the estimated remaining useful lives range from 1 year to 11 years, with a weighted-average remaining useful life of 8 years.
130The PNC Financial Services Group, Inc. –Form 10-Q121
Amortization expense on existing intangible assets follows:
Table 99: Amortization Expense on Existing Intangible Assets (a)
| | In millions | | | | In millions | |
Three months ended March 31, 2013 | | $ | 65 | | |
Three months ended March 31, 2012 | | | 95 | | |
Six months ended June 30, 2013 | | | $ | 128 | |
Six months ended June 30, 2012 | | | | 169 | |
Remainder of 2013 | | | 178 | | | | 115 | |
2014 | | | 205 | | | | 202 | |
2015 | | | 180 | | | | 179 | |
2016 | | | 157 | | | | 161 | |
2017 | | | 137 | | | | 140 | |
2018 | | | 120 | | | | 123 | |
| (a) | Amortization expense included amortization of mortgage servicing rights for other loan portfolios of $1less than $0.5 million for the threesix months ended March 31, 2012.June 30, 2013. The amount for the threesix months ended March 31, 2013June 30, 2012 was less than $.5$1 million. |
Changes in customer-related intangible assets during the first threesix months of 2013 follow:
Table 100: Summary of Changes in Customer-Related Other Intangible Assets
| | In millions | | Customer-
Related | | | Customer-
Related | |
December 31, 2012 | | $ | 726 | | | $ | 726 | |
Amortization | | | (37 | ) | | | (74 | ) |
March 31, 2013 | | $ | 689 | | |
June 30, 2013 | | | $ | 652 | |
Changes in commercial mortgage servicing rights (MSRs) follow:
Table 101: Commercial Mortgage Servicing Rights
| | In millions | | 2013 | | 2012 | | In millions | | 2013 | | | 2012 | |
Commercial Mortgage Servicing Rights – Net Carrying Amount | | | | | | Commercial Mortgage Servicing Rights – Net Carrying Amount | | | | | |
January 1 | | $ | 420 | | | $ | 468 | | January 1 | | $ | 420 | | | $ | 468 | |
Additions (a) | | | 47 | | | | 9 | | Additions (a) | | | 86 | | | | 25 | |
Amortization expense (b) | | | (28 | ) | | | (54 | ) | Amortization expense (b) | | | (54 | ) | | | (86 | ) |
Change in valuation allowance | | | 13 | | | | 5 | | Change in valuation allowance | | | 73 | | | | (9 | ) |
March 31 | | $ | 452 | | | $ | 428 | | |
June 30 | | June 30 | | $ | 525 | | | $ | 398 | |
Commercial Mortgage Servicing Rights – Valuation Allowance | | | | | | | | | | | | |
January 1 | | $ | (176 | ) | | $ | (197 | ) | January 1 | | $ | (176 | ) | | $ | (197 | ) |
Provision | | | (4 | ) | | | (24 | ) | Provision | | | (4 | ) | | | (44 | ) |
Recoveries | | | 17 | | | | 5 | | Recoveries | | | 76 | | | | 11 | |
Other (b) | | | | 24 | | Other (b) | | | 1 | | | | 24 | |
March 31 | | $ | (163 | ) | | $ | (192 | ) | |
June 30 | | June 30 | | $ | (103 | ) | | $ | (206 | ) |
| (a) | Additions for the first threesix months of 2013 included $20$31 million from loans sold with servicing retained and $27$55 million from purchases of servicing rights from third parties. Comparably, additions for the first threesix months of 2012 included $9$18 million from loans sold with servicing retained and zero$7 million from purchases of servicing rights from third parties. |
| (b) | Includes a direct write downwrite-down of servicing rights of $24 million for the first threesix months of 2012 primarily due to market-driven changes in interest rates.2012. |
We recognize as an other intangible asset the right to service mortgage loans for others. Commercial MSRs are purchased or originated when loans are sold with servicing retained. Commercial MSRs are initially recorded at fair value. These rights are subsequently accounted for at the lower of amortized cost or fair value, and are substantially amortized in proportion to and over the period of estimated net servicing income of 5 to 10 years.
Commercial MSRs are periodically evaluated for impairment. For purposes of impairment, the commercial MSRs are stratified based on asset type, which characterizes the predominant risk of the underlying financial asset. If the carrying amount of any individual stratum exceeds its fair value, a valuation reserve is established with a corresponding charge to Corporate services on our Consolidated Income Statement.
The fair value of commercial MSRs is estimated by using a discounted cash flow model incorporating inputs for assumptions as to constant prepayment rates, discount rates and other factors determined based on current market conditions and expectations.
Changes in the residential MSRs follow:
Table 102: Residential Mortgage Servicing Rights
| | In millions | | 2013 | | 2012 | | | 2013 | | 2012 | |
January 1 | | $ | 650 | | | $ | 647 | | | $ | 650 | | | $ | 647 | |
Additions: | | | | | | | | | | |
From loans sold with servicing retained | | | 37 | | | | 29 | | | | 80 | | | | 53 | |
RBC Bank (USA) acquisition | | | | | 16 | | | | | | 16 | |
Purchases | | | 64 | | | | 48 | | | | 64 | | | | 48 | |
Changes in fair value due to: | | | | | | | | | | |
Time and payoffs (a) | | | (50 | ) | | | (36 | ) | | | (105 | ) | | | (77 | ) |
Other (b) | | | 78 | | | | 20 | | | | 286 | | | | (106 | ) |
March 31 | | $ | 779 | | | $ | 724 | | |
Unpaid principal balance of loans serviced for others at March 31 | | $ | 120,490 | | | $ | 121,129 | | |
June 30 | | | $ | 975 | | | $ | 581 | |
Unpaid principal balance of loans serviced for others at June 30 | | | $ | 115,740 | | | $ | 116,011 | |
| (a) | Represents decrease in MSR value due to passage of time, including the impact from both regularly scheduled loan principal payments and loans that were paid down or paid off during the period. |
| (b) | Represents MSR value changes resulting primarily from market-driven changes in interest rates. |
We recognize mortgage servicing right assets on residential real estate loans when we retain the obligation to service these loans upon sale and the servicing fee is more than adequate compensation. MSRs are subject to declines in value principally from actual or expected prepayment of the underlying loans and also defaults. We manage this risk by economically hedging the fair value of MSRs with securities and derivative instruments which are expected to increase (or decrease) in value when the value of MSRs declines (or increases).
122The PNC Financial Services Group, Inc. –Form 10-Q131
The fair value of residential MSRs is estimated by using a cash flow valuation model which calculates the present value of estimated future net servicing cash flows, taking into consideration actual and expected mortgage loan prepayment rates, discount rates, servicing costs, and other economic factors which are determined based on current market conditions.
The fair value of commercial and residential MSRs and significant inputs to the valuation models as of March 31,June 30, 2013 are shown in the tables below. The expected and actual rates of mortgage loan prepayments are significant factors driving the fair value. Management uses internal proprietary models to estimate future commercial mortgage loan prepayments and a third party model to estimate future residential mortgage loan prepayments. These models have been refined based on current market conditions and management judgment. Future interest rates are another important factor in the valuation of MSRs. Management utilizes market implied forward interest rates to estimate the future direction of mortgage and discount rates. The forward rates utilized are derived from the current yield curve for U.S. dollar interest rate swaps and are consistent with pricing of capital markets instruments. Changes in the shape and slope of the forward curve in future periods may result in volatility in the fair value estimate.
A sensitivity analysis of the hypothetical effect on the fair value of MSRs to adverse changes in key assumptions is presented below. These sensitivities do not include the impact of the related hedging activities. Changes in fair value generally cannot be extrapolated because the relationship of the change in the assumption to the change in fair value may not be linear. Also, the effect of a variation in a particular assumption on the fair value of the MSRs is calculated independently without changing any other assumption. In reality, changes in one factor may result in changes in another (for example, changes in mortgage interest rates, which drive changes in prepayment rate estimates, could result in changes in the interest rate spread), which could either magnify or counteract the sensitivities.
The following tables set forth the fair value of commercial and residential MSRs and the sensitivity analysis of the hypothetical effect on the fair value of MSRs to immediate adverse changes of 10% and 20% in those assumptions:
Table 103: Commercial Mortgage Loan Servicing Rights – Key Valuation Assumptions
| | Dollars in millions | | March 31
2013 | | December 31
2012 | | | June 30
2013 | | | December 31
2012 | |
Fair Value | | $ | 457 | | | $ | 427 | | | $ | 530 | | | $ | 427 | |
Weighted-average life (years) | | | 5.4 | | | | 5.4 | | | | 5.5 | | | | 5.4 | |
Weighted-average constant prepayment rate | | | 7.81 | % | | | 7.63 | % | | | 6.60 | % | | | 7.63 | % |
Decline in fair value from 10% adverse change | | $ | 8 | | | $ | 8 | | | $ | 10 | | | $ | 8 | |
Decline in fair value from 20% adverse change | | $ | 17 | | | $ | 16 | | | $ | 19 | | | $ | 16 | |
Effective discount rate | | | 7.35 | % | | | 7.70 | % | | | 7.06 | % | | | 7.70 | % |
Decline in fair value from 10% adverse change | | $ | 13 | | | $ | 12 | | | $ | 13 | | | $ | 12 | |
Decline in fair value from 20% adverse change | | $ | 26 | | | $ | 23 | | | $ | 27 | | | $ | 23 | |
Table 104: Residential Mortgage Loan Servicing Rights – Key Valuation Assumptions
| | Dollars in millions | | March 31
2013 | | December 31
2012 | | | June 30
2013 | | | December 31
2012 | |
Fair value | | $ | 779 | | | $ | 650 | | | $ | 975 | | | $ | 650 | |
Weighted-average life (years) | | | 5.3 | | | | 4.3 | | | | 6.9 | | | | 4.3 | |
Weighted-average constant prepayment rate | | | 15.11 | % | | | 18.78 | % | | | 10.13 | % | | | 18.78 | % |
Decline in fair value from 10% adverse change | | $ | 44 | | | $ | 45 | | | $ | 38 | | | $ | 45 | |
Decline in fair value from 20% adverse change | | $ | 85 | | | $ | 85 | | | $ | 74 | | | $ | 85 | |
Weighted-average option adjusted spread | | | 11.01 | % | | | 11.15 | % | | | 10.96 | % | | | 11.15 | % |
Decline in fair value from 10% adverse change | | $ | 32 | | | $ | 26 | | | $ | 42 | | | $ | 26 | |
Decline in fair value from 20% adverse change | | $ | 62 | | | $ | 49 | | | $ | 80 | | | $ | 49 | |
Fees from mortgage and other loan servicing comprised of contractually specified servicing fees, late fees and ancillary fees follows:
Table 105: Fees from Mortgage and Other Loan Servicing
| | In millions | | 2013 | | | 2012 | | | 2013 | | | 2012 | |
Three months ended March 31 | | $ | 137 | | | $ | 138 | | |
Six months ended June 30 | | | $ | 274 | | | $ | 276 | |
Three months ended June 30 | | | | 137 | | | | 138 | |
We also generate servicing fees from fee-based activities provided to others for which we do not have an associated servicing asset.
Fees from commercial MSRs, residential MSRs and other loan servicing are reported on our Consolidated Income Statement in the line items Corporate services, Residential mortgage, and Consumer services, respectively.
132The PNC Financial Services Group, Inc. –Form 10-Q123
NOTE 11 CAPITAL SECURITIESOF SUBSIDIARY TRUSTSAND PERPETUAL TRUST SECURITIES
Capital Securities of Subsidiary TrustsCAPITAL SECURITIESOF SUBSIDIARY TRUSTS
Our capital securities of subsidiary trusts (“Trusts”) are described in Note 14 Capital Securities of Subsidiary Trusts and Perpetual Trust Securities in our 2012 Form 10-K. All of these Trusts are wholly owned finance subsidiaries of PNC. In the event of certain changes or amendments to regulatory requirements or federal tax rules, the capital securities are redeemable. The financial statements of the Trusts are not included in PNC’s consolidated financial statements in accordance with GAAP.
The obligations of the respective parent of each Trust, when taken collectively, are the equivalent of a full and unconditional guarantee of the obligations of such Trust under the terms of the capital securities. Such guarantee is subordinate in right of payment in the same manner as other junior subordinated debt. There are certain restrictions on PNC’s overall ability to obtain funds from its subsidiaries. For additional disclosure on these funding restrictions, including an explanation of dividend and intercompany loan limitations, see Note 22 Regulatory Matters in our 2012 Form 10-K.
On April 23, 2013, we redeemed the $15 million of trust preferred securities issued by the Yardville Capital Trust VI. On May 23, 2013, we redeemed $30 million of trust preferred securities issued by Fidelity Capital Trust III. On June 17, 2013 we redeemed the following trust preferred securities:
$15 million issued by Sterling Financial Statutory Trust III,
$15 million issued by Sterling Financial Statutory Trust IV,
$20 million issued by Sterling Financial Statutory Trust V,
$30 million issued by MAF Bancorp Capital Trust I, and
$8 million issued by James Monroe Statutory Trust III.
See Note 20 Subsequent Events for additional information on the redemption of $22 million on July 23, 2013 and a planned redemption of $35 million on September 16, 2013 of trust preferred securities.
PNC is also subject to restrictions on dividends and other provisions potentially imposed under the Exchange Agreement with PNC Preferred Funding Trust II, as described in Note 14 in
our 2012 Form 10-K in the Perpetual Trust Securities section, and to other provisions similar to or in some ways more restrictive than those potentially imposed under that agreement.
See Note 20 Subsequent Events for additional discussion of our March 2013 announcement of our April 2013 redemption of Yardville Capital Trust VI, our April 2013 announcement of our May 2013 redemption of the Fidelity Capital Trust III and our May 2013 announcement of our June 2013 redemptions of Sterling Financial Statutory Trust III, IV, and V, James Monroe Statutory Trust III and MAF Bancorp Capital Trust I trust preferred securities.
Perpetual Trust SecuritiesPERPETUAL TRUST SECURITIES
Our perpetual trust securities are described in Note 14 in our 2012 Form 10-K. Our 2012 Form 10-K also includes additional information regarding the PNC Preferred Funding Trust I and Trust II Securities, including descriptions of replacement capital and dividend restriction covenants. Prior to their redemption, the PNC Preferred Funding Trust III Securities included dividend restriction covenants similar to those described for the PNC Preferred Funding Trust II Securities.
On March 15, 2013, we redeemed $375 million of Fixed-To-Floating Non-cumulative Exchangeable Perpetual Trust Securities (REIT Preferred Securities) issued by PNC Preferred Funding Trust III with a current distribution rate of 8.7%.
124The PNC Financial Services Group, Inc. –Form 10-Q133
NOTE 12 CERTAIN EMPLOYEE BENEFIT AANDND STOCK BASED COMPENSATION PLANS
Pension And Postretirement PlansPENSION AND POSTRETIREMENT PLANS
As described in Note 15 Employee Benefit Plans in our 2012 Form 10-K, we have a noncontributory, qualified defined benefit pension plan covering eligible employees. Benefits are determined using a cash balance formula where earnings credits are a percentage of eligible compensation. Pension contributions are based on an actuarially determined amount necessary to fund total benefits payable to plan participants.
We also maintain nonqualified supplemental retirement plans for certain employees and provide certain health care and life insurance benefits for qualifying retired employees (postretirement benefits) through various plans. The nonqualified pension and postretirement benefit plans are unfunded. The Company reserves the right to terminate plans or make plan changes at any time.
The components of our net periodic pension and post-retirement benefit cost for the first threesix months of 2013 and 2012, respectively, were as follows:
Table 106: Net Periodic Pension and Postretirement Benefits Costs
| | | | Qualified Pension Plan | | | Nonqualified Retirement Plans | | | Postretirement Benefits | | | Qualified Pension Plan | | | Nonqualified Retirement Plans | | | Postretirement Benefits | |
Three months ended March 31 In millions | | 2013 | | 2012 | | | 2013 | | | 2012 | | | 2013 | | | 2012 | | |
Three months ended June 30 In millions | | | 2013 | | 2012 | | | 2013 | | | 2012 | | | 2013 | | 2012 | |
Net periodic cost consists of: | | | | | | | | | | | | | | | | | | | | | | | | | | | | | | |
Service cost | | $ | 28 | | | $ | 26 | | | $ | 1 | | | $ | 1 | | | $ | 1 | | | $ | 1 | | | $ | 29 | | | $ | 25 | | | $ | 1 | | | $ | 1 | | | $ | 2 | | | $ | 2 | |
Interest cost | | | 42 | | | | 48 | | | | 3 | | | | 3 | | | | 4 | | | | 4 | | | | 43 | | | | 48 | | | | 3 | | | | 4 | | | | 4 | | | | 4 | |
Expected return on plan assets | | | (72 | ) | | | (71 | ) | | | | | | | | | | | | | (72 | ) | | | (71 | ) | | | | | | | | | | |
Amortization of prior service credit | | | (2 | ) | | | (2 | ) | | | | | | | | (1 | ) | | | (1 | ) | | | (2 | ) | | | (2 | ) | | | | | | | | (1 | ) | | | (1 | ) |
Amortization of actuarial losses | | | 22 | | | | 22 | | | | 2 | | | | 2 | | | | | | 1 | | |
Amortization of actuarial losses/(gains) | | | | 21 | | | | 22 | | | | 2 | | | | 1 | | | | | (1 | ) |
Net periodic cost/(benefit) | | $ | 18 | | | $ | 23 | | | $ | 6 | | | $ | 6 | | | $ | 4 | | | $ | 5 | | | $ | 19 | | | $ | 22 | | | $ | 6 | | | $ | 6 | | | $ | 5 | | | $ | 4 | |
| | | | | | | | | | | | | | | | | | | | | | | | |
| | | Qualified Pension Plan | | | Nonqualified Retirement Plans | | | Postretirement Benefits | |
Six months ended June 30 In millions | | 2013 | | | 2012 | | | 2013 | | | 2012 | | | 2013 | | | 2012 | |
Net periodic cost consists of: | | | | | | | | | | | | | | | | | | | | | | | | |
Service cost | | $ | 57 | | | $ | 51 | | | $ | 2 | | | $ | 2 | | | $ | 3 | | | $ | 3 | |
Interest cost | | | 85 | | | | 96 | | | | 6 | | | | 7 | | | | 8 | | | | 8 | |
Expected return on plan assets | | | (144 | ) | | | (142 | ) | | | | | | | | | | | | | | | | |
Amortization of prior service credit | | | (4 | ) | | | (4 | ) | | | | | | | | | | | (2 | ) | | | (2 | ) |
Amortization of actuarial losses | | | 43 | | | | 44 | | | | 4 | | | | 3 | | | | | | | | | |
Net periodic cost/(benefit) | | $ | 37 | | | $ | 45 | | | $ | 12 | | | $ | 12 | | | $ | 9 | | | $ | 9 | |
Stock Based Compensation PlansSTOCK BASED COMPENSATION PLANS
As more fully described in Note 16 Stock Based Compensation Plans in our 2012 Form 10-K, we have long-term incentive award plans (Incentive Plans) that provide for the granting of incentive stock options, nonqualified stock options, stock appreciation rights, incentive shares/performance units, restricted stock, restricted share units, other share-based awards and dollar-denominated awards to executives and, other than incentive stock options, to non-employee directors. Certain Incentive Plan awards may be paid in stock, cash or a combination of stock and cash. We typically grant a substantial portion of our stock-based compensation awards during the first quarter of the year. As of March 31,June 30, 2013, no stock appreciation rights were outstanding.
Total compensation expense recognized related to all share-based payment arrangements during the first threesix months of 2013 and 2012 was $41$84 million and $31$56 million, respectively.
134 The PNC Financial Services Group, Inc. –Form 10-Q
Nonqualified Stock OptionsNONQUALIFIED STOCK OPTIONS
Options are granted at exercise prices not less than the market value of common stock on the grant date. Generally, options become exercisable in installments after the grant date. No
option may be exercisable after 10 years from its grant date. Payment of the option exercise price may be in cash or by surrendering shares of common stock at market value on the exercise date. The exercise price may be paid in previously owned shares.
For purposes of computing stock option expense, we estimated the fair value of stock options primarily by using the Black-Scholes option-pricing model. Option pricing models
require the use of numerous assumptions, many of which are very subjective. The option pricing assumptions used by PNC are as follows:
Table 107: Option Pricing Assumptions
| Weighted-average for the three months ended March 31 | | 2013 | | | 2012 | | |
Weighted-average for the six months ended June 30 | | | 2013 | | 2012 | |
Risk-free interest rate | | | .9 | % | | | 1.1 | % | | | .9 | % | | | 1.1 | % |
Dividend yield | | | 2.5 | | | | 2.3 | | | | 2.5 | | | | 2.3 | |
Volatility | | | 34.0 | | | | 35.1 | | | | 34.0 | | | | 35.1 | |
Expected life | | | 6.5 yrs. | | | | 5.9 yrs. | | | | 6.5 yrs. | | | | 5.9 yrs. | |
Grant-date fair value | | $ | 16.35 | | | $ | 16.22 | | | $ | 16.35 | | | $ | 16.22 | |
The PNC Financial Services Group, Inc. –Form 10-Q125
The following table represents the stock option activity for the first threesix months of 2013.
Table 108: Stock Option Rollforward
| | | | PNC | | | PNC Options
Converted From
National City
Options | | | Total | | | PNC | | | PNC Options Converted From National City Options | | | Total | |
| In thousands, except weighted-average data | | Shares | | | Weighted-Average
Exercise Price | | | Shares | | | Weighted-Average
Exercise Price | | | Shares | | | Weighted-Average
Exercise Price | | | Shares | | Weighted-Average
Exercise Price | | | Shares | | | Weighted-Average
Exercise Price | | | Shares | | | Weighted-Average
Exercise Price | |
Outstanding at December 31, 2012 | | | 14,817 | | | $ | 55.52 | | | | 747 | | | $ | 681.16 | | | | 15,564 | | | $ | 85.55 | | | | 14,817 | | | $ | 55.52 | | | | 747 | | | $ | 681.16 | | | | 15,564 | | | $ | 85.55 | |
Granted | | | 161 | | | | 63.87 | | | | | | | | | 161 | | | | 63.87 | | | | 161 | | | | 63.87 | | | | | | | | | 161 | | | | 63.87 | |
Exercised | | | (393 | ) | | | 48.83 | | | | | | | | | (393 | ) | | | 48.83 | | | | (2,492 | ) | | | 44.84 | | | | | | | | | (2,492 | ) | | | 44.84 | |
Cancelled | | | (321 | ) | | | 66.67 | | | | (11 | ) | | | 591.53 | | | | (332 | ) | | | 84.31 | | | | (475 | ) | | | 57.64 | | | | (19 | ) | | | 462.07 | | | | (494 | ) | | | 73.25 | |
Outstanding at March 31, 2013 | | | 14,264 | | | $ | 55.54 | | | | 736 | | | $ | 682.52 | | | | 15,000 | | | $ | 86.31 | | |
Exercisable at March 31, 2013 | | | 12,303 | | | | 54.28 | | | | 736 | | | | 682.52 | | | | 13,039 | | | $ | 89.74 | | |
Outstanding at June 30, 2013 | | | | 12,011 | | | $ | 57.76 | | | | 728 | | | $ | 686.89 | | | | 12,739 | | | $ | 93.72 | |
Exercisable at June 30, 2013 | | | | 10,253 | | | $ | 56.84 | | | | 728 | | | $ | 686.89 | | | | 10,981 | | | $ | 98.61 | |
During the first threesix months of 2013, we issued approximately 244,0002 million shares from treasury stock in connection with stock option exercise activity. As with past exercise activity, we currently intend to utilize treasury stock primarily for any future stock option exercises.
Incentive/Performance Unit Share Awards and Restricted Stock/Share Unit AwardsINCENTIVE/PERFORMANCE UNIT SHARE AWARDSAND RESTRICTED STOCK/SHARE UNIT AWARDS
The fair value of nonvested incentive/performance unit share awards and restricted stock/share unit awards is initially determined based on prices not less than the market value of our common stock on the date of grant. The value of certain incentive/performance unit share awards is subsequently remeasured based on the achievement of one or more financial and other performance goals generally over a three-year period. The Personnel and Compensation Committee (“P&CC”) of the Board of Directors approves the final award payout with respect to incentive/performance unit share awards. Restricted stock/share unit awards have various vesting periods generally ranging from 36 months to 60 months.
Beginning in 2013, we incorporated several enhanced risk-related performance changes to certain long-term incentive compensation programs. In addition to achieving certain financial performance metrics on both an absolute basis and relative to our peers, final payout amounts will be subject to a negative adjustment if PNC fails to meet certain risk-related performance metrics as specified in the award agreement. However, the P&CC has the discretion to reduce any or all of this negative adjustment under certain circumstances. These awards have either a three-year or a four-year performance period and are payable in either stock or a combination of stock and cash.
Additionally, performance-based restricted share units were granted in 2013 to certain executives as part of annual bonus deferral criteria. These units, payable solely in stock, vest ratably over a four-year period and contain the same risk-related discretionary criteria noted in the paragraph above.
126The PNC Financial Services Group, Inc. –Form 10-Q135
In the following table, the unit shares and related weighted-average grant date fair value of the incentive/performance awards exclude the effect of dividends on the underlying shares, as those dividends will be paid in cash.
Table 109: Nonvested Incentive/Performance Unit Share Awards and Restricted Stock/Share Unit Awards – Rollforward
| | Shares in thousands | | Nonvested
Incentive/
Performance
Unit Shares | | Weighted-
Average
Grant
Date Fair
Value | | | Nonvested
Restricted
Stock/
Share
Units | | Weighted-
Average
Grant
Date Fair
Value | | | Nonvested
Incentive/
Performance
Unit Shares | | Weighted-
Average
Grant Date
Fair Value | | | Nonvested
Restricted
Stock/
Share
Units | | Weighted-
Average
Grant Date
Fair Value | |
December 31, 2012 | | | 1,119 | | | $ | 61.14 | | | | 3,061 | | | $ | 60.04 | | | | 1,119 | | | $ | 61.14 | | | | 3,061 | | | $ | 60.04 | |
Granted | | | 885 | | | | 63.86 | | | | 1,082 | | | | 63.42 | | | | 885 | | | | 63.86 | | | | 1,123 | | | | 63.49 | |
Vested/Released | | | (326 | ) | | | 58.26 | | | | (602 | ) | | | 55.04 | | | | (326 | ) | | | 58.26 | | | | (611 | ) | | | 55.07 | |
Forfeited | | | (15 | ) | | | 57.80 | | | | (58 | ) | | | 60.74 | | | | (20 | ) | | | 59.36 | | | | (125 | ) | | | 61.76 | |
March 31, 2013 | | | 1,663 | | | $ | 63.19 | | | | 3,483 | | | $ | 61.94 | | |
June 30, 2013 | | | | 1,658 | | | $ | 63.18 | | | | 3,448 | | | $ | 61.98 | |
At March 31,June 30, 2013, there was $209$179 million of unamortized share-based compensation expense related to nonvested equity compensation arrangements granted under the Incentive Plans. This unamortized cost is expected to be recognized as expense over a period of no longer than five years.
Liability AwardsLIABILITY AWARDS
We granted cash-payable restricted share units to certain executives. The grants were made primarily as part of an annual bonus incentive deferral plan. While there are time-based and other vesting criteria, there are no market or performance criteria associated with these awards. Compensation expense recognized related to these awards was recorded in prior periods as part of annual cash bonus criteria. As of March 31,June 30, 2013, there were 833,502829,615 of these cash-payable restricted share units outstanding.
A summary of all nonvested, cash-payable restricted share unit activity follows:
Table 110: Nonvested Cash-Payable Restricted Share Units – Rollforward
| | In thousands | | Nonvested
Cash-Payable
Restricted
Share Units | | | Aggregate
Intrinsic
Value | | | Nonvested
Cash-Payable
Restricted
Share Units | | | Aggregate
Intrinsic
Value | |
Outstanding at December 31, 2012 | | | 920 | | | | | | | 920 | | | | |
Granted | | | 485 | | | | | | | 485 | | | | |
Vested and Released | | | (455 | ) | | | | | | (457 | ) | | | |
Forfeited | | | (1 | ) | | | | | | (2 | ) | | | |
Outstanding at March 31, 2013 | | | 949 | | | $ | 63,133 | | |
Outstanding at June 30, 2013 | | | | 946 | | | $ | 68,944 | |
NOTE 13 FINANCIAL DERIVATIVES
We use derivative financial instruments (derivatives) primarily to help manage exposure to interest rate, market and credit risk and reduce the effects that changes in interest rates may have on net income, fair value of assets and liabilities, and cash flows. We also enter into derivatives with customers to facilitate their risk management activities.
Derivatives represent contracts between parties that usually require little or no initial net investment and result in one party delivering cash or another type of asset to the other party based on a notional amount and an underlying as specified in the contract. Derivative transactions are often measured in terms of notional amount, but this amount is generally not exchanged and it is not recorded on the balance sheet. The notional amount is the basis to which the underlying is applied to determine required payments under the derivative contract. The underlying is a referenced interest rate (commonly LIBOR), security price, credit spread or other index. Residential and commercial real estate loan commitments associated with loans to be sold also qualify as derivative instruments.
All derivatives are carried on our Consolidated Balance Sheet at fair value. Derivative balances are presented on the Consolidated Balance Sheet on a net basis taking into consideration the effects of legally enforceable master netting agreements and any related cash collateral exchanged with counterparties. Further discussion regarding the rights of setoff associated with these legally enforceable master netting agreements is included in the Offsetting, Counterparty Credit Risk, and Contingent Features section below.
Further discussion on how derivatives are accounted for is included in Note 1 Accounting Policies in our 2012Form 10-K.
DERIVATIVES DESIGNATEDIN HEDGE RELATIONSHIPS
Certain derivatives used to manage interest rate risk as part of our asset and liability risk management activities are designated as accounting hedges under GAAP. Derivatives hedging the risks associated with changes in the fair value of assets or liabilities are considered fair value hedges, derivatives hedging the variability of expected future cash flows are considered cash flow hedges, and derivatives hedging a net investment in a foreign subsidiary are considered net investment hedges. Designating derivatives as accounting hedges allows for gains and losses on those derivatives, to the extent effective, to be recognized in the income statement in the same period the hedged items affect earnings.
Fair Value HedgesFAIR VALUE HEDGES
We enter into receive-fixed, pay-variable interest rate swaps to hedge changes in the fair value of outstanding fixed-rate debt
136 The PNC Financial Services Group, Inc. –Form 10-Q
and borrowings caused by fluctuations in market interest rates. The specific products hedged may include bank notes, Federal Home Loan Bank borrowings, and senior and subordinated debt. We also enter into pay-fixed, receive-variable interest
The PNC Financial Services Group, Inc. –Form 10-Q127
rate swaps and zero-coupon swaps to hedge changes in the fair value of fixed rate and zero-coupon investment securities caused by fluctuations in market interest rates. The specific products hedged include U.S. Treasury, government agency and other debt securities. For these hedge relationships, we use statistical regression analysis to assess hedge effectiveness at both the inception of the hedge relationship and on an ongoing basis. There were no components of derivative gains or losses excluded from the assessment of hedge effectiveness.
The ineffective portion of the change in value of our fair value hedge derivatives resulted in net losses of $4$13 million for the first threesix months of 2013 compared with net losses of $20$25 million for the first threesix months of 2012.
Cash Flow HedgesCASH FLOW HEDGES
We enter into receive-fixed, pay-variable interest rate swaps to modify the interest rate characteristics of designated commercial loans from variable to fixed in order to reduce the impact of changes in future cash flows due to market interest rate changes. For these cash flow hedges, any changes in the fair value of the derivatives that are effective in offsetting changes in the forecasted interest cash flows are recorded in Accumulated other comprehensive income and are reclassified to interest income in conjunction with the recognition of interest received on the loans. In the 12 months that follow March 31,June 30, 2013, we expect to reclassify from the amount currently reported in Accumulated other comprehensive income, net derivative gains of $232$222 million pretax, or $151$144 million after-tax, in association with interest received on the hedged loans. This amount could differ from amounts actually recognized due to changes in interest rates, hedge de-designations, and the addition of other hedges subsequent to March 31,June 30, 2013. The maximum length of time over which forecasted loan cash flows are hedged is 87 years. We use statistical regression analysis to assess the effectiveness of these hedge relationships at both the inception of the hedge relationship and on an ongoing basis.
We also periodically enter into forward purchase and sale contracts to hedge the variability of the consideration that will be paid or received related to the purchase or sale of investment securities. The forecasted purchase or sale is consummated upon gross settlement of the forward contract itself. As a result, hedge ineffectiveness, if any, is typically minimal. Gains and losses on these forward contracts are recorded in Accumulated other comprehensive income and are recognized in earnings when the hedged cash flows affect earnings. In the 12 months that follow March 31,June 30, 2013, we expect to reclassify from the amount currently reported in Accumulated other comprehensive income, net derivative gains of $42$34 million pretax, or $28$22 million after-tax, as
adjustments of yield on investment securities. The maximum length of time we are hedging forecasted purchases is twofour months. With respect to forecasted sale of securities, there were no amounts in Accumulated other comprehensive income at March 31,June 30, 2013.
There were no components of derivative gains or losses excluded from the assessment of hedge effectiveness related to either cash flow hedge strategy.
During the first threesix months of 2013 and 2012, there were no gains or losses from cash flow hedge derivatives reclassified to earnings because it became probable that the original forecasted transaction would not occur. The amount of cash flow hedge ineffectiveness recognized in income for the first threesix months of 2013 and 2012 was not material to PNC’s results of operations.
Net Investment HedgesNET INVESTMENT HEDGES
We enter into foreign currency forward contracts to hedge non-U.S. Dollar (USD) net investments in foreign subsidiaries against adverse changes in foreign exchange rates. We assess whether the hedging relationship is highly effective in achieving offsetting changes in the value of the hedge and hedged item by qualitatively verifying that the critical terms of the hedge and hedged item match at the inception of the hedging relationship and on an ongoing basis. There were no components of derivative gains or losses excluded from the assessment of the hedge effectiveness.
For the first threesix months of 2013 and 2012, there was no net investment hedge ineffectiveness.
Further detail regarding the notional amounts, fair values and gains and losses recognized related to derivatives used in fair value, cash flow, and net investment hedge strategies is presented in the following derivative tables: Tables 111: Derivatives Total Notional or Contractual Amounts and Fair Values, 113: Derivatives Designated in GAAP Hedge Relationships – Fair Value Hedges, 114: Derivatives Designated in GAAP Hedge Relationships – Cash Flow Hedges, and 115: Derivatives Designated in GAAP Hedge Relationships – Net Investment Hedges.
DERIVATIVES NOT DESIGNATEDIN HEDGE RELATIONSHIPS
We also enter into derivatives that are not designated as accounting hedges under GAAP.
The majority of these derivatives are used to manage risk related to residential and commercial mortgage banking activities and are considered economic hedges. Although these derivatives are used to hedge risk, they are not designated as accounting hedges because the contracts they are hedging are typically also carried at fair value on the balance sheet, resulting in symmetrical accounting treatment for both the hedging instrument and the hedged item.
The PNC Financial Services Group, Inc. –Form 10-Q137
Our residential mortgage banking activities consist of originating, selling and servicing mortgage loans. Residential mortgage loans that will be sold in the secondary market, and the related loan commitments, which are considered derivatives, are accounted for at fair value. Changes in the fair
128 The PNC Financial Services Group, Inc. –Form 10-Q
value of the loans and commitments due to interest rate risk are hedged with forward contracts to sell mortgage-backed securities, as well as U.S. Treasury and Eurodollar futures and options. Gains and losses on the loans and commitments held for sale and the derivatives used to economically hedge them are included in Residential mortgage noninterest income on the Consolidated Income Statement.
We typically retain the servicing rights related to residential mortgage loans that we sell. Residential mortgage servicing rights are accounted for at fair value with changes in fair value influenced primarily by changes in interest rates. Derivatives used to hedge the fair value of residential mortgage servicing rights include interest rate futures, swaps, options (including caps, floors, and swaptions), and forward contracts to purchase mortgage-backed securities. Gains and losses on residential mortgage servicing rights and the related derivatives used for hedging are included in Residential mortgage noninterest income.
Certain commercial mortgage loans held for sale are accounted for at fair value. These loans, and the related loan commitments, which are considered derivatives, are accounted for at fair value. In addition we originate loans for sale into the secondary market that are carried at the lower of cost or fair value. Derivatives used to economically hedge these loans and commitments from changes in fair value due to interest rate risk and credit risk include forward loan sale contracts, interest rate swaps, and credit default swaps. Gains and losses on the commitments, loans and derivatives are included in Other noninterest income. Derivatives used to economically hedge the change in value of commercial mortgage servicing rights include interest rate swaps and futures. Gains or losses on these derivatives are included in Corporate services noninterest income.
The residential and commercial mortgage loan commitments associated with loans to be sold which are accounted for as derivatives are valued based on the estimated fair value of the underlying loan and the probability that the loan will fund within the terms of the commitment. The fair value also takes into account the fair value of the embedded servicing right.
We offer derivatives to our customers in connection with their risk management needs. These derivatives primarily consist of interest rate swaps, interest rate caps, floors, swaptions and foreign exchange contracts, and equity contracts. We primarily manage our market
risk exposure from customer transactions by entering into a variety of hedging transactions with third-party dealers. Gains and losses on customer-related derivatives are included in Other noninterest income.
The derivatives portfolio also includes derivatives used for other risk management activities. These derivatives are entered into based on stated risk management objectives and
include credit default swaps (CDSs) used to mitigate the risk of economic loss on a portion of our loan exposure. We enter into credit default swaps under which we buy loss protection from or sell loss protection to a counterparty for the occurrence of a credit event related to a referenced entity or index. There were no credit default swaps sold as of March 31,June 30, 2013 and December 31, 2012. The fair values of these derivatives typically are based on related credit spreads. Gains and losses on the derivatives entered into for other risk management are included in Other noninterest income. CDSs are included in the following derivative tables: Tables 111: Derivatives Total Notional or Contractual Amounts and Fair Values, 117: Credit Default Swaps, 118: Credit Ratings of Credit Default Swaps and 119: Referenced/Underlying Assets of Credit Default Swaps.
We also periodically enter into risk participation agreements to share some of the credit exposure with other counterparties related to interest rate derivative contracts or to take on credit exposure to generate revenue. We will make/receive payments under these agreements if a customer defaults on its obligation to perform under certain derivative swap contracts. Risk participation agreements are included in the following derivative tables: Tables 111: Derivatives Total Notional or Contractual Amounts and Fair Values, 116: Gains (Losses) on Derivatives Not Designated as Hedging Instruments under GAAP, 120: Risk Participation Agreements Sold and 121: Internal Credit Ratings of Risk Participation Agreements Sold.
Included in the customer, mortgage banking risk management, and other risk management portfolios are written interest-rate caps and floors entered into with customers and for risk management purposes. We receive an upfront premium from the counterparty and are obligated to make payments to the counterparty if the underlying market interest rate rises above or falls below a certain level designated in the contract. Our ultimate obligation under written options is based on future market conditions and is only quantifiable at settlement.
In connection with the sales of a portion of our Visa Class B common shares in 2012, we entered into swap agreements with the purchaser in which we will make or receive payments based on subsequent changes in the conversion rate of Class B into Class A common shares and to make payments calculated by reference to the market price of the Class A common shares. The fair value of the swaps, included in Other liabilities on our Consolidated Balance Sheet, was $43 million at both March 31, 2013 and December 31, 2012.
Further detail regarding the derivatives not designated in hedging relationships is presented in the following derivative tables: Tables 111: Derivatives Total Notional or Contractual Amounts and Fair Values and 116: Gains (Losses) on Derivatives Not Designated as Hedging Instruments under GAAP.
138The PNC Financial Services Group, Inc. –Form 10-Q129
Table 111: Derivatives Total Notional or Contractual Amounts and Fair Values
| | | | March 31, 2013 | | | December 31, 2012 | | | June 30, 2013 | | | December 31, 2012 | |
| In millions | | Notional/
Contract
Amount | | | Asset
Fair Value (a) | | | Liability
Fair Value (b) | | | Notional/
Contract
Amount | | | Asset
Fair Value (a) | | | Liability
Fair Value (b) | | | Notional/
Contract
Amount | | | Asset
Fair
Value (a) | | | Liability
Fair
Value (b) | | | Notional/
Contract
Amount | | | Asset
Fair
Value (a) | | | Liability
Fair
Value (b) | |
Derivatives designated as hedging instruments under GAAP | | | | | | | | | | | | | | | | | | | | | | | | | | |
Interest rate contracts: | | | | | | | | | | | | | | | | | | | | | | | | | | |
Cash flow hedges: | | | | | | | | | | | | | | | | | | | | | | | | | | |
Receive fixed swaps (c) | | $ | 12,872 | | | $ | 438 | | | $ | 1 | | | $ | 13,428 | | | $ | 504 | | | | | | $ | 13,799 | | | $ | 307 | | | $ | 69 | | | $ | 13,428 | | | $ | 504 | | | | |
Forward purchase commitments | | | 1,110 | | | | 18 | | | | | | 250 | | | | 1 | | | | | | | 3,480 | | | | 9 | | | | 38 | | | | 250 | | | | 1 | | | | |
Subtotal | | $ | 13,982 | | | $ | 456 | | | $ | 1 | | | $ | 13,678 | | | $ | 505 | | | | | | $ | 17,279 | | | $ | 316 | | | $ | 107 | | | $ | 13,678 | | | $ | 505 | | | | |
Fair value hedges: | | | | | | | | | | | | | | | | | | | | | | | | | | |
Receive fixed swaps (c) | | $ | 13,874 | | | $ | 1,233 | | | $ | 12 | | | $ | 12,394 | | | $ | 1,365 | | | | | | $ | 13,856 | | | $ | 990 | | | $ | 153 | | | $ | 12,394 | | | $ | 1,365 | | | | |
Pay fixed swaps (c) (d) | | | 1,992 | | | | 5 | | | | 111 | | | | 2,319 | | | | 2 | | | $ | 144 | | | | 1,874 | | | | 26 | | | | 69 | | | | 2,319 | | | | 2 | | | $ | 144 | |
Subtotal | | $ | 15,866 | | | $ | 1,238 | | | $ | 123 | | | $ | 14,713 | | | $ | 1,367 | | | $ | 144 | | | $ | 15,730 | | | $ | 1,016 | | | $ | 222 | | | $ | 14,713 | | | $ | 1,367 | | | $ | 144 | |
Foreign exchange contracts: | | | | | | | | | | | | | | | | | | | | | | | | | | |
Net investment hedge | | | 822 | | | | 49 | | | | | | 879 | | | | | | 8 | | | | 848 | | | | 48 | | | | | | 879 | | | | | | 8 | |
Total derivatives designated as hedging instruments | | $ | 30,670 | | | $ | 1,743 | | | $ | 124 | | | $ | 29,270 | | | $ | 1,872 | | | $ | 152 | | | $ | 33,857 | | | $ | 1,380 | | | $ | 329 | | | $ | 29,270 | | | $ | 1,872 | | | $ | 152 | |
Derivatives not designated as hedging instruments under GAAP | | | | | | | | | | | | | | | | | | | | | | | | | | |
Derivatives used for residential mortgage banking activities: | | | | | | | | | | | | | | | | | | | | | | | | | | |
Residential mortgage servicing | | | | | | | | | | | | | | | | | | | | | | | | | | |
Interest rate contracts: | | | | | | | | | | | | | | | | | | | | | | | | | | |
Swaps | | $ | 57,752 | | | $ | 2,018 | | | $ | 1,513 | | | $ | 59,607 | | | $ | 2,204 | | | $ | 1,790 | | | $ | 61,792 | | | $ | 1,629 | | | $ | 1,290 | | | $ | 59,607 | | | $ | 2,204 | | | $ | 1,790 | |
Swaptions | | | 3,441 | | | | 29 | | | | 32 | | | | 5,890 | | | | 209 | | | | 119 | | | | 6,417 | | | | 33 | | | | 24 | | | | 5,890 | | | | 209 | | | | 119 | |
Futures (e) | | | 58,473 | | | | | | | | 49,816 | | | | | | | | | 46,276 | | | | | | | | 49,816 | | | | | | |
Future options | | | 26,700 | | | | 8 | | | | 3 | | | | 34,350 | | | | 5 | | | | 2 | | | | 25,750 | | | | 25 | | | | 5 | | | | 34,350 | | | | 5 | | | | 2 | |
Mortgage-backed securities commitments | | | 7,677 | | | | 15 | | | | 4 | | | | 3,429 | | | | 3 | | | | 1 | | | | 4,467 | | | | 17 | | | | 50 | | | | 3,429 | | | | 3 | | | | 1 | |
Subtotal | | $ | 154,043 | | | $ | 2,070 | | | $ | 1,552 | | | $ | 153,092 | | | $ | 2,421 | | | $ | 1,912 | | | $ | 144,702 | | | $ | 1,704 | | | $ | 1,369 | | | $ | 153,092 | | | $ | 2,421 | | | $ | 1,912 | |
Loan sales | | | | | | | | | | | | | | | | | | | | | | | | | | |
Interest rate contracts: | | | | | | | | | | | | | | | | | | | | | | | | | | |
Futures (e) | | $ | 585 | | | | | | | $ | 702 | | | | | | | | $ | 485 | | | | | | | $ | 702 | | | | | | |
Bond options | | | 800 | | | $ | 3 | | | | | | 900 | | | $ | 3 | | | | | | | 400 | | | $ | 10 | | | | | | 900 | | | $ | 3 | | | | |
Mortgage-backed securities commitments | | | 9,710 | | | | 11 | | | $ | 26 | | | | 8,033 | | | | 5 | | | $ | 14 | | | | 11,279 | | | | 232 | | | $ | 89 | | | | 8,033 | | | | 5 | | | $ | 14 | |
Residential mortgage loan commitments | | | 4,349 | | | | 70 | | | | | | 4,092 | | | | 85 | | | | | | | 3,738 | | | | 11 | | | | 22 | | | | 4,092 | | | | 85 | | | | |
Subtotal | | $ | 15,444 | | | $ | 84 | | | $ | 26 | | | $ | 13,727 | | | $ | 93 | | | $ | 14 | | | $ | 15,902 | | | $ | 253 | | | $ | 111 | | | $ | 13,727 | | | $ | 93 | | | $ | 14 | |
Subtotal | | $ | 169,487 | | | $ | 2,154 | | | $ | 1,578 | | | $ | 166,819 | | | $ | 2,514 | | | $ | 1,926 | | | $ | 160,604 | | | $ | 1,957 | | | $ | 1,480 | | | $ | 166,819 | | | $ | 2,514 | | | $ | 1,926 | |
Derivatives used for commercial mortgage banking activities | | | | | | | | | | | | | | | | | | | | | | | | | | |
Interest rate contracts: | | | | | | | | | | | | | | | | | | | | | | | | | | |
Swaps | | $ | 1,222 | | | $ | 52 | | | $ | 81 | | | $ | 1,222 | | | $ | 56 | | | $ | 84 | | | $ | 1,054 | | | $ | 22 | | | $ | 49 | | | $ | 1,222 | | | $ | 56 | | | $ | 84 | |
Swaptions | | | | | | | | | | | | | | | | 1,050 | | | | 5 | | | | 4 | | | | | | | | |
Futures (e) | | | 2,030 | | | | | | | | 2,030 | | | | | | | | | 1,279 | | | | | | | | 2,030 | | | | | | |
Future options | | | | 5,200 | | | | 2 | | | | 7 | | | | | | | | |
Commercial mortgage loan commitments | | | 572 | | | | 14 | | | | 8 | | | | 1,259 | | | | 12 | | | | 9 | | | | 1,313 | | | | 37 | | | | 24 | | | | 1,259 | | | | 12 | | | | 9 | |
Subtotal | | $ | 3,824 | | | $ | 66 | | | $ | 89 | | | $ | 4,511 | | | $ | 68 | | | $ | 93 | | | $ | 9,896 | | | $ | 66 | | | $ | 84 | | | $ | 4,511 | | | $ | 68 | | | $ | 93 | |
Credit contracts: | | | | | | | | | | | | | | | | | | | | | | | | | | |
Credit default swaps | | | 95 | | | | 2 | | | | | | 95 | | | | 2 | | | | | | | 95 | | | | 2 | | | | | | 95 | | | | 2 | | | | |
Subtotal | | $ | 3,919 | | | $ | 68 | | | $ | 89 | | | $ | 4,606 | | | $ | 70 | | | $ | 93 | | | $ | 9,991 | | | $ | 68 | | | $ | 84 | | | $ | 4,606 | | | $ | 70 | | | $ | 93 | |
Derivatives used for customer-related activities: | | | | | | | | | | | | | | | | | | | | | | | | | | |
Interest rate contracts: | | | | | | | | | | | | | | | | | | | | | | | | | | |
Swaps | | $ | 125,498 | | | $ | 3,510 | | | $ | 3,544 | | | $ | 127,567 | | | $ | 3,869 | | | $ | 3,917 | | | $ | 126,963 | | | $ | 2,862 | | | $ | 2,848 | | | $ | 127,567 | | | $ | 3,869 | | | $ | 3,917 | |
Caps/floors – Sold | | | 4,451 | | | | | | 2 | | | | 4,588 | | | | | | 1 | | | | 4,920 | | | | | | 7 | | | | 4,588 | | | | | | 1 | |
Caps/floors – Purchased | | | 4,182 | | | | 21 | | | | | | 4,187 | | | | 21 | | | | | | | 4,716 | | | | 22 | | | | | | 4,187 | | | | 21 | | | | |
Swaptions | | | 2,338 | | | | 75 | | | | 36 | | | | 2,285 | | | | 82 | | | | 35 | | | | 2,889 | | | | 61 | | | | 60 | | | | 2,285 | | | | 82 | | | | 35 | |
Futures (e) | | | 5,443 | | | | | | | | 9,113 | | | | | | | | | 5,344 | | | | | | | | 9,113 | | | | | | |
Mortgage-backed securities commitments | | | 2,335 | | | | 3 | | | | 4 | | | | 1,736 | | | | 2 | | | | 2 | | | | 2,689 | | | | 24 | | | | 22 | | | | 1,736 | | | | 2 | | | | 2 | |
Subtotal | | $ | 144,247 | | | $ | 3,609 | | | $ | 3,586 | | | $ | 149,476 | | | $ | 3,974 | | | $ | 3,955 | | | $ | 147,521 | | | $ | 2,969 | | | $ | 2,937 | | | $ | 149,476 | | | $ | 3,974 | | | $ | 3,955 | |
Foreign exchange contracts | | | 11,834 | | | | 169 | | | | 133 | | | | 10,737 | | | | 126 | | | | 112 | | | | 12,645 | | | | 209 | | | | 164 | | | | 10,737 | | | | 126 | | | | 112 | |
Equity contracts | | | 13 | | | | | | 1 | | | | 105 | | | | 1 | | | | 3 | | | | | | | | | | 105 | | | | 1 | | | | 3 | |
Credit contracts: | | | | | | | | | | | | | | | | | | | | | | | | | | |
Risk participation agreements | | | 3,757 | | | | 5 | | | | 6 | | | | 3,530 | | | | 5 | | | | 6 | | | | 3,769 | | | | 1 | | | | 4 | | | | 3,530 | | | | 5 | | | | 6 | |
Subtotal | | $ | 159,851 | | | $ | 3,783 | | | $ | 3,726 | | | $ | 163,848 | | | $ | 4,106 | | | $ | 4,076 | | | $ | 163,935 | | | $ | 3,179 | | | $ | 3,105 | | | $ | 163,848 | | | $ | 4,106 | | | $ | 4,076 | |
Derivatives used for other risk management activities: | | | | | | | | | | | | | | | | | | | | | | | | | | |
Interest rate contracts: | | | | | | | | | | | | | | | | | | | | | | | | | | |
Swaps | | $ | 794 | | | $ | 4 | | | | | $ | 601 | | | $ | 4 | | | | | | $ | 552 | | | | | | | $ | 601 | | | $ | 4 | | | | |
Futures (e) | | | 285 | | | | | | | | 274 | | | | | | | | | 155 | | | | | | | | 274 | | | | | | |
Residential mortgage loan commitments | | | | 600 | | | $ | 1 | | | $ | 1 | | | | | | | | |
Subtotal | | $ | 1,079 | | | $ | 4 | | | | | $ | 875 | | | $ | 4 | | | | | | $ | 1,307 | | | $ | 1 | | | $ | 1 | | | $ | 875 | | | $ | 4 | | | | |
Foreign exchange contracts | | | 15 | | | | | $ | 3 | | | | 17 | | | | | $ | 3 | | | | 13 | | | | | | | | 17 | | | | | $ | 3 | |
Equity contracts | | | 8 | | | | 3 | | | | 3 | | | | 8 | | | | 2 | | | | 2 | | | | | | | | | | 8 | | | | 2 | | | | 2 | |
Credit contracts: | | | | | | | | | | | | | | | | | | | | | | | | | | |
Credit default swaps | | | | | | | | | 15 | | | | | | | | | | | | | | | 15 | | | | | | |
Other contracts (f) | | | 962 | | | | | | 384 | | | | 898 | | | | | | 358 | | | | 941 | | | | | | 331 | | | | 898 | | | | | | 358 | |
Subtotal | | $ | 2,064 | | | $ | 7 | | | $ | 390 | | | $ | 1,813 | | | $ | 6 | | | $ | 363 | | | $ | 2,261 | | | $ | 1 | | | $ | 332 | | | $ | 1,813 | | | $ | 6 | | | $ | 363 | |
Total derivatives not designated as hedging instruments | | $ | 335,321 | | | $ | 6,012 | | | $ | 5,783 | | | $ | 337,086 | | | $ | 6,696 | | | $ | 6,458 | | | $ | 336,791 | | | $ | 5,205 | | | $ | 5,001 | | | $ | 337,086 | | | $ | 6,696 | | | $ | 6,458 | |
Total Gross Derivatives | | $ | 365,991 | | | $ | 7,755 | | | $ | 5,907 | | | $ | 366,356 | | | $ | 8,568 | | | $ | 6,610 | | | $ | 370,648 | | | $ | 6,585 | | | $ | 5,330 | | | $ | 366,356 | | | $ | 8,568 | | | $ | 6,610 | |
130The PNC Financial Services Group, Inc. –Form 10-Q139
| (a) | Included in Other assets on our Consolidated Balance Sheet. |
| (b) | Included in Other liabilities on our Consolidated Balance Sheet. |
| (c) | The floating rate portion of interest rate contracts is based on money-market indices. As a percent of notional amount, 47%48% were based on 1-month LIBOR and 53%52% on 3-month LIBOR at March 31,June 30, 2013 compared with 51% and 49%, respectively, at December 31, 2012. |
| (d) | Includes zero-coupon swaps. |
| (e) | Futures contracts settle in cash daily and therefore, no derivative asset or liability is recognized on our Consolidated Balance Sheet. |
| (f) | Includes PNC’s obligation to fund a portion of certain BlackRock LTIP programs a forward purchase commitment for certain loans upon conversion from a variable rate to a fixed rate related to a Non-agency securitization that PNC consolidated in the first quarter of 2013, and the swaps entered into in connection with sales of a portion of Visa Class B common shares in the second quarter of 2013 and second half of 2012. Refer to Note 9 Fair Value for additional information on the Visa swaps. |
OFFSETTING, COUNTERPARTY CREDIT RISK,AND CONTINGENT FEATURES
We utilize a net presentation on the Consolidated Balance Sheet for those derivative financial instruments entered into with counterparties under legally enforceable master netting agreements. The master netting agreements reduce credit risk by permitting the closeout netting of various types of derivative instruments with the same counterparty upon the occurrence of an event of default. The master netting agreement also may require the exchange of cash or marketable securities to collateralize either party’s net position. In certain cases, minimum thresholds must be exceeded before any collateral is exchanged. Collateral is typically exchanged daily based on the net fair value of the positions with the counterparty as of the preceding day. Any cash collateral exchanged with counterparties under these master netting agreements is also netted against the applicable derivative fair values on the Consolidated Balance Sheet.
However, the fair value of any securities held or pledged is not included in the net presentation on the balance sheet. In order for an arrangement to be eligible for netting under GAAP (ASC 210-20), we must obtain the requisite assurance that the offsetting rights included in the master netting
agreement would be legally enforceable in the event of bankruptcy, insolvency, or a similar proceeding of such third party. Enforceability is evidenced by obtaining a legal opinion that supports, with sufficient confidence, the enforceability of the master netting agreement in bankruptcy.
The following derivative Table 112: Derivative Assets and Liabilities Offsetting shows the impact legally enforceable master netting agreements had on our derivative assets and derivative liabilities as of March 31,June 30, 2013 and December 31, 2012. The table also includes the fair value of any securities collateral held or pledged under theselegally enforceable master netting agreements. Cash and securities collateral amounts are included in the table only to the extent of the related net derivative fair values.
FurtherFor further discussion on ASU 2011-11, Balance Sheet (Topic 210): Disclosures about Offsetting Assets and Liabilities and the impact of other instruments entered into under master netting arrangements, is included insee Note 1 under Recent Accounting Pronouncements.Pronouncements in the March 31, 2013Form 10-Q. Refer to Note 18 Commitments and Guarantees for additional information related to resale and repurchase agreements offsetting.
Table 112: Derivative Assets and Liabilities Offsetting
| | | | Gross
Fair Value
Derivative
Assets | | | Amounts Offset Under Master Netting Agreements | | | Net
Fair Value
Derivative
Assets | | | Securities
Collateral
Held Under
Master
Netting
Agreements | | | Net
Amounts | | |
March 31, 2013 In millions | | Fair Value
Offset Amount | | | Cash
Collateral | | | | | |
June 30, 2013 In millions | | | Gross
Fair Value Derivative
Assets | | | Amounts Offset on the
Consolidated Balance Sheet | | | Net
Fair Value Derivative
Assets | | | Securities
Collateral
Held Under Master Netting
Agreements | | | Net
Amounts | |
| | | Fair Value
Offset Amount | | | Cash
Collateral | | | | |
Derivative assets | | | | | | | | | | | | | | | | | | | | | | |
Interest rate contracts | | $ | 7,527 | | | $ | 4,365 | | | $ | 776 | | | $ | 2,386 | | | $ | 334 | | | $ | 2,052 | | | $ | 6,325 | | | $ | 3,534 | | | $ | 635 | | | $ | 2,156 | | | $ | 233 | | | $ | 1,923 | |
Foreign exchange contracts | | | 218 | | | | 145 | | | | 24 | | | | 49 | | | | | | 49 | | | | 257 | | | | 146 | | | | 23 | | | | 88 | | | | | | 88 | |
Equity contracts | | | 3 | | | | 3 | | | | | | | | | | | |
Credit contracts | | | 7 | | | | 1 | | | | | | 6 | | | | | 6 | | | | 3 | | | | 3 | | | | | | | | |
Total derivative assets | | $ | 7,755 | | | $ | 4,514 | | | $ | 800 | | | $ | 2,441 | (a) | | $ | 334 | | | $ | 2,107 | | | $ | 6,585 | | | $ | 3,683 | | | $ | 658 | | | $ | 2,244 | (a) | | $ | 233 | | | $ | 2,011 | |
| | | | | | | | | | | | | | |
| | | Gross
Fair Value
Derivative
Liabilities | | | Amounts Offset Under Master Netting Agreements | | | Net
Fair Value
Derivative
Liabilities | | | Securities
Collateral
Pledged
Under
Master
Netting
Agreements | | | Net
Amounts | | |
March 31, 2013 In millions | | Fair Value
Offset Amount | | | Cash
Collateral | | | | | |
Derivative liabilities | | | | | | | | | | | | |
Interest rate contracts | | $ | 5,377 | | | $ | 4,476 | | | $ | 731 | | | $ | 170 | | | $ | 12 | | | $ | 158 | | |
Foreign exchange contracts | | | 136 | | | | 38 | | | | 5 | | | | 93 | | | | | | 93 | | |
Equity contracts | | | 4 | | | | | | | | 4 | | | | | | 4 | | |
Credit contracts | | | 6 | | | | | | | | 6 | | | | | | 6 | | |
Other contracts | | | 384 | | | | | | | | 384 | | | | | 384 | | |
Total derivative liabilities | | $ | 5,907 | | | $ | 4,514 | | | $ | 736 | | | $ | 657 | (b) | | $ | 12 | | | $ | 645 | | |
| | | | | | | | | | | | | | | | | | | | | | | | |
June 30, 2013 In millions | | Gross Fair
Value Derivative
Liabilities | | | Amounts Offset on the Consolidated Balance Sheet | | | Net
Fair Value Derivative
Liabilities | | | Securities
Collateral
Pledged Under Master Netting
Agreements | | | Net
Amounts | |
| | | Fair Value
Offset Amount | | | Cash
Collateral | | | | |
Derivative liabilities | | | | | | | | | | | | | | | | | | | | | | | | |
Interest rate contracts | | $ | 4,831 | | | $ | 3,625 | | | $ | 573 | | | $ | 633 | | | $ | – | | | $ | 633 | |
Foreign exchange contracts | | | 164 | | | | 55 | | | | 9 | | | | 100 | | | | | | | | 100 | |
Credit contracts | | | 4 | | | | 3 | | | | | | | | 1 | | | | | | | | 1 | |
Other contracts | | | 331 | | | | | | | | | | | | 331 | | | | | | | | 331 | |
Total derivative liabilities | | $ | 5,330 | | | $ | 3,683 | | | $ | 582 | | | $ | 1,065 | (b) | | $ | – | | | $ | 1,065 | |
140The PNC Financial Services Group, Inc. –Form 10-Q131
| | | | Gross
Fair Value
Derivative
Assets | | | Amounts
Offset Under
Master Netting Agreements | | | Net
Fair Value
Derivative
Assets | | | Securities
Collateral
Held Under
Master
Netting
Agreements | | | Net
Amounts | | |
December 31, 2012 In millions | | | Gross Fair
Value Derivative
Assets | | | Amounts Offset on the Consolidated Balance Sheet | | | Net
Fair Value Derivative
Assets | | | Securities
Collateral
Held Under Master Netting
Agreements | | | Net
Amounts | |
| | Gross
Fair Value
Derivative
Assets | | | Fair Value
Offset Amount | | | Cash
Collateral | | | Net
Fair Value
Derivative
Assets | | | Securities
Collateral
Held Under
Master
Netting
Agreements | | | Net
Amounts | | | | Fair Value
Offset Amount | | | Cash
Collateral | | | | |
Derivative assets | | | | | | | | | | | | | | | | | | |
Interest rate contracts | | $ | 8,432 | | | $ | 5,041 | | | $ | 1,024 | | | $ | 2,367 | | | $ | 135 | | | $ | 2,232 | | | $ | 8,432 | | | $ | 5,041 | | | $ | 1,024 | | | $ | 2,367 | | | $ | 135 | | | $ | 2,232 | |
Foreign exchange contracts | | | 126 | | | | 61 | | | | 7 | | | | 58 | | | | | | 58 | | | | 126 | | | | 61 | | | | 7 | | | | 58 | | | | | | 58 | |
Equity contracts | | | 3 | | | | 3 | | | | | | | | | | | | | 3 | | | | 3 | | | | | | | | | | |
Credit contracts | | | 7 | | | | 2 | | | | | | 5 | | | | | 5 | | | | 7 | | | | 2 | | | | | | 5 | | | | | 5 | |
Total derivative assets | | $ | 8,568 | | | $ | 5,107 | | | $ | 1,031 | | | $ | 2,430 | (a) | | $ | 135 | | | $ | 2,295 | | | $ | 8,568 | | | $ | 5,107 | | | $ | 1,031 | | | $ | 2,430 | (a) | | $ | 135 | | | $ | 2,295 | |
| | | | | | | | | | | | | | |
| | | Gross
Fair Value
Derivative
Liabilities | | | Amounts
Offset Under
Master Netting Agreements | | | Net
Fair Value
Derivative
Liabilities | | | Securities
Collateral
Pledged
Under
Master
Netting
Agreements | | | Net
Amounts | | |
December 31, 2012 In millions | | Fair Value
Offset Amount | | | Cash
Collateral | | | | | |
Derivative liabilities | | | | | | | | | | | | | | |
Interest rate contracts | | $ | 6,118 | | | $ | 5,060 | | | $ | 908 | | | $ | 150 | | | $ | 18 | | | $ | 132 | | |
Foreign exchange contracts | | | 123 | | | | 47 | | | | 6 | | | | 70 | | | | | | 70 | | |
Equity contracts | | | 5 | | | | | | | | 5 | | | | | | 5 | | |
Credit contracts | | | 6 | | | | | | | | 6 | | | | | | 6 | | |
Other contracts | | | 358 | | | | | | | | 358 | | | | | 358 | | |
Total derivative liabilities | | $ | 6,610 | | | $ | 5,107 | | | $ | 914 | | | $ | 589 | (b) | | $ | 18 | | | $ | 571 | | |
| | | | | | | | | | | | | | | | | | | | | | | | |
December 31, 2012 In millions | | Gross Fair
Value Derivative
Liabilities | | | Amounts Offset on the
Consolidated Balance Sheet | | | Net
Fair Value Derivative
Liabilities | | | Securities
Collateral
Pledged Under Master Netting
Agreements | | | Net
Amounts | |
| | | Fair Value
Offset Amount | | | Cash
Collateral | | | | |
Derivative liabilities | | | | | | | | | | | | | | | | | | | | | | | | |
Interest rate contracts | | $ | 6,118 | | | $ | 5,060 | | | $ | 908 | | | $ | 150 | | | $ | 18 | | | $ | 132 | |
Foreign exchange contracts | | | 123 | | | | 47 | | | | 6 | | | | 70 | | | | | | | | 70 | |
Equity contracts | | | 5 | | | | | | | | | | | | 5 | | | | | | | | 5 | |
Credit contracts | | | 6 | | | | | | | | | | | | 6 | | | | | | | | 6 | |
Other contracts | | | 358 | | | | | | | | | | | | 358 | | | | | | | | 358 | |
Total derivative liabilities | | $ | 6,610 | | | $ | 5,107 | | | $ | 914 | | | $ | 589 | (b) | | $ | 18 | | | $ | 571 | |
| (a) | Represents the net amount of derivative assets included in Other Assets on our Consolidated Balance Sheet. |
| (b) | Represents the net amount of derivative liabilities included in Other Liabilities on our Consolidated Balance Sheet. |
In addition to using master netting and related collateral agreements to reduce credit risk associated with derivative instruments, we also seek to minimize credit risk by entering into transactions with counterparties with high credit ratings and by using internal credit approvals, limits, and monitoring procedures. Collateral may also be exchanged under certain derivative agreements that are not considered master netting agreements.
At March 31,June 30, 2013, we held cash, U.S. government securities and mortgage-backed securities totaling $1.2$1.0 billion under master netting and other collateral agreements to collateralize net derivative assets due from counterparties, and we have pledged cash, U.S. government securities and agency mortgage-backed securities totaling $792$618 million under these agreements to collateralize net derivative liabilities owed to counterparties. These totals may differ from the amounts presented in the preceding offsetting table because they may include collateral exchanged under an agreement that does not qualify as a master netting agreement or because the total amount of collateral held or pledged exceeds the net derivative fair value with the counterparty as of the balance sheet date due to timing or other factors. To the extent not netted against the derivative fair value under a master netting agreement, the receivable for cash pledged is included in Other assets and the obligation for cash held is included in Other borrowed funds on our Consolidated Balance Sheet. Securities held from counterparties are not recognized on our balance sheet.
Likewise securities we have pledged to counterparties remain on our balance sheet.
Certain of the master netting agreements and certain other derivative agreements also contain provisions that require PNC’s debt to maintain an investment grade credit rating from each of the major credit rating agencies. If PNC’s debt ratings were to fall below investment grade, we would be in violation of these provisions and the counterparties to the derivative instruments could request immediate payment or demand immediate and ongoing full overnight collateralization on derivative instruments in net liability positions. The aggregate fair value of all derivative instruments with credit-risk-related contingent features that were in a net liability position on March 31,June 30, 2013 was $924$837 million for which PNC had posted collateral of $748$617 million in the normal course of business. The maximum amount of collateral PNC would have been required to post if the credit-risk-related contingent features underlying these agreements had been triggered on March 31,June 30, 2013, would be an additional $176$220 million.
Our exposure related to risk participations where we sold protection is discussed in the Credit Derivatives section below.
Any nonperformance risk, including credit risk, is included in the determination of the estimated net fair value of the derivatives.
132 The PNC Financial Services Group, Inc. –Form 10-Q
GAINS (LOSSES)ON DERIVATIVES
The following tables provide the gains (losses) on derivatives designated as hedging instruments and not designated as hedging instruments under GAAP.
The PNC Financial Services Group, Inc. –Form 10-Q141
Gains (losses) on derivative instruments and related hedged items follow:
Table 113: Derivatives Designated in GAAP Hedge Relationships – Fair Value Hedges
| | | | | | | | | | March 31, 2013 | | | March 31, 2012 | | |
| Three months ended | | | | | | | | Gain
(Loss) on
Derivatives
Recognized
in Income | | | Gain
(Loss) on
Related
Hedged
Items
Recognized
in Income | | | Gain
(Loss) on
Derivatives
Recognized
in Income | | | Gain
(Loss) on
Related
Hedged
Items
Recognized
in Income | | |
| In millions | | Hedged Items | | | Location | | | Amount | | | Amount | | | Amount | | | Amount | | |
Six months ended In millions | | | | | | | June 30, 2013 | | June 30, 2012 | |
| | | | | | Gain
(Loss) on
Derivatives
Recognized
in Income | | Gain (Loss)
on Related
Hedged
Items
Recognized
in Income | | Gain
(Loss) on
Derivatives
Recognized
in Income | | Gain (Loss)
on Related
Hedged
Items
Recognized
in Income | |
| | Hedged Items | | Location | | Amount | | Amount | | Amount | | Amount | |
Interest rate contracts | |
| U.S. Treasury and
Government Agencies
Securities |
| |
| Investment securities
(interest income) |
| | $ | 22 | | | $ | (23 | ) | | $ | 19 | | | $ | (24 | ) | | U.S. Treasury and
Government Agencies
Securities | | Investment securities
(interest income) | | $ | 63 | | | $ | (66 | ) | | $ | (29 | ) | | $ | 26 | |
Interest rate contracts | | | Other Debt Securities | | |
| Investment securities
(interest income) |
| | | 2 | | | | (2 | ) | | | | | | | Other Debt Securities | | Investment securities
(interest income) | | | 5 | | | | (5 | ) | | | (2 | ) | | | 2 | |
Interest rate contracts | | | Subordinated debt | | |
| Borrowed funds
(interest expense) |
| | | (68 | ) | | | 66 | | | | (36 | ) | | | 26 | | | Subordinated debt | | Borrowed funds
(interest expense) | | | (263 | ) | | | 256 | | | | 8 | | | | (24 | ) |
Interest rate contracts | |
| Bank notes and senior
debt |
| |
| Borrowed funds
(interest expense) |
| | | (65 | ) | | | 64 | | | | (53 | ) | | | 48 | | | Bank notes and senior debt | | Borrowed funds
(interest expense) | | | (271 | ) | | | 268 | | | | 74 | | | | (80 | ) |
Total | | | | | | $ | (109 | ) | | $ | 105 | | | $ | (70 | ) | | $ | 50 | | | | | | $ | (466 | ) | | $ | 453 | | | $ | 51 | | | $ | (76 | ) |
| | | | | | | | | | | | | | | | | | | | |
Three months ended In millions | | | | | | June 30, 2013 | | | June 30, 2012 | |
| | | | | | Gain
(Loss) on
Derivatives
Recognized
in Income | | | Gain (Loss)
on Related
Hedged
Items
Recognized
in Income | | | Gain
(Loss) on
Derivatives
Recognized
in Income | | | Gain (Loss)
on Related
Hedged
Items
Recognized
in Income | |
| | Hedged Items | | Location | | Amount | | | Amount | | | Amount | | | Amount | |
Interest rate contracts | | U.S. Treasury and
Government Agencies
Securities | | Investment securities
(interest income) | | $ | 41 | | | $ | (43 | ) | | $ | (48 | ) | | $ | 50 | |
Interest rate contracts | | Other Debt Securities | | Investment securities
(interest income) | | | 3 | | | | (3 | ) | | | (2 | ) | | | 2 | |
Interest rate contracts | | Subordinated debt | | Borrowed funds
(interest expense) | | | (195 | ) | | | 190 | | | | 44 | | | | (50 | ) |
Interest rate contracts | | Bank notes and senior debt | | Borrowed funds
(interest expense) | | | (206 | ) | | | 204 | | | | 127 | | | | (128 | ) |
Total | | | | | | $ | (357 | ) | | $ | 348 | | | $ | 121 | | | $ | (126 | ) |
Table 114: Derivatives Designated in GAAP Hedge Relationships – Cash Flow Hedges
| | | | | | | | | | | | | | | | | | | | |
Three months ended
In millions | | | | | Gain
(Loss) on
Derivatives
Recognized
in OCI
(Effective
Portion) | | | Gain (Loss) Reclassified from
Accumulated OCI into Income
(Effective Portion) | | | Gain (Loss) Recognized in
Income on Derivatives (Ineffective
Portion) (a) |
| | | | | Amount | | | Location | | Amount | | | Location | | | Amount |
March 31, 2013 | | | Interest rate contracts | | | $ | 14 | | | Interest income | | $ | 106 | | | | Interest income | | | |
| | | | | | | | | | Noninterest income | | | 15 | | | | | | | |
March 31, 2012 | | | Interest rate contracts | | | $ | 53 | | | Interest income | | $ | 116 | | | | Interest income | | | |
| | | | | | | | | | | Noninterest income | | | 27 | | | | | | | |
| | | | | | | | | | | | | | | | |
Six months ended
In millions | | | | Gain (Loss) on Derivatives
Recognized in OCI
(Effective Portion) | | | Gain (Loss) Reclassified from Accumulated
OCI into Income
(Effective Portion) | | | Gain (Loss) Recognized in Income on
Derivatives
(Ineffective Portion) |
| | | | | Amount | | | Location | | Amount | | | Location | | Amount (a) |
June 30, 2013 | | Interest rate contracts | | $ | (179 | ) | | Interest income | | $ | 186 | | | Interest income | | |
| | | | | | | | Noninterest income | | | 23 | | | | | |
June 30, 2012 | | Interest rate contracts | | $ | 207 | | | Interest income | | $ | 232 | | | Interest income | | |
| | | | | | | | | Noninterest income | | | 59 | | | | | |
| | | | | | | | | | | | | | | | |
Three months ended
In millions | | | | Gain (Loss) on Derivatives
Recognized in OCI
(Effective Portion) | | | Gain (Loss) Reclassified from Accumulated
OCI into Income
(Effective Portion) | | | Gain (Loss) Recognized in Income on
Derivatives
(Ineffective Portion) |
| | | | | Amount | | | Location | | Amount | | | Location | | Amount (a) |
June 30, 2013 | | Interest rate contracts | | $ | (193 | ) | | Interest income | | $ | 80 | | | Interest income | | |
| | | | | | | | Noninterest income | | | 8 | | | | | |
June 30, 2012 | | Interest rate contracts | | $ | 154 | | | Interest income | | $ | 116 | | | Interest income | | |
| | | | | | | | | Noninterest income | | | 32 | | | | | |
| (a) | The amount of cash flow hedge ineffectiveness recognized in income was not material for the periods presented. |
142 The PNC Financial Services Group, Inc. –Form 10-Q
Table 115: Derivatives Designated in GAAP Hedge Relationships – Net Investment Hedges
| | | | | | |
Three months ended
In millions | | | | Gain (Loss) on Derivatives
Recognized in OCI
(Effective Portion) | |
March 31, 2013 | | Foreign exchange contracts | | $ | 57 | |
March 31, 2012 | | Foreign exchange contracts | | $ | (12 | ) |
| | | | | | |
Six months ended In millions | | | | Gain (Loss) on Derivatives
Recognized in OCI
(Effective Portion) | |
June 30, 2013 | | Foreign exchange contracts | | $ | 56 | |
June 30, 2012 | | Foreign exchange contracts | | | – | |
The PNC Financial Services Group, Inc. –Form 10-Q133
Gains (losses) on derivative instruments not designated in hedge relationships:
| | | | | | |
Three months ended
In millions | | | | Gain (Loss) on Derivatives
Recognized in OCI
(Effective Portion) | |
June 30, 2013 | | Foreign exchange contracts | | $ | (1 | ) |
June 30, 2012 | | Foreign exchange contracts | | | 12 | |
Table 116: Gains (Losses) on Derivatives Not Designated as Hedging Instruments under GAAP
| | | | Three months ended
March 31 | | | Three months
ended June 30 | | Six months
ended June 30 | |
| In millions | | 2013 | | 2012 | | | 2013 | | 2012 | | 2013 | | 2012 | |
Derivatives used for residential mortgage banking activities: | | | | | | | | | | | | | | |
Residential mortgage servicing | | | | | | | | | | | | | | |
Interest rate contracts | | $ | (39 | ) | | $ | 83 | | | $ | (172 | ) | | $ | 123 | | | $ | (211 | ) | | $ | 206 | |
Loan sales | | | | | | | | | | | | | | |
Interest rate contracts | | | 34 | | | | 22 | | | | 142 | | | | 14 | | | | 176 | | | | 36 | |
Gains (losses) included in residential mortgage banking activities (a) | | $ | (5 | ) | | $ | 105 | | | $ | (30 | ) | | $ | 137 | | | $ | (35 | ) | | $ | 242 | |
Derivatives used for commercial mortgage banking activities: | | | | | | | | | | | | | | |
Interest rate contracts (b) (c) | | $ | 6 | | | $ | 2 | | | $ | 1 | | | $ | 19 | | | $ | 7 | | | $ | 21 | |
Credit contracts (c) | | | (1 | ) | | | (1 | ) | | | | (1 | ) | | | (1 | ) |
Gains (losses) from commercial mortgage banking activities | | $ | 5 | | | $ | 1 | | | $ | 1 | | | $ | 19 | | | $ | 6 | | | $ | 20 | |
Derivatives used for customer-related activities: | | | | | | | | | | | | | | |
Interest rate contracts | | $ | 19 | | | $ | 36 | | | $ | 67 | | | $ | (9 | ) | | $ | 86 | | | $ | 27 | |
Foreign exchange contracts | | | 23 | | | | 17 | | | | (2 | ) | | | 39 | | | | 21 | | | | 56 | |
Equity contracts | | | (3 | ) | | | (2 | ) | | | | | (3 | ) | | | (3 | ) | | | (5 | ) |
Credit contracts | | | (1 | ) | | | (1 | ) | | | (2 | ) | | | (1 | ) | | | (3 | ) | | | (2 | ) |
Gains (losses) from customer-related activities (c) | | $ | 38 | | | $ | 50 | | | $ | 63 | | | $ | 26 | | | $ | 101 | | | $ | 76 | |
Derivatives used for other risk management activities: | | | | | | | | | | | | | | |
Interest rate contracts | | | | $ | 1 | | | $ | 4 | | | $ | (8 | ) | | $ | 4 | | | $ | (7 | ) |
Foreign exchange contracts | | | | | | | | 2 | | | | (1 | ) | | | 2 | | | | (1 | ) |
Credit contracts | | | | | (1 | ) | | | | | | | | | (1 | ) |
Other contracts (d) | | $ | (59 | ) | | | (54 | ) | | | (18 | ) | | | 44 | | | | (77 | ) | | | (10 | ) |
Gains (losses) from other risk management activities (c) | | $ | (59 | ) | | $ | (54 | ) | | $ | (12 | ) | | $ | 35 | | | $ | (71 | ) | | $ | (19 | ) |
Total gains (losses) from derivatives not designated as hedging instruments | | $ | (21 | ) | | $ | 102 | | | $ | 22 | | | $ | 217 | | | $ | 1 | | | $ | 319 | |
| (a) | Included in Residential mortgage noninterest income. |
| (b) | Included in Corporate services noninterest income. |
| (c) | Included in Other noninterest income. |
| (d) | Includes PNC’s obligation to fund a portion of certain BlackRock LTIP, programs, a forward purchase commitment for certain loans upon conversion from a variable rate to a fixed rate, related to a Non-agency securitization that PNC consolidated in the first quarter of 2013, and the swapsswap entered into in connection with salesthe sale of a portion of Visa Class B common shares in 2012.shares. |
Credit DerivativesCREDIT DERIVATIVES
The credit derivative underlying is based on the credit risk of a specific entity, entities, or an index. As discussed above, we enter into credit derivatives, specifically credit default swaps and risk participation agreements, as part of our commercial mortgage banking hedging activities and for customer and other risk management purposes. Detail regarding credit default swaps and risk participations sold follows.
The PNC Financial Services Group, Inc. –Form 10-Q143
Table 117: Credit Default Swaps (a)
| | | | March 31, 2013 | | | December 31, 2012 | | | June 30, 2013 | | | December 31, 2012 | |
| Dollars in millions | | Notional
Amount | | | Fair
Value | | | Weighted-
Average
Remaining
Maturity
In Years | | | Notional
Amount | | | Fair
Value | | | Weighted-
Average
Remaining
Maturity
In Years | | | Notional
Amount | | | Fair
Value | | | Weighted-
Average
Remaining
Maturity
In Years | | | Notional
Amount | | | Fair
Value | | | Weighted-
Average
Remaining
Maturity
In Years | |
Credit Default Swaps – Purchased | | | | | | | | | | | | | | | | | | | | | | | | | | |
Single name | | $ | 35 | | | | | | 8.0 | | | $ | 50 | | | | | | 5.8 | | | $ | 35 | | | | | | 7.8 | | | $ | 50 | | | | | | 5.8 | |
Index traded | | | 60 | | | $ | 1 | | | | 36.0 | | | | 60 | | | $ | 2 | | | | 36.1 | | | | 60 | | | $ | 2 | | | | 35.7 | | | | 60 | | | $ | 2 | | | | 36.1 | |
Total | | $ | 95 | | | $ | 1 | | | | 25.7 | | | $ | 110 | | | $ | 2 | | | | 22.4 | | | $ | 95 | | | $ | 2 | | | | 25.4 | | | $ | 110 | | | $ | 2 | | | | 22.4 | |
| (a) | There were no credit default swaps sold as of March 31,June 30, 2013 and December 31, 2012 .2012. |
134 The PNC Financial Services Group, Inc. –Form 10-Q
The notional amount of these credit default swaps by credit rating follows:
Table 118: Credit Ratings of Credit Default Swaps (a)
| | Dollars in millions | | March 31
2013 | | | December 31
2012 | | | June 30
2013 | | | December 31
2012 | |
Credit Default Swaps – Purchased | | | | | | | | | | |
Investment grade (b) | | $ | 95 | | | $ | 95 | | | $ | 95 | | | $ | 95 | |
Subinvestment grade (c) | | | | | 15 | | | | | | 15 | |
Total | | $ | 95 | | | $ | 110 | | | $ | 95 | | | $ | 110 | |
| (a) | There were no credit default swaps sold as of March 31,June 30, 2013 and December 31, 2012. |
| (b) | Investment grade with a rating of BBB-/Baa3 or above based on published rating agency information. |
| (c) | Subinvestment grade with a rating below BBB-/Baa3 based on published rating agency information. |
The referenced/underlying assets for these credit default swaps follow:
Table 119: Referenced/Underlying Assets of Credit Default Swaps
| | | | Corporate
Debt | | Commercial
mortgage-
backed
securities | | | Loans | | | Corporate
Debt | | Commercial
mortgage-backed
securities | | Loans | |
March 31, 2013 | | | 37 | % | | | 63 | % | | | 0 | % | |
June 30, 2013 | | | | 37 | % | | | 63 | % | | | 0 | % |
December 31, 2012 | | | 32 | % | | | 54 | % | | | 14 | % | | | 32 | % | | | 54 | % | | | 14 | % |
Risk Participation AgreementsRISK PARTICIPATION AGREEMENTS
We have sold risk participation agreements with terms ranging from less than 1 year to 24 years. We will be required to make payments under these agreements if a customer defaults on its obligation to perform under certain derivative swap contracts with third parties.
Table 120: Risk Participation Agreements Sold
| | Dollars in millions | | Notional
Amount | | | Fair
Value | | | Weighted-
Average
Remaining
Maturity
In Years | | | Notional
Amount | | | Fair Value | | Weighted-Average
Remaining Maturity
In Years | |
March 31, 2013 | | $ | 2,097 | | | $ | (6 | ) | | | 6.4 | | |
June 30, 2013 | | | $ | 2,240 | | | $ | (4 | ) | | | 6.3 | |
December 31, 2012 | | $ | 2,053 | | | $ | (6 | ) | | | 6.6 | | | $ | 2,053 | | | $ | (6 | ) | | | 6.6 | |
Based on our internal risk rating process of the underlying third parties to the swap contracts, the percentages of the exposure amount of risk participation agreements sold by internal credit rating follow:
Table 121: Internal Credit Ratings of Risk Participation Agreements Sold
| | | | March 31, 2013 | | | December 31, 2012 | | | June 30, 2013 | | December 31, 2012 | |
Pass (a) | | | 99 | % | | | 99 | % | | | 98 | % | | | 99 | % |
Below pass (b) | | | 1 | % | | | 1 | % | | | 2 | % | | | 1 | % |
| (a) | Indicates the expected risk of default is currently low. |
| (b) | Indicates a higher degree of risk of default. |
Assuming all underlying swap counterparties defaulted at March 31,June 30, 2013, the exposure from these agreements would be $124$76 million based on the fair value of the underlying swaps, compared with $143 million at December 31, 2012.
144The PNC Financial Services Group, Inc. –Form 10-Q135
NOTE 14 EARNINGS PER SHARE
Table 122: Basic and Diluted Earnings per Common Share
| | Three months ended March 31 | | | | | | | |
| | | | Three months
ended June 30 | | | Six months
ended June 30 | |
| In millions, except per share data | | 2013 | | | 2012 | | | 2013 | | | 2012 | | | 2013 | | | 2012 | |
Basic | | | | | | | | | | | | | |
Net income | | $ | 1,004 | | | $ | 811 | | | $ | 1,123 | | | $ | 546 | | | $ | 2,127 | | | $ | 1,357 | |
Less: | | | | | | | | | | | | | |
Net income (loss) attributable to noncontrolling interests | | | (9 | ) | | | 6 | | | | 1 | | | | (5 | ) | | | (8 | ) | | | 1 | |
Preferred stock dividends and discount accretion and redemptions | | | 75 | | | | 39 | | |
Preferred stock dividends and discount accretion | | | | 53 | | | | 25 | | | | 128 | | | | 64 | |
Dividends and undistributed earnings allocated to nonvested restricted shares | | | 4 | | | | 4 | | | | 5 | | | | 1 | | | | 9 | | | | 5 | |
Net income attributable to basic common shares | | $ | 934 | | | $ | 762 | | | $ | 1,064 | | | $ | 525 | | | $ | 1,998 | | | $ | 1,287 | |
Basic weighted-average common shares outstanding | | | 526 | | | | 526 | | | | 528 | | | | 527 | | | | 527 | | | | 526 | |
Basic earnings per common share (a) | | $ | 1.78 | | | $ | 1.45 | | | $ | 2.02 | | | $ | 1.00 | | | $ | 3.79 | | | $ | 2.44 | |
Diluted | | | | | | | | | | | | | |
Net income attributable to basic common shares | | $ | 934 | | | $ | 762 | | | $ | 1,064 | | | $ | 525 | | | $ | 1,998 | | | $ | 1,287 | |
Less: Impact of BlackRock earnings per share dilution | | | 5 | | | | 3 | | | | 4 | | | | 4 | | | | 9 | | | | 7 | |
Net income attributable to diluted common shares | | $ | 929 | | | $ | 759 | | | $ | 1,060 | | | $ | 521 | | | $ | 1,989 | | | $ | 1,280 | |
Basic weighted-average common shares outstanding | | | 526 | | | | 526 | | | | 528 | | | | 527 | | | | 527 | | | | 526 | |
Dilutive potential common shares (b) (c) | | | 2 | | | | 3 | | | | 3 | | | | 3 | | | | 3 | | | | 3 | |
Diluted weighted-average common shares outstanding | | | 528 | | | | 529 | | | | 531 | | | | 530 | | | | 530 | | | | 529 | |
Diluted earnings per common share (a) | | $ | 1.76 | | | $ | 1.44 | | | $ | 1.99 | | | $ | .98 | | | $ | 3.76 | | | $ | 2.42 | |
| (a) | Basic and diluted earnings per share under the two-class method are determined on net income reported on the income statement less earnings allocated to nonvested restricted shares (participating securities). |
| (b) | Excludes number of stock options considered to be anti-dilutive of 31 million and 5 million for the three months ended March 31,June 30, 2013 and March 31,June 30, 2012, respectively, and 1 million and 5 million for the six months ended June 30, 2013 and June 30, 2012, respectively. |
| (c) | Excludes number of warrants considered to be anti-dilutive of 17 million for both the three months ended March 31,June 30, 2012, and 17 million for the six months ended both June 30, 2013 and March 31, 2012, respectively.June 30, 2012. No warrants were considered to be anti-dilutive for the three months ended June 30, 2013. |
136The PNC Financial Services Group, Inc. –Form 10-Q145
NOTE 15 TOTAL EQUITY AANDND OTHER COMPREHENSIVE INCOME
Activity in total equity for the first threesix months of 2012 and 2013 follows.
Table 123: Rollforward of Total Equity
| | | | | | | Shareholders’ Equity | | | | | | | | | | | Shareholders’ Equity | | | | | | |
| In millions | | Shares
Outstanding
Common
Stock | | | Common
Stock | | Capital
Surplus -
Preferred
Stock | | Capital
Surplus -
Common
Stock and
Other | | Retained
Earnings | | Accumulated
Other
Comprehensive
Income (Loss) | | Treasury
Stock | | | Non-
controlling
Interests | | Total
Equity | | | Shares
Outstanding
Common
Stock | | | Common
Stock | | Capital
Surplus –
Preferred
Stock | | Capital
Surplus –
Common
Stock
and Other | | Retained
Earnings | | Accumulated
Other
Comprehensive
Income (Loss) | | Treasury
Stock | | | Non-
controlling
Interests | | Total
Equity | |
Balance at January 1, 2012 | | | 527 | | | $ | 2,683 | | | $ | 1,637 | | | $ | 12,072 | | | $ | 18,253 | | | $ | (105 | ) | | $ | (487 | ) | | $ | 3,193 | | | $ | 37,246 | | | | 527 | | | $ | 2,683 | | | $ | 1,637 | | | $ | 12,072 | | | $ | 18,253 | | | $ | (105 | ) | | $ | (487 | ) | | $ | 3,193 | | | $ | 37,246 | |
Net income | | | | | | | | | | | 805 | | | | | | | | | 6 | | | | 811 | | | | | | | | | | | | | 1,356 | | | | | | | | | 1 | | | | 1,357 | |
Other comprehensive income (loss), net of tax | | | | | | | | | | | | | 386 | | | | | | | | | 386 | | | | | | | | | | | | | | | 507 | | | | | | | | | 507 | |
Cash dividends declared | | | | | | | | | | | | | | | | | | | | | | | | | | | | | | | | | | | | | | | | | |
Common ($.35 per share) | | | | | | | | | | | (185 | ) | | | | | | | | | | (185 | ) | |
Common ($.75 per share) | | | | | | | | | | | | | (396 | ) | | | | | | | | | | (396 | ) |
Preferred | | | | | | | | | | | (38 | ) | | | | | | | | | | (38 | ) | | | | | | | | | | | | (63 | ) | | | | | | | | | | (63 | ) |
Preferred stock discount accretion | | | | | | | 1 | | | | | | (1 | ) | | | | | | | | | | | | | | | | | | 1 | | | | | | (1 | ) | | | | | | | | | | |
Common stock activity (a) | | | | | 2 | | | | | | (2 | ) | | | | | | | | | | | | | | | | | | 4 | | | | | | 26 | | | | | | | | | | | | | 30 | |
Treasury stock activity | | | 1 | | | | | | | | 19 | | | | | | | | 20 | | | | | | 39 | | | | 2 | | | | | | | | 46 | | | | | | | | 36 | | | | | | 82 | |
Preferred stock issuance – Series P (b) | | | | | | | | | 1,482 | | | | | | | | | | | | | | | 1,482 | |
Other | | | | | (15 | ) | | | | | (8 | ) | | | (23 | ) | | | | | (46 | ) | | | | | 15 | | | | (31 | ) |
Balance at March 31, 2012 (b) | | | 528 | | | $ | 2,685 | | | $ | 1,638 | | | $ | 12,074 | | | $ | 18,834 | | | $ | 281 | | | $ | (467 | ) | | $ | 3,191 | | | $ | 38,236 | | |
Balance at June 30, 2012 (c) | | | | 529 | | | $ | 2,687 | | | $ | 3,120 | | | $ | 12,098 | | | $ | 19,149 | | | $ | 402 | | | $ | (451 | ) | | $ | 3,209 | | | $ | 40,214 | |
Balance at January 1, 2013 | | | 528 | | | $ | 2,690 | | | $ | 3,590 | | | $ | 12,193 | | | $ | 20,265 | | | $ | 834 | | | $ | (569 | ) | | $ | 2,762 | | | $ | 41,765 | | | | 528 | | | $ | 2,690 | | | $ | 3,590 | | | $ | 12,193 | | | $ | 20,265 | | | $ | 834 | | | $ | (569 | ) | | $ | 2,762 | | | $ | 41,765 | |
Net income | | | | | | | | | | | 1,013 | | | | | | | | | (9 | ) | | | 1,004 | | | | | | | | | | | | | 2,135 | | | | | | | | | (8 | ) | | | 2,127 | |
Other comprehensive income (loss), net of tax | | | | | | | | | | | | | (67 | ) | | | | | | | | (67 | ) | | | | | | | | | | | | | | (789 | ) | | | | | | | | (789 | ) |
Cash dividends declared | | | | | | | | | | | | | | | | | | | | | | | | | | | | | | | | | | | | | | | | | |
Common ($.40 per share) | | | | | | | | | | | (210 | ) | | | | | | | | | | (210 | ) | |
Common ($.84 per share) | | | | | | | | | | | | | (444 | ) | | | | | | | | | | (444 | ) |
Preferred | | | | | | | | | | | (67 | ) | | | | | | | | | | (67 | ) | | | | | | | | | | | | (118 | ) | | | | | | | | | | (118 | ) |
Preferred stock discount accretion | | | | | | | 1 | | | | | | (1 | ) | | | | | | | | | | | | | | | | | | 3 | | | | | | (3 | ) | | | | | | | | | | |
Redemption of noncontrolling interests | | | | | | | | | | | (7 | ) | | | | | | | | (368 | ) | | | (375 | ) | |
Common stock activity (a) | | | | | | | | | 7 | | | | | | | | | | | | | 7 | | |
Redemption of noncontrolling interests (d) | | | | | | | | | | | | | (7 | ) | | | | | | | | (368 | ) | | | (375 | ) |
Common stock activity | | | | 1 | | | | 3 | | | | | | 32 | | | | | | | | | | | | | 35 | |
Treasury stock activity | | | 1 | | | | | | | | (17 | ) | | | | | | | 17 | | | | | | | | | 2 | | | | | | | | (42 | ) | | | | | | | 116 | | | | | | 74 | |
Other | | | | | (9 | ) | | | | | 30 | | | | 21 | | |
Balance at March 31, 2013 (b) | | | 529 | | | $ | 2,690 | | | $ | 3,591 | | | $ | 12,174 | | | $ | 20,993 | | | $ | 767 | | | $ | (552 | ) | | $ | 2,415 | | | $ | 42,078 | | |
Preferred stock redemption – Series L (e) | | | | | | | | | (150 | ) | | | | | | | | | | | | | | (150 | ) |
Preferred stock issuance – Series R (f) | | | | | | | | | 496 | | | | | | | | | | | | | | | 496 | |
Other (g) | | | | | | 51 | | | | | | (731 | ) | | | (680 | ) |
Balance at June 30, 2013 (c) | | | | 531 | | | $ | 2,693 | | | $ | 3,939 | | | $ | 12,234 | | | $ | 21,828 | | | $ | 45 | | | $ | (453 | ) | | $ | 1,655 | | | $ | 41,941 | |
| (a) | Common stock activity totaled less than .5 million shares issued. |
| (b) | 15,000 Series P preferred shares with a $1 par value were issued on April 24, 2012. |
| (c) | The par value of our preferred stock outstanding was less than $.5 million at each date and, therefore, is excluded from this presentation. |
| (d) | Relates to the redemption of REIT preferred securities in the first quarter of 2013. See Note 11 Capital Securities of Subsidiary Trusts and Perpetual Trust Securities for additional information. |
| (e) | 1,500 Series L preferred shares with a $1 par value were redeemed on April 19, 2013. |
| (f) | 5,000 Series R preferred shares with a $1 par value were issued on May 7, 2013. |
| (g) | Includes deconsolidation of low income housing tax credit investments in the amount of $675 million as of June 30, 2013. See Note 3 Loan Sale and Servicing Activities and Variable Interest Entities for additional information. |
146The PNC Financial Services Group, Inc. –Form 10-Q137
Table 124: Other Comprehensive Income
Details of other comprehensive income (loss) are as follows (in millions):follows:
| | | | Pretax | | | Tax | | | After-tax | | |
| In millions | | | Pretax | | Tax | | | After-tax | |
Net unrealized gains (losses) on non-OTTI securities | | | | | | | | | | | | | | |
Balance at December 31, 2011 | | $ | 1,098 | | | $ | (402 | ) | | $ | 696 | | |
First Quarter 2012 activity | | | | | | | | |
Balance at March 31, 2012 | | | $ | 1,336 | | | $ | (490 | ) | | $ | 846 | |
Second Quarter 2012 activity | | | | | | | | |
Increase in net unrealized gains (losses) on non-OTTI securities | | | 281 | | | | (103 | ) | | | 178 | | | | 200 | | | | (74 | ) | | | 126 | |
Less: Net gains (losses) realized as a yield adjustment reclassified to investment securities in interest income | | | 7 | | | | (2 | ) | | | 5 | | | | 12 | | | | (5 | ) | | | 7 | |
Less: Net gains (losses) realized on sales of securities reclassified to noninterest income | | | 36 | | | | (13 | ) | | | 23 | | | | 30 | | | | (11 | ) | | | 19 | |
Net unrealized gains (losses) on non-OTTI securities | | | 238 | | | | (88 | ) | | | 150 | | | | 158 | | | | (58 | ) | | | 100 | |
Balance at March 31, 2012 | | | 1,336 | | | | (490 | ) | | | 846 | | |
Balance at December 31, 2012 | | | 1,858 | | | | (681 | ) | | | 1,177 | | |
First Quarter 2013 activity | | | | | | | | |
Balance at June 30, 2012 | | | | 1,494 | | | | (548 | ) | | | 946 | |
Balance at March 31, 2013 | | | | 1,688 | | | | (619 | ) | | | 1,069 | |
Second Quarter 2013 activity | | | | | | | | |
Increase in net unrealized gains (losses) on non-OTTI securities | | | (157 | ) | | | 57 | | | | (100 | ) | | | (729 | ) | | | 264 | | | | (465 | ) |
Less: Net gains (losses) realized as a yield adjustment reclassified to investment securities in interest income | | | 14 | | | | (5 | ) | | | 9 | | | | 11 | | | | (4 | ) | | | 7 | |
Less: Net gains (losses) realized on sales of securities reclassified to noninterest income | | | (1 | ) | | | – | | | | (1 | ) | | | 53 | | | | (19 | ) | | | 34 | |
Net unrealized gains (losses) on non-OTTI securities | | | (170 | ) | | | 62 | | | | (108 | ) | | | (793 | ) | | | 287 | | | | (506 | ) |
Balance at March 31, 2013 | | $ | 1,688 | | | $ | (619 | ) | | $ | 1,069 | | |
Net unrealized gains (losses) on OTTI securities | | | | | | | | |
Balance at December 31, 2011 | | $ | (1,166 | ) | | $ | 428 | | | $ | (738 | ) | |
First Quarter 2012 activity | | | | | | | | |
Increase in net unrealized gains (losses) on OTTI securities | | | 362 | | | | (133 | ) | | | 229 | | |
Less: Net gains (losses) realized on sales of securities reclassified to noninterest income | | | (6 | ) | | | 2 | | | | (4 | ) | |
Less: OTTI losses realized on securities reclassified to noninterest income | | | (38 | ) | | | 14 | | | | (24 | ) | |
Balance at June 30, 2013 | | | $ | 895 | | | $ | (332 | ) | | $ | 563 | �� |
Net unrealized gains (losses) on OTTI securities | | | 406 | | | | (149 | ) | | | 257 | | | | | | | | |
Balance at March 31, 2012 | | | (760 | ) | | | 279 | | | | (481 | ) | | $ | (760 | ) | | $ | 279 | | | $ | (481 | ) |
Balance at December 31, 2012 | | | (195 | ) | | | 72 | | | | (123 | ) | |
First Quarter 2013 activity | | | | | | | | |
Second Quarter 2012 activity | | | | | | | | |
Increase in net unrealized gains (losses) on OTTI securities | | | 131 | | | | (47 | ) | | | 84 | | | | (26 | ) | | | 10 | | | | (16 | ) |
Less: OTTI losses realized on securities reclassified to noninterest income | | | (10 | ) | | | 4 | | | | (6 | ) | | | (34 | ) | | | 13 | | | | (21 | ) |
Net unrealized gains (losses) on OTTI securities | | | 141 | | | | (51 | ) | | | 90 | | | | 8 | | | | (3 | ) | | | 5 | |
Balance at June 30, 2012 | | | | (752 | ) | | | 276 | | | | (476 | ) |
Balance at March 31, 2013 | | $ | (54 | ) | | $ | 21 | | | $ | (33 | ) | | | (54 | ) | | | 21 | | | | (33 | ) |
Second Quarter 2013 activity | | | | | | | | |
Increase in net unrealized gains (losses) on OTTI securities | | | | (49 | ) | | | 17 | | | | (32 | ) |
Less: OTTI losses realized on securities reclassified to noninterest income | | | | (4 | ) | | | 1 | | | | (3 | ) |
Net unrealized gains (losses) on OTTI securities | | | | (45 | ) | | | 16 | | | | (29 | ) |
Balance at June 30, 2013 | | | $ | (99 | ) | | $ | 37 | | | $ | (62 | ) |
Net unrealized gains (losses) on cash flow hedge derivatives | | | | | | | | | | | | | | |
Balance at December 31, 2011 | | $ | 1,131 | | | $ | (414 | ) | | $ | 717 | | |
First Quarter 2012 activity | | | | | | | | |
Balance at March 31, 2012 | | | $ | 1,041 | | | $ | (381 | ) | | $ | 660 | |
Second Quarter 2012 activity | | | | | | | | |
Increase in net unrealized gains (losses) on cash flow hedge derivatives | | | 53 | | | | (19 | ) | | | 34 | | | | 154 | | | | (57 | ) | | | 97 | |
Less: Net gains (losses) realized as a yield adjustment reclassified to loan interest income (a) | | | 100 | | | | (36 | ) | | | 64 | | | | 101 | | | | (37 | ) | | | 64 | |
Less: Net gains (losses) realized as a yield adjustment reclassified to investment securities interest income (a) | | | 16 | | | | (6 | ) | | | 10 | | | | 15 | | | | (6 | ) | | | 9 | |
Less: Net gains (losses) realized on sales of securities reclassified to noninterest income (a) | | | 27 | | | | (10 | ) | | | 17 | | | | 32 | | | | (12 | ) | | | 20 | |
Net unrealized gains (losses) on cash flow hedge derivatives | | | (90 | ) | | | 33 | | | | (57 | ) | | | 6 | | | | (2 | ) | | | 4 | |
Balance at March 31, 2012 | | | 1,041 | | | | (381 | ) | | | 660 | | |
Balance at December 31, 2012 | | | 911 | | | | (333 | ) | | | 578 | | |
First Quarter 2013 activity | | | | | | | | |
Balance at June 30, 2012 | | | | 1,047 | | | | (383 | ) | | | 664 | |
Balance at March 31, 2013 | | | | 804 | | | | (294 | ) | | | 510 | |
Second Quarter 2013 activity | | | | | | | | |
Increase in net unrealized gains (losses) on cash flow hedge derivatives | | | 14 | | | | (5 | ) | | | 9 | | | | (193 | ) | | | 71 | | | | (122 | ) |
Less: Net gains (losses) realized as a yield adjustment reclassified to loan interest income (a) | | | 87 | | | | (32 | ) | | | 55 | | | | 66 | | | | (24 | ) | | | 42 | |
Less: Net gains (losses) realized as a yield adjustment reclassified to investment securities interest income (a) | | | 19 | | | | (7 | ) | | | 12 | | | | 14 | | | | (5 | ) | | | 9 | |
Less: Net gains (losses) realized on sales of securities reclassified to noninterest income (a) | | | 15 | | | | (5 | ) | | | 10 | | | | 8 | | | | (3 | ) | | | 5 | |
Net unrealized gains (losses) on cash flow hedge derivatives | | | (107 | ) | | | 39 | | | | (68 | ) | | | (281 | ) | | | 103 | | | | (178 | ) |
Balance at March 31, 2013 | | $ | 804 | | | $ | (294 | ) | | $ | 510 | | |
Balance at June 30, 2013 | | | $ | 523 | | | $ | (191 | ) | | $ | 332 | |
The PNC Financial Services Group, Inc. –Form 10-Q147
| | | | | | | | | | | | |
| In millions | | Pretax | | | Tax | | | After-tax | |
Pension and other postretirement benefit plan adjustments | | | | | | | | | | | | |
Balance at March 31, 2012 | | $ | (1,143 | ) | | $ | 419 | | | $ | (724 | ) |
Second Quarter 2012 activity | | | | | | | | | | | | |
Net pension and other postretirement benefit plan activity | | | 18 | | | | (7 | ) | | | 11 | |
Amortization of actuarial loss (gain) reclassified to other noninterest expense | | | 24 | | | | (9 | ) | | | 15 | |
Amortization of prior service cost (credit) reclassified to other noninterest expense | | | (3 | ) | | | 1 | | | | (2 | ) |
Total First Quarter 2012 activity | | | 39 | | | | (15 | ) | | | 24 | |
Balance at June 30, 2012 | | | (1,104 | ) | | | 404 | | | | (700 | ) |
Balance at March 31, 2013 | | | (1,180 | ) | | | 432 | | | | (748 | ) |
Second Quarter 2013 activity | | | | | | | | | | | | |
Net pension and other postretirement benefit plan activity | | | (14 | ) | | | 5 | | | | (9 | ) |
Amortization of actuarial loss (gain) reclassified to other noninterest expense | | | 24 | | | | (9 | ) | | | 15 | |
Amortization of prior service cost (credit) reclassified to other noninterest expense | | | (3 | ) | | | 1 | | | | (2 | ) |
Total Second Quarter 2013 activity | | | 7 | | | | (3 | ) | | | 4 | |
Balance at June 30, 2013 | | $ | (1,173 | ) | | $ | 429 | | | $ | (744 | ) |
Other | | | | | | | | | | | | |
Balance at March 31, 2012 | | $ | (39 | ) | | $ | 19 | | | $ | (20 | ) |
Second Quarter 2012 Activity | | | | | | | | | | | | |
BlackRock gains (losses) | | | (27 | ) | | | 17 | | | | (10 | ) |
Net investment hedge derivatives (b) | | | 12 | | | | (4 | ) | | | 8 | |
Foreign currency translation adjustments | | | (15 | ) | | | 5 | | | | (10 | ) |
Total Second Quarter 2012 activity | | | (30 | ) | | | 18 | | | | (12 | ) |
Balance at June 30, 2012 | | | (69 | ) | | | 37 | | | | (32 | ) |
Balance at March 31, 2013 | | | (47 | ) | | | 16 | | | | (31 | ) |
Second Quarter 2013 Activity | | | | | | | | | | | | |
BlackRock gains (losses) | | | (7 | ) | | | (6 | ) | | | (13 | ) |
Net investment hedge derivatives (b) | | | (1 | ) | | | | | | | (1 | ) |
Foreign currency translation adjustments | | | 1 | | | | | | | | 1 | |
Total Second Quarter 2013 activity | | | (7 | ) | | | (6 | ) | | | (13 | ) |
Balance at June 30, 2013 | | $ | (54 | ) | | $ | 10 | | | $ | (44 | ) |
| (a) | Cash flow hedge derivatives are interest rate contract derivatives designated as hedging instruments under GAAP. |
| (b) | Net investment hedge derivatives are foreign exchange contracts designated as hedging instruments under GAAP. |
138148 The PNC Financial Services Group, Inc. –Form 10-Q
| | | | | | | | | | | | |
| | | Pretax | | | Tax | | | After-tax | |
Pension and other postretirement benefit plan adjustments | | | | | | | | | | | | |
Balance at December 31, 2011 | | $ | (1,191 | ) | | $ | 436 | | | $ | (755 | ) |
First Quarter 2012 activity | | | | | | | | | | | | |
Net pension and other postretirement benefit plan activity | | | 27 | | | | (9 | ) | | | 18 | |
Amortization of actuarial loss (gain) reclassified to other noninterest expense | | | 24 | | | | (9 | ) | | | 15 | |
Amortization of prior service cost (credit) reclassified to other noninterest expense | | | (3 | ) | | | 1 | | | | (2 | ) |
Total First Quarter 2012 activity | | | 48 | | | | (17 | ) | | | 31 | |
Balance at March 31, 2012 | | | (1,143 | ) | | | 419 | | | | (724 | ) |
Balance at December 31, 2012 | | | (1,226 | ) | | | 449 | | | | (777 | ) |
First Quarter 2013 activity | | | | | | | | | | | | |
Net pension and other postretirement benefit plan activity | | | 25 | | | | (9 | ) | | | 16 | |
Amortization of actuarial loss (gain) reclassified to other noninterest expense | | | 24 | | | | (9 | ) | | | 15 | |
Amortization of prior service cost (credit) reclassified to other noninterest expense | | | (3 | ) | | | 1 | | | | (2 | ) |
Total First Quarter 2013 activity | | | 46 | | | | (17 | ) | | | 29 | |
Balance at March 31, 2013 | | $ | (1,180 | ) | | $ | 432 | | | $ | (748 | ) |
Other | | | | | | | | | | | | |
Balance at December 31, 2011 | | $ | (51 | ) | | $ | 26 | | | $ | (25 | ) |
First Quarter 2012 Activity | | | | | | | | | | | | |
BlackRock gains (losses) | | | 6 | | | | (5 | ) | | | 1 | |
Net investment hedge derivatives (b) | | | (12 | ) | | | 4 | | | | (8 | ) |
Foreign currency translation adjustments | | | 18 | | | | (6 | ) | | | 12 | |
Total First Quarter 2012 activity | | | 12 | | | | (7 | ) | | | 5 | |
Balance at March 31, 2012 | | | (39 | ) | | | 19 | | | | (20 | ) |
Balance at December 31, 2012 | | | (41 | ) | | | 20 | | | | (21 | ) |
First Quarter 2013 Activity | | | | | | | | | | | | |
BlackRock gains (losses) | | | (4 | ) | | | (5 | ) | | | (9 | ) |
Net investment hedge derivatives (b) | | | 57 | | | | (21 | ) | | | 36 | |
Foreign currency translation adjustments | | | (59 | ) | | | 22 | | | | (37 | ) |
Total First Quarter 2013 activity | | | (6 | ) | | | (4 | ) | | | (10 | ) |
Balance at March 31, 2013 | | $ | (47 | ) | | $ | 16 | | | $ | (31 | ) |
| | | | | | | | | | | | |
| In millions | | Pretax | | | Tax | | | After-tax | |
Net unrealized gains (losses) on non-OTTI securities | | | | | | | | | | | | |
Balance at December 31, 2011 | | $ | 1,098 | | | $ | (402 | ) | | $ | 696 | |
2012 activity | | | | | | | | | | | | |
Increase in net unrealized gains (losses) on non-OTTI securities | | | 481 | | | | (177 | ) | | | 304 | |
Less: Net gains (losses) realized as a yield adjustment reclassified to investment securities in interest income | | | 19 | | | | (7 | ) | | | 12 | |
Less: Net gains (losses) realized on sale of securities reclassified to noninterest income | | | 66 | | | | (24 | ) | | | 42 | |
Net unrealized gains (losses) on non-OTTI securities | | | 396 | | | | (146 | ) | | | 250 | |
Balance at June 30, 2012 | | | 1,494 | | | | (548 | ) | | | 946 | |
Balance at December 31, 2012 | | | 1,858 | | | | (681 | ) | | | 1,177 | |
2013 activity | | | | | | | | | | | | |
Increase in net unrealized gains (losses) on non-OTTI securities | | | (886 | ) | | | 321 | | | | (565 | ) |
Less: Net gains (losses) realized as a yield adjustment reclassified to investment securities in interest income | | | 25 | | | | (9 | ) | | | 16 | |
Less: Net gains (losses) realized on sale of securities reclassified to noninterest income | | | 52 | | | | (19 | ) | | | 33 | |
Net unrealized gains (losses) on non-OTTI securities | | | (963 | ) | | | 349 | | | | (614 | ) |
Balance at June 30, 2013 | | $ | 895 | | | $ | (332 | ) | | $ | 563 | |
Net unrealized gains (losses) on OTTI securities | | | | | | | | | | | | |
Balance at December 31, 2011 | | $ | (1,166 | ) | | $ | 428 | | | $ | (738 | ) |
2012 activity | | | | | | | | | | | | |
Increase in net unrealized gains (losses) on OTTI securities | | | 336 | | | | (123 | ) | | | 213 | |
Less: Net gains (losses) realized on sales of securities reclassified to noninterest income | | | (6 | ) | | | 2 | | | | (4 | ) |
Less: OTTI losses realized on securities reclassified to noninterest income | | | (72 | ) | | | 27 | | | | (45 | ) |
Net unrealized gains (losses) on OTTI securities | | | 414 | | | | (152 | ) | | | 262 | |
Balance at June 30, 2012 | | | (752 | ) | | | 276 | | | | (476 | ) |
Balance at December 31, 2012 | | | (195 | ) | | | 72 | | | | (123 | ) |
2013 activity | | | | | | | | | | | | |
Increase in net unrealized gains (losses) on OTTI securities | | | 82 | | | | (30 | ) | | | 52 | |
Less: OTTI losses realized on securities reclassified to noninterest income | | | (14 | ) | | | 5 | | | | (9 | ) |
Net unrealized gains (losses) on OTTI securities | | | 96 | | | | (35 | ) | | | 61 | |
Balance at June 30, 2013 | | $ | (99 | ) | | $ | 37 | | | $ | (62 | ) |
Net unrealized gains (losses) on cash flow hedge derivatives | | | | | | | | | | | | |
Balance at December 31, 2011 | | $ | 1,131 | | | $ | (414 | ) | | $ | 717 | |
2012 activity | | | | | | | | | | | | |
Increase in net unrealized gains (losses) on cash flow hedge derivatives | | | 207 | | | | (76 | ) | | | 131 | |
Less: Net gains (losses) realized as a yield adjustment reclassified to loan interest income (a) | | | 201 | | | | (74 | ) | | | 127 | |
Less: Net gains (losses) realized as a yield adjustment reclassified to investment securities interest income (a) | | | 31 | | | | (11 | ) | | | 20 | |
Less: Net gains (losses) realized on sales of securities reclassified to noninterest income (a) | | | 59 | | | | (22 | ) | | | 37 | |
Net unrealized gains (losses) on cash flow hedge derivatives | | | (84 | ) | | | 31 | | | | (53 | ) |
Balance at June 30, 2012 | | | 1,047 | | | | (383 | ) | | | 664 | |
Balance at December 31, 2012 | | | 911 | | | | (333 | ) | | | 578 | |
2013 activity | | | | | | | | | | | | |
Increase in net unrealized gains (losses) on cash flow hedge derivatives | | | (179 | ) | | | 66 | | | | (113 | ) |
Less: Net gains (losses) realized as a yield adjustment reclassified to loan interest income (a) | | | 153 | | | | (56 | ) | | | 97 | |
Less: Net gains (losses) realized as a yield adjustment reclassified to investment securities interest income (a) | | | 33 | | | | (12 | ) | | | 21 | |
Less: Net gains (losses) realized on sales of securities reclassified to noninterest income (a) | | | 23 | | | | (8 | ) | | | 15 | |
Net unrealized gains (losses) on cash flow hedge derivatives | | | (388 | ) | | | 142 | | | | (246 | ) |
Balance at June 30, 2013 | | $ | 523 | | | $ | (191 | ) | | $ | 332 | |
The PNC Financial Services Group, Inc. –Form 10-Q149
| | | | | | | | | | | | |
| In millions | | Pretax | | | Tax | | | After-tax | |
Pension and other postretirement benefit plan adjustments | | | | | | | | | | | | |
Balance at December 31, 2011 | | $ | (1,191 | ) | | $ | 436 | | | $ | (755 | ) |
2012 Activity | | | | | | | | | | | | |
Net pension and other postretirement benefit plan activity | | | 45 | | | | (16 | ) | | | 29 | |
Amortization of actuarial loss (gain) reclassified to other noninterest expense | | | 48 | | | | (18 | ) | | | 30 | |
Amortization of prior service cost (credit) reclassified to other noninterest expense | | | (6 | ) | | | 2 | | | | (4 | ) |
Total 2012 activity | | | 87 | | | | (32 | ) | | | 55 | |
Balance at June 30, 2012 | | | (1,104 | ) | | | 404 | | | | (700 | ) |
Balance at December 31, 2012 | | | (1,226 | ) | | | 449 | | | | (777 | ) |
2013 Activity | | | | | | | | | | | | |
Net pension and other postretirement benefit plan activity | | | 11 | | | | (4 | ) | | | 7 | |
Amortization of actuarial loss (gain) reclassified to other noninterest expense | | | 48 | | | | (18 | ) | | | 30 | |
Amortization of prior service cost (credit) reclassified to other noninterest expense | | | (6 | ) | | | 2 | | | | (4 | ) |
Total 2013 Activity | | | 53 | | | | (20 | ) | | | 33 | |
Balance at June 30, 2013 | | $ | (1,173 | ) | | $ | 429 | | | $ | (744 | ) |
Other | | | | | | | | | | | | |
Balance at December 31, 2011 | | $ | (51 | ) | | $ | 26 | | | $ | (25 | ) |
2012 Activity | | | | | | | | | | | | |
BlackRock gains (losses) | | | (20 | ) | | | 12 | | | | (8 | ) |
Foreign currency translation adjustments | | | 2 | | | | (1 | ) | | | 1 | |
Total 2012 activity | | | (18 | ) | | | 11 | | | | (7 | ) |
Balance at June 30, 2012 | | | (69 | ) | | | 37 | | | | (32 | ) |
Balance at December 31, 2012 | | | (41 | ) | | | 20 | | | | (21 | ) |
2013 Activity | | | | | | | | | | | | |
BlackRock gains (losses) | | | (11 | ) | | | (11 | ) | | | (22 | ) |
Net investment hedge derivatives (b) | | | 56 | | | | (21 | ) | | | 35 | |
Foreign currency translation adjustments | | | (58 | ) | | | 22 | | | | (36 | ) |
Total 2013 activity | | | (13 | ) | | | (10 | ) | | | (23 | ) |
Balance at June 30, 2013 | | $ | (54 | ) | | $ | 10 | | | $ | (44 | ) |
| (a) | Cash flow hedge derivatives are interest rate contract derivatives designated as hedging instruments under GAAP. |
| (b) | Net investment hedge derivatives are foreign exchange contracts designated as hedging instruments under GAAP. |
Table 125: Accumulated Other Comprehensive Income (Loss) Components
| | | | March 31, 2013 | | | December 31, 2012 | | | June 30, 2013 | | | December 31, 2012 | |
| In millions | | Pretax | | | After-tax | | | Pretax | | | After-tax | | | Pretax | | After-tax | | | Pretax | | | After-tax | |
Net unrealized gains (losses) on non-OTTI securities | | $ | 1,688 | | | $ | 1,069 | | | $ | 1,858 | | | $ | 1,177 | | | $ | 895 | | | $ | 563 | | | $ | 1,858 | | | $ | 1,177 | |
Net unrealized gains (losses) on OTTI securities | | | (54 | ) | | | (33 | ) | | | (195 | ) | | | (123 | ) | | | (99 | ) | | | (62 | ) | | | (195 | ) | | | (123 | ) |
Net unrealized gains (losses) on cash flow hedge derivatives | | | 804 | | | | 510 | | | | 911 | | | | 578 | | | | 523 | | | | 332 | | | | 911 | | | | 578 | |
Pension and other postretirement benefit plan adjustments | | | (1,180 | ) | | | (748 | ) | | | (1,226 | ) | | | (777 | ) | | | (1,173 | ) | | | (744 | ) | | | (1,226 | ) | | | (777 | ) |
Other | | | (47 | ) | | | (31 | ) | | | (41 | ) | | | (21 | ) | | | (54 | ) | | | (44 | ) | | | (41 | ) | | | (21 | ) |
Accumulated other comprehensive income (loss) | | $ | 1,211 | | | $ | 767 | | | $ | 1,307 | | | $ | 834 | | | $ | 92 | | | $ | 45 | | | $ | 1,307 | | | $ | 834 | |
150The PNC Financial Services Group, Inc. –Form 10-Q139
NOTE 16 INCOME TAXES
The net operating loss carryforwards at March 31,June 30, 2013 and December 31, 2012 follow:
Table 126: Net Operating Loss Carryforwards and Tax Credit Carryforwards
| | In millions | | March 31
2013 | | | December 31
2012 | | | June 30
2013 | | | December 31
2012 | |
Net Operating Loss Carryforwards: | | | | | | | | | | |
Federal | | $ | 1,692 | | | $ | 1,698 | | | $ | 1,157 | | | $ | 1,698 | |
State | | | 2,407 | | | | 2,468 | | | | 2,371 | | | | 2,468 | |
Valuation allowance – State | | | 59 | | | | 54 | | |
Tax Credit Carryforwards: | | | | | | | | | | |
Federal | | $ | 29 | | | $ | 29 | | | $ | 33 | | | $ | 29 | |
State | | | 4 | | | | 4 | | | | 4 | | | | 4 | |
Valuation Allowance: | | | | | | |
State | | | $ | 59 | | | $ | 54 | |
The federal net operating loss carryforwards expire from 2027 to 2032. The state net operating loss carryforwards will expire from 2013 to 2031. The majority of the tax credit carryforwards expire in 2032. All federal and most state net operating loss and credit carryforwards are from acquired entities and utilization is subject to various statutory limitations. It is anticipated that the company will be able to fully utilize its carryforwards for federal tax purposes. A valuation allowance has been recorded against certain state carryforwards as reflected above.
Examinations are substantially completed for PNC’s consolidated federal income tax returns for 2007 and 2008 and there are no outstanding unresolved issues. The Internal Revenue Service (IRS) is currently examining PNC’s 2009 and 2010 returns. National City’s consolidated federal income tax returns through 2008 have been audited by the IRS. Certain adjustments remain under review by the IRS Appeals Division for years 2003 through 2008.
The Company had unrecognized tax benefits of $133$109 million at March 31,June 30, 2013 and $176 million at December 31, 2012. The decrease results from the company partially resolving certain adjustments relating to legacy National City federal examinations and from resolving various state examinations. At March 31,June 30, 2013, $101$86 million of unrecognized tax benefits, if recognized, would favorably impact the effective income tax rate.
It is reasonably possible that the liability for unrecognized tax benefits could increase or decrease in the next twelve months due to completion of tax authorities’ exams or the expiration of statutes of limitations. Management estimates that the liability for unrecognized tax benefits could decrease by $82$68 million within the next twelve months.
NOTE 17 LEGAL PROCEEDINGS
We establish accruals for legal proceedings, including litigation and regulatory and governmental investigations and inquiries, when information related to the loss contingencies represented by those matters indicates both that a loss is probable and that the amount of loss can be reasonably estimated. Any such accruals are adjusted thereafter as appropriate to reflect changed circumstances. When we are able to do so, we also determine estimates of possible losses or ranges of possible losses, whether in excess of any related
accrued liability or where there is no accrued liability, for disclosed legal proceedings (“Disclosed Matters,” which areMatters. “Disclosed Matters” includes those matters disclosed in this Note 17 and also those matters disclosed in Note 23 Legal Proceedings in Part II, Item 8 of our 2012 Form 10-K and Note 17 Legal Proceedings in Part I, Item 1 of our Form 10-Q for the quarter ended March 31, 2013 (such prior disclosure referred to as “Prior Disclosure”)). For Disclosed Matters where we are able to estimate such possible losses or ranges of possible losses, as of March 31,June 30, 2013, we estimate that it is reasonably possible that we could incur losses in an aggregate amount of up to approximately $400 million. The estimates included in this amount are based on our analysis of currently available information and are subject to the application of significant judgment and a variety of assumptions and uncertainties. As new information is obtained, we may change our estimates. Due to the inherent subjectivity of the assessments and unpredictability of outcomes of legal proceedings, any amounts accrued or included in this aggregate amount may not represent the ultimate loss to us from the legal proceedings in question. Thus, our exposure and ultimate losses may be higher, and possibly significantly so, than the amounts accrued or this aggregate amount.
The aggregate estimated amount provided above does not include an estimate for every Disclosed Matter, as we are unable, at this time, to estimate the losses that it is reasonably possible that we could incur or ranges of such losses with respect to some of the matters disclosed for one or more of the following reasons. In our experience, legal proceedings are inherently unpredictable. In many legal proceedings, various factors exacerbate this inherent unpredictability, including, among others, one or more of the following: the proceeding is in its early stages; the damages sought are unspecified, unsupported or uncertain; it is unclear whether a case brought as a class action will be allowed to proceed on that basis or, if permitted to proceed as a class action, how the class will be defined; the plaintiff is seeking relief other than or in addition to compensatory damages; the matter presents meaningful legal uncertainties, including novel issues of law; we have not engaged in meaningful settlement discussions; discovery has not started or is not complete; there are significant facts in dispute; and there are a large number of parties named as defendants (including where it is uncertain how damages or liability, if any, will be shared among multiple defendants). Generally, the less progress that has been made in the
The PNC Financial Services Group, Inc. –Form 10-Q151
proceedings or the broader the range of potential results, the harder it is for us to estimate losses or ranges of losses that it is reasonably possible we could incur. Therefore, as the estimated aggregate amount disclosed above does not include all of the Disclosed Matters, the amount disclosed above does not represent our maximum reasonably possible loss exposure for all of the Disclosed Matters. The estimated aggregate amount also does not reflect any of our exposure to matters not so disclosed, as discussed below under “Other.”
We include in some of the descriptions of individual Disclosed Matters certain quantitative information related to the plaintiff’s claim against us as alleged in the plaintiff’s
140 The PNC Financial Services Group, Inc. –Form 10-Q
pleadings or other public filings or otherwise based on publicly available information. While information of this type may provide insight into the potential magnitude of a matter, it does not necessarily represent our estimate of reasonably possible loss or our judgment as to any currently appropriate accrual.
Some of our exposure in Disclosed Matters may be offset by applicable insurance coverage. We do not consider the possible availability of insurance coverage in determining the amounts of any accruals (although we record the amount of related insurance recoveries that are deemed probable up to the amount of the accrual) or in determining any estimates of possible losses or ranges of possible losses.
The following description updatesdescriptions update our disclosure of pending legal proceedings provided in our Prior Disclosure.
Captive Mortgage Reinsurance LitigationINTERCHANGE LITIGATION
ArgumentIn the cases that have been consolidated for pretrial proceedings in the United States District Court for the Eastern District of New York under the captionIn re Payment Card Interchange Fee and Merchant-Discount Antitrust Litigation (Master File No. 1:05-md-1720-JG-JO), the court has scheduled a hearing with respect to final court approval for September 2013. Numerous merchants, including some large national merchants, have objected to or requested exclusion (opted out) from the proposed class settlements, and some of those opting out have filed complaints in the U.S. District Courts for the Southern and Eastern Districts of New York against Visa, MasterCard and, in some instances, one or more of the other issuing banks.
CBNV MORTGAGE LITIGATION
MDL Proceedings in Pennsylvania. In June 2013, the court in the multidistrict litigation proceeding (MDL) in the United States District Court for the Western District of Pennsylvania under the captionIn re: Community Bank of Northern Virginia Lending Practices Litigation (No. 03-0425 (W.D. Pa.), MDL No. 1674) granted in part and denied in part the motion, dismissing the claims of any plaintiff whose loan did not originate or was not assigned to our predecessor, Community Bank of Northern Virginia (CBNV), narrowing the scope ofthe Real Estate Settlement Procedures Act (RESPA) claim,
and dismissing several of the named plaintiffs for lack ofstanding. The court also dismissed the claims against the other lender defendant on ourjurisdictional grounds. The limitation of the potential class to CBNV borrowers reduces its size toapproximately 22,500. Also in June 2013, the plaintiffs filed a motion for class certification, which was granted in July 2013.
OVERDRAFT LITIGATION
In August 2013, the United States District Court for the Southern District of Florida (the “MDL Court”) granted final approval to the settlement described below of the three pending lawsuits naming PNC Bank that had been consolidated for pre-trial proceedings in the MDL Court (together with one other case naming National City Bank, two cases naming RBC Bank (USA), and similar lawsuits against numerous other banks) under the captionIn re Checking Account Overdraft Litigation (MDL No. 2036, CaseNo. 1:09-MD-02036-JLK ). PNC Bank had reached an agreement to settle these cases for $90 million in June 2012.
The complaints in these three lawsuits alleged that PNC Bank engaged in unlawful practices in assessing overdraft fees arising from electronic point-of-sale and ATM debits. The principal practice challenged in these lawsuits is PNC Bank’s purportedly common policy of posting debit transactions on a daily basis from highest amount to lowest amount, thereby allegedly inflating the number of overdraft fees assessed. Other practices challenged include the failure to decline to honor debit card transactions where the account has insufficient funds to cover the transactions.
In the consolidated amended complaint against PNC Bank in the MDL Court, the plaintiffs asserted claims for breach of the covenant of good faith and fair dealing; unconscionability; conversion; unjust enrichment; and violation of the consumer protection statutes of Pennsylvania, Illinois and New Jersey.
The cases against PNC Bank in the MDL Court sought to certify multi-state classes of customers for the common law claims described below (covering all states in which PNC Bank had retail branch operations during the class periods), and subclasses of PNC Bank customers with accounts in Pennsylvania and New Jersey branches, with each subclass being asserted for purposes of claims under those states’ consumer protection statutes. No class periods were stated in any of the complaints, other than for the applicable statutes of limitations, which vary by state and claim.
PNC Bank’s motion to dismiss thea consolidated amended complaint with respect to the cases pending against it in the MDL Court was denied in March 2011. In December 2011, the plaintiffs in cases pending against PNC Bank in the MDL Court moved for class certification, which was granted in May 2012.
The lawsuits pending against RBC Bank (USA) consolidated in the MDL Court as well as another lawsuit making similar allegations against PNC Bank, as described in Prior Disclosure, remain pending.
152 The PNC Financial Services Group, Inc. –Form 10-Q
CAPTIVE MORTGAGE REINSURANCE LITIGATION
In June 2013, the United States District Court for the Eastern District of Pennsylvania, inWhite, et al. v. The PNC Financial Services Group, Inc., et al.(Civil Action No. 11-7928), pendingdismissed, without prejudice, the amended complaint on statute of limitations grounds. A second amended complaint, in response to the court’s dismissal order, was filed in July 2013. We filed a motion to dismiss the second amended complaint, also in July 2013. The court has not yet ruled on this motion.
RESIDENTIAL MORTGAGE-BACKED SECURITIES INDEMNIFICATION DEMANDS
The parties have settled several of the cases with respect to which we have received indemnification demands. There has not been any determination that the parties seeking indemnification have any liability to the plaintiffs in the other lawsuits and the amount, if any, for which we are responsible in the settled cases has not been determined.
LENDER PLACED INSURANCE LITIGATION
In June 2013, a lawsuit (Lauren v. PNC Bank, N.A.,et al., Case No. 2:13-cv-00762-TFM) was filed in the United States District Court for the EasternWestern District of Pennsylvania against PNC Bank and a provider of property and casualty insurance to PNC for certain residential mortgages. This lawsuit, which was heldbrought as a class action, alleges, with respect to PNC Bank, that it breached alleged contractual (including the implied covenant of good faith and fair dealing) and fiduciary duties to residential mortgage borrowers, and, as to Ohio borrowers, violated the Ohio Consumer Sales Practice Act in April 2013.connection with the administration of PNC Bank’s program for placement of insurance for borrowers who fail to obtain certain insurance coverages required by the terms of their mortgages. The plaintiff alleges, among other things, that defendants placed insurance in unnecessary and excessive amounts and that PNC Bank improperly profited from these arrangements by means of the payment of commissions to PNC Bank and by reinsurance arrangements between PNC Bank and the insurance provider. The plaintiff seeks to certify a nationwide class and an Ohio sub-class (for the Ohio statutory claim) of all persons who, during applicable periods, have or had a residential mortgage loan or line of credit with PNC Bank, and had hazard insurance placed upon the secured property by PNC Bank. The plaintiff seeks, among other things, damages, restitution or disgorgement of profits improperly obtained, injunctive relief, interest, and attorneys’ fees.
Other RegulatoryPATENT INFRINGEMENT LITIGATION
In June 2013, a lawsuit (Intellectual Ventures I LLC & Intellectual Ventures II LLC v. PNC Financial Services Group, Inc., and Governmental InquiriesPNC Bank NA, Case No. 2:13-cv-00740-AJS) was filed in the United States District Court for the Western District of Pennsylvania against PNC and PNC Bank for patent infringement. The plaintiffs allege that multiple systems by which PNC and PNC Bank provide online banking
services and other services via electronic means infringe five patents owned by the plaintiffs. The plaintiffs seek, among other things, a declaration that PNC and PNC Bank are infringing each of the patents, damages for past and future infringement, and attorneys’ fees.
OTHER REGULATORYAND GOVERNMENTAL INQUIRIES
PNC is the subject of investigations, audits and other forms of regulatory and governmental inquiry covering a broad range of issues in our banking, securities and other financial services businesses, in some cases as part of reviews of specified activities at multiple industry participants. Over the last few years, we have experienced an increase in regulatory and governmental investigations, audits and other inquiries. Areas of current regulatory or governmental inquiry with respect to PNC include consumer financial protection, fair lending, mortgage origination and servicing, mortgage-related insurance and reinsurance, sales by third party providers of voluntary identity protection services to PNC customers, municipal finance activities, and participation in government insurance or guarantee programs, some of which are described below and in Prior Disclosure. These inquiries, including those described below and in Prior Disclosure, may lead to administrative, civil or criminal proceedings, and possibly result in remedies including fines, penalties, restitution, or alterations in our business practices, and in additional expenses and collateral costs.
PNC has received a subpoena from the U.S. Attorney’s Office for the Southern District of New York seeking information regarding claims for foreclosure expenses that are incurred in connection with the foreclosure of loans insured or guaranteed by FHA, Fannie Mae or Freddie Mac. This inquiry is in its early stage, and PNC is cooperating with the investigation.
The Department of Justice, Civil Rights Division, and the Consumer Financial Protection Bureau are jointly investigating whether mortgage loan pricing by National City and PNC had a disparate impact on protected classes. In June 2013, PNC was advised by the CFPB that it had authorized settlement negotiations with PNC, as successor to National City Corporation, and by the Department of Justice that it had authorized the filing of a civil complaint against PNC, also as successor to National City. PNC continues to cooperate with the agencies’ investigation.
Our practice is to cooperate fully with regulatory and governmental investigations, audits and other inquiries, including those described in this Note 17 and in Prior Disclosure.
OtherOTHER
In addition to the proceedings or other matters described above and in Prior Disclosure, PNC and persons to whom we may have indemnification obligations, in the normal course of
The PNC Financial Services Group, Inc. –Form 10-Q153
business, are subject to various other pending and threatened legal proceedings in which claims for monetary damages and other relief are asserted. We do not anticipate, at the present time, that the ultimate aggregate liability, if any, arising out of such other legal proceedings will have a material adverse
effect on our financial position. However, we cannot now determine whether or not any claims asserted against us or others to whom we may have indemnification obligations, whether in the proceedings or other matters described above or otherwise, will have a material adverse effect on our results of operations in any future reporting period, which will depend on, among other things, the amount of the loss resulting from the claim and the amount of income otherwise reported for the reporting period.
See Note 18 Commitments and Guarantees for additional information regarding the Visa indemnification and our other obligations to provide indemnification, including to current and former officers, directors, employees and agents of PNC and companies we have acquired, including National City.acquired.
NOTE 18 COMMITMENTSAND GUARANTEES
Equity Funding and Other CommitmentsEQUITY FUNDINGAND OTHER COMMITMENTS
Our unfunded commitments at March 31,June 30, 2013 included private equity investments of $178 million, and other investments of $1$171 million.
Standby Letters of CreditSTANDBY LETTERSOF CREDIT
We issue standby letters of credit and have risk participations in standby letters of credit issued by other financial institutions, in each case to support obligations of our customers to third parties, such as insurance requirements and the facilitation of transactions involving capital markets product execution. Net outstanding standby letters of credit and internal credit ratings were as follows:
Table 127: Net Outstanding Standby Letters of Credit
| | Dollars in billions | | March 31
2013 | | | December 31
2012 | | | June 30
2013 | | December 31
2012 | |
Net outstanding standby letters of credit | | $ | 11.5 | | | $ | 11.5 | | | $ | 10.9 | | | $ | 11.5 | |
Internal credit ratings (as a percentage of portfolio): | | | | | | | | | | |
Pass (a)(b) | | | 96 | % | | | 95 | % | | | 96 | % | | | 95 | % |
Below pass (b)(c) | | | 4 | % | | | 5 | % | | | 4 | % | | | 5 | % |
| (a) | The amounts above exclude participations in standby letters of credit of $3.2 billion to other financial institutions as of June 30, 2013 and December 31, 2012. The amounts above also include $6.8 billion and $7.5 billion which support remarketing programs at June 30, 2013 and December 31, 2012, respectively. |
| (b) | Indicates that expected risk of loss is currently low. |
(b)(c) | Indicates a higher degree of risk of default. |
If the customer fails to meet its financial or performance obligation to the third party under the terms of the contract or there is a need to support a remarketing program, then upon the request of the guaranteed party, subject to the terms of the letter of credit, we would be obligated to make payment to them. The standby letters of credit and risk participations in standby letters of credit and bankers’ acceptances outstanding on March 31,June 30, 2013 had terms ranging from less than 1 year to 7 years. The aggregate maximum amount of future payments PNC could be required to make under outstanding standby letters of credit and risk participations in standby letters of credit and bankers’ acceptances was $14.6 billion at March 31, 2013, of which $7.4 billion support remarketing programs.
The PNC Financial Services Group, Inc. –Form 10-Q141
As of March 31,June 30, 2013, assets of $1.8$2.4 billion secured certain specifically identified standby letters of credit. Recourse provisions from third parties of $3.1 billion were also available for this purpose as of March 31, 2013. In addition, a portion of the remaining standby letters of credit and letter of credit risk participations issued on behalf of specific customers is also secured by collateral or guarantees that secure the customers’ other obligations to us. The carrying amount of the liability for our obligations related to standby letters of credit and risk participations in standby letters of credit and bankers’ acceptances was $227$215 million at March 31,June 30, 2013.
Standby Bond Purchase Agreements and Other Liquidity FacilitiesSTANDBY BOND PURCHASE AGREEMENTSAND OTHER LIQUIDITY FACILITIES
We enter into standby bond purchase agreements to support municipal bond obligations. At March 31,June 30, 2013, the aggregate of our commitments under these facilities was $568$556 million. We also enter into certain other liquidity facilities to support individual pools of receivables acquired by commercial paper conduits. At March 31,June 30, 2013, our total commitments under these facilities were $145 million.
IndemnificationsINDEMNIFICATIONS
We are a party to numerous acquisition or divestiture agreements under which we have purchased or sold, or agreed to purchase or sell, various types of assets. These agreements can cover the purchase or sale of entire businesses, loan portfolios, branch banks, partial interests in companies, or other types of assets.
These agreements generally include indemnification provisions under which we indemnify the third parties to these agreements against a variety of risks to the indemnified parties as a result of the transaction in question. When PNC is the seller, the indemnification provisions will generally also provide the buyer with protection relating to the quality of the assets we are selling and the extent of any liabilities being assumed by the buyer. Due to the nature of these indemnification provisions, we cannot quantify the total potential exposure to us resulting from them.
We provide indemnification in connection with securities offering transactions in which we are involved. When we are the issuer of the securities, we provide indemnification to the underwriters or placement agents analogous to the indemnification provided to the purchasers of businesses from us, as described above. When we are an underwriter or placement agent, we provide a limited indemnification to the issuer related to our actions in connection with the offering and, if there are other underwriters, indemnification to the other underwriters intended to result in an appropriate sharing of the risk of participating in the offering. Due to the nature of these indemnification provisions, we cannot quantify the total potential exposure to us resulting from them.
In the ordinary course of business, we enter into certain types of agreements that include provisions for indemnifying third parties. We also enter into certain types of agreements, including leases, assignments of leases, and subleases, in which we agree to indemnify third parties for acts by our
154 The PNC Financial Services Group, Inc. –Form 10-Q
agents, assignees and/or sublessees, and employees. We also enter into contracts for the delivery of technology service in which we indemnify the other party against claims of patent and copyright infringement by third parties. Due to the nature of these indemnification provisions, we cannot calculate our aggregate potential exposure under them.
In the ordinary course of business, we enter into contracts with third parties under which the third parties provide services on behalf of PNC. In many of these contracts, we agree to indemnify the third party service provider under certain circumstances. The terms of the indemnity vary from contract to contract and the amount of the indemnification liability, if any, cannot be determined.
We are a general or limited partner in certain asset management and investment limited partnerships, many of which contain indemnification provisions that would require us to make payments in excess of our remaining unfunded commitments. While in certain of these partnerships the maximum liability to us is limited to the sum of our unfunded commitments and partnership distributions received by us, in the others the indemnification liability is unlimited. As a result, we cannot determine our aggregate potential exposure for these indemnifications.
In some cases, indemnification obligations of the types described above arise under arrangements entered into by predecessor companies for which we become responsible as a result of the acquisition.
Pursuant to their bylaws, PNC and its subsidiaries provide indemnification to directors, officers and, in some cases, employees and agents against certain liabilities incurred as a result of their service on behalf of or at the request of PNC and its subsidiaries. PNC and its subsidiaries also advance on behalf of covered individuals costs incurred in connection with certain claims or proceedings, subject to written undertakings by each such individual to repay all amounts advanced if it is ultimately determined that the individual is not entitled to indemnification. We generally are responsible for similar indemnifications and advancement obligations that companies we acquire had to their officers, directors and sometimes employees and agents at the time of acquisition. We advanced such costs on behalf of several such individuals with respect to pending litigation or investigations during the first threesix months of 2013. It is not possible for us to determine the aggregate potential exposure resulting from the obligation to provide this indemnity or to advance such costs.
142 The PNC Financial Services Group, Inc. –Form 10-Q
Visa IndemnificationVISA INDEMNIFICATION
Our payment services business issues and acquires credit and debit card transactions through Visa U.S.A. Inc. card association or its affiliates (Visa). Our 2012 Form 10-K has additional information regarding the October 2007 Visa restructuring, our involvement with judgment and loss sharing
agreements with Visa and certain other banks, and the status of pending interchange litigation. This information was updated in Note 23 Legal Proceedings in our 2012 Form 10-K.10-K and in Note 17 Legal Proceedings in this Report. Additionally, we continue to have an obligation to indemnify Visa for judgments and settlements for the remaining specified litigation.
Recourse and Repurchase ObligationsRECOURSEAND REPURCHASE OBLIGATIONS
As discussed in Note 3 Loan Sale and Servicing Activities and Variable Interest Entities, PNC has sold commercial mortgage, residential mortgage and home equity loans directly or indirectly through securitization and loan sale transactions in which we have continuing involvement. One form of continuing involvement includes certain recourse and loan repurchase obligations associated with the transferred assets.
COMMERCIAL MORTGAGE LOAN RECOURSE OBLIGATIONS
We originate, close and service certain multi-family commercial mortgage loans which are sold to FNMA under FNMA’s Delegated Underwriting and Servicing (DUS) program. We participated in a similar program with the FHLMC.
Under these programs, we generally assume up to a one-third pari passu risk of loss on unpaid principal balances through a loss share arrangement. At March 31,June 30, 2013 and December 31, 2012, the unpaid principal balance outstanding of loans sold as a participant in these programs was $13.0$12.7 billion and $12.8 billion, respectively. The potential maximum exposure under the loss share arrangements was $4.0$3.9 billion at March 31,both June 30, 2013 and $3.9 billion at December 31, 2012.
We maintain a reserve for estimated losses based upon our exposure. The reserve for losses under these programs totaled $42$37 million and $43 million as of March 31,June 30, 2013 and December 31, 2012, respectively, and is included in Other liabilities on our Consolidated Balance Sheet. The comparable reserve as of March 31,June 30, 2012 was $50$48 million. If payment is required under these programs, we would not have a contractual interest in the collateral underlying the mortgage loans on which losses occurred, although the value of the collateral is taken into account in determining our share of such losses. Our exposure and activity associated with these recourse obligations are reported in the Corporate & Institutional Banking segment.
Table 128: Analysis of Commercial Mortgage Recourse Obligations
| | In millions | | 2013 | | | 2012 | | | 2013 | | 2012 | |
January 1 | | $ | 43 | | | $ | 47 | | | $ | 43 | | | $ | 47 | |
Reserve adjustments, net | | | (1 | ) | | | 3 | | | | (6 | ) | | | 5 | |
March 31 | | $ | 42 | | | $ | 50 | | |
Losses – loan repurchases and settlements | | | | | (4 | ) |
June 30 | | | $ | 37 | | | $ | 48 | |
The PNC Financial Services Group, Inc. –Form 10-Q155
RESIDENTIAL MORTGAGE LOANAND HOME EQUITY REPURCHASE OBLIGATIONS
While residential mortgage loans are sold on a non-recourse basis, we assume certain loan repurchase obligations associated with mortgage loans we have sold to investors. These loan repurchase obligations primarily relate to situations where PNC is alleged to have breached certain origination covenants and representations and warranties made to purchasers of the loans in the respective purchase and sale agreements. For additional information on loan sales see Note 3 Loan Sale and Servicing Activities and Variable Interest Entities. Our historical exposure and activity associated with Agency securitization repurchase obligations has primarily been related to transactions with FNMA and FHLMC, as indemnification and repurchase losses associated with FHA and VA-insured and uninsured loans pooled in GNMA securitizations historically have been minimal. Repurchase obligation activity associated with residential mortgages is reported in the Residential Mortgage Banking segment.
PNC’s repurchase obligations also include certain brokered home equity loans/lines that were sold to a limited number of private investors in the financial services industry by National City prior to our acquisition of National City. PNC is no longer engaged in the brokered home equity lending business, and our exposure under these loan repurchase obligations is limited to repurchases of loans sold in these transactions. Repurchase activity associated with brokered home equity loans/lines is reported in the Non-Strategic Assets Portfolio segment.
Indemnification and repurchase liabilities are initially recognized when loans are sold to investors and are subsequently evaluated by management. Initial recognition and subsequent adjustments to the indemnification and repurchase liability for the sold residential mortgage portfolio are recognized in Residential mortgage revenue on the Consolidated Income Statement. Since PNC is no longer engaged in the brokered home equity lending business, only subsequent adjustments are recognized to the home equity loans/lines indemnification and repurchase liability. These adjustments are recognized in Other noninterest income on the Consolidated Income Statement.
The PNC Financial Services Group, Inc. –Form 10-Q143
Management’s subsequent evaluation of these indemnification and repurchase liabilities is based upon trends in indemnification and repurchase requests, actual loss experience, risks in the underlying serviced loan portfolios, and current economic conditions. As part of its evaluation, management considers estimated loss projections over the life of the subject loan portfolio. At March 31,June 30, 2013 and December 31, 2012, the total indemnification and repurchase liability for estimated losses on indemnification and repurchase claims totaled $547 million and $672 million, respectively, and was included in Other liabilities on the Consolidated Balance Sheet. An analysis of the changes in this liability during the first threesix months of 2013 and 2012 follows:
Table 129: Analysis of Indemnification and Repurchase Liability for Asserted Claims and Unasserted Claims
| | | | 2013 | | | 2012 | | | | | 2013 | | | | | | | | | 2012 | | | | |
| In millions | | Residential
Mortgages (a) | | Home
Equity
Loans/
Lines (b) | | | Total | | | Residential
Mortgages (a) | | | Home
Equity
Loans/
Lines (b) | | | Total | | | Residential
Mortgages (a) | | Home Equity
Loans/Lines (b) | | | Total | | | Residential
Mortgages (a) | | | Home Equity
Loans/Lines (b) | | | Total | |
January 1 | | $ | 614 | | | $ | 58 | | | $ | 672 | | | $ | 83 | | | $ | 47 | | | $ | 130 | | | $ | 614 | | | $ | 58 | | | $ | 672 | | | $ | 83 | | | $ | 47 | | | $ | 130 | |
Reserve adjustments, net | | | 4 | | | | (3 | ) | | | 1 | | | | 32 | | | | 12 | | | | 44 | | | | 4 | | | | (3 | ) | | | 1 | | | | 32 | | | | 12 | | | | 44 | |
RBC Bank (USA) acquisition | | | | | | | | | 26 | | | | | | 26 | | | | | | | | | | 26 | | | | | | 26 | |
Losses – loan repurchases and settlements | | | (96 | ) | | | (30 | ) | | | (126 | ) | | | (40 | ) | | | (8 | ) | | | (48 | ) | | | (96 | ) | | | (30 | ) | | | (126 | ) | | | (40 | ) | | | (8 | ) | | | (48 | ) |
March 31 | | $ | 522 | | | $ | 25 | | | $ | 547 | | | $ | 101 | | | $ | 51 | | | $ | 152 | | | $ | 522 | | | $ | 25 | | | $ | 547 | | | $ | 101 | | | $ | 51 | | | $ | 152 | |
Reserve adjustments, net | | | | 73 | | | | 1 | | | | 74 | | | | 438 | | | | 15 | | | | 453 | |
Losses – loan repurchases and settlements | | | | (72 | ) | | | (2 | ) | | | (74 | ) | | | (77 | ) | | | (5 | ) | | | (82 | ) |
June 30 | | | $ | 523 | | | $ | 24 | | | $ | 547 | | | $ | 462 | | | $ | 61 | | | $ | 523 | |
| (a) | Repurchase obligation associated with sold loan portfolios of $115.9$114.4 billion and $126.0$115.7 billion at March 31,June 30, 2013 and March 31,June 30, 2012, respectively. |
| (b) | Repurchase obligation associated with sold loan portfolios of $3.9$3.8 billion and $4.4 billion at March 31,June 30, 2013 and March 31,June 30, 2012, respectively. PNC is no longer engaged in the brokered home equity business, which was acquired with National City. |
Management believes our indemnification and repurchase liabilities appropriately reflect the estimated probable losses on indemnification and repurchase claims for all loans sold and outstanding as of March 31,June 30, 2013 and 2012. In making these estimates, we consider the losses that we expect to incur over the life of the sold loans. While management seeks to obtain all relevant information in estimating the indemnification and repurchase liability, the estimation process is inherently uncertain and imprecise and, accordingly, it is reasonably possible that future
indemnification and repurchase losses could be more or less than our established liability. Factors that could affect our estimate include the volume of valid claims driven by investor strategies and behavior, our ability to successfully negotiate claims with investors, housing prices and other economic conditions. At March 31,June 30, 2013, we estimate that it is reasonably possible that we could incur additional losses in excess of our accrued indemnification and repurchase liability of up to approximately $357$355 million for our portfolio of residential mortgage loans sold. At March 31,June 30, 2013, the reasonably
156 The PNC Financial Services Group, Inc. –Form 10-Q
possible loss above our accrual for our portfolio of home equity loans/lines sold was not material. This estimate of potential additional losses in excess of our liability is based on assumed higher repurchase claims and lower claim rescissions than our current assumptions.
Reinsurance AgreementsREINSURANCE AGREEMENTS
We have two wholly-owned captive insurance subsidiaries which provide reinsurance to third-party insurers related to insurance sold to our customers. These subsidiaries enter into various types of reinsurance agreements with third-party insurers where the subsidiary assumes the risk of loss through either an excess of loss or quota share agreement up to 100% reinsurance. In excess of loss agreements, these subsidiaries
assume the risk of loss for an excess layer of coverage up to specified limits, once a defined first loss percentage is met. In quota share agreements, the subsidiaries and third-party insurers share the responsibility for payment of all claims.
These subsidiaries provide reinsurance for accidental death & dismemberment, credit life, accident & health, lender placed hazard and borrower and lender paid mortgage insurance with an aggregate maximum exposure up to the specified limits for all reinsurance contracts as follows:
Table 130: Reinsurance Agreements Exposure (a)
| | In millions | | March 31
2013 | | December 31
2012 | | | June 30
2013 | | December 31
2012 | |
Accidental Death & Dismemberment | | $ | 2,013 | | | $ | 2,049 | | | $ | 1,973 | | | $ | 2,049 | |
Credit Life, Accident & Health | | | 737 | | | | 795 | | | | 674 | | | | 795 | |
Lender Placed Hazard (b) | | | 2,871 | | | | 2,774 | | | | 2,901 | | | | 2,774 | |
Borrower and Lender Paid Mortgage Insurance | | | 193 | | | | 228 | | | | 183 | | | | 228 | |
Maximum Exposure | | $ | 5,814 | | | $ | 5,846 | | | $ | 5,731 | | | $ | 5,846 | |
Percentage of reinsurance agreements: | | | | | | | | | | |
Excess of Loss – Mortgage Insurance | | | 3 | % | | | 3 | % | | | 3 | % | | | 3 | % |
Quota Share | | | 97 | % | | | 97 | % | | | 97 | % | | | 97 | % |
Maximum Exposure to Quota Share Agreements with 100% Reinsurance | | $ | 736 | | | $ | 794 | | | $ | 673 | | | $ | 794 | |
| (a) | Reinsurance agreements exposure balances represent estimates based on availability of financial information from insurance carriers. |
| (b) | Through the purchase of catastrophe reinsurance connected to the Lender Placed Hazard Exposure, should a catastrophic event occur, PNC will benefit from this reinsurance. No credit for the catastrophe reinsurance protection is applied to the aggregate exposure figure. |
144 The PNC Financial Services Group, Inc. –Form 10-Q
A rollforward of the reinsurance reserves for probable losses for the first threesix months of 2013 and 2012 follows:
Table 131: Reinsurance Reserves – Rollforward
| | In millions | | 2013 | | 2012 | | | 2013 | | 2012 | |
January 1 | | $ | 61 | | | $ | 82 | | | $ | 61 | | | $ | 82 | |
Paid Losses | | | (12 | ) | | | (14 | ) | | | (21 | ) | | | (35 | ) |
Net Provision | | | 5 | | | | 8 | | | | 8 | | | | 23 | |
March 31 | | $ | 54 | | | $ | 76 | | |
June 30 | | | $ | 48 | | | $ | 70 | |
There were no changes to the terms of existing agreements, nor were any new relationships entered into or existing relationships exited.
There is a reasonable possibility that losses could be more than or less than the amount reserved due to ongoing uncertainty in various economic, social and other factors that could impact the frequency and severity of claims covered by these reinsurance agreements. At March 31,June 30, 2013, the reasonably possible loss above our accrual was not material.
Repurchase and Resale AgreementsREPURCHASEAND RESALE AGREEMENTS
We enter into repurchase and resale agreements where we transfer investment securities to/from a third party with the agreement to repurchase/resell those investment securities at a future date for a specified price. Repurchase and resale agreements are treated as collateralized financing transactions for accounting purposes and are generally carried at the amounts at which the securities will be subsequently reacquired or resold, including accrued interest. Repurchase and resale agreements are typically entered into with counterparties under master netting agreements which provide for the right to set off amounts owed one another and liquidate the purchased or borrowed securities in the event of counterparty default. Our policy is to take possession of securities purchased under agreements to resell. We monitor the market value of securities to be repurchased and resold and additional collateral may be obtained where considered appropriate to protect against credit exposure.
Repurchase and resale agreements are typically entered into with counterparties under industry standard master netting agreements which provide for the right to setoff amounts owed one another with respect to multiple repurchase and resale agreements under such master netting agreement (referred to as netting arrangements) and liquidate the purchased or borrowed securities in the event of counterparty default. In order for an arrangement to be eligible for netting under GAAP (ASC 210-20), we must obtain the requisite assurance that the offsetting rights included in the master netting agreement would be legally enforceable in the event of bankruptcy, insolvency, or a similar proceeding of such third party. Enforceability is evidenced by obtaining a legal opinion that supports, with sufficient confidence, the enforceability of the master netting agreement in bankruptcy.
In accordance with the disclosure requirements of ASU 2011-11,Balance Sheet (Topic 210): Disclosures about Offsetting Assets and Liabilities, Table 132: Resale and Repurchase Agreements Offsetting shows the amounts owed under resale and repurchase agreements. The amounts reported in that table excludeagreements and the market value adjustment onsecurities collateral associated with those agreements where a legal opinion supporting the structured resale agreementsenforceability of $17 million and $19 million at March 31, 2013 and December 31, 2012, respectively, that we have elected to account for at fair value. Refer to Note 9 Fair Value for additional information regarding the structured resale agreements at fair value.offsetting rights has been obtained. We do not present anyresale and repurchase and resale agreements entered into with the same counterparty under a legally enforceable master netting agreement on a net basis on our Consolidated Balance Sheet or within Table 132: Resale and Repurchase Agreements Offsetting. The amounts reported in Table 132 exclude the fair value adjustment on the structured resale agreements of $14 million and $19 million at June 30, 2013 and December 31, 2012, respectively, that we have elected to account for at fair value.
The PNC Financial Services Group, Inc. –Form 10-Q157
Refer to Note 9 Fair Value for additional information regarding the structured resale agreements at fair value.
FurtherFor further discussion on ASU 2011-11,Balance Sheet (Topic 210): Disclosures about Offsetting Assets and Liabilities and the impact of other instruments entered into under master nettingmasternetting arrangements, is included insee Note 1 under Recent Accounting Pronouncements.Pronouncements in the March 31, 2013 Form 10-Q. Refer to Note 13 Financial Derivatives for additional information related to offsetting of financial derivatives.
Table 132: Resale and Repurchase Agreements Offsetting
| | In millions | | Gross Resale
Agreements | | | Amounts Offset
Under Master Netting
Agreements | | Net Resale
Agreements (a) | | | Securities Collateral Held Under
Master Netting
Agreements (b) | | | Net
Amounts | | | Gross
Resale
Agreements | | | Amounts
Offset on the
Consolidated
Balance Sheet | | Net Resale
Agreements (a) (b) | | | Securities Collateral
Held Under Master
Netting Agreements (c) | | | Net
Amounts (b) | |
Resale Agreements | | | | | | | | | | | | | | | | | | | | | | |
March 31, 2013 | | $ | 1,066 | | | | | $ | 1,066 | | | $ | 977 | | | $ | 89 | | |
June 30, 2013 | | | $ | 1,089 | | | | | $ | 1,089 | | | $ | 999 | | | $ | 90 | |
December 31, 2012 | | | 975 | | | | | | 975 | | | | 884 | | | | 91 | | | | 975 | | | | | | 975 | | | | 884 | | | | 91 | |
| | | | | | | | | | | | |
| In millions | | Gross
Repurchase
Agreements | | | Amounts Offset
Under Master
Netting
Agreements | | Net
Repurchase
Agreements (c) | | | Securities Collateral
Pledged Under
Master Netting
Agreements (b) | | | Net
Amounts | | |
Repurchase Agreements | | | | | | | | | | | | |
March 31, 2013 | | $ | 3,530 | | | | | $ | 3,530 | | | $ | 2,543 | | | $ | 987 | | |
December 31, 2012 | | | 3,215 | | | | | | 3,215 | | | | 2,168 | | | | 1,047 | | |
| | | | | | | | | | | | | | | | | | |
| In millions | | Gross
Repurchase
Agreements | | | Amounts
Offset on the
Consolidated
Balance Sheet | | Net Repurchase
Agreements (d) (e) | | | Securities Collateral
Pledged Under Master
Netting Agreements (c) | | | Net
Amounts (e) | |
Repurchase Agreements | | | | | | | | | | | | | | | | | | |
June 30, 2013 | | $ | 3,237 | | | | | $ | 3,237 | | | $ | 2,355 | | | $ | 882 | |
December 31, 2012 | | | 3,215 | | | | | | 3,215 | | | | 2,168 | | | | 1,047 | |
| (a) | Represents the resale agreement amount included in Federal funds sold and resale agreements on our Consolidated Balance Sheet and the related accrued interest income in the amount of $1 million at both March 31,June 30, 2013 and December 31, 2012, respectively, which is included in Other Assets on the Consolidated Balance Sheet. |
| (b) | These amounts include certain long term resale agreements of $89 million at both March 31,June 30, 2013 and December 31, 2012, respectively, which are fully collateralized but do not have the benefits of a netting opinion and therefore might be subject to a stay in insolvency proceedings and therefore are not eligible under ASC 210-20 for netting. |
(b)(c) | In accordance with the requirements of ASU 2011-11, represents the fair value of securities collateral purchased or sold, up to the amount owed under the agreement, for agreements supported by a legally enforceable master netting agreement. |
(c)(d) | Represents the repurchase agreement amount included in Federal funds purchased and repurchase agreements on our Consolidated Balance Sheet and the related accrued interest expense in the amount of less than $1 million at both March 31,June 30, 2013 and December 31, 2012, which is included in Other Liabilities on the Consolidated Balance Sheet. |
| (e) | These amounts include overnight repurchase agreements of $937$832 million and $997 million at March 31,June 30, 2013 and December 31, 2012, respectively, entered into with municipalities, pension plans, and certain trusts and insurance companies as well as certain long term repurchase agreements of $50 million at both March 31,June 30, 2013 and December 31, 2012, which are fully collateralized but do not have the benefits of a netting opinion and therefore might be subject to a stay in insolvency proceedings and therefore are not eligible under ASC 210-20 for netting. |
The PNC Financial Services Group, Inc. –Form 10-Q145
NOTE 19 SEGMENT REPORTING
We have six reportable business segments:
Corporate & Institutional Banking
Residential Mortgage Banking
Non-Strategic Assets Portfolio
Results of individual businesses are presented based on our internal management reporting practices. There is no comprehensive, authoritative body of guidance for management accounting equivalent to GAAP; therefore, the financial results of our individual businesses are not necessarily comparable with similar information for any other company. We periodically refine our internal methodologies as management reporting practices are enhanced. To the extent practicable, retrospective application of new methodologies is made to prior period reportable business segment results and disclosures to create comparability to the current period presentation to reflect any such refinements.
Financial results are presented, to the extent practicable, as if each business operated on a stand-alone basis. Additionally,
we have aggregated the results for corporate support functions within “Other” for financial reporting purposes.
Assets receive a funding charge and liabilities and capital receive a funding credit based on a transfer pricing methodology that incorporates product maturities, duration and other factors. A portion of capital is intended to cover unexpected losses and is assigned to our business segments using our risk-based economic capital model, including consideration of the goodwill and other intangible assets at those business segments, as well as the diversification of risk among the business segments.
We have allocated the allowances for loan and lease losses and for unfunded loan commitments and letters of credit based on our assessment of risk in each business segment’s loan portfolio. Key reserve assumptions and estimation processes react to and are influenced by observed changes in loan portfolio performance experience, the financial strength of the borrower, and economic conditions. Key reserve assumptions are periodically updated.
Our allocation of the costs incurred by operations and other shared support areas not directly aligned with the businesses is primarily based on the use of services.
158 The PNC Financial Services Group, Inc. –Form 10-Q
Total business segment financial results differ from total consolidated net income. The impact of these differences is reflected in the “Other” category in the business segment tables. “Other” includes residual activities that do not meet the criteria for disclosure as a separate reportable business, such as gains or losses related to BlackRock transactions,
integration costs, asset and liability management activities including net securities gains or losses, other-than-temporary impairment of investment securities and certain trading activities, exited businesses, private equity investments, intercompany eliminations, most corporate overhead, tax adjustments that are not allocated to business segments, and differences between business segment performance reporting and financial statement reporting (GAAP), including the presentation of net income attributable to noncontrolling interests as the segments’ results exclude their portion of net income attributable to noncontrolling interests. Assets, revenue and earnings attributable to foreign activities were not material in the periods presented for comparative purposes.
Business Segment Products and ServicesBUSINESS SEGMENT PRODUCTSAND SERVICES
Retail Bankingprovides deposit, lending, brokerage, investment management and cash management services to consumer and small business customers within our primary geographic markets. Our customers are serviced through our branch network, ATMs, call centers, online banking and mobile channels. The branch network is located primarily in Pennsylvania, Ohio, New Jersey, Michigan, Illinois, Maryland, Indiana, North Carolina, Florida, Kentucky, Washington, D.C., Delaware, Alabama, Virginia, Georgia, Missouri, Wisconsin and South Carolina.
Corporate & Institutional Bankingprovides lending, treasury management, and capital markets-related products and services to mid-sized corporations, government and not-for-profit entities, and selectively to large corporations. Lending products include secured and unsecured loans, letters of credit and equipment leases. Treasury management services include cash and investment management, receivables management, disbursement services, funds transfer services, information reporting, and global trade services. Capital markets-related products and services include foreign exchange, derivatives, loan syndications, mergers and acquisitions advisory andrelated services to middle-market companies, our multi-seller conduit, securities underwriting, and securities sales and trading. Corporate & Institutional Banking also provides commercial loan servicing and real estate advisory and technology solutions for the commercial real estate finance industry. Corporate & Institutional Banking provides products and services generally within our primary geographic markets, with certain products and services offered nationally and internationally.
Asset Management Groupincludes personal wealth management for high net worth and ultra high net worth clients and institutional asset management. Wealth management products and services include investment andretirement planning, customized investment management, private banking, tailored credit solutions, and trust
management and administration for individuals and theirfamilies. Institutional asset management provides investment management, custody and retirement administration services. Institutional clients include corporations, unions,
146 The PNC Financial Services Group, Inc. –Form 10-Q
municipalities, non-profits, foundations and endowments, primarily located in our geographic footprint.
Residential Mortgage Banking directly originates primarily first lien residential mortgage loans on a nationwide basis with a significant presence within the retail banking footprint, and also originates loans through majority owned affiliates. Mortgage loans represent loans collateralized by one-to-four-family residential real estate. These loans are typically underwritten to government agency and/or third-party standards, and sold, servicing retained, to secondary mortgage conduits of FNMA, FHLMC, Federal Home Loan Banks and third-party investors, or are securitized and issued under the GNMA program. The mortgage servicing operation performs all functions related to servicing mortgage loans, primarily those in first lien position, for various investors and for loans owned by PNC. Certain loan applications are brokered by majority owned affiliates to others.
BlackRockis a leader in investment management, risk management and advisory services for institutional and retail clients worldwide. BlackRock provides diversified investment management services to institutional clients, intermediary and individual investors through various investment vehicles. Investment management services primarily consist of the management of equity, fixed income, multi-asset class, alternative investment and cash management products. BlackRock offers its investment products in a variety of
vehicles, including open-end and closed-end mutual funds,iShares® exchange-traded funds (ETFs), collective investment trusts and separate accounts. In addition, BlackRock provides market risk management, financial markets advisory and enterprise investment system services to a broad base of clients. Financial markets advisory services include valuation services relating to illiquid securities, dispositions and workout assignments (including long-term portfolio liquidation assignments), risk management and strategic planning and execution.
We hold an equity investment in BlackRock, which is a key component of our diversified revenue strategy. BlackRock is a publically traded company, and additional information regarding its business is available in its filings with the Securities and Exchange Commission (SEC). At March 31,June 30, 2013, our economic interest in BlackRock was 22%.
PNC received cash dividends from BlackRock of $63$125 million and $56$113 million during the first threesix months of 2013 and 2012, respectively.
Non-Strategic Assets Portfolio includes a consumer portfolio of mainly residential mortgage and brokered home equity loans and a small commercial loan and lease portfolio. We obtained a significant portion of these non-strategic assets through acquisitions of other companies.
The PNC Financial Services Group, Inc. –Form 10-Q 147159
Table 133: Results Of Businesses
| | | | | | | | | | | | | | | | | | | | | | | | | | | | | | | | |
Three months ended March 31 In millions | | Retail
Banking | | | Corporate &
Institutional
Banking | | | Asset
Management
Group | | | Residential
Mortgage
Banking | | | BlackRock | | | Non-Strategic
Assets
Portfolio | | | Other | | | Consolidated | |
2013 | | | | | | | | | | | | | | | | | | | | | | | | | | | | | | | | |
Income Statement | | | | | | | | | | | | | | | | | | | | | | | | | | | | | | | | |
Net interest income | | $ | 1,049 | | | $ | 926 | | | $ | 73 | | | $ | 48 | | | | | | | $ | 203 | | | $ | 90 | | | $ | 2,389 | |
Noninterest income | | | 434 | | | | 385 | | | | 182 | | | | 243 | | | $ | 138 | | | | 16 | | | | 168 | | | | 1,566 | |
Total revenue | | | 1,483 | | | | 1,311 | | | | 255 | | | | 291 | | | | 138 | | | | 219 | | | | 258 | | | | 3,955 | |
Provision for credit losses (benefit) | | | 162 | | | | 14 | | | | 5 | | | | 20 | | | | | | | | 42 | | | | (7 | ) | | | 236 | |
Depreciation and amortization | | | 47 | | | | 33 | | | | 10 | | | | 3 | | | | | | | | | | | | 82 | | | | 175 | |
Other noninterest expense | | | 1,084 | | | | 447 | | | | 173 | | | | 197 | | | | | | | | 52 | | | | 267 | | | | 2,220 | |
Income (loss) before income taxes and noncontrolling interests | | | 190 | | | | 817 | | | | 67 | | | | 71 | | | | 138 | | | | 125 | | | | (84 | ) | | | 1,324 | |
Income taxes (benefit) | | | 70 | | | | 276 | | | | 24 | | | | 26 | | | | 30 | | | | 46 | | | | (152 | ) | | | 320 | |
Net income | | $ | 120 | | | $ | 541 | | | $ | 43 | | | $ | 45 | | | $ | 108 | | | $ | 79 | | | $ | 68 | | | $ | 1,004 | |
Inter-segment revenue | | | | | | $ | 6 | | | $ | 3 | | | $ | 1 | | | $ | 4 | | | $ | (2 | ) | | $ | (12 | ) | | | | |
Average Assets (a) | | $ | 74,116 | | | $ | 111,671 | | | $ | 7,131 | | | $ | 10,803 | | | $ | 5,859 | | | $ | 10,735 | | | $ | 83,130 | | | $ | 303,445 | |
2012 | | | | | | | | | | | | | | | | | | | | | | | | | | | | | | | | |
Income Statement | | | | | | | | | | | | | | | | | | | | | | | | | | | | | | | | |
Net interest income | | $ | 1,044 | | | $ | 916 | | | $ | 75 | | | $ | 51 | | | | | | | $ | 217 | | | $ | (12 | ) | | $ | 2,291 | |
Noninterest income | | | 391 | | | | 328 | | | | 168 | | | | 242 | | | $ | 116 | | | | (19 | ) | | | 215 | | | | 1,441 | |
Total revenue | | | 1,435 | | | | 1,244 | | | | 243 | | | | 293 | | | | 116 | | | | 198 | | | | 203 | | | | 3,732 | |
Provision for credit losses (benefit) | | | 135 | | | | 19 | | | | 10 | | | | (7 | ) | | | | | | | 18 | | | | 10 | | | | 185 | |
Depreciation and amortization | | | 46 | | | | 33 | | | | 10 | | | | 3 | | | | | | | | | | | | 75 | | | | 167 | |
Other noninterest expense | | | 1,023 | | | | 430 | | | | 166 | | | | 200 | | | | | | | | 68 | | | | 401 | | | | 2,288 | |
Income (loss) before income taxes and noncontrolling interests | | | 231 | | | | 762 | | | | 57 | | | | 97 | | | | 116 | | | | 112 | | | | (283 | ) | | | 1,092 | |
Income taxes (benefit) | | | 84 | | | | 267 | | | | 21 | | | | 36 | | | | 26 | | | | 41 | | | | (194 | ) | | | 281 | |
Net income (loss) | | $ | 147 | | | $ | 495 | | | $ | 36 | | | $ | 61 | | | $ | 90 | | | $ | 71 | | | $ | (89 | ) | | $ | 811 | |
Inter-segment revenue | | | | | | $ | 9 | | | $ | 3 | | | $ | 2 | | | $ | 3 | | | $ | (2 | ) | | $ | (15 | ) | | | | |
Average Assets (a) | | $ | 69,709 | | | $ | 92,896 | | | $ | 6,566 | | | $ | 11,989 | | | $ | 5,565 | | | $ | 12,124 | | | $ | 82,693 | | | $ | 281,542 | |
(a) | Period-end balances for BlackRock. |
| | | | | | | | | | | | | | | | | | | | | | | | | | | | | | | | |
Three months ended June 30 In millions | | Retail
Banking | | | Corporate &
Institutional
Banking | | | Asset Management Group | | | Residential
Mortgage Banking | | | BlackRock | | | Non-Strategic Assets Portfolio | | | Other | | | Consolidated | |
2013 | | | | | | | | | | | | | | | | | | | | | | | | | | | | | | | | |
Income Statement | | | | | | | | | | | | | | | | | | | | | | | | | | | | | | | | |
Net interest income | | $ | 1,012 | | | $ | 912 | | | $ | 70 | | | $ | 51 | | | | | | | $ | 164 | | | $ | 49 | | | $ | 2,258 | |
Noninterest income | | | 542 | | | | 477 | | | | 184 | | | | 177 | | | $ | 149 | | | | 11 | | | | 266 | | | | 1,806 | |
Total revenue | | | 1,554 | | | | 1,389 | | | | 254 | | | | 228 | | | | 149 | | | | 175 | | | | 315 | | | | 4,064 | |
Provision for credit losses (benefit) | | | 148 | | | | (40 | ) | | | 1 | | | | 4 | | | | | | | | 39 | | | | 5 | | | | 157 | |
Depreciation and amortization | | | 45 | | | | 32 | | | | 11 | | | | 3 | | | | | | | | | | | | 86 | | | | 177 | |
Other noninterest expense | | | 1,111 | | | | 467 | | | | 184 | | | | 189 | | | | | | | | 41 | | | | 266 | | | | 2,258 | |
Income (loss) before income taxes and noncontrolling interests | | | 250 | | | | 930 | | | | 58 | | | | 32 | | | | 149 | | | | 95 | | | | (42 | ) | | | 1,472 | |
Income taxes (benefit) | | | 92 | | | | 318 | | | | 22 | | | | 12 | | | | 37 | | | | 35 | | | | (167 | ) | | | 349 | |
Net income | | $ | 158 | | | $ | 612 | | | $ | 36 | | | $ | 20 | | | $ | 112 | | | $ | 60 | | | $ | 125 | | | $ | 1,123 | |
Inter-segment revenue | | $ | 2 | | | $ | 5 | | | $ | 3 | | | $ | 2 | | | $ | 4 | | | $ | (3 | ) | | $ | (13 | ) | | | | |
Average Assets (a) | | $ | 74,516 | | | $ | 112,207 | | | $ | 7,289 | | | $ | 10,407 | | | $ | 5,982 | | | $ | 10,290 | | | $ | 81,336 | | | $ | 302,027 | |
2012 | | | | | | | | | | | | | | | | | | | | | | | | | | | | | | | | |
Income Statement | | | | | | | | | | | | | | | | | | | | | | | | | | | | | | | | |
Net interest income | | $ | 1,114 | | | $ | 1,059 | | | $ | 75 | | | $ | 53 | | | | | | | $ | 221 | | | $ | 4 | | | $ | 2,526 | |
Noninterest income | | | 437 | | | | 354 | | | | 165 | | | | (162 | ) | | $ | 111 | | | | 2 | | | | 190 | | | | 1,097 | |
Total revenue | | | 1,551 | | | | 1,413 | | | | 240 | | | | (109 | ) | | | 111 | | | | 223 | | | | 194 | | | | 3,623 | |
Provision for credit losses (benefit) | | | 165 | | | | 33 | | | | (1 | ) | | | (2 | ) | | | | | | | 50 | | | | 11 | | | | 256 | |
Depreciation and amortization | | | 48 | | | | 34 | | | | 10 | | | | 2 | | | | | | | | | | | | 83 | | | | 177 | |
Other noninterest expense | | | 1,123 | | | | 462 | | | | 171 | | | | 228 | | | | | | | | 67 | | | | 420 | | | | 2,471 | |
Income (loss) before income taxes and noncontrolling interests | | | 215 | | | | 884 | | | | 60 | | | | (337 | ) | | | 111 | | | | 106 | | | | (320 | ) | | | 719 | |
Income taxes (benefit) | | | 79 | | | | 307 | | | | 22 | | | | (124 | ) | | | 23 | | | | 39 | | | | (173 | ) | | | 173 | |
Net income (loss) | | $ | 136 | | | $ | 577 | | | $ | 38 | | | $ | (213 | ) | | $ | 88 | | | $ | 67 | | | $ | (147 | ) | | $ | 546 | |
Inter-segment revenue | | | | | | $ | 9 | | | $ | 3 | | | $ | 2 | | | $ | 4 | | | $ | (3 | ) | | $ | (15 | ) | | | | |
Average Assets (a) | | $ | 73,093 | | | $ | 102,835 | | | $ | 6,659 | | | $ | 11,501 | | | $ | 5,597 | | | $ | 12,690 | | | $ | 83,776 | | | $ | 296,151 | |
148160 The PNC Financial Services Group, Inc. –Form 10-Q
| | | | | | | | | | | | | | | | | | | | | | | | | | | | | | | | |
Six months ended June 30 In millions | | Retail
Banking | | | Corporate &
Institutional
Banking | | | Asset
Management
Group | | | Residential
Mortgage
Banking | | | BlackRock | | | Non-Strategic
Assets
Portfolio | | | Other | | | Consolidated | |
2013 | | | | | | | | | | | | | | | | | | | | | | | | | | | | | | | | |
Income Statement | | | | | | | | | | | | | | | | | | | | | | | | | | | | | | | | |
Net interest income | | $ | 2,061 | | | $ | 1,838 | | | $ | 143 | | | $ | 99 | | | | | | | $ | 367 | | | $ | 139 | | | $ | 4,647 | |
Noninterest income | | | 976 | | | | 862 | | | | 366 | | | | 420 | | | $ | 287 | | | | 27 | | | | 434 | | | | 3,372 | |
Total revenue | | | 3,037 | | | | 2,700 | | | | 509 | | | | 519 | | | | 287 | | | | 394 | | | | 573 | | | | 8,019 | |
Provision for credit losses (benefit) | | | 310 | | | | (26 | ) | | | 6 | | | | 24 | | | | | | | | 81 | | | | (2 | ) | | | 393 | |
Depreciation and amortization | | | 92 | | | | 64 | | | | 21 | | | | 6 | | | | | | | | | | | | 169 | | | | 352 | |
Other noninterest expense | | | 2,195 | | | | 915 | | | | 357 | | | | 386 | | | | | | | | 93 | | | | 532 | | | | 4,478 | |
Income (loss) before income taxes and noncontrolling interests | | | 440 | | | | 1,747 | | | | 125 | | | | 103 | | | | 287 | | | | 220 | | | | (126 | ) | | | 2,796 | |
Income taxes (benefit) | | | 162 | | | | 594 | | | | 46 | | | | 38 | | | | 67 | | | | 81 | | | | (319 | ) | | | 669 | |
Net income | | $ | 278 | | | $ | 1,153 | | | $ | 79 | | | $ | 65 | | | $ | 220 | | | $ | 139 | | | $ | 193 | | | $ | 2,127 | |
Inter-segment revenue | | $ | 2 | | | $ | 11 | | | $ | 6 | | | $ | 3 | | | $ | 8 | | | $ | (5 | ) | | $ | (25 | ) | | | | |
Average Assets (a) | | $ | 74,317 | | | $ | 111,941 | | | $ | 7,210 | | | $ | 10,604 | | | $ | 5,982 | | | $ | 10,511 | | | $ | 82,167 | | | $ | 302,732 | |
2012 | | | | | | | | | | | | | | | | | | | | | | | | | | | | | | | | |
Income Statement | | | | | | | | | | | | | | | | | | | | | | | | | | | | | | | | |
Net interest income | | $ | 2,158 | | | $ | 1,975 | | | $ | 150 | | | $ | 104 | | | | | | | $ | 438 | | | $ | (8 | ) | | $ | 4,817 | |
Noninterest income | | | 828 | | | | 682 | | | | 333 | | | | 80 | | | $ | 227 | | | | (17 | ) | | | 405 | | | | 2,538 | |
Total revenue | | | 2,986 | | | | 2,657 | | | | 483 | | | | 184 | | | | 227 | | | | 421 | | | | 397 | | | | 7,355 | |
Provision for credit losses (benefit) | | | 300 | | | | 52 | | | | 9 | | | | (9 | ) | | | | | | | 68 | | | | 21 | | | | 441 | |
Depreciation and amortization | | | 94 | | | | 67 | | | | 20 | | | | 5 | | | | | | | | | | | | 158 | | | | 344 | |
Other noninterest expense | | | 2,146 | | | | 892 | | | | 337 | | | | 428 | | | | | | | | 135 | | | | 821 | | | | 4,759 | |
Income (loss) before income taxes and noncontrolling interests | | | 446 | | | | 1,646 | | | | 117 | | | | (240 | ) | | | 227 | | | | 218 | | | | (603 | ) | | | 1,811 | |
Income taxes (benefit) | | | 163 | | | | 574 | | | | 43 | | | | (88 | ) | | | 49 | | | | 80 | | | | (367 | ) | | | 454 | |
Net income (loss) | | $ | 283 | | | $ | 1,072 | | | $ | 74 | | | $ | (152 | ) | | $ | 178 | | | $ | 138 | | | $ | (236 | ) | | $ | 1,357 | |
Inter-segment revenue | | | | | | $ | 18 | | | $ | 6 | | | $ | 4 | | | $ | 7 | | | $ | (5 | ) | | $ | (30 | ) | | | | |
Average Assets (a) | | $ | 71,420 | | | $ | 97,866 | | | $ | 6,613 | | | $ | 11,745 | | | $ | 5,597 | | | $ | 12,407 | | | $ | 83,199 | | | $ | 288,847 | |
| (a) | Period-end balances for BlackRock. |
NOTE 20 SUBSEQUENT EVENTS
On March 19,July 23, 2013, we announcedcompleted the redemption completed on April 19, 2013 of depositary shares representing interests in PNC’s 9.875% Fixed-To-Floating Rate Non-Cumulative Preferred Stock, Series L. Each depositary share represents a 1/4000th interest in a share of the Series L Preferred Stock. All 6,000,000 depositary shares were redeemed, as well as all 1,500 shares of Series L Preferred Stock underlying such depositary shares.
On March 22, 2013 we called for the redemption completed on April 23, 2013 of $15 million of trust preferred securities issued by Yardville Capital Trust VI.
As these redemptions were announced prior to March 31, 2013, our Tier 1 risk-based capital ratio at March 31, 2013 reflected these first quarter announced calls of these securities for redemption.
On April 8, 2013 we called for redemption on May 23, 2013 of the $30$22 million of trust preferred securities issued by Fidelity Capital Trust III.II, originally called on June 7, 2013.
On April 29, 2013 and May 9,July 25, 2013, PNC Bank N.A. issued $525$750 million and $120 million, respectively of floating rate seniorsubordinated notes with a maturity date of April 29, 2016.July 25, 2023. Interest is payable semi-annually at the 3-month LIBORa fixed rate reset quarterly, plus a
spread of .32%,3.80% on January 29, April 29,25 and July 29, and October 2925 of each year, beginning on July 29, 2013.January 25, 2014.
On MayAugust 1, 2013, we called for redemption, to be completed on June 17,September 16, 2013, of the following$35 million of trust preferred securities:
$15 million issued by Sterling Financial Statutory Trust III
$15 million issued by Sterling Financial Statutory Trust IV
$20 million issued by Sterling Financial Statutory Trust V
$30 millionsecurities issued by MAF Bancorp Capital Trust III.
$8 million issued by James Monroe Statutory Trust III
On May 7, 2013, we issued 500,000 depositary shares, each representing a 1/100th interest in a share of our Fixed-to-Floating Rate Non-Cumulative Perpetual Preferred Stock, Series R, in an underwritten public offering resulting in gross proceeds of $500 million to us before commissions and expenses. We issued 5,000 shares of Series R Preferred Stock to the depositary in this transaction. We intend to use the net proceeds from the sale of the depositary shares for general corporate purposes, which may include advances to our subsidiaries to finance their activities, repayment of outstanding indebtedness, and repurchases and redemptions of issued and outstanding securities of PNC and its subsidiaries.
The PNC Financial Services Group, Inc. –Form 10-Q 149161
STATISTICAL INFORMATION (UNAUDITED)
The PNC Financial Services Group, Inc.
Average Consolidated Balance Sheet And Net Interest Analysis
| | | | | | | | | | | | | | | | | Six months ended June 30 | |
| | | First Quarter 2013 | | | Fourth Quarter 2012 | | | 2013 | | | 2012 | |
Taxable-equivalent basis Dollars in millions | | Average
Balances | | | Interest
Income/
Expense | | | Average
Yields/
Rates | | | Average
Balances | | | Interest
Income/
Expense | | | Average
Yields/
Rates | | | Average
Balances | | | Interest
Income/
Expense | | | Average
Yields/
Rates | | | Average
Balances | | | Interest
Income/
Expense | | | Average
Yields/
Rates | |
Assets | | | | | | | | | | | | | | | | | | | | | | | | | | |
Interest-earning assets: | | | | | | | | | | | | | | | | | | | | | | | | | | |
Investment securities | | | | | | | | | | | | | | | | | | | | | | | | | | |
Securities available for sale | | | | | | | | | | | | | | | | | | | | | | | | | | |
Residential mortgage-backed | | | | | | | | | | | | | | | | | | | | | | | | | | |
Agency | | $ | 25,168 | | | $ | 182 | | | | 2.90 | % | | $ | 25,552 | | | $ | 188 | | | | 2.94 | % | | $ | 24,751 | | | $ | 334 | | | | 2.70 | % | | $ | 27,000 | | | $ | 426 | | | | 3.16 | % |
Non-agency | | | 6,025 | | | | 81 | | | | 5.40 | | | | 6,245 | | | | 85 | | | | 5.39 | | | | 5,957 | | | | 163 | | | | 5.46 | | | | 6,646 | | | | 183 | | | | 5.50 | |
Commercial mortgage-backed | | | 3,745 | | | | 38 | | | | 4.02 | | | | 3,674 | | | | 35 | | | | 3.81 | | | | 3,800 | | | | 76 | | | | 4.01 | | | | 3,667 | | | | 81 | | | | 4.42 | |
Asset-backed | | | 5,731 | | | | 27 | | | | 1.92 | | | | 5,643 | | | | 27 | | | | 1.93 | | | | 5,826 | | | | 54 | | | | 1.86 | | | | 4,865 | | | | 50 | | | | 2.06 | |
U.S. Treasury and government agencies | | | 2,715 | | | | 11 | | | | 1.65 | | | | 2,746 | | | | 12 | | | | 1.76 | | |
US Treasury and government agencies | | | | 2,393 | | | | 18 | | | | 1.53 | | | | 2,836 | | | | 29 | | | | 2.04 | |
State and municipal | | | 2,189 | | | | 28 | | | | 4.93 | | | | 2,034 | | | | 23 | | | | 4.66 | | | | 2,186 | | | | 52 | | | | 4.71 | | | | 1,836 | | | | 45 | | | | 4.87 | |
Other debt | | | 2,649 | | | | 17 | | | | 2.58 | | | | 2,860 | | | | 21 | | | | 2.91 | | | | 2,689 | | | | 34 | | | | 2.48 | | | | 3,087 | | | | 39 | | | | 2.56 | |
Corporate stock and other | | | 368 | | | | – | | | | .12 | | | | 346 | | | | – | | | | .24 | | |
Corporate stocks and other | | | | 335 | | | | | | .13 | | | | 332 | | | | | | .07 | |
Total securities available for sale | | | 48,590 | | | | 384 | | | | 3.16 | | | | 49,100 | | | | 391 | | | | 3.19 | | | | 47,937 | | | | 731 | | | | 3.05 | | | | 50,269 | | | | 853 | | | | 3.39 | |
Securities held to maturity | | | | | | | | | | | | | | | | | | | | | | | | | | |
Residential mortgage-backed | | | 4,146 | | | | 36 | | | | 3.44 | | | | 4,377 | | | | 36 | | | | 3.34 | | | | 3,988 | | | | 67 | | | | 3.35 | | | | 4,418 | | | | 80 | | | | 3.64 | |
Commercial mortgage-backed | | | 3,747 | | | | 44 | | | | 4.71 | | | | 3,967 | | | | 45 | | | | 4.50 | | | | 3,634 | | | | 82 | | | | 4.53 | | | | 4,506 | | | | 104 | | | | 4.59 | |
Asset-backed | | | 826 | | | | 4 | | | | 1.80 | | | | 702 | | | | 3 | | | | 1.76 | | | | 902 | | | | 8 | | | | 1.76 | | | | 1,022 | | | | 9 | | | | 1.75 | |
U.S. Treasury and government agencies | | | 231 | | | | 2 | | | | 3.77 | | | | 229 | | | | 3 | | | | 3.82 | | |
US Treasury and government agencies | | | | 232 | | | | 4 | | | | 3.78 | | | | 223 | | | | 4 | | | | 3.79 | |
State and municipal | | | 639 | | | | 7 | | | | 4.23 | | | | 664 | | | | 7 | | | | 4.23 | | | | 640 | | | | 14 | | | | 4.25 | | | | 671 | | | | 14 | | | | 4.19 | |
Other | | | 352 | | | | 2 | | | | 2.82 | | | | 355 | | | | 2 | | | | 2.89 | | | | 350 | | | | 5 | | | | 2.86 | | | | 360 | | | | 5 | | | | 2.86 | |
Total securities held to maturity | | | 9,941 | | | | 95 | | | | 3.82 | | | | 10,294 | | | | 96 | | | | 3.73 | | | | 9,746 | | | | 180 | | | | 3.70 | | | | 11,200 | | | | 216 | | | | 3.86 | |
Total investment securities | | | 58,531 | | | | 479 | | | | 3.27 | | | | 59,394 | | | | 487 | | | | 3.28 | | | | 57,683 | | | | 911 | | | | 3.16 | | | | 61,469 | | | | 1,069 | | | | 3.48 | |
Loans | | | | | | | | | | | | | | | | | | | | | | | | | | |
Commercial | | | 83,476 | | | | 841 | | | | 4.03 | | | | 80,876 | | | | 859 | | | | 4.16 | | | | 84,752 | | | | 1,648 | | | | 3.87 | | | | 73,208 | | | | 1,716 | | | | 4.64 | |
Commercial real estate | | | 18,850 | | | | 238 | | | | 5.05 | | | | 18,678 | | | | 266 | | | | 5.57 | | | | 18,855 | | | | 469 | | | | 4.94 | | | | 17,630 | | | | 490 | | | | 5.50 | |
Equipment lease financing | | | 7,241 | | | | 73 | | | | 4.05 | | | | 6,956 | | | | 74 | | | | 4.26 | | | | 7,296 | | | | 155 | | | | 4.23 | | | | 6,481 | | | | 157 | | | | 4.85 | |
Consumer | | | 61,411 | | | | 707 | | | | 4.67 | | | | 61,430 | | | | 722 | | | | 4.68 | | | | 61,499 | | | | 1,383 | | | | 4.54 | | | | 58,490 | | | | 1,374 | | | | 4.72 | |
Residential real estate | | | 15,121 | | | | 200 | | | | 5.29 | | | | 15,257 | | | | 205 | | | | 5.36 | | | | 14,957 | | | | 390 | | | | 5.21 | | | | 15,430 | | | | 425 | | | | 5.51 | |
Total loans | | | 186,099 | | | | 2,059 | | | | 4.45 | | | | 183,197 | | | | 2,126 | | | | 4.58 | | | | 187,359 | | | | 4,045 | | | | 4.32 | | | | 171,239 | | | | 4,162 | | | | 4.84 | |
Loans held for sale | | | 3,279 | | | | 53 | | | | 6.49 | | | | 3,025 | | | | 41 | | | | 5.34 | | | | 3,175 | | | | 85 | | | | 5.39 | | | | 2,963 | | | | 95 | | | | 6.44 | |
Federal funds sold and resale agreements | | | 1,176 | | | | 2 | | | | .74 | | | | 1,290 | | | | 4 | | | | 1.04 | | | | 1,159 | | | | 4 | | | | .68 | | | | 1,744 | | | | 13 | | | | 1.52 | |
Other | | | 7,095 | | | | 58 | | | | 3.25 | | | | 6,737 | | | | 55 | | | | 3.24 | | | | 6,765 | | | | 115 | | | | 3.44 | | | | 6,518 | | | | 120 | | | | 3.67 | |
Total interest-earning assets/interest income | | | 256,180 | | | | 2,651 | | | | 4.15 | | | | 253,643 | | | | 2,713 | | | | 4.24 | | | | 256,141 | | | | 5,160 | | | | 4.03 | | | | 243,933 | | | | 5,459 | | | | 4.46 | |
Noninterest-earning assets: | | | | | | | | | | | | | | | | | | | | | | | | | | |
Allowance for loan and lease losses | | | (3,937 | ) | | | | | | | | (3,987 | ) | | | | | | | (3,879 | ) | | | | | | | | (4,245 | ) | | | | |
Cash and due from banks | | | 4,055 | | | | | | | | | 4,126 | | | | | | | | 3,961 | | | | | | | | | 3,735 | | | | | |
Other | | | 47,147 | | | | | | | | | 48,349 | | | | | | | | 46,509 | | | | | | | | | 45,424 | | | | | |
Total assets | | $ | 303,445 | | | | | | | | $ | 302,131 | | | | | | | $ | 302,732 | | | | | | | | $ | 288,847 | | | | | |
Liabilities and Equity | | | | | | | | | | | | | | | | | | | | | | | | | | |
Interest-bearing liabilities: | | | | | | | | | | | | | | | | | | | | | | | | | | |
Interest-bearing deposits | | | | | | | | | | | | | | | | | | | | | | | | | | |
Money market | | $ | 69,003 | | | | 33 | | | | .19 | | | $ | 67,997 | | | | 33 | | | | .19 | | | $ | 69,063 | | | | 63 | | | | .19 | | | $ | 64,032 | | | | 69 | | | | .22 | |
Demand | | | 39,372 | | | | 4 | | | | .04 | | | | 36,619 | | | | 4 | | | | .04 | | | | 39,774 | | | | 9 | | | | .05 | | | | 32,993 | | | | 7 | | | | .04 | |
Savings | | | 10,671 | | | | 3 | | | | .10 | | | | 10,190 | | | | 2 | | | | .09 | | | | 10,899 | | | | 5 | | | | .10 | | | | 9,596 | | | | 5 | | | | .10 | |
Retail certificates of deposit | | | 23,488 | | | | 49 | | | | .85 | | | | 24,394 | | | | 55 | | | | .89 | | | | 23,062 | | | | 96 | | | | .84 | | | | 28,192 | | | | 97 | | | | .69 | |
Time deposits in foreign offices and other time | | | 2,267 | | | | 4 | | | | .61 | | | | 2,740 | | | | 3 | | | | .45 | | | | 2,216 | | | | 6 | | | | .52 | | | | 3,407 | | | | 8 | | | | .49 | |
Total interest-bearing deposits | | | 144,801 | | | | 93 | | | | .26 | | | | 141,940 | | | | 97 | | | | .27 | | | | 145,014 | | | | 179 | | | | .25 | | | | 138,220 | | | | 186 | | | | .27 | |
Borrowed funds | | | | | | | | | | | | | | | | | | | | | | | | | | |
Federal funds purchased and repurchase agreements | | | 4,328 | | | | 2 | | | | .16 | | | | 4,023 | | | | 3 | | | | .20 | | | | 4,229 | | | | 3 | | | | .15 | | | | 4,744 | | | | 5 | | | | .22 | |
Federal Home Loan Bank borrowings | | | 7,657 | | | | 11 | | | | .61 | | | | 8,877 | | | | 16 | | | | .70 | | | | 7,437 | | | | 21 | | | | .57 | | | | 9,603 | | | | 37 | | | | .77 | |
Bank notes and senior debt | | | 10,469 | | | | 48 | | | | 1.83 | | | | 9,702 | | | | 51 | | | | 2.07 | | | | 10,679 | | | | 95 | | | | 1.77 | | | | 10,878 | | | | 132 | | | | 2.39 | |
Subordinated debt | | | 7,249 | | | | 51 | | | | 2.83 | | | | 6,668 | | | | 59 | | | | 3.57 | | | | 7,125 | | | | 100 | | | | 2.81 | | | | 7,506 | | | | 185 | | | | 4.94 | |
Commercial paper | | | 7,967 | | | | 5 | | | | .25 | | | | 9,069 | | | | 7 | | | | .28 | | | | 7,613 | | | | 9 | | | | .23 | | | | 6,957 | | | | 9 | | | | .26 | |
Other | | | 2,057 | | | | 12 | | | | 2.28 | | | | 1,961 | | | | 14 | | | | 2.78 | | | | 2,078 | | | | 26 | | | | 2.45 | | | | 1,980 | | | | 22 | | | | 2.14 | |
Total borrowed funds | | | 39,727 | | | | 129 | | | | 1.30 | | | | 40,300 | | | | 150 | | | | 1.46 | | | | 39,161 | | | | 254 | | | | 1.29 | | | | 41,668 | | | | 390 | | | | 1.86 | |
Total interest-bearing liabilities/interest expense | | | 184,528 | | | | 222 | | | | .48 | | | | 182,240 | | | | 247 | | | | .54 | | | | 184,175 | | | | 433 | | | | .47 | | | | 179,888 | | | | 576 | | | | .64 | |
Noninterest-bearing liabilities and equity: | | | | | | | | | | | | | | | | | | | | | | | | | | |
Noninterest-bearing deposits | | | 64,850 | | | | | | | | | 65,527 | | | | | | | | 64,800 | | | | | | | | | 59,189 | | | | | |
Allowance for unfunded loan commitments and letters of credit | | | 249 | | | | | | | | | 239 | | | | | | | | 244 | | | | | | | | | 242 | | | | | |
Accrued expenses and other liabilities | | | 11,891 | | | | | | | | | 12,237 | | | | | | | | 11,406 | | | | | | | | | 10,781 | | | | | |
Equity | | | 41,927 | | | | | | | | | 41,888 | | | | | | | | 42,107 | | | | | | | | | 38,747 | | | | | |
Total liabilities and equity | | $ | 303,445 | | | | | | | | $ | 302,131 | | | | | | | $ | 302,732 | | | | | | | | $ | 288,847 | | | | | |
Interest rate spread | | | | | | | 3.67 | | | | | | | | 3.70 | | | | | | | | 3.56 | | | | | | | | 3.82 | |
Impact of noninterest-bearing sources | | | | | | | .14 | | | | | | | | .15 | | | | | | | | .13 | | | | | | | | .17 | |
Net interest income/margin | | | | $ | 2,429 | | | | 3.81 | % | | | | $ | 2,466 | | | | 3.85 | % | | | | $ | 4,727 | | | | 3.69 | % | | | | $ | 4,883 | | | | 3.99 | % |
Nonaccrual loans are included in loans, net of unearned income. The impact of financial derivatives used in interest rate risk management is included in the interest income/expense and average yields/rates of the related assets and liabilities. Basis adjustments related to hedged items are included in noninterest-earning assets and noninterest-bearing liabilities. Average balances of securities are based on amortized historical cost (excluding adjustments to fair value, which are included in other assets). Average balances for certain loans and borrowed funds accounted for at fair value, with changes in fair value recorded in trading noninterest income, are included in noninterest-earning assets and noninterest-bearing liabilities. The interest-earning deposits with the Federal Reserve are included in the ‘Other’ interest-earning assets category.
150162 The PNC Financial Services Group, Inc. –Form 10-Q
| | | | | | | | | | | | | | | | | | | | | | | | | | | | | | | | | | |
| Second Quarter 2013 | | | First Quarter 2013 | | | Second Quarter 2012 | |
| | | | | | | | |
Average Balances | | | Interest Income/
Expense | | | Average Yields/ Rates | | | Average Balances | | | Interest Income/ Expense | | | Average Yields/ Rates | | | Average Balances | | | Interest Income/ Expense | | | Average Yields/ Rates | |
| | | | | | | | | | | | | | | | | | | | | | | | | | | | | | | | | | |
| | | | | | | | | | | | | | | | | | | | | | | | | | | | | | | | | | |
| | | | | | | | | | | | | | | | | | | | | | | | | | | | | | | | | | |
| | | | | | | | | | | | | | | | | | | | | | | | | | | | | | | | | | |
| | | | | | | | | | | | | | | | | | | | | | | | | | | | | | | | | | |
| | $24,339 | | | $ | 152 | | | | 2.50 | % | | $ | 25,168 | | | $ | 182 | | | | 2.90 | % | | $ | 26,968 | | | $ | 214 | | | | 3.17 | % |
| | 5,889 | | | | 82 | | | | 5.51 | | | | 6,025 | | | | 81 | | | | 5.40 | | | | 6,716 | | | | 94 | | | | 5.63 | |
| | 3,855 | | | | 38 | | | | 4.00 | | | | 3,745 | | | | 38 | | | | 4.02 | | | | 3,561 | | | | 39 | | | | 4.41 | |
| | 5,919 | | | | 27 | | | | 1.80 | | | | 5,731 | | | | 27 | | | | 1.92 | | | | 5,401 | | | | 26 | | | | 1.91 | |
| | 2,074 | | | | 7 | | | | 1.37 | | | | 2,715 | | | | 11 | | | | 1.65 | | | | 2,549 | | | | 15 | | | | 2.33 | |
| | 2,182 | | | | 24 | | | | 4.48 | | | | 2,189 | | | | 28 | | | | 4.93 | | | | 1,902 | | | | 22 | | | | 4.63 | |
| | 2,728 | | | | 17 | | | | 2.39 | | | | 2,649 | | | | 17 | | | | 2.58 | | | | 3,178 | | | | 20 | | | | 2.56 | |
| | 304 | | | | | | | | .14 | | | | 368 | | | | | | | | .12 | | | | 317 | | | | | | | | .11 | |
| | 47,290 | | | | 347 | | | | 2.93 | | | | 48,590 | | | | 384 | | | | 3.16 | | | | 50,592 | | | | 430 | | | | 3.40 | |
| | | | | | | | | | | | | | | | | | | | | | | | | | | | | | | | | | |
| | 3,833 | | | | 31 | | | | 3.26 | | | | 4,146 | | | | 36 | | | | 3.44 | | | | 4,259 | | | | 39 | | | | 3.70 | |
| | 3,521 | | | | 38 | | | | 4.34 | | | | 3,747 | | | | 44 | | | | 4.71 | | | | 4,376 | | | | 51 | | | | 4.56 | |
| | 978 | | | | 4 | | | | 1.74 | | | | 826 | | | | 4 | | | | 1.80 | | | | 874 | | | | 4 | | | | 1.83 | |
| | 233 | | | | 2 | | | | 3.80 | | | | 231 | | | | 2 | | | | 3.77 | | | | 225 | | | | 2 | | | | 3.79 | |
| | 640 | | | | 7 | | | | 4.27 | | | | 639 | | | | 7 | | | | 4.23 | | | | 671 | | | | 7 | | | | 4.20 | |
| | 349 | | | | 3 | | | | 2.89 | | | | 352 | | | | 2 | | | | 2.82 | | | | 359 | | | | 2 | | | | 2.89 | |
| | 9,554 | | | | 85 | | | | 3.57 | | | | 9,941 | | | | 95 | | | | 3.82 | | | | 10,764 | | | | 105 | | | | 3.90 | |
| | 56,844 | | | | 432 | | | | 3.04 | | | | 58,531 | | | | 479 | | | | 3.27 | | | | 61,356 | | | | 535 | | | | 3.49 | |
| | | | | | | | | | | | | | | | | | | | | | | | | | | | | | | | | | |
| | 86,015 | | | | 807 | | | | 3.71 | | | | 83,476 | | | | 841 | | | | 4.03 | | | | 77,131 | | | | 927 | | | | 4.75 | |
| | 18,860 | | | | 231 | | | | 4.84 | | | | 18,850 | | | | 238 | | | | 5.05 | | | | 18,440 | | | | 270 | | | | 5.78 | |
| | 7,350 | | | | 82 | | | | 4.41 | | | | 7,241 | | | | 73 | | | | 4.05 | | | | 6,586 | | | | 81 | | | | 4.96 | |
| | 61,587 | | | | 676 | | | | 4.40 | | | | 61,411 | | | | 707 | | | | 4.67 | | | | 59,832 | | | | 695 | | | | 4.67 | |
| | 14,794 | | | | 190 | | | | 5.13 | | | | 15,121 | | | | 200 | | | | 5.29 | | | | 15,932 | | | | 216 | | | | 5.44 | |
| | 188,606 | | | | 1,986 | | | | 4.19 | | | | 186,099 | | | | 2,059 | | | | 4.45 | | | | 177,921 | | | | 2,189 | | | | 4.90 | |
| | 3,072 | | | | 32 | | | | 4.22 | | | | 3,279 | | | | 53 | | | | 6.49 | | | | 3,016 | | | | 45 | | | | 6.00 | |
| | 1,141 | | | | 2 | | | | .61 | | | | 1,176 | | | | 2 | | | | .74 | | | | 1,666 | | | | 6 | | | | 1.45 | |
| | 6,439 | | | | 57 | | | | 3.66 | | | | 7,095 | | | | 58 | | | | 3.25 | | | | 6,173 | | | | 56 | | | | 3.62 | |
| | 256,102 | | | | 2,509 | | | | 3.91 | | | | 256,180 | | | | 2,651 | | | | 4.15 | | | | 250,132 | | | | 2,831 | | | | 4.51 | |
| | | | | | | | | | | | | | | | | | | | | | | | | | | | | | | | | | |
| | (3,821) | | | | | | | | | | | | (3,937 | ) | | | | | | | | | | | (4,176 | ) | | | | | | | | |
| | 3,869 | | | | | | | | | | | | 4,055 | | | | | | | | | | | | 3,694 | | | | | | | | | |
| | 45,877 | | | | | | | | | | | | 47,147 | | | | | | | | | | | | 46,501 | | | | | | | | | |
| | $302,027 | | | | | | | | | | | $ | 303,445 | | | | | | | | | | | $ | 296,151 | | | | | | | | | |
| | | | | | | | | | | | | | | | | | | | | | | | | | | | | | | | | | |
| | | | | | | | | | | | | | | | | | | | | | | | | | | | | | | | | | |
| | | | | | | | | | | | | | | | | | | | | | | | | | | | | | | | | | |
| | $69,123 | | | | 30 | | | | .18 | | | $ | 69,003 | | | | 33 | | | | .19 | | | $ | 66,902 | | | | 34 | | | | .21 | |
| | 40,172 | | | | 5 | | | | .05 | | | | 39,372 | | | | 4 | | | | .04 | | | | 34,388 | | | | 4 | | | | .04 | |
| | 11,124 | | | | 2 | | | | .10 | | | | 10,671 | | | | 3 | | | | .10 | | | | 10,008 | | | | 2 | | | | .10 | |
| | 22,641 | | | | 47 | | | | .82 | | | | 23,488 | | | | 49 | | | | .85 | | | | 27,373 | | | | 39 | | | | .57 | |
| | 2,164 | | | | 2 | | | | .43 | | | | 2,267 | | | | 4 | | | | .61 | | | | 3,577 | | | | 4 | | | | .49 | |
| | 145,224 | | | | 86 | | | | .24 | | | | 144,801 | | | | 93 | | | | .26 | | | | 142,248 | | | | 83 | | | | .24 | |
| | | | | | | | | | | | | | | | | | | | | | | | | | | | | | | | | | |
| | 4,132 | | | | 1 | | | | .14 | | | | 4,328 | | | | 2 | | | | .16 | | | | 4,937 | | | | 3 | | | | .21 | |
| | 7,218 | | | | 10 | | | | .53 | | | | 7,657 | | | | 11 | | | | .61 | | | | 10,238 | | | | 19 | | | | .74 | |
| | 10,886 | | | | 47 | | | | 1.71 | | | | 10,469 | | | | 48 | | | | 1.83 | | | | 10,618 | | | | 62 | | | | 2.30 | |
| | 7,003 | | | | 49 | | | | 2.78 | | | | 7,249 | | | | 51 | | | | 2.83 | | | | 7,293 | | | | 87 | | | | 4.77 | |
| | 7,263 | | | | 4 | | | | .22 | | | | 7,967 | | | | 5 | | | | .25 | | | | 8,229 | | | | 5 | | | | .26 | |
| | 2,099 | | | | 14 | | | | 2.62 | | | | 2,057 | | | | 12 | | | | 2.28 | | | | 1,809 | | | | 11 | | | | 2.25 | |
| | 38,601 | | | | 125 | | | | 1.28 | | | | 39,727 | | | | 129 | | | | 1.30 | | | | 43,124 | | | | 187 | | | | 1.72 | |
| | 183,825 | | | | 211 | | | | .46 | | | | 184,528 | | | | 222 | | | | .48 | | | | 185,372 | | | | 270 | | | | .58 | |
| | | | | | | | | | | | | | | | | | | | | | | | | | | | | | | | | | |
| | 64,749 | | | | | | | | | | | | 64,850 | | | | | | | | | | | | 60,478 | | | | | | | | | |
| | 238 | | | | | | | | | | | | 249 | | | | | | | | | | | | 243 | | | | | | | | | |
| | 10,929 | | | | | | | | | | | | 11,891 | | | | | | | | | | | | 10,375 | | | | | | | | | |
| | 42,286 | | | | | | | | | | | | 41,927 | | | | | | | | | | | | 39,683 | | | | | | | | | |
| | $302,027 | | | | | | | | | | | $ | 303,445 | | | | | | | | | | | $ | 296,151 | | | | | | | | | |
| | | | | | | | | 3.45 | | | | | | | | | | | | 3.67 | | | | | | | | | | | | 3.93 | |
| | | | | | | | | | .13 | | | | | | | | | | | | .14 | | | | | | | | | | | | .15 | |
| | | | | $ | 2,298 | | | | 3.58 | % | | | | | | $ | 2,429 | | | | 3.81 | % | | | | | | $ | 2,561 | | | | 4.08 | % |
| | | | | | | | | | | | | | | | | | | | | | | | | | | | | | | | | | |
| Third Quarter 2012 | | | Second Quarter 2012 | | | First Quarter 2012 | |
Average Balances | | | Interest Income/ Expense | | | Average Yields/ Rates | | | Average Balances | | | Interest Income/ Expense | | | Average Yields/ Rates | | | Average Balances | | | Interest Income/ Expense | | | Average Yields/ Rates | |
| | | | | | | | | | | | | | | | | | | | | | | | | | | | | | | | | | |
| | | | | | | | | | | | | | | | | | | | | | | | | | | | | | | | | | |
| | | | | | | | | | | | | | | | | | | | | | | | | | | | | | | | | | |
| | | | | | | | | | | | | | | | | | | | | | | | | | | | | | | | | | |
| | | | | | | | | | | | | | | | | | | | | | | | | | | | | | | | | | |
| $ | 26,546 | | | $ | 201 | | | | 3.03 | % | | $ | 26,968 | | | $ | 214 | | | | 3.17 | % | | $ | 27,031 | | | $ | 212 | | | | 3.14 | % |
| | 6,490 | | | | 82 | | | | 5.08 | | | | 6,716 | | | | 94 | | | | 5.63 | | | | 6,577 | | | | 89 | | | | 5.38 | |
| | 3,720 | | | | 40 | | | | 4.29 | | | | 3,561 | | | | 39 | | | | 4.41 | | | | 3,774 | | | | 42 | | | | 4.42 | |
| | 5,525 | | | | 29 | | | | 2.09 | | | | 5,401 | | | | 26 | | | | 1.91 | | | | 4,329 | | | | 24 | | | | 2.24 | |
| | 2,516 | | | | 14 | | | | 2.08 | | | | 2,549 | | | | 15 | | | | 2.33 | | | | 3,123 | | | | 14 | | | | 1.80 | |
| | 1,972 | | | | 23 | | | | 4.62 | | | | 1,902 | | | | 22 | | | | 4.63 | | | | 1,770 | | | | 23 | | | | 5.13 | |
| | 3,045 | | | | 22 | | | | 2.85 | | | | 3,178 | | | | 20 | | | | 2.56 | | | | 2,996 | | | | 19 | | | | 2.55 | |
| | 390 | | | | – | | | | .12 | | | | 317 | | | | – | | | | .11 | | | | 347 | | | | – | | | | .03 | |
| | 50,204 | | | | 411 | | | | 3.27 | | | | 50,592 | | | | 430 | | | | 3.40 | | | | 49,947 | | | | 423 | | | | 3.38 | |
| | | | | | | | | | | | | | | | | | | | | | | | | | | | | | | | | | |
| | 4,480 | | | | 40 | | | | 3.50 | | | | 4,259 | | | | 39 | | | | 3.70 | | | | 4,576 | | | | 41 | | | | 3.58 | |
| | 4,180 | | | | 46 | | | | 4.46 | | | | 4,376 | | | | 51 | | | | 4.56 | | | | 4,635 | | | | 53 | | | | 4.62 | |
| | 825 | | | | 5 | | | | 2.61 | | | | 874 | | | | 4 | | | | 1.83 | | | | 1,170 | | | | 5 | | | | 1.68 | |
| | 227 | | | | 2 | | | | 3.81 | | | | 225 | | | | 2 | | | | 3.79 | | | | 223 | | | | 2 | | | | 3.79 | |
| | 671 | | | | 7 | | | | 4.18 | | | | 671 | | | | 7 | | | | 4.20 | | | | 671 | | | | 7 | | | | 4.18 | |
| | 357 | | | | 3 | | | | 2.82 | | | | 359 | | | | 2 | | | | 2.89 | | | | 361 | | | | 3 | | | | 2.83 | |
| | 10,740 | | | | 103 | | | | 3.83 | | | | 10,764 | | | | 105 | | | | 3.90 | | | | 11,636 | | | | 111 | | | | 3.82 | |
| | 60,944 | | | | 514 | | | | 3.37 | | | | 61,356 | | | | 535 | | | | 3.49 | | | | 61,583 | | | | 534 | | | | 3.47 | |
| | | | | | | | | | | | | | | | | | | | | | | | | | | | | | | | | | |
| | 79,250 | | | | 872 | | | | 4.30 | | | | 77,131 | | | | 927 | | | | 4.75 | | | | 69,286 | | | | 789 | | | | 4.51 | |
| | 18,514 | | | | 249 | | | | 5.26 | | | | 18,440 | | | | 270 | | | | 5.78 | | | | 16,818 | | | | 220 | | | | 5.19 | |
| | 6,774 | | | | 76 | | | | 4.45 | | | | 6,586 | | | | 81 | | | | 4.96 | | | | 6,377 | | | | 76 | | | | 4.74 | |
| | 60,570 | | | | 705 | | | | 4.63 | | | | 59,832 | | | | 695 | | | | 4.67 | | | | 57,148 | | | | 679 | | | | 4.78 | |
| | 15,575 | | | | 202 | | | | 5.18 | | | | 15,932 | | | | 216 | | | | 5.44 | | | | 14,927 | | | | 209 | | | | 5.59 | |
| | 180,683 | | | | 2,104 | | | | 4.59 | | | | 177,921 | | | | 2,189 | | | | 4.90 | | | | 164,556 | | | | 1,973 | | | | 4.78 | |
| | 2,956 | | | | 32 | | | | 4.34 | | | | 3,016 | | | | 45 | | | | 6.00 | | | | 2,910 | | | | 50 | | | | 6.89 | |
| | 1,601 | | | | 5 | | | | 1.22 | | | | 1,666 | | | | 6 | | | | 1.45 | | | | 1,821 | | | | 7 | | | | 1.58 | |
| | 6,422 | | | | 51 | | | | 3.27 | | | | 6,173 | | | | 56 | | | | 3.62 | | | | 6,864 | | | | 64 | | | | 3.71 | |
| | 252,606 | | | | 2,706 | | | | 4.24 | | | | 250,132 | | | | 2,831 | | | | 4.51 | | | | 237,734 | | | | 2,628 | | | | 4.41 | |
| | | | | | | | | | | | | | | | | | | | | | | | | | | | | | | | | | |
| | (4,152 | ) | | | | | | | | | | | (4,176 | ) | | | | | | | | | | | (4,314 | ) | | | | | | | | |
| | 3,907 | | | | | | | | | | | | 3,694 | | | | | | | | | | | | 3,777 | | | | | | | | | |
| | 47,781 | | | | | | | | | | | | 46,501 | | | | | | | | | | | | 44,345 | | | | | | | | | |
| $ | 300,142 | | | | | | | | | | | $ | 296,151 | | | | | | | | | | | $ | 281,542 | | | | | | | | | |
| | | | | | | | | | | | | | | | | | | | | | | | | | | | | | | | | | |
| | | | | | | | | | | | | | | | | | | | | | | | | | | | | | | | | | |
| | | | | | | | | | | | | | | | | | | | | | | | | | | | | | | | | | |
| $ | 67,628 | | | | 36 | | | | .21 | | | $ | 66,902 | | | | 34 | | | | .21 | | | $ | 61,162 | | | | 35 | | | | .23 | |
| | 34,733 | | | | 3 | | | | .04 | | | | 34,388 | | | | 4 | | | | .04 | | | | 31,599 | | | | 3 | | | | .04 | |
| | 10,066 | | | | 2 | | | | .09 | | | | 10,008 | | | | 2 | | | | .10 | | | | 9,183 | | | | 3 | | | | .10 | |
| | 25,695 | | | | 58 | | | | .90 | | | | 27,373 | | | | 39 | | | | .57 | | | | 29,011 | | | | 58 | | | | .80 | |
| | 3,230 | | | | 4 | | | | .38 | | | | 3,577 | | | | 4 | | | | .49 | | | | 3,238 | | | | 4 | | | | .49 | |
| | 141,352 | | | | 103 | | | | .29 | | | | 142,248 | | | | 83 | | | | .24 | | | | 134,193 | | | | 103 | | | | .31 | |
| | | | | | | | | | | | | | | | | | | | | | | | | | | | | | | | | | |
| | 4,659 | | | | 2 | | | | .19 | | | | 4,937 | | | | 3 | | | | .21 | | | | 4,551 | | | | 2 | | | | .22 | |
| | 10,626 | | | | 19 | | | | .69 | | | | 10,238 | | | | 19 | | | | .74 | | | | 8,967 | | | | 18 | | | | .80 | |
| | 9,657 | | | | 53 | | | | 2.16 | | | | 10,618 | | | | 62 | | | | 2.30 | | | | 11,138 | | | | 70 | | | | 2.48 | |
| | 6,408 | | | | 76 | | | | 4.71 | | | | 7,293 | | | | 87 | | | | 4.77 | | | | 7,719 | | | | 98 | | | | 5.09 | |
| | 10,518 | | | | 7 | | | | .28 | | | | 8,229 | | | | 5 | | | | .26 | | | | 5,684 | | | | 4 | | | | .26 | |
| | 1,868 | | | | 11 | | | | 2.43 | | | | 1,809 | | | | 11 | | | | 2.25 | | | | 2,153 | | | | 11 | | | | 2.05 | |
| | 43,736 | | | | 168 | | | | 1.53 | | | | 43,124 | | | | 187 | | | | 1.72 | | | | 40,212 | | | | 203 | | | | 2.01 | |
| | 185,088 | | | | 271 | | | | .58 | | | | 185,372 | | | | 270 | | | | .58 | | | | 174,405 | | | | 306 | | | | .70 | |
| | | | | | | | | | | | | | | | | | | | | | | | | | | | | | | | | | |
| | 62,483 | | | | | | | | | | | | 60,478 | | | | | | | | | | | | 57,900 | | | | | | | | | |
| | 225 | | | | | | | | | | | | 243 | | | | | | | | | | | | 240 | | | | | | | | | |
| | 11,590 | | | | | | | | | | | | 10,375 | | | | | | | | | | | | 11,186 | | | | | | | | | |
| | 40,756 | | | | | | | | | | | | 39,683 | | | | | | | | | | | | 37,811 | | | | | | | | | |
| $ | 300,142 | | | | | | | | | | | $ | 296,151 | | | | | | | | | | | $ | 281,542 | | | | | | | | | |
| | | | | | | | | 3.66 | | | | | | | | | | | | 3.93 | | | | | | | | | | | | 3.71 | |
| | | | | | | | | | .16 | | | | | | | | | | | | .15 | | | | | | | | | | | | .19 | |
| | | | | $ | 2,435 | | | | 3.82 | % | | | | | | $ | 2,561 | | | | 4.08 | % | | | | | | $ | 2,322 | | | | 3.90 | % |
Loan fees for the six months ended June 30, 2013 and June 30, 2012 were $110 million and $105 million, respectively. Loan fees for the three months ended June 30, 2013, March 31, 2013, December 31, 2012, September 30, 2012,and June 30, 2012 and March 31, 2012 were $58 million, $52 million, $57 million, $55 million,and $56 million and $49 million, respectively.
Interest income includes the effects of taxable-equivalent adjustments using a statutory federal income tax rate of 35% to increase tax-exempt interest income to a taxable-equivalent basis. The taxable-equivalent adjustments to interest income for the six months ended June 30, 2013 and June 30, 2012 were $80 million and $66 million, respectively. The taxable-equivalent adjustments to interest income for the three months ended June 30, 2013, March 31, 2013, December 31, 2012, September 30, 2012,and June 30, 2012 and March 31, 2012 were $40 million, $42 million, $36 million, $35$40 million, and $31$35 million, respectively.
The PNC Financial Services Group, Inc. –Form 10-Q 151163
PartPART II – Other InformationOTHER INFORMATION
ITEM 1. LEGAL PROCEEDINGS
See the information set forth in Note 17 Legal Proceedings in the Notes To Consolidated Financial Statements under Part I, Item 1 of this Report, which is incorporated by reference in response to this item.
ITEM 1A. RISK FACTORS
There are no material changes from any of the risk factors previously disclosed in PNC’s 2012 Form 10-K in response to Part I, Item 1A.
ITEM 2. UNREGISTERED SALES OF EQUITY SECURITIES AND USE OF PROCEEDS
(c) Details of our repurchases of PNC common stock during the firstsecond quarter of 2013 are included in the following table:
In thousands, except per share data
| | | | | | | | | | | | | | |
| 2013 period | | Total shares
purchased (a) | | | Average
price
paid per
share | | | Total shares
purchased as part of
publicly
announced
programs (b) | | Maximum
number
of shares
that may
yet be
purchased
under the
programs (b) | |
January 1 – 31 | | | 12 | | | $ | 60.95 | | | | | | 21,551 | |
February 1 – 28 | | | 362 | | | $ | 62.45 | | | | | | 21,551 | |
March 1 – 31 | | | 16 | | | $ | 62.37 | | | | | | 21,551 | |
Total | | | 390 | | | $ | 62.40 | | | | | | | |
| | | | | | | | | | | | |
| 2013 period | | Total shares
purchased (a) | | Average price
paid per
share | | | Total shares
purchased as part of publicly
announced
programs
(b) | | Maximum number of shares that may yet be purchased
under the programs
(b) | |
April 1 – 30 | | 34 | | $ | 59.63 | | | | | | 21,551 | |
May 1 – 31 | | 18 | | $ | 61.81 | | | | | | 21,551 | |
June 1 – 30 | | 19 | | $ | 62.07 | | | | | | 21,551 | |
Total | | 71 | | $ | 60.85 | | | | | | | |
| (a) | Reflects PNC common stock purchased in connection with our various employee benefit plans. No shares were purchased under the program referred to in note (b) to this table during the firstsecond quarter of 2013. Note 15 Employee Benefit Plans and Note 16 Stock Based Compensation Plans in the Notes toTo Consolidated Financial Statements in Item 8 of our 2012 Annual Report on Form 10-K include additional information regarding our employee benefit plans that use PNC common stock. |
| (b) | Our current stock repurchase program allows us to purchase up to 25 million shares on the open market or in privately negotiated transactions. This program was authorized on October 4, 2007 and will remain in effect until fully utilized or until modified, superseded or terminated. The extent and timing of share repurchases under this program will depend on a number of factors including, among others, market and general economic conditions, economic capital and regulatory capital considerations, alternative uses of capital, the potential impact on our credit ratings, and contractual and regulatory limitations, including the impact of the Federal Reserve’s supervisory assessment of capital adequacy program. |
In addition to the repurchases of PNC common stock during the second quarter of 2013 included in the table above, on April 19, 2013, PNC redeemed all 1,500 shares of its Series L Preferred Stock at a price of $100,000 per share plus accrued and unpaid interest and all 6,000,000 depositary shares representing fractional interests therein at a price of $25.00 per depositary share plus accrued and unpaid interest.
152164 The PNC Financial Services Group, Inc. –Form 10-Q
ITEM 6. EXHIBITS
The following exhibit index lists Exhibits filed, or in the case of Exhibits 32.1 and 32.2 furnished, with this Quarterly Report on Form 10-Q:
EXHIBIT INDEX
| | |
| |
3.6 and 4.2810.82 | | Statement with Respect to SharesAdditional 2013 forms of Fixed-to-Floating Rate Non-Cumulative Perpetual Preferred Stock, Series R
Incorporated by reference to Exhibit 3.1 of PNC’s Current Report on Form 8-K filed May 7, 2013
employee stock option, performance unit, restricted stock and restricted share unit agreements |
| |
4.29 | | Deposit Agreement, dated May 7, 2013, between the Corporation, Computershare Trust Company, N.A., Computershare Inc. and the holders from time to time of the Depositary Receipts representing interests in the Series R preferred stock
Incorporated by reference to Exhibit 4.2 of PNC’s Current Report on Form 8-K filed May 7, 2013
|
| |
| 12.1 | | Computation of Ratio of Earnings to Fixed Charges |
| |
| 12.2 | | Computation of Ratio of Earnings to Fixed Charges and Preferred Stock Dividends |
| |
| 31.1 | | Certification of Chief Executive Officer pursuant to Section 302 of the Sarbanes-Oxley Act of 2002 |
| |
| 31.2 | | Certification of Chief Financial Officer pursuant to Section 302 of the Sarbanes-Oxley Act of 2002 |
| |
| 32.1 | | Certification by Chief Executive Officer pursuant to 18 U.S.C. Section 1350 |
| |
| 32.2 | | Certification by Chief Financial Officer pursuant to 18 U.S.C. Section 1350 |
| |
99.5 | | Amendment to April 13, 2011 consent order between The PNC Financial Services Group, Inc. and the Board of Governors of the Federal Reserve System |
| |
99.6 | | Amendment to the April 13, 2011 consent order between PNC Bank, National Association and the Office of the Comptroller of the Currency |
| |
| 101 | | Interactive Data File (XBRL) |
You can obtain copies of these Exhibits electronically at the SEC’s website at www.sec.gov or by mail from the Public Reference Section of the SEC at 100 F Street, N.E., Washington, DC 20549 at prescribed rates. The Exhibits are also available as part of this Form 10-Q on PNC’s corporate website at www.pnc.com/secfilings. Shareholders and bondholders may also obtain copies of Exhibits, without charge, by contacting Shareholder Relations at 800-843-2206 or via e-mail at investor.relations@pnc.com. The interactive data file (XBRL) exhibit is only available electronically.
The PNC Financial Services Group, Inc. –Form 10-Q153
SIGNATURE
Pursuant to the requirements of the Securities Exchange Act of 1934, the registrant has duly caused this report to be signed on May 9,August 8, 2013 on its behalf by the undersigned thereunto duly authorized.
The PNC Financial Services Group, Inc.
|
/s/ Richard J. Johnson |
Richard J. Johnson |
Executive Vice President and Chief Financial Officer |
(Principal Financial Officer) |
The PNC Financial Services Group, Inc. –Form 10-Q165
CORPORATE INFORMATION
The PNC Financial Services Group, Inc.
CORPORATE HEADQUARTERS
The PNC Financial Services Group, Inc.
One PNC Plaza, 249 Fifth Avenue
Pittsburgh, Pennsylvania 15222-2707
412-762-2000
STOCK LISTINGThe common stock of The PNC Financial Services Group, Inc. is listed on the New York Stock Exchange under the symbol PNC.
INTERNET INFORMATION The PNC Financial Services Group, Inc.’s financial reports and information about its products and services are available on the internet at www.pnc.com. We provide information for investors on our corporate website under “About PNC – Investor Relations,” such as Investor Events, Quarterly Earnings, SEC Filings, Financial Information, Financial Press Releases and Message from the CEO. Under “Investor Relations,” we will from time to time post information that we believe may be important or useful to investors. We use our Twitter account, @pncnews, as an additional way of disseminating public information from time to time to investors. We generally post the following on our corporate website shortly before or promptly following its first use or release: financially-related press releases (including earnings releases), various SEC filings, presentation materials associated with earnings and other investor conference calls or events, and access to live and taped audio from suchearnings and other investor conference calls or events. For other investor conference calls or events, we generally post presentation materials associated with such events on our corporate website prior to or promptly following the event, and when posting prior to the event, this may range from shortly before to potentially several days in advance of the event. When warranted, we will also use our website to expedite public access to time-critical information regarding PNC in advance of distribution of a press release or a filing with the SEC disclosing the same information.
Starting in 2013, PNC is required to provide additional public disclosure regarding estimated income, losses and pro forma regulatory capital ratios under supervisory hypothetical severely adverse economic scenarios in March of each year and under a PNC-developed hypothetical severely adverse economic scenario in September of each year, as well as information concerning its capital stress testing processes, pursuant to the stress testing regulations adopted by the Federal Reserve and the OCC, and is required to make certain market risk-related public disclosures under the Federal banking agencies’ final market risk capital rule that became effective on January 1, 2013 and implements the enhancements to the market risk framework adopted by the Basel Committee (commonly referred to as “Basel II.5”). Under these regulations, PNC may be able to satisfy at least a
portion of these requirements through postings on its website, and PNC expects to do so without also providing disclosure of this information through filings with the Securities and Exchange Commission.
154 The PNC Financial Services Group, Inc. –Form 10-Q
You can also find the SEC reports and corporate governance information described in the sections below in the Investor Relations section of our website.
Where we have included web addresses in this Report, such as our web address and the web address of the SEC, we have included those web addresses as inactive textual references only. Except as specifically incorporated by reference into this Report, information on those websites is not part hereof.
FINANCIAL INFORMATION We are subject to the informational requirements of the Securities Exchange Act of 1934, as amended (Exchange Act), and, in accordance with the Exchange Act, we file annual, quarterly and current reports, proxy statements, and other information with the SEC. Our SEC File Number is 001-09718. You can obtain copies of these and other filings, including exhibits, electronically at the SEC’s internet website at www.sec.gov or on PNC’s corporate internet website at www.pnc.com/secfilings. Shareholders and bond holders may also obtain copies of these filings without charge by contacting Shareholder Services at 800-982-7652 or via the online contact form at www.computershare.com/contactus for copies without exhibits, and by contacting Shareholder Relations at 800-843-2206 or via email at investor.relations@pnc.com for copies of exhibits, including financial statement and schedule exhibits where applicable. The interactive data file (XBRL) exhibit is only available electronically.
CORPORATE GOVERNANCEAT PNCInformation about our Board of Directors and its committees and corporate governance at PNC is available on PNC’s corporate website at www.pnc.com/corporategovernance. Shareholders who would like to request printed copies of PNC’s Code of Business Conduct and Ethics or our Corporate Governance Guidelines or the charters of our Board’s Audit, Nominating and Governance, Personnel and Compensation, or Risk Committees (all of which are posted on the PNC corporate website) may do so by sending their requests to PNC’s Corporate Secretary at corporate headquarters at the above address. Copies will be provided without charge to shareholders.
INQUIRIESFor financial services call 888-PNC-2265.
Individual shareholders should contact Shareholder Services at 800-982-7652.
Analysts and institutional investors should contact
William H. Callihan, Senior Vice President, Director of Investor Relations, at 412-762-8257 or via email at investor.relations@pnc.com.
166 The PNC Financial Services Group, Inc. –Form 10-Q
News media representatives and others seeking general information should contact Fred Solomon, Senior Vice President, Corporate Communications, at 412-762-4550 or via email at corporate.communications@pnc.com.
COMMON STOCK PRICES/DIVIDENDS DECLARED
The table below sets forth by quarter the range of high and low sale and quarter-end closing prices for The PNC Financial Services Group, Inc. common stock and the cash dividends declared per common share.
| | | | High | | | Low | | | Close | | | Cash
Dividends
Declared
(a) | | | High | | Low | | Close | | Cash
Dividends
Declared
(a) | |
2013 Quarter | | | | | | | | | | | | | | | | | | |
First | | $ | 66.93 | | | $ | 58.96 | | | $ | 66.50 | | | $ | .40 | | | $ | 66.93 | | | $ | 58.96 | | | $ | 66.50 | | | $ | .40 | |
Second | | | | 74.19 | | | | 63.69 | | | | 72.92 | | | | .44 | |
Total | | | | | | | | $ | .40 | | | $ | .84 | |
2012 Quarter | | | | | | | | | | | | | | | | | | |
First | | $ | 64.79 | | | $ | 56.88 | | | $ | 64.49 | | | $ | .35 | | | $ | 64.79 | | | $ | 56.88 | | | $ | 64.49 | | | $ | .35 | |
Second | | | 67.89 | | | | 55.60 | | | | 61.11 | | | | .40 | | | | 67.89 | | | | 55.60 | | | | 61.11 | | | | .40 | |
Third | | | 67.04 | | | | 56.76 | | | | 63.10 | | | | .40 | | | | 67.04 | | | | 56.76 | | | | 63.10 | | | | .40 | |
Fourth | | | 65.73 | | | | 53.36 | | | | 58.31 | | | | .40 | | | | 65.73 | | | | 53.36 | | | | 58.31 | | | | .40 | |
Total | | | | | | | | $ | 1.55 | | | $ | 1.55 | |
| (a) | Our Board approved a secondthird quarter 2013 cash dividend of $.44 per common share, which was payable on the next business day after the payment date of MayAugust 5, 2013. |
DIVIDEND POLICY Holders of PNC common stock are entitled to receive dividends when declared by the Board of Directors out of funds legally available for this purpose. Our Board of
Directors may not pay or set apart dividends on the common stock until dividends for all past dividend periods on any series of outstanding preferred stock have been paid or declared and set apart for payment. The Board presently intends to continue the policy of paying quarterly cash dividends. The amount of any future dividends will depend on economic and market conditions, our financial condition and operating results, and other factors, including contractual restrictions and applicable government regulations and policies (such as those relating to the ability of bank and non-bank subsidiaries to pay dividends to the parent company and regulatory capital limitations, including the impact of the Federal Reserve’s supervisory assessment of capital adequacy program).
DIVIDEND REINVESTMENT AANDND STOCK PURCHASE PLAN
The PNC Financial Services Group, Inc. Dividend Reinvestment and Stock Purchase Plan enables holders of our common and preferred Series B stock to conveniently purchase additional shares of common stock. You can obtain a prospectus and enrollment form by contacting Shareholder Services at 800-982-7652.
REGISTRAR AANDND STOCK TRANSFER AGENT
Computershare Trust Company, N.A.
250 Royall Street
Canton, MA 02021
800-982-7652
The PNC Financial Services Group, Inc. –Form 10-Q 155167