UNITED STATES SECURITIES AND EXCHANGE COMMISSION
WASHINGTON, D.C. 20549
FORM10-Q
(Mark One)
| þ | QUARTERLY REPORT PURSUANT TO SECTION 13 OR 15(d) OF THE SECURITIES EXCHANGE ACT OF 1934 |
FOR THE QUARTERLY PERIOD ENDED MARCH 31,JUNE 30, 2013
| ¨ | TRANSITION REPORT PURSUANT TO SECTION 13 OR 15(d) OF THE SECURITIES EXCHANGE ACT OF 1934 |
FOR THE TRANSITION PERIOD FROM TO
COMMISSION FILE NUMBER:001-33776
RESOLUTE FOREST PRODUCTS INC.
(Exact name of registrant as specified in its charter)
| Delaware | 98-0526415 | |||
| (State or other jurisdiction of incorporation or organization) | (I.R.S. employer identification number) |
111 Duke Street, Suite 5000; Montreal, Quebec; Canada H3C 2M1
(Address of principal executive offices) (Zip Code)
(514)875-2515
(Registrant’s telephone number, including area code)
(Former name, former address and former fiscal year, if changed since last report)
Indicate by check mark whether the registrant (1) has filed all reports required to be filed by Section 13 or 15(d) of the Securities Exchange Act of 1934 during the preceding 12 months (or for such shorter period that the registrant was required to file such reports), and (2) has been subject to such filing requirements for the past 90 days. Yesþ No¨
Indicate by check mark whether the registrant has submitted electronically and posted on its corporate Website, if any, every Interactive Data File required to be submitted and posted pursuant to Rule 405 of RegulationS-T (§232.405 of this chapter) during the preceding 12 months (or for such shorter period that the registrant was required to submit and post such files). Yesþ No¨
Indicate by check mark whether the registrant is a large accelerated filer, an accelerated filer, anon-accelerated filer or a smaller reporting company. See the definitions of “large accelerated filer,” “accelerated filer” and “smaller reporting company” in Rule12b-2 of the Exchange Act.
| Large accelerated filer þ | Accelerated filer ¨ | Non-accelerated filer¨ | Smaller reporting company ¨ | |||
(Do not check if a smaller reporting company) |
Indicate by check mark whether the registrant is a shell company (as defined in Rule12b-2 of the Exchange Act). Yes¨ Noþ
Indicate by check mark whether the registrant has filed all documents and reports required to be filed by Sections 12, 13 or 15(d) of the Securities Exchange Act of 1934 subsequent to the distribution of securities under a plan confirmed by a court. Yesþ No¨
As of April 30,July 31, 2013, there were 94,762,56694,763,768 shares of Resolute Forest Products Inc. common stock outstanding.
RESOLUTE FOREST PRODUCTS INC.
| Page Number | ||||
PART I FINANCIAL INFORMATION | ||||
Item 1. Financial Statements: | ||||
| 1 | ||||
| 2 | ||||
Consolidated Balance Sheets as of | 3 | |||
| 4 | ||||
Consolidated Statements of Cash Flows for the | 5 | |||
Notes to Unaudited Interim Consolidated Financial Statements | 6 | |||
Item 2. Management’s Discussion and Analysis of Financial Condition and Results of Operations | ||||
Item 3. Quantitative and Qualitative Disclosures About Market Risk | ||||
PART II OTHER INFORMATION | ||||
CONSOLIDATED STATEMENTS OF OPERATIONS
(Unaudited, in millions, except per share amounts)
Three Months Ended March 31, | Three Months Ended June 30, | Six Months Ended June 30, | ||||||||||||||||||||||
| 2013 | 2012 | 2013 | 2012 | 2013 | 2012 | |||||||||||||||||||
Sales | $ | 1,074 | $ | 1,054 | $ | 1,107 | $ | 1,168 | $ | 2,181 | $ | 2,222 | ||||||||||||
Costs and expenses: | ||||||||||||||||||||||||
Cost of sales, excluding depreciation and amortization | 857 | 836 | 859 | 881 | 1,715 | 1,712 | ||||||||||||||||||
Depreciation and amortization | 60 | 57 | 61 | 58 | 121 | 115 | ||||||||||||||||||
Distribution costs | 123 | 121 | 130 | 133 | 253 | 254 | ||||||||||||||||||
Selling, general and administrative expenses | 44 | 32 | 44 | 41 | 88 | 73 | ||||||||||||||||||
Closure costs, impairment and other related charges | 40 | 5 | 12 | 88 | 52 | 93 | ||||||||||||||||||
Net gain on disposition of assets | – | (23) | (2) | (1) | (2) | (24) | ||||||||||||||||||
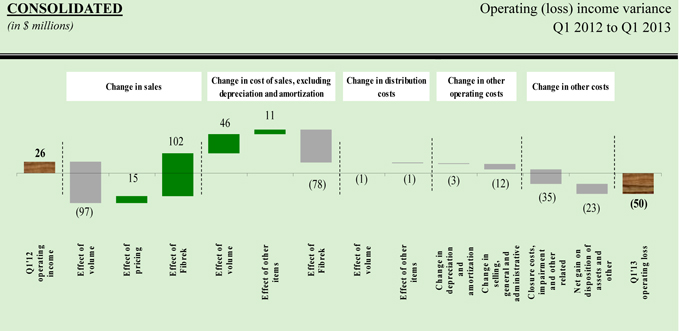
Operating (loss) income | (50) | 26 | ||||||||||||||||||||||
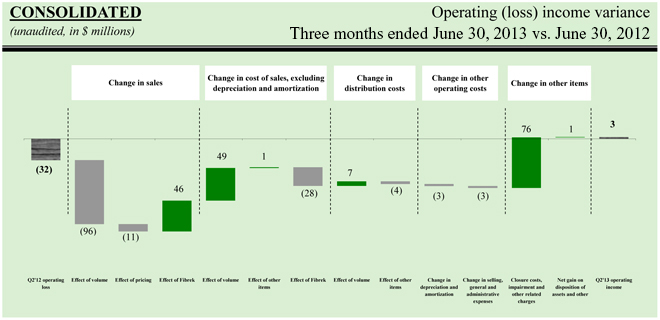
Operating income (loss) | 3 | (32) | (46) | (1) | ||||||||||||||||||||
Interest expense | (14) | (16) | (13) | (18) | (27) | (34) | ||||||||||||||||||
Other income, net | 18 | 13 | ||||||||||||||||||||||
(Loss) income before income taxes | (46) | 23 | ||||||||||||||||||||||
Income tax benefit | 41 | 10 | ||||||||||||||||||||||
Net (loss) income including noncontrolling interests | (5) | 33 | ||||||||||||||||||||||
Net income attributable to noncontrolling interests | – | (10) | ||||||||||||||||||||||
Other (expense) income, net | (65) | (10) | (47) | 3 | ||||||||||||||||||||
Loss before income taxes | (75) | (60) | (120) | (32) | ||||||||||||||||||||
Income tax benefit (provision) | 31 | (2) | 71 | 6 | ||||||||||||||||||||
Net loss including noncontrolling interests | (44) | (62) | (49) | (26) | ||||||||||||||||||||
Net loss attributable to noncontrolling interests | 1 | 45 | 1 | 35 | ||||||||||||||||||||
Net (loss) income attributable to Resolute Forest Products Inc. | $ | (5) | $ | 23 | $ | (43) | $ | (17) | $ | (48) | $ | 9 | ||||||||||||
Net (loss) income per share attributable to Resolute Forest Products Inc. common shareholders: | ||||||||||||||||||||||||
Basic | $ | (0.05) | $ | 0.23 | $ | (0.45) | $ | (0.17) | $ | (0.51) | $ | 0.09 | ||||||||||||
Diluted | (0.05) | 0.23 | (0.45) | (0.17) | (0.51) | 0.09 | ||||||||||||||||||
Weighted-average number of Resolute Forest Products Inc. common shares outstanding: | �� | |||||||||||||||||||||||
Basic | 94.8 | 97.1 | 94.8 | 98.9 | 94.8 | 98.0 | ||||||||||||||||||
Diluted | 94.8 | 97.1 | 94.8 | 98.9 | 94.8 | 98.0 | ||||||||||||||||||
See accompanying notes to unaudited interim consolidated financial statements.
CONSOLIDATED STATEMENTS OF COMPREHENSIVE (LOSS) INCOME
(Unaudited, in millions)
Three Months Ended March 31, | ||||||||
| 2013 | 2012 | |||||||
Net (loss) income including noncontrolling interests | $ | (5) | $ 33 | |||||
Other comprehensive (loss) income: | ||||||||
Change in unamortized prior service costs and credits, net of tax of $0 in both 2013 and 2012 | (1) | 2 | ||||||
Change in unamortized actuarial gains and losses, net of tax of $2 and $0 in 2013 and 2012, respectively | 4 | (2) | ||||||
Foreign currency translation | (2) | 3 | ||||||
Other comprehensive income, net of tax | 1 | 3 | ||||||
Comprehensive (loss) income including noncontrolling interests | (4) | 36 | ||||||
Less: Comprehensive income attributable to noncontrolling interests: | ||||||||
Net income | – | (10) | ||||||
Comprehensive income attributable to noncontrolling interests | – | (10) | ||||||
Comprehensive (loss) income attributable to Resolute Forest Products Inc. | $ | (4) | $ 26 | |||||
| Three Months Ended June 30, | Six Months Ended June 30, | |||||||||||||||
| 2013 | 2012 | 2013 | 2012 | |||||||||||||
Net loss including noncontrolling interests | $ | (44) | $ | (62) | $ | (49) | $ | (26) | ||||||||
Other comprehensive (loss) income: | ||||||||||||||||
Change in unamortized prior service credits and costs, net of tax of $5 for both the three and six months ended June 30, 2013 and $0 for both the three and six months ended June 30, 2012 | (13) | 9 | (14) | 11 | ||||||||||||
Change in unamortized actuarial losses, net of tax of $11 and $13 for the three and six months ended June 30, 2013, respectively, and $0 for both the three and six months ended June 30, 2012 | 20 | (19) | 24 | (21) | ||||||||||||
Foreign currency translation | (3) | (5) | (5) | (2) | ||||||||||||
Other comprehensive income (loss), net of tax | 4 | (15) | 5 | (12) | ||||||||||||
Comprehensive loss including noncontrolling interests | (40) | (77) | (44) | (38) | ||||||||||||
Less: Comprehensive loss attributable to noncontrolling interests: | ||||||||||||||||
Net loss | 1 | 45 | 1 | 35 | ||||||||||||
Change in unamortized actuarial losses, net of tax of $0 for both the three and six months ended June 30, 2012 | – | 5 | – | 5 | ||||||||||||
Foreign currency translation | – | 3 | – | 3 | ||||||||||||
Comprehensive loss attributable to noncontrolling interests | 1 | 53 | 1 | 43 | ||||||||||||
Comprehensive (loss) income attributable to Resolute Forest Products Inc. | $ | (39) | $ | (24) | $ | (43) | $ | 5 | ||||||||
See accompanying notes to unaudited interim consolidated financial statements.
CONSOLIDATED BALANCE SHEETS
(Unaudited, in millions, except per share amount)
| March 31, 2013 | December 31, 2012 | June 30, 2013 | December 31, 2012 | |||||||||||||
Assets | ||||||||||||||||
Current assets: | ||||||||||||||||
Cash and cash equivalents | $ 215 | $ 263 | $ | 248 | $ | 263 | ||||||||||
Accounts receivable, net: | ||||||||||||||||
Trade | 586 | 576 | 586 | 576 | ||||||||||||
Other | 121 | 121 | 112 | 121 | ||||||||||||
Inventories, net | 584 | 545 | 525 | 545 | ||||||||||||
Deferred income tax assets | 55 | 56 | 54 | 56 | ||||||||||||
Other current assets | 71 | 58 | 79 | 69 | ||||||||||||
Total current assets | 1,632 | 1,619 | 1,604 | 1,630 | ||||||||||||
Fixed assets, net | 2,386 | 2,440 | 2,354 | 2,440 | ||||||||||||
Amortizable intangible assets, net | 68 | 69 | 67 | 69 | ||||||||||||
Deferred income tax assets | 1,957 | 2,002 | 1,932 | 2,000 | ||||||||||||
Other assets | 188 | 194 | 191 | 194 | ||||||||||||
Total assets | $ 6,231 | $ 6,324 | $ | 6,148 | $ | 6,333 | ||||||||||
Liabilities and equity | ||||||||||||||||
Current liabilities: | ||||||||||||||||
Accounts payable and accrued liabilities | $ 592 | $ 581 | $ | 550 | $ | 581 | ||||||||||
Current portion of long-term debt | 3 | 2 | 2 | 2 | ||||||||||||
Total current liabilities | 595 | 583 | 552 | 583 | ||||||||||||
Long-term debt, net of current portion | 529 | 532 | 602 | 532 | ||||||||||||
Pension and other postretirement benefit obligations | 1,891 | 1,946 | 1,813 | 1,946 | ||||||||||||
Deferred income tax liabilities | 28 | 75 | 25 | 75 | ||||||||||||
Other long-term liabilities | 69 | 72 | 66 | 72 | ||||||||||||
Total liabilities | 3,112 | 3,208 | 3,058 | 3,208 | ||||||||||||
Commitments and contingencies | ||||||||||||||||
Equity: | ||||||||||||||||
Resolute Forest Products Inc. shareholders’ equity: | ||||||||||||||||
Common stock, $0.001 par value. 117.0 shares issued and 94.8 shares outstanding as of March 31, 2013 and December 31, 2012 | – | – | ||||||||||||||
Common stock, $0.001 par value. 117.0 shares issued and 94.8 shares outstanding as of June 30, 2013 and December 31, 2012 | – | – | ||||||||||||||
Additional paid-in capital | 3,746 | 3,730 | 3,748 | 3,730 | ||||||||||||
Retained earnings | 33 | 38 | ||||||||||||||
(Deficit) retained earnings | (1) | 47 | ||||||||||||||
Accumulated other comprehensive loss | (613) | (614) | (609) | (614) | ||||||||||||
Treasury stock at cost, 22.2 shares as of March 31, 2013 and December 31, 2012 | (61) | (61) | ||||||||||||||
Treasury stock at cost, 22.2 shares as of June 30, 2013 and December 31, 2012 | (61) | (61) | ||||||||||||||
Total Resolute Forest Products Inc. shareholders’ equity | 3,105 | 3,093 | 3,077 | 3,102 | ||||||||||||
Noncontrolling interests | 14 | 23 | 13 | 23 | ||||||||||||
Total equity | 3,119 | 3,116 | 3,090 | 3,125 | ||||||||||||
Total liabilities and equity | $ 6,231 | $ 6,324 | $ | 6,148 | $ | 6,333 | ||||||||||
See accompanying notes to unaudited interim consolidated financial statements.
CONSOLIDATED STATEMENTS OF CHANGES IN EQUITY
(Unaudited, in millions)
| Three Months Ended March 31, 2013 | Six Months Ended June 30, 2013 | |||||||||||||||||||||||||||||||||||||||||||||||||||||||
| Resolute Forest Products Inc. Shareholders’ Equity | Resolute Forest Products Inc. Shareholders’ Equity | |||||||||||||||||||||||||||||||||||||||||||||||||||||||
| Common Stock | Additional Paid-In Capital | Retained Earnings | Accumulated Other Comprehensive Loss | Treasury Stock | Non-controlling Interests | Total Equity | Common Stock | Additional Paid-In Capital | Retained Earnings (Deficit) | Accumulated Other Comprehensive Loss | Treasury Stock | Non- controlling Interests | Total Equity | |||||||||||||||||||||||||||||||||||||||||||
Balance as of December 31, 2012 | $ | – | $ | 3,730 | $ | 38 | $ | (614) | $ | (61) | $ | 23 | $ | 3,116 | $ | – | $ | 3,730 | $ | 47 | $ | (614) | $ | (61) | $ | 23 | $ | 3,125 | ||||||||||||||||||||||||||||
Share-based compensation costs for equity-classified awards | – | 2 | – | – | – | – | 2 | – | 4 | – | – | – | – | 4 | ||||||||||||||||||||||||||||||||||||||||||
Net loss | – | – | (5) | – | – | – | (5) | – | – | (48) | – | – | (1) | (49) | ||||||||||||||||||||||||||||||||||||||||||
Contribution of capital from noncontrolling interest | – | – | – | – | – | 5 | 5 | |||||||||||||||||||||||||||||||||||||||||||||||||
Acquisition of noncontrolling interest (Note 4 and Note 11) | – | 14 | – | – | – | (14) | – | |||||||||||||||||||||||||||||||||||||||||||||||||
Contribution of capital from noncontrolling interest (Note 12) | – | – | – | – | – | 5 | 5 | |||||||||||||||||||||||||||||||||||||||||||||||||
Acquisition of noncontrolling interest (Note 5 and Note 12) | – | 14 | – | – | – | (14) | – | |||||||||||||||||||||||||||||||||||||||||||||||||
Other comprehensive income, net of tax | – | – | – | 1 | – | – | 1 | – | – | – | 5 | – | – | 5 | ||||||||||||||||||||||||||||||||||||||||||
Balance as of March 31, 2013 | $ | – | $ | 3,746 | $ | 33 | $ | (613) | $ | (61) | $ | 14 | $ | 3,119 | ||||||||||||||||||||||||||||||||||||||||||
Balance as of June 30, 2013 | $ | – | $ | 3,748 | $ | (1) | $ | (609) | $ | (61) | $ | 13 | $ | 3,090 | ||||||||||||||||||||||||||||||||||||||||||
| Three Months Ended March 31, 2012 | ||||||||||||||||||||||||||||
| Resolute Forest Products Inc. Shareholders’ Equity | ||||||||||||||||||||||||||||
| Common Stock | Additional Paid-In Capital | Retained Earnings | Accumulated Other Comprehensive Loss | Treasury Stock | Non-controlling Interests | Total Equity | ||||||||||||||||||||||
Balance as of December 31, 2011 | $ | – | $ | 3,687 | $ | 41 | $ | (311) | $ | – | $ | 60 | $ | 3,477 | ||||||||||||||
Share-based compensation costs for equity-classified awards | – | 1 | – | – | – | – | 1 | |||||||||||||||||||||
Net income | – | – | 23 | – | – | 10 | 33 | |||||||||||||||||||||
Other comprehensive income, net of tax | – | – | – | 3 | – | – | 3 | |||||||||||||||||||||
Balance as of March 31, 2012 | $ | – | $ | 3,688 | $ | 64 | $ | (308) | $ | – | $ | 70 | $ | 3,514 | ||||||||||||||
| Six Months Ended June 30, 2012 | ||||||||||||||||||||||||||||
| Resolute Forest Products Inc. Shareholders’ Equity | ||||||||||||||||||||||||||||
| Common Stock | Additional Paid-In Capital | Retained Earnings | Accumulated Other Comprehensive Loss | Treasury Stock | Non- controlling Interests | Total Equity | ||||||||||||||||||||||
Balance as of December 31, 2011 | $ | �� | $ | 3,687 | $ | 47 | $ | (311) | $ | – | $ | 60 | $ | 3,483 | ||||||||||||||
Share-based compensation costs for equity-classified awards | – | 3 | – | – | – | – | 3 | |||||||||||||||||||||
Net income (loss) | – | – | 9 | – | – | (35) | (26) | |||||||||||||||||||||
Acquisition of Fibrek Inc. (2.8 shares) (Note 2) | – | 36 | – | – | – | 31 | 67 | |||||||||||||||||||||
Purchases of treasury stock (1.1 shares) (Note 14) | – | – | – | – | (12) | – | (12) | |||||||||||||||||||||
Dividend paid to noncontrolling interest | – | – | – | – | – | (1) | (1) | |||||||||||||||||||||
Other comprehensive loss, net of tax | – | – | – | (4) | – | (8) | (12) | |||||||||||||||||||||
Balance as of June 30, 2012 | $ | – | $ | 3,726 | $ | 56 | $ | (315) | $ | (12) | $ | 47 | $ | 3,502 | ||||||||||||||
See accompanying notes to unaudited interim consolidated financial statements.
CONSOLIDATED STATEMENTS OF CASH FLOWS
(Unaudited, in millions)
| Three Months Ended March 31, | Six Months Ended June 30, | |||||||||||||||||
| 2013 | 2012 | 2013 | 2012 | |||||||||||||||
Cash flows from operating activities: | ||||||||||||||||||
Net (loss) income including noncontrolling interests | $ | (5) | $ | 33 | ||||||||||||||
Adjustments to reconcile net (loss) income including noncontrolling interests to net cash (used in) provided by operating activities: | ||||||||||||||||||
Net loss including noncontrolling interests | $ | (49) | $ | (26) | ||||||||||||||
Adjustments to reconcile net loss including noncontrolling interests to net cash provided by operating activities: | ||||||||||||||||||
Share-based compensation | 2 | 1 | 4 | 3 | ||||||||||||||
Depreciation and amortization | 60 | 57 | 121 | 115 | ||||||||||||||
Closure costs, impairment and other related charges | 37 | 5 | 46 | 93 | ||||||||||||||
Inventory write-downs related to closures | 4 | – | 5 | 7 | ||||||||||||||
Deferred income taxes | (41) | (14) | (71) | – | ||||||||||||||
Net pension contributions | (16) | (18) | (35) | (35) | ||||||||||||||
Net gain on disposition of assets | – | (23) | (2) | (24) | ||||||||||||||
Loss (gain) on translation of foreign currency denominated deferred income taxes | 35 | (30) | 80 | (6) | ||||||||||||||
(Gain) loss on translation of foreign currency denominated pension and other postretirement benefit obligations | (35) | 24 | (78) | 5 | ||||||||||||||
Note payable forgiveness gain (Note 4) | (12) | – | ||||||||||||||||
Note payable forgiveness gain (Note 5) | (12) | – | ||||||||||||||||
Net loss on extinguishment of debt (Note 10) | 59 | – | ||||||||||||||||
Net planned major maintenance (Note 1) | (7) | (9) | ||||||||||||||||
Dividends received from equity method investees in excess of income | 3 | – | ||||||||||||||||
Changes in working capital: | ||||||||||||||||||
Accounts receivable | (9) | 56 | (5) | 75 | ||||||||||||||
Inventories | (43) | (26) | 14 | 8 | ||||||||||||||
Other current assets | (11) | (5) | (2) | 2 | ||||||||||||||
Accounts payable and accrued liabilities | 18 | (9) | (16) | (36) | ||||||||||||||
Other, net | (4) | 6 | (7) | 1 | ||||||||||||||
Net cash (used in) provided by operating activities | (20) | 57 | ||||||||||||||||
Net cash provided by operating activities | 48 | 173 | ||||||||||||||||
Cash flows from investing activities: | ||||||||||||||||||
Cash invested in fixed assets | (40) | (39) | (86) | (58) | ||||||||||||||
Disposition of assets | 2 | 26 | 3 | 26 | ||||||||||||||
Proceeds from insurance settlements | 4 | – | ||||||||||||||||
Acquisition of Fibrek Inc., net of cash acquired (Note 2) | – | (24) | ||||||||||||||||
Decrease in restricted cash | 2 | 4 | 3 | 76 | ||||||||||||||
Decrease (increase) in deposit requirements for letters of credit, net | 1 | (7) | 1 | (7) | ||||||||||||||
Net cash used in investing activities | (35) | (16) | ||||||||||||||||
Net cash (used in) provided by investing activities | (75) | 13 | ||||||||||||||||
Cash flows from financing activities: | ||||||||||||||||||
Issuance of long-term debt | 594 | – | ||||||||||||||||
Premium paid on extinguishment of debt | (84) | – | ||||||||||||||||
Purchases of treasury stock | – | (12) | ||||||||||||||||
Dividends and distribution to noncontrolling interests | – | (1) | ||||||||||||||||
Acquisition of noncontrolling interest | – | (17) | ||||||||||||||||
Payments of debt | (1) | – | (497) | (15) | ||||||||||||||
Payments of financing and credit facility fees | (9) | – | ||||||||||||||||
Contribution of capital from noncontrolling interest | 8 | – | 8 | – | ||||||||||||||
Net cash provided by financing activities | 7 | – | ||||||||||||||||
Net cash provided by (used in) financing activities | 12 | (45) | ||||||||||||||||
Net (decrease) increase in cash and cash equivalents | (48) | 41 | (15) | 141 | ||||||||||||||
Cash and cash equivalents: | ||||||||||||||||||
Beginning of period | 263 | 369 | 263 | 369 | ||||||||||||||
End of period | $ | 215 | $ | 410 | $ | 248 | $ | 510 | ||||||||||
See accompanying notes to unaudited interim consolidated financial statements.
Notes to Unaudited Interim Consolidated Financial Statements
Note 1. Organization and Basis of Presentation
Nature of operations
Resolute Forest Products Inc. (with its subsidiaries and affiliates, either individually or collectively, unless otherwise indicated, referred to as “Resolute Forest Products,” “we,” “our,” “us” or the “Company”) is incorporated in Delaware. We are a global leader in the forest products industry;industry, operating pulp and paper mills and wood products facilities in the United States, Canada and South Korea, and power generation assets in Canada. We offer a diverse range of products, including newsprint, coated papers, specialty papers, market pulp and wood products.
Financial statements
Our interim consolidated financial statements are unaudited and have been prepared in accordance with the requirements of the United States Securities and Exchange Commission (the “SEC”) for interim reporting. Under those rules, certain footnotes and other financial information that are normally required by United States generally accepted accounting principles (“U.S. GAAP”) may be condensed or omitted. In our opinion, all adjustments (consisting of normal recurring adjustments) necessary for the fair presentation of the unaudited interim consolidated financial statements have been made. All amounts are expressed in U.S. dollars, unless otherwise indicated. The results for the interim period ended March 31,June 30, 2013 are not necessarily indicative of the results to be expected for the full year. These unaudited interim consolidated financial statements should be read in conjunction with our Annual Report on Form10-K for the year ended December 31, 2012, filed with the SEC on March 1, 2013. Certain
Change in accounting policy for repairs and maintenance costs
In the second quarter of 2013, we changed our accounting policy for repairs and maintenance costs associated with planned major maintenance activities. Previously, all repairs and maintenance costs, including those associated with planned major maintenance, were expensed as incurred. We elected to change our accounting policy for planned major maintenance costs to the deferral method, whereby the costs of each planned major maintenance activity will be amortized on a straight-line basis over the estimated period until the next planned major maintenance activity. All other routine repairs and maintenance costs will continue to be expensed as incurred. We believe that the deferral method is preferable as the economic benefit associated with planned major maintenance activities are more appropriately recognized over the period of future benefit, which is not limited to the period the expense is incurred. In addition, the deferral method will enhance the comparability of our financial results with our peer companies. In accordance with Financial Accounting Standards Board (“FASB”) Accounting Standards Codification (“ASC”) 250, “Accounting Changes and Error Corrections,” we have applied the change in accounting policy retroactively by adjusting our comparative consolidated financial statements for the effect of this change. As a result of the change, retained earnings as of December 31, 2011 increased by $6 million, which represents the cumulative effect of the change on prior period amountsperiods.
RESOLUTE FOREST PRODUCTS INC.
Notes to Unaudited Interim Consolidated Financial Statements
The effect of the change in accounting policy on our Consolidated Statements of Operations for the three months ended June 30, 2013 and 2012 was as follows:
| Three Months Ended June 30, 2013 | Three Months Ended June 30, 2012 | |||||||||||||||||||||||
| (Unaudited, in millions, except per share amounts) | Before Accounting Policy Change | Adjustment | As Reported | As Previously Reported | Effect of Change | As Adjusted | ||||||||||||||||||
Cost of sales, excluding depreciation and amortization | $ | 865 | $ | (6) | $ | 859 | $ | 885 | $ | (4) | $ | 881 | ||||||||||||
Loss before income taxes | (81) | 6 | (75) | (64) | 4 | (60) | ||||||||||||||||||
Income tax benefit (provision) | 34 | (3) | 31 | (1) | (1) | (2) | ||||||||||||||||||
Net loss including noncontrolling interests | (47) | 3 | (44) | (65) | 3 | (62) | ||||||||||||||||||
Net loss attributable to Resolute Forest Products Inc. | (46) | 3 | (43) | (20) | 3 | (17) | ||||||||||||||||||
Basic net loss per share attributable to Resolute Forest Products Inc. | (0.48) | 0.03 | (0.45) | (0.20) | 0.03 | (0.17) | ||||||||||||||||||
Diluted net loss per share attributable to Resolute Forest Products Inc. | (0.48) | 0.03 | (0.45) | (0.20) | 0.03 | (0.17) | ||||||||||||||||||
Comprehensive loss attributable to Resolute Forest Products Inc. | (42) | 3 | (39) | (27) | 3 | (24) | ||||||||||||||||||
The effect of the change in accounting policy on our Consolidated Statements of Operations for the six months ended June 30, 2013 and 2012 was as follows:
| Six Months Ended June 30, 2013 | Six Months Ended June 30, 2012 | |||||||||||||||||||||||
| (Unaudited, in millions, except per share amounts) | Before Accounting Policy Change | Adjustment | As Reported | As Previously Reported | Effect of Change | As Adjusted | ||||||||||||||||||
Cost of sales, excluding depreciation and amortization | $ | 1,722 | $ | (7) | $ | 1,715 | $ | 1,721 | $ | (9) | $ | 1,712 | ||||||||||||
Loss before income taxes | (127) | 7 | (120) | (41) | 9 | (32) | ||||||||||||||||||
Income tax benefit | 75 | (4) | 71 | 9 | (3) | 6 | ||||||||||||||||||
Net loss including noncontrolling interests | (52) | 3 | (49) | (32) | 6 | (26) | ||||||||||||||||||
Net (loss) income attributable to Resolute Forest Products Inc. | (51) | 3 | (48) | 3 | 6 | 9 | ||||||||||||||||||
Basic net (loss) income per share attributable to Resolute Forest Products Inc. | (0.54) | 0.03 | (0.51) | 0.03 | 0.06 | 0.09 | ||||||||||||||||||
Diluted net (loss) income per share attributable to Resolute Forest Products Inc. | (0.54) | 0.03 | (0.51) | 0.03 | 0.06 | 0.09 | ||||||||||||||||||
Comprehensive (loss) income attributable to Resolute Forest Products Inc. | (46) | 3 | (43) | (1) | 6 | 5 | ||||||||||||||||||
RESOLUTE FOREST PRODUCTS INC.
Notes to Unaudited Interim Consolidated Financial Statements
The effect of the change in accounting policy on our Consolidated Statement of Operations for the three months ended March 31, 2013 is as follows:
| Three Months Ended March 31, 2013 | ||||||||||||
| (Unaudited, in millions, except per share amounts) | As Previously Reported | Effect of Change | As Adjusted | |||||||||
Cost of sales, excluding depreciation and amortization | $ | 857 | $ | (1) | $ | 856 | ||||||
Loss before income taxes | (46) | 1 | (45) | |||||||||
Income tax benefit | 41 | (1) | 40 | |||||||||
Net loss including noncontrolling interests | (5) | – | (5) | |||||||||
Net loss attributable to Resolute Forest Products Inc. | (5) | – | (5) | |||||||||
Basic net loss per share attributable to Resolute Forest Products Inc. | (0.05) | – | (0.05) | |||||||||
Diluted net loss per share attributable to Resolute Forest Products Inc. | (0.05) | – | (0.05) | |||||||||
Comprehensive loss attributable to Resolute Forest Products Inc. | (4) | – | (4) | |||||||||
The effect of the change in accounting policy on our Consolidated Balance Sheets as of June 30, 2013 and December 31, 2012 was as follows:
| June 30, 2013 | December 31, 2012 | |||||||||||||||||||||||
| (Unaudited, in millions) | Before Accounting Policy Change | Adjustment | As Reported | As Previously Reported | Effect of Change | As Adjusted | ||||||||||||||||||
Other current assets | $ | 61 | $ | 18 | $ | 79 | $ | 58 | $ | 11 | $ | 69 | ||||||||||||
Deferred income tax assets(non-current) | 1,938 | (6) | 1,932 | 2,002 | (2) | 2,000 | ||||||||||||||||||
(Deficit) retained earnings | (13) | 12 | (1) | 38 | 9 | 47 | ||||||||||||||||||
There was no impact on net cash provided by operating activities for all periods as a result of the change in accounting policy.
RESOLUTE FOREST PRODUCTS INC.
Notes to Unaudited Interim Consolidated Financial Statements
Note 2. Acquisition of Fibrek Inc.
On May 2, 2012, in connection with an offer to purchase all of the issued and outstanding shares of Fibrek Inc. (“Fibrek”), a producer and marketer of virgin and recycled kraft pulp operating three mills, we acquired a controlling interest in Fibrek and began consolidating its results of operations, financial position and cash flows in our footnotesconsolidated financial statements. Fibrek’s results of operations have been reclassifiedincluded in the market pulp segment.
Our acquisition of Fibrek was achieved in stages. In connection with the offer, between April 11, 2012 and April 25, 2012, we acquired approximately 48.8% of the then outstanding Fibrek shares. We accounted for this equity interest in Fibrek as an available for sale investment since we had no ability to conformexert significant influence over Fibrek at any time prior to acquiring a controlling interest.
On May 2, 2012 (the “acquisition date”), we acquired additional shares of Fibrek, after which we owned a controlling interest in Fibrek (approximately 50.1% of the then outstanding Fibrek shares) and Fibrek became a consolidated subsidiary. As aggregate consideration for the acquisition of our controlling interest in Fibrek, we distributed 1.9 million shares of our common stock and Cdn$36 million ($36 million, based on the exchange rates in effect on each of the dates we acquired the shares of Fibrek) in cash. The acquisition of a controlling interest in Fibrek was accounted for as a business combination in accordance with the acquisition method of accounting pursuant to Financial Accounting Standards Board Accounting Standards Codification 805, “Business Combinations.” On the acquisition date, we remeasured our initial equity investment in Fibrek at the acquisition-date fair value, resulting in a loss of $1 million, which was recorded in “Other (expense) income, net” in our Consolidated Statements of Operations for the three and six months ended June 30, 2012. Additionally, “Selling, general and administrative expenses” in our Consolidated Statements of Operations for the three and six months ended June 30, 2012 included $3 million and $7 million, respectively, of transaction costs associated with the acquisition of our controlling interest in Fibrek.
Subsequent to the 2013 presentation.May 2, 2012 acquisition date and prior to June 30, 2012, we acquired additional shares of Fibrek, which we accounted for as equity transactions whereby we adjusted the carrying amount of the noncontrolling interest in Fibrek to reflect the change in our ownership interest in Fibrek. As consideration for this additional equity interest in Fibrek, we distributed approximately 0.9 million newly-issued shares of our common stock and Cdn$17 million ($17 million, based on the exchange rates in effect on each of the dates we acquired the shares of Fibrek) in cash. Transaction costs of approximately $1 million associated with this acquisition of noncontrolling interest in Fibrek were recorded in “Additionalpaid-in capital” in our Consolidated Balance Sheet as of June 30, 2012. After the purchase of this additional equity interest, we owned approximately 74.6% of the then outstanding Fibrek shares.
On July 31, 2012, we completed the second step transaction for the remaining 25.4% of the outstanding Fibrek shares. See Note 13, “Commitments and Contingencies,” for additional information.
The following unaudited pro forma information for the three and six months ended June 30, 2012 represents our results of operations as if the acquisition of Fibrek had occurred on January 1, 2012. This pro forma information does not purport to be indicative of the results that would have occurred for the periods presented or that may be expected in the future.
| (Unaudited, in millions except per share data) | Three Months Ended June 30, 2012 | Six Months Ended June 30, 2012 | ||||||
Sales | $ | 1,212 | $ | 2,387 | ||||
Net (loss) income attributable to Resolute Forest Products Inc. | (13) | 9 | ||||||
Basic net (loss) income per share attributable to Resolute Forest Products Inc. | (0.13) | 0.09 | ||||||
Diluted net (loss) income per share attributable to Resolute Forest Products Inc. | (0.13) | 0.09 | ||||||
The unaudited pro forma net (loss) income attributable to Resolute Forest Products Inc. for the three and six months ended June 30, 2012 excludes $7 million and $18 million, respectively, of both our and Fibrek’s transaction costs associated with the acquisition.
RESOLUTE FOREST PRODUCTS INC.
Notes to Unaudited Interim Consolidated Financial Statements
Note 2.3. Closure Costs, Impairment and Other Related Charges
Closure costs, impairment and other related charges for the three and six months ended March 31,June 30, 2013 were comprised of the following:
| (Unaudited, in millions) | Accelerated Depreciation | Pension Plan Settlement Gain | Severance and Other Costs | Total | Accelerated Depreciation | Pension Plan Settlement Gain | Severance and Other Costs | Total | ||||||||||||||||||||||||||||||||
Indefinite idlings: | ||||||||||||||||||||||||||||||||||||||||
Paper machine in Calhoun, Tennessee(1) | $ | 35 | $ – | $ | 2 | $ | 37 | |||||||||||||||||||||||||||||||||
Second quarter 2013 | $ 9 | $ – | $ 3 | $ 12 | ||||||||||||||||||||||||||||||||||||
First six months 2013 | 44 | – | 5 | 49 | ||||||||||||||||||||||||||||||||||||
Kraft mill and paper machine in Fort Frances, Ontario | – | – | 4 | 4 | ||||||||||||||||||||||||||||||||||||
Second quarter 2013 | – | – | – | – | ||||||||||||||||||||||||||||||||||||
First six months 2013 | – | – | 4 | 4 | ||||||||||||||||||||||||||||||||||||
Other | – | (1) | – | (1) | ||||||||||||||||||||||||||||||||||||
| $ | 35 | $ (1) | $ | 6 | $ | 40 | ||||||||||||||||||||||||||||||||||
Second quarter 2013 | – | – | – | – | ||||||||||||||||||||||||||||||||||||
First six months 2013 | – | (1) | – | (1) | ||||||||||||||||||||||||||||||||||||
Total | ||||||||||||||||||||||||||||||||||||||||
Second quarter 2013 | $ 9 | $ – | $ 3 | $ 12 | ||||||||||||||||||||||||||||||||||||
First six months 2013 | 44 | (1) | 9 | 52 | ||||||||||||||||||||||||||||||||||||
| (1) | Following our acquisition of the noncontrolling interest in Calhoun Newsprint Company (“CNC”), we indefinitely idled a paper machine at the Calhoun mill on March 12, 2013, resulting in accelerated depreciation charges to reduce the carrying value of the assets to reflect their revised estimated remaining useful lives. For additional information regarding our acquisition of the noncontrolling interest in CNC, see Note |
Closure costs, impairment and other related charges for the three and six months ended March 31,June 30, 2012 were comprised of the following:
| (Unaudited, in millions) | Pension Plan Curtailment Losses | Severance and Other Costs | Total | Impairment of Assets | Pension Plan Curtailment and Settlement Losses | Severance and Other Costs | Total | ||||||||||||||||||||||||||||
Indefinite idling: | |||||||||||||||||||||||||||||||||||
Bowater Mersey Paper Company Limited(1) | |||||||||||||||||||||||||||||||||||
Second quarter 2012 | $ 70 | $ 9 | $ 9 | $ 88 | |||||||||||||||||||||||||||||||
First six months 2012 | 70 | 9 | 9 | 88 | |||||||||||||||||||||||||||||||
Restructuring initiative: | |||||||||||||||||||||||||||||||||||
Baie-Comeau, Quebec paper mill | $ | 2 | $ | 2 | $ | 4 | |||||||||||||||||||||||||||||
Second quarter 2012 | – | 1 | (1) | – | |||||||||||||||||||||||||||||||
First six months 2012 | – | 3 | 1 | 4 | |||||||||||||||||||||||||||||||
Other | 2 | (1 | ) | 1 | |||||||||||||||||||||||||||||||
| $ | 4 | $ | 1 | $ | 5 | ||||||||||||||||||||||||||||||
Second quarter 2012 | – | – | – | – | |||||||||||||||||||||||||||||||
First six months 2012 | – | 2 | (1) | 1 | |||||||||||||||||||||||||||||||
Total | |||||||||||||||||||||||||||||||||||
Second quarter 2012 | $ 70 | $ 10 | $ 8 | $ 88 | |||||||||||||||||||||||||||||||
First six months 2012 | 70 | 14 | 9 | 93 | |||||||||||||||||||||||||||||||
| (1) | We recorded long-lived asset impairment charges (including a $7 million write-down of an asset retirement obligation for environmental liabilities) related to the indefinite idling of our operations in Bowater Mersey Paper Company Limited (our “Mersey operations”) to reduce the carrying value of our net assets to fair value less costs to sell. |
RESOLUTE FOREST PRODUCTS INC.
Notes to Unaudited Interim Consolidated Financial Statements
Note 3.4. Net Gain on Disposition of Assets
During the three months ended March 31,June 30, 2013, we sold a parcel of land in Fort Frances and various other assets for total consideration of $2 million, resulting in a net gain on disposition of assets of approximately $2 million.
During the three months ended June 30, 2012, we sold our Petit Saguenay, Quebec sawmill, our recycling division’s assets located in Phoenix, Arizona and various other assets for consideration of less than $1 million, resulting in a net gain on disposition of assets of approximately $1 million. During the six months ended June 30, 2012, we also sold a portion of our Mersey timberlands in Nova Scotia and various other assets for proceedsconsideration of $26 million, resulting in a net gain on disposition of assets of $23 million.
Note 4.5. Other (Expense) Income, Net
Other (expense) income, net for the three and six months ended March 31,June 30, 2013 and 2012 was comprised of the following:
Three Months Ended June 30, | Six Months Ended June 30, | |||||||||||||||||||||||||
| (Unaudited, in millions) | 2013 | 2012 | 2013 | 2012 | 2013 | 2012 | ||||||||||||||||||||
Foreign exchange (loss) gain | $ | (5 | ) | $ | 12 | $ (7) | $ (9) | $ (12) | $ 3 | |||||||||||||||||
Net loss on extinguishment of debt (Note 10) | (59) | – | (59) | – | ||||||||||||||||||||||
Post-emergence costs(1) | – | (2) | (1) | (3) | (1) | (5) | ||||||||||||||||||||
Note payable forgiveness gain(2) | – | – | 12 | – | ||||||||||||||||||||||
Gain on liquidation settlement(3) | – | – | 9 | – | ||||||||||||||||||||||
Income from equity method investments | – | 1 | – | 1 | – | 2 | ||||||||||||||||||||
Interest income | 1 | 1 | – | 2 | 1 | 3 | ||||||||||||||||||||
Note payable forgiveness gain(2) | 12 | – | ||||||||||||||||||||||||
Gain on liquidation settlement(3) | 9 | – | ||||||||||||||||||||||||
Miscellaneous income | 1 | 1 | ||||||||||||||||||||||||
Miscellaneous income (expense) | 2 | (1) | 3 | – | ||||||||||||||||||||||
| $ | 18 | $ | 13 | $ (65) | $ (10) | $ (47) | $ 3 | |||||||||||||||||||
| (1) | Primarily represents ongoing legal and other professional fees for the resolution and settlement of disputed creditor claims, as well as costs for other post-emergence activities associated with the creditor protection proceedings, from which we emerged on December 9, 2010. For additional information, see Note 14, “Share Capital.” |
| (2) | On March 11, 2013, we acquired the noncontrolling interest in CNC, which was previously owned 51% by us and included in our consolidated financial statements on a fully consolidated basis. As a result, CNC became a wholly-owned subsidiary of ours. In connection with this transaction, we recognized a gain on the forgiveness of a $12 million note issued by CNC. The acquisition of the noncontrolling interest in CNC was accounted for as an equity transaction. |
| (3) | On February 2, 2010, Bridgewater Paper Company Limited (“BPCL”), a subsidiary of ours, filed for administration in the United Kingdom pursuant to the United Kingdom Insolvency Act 1986, as amended. As a result, we became a creditor of BPCL and lost control over their operations. In connection with our claims, we received a liquidation settlement of $9 million in March 2013. |
RESOLUTE FOREST PRODUCTS INC.
Notes to Unaudited Interim Consolidated Financial Statements
Note 5.6. Accumulated Other Comprehensive Loss
The change in our accumulated other comprehensive loss by component (net of tax) for the threesix months ended March 31,June 30, 2013 was as follows:
| (Unaudited, in millions) | Unamortized Prior Service Credits | Unamortized Actuarial Losses | Foreign Currency Translation | Total | Unamortized Prior Service Credits(1) | Unamortized Actuarial Losses(2) | Foreign Currency Translation | Total | ||||||||||||||||||||||||||||||||
Balance as of December 31, 2012 | $ 21 | $ (640) | $ 5 | $ (614) | $ 21 | $ (640) | $ 5 | $ (614) | ||||||||||||||||||||||||||||||||
Other comprehensive loss before reclassifications | – | – | (2) | (2) | ||||||||||||||||||||||||||||||||||||
Amounts reclassified from accumulated other comprehensive loss(1) | (1) | 4 | – | 3 | ||||||||||||||||||||||||||||||||||||
Other comprehensive (loss) income before reclassifications | (13) | 16 | (5) | (2) | ||||||||||||||||||||||||||||||||||||
Amounts reclassified from accumulated other comprehensive loss(3) | (1) | 8 | – | 7 | ||||||||||||||||||||||||||||||||||||
Net current period other comprehensive (loss) income | (1) | 4 | (2) | 1 | (14) | 24 | (5) | 5 | ||||||||||||||||||||||||||||||||
Balance as of March 31, 2013 | $ 20 | $ (636) | $ 3 | $ (613) | ||||||||||||||||||||||||||||||||||||
Balance as of June 30, 2013 | $ 7 | $ (616) | $ – | $ (609) | ||||||||||||||||||||||||||||||||||||
| (1) | In the second quarter of 2013, following the restart of our previously idled Gatineau, Quebec paper mill, 119 employees were reinstated to our pension plans. As a result, “Pension and other postretirement benefit obligations” and “Accumulated other comprehensive loss” in our Consolidated Balance Sheet as of June 30, 2013 were increased by $18 million and $13 million (net of tax of $5 million), respectively. |
| (2) | In the second quarter of 2013, we recorded certain adjustments associated with our previously reported pension and other postretirement benefit (“OPEB”) obligations. As a result, “Pension and other postretirement benefit obligations” and “Accumulated other comprehensive loss” in our Consolidated Balance Sheet as of June 30, 2013 were decreased by $27 million and $17 million (net of tax of $10 million), respectively. |
| (3) | See the table below for details about these reclassifications. |
The reclassifications out of accumulated other comprehensive loss for the threesix months ended March 31,June 30, 2013 were comprised of the following:
| (Unaudited, in millions) | Amounts Reclassified from Accumulated Other Comprehensive Loss | Affected Line in the Consolidated Statements of Operations | ||
Unamortized Prior Service Credits | ||||
Amortization of prior service credits | $ (1) | Cost of sales, excluding depreciation and amortization (1) | ||
| – | Income tax benefit (provision) | |||
| ||||
| $ (1) | Net of tax | |||
| ||||
Unamortized Actuarial Losses | ||||
Amortization of actuarial losses | $ | Cost of sales, excluding depreciation and amortization (1) | ||
| Income tax benefit (provision) | ||||
| ||||
| $ | Net of tax | |||
| ||||
Total Reclassifications | $ | Net of tax | ||
| (1) | These items are included in the computation of net periodic benefit cost related to our pension and |
RESOLUTE FOREST PRODUCTS INC.
Notes to Unaudited Interim Consolidated Financial Statements
Note 6.7. Net (Loss) Income Per Share
The weighted-average number of common shares outstanding used to calculate basic and diluted net (loss) income per share attributable to Resolute Forest Products Inc. common shareholders was 94.8 million for both the three and six months ended March 31,June 30, 2013 and 97.198.9 million and 98.0 million for the three and six months ended March 31, 2012.June 30, 2012, respectively.
For the three months ended March 31, 2013 and 2012, noNo adjustments to net (loss) income attributable to Resolute Forest Products Inc. common shareholders were necessary to calculate basic and diluted net (loss) income per share.share for all periods presented.
For the three and six months ended March 31,June 30, 2013 and the three months ended June 30, 2012, option shares of 1.5 million, 1.5 million and 0.9 million, respectively, and equity-classified restricted stock units (“RSUs”) and deferred stock units (“DSUs”) of 0.8 million, 0.8 million and 0.4 million, respectively, were excluded from the calculation of diluted net loss per share as the impact would have been antidilutive. For the threesix months ended March 31,June 30, 2012, the dilutive impact of 0.9 million option shares and 0.4 million equity-classified RSUs and DSUs on the weighted-average number of common shares outstanding used to calculate diluted net incomeloss per share was nominal.
Note 7.8. Inventories, Net
Inventories, net as of March 31,June 30, 2013 and December 31, 2012 were comprised of the following:
| (Unaudited, in millions) | March 31, 2013 | December 31, 2012 | June 30, 2013 | December 31, 2012 | ||||||||||||||||
Raw materials and work in process | $ | 198 | $ | 181 | $ | 149 | $ | 181 | ||||||||||||
Finished goods | 209 | 188 | 196 | 188 | ||||||||||||||||
Mill stores and other supplies | 177 | 176 | 180 | 176 | ||||||||||||||||
| $ | 584 | $ | 545 | $ | 525 | $ | 545 | |||||||||||||
During the three months ended March 31,June 30, 2013, we recorded charges of $1 million for write-downs of inventory as a result of the indefinite idling of a paper machine in Fort Frances. During the six months ended June 30, 2013, we also recorded charges of $4 million for write-downs of inventory primarily as a result of the indefinite idling of a paper machine in Calhoun. During the three months ended June 30, 2012, we recorded charges of $7 million for write-downs of inventory as a result of the indefinite idling of our Mersey operations. These charges were included in “Cost of sales, excluding depreciation and amortization” in our Consolidated Statements of Operations.
Note 8.9. Severance Related Liabilities
The activity in our severance related liabilities for the threesix months ended March 31,June 30, 2013 was as follows:
| (Unaudited, in millions) | 2013 Initiatives | 2012 Initiatives | 2011 Initiatives | Total | 2013 Initiatives | 2012 Initiatives | 2011 Initiatives | Total | ||||||||||||||||||||||||||||||||
Balance as of December 31, 2012 | $ – | $ 13 | $ 2 | $ 15 | $ | – | $ | 13 | $ | 2 | $ | 15 | ||||||||||||||||||||||||||||
Charges | 2 | 3 | – | 5 | 4 | 3 | – | 7 | ||||||||||||||||||||||||||||||||
Payments | – | (8 | ) | (1 | ) | (9 | ) | (3 | ) | (10 | ) | (1 | ) | (14 | ) | |||||||||||||||||||||||||
Balance as of March 31, 2013 | $ 2 | $ 8 | $ 1 | $ 11 | ||||||||||||||||||||||||||||||||||||
Balance as of June 30, 2013 | $ | 1 | $ | 6 | $ | 1 | $ | 8 | ||||||||||||||||||||||||||||||||
During the threesix months ended March 31,June 30, 2013, we recorded employee termination costs primarily as a result of the indefinite idling of a paper machine in Calhoun and the indefinite idling of the kraft mill and a paper machine in Fort Frances. The majority of the remaining severance liability is expected to be paid in 2013.within one year.
Employee termination costs were included in “Cost of sales, excluding depreciation and amortization,” “Selling, general and administrative expenses” or “Closure costs, impairment and other related charges” in our Consolidated Statements of Operations. The severance accruals were included in “Accounts payable and accrued liabilities” and “Other long-term liabilities” in our Consolidated Balance Sheets.
RESOLUTE FOREST PRODUCTS INC.
Notes to Unaudited Interim Consolidated Financial Statements
Note 9.10. Long-Term Debt
Overview
Long-term debt, including current portion, as of March 31,June 30, 2013 and December 31, 2012 was comprised of the following:
| (Unaudited, in millions) | March 31, 2013 | December 31, 2012 | June 30, 2013 | December 31, 2012 | ||||||||||||
5.875% senior notes due 2023: | ||||||||||||||||
Principal amount | $ | 600 | $ | – | ||||||||||||
Unamortized discount | (6) | – | ||||||||||||||
Total senior notes due 2023 | 594 | – | ||||||||||||||
10.25% senior secured notes due 2018: | ||||||||||||||||
Principal amount | $ | 501 | $ | 501 | 5 | 501 | ||||||||||
Unamortized premium | 26 | 27 | – | 27 | ||||||||||||
Total senior secured notes due 2018 | 527 | 528 | 5 | 528 | ||||||||||||
Other debt: | ||||||||||||||||
PSIF – Investissement Quebec loan | 2 | 3 | 2 | 3 | ||||||||||||
Capital lease obligation | 3 | 3 | 3 | 3 | ||||||||||||
Total other debt | 5 | 6 | 5 | 6 | ||||||||||||
Total debt | 532 | 534 | 604 | 534 | ||||||||||||
Less: Current portion of long-term debt | (3) | (2) | (2) | (2) | ||||||||||||
Long-term debt, net of current portion | $ | 529 | $ | 532 | $ | 602 | $ | 532 | ||||||||
Senior secured notes
2023 Notes
On May 8, 2013, we issued $600 million aggregate principal amount of 5.875% senior notes due 2023 (the “2023 Notes”) pursuant to an indenture as of that date (the “indenture”). Upon their issuance, the 2023 Notes were recorded at their fair value of $594 million, which reflected a discount of $6 million that is being amortized to interest expense using the interest method over the term of the notes, resulting in an effective interest rate of 6.0%. Interest on the notes is payable semi-annually on May 15 and November 15 of each year, beginning November 15, 2013, until their maturity date of May 15, 2023.
The notes are guaranteed by our current and future wholly-owned U.S. subsidiaries (the “guarantors”). The notes are unsecured and effectively junior to indebtedness under the ABL Credit Facility (as defined and discussed below) to the extent of the value of the collateral that secures the ABL Credit Facility and to future secured indebtedness. In addition, the notes are structurally subordinated to all existing and future liabilities of our subsidiaries that do not guarantee the notes.
The terms of the indenture impose certain restrictions, subject to a number of exceptions and qualifications, including limits on our ability to: incur, assume or guarantee additional indebtedness; issue redeemable stock and preferred stock; pay dividends or make distributions or redeem or repurchase capital stock; prepay, redeem or repurchase certain debt; make loans and investments; incur liens; issue dividends, make loans or transfer assets from our subsidiaries; sell or otherwise dispose of assets, including capital stock of subsidiaries; consolidate or merge with or into, or sell substantially all of our assets to, another person; enter into transactions with affiliates; and enter into new lines of business.
RESOLUTE FOREST PRODUCTS INC.
Notes to Unaudited Interim Consolidated Financial Statements
At any time prior to May 15, 2017, we may redeem some or all of the notes at a redemption price of 100% of the principal amount, plus accrued and unpaid interest and a “make-whole” premium. We may redeem up to 35% of the notes before May 15, 2016 using proceeds from certain equity offerings at a price of 105.875% of the principal amount. In the event of a change of control, each holder will have the right to require us to repurchase all or any part of that holder’s notes at a purchase price in cash equal to 101% of the aggregate principal amount of the notes plus any accrued and unpaid interest. If we sell certain of our assets and do not use the proceeds to pay down certain indebtedness, purchase additional assets or make capital expenditures, each as specified in the indenture, we must offer to purchase the notes at a redemption price of 100% of the principal amount thereof plus accrued and unpaid interest with the net cash proceeds from the asset sale.
On or after May 15, 2017, the 2023 Notes will be redeemable, in whole or in part, at redemption prices equal to a percentage of the principal amount plus accrued and unpaid interest, as follows:
| Year (beginning May 15) | Redemption Price | |||
2017 | 104.406 | % | ||
2018 | 102.938 | % | ||
2019 | 101.469 | % | ||
2020 and thereafter | 100.000 | % | ||
In connection with the offering of the 2023 Notes, we and the guarantors entered into a registration rights agreement, dated as of May 8, 2013, with the initial purchasers of the 2023 Notes. Under the terms of the registration rights agreement, we agreed to use our commercially reasonable efforts to file with the SEC and cause to become effective a registration statement relating to an offer (which we refer to as the “exchange offer”) to: (i) exchange the 2023 Notes for registered notes (which we refer to as the “exchange notes”), with substantially the same terms as the 2023 Notes; and (ii) exchange the guarantees related to the 2023 Notes for registered guarantees relating to the exchange notes, with substantially the same terms as the original guarantees. We have agreed to use our commercially reasonable efforts to cause the exchange offer to be completed within 400 days after the issuance of the 2023 Notes. In addition, we have agreed to file (and seek effectiveness of) a shelf registration statement, in certain circumstances, that would allow certain holders to offer some or all of the 2023 Notes to the public.
If the exchange offer is not so completed, or if the shelf registration statement is not effective in the required circumstances, the annual interest rate on the 2023 notes will increase by 0.25% per annum for the first 90-day period following the event triggering the increase. The interest rate on the 2023 Notes will increase by 0.25% per annum at the beginning of each subsequent 90-day period, up to a maximum of 1.0% additional interest per annum, until the exchange offer is completed or the shelf registration statement is filed, as applicable.
The fair value of the 2023 Notes was $537 million as of June 30, 2013 and was determined by reference to quotedover-the-counter prices (Level 2).
In connection with the issuance of the notes, we incurred fees of approximately $9 million, which were recorded as deferred financing costs in “Other assets” in our Consolidated Balance Sheet as of June 30, 2013, and are being amortized to interest expense using the interest method over the term of the notes.
2018 Notes
Our 10.25% senior secured notes (the “2018 Notes”) have a maturity date of October 15, 2018. Interest is payable on the notes on April 15 and October 15 of each year until maturity.
On May 8, 2013, we used the proceeds of the sale of the 2023 Notes to purchase $496 million aggregate principal amount of the 2018 Notes, or 99% of the outstanding amount, in connection with the tender offer and consent solicitation that expired on May 21, 2013. Aggregate consideration for the purchase was $584 million, including accrued and unpaid interest of $4 million, and in connection therewith, we entered into a supplemental indenture to implement certain changes to the 2018 Notes indenture and to release the collateral securing the 2018 Notes. Accordingly, we recorded a loss on extinguishment of debt of $59 million (net of $25 million write-down of unamortized premium) in “Other (expense) income, net” in our Consolidated Statements of Operations for the three and six months ended June 30, 2013.
RESOLUTE FOREST PRODUCTS INC.
Notes to Unaudited Interim Consolidated Financial Statements
The fair value of the 2018 Notes was $580$5 million and $576 million as of March 31,June 30, 2013 and December 31, 2012, respectively, and was determined by reference to quoted market prices (Level 1).
On April 24,prices. As of June 30, 2013, we commenced a tender offer, in connection with which we also solicited consents from tendering holders ofthe 2018 Notes were reclassified from Level 1 to amend the terms of the governing indenture to eliminate substantially all of the restrictive covenants and certain events of default under the indenture and to release the collateral securing the obligations under the 2018 Notes. On May 8, 2013, we completed a private offering of $600 million aggregate principal amount of our 5.875% senior notes due 2023 (the “2023 Notes”) and used the net proceeds to repurchase $497 million of tendered 2018 Notes. For additional information, see Note 15, “Subsequent Events.”Level 2 as they are no longer traded in active markets.
ABL Credit Facility
Our senior secured asset-based revolving credit facility (the “ABL Credit Facility”), as amended, has a maturity date ofmatures October 28, 20162016. On April 29, 2013, we entered into an agreement with the administrative agent for the ABL Credit Facility and provides an asset-based revolving credit facilityBank of upAmerica, N.A., Canadian Branch, in order to $600add Bank of America as a lender thereunder, and also increase the aggregate commitments of the ABL Credit Facility by $65 million at any time,to $665 million, subject to borrowing base availability.limitations. As of March 31,June 30, 2013, we had no borrowings and $54$47 million of letters of credit outstanding under the ABL Credit Facility. As of March 31,June 30, 2013, we had $537$467 million of availability under the ABL Credit Facility, which was comprised of $302$294 million for the U.S. borrowers (Resolute Forest Products Inc., Resolute FP US Inc. and AbiBow Recycling LLC) and $235$173 million for the Canadian borrower (Resolute FP Canada Inc.).
On April 29, 2013, we entered into an agreement to add a lender and to increase the aggregate commitments of the ABL Credit Facility by $65 million to $665 million. For additional information, see Note 15, “Subsequent Events.”
PSIF – Investissement Quebec
Our loan granted by Investissement Quebec through the Soutien à l’industrie forestière program (“PSIF”) is interest-free and payable in monthly installments over a maximum of four years, starting December 31, 2010. Under the loan agreement, we must comply with certain restrictive covenants, including the requirement to meet certain financial ratios. As of March 31,June 30, 2013, the fair value of the loan approximated its carrying value of $2 million. The fair value was determined by discounting the cash flows using a current interest rate (4.4%) for financial instruments with similar characteristics and maturities (Level 3).
Capital lease obligation
We have a capital lease obligation for a warehouse, which can be renewed for 20 years at our option. Minimal payments are determined by an escalatory price clause.
RESOLUTE FOREST PRODUCTS INC.
Notes to Unaudited Interim Consolidated Financial Statements
Note 10.11. Employee Benefit Plans
Pension and OPEB plans
The components of net periodic benefit cost relating to our pension and OPEB plans for the three and six months ended March 31,June 30, 2013 and 2012 were as follows:
| Pension Plans: | Pension Plans: | |||||||||||||||||||||||||||||||||
| Pension Plans | OPEB Plans | Three Months Ended June 30, | Six Months Ended June 30, | |||||||||||||||||||||||||||||||
| (Unaudited, in millions) | 2013 | 2012 | 2013 | 2012 | 2013 | 2012 | 2013 | 2012 | ||||||||||||||||||||||||||
Service cost | $ | 8 | $ | 9 | $ | 1 | $ | 1 | $ | 8 | $ | 9 | $ | 16 | $ | 18 | ||||||||||||||||||
Interest cost | 70 | 76 | 4 | 5 | 70 | 76 | 140 | 152 | ||||||||||||||||||||||||||
Expected return on plan assets | (78) | (84) | – | – | (77 | ) | (83 | ) | (155 | ) | (167 | ) | ||||||||||||||||||||||
Amortization of actuarial losses | 6 | – | – | – | 6 | – | 12 | – | ||||||||||||||||||||||||||
Amortization of prior service credits | (1) | – | – | – | – | – | (1 | ) | – | |||||||||||||||||||||||||
Settlement and curtailments | (1) | 4 | – | – | – | 10 | (1 | ) | 14 | |||||||||||||||||||||||||
| $ | 4 | $ | 5 | $ | 5 | $ | 6 | $ | 7 | $ | 12 | $ | 11 | $ | 17 | |||||||||||||||||||
| OPEB Plans: | ||||||||||||||||||||||||||||||||||
| Three Months Ended June 30, | Six Months Ended June 30, | |||||||||||||||||||||||||||||||||
| (Unaudited, in millions) | 2013 | 2012 | 2013 | 2012 | ||||||||||||||||||||||||||||||
Service cost | $ | 1 | $ | – | $ | 2 | $ | 1 | ||||||||||||||||||||||||||
Interest cost | 4 | 5 | 8 | 10 | ||||||||||||||||||||||||||||||
| $ | 5 | $ | 5 | $ | 10 | $ | 11 | |||||||||||||||||||||||||||
EventEvents impacting net periodic benefit cost for the three and six months ended March 31,June 30, 2012
In June 2012, we announced the indefinite idling of part of our Mersey operations, which resulted in the elimination of approximately 176 positions. A curtailment loss of $7 million was included in the net periodic benefit cost of our pension plans for the three months ended June 30, 2012.
In the fourth quarter of 2011, as a result of a workforce reduction at our Mersey operations, approximately 97 positions were eliminated. A settlement loss of $2 million was included in the net periodic benefit cost of our pension plans for the three months ended June 30, 2012.
In March 2012, we incurred a curtailment loss of $4 million primarily due to the announcement ofannounced a workforce reduction at our Baie-Comeau paper mill, which resulted in the elimination of approximately 90 positions. ThisA curtailment loss of $1 million and $3 million was included in the net periodic benefit cost of our pension plans whichfor the three and six months ended June 30, 2012, respectively.
The cost of these curtailments and settlement was recordedincluded in “Closure costs, impairment and other related charges” in our Consolidated Statements of Operations for the three months ended March 31, 2012.respective periods.
Defined contribution plans
The expense for our defined contribution plans totaled $6$5 million for both the three months ended March 31,June 30, 2013 and 2012 and $11 million for both the six months ended June 30, 2013 and 2012.
RESOLUTE FOREST PRODUCTS INC.
Notes to Unaudited Interim Consolidated Financial Statements
Canadian pension funding
On April 26, 2013, we reached an agreement in principle with our stakeholders in Quebec, the provincial government, and its pension regulator, concerning the previously-disclosed funding relief measures, solvency deficit and corrective measures related to our material Canadian registered pension plans. For additional information, see Note 15, “Subsequent Events.”
RESOLUTE FOREST PRODUCTS INC.
Notesplans.Under the agreement in principle, we would agree to Unaudited Interim Consolidated Financial Statements
make incremental contributions beyond the basic funding requirements under the existing framework in order to secure longer-term funding stability. We continue to engage our Ontario stakeholders and the provincial government of Ontario and its pension regulator.
Note 11.12. Income Taxes
The income tax benefit (provision) attributable to (loss) incomeloss before income taxes differs from the amounts computed by applying the United States federal statutory income tax rate of 35% for the three and six months ended March 31,June 30, 2013 and 2012 as a result of the following:
| Three Months Ended June 30, | Six Months Ended June 30, | |||||||||||||||||||||||
| (Unaudited, in millions) | 2013 | 2012 | 2013 | 2012 | 2013 | 2012 | ||||||||||||||||||
(Loss) income before income taxes | $ | (46) | $ | 23 | ||||||||||||||||||||
Loss before income taxes | $ | (75 | ) | $ | (60 | ) | $ | (120 | ) | $ | (32 | ) | ||||||||||||
Income tax benefit: | ||||||||||||||||||||||||
Expected income tax benefit (provision) | 16 | (8) | ||||||||||||||||||||||
Income tax benefit (provision): | ||||||||||||||||||||||||
Expected income tax benefit | 26 | 21 | 42 | 11 | ||||||||||||||||||||
Changes resulting from: | ||||||||||||||||||||||||
Valuation allowance | 35 | 3 | (1 | ) | (31 | ) | 33 | (28 | ) | |||||||||||||||
Adjustments for unrecognized tax benefits | – | 4 | – | – | – | 4 | ||||||||||||||||||
Foreign exchange | (1) | 7 | – | (4 | ) | (1 | ) | 3 | ||||||||||||||||
Reorganization-related and other tax adjustments | – | (3) | – | 13 | – | 10 | ||||||||||||||||||
Research and development tax incentives | – | 2 | 1 | 1 | 1 | 3 | ||||||||||||||||||
State income taxes and foreign tax rate differences | (3) | 2 | 7 | (1 | ) | 4 | 1 | |||||||||||||||||
Other, net | (6) | 3 | (2 | ) | (1 | ) | (8 | ) | 2 | |||||||||||||||
| $ | 41 | $ | 10 | $ | 31 | $ | (2 | ) | $ | 71 | $ | 6 | ||||||||||||
During the threesix months ended March 31,June 30, 2013, we reversed $35$33 million of valuation allowance, primarily related to available U.S. capital losses which are now expected to be utilized in the future as a result of the acquisition of the noncontrolling interest in CNC. The increase in the valuation allowance during the three and six months ended June 30, 2012 related to costs associated with the indefinite idling of our Mersey operations where we did not recognize tax benefits. During the threesix months ended March 31,June 30, 2012, we recorded benefitsa benefit of $4 million for previously unrecognized tax benefits, following the conclusion of tax examinations related to prior year research and development tax incentive claims.
As a result of the contribution of capital from the noncontrolling interest and the subsequent acquisition of the noncontrolling interest in CNC, we established a deferred income tax provision of $3 million.million in the first quarter of 2013. Since this acquisition was accounted for as an equity transaction, as discussed in Note 4,5, “Other (Expense) Income, Net,” the recording of this deferred tax provision resulted in a reduction of “Additionalpaid-in capital” in our Consolidated Balance Sheet as of March 31,June 30, 2013.
For the three and six months ended June 30, 2013, in accordance with FASB ASC 740, “Income Taxes,” we calculated our income tax benefit under the discrete method. The discrete method was used, as the consolidated estimated annual effective tax rate was not considered a reliable estimate of theyear-to-date income tax benefit, since small changes in estimated income in different tax jurisdictions would result in significant changes in the estimated consolidated annual effective tax rate.
At each reporting period, we assess whether it is more likely than not that the deferred income tax assets will be realized based on the review of all available positive and negative evidence, including future reversals of existing taxable temporary differences, estimates of future taxable income, past operating results and prudent and feasible tax planning strategies. The impact of changing dynamics in the pulp and paper industry on the actual and forecasted earnings of our U.S. operations may limit our ability to continue to recognize our deferred income tax assets. If future results do not meet expectations, we may be required to reduce our U.S. net deferred income tax assets by recording a valuation allowance of up to $630 million, representing the U.S. portion of the net deferred income tax assets of $1,961 million as of June 30, 2013. Such valuation allowance, if taken, would be recorded as a charge to income tax expense and could materially affect our results of operations and financial condition.
RESOLUTE FOREST PRODUCTS INC.
Notes to Unaudited Interim Consolidated Financial Statements
Note 12.13. Commitments and Contingencies
Legal matters
We are involved in various legal proceedings relating to contracts, commercial disputes, taxes, environmental issues, employment and workers’ compensation claims, Aboriginal claims and other matters. We periodically review the status of these proceedings with both inside and outside counsel. Although the final outcome of any of these matters is subject to many variables and cannot be predicted with any degree of certainty, we establish reserves for a matter (including legal costs expected to be incurred) when we believe an adverse outcome is probable and the amount can be reasonably estimated. We believe that the ultimate disposition of these matters will not have a material adverse effect on our financial condition, but it could have a material adverse effect on our results of operations in any given quarter or year.
Effective July 31, 2012, we completed the second step transaction pursuant to which we acquired the remaining 25.4% of the outstanding Fibrek Inc. (“Fibrek”) shares, following the approval of Fibrek’s shareholders on July 23, 2012, and the issuance of a final order of the Quebec Superior Court in Canada approving the arrangement on July 27, 2012. Certain former shareholders of Fibrek exercised (or purported to exercise) rights of dissent in respect of the transaction, asking for a judicial determination of the fair value of their claim under the Canada Business Corporations Act. No consideration has to date been paid to the former Fibrek shareholders who exercised (or purported to exercise) rights of dissent. Any such consideration will only be paid out upon settlement or judicial determination of the fair value of their claims and will be paid entirely in cash. Accordingly, we cannot presently determine the amount that ultimately will be paid to former holders of Fibrek shares in connection with the proceedings, but we have reserved approximately Cdn$14 million ($1413 million, based on the exchange rate in effect on March 31,June 30, 2013) for the eventual payment of those claims.
On June 12, 2012, we filed a motion for directives with the Quebec Superior Court in Canada, the court with jurisdiction in our 2010 creditor protection proceedings under theCompanies’ Creditors Arrangement Act (Canada), seeking an order to prevent pension regulators in each of Quebec, New Brunswick and Newfoundland and Labrador from declaring partialwind-ups
RESOLUTE FOREST PRODUCTS INC.
Notes to Unaudited Interim Consolidated Financial Statements
wind-ups of pension plans relating to employees of former operations in New Brunswick and Newfoundland and Labrador, or a declaration that any claim for accelerated reimbursements of deficits arising from a partialwind-up is a barred claim under the creditor protection proceedings. These plans are subject to the funding relief regulations described in Note 18, “Pension and Other Postretirement Benefit Plans - Canadian-Canadian pension funding,” to our consolidated financial statements for the year ended December 31, 2012 and we contend, among other things, that any such declaration, if issued, would be inconsistent with the court’s sanction order confirming the plan of reorganization and the terms of our emergence from the creditor protection proceedings. A partialwind-up would likely shorten the period in which any deficit within those plans, which could exceed $150 million, would have to be funded if we do not obtain the relief sought. No hearing date has been set to date.
Information on our commitments and contingencies is presented in Note 20, “Commitments and Contingencies,” included in our consolidated financial statements for the year ended December 31, 2012. ThereExcept as updated above, there has been no material development to the commitments and contingencies described in our consolidated financial statements for the year ended December 31, 2012.
Other
The province of Quebec informed us on December 30, 2011 that it intended not to renew our water rights associated with ourJim-Gray hydroelectric dam and to require us to transfer the property to the province for no consideration. On June 13, 2013, the province of Quebec granted us an extension to transfer the property. As extended, an agreement on the terms of the transfer would need to be entered into at the latest on November 1, 2013. The province’s actions are contrary to our understanding of the water power lease in question. We continue to evaluate our legal options. At this time, we believe that the remaining useful life of the assets remains unchanged. The carrying value of the hydroelectric assets and the intangible assets associated with theJim-Gray dam as of June 30, 2013 was approximately $91 million. If we are unable to renew the water rights at this dam, we will reevaluate the remaining useful life of these assets, which may result in accelerated depreciation and amortization charges at that time. Additional information regarding ourJim-Gray hydroelectric dam is presented in Note 5, “Amortizable Intangible Assets, Net,” and Note 13, “Fixed Assets, Net,” included in our consolidated financial statements for the year ended December 31, 2012.
RESOLUTE FOREST PRODUCTS INC.
Notes to Unaudited Interim Consolidated Financial Statements
Note 14. Share Capital
Common stock
On May 22, 2013, we completed the final distribution of shares of common stock from the disputed claim share reserve established under theDebtors’ Second Amended Joint Plan of Reorganization under Chapter 11 of the United StatesBankruptcy Code (the “Chapter 11 Reorganization Plan”). During the three and six months ended June 30, 2013, we distributed a total of 2,050,920 and 2,269,734 shares of common stock, respectively, from our disputed share reserve. There is no remaining unresolved claim under that plan.
As the aggregate of allowed claims against certain Chapter 11 debtors was resolved for less than was originally reserved when the disputed claim share reserve was established, the 276,662 remaining shares reserved for Chapter 11 unsecured claims were transferred to us pursuant to the Chapter 11 Reorganization Plan.
As of August 9, 2013, we completed the final allocation of shares of common stock from the disputed claim share reserve established under theCompanies’ Creditors Arrangement Act (Canada) Plan of Reorganization and Compromise (the “CCAA Reorganization Plan”). See Note 17, “Subsequent Event,” for additional information.
Treasury stock
On May 22, 2012, our board approved a share repurchase program of up to 10% of our common stock, for an aggregate purchase price of up to $100 million. During the three months ended June 30, 2012, we repurchased 1.1 million shares at a cost of $12 million.
RESOLUTE FOREST PRODUCTS INC.
Notes to Unaudited Interim Consolidated Financial Statements
Note 13.15. Segment Information
We manage our business based on the products we manufacture. Accordingly, our reportable segments correspond to our primary product lines: newsprint, coated papers, specialty papers, market pulp and wood products.
None of the income or loss items following “Operating income (loss) income”” in our Consolidated Statements of Operations are allocated to our segments, since those items are reviewed separately by management. For the same reason, closure costs, impairment and other related charges, employee termination costs, net gain on disposition of assets and other discretionary charges or credits are not allocated to our segments. We allocate depreciation expense to our segments, although the related fixed assets are not allocated to segment assets. Additionally, all selling, general and administrative expenses, excluding employee termination costs and certain discretionary charges and credits, are allocated to our segments.
Information about certain segment data for the three and six months ended March 31,June 30, 2013 and 2012 was as follows:
| (Unaudited, in millions) | Newsprint | Coated Papers | Specialty Papers | Market Pulp (1) | Wood Products | Corporate and Other | Consolidated Total | ||||||||||||||||||||||||||||
Sales | |||||||||||||||||||||||||||||||||||
First quarter 2013 | $ | 356 | $ | 102 | $ | 238 | $ | 240 | $ | 138 | $ | – | $ | 1,074 | |||||||||||||||||||||
First quarter 2012 | 416 | 128 | 272 | 127 | 111 | – | 1,054 | ||||||||||||||||||||||||||||
Depreciation and amortization |
| ||||||||||||||||||||||||||||||||||
First quarter 2013 | $ | 18 | $ | 9 | $ | 10 | $ | 13 | $ | 9 | $ | 1 | $ | 60 | |||||||||||||||||||||
First quarter 2012 | 18 | 10 | 12 | 8 | 9 | – | 57 | ||||||||||||||||||||||||||||
Operating (loss) income(2) | |||||||||||||||||||||||||||||||||||
First quarter 2013 | $ | (2) | $ | (3 | ) | $ | 9 | $ | (4) | $ | 16 | $ | (66) | $ | (50) | ||||||||||||||||||||
First quarter 2012 | 21 | (1 | ) | 15 | (21) | (6) | 18 | 26 | |||||||||||||||||||||||||||
| (Unaudited, in millions) | Newsprint | Coated Papers | Specialty Papers | Market Pulp (1) | Wood Products | Corporate and Other | Consolidated Total | |||||||||||||||||||||
Sales | ||||||||||||||||||||||||||||
Second quarter 2013 | $ | 364 | $ | 96 | $ | 242 | $ | 263 | $ | 142 | $ | – | $ | 1,107 | ||||||||||||||
Second quarter 2012 | 416 | 121 | 288 | 211 | 132 | – | 1,168 | |||||||||||||||||||||
First six months 2013 | 720 | 198 | 480 | 503 | 280 | – | 2,181 | |||||||||||||||||||||
First six months 2012 | 832 | 249 | 560 | 338 | 243 | – | 2,222 | |||||||||||||||||||||
Depreciation and amortization | ||||||||||||||||||||||||||||
Second quarter 2013 | $ | 18 | $ | 9 | $ | 10 | $ | 13 | $ | 9 | $ | 2 | $ | 61 | ||||||||||||||
Second quarter 2012 | 18 | 9 | 12 | 10 | 9 | – | 58 | |||||||||||||||||||||
First six months 2013 | 36 | 18 | 20 | 26 | 18 | 3 | 121 | |||||||||||||||||||||
First six months 2012 | 36 | 19 | 24 | 18 | 18 | – | 115 | |||||||||||||||||||||
Operating income (loss)(2) | ||||||||||||||||||||||||||||
Second quarter 2013 | $ | 10 | $ | 2 | $ | – | $ | 10 | $ | 16 | $ | (35) | $ | 3 | ||||||||||||||
Second quarter 2012 | 32 | 3 | 28 | (3) | 12 | (104) | (32) | |||||||||||||||||||||
First six months 2013 | 8 | 2 | 8 | 5 | 32 | (101) | (46) | |||||||||||||||||||||
First six months 2012 | 53 | 4 | 42 | (20) | 6 | (86) | (1) | |||||||||||||||||||||
| (1) | Market pulp sales excluded inter-segment sales of |
| (2) | Corporate and other operating loss for the three and six months ended |
| Three Months Ended June 30, | Six Months Ended June 30, | |||||||||||||||||||||||||
| (Unaudited, in millions) | 2013 | 2012 | 2013 | 2012 | 2013 | 2012 | ||||||||||||||||||||
Net gain on disposition of assets | $ | – | $ | 23 | $ | 2 | $ | 1 | $ | 2 | $ | 24 | ||||||||||||||
Closure costs, impairment and other related charges | (40) | (5) | (12 | ) | (88 | ) | (52 | ) | (93 | ) | ||||||||||||||||
Inventory write-downs related to closures | (4) | – | (1 | ) | (7 | ) | (5 | ) | (7 | ) | ||||||||||||||||
Employee termination costs | – | (2) | ||||||||||||||||||||||||
Severance | – | (1 | ) | – | (3 | ) | ||||||||||||||||||||
Transaction costs | (3) | (4) | (2 | ) | (3 | ) | (5 | ) | (7 | ) | ||||||||||||||||
Start up costs of idled mill | (15) | – | (13 | ) | – | (28 | ) | – | ||||||||||||||||||
| $ | (62) | $ | 12 | $ | (26 | ) | $ | (98 | ) | $ | (88 | ) | $ | (86 | ) | |||||||||||
RESOLUTE FOREST PRODUCTS INC.
Notes to Unaudited Interim Consolidated Financial Statements
Note 14.16. Condensed Consolidating Financial Information
The following information is presented in accordance with Rule3-10 of RegulationS-X and the public information requirements of Rule 144 promulgated pursuant to the Securities Act of 1933, as amended, in connection with Resolute Forest Products Inc.’s 2018 Notes and 2023 Notes that are fully and unconditionally guaranteed, on a joint and several basis, by all of our 100% owned material U.S. subsidiaries (the “Guarantor Subsidiaries”). The 2018 Notes and 2023 Notes are not guaranteed by our foreign subsidiaries and our less than 100% owned U.S. subsidiaries (the “Non-guarantor Subsidiaries”).
The following condensed consolidating financial information sets forth the Statements of Operations and Comprehensive (Loss) Income for the three and six months ended March 31,June 30, 2013 and 2012, the Balance Sheets as of March 31,June 30, 2013 and December 31, 2012 and the Statements of Cash Flows for the threesix months ended March 31,June 30, 2013 and 2012 for Resolute Forest Products Inc. (the “Parent”), the Guarantor Subsidiaries on a combined basis and theNon-guarantor Subsidiaries on a combined basis. The condensed consolidating financial information reflects the investments of the Parent in the Guarantor Subsidiaries andNon-guarantor Subsidiaries, as well as the investments of the Guarantor Subsidiaries in theNon-guarantor Subsidiaries, using the equity method of accounting. The principal consolidating adjustments are elimination entries to eliminate the investments in subsidiaries and intercompany balances and transactions.
| CONDENSED CONSOLIDATING STATEMENT OF OPERATIONS AND COMPREHENSIVE (LOSS) INCOME | CONDENSED CONSOLIDATING STATEMENT OF OPERATIONS AND COMPREHENSIVE (LOSS) INCOME | CONDENSED CONSOLIDATING STATEMENT OF OPERATIONS AND COMPREHENSIVE (LOSS) INCOME | ||||||||||||||||||||||||||||||||||||||
For the Three Months Ended March 31, 2013
| ||||||||||||||||||||||||||||||||||||||||
For the Three Months Ended June 30, 2013
| For the Three Months Ended June 30, 2013
| |||||||||||||||||||||||||||||||||||||||
| (Unaudited, in millions) | Parent | Guarantor Subsidiaries | Non-guarantor Subsidiaries | Consolidating Adjustments | Consolidated | Parent | Guarantor Subsidiaries | Non-guarantor Subsidiaries | Consolidating Adjustments | Consolidated | ||||||||||||||||||||||||||||||
Sales | $ – | $ 847 | $ 688 | $ (461) | $ 1,074 | $ – | $ 935 | $ 732 | $ (560) | $ 1,107 | ||||||||||||||||||||||||||||||
Costs and expenses: | ||||||||||||||||||||||||||||||||||||||||
Cost of sales, excluding depreciation and amortization | – | 778 | 533 | (454) | 857 | – | 859 | 558 | (558) | 859 | ||||||||||||||||||||||||||||||
Depreciation and amortization | – | 25 | 35 | – | 60 | – | 25 | 36 | – | 61 | ||||||||||||||||||||||||||||||
Distribution costs | – | 43 | 82 | �� | (2) | 123 | – | 42 | 89 | (1) | 130 | |||||||||||||||||||||||||||||
Selling, general and administrative expenses | 5 | 12 | 27 | – | 44 | 5 | 15 | 24 | – | 44 | ||||||||||||||||||||||||||||||
Closure costs, impairment and other related charges | – | 37 | 3 | – | 40 | – | 12 | – | – | 12 | ||||||||||||||||||||||||||||||
Net gain on disposition of assets | – | – | (2) | – | (2) | |||||||||||||||||||||||||||||||||||
Operating (loss) income | (5) | (48) | 8 | (5) | (50) | (5) | (18) | 27 | (1) | 3 | ||||||||||||||||||||||||||||||
Interest expense | (32) | – | (2) | 20 | (14) | (23) | (1) | (2) | 13 | (13) | ||||||||||||||||||||||||||||||
Other income, net | – | 34 | 4 | (20) | 18 | |||||||||||||||||||||||||||||||||||
Parent’s equity in income of subsidiaries | 21 | – | – | (21) | – | |||||||||||||||||||||||||||||||||||
Other (expense) income, net | (59) | 11 | (4) | (13) | (65) | |||||||||||||||||||||||||||||||||||
Parent’s equity in income (loss) of subsidiaries | 11 | – | – | (11) | – | |||||||||||||||||||||||||||||||||||
(Loss) income before income taxes | (16) | (14) | 10 | (26) | (46) | (76) | (8) | 21 | (12) | (75) | ||||||||||||||||||||||||||||||
Income tax benefit (provision) | 11 | 36 | (7) | 1 | 41 | 33 | 5 | (7) | – | 31 | ||||||||||||||||||||||||||||||
Net (loss) income including noncontrolling interests | (5) | 22 | 3 | (25) | (5) | (43) | (3) | 14 | (12) | (44) | ||||||||||||||||||||||||||||||
Net income attributable to noncontrolling interests | – | – | – | – | – | |||||||||||||||||||||||||||||||||||
Net loss attributable to noncontrolling interests | – | – | 1 | – | 1 | |||||||||||||||||||||||||||||||||||
Net (loss) income attributable to Resolute Forest Products Inc. | $ (5) | $ 22 | $ 3 | $ (25) | $ (5) | $ (43) | $ (3) | $ 15 | $ (12) | $ (43) | ||||||||||||||||||||||||||||||
Comprehensive (loss) income attributable to Resolute Forest Products Inc. | $ (4) | $ 23 | $ 3 | $ (26) | $ (4) | $ (39) | $ 14 | $ 2 | $ (16) | $ (39) | ||||||||||||||||||||||||||||||
RESOLUTE FOREST PRODUCTS INC.
Notes to Unaudited Interim Consolidated Financial Statements
| CONDENSED CONSOLIDATING STATEMENT OF OPERATIONS AND COMPREHENSIVE INCOME | ||||||||||||||||||||||||||||||||||||||||
For the Three Months Ended March 31, 2012
| ||||||||||||||||||||||||||||||||||||||||
| CONDENSED CONSOLIDATING STATEMENT OF OPERATIONS AND COMPREHENSIVE (LOSS) INCOME | CONDENSED CONSOLIDATING STATEMENT OF OPERATIONS AND COMPREHENSIVE (LOSS) INCOME | |||||||||||||||||||||||||||||||||||||||
For the Six Months Ended June 30, 2013
| For the Six Months Ended June 30, 2013
| |||||||||||||||||||||||||||||||||||||||
| (Unaudited, in millions) | Parent | Guarantor Subsidiaries | Non-guarantor Subsidiaries | Consolidating Adjustments | Consolidated | Parent | Guarantor Subsidiaries | Non-guarantor Subsidiaries | Consolidating Adjustments | Consolidated | ||||||||||||||||||||||||||||||
Sales | $ – | $ 716 | $ 734 | $ (396) | $ 1,054 | $ – | $ 1,782 | $ 1,420 | $ (1,021) | $ 2,181 | ||||||||||||||||||||||||||||||
Costs and expenses: | ||||||||||||||||||||||||||||||||||||||||
Cost of sales, excluding depreciation and amortization | – | 654 | 578 | (396) | 836 | – | 1,633 | 1,094 | (1,012) | 1,715 | ||||||||||||||||||||||||||||||
Depreciation and amortization | – | 24 | 33 | – | 57 | – | 50 | 71 | – | 121 | ||||||||||||||||||||||||||||||
Distribution costs | – | 32 | 89 | – | 121 | – | 85 | 171 | (3) | 253 | ||||||||||||||||||||||||||||||
Selling, general and administrative expenses | 6 | 15 | 11 | – | 32 | 10 | 27 | 51 | – | 88 | ||||||||||||||||||||||||||||||
Closure costs, impairment and other related charges | – | – | 5 | – | 5 | – | 49 | 3 | – | 52 | ||||||||||||||||||||||||||||||
Net gain on disposition of assets | – | – | (23) | – | (23) | – | – | (2) | – | (2) | ||||||||||||||||||||||||||||||
Operating (loss) income | (6) | (9) | 41 | – | 26 | (10) | (62) | 32 | (6) | (46) | ||||||||||||||||||||||||||||||
Interest expense | (54) | (1) | (1) | 40 | (16) | (55) | (1) | (4) | 33 | (27) | ||||||||||||||||||||||||||||||
Other income, net | – | 43 | 10 | (40) | 13 | |||||||||||||||||||||||||||||||||||
Other (expense) income, net | (59) | 45 | – | (33) | (47) | |||||||||||||||||||||||||||||||||||
Parent’s equity in income of subsidiaries | 61 | – | – | (61) | – | 32 | – | – | (32) | – | ||||||||||||||||||||||||||||||
Income before income taxes | 1 | 33 | 50 | (61) | 23 | |||||||||||||||||||||||||||||||||||
(Loss) income before income taxes | (92) | (18) | 28 | (38) | (120) | |||||||||||||||||||||||||||||||||||
Income tax benefit (provision) | 22 | (15) | 3 | – | 10 | 44 | 40 | (14) | 1 | 71 | ||||||||||||||||||||||||||||||
Net income including noncontrolling interests | 23 | 18 | 53 | (61) | 33 | |||||||||||||||||||||||||||||||||||
Net income attributable to noncontrolling interests | – | – | (10) | – | (10) | |||||||||||||||||||||||||||||||||||
Net income attributable to Resolute Forest Products Inc. | $ 23 | $ 18 | $ 43 | $ (61) | $ 23 | |||||||||||||||||||||||||||||||||||
Comprehensive income attributable to Resolute Forest Products Inc. | $ 26 | $ 18 | $ 46 | $ (64) | $ 26 | |||||||||||||||||||||||||||||||||||
Net (loss) income including noncontrolling interests | (48) | 22 | 14 | (37) | (49) | |||||||||||||||||||||||||||||||||||
Net loss attributable to noncontrolling interests | – | – | 1 | – | 1 | |||||||||||||||||||||||||||||||||||
Net (loss) income attributable to Resolute Forest Products Inc. | $ (48) | $ 22 | $ 15 | $ (37) | $ (48) | |||||||||||||||||||||||||||||||||||
Comprehensive (loss) income attributable to Resolute Forest Products Inc. | $ (43) | $ 40 | $ 2 | $ (42) | $ (43) | |||||||||||||||||||||||||||||||||||
RESOLUTE FOREST PRODUCTS INC.
Notes to Unaudited Interim Consolidated Financial Statements
| CONDENSED CONSOLIDATING BALANCE SHEET | ||||||||||||||||||||
As of March 31, 2013
| ||||||||||||||||||||
| (Unaudited, in millions) | Parent | Guarantor Subsidiaries | Non-guarantor Subsidiaries | Consolidating Adjustments | Consolidated | |||||||||||||||
Assets | ||||||||||||||||||||
Current assets: | ||||||||||||||||||||
Cash and cash equivalents | $ – | $ 122 | $ 93 | $ – | $ 215 | |||||||||||||||
Accounts receivable, net | – | 436 | 271 | – | 707 | |||||||||||||||
Accounts receivable from affiliates | 19 | 368 | 117 | (504) | – | |||||||||||||||
Inventories, net | – | 221 | 372 | (9) | 584 | |||||||||||||||
Deferred income tax assets | – | 11 | 44 | – | 55 | |||||||||||||||
Note and interest receivable from parent | – | 342 | – | (342) | – | |||||||||||||||
Note receivable from subsidiary | 41 | – | – | (41) | – | |||||||||||||||
Other current assets | – | 22 | 49 | – | 71 | |||||||||||||||
Total current assets | 60 | 1,522 | 946 | (896) | 1,632 | |||||||||||||||
Fixed assets, net | – | 908 | 1,478 | – | 2,386 | |||||||||||||||
Amortizable intangible assets, net | – | – | 68 | – | 68 | |||||||||||||||
Deferred income tax assets | – | 593 | 1,362 | 2 | 1,957 | |||||||||||||||
Notes receivable from affiliates | – | 530 | – | (530) | – | |||||||||||||||
Note receivable from parent | – | 270 | – | (270) | – | |||||||||||||||
Investments in and advances to consolidated subsidiaries | 4,928 | 2,038 | – | (6,966) | – | |||||||||||||||
Other assets | – | 119 | 69 | – | 188 | |||||||||||||||
Total assets | $ 4,988 | $ 5,980 | $ 3,923 | $ (8,660) | $ 6,231 | |||||||||||||||
Liabilities and equity | ||||||||||||||||||||
Current liabilities: | ||||||||||||||||||||
Accounts payable and accrued liabilities | $ 25 | $ 212 | $ 355 | $ – | $ 592 | |||||||||||||||
Current portion of long-term debt | – | – | 3 | – | 3 | |||||||||||||||
Accounts payable to affiliates | 384 | 120 | – | (504) | – | |||||||||||||||
Note and interest payable to subsidiary | 342 | – | – | (342) | – | |||||||||||||||
Note payable to parent | – | – | 41 | (41) | – | |||||||||||||||
Total current liabilities | 751 | 332 | 399 | (887) | 595 | |||||||||||||||
Long-term debt, net of current portion | 527 | 2 | – | – | 529 | |||||||||||||||
Long-term debt due to subsidiary | 270 | – | – | (270) | – | |||||||||||||||
Long-term debt due to affiliate | – | – | 530 | (530) | – | |||||||||||||||
Pension and other postretirement benefit obligations | – | 561 | 1,330 | – | 1,891 | |||||||||||||||
Deferred income tax liabilities | – | – | 28 | – | 28 | |||||||||||||||
Other long-term liabilities | – | 28 | 41 | – | 69 | |||||||||||||||
Total liabilities | 1,548 | 923 | 2,328 | (1,687) | 3,112 | |||||||||||||||
Total equity | 3,440 | 5,057 | 1,595 | (6,973) | 3,119 | |||||||||||||||
Total liabilities and equity | $ 4,988 | $ 5,980 | $ 3,923 | $ (8,660) | $ 6,231 | |||||||||||||||
| CONDENSED CONSOLIDATING STATEMENT OF OPERATIONS AND COMPREHENSIVE (LOSS) INCOME | ||||||||||||||||||||
For the Three Months Ended June 30, 2012
| ||||||||||||||||||||
| (Unaudited, in millions) | Parent | Guarantor Subsidiaries | Non-guarantor Subsidiaries | Consolidating Adjustments | Consolidated | |||||||||||||||
Sales | $ – | $ 729 | $ 797 | $ (358) | $ 1,168 | |||||||||||||||
Costs and expenses: | ||||||||||||||||||||
Cost of sales, excluding depreciation and amortization | – | 633 | 606 | (358) | 881 | |||||||||||||||
Depreciation and amortization | – | 22 | 36 | – | 58 | |||||||||||||||
Distribution costs | – | 38 | 95 | – | 133 | |||||||||||||||
Selling, general and administrative expenses | 6 | 8 | 27 | – | 41 | |||||||||||||||
Closure costs, impairment and other related charges | – | – | 88 | – | 88 | |||||||||||||||
Net gain on disposition of assets | – | – | (1) | – | (1) | |||||||||||||||
Operating (loss) income | (6) | 28 | (54) | – | (32) | |||||||||||||||
Interest expense | (52) | (1) | (4) | 39 | (18) | |||||||||||||||
Other income (expense), net | – | 40 | (11) | (39) | (10) | |||||||||||||||
Parent’s equity in income (loss) of subsidiaries | 20 | – | – | (20) | – | |||||||||||||||
(Loss) income before income taxes | (38) | 67 | (69) | (20) | (60) | |||||||||||||||
Income tax benefit (provision) | 21 | (15) | (8) | – | (2) | |||||||||||||||
Net (loss) income including noncontrolling interests | (17) | 52 | (77) | (20) | (62) | |||||||||||||||
Net loss attributable to noncontrolling interests | – | – | 45 | – | 45 | |||||||||||||||
Net (loss) income attributable to Resolute Forest Products Inc. | $ (17) | $ 52 | $ (32) | $ (20) | $ (17) | |||||||||||||||
Comprehensive (loss) income attributable to Resolute Forest Products Inc. | $ (24) | $ 52 | $ (39) | $ (13) | $ (24) | |||||||||||||||
RESOLUTE FOREST PRODUCTS INC.
Notes to Unaudited Interim Consolidated Financial Statements
CONDENSED CONSOLIDATING BALANCE SHEET As of December 31, 2012
| ||||||||||||||||||||
| (Unaudited, in millions) | Parent | Guarantor Subsidiaries | Non-guarantor Subsidiaries | Consolidating Adjustments | Consolidated | |||||||||||||||
Assets | ||||||||||||||||||||
Current assets: | ||||||||||||||||||||
Cash and cash equivalents | $ 5 | $ 171 | $ 87 | $ – | $ 263 | |||||||||||||||
Accounts receivable, net | – | 383 | 366 | (52) | 697 | |||||||||||||||
Accounts receivable from affiliates | – | 262 | 211 | (473) | – | |||||||||||||||
Inventories, net | – | 221 | 328 | (4) | 545 | |||||||||||||||
Deferred income tax assets | – | 11 | 45 | – | 56 | |||||||||||||||
Notes and interest receivable from parent | – | 593 | – | (593) | – | |||||||||||||||
Notes receivable from affiliates | – | 9 | 138 | (147) | – | |||||||||||||||
Note receivable from subsidiary | 41 | – | – | (41) | – | |||||||||||||||
Other current assets | – | 18 | 40 | – | 58 | |||||||||||||||
Total current assets | 46 | 1,668 | 1,215 | (1,310) | 1,619 | |||||||||||||||
Fixed assets, net | – | 908 | 1,532 | – | 2,440 | |||||||||||||||
Amortizable intangible assets, net | – | – | 69 | – | 69 | |||||||||||||||
Deferred income tax assets | – | 595 | 1,406 | 1 | 2,002 | |||||||||||||||
Note receivable from affiliate | – | 531 | – | (531) | – | |||||||||||||||
Investments in and advances to consolidated subsidiaries | 4,850 | 2,089 | – | (6,939) | – | |||||||||||||||
Other assets | – | 98 | 96 | – | 194 | |||||||||||||||
Total assets | $ 4,896 | $ 5,889 | $ 4,318 | $ (8,779) | $ 6,324 | |||||||||||||||
Liabilities and equity | ||||||||||||||||||||
Current liabilities: | ||||||||||||||||||||
Accounts payable and accrued liabilities | $ 11 | $ 198 | $ 424 | $ (52) | $ 581 | |||||||||||||||
Current portion of long-term debt | – | – | 2 | – | 2 | |||||||||||||||
Accounts payable to affiliates | 336 | 135 | 2 | (473) | – | |||||||||||||||
Notes and interest payable to subsidiaries | 593 | – | – | (593) | – | |||||||||||||||
Notes payable to affiliates | – | 138 | 9 | (147) | – | |||||||||||||||
Note payable to parent | – | – | 41 | (41) | – | |||||||||||||||
Total current liabilities | 940 | 471 | 478 | (1,306) | 583 | |||||||||||||||
Long-term debt, net of current portion | 528 | 3 | 1 | – | 532 | |||||||||||||||
Long-term debt due to affiliate | – | – | 531 | (531) | – | |||||||||||||||
Pension and other postretirement benefit obligations | – | 559 | 1,387 | – | 1,946 | |||||||||||||||
Deferred income tax liabilities | – | – | 75 | – | 75 | |||||||||||||||
Other long-term liabilities | – | 36 | 36 | – | 72 | |||||||||||||||
Total liabilities | 1,468 | 1,069 | 2,508 | (1,837) | 3,208 | |||||||||||||||
Total equity | 3,428 | 4,820 | 1,810 | (6,942) | 3,116 | |||||||||||||||
Total liabilities and equity | $ 4,896 | $ 5,889 | $ 4,318 | $ (8,779) | $ 6,324 | |||||||||||||||
| CONDENSED CONSOLIDATING STATEMENT OF OPERATIONS AND COMPREHENSIVE INCOME | ||||||||||||||||||||
For the Six Months Ended June 30, 2012
| ||||||||||||||||||||
| (Unaudited, in millions) | Parent | Guarantor Subsidiaries | Non-guarantor Subsidiaries | Consolidating Adjustments | Consolidated | |||||||||||||||
Sales | $ – | $ 1,445 | $ 1,531 | $ (754) | $ 2,222 | |||||||||||||||
Costs and expenses: | ||||||||||||||||||||
Cost of sales, excluding depreciation and amortization | – | 1,279 | 1,187 | (754) | 1,712 | |||||||||||||||
Depreciation and amortization | – | 46 | 69 | – | 115 | |||||||||||||||
Distribution costs | – | 70 | 184 | – | 254 | |||||||||||||||
Selling, general and administrative expenses | 12 | 23 | 38 | – | 73 | |||||||||||||||
Closure costs, impairment and other related charges | – | – | 93 | – | 93 | |||||||||||||||
Net gain on disposition of assets | – | – | (24) | – | (24) | |||||||||||||||
Operating (loss) income | (12) | 27 | (16) | – | (1) | |||||||||||||||
Interest expense | (106) | (2) | (5) | 79 | (34) | |||||||||||||||
Other income (expense), net | – | 83 | (1) | (79) | 3 | |||||||||||||||
Parent’s equity in income of subsidiaries | 84 | – | – | (84) | – | |||||||||||||||
(Loss) income before income taxes | (34) | 108 | (22) | (84) | (32) | |||||||||||||||
Income tax benefit (provision) | 43 | (33) | (4) | – | 6 | |||||||||||||||
Net income (loss) including noncontrolling interests | 9 | 75 | (26) | (84) | (26) | |||||||||||||||
Net loss attributable to noncontrolling interests | – | – | 35 | – | 35 | |||||||||||||||
Net income attributable to Resolute Forest Products Inc. | $ 9 | $ 75 | $ 9 | $ (84) | $ 9 | |||||||||||||||
Comprehensive income attributable to Resolute Forest Products Inc. | $ 5 | $ 75 | $ 5 | $ (80) | $ 5 | |||||||||||||||
RESOLUTE FOREST PRODUCTS INC.
Notes to Unaudited Interim Consolidated Financial Statements
CONDENSED CONSOLIDATING STATEMENT OF CASH FLOWS For the Three Months Ended March 31, 2013
| |||||||||||||||||||||||||
| (Unaudited, in millions) | Parent | Guarantor Subsidiaries | Non-guarantor Subsidiaries | Consolidating Adjustments | Consolidated | ||||||||||||||||||||
Net cash (used in) provided by operating activities | $ | – | $ (50) | $ | 30 | $ | – | $ | (20 | ) | |||||||||||||||
Cash flows from investing activities: | |||||||||||||||||||||||||
Cash invested in fixed assets | – | (12) | (28) | – | (40 | ) | |||||||||||||||||||
Disposition of assets | – | – | 2 | – | 2 | ||||||||||||||||||||
Decrease in restricted cash | – | – | 2 | – | 2 | ||||||||||||||||||||
Decrease in deposit requirements for letters of credit, net | – | – | 1 | – | 1 | ||||||||||||||||||||
Advances (to) from affiliates | (5 | ) | 5 | – | – | – | |||||||||||||||||||
Net cash used in investing activities | (5 | ) | (7) | (23) | – | (35 | ) | ||||||||||||||||||
Cash flows from financing activities: | |||||||||||||||||||||||||
Payments of debt | – | – | (1) | – | (1 | ) | |||||||||||||||||||
Contribution of capital from noncontrolling interest | – | 8 | – | – | 8 | ||||||||||||||||||||
Net cash provided by (used in) financing activities | – | 8 | (1) | – | 7 | ||||||||||||||||||||
Net (decrease) increase in cash and cash equivalents | (5 | ) | (49) | 6 | – | (48 | ) | ||||||||||||||||||
Cash and cash equivalents: | |||||||||||||||||||||||||
Beginning of period | 5 | 171 | 87 | – | 263 | ||||||||||||||||||||
End of period | $ | – | $ | 122 | $ | 93 | $ | – | $ | 215 | |||||||||||||||
CONDENSED CONSOLIDATING STATEMENT OF CASH FLOWS For the Three Months Ended March 31, 2012
| |||||||||||||||||||||||||
| (Unaudited, in millions) | Parent | Guarantor Subsidiaries | Non-guarantor Subsidiaries | Consolidating Adjustments | Consolidated | ||||||||||||||||||||
Net cash provided by operating activities | $ | – | $ | 48 | $ 9 | $ | – | $ | 57 | ||||||||||||||||
Cash flows from investing activities: | |||||||||||||||||||||||||
Cash invested in fixed assets | – | (10) | (29) | – | (39 | ) | |||||||||||||||||||
Disposition of assets | – | – | 26 | – | 26 | ||||||||||||||||||||
Decrease in restricted cash | – | – | 4 | – | 4 | ||||||||||||||||||||
Increase in deposit requirements for letters of credit, net | – | – | (7) | – | (7 | ) | |||||||||||||||||||
Net cash used in investing activities | – | (10) | (6) | – | (16 | ) | |||||||||||||||||||
Cash flows from financing activities: | |||||||||||||||||||||||||
Net cash used in financing activities | – | – | – | – | – | ||||||||||||||||||||
Net increase in cash and cash equivalents | – | 38 | 3 | – | 41 | ||||||||||||||||||||
Cash and cash equivalents: | |||||||||||||||||||||||||
Beginning of period | – | 128 | 241 | – | 369 | ||||||||||||||||||||
End of period | $ | – | $ | 166 | $ | 244 | $ | – | $ | 410 | |||||||||||||||
| CONDENSED CONSOLIDATING BALANCE SHEET | ||||||||||||||||||||
As of June 30, 2013
| ||||||||||||||||||||
| (Unaudited, in millions) | Parent | Guarantor Subsidiaries | Non-guarantor Subsidiaries | Consolidating Adjustments | Consolidated | |||||||||||||||
Assets | ||||||||||||||||||||
Current assets: | ||||||||||||||||||||
Cash and cash equivalents | $ – | $ 153 | $ 95 | $ – | $ 248 | |||||||||||||||
Accounts receivable, net | – | 454 | 244 | – | 698 | |||||||||||||||
Accounts receivable from affiliates | – | 229 | 203 | (432) | – | |||||||||||||||
Inventories, net | – | 217 | 318 | (10) | 525 | |||||||||||||||
Deferred income tax assets | – | 11 | 43 | – | 54 | |||||||||||||||
Interest receivable from parent | – | 3 | – | (3) | – | |||||||||||||||
Note receivable from subsidiary | 41 | – | – | (41) | – | |||||||||||||||
Other current assets | – | 36 | 43 | – | 79 | |||||||||||||||
Total current assets | 41 | 1,103 | 946 | (486) | 1,604 | |||||||||||||||
Fixed assets, net | – | 887 | 1,467 | – | 2,354 | |||||||||||||||
Amortizable intangible assets, net | – | – | 67 | – | 67 | |||||||||||||||
Deferred income tax assets | – | 617 | 1,313 | 2 | 1,932 | |||||||||||||||
Notes receivable from affiliates | – | 530 | – | (530) | – | |||||||||||||||
Notes receivable from parent | – | 622 | – | (622) | – | |||||||||||||||
Investments in and advances to consolidated subsidiaries | 5,024 | 1,964 | – | (6,988) | – | |||||||||||||||
Other assets | 9 | 116 | 66 | – | 191 | |||||||||||||||
Total assets | $ 5,074 | $ 5,839 | $ 3,859 | $ (8,624) | $6,148 | |||||||||||||||
Liabilities and equity | ||||||||||||||||||||
Current liabilities: | ||||||||||||||||||||
Accounts payable and accrued liabilities | $ 6 | $ 199 | $ 345 | $ – | $ 550 | |||||||||||||||
Current portion of long-term debt | – | – | 2 | – | 2 | |||||||||||||||
Accounts payable to affiliates | 432 | – | – | (432) | – | |||||||||||||||
Interest payable to subsidiary | 3 | – | – | (3) | – | |||||||||||||||
Note payable to parent | – | – | 41 | (41) | – | |||||||||||||||
Total current liabilities | 441 | 199 | 388 | (476) | 552 | |||||||||||||||
Long-term debt, net of current portion | 599 | 3 | – | – | 602 | |||||||||||||||
Long-term debt due to subsidiaries | 622 | – | – | (622) | – | |||||||||||||||
Long-term debt due to affiliate | – | – | 530 | (530) | – | |||||||||||||||
Pension and other postretirement benefit obligations | – | 532 | 1,281 | – | 1,813 | |||||||||||||||
Deferred income tax liabilities | – | – | 25 | – | 25 | |||||||||||||||
Other long-term liabilities | – | 28 | 38 | – | 66 | |||||||||||||||
Total liabilities | 1,662 | 762 | 2,262 | (1,628) | 3,058 | |||||||||||||||
Total equity | 3,412 | 5,077 | 1,597 | (6,996) | 3,090 | |||||||||||||||
Total liabilities and equity | $ 5,074 | $ 5,839 | $ 3,859 | $ (8,624) | $ 6,148 | |||||||||||||||
RESOLUTE FOREST PRODUCTS INC.
Notes to Unaudited Interim Consolidated Financial Statements
| CONDENSED CONSOLIDATING BALANCE SHEET | ||||||||||||||||||||
As of December 31, 2012
| ||||||||||||||||||||
| (Unaudited, in millions) | Parent | Guarantor Subsidiaries | Non-guarantor Subsidiaries | Consolidating Adjustments | Consolidated | |||||||||||||||
Assets | ||||||||||||||||||||
Current assets: | ||||||||||||||||||||
Cash and cash equivalents | $ 5 | $ 171 | $ 87 | $ – | $ 263 | |||||||||||||||
Accounts receivable, net | – | 383 | 366 | (52) | 697 | |||||||||||||||
Accounts receivable from affiliates | – | 262 | 211 | (473) | – | |||||||||||||||
Inventories, net | – | 221 | 328 | (4) | 545 | |||||||||||||||
Deferred income tax assets | – | 11 | 45 | – | 56 | |||||||||||||||
Notes and interest receivable from parent | – | 593 | – | (593) | – | |||||||||||||||
Notes receivable from affiliates | – | 9 | 138 | (147) | – | |||||||||||||||
Note receivable from subsidiary | 41 | – | – | (41) | – | |||||||||||||||
Other current assets | – | 22 | 47 | – | 69 | |||||||||||||||
Total current assets | 46 | 1,672 | 1,222 | (1,310) | 1,630 | |||||||||||||||
Fixed assets, net | – | 908 | 1,532 | – | 2,440 | |||||||||||||||
Amortizable intangible assets, net | – | – | 69 | – | 69 | |||||||||||||||
Deferred income tax assets | – | 594 | 1,405 | 1 | 2,000 | |||||||||||||||
Note receivable from affiliate | – | 531 | – | (531) | – | |||||||||||||||
Investments in and advances to consolidated subsidiaries | 4,859 | 2,089 | – | (6,948) | – | |||||||||||||||
Other assets | – | 98 | 96 | – | 194 | |||||||||||||||
Total assets | $ 4,905 | $ 5,892 | $ 4,324 | $ (8,788) | $ 6,333 | |||||||||||||||
Liabilities and equity | ||||||||||||||||||||
Current liabilities: | ||||||||||||||||||||
Accounts payable and accrued liabilities | $ 11 | $ 198 | $ 424 | $ (52) | $ 581 | |||||||||||||||
Current portion of long-term debt | – | – | 2 | – | 2 | |||||||||||||||
Accounts payable to affiliates | 336 | 135 | 2 | (473) | – | |||||||||||||||
Notes and interest payable to subsidiaries | 593 | – | – | (593) | – | |||||||||||||||
Notes payable to affiliates | – | 138 | 9 | (147) | – | |||||||||||||||
Note payable to parent | – | – | 41 | (41) | – | |||||||||||||||
Total current liabilities | 940 | 471 | 478 | (1,306) | 583 | |||||||||||||||
Long-term debt, net of current portion | 528 | 3 | 1 | – | 532 | |||||||||||||||
Long-term debt due to affiliate | – | – | 531 | (531) | – | |||||||||||||||
Pension and other postretirement benefit obligations | – | 559 | 1,387 | – | 1,946 | |||||||||||||||
Deferred income tax liabilities | – | – | 75 | – | 75 | |||||||||||||||
Other long-term liabilities | – | 36 | 36 | – | 72 | |||||||||||||||
Total liabilities | 1,468 | 1,069 | 2,508 | (1,837) | 3,208 | |||||||||||||||
Total equity | 3,437 | 4,823 | 1,816 | (6,951) | 3,125 | |||||||||||||||
Total liabilities and equity | $ 4,905 | $ 5,892 | $ 4,324 | $ (8,788) | $ 6,333 | |||||||||||||||
RESOLUTE FOREST PRODUCTS INC.
Notes to Unaudited Interim Consolidated Financial Statements
CONDENSED CONSOLIDATING STATEMENT OF CASH FLOWS For the Six Months Ended June 30, 2013
| |||||||||||||||||||||||||||||
| (Unaudited, in millions) | Parent | Guarantor Subsidiaries | Non-guarantor Subsidiaries | Consolidating Adjustments | Consolidated | ||||||||||||||||||||||||
Net cash (used in) provided by operating activities | $ | – | $(7) | $ | 55 | $ | – | $ | 48 | ||||||||||||||||||||
Cash flows from investing activities: | |||||||||||||||||||||||||||||
Cash invested in fixed assets | – | (29) | (57) | – | (86) | ||||||||||||||||||||||||
Disposition of assets | – | – | 3 | – | 3 | ||||||||||||||||||||||||
Proceeds from insurance settlements | – | – | 4 | – | 4 | ||||||||||||||||||||||||
Decrease in restricted cash | – | – | 3 | – | 3 | ||||||||||||||||||||||||
Decrease in deposit requirements for letters of credit, net | – | – | 1 | – | 1 | ||||||||||||||||||||||||
Advances (to) from affiliates | (10) | 10 | – | – | – | ||||||||||||||||||||||||
Net cash used in investing activities | (10) | (19) | (46) | – | (75) | ||||||||||||||||||||||||
Cash flows from financing activities: | |||||||||||||||||||||||||||||
Issuance of long-term debt | 594 | – | – | – | 594 | ||||||||||||||||||||||||
Premium paid on extinguishment of debt | (84) | – | – | – | (84) | ||||||||||||||||||||||||
Payments of debt | (496) | – | (1) | – | (497) | ||||||||||||||||||||||||
Payments of financing and credit facility fees | (9) | – | – | – | (9) | ||||||||||||||||||||||||
Contribution of capital from noncontrolling interest | – | 8 | – | – | 8 | ||||||||||||||||||||||||
Net cash provided by (used in) financing activities | 5 | 8 | (1) | – | 12 | ||||||||||||||||||||||||
Net (decrease) increase in cash and cash equivalents | (5) | (18) | 8 | – | (15) | ||||||||||||||||||||||||
Cash and cash equivalents: | |||||||||||||||||||||||||||||
Beginning of period | 5 | 171 | 87 | – | 263 | ||||||||||||||||||||||||
End of period | $ | – | $ | 153 | $ | 95 | $ | – | $ | 248 | |||||||||||||||||||
CONDENSED CONSOLIDATING STATEMENT OF CASH FLOWS For the Six Months Ended June 30, 2012
| |||||||||||||||||||||||||||||
| (Unaudited, in millions) | Parent | Guarantor Subsidiaries | Non-guarantor Subsidiaries | Consolidating Adjustments | Consolidated | ||||||||||||||||||||||||
Net cash provided by operating activities | $ | – | $75 | $ | 98 | $ | – | $ | 173 | ||||||||||||||||||||
Cash flows from investing activities: | |||||||||||||||||||||||||||||
Cash invested in fixed assets | – | (24) | (34) | – | (58) | ||||||||||||||||||||||||
Disposition of assets | – | – | 26 | – | 26 | ||||||||||||||||||||||||
Acquisition of Fibrek, net of cash acquired | – | – | (24) | – | (24) | ||||||||||||||||||||||||
Decrease in restricted cash | – | – | 76 | – | 76 | ||||||||||||||||||||||||
Increase in deposit requirements for letters of credit, net | – | – | (7) | – | (7) | ||||||||||||||||||||||||
Advances from (to) affiliate | 12 | – | (12) | – | – | ||||||||||||||||||||||||
Net cash provided by (used in) investing activities | 12 | (24) | 25 | – | 13 | ||||||||||||||||||||||||
Cash flows from financing activities: | |||||||||||||||||||||||||||||
Purchases of treasury stock | (12) | – | – | – | (12) | ||||||||||||||||||||||||
Dividend to noncontrolling interests | – | – | (1) | – | (1) | ||||||||||||||||||||||||
Acquisition of noncontrolling interest | – | – | (17) | – | (17) | ||||||||||||||||||||||||
Payments of long-term debt | – | – | (15) | – | (15) | ||||||||||||||||||||||||
Net cash used in financing activities | (12) | – | (33) | – | (45) | ||||||||||||||||||||||||
Net increase in cash and cash equivalents | – | 51 | 90 | – | 141 | ||||||||||||||||||||||||
Cash and cash equivalents: | |||||||||||||||||||||||||||||
Beginning of period | – | 128 | 241 | – | 369 | ||||||||||||||||||||||||
End of period | $ | – | $ | 179 | $ | 331 | $ | – | $ | 510 | |||||||||||||||||||
RESOLUTE FOREST PRODUCTS INC.
Notes to Unaudited Interim Consolidated Financial Statements
Note 15.17. Subsequent EventsEvent
The following significant eventsevent occurred subsequent to March 31,June 30, 2013:
| • | On August 8 and 9, 2013, we distributed from the disputed claim share reserve 1,268,420 shares of common stock for the benefit of unsecured creditors under the CCAA plan of reorganization and compromise. The remaining 203,971 shares from the disputed claim reserve have been definitively allocated for distribution as follows: (1) as certain debtors had no creditor, 46,884 shares will be transferred to the Company pursuant to the CCAA plan of reorganization and compromise; and (2) 156,907 shares will be transferred to other claimholders, mostly current or former Canadian employees, subject to certain required regulatory clearances. There being no remaining unresolved unsecured claim under the CCAA plan of reorganization and compromise, this was the final distribution to unsecured creditors under that plan of reorganization. Of these distributions and allocations, 9,497 shares related to Chapter 11 general unsecured claims further distributed or allocated, as the case may be, in connection with this final CCAA distribution for administrative purposes. When we refer to “creditor protection proceedings,” we mean the proceedings under Chapter 11 of the United States Bankruptcy Code, as amended (or “Chapter 11”), and theCompanies’ Creditors Arrangement Act (Canada), as applicable (or “CCAA”), from which AbitibiBowater Inc. (our predecessor entity) and all but one of its debtor affiliates successfully emerged on December 9, 2010. When we refer to “disputed claim share reserve,” we mean the reserve of 23,382,073 shares established under the plans of reorganization for claims that remained in dispute as of the emergence date, from which there have been interim distributions to unsecured creditors as disputed claims were resolved. |
RESOLUTE FOREST PRODUCTS INC.
| ITEM 2. | MANAGEMENT’S DISCUSSION AND ANALYSIS OF FINANCIAL CONDITION AND RESULTS OF OPERATIONS |
The following management’s discussion and analysis is intended to help the reader understand Resolute Forest Products, our results of operations, cash flows and financial condition. The discussion is provided as a supplement to, and should be read in conjunction with, our consolidated financial statements and the accompanying notes contained inItem 1 – Financial Statements.
When we refer to “Resolute Forest Products,” “we,” “our,” “us” or the “Company,” we mean Resolute Forest Products Inc. with its subsidiaries and affiliates, either individually or collectively, unless otherwise indicated.
CAUTIONARY STATEMENTS REGARDING FORWARD-LOOKING INFORMATIONAND USEOF THIRD-PARTY DATA
Statements in this quarterly report on Form 10-Q that are not reported financial results or other historical information of Resolute Forest Products are “forward-looking statements” within the meaning of the Private Securities Litigation Reform Act of 1995. They include, for example, statements relating to our: efforts to reach resolution concerning the funding relief measures related to the material Canadian registered pension plans; efforts to continue to reduce costs and increase revenues and profitability, including our cost-reduction initiatives regarding selling, general and administrative expenses;initiatives; business and operating outlook; assessment of market conditions; prospects, growth strategies and the industry in which we operate; and strategies for achieving our goals generally; and our ability to repurchase or redeem our 10.25% senior secured notes due 2018 with the proceeds from the sale of our 5.875% senior notes due 2023.generally. Forward-looking statements may be identified by the use of forward-looking terminology such as the words “should,” “would,” “could,” “will,” “may,” “expect,” “believe,” “anticipate,” “attempt,” “project” and other terms with similar meaning indicating possible future events or potential impact on our business or Resolute Forest Products’ shareholders.
The reader is cautioned not to place undue reliance on these forward-looking statements, which are not guarantees of future performance. These statements are based on management’s current assumptions, beliefs and expectations, all of which involve a number of business risks and uncertainties that could cause actual results to differ materially. The potential risks and uncertainties that could cause our actual future financial condition, results of operations and performance to differ materially from those expressed or implied in this quarterly report on Form 10-Q include, but are not limited to, the potential risks and uncertainties set forth under the heading “Risk Factors” in Exhibit 99.4 to Resolute’s current report on Form 8-K filed with the U.S. Securities and Exchange Commission (the “SEC”) on April 24, 2013.
All forward-looking statements in this quarterly report on Form 10-Q are expressly qualified by the cautionary statements contained or referred to in this section and in our other filings with the SEC and the Canadian securities regulatory authorities. We disclaim any obligation to publicly update or revise any forward-looking information, whether as a result of new information, future events or otherwise, except as required by law.
RESOLUTE FOREST PRODUCTS INC.
Market and industry data
Information aboutThe information on industry orand general economic conditions contained in this quarterly report on Form 10-Q iswas derived from third-party sources and certain trade publications that we believe areto be widely accepted and accurate; however, weaccurate. We have not independently verified thisthe information and cannot provide assurancesassure you of its accuracy.
OVERVIEW
Resolute Forest Products is a global leader in the forest products industry, with a diverse range of products, including newsprint, commercial printingcoated papers, specialty papers, market pulp and wood products, which are marketed in close to 80 countries. We own or operate over 40 pulp and paper mills and wood products facilities in the U.S., Canada and South Korea, and power generation assets in Canada. By capacity, we are the largest producer of newsprint in the world, the largest producer of uncoated mechanical papers in North America and the biggest Canadian volume producer of wood products east of the Rockies. We are also a significant North American producer in coated papers and market pulp.
We report our activities in five business segments: newsprint, coated papers, specialty papers, market pulp and wood products. See “Results“Results of Operations”Operations” below for further information about our business segments.
We are guided by our vision and values, focusing on safety, profitability, accountability, sustainability and teamwork, and we believe that the following elements best define us:
| • | Competitive cost structure – as a result of aggressive cost reductions and mill rationalizations, today we compete as a leading, lower-cost North American producer. When compared to the company that filed for creditor protection in 2009, today we have |
| • | Synergistic and diversified asset base– in implementing our mill rationalization efforts, we operate our best assets, closing or selling the |
| • | Financial strength – we make disciplined capital management a priority, and we strive to maintain a conservative capital structure. |
Our Business
For information relating to our business, including our products, strategy, sustainable performance and development, and power generation assets, refer to our annual report on Form 10-K for the year ended December 31, 2012 (the “2012 annual report”). There has not been any material change in our business since December 31, 2012.
RESOLUTE FOREST PRODUCTS INC.
FirstSecond Quarter Overview
Three months ended June 30, 2013 vs. June 30, 2012
We recorded operating income of $3 million in the second quarter, compared to an operating loss of $50$32 million in the first quarter, compared to operating income of $26 million in the firstsecond quarter of 2012. Excluding special items, operating income was $12$29 million, compared to $14$66 million in the year-ago period.
Our net loss in the firstsecond quarter was $5$43 million, or net income of $28$18 million, excluding special items, on sales of $1,074$1,107 million. This compares to a net incomeloss of $23$17 million in the firstsecond quarter of 2012, or $7net income of $33 million, excluding special items, on sales of $1,054$1,168 million.
We generated a net loss per common share of $0.05,$0.45, compared to a net incomeloss of $0.23$0.17 per share in the firstsecond quarter of 2012. Excluding special items, earnings per diluted share was $0.30,$0.19, compared to $0.07$0.33 in the year-ago period.
Fibrek Inc.’s (“Fibrek”) results of operations have been included in our consolidated financial statements, in the market pulp segment, since May 2, 2012, the date we acquired a controlling interest. The amount of Fibrek’s sales and operating income included in our results for the firstsecond quarter of 2013 were $102$120 million and $7$12 million, respectively.respectively, compared to $74 million and $1 million, respectively, in the second quarter of 2012.
As more fully described below under “Change in Accounting Policy”, during the second quarter, we changed our accounting policy from the direct expensing of costs associated with planned major maintenance activities to the deferral method. The change in accounting policy was applied retroactively by adjusting comparative consolidated financial statements for the new policy.
Three Months Ended March 31, 2013 |
| Operating income |
|
| Net income |
| EPS | |||||||||||||||||
(in millions, except per share amounts) | (loss) | (loss) | ||||||||||||||||||||||
GAAP | $ | (50) | $ | (5) | $ | (0.05) | ||||||||||||||||||
Adjustments for special items | ||||||||||||||||||||||||
Charge on non-cash translation of Canadian dollar net monetary assets | – | 7 | 0.07 | |||||||||||||||||||||
Three Months Ended June 30, 2013 |
| Operating income |
| | Net income | | EPS | |||||||||||||||||
(unaudited, in millions, except per share amounts) | (loss) | (loss) | ||||||||||||||||||||||
GAAP, as reported | $ | 3 | $ | (43) | $ | (0.45) | ||||||||||||||||||
Adjustments for special items1: | ||||||||||||||||||||||||
Loss on non-cash translation of Canadian dollar net monetary assets | – | 7 | 0.07 | |||||||||||||||||||||
Closure costs, impairment and other related charges | 40 | 25 | 0.27 | 12 | 7 | 0.07 | ||||||||||||||||||
Inventory write-downs related to closures | 4 | 2 | 0.02 | 1 | 1 | 0.01 | ||||||||||||||||||
Start-up costs of idled mill | 15 | 11 | 0.12 | 13 | 9 | 0.10 | ||||||||||||||||||
Net gain on disposition of assets | (2) | (2) | (0.02) | |||||||||||||||||||||
Net loss on extinguishment of debt | – | 38 | 0.40 | |||||||||||||||||||||
Transaction costs | 3 | 3 | 0.03 | 2 | 2 | 0.02 | ||||||||||||||||||
Other income, net | – | (15) | (0.16) | – | (1) | (0.01) | ||||||||||||||||||
GAAP, as adjusted for special items | $ | 12 | $ | 28 | $ | 0.30 | $ | 29 | $ | 18 | $ | 0.19 | ||||||||||||
Three Months Ended March 31, 2012 | | Operating income | |
| Net income |
| EPS | |||||
(in millions, except per share amounts) | (loss) | (loss) | ||||||||||
GAAP | $ | 26 | $ | 23 | $ | 0.23 | ||||||
Adjustments for special items | ||||||||||||
Gain on non-cash translation of Canadian dollar net monetary assets | – | (15) | (0.15) | |||||||||
Severance | 2 | 1 | 0.01 | |||||||||
Closure costs, impairment and other related charges | 5 | 4 | 0.04 | |||||||||
Net gain on disposition of assets | (23) | (12) | (0.12) | |||||||||
Post-emergence expenses | – | 1 | 0.01 | |||||||||
Transaction costs | 4 | 4 | 0.04 | |||||||||
Other income, net | – | (2) | (0.02) | |||||||||
Non-cash charge for reorganization-related and other tax adjustments | – | 3 | 0.03 | |||||||||
GAAP, as adjusted for special items | $ | 14 | $ | 7 | $ | 0.07 |
RESOLUTE FOREST PRODUCTS INC.
RESULTSOF OPERATIONS
Consolidated Results
Selected Quarterly Financial Information
| Three Months Ended March 31, | ||||||||
| (in millions, except per share amounts) | 2013 | 2012 | ||||||
Sales | $ | 1,074 | $ | 1,054 | ||||
Operating (loss) income per segment | ||||||||
Newsprint | (2) | 21 | ||||||
Coated papers | (3) | (1) | ||||||
Specialty papers | 9 | 15 | ||||||
Market pulp | (4) | (21) | ||||||
Wood products | 16 | (6) | ||||||
Corporate / other | (66) | 18 | ||||||
Total | (50) | 26 | ||||||
Net (loss) income | (5) | 23 | ||||||
Net (loss) income per common share | ||||||||
Basic | $ | (0.05) | $ | 0.23 | ||||
Diluted | $ | (0.05) | 0.23 | |||||
Cash and cash equivalents | $ | 215 | $ | 410 | ||||
Total assets | 6,231 | 6,336 | ||||||
Adjusted EBITDA1 | $ | 72 | $ | 71 | ||||
Adjusted EBITDA margin1 | 6.7% | 6.7% | ||||||
Three Months Ended June 30, 2012 |
| Operating income |
|
| Net income |
| EPS | |||||
(unaudited, in millions, except per share amounts) | (loss) | (loss) | ||||||||||
GAAP, as reported | $ | (32) | $ | (17) | $ | (0.17) | ||||||
Adjustments for special items: | ||||||||||||
Loss on non-cash translation of Canadian dollar net monetary assets | – | 10 | 0.10 | |||||||||
Severance | 1 | 1 | 0.01 | |||||||||
Closure costs, impairment and other related charges | 88 | 45 | 0.45 | |||||||||
Inventory write-downs related to closures | 7 | 4 | 0.04 | |||||||||
Net gain on disposition of assets | (1) | (1) | (0.01) | |||||||||
Transaction costs | 3 | 3 | 0.03 | |||||||||
Other expense, net | – | 1 | 0.01 | |||||||||
Non-cash reorganization-related and other tax adjustments | – | (13) | (0.13) | |||||||||
GAAP, as adjusted for special items | $ | 66 | $ | 33 | $ | 0.33 |
| 1. |
|
Six months ended June 30, 2013 vs. June 30, 2012
We recorded an operating loss of $46 million through the first six months of the year, compared to an operating loss of $1 million in the same period of 2012. Excluding special items, operating income was $42 million, compared to $85 million in the year-ago period.
Our net loss in the first six months of 2013 was $48 million, or net income of $46 million, excluding special items, on sales of $2,181 million. This compares to net income of $9 million in the first six months of 2012, or net income of $43 million, excluding special items, on sales of $2,222 million.
We generated a net loss per common share of $0.51, compared to net income of $0.09 per diluted share in the first six months of 2012. Excluding special items, earnings per diluted share was $0.49, compared to $0.44 in the year-ago period.
Fibrek’s results of operations have been included in our consolidated financial statements, in the market pulp segment, since May 2, 2012, the date we acquired a controlling interest. The amount of Fibrek’s sales and operating income included in our results for the first six months of 2013 were $222 million and $19 million, respectively, compared to $74 million and $1 million, respectively, in the first six months of 2012.
Six Months Ended June 30, 2013 |
| Operating income |
| | Net income | | EPS | |||||
(unaudited, in millions, except per share amounts) | (loss) | (loss) | ||||||||||
GAAP, as reported | $ | (46) | $ | (48) | $ | (0.51) | ||||||
Adjustments for special items1: | ||||||||||||
Loss on non-cash translation of Canadian dollar net monetary assets | – | 14 | 0.15 | |||||||||
Closure costs, impairment and other related charges | 52 | 32 | 0.34 | |||||||||
Inventory write-downs related to closures | 5 | 3 | 0.03 | |||||||||
Start-up costs of idled mill | 28 | 20 | 0.21 | |||||||||
Net gain on disposition of assets | (2) | (2) | (0.02) | |||||||||
Net loss on extinguishment of debt | – | 38 | 0.40 | |||||||||
Transaction costs | 5 | 5 | 0.06 | |||||||||
Other income, net | – | (16) | (0.17) | |||||||||
GAAP, as adjusted for special items | $ | 42 | $ | 46 | $ | 0.49 | ||||||
Six Months Ended June 30, 2012 |
| Operating income |
|
| Net income |
| EPS | |||||
(unaudited, in millions, except per share amounts) | (loss) | (loss) | ||||||||||
GAAP, as reported | $ | (1) | $ | 9 | $ | 0.09 | ||||||
Adjustments for special items: | ||||||||||||
Gain on non-cash translation of Canadian dollar net monetary assets | – | (5) | (0.05) | |||||||||
Severance | 3 | 2 | 0.02 | |||||||||
Closure costs, impairment and other related charges | 93 | 49 | 0.50 | |||||||||
Inventory write-downs related to closures | 7 | 4 | 0.04 | |||||||||
Net gain on disposition of assets | (24) | (13) | (0.13) | |||||||||
Transaction costs | 7 | 7 | 0.07 | |||||||||
Non-cash charge for reorganization-related and other tax adjustments | – | (10) | (0.10) | |||||||||
GAAP, as adjusted for special items | $ | 85 | $ | 43 | $ | 0.44 | ||||||
| 1. | Operating income (loss), net income (loss) and net income (loss) per share, in each case as adjusted for special items, are non-GAAP financial measures, reconciled below. For more information on the calculation and reason we include this measure, see note 1 under “Results of Operations – Overview – Second Quarter Overview” above. |
RESULTSOF OPERATIONS
Consolidated Results
Selected Financial Information
| Three Months Ended June 30, | Six Months Ended June 30, | |||||||||||||||
| (unaudited, in millions, except per share amounts) | 2013 | 2012 | 2013 | 2012 | ||||||||||||
Sales | $ | 1,107 | $ | 1,168 | $ | 2,181 | $ | 2,222 | ||||||||
Operating income (loss) per segment | ||||||||||||||||
Newsprint | 10 | 32 | 8 | 53 | ||||||||||||
Coated papers | 2 | 3 | 2 | 4 | ||||||||||||
Specialty papers | – | 28 | 8 | 42 | ||||||||||||
Market pulp | 10 | (3) | 5 | (20) | ||||||||||||
Wood products | 16 | 12 | 32 | 6 | ||||||||||||
Corporate / other | (35) | (104) | (101) | (86) | ||||||||||||
Total | 3 | (32) | (46) | (1) | ||||||||||||
Net (loss) income | (43) | (17) | (48) | 9 | ||||||||||||
Net (loss) income per common share | ||||||||||||||||
Basic | $ | (0.45) | $ | (0.17) | $ | (0.51) | $ | 0.09 | ||||||||
Diluted | (0.45) | (0.17) | (0.51) | 0.09 | ||||||||||||
Adjusted EBITDA1 | $ | 90 | $ | 124 | $ | 163 | $ | 200 | ||||||||
Adjusted EBITDA margin1 | 8.1% | 10.6% | 7.5% | 9.0% | ||||||||||||
As of June 30, | As of December 31, | |||||||
| (unaudited, in millions) | 2013 | 2012 | ||||||
Cash and cash equivalents | $ | 248 | $ | 263 | ||||
Total assets | 6,148 | 6,333 | ||||||
| 1. | Earnings before interest expense, income taxes and depreciation, or“EBITDA”, adjusted EBITDA and adjusted EBITDA margin are non-GAAP financial measures. |
| EBITDA is calculated as net (loss) income including noncontrolling interests from the consolidated statements of operations, adjusted for interest expense, income taxes and depreciation and amortization. Adjusted EBITDA means EBITDA, excluding special items, such as foreign exchange translation gains and losses, |
| Three Months Ended March 31, | Three Months Ended June 30, | Six Months Ended June 30, | ||||||||||||||||||||||
| (in millions) | 2013 | 2012 | ||||||||||||||||||||||
Net (loss) income including noncontrolling interests | $ | (5) | $ | 33 | ||||||||||||||||||||
| (unaudited, in millions) | 2013 | 2012 | 2013 | 2012 | ||||||||||||||||||||
Net loss including noncontrolling interests | $ | (44) | $ | (62) | $ | (49) | $ | (26) | ||||||||||||||||
Interest expense | 14 | 16 | 13 | 18 | 27 | 34 | ||||||||||||||||||
Income tax benefit | (41) | (10) | ||||||||||||||||||||||
Income tax (benefit) provision | (31) | 2 | (71) | (6) | ||||||||||||||||||||
Depreciation and amortization | 60 | 57 | 61 | 58 | 121 | 115 | ||||||||||||||||||
EBITDA | $ | 28 | $ | 96 | $ | (1) | $ | 16 | $ | 28 | $ | 117 | ||||||||||||
Foreign exchange translation loss (gain) | 5 | (12) | ||||||||||||||||||||||
Employee termination costs | – | 2 | ||||||||||||||||||||||
Loss (gain) on non-cash translation of Canadian dollar net monetary assets | 7 | 9 | 12 | (3) | ||||||||||||||||||||
Severance | – | 1 | – | 3 | ||||||||||||||||||||
Closure costs, impairment and other related charges | 40 | 5 | 12 | 88 | 52 | 93 | ||||||||||||||||||
Inventory write-downs related to closures | 4 | – | 1 | 7 | 5 | 7 | ||||||||||||||||||
Start up costs of idled mill | 15 | – | 13 | – | 28 | – | ||||||||||||||||||
Net gain on disposition of assets | – | (23) | (2) | (1) | (2) | (24) | ||||||||||||||||||
Post-emergence costs | – | 2 | ||||||||||||||||||||||
Net loss on extinguishment of debt | 59 | – | 59 | – | ||||||||||||||||||||
Transaction costs | 3 | 4 | 2 | 3 | 5 | 7 | ||||||||||||||||||
Other income, net | (23) | (3) | ||||||||||||||||||||||
Other (income) expense, net | (1) | 1 | (24) | – | ||||||||||||||||||||
Adjusted EBITDA | $ | 72 | $ | 71 | $ | 90 | $ | 124 | $ | 163 | $ | 200 | ||||||||||||
First quarterThree months ended June 30, 2013 vs. first quarterJune 30, 2012
Operating (loss) income variance analysis
Sales
Sales rose by $20Our sales were $61 million, or 1.9%5%, to $1,074lower than the year-ago period, at $1,107 million. Volume dropped $96 million with the additionas a result of Fibrek’s sales ($102 million) and gains in overall pricing outweighing the decline in volume ($97 million). The volume reduction is due mainly to our 2012 efforts to adjuststreamline production and adapt to changing market dynamics by focusing our production in ourthe most cost-effective mills, as a result of whichmills. Accordingly, we operatednow operate four fewer machines overall compared to the year-ago period. Inperiod, not including the three pulp mills acquired with Fibrek. These Fibrek mills generated an additional $46 million of sales compared to the year-ago period, as we started to include their results of operations in our consolidated financial statements as of May 2, 2012, the date we acquired a controlling interest.
Pricing for all grades consolidated slid by $11 million, reflecting the net unfavorable effect of a drop in newsprint pricing ($24 million) and since then, we:
idled and subsequently sold our Mersey, Nova Scotia, newsprint mill, which can no longer be usedspecialty papers ($8 million), compared to make paper;
restarted a high-gloss paper machine in Dolbeau, Quebec;
closed a high-gloss paper machine in Laurentide, Quebec;
indefinitely idled the pulp mill and high-bright and book paper machine in Fort Frances, Ontario;
indeterminately idled a coated paper machine in Catawba, South Carolina;
indefinitely idled a newsprint machine at our Calhoun, Tennessee, mill;
are currently in the final stages of restarting our Gatineau, Quebec, newsprint mill.
We gained $15 million in overallsignificantly higher pricing over the first quarter of 2012, reflecting a $104 per thousand board feet increase infor wood products ($23 million). The average transaction price infor coated paper and pulp grades, including the wood products segment ($36 million), offset by a $26 per metric ton drop in average transaction price in newsprint ($15 million) and lower levels in specialty papers ($4 million) and market pulp, in large part as a result of a significant decrease in pricing for fluff pulp ($4 million).former Fibrek mills, was unchanged.
Compared to the firstsecond quarter of 2012, we took approximately 116,00066,000 metric tons less downtime in our newsprint, specialty and market pulp segments, not including 39,000 metric tonsdowntime associated with machines that were closed or idled later in 2012. Inventories rose 59,00025,000 metric tons in newsprint and 33,000 thousand board feet in wood products, but they dropped 16,000 metric tons in market pulp because of Fibrek, and 37,000 metric22,000 short tons in newsprint.specialty.
RESOLUTE FOREST PRODUCTS INC.
Cost of sales, excluding depreciation and amortization
Cost of sales, excluding depreciation and amortization, which we refer to as “COS”, increaseddecreased by $21$22 million reflecting an $11 million improvement after adjusting forin the effect of Fibrekquarter, including lower volume ($7849 million) and COS associated with the loweradditional Fibrek volume ($4628 million). ItOverall COS was favorablyotherwise affected by:
lower non-Fibrek manufacturing costs due mainly to lower labor costs, improved operating efficiencies and external power sales from our continued asset optimizationnew cogeneration facilities, offset by higher steam costs and labor restructuring initiativesstumpage fees ($18 million);
costs associated with the restart of the Gatineau, Quebec, mill ($13 million);
timing of annual outage at our Coosa Pines, Alabama, milla decrease in other closed or idled mills costs ($89 million), which has been delayed to the second quarter; and;
the idlingfavorable impact of a weaker Canadian dollar compared to the Mersey facility last JuneU.S. dollar ($7 million); and
an increase in the net pension expense ($5 million) due primarily to the amortization of actuarial losses starting in 2013.
Compared to 2013, 2012 COS was also favorably affected with the receipt of insurance proceeds ($4 million) for the 2011 roof collapse at our Clermont mill and unfavorably affected by inventory variation costs associated with the significant reduction in specialty papers inventory ($6 million).
But costs were unfavorably affectedThe cogeneration assets used to make external sales of power – Dolbeau (specialty papers), Fort Frances (specialty papers), Gatineau (newsprint), Saint-Felicien (market pulp) and Thunder Bay (newsprint and market pulp) – together reduced COS by higher mill start-up costs and increases in certain other manufacturing costs, as more fully describedapproximately $14 million in the segment variances below.second quarter of 2013, $11 million higher than the same period in 2012. These results do not include other operational efficiencies realized with the operation of the cogeneration assets, such as labor efficiencies.
Depreciation and amortization
Depreciation and amortization increased by $3 million, mainly as a result of the acquisition of Fibrek’s assets.
Selling, general and administrative expenses
Selling, general and administrative expenses, which we refer to as “SG&A”, rose by $12$3 million in the quarter, primarily because we recorded in the firstsecond quarter of 2012 we recorded a refund of certain group benefit premiums paid in prior years ($92 million).
Closure costs, impairment and other related charges
We recorded closure costs, impairment and other related charges of $40$12 million, $35$76 million moreless than in the year-ago period. This reflects mainlyCurrent period items included accelerated depreciation and severance charges associated with the idling of a newsprint machine at our Calhoun mill.
Net gain on disposition Second quarter 2012 items included asset impairment and severance charges associated with the indefinite idling of assets
The lower net gain on disposition of assets reflects the sale, in the first quarter of 2012, of timberlands inMersey, Nova Scotia, ($22 million).newsprint mill, which we later sold.
Net (loss) incomeloss variance analysis
Net loss was $5 million, or $0.05 per share, a decrease of $28 million, or $0.28 per share, compared to net income of $23 million, or $0.23 per diluted share, in the first quarter of 2012.
Interestexpense
Interest expense decreased by $2$5 million, to $14$13 million, reflecting the lower principal amount of senior secured notes because of andue 2018 following the $85 million redemption in October 2012.
RESOLUTE FOREST PRODUCTS INC.
Because of the mid-quarter completion, the refinancing of our 10.25% senior secured notes due 2018 with 5.875% senior unsecured notes due 2023 had only a $1 million favorable effect in the second quarter.
Other income,expense, net
Other income,expense, net, rose by $5$55 million, to $18 million. The change stems from$65 million, reflecting the forgivenesstender premium paid to holders of a $12 million note payable in connection with our acquisition of our former joint venture partner’s interest in Calhoun Newsprint Company (or “CNC”)2018 notes ($84 million), andrecorded as a $9 million distribution from the liquidation of a former U.K. subsidiary, offset by a $5 million loss on extinguishment of debt, net of the translationwrite-down of Canadian dollar net monetary assets to U.S. dollars. This compares to a $12 million gain on the translation of Canadian dollar net monetary assets to U.S. dollars in the first quarter of 2012.associated unamortized premium ($25 million).
Income taxes
We recorded a $41$31 million income tax benefit in the firstsecond quarter of 2013, on a loss before income taxes of $46$75 million, resulting in an effective tax rate forof 41%. Compared to the first quarterU.S. federal statutory income tax rate of 89%. The35%, our effective tax rate reflects the favorable effectsimpact of a $35 million reversal of valuation allowances, primarily related to available U.S. capital losses that we will now be able to use as a result of the acquisition of the noncontrolling interestdifferences in CNC, partly offset by the unfavorable impacts related to various non-deductible itemsstate and otherforeign tax adjustments.rates. In the firstsecond quarter of 2012, we recorded an income tax benefitprovision of $10$2 million on incomea loss before income taxes of $23$60 million, resulting in an effective tax rate of (43)(3)%. TheOur effective tax rate in the firstsecond quarter of 2012 was impacted by favorable adjustmentsan increase in our valuation allowance related to researchcosts associated with the indefinite idling of our Mersey newsprint mill, where we did not recognize tax benefits and developmentfavorable reorganization-related adjustments.
In accordance with Financial Accounting Standards Board (“FASB”) Accounting Standards Codification (“ASC”) 740 “Income Taxes”, we calculated our income tax incentives,benefit using the discrete method. We considered that the consolidated estimated annual effective tax rate was not a reliable estimate of the year-to-date income tax benefit (provision) because small changes in estimated income in different tax jurisdictions would result in significant changes in the estimated consolidated annual effective tax rate.
At each reporting period, we assess whether it is more likely than not that the deferred income tax assets will be realized based on the review of all available positive and negative evidence, including future reversals of existing taxable temporary differences, estimates of future taxable income, past operating results and prudent and feasible tax planning strategies. The impact of changing dynamics in the pulp and paper industry on the actual and forecasted earnings of our U.S. operations may limit our ability to continue to recognize our deferred income tax assets. If future results do not meet expectations, we may be required to reduce our U.S. net deferred income tax assets by recording a valuation allowance of up to $630 million, representing the U.S. portion of the net deferred income tax asset of $1,961 million as wellof June 30, 2013. Such valuation allowance, if taken, would be recorded as foreign exchange related items, partly offset by an unfavorable reorganization-relateda charge to income tax expense and other tax adjustment.could materially affect our results of operations and financial condition.
Some of our Canadian subsidiaries, including our principal Canadian operating subsidiary, use the U.S. dollar as functional currency but determine taxable income in Canadian dollars. This can cause frequent and substantial variations to our effective tax rate compared to the
weighted-average of both domestic and foreign statutory tax rates because the foreign exchange gains and losses used to calculate the income tax provision of our Canadian subsidiaries are determined on a different basis from the foreign exchange gains and losses included in our consolidated financial statements. Due to the variability and volatilityunpredictability of foreign exchange rates, we are unable to estimate the impact of future changes in exchange rates on our effective tax rate.
Noncontrolling interests
WeIn the first half of 2012, we recorded incomea loss of $10$45 million attributable to noncontrolling interests, in the first quarter of 2012, primarily representing our former joint venture partner’s share of the impairment, severance and other charges related to the indefinite idling of the Mersey newsprint mill, which we later sold.
Six months ended June 30, 2013 vs. June 30, 2012
Operating loss variance analysis
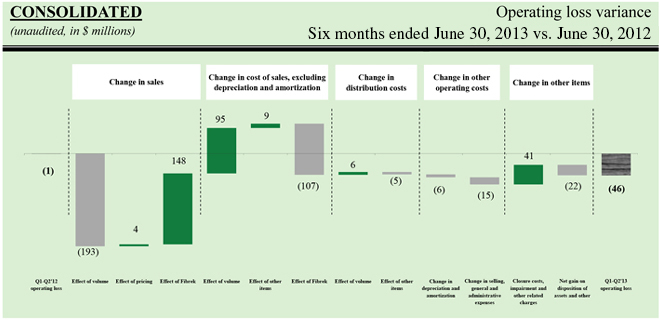
Sales
Our sales were $41 million lower, or 2%, than the year-ago period, at $2,181 million. Volume dropped $193 million as a result of our efforts to streamline production and adapt to changing market dynamics by focusing production in the most cost-effective mills. Accordingly, we now operate four fewer machines overall compared to the year-ago period, not including the three pulp mills acquired with Fibrek. These Fibrek mills generated an additional $148 million of sales compared to the year-ago period, as we started to include their results of operations in our consolidated financial statements as of May 2, 2012, the date we acquired a controlling interest.
Average pricing for all grades rose by $4 million, reflecting the net favorable effect of higher pricing in wood products ($59 million), offset by a drop in newsprint pricing ($39 million), specialty papers ($12 million) and non-Fibrek pulp ($5 million).
Compared to the first half of 2012, we took approximately 116,000 metric tons less downtime in our newsprint, specialty and market pulp segments, not including downtime associated with machines that were closed or idled later in 2012. Inventories rose 25,000 metric tons in newsprint and 33,000 thousand board feet in wood products, but they dropped 16,000 metric tons in market pulp and 22,000 short tons in specialty.
Cost of sales, excluding depreciation and amortization
COS increased by $3 million in the first half of the year. Excluding the higher costs associated with Fibrek ($107 million), which were partially offset by lower sales volumes ($95 million), overall COS was otherwise affected by:
lower manufacturing costs due mainly to lower labor costs, improved operating efficiencies and external power sales from our new cogeneration facilities, offset by higher steam costs and stumpage fees ($35 million);
costs associated with the restart of the Gatineau mill ($28 million);
a decrease in other closed or idled mills costs ($10 million);
the favorable impact of a weaker Canadian dollar compared to the U.S. dollar ($10 million); and
an increase in the net pension expense ($9 million) due primarily to the amortization of actuarial losses starting in 2013.
In 2012, COS was also favorably affected with the receipt of insurance proceeds ($7 million) for the 2011 roof collapse at our Clermont mill.
Depreciation and amortization
Depreciation and amortization increased by $6 million, mainly as a result of the acquisition of Fibrek’s assets.
Selling, general and administrative expenses
SG&A rose by $15 million during the first six months of the year, on account of the acquisition of Fibrek ($5 million) and because we recorded a refund of certain group benefit premiums paid in prior years ($11 million) in the first half of 2012.
Closure costs, impairment and other related charges
We recorded closure costs, impairment and other related charges of $52 million, $41 million less than in the year-ago period, as a result of accelerated depreciation and severance charges and other charges associated with the idling of a newsprint machine at our Calhoun mill ($49
million) in the first half of 2013, compared to the first half of 2012, asset impairment and severance and other charges associated with the indefinite idling of the Mersey, newsprint mill ($88 million), which we later sold.
Net gain on disposition of assets
We recorded a gain on disposition of assets of $2 million in the first half of 2013 compared to $24 million in the year-ago period, related to the sale of timberlands in Nova Scotia.
Net (loss) income variance analysis
Interestexpense
Interest expense decreased by $7 million, to $27 million, reflecting the lower principal amount of senior secured notes due 2018 following the $85 million redemption in October 2012. Because of the mid-second quarter completion, the refinancing of our 10.25% senior secured notes due 2018 with 5.875% senior unsecured notes due 2023 had only a $1 million favorable effect in the first six months.
Other (expense) income, net
The $47 million we recorded as other expense, net, was the product of:
the tender premium paid to holders of 2018 notes ($84 million) in the refinancing;
a write-down of the unamortized premium associated with the 2018 notes ($25 million);
a loss on non-cash translation of Canadian dollar net monetary assets ($12 million);
| • | the forgiveness of a note payable in connection with our acquisition of a former joint venture partner’s interest in Calhoun Newsprint Company (“CNC”) ($12 million); and |
a distribution from the liquidation of a former U.K. subsidiary ($9 million).
Income taxes
We recorded a $71 million income tax benefit in the first six months of 2013, on a loss before income taxes of $120 million, resulting in an effective tax rate of 59%. The effective tax rate reflects the favorable impact of a $33 million reversal of valuation allowance, primarily related to available U.S. capital losses which are now expected to be utilized in the future as a result of the acquisition of the noncontrolling interest in CNC, partly offset by the unfavorable impacts related to various non deductible items and other tax adjustments. In the first six months of 2012, we recorded an income tax benefit of $6 million on a loss before income taxes of $32 million, resulting in an effective tax rate of 19%. Our effective tax rate in the first six months of 2012 reflects the impact of an increase in our valuation allowance related to costs associated with the indefinite idling of our Mersey newsprint mill, where we did not recognize tax benefits and favorable reorganization-related adjustments and research and development tax incentives.
Noncontrolling interests
In the first half of 2012, we recorded a loss of $35 million attributable to noncontrolling interests, primarily representing our former joint venture partner’s share of the impairment, severance and other charges related to the indefinite idling of the Mersey newsprint mill, which we later sold, partially offset by the partner’s share of the gain from the sale of timberlands in Nova Scotia.
RESOLUTE FOREST PRODUCTS INC.
Segment Earnings
We manage our business based on the products we manufacture. Our reportable segments correspond to our principal product lines: newsprint, coated papers, specialty papers, market pulp and wood products.
We do not allocate any of the income or loss items following “operating income (loss) income”” in our consolidated statements of operations to our segments because those items are reviewed separately by management. Similarly, we do not allocate to the segments closure costs, impairment and other related charges, employee termination costs,severance, net gain on disposition of assets, as well as other discretionary charges or credits. We also exclude certain corporate items from the segments, and present those separately as corporate and other, consistent with how management analyzes the results.
We allocate depreciation and SG&A to the segments, with the exception of employee termination costsseverance and certain other discretionary charges and credits, which we present under corporate and other.
NEWSPRINT
Highlights
| Three Months Ended March 31, | ||||||||
| (in millions, except where otherwise stated) | 2013 | 2012 | ||||||
Sales | $ | 356 | $ | 416 | ||||
Operating (loss) income 1 | (2) | 21 | ||||||
EBITDA2 | 16 | 39 | ||||||
(in thousands of metric tons) | ||||||||
Shipments | 563 | 633 | ||||||
Downtime | 55 | 85 | ||||||
Inventory at end of period | 110 | 73 | ||||||
| Three Months Ended March 31, | ||||||||
| (in millions) | 2013 | 2012 | ||||||
Net (loss) income including noncontrolling interests | $ | (2) | $ | 21 | ||||
Depreciation and amortization | 18 | 18 | ||||||
EBITDA | 16 | 39 | ||||||
RESOLUTE FOREST PRODUCTS INC.
Industry trends
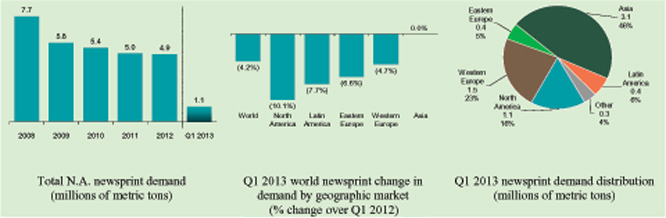
Source: Pulp & Paper Products Council (or “PPPC”)
Total North American newsprint demand declined 10% in the first quarter of 2013. Demand from newspapers and other end-users, mainly commercial printers, was down 11% and 8%, respectively. At 91%, however, the average operating rate in the industry remained elevated on a shipment-to-capacity basis. Global demand for newsprint was down 4% in the first quarter, including an 8% decline in Latin America, a 7% and 5% decline in Eastern and Western Europe, respectively, and a 3% decline in India. Exports from North American producers were up 8% compared to the first quarter of 2012, representing an increase of nearly 40,000 metric tons.
RESOLUTE FOREST PRODUCTS INC.
First quarter 2013 vs. first quarter 2012
Operating (loss) income variance analysis
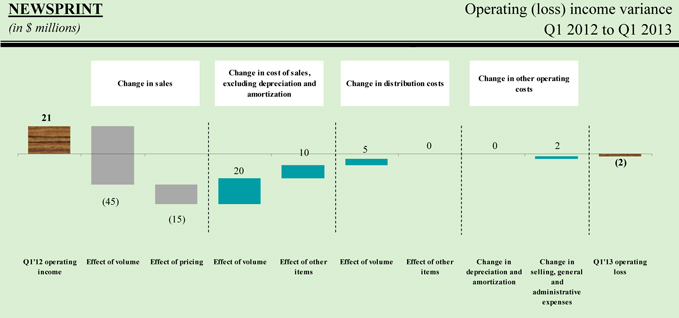
Sales
Newsprint sales decreased $60 million, or 14%, to $356 million, primarily as a result of a 70,000 metric ton decrease in shipments ($45 million) and a $26 per metric ton reduction in average transaction price ($15 million).
The decline in shipments reflects our efforts to adjust to market dynamics by focusing our production in our most cost-effective mills, including closing the Mersey facility in June and idling a newsprint machine at the Calhoun mill in March of this year. We took 9,000 metric tons less downtime this quarter (net of 21,000 tons associated with the Mersey mill) and our inventory rose by 37,000 metric tons. Our export volume represented 46% of total shipments, compared to 43% in the first quarter of 2012.
Cost of sales, excluding depreciation and amortization
Segment COS improved by $30 million, or $10 million when removing the impact of lower volume. In addition to a $2 million favorable effect from a lower average Canadian dollar against the U.S. dollar in the period, manufacturing costs improved by $8 million, reflecting lower fixed costs following the closure of Mersey, favorable chip pricing in Quebec and the benefit of mill labor restructurings and other efficiency initiatives, offset in part by additional maintenance costs, and higher steam and power costs as a result of higher natural gas prices and higher wood costs in the U.S.
RESOLUTE FOREST PRODUCTS INC.
COATED PAPERS
Highlights
| Three Months Ended March 31, | ||||||||
| (in millions, except where otherwise stated) | 2013 | 2012 | ||||||
Sales | $ | 102 | $ | 128 | ||||
Operating loss1 | (3) | (1) | ||||||
EBITDA2 | 6 | 9 | ||||||
(in thousands of short tons) | ||||||||
Shipments | 126 | 162 | ||||||
Downtime | 36 | 12 | ||||||
Inventory at end of period | 19 | 22 | ||||||
| Three Months Ended March 31, | ||||||||
| (in millions) | 2013 | 2012 | ||||||
Net loss including noncontrolling interests | $ | (3) | $ | (1) | ||||
Depreciation and amortization | 9 | 10 | ||||||
EBITDA | 6 | 9 | ||||||
Industry trends
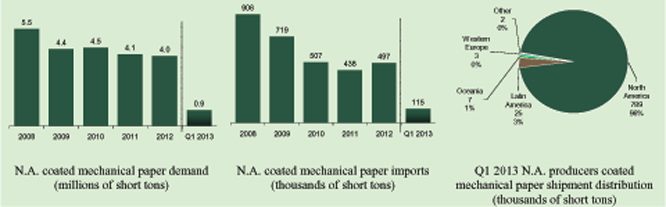
Source: PPPC
North American total demand for coated mechanical paper was down 5% in the first quarter, with shipments from North American producers down 10%, about 90,000 short tons, and imports up 12%, or about 12,000 short tons, mostly from Western Europe. Accordingly, the industry shipment-to-capacity ratio fell to 87% for the quarter, compared to an average of 94% for 2012.
RESOLUTE FOREST PRODUCTS INC.
First quarter 2013 vs. first quarter 2012
Operating loss variance analysis
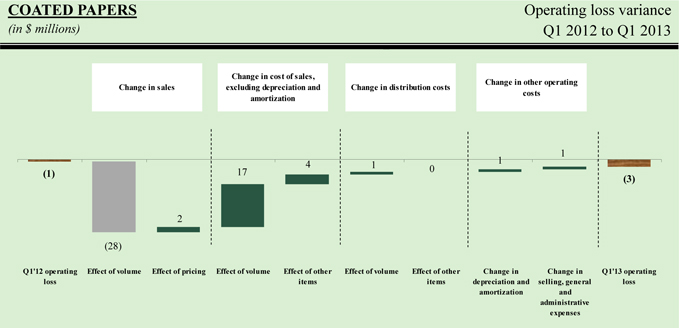
Sales
Coated paper sales decreased $26 million, or 20%, to $102 million. The indeterminate idling of a paper machine at our Catawba mill in June of 2012 accounts for the 36,000 short tons (33,000 metric tons) of lower volume ($28 million). The idled machine represents a reduction of approximately 146,000 short tons (132,000 metric tons) of capacity on an annualized basis. Compared to the year-ago period, average transaction price improved $20 per short ton ($2 million).
Cost of sales, excluding depreciation and amortization
Segment COS decreased $21 million in the first quarter, or $4 million when adjusted for the impact of volume. This reflects favorable power costs and labor and maintenance cost savings following the Catawba machine idling, offset in part by higher costs of chemicals and fiber.
RESOLUTE FOREST PRODUCTS INC.
SPECIALTY PAPERS
Highlights
| Three Months Ended March 31, | ||||||||
| (in millions, except where otherwise stated) | 2013 | 2012 | ||||||
Sales | $ | 238 | $ | 272 | ||||
Operating income 1 | 9 | 15 | ||||||
EBITDA2 | 19 | 27 | ||||||
(in thousands of short tons) | ||||||||
Shipments | 323 | 363 | ||||||
Downtime | 9 | 40 | ||||||
Inventory at end of period | 74 | 80 | ||||||
| Three Months Ended March 31, | ||||||||
| (in millions) | 2013 | 2012 | ||||||
Net income including noncontrolling interests | $ | 9 | $ | 15 | ||||
Depreciation and amortization | 10 | 12 | ||||||
EBITDA | 19 | 27 | ||||||
Industry trends

Source: PPPC
Total North American demand for uncoated mechanical paper declined 2% in the first quarter, reflecting an increase of 8% in high-gloss grades, but a drop of 8% in higher brightness grades and a 16% drop in lightweight grades, where we have only limited exposure. The shipment-to-capacity ratio stood at 89% at the end of March, compared to an average of 90% in the year-ago period, in part the result of significant capacity additions in North America in late 2012.
RESOLUTE FOREST PRODUCTS INC.
First quarter 2013 vs. first quarter 2012
Operating income variance analysis
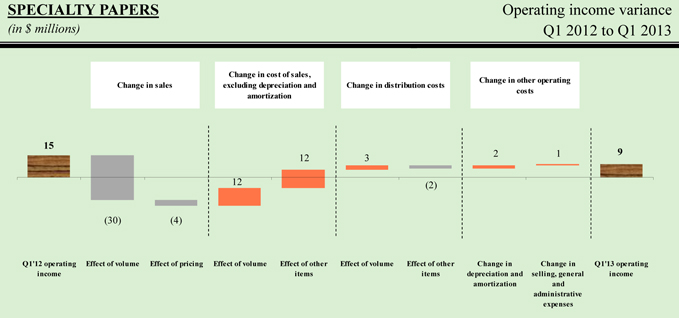
Sales
Specialty paper sales decreased $34 million, or 13%, to $238 million, reflecting the unfavorable effect of a 40,000 short ton decrease in shipments ($30 million) and a $12 per short ton, or 2%, reduction in average transaction price ($4 million).
The 40,000 short ton decline in shipments reflects our efforts to adjust to market dynamics by focusing our production in our most cost-effective mills, including the idling of two higher-cost paper machines in November 2012 and the re-start of our lower-cost Dolbeau, Quebec, facility. We took 12,000 short tons less downtime this quarter (net of 19,000 short tons associated with the two idled machines). These adjustments resulted in a net decrease of approximately 100,000 short tons (90,000 metric tons) of operating capacity on an annualized basis.
Cost of sales, excluding depreciation and amortization
Segment COS decreased $24 million, or $12 million when adjusting for the effects of volume. The cost improvement results partly from more competitive operating performance with the Dolbeau mill, including its cogeneration facility, having reached full production; and other mill-level efficiency improvements.
RESOLUTE FOREST PRODUCTS INC.
MARKET PULP
Highlights
| Three Months Ended March 31, | ||||||||
| (in millions, except where otherwise stated) | 2013 | 2012 | ||||||
Sales | $ | 240 | $ | 127 | ||||
Operating loss1 | (4) | (21) | ||||||
EBITDA1 | 9 | (13) | ||||||
| (in thousands of metric tons) | ||||||||
Shipments | 374 | 199 | ||||||
Downtime | 19 | 77 | ||||||
Inventory at end of period | 113 | 54 | ||||||
RESOLUTE FOREST PRODUCTS INC.
| Three Months Ended March 31, | ||||||||
| (in millions) | 2013 | 2012 | ||||||
Net loss including noncontrolling interests | $ | (4) | $ | (21) | ||||
Depreciation and amortization | 13 | 8 | ||||||
EBITDA | 9 | (13) | ||||||
Industry trends
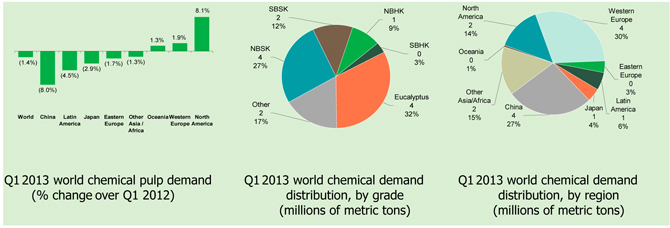
Source: PPPC
Overall chemical market pulp demand slipped 1.4% in the first quarter. Demand from China was down 8%, but it was up 2% in Western Europe and 8% in North America, on U.S. tissue paper capacity increases. Global demand for softwood pulp, which represents about 80% of our virgin fiber capacity, was down 1% in the quarter, including a 6% increase in demand for southern bleached softwood kraft and 2% decrease in demand for northern bleached softwood kraft.
RESOLUTE FOREST PRODUCTS INC.
First quarter 2013 vs. first quarter 2012
Operating loss variance analysis
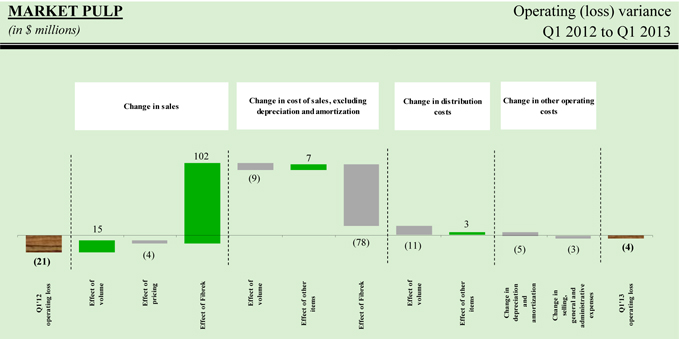
Sales
Sales rose $113 million, or 89%, to $240 million, mostly as a result of our acquisition of Fibrek, but also a 25,000 metric ton increase ($15 million) in non-Fibrek shipments owing to 60,000 metric tons less downtime, annual maintenance timing and operational configuration adjustments. Not including Fibrek, average transaction price was $20 per metric ton lower ($4 million), in large part as a result of a significant decrease in pricing for fluff pulp.
Cost of sales, excluding depreciation and amortization
Segment COS increased $80 million in the first quarter, mostly because of Fibrek ($78 million). Excluding the impact of non-Fibrek higher volume ($9 million), COS was $7 million lower, mostly as a result of the favorable impact of annual maintenance timing for the Coosa Pines mill, which was delayed to the second quarter, partly offset by higher costs for chemicals, wood and other maintenance.
Distribution costs & depreciation and amortization
Primarily as a result of adding the three Fibrek mills to our asset base, segment depreciation and amortization increased by $5 million and distribution costs increased by $8 million.
Selling, general and administrative expenses
SG&A increased $3 million on account of the acquisition of Fibrek.
RESOLUTE FOREST PRODUCTS INC.
WOOD PRODUCTS
Highlights
| Three Months Ended March 31, | Three Months Ended June 30, | Six Months Ended June 30, | ||||||||||||||||||||||
| (in millions, except where otherwise stated) | 2013 | 2012 | ||||||||||||||||||||||
| (unaudited, in millions, except where otherwise stated) | 2013 | 2012 | 2013 | 2012 | ||||||||||||||||||||
Sales | $ | 138 | $ | 111 | $ | 364 | $ | 416 | $ | 720 | $ | 832 | ||||||||||||
Operating income (loss)1 | 16 | (6) | ||||||||||||||||||||||
Operating income 1 | 10 | 32 | 8 | 53 | ||||||||||||||||||||
EBITDA2 | 25 | 3 | 28 | 50 | 44 | 89 | ||||||||||||||||||
| (in millions of board feet) | ||||||||||||||||||||||||
(in thousands of metric tons) | ||||||||||||||||||||||||
Shipments | 338 | 367 | 596 | 639 | 1,159 | 1,272 | ||||||||||||||||||
Downtime | 136 | 165 | 21 | 71 | 77 | 156 | ||||||||||||||||||
Inventory at end of period | 122 | 131 | 107 | 82 | 107 | 82 | ||||||||||||||||||
| 1. | Net income (loss) including noncontrolling interests is equal to operating income (loss) in this segment. |
| 2. | EBITDA, a non-GAAP financial measure, is reconciled below. For more information on the calculation and reason we include this measure, see note 1 under “Results of Operations – Consolidated |
| Three Months Ended March 31, | Three Months Ended June 30, | Six Months Ended June 30, | ||||||||||||||||||||||
| (in millions) | 2013 | 2012 | ||||||||||||||||||||||
Net income (loss) including noncontrolling interests | $ | 16 | $ | (6) | ||||||||||||||||||||
| (unaudited, in millions) | 2013 | 2012 | 2013 | 2012 | ||||||||||||||||||||
Net income including noncontrolling interests | 10 | $ | 32 | 8 | $ | 53 | ||||||||||||||||||
Depreciation and amortization | 9 | 9 | 18 | 18 | 36 | 36 | ||||||||||||||||||
EBITDA | 25 | 3 | 28 | 50 | 44 | 89 | ||||||||||||||||||
Industry trends
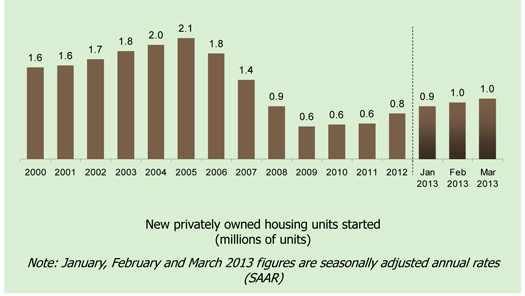
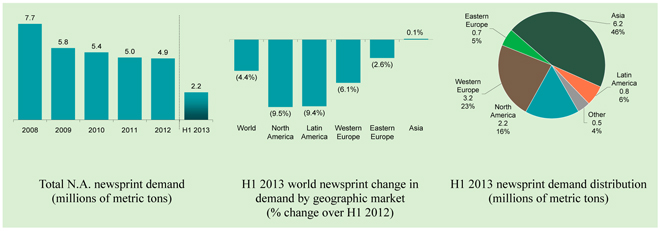
Source: U.S. Census BureauPulp & Paper Products Council (or “PPPC”)
Seasonally-adjusted housing starts reached 1.04 millionTotal North American newsprint demand declined 10% in March 2013,the first half of the year, reflecting a 10% drop from newspaper publishers and a 6% decline from other users. Global demand for newsprint was down 4% through June, including: Latin America (down 9%), Western Europe (down 6%), China (down 1%), India (up 5%) and Turkey (up 18%). The average operating rate in the North American industry on a shipment-to-capacity basis was at 92% through six months.
While precarious because of currency fluctuations, exports from North American producers were up 47% from9%, an increase of over 80,000 metric tons, compared to the Marchfirst half of 2012, levels.reflecting mainly gains in shipments to non-Japan Asia, up 36%, although shipments to Western Europe were down 33%.
RESOLUTE FOREST PRODUCTS INC.Three months ended June 30, 2013 vs. June 30, 2012
Operating income variance analysis
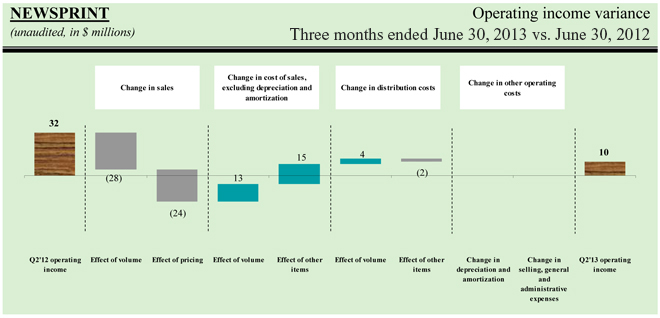
Sales
Newsprint sales decreased $52 million, or 12.5%, to $364 million, as a result of a 43,000 metric ton decrease in shipments ($28 million) and a $40 per metric ton reduction in average transaction price ($24 million).
The decline in shipments reflects our efforts to adjust to market dynamics by focusing our production in our most cost-effective mills. We idled and subsequently sold the Mersey facility in 2012 and indefinitely idled a newsprint machine at the Calhoun mill in March of this year. We restarted the Gatineau mill, including its power cogeneration facility, during the second quarter.
We took 30,000 metric tons less downtime this quarter, not including the 20,000 tons of second quarter 2012 downtime at the Mersey mill. Finished goods inventory rose by 25,000 metric tons. Our export volume represented 45% of total shipments, compared to 43% in the second quarter of 2012.
Cost of sales, excluding depreciation and amortization
Segment COS improved by $28 million, or $15 million after adjusting for the lower volume. In addition to a $3 million favorable change from a lower average Canadian dollar against the U.S. dollar in the period, manufacturing costs improved by $19 million, reflecting:
power sales from cogeneration assets and asset optimization efficiencies with the Gatineau mill operating rather than the Mersey and Calhoun mills ($12 million);
lower overall fiber costs ($6 million); and
lower labor costs from our various restructuring initiatives ($4 million).
These items were only partially offset by unfavorable steam and power costs because of higher natural gas prices ($3 million).
2012 segment COS was also favorably affected with the receipt of insurance proceeds ($4 million) for the 2011 roof collapse at our Clermont mill.
First quarterSix months ended June 30, 2013 vs. June 30, 2012
Operating income variance analysis
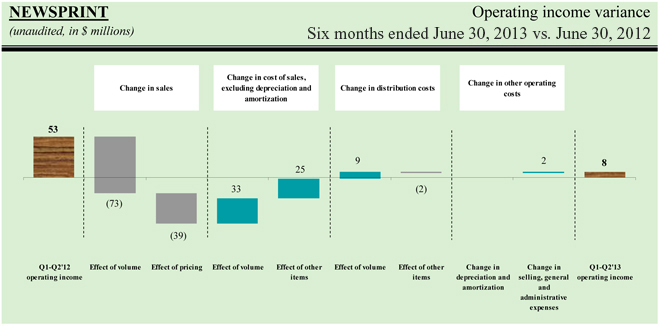
Sales
Newsprint sales decreased $112 million, or 13.5%, to $720 million. This reflects a 113,000 metric ton decrease in shipments ($73 million), for the reasons described above, and a $33 per metric ton reduction in average transaction price ($39 million).
We took 38,000 metric tons less downtime this quarter, not including the 41,000 tons of first half 2012 downtime at the Mersey mill. Our export volume represented 45% of total shipments, compared to 43% in the first six months of 2012.
Cost of sales, excluding depreciation and amortization
Segment COS improved by $58 million, or $25 million after adjusting for the lower volume. In addition to a $4 million favorable effect from a lower average Canadian dollar against the U.S. dollar in the period, manufacturing costs improved by $29 million as a result of:
lower overall fiber costs, mainly wood chip pricing ($12 million);
lower labor costs from our various restructuring initiatives ($9 million); and
power sales from cogeneration assets and asset optimization efficiencies with the Gatineau mill operating rather than the Mersey and Calhoun mills ($18 million).
These items were partially offset with higher maintenance costs ($3 million) and unfavorable steam and power costs because of higher natural gas prices ($6 million).
2012 segment COS was also favorably affected with the receipt of insurance proceeds ($7 million) for the 2011 roof collapse at our Clermont mill.
COATED PAPERS
Highlights
| Three Months Ended June 30, | Six Months Ended June 30, | |||||||||||||||
| (unaudited, in millions, except where otherwise stated) | 2013 | 2012 | 2013 | 2012 | ||||||||||||
Sales | $ | 96 | $ | 121 | $ | 198 | $ | 249 | ||||||||
Operating income 1 | 2 | 3 | 2 | 4 | ||||||||||||
EBITDA2 | 11 | 12 | 20 | 23 | ||||||||||||
(in thousands of short tons) | ||||||||||||||||
Shipments | 124 | 154 | 250 | 316 | ||||||||||||
Downtime | 37 | 5 | 73 | 17 | ||||||||||||
Inventory at end of period | 24 | 28 | 24 | 28 | ||||||||||||
| 1. | Net income (loss) including noncontrolling interests is equal to operating income (loss) in this segment. |
| 2. | EBITDA, a non-GAAP financial measure, is reconciled below. For more information on the calculation and reason we include this measure, see note 1 under “Results of Operations – Consolidated Results – Selected Financial Information” above. |
| Three Months Ended June 30, | Six Months Ended June 30 | |||||||||||||||
| (unaudited, in millions) | 2013 | 2012 | 2013 | 2012 | ||||||||||||
Net income including noncontrolling interests | $ | 2 | $ | 3 | $ | 2 | $ | 4 | ||||||||
Depreciation and amortization | 9 | 9 | 18 | 19 | ||||||||||||
EBITDA | 11 | 12 | 20 | 23 | ||||||||||||
Industry trends
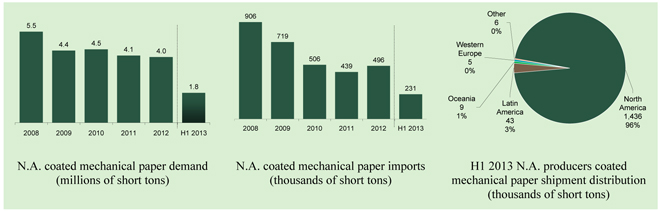
Source: PPPC
The trend continued on pace with the first quarter. North American total demand for coated mechanical papers was down 5% in the first half of the year, with shipments from North American producers down 11%, about 200,000 short tons, and imports up 22%, or about 43,000 short tons, mostly from Western Europe. The industry shipment-to-capacity ratio widened to 87% in the first half of the year, compared to an average of 94% for all of 2012.
Three months ended June 30, 2013 vs. June 30, 2012
Operating income variance analysis
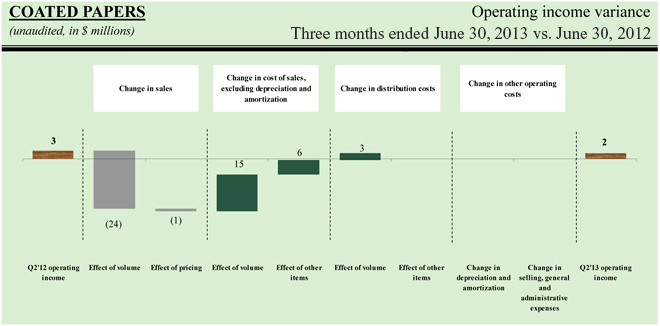
Sales
Coated paper sales decreased $25 million, or 21%, to $96 million. The indeterminate idling of a paper machine at our Catawba mill at the end of June 2012 accounts for the 30,000 short tons
(27,000 metric tons) of lower volume ($24 million). It represents a reduction of approximately 146,000 short tons (132,000 metric tons) of capacity on an annualized basis. Compared to the year-ago period, average transaction price fell by $8 per short ton, or 1% ($1 million), and finished goods inventory dropped by 4,000 short tons, or 14%.
Cost of sales, excluding depreciation and amortization
Segment COS decreased $21 million in the quarter, or $6 million when adjusted for the impact of volume, which reflected lower power and labor costs, and favorable usage of coating chemicals.
Six months ended June 30, 2013 vs. June 30, 2012
Operating income variance analysis

Sales
Coated paper sales decreased $51 million, or 20%, to $198 million, reflecting 66,000 short tons (60,000 metric tons) of lower volume ($52 million) for the reasons described above. Compared to the year-ago period, average transaction price increased by $4 per short ton, or 0.5% ($1 million).
Cost of sales, excluding depreciation and amortization
Segment COS decreased $43 million in the first half of the year, or $11 million when adjusted for the impact of volume. This reflects lower labor, power and maintenance costs.
SPECIALTY PAPERS
Highlights
| Three Months Ended June 30, | Six Months Ended June 30, | |||||||||||||||
| (unaudited, in millions, except where otherwise stated) | 2013 | 2012 | 2013 | 2012 | ||||||||||||
Sales | $ | 242 | $ | 288 | $ | 480 | $ | 560 | ||||||||
Operating income 1 | – | 28 | 8 | 42 | ||||||||||||
EBITDA2 | 10 | 40 | 28 | 66 | ||||||||||||
(in thousands of short tons) | ||||||||||||||||
Shipments | 335 | 386 | 658 | 749 | ||||||||||||
Downtime | 13 | 7 | 22 | 47 | ||||||||||||
Inventory at end of period | 58 | 80 | 58 | 80 | ||||||||||||
| 1. | Net income (loss) including noncontrolling interests is equal to operating income (loss) in this segment. |
| 2. | EBITDA, a non-GAAP financial measure, is reconciled below. For more information on the calculation and reason we include this measure, see note 1 under “Results of Operations – Consolidated Results – Selected Financial Information” above. |
| Three Months Ended June 30, | Six Months Ended June 30, | |||||||||||||||
| (unaudited, in millions) | 2013 | 2012 | 2013 | 2012 | ||||||||||||
Net income including noncontrolling interests | $ | – | $ | 28 | $ | 8 | $ | 42 | ||||||||
Depreciation and amortization | 10 | 12 | 20 | 24 | ||||||||||||
EBITDA | 10 | 40 | 28 | 66 | ||||||||||||
Industry trends
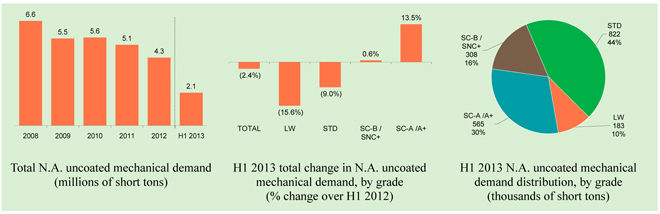
Source: PPPC
Overall North American demand for uncoated mechanical papers in the first half of the year was down 2.4%, compared to a 16% drop in total North American demand in the same period in 2012. This included a 9% increase in demand for high-gloss grades, driven by an increase in industry capacity following a mill restart in Nova Scotia, Canada, and from grade shifting down from lighter-weight coated papers. Demand for lightweight uncoated mechanical papers, where we have only
limited exposure, was down 16%. Demand for the standard commercial grades fell by 9% in the first half of the year. Overall, the industry shipment-to-capacity ratio stood at 91% for the first half of the year.
Three months ended June 30, 2013 vs. June 30, 2012
Operating income variance analysis
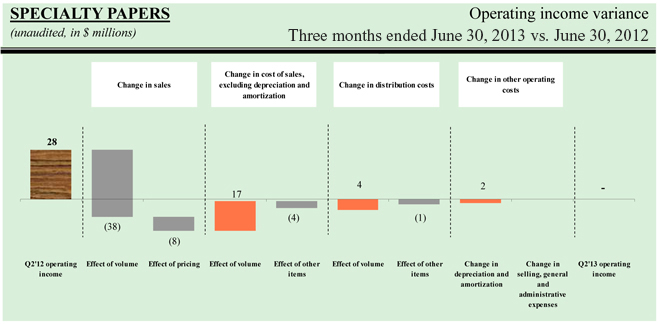
Sales
Specialty paper sales decreased $46 million, or 16%, to $242 million. Shipments decreased by 51,000 short tons (46,000 metric tons) ($38 million) and the average transaction price dropped $25 per short ton, or 3% ($8 million).
The decline in shipments reflects our efforts to adjust to market dynamics by focusing production in our most cost-effective mills, including our decision to idle two higher-cost paper machines in November 2012 (Fort Frances and Laurentide) and to restart the lower-cost Dolbeau facility. These adjustments resulted in a net decrease of approximately 100,000 short tons (91,000 metric tons) of operating capacity on an annualized basis. Our finished goods inventory fell by 22,000 short tons (20,000 metric tons), or 28%.
Cost of sales, excluding depreciation and amortization
Segment COS were $4 million higher when adjusting for the effect of lower volume ($17 million), as a result of:
higher costs for steam (natural gas pricing) and chemicals (usage) ($5 million); and
higher maintenance costs, including the cold outage at Calhoun ($2 million).
And partially offset by:
power sales from cogeneration assets and lower labor costs as a result of our various restructuring initiatives ($7 million);
lower kraft usage ($3 million); and
the favorable impact of a weaker Canadian dollar compared to the U.S. dollar ($2 million).
Segment COS were also unfavorably affected by inventory variation costs associated with the significant reduction in inventory ($6 million).
Six months ended June 30, 2013 vs. June 30, 2012
Operating income variance analysis
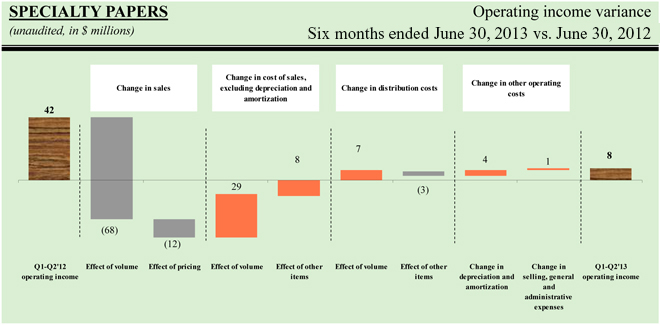
Sales
Specialty paper sales decreased $80 million, or 14%, to $480 million, reflecting a 91,000 short tons (83,000 metric tons) decrease in shipments ($68 million) for the reasons described above and an $19 per short ton, or 3%, reduction in average transaction price ($12 million).
We took 3,000 short tons (2,700 metric tons) more downtime in the first half of 2013 compared to the same period in 2012, not including the 28,000 short tons (25,000 metric tons) of downtime at the now-idled Fort Frances mill.
Cost of sales, excluding depreciation and amortization
Segment COS dropped by $8 million when adjusting for the effects of volume ($29 million). The favorable items affecting COS included:
power sales from cogeneration assets and lower labor costs from our various restructuring initiatives ($11 million);
lower kraft usage ($8 million); and
the favorable impact of a weaker Canadian dollar compared to the U.S. dollar ($4 million).
The unfavorable items affecting COS included:
higher fuel costs because of higher natural gas prices ($6 million);
higher chemical costs ($3 million); and
higher maintenance costs ($2 million).
Segment COS were also unfavorably affected by inventory variation costs associated with the significant reduction in inventory
(4 million).
Depreciation and amortization
Depreciation and amortization decreased by $4 million because of the accelerated depreciation taken on the idled machines at Laurentide and Fort Frances in the second half of 2012.
MARKET PULP
Highlights
| Three Months Ended June 30, | Six Months Ended June 30, | |||||||||||||||
| (unaudited, in millions, except where otherwise stated) | 2013 | 2012 | 2013 | 2012 | ||||||||||||
Sales | $ | 263 | $ | 211 | $ | 503 | $ | 338 | ||||||||
Operating income (loss) 1 | 10 | (3) | 5 | (20) | ||||||||||||
EBITDA2 | 23 | 7 | 31 | (2) | ||||||||||||
(in thousands of metric tons) | ||||||||||||||||
Shipments | 393 | 318 | 767 | 517 | ||||||||||||
Downtime | 10 | 52 | 30 | 129 | ||||||||||||
Inventory at end of period | 98 | 114 | 98 | 114 | ||||||||||||
| 1. | Net income (loss) including noncontrolling interests is equal to operating income (loss) in this segment. |
| 2. | EBITDA, a non-GAAP financial measure, is reconciled below. For more information on the calculation and reason we include this measure, see note 1 under “Results of Operations – Consolidated Results – Selected Financial Information” above. |
| Three Months Ended June 30, | Six Months Ended June 30, | |||||||||||||||
| (unaudited, in millions) | 2013 | 2012 | 2013 | 2012 | ||||||||||||
Net income (loss) including noncontrolling interests | $ | 10 | $ | (3) | $ | 5 | $ | (20) | ||||||||
Depreciation and amortization | 13 | 10 | 26 | 18 | ||||||||||||
EBITDA | 23 | 7 | 31 | (2) | ||||||||||||
Industry trends
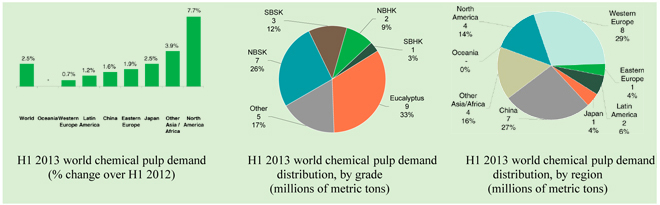
Source: PPPC
Overall demand for chemical market pulp rose by 2.5% in the first half of the year, with increases in each of the largest markets: North America (8%), China (2%) and Western Europe (1%). Global shipments of softwood pulp, which represented about 60% of our total second quarter shipments and about 80% of our virgin fiber capacity (i.e., excluding recycled bleached kraft pulp), were up about 2%.
Three months ended June 30, 2013 vs. June 30, 2012
Operating income (loss) variance analysis
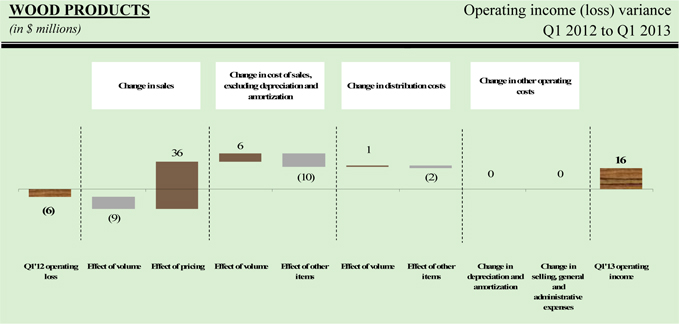
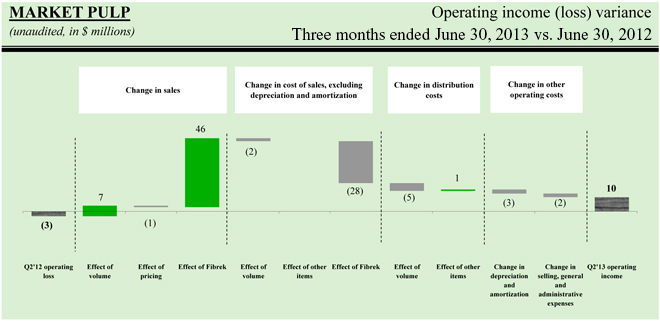
Sales
Sales rose $52 million, or 25%, to $263 million, mostly because of our acquisition of Fibrek ($46 million) and a 10,000 metric ton increase, or 5%, in non-Fibrek shipments ($7 million). Fibrek’s volume was higher than the year-ago period because its results of operations have been included in our consolidated financial statements only as of May 2, 2012, the date we acquired a controlling interest. Average transaction price was essentially unchanged, despite a $25 per metric ton decrease in fluff pulp pricing.
We recorded 42,000 metric tons less downtime in the second quarter of 2013, including 20,000 metric tons less downtime at the three Fibrek mills.
Cost of sales, excluding depreciation and amortization
Segment COS increased $30 million in the second quarter, mostly because of Fibrek ($28 million). Fibrek experienced higher steam and maintenance costs ($3 million), partially offset by incremental power sales, as of November 2012, from the new 9.5MW turbogenerator. Excluding the impact of non-Fibrek higher volume ($2 million), COS was unchanged as higher steam and wood costs ($3 million) offset the benefits of power sales and labor efficiencies ($3 million).
Depreciation and amortization & selling, general and administrative expenses
The addition of the three Fibrek mills to our asset base caused higher segment depreciation and amortization ($3 million) and SG&A allocation ($2 million).
Six months ended June 30, 2013 vs. June 30, 2012
Operating income (loss) variance analysis
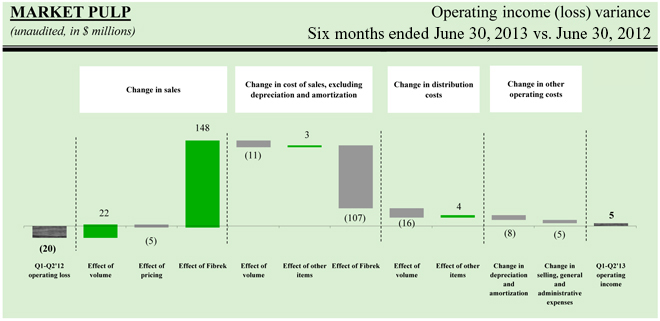
Sales
The $165 million increase in sales, or 49%, to $503 million, is primarily the result of our Fibrek acquisition, whose results of operations have only been included in our consolidated results only as of May 2, 2012. Excluding the Fibrek effect ($148 million), sales grew by $17 million, or 6%, because of a 35,000 metric ton increase in shipments ($22 million), partly offset by an $11 per metric ton drop in average transaction price ($5 million).
We took 81,000 metric tons less downtime in the first half of 2013, compared to significant market-related downtime in the same period in 2012, not including 18,000 metric tons of downtime at the Fort Frances mill, which was later idled.
Cost of sales, excluding depreciation and amortization
Segment cost of sales increased $115 million, mainly as a result of our acquisition of Fibrek ($107 million) and higher non-Fibrek shipments ($11 million). Net of these effects, there was a net favorable change of $11 million from power sales from cogeneration assets, labor efficiencies and inventory variation.
These favorable items were partly offset by higher steam, chemical and wood costs ($6 million).
Distribution costs & depreciation and amortization
Segment distribution costs increased by $12 million in the first six months ended 2013 because of the higher shipments with the addition of Fibrek ($13 million). Depreciation and amortization rose by $8 million, primarily as a result of the addition of the three Fibrek mills to our asset base.
Selling, general and administrative expenses
Segment SG&A allocation rose by $5 million on account of the acquisition of Fibrek.
WOOD PRODUCTS
Highlights
| Three Months Ended June 30, | Six Months Ended June 30, | |||||||||||||||
| (unaudited, in millions, except where otherwise stated) | 2013 | 2012 | 2013 | 2012 | ||||||||||||
Sales | $ | 142 | $ | 132 | $ | 280 | $ | 243 | ||||||||
Operating income 1 | 16 | 12 | 32 | 6 | ||||||||||||
EBITDA2 | 25 | 21 | 50 | 24 | ||||||||||||
| (in millions of board feet) | ||||||||||||||||
Shipments | 345 | 384 | 683 | 751 | ||||||||||||
Downtime | 122 | 201 | 258 | 366 | ||||||||||||
Inventory at end of period | 149 | 116 | 149 | 116 | ||||||||||||
| 1. | Net income (loss) including noncontrolling interests is equal to operating income (loss) in this segment. |
| 2. | EBITDA, a non-GAAP financial measure, is reconciled below. For more information on the calculation and reason we include this measure, see note 1 under “Results of Operations – Consolidated Results– Selected Financial Information” above. |
| Three Months Ended June 30, | Six Months Ended June 30, | |||||||||||||||
| (unaudited, in millions) | 2013 | 2012 | 2013 | 2012 | ||||||||||||
Net income including noncontrolling interests | $ | 16 | $ | 12 | $ | 32 | $ | 6 | ||||||||
Depreciation and amortization | 9 | 9 | 18 | 18 | ||||||||||||
EBITDA | 25 | 21 | 50 | 24 | ||||||||||||
Industry trends
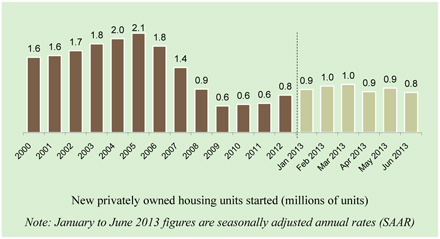
Source: U.S. Census Bureau
After breaking the one million barrier in March, seasonally-adjusted housing starts pulled back to 836,000 through June, still 10% higher than the 757,000 starts reported in June of 2012, when the U.S. housing recovery began to gain momentum.
The benchmark Random Lengths composite struck a high of $451 per thousand board feet in the first week of the second quarter, then fell to a low of $322 toward the end of the quarter. Market prices have gradually improved since then, closing on July 26 at $353 per thousand board feet.
Three months ended June 30, 2013 vs. June 30, 2012
Operating income variance analysis
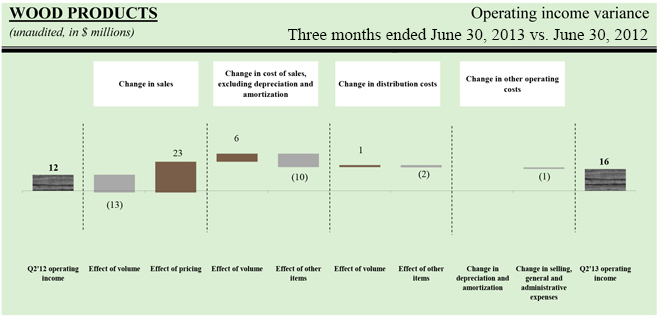
Sales
Wood products sales increased $27$10 million, or 24%8%, to $138$142 million, primarily as a result of the $104$69 per thousand board feet increase in average transaction price ($3623 million), which was partially offset by a 2939 million board feet reduction in shipments ($913 million) due mainly to the closure of our Oakhill, Nova Scotia, facility in the second half of 2012. Although down 9Inventory was 33 million board feet inventory remained high, as our ability to make shipments was affected byhigher, or 28%, than the limited availabilitysecond quarter of rail cars.2012.
Cost of sales, excluding depreciation and amortization
Segment COS increased $4 million during the quarter, as the favorable impact of lower volume ($6 million) was more than offset by higher stumpage fees ($46 million), which are linked to lumber selling prices, and lower wood chip selling prices ($54 million).
Six months ended June 30, 2013 vs. June 30, 2012
Operating income variance analysis
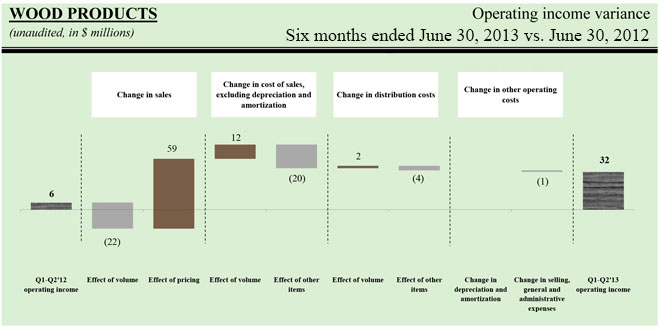
Sales
Wood products sales increased $37 million, or 15%, to $280 million, the product of an $86 per thousand board feet rise in average transaction price ($59 million), partially offset by a 68 million board feet reduction in shipments ($22 million) mostly from the Oakhill closure.
Cost of sales, excluding depreciation and amortization
Segment COS increased $8 million during the first six months. The favorable impact of lower volume ($12 million) was more than offset by higher stumpage fees ($10 million) and lower wood chip selling prices ($9 million).
CORPORATE AND OTHER
Highlights
| Three Months Ended March 31, | Three Months Ended June 30, | Six Months Ended June 30, | ||||||||||||||||||||||
| (in millions) | 2013 | 2012 | ||||||||||||||||||||||
| (unaudited, in millions) | 2013 | 2012 | 2013 | 2012 | ||||||||||||||||||||
Cost of sales, excluding depreciation and amortization | $ | (18) | $ | (6) | $ | (17) | $ | (11) | $ | (35) | $ | (17) | ||||||||||||
Depreciation and amortization | (1) | – | (2) | – | (3) | – | ||||||||||||||||||
Distribution costs | – | – | ||||||||||||||||||||||
Selling, general and administrative expenses | (7) | 6 | (6) | (6) | (13) | – | ||||||||||||||||||
Closure costs, impairment and other related charges | (40) | (5) | (12) | (88) | (52) | (93) | ||||||||||||||||||
Net gain on disposition of assets and other | – | 23 | 2 | 1 | 2 | 24 | ||||||||||||||||||
Operating (loss) income | $ | (66) | $ | 18 | ||||||||||||||||||||
Operating loss | $ | (35) | $ | (104) | $ | (101) | $ | (86) | ||||||||||||||||
RESOLUTE FOREST PRODUCTS INC.
The table below shows the reconciliation of net (loss) income including noncontrolling interests to EBITDA and adjusted EBITDA, which are non-GAAP financial measures. For more information on the calculation and reason we include these measures, see note 1 under “Results“Results of Operations – Consolidated EarningsResults – Selected Quarterly Financial Information”Information” above.
| Three Months Ended March 31, | Three Months Ended June 30, | Six Months Ended June 30, | ||||||||||||||||||||||
| (in millions) | 2013 | 2012 | ||||||||||||||||||||||
Net (loss) income including noncontrolling interests | $ | (21) | $ | 25 | ||||||||||||||||||||
| (unaudited, in millions) | 2013 | 2012 | 2013 | 2012 | ||||||||||||||||||||
Net loss including noncontrolling interests | $ | (82) | $ | (134) | $ | (104) | $ | (111) | ||||||||||||||||
Interest expense | 14 | 16 | 13 | 18 | 27 | 34 | ||||||||||||||||||
Income tax benefit | (41) | (10) | ||||||||||||||||||||||
Income tax (benefit) provision | (31) | 2 | (71) | (6) | ||||||||||||||||||||
Depreciation and amortization | 1 | – | 2 | – | 3 | – | ||||||||||||||||||
EBITDA | $ | (47) | $ | 31 | $ | (98) | $ | (114) | $ | (145) | $ | (83) | ||||||||||||
Foreign exchange translation loss (gain) | 5 | (12) | 7 | 9 | 12 | (3) | ||||||||||||||||||
Employee termination costs | – | 2 | ||||||||||||||||||||||
Severance | – | 1 | – | 3 | ||||||||||||||||||||
Closure costs, impairment and other related charges | 40 | 5 | 12 | 88 | 52 | 93 | ||||||||||||||||||
Inventory write-downs related to closures | 4 | – | 1 | 7 | 5 | 7 | ||||||||||||||||||
Start up costs of idled mill | 15 | – | 13 | – | 28 | – | ||||||||||||||||||
Net gain on disposition of assets | – | (23) | (2) | (1) | (2) | (24) | ||||||||||||||||||
Post-emergence costs | – | 2 | ||||||||||||||||||||||
Net loss on extinguishment of debt | 59 | – | 59 | – | ||||||||||||||||||||
Transaction costs | 3 | 4 | 2 | 3 | 5 | 7 | ||||||||||||||||||
Other income, net | (23) | (3) | ||||||||||||||||||||||
Other (income) expense, net | (1) | 1 | (24) | – | ||||||||||||||||||||
Adjusted EBITDA | (3) | 6 | $ | (7) | $ | (6) | $ | (10) | $ | – | ||||||||||||||
First quarterThree months June 30, 2013 vs. first quarterJune 30, 2012
Costs,Cost of sales, excluding depreciation and amortization
COS rose by $6 million, to $17 million in the second quarter of 2013, including start-up costs for the restart of the Gatineau mill ($13 million), and an inventory write-down and other costs associated with a closed mill ($2 million). By comparison, we incurred inventory write-downs and other costs associated with closed mills ($11 million) in the second quarter of 2012.
Depreciation and amortization
Depreciation and amortization increased by $2 million, mainly as we began to amortize the costs associated with the implementation of an integrated business management software.
Closure costs, impairment and other related charges
We recorded closure costs, impairment and other related charges of $12 million, $76 million less than in the year-ago period. Second quarter 2013 items included accelerated depreciation and severance charges associated with the idling of a newsprint machine at our Calhoun mill. Second quarter 2012 items included asset impairment and severance charges associated with the idling of the Mersey newsprint mill.
Six months June 30, 2013 vs. June 30, 2012
Cost of sales, excluding depreciation and amortization
COS rose by $18 million, to $18$35 million. In the first quarterhalf of 2013, we incurred start-up costs for the restart of the Gatineau mill ($1528 million) and inventory write-downs with the idling of a newsprint machine at our Calhoun mill ($4 million). By comparison,In the first half of 2012, we incurred costs associated with closed mills ($9 million) and an inventory write-down in connection with the idling of $5 million in the first quarter of 2012.
RESOLUTE FOREST PRODUCTS INC.
Mersey ($7 million).
Selling, general and administrative expenses
Corporate SG&A was $13 million, higher, primarilyup from nil in the first half of 2012, mostly because in the first quarter of 2012 we recorded a refund of certain group benefit premiums paid in prior years ($911 million).
Closure costs, impairment and other related charges
We recorded closure costs, impairment and other related charges of $40$52 million, $35compared to $93 million more than in the year-ago period. This reflects mainlyThe current period included accelerated depreciation and severance charges associated with the idling of a newsprint machine at our Calhoun mill. In the same period of 2012, we recorded:
long-lived asset impairment charges in connection with idling of Mersey ($70 million);
severance costs, a pension plan curtailment loss and a pension plan settlement loss as a result of restructuring initiatives at Mersey ($18 million); and
severance costs and pension curtailment losses associated with restructuring initiatives at our Baie-Comeau and Kenogami paper mills ($5 million).
Net gain on disposition of assets
The lower netWe recorded a gain on disposition of assets reflects the sale,of $2 million in the first quarterhalf of 2012,2013 compared to $24 million in the year-ago period, related to the sale of timberlands in Nova Scotia ($22 million).Scotia.
LIQUIDITYAND CAPITAL RESOURCES
Capital Resources
We rely on cash and cash equivalents, net cash provided by operations and our senior secured asset-based revolving credit facility, or “ABL“ABL credit facility”facility”, to fund our operations, make pension contributions and finance our working capital and capital expenditures. As of March 31,June 30, 2013, we had cash and cash equivalents of $215$248 million and availability of $537$467 million under the ABL credit facility. In our view, the Company haswe have sufficient financial resources available to finance its business plan, meet its working capital requirements and maintain an appropriate level of capital spending.
IssuanceRefinancing of 2023senior secured notes
On May 8, 2013, we completed the private offering of $600 million aggregate principal amount of our 5.875% senior notes due 2023 (the “2023 notes”). The 2023 notes are unsecured and are guaranteed by substantially all of our U.S. subsidiaries, all of which also guaranteed our 10.25% senior secured notes due 2018 (the “2018 notes”). The 2023 notes were sold at an offering price of 99.062% of the principal amount. Interest on the notes is payable semi-annually on May 15 and November 15 of each year, beginning November 15, 2013.
The 2023 notes were issued pursuant to an indenture dated May 8, 2013, by and amongWe used the Company, the guarantors and Wells Fargo Bank, National Association, as trustee. The termsproceeds of the 2023 notes indenture impose certain restrictions, subject to a number of exceptions and qualifications, including limits on our ability to:
incur, assume or guarantee additional indebtedness;
issue redeemable stock and preferred stock;
RESOLUTE FOREST PRODUCTS INC.
pay dividends or make distributions or redeem or repurchase capital stock;
prepay, redeem or repurchase certain debt;
make loans and investments;
incur liens;
issue dividends, make loans or transfer assets from our subsidiaries;
sell or otherwise dispose of assets, including capital stock of subsidiaries;
consolidate or merge with or into, or sell substantially all of our assets to, another person;
enter into transactions with affiliates; and
enter into new lines of business.
The 2023 notes will be redeemable, in whole or in part, at any time on or after May 15, 2017, at the redemption prices specified in the 2023 notes indenture, plus accrued and unpaid interest. Before that date, we may redeem some or all of the notes at a redemption price of 100% of the principal amount, plus accrued and unpaid interest, plus a “make-whole” premium. We may redeem up to 35% of the notes before May 15, 2016, using proceeds from certain equity offerings at a price of 105.875% of the principal amount. We could be required to make an offer to purchase the notes upon the sale of certain assets or upon a change of control.
In connection with the offering of the 2023 notes, we and the guarantors entered into a registration rights agreement, dated as of May 8, 2013, with the initial purchasers of the 2023 notes. Under the terms of the registration rights agreement, we agreed to use our commercially reasonable efforts to file with the SEC and cause to become effective a registration statement relating to an offer (which we refer to as the “exchange offer”) to: (i) exchange the 2023 notes for registered notes (which we refer to as the “exchange notes”), with substantially the same terms as the 2023 notes; and (ii) exchange the guarantees related to the 2023 notes for registered guarantees relating to the exchange notes, with substantially the same terms as the original guarantees. We have agreed to use our commercially reasonable efforts to cause the exchange offer to be completed within 400 days after the issuance of the 2023 notes. In addition, we have agreed to file (and seek effectiveness of) a shelf registration statement, in certain circumstances, that would allow certain holders to offer some or all of the 2023 notes to the public.
If the exchange offer is not so completed, or if the shelf registration statement is not effective in the required circumstances, the annual interest ratepurchase, on the 2023 notes will increase by 0.25% per annum for the first 90-day period following the event triggering the increase. The interest rate on the 2023 notes will increase by 0.25% per annum at the beginningMay 8, 2013, $496 million aggregate principal amount of each subsequent 90-day period, up to a maximum of 1.0% additional interestper annum, until the exchange offer is completed or the shelf registration statement is filed, as applicable.
RESOLUTE FOREST PRODUCTS INC.
Tender offer for 2018 notes,
We commenced a tender offer on April 24, 2013, or 99% of the outstanding amount, in connection with whichthe tender offer and consent solicitation that expired on May 21, 2013. Aggregate consideration for the purchase was $584 million, including accrued and unpaid interest of $4 million. Accordingly, we also solicited consents from tendering holdersrecorded a loss on extinguishment of the 2018 notes to amend the terms($84 million), net of the governingwrite-down of the associated unamortized premium ($25 million). In connection with the refinancing, we entered into a supplemental indenture to eliminate substantially all of the restrictive covenants and certain events of default under the indenture and to release the collateral securing the obligations under the 2018 notes.
The tender offer and consent solicitation included an early tender deadline of May 7, 2013. As of the early tender deadline, approximately $497 million aggregate principal amount of the 2018 notes, or 99%, had been tendered. Using proceeds from the sale of the 2023 notes, under the terms of the tender offer, we exercised on May 8, 2013, our option to purchase notes tendered before the early tender deadline, for aggregate consideration of $579 million, plus accrued and unpaid interest, and in connection with that purchase, we entered into a supplemental indenture to implement the changes to the 2018 notes indenture and to release the collateral securing the 2018 notes, as described above. There remains $4$5 million of outstanding principal amount of 2018 notes as of May 10. The tender offer remains outstandingAugust 9, which will be redeemable, at our option, in the fourth quarter of 2013, at a redemption price of 103% of the principal amount, plus accrued and will continue through May 21, 2013.unpaid interest.
ABL incremental commitment agreement
On April 29, 2013, we entered into an agreement with the administrative agent for the ABL credit facility and Bank of America, N.A., Canadian Branch, in order to add Bank of America as a lender thereunder, and to increase the aggregate commitments of the ABL Credit Facility by $65 million to $665 million, subject to borrowing base limitations.Theselimitations. These transactions closed on May 8, concurrent with the closing of the offering of the 2023 notes.
Flow of Funds
Summary of cash flows
A summary of cash flows for the threesix months ended March 31,June 30, 2013 and 2012 was as follows:
| Three Months Ended March 31, | ||||||||
| (in millions) | 2013 | 2012 | ||||||
Net cash (used in) provided by operating activities | $ | (20) | $ | 57 | ||||
Net cash used in investing activities | (35) | (16 | ) | |||||
Net cash provided by financing activities | 7 | – | ||||||
Net (decrease) increase in cash and cash equivalents | $ | (48) | $ | 41 | ||||
RESOLUTE FOREST PRODUCTS INC.
| Six Months Ended June 30, | ||||||||
| (unaudited, in millions) | 2013 | 2012 | ||||||
Net cash provided by operating activities | $ | 48 | $ | 173 | ||||
Net cash (used in) provided by investing activities | (75) | 13 | ||||||
Net cash provided by (used in) financing activities | 12 | (45 | ) | |||||
Net (decrease) increase in cash and cash equivalents | $ | (15) | $ | 141 | ||||
First quarterSix months ended June 30, 2013 vs. first quarterJune 30, 2012
Cash (used in) provided by operating activities
We generated $77$125 million less cash from operating activities in the first quartersix months of 2013 compared to the same quarterperiod of 2012. The change was mainly unfavorably affected by: start- upthe impact of lower sales on operating income, mostly from lower volume; start-up costs associated with the Gatineau mill ($1528 million); and ana $9 million increase in working capital ($61 million) fromcompared to a rise in accounts receivable and higher levels of inventory, specifically finished goods$49 million decrease in the wood products segment due to limited rail car availability and in the newsprint and specialty papers segments becausefirst six months of lower shipments.
This decline was partially offset with a $9 million distribution from the liquidation of Bridgewater Paper Company Limited, a U.K. subsidiary that we deconsolidated in 2010 when it filed administration under U.K. insolvency law.2012.
Cash used in(used in) provided by investing activities
We used $35$75 million for investing activities in the first quarterhalf of 2013, $19$88 million morehigher than the year-ago period. TheOther than the $28 million increase in cash invested in fixed assets, the difference is almost entirely due to items from the first quarterhalf of 2012, namely: including the following items of cash provided by investing activities:
a decrease in restricted cash due to the release of a tax indemnity given in connection with the sale of our interest in Manicouagan Power Company in 2009 ($76 million); and
the proceeds from disposition of timberlands in Nova Scotia ($24 million);
and the following elements of cash used in investing activities:
the cash portion of the consideration paid for the acquisition of Fibrek ($24 million, net of cash acquired); and
an increase in deposit requirements for letters of credit ($7 million).
Cash provided by (used in) financing activities
Financing activities provided $7$12 million more cash in the quarter,first half of 2013, compared to a use of $45 million in the productfirst half of 2012, for a $57 million difference.
In the first six months of 2013, we received proceeds of $594 million with the issuance of 2023 notes, used $496 million to repurchase 99% of the then-outstanding 2018 notes, paid $84 million as a tender offer premium to holders of 2018 notes and incurred financing and credit facility fees of $9 million. We also received an $8 million payment from our former joint venture partner in CNC, in connection with the transaction pursuant to which we acquired their interest.
In the first six months of 2012, we repaid Fibrek’s asset-based revolving credit facility ($15 million), we paid $17 million in cash as part of the consideration to acquire shares of the noncontrolling interest in Fibrek and we repurchased some of our own shares under our share repurchase program ($12 million).
Employee Benefit Plans
Canadian pension funding
We refer you to “Management’s Discussion and Analysis of Financial Condition and Results of Operations — Employee Benefit Plans—Canadian Pension Funding” in the 2012 annual report for a description of the funding relief measures, solvency deficit and corrective measures related to our material Canadian registered pension plans.
We have worked, and will continue to work, with our stakeholders, including employees, retirees and unions, and also the provincial governments of Quebec and Ontario and the related pension regulators, to reach an outcome on corrective measures that is consistent with what we believe was the objective of the funding relief measures: balancing the need to meet our obligations to retirees while giving us the funding stability we need to manage our business.
On April 26, we reached an agreement in principle with Company stakeholders in Quebec, the provincial government, and its pension regulator to replace the corrective measures mechanism under the existing funding relief regulations in favor of more stable, predictable and balanced pension funding parameters, including reasonable incremental contributions beyond the basic funding requirements under the existing framework. We started the process of engagement withcontinue to engage our Ontario stakeholders and the provincial government of Ontario and its pension regulator.
Should we fail to reach a satisfactory resolution, we cannot estimate, at this time, the additional contributions, if any, that may be made or required in future years in respect of the corrective measures, but they could be material, which would negatively impact our cash flows and materially affect our results of operations or financial condition. See “We could be required
RESOLUTE FOREST PRODUCTS INC.
to make contributions to our Canadian pension plans at levels that could be significantly higher than expected, which could have an adverse impact on our financial condition”condition” in the risk factors incorporated by referenceincluded in this quarterlyexhibit 99.4 to our current report on Form 10-Q8-K filed on April 24, 2013 for more information on the associated risks and uncertainties.
Share Repurchase Program
On May 22, 2012, the board approved a share repurchase program of up to 10% of our common stock, for an aggregate purchase price of up to $100 million. Through March 31,June 30, 2013, we repurchased 5.6 million shares at a cost of $67 million. We did not repurchase shares in the first quartersix months of 2013.
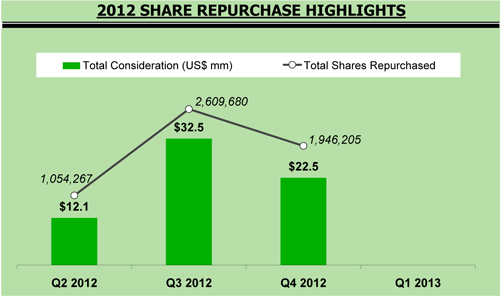
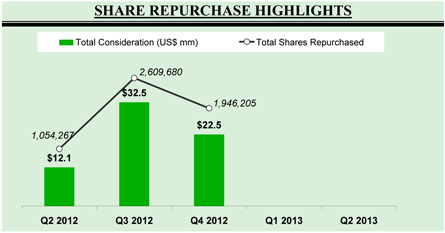
RCECENTHANGEACCOUNTINGIN GAUIDANCECCOUNTING POLICY
NoneIn the second quarter of 2013, we changed our accounting policy for repairs and maintenance costs associated with planned major maintenance activities. Previously, all repairs and maintenance costs, including those associated with planned major maintenance, were expensed as incurred. We elected to change our accounting policy for planned major maintenance costs to the newdeferral method, whereby the costs of each planned major maintenance activity will be amortized on a straight-line basis over the estimated period until the next planned major maintenance activity. All other routine repairs and maintenance costs will continue to be expensed as incurred. We believe that the deferral method is preferable as the economic benefit associated with planned major maintenance activities are more appropriately recognized over the period of future benefit, which is not limited to the period the expense is incurred. In addition, the deferral method will enhance the comparability of our financial results with our peer companies. In accordance with ASC 250, “Accounting Changes and Error Corrections,” we have applied the change in accounting guidance is expected to materially affectpolicy retroactively by adjusting our resultscomparative consolidated financial statements for the effect of operations or financial condition.
RESOLUTE FOREST PRODUCTS INC.this change.
ITEM 3. QUANTITATIVE AND QUALITATIVE DISCLOSURES ABOUT MARKET RISK
Information relating to quantitative and qualitative disclosures about market risk is disclosed in Part II, Item 7A, “Quantitative and Qualitative Disclosures About Market Risk,” in our 2012 Annual Report. There have been no material changes in our exposure to market risk as previously disclosed in our 2012 Annual Report.
ITEM 4. CONTROLS AND PROCEDURES
(a) Evaluation of Disclosure Controls and Procedures:
We have evaluated the effectiveness of the design and operation of our disclosure controls and procedures, as defined in Rules 13a–15(e) and 15d–15(e) of the Securities Exchange Act of 1934, as of March 31,June 30, 2013. Based on that evaluation, the President and Chief Executive Officer and the Senior Vice President and Chief Financial Officer concluded that our disclosure controls and procedures were effective as of such date in recording, processing, summarizing and timely reporting information required to be disclosed in our reports to the SEC.
(b) Changes in Internal Control over Financial Reporting:
In connection with the evaluation of internal control over financial reporting, there were no changes during the period covered by this report that have materially affected, or are reasonably likely to materially affect, our internal control over financial reporting.
PART II — II—OTHER INFORMATION
Information on our legal proceedings is presented under Part I, Item 3, “Legal Proceedings,” in our 2012 Annual Report. There have been no material changes to the legal proceedings described in the 2012 Annual Report.
In addition to the other information set forth in this Form 10-Q, you should carefully consider the risk factors set forth under the heading “Risk Factors” in Exhibit 99.4 of our Current Report on Form 8-K, filed with the SEC on April 24, 2013 (the “Form 8-K”), which amend and restate the risk factors set forth under Part I, Item 1A, “Risk Factors,” in our 2012 Annual Report. These risk factors could materially affect our business, financial condition or future results. The risks described in this report and in the Form 8-K are not the only risks we are facing. Additional risks and uncertainties not currently known to us or that we currently deem to be immaterial may also materially affect our business, financial condition or future results.
On May 8, 2013, we completed the private offering of $600 million aggregate principal amount of our 5.875% senior notes due 2023, the net proceeds from which are being used to repurchase, repay or otherwise discharge all of our outstanding 10.25% senior secured notes due 2018. For additional information, see “Issuance of 2023 notes” and “Tender offer for 2018 notes” included in Part I, Item 2, “Management’s Discussion and Analysis of Financial Condition and Results of Operations.”
RESOLUTE FOREST PRODUCTS INC.
Exhibit No. | Description | |
|
RESOLUTE FOREST PRODUCTS INC.
RESOLUTE FOREST PRODUCTS INC.
Pursuant to the requirements of the Securities Exchange Act of 1934, the Registrant has duly caused this Report to be signed on its behalf by the undersigned thereunto duly authorized.
Dated: May 10, 2013
RESOLUTE FOREST PRODUCTS INC.
EXHIBIT INDEX
|
| |
| 31.1* | Certification of President and Chief Executive Officer Pursuant to Section 302 of the Sarbanes-Oxley Act of 2002. | |
| 31.2* | Certification of Senior Vice President and Chief Financial Officer Pursuant to Section 302 of the Sarbanes-Oxley Act of 2002. | |
| 32.1* | Certification of President and Chief Executive Officer Pursuant to Section 906 of the Sarbanes-Oxley Act of 2002. | |
| 32.2* | Certification of Senior Vice President and Chief Financial Officer Pursuant to Section 906 of the Sarbanes-Oxley Act of 2002. | |
| 101.INS** | XBRL Instance Document. | |
| 101.SCH** | XBRL Taxonomy Extension Schema Document. | |
| 101.CAL** | XBRL Taxonomy Extension Calculation Linkbase Document. | |
| 101.LAB** | XBRL Taxonomy Extension Label Linkbase Document. | |
| 101.PRE** | XBRL Taxonomy Extension Presentation Linkbase Document. | |
| 101.DEF** | XBRL Taxonomy Extension Definition Linkbase Document. | |
| * | Filed with this Form 10-Q. |
Pursuant to the requirements of the Securities Exchange Act of 1934, the Registrant has duly caused this Report to be signed on its behalf by the undersigned thereunto duly authorized.
| RESOLUTE FOREST PRODUCTS INC. | ||
| By | /s/ Jo-Ann Longworth | |
| Jo-Ann Longworth | ||
Senior Vice President and Chief Financial Officer | ||
| By | /s/ Silvana Travaglini | |
| Silvana Travaglini | ||
| Vice President and Chief Accounting Officer | ||
Dated: August 9, 2013
RESOLUTE FOREST PRODUCTS INC.
EXHIBIT INDEX
Exhibit No. | Description | |
| 18.1* | Letter From Independent Registered Accounting Firm Regarding Change in Accounting Policy. | |
| 31.1* | Certification of President and Chief Executive Officer Pursuant to Section 302 of the Sarbanes-Oxley Act of 2002. | |
| 31.2* | Certification of Senior Vice President and Chief Financial Officer Pursuant to Section 302 of the Sarbanes-Oxley Act of 2002. | |
| 32.1* | Certification of President and Chief Executive Officer Pursuant to Section 906 of the Sarbanes-Oxley Act of 2002. | |
| 32.2* | Certification of Senior Vice President and Chief Financial Officer Pursuant to Section 906 of the Sarbanes-Oxley Act of 2002. | |
| 101.INS** | XBRL Instance Document. | |
| 101.SCH** | XBRL Taxonomy Extension Schema Document. | |
| 101.CAL** | XBRL Taxonomy Extension Calculation Linkbase Document. | |
| 101.LAB** | XBRL Taxonomy Extension Label Linkbase Document. | |
| 101.PRE** | XBRL Taxonomy Extension Presentation Linkbase Document. | |
| 101.DEF** | XBRL Taxonomy Extension Definition Linkbase Document. | |
| * | Filed with this Form 10-Q. |
| ** | Interactive data files furnished with this Form 10-Q, which represent the following materials from this Form 10-Q formatted in XBRL (eXtensible Business Reporting Language): (i) the Consolidated Statements of Operations, (ii) the Consolidated Statements of Comprehensive (Loss) Income, (iii) the Consolidated Balance Sheets, (iv) the Consolidated Statements of Changes in Equity, (v) the Consolidated Statements of Cash Flows and (vi) the Notes to Unaudited Interim Consolidated Financial Statements. Pursuant to applicable securities laws and regulations, the Company is deemed to have complied with the reporting obligation relating to the submission of interactive data files in such exhibits and is not subject to liability under any anti-fraud provisions or other liability provisions of the federal securities laws as long as the Company has made a good faith attempt to comply with the submission requirements and promptly amends the interactive data files after becoming aware that the interactive data files fail to comply with the submission requirements. In addition, users of this data are advised that, pursuant to Rule 406T of Regulation S-T, these interactive data files are deemed not filed or part of a registration statement or prospectus for purposes of Sections 11 or 12 of the Securities Act of 1933 or Section 18 of the Securities Exchange Act of 1934 and otherwise are not subject to liability under these sections. |