

UNITED STATES
SECURITIES AND EXCHANGE COMMISSION
WASHINGTON, DC 20549
FORM 10-Q
| x | QUARTERLY REPORT PURSUANT TO SECTION 13 OR 15(d) OF THE SECURITIES EXCHANGE ACT OF 1934 |
For the Period Ended JuneSeptember 30, 2013
OR
| ¨ | TRANSITION REPORT PURSUANT TO SECTION 13 OR 15(d) OF THE SECURITIES EXCHANGE ACT OF 1934 |
Commission File Number 000-51274
THE FRONTIER FUND
FRONTIER DIVERSIFIED SERIES; FRONTIER MASTERS SERIES;
FRONTIER LONG/SHORT COMMODITY SERIES; BALANCED SERIES;
FRONTIER SELECT SERIES (FORMERLY TIVERTON/GRAHAM/TRANSTREND SERIES);
WINTON SERIES; FRONTIER HERITAGE SERIES (FORMERLY WINTON/GRAHAM SERIES)
(Exact Name of Registrant as specified in its Charter)
| Delaware | 36-6815533 | |
| (State of Organization) | (IRS Employer Identification No.) |
c/o Equinox Fund Management, LLC
1775 Sherman Street, Suite 2500
Denver, Colorado 80203
(Address of Principal Executive Offices)
(303) 837-0600
(Registrant’s Telephone Number)
Securities to be registered pursuant to Section 12(b) of the Act: None
Securities registered pursuant to Section 12(g) of the Act:
Frontier Diversified Series Class 1, Class 2 and Class 3 Units;
Frontier Masters Series Class 1, Class 2 and Class 3 Units;
Frontier Long/Short Commodity Series Class 1, Class 2, Class 3, Class 1a, Class 2a and Class 3a Units;
Balanced Series Class 1, Class 2, Class 3, Class 1a, Class 2a and Class 3a Units;
Frontier Select Series (formerly Tiverton/Graham/Transtrend Series) Class 1, Class 2 and Class 3 Units;
Winton Series Class 1, Class 2 and Class 3 Units;
Frontier Heritage Series (formerly Winton/Graham Series) Class 1, Class 2 and Class 3 Units
Indicate by check mark whether the registrant: (1) has filed all reports required to be filed by Section 13 or 15(d) of the Securities Exchange Act of 1934 during the preceding 12 months (or for such shorter period that the registrant was required to file such reports), and (2) has been subject to such filing requirements for the past 90 days. Yes x No ¨
Indicate by check mark whether the registrant has submitted electronically and posted on its corporate Web site, if any, every Interactive Data File required to be submitted and posted pursuant to Rule 405 of Regulation S-T (§232.405 of this chapter) during the preceding 12 months (or for such shorter period that the registrant was required to submit and post such files) Yes x No ¨
Indicate by check mark whether the registrant is a large accelerated filer, an accelerated filer, a non-accelerated filer, or a smaller reporting company. See the definitions of “large accelerated filer,” “accelerated filer” and “smaller reporting company” in Rule 12b-2 of the Exchange Act.
| Large Accelerated Filer | ¨ | Accelerated Filer | ¨ | |||
| Non-Accelerated Filer | x (Do not check if a smaller reporting company) | Smaller reporting company | ¨ | |||
Indicate by check mark whether the registrant is a shell company (as defined in Rule 1 2b-2 of the Exchange Act). Yes ¨ No x
| (1) | These financial statements represent the consolidated financial statements of the Series of the Trust. |
Special Note About Forward-Looking Statements
THIS REPORT CONTAINS STATEMENTS WHICH CONSTITUTE FORWARD-LOOKING STATEMENTS WITHIN THE MEANING OF THE PRIVATE SECURITIES LITIGATION REFORM ACT OF 1995 AND OTHER FEDERAL SECURITIES LAWS. THESE FORWARD-LOOKING STATEMENTS REFLECT THE MANAGING OWNER’S CURRENT EXPECTATIONS ABOUT THE FUTURE RESULTS, PERFORMANCE, PROSPECTS AND OPPORTUNITIES OF THE TRUST. THE MANAGING OWNER HAS TRIED TO IDENTIFY THESE FORWARD-LOOKING STATEMENTS BY USING WORDS SUCH AS “MAY,” “WILL,” “EXPECT,” “ANTICIPATE,” “BELIEVE,” “INTEND,” “SHOULD,” “ESTIMATE” OR THE NEGATIVE OF THOSE TERMS OR SIMILAR EXPRESSIONS. THESE FORWARD-LOOKING STATEMENTS ARE BASED ON INFORMATION CURRENTLY AVAILABLE TO THE MANAGING OWNER AND ARE SUBJECT TO A NUMBER OF RISKS, UNCERTAINTIES AND OTHER FACTORS, BOTH KNOWN, SUCH AS THOSE DESCRIBED IN THE “RISK FACTORS” SECTION UNDER ITEM 1A AND ELSEWHERE IN THIS REPORT, AND UNKNOWN, THAT COULD CAUSE THE TRUST’S ACTUAL RESULTS, PERFORMANCE, PROSPECTS OR OPPORTUNITIES TO DIFFER MATERIALLY FROM THOSE EXPRESSED IN, OR IMPLIED BY, THESE FORWARD-LOOKING STATEMENTS.
YOU SHOULD NOT PLACE UNDUE RELIANCE ON ANY FORWARD-LOOKING STATEMENTS. EXCEPT AS EXPRESSLY REQUIRED BY THE FEDERAL SECURITIES LAWS, THE MANAGING OWNER UNDERTAKES NO OBLIGATION TO PUBLICLY UPDATE OR REVISE ANY FORWARD-LOOKING STATEMENTS OR THE RISKS, UNCERTAINTIES OR OTHER FACTORS DESCRIBED HEREIN, AS A RESULT OF NEW INFORMATION, FUTURE EVENTS OR CHANGED CIRCUMSTANCES OR FOR ANY OTHER REASON AFTER THE DATE OF THIS REPORT.
UNLESS EXPRESSLY STATED OTHERWISE, ALL INFORMATION IN THIS REPORT IS AS OF JUNESEPTEMBER 30, 2013, AND THE MANAGING OWNER UNDERTAKES NO OBLIGATION TO UPDATE THIS INFORMATION.
| ITEM 1. | Financial Statements |
The Series of the Frontier Fund
Statements of Financial Condition
JuneSeptember 30, 2013 and December 31, 2012
| Frontier Diversified Series | Frontier Masters Series | Frontier Long/Short Commodity Series | Frontier Diversified Series | Frontier Masters Series | Frontier Long/Short Commodity Series | |||||||||||||||||||||||||||||||||||||||||||
| 6/30/2013 (Unaudited) | 12/31/2012 | 6/30/2013 (Unaudited) | 12/31/2012 | 6/30/2013 (Unaudited) | 12/31/2012 | 9/30/2013 (Unaudited) | 12/31/2012 | 9/30/2013 (Unaudited) | 12/31/2012 | 9/30/2013 (Unaudited) | 12/31/2012 | |||||||||||||||||||||||||||||||||||||
| ASSETS | ||||||||||||||||||||||||||||||||||||||||||||||||
Cash and cash equivalents | $ | 1,012,912 | $ | 2,681,889 | $ | 599,271 | $ | 1,542,661 | $ | 609,160 | $ | 1,710,151 | $ | 1,381,083 | $ | 2,681,889 | $ | 827,898 | $ | 1,542,661 | $ | 693,230 | $ | 1,710,151 | ||||||||||||||||||||||||
U.S. Treasury securities, at fair value | — | 3,853,000 | — | 2,212,909 | — | 2,388,540 | — | 3,853,000 | — | 2,212,909 | — | 2,388,540 | ||||||||||||||||||||||||||||||||||||
Custom time deposits | 52,557,208 | 66,875,140 | 31,094,504 | 38,288,877 | 31,607,650 | 41,327,739 | 44,968,522 | 66,875,140 | 28,180,906 | 38,288,877 | 23,596,948 | 41,327,739 | ||||||||||||||||||||||||||||||||||||
Receivable from futures commission merchants | — | — | — | — | 14,142,506 | 14,770,973 | — | — | — | — | 6,922,041 | 14,770,973 | ||||||||||||||||||||||||||||||||||||
Open trade equity, at fair value | — | — | — | — | — | — | ||||||||||||||||||||||||||||||||||||||||||
Swap contracts, at fair value | 2,413,658 | — | — | — | 2,819,497 | — | ||||||||||||||||||||||||||||||||||||||||||
Investments in unconsolidated trading companies, at fair value | 37,507,662 | 42,826,426 | 12,991,804 | 9,771,797 | 1,847,332 | 3,675,238 | 19,964,338 | 42,826,426 | 8,927,278 | 9,771,797 | — | 3,675,238 | ||||||||||||||||||||||||||||||||||||
Prepaid service fees - Class 1 | 27,629 | 40,235 | 26,773 | 57,276 | 18,652 | 42,004 | 9,913 | 40,235 | 20,100 | 57,276 | 7,871 | 42,004 | ||||||||||||||||||||||||||||||||||||
Interest receivable | 119 | 54,006 | 70 | 31,017 | 71 | 33,479 | 188 | 54,006 | 118 | 31,017 | 99 | 33,479 | ||||||||||||||||||||||||||||||||||||
Receivable from related parties | 22,411 | 114,481 | 14,163 | 38,735 | 18,333 | 549 | 1,388 | 114,481 | — | 38,735 | 2,032 | 549 | ||||||||||||||||||||||||||||||||||||
Receivable from other series | — | — | — | — | — | — | ||||||||||||||||||||||||||||||||||||||||||
Other assets | — | — | — | — | — | — | — | — | — | — | — | — | ||||||||||||||||||||||||||||||||||||
|
|
|
|
|
|
|
|
|
|
|
| |||||||||||||||||||||||||||||||||||||
Total Assets | $ | 91,127,941 | $ | 116,445,177 | $ | 44,726,585 | $ | 51,943,272 | $ | 48,243,704 | $ | 63,948,673 | $ | 68,739,090 | $ | 116,445,177 | $ | 37,956,300 | $ | 51,943,272 | $ | 34,041,718 | $ | 63,948,673 | ||||||||||||||||||||||||
|
|
|
|
|
|
|
|
|
|
|
| |||||||||||||||||||||||||||||||||||||
| LIABILITIES & CAPITAL | ||||||||||||||||||||||||||||||||||||||||||||||||
LIABILITIES | ||||||||||||||||||||||||||||||||||||||||||||||||
Open trade deficit, at fair value | $ | — | $ | — | $ | — | $ | — | $ | 2,707,217 | $ | 819,535 | $ | — | $ | — | $ | — | $ | — | $ | 200,291 | $ | 819,535 | ||||||||||||||||||||||||
Options written, at fair value | — | — | — | — | 320,050 | 928,690 | — | — | — | — | 29,302 | 928,690 | ||||||||||||||||||||||||||||||||||||
Pending owner additions | 2,608 | 23,900 | 1,292 | 15,449 | — | 62,537 | 62,060 | 23,900 | 1,289 | 15,449 | — | 62,537 | ||||||||||||||||||||||||||||||||||||
Owner redemptions payable | 932,831 | 521,439 | 44,755 | 141,453 | 406,457 | 344,538 | 358,273 | 521,439 | 158,560 | 141,453 | 53,464 | 344,538 | ||||||||||||||||||||||||||||||||||||
Incentive fees payable to Managing Owner | — | 189,903 | — | — | — | — | — | 189,903 | — | — | — | — | ||||||||||||||||||||||||||||||||||||
Management fees payable to Managing Owner | 121,590 | 150,188 | 104,266 | 118,274 | 189,068 | 277,379 | 101,464 | 150,188 | 98,876 | 118,274 | 152,047 | 277,379 | ||||||||||||||||||||||||||||||||||||
Interest payable to Managing Owner | 35,874 | 41,394 | 17,657 | 20,028 | 22,798 | 26,319 | 30,460 | 41,394 | 14,883 | 20,028 | 19,227 | 26,319 | ||||||||||||||||||||||||||||||||||||
Trading fees payable to Managing Owner | 192,678 | 228,169 | 90,921 | 104,852 | 57,794 | 79,400 | 149,772 | 228,169 | 80,808 | 104,852 | 42,620 | 79,400 | ||||||||||||||||||||||||||||||||||||
Service fees payable to Managing Owner | 72,227 | 89,177 | 42,689 | 47,423 | 23,374 | 24,074 | 54,639 | 89,177 | 39,713 | 47,423 | 17,705 | 24,074 | ||||||||||||||||||||||||||||||||||||
Payables to related parties | — | 19,435 | 33,137 | 9,635 | — | 34,037 | — | 19,435 | 1,361 | 9,635 | — | 34,037 | ||||||||||||||||||||||||||||||||||||
Other liabilities | — | — | — | — | 514 | — | — | — | — | — | 356 | — | ||||||||||||||||||||||||||||||||||||
|
|
|
|
|
|
|
|
|
|
|
| |||||||||||||||||||||||||||||||||||||
Total Liabilities | 1,357,808 | 1,263,605 | 334,717 | 457,114 | 3,727,272 | 2,596,509 | 756,668 | 1,263,605 | 395,490 | 457,114 | 515,012 | 2,596,509 | ||||||||||||||||||||||||||||||||||||
|
|
|
|
|
|
|
|
|
|
|
| |||||||||||||||||||||||||||||||||||||
CAPITAL | ||||||||||||||||||||||||||||||||||||||||||||||||
Managing Owner Units - Class 1 | 23,527 | 25,959 | 26,055 | 27,804 | — | — | 21,486 | 25,959 | 24,163 | 27,804 | — | — | ||||||||||||||||||||||||||||||||||||
Managing Owner Units - Class 1a | — | — | — | — | — | 12,732 | — | — | — | — | — | 12,732 | ||||||||||||||||||||||||||||||||||||
Managing Owner Units - Class 2 | 1,313,530 | 1,436,973 | 572,298 | 605,508 | 414,516 | 449,011 | 1,205,022 | 1,436,973 | 533,151 | 605,508 | 388,718 | 449,011 | ||||||||||||||||||||||||||||||||||||
Managing Owner Units - Class 2a | — | — | — | — | 238,083 | 256,560 | — | — | — | — | 224,080 | 256,560 | ||||||||||||||||||||||||||||||||||||
Managing Owner Units - Class 3a | — | — | — | — | 11,721 | — | — | — | — | — | 11,039 | — | ||||||||||||||||||||||||||||||||||||
Limited Owner Units - Class 1 | 45,214,923 | 58,973,977 | 30,694,768 | 34,575,695 | — | — | 33,821,461 | 58,973,977 | 26,286,114 | 34,575,695 | — | — | ||||||||||||||||||||||||||||||||||||
Limited Owner Units - Class 1a | — | — | — | — | 14,941,599 | 18,970,806 | — | — | — | — | 11,243,674 | 18,970,806 | ||||||||||||||||||||||||||||||||||||
Limited Owner Units - Class 2 | 43,218,153 | 54,744,663 | 13,098,747 | 16,277,151 | 4,335,915 | 6,449,774 | 32,934,453 | 54,744,663 | 10,717,382 | 16,277,151 | 3,547,618 | 6,449,774 | ||||||||||||||||||||||||||||||||||||
Limited Owner Units - Class 2a | — | — | — | — | 7,261,874 | 10,625,551 | — | — | — | — | 4,082,583 | 10,625,551 | ||||||||||||||||||||||||||||||||||||
Limited Owner Units - Class 3 | — | — | — | — | 13,159,058 | 19,761,047 | — | — | — | — | 11,321,675 | 19,761,047 | ||||||||||||||||||||||||||||||||||||
Limited Owner Units - Class 3a | — | — | — | — | 22,658 | — | — | — | — | — | 117,179 | — | ||||||||||||||||||||||||||||||||||||
|
|
|
|
|
|
|
|
|
|
|
| |||||||||||||||||||||||||||||||||||||
Total Owners’ Capital | 89,770,133 | 115,181,572 | 44,391,868 | 51,486,158 | 40,385,424 | 56,525,481 | 67,982,422 | 115,181,572 | 37,560,810 | 51,486,158 | 30,936,566 | 56,525,481 | ||||||||||||||||||||||||||||||||||||
|
|
|
|
|
|
|
|
|
|
|
| |||||||||||||||||||||||||||||||||||||
Non-Controlling Interests | — | — | — | — | 4,131,008 | 4,826,683 | — | — | — | — | 2,590,140 | 4,826,683 | ||||||||||||||||||||||||||||||||||||
|
|
|
|
|
|
|
|
|
|
|
| |||||||||||||||||||||||||||||||||||||
Total Capital | 89,770,133 | 115,181,572 | 44,391,868 | 51,486,158 | 44,516,432 | 61,352,164 | 67,982,422 | 115,181,572 | 37,560,810 | 51,486,158 | 33,526,706 | 61,352,164 | ||||||||||||||||||||||||||||||||||||
|
|
|
|
|
|
|
|
|
|
|
| |||||||||||||||||||||||||||||||||||||
Total Liabilities and Capital | $ | 91,127,941 | $ | 116,445,177 | $ | 44,726,585 | $ | 51,943,272 | $ | 48,243,704 | $ | 63,948,673 | $ | 68,739,090 | $ | 116,445,177 | $ | 37,956,300 | $ | 51,943,272 | $ | 34,041,718 | $ | 63,948,673 | ||||||||||||||||||||||||
|
|
|
|
|
|
|
|
|
|
|
| |||||||||||||||||||||||||||||||||||||
Units Outstanding | ||||||||||||||||||||||||||||||||||||||||||||||||
Class 1 | 528,790 | 625,015 | 324,250 | 342,249 | N/A | N/A | 433,157 | 625,015 | 299,434 | 342,249 | N/A | N/A | ||||||||||||||||||||||||||||||||||||
Class 1a | N/A | N/A | N/A | N/A | 149,563 | 174,830 | N/A | N/A | N/A | N/A | 120,121 | 174,830 | ||||||||||||||||||||||||||||||||||||
Class 2 | 484,835 | 559,127 | 134,416 | 156,889 | 35,331 | 47,367 | 405,160 | 559,127 | 118,739 | 156,889 | 31,219 | 47,367 | ||||||||||||||||||||||||||||||||||||
Class 2a | N/A | N/A | N/A | N/A | 70,003 | 94,257 | N/A | N/A | N/A | N/A | 42,710 | 94,257 | ||||||||||||||||||||||||||||||||||||
Class 3 | N/A | N/A | N/A | N/A | 97,842 | 135,642 | N/A | N/A | N/A | N/A | 89,767 | 135,642 | ||||||||||||||||||||||||||||||||||||
Class 3a | N/A | N/A | N/A | N/A | 321 | (2) | N/A | N/A | N/A | N/A | N/A | 1,271 | (2) | N/A | ||||||||||||||||||||||||||||||||||
Net Asset Value per Unit | ||||||||||||||||||||||||||||||||||||||||||||||||
Class 1 | $ | 85.55 | $ | 94.40 | $ | 94.74 | $ | 101.11 | N/A | $ | 135.41 | (1) | $ | 78.13 | $ | 94.40 | $ | 87.87 | $ | 101.11 | N/A | $ | 135.41 | (1) | ||||||||||||||||||||||||
Class 1a | N/A | N/A | N/A | N/A | $ | 99.90 | $ | 108.58 | N/A | N/A | N/A | N/A | $ | 93.60 | $ | 108.58 | ||||||||||||||||||||||||||||||||
Class 2 | $ | 91.85 | $ | 100.48 | $ | 101.71 | $ | 107.61 | $ | 134.46 | $ | 145.65 | $ | 84.26 | $ | 100.48 | $ | 94.75 | $ | 107.61 | $ | 126.09 | $ | 145.65 | ||||||||||||||||||||||||
Class 2a | N/A | N/A | N/A | N/A | $ | 107.14 | $ | 115.45 | N/A | N/A | N/A | N/A | $ | 100.84 | $ | 115.45 | ||||||||||||||||||||||||||||||||
Class 3 | N/A | N/A | N/A | N/A | $ | 134.49 | $ | 145.69 | N/A | N/A | N/A | N/A | $ | 126.12 | $ | 145.69 | ||||||||||||||||||||||||||||||||
Class 3a | N/A | N/A | N/A | N/A | $ | 107.15 | (2) | N/A | N/A | N/A | N/A | N/A | $ | 100.91 | (2) | N/A | ||||||||||||||||||||||||||||||||
| (1) | Class 1 operations ceased July 18, 2012 and all remaining Class 1 Units were exchanged for Class 3 Units. |
| (2) | Class 3a operations began June 17, 2013. |
The accompanying notes are an integral part of these financial statements.
The Series of the Frontier Fund
Statements of Financial Condition
JuneSeptember 30, 2013 and December 31, 2012
| Balanced Series | Frontier Select Series (1) | Balanced Series | Frontier Select Series (1) | |||||||||||||||||||||||||||||
| 6/30/2013 (Unaudited) | 12/31/2012 | 6/30/2013 (Unaudited) | 12/31/2012 | 9/30/2013 (Unaudited) | 12/31/2012 | 9/30/2013 (Unaudited) | 12/31/2012 | |||||||||||||||||||||||||
| ASSETS | ||||||||||||||||||||||||||||||||
Cash and cash equivalents | $ | 1,746,479 | $ | 4,111,855 | $ | 323,675 | $ | 664,310 | $ | 2,438,659 | $ | 4,111,855 | $ | 430,385 | $ | 664,310 | ||||||||||||||||
U.S. Treasury securities, at fair value | — | 5,951,633 | — | 961,568 | — | 5,951,633 | — | 961,568 | ||||||||||||||||||||||||
Custom time deposits | 90,619,958 | 102,978,191 | 16,794,625 | 16,637,538 | 83,009,823 | 102,978,191 | 14,649,926 | 16,637,538 | ||||||||||||||||||||||||
Receivable from futures commission merchants | 22,019,309 | 92,043,593 | — | — | 20,948,268 | 92,043,593 | — | — | ||||||||||||||||||||||||
Open trade equity, at fair value | 436,878 | — | — | — | — | — | — | — | ||||||||||||||||||||||||
Swap contracts, at fair value | 16,806,761 | 22,289,478 | — | — | 7,410,271 | 22,289,478 | — | — | ||||||||||||||||||||||||
Investments in unconsolidated trading companies, at fair value | 35,853,911 | 20,193,128 | 5,098,984 | 7,373,509 | 17,588,160 | 20,193,128 | 4,343,695 | 7,373,509 | ||||||||||||||||||||||||
Interest receivable | 205 | 83,422 | 38 | 13,478 | 348 | 83,422 | 61 | 13,478 | ||||||||||||||||||||||||
Receivable from related parties | 52,651 | 17,313 | 6,241 | — | — | 17,313 | — | — | ||||||||||||||||||||||||
Prepaid service fees | 612 | — | — | — | 423 | — | — | — | ||||||||||||||||||||||||
Other assets | 50 | 34,301 | — | — | 50 | 34,301 | — | — | ||||||||||||||||||||||||
|
|
|
|
|
|
|
| |||||||||||||||||||||||||
Total Assets | $ | 167,536,814 | $ | 247,702,914 | $ | 22,223,563 | $ | 25,650,403 | $ | 131,396,002 | $ | 247,702,914 | $ | 19,424,067 | $ | 25,650,403 | ||||||||||||||||
|
|
|
|
|
|
|
| |||||||||||||||||||||||||
| LIABILITIES & CAPITAL | ||||||||||||||||||||||||||||||||
LIABILITIES | ||||||||||||||||||||||||||||||||
Open trade deficit, at fair value | $ | — | $ | 672,511 | $ | — | $ | — | $ | 197,674 | $ | 672,511 | $ | — | $ | — | ||||||||||||||||
Options written, at fair value | 144,318 | 165,363 | — | — | 467,791 | 165,363 | — | — | ||||||||||||||||||||||||
Pending owner additions | 19,549 | 34,831 | 1,065 | 1,522 | 14,800 | 34,831 | 940 | 1,522 | ||||||||||||||||||||||||
Owner redemptions payable | 581,690 | 342,417 | 21,147 | 40,093 | 760,835 | 342,417 | 15,072 | 40,093 | ||||||||||||||||||||||||
Incentive fees payable to Managing Owner | — | 527,306 | — | — | — | 527,306 | — | — | ||||||||||||||||||||||||
Management fees payable to Managing Owner | 129,298 | 193,155 | 44,909 | 103,089 | 92,310 | 193,155 | 45,546 | 103,089 | ||||||||||||||||||||||||
Interest payable to Managing Owner | 256,653 | 330,341 | 36,306 | 42,764 | 207,056 | 330,341 | 33,837 | 42,764 | ||||||||||||||||||||||||
Trading fees payable to Managing Owner | 97,612 | 132,875 | 13,626 | 16,057 | 79,628 | 132,875 | 12,681 | 16,057 | ||||||||||||||||||||||||
Service fees payable to Managing Owner | 238,795 | 332,942 | 43,481 | 54,702 | 202,653 | 332,942 | 42,233 | 54,702 | ||||||||||||||||||||||||
Payables to related parties | — | 1,490 | — | 47,535 | 6,268 | 1,490 | 322 | 47,535 | ||||||||||||||||||||||||
Other liabilities | 5,512 | — | — | — | 1,387 | — | — | — | ||||||||||||||||||||||||
|
|
|
|
|
|
|
| |||||||||||||||||||||||||
Total Liabilities | 1,473,427 | 2,733,231 | 160,534 | 305,762 | 2,030,402 | 2,733,231 | 150,631 | 305,762 | ||||||||||||||||||||||||
|
|
|
|
|
|
|
| |||||||||||||||||||||||||
CAPITAL | ||||||||||||||||||||||||||||||||
Managing Owner Units - Class 2 | 2,909,316 | 3,225,784 | 7,329 | 7,013 | 2,238,810 | 3,225,784 | 6,931 | 7,013 | ||||||||||||||||||||||||
Managing Owner Units - Class 2a | 141,911 | 153,884 | — | — | 133,769 | 153,884 | — | — | ||||||||||||||||||||||||
Limited Owner Units - Class 1 | 108,082,752 | 143,906,872 | 19,323,354 | 22,266,758 | 86,381,929 | 143,906,872 | 17,006,881 | 22,266,758 | ||||||||||||||||||||||||
Limited Owner Units - Class 2 | 37,337,239 | 48,233,784 | 2,732,346 | 3,070,870 | 29,518,614 | 48,233,784 | 2,259,624 | 3,070,870 | ||||||||||||||||||||||||
Limited Owner Units - Class 2a | 627,841 | 855,636 | — | — | 506,762 | 855,636 | — | — | ||||||||||||||||||||||||
Limited Owner Units - Class 3a | 2,597,739 | 3,776,790 | — | — | 2,298,925 | 3,776,790 | — | — | ||||||||||||||||||||||||
|
|
|
|
|
|
|
| |||||||||||||||||||||||||
Total Owners’ Capital | 151,696,798 | 200,152,750 | 22,063,029 | 25,344,641 | 121,078,809 | 200,152,750 | 19,273,436 | 25,344,641 | ||||||||||||||||||||||||
|
|
|
|
|
|
|
| |||||||||||||||||||||||||
Non-Controlling Interests | 14,366,589 | 44,816,933 | — | — | 8,286,791 | 44,816,933 | — | — | ||||||||||||||||||||||||
|
|
|
|
|
|
|
| |||||||||||||||||||||||||
Total Capital | 166,063,387 | 244,969,683 | 22,063,029 | 25,344,641 | 129,365,600 | 244,969,683 | 19,273,436 | 25,344,641 | ||||||||||||||||||||||||
|
|
|
|
|
|
|
| |||||||||||||||||||||||||
Total Liabilities and Capital | $ | 167,536,814 | $ | 247,702,914 | $ | 22,223,563 | $ | 25,650,403 | $ | 131,396,002 | $ | 247,702,914 | $ | 19,424,067 | $ | 25,650,403 | ||||||||||||||||
|
|
|
|
|
|
|
| |||||||||||||||||||||||||
Units Outstanding | ||||||||||||||||||||||||||||||||
Class 1 | 1,030,440 | 1,237,173 | 238,543 | 283,073 | 883,942 | 1,237,173 | 223,714 | 283,073 | ||||||||||||||||||||||||
Class 2 | 294,764 | 344,894 | 26,334 | 30,918 | 247,726 | 344,894 | 23,036 | 30,918 | ||||||||||||||||||||||||
Class 2a | 6,712 | 8,117 | N/A | N/A | 5,925 | 8,117 | N/A | N/A | ||||||||||||||||||||||||
Class 3a | 22,725 | 30,469 | N/A | N/A | 21,335 | 30,469 | N/A | N/A | ||||||||||||||||||||||||
Net Asset Value per Unit | ||||||||||||||||||||||||||||||||
Class 1 | $ | 104.89 | $ | 116.32 | $ | 81.01 | $ | 78.66 | $ | 97.72 | $ | 116.32 | $ | 76.02 | $ | 78.66 | ||||||||||||||||
Class 1a | N/A | $ | 104.32 | (2) | N/A | N/A | ||||||||||||||||||||||||||
Class 2 | $ | 136.54 | $ | 149.20 | $ | 104.04 | $ | 99.55 | $ | 128.20 | $ | 149.20 | $ | 98.39 | $ | 99.55 | ||||||||||||||||
Class 2a | $ | 114.69 | $ | 124.36 | N/A | N/A | $ | 108.11 | $ | 124.36 | N/A | N/A | ||||||||||||||||||||
Class 3a | $ | 114.31 | $ | 123.96 | N/A | N/A | $ | 107.75 | $ | 123.96 | N/A | N/A | ||||||||||||||||||||
| (1) | Formerly the Tiverton/Graham/Transtrend Series. |
The accompanying notes are an integral part of these financial statements.
The Series of the Frontier Fund
Statements of Financial Condition
JuneSeptember 30, 2013 and December 31, 2012
| Winton Series | Frontier Heritage Series (1) | Winton Series | Frontier Heritage Series (1) | |||||||||||||||||||||||||||||
| 6/30/2013 (Unaudited) | 12/31/2012 | 6/30/2013 (Unaudited) | 12/31/2012 | 9/30/2013 (Unaudited) | 12/31/2012 | 9/30/2013 (Unaudited) | 12/31/2012 | |||||||||||||||||||||||||
| ASSETS | ||||||||||||||||||||||||||||||||
Cash and cash equivalents | $ | 620,384 | $ | 1,249,455 | $ | 282,124 | $ | 536,159 | $ | 858,214 | $ | 1,249,455 | $ | 347,039 | $ | 536,159 | ||||||||||||||||
U.S. Treasury securities, at fair value | — | 1,808,547 | — | 776,073 | — | 1,808,547 | — | 776,073 | ||||||||||||||||||||||||
Custom time deposits | 32,189,994 | 31,292,395 | 14,638,642 | 13,428,015 | 29,212,841 | 31,292,395 | 11,812,899 | 13,428,015 | ||||||||||||||||||||||||
Investments in unconsolidated trading companies, at fair value | 6,246,046 | 6,865,965 | 2,663,149 | 6,174,855 | 6,712,629 | 6,865,965 | 2,958,796 | 6,174,855 | ||||||||||||||||||||||||
Interest receivable | 73 | 25,350 | 33 | 10,878 | 122 | 25,350 | 49 | 10,878 | ||||||||||||||||||||||||
Receivable from related parties | 44,110 | — | 3,871 | — | — | — | — | — | ||||||||||||||||||||||||
Other assets | — | — | — | — | — | — | — | — | ||||||||||||||||||||||||
|
|
|
|
|
|
|
| |||||||||||||||||||||||||
Total Assets | $ | 39,100,607 | $ | 41,241,712 | $ | 17,587,819 | $ | 20,925,980 | $ | 36,783,806 | $ | 41,241,712 | $ | 15,118,783 | $ | 20,925,980 | ||||||||||||||||
|
|
|
|
|
|
|
| |||||||||||||||||||||||||
| LIABILITIES & CAPITAL | ||||||||||||||||||||||||||||||||
LIABILITIES | ||||||||||||||||||||||||||||||||
Pending owner additions | $ | 13,532 | $ | 15,044 | $ | 3,012 | $ | 3,976 | $ | 13,280 | $ | 15,044 | $ | 2,732 | $ | 3,976 | ||||||||||||||||
Owner redemptions payable | — | 22,467 | 7,427 | 18,231 | 165,770 | 22,467 | 21,205 | 18,231 | ||||||||||||||||||||||||
Management fees payable to Managing Owner | 85,774 | 86,138 | 24,021 | 63,642 | 87,013 | 86,138 | 24,337 | 63,642 | ||||||||||||||||||||||||
Interest payable to Managing Owner | 64,591 | 69,369 | 29,482 | 35,011 | 62,052 | 69,369 | 26,236 | 35,011 | ||||||||||||||||||||||||
Trading fees payable to Managing Owner | 24,181 | 26,041 | 11,045 | 13,148 | 23,305 | 26,041 | 9,847 | 13,148 | ||||||||||||||||||||||||
Service fees payable to Managing Owner | 52,335 | 62,556 | 29,697 | 38,116 | 52,149 | 62,556 | 27,616 | 38,116 | ||||||||||||||||||||||||
Payables to related parties | — | 563 | — | 317 | 2,070 | 563 | 861 | 317 | ||||||||||||||||||||||||
Other liabilities | — | — | — | — | — | — | — | — | ||||||||||||||||||||||||
|
|
|
|
|
|
|
| |||||||||||||||||||||||||
Total Liabilities | 240,413 | 282,178 | 104,684 | 172,441 | 405,639 | 282,178 | 112,834 | 172,441 | ||||||||||||||||||||||||
|
|
|
|
|
|
|
| |||||||||||||||||||||||||
CAPITAL | ||||||||||||||||||||||||||||||||
Managing Owner Units - Class 2 | 33,734 | 32,721 | 54,409 | 51,683 | 33,179 | 32,721 | 53,418 | 51,683 | ||||||||||||||||||||||||
Limited Owner Units - Class 1 | 28,506,866 | 30,645,208 | 13,877,265 | 16,680,498 | 26,594,221 | 30,645,208 | 11,974,513 | 16,680,498 | ||||||||||||||||||||||||
Limited Owner Units - Class 2 | 10,319,594 | 10,281,605 | 3,551,461 | 4,021,358 | 9,750,767 | 10,281,605 | 2,978,018 | 4,021,358 | ||||||||||||||||||||||||
|
|
|
|
|
|
|
| |||||||||||||||||||||||||
Total Owners’ Capital | 38,860,194 | 40,959,534 | 17,483,135 | 20,753,539 | 36,378,167 | 40,959,534 | 15,005,949 | 20,753,539 | ||||||||||||||||||||||||
|
|
|
|
|
|
|
| |||||||||||||||||||||||||
Non-Controlling Interests | — | — | — | — | — | — | — | — | ||||||||||||||||||||||||
|
|
|
|
|
|
|
| |||||||||||||||||||||||||
Total Capital | 38,860,194 | 40,959,534 | 17,483,135 | 20,753,539 | 36,378,167 | 40,959,534 | 15,005,949 | 20,753,539 | ||||||||||||||||||||||||
|
|
|
|
|
|
|
| |||||||||||||||||||||||||
Total Liabilities and Capital | $ | 39,100,607 | $ | 41,241,712 | $ | 17,587,819 | $ | 20,925,980 | $ | 36,783,806 | $ | 41,241,712 | $ | 15,118,783 | $ | 20,925,980 | ||||||||||||||||
|
|
|
|
|
|
|
| |||||||||||||||||||||||||
Units Outstanding | ||||||||||||||||||||||||||||||||
Class 1 | 214,647 | 234,414 | 141,485 | 176,419 | 205,176 | 234,414 | 125,316 | 176,419 | ||||||||||||||||||||||||
Class 2 | 63,442 | 65,159 | 28,385 | 33,753 | 60,956 | 65,159 | 24,306 | 33,753 | ||||||||||||||||||||||||
Net Asset Value per Unit | ||||||||||||||||||||||||||||||||
Class 1 | $ | 132.81 | $ | 130.73 | $ | 98.08 | $ | 94.55 | $ | 129.62 | $ | 130.73 | $ | 95.55 | $ | 94.55 | ||||||||||||||||
Class 2 | $ | 163.19 | $ | 158.30 | $ | 127.04 | $ | 120.67 | $ | 160.51 | $ | 158.30 | $ | 124.72 | $ | 120.67 | ||||||||||||||||
| (1) | Formerly the Winton/Graham Series. |
The accompanying notes are an integral part of these financial statements.
The Series of the Frontier Fund
Condensed Schedules of Investments (Unaudited)
JuneSeptember 30, 2013
| Frontier Diversified Series | Frontier Masters Series | Frontier Long/Short Commodity Series | Frontier Diversified Series | Frontier Masters Series | Frontier Long/Short Commodity Series | |||||||||||||||||||||||||||||||||||||||||||
Description | Value | % of Total Capital (Net Asset Value) | Value | % of Total Capital (Net Asset Value) | Value | % of Total Capital (Net Asset Value) | Value | % of Total Capital (Net Asset Value) | Value | % of Total Capital (Net Asset Value) | Value | % of Total Capital (Net Asset Value) | ||||||||||||||||||||||||||||||||||||
LONG FUTURES CONTRACTS * | ||||||||||||||||||||||||||||||||||||||||||||||||
Various currency futures contracts (U.S.) | $ | — | 0.00 | % | $ | — | 0.00 | % | $ | 44,496 | 0.13 | % | ||||||||||||||||||||||||||||||||||||
Various energy futures contracts (U.S.) | — | 0.00 | % | — | 0.00 | % | (486,354 | ) | -1.45 | % | ||||||||||||||||||||||||||||||||||||||
Crude Oil Settling 3/1/2014 (Number of Contracts: 539) | — | 0.00 | % | — | 0.00 | % | 848,922 | 2.53 | % | |||||||||||||||||||||||||||||||||||||||
Various interest rates futures contracts (U.S.) | — | 0.00 | % | — | 0.00 | % | (206,430 | ) | -0.62 | % | ||||||||||||||||||||||||||||||||||||||
Various soft futures contracts (Canada) | — | 0.00 | % | — | 0.00 | % | — | 0.00 | % | |||||||||||||||||||||||||||||||||||||||
Various soft futures contracts (Europe) | — | 0.00 | % | — | 0.00 | % | — | 0.00 | % | |||||||||||||||||||||||||||||||||||||||
Various soft futures contracts (U.S.) | — | 0.00 | % | — | 0.00 | % | (144,638 | ) | -0.43 | % | ||||||||||||||||||||||||||||||||||||||
Corn Settling 3/1/2014 (Number of Contracts: 271) | — | 0.00 | % | — | 0.00 | % | (440,575 | ) | -1.31 | % | ||||||||||||||||||||||||||||||||||||||
Various stock index futures contracts (Canada) | — | 0.00 | % | — | 0.00 | % | — | 0.00 | % | |||||||||||||||||||||||||||||||||||||||
Various stock index futures contracts (Europe) | — | 0.00 | % | — | 0.00 | % | (730 | ) | 0.00 | % | ||||||||||||||||||||||||||||||||||||||
Various stock index futures contracts (U.S.) | — | 0.00 | % | — | 0.00 | % | (21,395 | ) | -0.06 | % | ||||||||||||||||||||||||||||||||||||||
Various base metals futures contracts (U.S.) | $ | — | 0.00 | % | $ | — | 0.00 | % | $ | 32,718 | 0.07 | % | — | 0.00 | % | — | 0.00 | % | 11,188 | 0.03 | % | |||||||||||||||||||||||||||
Various base metals futures contracts (Europe) | — | 0.00 | % | — | 0.00 | % | (53,846 | ) | -0.12 | % | — | 0.00 | % | — | 0.00 | % | (7,935 | ) | -0.02 | % | ||||||||||||||||||||||||||||
Various currency futures contracts (U.S.) | — | 0.00 | % | — | 0.00 | % | (137,611 | ) | -0.31 | % | ||||||||||||||||||||||||||||||||||||||
Various energy futures contracts (U.S.) | — | 0.00 | % | — | 0.00 | % | (86,861 | ) | -0.20 | % | ||||||||||||||||||||||||||||||||||||||
Crude Oil Settling 12/01/2013(Number of Contracts: 700) | — | 0.00 | % | — | 0.00 | % | 1,173,747 | 2.64 | % | |||||||||||||||||||||||||||||||||||||||
Natural Gas Settling 01/01/2014(Number of Contracts: 332) | — | 0.00 | % | — | 0.00 | % | (1,709,680 | ) | -3.84 | % | ||||||||||||||||||||||||||||||||||||||
Various interest rates futures contracts (Canada) | — | 0.00 | % | — | 0.00 | % | 1,735 | 0.00 | % | |||||||||||||||||||||||||||||||||||||||
Various interest rates futures contracts (Europe) | — | 0.00 | % | — | 0.00 | % | 137,318 | 0.31 | % | |||||||||||||||||||||||||||||||||||||||
Various interest rates futures contracts (Far East) | — | 0.00 | % | — | 0.00 | % | (17,753 | ) | -0.04 | % | ||||||||||||||||||||||||||||||||||||||
Various interest rates futures contracts (Oceanic) | — | 0.00 | % | — | 0.00 | % | (4,760 | ) | -0.01 | % | ||||||||||||||||||||||||||||||||||||||
Various interest rates futures contracts (U.S.) | — | 0.00 | % | — | 0.00 | % | (346,307 | ) | -0.78 | % | ||||||||||||||||||||||||||||||||||||||
90 Day Euro Time Deposit Settling 12/01/2017(Number of Contracts: 772) | — | 0.00 | % | — | 0.00 | % | (1,660,091 | ) | -3.73 | % | ||||||||||||||||||||||||||||||||||||||
Various precious metal futures contracts (U.S.) | — | 0.00 | % | — | 0.00 | % | (51,665 | ) | -0.12 | % | — | 0.00 | % | — | 0.00 | % | (43,817 | ) | -0.13 | % | ||||||||||||||||||||||||||||
Various soft futures contracts (Canada) | — | 0.00 | % | — | 0.00 | % | 91 | 0.00 | % | |||||||||||||||||||||||||||||||||||||||
Various soft futures contracts (Europe) | — | 0.00 | % | — | 0.00 | % | (2,750 | ) | -0.01 | % | ||||||||||||||||||||||||||||||||||||||
Various soft futures contracts (Far East) | — | 0.00 | % | — | 0.00 | % | — | 0.00 | % | |||||||||||||||||||||||||||||||||||||||
Various soft futures contracts (U.S.) | — | 0.00 | % | — | 0.00 | % | 103,506 | 0.23 | % | |||||||||||||||||||||||||||||||||||||||
Various stock index futures contracts (Canada) | — | 0.00 | % | — | 0.00 | % | — | 0.00 | % | |||||||||||||||||||||||||||||||||||||||
Various stock index futures contracts (Europe) | — | 0.00 | % | — | 0.00 | % | — | 0.00 | % | |||||||||||||||||||||||||||||||||||||||
Various stock index futures contracts (Far East) | — | 0.00 | % | — | 0.00 | % | (940 | ) | 0.00 | % | ||||||||||||||||||||||||||||||||||||||
Various stock index futures contracts (Oceanic) | — | 0.00 | % | — | 0.00 | % | — | 0.00 | % | |||||||||||||||||||||||||||||||||||||||
Various stock index futures contracts (U.S.) | — | 0.00 | % | — | 0.00 | % | 88,446 | 0.20 | % | |||||||||||||||||||||||||||||||||||||||
|
|
|
|
|
|
|
|
|
|
|
| |||||||||||||||||||||||||||||||||||||
Total Long Futures Contracts | $ | — | 0.00 | % | $ | — | 0.00 | % | $ | (2,534,703 | ) | -5.69 | % | $ | — | 0.00 | % | $ | — | 0.00 | % | $ | (447,268 | ) | -1.33 | % | ||||||||||||||||||||||
|
|
|
|
|
|
|
|
|
|
|
| |||||||||||||||||||||||||||||||||||||
OPTIONS PURCHASED * | ||||||||||||||||||||||||||||||||||||||||||||||||
Various energy futures contracts (U.S.) | $ | — | 0.00 | % | $ | — | 0.00 | % | $ | 806,244 | 1.81 | % | $ | — | 0.00 | % | $ | — | 0.00 | % | $ | 3,680 | 0.01 | % | ||||||||||||||||||||||||
Various soft futures contracts (U.S.) | — | 0.00 | % | — | 0.00 | % | 74,880 | 0.17 | % | — | 0.00 | % | — | 0.00 | % | (318,197 | ) | -0.95 | % | |||||||||||||||||||||||||||||
Various stock index futures contracts (U.S.) | — | 0.00 | % | — | 0.00 | % | 24,250 | 0.05 | % | |||||||||||||||||||||||||||||||||||||||
Corn Settling 5/1/2014 (Number of Contracts: 317) | — | 0.00 | % | — | 0.00 | % | 553,800 | 1.65 | % | |||||||||||||||||||||||||||||||||||||||
|
|
|
|
|
|
|
|
|
|
|
| |||||||||||||||||||||||||||||||||||||
Total Options Purchased | $ | — | 0.00 | % | $ | — | 0.00 | % | $ | 905,374 | 2.03 | % | $ | — | 0.00 | % | $ | — | 0.00 | % | $ | 239,283 | 0.71 | % | ||||||||||||||||||||||||
|
|
|
|
|
|
|
|
|
|
|
| |||||||||||||||||||||||||||||||||||||
SHORT FUTURES CONTRACTS * | ||||||||||||||||||||||||||||||||||||||||||||||||
Various base metals futures contracts (U.S.) | $ | — | 0.00 | % | $ | — | 0.00 | % | $ | (21,937 | ) | -0.05 | % | |||||||||||||||||||||||||||||||||||
Various base metals futures contracts (Europe) | — | 0.00 | % | — | 0.00 | % | 10,986 | 0.02 | % | |||||||||||||||||||||||||||||||||||||||
Various currency futures contracts (U.S.) | — | 0.00 | % | — | 0.00 | % | 172,676 | 0.39 | % | $ | — | 0.00 | % | $ | — | 0.00 | % | $ | (75,950 | ) | -0.23 | % | ||||||||||||||||||||||||||
Various energy futures contracts (U.S.) | — | 0.00 | % | — | 0.00 | % | 890,863 | 2.00 | % | — | 0.00 | % | — | 0.00 | % | 458,454 | 1.37 | % | ||||||||||||||||||||||||||||||
Crude Oil Settling 09/01/2013(Number of Contracts: | — | 0.00 | % | — | 0.00 | % | (3,607,599 | ) | -8.10 | % | ||||||||||||||||||||||||||||||||||||||
Natural Gas Settling 09/01/2013(Number of Contracts: | — | 0.00 | % | — | 0.00 | % | 861,116 | 1.93 | % | |||||||||||||||||||||||||||||||||||||||
Various interest rates futures contracts (Canada) | — | 0.00 | % | — | 0.00 | % | — | 0.00 | % | |||||||||||||||||||||||||||||||||||||||
Various interest rates futures contracts (Europe) | — | 0.00 | % | — | 0.00 | % | (2,478 | ) | -0.01 | % | — | 0.00 | % | — | 0.00 | % | (62,495 | ) | -0.19 | % | ||||||||||||||||||||||||||||
Various interest rates futures contracts (Far East) | — | 0.00 | % | — | 0.00 | % | 8,362 | 0.02 | % | — | 0.00 | % | — | 0.00 | % | (142,739 | ) | -0.43 | % | |||||||||||||||||||||||||||||
Various interest rates futures contracts (Oceanic) | — | 0.00 | % | — | 0.00 | % | (44 | ) | 0.00 | % | ||||||||||||||||||||||||||||||||||||||
Various interest rates futures contracts (U.S.) | — | 0.00 | % | — | 0.00 | % | (10,550 | ) | -0.02 | % | — | 0.00 | % | — | 0.00 | % | (17,492 | ) | -0.05 | % | ||||||||||||||||||||||||||||
90 Day Euro Time Deposit Settling 12/01/2015(Number of Contracts: | — | 0.00 | % | — | 0.00 | % | 486,678 | 1.09 | % | |||||||||||||||||||||||||||||||||||||||
90 Day Euro Time Deposit Settling 12/1/2015 (Number of Contracts: 627) | — | 0.00 | % | — | 0.00 | % | (591,175 | ) | -1.76 | % | ||||||||||||||||||||||||||||||||||||||
Various soft futures contracts (U.S.) | — | 0.00 | % | — | 0.00 | % | 618,604 | 1.85 | % | |||||||||||||||||||||||||||||||||||||||
Various base metals futures contracts (Europe) | — | 0.00 | % | — | 0.00 | % | (171,384 | ) | -0.51 | % | ||||||||||||||||||||||||||||||||||||||
Various precious metal futures contracts (U.S.) | — | 0.00 | % | — | 0.00 | % | (192,604 | ) | -0.43 | % | — | 0.00 | % | — | 0.00 | % | (8,129 | ) | -0.02 | % | ||||||||||||||||||||||||||||
Various soft futures contracts (Canada) | — | 0.00 | % | — | 0.00 | % | 992 | 0.00 | % | |||||||||||||||||||||||||||||||||||||||
Various soft futures contracts (Europe) | — | 0.00 | % | — | 0.00 | % | (134 | ) | 0.00 | % | ||||||||||||||||||||||||||||||||||||||
Various soft futures contracts (U.S.) | — | 0.00 | % | — | 0.00 | % | (146,225 | ) | -0.33 | % | ||||||||||||||||||||||||||||||||||||||
Sugar Settling 05/01/2014(Number of Contracts: | — | 0.00 | % | — | 0.00 | % | 490,298 | 1.10 | % | |||||||||||||||||||||||||||||||||||||||
Various stock index futures contracts (Europe) | — | 0.00 | % | — | 0.00 | % | — | 0.00 | % | |||||||||||||||||||||||||||||||||||||||
Various stock index futures contracts (Far East) | — | 0.00 | % | — | 0.00 | % | — | 0.00 | % | |||||||||||||||||||||||||||||||||||||||
Various stock index futures contracts (U.S.) | — | 0.00 | % | — | 0.00 | % | (18,288 | ) | -0.04 | % | ||||||||||||||||||||||||||||||||||||||
|
|
|
|
|
|
|
|
|
|
|
| |||||||||||||||||||||||||||||||||||||
Total Short Futures Contracts | $ | — | 0.00 | % | $ | — | 0.00 | % | $ | (1,077,888 | ) | -2.42 | % | $ | — | 0.00 | % | $ | — | 0.00 | % | $ | 7,694 | 0.03 | % | |||||||||||||||||||||||
|
|
|
|
|
|
|
|
|
|
|
| |||||||||||||||||||||||||||||||||||||
CURRENCY FORWARDS * | ||||||||||||||||||||||||||||||||||||||||||||||||
Various currency forwards contracts | $ | — | 0.00 | % | $ | — | 0.00 | % | $ | — | 0.00 | % | ||||||||||||||||||||||||||||||||||||
Various currency forwards contracts (NA) | $ | — | 0.00 | % | $ | — | 0.00 | % | $ | — | 0.00 | % | ||||||||||||||||||||||||||||||||||||
|
|
|
|
|
|
|
|
|
|
|
| |||||||||||||||||||||||||||||||||||||
Total Currency Forwards | $ | — | 0.00 | % | $ | — | 0.00 | % | $ | — | 0.00 | % | $ | — | 0.00 | % | $ | — | 0.00 | % | $ | — | 0.00 | % | ||||||||||||||||||||||||
|
|
|
|
|
|
|
|
|
|
|
| |||||||||||||||||||||||||||||||||||||
Total Open Trade Deficit | $ | — | 0.00 | % | $ | — | 0.00 | % | $ | (2,707,217 | ) | -6.08 | % | |||||||||||||||||||||||||||||||||||
Total Open Trade Equity (Deficit) | $ | — | 0.00 | % | $ | — | 0.00 | % | $ | (200,291 | ) | -0.59 | % | |||||||||||||||||||||||||||||||||||
|
|
|
|
|
|
|
|
|
|
|
| |||||||||||||||||||||||||||||||||||||
OPTIONS WRITTEN * | ||||||||||||||||||||||||||||||||||||||||||||||||
Various energy futures contracts (U.S.) | $ | — | 0.00 | % | $ | — | 0.00 | % | $ | (11,390 | ) | -0.03 | % | |||||||||||||||||||||||||||||||||||
Various soft futures contracts (U.S.) | — | 0.00 | % | — | 0.00 | % | (308,660 | ) | -0.69 | % | — | 0.00 | % | — | 0.00 | % | (29,302 | ) | -0.09 | % | ||||||||||||||||||||||||||||
Various stock index futures contracts (U.S.) | — | 0.00 | % | — | 0.00 | % | — | 0.00 | % | |||||||||||||||||||||||||||||||||||||||
|
|
|
|
|
|
|
|
|
|
|
| |||||||||||||||||||||||||||||||||||||
Total Options Written | $ | — | 0.00 | % | $ | — | 0.00 | % | $ | (320,050 | ) | -0.72 | % | $ | — | 0.00 | % | $ | — | 0.00 | % | $ | (29,302 | ) | -0.09 | % | ||||||||||||||||||||||
|
|
|
|
|
|
|
|
|
|
|
| |||||||||||||||||||||||||||||||||||||
Swaps (1) | ||||||||||||||||||||||||||||||||||||||||||||||||
Frontier XXXV Diversified select swap (U.S.) | $ | 2,413,658 | 3.55 | % | $ | — | 0.00 | % | $ | — | 0.00 | % | ||||||||||||||||||||||||||||||||||||
Frontier XXXVII L/S select swap (U.S.) | — | 0.00 | % | — | 0.00 | % | 2,819,497 | 8.41 | % | |||||||||||||||||||||||||||||||||||||||
|
|
|
|
|
| |||||||||||||||||||||||||||||||||||||||||||
Total Swaps | $ | 2,413,658 | 3.55 | % | $ | — | 0.00 | % | $ | 2,819,497 | 8.41 | % | ||||||||||||||||||||||||||||||||||||
|
|
|
|
|
| |||||||||||||||||||||||||||||||||||||||||||
| * | Except for those items disclosed, no individual futures, forwards and option on futures contract position constituted greater than 1 percent of Net Asset Value. Accordingly, the number of contracts and expiration dates are not presented. |
| (1) | See Note 4 to the Financial Statements. |
The accompanying notes are an integral part of these financial statements.
The Series of the Frontier Fund
Condensed Schedules of Investments (Unaudited)
JuneSeptember 30, 2013
| Balanced Series | Frontier Select Series (1) | Balanced Series | Frontier Select Series (1) | |||||||||||||||||||||||||||||
Description | Value | % of Total Capital (Net Asset Value) | Value | % of Total Capital (Net Asset Value) | Value | % of Total Capital (Net Asset Value) | Value | % of Total Capital (Net Asset Value) | ||||||||||||||||||||||||
LONG FUTURES CONTRACTS * | ||||||||||||||||||||||||||||||||
Various base metals futures contracts (Europe) | $ | (781,511 | ) | -0.47 | % | $ | — | 0.00 | % | |||||||||||||||||||||||
Various base metals futures contracts (U.S.) | 100 | 0.00 | % | — | 0.00 | % | ||||||||||||||||||||||||||
Various currency futures contracts (U.S.) | (330,835 | ) | -0.20 | % | — | 0.00 | % | $ | 216,281 | 0.17 | % | $ | — | 0.00 | % | |||||||||||||||||
Various energy futures contracts (U.S.) | (28,509 | ) | -0.02 | % | — | 0.00 | % | (151,238 | ) | -0.12 | % | — | 0.00 | % | ||||||||||||||||||
Various interest rates futures contracts (Canada) | (4,871 | ) | 0.00 | % | — | 0.00 | % | 43,947 | 0.03 | % | — | 0.00 | % | |||||||||||||||||||
Various interest rates futures contracts (Europe) | (37,496 | ) | -0.02 | % | — | 0.00 | % | 418,179 | 0.32 | % | — | 0.00 | % | |||||||||||||||||||
Various interest rates futures contracts (Far East) | 18,499 | 0.01 | % | — | 0.00 | % | 118,474 | 0.09 | % | — | 0.00 | % | ||||||||||||||||||||
Various interest rates futures contracts (Oceanic) | 2,512 | 0.00 | % | — | 0.00 | % | 46,796 | 0.04 | % | — | 0.00 | % | ||||||||||||||||||||
Various interest rates futures contracts (U.S.) | (163,233 | ) | -0.10 | % | — | 0.00 | % | 446,869 | 0.35 | % | — | 0.00 | % | |||||||||||||||||||
Various precious metal futures contracts (U.S.) | 15,181 | 0.01 | % | — | 0.00 | % | ||||||||||||||||||||||||||
Various soft futures contracts (Canada) | — | 0.00 | % | — | 0.00 | % | ||||||||||||||||||||||||||
Various soft futures contracts (Europe) | 17,034 | 0.01 | % | — | 0.00 | % | 7,307 | 0.01 | % | — | 0.00 | % | ||||||||||||||||||||
Various soft futures contracts (Far East) | (45,983 | ) | -0.03 | % | — | 0.00 | % | |||||||||||||||||||||||||
Various soft futures contracts (U.S.) | (317,552 | ) | -0.19 | % | — | 0.00 | % | 79,426 | 0.06 | % | — | 0.00 | % | |||||||||||||||||||
Various stock index futures contracts (Africa) | 1,807 | 0.00 | % | — | 0.00 | % | ||||||||||||||||||||||||||
Various stock index futures contracts (Canada) | (1,084 | ) | 0.00 | % | — | 0.00 | % | (5,391 | ) | 0.00 | % | — | 0.00 | % | ||||||||||||||||||
Various stock index futures contracts (Europe) | (1,288 | ) | 0.00 | % | — | 0.00 | % | (244,889 | ) | -0.19 | % | — | 0.00 | % | ||||||||||||||||||
Various stock index futures contracts (Far East) | 6,936 | 0.00 | % | — | 0.00 | % | (102,474 | ) | -0.08 | % | — | 0.00 | % | |||||||||||||||||||
Various stock index futures contracts (Oceanic) | 754 | 0.00 | % | — | 0.00 | % | (13,202 | ) | -0.01 | % | — | 0.00 | % | |||||||||||||||||||
Various stock index futures contracts (U.S.) | (272,667 | ) | -0.16 | % | — | 0.00 | % | (410,914 | ) | -0.32 | % | — | 0.00 | % | ||||||||||||||||||
Various base metals futures contracts (U.S.) | 4,024 | 0.00 | % | — | 0.00 | % | ||||||||||||||||||||||||||
Various base metals futures contracts (Europe) | 54,036 | 0.04 | % | — | 0.00 | % | ||||||||||||||||||||||||||
Various precious metal futures contracts (U.S.) | (8,782 | ) | -0.01 | % | — | 0.00 | % | |||||||||||||||||||||||||
|
|
|
|
|
|
|
| |||||||||||||||||||||||||
Total Long Futures Contracts | $ | (1,924,013 | ) | -1.16 | % | $ | — | 0.00 | % | $ | 500,256 | 0.38 | % | $ | — | 0.00 | % | |||||||||||||||
|
|
|
|
|
|
|
| |||||||||||||||||||||||||
OPTIONS PURCHASED * | ||||||||||||||||||||||||||||||||
Various energy futures contracts (U.S.) | $ | — | 0.00 | % | $ | — | 0.00 | % | ||||||||||||||||||||||||
Various soft futures contracts (U.S.) | — | 0.00 | % | — | 0.00 | % | ||||||||||||||||||||||||||
Various stock index futures contracts (U.S.) | 663,779 | 0.40 | % | — | 0.00 | % | 607,025 | 0.47 | % | — | 0.00 | % | ||||||||||||||||||||
|
|
|
|
|
|
|
| |||||||||||||||||||||||||
Total Options Purchased | $ | 663,779 | 0.40 | % | $ | — | 0.00 | % | $ | 607,025 | 0.47 | % | $ | — | 0.00 | % | ||||||||||||||||
|
|
|
|
|
|
|
| |||||||||||||||||||||||||
SHORT FUTURES CONTRACTS * | ||||||||||||||||||||||||||||||||
Various base metals futures contracts (Europe) | $ | 778,735 | 0.47 | % | $ | — | 0.00 | % | ||||||||||||||||||||||||
Various base metals futures contracts (U.S.) | 4,187 | 0.00 | % | — | 0.00 | % | ||||||||||||||||||||||||||
Various currency futures contracts (U.S.) | 276,157 | 0.17 | % | — | 0.00 | % | $ | (144,815 | ) | -0.11 | % | $ | — | 0.00 | % | |||||||||||||||||
Various energy futures contracts (U.S.) | 19,426 | 0.01 | % | — | 0.00 | % | 12,489 | 0.01 | % | — | 0.00 | % | ||||||||||||||||||||
Various interest rates futures contracts (Canada) | 67,054 | 0.04 | % | — | 0.00 | % | (16,358 | ) | -0.01 | % | — | 0.00 | % | |||||||||||||||||||
Various interest rates futures contracts (Europe) | (16,678 | ) | -0.01 | % | — | 0.00 | % | (367,589 | ) | -0.28 | % | — | 0.00 | % | ||||||||||||||||||
Various interest rates futures contracts (Far East) | (16,040 | ) | -0.01 | % | — | 0.00 | % | |||||||||||||||||||||||||
Various interest rates futures contracts (Oceanic) | (61,114 | ) | -0.04 | % | — | 0.00 | % | (27,776 | ) | -0.02 | % | — | 0.00 | % | ||||||||||||||||||
Various interest rates futures contracts (U.S.) | 82,659 | 0.05 | % | — | 0.00 | % | (107,570 | ) | -0.08 | % | — | 0.00 | % | |||||||||||||||||||
Various precious metal futures contracts (U.S.) | 99,771 | 0.06 | % | — | 0.00 | % | ||||||||||||||||||||||||||
Various soft futures contracts (Canada) | — | 0.00 | % | — | 0.00 | % | ||||||||||||||||||||||||||
Various soft futures contracts (Europe) | 76,996 | 0.05 | % | — | 0.00 | % | 34,891 | 0.03 | % | — | 0.00 | % | ||||||||||||||||||||
Various soft futures contracts (U.S.) | 678,385 | 0.41 | % | — | 0.00 | % | 36,966 | 0.03 | % | — | 0.00 | % | ||||||||||||||||||||
Various stock index futures contracts (Europe) | 7,243 | 0.00 | % | — | 0.00 | % | 113 | 0.00 | % | — | 0.00 | % | ||||||||||||||||||||
Various stock index futures contracts (Far East) | (217,269 | ) | -0.13 | % | — | 0.00 | % | |||||||||||||||||||||||||
Various stock index futures contracts (U.S.) | (82,400 | ) | -0.05 | % | — | 0.00 | % | (6,998 | ) | -0.01 | % | — | 0.00 | % | ||||||||||||||||||
Various base metals futures contracts (U.S.) | (1,703 | ) | 0.00 | % | — | 0.00 | % | |||||||||||||||||||||||||
Various base metals futures contracts (Europe) | (757,163 | ) | -0.59 | % | — | 0.00 | % | |||||||||||||||||||||||||
Various precious metal futures contracts (U.S.) | 40,558 | 0.03 | % | — | 0.00 | % | ||||||||||||||||||||||||||
|
|
|
|
|
|
|
| |||||||||||||||||||||||||
Total Short Futures Contracts | $ | 1,697,112 | 1.02 | % | $ | — | 0.00 | % | $ | (1,304,955 | ) | -1.00 | % | $ | — | 0.00 | % | |||||||||||||||
|
|
|
|
|
|
|
| |||||||||||||||||||||||||
CURRENCY FORWARDS * | ||||||||||||||||||||||||||||||||
Various currency forwards contracts | $ | — | 0.00 | % | $ | — | 0.00 | % | ||||||||||||||||||||||||
Various currency forwards contracts (NA) | $ | — | 0.00 | % | $ | — | 0.00 | % | ||||||||||||||||||||||||
|
|
|
|
|
|
|
| |||||||||||||||||||||||||
Total Currency Forwards | $ | — | 0.00 | % | $ | — | 0.00 | % | $ | — | 0.00 | % | $ | — | 0.00 | % | ||||||||||||||||
|
|
|
|
|
|
|
| |||||||||||||||||||||||||
Total Open Trade Equity | $ | 436,878 | 0.26 | % | $ | — | 0.00 | % | ||||||||||||||||||||||||
Total Open Trade Equity (Deficit) | $ | (197,674 | ) | -0.15 | % | $ | — | 0.00 | % | |||||||||||||||||||||||
|
|
|
|
|
|
|
| |||||||||||||||||||||||||
OPTIONS WRITTEN * | ||||||||||||||||||||||||||||||||
Various energy futures contracts (U.S.) | $ | — | 0.00 | % | $ | — | 0.00 | % | ||||||||||||||||||||||||
Various soft futures contracts (U.S.) | — | 0.00 | % | — | 0.00 | % | ||||||||||||||||||||||||||
Various stock index futures contracts (U.S.) | (144,318 | ) | -0.09 | % | — | 0.00 | % | $ | (467,791 | ) | -0.36 | % | $ | — | 0.00 | % | ||||||||||||||||
|
|
|
|
|
|
|
| |||||||||||||||||||||||||
Total Options Written | $ | (144,318 | ) | -0.09 | % | $ | — | 0.00 | % | $ | (467,791 | ) | -0.36 | % | $ | — | 0.00 | % | ||||||||||||||
|
|
|
|
|
|
|
| |||||||||||||||||||||||||
Swaps (2) | ||||||||||||||||||||||||||||||||
Frontier Balanced RCW-1 Swap (U.S.) | $ | 16,806,761 | 10.12 | % | $ | — | 0.00 | % | ||||||||||||||||||||||||
Frontier XXXIV Balanced select swap (U.S.) | $ | 7,410,271 | 5.73 | % | $ | — | 0.00 | % | ||||||||||||||||||||||||
|
|
|
|
|
|
|
| |||||||||||||||||||||||||
Total Swaps | $ | 16,806,761 | 10.12 | % | $ | — | 0.00 | % | $ | 7,410,271 | 5.73 | % | $ | — | 0.00 | % | ||||||||||||||||
|
|
|
|
|
|
|
| |||||||||||||||||||||||||
| * | Except for those items disclosed, no individual futures, forwards and option on futures contract position constituted greater than 1 percent of Net Asset Value. Accordingly, the number of contracts and expiration dates are not presented. |
| (1) | Formerly the Tiverton/Graham/Transtrend Series. |
| (2) | See Note 4 to the Financial Statements. |
The accompanying notes are an integral part of these financial statements.
The Series of the Frontier Fund
Condensed Schedules of Investments (Unaudited)
JuneSeptember 30, 2013
| Winton Series | Frontier Heritage Series (1) | Winton Series | Frontier Heritage Series (1) | |||||||||||||||||||||||||||||
Description | Value | % of Total Capital (Net Asset Value) | Value | % of Total Capital (Net Asset Value) | Value | % of Total Capital (Net Asset Value) | Value | % of Total Capital (Net Asset Value) | ||||||||||||||||||||||||
LONG FUTURES CONTRACTS * | ||||||||||||||||||||||||||||||||
Various base metals futures contracts (Europe) | $ | — | 0.00 | % | $ | — | 0.00 | % | ||||||||||||||||||||||||
Various base metals futures contracts (U.S.) | — | 0.00 | % | — | 0.00 | % | ||||||||||||||||||||||||||
Various currency futures contracts (U.S.) | — | 0.00 | % | — | 0.00 | % | $ | — | 0.00 | % | $ | — | 0.00 | % | ||||||||||||||||||
Various energy futures contracts (Europe) | — | 0.00 | % | — | 0.00 | % | — | 0.00 | % | — | 0.00 | % | ||||||||||||||||||||
Various energy futures contracts (Far East) | — | 0.00 | % | — | 0.00 | % | — | 0.00 | % | — | 0.00 | % | ||||||||||||||||||||
Various energy futures contracts (U.S.) | — | 0.00 | % | — | 0.00 | % | — | 0.00 | % | — | 0.00 | % | ||||||||||||||||||||
Various interest rates futures contracts (Canada) | — | 0.00 | % | — | 0.00 | % | — | 0.00 | % | — | 0.00 | % | ||||||||||||||||||||
Various interest rates futures contracts (Europe) | — | 0.00 | % | — | 0.00 | % | — | 0.00 | % | — | 0.00 | % | ||||||||||||||||||||
Various interest rates futures contracts (Far East) | — | 0.00 | % | — | 0.00 | % | — | 0.00 | % | — | 0.00 | % | ||||||||||||||||||||
Various interest rates futures contracts (Oceanic) | — | 0.00 | % | — | 0.00 | % | — | 0.00 | % | — | 0.00 | % | ||||||||||||||||||||
Various interest rates futures contracts (U.S.) | — | 0.00 | % | — | 0.00 | % | — | 0.00 | % | — | 0.00 | % | ||||||||||||||||||||
Various precious metal futures contracts (Far East) | — | 0.00 | % | — | 0.00 | % | ||||||||||||||||||||||||||
Various precious metal futures contracts (U.S.) | — | 0.00 | % | — | 0.00 | % | ||||||||||||||||||||||||||
Various soft futures contracts (Canada) | — | 0.00 | % | — | 0.00 | % | — | 0.00 | % | — | 0.00 | % | ||||||||||||||||||||
Various soft futures contracts (Europe) | — | 0.00 | % | — | 0.00 | % | — | 0.00 | % | — | 0.00 | % | ||||||||||||||||||||
Various soft futures contracts (Far East) | — | 0.00 | % | — | 0.00 | % | ||||||||||||||||||||||||||
Various soft futures contracts (U.S.) | — | 0.00 | % | — | 0.00 | % | — | 0.00 | % | — | 0.00 | % | ||||||||||||||||||||
Various stock index futures contracts (Africa) | — | 0.00 | % | — | 0.00 | % | — | 0.00 | % | — | 0.00 | % | ||||||||||||||||||||
Various stock index futures contracts (Canada) | — | 0.00 | % | — | 0.00 | % | — | 0.00 | % | — | 0.00 | % | ||||||||||||||||||||
Various stock index futures contracts (Europe) | — | 0.00 | % | — | 0.00 | % | — | 0.00 | % | — | 0.00 | % | ||||||||||||||||||||
Various stock index futures contracts (Far East) | — | 0.00 | % | — | 0.00 | % | — | 0.00 | % | — | 0.00 | % | ||||||||||||||||||||
Various stock index futures contracts (Oceanic) | — | 0.00 | % | — | 0.00 | % | — | 0.00 | % | — | 0.00 | % | ||||||||||||||||||||
Various stock index futures contracts (U.S.) | — | 0.00 | % | — | 0.00 | % | — | 0.00 | % | — | 0.00 | % | ||||||||||||||||||||
Various soft futures contracts (Far East) | — | 0.00 | % | — | 0.00 | % | ||||||||||||||||||||||||||
Various base metals futures contracts (U.S.) | — | 0.00 | % | — | 0.00 | % | ||||||||||||||||||||||||||
Various base metals futures contracts (Europe) | — | 0.00 | % | — | 0.00 | % | ||||||||||||||||||||||||||
Various precious metal futures contracts (U.S.) | — | 0.00 | % | — | 0.00 | % | ||||||||||||||||||||||||||
Various precious metal futures contracts (Far East) | — | 0.00 | % | — | 0.00 | % | ||||||||||||||||||||||||||
|
|
|
|
|
|
|
| |||||||||||||||||||||||||
Total Long Futures Contracts | $ | — | 0.00 | % | $ | — | 0.00 | % | $ | — | 0.00 | % | $ | — | 0.00 | % | ||||||||||||||||
|
|
|
|
|
|
|
| |||||||||||||||||||||||||
OPTIONS PURCHASED * | ||||||||||||||||||||||||||||||||
Various base metals futures contracts (Europe) | $ | — | 0.00 | % | $ | — | 0.00 | % | ||||||||||||||||||||||||
Various currency futures contracts (U.S.) | — | 0.00 | % | — | 0.00 | % | $ | — | 0.00 | % | $ | — | 0.00 | % | ||||||||||||||||||
Various energy futures contracts (U.S.) | — | 0.00 | % | — | 0.00 | % | — | 0.00 | % | — | 0.00 | % | ||||||||||||||||||||
Various precious metal futures contracts (U.S.) | — | 0.00 | % | — | 0.00 | % | ||||||||||||||||||||||||||
Various soft futures contracts (U.S.) | — | 0.00 | % | — | 0.00 | % | — | 0.00 | % | — | 0.00 | % | ||||||||||||||||||||
Various stock index futures contracts (U.S.) | — | 0.00 | % | — | 0.00 | % | — | 0.00 | % | — | 0.00 | % | ||||||||||||||||||||
Various base metals futures contracts (Europe) | — | 0.00 | % | — | 0.00 | % | ||||||||||||||||||||||||||
Various precious metal futures contracts (U.S.) | — | 0.00 | % | — | 0.00 | % | ||||||||||||||||||||||||||
|
|
|
|
|
|
|
| |||||||||||||||||||||||||
Total Options Purchased | $ | — | 0.00 | % | $ | — | 0.00 | % | $ | — | 0.00 | % | $ | — | 0.00 | % | ||||||||||||||||
|
|
|
|
|
|
|
| |||||||||||||||||||||||||
SHORT FUTURES CONTRACTS * | ||||||||||||||||||||||||||||||||
Various base metals futures contracts (Europe) | $ | — | 0.00 | % | $ | — | 0.00 | % | ||||||||||||||||||||||||
Various base metals futures contracts (U.S.) | — | 0.00 | % | — | 0.00 | % | ||||||||||||||||||||||||||
Various currency futures contracts (Far East) | — | 0.00 | % | — | 0.00 | % | ||||||||||||||||||||||||||
Various currency futures contracts (U.S.) | — | 0.00 | % | — | 0.00 | % | $ | — | 0.00 | % | $ | — | 0.00 | % | ||||||||||||||||||
Various energy futures contracts (Europe) | — | 0.00 | % | — | 0.00 | % | — | 0.00 | % | — | 0.00 | % | ||||||||||||||||||||
Various energy futures contracts (Far East) | — | 0.00 | % | — | 0.00 | % | — | 0.00 | % | — | 0.00 | % | ||||||||||||||||||||
Various energy futures contracts (U.S.) | — | 0.00 | % | — | 0.00 | % | — | 0.00 | % | — | 0.00 | % | ||||||||||||||||||||
Various interest rates futures contracts (Canada) | — | 0.00 | % | — | 0.00 | % | — | 0.00 | % | — | 0.00 | % | ||||||||||||||||||||
Various interest rates futures contracts (Europe) | — | 0.00 | % | — | 0.00 | % | — | 0.00 | % | — | 0.00 | % | ||||||||||||||||||||
Various interest rates futures contracts (Far East) | — | 0.00 | % | — | 0.00 | % | — | 0.00 | % | — | 0.00 | % | ||||||||||||||||||||
Various interest rates futures contracts (Oceanic) | — | 0.00 | % | — | 0.00 | % | — | 0.00 | % | — | 0.00 | % | ||||||||||||||||||||
Various interest rates futures contracts (U.S.) | — | 0.00 | % | — | 0.00 | % | — | 0.00 | % | — | 0.00 | % | ||||||||||||||||||||
Various precious metal futures contracts (U.S.) | — | 0.00 | % | — | 0.00 | % | ||||||||||||||||||||||||||
Various soft futures contracts (Canada) | — | 0.00 | % | — | 0.00 | % | — | 0.00 | % | — | 0.00 | % | ||||||||||||||||||||
Various soft futures contracts (Europe) | — | 0.00 | % | — | 0.00 | % | — | 0.00 | % | — | 0.00 | % | ||||||||||||||||||||
Various soft futures contracts (Far East) | — | 0.00 | % | — | 0.00 | % | ||||||||||||||||||||||||||
Various soft futures contracts (U.S.) | — | 0.00 | % | — | 0.00 | % | — | 0.00 | % | — | 0.00 | % | ||||||||||||||||||||
Various stock index futures contracts (Africa) | — | 0.00 | % | — | 0.00 | % | — | 0.00 | % | — | 0.00 | % | ||||||||||||||||||||
Various stock index futures contracts (Canada) | — | 0.00 | % | — | 0.00 | % | — | 0.00 | % | — | 0.00 | % | ||||||||||||||||||||
Various stock index futures contracts (Europe) | — | 0.00 | % | — | 0.00 | % | — | 0.00 | % | — | 0.00 | % | ||||||||||||||||||||
Various stock index futures contracts (Far East) | — | 0.00 | % | — | 0.00 | % | — | 0.00 | % | — | 0.00 | % | ||||||||||||||||||||
Various stock index futures contracts (U.S.) | — | 0.00 | % | — | 0.00 | % | — | 0.00 | % | — | 0.00 | % | ||||||||||||||||||||
Various currency futures contracts (Far East) | — | 0.00 | % | — | 0.00 | % | ||||||||||||||||||||||||||
Various soft futures contracts (Far East) | — | 0.00 | % | — | 0.00 | % | ||||||||||||||||||||||||||
Various base metals futures contracts (U.S.) | — | 0.00 | % | — | 0.00 | % | ||||||||||||||||||||||||||
Various base metals futures contracts (Europe) | — | 0.00 | % | — | 0.00 | % | ||||||||||||||||||||||||||
Various precious metal futures contracts (U.S.) | — | 0.00 | % | — | 0.00 | % | ||||||||||||||||||||||||||
|
|
|
|
|
|
|
| |||||||||||||||||||||||||
Total Short Futures Contracts | $ | — | 0.00 | % | $ | — | 0.00 | % | $ | — | 0.00 | % | $ | — | 0.00 | % | ||||||||||||||||
|
|
|
|
|
|
|
| |||||||||||||||||||||||||
CURRENCY FORWARDS * | ||||||||||||||||||||||||||||||||
Various currency forward contracts | $ | — | 0.00 | % | $ | — | 0.00 | % | $ | — | 0.00 | % | $ | — | 0.00 | % | ||||||||||||||||
|
|
|
|
|
|
|
| |||||||||||||||||||||||||
Total Currency Forwards | $ | — | 0.00 | % | $ | — | 0.00 | % | $ | — | 0.00 | % | $ | — | 0.00 | % | ||||||||||||||||
|
|
|
|
|
|
|
| |||||||||||||||||||||||||
Total Open Trade Equity (Deficit) | $ | — | 0.00 | % | $ | — | 0.00 | % | $ | — | 0.00 | % | $ | — | 0.00 | % | ||||||||||||||||
|
|
|
|
|
|
|
| |||||||||||||||||||||||||
OPTIONS WRITTEN * | ||||||||||||||||||||||||||||||||
Various base metals futures contracts (Europe) | $ | — | 0.00 | % | $ | — | 0.00 | % | ||||||||||||||||||||||||
Various currency futures contracts (U.S.) | — | 0.00 | % | — | 0.00 | % | $ | — | 0.00 | % | $ | — | 0.00 | % | ||||||||||||||||||
Various energy futures contracts (U.S.) | — | 0.00 | % | — | 0.00 | % | — | 0.00 | % | — | 0.00 | % | ||||||||||||||||||||
Various precious metal futures contracts (U.S.) | — | 0.00 | % | — | 0.00 | % | ||||||||||||||||||||||||||
Various soft futures contracts (U.S.) | — | 0.00 | % | — | 0.00 | % | — | 0.00 | % | — | 0.00 | % | ||||||||||||||||||||
Various stock index futures contracts (U.S.) | — | 0.00 | % | — | 0.00 | % | — | 0.00 | % | — | 0.00 | % | ||||||||||||||||||||
Various base metals futures contracts (Europe) | — | 0.00 | % | — | 0.00 | % | ||||||||||||||||||||||||||
Various precious metal futures contracts (U.S.) | — | 0.00 | % | — | 0.00 | % | ||||||||||||||||||||||||||
|
|
|
|
|
|
|
| |||||||||||||||||||||||||
Total Options Written | $ | — | 0.00 | % | $ | — | 0.00 | % | $ | — | 0.00 | % | $ | — | 0.00 | % | ||||||||||||||||
|
|
|
|
|
|
|
| |||||||||||||||||||||||||
| * | Except for those items disclosed, no individual futures, forwards and option on futures contract position constituted greater than 1 percent of Net Asset Value. Accordingly, the number of contracts and expiration dates are not presented. |
| (1) | Formerly the Winton/Graham Series. |
The accompanying notes are an integral part of these financial statements.
The Series of the Frontier Fund
Condensed Schedules of Investments
December 31, 2012
| Frontier Diversified Series | Frontier Masters Series | Frontier Long/Short Commodity Series | Frontier Diversified Series | Frontier Masters Series | Frontier Long/Short Commodity Series | |||||||||||||||||||||||||||||||||||||||||||
Description | Value | % of Total Capital (Net Asset Value) | Value | % of Total Capital (Net Asset Value) | Value | % of Total Capital (Net Asset Value) | Value | % of Total Capital (Net Asset Value) | Value | % of Total Capital (Net Asset Value) | Value | % of Total Capital (Net Asset Value) | ||||||||||||||||||||||||||||||||||||
LONG FUTURES CONTRACTS * | ||||||||||||||||||||||||||||||||||||||||||||||||
Various base metals futures contracts (U.S.) | $ | — | 0.00 | % | $ | — | 0.00 | % | $ | (22,516 | ) | -0.04 | % | $ | — | 0.00 | % | $ | — | 0.00 | % | $ | (22,516 | ) | -0.04 | % | ||||||||||||||||||||||
Various base metals futures contracts (Europe) | — | 0.00 | % | — | 0.00 | % | 892,015 | 1.45 | % | — | 0.00 | % | — | 0.00 | % | 892,015 | 1.45 | % | ||||||||||||||||||||||||||||||
Various base metals futures contracts (Far East) | — | 0.00 | % | — | 0.00 | % | — | 0.00 | % | — | 0.00 | % | — | 0.00 | % | — | 0.00 | % | ||||||||||||||||||||||||||||||
Various currency futures contracts (U.S.) | — | 0.00 | % | — | 0.00 | % | (29,925 | ) | -0.05 | % | — | 0.00 | % | — | 0.00 | % | (29,925 | ) | -0.05 | % | ||||||||||||||||||||||||||||
Various currency futures contracts (Europe) | — | 0.00 | % | — | 0.00 | % | — | 0.00 | % | — | 0.00 | % | — | 0.00 | % | — | 0.00 | % | ||||||||||||||||||||||||||||||
Various currency futures contracts (Far East) | — | 0.00 | % | — | 0.00 | % | — | 0.00 | % | — | 0.00 | % | — | 0.00 | % | — | 0.00 | % | ||||||||||||||||||||||||||||||
Various energy futures contracts (U.S.) | — | 0.00 | % | — | 0.00 | % | 857,585 | 1.40 | % | — | 0.00 | % | — | 0.00 | % | 857,585 | 1.40 | % | ||||||||||||||||||||||||||||||
Brent Crude Oil Settling 4/1/2013 (Number of Contracts: 497) | — | 0.00 | % | — | 0.00 | % | 1,188,750 | 1.94 | % | — | 0.00 | % | — | 0.00 | % | 1,188,750 | 1.94 | % | ||||||||||||||||||||||||||||||
Brent Crude Oil Settling 9/1/2013 (Number of Contracts: 270) | — | 0.00 | % | — | 0.00 | % | 729,410 | 1.19 | % | — | 0.00 | % | — | 0.00 | % | 729,410 | 1.19 | % | ||||||||||||||||||||||||||||||
Crude Oil Settling 2/1/2013 (Number of Contracts: 566) | — | 0.00 | % | — | 0.00 | % | 1,837,974 | 3.00 | % | — | 0.00 | % | — | 0.00 | % | 1,837,974 | 3.00 | % | ||||||||||||||||||||||||||||||
Crude Oil Settling 2/1/2014 (Number of Contracts: 606) | — | 0.00 | % | — | 0.00 | % | 1,784,120 | 2.91 | % | — | 0.00 | % | — | 0.00 | % | 1,784,120 | 2.91 | % | ||||||||||||||||||||||||||||||
Crude Oil Settling 4/1/2014 (Number of Contracts: 428) | — | 0.00 | % | — | 0.00 | % | 1,628,500 | 2.65 | % | — | 0.00 | % | — | 0.00 | % | 1,628,500 | 2.65 | % | ||||||||||||||||||||||||||||||
Crude Oil Settling 8/1/2014 (Number of Contracts: 219) | — | 0.00 | % | — | 0.00 | % | 630,550 | 1.03 | % | — | 0.00 | % | — | 0.00 | % | 630,550 | 1.03 | % | ||||||||||||||||||||||||||||||
Crude Oil Settling 1/1/2015 (Number of Contracts: 191) | — | 0.00 | % | — | 0.00 | % | 722,766 | 1.18 | % | — | 0.00 | % | — | 0.00 | % | 722,766 | 1.18 | % | ||||||||||||||||||||||||||||||
Various energy futures contracts (Far East) | — | 0.00 | % | — | 0.00 | % | — | 0.00 | % | — | 0.00 | % | — | 0.00 | % | — | 0.00 | % | ||||||||||||||||||||||||||||||
Various interest rates futures contracts (U.S.) | — | 0.00 | % | — | 0.00 | % | 16,663 | 0.03 | % | — | 0.00 | % | — | 0.00 | % | 16,663 | 0.03 | % | ||||||||||||||||||||||||||||||
Various interest rates futures contracts (Canada) | — | 0.00 | % | — | 0.00 | % | (13,842 | ) | -0.02 | % | — | 0.00 | % | — | 0.00 | % | (13,842 | ) | -0.02 | % | ||||||||||||||||||||||||||||
Various interest rates futures contracts (Europe) | — | 0.00 | % | — | 0.00 | % | 37,199 | 0.06 | % | — | 0.00 | % | — | 0.00 | % | 37,199 | 0.06 | % | ||||||||||||||||||||||||||||||
Various interest rates futures contracts (Far East) | — | 0.00 | % | — | 0.00 | % | (3,574 | ) | -0.01 | % | — | 0.00 | % | — | 0.00 | % | (3,574 | ) | -0.01 | % | ||||||||||||||||||||||||||||
Various interest rates futures contracts (Mexico) | — | 0.00 | % | — | 0.00 | % | — | 0.00 | % | — | 0.00 | % | — | 0.00 | % | — | 0.00 | % | ||||||||||||||||||||||||||||||
Various interest rates futures contracts (Oceanic) | — | 0.00 | % | — | 0.00 | % | 20,049 | 0.03 | % | — | 0.00 | % | — | 0.00 | % | 20,049 | 0.03 | % | ||||||||||||||||||||||||||||||
Various precious metals futures contracts (U.S.) | — | 0.00 | % | — | 0.00 | % | (357,780 | ) | -0.58 | % | — | 0.00 | % | — | 0.00 | % | (357,780 | ) | -0.58 | % | ||||||||||||||||||||||||||||
Various precious metals futures contracts (Far East) | — | 0.00 | % | — | 0.00 | % | — | 0.00 | % | — | 0.00 | % | — | 0.00 | % | — | 0.00 | % | ||||||||||||||||||||||||||||||
Various soft futures contracts (Canada) | — | 0.00 | % | — | 0.00 | % | (827 | ) | 0.00 | % | — | 0.00 | % | — | 0.00 | % | (827 | ) | 0.00 | % | ||||||||||||||||||||||||||||
Various soft futures contracts (Europe) | — | 0.00 | % | — | 0.00 | % | 285 | 0.00 | % | — | 0.00 | % | — | 0.00 | % | 285 | 0.00 | % | ||||||||||||||||||||||||||||||
Various soft futures contracts (Far East) | — | 0.00 | % | — | 0.00 | % | — | 0.00 | % | — | 0.00 | % | — | 0.00 | % | — | 0.00 | % | ||||||||||||||||||||||||||||||
Various soft futures contracts (U.S.) | — | 0.00 | % | — | 0.00 | % | (968,793 | ) | -1.58 | % | — | 0.00 | % | — | 0.00 | % | (968,793 | ) | -1.58 | % | ||||||||||||||||||||||||||||
Various stock index futures contracts (U.S.) | — | 0.00 | % | — | 0.00 | % | 2,499 | 0.00 | % | — | 0.00 | % | — | 0.00 | % | 2,499 | 0.00 | % | ||||||||||||||||||||||||||||||
Various stock index futures contracts (Canada) | — | 0.00 | % | — | 0.00 | % | — | 0.00 | % | — | 0.00 | % | — | 0.00 | % | — | 0.00 | % | ||||||||||||||||||||||||||||||
Various stock index futures contracts (Europe) | — | 0.00 | % | — | 0.00 | % | (33,084 | ) | -0.05 | % | — | 0.00 | % | — | 0.00 | % | (33,084 | ) | -0.05 | % | ||||||||||||||||||||||||||||
Various stock index futures contracts (Far East) | — | 0.00 | % | — | 0.00 | % | 83,003 | 0.14 | % | — | 0.00 | % | — | 0.00 | % | 83,003 | 0.14 | % | ||||||||||||||||||||||||||||||
Various stock index futures contracts (Africa) | — | 0.00 | % | — | 0.00 | % | — | 0.00 | % | — | 0.00 | % | — | 0.00 | % | — | 0.00 | % | ||||||||||||||||||||||||||||||
Various stock index futures contracts (Oceanic) | — | 0.00 | % | — | 0.00 | % | 10,863 | 0.02 | % | — | 0.00 | % | — | 0.00 | % | 10,863 | 0.02 | % | ||||||||||||||||||||||||||||||
Various stock index futures contracts (Mexico) | — | 0.00 | % | — | 0.00 | % | — | 0.00 | % | — | 0.00 | % | — | 0.00 | % | — | 0.00 | % | ||||||||||||||||||||||||||||||
|
|
|
|
|
|
|
|
|
|
|
| |||||||||||||||||||||||||||||||||||||
Total Long Futures Contracts | $ | — | 0.00 | % | $ | — | 0.00 | % | $ | 9,011,890 | 14.70 | % | $ | — | 0.00 | % | $ | — | 0.00 | % | $ | 9,011,890 | 14.70 | % | ||||||||||||||||||||||||
|
|
|
|
|
|
|
|
|
|
|
| |||||||||||||||||||||||||||||||||||||
OPTIONS PURCHASED * | ||||||||||||||||||||||||||||||||||||||||||||||||
Various energy futures contracts (U.S.) | $ | — | 0.00 | % | $ | — | 0.00 | % | $ | 1,417,280 | 2.31 | % | $ | — | 0.00 | % | $ | — | 0.00 | % | $ | 1,417,280 | 2.31 | % | ||||||||||||||||||||||||
Various currency futures contracts (U.S.) | — | 0.00 | % | — | 0.00 | % | 517,500 | 0.84 | % | — | 0.00 | % | — | 0.00 | % | 517,500 | 0.84 | % | ||||||||||||||||||||||||||||||
Various interest rates futures contracts (U.S.) | — | 0.00 | % | — | 0.00 | % | — | 0.00 | % | — | 0.00 | % | — | 0.00 | % | — | 0.00 | % | ||||||||||||||||||||||||||||||
Various soft futures contracts (U.S.) | — | 0.00 | % | — | 0.00 | % | 966,540 | 1.58 | % | — | 0.00 | % | — | 0.00 | % | 966,540 | 1.58 | % | ||||||||||||||||||||||||||||||
|
|
|
|
|
|
|
|
|
|
|
| |||||||||||||||||||||||||||||||||||||
Total Options Purchased | $ | — | 0.00 | % | $ | — | 0.00 | % | $ | 2,901,320 | 4.73 | % | $ | — | 0.00 | % | $ | — | 0.00 | % | $ | 2,901,320 | 4.73 | % | ||||||||||||||||||||||||
|
|
|
|
|
|
|
|
|
|
|
| |||||||||||||||||||||||||||||||||||||
SHORT FUTURES CONTRACTS * | ||||||||||||||||||||||||||||||||||||||||||||||||
Various base metals futures contracts (U.S.) | $ | — | 0.00 | % | $ | — | 0.00 | % | $ | 8,300 | 0.01 | % | $ | — | 0.00 | % | $ | — | 0.00 | % | $ | 8,300 | 0.01 | % | ||||||||||||||||||||||||
Various base metals futures contracts (Europe) | — | 0.00 | % | — | 0.00 | % | (1,111,581 | ) | -1.81 | % | — | 0.00 | % | — | 0.00 | % | (1,111,581 | ) | -1.81 | % | ||||||||||||||||||||||||||||
Various base metals futures contracts (Far East) | — | 0.00 | % | — | 0.00 | % | — | 0.00 | % | — | 0.00 | % | — | 0.00 | % | — | 0.00 | % | ||||||||||||||||||||||||||||||
Various currency futures contracts (U.S.) | — | 0.00 | % | — | 0.00 | % | 99,526 | 0.16 | % | — | 0.00 | % | — | 0.00 | % | 99,526 | 0.16 | % | ||||||||||||||||||||||||||||||
Various currency futures contracts (Europe) | — | 0.00 | % | — | 0.00 | % | — | 0.00 | % | — | 0.00 | % | — | 0.00 | % | — | 0.00 | % | ||||||||||||||||||||||||||||||
Various currency futures contracts (Far East) | — | 0.00 | % | — | 0.00 | % | — | 0.00 | % | — | 0.00 | % | — | 0.00 | % | — | 0.00 | % | ||||||||||||||||||||||||||||||
Various energy futures contracts (U.S.) | — | 0.00 | % | — | 0.00 | % | (1,309,564 | ) | -2.13 | % | — | 0.00 | % | — | 0.00 | % | (1,309,564 | ) | -2.13 | % | ||||||||||||||||||||||||||||
Brent Crude Oil, Settling 6/1/2013 (Number of Contracts: 424) | — | 0.00 | % | — | 0.00 | % | (1,182,720 | ) | -1.93 | % | — | 0.00 | % | — | 0.00 | % | (1,182,720 | ) | -1.93 | % | ||||||||||||||||||||||||||||
Crude Oil, Settling 4/1/2013 (Number of Contracts: 323) | — | 0.00 | % | — | 0.00 | % | (923,841 | ) | -1.51 | % | — | 0.00 | % | — | 0.00 | % | (923,841 | ) | -1.51 | % | ||||||||||||||||||||||||||||
Crude Oil, Settling 5/1/2013 (Number of Contracts: 166) | — | 0.00 | % | — | 0.00 | % | (669,526 | ) | -1.09 | % | — | 0.00 | % | — | 0.00 | % | (669,526 | ) | -1.09 | % | ||||||||||||||||||||||||||||
Crude Oil, Settling 6/1/2013 (Number of Contracts: 787) | — | 0.00 | % | — | 0.00 | % | (3,500,831 | ) | -5.71 | % | — | 0.00 | % | — | 0.00 | % | (3,500,831 | ) | -5.71 | % | ||||||||||||||||||||||||||||
Crude Oil, Settling 7/1/2013 (Number of Contracts: 290) | — | 0.00 | % | — | 0.00 | % | (1,400,082 | ) | -2.28 | % | — | 0.00 | % | — | 0.00 | % | (1,400,082 | ) | -2.28 | % | ||||||||||||||||||||||||||||
Crude Oil, Settling 3/1/2014 (Number of Contracts: 450) | — | 0.00 | % | — | 0.00 | % | (1,446,060 | ) | -2.36 | % | — | 0.00 | % | — | 0.00 | % | (1,446,060 | ) | -2.36 | % | ||||||||||||||||||||||||||||
Crude Oil, Settling 6/1/2014 (Number of Contracts: 449) | — | 0.00 | % | — | 0.00 | % | (1,477,983 | ) | -2.41 | % | — | 0.00 | % | — | 0.00 | % | (1,477,983 | ) | -2.41 | % | ||||||||||||||||||||||||||||
Crude Oil, Settling 9/1/2014 (Number of Contracts: 219) | — | 0.00 | % | — | 0.00 | % | (618,510 | ) | -1.01 | % | — | 0.00 | % | — | 0.00 | % | (618,510 | ) | -1.01 | % | ||||||||||||||||||||||||||||
Various energy futures contracts (Far East) | — | 0.00 | % | — | 0.00 | % | — | 0.00 | % | — | 0.00 | % | — | 0.00 | % | — | 0.00 | % | ||||||||||||||||||||||||||||||
Various interest rates futures contracts (US) | —�� | 0.00 | % | — | 0.00 | % | 12,197 | 0.02 | % | — | 0.00 | % | — | 0.00 | % | 12,197 | 0.02 | % | ||||||||||||||||||||||||||||||
Various interest rates futures contracts (Canada) | — | 0.00 | % | — | 0.00 | % | — | 0.00 | % | — | 0.00 | % | — | 0.00 | % | — | 0.00 | % | ||||||||||||||||||||||||||||||
Various interest rates futures contracts (Europe) | — | 0.00 | % | — | 0.00 | % | — | 0.00 | % | — | 0.00 | % | — | 0.00 | % | — | 0.00 | % | ||||||||||||||||||||||||||||||
Various interest rates futures contracts (Far East) | — | 0.00 | % | — | 0.00 | % | 24,219 | 0.04 | % | — | 0.00 | % | — | 0.00 | % | 24,219 | 0.04 | % | ||||||||||||||||||||||||||||||
Various interest rates futures contracts (Oceanic) | — | 0.00 | % | — | 0.00 | % | — | 0.00 | % | — | 0.00 | % | — | 0.00 | % | — | 0.00 | % | ||||||||||||||||||||||||||||||
Various precious metals futures contracts (U.S.) | — | 0.00 | % | — | 0.00 | % | 59,128 | 0.10 | % | — | 0.00 | % | — | 0.00 | % | 59,128 | 0.10 | % | ||||||||||||||||||||||||||||||
Various soft futures contracts (U.S.) | — | 0.00 | % | — | 0.00 | % | 703,810 | 1.15 | % | — | 0.00 | % | — | 0.00 | % | 703,810 | 1.15 | % | ||||||||||||||||||||||||||||||
Various soft futures contracts (Far East) | — | 0.00 | % | — | 0.00 | % | — | 0.00 | % | — | 0.00 | % | — | 0.00 | % | — | 0.00 | % | ||||||||||||||||||||||||||||||
Various soft futures contracts (Europe) | — | 0.00 | % | — | 0.00 | % | 773 | 0.00 | % | — | 0.00 | % | — | 0.00 | % | 773 | 0.00 | % | ||||||||||||||||||||||||||||||
Various stock index futures contracts (U.S.) | — | 0.00 | % | — | 0.00 | % | — | 0.00 | % | — | 0.00 | % | — | 0.00 | % | — | 0.00 | % | ||||||||||||||||||||||||||||||
Various stock index futures contracts (Canada) | — | 0.00 | % | — | 0.00 | % | — | 0.00 | % | — | 0.00 | % | — | 0.00 | % | — | 0.00 | % | ||||||||||||||||||||||||||||||
Various stock index futures contracts (Europe) | — | 0.00 | % | — | 0.00 | % | — | 0.00 | % | — | 0.00 | % | — | 0.00 | % | — | 0.00 | % | ||||||||||||||||||||||||||||||
Various stock index futures contracts (Africa) | — | 0.00 | % | — | 0.00 | % | — | 0.00 | % | — | 0.00 | % | — | 0.00 | % | — | 0.00 | % | ||||||||||||||||||||||||||||||
Various stock index futures contracts (Oceanic) | — | 0.00 | % | — | 0.00 | % | — | 0.00 | % | — | 0.00 | % | — | 0.00 | % | — | 0.00 | % | ||||||||||||||||||||||||||||||
Various stock index futures contracts (Far East) | — | 0.00 | % | — | 0.00 | % | — | 0.00 | % | — | 0.00 | % | — | 0.00 | % | — | 0.00 | % | ||||||||||||||||||||||||||||||
|
|
|
|
|
|
|
|
|
|
|
| |||||||||||||||||||||||||||||||||||||
Total Short Futures Contracts | $ | — | 0.00 | % | $ | — | 0.00 | % | $ | (12,732,745 | ) | -20.76 | % | $ | — | 0.00 | % | $ | — | 0.00 | % | $ | (12,732,745 | ) | -20.76 | % | ||||||||||||||||||||||
|
|
|
|
|
|
|
|
|
|
|
| |||||||||||||||||||||||||||||||||||||
CURRENCY FORWARDS * | $ | — | 0.00 | % | $ | — | 0.00 | % | $ | — | 0.00 | % | $ | — | 0.00 | % | $ | — | 0.00 | % | $ | — | 0.00 | % | ||||||||||||||||||||||||
|
|
|
|
|
|
|
|
|
|
|
| |||||||||||||||||||||||||||||||||||||
Total Open Trade Equity (Deficit) | $ | — | 0.00 | % | $ | — | 0.00 | % | $ | (819,535 | ) | -1.33 | % | $ | — | 0.00 | % | $ | — | 0.00 | % | $ | (819,535 | ) | -1.33 | % | ||||||||||||||||||||||
|
|
|
|
|
|
|
|
|
|
|
| |||||||||||||||||||||||||||||||||||||
OPTIONS WRITTEN * | ||||||||||||||||||||||||||||||||||||||||||||||||
Various interest rates futures contracts (U.S.) | $ | — | 0.00 | % | $ | — | 0.00 | % | $ | — | 0.00 | % | $ | — | 0.00 | % | $ | — | 0.00 | % | $ | — | 0.00 | % | ||||||||||||||||||||||||
Various currency futures contracts (U.S.) | — | 0.00 | % | — | 0.00 | % | (155,250 | ) | -0.25 | % | — | 0.00 | % | — | 0.00 | % | (155,250 | ) | -0.25 | % | ||||||||||||||||||||||||||||
Various energy futures contracts (U.S.) | — | 0.00 | % | — | 0.00 | % | (445,060 | ) | -0.73 | % | — | 0.00 | % | — | 0.00 | % | (445,060 | ) | -0.73 | % | ||||||||||||||||||||||||||||
Various soft futures contracts (U.S.) | — | 0.00 | % | — | 0.00 | % | (328,380 | ) | -0.54 | % | — | 0.00 | % | — | 0.00 | % | (328,380 | ) | -0.54 | % | ||||||||||||||||||||||||||||
|
|
|
|
|
|
|
|
|
|
|
| |||||||||||||||||||||||||||||||||||||
Total Options Written | $ | — | 0.00 | % | $ | — | 0.00 | % | $ | (928,690 | ) | -1.52 | % | $ | — | 0.00 | % | $ | — | 0.00 | % | $ | (928,690 | ) | -1.52 | % | ||||||||||||||||||||||
|
|
|
|
|
|
|
|
|
|
|
| |||||||||||||||||||||||||||||||||||||
U.S. TREASURY SECURITIES | Fair Value | Fair Value | Fair Value | Fair Value | Fair Value | Fair Value | ||||||||||||||||||||||||||||||||||||||||||
US Treasury Note 4.000% due 02/15/2015 (1) | $ | 3,853,000 | 3.35 | % | $ | 2,212,909 | 4.30 | % | $ | 2,388,540 | 3.89 | % | $ | 3,853,000 | 3.35 | % | $ | 2,212,909 | 4.30 | % | $ | 2,388,540 | 3.89 | % | ||||||||||||||||||||||||
|
|
|
|
|
|
|
|
|
|
|
| |||||||||||||||||||||||||||||||||||||
Additional Disclosure on U.S. Treasury Securities | Face Value | Face Value | Face Value | Face Value | Face Value | Face Value | ||||||||||||||||||||||||||||||||||||||||||
U.S. Treasury Note 4.000% due 02/15/2015 (1) | $ | 3,574,465 | $ | 2,052,937 | $ | 2,215,872 | $ | 3,574,465 | $ | 2,052,937 | $ | 2,215,872 | ||||||||||||||||||||||||||||||||||||
|
|
|
|
|
| |||||||||||||||||||||||||||||||||||||||||||
| Cost | Cost | Cost | Cost | Cost | Cost | |||||||||||||||||||||||||||||||||||||||||||
U.S. Treasury Note 4.000% due 02/15/2015 (1) | $ | 3,702,643 | $ | 2,126,554 | $ | 2,295,332 | $ | 3,702,643 | $ | 2,126,554 | $ | 2,295,332 | ||||||||||||||||||||||||||||||||||||
|
|
|
|
|
| |||||||||||||||||||||||||||||||||||||||||||
| * | Except for those items disclosed, no individual futures, forwards and option on futures contract position constituted greater than 1 percent of Net Asset Value. Accordingly, the number of contracts and expiration dates are not presented. |
| (1) | Assets have been allocated to each Series based upon ownership in the cash management pool. See Note 2. |
The accompanying notes are an integral part of these financial statements.
The Series of the Frontier Fund
Condensed Schedules of Investments
December 31, 2012
| Balanced Series | Frontier Select Series (2) | Balanced Series | Frontier Select Series (2) | |||||||||||||||||||||||||||||
Description | Value | % of Total Capital (Net Asset Value) | Value | % of Total Capital (Net Asset Value) | Value | % of Total Capital (Net Asset Value) | Value | % of Total Capital (Net Asset Value) | ||||||||||||||||||||||||
LONG FUTURES CONTRACTS * | ||||||||||||||||||||||||||||||||
Various base metals futures contracts (U.S.) | $ | 7,365 | 0.00 | % | $ | — | 0.00 | % | $ | 7,365 | 0.00 | % | $ | — | 0.00 | % | ||||||||||||||||
Various base metals futures contracts (Europe) | 1,079,576 | 0.44 | % | — | 0.00 | % | 1,079,576 | 0.44 | % | — | 0.00 | % | ||||||||||||||||||||
Various currency futures contracts (U.S.) | (2,013,943 | ) | -0.82 | % | — | 0.00 | % | (2,013,943 | ) | -0.82 | % | — | 0.00 | % | ||||||||||||||||||
Various currency futures contracts (Europe) | — | 0.00 | % | — | 0.00 | % | — | 0.00 | % | — | 0.00 | % | ||||||||||||||||||||
Various currency futures contracts (Far East) | — | 0.00 | % | — | 0.00 | % | — | 0.00 | % | — | 0.00 | % | ||||||||||||||||||||
Various energy futures contracts (U.S.) | 618,362 | 0.25 | % | — | 0.00 | % | 618,362 | 0.25 | % | — | 0.00 | % | ||||||||||||||||||||
Brent Curde Oil Settling 2/1/2013 (Number of Contracts: 735) | 2,850,050 | 1.16 | % | — | 0.00 | % | 2,850,050 | 1.16 | % | — | 0.00 | % | ||||||||||||||||||||
Various interest rates futures contracts (U.S.) | (285,562 | ) | -0.12 | % | — | 0.00 | % | (285,562 | ) | -0.12 | % | — | 0.00 | % | ||||||||||||||||||
Various interest rates futures contracts (Canada) | (62,247 | ) | -0.03 | % | — | 0.00 | % | (62,247 | ) | -0.03 | % | — | 0.00 | % | ||||||||||||||||||
Various interest rates futures contracts (Europe) | 1,247,403 | 0.51 | % | — | 0.00 | % | 1,247,403 | 0.51 | % | — | 0.00 | % | ||||||||||||||||||||
Various interest rates futures contracts (Far East) | (146,326 | ) | -0.06 | % | — | 0.00 | % | (146,326 | ) | -0.06 | % | — | 0.00 | % | ||||||||||||||||||
Various interest rates futures contracts (Oceanic) | 298,712 | 0.12 | % | — | 0.00 | % | 298,712 | 0.12 | % | — | 0.00 | % | ||||||||||||||||||||
Various precious metals futures contracts (U.S.) | 76,885 | 0.03 | % | — | 0.00 | % | 76,885 | 0.03 | % | — | 0.00 | % | ||||||||||||||||||||
Various soft futures contracts (U.S.) | (888,222 | ) | -0.36 | % | — | 0.00 | % | (888,222 | ) | -0.36 | % | — | 0.00 | % | ||||||||||||||||||
Various soft futures contracts (Europe) | (131,803 | ) | -0.05 | % | — | 0.00 | % | (131,803 | ) | -0.05 | % | — | 0.00 | % | ||||||||||||||||||
Various stock index futures contracts (U.S.) | (494,955 | ) | -0.20 | % | — | 0.00 | % | (494,955 | ) | -0.20 | % | — | 0.00 | % | ||||||||||||||||||
Various stock index futures contracts (Canada) | 246,124 | 0.10 | % | — | 0.00 | % | 246,124 | 0.10 | % | — | 0.00 | % | ||||||||||||||||||||
Various stock index futures contracts (Europe) | (1,219,796 | ) | -0.50 | % | — | 0.00 | % | (1,219,796 | ) | -0.50 | % | — | 0.00 | % | ||||||||||||||||||
Various stock index futures contracts (Africa) | 82,200 | 0.03 | % | — | 0.00 | % | 82,200 | 0.03 | % | — | 0.00 | % | ||||||||||||||||||||
Various stock index futures contracts (Oceanic) | 132,147 | 0.05 | % | — | 0.00 | % | 132,147 | 0.05 | % | — | 0.00 | % | ||||||||||||||||||||
Various stock index futures contracts (Far East) | 1,111,191 | 0.45 | % | — | 0.00 | % | 1,111,191 | 0.45 | % | — | 0.00 | % | ||||||||||||||||||||
|
|
|
|
|
|
|
| |||||||||||||||||||||||||
Total Long Futures Contracts | $ | 2,507,161 | 1.00 | % | $ | — | 0.00 | % | $ | 2,507,161 | 1.00 | % | $ | — | 0.00 | % | ||||||||||||||||
|
|
|
|
|
|
|
| |||||||||||||||||||||||||
OPTIONS PURCHASED * | ||||||||||||||||||||||||||||||||
Various base metals futures contracts (Europe) | $ | — | 0.00 | % | $ | — | 0.00 | % | $ | — | 0.00 | % | $ | — | 0.00 | % | ||||||||||||||||
Various base metals futures contracts (U.S.) | — | 0.00 | % | — | 0.00 | % | — | 0.00 | % | — | 0.00 | % | ||||||||||||||||||||
Various currency futures contracts (U.S.) | — | 0.00 | % | — | 0.00 | % | — | 0.00 | % | — | 0.00 | % | ||||||||||||||||||||
Various energy futures contracts (U.S.) | — | 0.00 | % | — | 0.00 | % | — | 0.00 | % | — | 0.00 | % | ||||||||||||||||||||
Various soft futures contracts (U.S.) | — | 0.00 | % | — | 0.00 | % | — | 0.00 | % | — | 0.00 | % | ||||||||||||||||||||
Various stock index futures contracts (U.S.) | 439,170 | 0.18 | % | — | 0.00 | % | 439,170 | 0.18 | % | — | 0.00 | % | ||||||||||||||||||||
|
|
|
|
|
|
|
| |||||||||||||||||||||||||
Total Options Purchased | $ | 439,170 | 0.18 | % | $ | — | 0.00 | % | 439,170 | 0.18 | % | $ | — | 0.00 | % | |||||||||||||||||
|
|
|
|
|
|
|
| |||||||||||||||||||||||||
SHORT FUTURES CONTRACTS * | ||||||||||||||||||||||||||||||||
Various base metals futures contracts (U.S.) | $ | (57,925 | ) | -0.02 | % | $ | — | 0.00 | % | $ | (57,925 | ) | -0.02 | % | $ | — | 0.00 | % | ||||||||||||||
Various base metals futures contracts (Europe) | (3,453,452 | ) | -1.41 | % | — | 0.00 | % | (3,453,452 | ) | -1.41 | % | — | 0.00 | % | ||||||||||||||||||
Various currency futures contracts (US) | 1,732,960 | 0.71 | % | — | 0.00 | % | 1,732,960 | 0.71 | % | — | 0.00 | % | ||||||||||||||||||||
Various currency futures contracts (Europe) | — | 0.00 | % | — | 0.00 | % | — | 0.00 | % | — | 0.00 | % | ||||||||||||||||||||
Various energy futures contracts (U.S.) | (2,108,322 | ) | -0.86 | % | — | 0.00 | % | (2,108,322 | ) | -0.86 | % | — | 0.00 | % | ||||||||||||||||||
Various energy futures contracts (Europe) | — | 0.00 | % | — | 0.00 | % | — | 0.00 | % | — | 0.00 | % | ||||||||||||||||||||
Various interest rates futures contracts (U.S.) | (356,406 | ) | -0.15 | % | — | 0.00 | % | (356,406 | ) | -0.15 | % | — | 0.00 | % | ||||||||||||||||||
Various interest rates futures contracts (Canada) | 79,806 | 0.03 | % | — | 0.00 | % | 79,806 | 0.03 | % | — | 0.00 | % | ||||||||||||||||||||
Various interest rates futures contracts (Europe) | 9,865 | 0.00 | % | — | 0.00 | % | 9,865 | 0.00 | % | — | 0.00 | % | ||||||||||||||||||||
Various interest rates futures contracts (Far East) | 172,781 | 0.07 | % | — | 0.00 | % | 172,781 | 0.07 | % | — | 0.00 | % | ||||||||||||||||||||
Various interest rates futures contracts (Oceanic) | (1,482 | ) | 0.00 | % | — | 0.00 | % | (1,482 | ) | 0.00 | % | — | 0.00 | % | ||||||||||||||||||
Various precious metals futures contracts (U.S.) | 8,095 | 0.00 | % | — | 0.00 | % | 8,095 | 0.00 | % | — | 0.00 | % | ||||||||||||||||||||
Various soft futures contracts (U.S.) | 1,114,717 | 0.46 | % | — | 0.00 | % | 1,114,717 | 0.46 | % | — | 0.00 | % | ||||||||||||||||||||
Various soft futures contracts (Europe) | 124,047 | 0.05 | % | — | 0.00 | % | 124,047 | 0.05 | % | — | 0.00 | % | ||||||||||||||||||||
Various soft futures contracts (Far East) | — | 0.00 | % | — | 0.00 | % | — | 0.00 | % | — | 0.00 | % | ||||||||||||||||||||
Various soft futures contracts (Canada) | — | 0.00 | % | — | 0.00 | % | — | 0.00 | % | — | 0.00 | % | ||||||||||||||||||||
Various stock index futures contracts (U.S.) | (341,725 | ) | -0.14 | % | — | 0.00 | % | (341,725 | ) | -0.14 | % | — | 0.00 | % | ||||||||||||||||||
Various stock index futures contracts (Canada) | — | 0.00 | % | — | 0.00 | % | — | 0.00 | % | — | 0.00 | % | ||||||||||||||||||||
Various stock index futures contracts (Europe) | 86,851 | 0.04 | % | — | 0.00 | % | 86,851 | 0.04 | % | — | 0.00 | % | ||||||||||||||||||||
Various stock index futures contracts (Oceanic) | — | 0.00 | % | — | 0.00 | % | — | 0.00 | % | — | 0.00 | % | ||||||||||||||||||||
Various stock index futures contracts (Far East) | (628,652 | ) | -0.26 | % | — | 0.00 | % | (628,652 | ) | -0.26 | % | — | 0.00 | % | ||||||||||||||||||
|
|
|
|
|
|
|
| |||||||||||||||||||||||||
Total Short Futures Contracts | $ | (3,618,842 | ) | -1.95 | % | $ | — | 0.00 | % | $ | (3,618,842 | ) | -1.95 | % | $ | — | 0.00 | % | ||||||||||||||
|
|
|
|
|
|
|
| |||||||||||||||||||||||||
CURRENCY FORWARDS * | $ | — | 0.00 | % | $ | — | 0.00 | % | $ | — | 0.00 | % | $ | — | 0.00 | % | ||||||||||||||||
|
|
|
|
|
|
|
| |||||||||||||||||||||||||
Total Open Trade Equity (Deficit) | $ | (672,511 | ) | -0.27 | % | $ | — | 0.00 | % | $ | (672,511 | ) | -0.27 | % | $ | — | 0.00 | % | ||||||||||||||
|
|
|
|
|
|
|
| |||||||||||||||||||||||||
OPTIONS WRITTEN * | ||||||||||||||||||||||||||||||||
Various base metals futures contracts (Europe) | $ | — | 0.00 | % | $ | — | 0.00 | % | $ | — | 0.00 | % | $ | — | 0.00 | % | ||||||||||||||||
Various base metals futures contracts (U.S) | — | 0.00 | % | — | 0.00 | % | — | 0.00 | % | — | 0.00 | % | ||||||||||||||||||||
Various currency futures contracts (Europe) | — | 0.00 | % | — | 0.00 | % | — | 0.00 | % | — | 0.00 | % | ||||||||||||||||||||
Various energy futures contracts (U.S.) | — | 0.00 | % | — | 0.00 | % | — | 0.00 | % | — | 0.00 | % | ||||||||||||||||||||
Various soft futures contracts (U.S.) | — | 0.00 | % | — | 0.00 | % | — | 0.00 | % | — | 0.00 | % | ||||||||||||||||||||
Various stock index futures contracts (U.S.) | (165,363 | ) | -0.07 | % | — | 0.00 | % | (165,363 | ) | -0.07 | % | — | 0.00 | % | ||||||||||||||||||
|
|
|
|
|
|
|
| |||||||||||||||||||||||||
Total Options Written | $ | (165,363 | ) | -0.07 | % | $ | — | 0.00 | % | $ | (165,363 | ) | -0.07 | % | $ | — | 0.00 | % | ||||||||||||||
|
|
|
|
|
|
|
| |||||||||||||||||||||||||
Swaps (3) | ||||||||||||||||||||||||||||||||
Frontier Select CTA TRS Deutsche Bank Swap (U.S.) | $ | 4,503,745 | 1.84 | % | $ | — | 0.00 | % | 4,503,745 | 1.84 | % | — | 0.00 | % | ||||||||||||||||||
Frontier Balanced RCW-1 Swap (U.S.) | 17,785,733 | 7.26 | % | — | 0.00 | % | 17,785,733 | 7.26 | % | — | 0.00 | % | ||||||||||||||||||||
|
|
|
|
|
|
|
| |||||||||||||||||||||||||
Total Swaps | $ | 22,289,478 | 9.10 | % | $ | — | 0.00 | % | $ | 22,289,478 | 9.10 | % | $ | — | 0.00 | % | ||||||||||||||||
|
|
|
|
|
|
|
| |||||||||||||||||||||||||
U.S. TREASURY SECURITIES | ||||||||||||||||||||||||||||||||
| Fair Value | Fair Value | Fair Value | Fair Value | |||||||||||||||||||||||||||||
US Treasury Note 4.000% due 02/15/2015 (1) | $ | 5,951,633 | 2.97 | % | $ | 961,568 | 3.79 | % | $ | 5,951,633 | 2.97 | % | $ | 961,568 | 3.79 | % | ||||||||||||||||
|
|
|
|
|
|
|
| |||||||||||||||||||||||||
Additional Disclosure on U.S. Treasury Securities | Face Value | Face Value | Face Value | Face Value | ||||||||||||||||||||||||||||
US Treasury Note 4.000% due 02/15/2015 (1) | $ | 5,521,388 | $ | 892,056 | $ | 5,521,388 | $ | 892,056 | ||||||||||||||||||||||||
|
|
|
| |||||||||||||||||||||||||||||
| Cost | Cost | Cost | Cost | |||||||||||||||||||||||||||||
US Treasury Note 4.000% due 02/15/2015 (1) | $ | 5,719,381 | $ | 924,044 | $ | 5,719,381 | $ | 924,044 | ||||||||||||||||||||||||
|
|
|
| |||||||||||||||||||||||||||||
| * | Except for those items disclosed, no individual futures, forwards and option on futures contract position constituted greater than 1 percent of Net Asset Value. Accordingly, the number of contracts and expiration dates are not presented. |
| (1) | Assets have been allocated to each Series based upon ownership in the cash management pool. See Note 2. |
| (2) | Formerly the Tiverton/Graham/Tiverton Series. |
| (3) | See Note 4 to the Financial Statements. |
The accompanying notes are an integral part of these financial statements.
The Series of the Frontier Fund
Condensed Schedules of Investments
December 31, 2012
| Winton Series | Frontier Heritage Series (2) | Winton Series | Frontier Heritage Series (2) | |||||||||||||||||||||||||||||
Description | Value | % of Total Capital (Net Asset Value) | Value | % of Total Capital (Net Asset Value) | Value | % of Total Capital (Net Asset Value) | Value | % of Total Capital (Net Asset Value) | ||||||||||||||||||||||||
LONG FUTURES CONTRACTS * | ||||||||||||||||||||||||||||||||
Various base metals futures contracts (U.S.) | $ | — | 0.00 | % | $ | — | 0.00 | % | $ | — | 0.00 | % | $ | — | 0.00 | % | ||||||||||||||||
Various base metals futures contracts (Europe) | — | 0.00 | % | — | 0.00 | % | — | 0.00 | % | — | 0.00 | % | ||||||||||||||||||||
Various currency futures contracts (U.S.) | — | 0.00 | % | — | 0.00 | % | — | 0.00 | % | — | 0.00 | % | ||||||||||||||||||||
Various currency futures contracts (Canada) | — | 0.00 | % | — | 0.00 | % | — | 0.00 | % | — | 0.00 | % | ||||||||||||||||||||
Various currency futures contracts (Europe) | — | 0.00 | % | — | 0.00 | % | — | 0.00 | % | — | 0.00 | % | ||||||||||||||||||||
Various currency futures contracts (Far East) | — | 0.00 | % | — | 0.00 | % | — | 0.00 | % | — | 0.00 | % | ||||||||||||||||||||
Various energy futures contracts (U.S.) | — | 0.00 | % | — | 0.00 | % | — | 0.00 | % | — | 0.00 | % | ||||||||||||||||||||
Various energy futures contracts (Europe) | — | 0.00 | % | — | 0.00 | % | — | 0.00 | % | — | 0.00 | % | ||||||||||||||||||||
Various interest rates futures contracts (U.S.) | — | 0.00 | % | — | 0.00 | % | — | 0.00 | % | — | 0.00 | % | ||||||||||||||||||||
Various interest rates futures contracts (Canada) | — | 0.00 | % | — | 0.00 | % | — | 0.00 | % | — | 0.00 | % | ||||||||||||||||||||
Various interest rates futures contracts (Europe) | — | 0.00 | % | — | 0.00 | % | — | 0.00 | % | — | 0.00 | % | ||||||||||||||||||||
Various interest rates futures contracts (Far East) | — | 0.00 | % | — | 0.00 | % | — | 0.00 | % | — | 0.00 | % | ||||||||||||||||||||
Various precious metals futures contracts (U.S.) | — | 0.00 | % | — | 0.00 | % | — | 0.00 | % | — | 0.00 | % | ||||||||||||||||||||
Various precious metals futures contracts (Europe) | — | 0.00 | % | — | 0.00 | % | — | 0.00 | % | — | 0.00 | % | ||||||||||||||||||||
Various soft futures contracts (U.S.) | — | 0.00 | % | — | 0.00 | % | — | 0.00 | % | — | 0.00 | % | ||||||||||||||||||||
Various soft futures contracts (Europe) | — | 0.00 | % | — | 0.00 | % | — | 0.00 | % | — | 0.00 | % | ||||||||||||||||||||
Various soft futures contracts (Canada) | — | 0.00 | % | — | 0.00 | % | — | 0.00 | % | — | 0.00 | % | ||||||||||||||||||||
Various stock index futures contracts (U.S.) | — | 0.00 | % | — | 0.00 | % | — | 0.00 | % | — | 0.00 | % | ||||||||||||||||||||
Various stock index futures contracts (Canada) | — | 0.00 | % | — | 0.00 | % | — | 0.00 | % | — | 0.00 | % | ||||||||||||||||||||
Various stock index futures contracts (Europe) | — | 0.00 | % | — | 0.00 | % | — | 0.00 | % | — | 0.00 | % | ||||||||||||||||||||
Various stock index futures contracts (Far East) | — | 0.00 | % | — | 0.00 | % | — | 0.00 | % | — | 0.00 | % | ||||||||||||||||||||
|
|
|
|
|
|
|
| |||||||||||||||||||||||||
Total Long Futures Contracts | $ | — | 0.00 | % | $ | — | 0.00 | % | $ | — | 0.00 | % | $ | — | 0.00 | % | ||||||||||||||||
|
|
|
|
|
|
|
| |||||||||||||||||||||||||
Various base metals futures contracts (Europe) | $ | — | 0.00 | % | $ | — | 0.00 | % | $ | — | 0.00 | % | $ | — | 0.00 | % | ||||||||||||||||
Various currency futures contracts (U.S.) | — | 0.00 | % | — | 0.00 | % | — | 0.00 | % | — | 0.00 | % | ||||||||||||||||||||
Various currency futures contracts (Canada) | — | 0.00 | % | — | 0.00 | % | — | 0.00 | % | — | 0.00 | % | ||||||||||||||||||||
Various base metals futures contracts (US) | — | 0.00 | % | — | 0.00 | % | — | 0.00 | % | — | 0.00 | % | ||||||||||||||||||||
Various base metals futures contracts (Europe) | — | 0.00 | % | — | 0.00 | % | — | 0.00 | % | — | 0.00 | % | ||||||||||||||||||||
Various currency futures contracts (US) | — | 0.00 | % | — | 0.00 | % | — | 0.00 | % | — | 0.00 | % | ||||||||||||||||||||
Various currency futures contracts (Canada) | — | 0.00 | % | — | 0.00 | % | — | 0.00 | % | — | 0.00 | % | ||||||||||||||||||||
Various currency futures contracts (Europe) | — | 0.00 | % | — | 0.00 | % | — | 0.00 | % | — | 0.00 | % | ||||||||||||||||||||
Various currency futures contracts (Far East) | — | 0.00 | % | — | 0.00 | % | — | 0.00 | % | — | 0.00 | % | ||||||||||||||||||||
Various energy futures contracts (US) | — | 0.00 | % | — | 0.00 | % | — | 0.00 | % | — | 0.00 | % | ||||||||||||||||||||
Various energy futures contracts (Europe) | — | 0.00 | % | — | 0.00 | % | — | 0.00 | % | — | 0.00 | % | ||||||||||||||||||||
Various interest rates futures contracts (US) | — | 0.00 | % | — | 0.00 | % | — | 0.00 | % | — | 0.00 | % | ||||||||||||||||||||
Various interest rates futures contracts (Canada) | — | 0.00 | % | — | 0.00 | % | — | 0.00 | % | — | 0.00 | % | ||||||||||||||||||||
Various interest rates futures contracts (Europe) | — | 0.00 | % | — | 0.00 | % | — | 0.00 | % | — | 0.00 | % | ||||||||||||||||||||
Various interest rates futures contracts (Far East) | — | 0.00 | % | — | 0.00 | % | — | 0.00 | % | — | 0.00 | % | ||||||||||||||||||||
Various precious metals futures contracts (US) | — | 0.00 | % | — | 0.00 | % | — | 0.00 | % | — | 0.00 | % | ||||||||||||||||||||
Various soft futures contracts (US) | — | 0.00 | % | — | 0.00 | % | — | 0.00 | % | — | 0.00 | % | ||||||||||||||||||||
Various soft futures contracts (Canada) | — | 0.00 | % | — | 0.00 | % | — | 0.00 | % | — | 0.00 | % | ||||||||||||||||||||
Various soft futures contracts (Europe) | — | 0.00 | % | — | 0.00 | % | — | 0.00 | % | — | 0.00 | % | ||||||||||||||||||||
Various stock index futures contracts (US) | — | 0.00 | % | — | 0.00 | % | — | 0.00 | % | — | 0.00 | % | ||||||||||||||||||||
Various stock index futures contracts (Canada) | — | 0.00 | % | — | 0.00 | % | — | 0.00 | % | — | 0.00 | % | ||||||||||||||||||||
Various stock index futures contracts (Europe) | — | 0.00 | % | — | 0.00 | % | — | 0.00 | % | — | 0.00 | % | ||||||||||||||||||||
Various stock index futures contracts (Far East) | — | 0.00 | % | — | 0.00 | % | — | 0.00 | % | — | 0.00 | % | ||||||||||||||||||||
|
|
|
|
|
|
|
| |||||||||||||||||||||||||
Total Short Futures Contracts | $ | — | 0.00 | % | $ | — | 0.00 | % | $ | — | 0.00 | % | $ | — | 0.00 | % | ||||||||||||||||
|
|
|
|
|
|
|
| |||||||||||||||||||||||||
CURRENCY FORWARDS * | $ | — | 0.00 | % | $ | — | 0.00 | % | $ | — | 0.00 | % | $ | — | 0.00 | % | ||||||||||||||||
|
|
|
|
|
|
|
| |||||||||||||||||||||||||
Total Open Trade Equity | $ | — | 0.00 | % | $ | — | 0.00 | % | $ | — | 0.00 | % | $ | — | 0.00 | % | ||||||||||||||||
|
|
|
|
|
|
|
| |||||||||||||||||||||||||
U.S. TREASURY SECURITIES | ||||||||||||||||||||||||||||||||
| Fair Value | Fair Value | Fair Value | Fair Value | |||||||||||||||||||||||||||||
US Treasury Note 4.000% due 02/15/2015 (1) | $ | 1,808,547 | 4.42 | % | $ | 776,073 | 3.74 | % | $ | 1,808,547 | 4.42 | % | $ | 776,073 | 3.74 | % | ||||||||||||||||
|
|
|
|
|
|
|
| |||||||||||||||||||||||||
Additional Disclosure on U.S. Treasury Securities | Face Value | Face Value | Face Value | Face Value | ||||||||||||||||||||||||||||
US Treasury Note 4.000% due 02/15/2015 (1) | $ | 1,677,806 | $ | 719,971 | $ | 1,677,806 | $ | 719,971 | ||||||||||||||||||||||||
|
|
|
| |||||||||||||||||||||||||||||
| Cost | Cost | Cost | Cost | |||||||||||||||||||||||||||||
US Treasury Note 4.000% due 02/15/2015 (1) | $ | 1,737,971 | $ | 745,788 | $ | 1,737,971 | $ | 745,788 | ||||||||||||||||||||||||
|
|
|
| |||||||||||||||||||||||||||||
| * | Except for those items disclosed, no individual futures, forwards and option on futures contract position constituted greater than 1 percent of Net Asset Value. Accordingly, the number of contracts and expiration dates are not presented. |
| (1) | Assets have been allocated to each Series based upon ownership in the cash management pool. See Note 2. |
| (2) | Formerly the Winton/Graham Series. |
The accompanying notes are an integral part of these financial statements.
The Series of the Frontier Fund
For the Three Months Ended JuneSeptember 30, 2013 and 2012
| Frontier Diversified Series | Frontier Masters Series | Frontier Long/Short Commodity Series | Frontier Diversified Series | Frontier Masters Series | Frontier Long/Short Commodity Series | |||||||||||||||||||||||||||||||||||||||||||
| (Unaudited) | (Unaudited) | (Unaudited) | (Unaudited) | (Unaudited) | (Unaudited) | |||||||||||||||||||||||||||||||||||||||||||
| 6/30/2013 | 6/30/2012 | 6/30/2013 | 6/30/2012 | 6/30/2013 | 6/30/2012 | 9/30/2013 | 9/30/2012 | 9/30/2013 | 9/30/2012 | 9/30/2013 | 9/30/2012 | |||||||||||||||||||||||||||||||||||||
Investment income: | ||||||||||||||||||||||||||||||||||||||||||||||||
Interest - net | $ | 462,159 | $ | 545,961 | $ | 224,184 | $ | 261,367 | $ | 288,183 | $ | 348,055 | $ | 399,992 | $ | 524,861 | $ | 192,004 | $ | 251,275 | $ | 249,355 | $ | 336,190 | ||||||||||||||||||||||||
|
|
|
|
|
|
|
|
|
|
|
| |||||||||||||||||||||||||||||||||||||
Total Income | 462,159 | 545,961 | 224,184 | 261,367 | 288,183 | 348,055 | 399,992 | 524,861 | 192,004 | 251,275 | 249,355 | 336,190 | ||||||||||||||||||||||||||||||||||||
|
|
|
|
|
|
|
|
|
|
|
| |||||||||||||||||||||||||||||||||||||
Expenses: | ||||||||||||||||||||||||||||||||||||||||||||||||
Incentive Fees | — | 1,616,858 | — | 84,508 | — | 397,085 | — | 1,456,640 | — | 403,573 | — | 585,049 | ||||||||||||||||||||||||||||||||||||
Management Fees | 387,812 | 485,272 | 330,187 | 352,534 | 590,929 | 866,092 | 333,759 | 443,895 | 315,200 | 364,814 | 518,079 | 868,971 | ||||||||||||||||||||||||||||||||||||
Service Fees - Class 1 | 290,900 | 372,751 | 176,471 | 189,579 | 88,071 | 115,189 | 225,937 | 366,831 | 156,560 | 207,528 | 71,049 | 112,879 | ||||||||||||||||||||||||||||||||||||
Trading Fees | 614,290 | 749,188 | 288,777 | 319,341 | 190,367 | 257,297 | 475,785 | 735,492 | 252,770 | 342,724 | 146,883 | 266,738 | ||||||||||||||||||||||||||||||||||||
|
|
|
|
|
|
|
|
|
|
|
| |||||||||||||||||||||||||||||||||||||
Total Expenses | 1,293,002 | 3,224,069 | 795,435 | 945,962 | 869,367 | 1,635,663 | 1,035,481 | 3,002,858 | 724,530 | 1,318,639 | 736,011 | 1,833,637 | ||||||||||||||||||||||||||||||||||||
|
|
|
|
|
|
|
|
|
|
|
| |||||||||||||||||||||||||||||||||||||
Investment income/(loss) - net | (830,843 | ) | (2,678,108 | ) | (571,251 | ) | (684,595 | ) | (581,184 | ) | (1,287,608 | ) | ||||||||||||||||||||||||||||||||||||
Investment (loss) - net | (635,489 | ) | (2,477,997 | ) | (532,526 | ) | (1,067,364 | ) | (486,656 | ) | (1,497,447 | ) | ||||||||||||||||||||||||||||||||||||
|
|
|
|
|
|
|
|
|
|
|
| |||||||||||||||||||||||||||||||||||||
Realized and unrealized gain/(loss) on investments: | ||||||||||||||||||||||||||||||||||||||||||||||||
Net realized gain/(loss) on futures, forwards and options | (141,927 | ) | — | — | 2,146,959 | 1,784,593 | 35,577,284 | — | — | — | 626,741 | (6,125,553 | ) | (37,284,952 | ) | |||||||||||||||||||||||||||||||||
Net change in open trade equity/(deficit) | 141,927 | — | — | (522,901 | ) | (4,849,262 | ) | (35,876,321 | ) | — | — | — | (158,295 | ) | 3,443,127 | 39,443,564 | ||||||||||||||||||||||||||||||||
Net unrealized gain/(loss) on swap contracts | (986,342 | ) | — | (60,503 | ) | |||||||||||||||||||||||||||||||||||||||||||
Net realized gain/(loss) on U.S. Treasury securities | — | 101,433 | — | 49,269 | — | 63,612 | — | — | — | — | — | — | ||||||||||||||||||||||||||||||||||||
Net unrealized gain/(loss) on U.S. Treasury securities | — | (133,952 | ) | — | (65,064 | ) | — | (84,007 | ) | — | (35,655 | ) | — | (17,319 | ) | — | (22,359 | ) | ||||||||||||||||||||||||||||||
Trading commissions | (1,091 | ) | — | — | (41,493 | ) | (410,672 | ) | (475,122 | ) | — | — | — | (47,113 | ) | (309,658 | ) | (503,103 | ) | |||||||||||||||||||||||||||||
Change in fair value of investments in unconsolidated trading companies | (7,088,208 | ) | 6,132,808 | (2,575,152 | ) | 303,890 | (128,404 | ) | (143,488 | ) | (5,709,980 | ) | 3,123,724 | (2,509,310 | ) | 2,394,445 | (350,898 | ) | (647,557 | ) | ||||||||||||||||||||||||||||
|
|
|
|
|
|
|
|
|
|
|
| |||||||||||||||||||||||||||||||||||||
Net gain/(loss) on investments | (7,089,299 | ) | 6,100,289 | (2,575,152 | ) | 1,870,660 | (3,603,745 | ) | (938,042 | ) | (6,696,322 | ) | 3,088,069 | (2,509,310 | ) | 2,798,459 | (3,403,485 | ) | 985,593 | |||||||||||||||||||||||||||||
|
|
|
|
|
|
|
|
|
|
|
| |||||||||||||||||||||||||||||||||||||
NET INCREASE/(DECREASE) IN CAPITAL RESULTING FROM OPERATIONS | (7,920,142 | ) | 3,422,181 | (3,146,403 | ) | 1,186,065 | (4,184,929 | ) | (2,225,650 | ) | (7,331,811 | ) | 610,072 | (3,041,836 | ) | 1,731,095 | (3,890,141 | ) | (511,854 | ) | ||||||||||||||||||||||||||||
|
|
|
|
|
|
|
|
|
|
|
| |||||||||||||||||||||||||||||||||||||
Less: Operations attributable to non-controlling interests | — | — | — | 556,867 | (855,727 | ) | 702,246 | — | — | — | 148,709 | (1,606,510 | ) | (5,316,448 | ) | |||||||||||||||||||||||||||||||||
|
|
|
|
|
|
|
|
|
|
|
| |||||||||||||||||||||||||||||||||||||
NET INCREASE/(DECREASE) IN CAPITAL RESULTING FROM OPERATIONS ATTRIBUTABLE TO CONTROLLING INTERESTS | $ | (7,920,142 | ) | $ | 3,422,181 | $ | (3,146,403 | ) | $ | 629,198 | $ | (3,329,202 | ) | $ | (2,927,896 | ) | $ | (7,331,811 | ) | $ | 610,072 | $ | (3,041,836 | ) | $ | 1,582,386 | $ | (2,283,631 | ) | $ | 4,804,594 | |||||||||||||||||
|
|
|
|
|
|
|
|
|
|
|
| |||||||||||||||||||||||||||||||||||||
NET INCREASE/(DECREASE) IN CAPITAL RESULTING FROM OPERATIONS ATTRIBUTABLE TO CONTROLLING INTERESTS PER UNIT | ||||||||||||||||||||||||||||||||||||||||||||||||
Class 1 | $ | (7.66 | ) | $ | 2.37 | $ | (6.90 | ) | $ | 1.09 | N/A | $ | (6.14 | )(1) | $ | (7.42 | ) | $ | 0.22 | $ | (6.87 | ) | $ | 2.88 | N/A | $ | 7.34 | |||||||||||||||||||||
Class 1a | N/A | N/A | N/A | N/A | $ | (8.07 | ) | $ | (5.29 | ) | N/A | N/A | N/A | N/A | $ | (6.30 | ) | $ | 8.16 | |||||||||||||||||||||||||||||
Class 2 | $ | (7.79 | ) | $ | 2.95 | $ | (6.89 | ) | $ | 1.63 | $ | (10.65 | ) | $ | (6.68 | ) | $ | (7.59 | ) | $ | 0.67 | $ | (6.96 | ) | $ | 3.52 | $ | (8.37 | ) | $ | 11.08 | |||||||||||||||||
Class 2a | N/A | N/A | N/A | N/A | $ | (8.15 | ) | $ | (5.03 | ) | N/A | N/A | N/A | N/A | $ | (6.30 | ) | $ | 9.10 | |||||||||||||||||||||||||||||
Class 3 | N/A | N/A | N/A | N/A | $ | (10.65 | ) | $ | (6.69 | ) | N/A | N/A | N/A | N/A | $ | (8.37 | ) | $ | 11.15 | |||||||||||||||||||||||||||||
Class 3a | N/A | N/A | N/A | N/A | $ | (2.45 | )(2) | N/A | N/A | N/A | N/A | N/A | $ | (6.24 | )(1) | N/A | ||||||||||||||||||||||||||||||||
| (1) |
| Class 3a operations began June 17, 2013. |
The accompanying notes are an integral part of these financial statements.
The Series of the Frontier Fund
Statements of Operations
For the Three Months Ended JuneSeptember 30, 2013 and 2012
| Balanced Series | Frontier Select Series (1) | Balanced Series | Frontier Select Series (1) | |||||||||||||||||||||||||||||
| (Unaudited) | (Unaudited) | (Unaudited) | (Unaudited) | |||||||||||||||||||||||||||||
| 6/30/2013 | 6/30/2012 | 6/30/2013 | 6/30/2012 | 9/30/2013 | 9/30/2012 | 9/30/2013 | 9/30/2012 | |||||||||||||||||||||||||
Investment income: | ||||||||||||||||||||||||||||||||
Interest - net | $ | 75,270 | $ | 35,188 | $ | 87,463 | $ | 65,518 | $ | 123,819 | $ | 22,120 | $ | 68,662 | $ | 75,086 | ||||||||||||||||
|
|
|
|
|
|
|
| |||||||||||||||||||||||||
Total Income/(loss) | 75,270 | 35,188 | 87,463 | 65,518 | 123,819 | 22,120 | 68,662 | 75,086 | ||||||||||||||||||||||||
|
|
|
|
|
|
|
| |||||||||||||||||||||||||
Expenses: | ||||||||||||||||||||||||||||||||
Incentive Fees | 397,624 | 3,107,181 | — | 58,853 | — | 3,268,561 | — | 7,136 | ||||||||||||||||||||||||
Management Fees | 421,392 | 650,186 | 138,094 | 357,444 | 334,849 | 601,212 | 140,444 | 326,209 | ||||||||||||||||||||||||
Service Fees - Class 1 | 924,919 | 1,264,776 | 152,793 | 218,705 | 741,647 | 1,240,331 | 141,965 | 213,767 | ||||||||||||||||||||||||
Trading Fees | 327,556 | 452,743 | 43,541 | 61,958 | 261,429 | 443,728 | 40,356 | 60,869 | ||||||||||||||||||||||||
|
|
|
|
|
|
|
| |||||||||||||||||||||||||
Total Expenses | 2,071,491 | 5,474,886 | 334,428 | 696,960 | 1,337,925 | 5,553,832 | 322,765 | 607,981 | ||||||||||||||||||||||||
|
|
|
|
|
|
|
| |||||||||||||||||||||||||
Investment (loss) - net | (1,996,221 | ) | (5,439,698 | ) | (246,965 | ) | (631,442 | ) | (1,214,106 | ) | (5,531,712 | ) | (254,103 | ) | (532,895 | ) | ||||||||||||||||
|
|
|
|
|
|
|
| |||||||||||||||||||||||||
Realized and unrealized gain/(loss) on investments: | ||||||||||||||||||||||||||||||||
Net realized gain/(loss) on futures, forwards and options | 4,835,504 | 17,730,726 | — | — | 1,183,617 | 19,443,157 | — | — | ||||||||||||||||||||||||
Net change in open trade equity/(deficit) | (879,019 | ) | 4,894,639 | — | — | (1,457,328 | ) | (2,873,395 | ) | — | — | |||||||||||||||||||||
Net realized gain/(loss) on swap contracts | (1,908,743 | ) | — | — | — | (1,645,980 | ) | — | — | — | ||||||||||||||||||||||
Net unrealized gain/(loss) on swap contracts | 1,230,360 | 682,682 | — | — | (998,324 | ) | 259,527 | — | — | |||||||||||||||||||||||
Net realized gain/(loss) on U.S. Treasury securities | — | 165,998 | — | 33,684 | — | — | — | — | ||||||||||||||||||||||||
Net unrealized gain/(loss) on U.S. Treasury securities | — | (219,217 | ) | — | (44,566 | ) | — | (58,350 | ) | — | (12,605 | ) | ||||||||||||||||||||
Trading commissions | (477,420 | ) | (1,468,701 | ) | — | — | (214,905 | ) | (1,250,434 | ) | — | — | ||||||||||||||||||||
Change in fair value of investments in unconsolidated trading companies | (11,743,384 | ) | (1,698,555 | ) | 31,845 | (637,185 | ) | (6,903,390 | ) | (2,928,309 | ) | (1,021,631 | ) | 323,029 | ||||||||||||||||||
|
|
|
|
|
|
|
| |||||||||||||||||||||||||
Net gain/(loss) on investments | (8,942,702 | ) | 20,087,572 | 31,845 | (648,067 | ) | (10,036,310 | ) | 12,592,196 | (1,021,631 | ) | 310,424 | ||||||||||||||||||||
|
|
|
|
|
|
|
| |||||||||||||||||||||||||
NET INCREASE/(DECREASE) IN CAPITAL RESULTING FROM OPERATIONS | (10,938,923 | ) | 14,647,874 | (215,120 | ) | (1,279,509 | ) | (11,250,416 | ) | 7,060,484 | (1,275,734 | ) | (222,471 | ) | ||||||||||||||||||
|
|
|
|
|
|
|
| |||||||||||||||||||||||||
Less: Operations attributable to non-controlling interests | 2,191,011 | 7,272,062 | — | — | (1,528,637 | ) | 6,167,281 | — | — | |||||||||||||||||||||||
|
|
|
|
|
|
|
| |||||||||||||||||||||||||
NET INCREASE/(DECREASE) IN CAPITAL RESULTING FROM OPERATIONS ATTRIBUTABLE TO CONTROLLING INTERESTS | $ | (13,129,934 | ) | $ | 7,375,812 | $ | (215,120 | ) | $ | (1,279,509 | ) | $ | (9,721,779 | ) | $ | 893,203 | $ | (1,275,734 | ) | $ | (222,471 | ) | ||||||||||
|
|
|
|
|
|
|
| |||||||||||||||||||||||||
NET INCREASE/(DECREASE) IN CAPITAL RESULTING FROM OPERATIONS ATTRIBUTABLE TO CONTROLLING INTERESTS PER UNIT | ||||||||||||||||||||||||||||||||
Class 1 | $ | (9.31 | ) | $ | 3.53 | $ | (0.85 | ) | $ | (3.34 | ) | $ | (7.17 | ) | $ | 0.14 | $ | (4.99 | ) | $ | (0.99 | ) | ||||||||||
Class 1a | N/A | (2) | $ | 4.26 | N/A | N/A | N/A | (2) | $ | 4.45 | N/A | N/A | ||||||||||||||||||||
Class 2 | $ | (11.01 | ) | $ | 5.57 | $ | (0.31 | ) | $ | (3.88 | ) | $ | (8.34 | ) | $ | 1.29 | $ | (5.65 | ) | $ | 0.08 | |||||||||||
Class 2a | $ | (8.77 | ) | $ | 5.15 | N/A | N/A | $ | (6.58 | ) | $ | 1.16 | N/A | N/A | ||||||||||||||||||
Class 3a | $ | (8.74 | )(2) | $ | 4.69 | N/A | N/A | $ | (6.56 | )(2) | $ | 1.18 | N/A | N/A | ||||||||||||||||||
| (1) | Formerly known as the Tiverton/Graham/Transtrend Series. |
| (2) | Class 1a operations ceased July 17, 2012 and all remaining Class 1a Units were exchanged for Class 3a Units. |
The accompanying notes are an integral part of these financial statements.
The Series of the Frontier Fund
Statements of Operations
For the Three Months Ended June 30,September, 2013 and 2012
| Winton Series | Frontier Heritage Series (1) | Winton Series | Frontier Heritage Series (1) | |||||||||||||||||||||||||||||
| (Unaudited) | (Unaudited) | (Unaudited) | (Unaudited) | |||||||||||||||||||||||||||||
| 6/30/2013 | 6/30/2012 | 6/30/2013 | 6/30/2012 | 9/30/2013 | 9/30/2012 | 9/30/2013 | 9/30/2012 | |||||||||||||||||||||||||
Investment income: | ||||||||||||||||||||||||||||||||
Interest - net | $ | 94,585 | $ | 132,557 | $ | 35,758 | $ | 32,021 | $ | 66,992 | $ | 127,814 | $ | 29,602 | $ | 31,821 | ||||||||||||||||
|
|
|
|
|
|
|
| |||||||||||||||||||||||||
Total Income | 94,585 | 132,557 | 35,758 | 32,021 | 66,992 | 127,814 | 29,602 | 31,821 | ||||||||||||||||||||||||
|
|
|
|
|
|
|
| |||||||||||||||||||||||||
Expenses: | ||||||||||||||||||||||||||||||||
Management Fees | 268,121 | 259,761 | 75,144 | 290,031 | 264,894 | 259,965 | 74,121 | 225,076 | ||||||||||||||||||||||||
Service Fees - Class 1 | 226,897 | 266,262 | 116,307 | 159,136 | 211,612 | 257,849 | 101,377 | 153,063 | ||||||||||||||||||||||||
Trading Fees | 76,915 | 87,171 | 36,145 | 48,908 | 72,271 | 84,533 | 31,828 | 47,300 | ||||||||||||||||||||||||
|
|
|
|
|
|
|
| |||||||||||||||||||||||||
Total Expenses | 571,933 | 613,194 | 227,596 | 498,075 | 548,777 | 602,347 | 207,326 | 425,439 | ||||||||||||||||||||||||
|
|
|
|
|
|
|
| |||||||||||||||||||||||||
Investment (loss) - net | (477,348 | ) | (480,637 | ) | (191,838 | ) | (466,054 | ) | (481,785 | ) | (474,533 | ) | (177,724 | ) | (393,618 | ) | ||||||||||||||||
|
|
|
|
|
|
|
| |||||||||||||||||||||||||
Realized and unrealized gain/(loss) on investments: | ||||||||||||||||||||||||||||||||
Net realized gain/(loss) on U.S. Treasury securities | — | 52,823 | — | 23,284 | — | — | — | — | ||||||||||||||||||||||||
Net unrealized gain/(loss) on U.S. Treasury securities | — | (69,758 | ) | — | (30,749 | ) | — | (18,568 | ) | — | (8,184 | ) | ||||||||||||||||||||
Change in fair value of investments in unconsolidated trading companies | (529,952 | ) | (1,582,723 | ) | (414,134 | ) | (1,638,888 | ) | (380,598 | ) | 602,511 | (249,447 | ) | 1,185,902 | ||||||||||||||||||
|
|
|
|
|
|
|
| |||||||||||||||||||||||||
Net gain/(loss) on investments | (529,952 | ) | (1,599,658 | ) | (414,134 | ) | (1,646,353 | ) | (380,598 | ) | 583,943 | (249,447 | ) | 1,177,718 | ||||||||||||||||||
|
|
|
|
|
|
|
| |||||||||||||||||||||||||
NET INCREASE/(DECREASE) IN CAPITAL RESULTING FROM OPERATIONS | (1,007,300 | ) | (2,080,295 | ) | (605,972 | ) | (2,112,407 | ) | (862,383 | ) | 109,410 | (427,171 | ) | 784,100 | ||||||||||||||||||
|
|
|
|
|
|
|
| |||||||||||||||||||||||||
Less: Operations attributable to non-controlling interests | — | — | — | — | — | — | — | — | ||||||||||||||||||||||||
|
|
|
|
|
|
|
| |||||||||||||||||||||||||
NET INCREASE/(DECREASE) IN CAPITAL RESULTING FROM OPERATIONS ATTRIBUTABLE TO CONTROLLING INTERESTS | $ | (1,007,300 | ) | $ | (2,080,295 | ) | $ | (605,972 | ) | $ | (2,112,407 | ) | $ | (862,383 | ) | $ | 109,410 | $ | (427,171 | ) | $ | 784,100 | ||||||||||
|
|
|
|
|
|
|
| |||||||||||||||||||||||||
NET INCREASE/(DECREASE) IN CAPITAL RESULTING FROM OPERATIONS ATTRIBUTABLE TO CONTROLLING INTERESTS PER UNIT | ||||||||||||||||||||||||||||||||
Class 1 | $ | (3.72 | ) | $ | (6.28 | ) | $ | (3.55 | ) | $ | (8.32 | ) | $ | (3.19 | ) | $ | 0.01 | $ | (2.53 | ) | $ | 2.75 | ||||||||||
Class 2 | $ | (3.33 | ) | $ | (6.23 | ) | $ | (3.61 | ) | $ | (9.45 | ) | $ | (2.68 | ) | $ | 1.16 | $ | (2.32 | ) | $ | 4.35 | ||||||||||
| (1) | Formerly known as the Winton/Graham Series |
The accompanying notes are an integral part of these financial statements.
The Series of the Frontier Fund
Statements of Operations
For the SixNine Months Ended JuneSeptember 30, 2013 and 2012
| Frontier Diversified Series | Frontier Masters Series | Frontier Long/Short Commodity Series | Frontier Diversified Series | Frontier Masters Series | Frontier Long/Short Commodity Series | |||||||||||||||||||||||||||||||||||||||||||
| (Unaudited) | (Unaudited) | (Unaudited) | (Unaudited) | (Unaudited) | (Unaudited) | |||||||||||||||||||||||||||||||||||||||||||
| 6/30/2013 | 6/30/2012 | 6/30/2013 | 6/30/2012 | 6/30/2013 | 6/30/2012 | 9/30/2013 | 9/30/2012 | 9/30/2013 | 9/30/2012 | 9/30/2013 | 9/30/2012 | |||||||||||||||||||||||||||||||||||||
Investment income: | ||||||||||||||||||||||||||||||||||||||||||||||||
Interest - net | $ | 938,684 | $ | 1,143,240 | $ | 455,372 | $ | 529,226 | $ | 585,282 | $ | 711,631 | $ | 1,338,676 | $ | 1,668,101 | $ | 647,376 | $ | 780,501 | $ | 834,637 | $ | 1,047,821 | ||||||||||||||||||||||||
|
|
|
|
|
|
|
|
|
|
|
| |||||||||||||||||||||||||||||||||||||
Total Income | 938,684 | 1,143,240 | 455,372 | 529,226 | 585,282 | 711,631 | 1,338,676 | 1,668,101 | 647,376 | 780,501 | 834,637 | 1,047,821 | ||||||||||||||||||||||||||||||||||||
|
|
|
|
|
|
|
|
|
|
|
| |||||||||||||||||||||||||||||||||||||
Expenses: | ||||||||||||||||||||||||||||||||||||||||||||||||
Incentive Fees | 184,498 | 1,622,616 | — | 84,508 | — | 474,155 | 184,498 | 3,079,256 | — | 488,081 | — | 1,059,204 | ||||||||||||||||||||||||||||||||||||
Management Fees | 798,238 | 1,001,476 | 654,910 | 705,144 | 1,229,182 | 1,730,283 | 1,131,997 | 1,445,371 | 970,110 | 1,069,958 | 1,747,261 | 2,599,254 | ||||||||||||||||||||||||||||||||||||
Service Fees - Class 1 | 596,303 | 764,517 | 351,815 | 376,906 | 184,174 | 240,025 | 822,240 | 1,131,348 | 508,375 | 584,434 | 255,223 | 352,904 | ||||||||||||||||||||||||||||||||||||
Trading Fees | 1,250,812 | 1,522,885 | 581,403 | 636,911 | 402,099 | 511,670 | 1,726,597 | 2,258,377 | 834,173 | 979,635 | 548,982 | 778,408 | ||||||||||||||||||||||||||||||||||||
|
|
|
|
|
|
|
|
|
|
|
| |||||||||||||||||||||||||||||||||||||
Total Expenses | 2,829,851 | 4,911,494 | 1,588,128 | 1,803,469 | 1,815,455 | 2,956,133 | 3,865,332 | 7,914,352 | 2,312,658 | 3,122,108 | 2,551,466 | 4,789,770 | ||||||||||||||||||||||||||||||||||||
|
|
|
|
|
|
|
|
|
|
|
| |||||||||||||||||||||||||||||||||||||
Investment income/(loss) - net | (1,891,167 | ) | (3,768,254 | ) | (1,132,756 | ) | (1,274,243 | ) | (1,230,173 | ) | (2,244,502 | ) | ||||||||||||||||||||||||||||||||||||
Investment (loss) - net | (2,526,656 | ) | (6,246,251 | ) | (1,665,282 | ) | (2,341,607 | ) | (1,716,829 | ) | (3,741,949 | ) | ||||||||||||||||||||||||||||||||||||
|
|
|
|
|
|
|
|
|
|
|
| |||||||||||||||||||||||||||||||||||||
Realized and unrealized gain/(loss) on investments: | ||||||||||||||||||||||||||||||||||||||||||||||||
Net realized gain/(loss) on futures, forwards and options | 734,081 | — | — | 3,438,153 | (130,988 | ) | 1,862,384 | 734,081 | — | — | 4,064,894 | (6,256,541 | ) | (35,422,568 | ) | |||||||||||||||||||||||||||||||||
Net change in open trade equity/(deficit) | (566,777 | ) | — | — | (848,382 | ) | (3,390,670 | ) | (6,274,138 | ) | (566,777 | ) | — | — | (1,006,677 | ) | 52,457 | 33,169,426 | ||||||||||||||||||||||||||||||
Net realized gain/(loss) on swap contracts | — | (106,862 | ) | — | (55,669 | ) | — | (58,693 | ) | — | (106,862 | ) | — | (55,669 | ) | — | (58,693 | ) | ||||||||||||||||||||||||||||||
Net unrealized gain/(loss) on swap contracts | — | (23,719 | ) | — | (2,775 | ) | — | (20,529 | ) | (986,342 | ) | (23,719 | ) | — | (2,775 | ) | (60,503 | ) | (20,529 | ) | ||||||||||||||||||||||||||||
Net realized gain/(loss) on U.S. Treasury securities | 221,284 | 176,189 | 107,483 | 84,120 | 138,776 | 110,579 | 221,284 | 176,189 | 107,483 | 84,120 | 138,776 | 110,579 | ||||||||||||||||||||||||||||||||||||
Net unrealized gain/(loss) on U.S. Treasury securities | (236,981 | ) | (344,875 | ) | (115,107 | ) | (161,783 | ) | (148,620 | ) | (212,182 | ) | (236,981 | ) | (380,530 | ) | (118,107 | ) | (179,102 | ) | (148,620 | ) | (234,541 | ) | ||||||||||||||||||||||||
Trading commissions | (5,416 | ) | — | — | (72,157 | ) | (784,182 | ) | (898,855 | ) | (5,416 | ) | — | — | (119,270 | ) | (1,093,840 | ) | (1,401,958 | ) | ||||||||||||||||||||||||||||
Change in fair value of investments in unconsolidated trading companies | (7,348,507 | ) | 2,154,374 | (1,684,494 | ) | 494,168 | (659,517 | ) | (1,178,743 | ) | (13,058,787 | ) | 5,278,098 | (4,193,804 | ) | 2,888,613 | (1,010,415 | ) | (1,826,300 | ) | ||||||||||||||||||||||||||||
|
|
|
|
|
|
|
|
|
|
|
| |||||||||||||||||||||||||||||||||||||
Net gain/(loss) on investments | (7,202,316 | ) | 1,855,107 | (1,692,118 | ) | 2,875,675 | (4,975,201 | ) | (6,670,177 | ) | (13,898,938 | ) | 4,943,176 | (4,204,428 | ) | 5,674,134 | (8,378,686 | ) | (5,684,584 | ) | ||||||||||||||||||||||||||||
|
|
|
|
|
|
|
|
|
|
|
| |||||||||||||||||||||||||||||||||||||
NET INCREASE/(DECREASE) IN CAPITAL RESULTING FROM OPERATIONS | (9,093,483 | ) | (1,913,147 | ) | (2,824,874 | ) | 1,601,432 | (6,205,374 | ) | (8,914,679 | ) | (16,425,594 | ) | (1,303,075 | ) | (5,869,710 | ) | 3,332,527 | (10,095,515 | ) | (9,426,533 | ) | ||||||||||||||||||||||||||
|
|
|
|
|
|
|
|
|
|
|
| |||||||||||||||||||||||||||||||||||||
Less: Operations attributable to non-controlling interests | — | — | — | 527,388 | (2,681,444 | ) | (5,453,840 | ) | — | — | — | 676,097 | (4,287,954 | ) | (10,770,288 | ) | ||||||||||||||||||||||||||||||||
|
|
|
|
|
|
|
|
|
|
|
| |||||||||||||||||||||||||||||||||||||
NET INCREASE/(DECREASE) IN CAPITAL RESULTING FROM OPERATIONS ATTRIBUTABLE TO CONTROLLING INTERESTS | $ | (9,093,483 | ) | $ | (1,913,147 | ) | $ | (2,824,874 | ) | $ | 1,074,044 | $ | (3,523,930 | ) | $ | (3,460,839 | ) | $ | (16,425,594 | ) | $ | (1,303,075 | ) | $ | (5,869,710 | ) | $ | 2,656,430 | $ | (5,807,561 | ) | $ | 1,343,755 | |||||||||||||||
|
|
|
|
|
|
|
|
|
|
|
| |||||||||||||||||||||||||||||||||||||
NET INCREASE/(DECREASE) IN CAPITAL RESULTING FROM OPERATIONS ATTRIBUTABLE TO CONTROLLING INTERESTS PER UNIT | ||||||||||||||||||||||||||||||||||||||||||||||||
Class 1 | $ | (8.85 | ) | $ | (1.80 | ) | $ | (6.37 | ) | $ | 1.79 | N/A | $ | (8.06 | )(1) | $ | (16.27 | ) | $ | (1.58 | ) | $ | (13.24 | ) | $ | 4.67 | N/A | $ | 0.72 | |||||||||||||||||||
Class 1a | N/A | N/A | N/A | N/A | $ | (8.68 | ) | $ | (6.45 | ) | N/A | N/A | N/A | N/A | $ | (14.98 | ) | $ | 1.71 | |||||||||||||||||||||||||||||
Class 2 | $ | (8.63 | ) | $ | (0.97 | ) | $ | (5.90 | ) | $ | 2.82 | $ | (11.19 | ) | $ | (7.77 | ) | $ | (16.22 | ) | $ | (0.30 | ) | $ | (12.86 | ) | $ | 6.34 | $ | (19.56 | ) | $ | 3.31 | |||||||||||||||
Class 2a | N/A | N/A | N/A | N/A | $ | (8.31 | ) | $ | (5.69 | ) | N/A | N/A | N/A | N/A | $ | (14.61 | ) | $ | 3.41 | |||||||||||||||||||||||||||||
Class 3 | N/A | N/A | N/A | N/A | $ | (11.20 | ) | $ | (7.78 | ) | N/A | N/A | N/A | N/A | $ | (19.57 | ) | $ | 3.37 | |||||||||||||||||||||||||||||
Class 3a | N/A | N/A | N/A | N/A | $ | (2.45 | )(2) | N/A | N/A | N/A | N/A | N/A | $ | (8.69 | )(1) | N/A | ||||||||||||||||||||||||||||||||
| (1) |
| Class 3a operations began June 17, 2013. |
The accompanying notes are an integral part of these financial statements.
The Series of the Frontier Fund
Statements of Operations
For the SixNine Months Ended JuneSeptember 30, 2013 and 2012
| Balanced Series | Frontier Select Series (1) | Balanced Series | Frontier Select Series (1) | |||||||||||||||||||||||||||||
| (Unaudited) | (Unaudited) | (Unaudited) | (Unaudited) | |||||||||||||||||||||||||||||
| 6/30/2013 | 6/30/2012 | 6/30/2013 | 6/30/2012 | 9/30/2013 | 9/30/2012 | 9/30/2013 | 9/30/2012 | |||||||||||||||||||||||||
Investment income: | ||||||||||||||||||||||||||||||||
Interest - net | $ | 122,551 | $ | 186,736 | $ | 178,057 | $ | 83,962 | $ | 246,370 | $ | 208,856 | $ | 246,719 | $ | 159,048 | ||||||||||||||||
|
|
|
|
|
|
|
| |||||||||||||||||||||||||
Total Income | 122,551 | 186,736 | 178,057 | 83,962 | 246,370 | 208,856 | 246,719 | 159,048 | ||||||||||||||||||||||||
|
|
|
|
|
|
|
| |||||||||||||||||||||||||
Expenses: | ||||||||||||||||||||||||||||||||
Incentive Fees | 657,063 | 3,285,306 | — | 58,853 | 657,063 | 6,553,867 | — | 65,989 | ||||||||||||||||||||||||
Management Fees | 916,029 | 1,339,664 | 347,293 | 630,430 | 1,250,878 | 1,940,876 | 487,737 | 956,639 | ||||||||||||||||||||||||
Service Fees - Class 1 | 1,916,467 | 2,605,664 | 310,652 | 473,019 | 2,658,114 | 3,845,995 | 452,617 | 686,786 | ||||||||||||||||||||||||
Trading Fees | 673,471 | 930,270 | 88,324 | 132,847 | 934,900 | 1,373,998 | 128,680 | 193,716 | ||||||||||||||||||||||||
|
|
|
|
|
|
|
| |||||||||||||||||||||||||
Total Expenses | 4,163,030 | 8,160,904 | 746,269 | 1,295,149 | 5,500,955 | 13,714,736 | 1,069,034 | 1,903,130 | ||||||||||||||||||||||||
|
|
|
|
|
|
|
| |||||||||||||||||||||||||
Investment (loss) - net | (4,040,479 | ) | (7,974,168 | ) | (568,212 | ) | (1,211,187 | ) | (5,254,585 | ) | (13,505,880 | ) | (822,315 | ) | (1,744,082 | ) | ||||||||||||||||
|
|
|
|
|
|
|
| |||||||||||||||||||||||||
Realized and unrealized gain/(loss) on investments: | ||||||||||||||||||||||||||||||||
Net realized gain/(loss) on futures, forwards and options | (2,875,164 | ) | 14,305,074 | — | — | (1,691,547 | ) | 33,748,231 | — | — | ||||||||||||||||||||||
Net change in open trade equity/(deficit) | 1,200,003 | 2,536,358 | — | — | (257,325 | ) | (337,037 | ) | — | — | ||||||||||||||||||||||
Net realized gain/(loss) on swap contracts | (1,908,743 | ) | (175,294 | ) | — | (34,232 | ) | (3,554,723 | ) | (175,294 | ) | — | (34,232 | ) | ||||||||||||||||||
Net unrealized gain/(loss) on swap contracts | 772,617 | 1,331,127 | — | (2,448 | ) | (225,707 | ) | 1,590,654 | — | (2,448 | ) | |||||||||||||||||||||
Net realized gain/(loss) on U.S. Treasury securities | 362,137 | 290,166 | 78,233 | 59,410 | 362,137 | 290,166 | 78,233 | 59,410 | ||||||||||||||||||||||||
Net unrealized gain/(loss) on U.S. Treasury securities | (387,826 | ) | (573,994 | ) | (83,782 | ) | (107,356 | ) | (387,826 | ) | (632,344 | ) | (83,782 | ) | (119,961 | ) | ||||||||||||||||
Trading commissions | (1,146,861 | ) | (2,676,067 | ) | — | — | (1,361,766 | ) | (3,926,501 | ) | — | — | ||||||||||||||||||||
Change in fair value of investments in unconsolidated trading companies | (8,931,059 | ) | (5,687,507 | ) | 1,360,285 | (445,682 | ) | (15,834,449 | ) | (8,615,816 | ) | 338,654 | (122,653 | ) | ||||||||||||||||||
Net realized gain/(loss) on investment in Berkeley Quantitative Colorado Fund LLC | — | — | — | (2,172,987 | ) | — | — | — | (2,172,987 | ) | ||||||||||||||||||||||
Net unrealized gain/(loss) on investment in Berkeley Quantitative Colorado Fund LLC | — | — | — | 2,084,880 | — | — | — | 2,084,880 | ||||||||||||||||||||||||
|
|
|
|
|
|
|
| |||||||||||||||||||||||||
Net gain/(loss) on investments | (12,914,896 | ) | 9,349,863 | 1,354,736 | (618,415 | ) | (22,951,206 | ) | 21,942,059 | 333,105 | (307,991 | ) | ||||||||||||||||||||
|
|
|
|
|
|
|
| |||||||||||||||||||||||||
NET INCREASE/(DECREASE) IN CAPITAL RESULTING FROM OPERATIONS | (16,955,375 | ) | 1,375,695 | 786,524 | (1,829,602 | ) | (28,205,791 | ) | 8,436,179 | (489,210 | ) | (2,052,073 | ) | |||||||||||||||||||
|
|
|
|
|
|
|
| |||||||||||||||||||||||||
Less: Operations attributable to non-controlling interests | (613,022 | ) | 4,229,152 | — | — | (2,141,659 | ) | 10,396,433 | — | — | ||||||||||||||||||||||
|
|
|
|
|
|
|
| |||||||||||||||||||||||||
NET INCREASE/(DECREASE) IN CAPITAL RESULTING FROM OPERATIONS ATTRIBUTABLE TO CONTROLLING INTERESTS | $ | (16,342,353 | ) | $ | (2,853,457 | ) | $ | 786,524 | $ | (1,829,602 | ) | $ | (26,064,132 | ) | $ | (1,960,254 | ) | $ | (489,210 | ) | $ | (2,052,073 | ) | |||||||||
|
|
|
|
|
|
|
| |||||||||||||||||||||||||
NET INCREASE/(DECREASE) IN CAPITAL RESULTING FROM OPERATIONS ATTRIBUTABLE TO CONTROLLING INTERESTS PER UNIT | ||||||||||||||||||||||||||||||||
Class 1 | $ | (11.43 | ) | $ | (1.85 | ) | $ | 2.35 | $ | (4.73 | ) | $ | (18.60 | ) | $ | (1.71 | ) | $ | (2.64 | ) | $ | (5.72 | ) | |||||||||
Class 1a | N/A | (2) | $ | (0.32 | ) | N/A | N/A | N/A | (2) | $ | 4.13 | N/A | N/A | |||||||||||||||||||
Class 2 | $ | (12.66 | ) | $ | (0.01 | ) | $ | 4.49 | $ | (4.80 | ) | $ | (21.00 | ) | $ | 1.28 | $ | (1.16 | ) | $ | (4.72 | ) | ||||||||||
Class 2a | $ | (9.67 | ) | $ | 0.64 | N/A | N/A | $ | (16.25 | ) | $ | 1.80 | N/A | N/A | ||||||||||||||||||
Class 3a | $ | (9.65 | )(2) | $ | 0.18 | N/A | N/A | $ | (16.21 | )(2) | $ | 1.36 | N/A | N/A | ||||||||||||||||||
| (1) | Formerly known as the Tiverton/Graham/Transtrend Series. |
| (2) | Class 1a operations ceased July 17, 2012 and all remaining Class 1a Units were exchanged for Class 3a Units. |
The accompanying notes are an integral part of these financial statements.
The Series of the Frontier Fund
Statements of Operations
For the SixNine Months Ended JuneSeptember 30, 2013 and 2012
| Winton Series | Frontier Heritage Series (1) | Winton Series | Frontier Heritage Series (1) | |||||||||||||||||||||||||||||
| (Unaudited) | (Unaudited) | (Unaudited) | (Unaudited) | |||||||||||||||||||||||||||||
| 6/30/2013 | 6/30/2012 | 6/30/2013 | 6/30/2012 | 9/30/2013 | 9/30/2012 | 9/30/2013 | 9/30/2012 | |||||||||||||||||||||||||
Investment income: | ||||||||||||||||||||||||||||||||
Interest - net | $ | 204,611 | $ | 258,693 | $ | 72,996 | $ | 53,990 | $ | 271,603 | $ | 386,507 | $ | 102,598 | $ | 85,811 | ||||||||||||||||
|
|
|
|
|
|
|
| |||||||||||||||||||||||||
Total Income | 204,611 | 258,693 | 72,996 | 53,990 | 271,603 | 386,507 | 102,598 | 85,811 | ||||||||||||||||||||||||
|
|
|
|
|
|
|
| |||||||||||||||||||||||||
Expenses: | ||||||||||||||||||||||||||||||||
Management Fees | 520,375 | 527,370 | 214,205 | 588,344 | 785,269 | 787,335 | 288,326 | 813,420 | ||||||||||||||||||||||||
Service Fees - Class 1 | 449,703 | 548,690 | 236,146 | 338,208 | 661,315 | 806,539 | 337,523 | 491,271 | ||||||||||||||||||||||||
Trading Fees | 151,657 | 178,594 | 73,328 | 103,966 | 223,928 | 263,127 | 105,156 | 151,266 | ||||||||||||||||||||||||
|
|
|
|
|
|
|
| |||||||||||||||||||||||||
Total Expenses | 1,121,735 | 1,254,654 | 523,679 | 1,030,518 | 1,670,512 | 1,857,001 | 731,005 | 1,455,957 | ||||||||||||||||||||||||
|
|
|
|
|
|
|
| |||||||||||||||||||||||||
Investment (loss) - net | (917,124 | ) | (995,961 | ) | (450,683 | ) | (976,528 | ) | (1,398,909 | ) | (1,470,494 | ) | (628,407 | ) | (1,370,146 | ) | ||||||||||||||||
|
|
|
|
|
|
|
| |||||||||||||||||||||||||
Realized and unrealized gain/(loss) on investments: | ||||||||||||||||||||||||||||||||
Net realized gain/(loss) on swap contracts | — | (57,781 | ) | — | (30,602 | ) | — | (57,781 | ) | — | (30,602 | ) | ||||||||||||||||||||
Net unrealized gain/(loss) on swap contracts | — | (7,291 | ) | — | 943 | — | (7,291 | ) | — | 943 | ||||||||||||||||||||||
Net realized gain/(loss) on U.S. Treasury securities | 115,236 | 90,903 | 50,795 | 40,172 | 115,236 | 90,903 | 50,795 | 40,172 | ||||||||||||||||||||||||
Net unrealized gain/(loss) on U.S. Treasury securities | (123,411 | ) | (174,630 | ) | (54,398 | ) | (77,637 | ) | (123,411 | ) | (193,198 | ) | (54,398 | ) | (85,821 | ) | ||||||||||||||||
Change in fair value of investments in unconsolidated trading companies | 1,789,423 | (1,948,477 | ) | 1,349,322 | (1,094,706 | ) | 1,408,825 | (1,345,966 | ) | 1,099,875 | 91,196 | |||||||||||||||||||||
|
|
|
|
|
|
|
| |||||||||||||||||||||||||
Net gain/(loss) on investments | 1,781,248 | (2,097,276 | ) | 1,345,719 | (1,161,830 | ) | 1,400,650 | (1,513,333 | ) | 1,096,272 | 15,888 | |||||||||||||||||||||
|
|
|
|
|
|
|
| |||||||||||||||||||||||||
NET INCREASE/(DECREASE) IN CAPITAL RESULTING FROM OPERATIONS | 864,124 | (3,093,237 | ) | 895,036 | (2,138,358 | ) | 1,741 | (2,983,827 | ) | 467,865 | (1,354,258 | ) | ||||||||||||||||||||
|
|
|
|
|
|
|
| |||||||||||||||||||||||||
Less: Operations attributable to non-controlling interests | — | — | — | — | — | — | — | — | ||||||||||||||||||||||||
|
|
|
|
|
|
|
| |||||||||||||||||||||||||
NET INCREASE/(DECREASE) IN CAPITAL RESULTING FROM OPERATIONS ATTRIBUTABLE TO CONTROLLING INTERESTS | $ | 864,124 | $ | (3,093,237 | ) | $ | 895,036 | $ | (2,138,358 | ) | $ | 1,741 | $ | (2,983,827 | ) | $ | 467,865 | $ | (1,354,258 | ) | ||||||||||||
|
|
|
|
|
|
|
| |||||||||||||||||||||||||
NET INCREASE/(DECREASE) IN CAPITAL RESULTING FROM OPERATIONS ATTRIBUTABLE TO CONTROLLING INTERESTS PER UNIT | ||||||||||||||||||||||||||||||||
Class 1 | $ | 2.08 | $ | (9.41 | ) | $ | 3.53 | $ | (8.68 | ) | $ | (1.11 | ) | $ | (9.40 | ) | $ | 1.00 | $ | (5.93 | ) | |||||||||||
Class 2 | $ | 4.89 | $ | (8.70 | ) | $ | 6.37 | $ | (8.92 | ) | $ | 2.21 | $ | (7.54 | ) | $ | 4.05 | $ | (4.57 | ) | ||||||||||||
| (1) | Formerly known as the Winton/Graham Series. |
The accompanying notes are an integral part of these financial statements.
The Series of the Frontier Fund
Statements of Changes in Owners’ Capital
For the SixNine Months Ended JuneSeptember 30, 2013
(Unaudited)
| Frontier Diversified Series | Frontier Masters Series | Frontier Diversified Series | Frontier Masters Series | |||||||||||||||||||||||||||||||||||||||||||||||||||||||||||||||||||||||||||||
| Class 1 | Class 1 | Class 2 | Class 2 | Class 1 | Class 1 | Class 2 | Class 2 | Class 1 | Class 1 | Class 2 | Class 2 | Class 1 | Class 1 | Class 2 | Class 2 | |||||||||||||||||||||||||||||||||||||||||||||||||||||||||||||||||
| Managing Owner | Limited Owners | Managing Owner | Limited Owners | Total | Managing Owner | Limited Owners | Managing Owner | Limited Owners | Total | Managing Owner | Limited Owners | Managing Owner | Limited Owners | Total | Managing Owner | Limited Owners | Managing Owner | Limited Owners | Total | |||||||||||||||||||||||||||||||||||||||||||||||||||||||||||||
Owners’ Capital, December 31, 2012 | $ | 25,959 | $ | 58,973,977 | $ | 1,436,973 | $ | 54,744,663 | $ | 115,181,572 | $ | 27,804 | $ | 34,575,695 | $ | 605,508 | $ | 16,277,151 | $ | 51,486,158 | $ | 25,959 | $ | 58,973,977 | $ | 1,436,973 | $ | 54,744,663 | $ | 115,181,572 | $ | 27,804 | $ | 34,575,695 | $ | 605,508 | $ | 16,277,151 | $ | 51,486,158 | ||||||||||||||||||||||||||||||||||||||||
|
|
|
|
|
|
|
|
|
| |||||||||||||||||||||||||||||||||||||||||||||||||||||||||||||||||||||||
Sale of Units | — | 1,276,358 | — | 1,277,401 | 2,553,759 | — | 1,650,028 | — | 482,083 | 2,132,111 | — | 1,463,020 | — | 2,709,517 | 4,172,537 | — | 2,545,424 | — | 594,083 | 3,139,507 | ||||||||||||||||||||||||||||||||||||||||||||||||||||||||||||
Redemption of Units | — | (10,253,451 | ) | — | (8,618,264 | ) | (18,871,715 | ) | — | (3,488,791 | ) | — | (2,912,736 | ) | (6,401,527 | ) | — | (18,058,110 | ) | — | (16,887,983 | ) | (34,946,093 | ) | — | (6,636,880 | ) | — | (4,558,265 | ) | (11,195,145 | ) | ||||||||||||||||||||||||||||||||||||||||||||||||
Net increase/(decrease) in Owners’ Capital resulting from operations | (2,432 | ) | (4,781,961 | ) | (123,443 | ) | (4,185,647 | ) | (9,093,483 | ) | (1,749 | ) | (2,042,164 | ) | (33,210 | ) | (747,751 | ) | (2,824,874 | ) | (4,473 | ) | (8,557,426 | ) | (231,951 | ) | (7,631,744 | ) | (16,425,594 | ) | (3,641 | ) | (4,198,125 | ) | (72,357 | ) | (1,595,587 | ) | (5,869,710 | ) | ||||||||||||||||||||||||||||||||||||||||
|
|
|
|
|
|
|
|
|
|
|
|
|
|
|
|
|
|
|
| |||||||||||||||||||||||||||||||||||||||||||||||||||||||||||||
Owners’ Capital, June 30, 2013 | $ | 23,527 | $ | 45,214,923 | $ | 1,313,530 | $ | 43,218,153 | $ | 89,770,133 | $ | 26,055 | $ | 30,694,768 | $ | 572,298 | $ | 13,098,747 | $ | 44,391,868 | ||||||||||||||||||||||||||||||||||||||||||||||||||||||||||||
Owners’ Capital, September 30, 2013 | $ | 21,486 | $ | 33,821,461 | $ | 1,205,022 | $ | 32,934,453 | $ | 67,982,422 | $ | 24,163 | $ | 26,286,114 | $ | 533,151 | $ | 10,717,382 | $ | 37,560,810 | ||||||||||||||||||||||||||||||||||||||||||||||||||||||||||||
|
|
|
|
|
|
|
|
|
|
|
|
|
|
|
|
|
|
|
| |||||||||||||||||||||||||||||||||||||||||||||||||||||||||||||
Owners’ Capital - Units, December 31, 2012 | 275 | 624,740 | 14,301 | 544,826 | 275 | 341,974 | 5,627 | 151,262 | 275 | 624,740 | 14,301 | 544,826 | 275 | 341,974 | 5,627 | 151,262 | ||||||||||||||||||||||||||||||||||||||||||||||||||||||||||||||||
|
|
|
|
|
|
|
|
|
|
|
|
|
|
|
| |||||||||||||||||||||||||||||||||||||||||||||||||||||||||||||||||
Sale of Units | — | 13,875 | — | 12,830 | — | 16,271 | — | 4,499 | — | 16,215 | — | 29,156 | — | 26,079 | — | 5,650 | ||||||||||||||||||||||||||||||||||||||||||||||||||||||||||||||||
Redemption of Units | — | (110,100 | ) | — | (87,122 | ) | — | (34,270 | ) | — | (26,972 | ) | — | (208,073 | ) | — | (183,123 | ) | — | (68,894 | ) | — | (43,800 | ) | ||||||||||||||||||||||||||||||||||||||||||||||||||||||||
|
|
|
|
|
|
|
|
|
|
|
|
|
|
|
| |||||||||||||||||||||||||||||||||||||||||||||||||||||||||||||||||
Owners’ Capital - Units, June 30, 2013 | 275 | 528,515 | 14,301 | 470,534 | 275 | 323,975 | 5,627 | 128,789 | ||||||||||||||||||||||||||||||||||||||||||||||||||||||||||||||||||||||||
Owners’ Capital - Units, September 30, 2013 | 275 | 432,882 | 14,301 | 390,859 | 275 | 299,159 | 5,627 | 113,112 | ||||||||||||||||||||||||||||||||||||||||||||||||||||||||||||||||||||||||
|
|
|
|
|
|
|
|
|
|
|
|
|
|
|
| |||||||||||||||||||||||||||||||||||||||||||||||||||||||||||||||||
| (1) | (1) | (1) | (1) | (1) | (1) | (1) | (1) | |||||||||||||||||||||||||||||||||||||||||||||||||||||||||||||||||||||||||
Net asset value per unit at December 31, 2012 | $ | 94.40 | $ | 100.48 | $ | 101.11 | $ | 107.61 | $ | 94.40 | $ | 100.48 | $ | 101.11 | $ | 107.61 | ||||||||||||||||||||||||||||||||||||||||||||||||||||||||||||||||
Change in net asset value per unit for the period ended June 30, 2013 | (8.85 | ) | (8.63 | ) | (6.37 | ) | (5.90 | ) | ||||||||||||||||||||||||||||||||||||||||||||||||||||||||||||||||||||||||
Change in net asset value per unit for the period ended September 30, 2013 | (16.27 | ) | (16.22 | ) | (13.24 | ) | (12.86 | ) | ||||||||||||||||||||||||||||||||||||||||||||||||||||||||||||||||||||||||
|
|
|
|
|
|
|
| |||||||||||||||||||||||||||||||||||||||||||||||||||||||||||||||||||||||||
Net asset value per unit at June 30, 2013 | $ | 85.55 | $ | 91.85 | $ | 94.74 | $ | 101.71 | ||||||||||||||||||||||||||||||||||||||||||||||||||||||||||||||||||||||||
Net asset value per unit at September 30, 2013 | $ | 78.13 | $ | 84.26 | $ | 87.87 | $ | 94.75 | ||||||||||||||||||||||||||||||||||||||||||||||||||||||||||||||||||||||||
|
|
|
|
|
|
|
| |||||||||||||||||||||||||||||||||||||||||||||||||||||||||||||||||||||||||
| (1) | Values are for both the Managing Owner and Limited Owners. |
The accompanying notes are an integral part of these financial statements.
The Series of the Frontier Fund
Statements of Changes in Owners’ Capital
For the SixNine Months Ended JuneSeptember 30, 2013
(Unaudited)
| Frontier Long/Short Commodity Series | Frontier Long/Short Commodity Series | |||||||||||||||||||||||||||||||||||||||||||||||||||||||||||||||||||||||||||||||||||||||
| Class 2 | Class 3 | Class 1a | Class 1a | Class 2a | Class 2a | Class 3a (2) | Class 2 | Class 3 | Class 1a | Class 1a | Class 2a | Class 2a | Class 3a (2) | |||||||||||||||||||||||||||||||||||||||||||||||||||||||||||||||||||||||||||
| Managing Owner | Limited Owners | Limited Owners | Managing Owner | Limited Owners | Managing Owner | Limited Owners | Managing Owner | Limited Owners | Non-Controlling Interests | Total | Managing Owner | Limited Owners | Limited Owners | Managing Owner | Limited Owners | Managing Owner | Limited Owners | Managing Owner | Limited Owners | Non-Controlling Interests | Total | |||||||||||||||||||||||||||||||||||||||||||||||||||||||||||||||||||
Owners’ Capital, December 31, 2012 | $ | 449,011 | $ | 6,449,774 | $ | 19,761,047 | $ | 12,732 | $ | 18,970,806 | $ | 256,560 | $ | 10,625,551 | $ | — | $ | — | $ | 4,826,683 | $ | 61,352,164 | $ | 449,011 | $ | 6,449,774 | $ | 19,761,047 | $ | 12,732 | $ | 18,970,806 | $ | 256,560 | $ | 10,625,551 | $ | — | $ | — | $ | 4,826,683 | $ | 61,352,164 | ||||||||||||||||||||||||||||||||||||||||||||
|
|
|
|
|
|
|
|
|
|
| ||||||||||||||||||||||||||||||||||||||||||||||||||||||||||||||||||||||||||||||
Sale of Units | — | — | — | — | 639,187 | — | 226,400 | 11,990 | 23,178 | — | 900,755 | — | — | — | — | 676,187 | — | 251,400 | 11,990 | 121,876 | — | 1,061,453 | ||||||||||||||||||||||||||||||||||||||||||||||||||||||||||||||||||
Redemption of Units | — | (1,741,073 | ) | (5,482,870 | ) | (11,990 | ) | (3,345,312 | ) | — | (2,935,637 | ) | — | — | — | (13,516,882 | ) | — | (2,265,262 | ) | (6,530,834 | ) | (11,990 | ) | (6,223,643 | ) | — | (5,811,078 | ) | — | — | — | (20,842,807 | ) | ||||||||||||||||||||||||||||||||||||||||||||||||||||||
Change in control of ownership - Trading Companies | — | — | — | — | — | — | — | — | — | 3,006,720 | 3,006,720 | — | — | — | — | — | — | — | — | — | 1,574,902 | 1,574,902 | ||||||||||||||||||||||||||||||||||||||||||||||||||||||||||||||||||
Contributions to Trading Companies | — | — | — | — | — | — | — | — | — | 533,749 | 533,749 | |||||||||||||||||||||||||||||||||||||||||||||||||||||||||||||||||||||||||||||
Distributions to Trading Companies | — | — | — | — | — | — | — | — | — | (1,554,700 | ) | (1,554,700 | ) | |||||||||||||||||||||||||||||||||||||||||||||||||||||||||||||||||||||||||||
Contributions | — | — | — | — | — | — | — | — | — | 5,619,753 | 5,619,753 | |||||||||||||||||||||||||||||||||||||||||||||||||||||||||||||||||||||||||||||
Distributions | — | — | — | — | — | — | — | — | — | (5,143,244 | ) | (5,143,244 | ) | |||||||||||||||||||||||||||||||||||||||||||||||||||||||||||||||||||||||||||
Operations attributable to non-controlling interests | — | — | — | — | — | — | — | — | — | (2,681,444 | ) | (2,681,444 | ) | — | — | — | — | — | — | — | — | — | (4,287,954 | ) | (4,287,954 | ) | ||||||||||||||||||||||||||||||||||||||||||||||||||||||||||||||
Net increase/(decrease) in Owners’ Capital resulting from operations attributable to controlling interests | (34,495 | ) | (372,786 | ) | (1,119,119 | ) | (742 | ) | (1,323,082 | ) | (18,477 | ) | (654,440 | ) | (269 | ) | (520 | ) | — | (3,523,930 | ) | (60,293 | ) | (636,894 | ) | (1,908,538 | ) | (742 | ) | (2,179,676 | ) | (32,480 | ) | (983,290 | ) | (951 | ) | (4,697 | ) | — | (5,807,561 | ) | ||||||||||||||||||||||||||||||||||||||||||||||
|
|
|
|
|
|
|
|
|
|
|
|
|
|
|
|
|
|
|
|
|
| |||||||||||||||||||||||||||||||||||||||||||||||||||||||||||||||||||
Owners’ Capital, June 30, 2013 | $ | 414,516 | $ | 4,335,915 | $ | 13,159,058 | $ | — | $ | 14,941,599 | $ | 238,083 | $ | 7,261,874 | $ | 11,721 | $ | 22,658 | $ | 4,131,008 | $ | 44,516,432 | ||||||||||||||||||||||||||||||||||||||||||||||||||||||||||||||||||
Owners’ Capital, September 30, 2013 | $ | 388,718 | $ | 3,547,618 | $ | 11,321,675 | $ | — | $ | 11,243,674 | $ | 224,080 | $ | 4,082,583 | $ | 11,039 | $ | 117,179 | $ | 2,590,140 | 33,526,706 | |||||||||||||||||||||||||||||||||||||||||||||||||||||||||||||||||||
|
|
|
|
|
|
|
|
|
|
|
|
|
|
|
|
|
|
|
|
|
| |||||||||||||||||||||||||||||||||||||||||||||||||||||||||||||||||||
Owners’ Capital - Units, December 31, 2012 | 3,083 | 44,284 | 135,642 | 117 | 174,713 | 2,222 | 92,035 | — | — | 3,083 | 44,284 | 135,642 | 117 | 174,713 | 2,222 | 92,035 | — | — | ||||||||||||||||||||||||||||||||||||||||||||||||||||||||||||||||||||||
|
|
|
|
|
|
|
|
|
|
|
|
|
|
|
|
|
| |||||||||||||||||||||||||||||||||||||||||||||||||||||||||||||||||||||||
Sale of Units | — | — | — | — | 5,950 | — | 1,974 | 109 | 212 | — | — | — | — | 6,334 | — | 2,208 | 109 | 1,162 | ||||||||||||||||||||||||||||||||||||||||||||||||||||||||||||||||||||||
Redemption of Units | — | (12,036 | ) | (37,800 | ) | (117 | ) | (31,100 | ) | — | (26,228 | ) | — | — | — | (16,148 | ) | (45,875 | ) | (117 | ) | (60,926 | ) | — | (53,755 | ) | — | — | ||||||||||||||||||||||||||||||||||||||||||||||||||||||||||||
|
|
|
|
|
|
|
|
|
|
|
|
|
|
|
|
|
| |||||||||||||||||||||||||||||||||||||||||||||||||||||||||||||||||||||||
Owners’ Capital - Units, June 30, 2013 | 3,083 | 32,248 | 97,842 | — | 149,563 | 2,222 | 67,781 | 109 | 212 | |||||||||||||||||||||||||||||||||||||||||||||||||||||||||||||||||||||||||||||||
Owners’ Capital - Units, September 30, 2013 | 3,083 | 28,136 | 89,767 | — | 120,121 | 2,222 | 40,488 | 109 | 1,162 | |||||||||||||||||||||||||||||||||||||||||||||||||||||||||||||||||||||||||||||||
|
|
|
|
|
|
|
|
|
|
|
|
|
|
|
|
|
| |||||||||||||||||||||||||||||||||||||||||||||||||||||||||||||||||||||||
| (1) | (1) | (1) | (1) | (1) | (1) | (1) | (1) | |||||||||||||||||||||||||||||||||||||||||||||||||||||||||||||||||||||||||||||||||
Net asset value per unit at December 31, 2012 | $ | 145.65 | $ | 145.69 | $ | 108.58 | $ | 115.45 | $ | 109.60 | $ | 145.65 | $ | 145.69 | $ | 108.58 | $ | 115.45 | $ | 109.60 | ||||||||||||||||||||||||||||||||||||||||||||||||||||||||||||||||||||
Change in net asset value per unit for the period ended June 30, 2013 | (11.19 | ) | (11.20 | ) | (8.68 | ) | (8.31 | ) | (2.45 | ) | ||||||||||||||||||||||||||||||||||||||||||||||||||||||||||||||||||||||||||||||
Change in net asset value per unit for the period ended September 30, 2013 | (19.56 | ) | (19.57 | ) | (14.98 | ) | (14.61 | ) | (8.69 | ) | ||||||||||||||||||||||||||||||||||||||||||||||||||||||||||||||||||||||||||||||
|
|
|
|
|
|
|
|
|
| |||||||||||||||||||||||||||||||||||||||||||||||||||||||||||||||||||||||||||||||
Net asset value per unit at June 30, 2013 | $ | 134.46 | $ | 134.49 | $ | 99.90 | $ | 107.14 | $ | 107.15 | ||||||||||||||||||||||||||||||||||||||||||||||||||||||||||||||||||||||||||||||
Net asset value per unit at September 30, 2013 | $ | 126.09 | $ | 126.12 | $ | 93.60 | $ | 100.84 | $ | 100.91 | ||||||||||||||||||||||||||||||||||||||||||||||||||||||||||||||||||||||||||||||
|
|
|
|
|
|
|
|
|
| |||||||||||||||||||||||||||||||||||||||||||||||||||||||||||||||||||||||||||||||
| (1) | Values are for both the Managing Owner and Limited Owners. |
| (2) | Class 1a operations ceased July 17, 2012 and all remaining Class 1a Units were exchanged for Class 3a Units. |
The accompanying notes are an integral part of these financial statements.
The Series of the Frontier Fund
Statements of Changes in Owners’ Capital
For the SixNine Months Ended JuneSeptember 30, 2013
(Unaudited)
| Balanced Series | Balanced Series | |||||||||||||||||||||||||||||||||||||||||||||||||||||||||||||||
| Class 1 | Class 2 | Class 2a | Class 3a | Class 1 | Class 2 | Class 2a | Class 3a | |||||||||||||||||||||||||||||||||||||||||||||||||||||||||
| Limited Owners | Managing Owner | Limited Owners | Managing Owner | Limited Owners | Limited Owners | Non-Controlling Interests | Total | Limited Owners | Managing Owner | Limited Owners | Managing Owner | Limited Owners | Limited Owners | Non-Controlling Interests | Total | |||||||||||||||||||||||||||||||||||||||||||||||||
Owners’ Capital, December 31, 2012 | $ | 143,906,872 | $ | 3,225,784 | $ | 48,233,784 | $ | 153,884 | $ | 855,636 | $ | 3,776,790 | $ | 44,816,933 | $ | 244,969,683 | $ | 143,906,872 | $ | 3,225,784 | $ | 48,233,784 | $ | 153,884 | $ | 855,636 | $ | 3,776,790 | $ | 44,816,933 | $ | 244,969,683 | ||||||||||||||||||||||||||||||||
|
|
|
|
|
|
|
| |||||||||||||||||||||||||||||||||||||||||||||||||||||||||
Sale of Units | 168,617 | — | 7,692 | — | — | — | — | 176,309 | 223,025 | — | 11,513 | — | — | — | — | 234,538 | ||||||||||||||||||||||||||||||||||||||||||||||||
Redemption of Units | (23,762,099 | ) | (47,933 | ) | (7,353,211 | ) | — | (172,020 | ) | (954,645 | ) | — | (32,289,908 | ) | (38,380,811 | ) | (547,933 | ) | (12,952,912 | ) | — | (257,150 | ) | (1,105,541 | ) | — | (53,244,347 | ) | ||||||||||||||||||||||||||||||||||||
Change in control of ownership - Trading Companies | — | — | — | — | — | — | (32,918,537 | ) | (32,918,537 | ) | — | — | — | — | — | — | (51,747,039 | ) | (51,747,039 | ) | ||||||||||||||||||||||||||||||||||||||||||||
Contributions to Trading Companies | — | — | — | — | — | — | 28,003,136 | 28,003,136 | ||||||||||||||||||||||||||||||||||||||||||||||||||||||||
Distributions to Trading Companies | — | — | — | — | — | — | (24,921,921 | ) | (24,921,921 | ) | ||||||||||||||||||||||||||||||||||||||||||||||||||||||
Contributions | — | — | — | — | — | — | 56,807,054 | 56,807,054 | ||||||||||||||||||||||||||||||||||||||||||||||||||||||||
Distributions | — | — | — | — | — | — | (39,448,498 | ) | (39,448,498 | ) | ||||||||||||||||||||||||||||||||||||||||||||||||||||||
Operations attributable to non-controlling interests | — | — | — | — | — | — | (613,022 | ) | (613,022 | ) | — | — | — | — | — | — | (2,141,659 | ) | (2,141,659 | ) | ||||||||||||||||||||||||||||||||||||||||||||
Net increase/(decrease) in Owners’ Capital resulting from operations attributable to controlling interests | (12,230,638 | ) | (268,535 | ) | (3,551,026 | ) | (11,973 | ) | (55,775 | ) | (224,406 | ) | — | (16,342,353 | ) | (19,367,157 | ) | (439,041 | ) | (5,773,771 | ) | (20,115 | ) | (91,724 | ) | (372,324 | ) | — | (26,064,132 | ) | ||||||||||||||||||||||||||||||||||
|
|
|
|
|
|
|
|
|
|
|
|
|
|
|
| |||||||||||||||||||||||||||||||||||||||||||||||||
Owners’ Capital, June 30, 2013 | $ | 108,082,752 | $ | 2,909,316 | $ | 37,337,239 | $ | 141,911 | $ | 627,841 | $ | 2,597,739 | $ | 14,366,589 | $ | 166,063,387 | ||||||||||||||||||||||||||||||||||||||||||||||||
Owners’ Capital, September 30, 2013 | $ | 86,381,929 | $ | 2,238,810 | $ | 29,518,614 | $ | 133,769 | $ | 506,762 | $ | 2,298,925 | $ | 8,286,791 | $ | 129,365,600 | ||||||||||||||||||||||||||||||||||||||||||||||||
|
|
|
|
|
|
|
|
|
|
|
|
|
|
|
| |||||||||||||||||||||||||||||||||||||||||||||||||
Owners’ Capital - Units, December 31, 2012 | 1,237,173 | 21,620 | 323,274 | 1,237 | 6,880 | 30,469 | 1,237,173 | 21,620 | 323,274 | 1,237 | 6,880 | 30,469 | ||||||||||||||||||||||||||||||||||||||||||||||||||||
|
|
|
|
|
|
|
|
|
|
|
| |||||||||||||||||||||||||||||||||||||||||||||||||||||
Sale of Units | 1,466 | — | 51 | — | — | — | 2,011 | — | 80 | — | — | — | ||||||||||||||||||||||||||||||||||||||||||||||||||||
Redemption of Units | (208,199 | ) | (312 | ) | (49,869 | ) | — | (1,405 | ) | (7,744 | ) | (355,242 | ) | (4,156 | ) | (93,092 | ) | — | (2,192 | ) | (9,134 | ) | ||||||||||||||||||||||||||||||||||||||||||
|
|
|
|
|
|
|
|
|
|
|
| |||||||||||||||||||||||||||||||||||||||||||||||||||||
Owners’ Capital - Units, June 30, 2013 | 1,030,440 | 21,308 | 273,456 | 1,237 | 5,475 | 22,725 | ||||||||||||||||||||||||||||||||||||||||||||||||||||||||||
Owners’ Capital - Units, September 30, 2013 | 883,942 | 17,464 | 230,262 | 1,237 | 4,688 | 21,335 | ||||||||||||||||||||||||||||||||||||||||||||||||||||||||||
|
|
|
|
|
|
|
|
|
|
|
| |||||||||||||||||||||||||||||||||||||||||||||||||||||
| (1) | (1) | (1) | (1) | |||||||||||||||||||||||||||||||||||||||||||||||||||||||||||||
Net asset value per unit at December 31, 2012 | $ | 116.32 | $ | 149.20 | $ | 124.36 | $ | 123.96 | $ | 116.32 | $ | 149.20 | $ | 124.36 | $ | 123.96 | ||||||||||||||||||||||||||||||||||||||||||||||||
Change in net asset value per unit for the period ended June 30, 2013 | (11.43 | ) | (12.66 | ) | (9.67 | ) | (9.65 | ) | ||||||||||||||||||||||||||||||||||||||||||||||||||||||||
Change in net asset value per unit for the period ended September 30, 2013 | (18.60 | ) | (21.00 | ) | (16.25 | ) | (16.21 | ) | ||||||||||||||||||||||||||||||||||||||||||||||||||||||||
|
|
|
|
|
|
|
| |||||||||||||||||||||||||||||||||||||||||||||||||||||||||
Net asset value per unit at June 30, 2013 | $ | 104.89 | $ | 136.54 | $ | 114.69 | $ | 114.31 | ||||||||||||||||||||||||||||||||||||||||||||||||||||||||
Net asset value per unit at September 30, 2013 | $ | 97.72 | $ | 128.20 | $ | 108.11 | $ | 107.75 | ||||||||||||||||||||||||||||||||||||||||||||||||||||||||
|
|
|
|
|
|
|
| |||||||||||||||||||||||||||||||||||||||||||||||||||||||||
| (1) | Values are for both the Managing Owner and Limited Owners. |
The accompanying notes are an integral part of these financial statements.
The Series of the Frontier Fund
Statements of Changes in Owners’ Capital
For the SixNine Months Ended JuneSeptember 30, 2013
(Unaudited)
| Frontier Select Series (2) | Winton Series | Frontier Heritage Series (3) | Frontier Select Series (2) | Winton Series | Frontier Heritage Series (3) | |||||||||||||||||||||||||||||||||||||||||||||||||||||||||||||||||||||||||||||||||||||||||||
| Class 1 | Class 2 | Class 1 | Class 2 | Class 1 | Class 2 | Class 1 | Class 2 | Class 1 | Class 2 | Class 1 | Class 2 | |||||||||||||||||||||||||||||||||||||||||||||||||||||||||||||||||||||||||||||||||||||
| Limited Owners | Managing Owner | Limited Owners | Total | Limited Owners | Managing Owner | Limited Owners | Total | Limited Owners | Managing Owner | Limited Owners | Total | Limited Owners | Managing Owner | Limited Owners | Total | Limited Owners | Managing Owner | Limited Owners | Total | Limited Owners | Managing Owner | Limited Owners | Total | |||||||||||||||||||||||||||||||||||||||||||||||||||||||||||||||||||||||||
Owners’ Capital, December 31, 2012 | $ | 22,266,758 | $ | 7,013 | $ | 3,070,870 | $ | 25,344,641 | $ | 30,645,208 | $ | 32,721 | $ | 10,281,605 | $ | 40,959,534 | $ | 16,680,498 | $ | 51,683 | $ | 4,021,358 | $ | 20,753,539 | $ | 22,266,758 | $ | 7,013 | $ | 3,070,870 | $ | 25,344,641 | $ | 30,645,208 | $ | 32,721 | $ | 10,281,605 | $ | 40,959,534 | $ | 16,680,498 | $ | 51,683 | $ | 4,021,358 | $ | 20,753,539 | ||||||||||||||||||||||||||||||||||||||||||||||||
|
|
|
|
|
|
|
|
|
|
|
| |||||||||||||||||||||||||||||||||||||||||||||||||||||||||||||||||||||||||||||||||||||
Sale of Units | 8,725 | — | — | 8,725 | 91,099 | — | — | 91,099 | 23,085 | — | — | 23,085 | 12,067 | — | — | 12,067 | 134,791 | — | — | 134,791 | 32,332 | — | — | 32,332 | ||||||||||||||||||||||||||||||||||||||||||||||||||||||||||||||||||||||||
Redemption of Units | (3,608,609 | ) | — | (468,252 | ) | (4,076,861 | ) | (2,768,291 | ) | — | (286,272 | ) | (3,054,563 | ) | (3,512,281 | ) | — | (676,244 | ) | (4,188,525 | ) | (4,788,445 | ) | — | (805,617 | ) | (5,594,062 | ) | (4,031,879 | ) | — | (686,020 | ) | (4,717,899 | ) | (5,066,082 | ) | — | (1,181,705 | ) | (6,247,787 | ) | ||||||||||||||||||||||||||||||||||||||||||||||||||||||
Net increase/(decrease) in Owners’ Capital resulting from operations attributable to controlling interests | 656,480 | 316 | 129,728 | 786,524 | 538,850 | 1,013 | 324,261 | 864,124 | 685,963 | 2,726 | 206,347 | 895,036 | (483,499 | ) | (82 | ) | (5,629 | ) | (489,210 | ) | (153,899 | ) | 458 | 155,182 | 1,741 | 327,765 | 1,735 | 138,365 | 467,865 | |||||||||||||||||||||||||||||||||||||||||||||||||||||||||||||||||||
|
|
|
|
|
|
|
|
|
|
|
|
|
|
|
|
|
|
|
|
|
|
|
| |||||||||||||||||||||||||||||||||||||||||||||||||||||||||||||||||||||||||
Owners’ Capital, June 30, 2013 | $ | 19,323,354 | $ | 7,329 | $ | 2,732,346 | $ | 22,063,029 | $ | 28,506,866 | $ | 33,734 | $ | 10,319,594 | $ | 38,860,194 | $ | 13,877,265 | $ | 54,409 | $ | 3,551,461 | $ | 17,483,135 | ||||||||||||||||||||||||||||||||||||||||||||||||||||||||||||||||||||||||
Owners’ Capital, September 30, 2013 | $ | 17,006,881 | $ | 6,931 | $ | 2,259,624 | $ | 19,273,436 | $ | 26,594,221 | $ | 33,179 | $ | 9,750,767 | $ | 36,378,167 | $ | 11,974,513 | $ | 53,418 | $ | 2,978,018 | $ | 15,005,949 | ||||||||||||||||||||||||||||||||||||||||||||||||||||||||||||||||||||||||
|
|
|
|
|
|
|
|
|
|
|
|
|
|
|
|
|
|
|
|
|
|
|
| |||||||||||||||||||||||||||||||||||||||||||||||||||||||||||||||||||||||||
Owners’ Capital - Units, December 31, 2012 | 283,073 | 70 | 30,848 | 234,414 | 207 | 64,952 | 176,419 | 428 | 33,325 | 283,073 | 70 | 30,848 | 234,414 | 207 | 64,952 | 176,419 | 428 | 33,325 | ||||||||||||||||||||||||||||||||||||||||||||||||||||||||||||||||||||||||||||||
|
|
|
|
|
|
|
|
|
|
|
|
|
|
|
|
|
| |||||||||||||||||||||||||||||||||||||||||||||||||||||||||||||||||||||||||||||||
Sale of Units | 108 | — | — | 667 | — | — | 230 | — | — | 150 | — | — | 1,003 | — | — | 326 | — | — | ||||||||||||||||||||||||||||||||||||||||||||||||||||||||||||||||||||||||||||||
Redemption of Units | (44,638 | ) | — | (4,584 | ) | (20,434 | ) | — | (1,717 | ) | (35,164 | ) | — | (5,368 | ) | (59,509 | ) | — | (7,882 | ) | (30,241 | ) | — | (4,203 | ) | (51,429 | ) | — | (9,447 | ) | ||||||||||||||||||||||||||||||||||||||||||||||||||||||||||||||||||
|
|
|
|
|
|
|
|
|
|
|
|
|
|
|
|
|
| |||||||||||||||||||||||||||||||||||||||||||||||||||||||||||||||||||||||||||||||
Owners’ Capital - Units, June 30, 2013 | 238,543 | 70 | 26,264 | 214,647 | 207 | 63,235 | 141,485 | 428 | 27,957 | |||||||||||||||||||||||||||||||||||||||||||||||||||||||||||||||||||||||||||||||||||||||
Owners’ Capital - Units, September 30, 2013 | 223,714 | 70 | 22,966 | 205,176 | 207 | 60,749 | 125,316 | 428 | 23,878 | |||||||||||||||||||||||||||||||||||||||||||||||||||||||||||||||||||||||||||||||||||||||
|
|
|
|
|
|
|
|
|
|
|
|
|
|
|
|
|
| |||||||||||||||||||||||||||||||||||||||||||||||||||||||||||||||||||||||||||||||
| (1) | (1) | (1) | (1) | (1) | (1) | |||||||||||||||||||||||||||||||||||||||||||||||||||||||||||||||||||||||||||||||||||||||||||
Net asset value per unit at December 31, 2012 | $ | 78.66 | $ | 99.55 | $ | 130.73 | $ | 158.30 | $ | 94.55 | $ | 120.67 | $ | 78.66 | $ | 99.55 | $ | 130.73 | $ | 158.30 | $ | 94.55 | $ | 120.67 | ||||||||||||||||||||||||||||||||||||||||||||||||||||||||||||||||||||||||
Change in net asset value per unit for the period ended June 30, 2013 | 2.35 | 4.49 | 2.08 | 4.89 | 3.53 | 6.37 | ||||||||||||||||||||||||||||||||||||||||||||||||||||||||||||||||||||||||||||||||||||||||||
Change in net asset value per unit for the period ended September 30, 2013 | (2.64 | ) | (1.16 | ) | (1.11 | ) | 2.21 | 1.00 | 4.05 | |||||||||||||||||||||||||||||||||||||||||||||||||||||||||||||||||||||||||||||||||||||||
|
|
|
|
|
|
|
|
|
|
|
| |||||||||||||||||||||||||||||||||||||||||||||||||||||||||||||||||||||||||||||||||||||
Net asset value per unit at June 30, 2013 | $ | 81.01 | $ | 104.04 | $ | 132.81 | $ | 163.19 | $ | 98.08 | $ | 127.04 | ||||||||||||||||||||||||||||||||||||||||||||||||||||||||||||||||||||||||||||||||||||
Net asset value per unit at September 30, 2013 | $ | 76.02 | $ | 98.39 | $ | 129.62 | $ | 160.51 | $ | 95.55 | $ | 124.72 | ||||||||||||||||||||||||||||||||||||||||||||||||||||||||||||||||||||||||||||||||||||
|
|
|
|
|
|
|
|
|
|
|
| |||||||||||||||||||||||||||||||||||||||||||||||||||||||||||||||||||||||||||||||||||||
| (1) | Values are for both the Managing Owner and Limited Owners. |
| (2) | Formerly the Tiverton/Graham/Transtrend Series. |
| (3) | Formerly the Winton/Graham Series. |
The accompanying notes are an integral part of these financial statements.
The Series of the Frontier Fund
For the SixNine Months Ended JuneSeptember 30, 2013 and 2012
(Unaudited)
| Frontier Diversified Series | Frontier Masters Series | Frontier Long/Short Commodity Series | Frontier Diversified Series | Frontier Masters Series | Frontier Long/Short Commodity Series | |||||||||||||||||||||||||||||||||||||||||||
| 6/30/2013 | 6/30/2012 | 6/30/2013 | 6/30/2012 | 6/30/2013 | 6/30/2012 | 9/30/2013 | 9/30/2012 | 9/30/2013 | 9/30/2012 | 9/30/2013 | 9/30/2012 | |||||||||||||||||||||||||||||||||||||
Cash Flows from Operating Activities: | ||||||||||||||||||||||||||||||||||||||||||||||||
Net increase/(decrease) in capital resulting from operations | $ | (9,093,483 | ) | $ | (1,913,147 | ) | $ | (2,824,874 | ) | $ | 1,601,432 | $ | (6,205,374 | ) | $ | (8,914,679 | ) | $ | (16,425,594 | ) | $ | (1,303,075 | ) | $ | (5,869,710 | ) | $ | 3,332,527 | $ | (10,095,515 | ) | $ | (9,426,533 | ) | ||||||||||||||
Adjustments to reconcile net increase/(decrease) in capital resulting from operations to net cash provided by (used in) operating activities: | ||||||||||||||||||||||||||||||||||||||||||||||||
Change in: | ||||||||||||||||||||||||||||||||||||||||||||||||
Net change in open trade equity/(deficit), at fair value | — | — | — | 848,376 | 1,887,682 | 5,691,998 | — | — | — | 1,006,929 | (619,244 | ) | (34,474,951 | ) | ||||||||||||||||||||||||||||||||||
Net change in options written, at fair value | — | — | — | — | (608,640 | ) | 662,500 | — | — | — | — | (899,388 | ) | (465,465 | ) | |||||||||||||||||||||||||||||||||
Net change in ownership allocation of U.S. Treasury securities | 154,070 | 48,344 | 416,252 | (880,732 | ) | 68,797 | (460,331 | ) | 154,070 | 283,224 | 413,252 | (1,319,471 | ) | 68,797 | (1,026,151 | ) | ||||||||||||||||||||||||||||||||
Net change in ownership allocation of custom time deposits | 5,520,176 | 19,132 | 2,921,097 | (5,206,281 | ) | 4,202,673 | 671,254 | 5,897,177 | 1,251,670 | 2,331,811 | (9,281,656 | ) | 7,690,645 | (4,499,445 | ) | |||||||||||||||||||||||||||||||||
Net change in ownership allocation of credit default swaps | — | 423 | — | (1,219 | ) | — | (4,324 | ) | — | 423 | — | (1,219 | ) | — | (4,324 | ) | ||||||||||||||||||||||||||||||||
Net realized (gain) on swap contracts | — | 106,862 | — | 55,669 | — | 58,693 | — | 106,862 | — | 55,669 | — | 58,693 | ||||||||||||||||||||||||||||||||||||
Net unrealized (gain)/loss on swap contracts | — | 23,719 | — | 2,775 | — | 20,529 | 986,342 | 23,719 | — | 2,775 | 60,503 | 20,529 | ||||||||||||||||||||||||||||||||||||
Net unrealized (gain)/loss on U.S. Treasury securities | 236,981 | 344,875 | 115,107 | 161,783 | 148,620 | 212,182 | 236,981 | 380,530 | 118,107 | 179,102 | 148,620 | 234,541 | ||||||||||||||||||||||||||||||||||||
Net realized (gain)/loss on U.S. Treasury securities | (221,284 | ) | (176,189 | ) | (107,483 | ) | (84,120 | ) | (138,776 | ) | (110,579 | ) | (221,284 | ) | (176,189 | ) | (107,483 | ) | (84,120 | ) | (138,776 | ) | (110,579 | ) | ||||||||||||||||||||||||
(Purchases) sales of: | ||||||||||||||||||||||||||||||||||||||||||||||||
Purchases of swap contracts | (3,400,000 | ) | — | — | (2,880,000 | ) | ||||||||||||||||||||||||||||||||||||||||||
Sales of custom time deposits | 8,797,756 | 4,380,919 | 4,273,276 | 2,418,141 | 5,517,416 | 2,122,345 | 16,009,441 | 4,380,919 | 7,776,160 | 2,418,141 | 10,040,146 | 2,122,345 | ||||||||||||||||||||||||||||||||||||
Sales of U.S. Treasury securities | 3,683,233 | 7,795,181 | 1,789,033 | 3,735,419 | 2,309,899 | 4,973,010 | 3,683,233 | 7,795,181 | 1,789,033 | 3,735,419 | 2,309,899 | 4,973,010 | ||||||||||||||||||||||||||||||||||||
Increase and/or decrease in: | ||||||||||||||||||||||||||||||||||||||||||||||||
Receivable from futures commission merchants | — | — | — | (2,220,779 | ) | 628,467 | (10,742,946 | ) | — | — | — | (1,685,977 | ) | 7,848,932 | 36,127,410 | |||||||||||||||||||||||||||||||||
Change in control of ownership - trading companies | — | — | — | — | 3,006,720 | 7,337,360 | — | — | — | — | 1,574,902 | 7,337,360 | ||||||||||||||||||||||||||||||||||||
Contributions to trading companies | — | — | — | 2,506,321 | 533,749 | 23,164,665 | — | — | — | 5,101,862 | 5,619,753 | 45,161,968 | ||||||||||||||||||||||||||||||||||||
Distributions from trading companies | — | — | — | (565,724 | ) | (1,554,700 | ) | (23,882,978 | ) | — | — | — | (3,553,695 | ) | (5,143,244 | ) | (43,611,245 | ) | ||||||||||||||||||||||||||||||
Investments in unconsolidated trading companies, at fair value | 5,318,764 | (4,962,592 | ) | (3,220,007 | ) | (3,098,220 | ) | 1,827,906 | (313,371 | ) | 22,862,088 | (4,260,887 | ) | 844,519 | (3,861,307 | ) | 3,675,238 | 352,715 | ||||||||||||||||||||||||||||||
Prepaid service fees - Class 1 | 12,606 | 115,319 | 30,503 | 9,517 | 23,352 | 39,084 | 30,322 | 113,819 | 37,176 | (22,359 | ) | 34,133 | 50,008 | |||||||||||||||||||||||||||||||||||
Interest receivable | 53,887 | 110,603 | 30,947 | 40,458 | 33,408 | 63,698 | 53,818 | 190,012 | 30,899 | 77,801 | 33,380 | 105,513 | ||||||||||||||||||||||||||||||||||||
Receivable from related parties | 92,070 | (2,076 | ) | 24,572 | (504 | ) | (17,784 | ) | 3,574 | 113,093 | 16,362 | 38,735 | — | (1,483 | ) | (14,489 | ) | |||||||||||||||||||||||||||||||
Other assets | — | (6,068 | ) | — | (3,007 | ) | — | (4,285 | ) | — | (19,798 | ) | — | (12,277 | ) | — | (15,874 | ) | ||||||||||||||||||||||||||||||
Incentive fees payable to Managing Owner | (189,903 | ) | 1,095,141 | — | 84,508 | — | 270,321 | (189,903 | ) | 934,608 | — | 403,572 | — | 465,009 | ||||||||||||||||||||||||||||||||||
Management fees payable to Managing Owner | (28,598 | ) | (37,660 | ) | (14,008 | ) | (3,230 | ) | (88,311 | ) | (13,722 | ) | (48,724 | ) | (36,038 | ) | (19,398 | ) | 2,375 | (125,332 | ) | 3,300 | ||||||||||||||||||||||||||
Interest payable to Managing Owner | (5,520 | ) | (9,942 | ) | (2,371 | ) | (2,229 | ) | (3,521 | ) | (2,490 | ) | (10,934 | ) | (10,607 | ) | (5,145 | ) | (2,697 | ) | (7,092 | ) | (2,721 | ) | ||||||||||||||||||||||||
Trading fees payable to Managing Owner | (35,491 | ) | (15,190 | ) | (13,931 | ) | 5,289 | (21,606 | ) | 919 | (78,397 | ) | (32,758 | ) | (24,044 | ) | 7,824 | (36,780 | ) | 4,434 | ||||||||||||||||||||||||||||
Service fees payable to Managing Owner | (16,950 | ) | 11,525 | (4,734 | ) | 6,823 | (700 | ) | (3,191 | ) | (34,538 | ) | 14,696 | (7,710 | ) | 9,596 | (6,369 | ) | 1,397 | |||||||||||||||||||||||||||||
Payables to related parties | (19,435 | ) | — | 23,502 | 550 | (34,037 | ) | 20,733 | (19,435 | ) | 34,606 | (8,274 | ) | 78,305 | (34,037 | ) | 5,902 | |||||||||||||||||||||||||||||||
Other liabilities | — | 18,897 | — | 22,590 | 514 | 1,201 | — | 56,315 | — | 92,658 | 356 | 9,639 | ||||||||||||||||||||||||||||||||||||
|
|
|
|
|
|
|
|
|
|
|
| |||||||||||||||||||||||||||||||||||||
Net cash provided by (used in) operating activities | 14,258,879 | 6,948,076 | 3,436,881 | (566,394 | ) | 11,515,754 | 861,170 | 29,597,756 | 9,743,594 | 7,337,928 | (3,320,223 | ) | 19,118,044 | 3,381,996 | ||||||||||||||||||||||||||||||||||
|
|
|
|
|
|
|
|
|
|
|
| |||||||||||||||||||||||||||||||||||||
Cash Flows from Financing Activities: | ||||||||||||||||||||||||||||||||||||||||||||||||
Proceeds from sale of units | 2,553,759 | 7,784,912 | 2,132,111 | 4,251,958 | 900,755 | 8,997,501 | 4,172,537 | 9,803,970 | 3,139,507 | 8,127,497 | 1,061,453 | 11,020,642 | ||||||||||||||||||||||||||||||||||||
Payment for redemption of units | (18,871,715 | ) | (14,799,497 | ) | (6,401,527 | ) | (3,588,943 | ) | (13,516,882 | ) | (10,211,491 | ) | (34,946,093 | ) | (21,802,136 | ) | (11,195,145 | ) | (5,750,786 | ) | (20,842,807 | ) | (16,082,764 | ) | ||||||||||||||||||||||||
Pending owner additions | (21,292 | ) | (203,104 | ) | (14,157 | ) | 39,147 | (62,537 | ) | 15,207 | 38,160 | 519,278 | (14,160 | ) | (1,686 | ) | (62,537 | ) | 16,320 | |||||||||||||||||||||||||||||
Owner redemptions payable | 411,392 | (87,586 | ) | (96,698 | ) | (4,996 | ) | 61,919 | (52,668 | ) | (163,166 | ) | (236,833 | ) | 17,107 | 10,503 | (291,074 | ) | 137,430 | |||||||||||||||||||||||||||||
|
|
|
|
|
|
|
|
|
|
|
| |||||||||||||||||||||||||||||||||||||
Net cash provided by (used in) financing activities | (15,927,856 | ) | (7,305,275 | ) | (4,380,271 | ) | 697,166 | (12,616,745 | ) | (1,251,451 | ) | (30,898,562 | ) | (11,715,721 | ) | (8,052,691 | ) | 2,385,528 | (20,134,965 | ) | (4,908,372 | ) | ||||||||||||||||||||||||||
|
|
|
|
|
|
|
|
|
|
|
| |||||||||||||||||||||||||||||||||||||
Net increase (decrease) in cash and cash equivalents | (1,668,977 | ) | (357,199 | ) | (943,390 | ) | 130,772 | (1,100,991 | ) | (390,281 | ) | (1,300,806 | ) | (1,972,127 | ) | (714,763 | ) | (934,695 | ) | (1,016,921 | ) | (1,526,376 | ) | |||||||||||||||||||||||||
Cash and cash equivalents, beginning of period | 2,681,889 | 4,976,749 | 1,542,661 | 2,234,716 | 1,710,151 | 3,045,849 | 2,681,889 | 4,976,749 | 1,542,661 | 2,234,716 | 1,710,151 | 3,045,849 | ||||||||||||||||||||||||||||||||||||
|
|
|
|
|
|
|
|
|
|
|
| |||||||||||||||||||||||||||||||||||||
Cash and cash equivalents, end of period | $ | 1,012,912 | $ | 4,619,550 | $ | 599,271 | $ | 2,365,488 | $ | 609,160 | $ | 2,655,568 | $ | 1,381,083 | $ | 3,004,622 | $ | 827,898 | $ | 1,300,021 | $ | 693,230 | $ | 1,519,473 | ||||||||||||||||||||||||
|
|
|
|
|
|
|
|
|
|
|
| |||||||||||||||||||||||||||||||||||||
The accompanying notes are an integral part of these financial statements.
The Series of the Frontier Fund
Statements of Cash Flows
For the SixNine Months Ended JuneSeptember 30, 2013 and 2012
(Unaudited)
| Balanced Series | Frontier Select Series (1) | Balanced Series | Frontier Select Series (1) | |||||||||||||||||||||||||||||
| 6/30/2013 | 6/30/2012 | 6/30/2013 | 6/30/2012 | 9/30/2013 | 9/30/2012 | 9/30/2013 | 9/30/2012 | |||||||||||||||||||||||||
Cash Flows from Operating Activities: | ||||||||||||||||||||||||||||||||
Net increase/(decrease) in capital resulting from operations | $ | (16,955,375 | ) | $ | 1,375,695 | $ | 786,524 | $ | (1,829,602 | ) | $ | (28,205,791 | ) | $ | 8,436,179 | $ | (489,210 | ) | $ | (2,052,073 | ) | |||||||||||
Adjustments to reconcile net increase/(decrease) in capital resulting from operations to net cash provided by (used in) operating activities: | ||||||||||||||||||||||||||||||||
Change in: | ||||||||||||||||||||||||||||||||
Net change in open trade equity, at fair value | (1,109,389 | ) | (5,212,272 | ) | — | — | (474,837 | ) | 2,255,152 | — | — | |||||||||||||||||||||
Net change in options written, at fair value | (21,045 | ) | 982,158 | — | — | 302,428 | 802,305 | — | — | |||||||||||||||||||||||
Net change in ownership allocation of U.S. Treasury securities | (101,758 | ) | 2,126,630 | (346,146 | ) | (894,064 | ) | (101,758 | ) | 2,632,734 | (346,146 | ) | (620,043 | ) | ||||||||||||||||||
Net change in custom time deposits | (2,039,513 | ) | 6,414,370 | (3,267,434 | ) | (2,986,681 | ) | (6,231,481 | ) | 9,436,860 | (3,672,345 | ) | (878,775 | ) | ||||||||||||||||||
Net change in ownership allocation of credit default swaps | — | 9,783 | — | (2,283 | ) | — | 9,233 | — | (2,283 | ) | ||||||||||||||||||||||
Net change in ownership allocation of total return swaps | 5,334 | — | — | — | 3,911 | — | — | — | ||||||||||||||||||||||||
Net unrealized (gain)/loss on swap contracts | (772,617 | ) | (1,331,127 | ) | — | 2,448 | 225,707 | (1,590,654 | ) | — | 2,448 | |||||||||||||||||||||
Net realized (gain)/loss on swap contracts | 1,908,743 | 175,294 | — | 34,232 | 3,554,723 | 175,294 | — | 34,232 | ||||||||||||||||||||||||
Net unrealized (gain)/loss on U.S. Treasury securities | 387,826 | 573,994 | 83,782 | 107,356 | 387,826 | 632,344 | 83,782 | 119,961 | ||||||||||||||||||||||||
Net realized (gain)/loss on U.S. Treasury securities | (362,137 | ) | (290,166 | ) | (78,233 | ) | (59,410 | ) | (362,137 | ) | (290,166 | ) | (78,233 | ) | (59,410 | ) | ||||||||||||||||
Net realized (gain)/loss on investment in Berkeley Quantitative Colorado Fund LLC | — | — | — | 2,172,987 | — | — | — | 2,172,987 | ||||||||||||||||||||||||
Net unrealized (gain)/loss on investment in Berkeley Quantitative Colorado Fund LLC | — | — | — | (2,084,880 | ) | — | — | — | (2,084,880 | ) | ||||||||||||||||||||||
(Purchases) sales of: | ||||||||||||||||||||||||||||||||
Purchase of swap contracts | (9,600,000 | ) | — | — | — | |||||||||||||||||||||||||||
Sales of swap contracts | 4,341,257 | 10,362 | — | — | 20,694,866 | 10,362 | — | — | ||||||||||||||||||||||||
Sales of custom time deposits | 14,397,746 | 8,877,976 | 3,110,347 | 2,014,489 | 26,199,849 | 8,877,976 | 5,659,957 | 2,014,489 | ||||||||||||||||||||||||
Sales of U.S. Treasury securities | 6,027,702 | 12,612,900 | 1,302,165 | 2,693,512 | 6,027,702 | 12,612,900 | 1,302,165 | 2,693,512 | ||||||||||||||||||||||||
Sale (purchase) of Berkeley Quantitative Colorado Fund LLC | — | — | — | 6,182,737 | — | — | — | 6,182,737 | ||||||||||||||||||||||||
Increase and/or decrease in: | ||||||||||||||||||||||||||||||||
Receivable from futures commission merchants | 70,024,284 | (9,836,454 | ) | — | — | 71,095,325 | (17,951,575 | ) | — | — | ||||||||||||||||||||||
Change in control of ownership - trading companies | (32,918,537 | ) | (4,147,463 | ) | — | — | (51,747,039 | ) | (1,186,925 | ) | — | — | ||||||||||||||||||||
Investments in unconsolidated trading companies, at fair value | (15,660,783 | ) | 632,986 | 2,274,525 | (266,021 | ) | 2,604,968 | 243,627 | 3,029,814 | (545,298 | ) | |||||||||||||||||||||
Contributions to trading companies | 28,003,136 | 80,675,516 | — | — | 56,807,054 | 126,650,519 | — | — | ||||||||||||||||||||||||
Distributions from trading companies | (24,921,921 | ) | (72,990,346 | ) | — | — | (39,448,498 | ) | (127,498,438 | ) | — | — | ||||||||||||||||||||
Prepaid service fees - Class 1 | (612 | ) | — | — | — | (423 | ) | — | — | — | ||||||||||||||||||||||
Interest receivable | 83,217 | 207,419 | 13,440 | 25,492 | 83,074 | 339,415 | 13,417 | 49,699 | ||||||||||||||||||||||||
Receivable from related parties | (35,338 | ) | (46,426 | ) | (6,241 | ) | (10,598 | ) | 17,313 | — | — | — | ||||||||||||||||||||
Other assets | 34,251 | (19,591 | ) | — | (13,981 | ) | 34,251 | (21,234 | ) | — | (67,176 | ) | ||||||||||||||||||||
Incentive fees payable to Managing Owner | (527,306 | ) | 1,912,622 | — | 58,853 | (527,306 | ) | 2,073,529 | — | 7,136 | ||||||||||||||||||||||
Management fees payable to Managing Owner | (63,857 | ) | (54,547 | ) | (58,180 | ) | 11,931 | (100,845 | ) | (50,892 | ) | (57,543 | ) | 4,760 | ||||||||||||||||||
Interest payable to Managing Owner | (73,688 | ) | (59,149 | ) | (6,458 | ) | (13,707 | ) | (123,285 | ) | (56,192 | ) | (8,927 | ) | (17,634 | ) | ||||||||||||||||
Trading fees payable to Managing Owner | (35,263 | ) | (30,870 | ) | (2,431 | ) | (15,451 | ) | (53,247 | ) | (29,598 | ) | (3,376 | ) | (6,245 | ) | ||||||||||||||||
Service fees payable to Managing Owner | (94,147 | ) | (56,704 | ) | (11,221 | ) | (15,605 | ) | (130,289 | ) | (76,365 | ) | (12,469 | ) | (22,636 | ) | ||||||||||||||||
Payables to related parties | (1,490 | ) | (1,512 | ) | (47,535 | ) | 111 | 4,778 | 37,630 | (47,213 | ) | 18,229 | ||||||||||||||||||||
Other liabilities | 5,512 | 6,002 | — | 943 | 1,387 | (675 | ) | — | (229 | ) | ||||||||||||||||||||||
|
|
|
|
|
|
|
| |||||||||||||||||||||||||
Net cash provided by (used in) operating activities | 29,524,232 | 22,517,080 | 3,746,904 | 5,112,808 | 50,938,226 | 26,473,345 | 5,373,673 | 6,943,508 | ||||||||||||||||||||||||
|
|
|
|
|
|
|
| |||||||||||||||||||||||||
Cash Flows from Financing Activities: | ||||||||||||||||||||||||||||||||
Proceeds from sale of units | 176,309 | 2,256,421 | 8,725 | 18,031 | 234,538 | 2,644,851 | 12,067 | 26,014 | ||||||||||||||||||||||||
Payment for redemption of units | (32,289,908 | ) | (27,279,525 | ) | (4,076,861 | ) | (4,991,423 | ) | (53,244,347 | ) | (35,399,495 | ) | (5,594,062 | ) | (7,864,725 | ) | ||||||||||||||||
Pending owner additions | (15,282 | ) | (4,332 | ) | (457 | ) | (713 | ) | (20,031 | ) | (6,403 | ) | (582 | ) | (1,179 | ) | ||||||||||||||||
Owner redemptions payable | 239,273 | 339,456 | (18,946 | ) | (150,091 | ) | 418,418 | 216,938 | (25,021 | ) | 144,984 | |||||||||||||||||||||
|
|
|
|
|
|
|
| |||||||||||||||||||||||||
Net cash provided by (used in) financing activities | (31,889,608 | ) | (24,687,980 | ) | (4,087,539 | ) | (5,124,196 | ) | (52,611,422 | ) | (32,544,109 | ) | (5,607,598 | ) | (7,694,906 | ) | ||||||||||||||||
|
|
|
|
|
|
|
| |||||||||||||||||||||||||
Net increase (decrease) in cash and cash equivalents | (2,365,376 | ) | (2,170,900 | ) | (340,635 | ) | (11,388 | ) | (1,673,196 | ) | (6,070,764 | ) | (233,925 | ) | (751,398 | ) | ||||||||||||||||
Cash and cash equivalents, beginning of period | 4,111,855 | 9,758,138 | 664,310 | 1,352,378 | 4,111,855 | 9,758,138 | 664,310 | 1,352,378 | ||||||||||||||||||||||||
|
|
|
|
|
|
|
| |||||||||||||||||||||||||
Cash and cash equivalents, end of period | $ | 1,746,479 | $ | 7,587,238 | $ | 323,675 | $ | 1,340,990 | $ | 2,438,659 | $ | 3,687,374 | $ | 430,385 | $ | 600,980 | ||||||||||||||||
|
|
|
|
|
|
|
| |||||||||||||||||||||||||
| (1) | Formerly the Tiverton/Graham/Transtrend Series. |
The accompanying notes are an integral part of these financial statements.
The Series of the Frontier Fund
Statements of Cash Flows
For the SixNine Months Ended JuneSeptember 30, 2013 and 2012
(Unaudited)
| Winton Series | Frontier Heritage Series (1) | Winton Series | Frontier Heritage Series (1) | |||||||||||||||||||||||||||||
| 6/30/2013 | 6/30/2012 | 6/30/2013 | 6/30/2012 | 9/30/2013 | 9/30/2012 | 9/30/2013 | 9/30/2012 | |||||||||||||||||||||||||
Cash Flows from Operating Activities: | ||||||||||||||||||||||||||||||||
Net increase/(decrease) in capital resulting from operations | $ | 864,124 | $ | (3,093,237 | ) | $ | 895,036 | $ | (2,138,358 | ) | $ | 1,741 | $ | (2,983,827 | ) | $ | 467,865 | $ | (1,354,258 | ) | ||||||||||||
Adjustments to reconcile net increase/(decrease) in capital resulting from operations to net cash provided by (used in) operating activities: | ||||||||||||||||||||||||||||||||
Change in: | ||||||||||||||||||||||||||||||||
Net change in open trade equity, at fair value | — | — | — | — | — | — | — | — | ||||||||||||||||||||||||
Net change in ownership allocation of U.S. Treasury securities | (117,717 | ) | (342,280 | ) | (73,002 | ) | 337,466 | (117,717 | ) | (137,380 | ) | (73,002 | ) | 142,108 | ||||||||||||||||||
Net change in custom time deposits | (5,479,138 | ) | 266,609 | (3,230,118 | ) | 1,223,716 | (6,257,558 | ) | 1,658,699 | (2,059,790 | ) | (555,628 | ) | |||||||||||||||||||
Net change in ownership allocation of credit default swaps | — | (3,184 | ) | — | 722 | — | (3,184 | ) | — | 722 | ||||||||||||||||||||||
Net unrealized (gain)/loss on swap contracts | — | 7,291 | — | (943 | ) | — | 7,291 | — | (943 | ) | ||||||||||||||||||||||
Net realized (gain)/loss on swap contracts | — | 57,781 | — | 30,602 | — | 57,781 | — | 30,602 | ||||||||||||||||||||||||
Net unrealized (gain) loss on U.S. Treasury securities, at fair value | 123,411 | 174,630 | 54,398 | 77,637 | 123,411 | 193,198 | 54,398 | 85,821 | ||||||||||||||||||||||||
Net realized (gain) loss on U.S. Treasury securities, at fair value | (115,236 | ) | (90,903 | ) | (50,795 | ) | (40,172 | ) | | (115,236 | ) | (90,903 | ) | (50,795 | ) | (40,172 | ) | |||||||||||||||
(Purchases) sale of: | ||||||||||||||||||||||||||||||||
Sales of custom time deposits | 4,581,539 | 2,095,034 | 2,019,491 | 2,476,747 | 8,337,112 | 2,095,034 | 3,674,906 | 2,476,747 | ||||||||||||||||||||||||
Sales of U.S. Treasury Securities, at fair value | 1,918,089 | 4,077,744 | 845,472 | 1,806,127 | 1,918,089 | 4,077,744 | | 845,472 | | 1,806,127 | ||||||||||||||||||||||
Increase and/or decrease in: | ||||||||||||||||||||||||||||||||
Investments in unconsolidated trading companies, at fair value | 619,919 | (1,009,532 | ) | 3,511,706 | 266,141 | 153,336 | (2,288,507 | ) | 3,216,059 | 2,343,965 | ||||||||||||||||||||||
Interest receivable | 25,277 | 52,722 | 10,845 | 30,119 | 25,228 | 90,374 | 10,829 | 44,409 | ||||||||||||||||||||||||
Receivable from related parties | (44,110 | ) | — | (3,871 | ) | — | — | — | — | — | ||||||||||||||||||||||
Other assets | — | (17,710 | ) | — | (13,047 | ) | — | (55,933 | ) | — | (31,304 | ) | ||||||||||||||||||||
Management fees payable to Managing Owner | (364 | ) | (8,329 | ) | (39,621 | ) | (8,631 | ) | 875 | (6,162 | ) | (39,305 | ) | (35,782 | ) | |||||||||||||||||
Interest payable to Managing Owner | (4,778 | ) | (11,466 | ) | (5,529 | ) | (11,697 | ) | (7,317 | ) | (12,129 | ) | (8,775 | ) | (12,375 | ) | ||||||||||||||||
Trading fees payable to Managing Owner | (1,860 | ) | (3,996 | ) | (2,103 | ) | (4,308 | ) | (2,736 | ) | (4,268 | ) | (3,301 | ) | (4,563 | ) | ||||||||||||||||
Service fees payable to Managing Owner | (10,221 | ) | (8,491 | ) | (8,419 | ) | (11,300 | ) | (10,407 | ) | (12,076 | ) | (10,500 | ) | (13,837 | ) | ||||||||||||||||
Payables to related parties | (563 | ) | 95 | (317 | ) | (120 | ) | 1,507 | 77 | 544 | (342 | ) | ||||||||||||||||||||
Other liabilities | — | 1,737 | — | (514 | ) | — | 267 | — | (1,338 | ) | ||||||||||||||||||||||
|
|
|
|
|
|
|
| |||||||||||||||||||||||||
Net cash provided by (used in) operating activities | 2,358,372 | 2,144,515 | 3,923,173 | 4,020,187 | 4,050,328 | 2,586,096 | 6,024,605 | 4,879,959 | ||||||||||||||||||||||||
|
|
|
|
|
|
|
| |||||||||||||||||||||||||
Cash Flows from Financing Activities: | ||||||||||||||||||||||||||||||||
Proceeds from sale of units | 91,099 | 107,528 | 23,085 | 31,984 | 134,791 | 158,451 | 32,332 | 47,245 | ||||||||||||||||||||||||
Payment for redemption of units | (3,054,563 | ) | (2,252,999 | ) | (4,188,525 | ) | (4,344,915 | ) | (4,717,899 | ) | (3,781,990 | ) | (6,247,787 | ) | (5,629,301 | ) | ||||||||||||||||
Pending owner additions | (1,512 | ) | (2,296 | ) | (964 | ) | (833 | ) | (1,764 | ) | (2,766 | ) | (1,244 | ) | (1,043 | ) | ||||||||||||||||
Owner redemptions payable | (22,467 | ) | 99,030 | (10,804 | ) | 27,306 | 143,303 | 15,090 | 2,974 | 48,319 | ||||||||||||||||||||||
|
|
|
|
|
|
|
| |||||||||||||||||||||||||
Net cash provided by (used in) financing activities | (2,987,443 | ) | (2,048,737 | ) | (4,177,208 | ) | (4,286,458 | ) | (4,441,569 | ) | (3,611,215 | ) | (6,213,725 | ) | (5,534,780 | ) | ||||||||||||||||
|
|
|
|
|
|
|
| |||||||||||||||||||||||||
Net increase (decrease) in cash and cash equivalents | (629,071 | ) | 95,778 | (254,035 | ) | (266,271 | ) | (391,241 | ) | (1,025,119 | ) | (189,120 | ) | (654,821 | ) | |||||||||||||||||
Cash and cash equivalents, beginning of period | 1,249,455 | 2,051,272 | 536,159 | 1,156,042 | 1,249,455 | 2,051,272 | 536,159 | 1,156,042 | ||||||||||||||||||||||||
|
|
|
|
|
|
|
| |||||||||||||||||||||||||
Cash and cash equivalents, end of period | $ | 620,384 | $ | 2,147,050 | $ | 282,124 | $ | 889,771 | $ | 858,214 | $ | 1,026,153 | $ | 347,039 | $ | 501,221 | ||||||||||||||||
|
|
|
|
|
|
|
| |||||||||||||||||||||||||
| (1) | Formerly the Winton/Graham Series. |
The accompanying notes are an integral part of these financial statements.
The Series of the Frontier Fund
Notes to Financial Statements (Unaudited)
1. Organization and Purpose
The Frontier Fund, which is referred to in this report as the “Trust”, was formed on August 8, 2003, as a Delaware statutory trust. Please refer to the consolidated financial statements of the Trust included within this quarterly report. The Trust is a multi-advisor commodity pool, as described in Commodity Futures Trading Commission (the “CFTC”) Regulation § 4.10(d)(2). The Trust has authority to issue separate series, or each, a Series, of units of beneficial interest (the “Units”) pursuant to the requirements of the Delaware Statutory Trust Act, as amended (the “Trust Act”). The assets of each Series are valued and accounted for separately from the assets of other Series. The Trust is not registered as an investment company under the Investment Company Act of 1940, as amended (the “Investment Company Act”). It is managed by its Managing Owner, Equinox Fund Management, LLC.
Purchasers of Units are limited owners of the Trust (“Limited Owners”) with respect to beneficial interests of the Series’ Units purchased. The Trust Act provides that, except as otherwise provided in the amended and restated declaration of trust and trust agreement dated August 8, 2003, by and among the Managing Owner, Wilmington Trust Company as trustee and the unitholders from time to time (the “Trust Agreement”), unitholders in a Delaware statutory trust will have the same limitation of liability as do stockholders of private corporations organized under the General Corporation Law of the State of Delaware. The Trust Agreement confers substantially the same limited liability, and contains the same limited exceptions thereto, as would a limited partnership agreement for a Delaware limited partnership engaged in like transactions as the Trust. In addition, pursuant to the Trust Agreement, the Managing Owner of the Trust is liable for obligations of a Series in excess of that Series’ assets. Limited Owners do not have any such liability. The Managing Owner will make contributions to the Series of the Trust necessary to maintain at least a 1% interest in the aggregate capital, profits and losses of the combined Series of the Trust.
The Trust, in relation to the Series, has been organized to pool assets of investor funds for the purpose of trading in the United States (“U.S.”) and international markets for currencies, interest rates, stock indices, agricultural and energy products, precious and base metals and other commodities. The Trust, in relation to the Series, may also engage in futures contracts, forwards, option contracts and other interest in derivative instruments, including swap contracts (“Swaps”).
The Trust has seven (7) separate and distinct Series of Units issued and outstanding: Frontier Diversified Series, Frontier Masters Series, Balanced Series, Frontier Long/Short Commodity Series, Frontier Select Series (formerly Tiverton/Graham/Transtrend Series), Winton Series, and Frontier Heritage Series (formerly Winton/Graham Series) (each a “Series” and collectively, the “Series”). The Currency Series ceased trading on April 18, 2013. The Trust, with respect to the Series, may issue additional Series of Units.
The Trust, with respect to each Series:
engages in the speculative trading of a diversified portfolio of futures, forward (including interbank foreign currencies), options contracts and other derivative instruments (including swap contracts), and may, from time to time, engage in cash and spot transactions;
allocates funds to a limited liability trading company or companies (“Trading Company”). Except as otherwise described in these notes, each Trading Company has one-year renewable contracts with its own independent commodity trading advisor(s), or each, a Trading Advisor, that will manage all or a portion of such Trading Company’s assets and make the trading decisions for the assets of each Series vested in such Trading Company. Each Trading Company will segregate its assets from any other Trading Company;
maintains separate, distinct records for each Series, and accounts for the assets of each Series separately from the other Series;
calculates the Net Asset Value (“NAV”) of its Units for each Series separately from the other Series;
has an investment objective of increasing the value of each Series’ Units over the long term (capital appreciation), while controlling risk and volatility; further, to offer exposure to the investment programs of individual Trading Advisors and to specific instruments (currencies);
maintains each Series of Units in three or six sub-classes—Class 1, Class 1a, Class 2, Class 2a, Class 3, and Class 3a. Investors who have purchased Class 1 or Class 1a Units of any Series are charged a service fee of up to three percent (3.0%) annually of the NAV of each Unit purchased, for the benefit of Selling Agents selling such Class 1 or Class 1a Units. The initial service fee, which is amortized monthly at an annual rate of up to three percent (3.0%) of the average daily NAV of Class 1 or Class 1 a1a of such Series, is prepaid to Equinox Fund Management, LLC (the “Managing Owner”) by each Series, and paid to the selling agents by the Managing Owner in the month following sale; provided, however, that investors who redeem all or a portion of their Class 1 or Class 1 a1a Units of any Series during the first twelve (12) months following the effective date of their purchase are subject to a redemption fee of up to three percent (3.0%) of the NAV at which such investor redeemed to reimburse the Managing Owner for the then-unamortized balance of the prepaid initial service fee. With respect to Class 2 and Class 2a Units of any Series, the Managing Owner pays an ongoing service fee to Selling Agents of up to one half percent (0.5%) annually of the NAV of each Class 2 or Class 2a Unit (of which 0.25% will
following the effective date of their purchase are subject to a redemption fee of up to three percent (3.0%) of the NAV at which such investor redeemed to reimburse the Managing Owner for the then-unamortized balance of the prepaid initial service fee. With respect to Class 2 and Class 2a Units of any Series, the Managing Owner pays an ongoing service fee to Selling Agents of up to one half percent (0.5%) annually of the NAV of each Class 2 or Class 2a Unit (of which 0.25% will be charged to Limited Owners holding Class 2 Units of the Frontier Diversified Series and Frontier Masters Series or Class 2a Units of the Frontier Long/Short Commodity Series) sold until such Class 2 or Class 2a Units which are subject to the fee limitation are reclassified as Class 3 or Class 3a Units of the applicable Series. The Managing Owner may also pay Selling Agents certain additional fees and expenses for administrative and other services rendered and expenses incurred by such Selling Agents; and |
all payments made to Selling Agents who are members of the Financial Industry Regulatory Authority, Inc. (“FINRA”) and their associated persons that constitute underwriting compensation will be subject to the limitations set forth in Rule 2310(b)(4)(B)(ii) (formerly Rule 281 0(b)2810(b)(4)(B)(ii)) of the Conduct Rules of FINRA (“Rule 2310”). An investor’s Class 1 Units or Class 2 Units of any Series, or Class 1a Units or Class 2a Units of the Frontier Long/Short Commodity Series or Balanced Series will be classified as Class 3 or Class 3a Units of such Series, as applicable, when the Managing Owner determines that the fee limitation set forth in Rule 2310 with respect to such Units has been reached or will be reached. No service fees are paid with respect to Class 3 or Class 3a Units. Units of any Class in a Series may be redeemed, in whole or in part, on a daily basis, at the then current NAV per Unit for such Series on the day of the week after the date the Managing Owner is in receipt of a redemption request for at least one (1) Business Day to be received by the Managing Owner prior to 4:00 PM in New York.
The assets of any particular Series include only those funds and other assets that are paid to, held by or distributed to the Trust, with respect to the Series, on account of and for the benefit of that Series. Under the “Inter-Series Limitation on Liability” expressly provided for under Section 3804(a) of the Trust Act, separate and distinct records of the cash and equivalents, although pooled for maximizing returns, is maintained in the books and records of each Series.
As of JuneSeptember 30, 2013, the Trust, with respect to the Frontier Diversified Series, Frontier Masters Series, Frontier Select Series (formerly Tiverton/Graham/Transtrend Series), Winton Series and Frontier Heritage Series (formerly Winton/Graham Series) separates Units into three separate Classes—Class 1, Class 2, and Class 3. The Trust, with respect to the Balanced Series and the Frontier Long/Short Commodity Series separates Units into six separate Classes—Class 1, Class 2, Class 3, Class 1a, Class 2a and Class 3a. It is expected that between 10% and 30% of each Series’ assets normally will be invested in one or more Trading Companies to be committed as margin for trading positions, but from time to time these percentages may be substantially more or less. The remainders of each Series’ assets are maintained at the Trust level for cash management. Each of the respective Series has invested monies into pooled cash management assets which have included purchases of certificates of deposit and custom time deposits. Each Series’ ownership in these investments is based on its percentage ownership in the pooled cash management assets on the reporting date.
As of JuneSeptember 30, 2013, Winton Series has invested a portion of its assets in a single Trading Company, and a single Trading Advisor manages 100% of the assets invested in such Trading Company. Each of the Frontier Diversified Series, Frontier Masters Series, Frontier Long/Short Commodity Series, Balanced Series, Frontier Select Series (formerly Tiverton/Graham/Transtrend Series), and Frontier Heritage Series (formerly Winton/Graham Series) has invested a portion of its assets in several different Trading Companies and one or more Trading Advisors may manage the assets invested in such Trading Companies.
In November 2010, the Frontier Select Series (formerly Tiverton/Graham/Transtrend Series) invested a portion of its assets in Berkeley Quantitative Colorado Fund LLC, an unaffiliated company, managed by an affiliate of Berkeley Quantitative L.P. Through this investment, Berkeley Quantitative L.P. became a commodity trading advisor to the Series. This investment was liquidated on March 20, 2012.
During July 2012, Frontier Long/Short Commodity Series Class 1 Units and Balanced Series Class 1a Units ceased Trading Operations and all remaining Units were exchanged for Class 3 Units and Class 3a Units, respectively.
The Trust has entered into agreements, which provide for the indemnification of futures clearing brokers, currency trading companies, and commodity trading advisers, among others, against losses, costs, claims and liabilities arising from the performance of their individual obligations under such agreements, except for gross negligence or bad faith.
2. Significant Accounting Policies
The following are the significant accounting policies of the Series of the Trust.
Basis of Presentation—The Series of the Trust follow U.S. Generally Accepted Accounting Principles (“GAAP”), as established by the Financial Accounting Standards Board (the “FASB”), to ensure consistent reporting of financial condition, condensed schedules of investments, results of operations, changes in capital and cash flows.
These financial statements should be read in conjunction with the audited financial statements and notes thereto included in our 2012 Annual Report on Form 10-K as filed with the SEC.
Consolidation—The Series, through investing in the Trading Companies, authorize certain Trading Advisors to place trades and manage assets at pre-determined investment levels. The Trading Companies were organized by the Managing Owner for the purpose of investing in commodities interests and derivative instruments, and have no operating income or expenses, except for trading income and expenses, all of which is allocated to the Series. Trading Companies in which a Series has a controlling and majority equity interest are consolidated by such Series. Investments in Trading Companies in which a Series does not have a controlling and majority
interest are accounted for under the equity method, which approximates fair value. Fair value represents the proportionate share of the Series interest in the NAV in a Trading Company. The equity interest held by Series of the Trust is shown as investments in unconsolidated trading companies in the statements of financial condition. The income or loss attributable thereto in proportion of investment level is shown in the statements of operations as change in fair value of investments in unconsolidated trading companies.
The consolidated financial statements of the Balanced Series include the assets, liabilities and earnings of its majority-controlled Trading Companies;trading companies; Frontier Trading Company I LLC and Frontier Trading Company IX, LLC and the assets and liabilities of its majority owned Trading Companies, and the earnings of Frontier Trading Company XXIII, LLC from July 11, 2012 to March 12, 2013 and from April 29, 2013 to September 30, 2013 and the earnings of Frontier Trading Company XXXIV, LLC from July 31, 2013 to September 30, 2013. Also included in the consolidated financial statements were the earnings of its majority controlled trading company, Frontier Trading Company XVIII, LLC from January 1, 2011 through May 14, 2012, the earnings from Frontier Trading Company XIV, LLC from January 1, 2013 through May 16, 2013, the earnings from Frontier Trading Company XV, LLC from January 1, 2012 through JuneSeptember 30, 2012, and the earnings from Frontier Trading Company XVII, LLC from January 1, 2013 through April 18, 2013 and the earnings from Frontier Trading Company XXIII, LLC from April 29, 2013 through June 30, 2013. Multiple Series have investment interests in Frontier Trading Company I LLC. The Managing Owner assigns the full ownership and earnings of that swap identified in footnote four as Option/Swap with Societe Generale, owned by Frontier Trading Company I LLC, to the Balanced Series.
The consolidated financial statements of the Frontier Long/Short Commodity Series include the assets, liabilities and earnings of its majority controlled trading companies; Frontier Trading Company VII, LLC, from September 28, 2011 to JuneSeptember 30, 2013, and Frontier Trading Company XVIII, LLC from May 15, 2012 through JuneSeptember 30, 2013, and Frontier Trading Company XXXVII, LLC from July 31, 2013 through September 30, 2013.
The consolidated financial statements of the Frontier Masters Series include the assets, liabilities and earnings of its majority owned trading company, Frontier Trading Company XXI, LLC (earnings from March 1, 2011 through December 28, 2012). The consolidated financial statements of the Frontier Diversified Series include the assets, liabilities and earnings of its majority owned trading company, Frontier Trading Company V, LLC (earnings from March 9, 2013 through June 30, 2013).
The consolidated financial statements of the Frontier Diversified Series include the assets, liabilities and earnings of its majority owned trading company, Frontier Trading Company V, LLC (earnings from March 9, 2013 through JuneAugust 26, 2013 (Closed)) and Frontier Trading Company XXXV, LLC from July 31, 2013 through September 30, 2013).2013.
Investment in Berkeley Quantitative Colorado Fund LLC—The Frontier Select Series (formerly Tiverton/Graham/Transtrend Series) had an investment in the Berkeley Quantitative Colorado Fund LLC. The Berkeley Quantitative Colorado Fund LLC began operations on November 1, 2010 and was liquidated on March 20, 2012. The Berkeley Quantitative Colorado Fund LLC was not consolidated into the financial statements of the Frontier Select Series (formerly Tiverton/Graham/Transtrend Series) because the Trust had no control or transparency over the operations of the trading company. This investment was shown on the statements of financial condition with the change in fair value shown in net unrealized gain/(loss) on the Berkeley Quantitative Colorado Fund LLC. This investment was liquidated on March 20, 2012.
Use of Estimates—The preparation of financial statements in conformity with GAAP may require the Managing Owner to make estimates and assumptions that affect the reported amounts of assets and liabilities and disclosure of contingent assets and liabilities at the date of the financial statements and the reported amounts of revenue and expenses during the reporting period. The valuation of swap contracts requires significant estimates as well as the valuation of certain other investments. Please refer to Note 3 for discussion of valuation methodology. Actual results could differ from these estimates, and such differences could be material.
Cash and Cash Equivalents—Cash and cash equivalents include cash and overnight investments in interest-bearing demand deposits held at banks with original maturities of three months or less.
Interest Income—Aggregate interest income from all sources, including U.S. Treasuries, custom time deposits and assets held at Futures Commission Merchants (“FCM”), up to two percentage points of the aggregate percentage yield (annualized) is paid to the Managing Owner by the Balanced Series (Class 1 and Class 2 only), Frontier Select Series (formerly Tiverton/Graham/Transtrend Series), Winton Series and Frontier Heritage Series.Series (formerly Winton/Graham Series). For the Frontier Diversified Series, Frontier Long/Short Commodity Series, Frontier Masters Series and Balanced Series (Class 1a, Class 2a and Class 3a only), 20% of the total interest allocated to each Series is paid to the Managing Owner. All interest not paid to the Managing Owner is interest income to the Series.
U.S. Treasury Securities, custom time deposits and certain demand deposits are pooled for purposes of maximizing returns on these assets to investors of all Series. Interest income from pooled cash management assets is recognized on the accrual basis and allocated daily to each Series based upon its daily proportion of ownership of the pool. All U.S. Treasury Securities have been liquidated as of JuneSeptember 30, 2013.
U.S. Treasury Securities—U.S. Treasury Securities were allocated to all Series of the Trust based on each Series’ percentage ownership in the pooled cash management assets as of the reporting date. They were reported at fair value as Level 1 inputs under ASC 820,Fair Value Measurements and Disclosures (“ASC 820”). The Series of the Trust valued U.S. Treasury Securities at fair value and recorded the daily change in value in the statements of operations as net unrealized gain/(loss) on U.S. Treasury securities. Accrued interest was reported on the statements of financial condition as interest receivable.
Custom Time Deposits—Custom time deposits are structured deposit agreements with U.S. Bank National Association that earn a guaranteed fixed interest rate 3.75%, mature nine months from the deposit date and are subject to automatic six-month rollovers through October 2015.2013. Custom time deposits were purchased on April 1, 2010, September 15, 2009, October 21, 2008 and
October 30, 2008. Interest is paid monthly or at least every nine months. Unscheduled withdrawals will be subject to certain penalties and other costs of up to 1.0% of the amount deposited if withdrawn within the first nine months from the deposit date. The withdrawal fee is set at 0.225% for the period from nine months to one year subsequent to the deposit date and decreases by .05%..05% increments for each year thereafter through the maturity date. In May 2011, July 2011, August 2011, January 2012, October 2012, November 2012, April 2013, June 2013, July 2013 and JuneAugust 2013, the Trust, with respect to the Series, redeemed approximately $25 million, $25 million, $50 million, $25 million, $16 million, $5 million, $35 million, $20 million and $35$15 million, respectively, in custom time deposits held with U.S. Bank N.A which represented a full liquidation of the 2.17% investment tranche and an additional $65$100 million of the 3.75% tranche. Custom time deposits are allocated to each Series based on their percentage ownership in the pooled cash management assets as of the reporting date. The Series of the Trust values the custom time deposits at face value plus accrued interest as it is considered a deposit account under paragraph 7.50 of theInvestment Company Audit Guide, and accordingly, this deposit is not subject to ASC 820.
Credit Default Swaps—The Series of the Trust invested in credit default swaps for the purpose of mitigating part of the risk of concentration of deposits with U.S. Bank National Association to other major financial institutions. See Note 4. Credit Default Swaps were allocated to each Series based on their percentage ownership in the pooled cash management assets as of the reporting date. Credit Default Swaps were reported at fair value based upon counterparty value per the valuation policy. The Series of the Trust recorded the daily change in fair value in the statements of operations as net unrealized gain/(loss) on swap contracts. All Credit Default Swaps expired during March 2012.
Receivable From Futures Commission Merchants—The Series of the Trust deposits assets with a FCM subject to CFTC regulations and various exchange and broker requirements. Margin requirements are satisfied by the deposit of cash with such FCM. The Trust, with respect to the Series, earns interest income on its assets deposited with the FCM.
Investment Transactions—Futures, options on futures, forward and swap contracts are recorded on a trade date basis and realized gains or losses are recognized when contracts are settled. Unrealized gains or losses on open contracts (the difference between contract trade price and market price) are reported in the statements of financial condition as a net change in open trade equity (deficit) as there exists a right of offset of unrealized gains or losses in accordance with ASC 210,Balance Sheet (“ASC 210”).
Any change in net unrealized gain or loss from the preceding period is reported in the statements of operations. Fair value of exchange-traded contracts is based upon exchange settlement prices. Fair value of non-exchange-traded contracts is based on third party quoted dealer values on the interbank market. For U.S. Treasury securities, interest is recognized in the period earned and the instruments are marked-to-market daily based on third party information. Custom time deposits are valued at face value plus accrued interest and the interest income is recognized in the period earned. Transaction costs are recognized as incurred and reflected separately in the statements of operations.
Foreign currency transactions—The Series’ functional currency is the U.S. dollar, however, they transact business in currencies other than the U.S. dollar. The Series do not isolate that portion of the results of operations resulting from changes in foreign exchange rates on investments from fluctuations arising from changes in market prices of securities held. Such fluctuations are included with the net realized or unrealized gain or loss from investments.
Allocation of Earnings—Each Series of the Trust maintainsmay maintain three or six classes of Units—Class 1, Class 2, Class 3, Class 1a, Class 2a and Class 3a). All classes have identical voting, dividend, liquidation and other rights and the same terms and conditions, except that fees charged to a Class or Series differ as described below. Revenues, expenses (other than expenses attributable to a specific class), and realized and unrealized trading gains and losses of each Series are allocated daily to Class 1, Class 1a, Class 2, Class 2a, Class 3 and Class 3a Units based on each Class’ respective owners’ capital balances as applicable to the classes maintained by the Series.
Each Series allocates funds to an affiliated Trading Company, or Companies, of the Trust. Each Trading Company allocates all of its daily trading gains or losses to the Series in proportion to each Series’ ownership trading level interest in the Trading Company, adjusted on a daily basis (except for Trading Advisors and other investments such as swapSwaps that are directly allocated to a specific series). The value of all open contracts and cash held at clearing brokers is similarly allocated to the Series in proportion to each Series’ funds allocated to the Trading Company, or Companies.
Payments by the Managing Owner—The Managing Owner may make discretionary payments to a Series related to a variety of factors, including investment losses to reimburse the effect of a loss on a portfolio investment which has been caused by a situation outside the Trust’s, or it’s affiliates’, direct control. Such payments will be made on a discretionary basis and will be disclosed in the statement of operations as a net increase from payments by managing owner. These payments are in accordance with the Trust agreement on a discretionary basis as determined by the Managing Owner.
Investments and Swaps—The Trust, with respect to the Series, records investment transactions on a trade date basis and all investments are recorded at fair value, with changes in fair value reported as a component of realized and unrealized gains/(losses) on investments in the statements of operations. Certain Series of the Trust strategically invest a portion or all of their assets in total return Swaps, selected at the discretion of the Managing Owner. Swaps are privately negotiated contracts designed to provide investment returns linked to those produced by one or more underlying investment products or indices. In a typical Swap, two parties agree to exchange the returns (or differentials in rates of return) earned or realized on one or more particular predetermined investmentinvestments or instrument.instruments. The gross returns to be exchanged or “swapped” between the parties are calculated with respect to a “notional amount”
(i.e. (i.e., the amount of value of the underlying asset used in computing the particular interest rate, return, or other amount to be exchanged) in a particular investment, or in a “basket” of securities. The valuation of swap contracts requires significant estimates. Swap contracts are reported utilizing Level 3 Inputs. The significant unobservable inputs used in the fair value measurement of the Trust, with respect to the Series’ Swap contracts are asset liquidity, debt valuation, credit risk, volatility, market risk, distributions, dividends, risk premiums, and other risk management tools. Significant increases (decreases) in any of those inputs in isolation would result in a significantly lower (higher) fair value measurement. Swap Contracts are reported at fair value based upon a weekly indicative value that is calculated by management using bid/ask prices from the counterparty. This fair value is corroborated by valuations provided by a third party pricing service on a daily basis. The third party pricing service utilizes a Black Scholes pricing model with input adjustments factoring in volatility and liquidity of the instruments. All valuation processes are monitored by the valuation committee of the Managing Owner.
Income Taxes—The Trust, with respect to the Series, applies the provisions of ASC 740Income Taxes(“ASC 740”), which provides guidance for how uncertain tax positions should be recognized, measured, presented and disclosed in the financial statements. This interpretation also provides guidance on derecognition, classification, interest and penalties, accounting in interim periods and disclosure. ASC 740 requires the evaluation of tax positions taken or expected to be taken in the course of preparing the Trust, with respect to the Series’, financial statements to determine whether the tax positions are “more-likely-than-not” of being sustained by the applicable tax authority. Tax positions with respect to tax at the Trust’s level not deemed to meet the “more-likely-than-not” threshold would be recorded as a tax benefit or expense in the current year. The Managing Owner has concluded there is no tax expense, interest or penalties to be recorded by the Trust, with respect to the Series. The 2009 through 2012 tax years generally remain subject to examination by U.S. federal and most state tax authorities.
In the opinion of the Managing Owner, (i) the Trust, with respect to the Series, is treated as a partnership for Federal income tax purposes and, assuming that at least 90% of the gross income of the Trust constitutes “qualifying income” within the meaning of Section 7704(d) of the Code, the Trust is not a publicly traded partnership treated as a corporation, and (ii) the discussion set forth in the Prospectus under the heading “Federal Income Tax Consequences” correctly summarizes the material Federal income tax consequences as of the date of the Prospectus to potential U.S. Limited Owners of the purchase, ownership and disposition of Units of the Trust.
Fees and Expenses—All management fees, incentive fees, service fees and trading fees of the Trust, with respect to the Series, are paid to the Managing Owner. It is the responsibility of the Managing Owner to pay all Trading Advisor management and incentive fees, Selling Agent Service fees and all other operating expenses and continuing offering costs of the Trust, with respect to the Series.
Service Fees—The Trust maintainsmay maintain each Series of Units in three or six sub-classes—Class 1, Class 1a, Class 2, Class 2a, Class 3, and Class 3a. Investors who have purchased Class 1 or Class 1a Units of any Series are charged a service fee of up to three percent (3.0%) annually of the NAV of each Unit purchased, for the benefit of selling agents selling such Class 1 or Class 1a Units. The initial service fee, which is amortized monthly at an annual rate of up to three percent (3.0%) of the average daily NAV of Class 1 or Class 1a of such Series, is prepaid to the Managing Owner by each Series, and paid to the selling agents by the Managing Owner in the month following sale; provided, however, that investors who redeem all or a portion of their Class 1 or Class 1a Units of any Series during the first twelve (12) months following the effective date of their purchase are subject to a redemption fee of up to three percent (3.0%) of the NAV at which such investor redeemed to reimburse the Managing Owner for the then-unamortized balance of the prepaid initial service fee. With respect to Class 2 and Class 2a Units of any Series, the Managing Owner pays an ongoing service fee to Selling Agents of up to one half percent (0.5%) annually of the NAV of each Class 2 or Class 2a Unit (of which 0.25% will be charged to Limited Owners holding Class 2 Units of the Frontier Diversified Series and Frontier Masters Series or Class 2a Units of the Frontier Long/Short Commodity Series) sold until such Class 2 or Class 2a Units which are subject to the fee limitation are reclassified as Class 3 or Class 3a Units of the applicable Series for administrative purposes. The Managing Owner may also pay Selling Agents certain additional fees and expenses for administrative and other services rendered and expenses incurred by such Selling Agents.
These service fees are part of the offering costs of the Trust, with respect to the Series, which include registration and filing fees, legal and blue sky expenses, accounting and audit, printing, marketing support and other offering costs which are bornborne by the Managing Owner. With respect to the service fees, the initial service fee (for the first 12 months) relating to a purchase of Class 1 and Class 1a Units by an investor is prepaid by the Managing Owner to the relevant selling agent in the month following such purchase and is reimbursed for such payment by the Series monthly in arrears in an amount based upon a corresponding percentage of NAV, calculated daily. Consequently, the Managing Owner bears the risk of the downside and the benefit of the upside potential of any difference between the amount of the initial service fee prepaid by it and the amount of the reimbursement thereof, which may result from variations in NAV over the following 12 months.
Pending Owner Additions—Funds received for new subscriptions and for additions to existing owner interests are recorded as capital additions at the NAV per unit of the second business day following receipt.
Recently Issued Accounting Pronouncements—In June of 2013, FASB issued ASU 2013-08 to (i) modify Topic 946 for determining whether an entity is an investment company; (ii) update the measurement requirements for noncontrolling interests in other investment companies; and (iii) require additional disclosures for investment companies under U.S. GAAP. This guidance is effective
for annual and interim periods beginning on or after December 15, 2013. An entity should provide the disclosures required by those amendments retrospectively for all comparative periods presented. The adoption of this guidance is not expected to have a material impact on the financial positions or results of operations.
Recently Adopted Accounting Pronouncements —In December of 2011, FASB issued new guidance that requires an entity to disclose information about offsetting and related arrangements to enable users of its financial statements to understand the effect of those arrangements on its financial position. FASB issued additional clarification to specify that the guidance applies only to derivatives, repurchase agreements and reverse repurchase agreements, and securities borrowing and securities lending transactions that are either offset in accordance with specific criteria of the Codification or subject to a master netting arrangement or similar agreement. This guidance is effective for annual and interim periods beginning on or after January 1, 2013. An entity should provide the disclosures required by those amendments retrospectively for all comparative periods presented. The adoption of this guidance is not expected to have a material impact on the Series financial position or results of operations and is disclosed in Note 8.
Subsequent Events—The Trust, with respect to the Series, follows the provisions of ASC 855,Subsequent Events, which establishes general standards of accounting for and disclosure of events that occur after the balance sheet date and up through the date the financial statements are issued. Refer to Note 11.
3. Fair Value Measurements
In connection with the valuation of investments the Series apply ASC 820,Fair Value Measurement (“ASC 820”). ASC 820 provides clarification that when a quoted price in an active market for the identical asset or liability is not available, a reporting entity is required to measure fair value using certain techniques. ASC 820 also clarifies that when estimating the fair value of an asset or liability, a reporting entity is not required to include a separate input or adjustment to other inputs relating to the existence of a restriction that prevents the transfer of an asset or liability. ASC 820 also clarifies that both a quoted price in an active market for the identical asset or liability at the measurement date and the quoted price for the identical asset or liability when traded as an asset in an active market when no adjustments to the quoted price of the asset are required are Level 1 fair value measurements.
Level 1 Inputs
Unadjusted quoted prices in active markets for identical financial assets that the reporting entity has the ability to access at the measurement date.
Level 2 Inputs
Inputs other than quoted prices included in Level 1 that are observable for the financial asset or liabilities, either directly or indirectly. These might include quoted prices for similar financial assets in active markets, quoted prices for identical or similar financial assets in markets that are not active, inputs other than quoted prices that are observable for the financial asset or inputs that are derived principally from or corroborated by market data by correlation or other means.
Level 3 Inputs
Unobservable inputs for determining the fair value of financial assets that reflect an entity’s own assumptions about the assumptions that market participants would use in pricing the financial asset.
The Trust, with respect to the Series, uses the following methodologies to value instruments within its financial asset portfolio at fair value:
Trading Securities.These instruments include U.S. Treasury securities and open trade equity positions (futures contracts) that are actively traded on public markets with quoted pricing for corroboration. U.S. Treasury securities and futures contracts, are reported at fair value using Level 1 inputs. Trading securities instruments further include open trade equity positions (trading options and currency forwards) that are quoted prices for identical or similar assets that are not traded on active markets. Trading options and currency forwards are reported at fair value using Level 2 inputs.
Swap Contracts. Certain Series of the Trust strategically invest a portion or all of their assets in total return Swaps, selected at the direction of the Managing Owner. Swaps are privately negotiated contracts designed to provide investment returns linked to those produced by one or more investment products or indices. In a typical Swap, two parties agree to exchange the returns (or differentials in rates of return) earned or realized on one or more particular predetermined investments or instruments. The gross returns to be exchanged or “swapped” between the parties are calculated with respect to a “notional amount” (i.e., the amount of value of the underlying asset used in computing the particular interest rate, return, or other amount to be exchanged) in a particular investment, or in a “basket” of securities. Swap contracts are reported at fair value basis upon daily reports from the counterparty. The valuation requires significant estimates utilizing Level 3 inputs, corroborated by management through the use of a third party pricing service (“pricing service”). The pricing service, utilizing proprietary model-intensive methodologies, selects and implements the pricing model appropriate for each swap valuation. The pricing service does not provide detail of the pricing model to management. The Managing Owner engages, via inquiry and review of methodology documentation, with the service provider to gain an understanding of the valuation model selected;selected, the components of the model, both observable and unobservable; and quality control testing procedures in place. The pricing service’s methodology includes performance of
tolerance testing on its valuation models to ensure consistency and reasonableness of the values derived. The tolerance testing includes valuing the components of the product separately, i.e. underlying asset, volatility, financing rates, and so forth. The tolerance testing is part of the initial valuation setup and throughout the ongoing daily valuation process. The pricing service also has several layers of quality control including: engineering / reverse engineering process to understand each swapSwap and its’ subcomponent parts fully; comparative analysis against other valuations performed with similar composition and characteristics; review of output valuation against expectations based on observable price movements of underlying futures; and lastly, periodic review by senior a financial engineer to ensure the design and function of the model is stable and performperforms as expected.
The Managing Owner has chartered a valuation committee to provide oversight of the valuation process for the Series. The valuation committee meets at least monthly to discuss the valuation process and any valuation issues that may arise. The valuation committee is comprised of senior members of the Managing Owner’s management team with varying areas of expertise that add value to the committee. The valuation committee reports to both the Managing Owner’s Investment Oversight and Risk Committee and the Trust’s Executive Committee. The committee further remains in communication with the Managing Owner’s Due Diligence Committee that provides ongoing counterparty risk monitoring of the swap counterparties. The committee monitors daily pricing provided by the swap counterparty and daily valuation provided by the third party pricing service. The Valuationvaluation committee may request a price challenge if the daily valuation provided by the counterparty valuations differs significantly from the valuation obtained by the pricing service. The Managing Owner’s valuation committee monitors some additional input factors such as liquidity, volatility, and counterparty risk in order to further review the valuations provideprovided by the pricing service.
Investment in Unconsolidated Trading Companies. This investment represents the fair value of the allocation of cash, futures, forwards, options and swaps to each respective Series relative to its trading allocations from unconsolidated Trading Companies. The Series may redeem their investment in the trading companies on a daily basis at the stated net asset value and therefore the inputs qualify for Level 2. However, as the Series, under the same management as the Trading Companies, have access to the underlying positions of the Trading Companies, the level determination isare reflected on that basis. As such, the Series report investments in unconsolidated Trading Companies at fair value using the corresponding inputs of the underlying securities of the Trading Companies which results in the Series reporting the corresponding Level determination from the inputs of the Trading Company.
The following table summarizes the instruments that comprise the Trust, with respect to the Series, financial asset portfolio, by Series, measured at fair value on a recurring basis as of JuneSeptember 30, 2013 and December 31, 2012, segregated by the level of valuation inputs within the fair value hierarchy utilized to measure fair value:
June 30, 2013 | Level 1 Inputs | Level 2 Inputs | Level 3 Inputs | Total Fair Value | ||||||||||||||||||||||||||||
September 30, 2013 | Level 1 Inputs | Level 2 Inputs | Level 3 Inputs | Total Fair Value | ||||||||||||||||||||||||||||
Frontier Diversified Series | ||||||||||||||||||||||||||||||||
Investment in Unconsolidated Trading Companies | $ | 36,421,672 | $ | 455,536 | $ | 630,454 | $ | 37,507,662 | $ | 19,392,371 | $ | 571,967 | $ | — | $ | 19,964,338 | ||||||||||||||||
Swap Contracts | — | — | 2,413,658 | 2,413,658 | ||||||||||||||||||||||||||||
Frontier Masters Series | ||||||||||||||||||||||||||||||||
Investment in Unconsolidated Trading Companies | 11,676,330 | 1,315,474 | — | 12,991,804 | 8,512,459 | 414,819 | — | 8,927,278 | ||||||||||||||||||||||||
Frontier Long/Short Commodity Series | ||||||||||||||||||||||||||||||||
Open Trade Equity (Deficit) | (3,612,591 | ) | 905,374 | — | (2,707,217 | ) | (439,574 | ) | 239,283 | — | (200,291 | ) | ||||||||||||||||||||
Options Written | — | (320,050 | ) | — | (320,050 | ) | — | (29,302 | ) | — | (29,302 | ) | ||||||||||||||||||||
Investment in Unconsolidated Trading Companies | 1,821,453 | 25,879 | — | 1,847,332 | ||||||||||||||||||||||||||||
Swap Contracts | — | — | 2,819,497 | 2,819,497 | ||||||||||||||||||||||||||||
Balanced Series | ||||||||||||||||||||||||||||||||
Open Trade Equity (Deficit) | (226,901 | ) | 663,779 | — | 436,878 | (804,699 | ) | 607,025 | — | (197,674 | ) | |||||||||||||||||||||
Options Written | — | (144,318 | ) | — | (144,318 | ) | — | (467,791 | ) | — | (467,791 | ) | ||||||||||||||||||||
Swap Contracts | — | — | 16,806,761 | 16,806,761 | — | — | 7,410,271 | 7,410,271 | ||||||||||||||||||||||||
Investment in Unconsolidated Trading Companies | 33,557,357 | 132,616 | 2,163,938 | 35,853,911 | 15,009,328 | 689,796 | 1,889,036 | 17,588,160 | ||||||||||||||||||||||||
Frontier Select Series (1) | ||||||||||||||||||||||||||||||||
Investment in Unconsolidated Trading Companies | 2,601,342 | 1,488,916 | 1,008,726 | 5,098,984 | 3,015,214 | 165,519 | 1,162,962 | 4,343,695 | ||||||||||||||||||||||||
Winton Series | ||||||||||||||||||||||||||||||||
Investment in Unconsolidated Trading Companies | 6,323,621 | (77,575 | ) | — | 6,246,046 | 6,471,321 | 241,308 | — | 6,712,629 | |||||||||||||||||||||||
Frontier Heritage Series (2) | ||||||||||||||||||||||||||||||||
Investment in Unconsolidated Trading Companies | 1,419,658 | (17,416 | ) | 1,260,907 | 2,663,149 | 1,450,986 | 54,106 | 1,453,704 | 2,958,796 | |||||||||||||||||||||||
| (1) | Formerly the Tiverton/Graham/Transtrend Series. |
| (2) | Formerly the Winton/Graham Series. |
December 31, 2012 | Level 1 Inputs | Level 2 Inputs | Level 3 Inputs | Total Fair Value | Level 1 Inputs | Level 2 Inputs | Level 3 Inputs | Total Fair Value | ||||||||||||||||||||||||
Frontier Diversified Series | ||||||||||||||||||||||||||||||||
Investment in Unconsolidated Trading Companies | $ | 41,070,543 | $ | 1,755,883 | $ | — | $ | 42,826,426 | $ | 41,070,543 | $ | 1,755,883 | $ | — | $ | 42,826,426 | ||||||||||||||||
U.S. Treasury Securities | 3,853,000 | — | — | 3,853,000 | 3,853,000 | — | — | 3,853,000 | ||||||||||||||||||||||||
Frontier Masters Series | ||||||||||||||||||||||||||||||||
Investment in Unconsolidated Trading Companies | 8,172,213 | 1,599,584 | — | 9,771,797 | 8,172,213 | 1,599,584 | — | 9,771,797 | ||||||||||||||||||||||||
U.S. Treasury Securities | 2,212,909 | — | — | 2,212,909 | 2,212,909 | — | — | 2,212,909 | ||||||||||||||||||||||||
Frontier Long/Short Commodity Series | ||||||||||||||||||||||||||||||||
Open Trade Equity (Deficit) | (3,720,855 | ) | 2,901,320 | — | (819,535 | ) | (3,720,855 | ) | 2,901,320 | — | (819,535 | ) | ||||||||||||||||||||
Options Written | — | (928,690 | ) | — | (928,690 | ) | — | (928,690 | ) | — | (928,690 | ) | ||||||||||||||||||||
Investment in Unconsolidated Trading Companies | 3,661,455 | 13,783 | — | 3,675,238 | 3,661,455 | 13,783 | — | 3,675,238 | ||||||||||||||||||||||||
U.S. Treasury Securities | 2,388,540 | — | — | 2,388,540 | 2,388,540 | — | — | 2,388,540 | ||||||||||||||||||||||||
Balanced Series | ||||||||||||||||||||||||||||||||
Open Trade Equity (Deficit) | (1,111,681 | ) | 439,170 | — | (672,511 | ) | (1,111,681 | ) | 439,170 | — | (672,511 | ) | ||||||||||||||||||||
Options Written | — | (165,363 | ) | — | (165,363 | ) | — | (165,363 | ) | — | (165,363 | ) | ||||||||||||||||||||
Swap Contracts | — | — | 22,289,478 | 22,289,478 | — | — | 22,289,478 | 22,289,478 | ||||||||||||||||||||||||
Investment in Unconsolidated Trading Companies | 16,719,672 | 3,473,456 | — | 20,193,128 | 16,719,672 | 3,473,456 | — | 20,193,128 | ||||||||||||||||||||||||
U.S. Treasury Securities | 5,951,633 | — | — | 5,951,633 | 5,951,633 | — | — | 5,951,633 | ||||||||||||||||||||||||
Frontier Select Series (1) | ||||||||||||||||||||||||||||||||
Investment in Unconsolidated Trading Companies | 5,981,225 | 1,392,284 | — | 7,373,509 | 5,981,225 | 1,392,284 | — | 7,373,509 | ||||||||||||||||||||||||
U.S. Treasury Securities | 961,568 | — | — | 961,568 | 961,568 | — | — | 961,568 | ||||||||||||||||||||||||
Winton Series | ||||||||||||||||||||||||||||||||
Investment in Unconsolidated Trading Companies | 6,820,010 | 45,955 | — | 6,865,965 | 6,820,010 | 45,955 | — | 6,865,965 | ||||||||||||||||||||||||
U.S. Treasury Securities | 1,808,547 | — | — | 1,808,547 | 1,808,547 | — | — | 1,808,547 | ||||||||||||||||||||||||
Frontier Heritage Series (2) | ||||||||||||||||||||||||||||||||
Investment in Unconsolidated Trading Companies | 6,070,974 | 103,881 | — | 6,174,855 | 6,070,974 | 103,881 | — | 6,174,855 | ||||||||||||||||||||||||
U.S. Treasury Securities | 776,073 | — | — | 776,073 | 776,073 | — | — | 776,073 | ||||||||||||||||||||||||
| (1) | Formerly the Tiverton/Graham/Trasntrend Series. |
| (2) | Formerly the Winton/Graham Series. |
The changes in Level 3 assets measured at fair value on a recurring basis are summarized in the following tables. Swap contract asset gains and losses (realized/unrealized) included in earnings are classified in “realized and unrealized gain (loss) on investments — net unrealized gain/(loss) on swap contracts” on the statements of operations. Investment in unconsolidated trading company asset gains and losses (realized/unrealized) included in earnings are classified in “Change in fair value of investments in unconsolidated trading
companies.” During the sixnine months ended JuneSeptember 30, 2013, all identified Level 3 assets are components of the Frontier Diversified Series, Balanced Series, Frontier Select Series (formerly Tiverton/Graham/Transtrend Series), and Winton Series and Frontier Heritage Series (formerly Winton/Graham Series) Series..
For the SixNine Months Ended JuneSeptember 30, 2013
Swaps:
| Balanced Series | Frontier Diversified Series | Frontier Long/Short Commodity Series | Balanced Series | |||||||||||||
Balance of recurring Level 3 assets as of January 1, 2013 | $ | 22,289,478 | $ | — | $ | — | $ | 22,289,478 | ||||||||
Total gains or losses (realized/unrealized): | ||||||||||||||||
Included in earnings-realized | (1,908,743 | ) | — | — | (3,554,723 | ) | ||||||||||
Included in earnings-unrealized | 772,617 | (986,342 | ) | (60,503 | ) | (225,707 | ) | |||||||||
Purchases of investments | 3,400,000 | 2,880,000 | 9,600,000 | |||||||||||||
Sales of investments | (4,341,257 | ) | — | — | (20,694,866 | ) | ||||||||||
Change in ownership allocation of total return swaps | (5,334 | ) | — | — | (3,911 | ) | ||||||||||
Transfers in and/or out of Level 3 | — | — | — | — | ||||||||||||
|
|
|
| |||||||||||||
Balance of recurring Level 3 assets as of June 30, 2013 | $ | 16,806,761 | ||||||||||||||
Balance of recurring Level 3 assets as of September 30, 2013 | $ | 2,413,658 | $ | 2,819,497 | $ | 7,410,271 | ||||||||||
|
|
|
| |||||||||||||
Investments in Unconsolidated Trading Companies:
| Balanced Series | Frontier Select Series (1) | Balanced Series | Frontier Select Series (1) | |||||||||||||
Balance of recurring Level 3 assets as of January 1, 2013 | $ | — | $ | — | $ | — | $ | — | ||||||||
Change in fair value of investments in unconsolidated trading companies | 763,938 | (591,274 | ) | 489,036 | (437,038 | ) | ||||||||||
Proceeds from sales of investments of unconsolidated trading companies | — | — | — | — | ||||||||||||
Purchases of investments of unconsolidated trading companies | 1,400,000 | 1,600,000 | 1,400,000 | 1,600,000 | ||||||||||||
Change in ownership allocation | — | — | — | — | ||||||||||||
Transfers in and/or out of Level 3 | — | — | — | — | ||||||||||||
|
|
|
| |||||||||||||
Balance of recurring Level 3 assets as of June 30, 2013 | $ | 2,163,938 | $ | 1,008,726 | ||||||||||||
Balance of recurring Level 3 assets as of September 30, 2013 | $ | 1,889,036 | $ | 1,162,962 | ||||||||||||
|
|
|
| |||||||||||||
| Frontier Diversified Series | Frontier Heritage Series (2) | Frontier Diversified Series | Frontier Heritage Series (2) | |||||||||||||
Balance of recurring Level 3 assets as of January 1, 2013 | $ | — | $ | — | $ | — | $ | — | ||||||||
Change in fair value of investments in unconsolidated trading companies | (369,546 | ) | (739,093 | ) | (369,546 | ) | (546,296 | ) | ||||||||
Proceeds from sales of investments of unconsolidated trading companies | — | — | — | — | ||||||||||||
Purchases of investments of unconsolidated trading companies | 1,000,000 | 2,000,000 | 1,000,000 | 2,000,000 | ||||||||||||
Change in ownership allocation | — | — | (630,454 | ) | — | |||||||||||
Transfers in and/or out of Level 3 | — | — | — | — | ||||||||||||
|
|
|
| |||||||||||||
Balance of recurring Level 3 assets as of June 30, 2013 | $ | 630,454 | $ | 1,260,907 | ||||||||||||
Balance of recurring Level 3 assets as of September 30, 2013 | $ | — | $ | 1,453,704 | ||||||||||||
|
|
|
| |||||||||||||
| (1) | Formerly the Tiverton/Graham/Transtrend Series. |
| (2) | Formerly the Winton/Graham Series. |
For the Year Ended December 31, 2012
Swaps:
| Frontier Diversified Series | Frontier Masters Series | Frontier Long/Short Commodity Series | ||||||||||
Balance of recurring Level 3 assets as of January 1, 2012 | $ | 131,004 | $ | 57,225 | $ | 74,898 | ||||||
Total gains or losses (realized/unrealized): | ||||||||||||
Included in earnings-realized | (106,862 | ) | (55,669 | ) | (58,693 | ) | ||||||
Included in earnings-unrealized | (23,719 | ) | (2,775 | ) | (20,529 | ) | ||||||
Change in ownership allocation of credit default swaps | (423 | ) | 1,219 | 4,324 | ||||||||
Transfers in and/or out of Level 3 | — | — | — | |||||||||
|
|
|
|
|
| |||||||
Balance of recurring Level 3 assets as of December 31, 2012 | $ | — | $ | — | $ | — | ||||||
|
|
|
|
|
| |||||||
| Balanced Series | Frontier Select Series (1) | |||||||
Balance of recurring Level 3 assets as of January 1, 2012 | $ | 23,819,312 | $ | 34,397 | ||||
Total gains or losses (realized/unrealized): | ||||||||
Included in earnings-realized | (175,294 | ) | (34,232 | ) | ||||
Included in earnings-unrealized | (1,334,945 | ) | (2,448 | ) | ||||
Sales of swap contract | — | — | ||||||
Change in ownership allocation of credit default swaps | (19,595 | ) | 2,283 | |||||
Transfers in and/or out of Level 3 | — | — | ||||||
|
|
|
| |||||
Balance of recurring Level 3 assets as of December 31, 2012 | $ | 22,289,478 | $ | — | ||||
|
|
|
| |||||
| Winton Series | Frontier Heritage Series (2) | |||||||
Balance of recurring Level 3 assets as of January 1, 2012 | $ | 61,888 | $ | 30,381 | ||||
Total gains or losses (realized/unrealized): | ||||||||
Included in earnings-realized | (57,781 | ) | (30,602 | ) | ||||
Included in earnings-unrealized | (7,291 | ) | 943 | |||||
Change in ownership allocation of credit default swaps | 3,184 | (722 | ) | |||||
Transfers in and/or out of Level 3 | — | — | ||||||
|
|
|
| |||||
Balance of recurring Level 3 assets as of December 31, 2012 | $ | — | $ | — | ||||
|
|
|
| |||||
| (1) | Formerly the Tiverton/Graham/Trasntrend Series. |
| (2) | Formerly the Winton/Graham Series. |
The Series of the Trust assess the levels of the investments at each measurement date, and transfers between levels are recognized on the actual date of the event or change in circumstances that caused the transfer in accordance with the Series’ accounting policy regarding the recognition of transfers between levels of the fair value hierarchy. During the sixnine months ended JuneSeptember 30, 2013, all identified Level 3 assets are components of the Frontier Diversified Series, Balanced Series, Frontier Select Series (formerly Tiverton/Graham/Transtrend Series) and Frontier Heritage Series.Series (formerly Winton/Graham Series). During the year ended December 31, 2012, the Trust transferred currency forwards from Level 1 assets to Level 2 assets.
4. Swaps
In addition to authorizing Trading Advisors to manage pre-determined investment levels of futures and forward contracts, certain Series of the Trust will strategically invest a portion or all of their assets in total return Swaps, selected at the direction of the Managing Owner. Total return Swaps are privately negotiated contracts designed to provide investment returns linked to those produced by one or more investment products or indices. In a typical total return Swap, two parties agree to exchange the returns (or differentials in rates of return) earned or realized on one or more particular predetermined investments or instruments. The gross returns to be exchanged or “swapped” between the parties are calculated with respect to a “notional amount” (i.e., the amount or value of the underlying asset used in computing the particular interest rate, return, or other amount to be exchanged) in a particular investment, or in a “basket” of securities.
Each Series invested in Credit Default Swaps (“CDS”) with highly-rated counterparties as part of its portfolio. CDS’s are over-the-counter investment instruments designed to mitigate counterparty risk and generally pay upon the happening of a credit default of a counterparty. The CDS were allocated to each Series based on their percentage ownership in the pooled cash management assets at U.S. Bank National Association as of the reporting date. All Credit Default Swaps expired during March, 2012.
Each Series’ investment in Swaps will likely differ substantially over time due to cash flows, portfolio management decisions and market movements. The Swaps serve to diversify the investment holdings of each Series and to provide access to programs and advisors that would not be otherwise available to the Series, and are not used for hedging purposes.
The Managing Owner follows a procedure in selecting well-established financial institutions which the Managing Owner, in its sole discretion, considers to be reputable, reliable, financially responsible and well established to act as swap counterparties. The procedure includes due diligence review of documentation on all new and existing financial institution counterparties prior to initiation of the relationship, and quarterly ongoing review during the relationship, to ensure that counterparties meet the Managing Owner’s minimum credit requirements, the counterparty average rating being no less than an investment grade rating as defined by the rating agencies. As of JuneSeptember 30, 2013 and December 31, 2012, approximately 5.3%5.1% and 4.0%, respectively, of the Trust’s assets were deposited with over-the-counter counterparties in order to initiate and maintain Swaps and is recorded as cash and cash equivalents on the Statements of Financial Condition.Condition of the Trust.
The Series may strategically invest assets in one or more swapsSwaps linked to certain underlying investments or indices at the direction of the Managing Owner. The Trading Company in which the assets of these Series will be invested will not own any of the investments or indices referenced by any Swap entered into by these Series. In addition, neither the swap counterparty to the Trading Company of these Series nor any advisor referenced by any such Swap is a Trading Advisor to these Series.
TheOn September 6, 2013, the Balanced Series had investedliquidated the Frontier Balanced RCW-1 Swap in the following swaps asamount of and for$16,353,609. On April 18, 2013, the six months ended June 30, 2013:Balanced Series liquidated the Frontier Select CTA TRS Deutsche Bank Swap in the amount of $4,341,257.
| Balanced Series Option/Swap | Total Return Swap | |||||||
Counterparty | Societe Generale | DeutscheBank | ||||||
Notional Amount | $ | 52,651,671 | $ | 0 | ||||
Termination Date | 11/21/2014 | 6/30/2016 | ||||||
Investee Returns | Total Returns | Total Returns | ||||||
Realized Gain/(Loss) | $ | — | $ | (1,908,743 | ) | |||
|
|
|
| |||||
Unrealized Gain/(Loss) | $ | (973,637 | ) | $ | 1,746,254 | |||
|
|
|
| |||||
Fair Value as of 6/30/13 | $ | 16,806,761 | $ | — | ||||
|
|
|
| |||||
The Series had invested in the following Swaps as of and for the nine months ended September 30, 2013:
| Balanced Series | ||||||||||||
| Balanced Series Option/Swap | Total Return Swap | Total Return Swap | ||||||||||
Counterparty | Societe Generale | DeutscheBank | DeutscheBank AG | |||||||||
Notional Amount | $ | — | $ | — | $ | 54,591,769 | ||||||
Termination Date | 11/21/2014 | 6/30/2016 | 8/2/2018 | |||||||||
Investee Returns | Total Returns | On Default | On Default | |||||||||
Realized Gain/(Loss) | $ | (1,645,980 | ) | $ | (1,908,743 | ) | $ | — | ||||
|
|
|
|
|
| |||||||
Unrealized Gain/(Loss) | $ | 215,224 | $ | 1,746,254 | $ | (2,187,185 | ) | |||||
|
|
|
|
|
| |||||||
Fair Value as of 9/30/2013 | $ | — | $ | — | $ | 7,410,271 | ||||||
|
|
|
|
|
| |||||||
| Diversified Series | ||||
| Total Return Swap | ||||
Counterparty | DeutscheBank AG | |||
Notional Amount | $ | 25,500,000 | ||
Termination Date | 8/2/2018 | |||
Investee Returns | On Default | |||
Realized Gain/(Loss) | $ | — | ||
|
| |||
Unrealized Gain/(Loss) | $ | (986,342 | ) | |
|
| |||
Fair Value as of 9/30/2013 | $ | 2,413,658 | ||
|
| |||
| Frontier Long/Short Commodity Series | ||||
| Total Return Swap | ||||
Counterparty | DeutscheBank AG | |||
Notional Amount | $ | 34,400,000 | ||
Termination Date | 8/7/2018 | |||
Investee Returns | On Default | |||
Realized Gain/(Loss) | $ | — | ||
|
| |||
Unrealized Gain/(Loss) | $ | (60,503 | ) | |
|
| |||
Fair Value as of 9/30/2013 | $ | 2,819,497 | ||
|
| |||
The Series had invested in the following Swaps as and for the year ended December 31, 2012:
| Frontier Diversified Series | Frontier Diversified Series | |||||||||||||||
| Credit Default Swap | Credit Default Swap | Credit Default Swap | Credit Default Swap | |||||||||||||
Counterparty | BNP Paribas | Societe Generale | BNP Paribas | Societe Generale | ||||||||||||
Notional Amount | $ | — | $ | — | $ | — | $ | — | ||||||||
Termination Date | 3/20/2012 | 3/20/2012 | 3/20/2012 | 3/20/2012 | ||||||||||||
Investee Returns | On Default | On Default | On Default | On Default | ||||||||||||
Realized Gain/(Loss) | $ | (83,850 | ) | $ | (23,012 | ) | $ | (83,850 | ) | $ | (23,012 | ) | ||||
|
|
|
| |||||||||||||
Unrealized Gain/(Loss) | $ | (46,731 | ) | $ | 23,012 | $ | (46,731 | ) | $ | 23,012 | ||||||
|
|
|
| |||||||||||||
Fair Value as of 12/31/2012 | $ | — | $ | — | $ | — | $ | — | ||||||||
|
|
|
| |||||||||||||
| Frontier Masters Series | Frontier Masters Series | |||||||||||||||
| Credit Default Swap | Credit Default Swap | Credit Default Swap | Credit Default Swap | |||||||||||||
Counterparty | BNP Paribas | Societe Generale | BNP Paribas | Societe Generale | ||||||||||||
Notional Amount | $ | — | $ | — | $ | — | $ | — | ||||||||
Termination Date | 3/20/2012 | 3/20/2012 | 3/20/2012 | 3/20/2012 | ||||||||||||
Investee Returns | On Default | On Default | On Default | On Default | ||||||||||||
Realized Gain/(Loss) | $ | (44,412 | ) | $ | (11,257 | ) | $ | (44,412 | ) | $ | (11,257 | ) | ||||
|
|
|
| |||||||||||||
Unrealized Gain/(Loss) | $ | (14,032 | ) | $ | 11,257 | $ | (14,032 | ) | $ | 11,257 | ||||||
|
|
|
| |||||||||||||
Fair Value as of 12/31/2012 | $ | — | $ | — | $ | — | $ | — | ||||||||
|
|
|
| |||||||||||||
| Frontier Long/Short Commodity Series | Frontier Long/Short Commodity Series | |||||||||||||||
| Credit Default Swap | Credit Default Swap | Credit Default Swap | Credit Default Swap | |||||||||||||
Counterparty | BNP Paribas | Societe Generale | BNP Paribas | Societe Generale | ||||||||||||
Notional Amount | $ | — | $ | — | $ | — | $ | — | ||||||||
Termination Date | 3/20/2012 | 3/20/2012 | 3/20/2012 | 3/20/2012 | ||||||||||||
Investee Returns | On Default | On Default | On Default | On Default | ||||||||||||
Realized Gain/(Loss) | $ | (45,848 | ) | $ | (12,845 | ) | $ | (45,848 | ) | $ | (12,845 | ) | ||||
|
|
|
| |||||||||||||
Unrealized Gain/(Loss) | $ | (33,374 | ) | $ | 12,845 | $ | (33,374 | ) | $ | 12,845 | ||||||
|
|
|
| |||||||||||||
Fair Value as of 12/31/2012 | $ | — | $ | — | $ | — | $ | — | ||||||||
|
|
|
| |||||||||||||
| Balanced Series | Balanced Series | |||||||||||||||||||||||||||||||
| Credit Default Swap | Credit Default Swap | Option/Swap | Total Return Swap | Credit Default Swap | Credit Default Swap | Option/Swap | Total Return Swap | |||||||||||||||||||||||||
Counterparty | BNP Paribas | Societe Generale | Societe Generale | DeutscheBank | BNP Paribas | Societe Generale | Societe Generale | DeutscheBank | ||||||||||||||||||||||||
Notional Amount | $ | — | $ | — | $ | 20,486,403 | $ | 23,551,287 | $ | — | $ | — | $ | 20,486,403 | $ | 23,551,287 | ||||||||||||||||
Termination Date | 3/20/2012 | 3/20/2012 | 11/21/2014 | 6/30/2016 | 3/20/2012 | 3/20/2012 | 11/21/2014 | 6/30/2016 | ||||||||||||||||||||||||
Investee Returns | On Default | On Default | Total Returns | Total Returns | On Default | On Default | Total Returns | Total Returns | ||||||||||||||||||||||||
Realized Gain/(Loss) | $ | (133,362 | ) | $ | (41,932 | ) | $ | — | $ | — | $ | (133,362 | ) | $ | (41,932 | ) | $ | — | $ | — | ||||||||||||
|
|
|
|
|
|
|
| |||||||||||||||||||||||||
Unrealized Gain/(Loss) | $ | (87,639 | ) | $ | 41,932 | $ | 78,977 | $ | (1,344,945 | ) | $ | (87,639 | ) | $ | 41,932 | $ | 78,977 | $ | (1,344,945 | ) | ||||||||||||
|
|
|
|
|
|
|
| |||||||||||||||||||||||||
Fair Value as of 12/31/2012 | $ | — | $ | — | $ | 17,785,734 | $ | 4,503,744 | $ | — | $ | — | $ | 17,785,734 | $ | 4,503,744 | ||||||||||||||||
|
|
|
|
|
|
|
| |||||||||||||||||||||||||
| Frontier Select Series (1) | Frontier Select Series (1) | |||||||||||||||
| Credit Default Swap | Credit Default Swap | Credit Default Swap | Credit Default Swap | |||||||||||||
Counterparty | BNP Paribas | Societe Generale | BNP Paribas | Societe Generale | ||||||||||||
Notional Amount | $ | — | $ | — | $ | — | $ | — | ||||||||
Termination Date | 3/20/2012 | 3/20/2012 | 3/20/2012 | 3/20/2012 | ||||||||||||
Investee Returns | On Default | On Default | On Default | On Default | ||||||||||||
Realized Gain/(Loss) | $ | (26,333 | ) | $ | (7,899 | ) | $ | (26,333 | ) | $ | (7,899 | ) | ||||
|
|
|
| |||||||||||||
Unrealized Gain/(Loss) | $ | (10,347 | ) | $ | 7,899 | $ | (10,347 | ) | $ | 7,899 | ||||||
|
|
|
| |||||||||||||
Fair Value as of 12/31/2012 | $ | — | $ | — | $ | — | $ | — | ||||||||
|
|
|
| |||||||||||||
| (1) | Formerly known as the Tiverton/Graham/Transtrend Series |
| Winton Series | ||||||||
| Credit Default Swap | Credit Default Swap | |||||||
Counterparty | BNP Paribas | Societe Generale | ||||||
Notional Amount | $ | — | $ | — | ||||
Termination Date | 3/20/2012 | 3/20/2012 | ||||||
Investee Returns | On Default | On Default | ||||||
Realized Gain/(Loss) | $ | (45,616 | ) | $ | (12,165 | ) | ||
|
|
|
| |||||
Unrealized Gain/(Loss) | $ | (19,456 | ) | $ | 12,165 | |||
|
|
|
| |||||
Fair Value as of 12/31/2012 | $ | — | $ | — | ||||
|
|
|
| |||||
| Frontier Heritage Series (1) | ||||||||
| Credit Default Swap | Credit Default Swap | |||||||
Counterparty | BNP Paribas | Societe Generale | ||||||
Notional Amount | $ | — | $ | — | ||||
Termination Date | 3/20/2012 | 3/20/2012 | ||||||
Investee Returns | On Default | On Default | ||||||
Realized Gain/(Loss) | $ | (23,131 | ) | $ | (7,471 | ) | ||
|
|
|
| |||||
Unrealized Gain/(Loss) | $ | (6,528 | ) | $ | 7,471 | |||
|
|
|
| |||||
Fair Value as of 12/31/2012 | $ | — | $ | — | ||||
|
|
|
| |||||
| (1) | Formerly the Winton/Graham Series. |
5. Investments in Unconsolidated Trading Companies
Investments in unconsolidated trading companies represent cash and open trade equity invested in the Trading Companies by each Series and cumulative trading profits or losses allocated to each Series by the Trading Companies. Trading Companies allocate trading profits or losses on the basis of the proportion of each Series’ capital allocated for trading to each respective Trading Company, which bears no relationship to the amount of cash invested by a Series in the Trading Company. The Trading Companies are valued using the equity method of accounting, which approximates fair value.
The following table summarizes the Balanced Series, Winton Series, Frontier Select Series (formerly Tiverton/Graham/Transtrend Series), Frontier Heritage Series (formerly Winton/Graham Series), Frontier Long/Short Commodity Series, Frontier Diversified Series, and Frontier Masters Series investments in unconsolidated Trading Companies as of JuneSeptember 30, 2013 and December 31, 2012.
| As of June 30, 2013 | As of December 31, 2012 | As of September 30, 2013 | As of December 31, 2012 | |||||||||||||||||||||||||||||
| Percentage of Series Net Assets Invested in Unconsolidated Trading Companies | Fair Value | Percentage of Series Net Assets Invested in Unconsolidated Trading Companies | Fair Value | Percentage of Series Net Assets Invested in Unconsolidated Trading Companies | Fair Value | Percentage of Series Net Assets Invested in Unconsolidated Trading Companies | Fair Value | |||||||||||||||||||||||||
Series | ||||||||||||||||||||||||||||||||
Frontier Diversified Series — | ||||||||||||||||||||||||||||||||
Frontier Trading Companies I, II, VII, IX, XIV, XV and XXXIX | 41.78 | % | $ | 37,507,662 | 37.18 | % | $ | 42,826,426 | ||||||||||||||||||||||||
Frontier Trading Companies I, II, VII, IX, XIV, XV, XXXIII and XXXIX | 29.37 | % | $ | 19,964,338 | 37.18 | % | $ | 42,826,426 | ||||||||||||||||||||||||
Frontier Masters Series — | ||||||||||||||||||||||||||||||||
Frontier Trading Companies II, XIV and XV | 29.27 | % | $ | 12,991,804 | 18.98 | % | $ | 9,771,797 | 23.77 | % | $ | 8,927,278 | 18.98 | % | $ | 9,771,797 | ||||||||||||||||
Frontier Long/Short Commodity Series — | ||||||||||||||||||||||||||||||||
Frontier Trading Company I | 4.15 | % | $ | 1,847,332 | 6.00 | % | $ | 3,675,238 | — | — | 6.00 | % | $ | 3,675,238 | ||||||||||||||||||
Balanced Series — | ||||||||||||||||||||||||||||||||
Frontier Trading Companies II, VII, XIV, XV, XVIII, XXIII and XXXIX | 21.59 | % | 35,853,911 | 8.24 | % | $ | 20,193,128 | 13.60 | % | $ | 17,588,160 | 8.24 | % | $ | 20,193,128 | |||||||||||||||||
Frontier Select Series (1) — | ||||||||||||||||||||||||||||||||
Frontier Trading Companies XV and XXXIX | 23.11 | % | $ | 5,098,984 | 29.09 | % | $ | 7,373,509 | 22.54 | % | $ | 4,343,695 | 29.09 | % | $ | 7,373,509 | ||||||||||||||||
Winton Series — | ||||||||||||||||||||||||||||||||
Frontier Trading Company II | 16.07 | % | $ | 6,246,046 | 16.76 | % | $ | 6,865,965 | 18.45 | % | $ | 6,712,629 | 16.76 | % | $ | 6,865,965 | ||||||||||||||||
Frontier Heritage Series (2) — | ||||||||||||||||||||||||||||||||
Frontier Trading Companies II and XXXIX | 15.23 | % | $ | 2,663,149 | 29.75 | % | $ | 6,174,855 | 19.72 | % | $ | 2,958,796 | 29.75 | % | $ | 6,174,855 | ||||||||||||||||
| (1) | Formerly known as the Tiverton/Graham/Transtrend Series. |
| (1) | Formerly known as the Winton/Graham Series. |
The following tables summarize the Balanced Series, Winton Series, Frontier Select Series (formerly Tiverton/Graham/Transtrend Series), Frontier Heritage Series (formerly Winton/Graham Series), Frontier Long/Short Commodity Series, Frontier Diversified Series and Frontier Masters Series equity in earnings from unconsolidated Trading Companies for the three and sixnine months ended JuneSeptember 30, 2013 and 2012.
| Three Months Ended June 30, 2013 | Three Months Ended June 30, 2012 | |||||||||||||||||||||||||||||||
| Change in | Change in | |||||||||||||||||||||||||||||||
| Trading | Realized | Unrealized | Net Income | Trading | Realized | Unrealized | Net Income | |||||||||||||||||||||||||
| Commissions | Gain/(Loss) | Gain/(Loss) | (Loss) | Commissions | Gain/(Loss) | Gain/(Loss) | (Loss) | |||||||||||||||||||||||||
Trading Company | ||||||||||||||||||||||||||||||||
Balanced Series — | ||||||||||||||||||||||||||||||||
Frontier Trading Company II LLC | $ | (12,946 | ) | $ | (539,578 | ) | $ | 62,863 | $ | (489,661 | ) | $ | (17,916 | ) | $ | (1,852,805 | ) | $ | (71,726 | ) | $ | (1,942,447 | ) | |||||||||
Frontier Trading Company V LLC | — | — | — | — | (35,526 | ) | (635,141 | ) | (13,754 | ) | (684,421 | ) | ||||||||||||||||||||
Frontier Trading Company VII, LLC | (159,810 | ) | 2,081,836 | (2,295,710 | ) | (373,684 | ) | (166,377 | ) | 19,776,151 | (19,154,575 | ) | 455,199 | |||||||||||||||||||
Frontier Trading Company XIV, LLC | (279,927 | ) | (9,105,539 | ) | (2,336,599 | ) | (11,722,065 | ) | ||||||||||||||||||||||||
Frontier Trading Company XV, LLC | (39,203 | ) | (1,020,514 | ) | 2,734,056 | 1,674,339 | — | — | — | — | ||||||||||||||||||||||
Frontier Trading Company XVIII, LLC | (4,876 | ) | (189,505 | ) | (79,789 | ) | (274,170 | ) | — | — | — | — | ||||||||||||||||||||
Frontier Trading Company XXIII, LLC | (2,345 | ) | (207,732 | ) | (29,113 | ) | (239,190 | ) | (5,104 | ) | 81,914 | (89,226 | ) | (12,416 | ) | |||||||||||||||||
Frontier Trading Company XXXIX, LLC | — | — | (318,953 | ) | (318,953 | ) | (11,402 | ) | 595,621 | (98,689 | ) | 485,530 | ||||||||||||||||||||
|
|
|
|
|
|
|
|
|
|
|
|
|
|
|
| |||||||||||||||||
Total | $ | (499,107 | ) | $ | (8,981,032 | ) | $ | (2,263,245 | ) | $ | (11,743,384 | ) | $ | (236,325 | ) | $ | 17,965,740 | $ | (19,427,970 | ) | $ | (1,698,555 | ) | |||||||||
|
|
|
|
|
|
|
|
|
|
|
|
|
|
|
| |||||||||||||||||
Winton Series — | ||||||||||||||||||||||||||||||||
Frontier Trading Company II LLC | $ | (13,821 | ) | $ | (576,780 | ) | $ | 60,649 | $ | (529,952 | ) | $ | (15,481 | ) | $ | (1,390,213 | ) | $ | (177,029 | ) | $ | (1,582,723 | ) | |||||||||
|
|
|
|
|
|
|
|
|
|
|
|
|
|
|
| |||||||||||||||||
Frontier Select Series (1) — | ||||||||||||||||||||||||||||||||
Frontier Trading Company V LLC | $ | — | $ | — | $ | — | $ | — | $ | (40,729 | ) | $ | (632,368 | ) | $ | (139,511 | ) | $ | (812,608 | ) | ||||||||||||
Frontier Trading Company XV, LLC | (24,461 | ) | (375,851 | ) | 668,464 | 268,152 | (20,623 | ) | (252,670 | ) | (4,022 | ) | (277,315 | ) | ||||||||||||||||||
Frontier Trading Company XXI, LLC | — | — | — | — | (11,707 | ) | 599,571 | (135,126 | ) | 452,738 | ||||||||||||||||||||||
Frontier Trading Company XXXIX, LLC | — | — | (236,307 | ) | (236,307 | ) | — | — | — | — | ||||||||||||||||||||||
|
|
|
|
|
|
|
|
|
|
|
|
|
|
|
| |||||||||||||||||
Total | $ | (24,461 | ) | $ | (375,851 | ) | $ | 432,157 | $ | 31,845 | $ | (73,059 | ) | $ | (285,467 | ) | $ | (278,659 | ) | $ | (637,185 | ) | ||||||||||
|
|
|
|
|
|
|
|
|
|
|
|
|
|
|
| |||||||||||||||||
Frontier Heritage Series (2) — | ||||||||||||||||||||||||||||||||
Frontier Trading Company II LLC | $ | (3,105 | ) | $ | (129,407 | ) | $ | 13,762 | $ | (118,750 | ) | $ | (5,678 | ) | $ | (509,980 | ) | $ | (64,805 | ) | $ | (580,463 | ) | |||||||||
Frontier Trading Company V LLC | — | — | — | — | (53,093 | ) | (824,003 | ) | (181,329 | ) | (1,058,425 | ) | ||||||||||||||||||||
Frontier Trading Company XXXIX, LLC | — | — | (295,384 | ) | (295,384 | ) | — | — | — | — | ||||||||||||||||||||||
|
|
|
|
|
|
|
|
|
|
|
|
|
|
|
| |||||||||||||||||
Total | $ | (3,105 | ) | $ | (129,407 | ) | $ | (281,622 | ) | $ | (414,134 | ) | $ | (58,771 | ) | $ | (1,333,983 | ) | $ | (246,134 | ) | $ | (1,638,888 | ) | ||||||||
|
|
|
|
|
|
|
|
|
|
|
|
|
|
|
| |||||||||||||||||
Frontier Long/Short Commodity Series — | ||||||||||||||||||||||||||||||||
Frontier Trading Company I LLC | $ | (15,290 | ) | $ | (142,958 | ) | $ | 116,200 | $ | (42,048 | ) | $ | (16,133 | ) | $ | (34,582 | ) | $ | (47,556 | ) | $ | (98,271 | ) | |||||||||
Frontier Trading Companies XVIII, LLC | — | — | — | — | (3,657 | ) | (355,892 | ) | 23,731 | (335,818 | ) | |||||||||||||||||||||
Frontier Trading Companies XXIII, LLC | (847 | ) | (85,317 | ) | (192 | ) | (86,356 | ) | (6,833 | ) | 357,505 | (60,071 | ) | 290,601 | ||||||||||||||||||
|
|
|
|
|
|
|
|
|
|
|
|
|
|
|
| |||||||||||||||||
Total | $ | (16,137 | ) | $ | (228,275 | ) | $ | 116,008 | $ | (128,404 | ) | $ | (26,623 | ) | $ | (32,969 | ) | $ | (83,896 | ) | $ | (143,488 | ) | |||||||||
|
|
|
|
|
|
|
|
|
|
|
|
|
|
|
| |||||||||||||||||
Frontier Diversified Series — | ||||||||||||||||||||||||||||||||
Frontier Trading Company I LLC | $ | (103,240 | ) | $ | (1,415,475 | ) | $ | 324,957 | $ | (1,193,758 | ) | $ | (205,715 | ) | $ | 5,205,460 | $ | 435,571 | $ | 5,435,316 | ||||||||||||
Frontier Trading Company II LLC | (7,249 | ) | (303,448 | ) | 31,245 | (279,452 | ) | (9,897 | ) | (888,290 | ) | (114,024 | ) | (1,012,211 | ) | |||||||||||||||||
Frontier Trading Company V LLC | — | — | — | — | (21,456 | ) | (332,944 | ) | (73,698 | ) | (428,098 | ) | ||||||||||||||||||||
Frontier Trading Company VI LLC | — | — | — | — | — | — | — | — | ||||||||||||||||||||||||
Frontier Trading Company VII, LLC | (104,230 | ) | 1,326,190 | (1,436,873 | ) | (214,913 | ) | (88,559 | ) | 10,211,301 | (9,920,508 | ) | 202,234 | |||||||||||||||||||
Frontier Trading Company IX, LLC | — | — | — | — | (679 | ) | (119,840 | ) | 99,267 | (21,252 | ) | |||||||||||||||||||||
Frontier Trading Company XIV, LLC | (266,843 | ) | (4,027,108 | ) | (2,097,543 | ) | (6,391,494 | ) | (164,949 | ) | 2,218,611 | 903,120 | 2,956,782 | |||||||||||||||||||
Frontier Trading Company XV, LLC | (31,200 | ) | (812,235 | ) | 2,175,783 | 1,332,348 | (44,583 | ) | (547,849 | ) | (7,737 | ) | (600,169 | ) | ||||||||||||||||||
Frontier Trading Company XVIII, LLC | — | — | — | — | (8,651 | ) | (662,245 | ) | 18,261 | (652,635 | ) | |||||||||||||||||||||
Frontier Trading Company XXI, LLC | — | — | — | — | (271 | ) | 14,101 | (3,565 | ) | 10,265 | ||||||||||||||||||||||
Frontier Trading Company XXIII, LLC | (1,895 | ) | (190,888 | ) | (464 | ) | (193,247 | ) | (5,699 | ) | 297,819 | (49,544 | ) | 242,576 | ||||||||||||||||||
Frontier Trading Company XXXIX, LLC | — | — | (147,692 | ) | (147,692 | ) | — | — | — | — | ||||||||||||||||||||||
|
|
|
|
|
|
|
|
|
|
|
|
|
|
|
| |||||||||||||||||
Total | $ | (514,657 | ) | $ | (5,422,964 | ) | $ | (1,150,587 | ) | $ | (7,088,208 | ) | $ | (550,459 | ) | $ | 15,396,124 | $ | (8,712,857 | ) | $ | 6,132,808 | ||||||||||
|
|
|
|
|
|
|
|
|
|
|
|
|
|
|
| |||||||||||||||||
Frontier Masters Series — | ||||||||||||||||||||||||||||||||
Frontier Trading Company II LLC | $ | (4,095 | ) | $ | (170,489 | ) | $ | 16,711 | $ | (157,873 | ) | $ | (4,580 | ) | $ | (411,358 | ) | $ | (52,424 | ) | $ | (468,362 | ) | |||||||||
Frontier Trading Company XIV, LLC | (106,640 | ) | (1,602,756 | ) | (841,813 | ) | (2,551,209 | ) | (69,982 | ) | 805,362 | 231,363 | 966,743 | |||||||||||||||||||
Frontier Trading Company XV, LLC | (37,892 | ) | (487,520 | ) | 659,342 | 133,930 | (14,453 | ) | (177,239 | ) | (2,799 | ) | (194,491 | ) | ||||||||||||||||||
|
|
|
|
|
|
|
|
|
|
|
|
|
|
|
| |||||||||||||||||
Total | $ | (148,627 | ) | $ | (2,260,765 | ) | $ | (165,760 | ) | $ | (2,575,152 | ) | $ | (89,015 | ) | $ | 216,765 | $ | 176,140 | $ | 303,890 | |||||||||||
|
|
|
|
|
|
|
|
|
|
|
|
|
|
|
| |||||||||||||||||
| Three Months Ended September 30, 2013 | Three Months Ended September 30, 2012 | |||||||||||||||||||||||||||||||
| Change in | Change in | |||||||||||||||||||||||||||||||
| Trading | Realized | Unrealized | Net Income | Trading | Realized | Unrealized | Net Income | |||||||||||||||||||||||||
| Commissions | Gain/(Loss) | Gain/(Loss) | (Loss) | Commissions | Gain/(Loss) | Gain/(Loss) | (Loss) | |||||||||||||||||||||||||
Trading Company | ||||||||||||||||||||||||||||||||
Balanced Series — | ||||||||||||||||||||||||||||||||
Frontier Trading Company I LLC | ||||||||||||||||||||||||||||||||
Frontier Trading Company II LLC | $ | (9,318 | ) | $ | (560,883 | ) | $ | 223,628 | $ | (346,573 | ) | $ | (14,301 | ) | $ | 70,125 | $ | 373,430 | $ | 429,254 | ||||||||||||
Frontier Trading Company V LLC | — | — | — | — | (17,266 | ) | 845,162 | (665,782 | ) | 162,114 | ||||||||||||||||||||||
Frontier Trading Company VII, LLC | (92,999 | ) | (3,300,304 | ) | 2,074,995 | (1,318,308 | ) | (192,209 | ) | (24,332,527 | ) | 20,896,332 | (3,628,403 | ) | ||||||||||||||||||
Frontier Trading Company XIV, LLC | (192,816 | ) | (5,398,107 | ) | 2,531,471 | (3,059,452 | ) | — | — | — | — | |||||||||||||||||||||
Frontier Trading Company XV, LLC | (33,508 | ) | 371,848 | (2,216,125 | ) | (1,877,785 | ) | — | — | — | — | |||||||||||||||||||||
Frontier Trading Company XVIII, LLC | (1,048 | ) | (33,791 | ) | — | (34,839 | ) | (5,348 | ) | 185,413 | 46,345 | 226,410 | ||||||||||||||||||||
Frontier Trading Company XXIII, LLC | — | — | — | — | (872 | ) | (136,395 | ) | 19,584 | (117,683 | ) | |||||||||||||||||||||
Frontier Trading Company XXXIX, LLC | (1,468 | ) | — | (264,965 | ) | (266,433 | ) | — | — | — | — | |||||||||||||||||||||
|
|
|
|
|
|
|
|
|
|
|
|
|
|
|
| |||||||||||||||||
Total | $ | (331,157 | ) | $ | (8,921,237 | ) | $ | 2,349,004 | $ | (6,903,390 | ) | $ | (229,996 | ) | $ | (23,368,222 | ) | $ | 20,669,909 | $ | (2,928,309 | ) | ||||||||||
|
|
|
|
|
|
|
|
|
|
|
|
|
|
|
| |||||||||||||||||
Winton Series — | ||||||||||||||||||||||||||||||||
Frontier Trading Company II LLC | $ | (11,655 | ) | $ | (666,174 | ) | $ | 297,231 | $ | (380,598 | ) | $ | (11,442 | ) | $ | 24,971 | $ | 588,982 | $ | 602,511 | ||||||||||||
|
|
|
|
|
|
|
|
|
|
|
|
|
|
|
| |||||||||||||||||
Frontier Select Series (1) — | ||||||||||||||||||||||||||||||||
Frontier Trading Company V LLC | $ | — | $ | — | $ | — | $ | — | $ | (22,533 | ) | $ | 1,102,656 | $ | (865,374 | ) | $ | 214,749 | ||||||||||||||
Frontier Trading Company XV, LLC | (24,262 | ) | 85,305 | (951,521 | ) | (890,478 | ) | (20,157 | ) | 62,519 | (55,047 | ) | (12,684 | ) | ||||||||||||||||||
Frontier Trading Company XXI, LLC | — | — | — | (13,232 | ) | 174,405 | (40,209 | ) | 120,964 | |||||||||||||||||||||||
Frontier Trading Company XXXIX, LLC | (903 | ) | — | (130,250 | ) | (131,153 | ) | — | — | — | — | |||||||||||||||||||||
|
|
|
|
|
|
|
|
|
|
|
|
|
|
|
| |||||||||||||||||
Total | $ | (25,165 | ) | $ | 85,305 | $ | (1,081,771 | ) | $ | (1,021,631 | ) | $ | (55,922 | ) | $ | 1,339,580 | $ | (960,630 | ) | $ | 323,029 | |||||||||||
|
|
|
|
|
|
|
|
|
|
|
|
|
|
|
| |||||||||||||||||
Frontier Heritage Series (2) — | ||||||||||||||||||||||||||||||||
Frontier Trading Company II LLC | $ | (2,614 | ) | $ | (149,499 | ) | $ | 66,609 | $ | (85,504 | ) | $ | (3,363 | ) | $ | 326 | $ | 426,552 | $ | 423,516 | ||||||||||||
Frontier Trading Company V LLC | — | — | — | — | (21,237 | ) | 834,906 | (51,282 | ) | 762,386 | ||||||||||||||||||||||
Frontier Trading Company XXXIX, LLC | (1,129 | ) | (162,814 | ) | — | (163,943 | ) | — | — | — | — | |||||||||||||||||||||
|
|
|
|
|
|
|
|
|
|
|
|
|
|
|
| |||||||||||||||||
Total | $ | (3,743 | ) | $ | (312,313 | ) | $ | 66,609 | $ | (249,447 | ) | $ | (24,600 | ) | $ | 835,232 | $ | 375,270 | $ | 1,185,902 | ||||||||||||
|
|
|
|
|
|
|
|
|
|
|
|
|
|
|
| |||||||||||||||||
Frontier Long/Short Commodity Series — | ||||||||||||||||||||||||||||||||
Frontier Trading Company I LLC | $ | (4,748 | ) | $ | (478,294 | ) | $ | 132,144 | $ | (350,898 | ) | $ | (18,573 | ) | $ | (370,180 | ) | $ | 2,936 | $ | (385,817 | ) | ||||||||||
Frontier Trading Companies XVIII, LLC | — | — | — | — | — | — | — | — | ||||||||||||||||||||||||
Frontier Trading Companies XXIII, LLC | — | — | — | — | (6,502 | ) | (323,461 | ) | 68,223 | (261,740 | ) | |||||||||||||||||||||
|
|
|
|
|
|
|
|
|
|
|
|
|
|
|
| |||||||||||||||||
Total | $ | (4,748 | ) | $ | (478,294 | ) | $ | — | $ | (350,898 | ) | $ | (25,075 | ) | $ | (693,641 | ) | $ | 71,159 | $ | (647,557 | ) | ||||||||||
|
|
|
|
|
|
|
|
|
|
|
|
|
|
|
| |||||||||||||||||
Frontier Diversified Series — | ||||||||||||||||||||||||||||||||
Frontier Trading Company I LLC | $ | (82,715 | ) | $ | (95,717 | ) | $ | (814,937 | ) | $ | (993,369 | ) | $ | (147,606 | ) | $ | (191,391 | ) | $ | (393,000 | ) | $ | (731,997 | ) | ||||||||
Frontier Trading Company II LLC | (5,469 | ) | (310,367 | ) | 140,441 | (175,395 | ) | (6,875 | ) | 7,849 | 420,549 | 421,524 | ||||||||||||||||||||
Frontier Trading Company V LLC | — | — | — | — | (11,924 | ) | 583,700 | (459,899 | ) | 111,876 | ||||||||||||||||||||||
Frontier Trading Company VI LLC | — | — | — | — | — | — | — | — | ||||||||||||||||||||||||
Frontier Trading Company VII, LLC | (91,413 | ) | (1,364,053 | ) | 1,202,102 | (253,364 | ) | (107,417 | ) | (12,417,915 | ) | 10,661,492 | (1,863,839 | ) | ||||||||||||||||||
Frontier Trading Company IX, LLC | — | (6 | ) | (6 | ) | (19 | ) | 532 | — | 513 | ||||||||||||||||||||||
Frontier Trading Company XIV, LLC | (163,648 | ) | (4,745,349 | ) | 2,016,387 | (2,892,610 | ) | (161,652 | ) | 6,242,591 | (542,495 | ) | 5,538,445 | |||||||||||||||||||
Frontier Trading Company XV, LLC | (25,366 | ) | 244,658 | (1,593,532 | ) | (1,374,240 | ) | (34,788 | ) | 92,877 | (43,252 | ) | 14,837 | |||||||||||||||||||
Frontier Trading Company XVIII, LLC | — | — | — | — | (1,662 | ) | 57,605 | 14,262 | 70,205 | |||||||||||||||||||||||
Frontier Trading Company XXI, LLC | — | — | — | — | (309 | ) | 4,122 | (1,108 | ) | 2,705 | ||||||||||||||||||||||
Frontier Trading Company XXIII, LLC | (1,893 | ) | 7,569 | (29,894 | ) | (24,218 | ) | (12,364 | ) | (550,605 | ) | 122,426 | (440,544 | ) | ||||||||||||||||||
Frontier Trading Company XXXIX, LLC | — | — | 3,222 | 3,222 | — | — | — | — | ||||||||||||||||||||||||
|
|
|
|
|
|
|
|
|
|
|
|
|
|
|
| |||||||||||||||||
Total | $ | (370,504 | ) | $ | (6,263,265 | ) | $ | 923,789 | $ | (5,709,980 | ) | $ | (484,616 | ) | $ | (6,170,635 | ) | $ | 9,778,975 | $ | 3,123,724 | |||||||||||
|
|
|
|
|
|
|
|
|
|
|
|
|
|
|
| |||||||||||||||||
Frontier Masters Series — | ||||||||||||||||||||||||||||||||
Frontier Trading Company II LLC | $ | (3,449 | ) | $ | (197,161 | ) | $ | 87,980 | $ | (112,630 | ) | $ | (3,386 | ) | $ | 7,390 | $ | 174,274 | $ | 178,278 | ||||||||||||
Frontier Trading Company XIV, LLC | (72,982 | ) | (2,210,977 | ) | 1,025,721 | (1,258,238 | ) | (65,090 | ) | 2,513,002 | (222,782 | ) | 2,225,130 | |||||||||||||||||||
Frontier Trading Company XV, LLC | (35,063 | ) | 99,114 | (1,202,493 | ) | (1,138,442 | ) | (14,120 | ) | 44,241 | (39,084 | ) | (8,963 | ) | ||||||||||||||||||
|
|
|
|
|
|
|
|
|
|
|
|
|
|
|
| |||||||||||||||||
Total | $ | (111,494 | ) | $ | (2,309,024 | ) | $ | (88,792 | ) | $ | (2,509,310 | ) | $ | (82,596 | ) | $ | 2,564,633 | $ | (87,592 | ) | $ | 2,394,445 | ||||||||||
|
|
|
|
|
|
|
|
|
|
|
|
|
|
|
| |||||||||||||||||
| (1) | Formerly known as the Tiverton/Graham/Transtrend Series. |
| (2) | Formerly known as the Winton/Graham Series. |
Trading Company Balanced Series — Frontier Trading Company II LLC Frontier Trading Company V LLC Frontier Trading Company VII, LLC Frontier Trading Company XV, LLC Frontier Trading Company XVI, LLC Frontier Trading Company XVIII, LLC Frontier Trading Company XXIII, LLC Frontier Trading Company XXXIX, LLC Total Winton Series — Frontier Trading Company II LLC Frontier Select Series (1) — Frontier Trading Company V LLC Frontier Trading Company VI LLC Frontier Trading Company XV, LLC Frontier Trading Company XXI, LLC Frontier Trading Company XXXIX, LLC Total Frontier Heritage Series (2) — Frontier Trading Company II LLC Frontier Trading Company V LLC Frontier Trading Company XXXIX, LLC Total Frontier Long/Short Commodity Series — Frontier Trading Company I LLC Frontier Trading Companies XVIII, LLC Frontier Trading Companies XXIII, LLC Total Frontier Diversified Series — Frontier Trading Company I LLC Frontier Trading Company II LLC Frontier Trading Company V LLC Frontier Trading Company VI LLC Frontier Trading Company VII, LLC Frontier Trading Company IX, LLC Frontier Trading Company XIV, LLC Frontier Trading Company XV, LLC Frontier Trading Company XVIII, LLC Frontier Trading Company XXI, LLC Frontier Trading Company XXIII, LLC Frontier Trading Company XXXIX, LLC Total Frontier Masters Series — Frontier Trading Company II LLC Frontier Trading Company XIV, LLC Frontier Trading Company XV, LLC Total Six Months Ended June 30, 2013 Six Months Ended June 30, 2012 Trading
Commissions Realized
Gain/(Loss) Change in
Unrealized
Gain/(Loss) Net Income
(Loss) Trading
Commissions Realized
Gain/(Loss) Change in
Unrealized
Gain/(Loss) Net Income
(Loss) $ (24,447 ) $ 1,843,105 $ 92,506 $ 1,911,164 $ (35,396 ) $ (722,502 ) $ (1,675,917 ) $ (2,433,815 ) (13,876 ) 1,530,384 (272,459 ) 1,244,049 (86,709 ) (75,583 ) 28,999 (133,293 ) (303,885 ) 755,131 (2,039,158 ) (1,587,912 ) (353,032 ) 1,722,221 (4,849,275 ) (3,480,086 ) (279,928 ) (9,105,539 ) (2,336,596 ) (11,722,063 ) — — — — (75,888 ) (928,664 ) 2,989,224 1,984,672 — — — — (8,645 ) (141,517 ) (108,880 ) (259,042 ) (5,104 ) 81,914 (89,226 ) (12,416 ) (3,524 ) (194,695 ) 546 (197,673 ) (19,932 ) 366,125 25,910 372,103 — — (304,254 ) (304,254 ) — — — — $ (710,193 ) $ (6,241,795 ) $ (1,979,071 ) $ (8,931,059 ) $ (500,173 ) $ 1,372,175 $ (6,559,509 ) $ (5,687,507 ) $ (25,474 ) $ 1,927,612 $ (112,715 ) $ 1,789,423 $ (28,363 ) $ (556,822 ) $ (1,363,292 ) $ (1,948,477 ) $ (12,346 ) $ 1,188,592 $ (78,854 ) $ 1,097,392 $ (90,474 ) $ 1,407,844 $ (1,585,534 ) $ (268,164 ) — — — — — — — — (47,319 ) (244,203 ) 773,923 482,401 (33,520 ) (461,917 ) (80,070 ) (575,507 ) — — — — (15,305 ) 999,066 (585,772 ) 397,989 — — (219,508 ) (219,508 ) — — — — $ (59,665 ) $ 944,389 $ 475,561 $ 1,360,285 $ (139,299 ) $ 1,944,993 $ (2,251,376 ) $ (445,682 ) $ (5,769 ) $ 425,541 $ 17,831 $ 437,603 $ (10,425 ) $ (203,658 ) $ (499,542 ) $ (713,625 ) (13,268 ) 1,404,612 (205,240 ) 1,186,104 (120,422 ) (131,861 ) (128,798 ) (381,081 ) — — (274,385 ) (274,385 ) — — — — $ (19,037 ) $ 1,830,153 $ (461,794 ) $ 1,349,322 $ (130,847 ) $ (335,519 ) $ (628,340 ) $ (1,094,706 ) $ (31,084 ) $ (300,076 ) $ (34,052 ) $ (365,212 ) $ (30,337 ) $ (1,074,546 ) $ (352,990 ) $ (1,457,873 ) — — — — (11,271 ) 116,615 (48,976 ) 56,368 (7,155 ) (265,826 ) (21,324 ) (294,305 ) (11,951 ) 220,061 14,652 222,762 $ (38,239 ) $ (565,902 ) $ (55,376 ) $ (659,517 ) $ (53,559 ) $ (737,870 ) $ (387,314 ) $ (1,178,743 ) $ (231,756 ) $ (1,773,046 ) $ (347,089 ) $ (2,351,891 ) $ (400,475 ) $ 2,874,056 $ 436,648 $ 2,910,229 (13,345 ) 1,007,609 (60,975 ) 933,289 (18,113 ) (357,566 ) (867,409 ) (1,243,088 ) (9,571 ) 1,055,495 (187,841 ) 858,083 (48,564 ) (63,695 ) (51,741 ) (164,000 ) — — — — — — — — (192,161 ) 792,098 (1,388,587 ) (788,650 ) (184,808 ) 894,375 (2,539,440 ) (1,829,873 ) — — — — (12,366 ) (279,533 ) (62,409 ) (354,308 ) (345,261 ) (5,253,059 ) (1,159,086 ) (6,757,406 ) (260,656 ) 3,356,066 676,628 3,772,038 (49,686 ) (779,606 ) 2,324,062 1,494,770 (74,840 ) (1,117,012 ) (56,270 ) (1,248,122 ) — — — — (23,333 ) 249,110 (120,020 ) 105,757 — — — — (525 ) 22,536 (2,097 ) 19,914 (15,095 ) (518,968 ) (65,447 ) (599,510 ) (9,965 ) 183,087 12,705 185,827 — — (137,192 ) (137,192 ) — — — — $ (856,875 ) $ (5,469,477 ) $ (1,022,155 ) $ (7,348,507 ) $ (1,033,645 ) $ 5,761,424 $ (2,573,405 ) $ 2,154,374 $ (7,544 ) $ 570,668 $ (34,613 ) $ 528,511 $ (8,393 ) $ (164,813 ) $ (403,624 ) $ (576,830 ) (138,056 ) (2,094,361 ) (466,073 ) (2,698,490 ) (130,287 ) 1,523,879 82,800 1,476,392 (75,581 ) (410,523 ) 971,589 485,485 (24,285 ) (362,271 ) (18,838 ) (405,394 ) $ (221,181 ) $ (1,934,216 ) $ 470,903 $ (1,684,494 ) $ (162,965 ) $ 996,795 $ (339,662 ) $ 494,168
| Nine Months Ended September 30, 2013 | Nine Months Ended September 30, 2012 | |||||||||||||||||||||||||||||||
| Trading Commissions | Realized Gain/(Loss) | Change in Unrealized Gain/(Loss) | Net Income (Loss) | Trading Commissions | Realized Gain/(Loss) | Change in Unrealized Gain/(Loss) | Net Income (Loss) | |||||||||||||||||||||||||
Trading Company | ||||||||||||||||||||||||||||||||
Balanced Series — | ||||||||||||||||||||||||||||||||
Frontier Trading Company II LLC | $ | (33,765 | ) | $ | 1,282,222 | $ | 316,134 | $ | 1,564,591 | $ | (49,697 | ) | $ | (652,377 | ) | $ | (1,302,487 | ) | $ | (2,004,561 | ) | |||||||||||
Frontier Trading Company V LLC | (13,876 | ) | 1,530,384 | (272,459 | ) | 1,244,049 | (103,975 | ) | 769,589 | (636,783 | ) | 28,831 | ||||||||||||||||||||
Frontier Trading Company VII, LLC | (396,883 | ) | (2,545,172 | ) | 35,837 | (2,906,218 | ) | (545,241 | ) | (22,610,306 | ) | 16,047,057 | (7,108,490 | ) | ||||||||||||||||||
Frontier Trading Company XV, LLC | (472,744 | ) | (14,503,646 | ) | 194,875 | (14,781,515 | ) | |||||||||||||||||||||||||
Frontier Trading Company XVI, LLC | (109,397 | ) | (556,817 | ) | 773,099 | 106,885 | ||||||||||||||||||||||||||
Frontier Trading Company XVIII, LLC | (9,693 | ) | (192,512 | ) | (91,675 | ) | (293,880 | ) | (10,452 | ) | 267,327 | (42,881 | ) | 213,994 | ||||||||||||||||||
Frontier Trading Company XXIII, LLC | (3,526 | ) | (194,695 | ) | 546 | (197,675 | ) | (20,804 | ) | 229,730 | 45,494 | 254,420 | ||||||||||||||||||||
Frontier Trading Company XXXIX, LLC | (1,468 | ) | — | (569,218 | ) | (570,686 | ) | |||||||||||||||||||||||||
|
|
|
|
|
|
|
|
|
|
|
|
|
|
|
| |||||||||||||||||
Total | $ | (1,041,352 | ) | $ | (15,180,236 | ) | $ | 387,139 | $ | (15,834,449 | ) | $ | (730,169 | ) | $ | (21,996,037 | ) | $ | 14,110,400 | $ | (8,615,806 | ) | ||||||||||
|
|
|
|
|
|
|
|
|
|
|
|
|
|
|
| |||||||||||||||||
Winton Series — | ||||||||||||||||||||||||||||||||
Frontier Trading Company II LLC | $ | (37,129 | ) | $ | 1,261,438 | $ | 184,516 | $ | 1,408,825 | $ | (39,805 | ) | $ | (531,851 | ) | $ | (774,310 | ) | $ | (1,345,966 | ) | |||||||||||
|
|
|
|
|
|
|
|
|
|
|
|
|
|
|
| |||||||||||||||||
Frontier Select Series (1) — | ||||||||||||||||||||||||||||||||
Frontier Trading Company V LLC | $ | (12,346 | ) | $ | 1,188,592 | $ | (78,854 | ) | $ | 1,097,392 | $ | (113,007 | ) | $ | 2,510,500 | $ | (2,450,908 | ) | $ | (53,415 | ) | |||||||||||
Frontier Trading Company VI LLC | — | — | — | |||||||||||||||||||||||||||||
Frontier Trading Company XV, LLC | (71,581 | ) | (158,898 | ) | (177,597 | ) | (408,076 | ) | (53,677 | ) | (399,398 | ) | (135,117 | ) | (588,192 | ) | ||||||||||||||||
Frontier Trading Company XXI, LLC | — | — | — | (28,537 | ) | 1,173,471 | (625,981 | ) | 518,953 | |||||||||||||||||||||||
Frontier Trading Company XXXIX, LLC | (903 | ) | — | (349,759 | ) | (350,662 | ) | |||||||||||||||||||||||||
|
|
|
|
|
|
|
|
|
|
|
|
|
|
|
| |||||||||||||||||
Total | $ | (84,830 | ) | $ | 1,029,694 | $ | (606,210 | ) | $ | 338,654 | $ | (195,221 | ) | $ | 3,284,573 | $ | (3,212,006 | ) | $ | (122,654 | ) | |||||||||||
|
|
|
|
|
|
|
|
|
|
|
|
|
|
|
| |||||||||||||||||
Frontier Heritage Series (2) — | ||||||||||||||||||||||||||||||||
Frontier Trading Company II LLC | $ | (8,383 | ) | $ | 276,041 | $ | 84,440 | $ | 352,098 | $ | (13,788 | ) | $ | (203,332 | ) | $ | (72,990 | ) | $ | (290,110 | ) | |||||||||||
Frontier Trading Company V LLC | (13,268 | ) | 1,404,612 | (205,240 | ) | 1,186,104 | (141,659 | ) | 703,045 | (180,080 | ) | 381,306 | ||||||||||||||||||||
Frontier Trading Company XXXIX, LLC | (1,129 | ) | — | (437,198 | ) | (438,327 | ) | |||||||||||||||||||||||||
|
|
|
|
|
|
|
|
|
|
|
|
|
|
|
| |||||||||||||||||
Total | $ | (22,780 | ) | $ | 1,680,653 | $ | (557,998 | ) | $ | 1,099,875 | $ | (155,447 | ) | $ | 499,713 | $ | (253,070 | ) | $ | 91,196 | ||||||||||||
|
|
|
|
|
|
|
|
|
|
|
|
|
|
|
| |||||||||||||||||
Frontier Long/Short Commodity Series — | ||||||||||||||||||||||||||||||||
Frontier Trading Company I LLC | $ | (35,831 | ) | $ | (778,371 | ) | $ | 98,091 | $ | (716,111 | ) | $ | (48,910 | ) | $ | (1,444,726 | ) | $ | (350,054 | ) | $ | (1,843,690 | ) | |||||||||
Frontier Trading Companies XVIII, LLC | — | — | (11,271 | ) | 116,615 | (48,976 | ) | 56,368 | ||||||||||||||||||||||||
Frontier Trading Companies XXIII, LLC | (7,153 | ) | (263,068 | ) | (24,083 | ) | (294,304 | ) | (18,453 | ) | (103,400 | ) | 82,874 | (38,979 | ) | |||||||||||||||||
|
|
|
|
|
|
|
|
|
|
|
|
|
|
|
| |||||||||||||||||
Total | $ | (42,984 | ) | $ | (1,041,439 | ) | $ | 74,008 | $ | (1,010,415 | ) | $ | (78,634 | ) | $ | (1,431,511 | ) | $ | (316,156 | ) | $ | (1,826,301 | ) | |||||||||
|
|
|
|
|
|
|
|
|
|
|
|
|
|
|
| |||||||||||||||||
Frontier Diversified Series — | ||||||||||||||||||||||||||||||||
Frontier Trading Company I LLC | $ | (314,471 | ) | $ | (1,868,764 | ) | $ | (1,162,025 | ) | $ | (3,345,260 | ) | $ | (548,081 | ) | $ | 2,682,665 | $ | 43,648 | $ | 2,178,232 | |||||||||||
Frontier Trading Company II LLC | (18,815 | ) | 697,242 | 79,465 | 757,892 | (24,988 | ) | (349,717 | ) | (446,860 | ) | (821,565 | ) | |||||||||||||||||||
Frontier Trading Company V LLC | (380,661 | ) | (10,547,784 | ) | 281,573 | (10,646,872 | ) | (60,488 | ) | 520,005 | (511,640 | ) | (52,123 | ) | ||||||||||||||||||
Frontier Trading Company VI LLC | ||||||||||||||||||||||||||||||||
Frontier Trading Company VII, LLC | (283,574 | ) | (571,954 | ) | (186,485 | ) | (1,042,013 | ) | (292,225 | ) | (11,523,540 | ) | 8,122,052 | (3,693,713 | ) | |||||||||||||||||
Frontier Trading Company IX, LLC | (12,383 | ) | (279,001 | ) | (62,409 | ) | (353,793 | ) | ||||||||||||||||||||||||
Frontier Trading Company XIV, LLC | (137,819 | ) | 1,604,571 | 387,887 | 1,854,639 | (422,308 | ) | 9,598,657 | 134,134 | 9,310,483 | ||||||||||||||||||||||
Frontier Trading Company XV, LLC | (75,052 | ) | (534,948 | ) | 730,530 | 120,530 | (109,628 | ) | (1,024,135 | ) | (99,522 | ) | (1,233,285 | ) | ||||||||||||||||||
Frontier Trading Company XVIII, LLC | (24,995 | ) | 306,715 | (105,758 | ) | 175,962 | ||||||||||||||||||||||||||
Frontier Trading Company XXI, LLC | (834 | ) | 26,658 | (3,205 | ) | 22,619 | ||||||||||||||||||||||||||
Frontier Trading Company XXIII, LLC | (16,989 | ) | (511,401 | ) | (95,340 | ) | (623,730 | ) | (22,330 | ) | (367,519 | ) | 135,130 | (254,719 | ) | |||||||||||||||||
Frontier Trading Company XXXIX, LLC | (133,973 | ) | (133,973 | ) | ||||||||||||||||||||||||||||
|
|
|
|
|
|
|
|
|
|
|
|
|
|
|
| |||||||||||||||||
Total | $ | (1,227,381 | ) | $ | (11,733,038 | ) | $ | (98,368 | ) | $ | (13,058,787 | ) | $ | (1,518,260 | ) | $ | (409,212 | ) | $ | 7,205,570 | $ | 5,278,098 | ||||||||||
|
|
|
|
|
|
|
|
|
|
|
|
|
|
|
| |||||||||||||||||
Frontier Masters Series — | ||||||||||||||||||||||||||||||||
Frontier Trading Company II LLC | $ | (10,993 | ) | $ | 373,507 | $ | 53,367 | $ | 415,881 | $ | (11,779 | ) | $ | (157,423 | ) | $ | (229,350 | ) | $ | (398,552 | ) | |||||||||||
Frontier Trading Company XIV, LLC | (211,038 | ) | (4,305,339 | ) | 559,649 | (3,956,728 | ) | (195,378 | ) | 4,036,881 | (139,982 | ) | 3,701,521 | |||||||||||||||||||
Frontier Trading Company XV, LLC | (110,645 | ) | (311,409 | ) | (230,903 | ) | (652,957 | ) | (38,432 | ) | (318,002 | ) | (57,922 | ) | (414,356 | ) | ||||||||||||||||
|
|
|
|
|
|
|
|
|
|
|
|
|
|
|
| |||||||||||||||||
Total | $ | (332,676 | ) | $ | (4,243,241 | ) | $ | 382,113 | $ | (4,193,804 | ) | $ | (245,589 | ) | $ | 3,561,456 | $ | (427,254 | ) | $ | 2,888,613 | |||||||||||
|
|
|
|
|
|
|
|
|
|
|
|
|
|
|
| |||||||||||||||||
| (1) | Formerly known as the Tiverton/Graham/Transtrend Series. |
| (2) | Formerly known as the Winton/Graham Series. |
The statements of financial condition as of JuneSeptember 30, 2013 and December 31, 2012 and the Condensed Statement of Income for the three and sixnine months ended JuneSeptember 30, 2013 and 2012 for the unconsolidated Trading Companies are as follows:
| Statements of Financial Condition - June 30, 2013 | Frontier Trading Company II LLC | Frontier Trading Company XIV LLC | Frontier Trading Company XV LLC | Frontier Trading Company XXXIX LLC | ||||||||||||||||||||||||||||
| Statements of Financial Condition - September 30, 2013 | Frontier Trading Company II LLC | Frontier Trading Company XV LLC | Frontier Trading Company XIV LLC | Frontier Trading Company XXXIX LLC | ||||||||||||||||||||||||||||
Receivable from commission merchants | $ | 17,226,194 | $ | 40,160,305 | $ | 12,461,448 | $ | — | $ | 14,873,923 | $ | 11,728,864 | $ | 12,260,120 | $ | 5,996,500 | ||||||||||||||||
Open trade equity/(deficit) | 1,401,471 | (4,736,133 | ) | 12,145,018 | 5,064,660 | 2,217,360 | 3,540,384 | 493,826 | -1,490,149 | |||||||||||||||||||||||
Interest receivable/(payable) | (195 | ) | (5,084 | ) | (103 | ) | — | 485 | 1,172 | (1,325 | ) | 0 | ||||||||||||||||||||
|
|
|
|
|
|
|
| |||||||||||||||||||||||||
Total assets | $ | 18,627,470 | $ | 35,419,088 | $ | 24,606,363 | $ | 5,064,660 | $ | 17,091,768 | $ | 15,270,420 | 12,752,621 | $ | 4,506,351 | |||||||||||||||||
|
|
|
|
|
|
|
| |||||||||||||||||||||||||
|
|
|
|
|
|
|
| |||||||||||||||||||||||||
Members’ equity | $ | 18,627,470 | $ | 35,419,088 | $ | 24,606,363 | $ | 5,064,660 | $ | 17,091,768 | $ | 15,270,420 | $ | 12,752,621 | $ | 4,506,351 | ||||||||||||||||
|
|
|
|
|
|
|
| |||||||||||||||||||||||||
Condensed Statement of Income - For the Three Months Ended June 30, 2013 | ||||||||||||||||||||||||||||||||
Condensed Statement of Income - For the Three Months Ended September 30, 2013 | ||||||||||||||||||||||||||||||||
Interest income | $ | 4,489 | $ | (5,645 | ) | $ | (3,780 | ) | $ | — | $ | 1,296 | $ | 14,902 | $ | (6,289 | ) | $ | — | |||||||||||||
Net realized gain/(loss) on investments, less commissions | (1,765,407 | ) | (19,128,908 | ) | (2,845,992 | ) | — | (1,917,886 | ) | 667,824 | (12,615,137 | ) | (3,500 | ) | ||||||||||||||||||
Change in open trade equity/(deficit) | 185,230 | (4,788,038 | ) | 6,400,468 | (998,336 | ) | 815,889 | (5,963,669 | ) | 5,229,959 | (554,809 | ) | ||||||||||||||||||||
|
|
|
|
|
|
|
| |||||||||||||||||||||||||
Net income/(loss) | $ | (1,575,688 | ) | $ | (23,922,591 | ) | $ | 3,550,696 | $ | (998,336 | ) | $ | (1,100,701 | ) | $ | (5,280,943 | ) | $ | (7,391,467 | ) | $ | (558,309 | ) | |||||||||
|
|
|
|
|
|
|
| |||||||||||||||||||||||||
Condensed Statement of Income - For the Six Months Ended June 30, 2013 | ||||||||||||||||||||||||||||||||
Condensed Statement of Income - For the Nine Months Ended September 30, 2013 | ||||||||||||||||||||||||||||||||
Interest income | $ | 11,714 | $ | (5,645 | ) | $ | (6,956 | ) | $ | — | $ | 13,010 | $ | 7,946 | $ | (11,934 | ) | $ | — | |||||||||||||
Net realized gain/(loss) on investments, less commissions | 5,686,242 | (19,128,908 | ) | (2,603,247 | ) | — | 3,768,357 | (1,935,423 | ) | (31,744,045 | ) | (3,500 | ) | |||||||||||||||||||
Change in open trade equity/(deficit) | (97,966 | ) | (4,788,038 | ) | 7,253,090 | (935,339 | ) | 717,922 | 1,289,421 | 441,921 | (1,490,149 | ) | ||||||||||||||||||||
|
|
|
|
|
|
|
| |||||||||||||||||||||||||
Net income/(loss) | $ | 5,599,990 | $ | (23,922,591 | ) | $ | 4,642,887 | $ | (935,339 | ) | $ | 4,499,289 | $ | (638,056 | ) | $ | (31,314,058 | ) | $ | (1,493,649 | ) | |||||||||||
|
|
|
|
|
|
|
| |||||||||||||||||||||||||
| Statements of Financial Condition - December 31, 2012 | Frontier Trading Company II LLC | Frontier Trading Company V LLC | Frontier Trading Company XXIII, LLC | Frontier Trading Company II LLC | Frontier Trading Company V LLC | Frontier Trading Company XXIII, LLC | ||||||||||||||||||
Receivable from commission merchants | $ | 20,525,159 | $ | 14,732,606 | $ | 3,343,890 | $ | 20,525,159 | $ | 14,732,606 | $ | 3,343,890 | ||||||||||||
Open trade equity/(deficit) | 1,499,438 | 1,311,171 | 231,181 | 1,499,438 | 1,311,171 | $ | 231,181 | |||||||||||||||||
Interest receivable/(payable) | 2,882 | 2,181 | (7 | ) | 2,882 | 2,181 | (7 | ) | ||||||||||||||||
|
|
|
|
|
| |||||||||||||||||||
Total assets | $ | 22,027,479 | $ | 16,045,958 | $ | 3,575,064 | $ | 22,027,479 | $ | 16,045,958 | $ | 3,575,064 | ||||||||||||
|
|
|
|
|
| |||||||||||||||||||
|
|
|
|
|
| |||||||||||||||||||
Members’ equity | $ | 22,027,479 | $ | 16,045,958 | $ | 3,575,064 | $ | 22,027,479 | $ | 16,045,958 | $ | 3,575,064 | ||||||||||||
|
|
|
|
|
| |||||||||||||||||||
Condensed Statement of Income - For the Three Months Ended June 30, 2012 | ||||||||||||||||||||||||
Condensed Statement of Income - For the Three Months Ended September 30, 2012 | ||||||||||||||||||||||||
Interest income | $ | 7,597 | $ | 1,418 | $ | — | $ | 7,977 | $ | 7,318 | $ | — | ||||||||||||
Net realized gain/(loss) on investments, less commissions | (5,106,197 | ) | (2,575,258 | ) | 1,256,221 | 71,295 | 3,293,463 | — | ||||||||||||||||
Change in open trade equity/(deficit) | (480,006 | ) | (408,292 | ) | (213,344 | ) | 1,983,787 | (2,042,336 | ) | — | ||||||||||||||
|
|
|
|
|
| |||||||||||||||||||
Net income/(loss) | $ | (5,578,606 | ) | $ | (2,982,132 | ) | $ | 1,042,877 | $ | 2,063,059 | $ | 1,258,445 | $ | — | ||||||||||
|
|
|
|
|
| |||||||||||||||||||
Condensed Statement of Income - For the Six Months Ended June 30, 2012 | ||||||||||||||||||||||||
Condensed Statement of Income - For the Nine Months Ended September 30, 2012 | ||||||||||||||||||||||||
Interest income | $ | 16,404 | $ | 2,153 | $ | — | $ | 24,381 | $ | 9,471 | $ | — | ||||||||||||
Net realized gain/(loss) on investments, less commissions | (2,106,051 | ) | 790,538 | 744,714 | (2,034,756 | ) | 4,084,001 | — | ||||||||||||||||
Change in open trade equity/(deficit) | (4,809,783 | ) | (1,737,074 | ) | 54,463 | (2,825,996 | ) | (3,779,410 | ) | — | ||||||||||||||
|
|
|
|
|
| |||||||||||||||||||
Net income/(loss) | $ | (6,899,430 | ) | $ | (944,383 | ) | $ | 799,177 | $ | (4,836,371 | ) | $ | 314,062 | $ | — | |||||||||
|
|
|
|
|
| |||||||||||||||||||
6. Transactions with Affiliates
The Managing Owner contributes funds to the Trust, with respect to the Series, in order to have a 1% interest in the aggregate capital, profits and losses of all Series and in return will receive units designated as general units in the Series in which the Managing Owner invests such funds. The general units may only be purchased by the Managing Owner and may be subject to no advisory fees or advisory fees at reduced rates. Otherwise, the general units hold the same rights as the limited units. The Managing Owner is required to maintain at least a 1% interest (“Minimum Purchase Commitment”) in the aggregate capital, profits and losses of all Series so long as it is acting as the Managing Owner of the Trust. Such contribution was made by the Managing Owner before trading commenced for the Trust and will be maintained throughout the existence of the Trust, and the Managing Owner will make such purchases as are necessary to effect this requirement. Additionally, the Managing Owner agreed with certain regulatory bodies to maintain a 1%
interest specifically in the Balanced Series Class 1a Units and Balanced Series Class 2a Units, aggregated, and each of the Frontier Long/Short Commodity Series, Frontier Diversified Series and Frontier Masters Series. The 1% interest in these specific Series is included in computing the Minimum Purchase Commitment in aggregate capital. In addition to the General Units the Managing Owner receives in respect of its Minimum Purchase Commitment, the Managing Owner may purchase Limited Units in any Series as a Limited Owner. Principals of the Managing Owner or affiliates are allowed to own beneficial interests in the Trust, with respect to the Series, as well. All Units purchased by the Managing Owner are held for investment purposes only and not for resale. The Managing Owner may make purchases or redemptions at any time on the same terms as any Limited Owner. The Trust has and will continue to have certain relationships with the Managing Owner and its affiliates.
Expenses
Management Fees—Each Series of Units pays to the Managing Owner a monthly management fee equal to a certain percentage of such Series’ assets attributable to such Series (including notional assets), calculated on a daily basis. The annual rate of the management fee is 0.5% for the Balanced Series Class 1, Class 2 and Class 3, 1.0% for the Balanced Series Class 1a and Class 2a, 2.0% for the Winton Series, Frontier Long/Short Commodity Series Class 1a and Class 2a and Frontier Masters Series, 0.75% for Frontier Diversified Series, 2.5% for the Frontier Heritage Series (formerly Winton/Graham Series) and Frontier Select Series (formerly Tiverton/Graham/Transtrend Series), and 3.5% for the Frontier Long/Short Commodity Series Class 1 and Class 2. The Managing Owner may pay all or a portion of such management fees to the Trading Advisor(s) for such Series.
Trading Fees—In connection with each Series’ trading activities, the Frontier Long/Short Commodity Series (Classes 1, 2 and 3), Balanced Series, Frontier Select Series (formerly Tiverton/Graham/Transtrend Series), Winton Series and Frontier Heritage Series (formerly Winton/Graham Series) pays to the Managing Owner a trading fee, or FCM Fee, up to 0.75% of such Series’ NAV, calculated daily. The Frontier Diversified Series, Frontier Long/Short Commodity Series (Classes 1a and 2a) and Frontier Masters Series pays to the Managing Owner a trading fee, or FCM Fee, up to 2.25% and a custodial/due diligence fee of 0.12% of such Series’ NAV, calculated daily.
Incentive Fees—Some Series pay to the Managing Owner an incentive fee of a certain percentage of new net trading profits generated by such Series, monthly or quarterly. Because the Balanced Series, Frontier Heritage Series (formerly Winton/Graham Series), Frontier Select Series (formerly Tiverton/Graham/Transtrend Series), and Frontier Long/Short Commodity Series may each employ multiple Trading Advisors, these Series will pay the Managing Owner a monthly incentive fee calculated on a Trading Advisor by Trading Advisor basis. It is therefore possible that in any given period the Series may pay incentive fees to the Managing Owner for one or more Trading Advisors while each of these Series as a whole experiences losses. The incentive fee is 25% for the Balanced Series and the Frontier Diversified Series and 20% for the Winton Series, Frontier Heritage Series (formerly Winton/Graham Series), Frontier Select Series (formerly Tiverton/Graham/Transtrend Series), Frontier Long/Short Commodity Series and Frontier Masters Series. The Managing Owner may pay all or a portion of such incentive fees to the Trading Advisor(s) for such Series.
Service Fees—In addition, with respect to Class 1 and Class 1a Units of each Series, as applicable, the Series pays monthly or service feefees to the Managing Owner up to 3% annually, which the Managing Owner pays to selling agents of the Trust, with respect to the Series.
The following table summarizes fees earned by the Managing Owner for the three and sixnine months ended JuneSeptember 30, 2013 and 2012.
| Three Months Ended June 30, 2013 | Incentive Fee | Management Fee | Service Fee | Trading Fee | ||||||||||||||||||||||||||||
| Three Months Ended September 30, 2013 | Incentive Fee | Management Fee | Service Fee | Trading Fee | ||||||||||||||||||||||||||||
Frontier Diversified Series | $ | — | $ | 387,812 | $ | 290,900 | $ | 614,290 | $ | — | $ | 333,759 | $ | 225,937 | $ | 475,785 | ||||||||||||||||
Frontier Masters Series | — | 330,187 | 176,471 | 288,777 | — | 315,200 | 156,560 | 252,770 | ||||||||||||||||||||||||
Frontier Long/Short Commodity Series | — | 590,929 | 88,071 | 190,367 | — | 518,079 | 71,049 | 146,883 | ||||||||||||||||||||||||
Balanced Series | 397,624 | 421,392 | 924,919 | 327,556 | — | 334,849 | 741,647 | 261,429 | ||||||||||||||||||||||||
Frontier Select Series (1) | — | 138,094 | 152,793 | 43,541 | — | 140,444 | 141,965 | 40,356 | ||||||||||||||||||||||||
Winton Series | — | 268,121 | 226,897 | 76,915 | — | 264,894 | 211,612 | 72,271 | ||||||||||||||||||||||||
Frontier Heritage Series (2) | — | 75,144 | 116,307 | 36,145 | — | 74,121 | 101,377 | 31,828 | ||||||||||||||||||||||||
| Three Months Ended June 30, 2012 | Incentive Fee | Management Fee | Service Fee | Trading Fee | ||||||||||||||||||||||||||||
| Three Months Ended September 30, 2012 | Incentive Fee | Management Fee | Service Fee | Trading Fee | ||||||||||||||||||||||||||||
Frontier Diversified Series | $ | 1,616,858 | $ | 485,272 | $ | 372,751 | $ | 749,188 | $ | 443,895 | $ | 735,492 | $ | 1,456,640 | $ | 366,831 | ||||||||||||||||
Frontier Masters Series | 84,508 | 352,534 | 189,579 | 319,341 | 364,814 | 342,724 | 403,573 | 207,528 | ||||||||||||||||||||||||
Frontier Long/Short Commodity Series | 397,085 | 866,092 | 115,189 | 257,297 | 868,971 | 266,738 | 585,049 | 112,879 | ||||||||||||||||||||||||
Balanced Series | 3,107,181 | 650,186 | 1,264,776 | 452,743 | 601,212 | 443,728 | 3,268,561 | 1,240,331 | ||||||||||||||||||||||||
Frontier Select Series (1) | 58,853 | 357,444 | 218,705 | 61,958 | 326,209 | 60,869 | 7,136 | 213,767 | ||||||||||||||||||||||||
Winton Series | — | 259,761 | 266,262 | 87,171 | 259,965 | 84,533 | — | 257,849 | ||||||||||||||||||||||||
Frontier Heritage Series (2) | — | 290,031 | 159,136 | 48,908 | 225,076 | 47,300 | — | 153,063 | ||||||||||||||||||||||||
| (1) | Formerly the Tiverton/Graham/Transtrend Series. |
| (2) | Formerly the Winton/Graham Series. |
| Six Months Ended June 30, 2013 | Incentive Fee | Management Fee | Service Fee | Trading Fee | ||||||||||||||||||||||||||||
| Nine Months Ended September 30, 2013 | Incentive Fee | Management Fee | Service Fee | Trading Fee | ||||||||||||||||||||||||||||
Frontier Diversified Series | $ | 184,498 | $ | 798,238 | $ | 596,303 | $ | 1,250,812 | $ | 184,498 | $ | 1,131,997 | $ | 822,240 | $ | 1,726,597 | ||||||||||||||||
Frontier Masters Series | — | 654,910 | 351,815 | 581,403 | — | 970,110 | 508,375 | 834,173 | ||||||||||||||||||||||||
Frontier Long/Short Commodity Series | — | 1,229,182 | 184,174 | 402,099 | — | 1,747,261 | 255,223 | 548,982 | ||||||||||||||||||||||||
Balanced Series | 657,063 | 916,029 | 1,916,467 | 673,471 | 657,063 | 1,250,878 | 2,658,114 | 934,900 | ||||||||||||||||||||||||
Frontier Select Series (1) | — | 347,293 | 310,652 | 88,324 | — | 487,737 | 452,617 | 128,680 | ||||||||||||||||||||||||
Winton Series | — | 520,375 | 449,703 | 151,657 | — | 785,269 | 661,315 | 223,928 | ||||||||||||||||||||||||
Frontier Heritage Series (2) | — | 214,205 | 236,146 | 73,328 | — | 288,326 | 337,523 | 105,156 | ||||||||||||||||||||||||
| Six Months Ended June 30, 2012 | Incentive Fee | Management Fee | Service Fee | Trading Fee | ||||||||||||||||||||||||||||
| Nine Months Ended September 30, 2012 | Incentive Fee | Management Fee | Service Fee | Trading Fee | ||||||||||||||||||||||||||||
Frontier Diversified Series | $ | 1,622,616 | $ | 1,001,476 | $ | 764,517 | $ | 1,522,885 | $ | 1,445,371 | $ | 2,258,377 | $ | 3,079,256 | $ | 1,131,348 | ||||||||||||||||
Frontier Masters Series | 84,508 | 705,144 | 376,906 | 636,911 | 1,069,958 | 979,635 | 488,081 | 584,434 | ||||||||||||||||||||||||
Frontier Long/Short Commodity Series | 474,155 | 1,730,283 | 240,025 | 511,670 | 2,599,254 | 778,408 | 1,059,204 | 352,904 | ||||||||||||||||||||||||
Balanced Series | 3,285,306 | 1,339,664 | 2,605,664 | 930,270 | 1,940,876 | 1,373,998 | 6,553,867 | 3,845,995 | ||||||||||||||||||||||||
Frontier Select Series (1) | 58,853 | 630,430 | 473,019 | 132,847 | 956,639 | 193,716 | 65,989 | 686,786 | ||||||||||||||||||||||||
Winton Series | — | 527,370 | 548,690 | 178,594 | 787,335 | 263,127 | — | 806,539 | ||||||||||||||||||||||||
Frontier Heritage Series (2) | — | 588,344 | 338,208 | 103,966 | 813,420 | 151,266 | — | 491,271 | ||||||||||||||||||||||||
| (1) | Formerly the Tiverton/Graham/Transtrend Series. |
| (2) | Formerly the Winton/Graham Series. |
The following table summarizes fees payable to the Managing Owner as of JuneSeptember 30, 2013 and December 31, 2012.
As of JuneSeptember 30, 2013
| Incentive Fees | Management Fees | Trading Fees | Service Fees | Incentive Fees | Management Fees | Trading Fees | Service Fees | |||||||||||||||||||||||||
Frontier Diversified Series | $ | — | $ | 121,590 | $ | 192,678 | $ | 72,227 | $ | — | $ | 101,464 | $ | 149,772 | $ | 54,639 | ||||||||||||||||
Frontier Masters Series | — | 104,266 | 90,921 | 42,689 | — | 98,876 | 80,808 | 39,713 | ||||||||||||||||||||||||
Frontier Long/Short Commodity Series | — | 189,068 | 57,794 | 23,374 | — | 152,047 | 42,620 | 17,705 | ||||||||||||||||||||||||
Balanced Series | — | 129,298 | 97,612 | 238,795 | — | 92,310 | 79,628 | 202,653 | ||||||||||||||||||||||||
Frontier Select Series (1) | — | 44,909 | 13,626 | 43,481 | — | 45,546 | 12,681 | 42,233 | ||||||||||||||||||||||||
Winton Series | — | 85,774 | 24,181 | 52,335 | — | 87,013 | 23,305 | 52,149 | ||||||||||||||||||||||||
Frontier Heritage Series (2) | — | 24,021 | 11,045 | 29,697 | — | 24,337 | 9,847 | 27,616 | ||||||||||||||||||||||||
As of December 31, 2012
| Incentive Fees | Management Fees | Trading Fees | Service Fees | |||||||||||||
Frontier Diversified Series | $ | 189,903 | $ | 150,188 | $ | 228,169 | $ | 89,177 | ||||||||
Frontier Masters Series | — | 118,274 | 104,852 | 47,423 | ||||||||||||
Frontier Long/Short Commodity Series | — | 277,379 | 79,400 | 24,074 | ||||||||||||
Balanced Series | 527,306 | 193,155 | 132,875 | 332,942 | ||||||||||||
Frontier Select Series (1) | — | 103,089 | 16,057 | 54,702 | ||||||||||||
Winton Series | — | 86,138 | 26,041 | 62,556 | ||||||||||||
Frontier Heritage Series (2) | — | 63,642 | 13,148 | 38,116 | ||||||||||||
| (1) | Formerly the Tiverton/Graham/Transtrend Series. |
| (2) | Formerly the Winton/Graham Series. |
With respect to the service fees, the initial service fee (for the first 12 months) relating to a purchase of Units by an investor is prepaid by the Managing Owner to the relevant selling agent in the month following such purchase and is reimbursed therefore by the Series monthly in arrears in an amount based upon a corresponding percentage of NAV, calculated daily. Consequently, the Managing Owner bears the risk and the benefit of the upside potential of any difference between the amount of the initial service fee prepaid by it and the amount of the reimbursement thereof, which may result from variations in NAV over the following 12 months. For the six
nine months ended JuneSeptember 30, 2013, amounts paid or owed to the Managing Owner for the difference in monthly service fees from prepaid initial service fees were $1,328($1,956) for the Balanced Series, ($1,843)$370 for the Frontier Long/Short Commodity Series, ($1,657)1,424) for the Frontier Diversified Series, $67($137) for the Frontier Select Series (formerly Tiverton/Graham/Transtrend Series), $63($434) for the Frontier Heritage Series (formerly Winton/Graham Series), $776($692) for the Winton Series and ($416)2,196) for the Frontier Masters Series.
For the year ended December 31, 2012, amounts paid or owed to the Managing Owner for the difference in monthly service fees from prepaid initial service fees were $23,454 for the Balanced Series, ($5,660) for the Frontier Long/Short Commodity Series, ($4,996) for the Frontier Diversified Series, ($7,427) for the Frontier Select Series (formerly Tiverton/Graham/Transtrend Series), $4,064 for the Frontier Heritage Series (formerly Winton/Graham Series), $6,938 for the Winton Series and $1,336 for the Frontier Masters Series.
Aggregate interest income from all sources, including assets held at clearing brokers, up to 2% (annualized) is paid to the Managing Owner by the Balanced Series (Class 1 and Class 2 only), Winton Series, Frontier Select Series (formerly Tiverton/Graham/Transtrend Series), and Frontier Heritage Series (formerly Winton/Graham Series). For the Frontier Diversified Series, Frontier Long/Short Commodity Series, Frontier Masters Series, and Balanced Series (Class 1a and Class 2a only), 20% of the total interest allocated to each Series is paid to the Managing Owner. During the three months ended JuneSeptember 30, 2013 and 2012, the Trust paid $1,507,617$1,279,912, and $1,893,692,$1,840,120, respectively, of such interest income to the Managing Owner Such expenses are not included in the statements of operations of the Series. During the sixnine months ended JuneSeptember 30, 2013 and 2012, the Trust paid $3,089,699$4,369,611, and $3,907,894,$5,748,014, respectively, of such interest income to the Managing OwnerOwner. Such expenses are not included in the statements of operations of the Series. All other interest income is recorded by the respective Series on the statements of operations.
The Managing Owner paid to The Bornhoft Group Corporation, an affiliate of the Trust, a monthly fee of 0.25% (annualized) of the NAV of the Trust, for services in connection with the daily valuation of each Series and Class. The amount paid under this agreement was $77,196 and $465,830$465,858 for the three and sixnine months ended JuneSeptember 30, 2012. As of April 20, 2012, the contract with The Bornhoft Group Corporation was amended to provide for an annual payment of $600,000 for investment and advisor services and 0.1% annually of the trading level with the Balanced Series in lieu of a monthly service fee. The Managing Owner paid $274,246$232,150 and $657,374,$889,524, respectively under this agreement for the three and sixnine months ended JuneSeptember 30, 2013. The Managing Owner paid $324,029 under this agreement for the three and six months ended June 30, 2012.
Equinox Financial Group, LLC, an affiliate of the Trust, provides management services for the Managing Owner who paid $430,000$115,000 and $680,000, respectively,$795,000, for the three and sixnine months ended JuneSeptember 30, 2013.
Solon Capital, LLC, an affiliate of the Trust, provides product development and marketing services. For these services, the Managing Owner paid Solon Capital, LLC, $499,652$412,265, and $665,478, respectively, for the three months ended JuneSeptember 30, 2013 and 2012 and $1,047,744$1,460,009, and $1,365,020,$2,030,547, respectively, for the sixnine months ended JuneSeptember 30, 2013 and 2012.
During the nine months ended September 30, 2013, the Currency Series was advanced $987,152 from the other Series of the Trust to pay investor redemptions prior to the Currency Series receiving payment from the liquidation of it’s an investment in the unconsolidated trading company.
Solon Capital, LLC, an affiliate of the Trust, provides product development and marketing services. For these services, the Managing Owner paid Solon Capital, LLC, $412,265, and $665,478, respectively, for the three months ended September 30, 2013 and 2012 and $1,460,009, and $2,030,547, respectively, for the nine months ended September 30, 2013 and 2012 .
Equinox Group Distributors LLC (formerly Bornhoft Group Securities Corporation), an affiliate under common control of the Managing Owner, serves as wholesaler of the Trust by marketing to broker/dealer organizations.
7. Financial Highlights
The following information presents the financial highlights of the Trust, with respect to the Series, for the three and sixnine months ended JuneSeptember 30, 2013 and 2012.
| Frontier Diversified Series | Frontier Masters Series | Frontier Long/Short Commodity Series (7) | Frontier Diversified Series | Frontier Masters Series | Frontier Long/Short Commodity Series (7) | |||||||||||||||||||||||||||||||||||||||||||||||||||||||||||||||||||
| Class 1 | Class 2 | Class 1 | Class 2 | Class 2 | Class 3 | Class 1a | Class 2a | Class 3a | Class 1 | Class 2 | Class 1 | Class 2 | Class 2 | Class 3 | Class 1a | Class 2a | Class 3a | |||||||||||||||||||||||||||||||||||||||||||||||||||||||
Per unit operating performance (1) | ||||||||||||||||||||||||||||||||||||||||||||||||||||||||||||||||||||||||
Net asset value, December 31, 2012 | $ | 94.40 | $ | 100.48 | $ | 101.11 | $ | 107.61 | $ | 145.65 | $ | 145.69 | $ | 108.58 | $ | 115.45 | $ | 109.60 | ||||||||||||||||||||||||||||||||||||||||||||||||||||||
Net asset value, June 30, 2013 | $ | 85.55 | $ | 91.85 | $ | 94.74 | $ | 101.71 | $ | 134.46 | $ | 134.49 | $ | 99.90 | $ | 107.14 | $ | 107.15 | ||||||||||||||||||||||||||||||||||||||||||||||||||||||
Net operating results: | ||||||||||||||||||||||||||||||||||||||||||||||||||||||||||||||||||||||||
Interest income | 0.82 | 0.87 | 0.92 | 0.99 | 1.70 | 1.70 | 1.27 | 1.35 | 1.26 | 0.41 | 0.45 | 0.43 | 0.46 | 0.92 | 0.92 | 0.68 | 0.74 | 0.73 | ||||||||||||||||||||||||||||||||||||||||||||||||||||||
Expenses | (2.97 | ) | (2.08 | ) | (3.57 | ) | (2.68 | ) | (4.75 | ) | (4.75 | ) | (3.53 | ) | (3.77 | ) | (3.53 | ) | (1.31 | ) | (0.90 | ) | (1.76 | ) | (1.36 | ) | (2.45 | ) | (2.45 | ) | (1.82 | ) | (1.96 | ) | (1.94 | ) | ||||||||||||||||||||||||||||||||||||
Net gain/(loss) on investments, net of non-controlling interests | (6.70 | ) | (7.42 | ) | (3.72 | ) | (4.21 | ) | (8.14 | ) | (8.15 | ) | (6.42 | ) | (5.89 | ) | (0.18 | ) | (6.52 | ) | (7.14 | ) | (5.54 | ) | (6.06 | ) | (6.84 | ) | (6.84 | ) | (5.16 | ) | (5.08 | ) | (5.03 | ) | ||||||||||||||||||||||||||||||||||||
|
|
|
|
|
|
|
|
|
|
|
|
|
|
|
|
|
| |||||||||||||||||||||||||||||||||||||||||||||||||||||||
Net income/(loss) | (8.85 | ) | (8.63 | ) | (6.37 | ) | (5.90 | ) | (11.19 | ) | (11.20 | ) | (8.68 | ) | (8.31 | ) | (2.45 | ) | (7.42 | ) | (7.59 | ) | (6.87 | ) | (6.96 | ) | (8.37 | ) | (8.37 | ) | (6.30 | ) | (6.30 | ) | (6.24 | ) | ||||||||||||||||||||||||||||||||||||
|
|
|
|
|
|
|
|
|
|
|
|
|
|
|
|
|
| |||||||||||||||||||||||||||||||||||||||||||||||||||||||
Net asset value, June 30, 2013 | $ | 85.55 | $ | 91.85 | $ | 94.74 | $ | 101.71 | $ | 134.46 | $ | 134.49 | $ | 99.90 | $ | 107.14 | $ | 107.15 | ||||||||||||||||||||||||||||||||||||||||||||||||||||||
Net asset value, September 30, 2013 | $ | 78.13 | $ | 84.26 | $ | 87.87 | $ | 94.75 | $ | 126.09 | $ | 126.12 | $ | 93.60 | $ | 100.84 | $ | 100.91 | ||||||||||||||||||||||||||||||||||||||||||||||||||||||
|
|
|
|
|
|
|
|
|
|
|
|
|
|
|
|
|
| |||||||||||||||||||||||||||||||||||||||||||||||||||||||
Ratios to average net assets (3) | ||||||||||||||||||||||||||||||||||||||||||||||||||||||||||||||||||||||||
Net investment income/(loss) | -4.48 | % | -2.26 | % | -5.25 | % | -3.15 | % | -4.26 | % | -4.26 | % | -4.26 | % | -4.26 | % | -4.26 | % | -4.41 | % | -2.10 | % | -5.77 | % | -3.61 | % | -4.68 | % | -4.68 | % | -4.68 | % | -4.68 | % | -4.68 | % | ||||||||||||||||||||||||||||||||||||
Expenses before incentive fees (6) | 6.08 | % | 3.85 | % | 7.09 | % | 4.99 | % | 6.64 | % | 6.64 | % | 6.64 | % | 6.64 | % | 6.64 | % | 6.45 | % | 4.14 | % | 7.62 | % | 5.46 | % | 7.48 | % | 7.48 | % | 7.48 | % | 7.48 | % | 7.48 | % | ||||||||||||||||||||||||||||||||||||
Expenses after incentive fees (6) | 6.25 | % | 4.02 | % | 7.09 | % | 4.99 | % | 6.64 | % | 6.64 | % | 6.64 | % | 6.64 | % | 6.64 | % | 6.45 | % | 4.14 | % | 7.62 | % | 5.46 | % | 7.48 | % | 7.48 | % | 7.48 | % | 7.48 | % | 7.48 | % | ||||||||||||||||||||||||||||||||||||
Total return before incentive fees (2) | -9.20 | % | -8.42 | % | -6.30 | % | -5.48 | % | -7.68 | % | -7.69 | % | -7.99 | % | -7.20 | % | -2.24 | % | -8.67 | % | -8.26 | % | -7.25 | % | -6.84 | % | -6.22 | % | -6.22 | % | -6.31 | % | -5.88 | % | -5.82 | % | ||||||||||||||||||||||||||||||||||||
Total return after incentive fees (2) | -9.38 | % | -8.59 | % | -6.30 | % | -5.48 | % | -7.68 | % | -7.69 | % | -7.99 | % | -7.20 | % | -2.24 | % | -8.67 | % | -8.26 | % | -7.25 | % | -6.84 | % | -6.22 | % | -6.22 | % | -6.31 | % | -5.88 | % | -5.82 | % | ||||||||||||||||||||||||||||||||||||
| Balanced Series | Frontier Select Series (4) | Balanced Series | Frontier Select Series (4) | |||||||||||||||||||||||||||||||||||||||||||||
| Class 1 | Class 2 | Class 2a | Class 3a | Class 1 | Class 2 | Class 1 | Class 2 | Class 2a | Class 3a | Class 1 | Class 2 | |||||||||||||||||||||||||||||||||||||
Per unit operating performance (1) | ||||||||||||||||||||||||||||||||||||||||||||||||
Net asset value, December 31, 2012 | $ | 116.32 | $ | 149.20 | $ | 124.36 | $ | 123.96 | $ | 78.66 | $ | 99.55 | ||||||||||||||||||||||||||||||||||||
Net asset value, June 30, 2013 | $ | 104.89 | $ | 136.54 | $ | 114.69 | $ | 114.31 | $ | 81.01 | $ | 104.04 | ||||||||||||||||||||||||||||||||||||
Net operating results: | ||||||||||||||||||||||||||||||||||||||||||||||||
Interest income | 0.08 | 0.10 | 0.08 | 0.08 | 0.60 | 0.77 | 0.09 | 0.12 | 0.10 | 0.10 | 0.26 | 0.34 | ||||||||||||||||||||||||||||||||||||
Expenses | (3.10 | ) | (1.83 | ) | (1.53 | ) | (1.52 | ) | (2.66 | ) | (1.88 | ) | (1.22 | ) | (0.58 | ) | (0.49 | ) | (0.48 | ) | (1.30 | ) | (0.89 | ) | ||||||||||||||||||||||||
Net gain/(loss) on investments, net of non-controlling interests | (8.41 | ) | (10.93 | ) | (8.22 | ) | (8.21 | ) | 4.41 | 5.60 | (6.04 | ) | (7.88 | ) | (6.19 | ) | (6.18 | ) | (3.95 | ) | (5.10 | ) | ||||||||||||||||||||||||||
|
|
|
|
|
|
|
|
|
|
|
| |||||||||||||||||||||||||||||||||||||
Net income/(loss) | (11.43 | ) | (12.66 | ) | (9.67 | ) | (9.65 | ) | 2.35 | 4.49 | (7.17 | ) | (8.34 | ) | (6.58 | ) | (6.56 | ) | (4.99 | ) | (5.65 | ) | ||||||||||||||||||||||||||
|
|
|
|
|
|
|
|
|
|
|
| |||||||||||||||||||||||||||||||||||||
Net asset value, June 30, 2013 | $ | 104.89 | $ | 136.54 | $ | 114.69 | $ | 114.31 | $ | 81.01 | $ | 104.04 | ||||||||||||||||||||||||||||||||||||
Net asset value, September 30, 2013 | $ | 97.72 | $ | 128.20 | $ | 108.11 | $ | 107.75 | $ | 76.02 | $ | 98.39 | ||||||||||||||||||||||||||||||||||||
|
|
|
|
|
|
|
|
|
|
|
| |||||||||||||||||||||||||||||||||||||
Ratios to average net assets (3) | ||||||||||||||||||||||||||||||||||||||||||||||||
Net investment income/(loss) (8) | -4.96 | % | -1.98 | % | -1.98 | % | -1.98 | % | -5.14 | % | -2.17 | % | ||||||||||||||||||||||||||||||||||||
Net investment income/(loss) | -4.47 | % | -1.39 | % | -1.39 | % | -1.39 | % | -5.20 | % | -2.13 | % | ||||||||||||||||||||||||||||||||||||
Expenses before incentive fees (6) | 4.73 | % | 1.76 | % | 1.76 | % | 1.76 | % | 6.64 | % | 3.67 | % | 4.83 | % | 1.76 | % | 1.76 | % | 1.76 | % | 6.51 | % | 3.44 | % | ||||||||||||||||||||||||
Expenses after incentive fees (6) | 5.09 | % | 2.12 | % | 2.12 | % | 2.12 | % | 6.64 | % | 3.67 | % | 4.83 | % | 1.76 | % | 1.76 | % | 1.76 | % | 6.51 | % | 3.44 | % | ||||||||||||||||||||||||
Total return before incentive fees (2) | -9.47 | % | -8.12 | % | -7.42 | % | -7.42 | % | 2.99 | % | 4.51 | % | -6.84 | % | -6.11 | % | -5.74 | % | -5.74 | % | -6.16 | % | -5.43 | % | ||||||||||||||||||||||||
Total return after incentive fees (2) | -9.83 | % | -8.49 | % | -7.78 | % | -7.78 | % | 2.99 | % | 4.51 | % | -6.84 | % | -6.11 | % | -5.74 | % | -5.74 | % | -6.16 | % | -5.43 | % | ||||||||||||||||||||||||
| Winton Series | Frontier Heritage Series (5) | Winton Series | Frontier Heritage Series (5) | |||||||||||||||||||||||||||||
| Class 1 | Class 2 | Class 1 | Class 2 | Class 1 | Class 2 | Class 1 | Class 2 | |||||||||||||||||||||||||
Per unit operating performance (1) | ||||||||||||||||||||||||||||||||
Net asset value, December 31, 2012 | $ | 130.73 | $ | 158.30 | $ | 94.55 | $ | 120.67 | ||||||||||||||||||||||||
Net asset value, June 30, 2013 | $ | 132.81 | $ | 163.19 | $ | 98.08 | $ | 127.04 | ||||||||||||||||||||||||
Net operating results: | ||||||||||||||||||||||||||||||||
Interest income | 0.68 | 0.83 | 0.37 | 0.47 | 0.23 | 0.29 | 0.17 | 0.23 | ||||||||||||||||||||||||
Expenses | (4.23 | ) | (2.71 | ) | (2.92 | ) | (1.86 | ) | (2.18 | ) | (1.44 | ) | (1.37 | ) | (0.81 | ) | ||||||||||||||||
Net gain/(loss) on investments, net of non-controlling interests | 5.63 | 6.77 | 6.08 | 7.76 | (1.24 | ) | (1.53 | ) | (1.33 | ) | (1.74 | ) | ||||||||||||||||||||
|
|
|
|
|
|
|
| |||||||||||||||||||||||||
Net income/(loss) | 2.08 | 4.89 | 3.53 | 6.37 | (3.19 | ) | (2.68 | ) | (2.53 | ) | (2.32 | ) | ||||||||||||||||||||
|
|
|
|
|
|
|
| |||||||||||||||||||||||||
Net asset value, June 30, 2013 | $ | 132.81 | $ | 163.19 | $ | 98.08 | $ | 127.04 | ||||||||||||||||||||||||
Net asset value, September 30, 2013 | $ | 129.62 | $ | 160.51 | $ | 95.55 | $ | 124.72 | ||||||||||||||||||||||||
|
|
|
|
|
|
|
| |||||||||||||||||||||||||
Ratios to average net assets (3) | ||||||||||||||||||||||||||||||||
Net investment income/(loss) | -5.26 | % | -2.29 | % | -5.15 | % | -2.18 | % | -5.94 | % | -2.87 | % | -4.92 | % | -1.84 | % | ||||||||||||||||
Expenses before incentive fees (6) | 6.26 | % | 3.29 | % | 5.89 | % | 2.92 | % | 6.65 | % | 3.58 | % | 5.63 | % | 2.56 | % | ||||||||||||||||
Expenses after incentive fees (6) | 6.26 | % | 3.29 | % | 5.89 | % | 2.92 | % | 6.65 | % | 3.58 | % | 5.63 | % | 2.56 | % | ||||||||||||||||
Total return before incentive fees (2) | 1.59 | % | 3.09 | % | 3.73 | % | 5.28 | % | -2.40 | % | -1.64 | % | -2.58 | % | -1.83 | % | ||||||||||||||||
Total return after incentive fees (2) | 1.59 | % | 3.09 | % | 3.73 | % | 5.28 | % | -2.40 | % | -1.64 | % | -2.58 | % | -1.83 | % | ||||||||||||||||
| (1) | Interest income and expenses per unit are calculated by dividing these amounts by the average number of units outstanding during the period. The net gain/(loss) on investments, net of non-controlling interests is a balancing amount necessary to reconcile the change in net asset value per unit with the other per unit information. |
| (2) | Impact of incentive fee computed using average net assets, otherwise computed using average units outstanding during the period prior to the effects of any non-controlling transactions. An owner’s total returns may vary from the above returns based on the timing of contributions and withdrawals. Total returns are not annualized. |
| (3) | Annualized with the exception of incentive fees. |
| (4) | Formerly the Tiverton/Graham/Transtrend Series. |
| (5) | Formerly the Winton/Graham Series. |
| (6) | Expense ratios do not reflect interest allocated to the Managing Owner as such expenses are not included in the Statements of Operations of the Series, see footnote 6. |
| (7) | Class 3a operations began June 17, 2013. |
Per unit operating performance (1) Net asset value, December 31, 2012 Net operating results: Interest income Expenses Net gain/(loss) on investments, net of non-controlling interests Net income/(loss) Net asset value, September 30, 2013 Ratios to average net assets (3) Net investment income/(loss) Expenses before incentive fees (6) Expenses after incentive fees (6) Total return before incentive fees (2) Total return after incentive fees (2) Frontier Diversified Series Frontier Masters Series Frontier Long/Short Commodity Series (7) Class 1 Class 2 Class 1 Class 2 Class 2 Class 3 Class 1a Class 2a Class 3a $ 94.40 $ 100.48 $ 101.11 $ 107.61 $ 145.65 $ 145.69 $ 108.58 $ 115.45 $ 109.60 1.23 1.32 1.35 1.45 2.61 2.61 1.94 2.09 1.92 (4.30 ) (3.00 ) (5.32 ) (4.05 ) (7.17 ) (7.19 ) (7.00 ) (5.75 ) (5.29 ) (13.20 ) (14.54 ) (9.27 ) (10.26 ) (15.00 ) (14.99 ) (9.92 ) (10.95 ) (5.32 ) (16.27 ) (16.22 ) (13.24 ) (12.86 ) (19.56 ) (19.57 ) (14.98 ) (14.61 ) (8.69 ) $ 78.13 $ 84.26 $ 87.87 $ 94.75 $ 126.09 $ 126.12 $ 93.60 $ 100.84 $ 100.91 -4.53 % -2.28 % -5.41 % -3.29 % -4.36 % -4.36 % -6.50 % -4.36 % -4.36 % 6.17 % 3.93 % 7.25 % 5.13 % 6.86 % 6.86 % 8.99 % 6.86 % 6.86 % 6.36 % 4.12 % 7.25 % 5.13 % 6.86 % 6.86 % 8.99 % 6.86 % 6.86 % -17.05 % -15.95 % -13.09 % -11.95 % -13.43 % -13.43 % -13.80 % -12.65 % -7.93 % -17.24 % -16.14 % -13.09 % -11.95 % -13.43 % -13.43 % -13.80 % -12.65 % -7.93 %
| Balanced Series | Frontier Select Series (4) | |||||||||||||||||||||||
| Class 1 | Class 2 | Class 2a | Class 3a | Class 1 | Class 2 | |||||||||||||||||||
Per unit operating performance (1) | ||||||||||||||||||||||||
Net asset value, December 31, 2012 | $ | 116.32 | $ | 149.20 | $ | 124.36 | $ | 123.96 | $ | 78.66 | $ | 99.55 | ||||||||||||
Net operating results: | ||||||||||||||||||||||||
Interest income | 0.16 | 0.21 | 0.18 | 0.18 | 0.87 | 1.11 | ||||||||||||||||||
Expenses | (4.36 | ) | (2.44 | ) | (2.05 | ) | (2.04 | ) | (3.97 | ) | (2.77 | ) | ||||||||||||
Net gain/(loss) on investments, net of non-controlling interests | (14.40 | ) | (18.77 | ) | (14.38 | ) | (14.35 | ) | 0.46 | 0.50 | ||||||||||||||
|
|
|
|
|
|
|
|
|
|
|
| |||||||||||||
Net income/(loss) | (18.60 | ) | (21.00 | ) | (16.25 | ) | (16.21 | ) | (2.64 | ) | (1.16 | ) | ||||||||||||
|
|
|
|
|
|
|
|
|
|
|
| |||||||||||||
Net asset value, September 30, 2013 | $ | 97.72 | $ | 128.20 | $ | 108.11 | $ | 107.75 | $ | 76.02 | $ | 98.39 | ||||||||||||
|
|
|
|
|
|
|
|
|
|
|
| |||||||||||||
Ratios to average net assets (3) | ||||||||||||||||||||||||
Net investment income/(loss) | -4.96 | % | -1.95 | % | -1.95 | % | -1.95 | % | -5.16 | % | -2.16 | % | ||||||||||||
Expenses before incentive fees (6) | 4.76 | % | 1.76 | % | 1.76 | % | 1.76 | % | 6.60 | % | 3.60 | % | ||||||||||||
Expenses after incentive fees (6) | 5.15 | % | 2.15 | % | 2.15 | % | 2.15 | % | 6.60 | % | 3.60 | % | ||||||||||||
Total return before incentive fees (2) | -15.59 | % | -13.68 | % | -12.67 | % | -12.68 | % | -3.36 | % | -1.17 | % | ||||||||||||
Total return after incentive fees (2) | -15.99 | % | -14.07 | % | -13.07 | % | -13.08 | % | -3.36 | % | -1.17 | % | ||||||||||||
| Winton Series | Frontier Heritage Series (5) | |||||||||||||||
| Class 1 | Class 2 | Class 1 | Class 2 | |||||||||||||
Per unit operating performance (1) | ||||||||||||||||
Net asset value, December 31, 2012 | $ | 130.73 | $ | 158.30 | $ | 94.55 | $ | 120.67 | ||||||||
Net operating results: | ||||||||||||||||
Interest income | 0.91 | 1.12 | 0.54 | 0.70 | ||||||||||||
Expenses | (6.41 | ) | (4.15 | ) | (4.30 | ) | (2.68 | ) | ||||||||
Net gain/(loss) on investments, net of non-controlling interests | 4.39 | 5.24 | 4.76 | 6.03 | ||||||||||||
|
|
|
|
|
|
|
| |||||||||
Net income/(loss) | (1.11 | ) | 2.21 | 1.00 | 4.05 | |||||||||||
|
|
|
|
|
|
|
| |||||||||
Net asset value, September 30, 2013 | $ | 129.62 | $ | 160.51 | $ | 95.55 | $ | 124.72 | ||||||||
|
|
|
|
|
|
|
| |||||||||
Ratios to average net assets (3) | ||||||||||||||||
Net investment income/(loss) | -5.47 | % | -2.47 | % | -5.08 | % | -2.08 | % | ||||||||
Expenses before incentive fees (6) | 6.38 | % | 3.38 | % | 5.81 | % | 2.81 | % | ||||||||
Expenses after incentive fees (6) | �� | 6.38 | % | 3.38 | % | 5.81 | % | 2.81 | % | |||||||
Total return before incentive fees (2) | -0.85 | % | 1.40 | % | 1.06 | % | 3.36 | % | ||||||||
Total return after incentive fees (2) | -0.85 | % | 1.40 | % | 1.06 | % | 3.36 | % | ||||||||
| (1) | Interest income and expenses per unit are calculated by dividing these amounts by the average number of units outstanding during the period. The net gain/(loss) on investments, net of non-controlling interests is a balancing amount necessary to reconcile the change in net asset value per unit with the other per unit information. |
| (2) | Impact of incentive fee computed using average net assets, otherwise computed using average units outstanding during the period prior to the effects of any non-controlling transactions. An owner’s total returns may vary from the above returns based on the timing of contributions and withdrawals. Total returns are not annualized. |
| (3) | Annualized with the exception of incentive fees. |
| (4) | Formerly the Tiverton/Graham/Transtrend Series. |
| (5) | Formerly the Winton/Graham Series. |
| (6) | Expense ratios do not reflect interest allocated to the Managing Owner as such expenses are not included in the Statements of Operations of the Series, see footnote 6. |
| (7) | Class 3a operations began June 17, 2013 |
| Frontier Diversified Series | Frontier Masters Series | Frontier Long/Short Commodity Series (7) | Frontier Diversified Series | Frontier Masters Series | Frontier Long/Short Commodity Series (8) | |||||||||||||||||||||||||||||||||||||||||||||||||||||||||||||||||||
| Class 1 | Class 2 | Class 1 | Class 2 | Class 2 | Class 3 | Class 1a | Class 2a | Class 3a | Class 1 | Class 2 | Class 1 | Class 2 | Class 1 | Class 2 | Class 3 | Class 1a | Class 2a | |||||||||||||||||||||||||||||||||||||||||||||||||||||||
Per unit operating performance (1) | ||||||||||||||||||||||||||||||||||||||||||||||||||||||||||||||||||||||||
Net asset value, March 31, 2013 | $ | 93.21 | $ | 99.64 | $ | 101.64 | $ | 108.60 | $ | 145.11 | $ | 145.14 | $ | 107.97 | $ | 115.29 | $ | 109.60 | ||||||||||||||||||||||||||||||||||||||||||||||||||||||
Net asset value, June 30, 2012 | $ | 97.60 | $ | 102.99 | $ | 102.04 | $ | 107.65 | $ | 128.07 | $ | 154.20 | $ | 154.18 | $ | 115.26 | $ | 121.54 | ||||||||||||||||||||||||||||||||||||||||||||||||||||||
Net operating results: | ||||||||||||||||||||||||||||||||||||||||||||||||||||||||||||||||||||||||
Interest income | 0.42 | 0.45 | 0.47 | 0.50 | 0.90 | 0.90 | 0.67 | 0.71 | 0.68 | 0.42 | 0.44 | 0.46 | 0.49 | 0.63 | 0.59 | 0.79 | 0.62 | 0.79 | ||||||||||||||||||||||||||||||||||||||||||||||||||||||
Expenses | (1.43 | ) | (0.97 | ) | (1.83 | ) | (1.38 | ) | (2.43 | ) | (2.43 | ) | (1.81 | ) | (1.94 | ) | (1.83 | ) | (2.66 | ) | (2.23 | ) | (2.61 | ) | (2.16 | ) | (4.30 | ) | (3.03 | ) | (4.05 | ) | (4.27 | ) | (4.05 | ) | ||||||||||||||||||||||||||||||||||||
Net gain/(loss) on investments, net of non-controlling interests | (6.65 | ) | (7.27 | ) | (5.54 | ) | (6.01 | ) | (9.12 | ) | (9.12 | ) | (6.93 | ) | (6.92 | ) | (1.30 | ) | 2.46 | 2.46 | 5.03 | 5.19 | 11.01 | 13.52 | 14.41 | 11.81 | 12.36 | |||||||||||||||||||||||||||||||||||||||||||||
|
|
|
|
|
|
|
|
|
|
|
|
|
|
|
|
|
| |||||||||||||||||||||||||||||||||||||||||||||||||||||||
Net income/(loss) | (7.66 | ) | (7.79 | ) | (6.90 | ) | (6.89 | ) | (10.65 | ) | (10.65 | ) | (8.07 | ) | (8.15 | ) | (2.45 | ) | 0.22 | 0.67 | 2.88 | 3.52 | 7.34 | 11.08 | 11.15 | 8.16 | 9.10 | |||||||||||||||||||||||||||||||||||||||||||||
|
|
|
|
|
|
|
|
|
|
|
|
|
|
|
|
|
| |||||||||||||||||||||||||||||||||||||||||||||||||||||||
Net asset value, June 30, 2013 | $ | 85.55 | $ | 91.85 | $ | 94.74 | $ | 101.71 | $ | 134.46 | $ | 134.49 | $ | 99.90 | $ | 107.14 | $ | 107.15 | ||||||||||||||||||||||||||||||||||||||||||||||||||||||
Net asset value, September 30, 2012 | $ | 97.82 | $ | 103.66 | $ | 104.92 | $ | 111.17 | $ | 135.41 | $ | 165.28 | $ | 165.33 | $ | 123.42 | $ | 130.64 | ||||||||||||||||||||||||||||||||||||||||||||||||||||||
|
|
|
|
|
|
|
|
|
|
|
|
|
|
|
|
|
| |||||||||||||||||||||||||||||||||||||||||||||||||||||||
Ratios to average net assets (3) | ||||||||||||||||||||||||||||||||||||||||||||||||||||||||||||||||||||||||
Net investment income/(loss) | -4.36 | % | -2.09 | % | -5.37 | % | -3.25 | % | -4.34 | % | -4.34 | % | -4.34 | % | -4.34 | % | -4.34 | % | -5.53 | % | -3.30 | % | -6.15 | % | -3.96 | % | -41.61 | % | -4.46 | % | -5.68 | % | -9.63 | % | -6.98 | % | ||||||||||||||||||||||||||||||||||||
Expenses before incentive fees (6) | 6.15 | % | 3.89 | % | 7.22 | % | 5.10 | % | 6.87 | % | 6.87 | % | 6.87 | % | 6.87 | % | 6.87 | % | 6.07 | % | 3.84 | % | 7.25 | % | 5.07 | % | 50.73 | % | 5.14 | % | 6.87 | % | 10.94 | % | 8.73 | % | ||||||||||||||||||||||||||||||||||||
Expenses after incentive fees (6) | 6.15 | % | 3.89 | % | 7.22 | % | 5.10 | % | 6.87 | % | 6.87 | % | 6.87 | % | 6.87 | % | 6.87 | % | 7.24 | % | 5.01 | % | 7.95 | % | 5.77 | % | 51.57 | % | 5.98 | % | 7.71 | % | 11.78 | % | 9.56 | % | ||||||||||||||||||||||||||||||||||||
Total return before incentive fees (2) | -8.22 | % | -7.82 | % | -6.79 | % | -6.34 | % | -7.34 | % | -7.34 | % | -7.47 | % | -7.07 | % | -2.24 | % | 1.39 | % | 1.82 | % | 3.52 | % | 15.90 | % | 6.57 | % | 8.03 | % | 8.07 | % | 7.92 | % | 8.33 | % | ||||||||||||||||||||||||||||||||||||
Total return after incentive fees (2) | -8.22 | % | -7.82 | % | -6.79 | % | -6.34 | % | -7.34 | % | -7.34 | % | -7.47 | % | -7.07 | % | -2.24 | % | 0.23 | % | 0.65 | % | 2.82 | % | 3.27 | % | 5.73 | % | 7.19 | % | 7.23 | % | 7.08 | % | 7.49 | % | ||||||||||||||||||||||||||||||||||||
| Balanced Series | Frontier Select Series (4) | Balanced Series (7) | Frontier Select Series (4) | |||||||||||||||||||||||||||||||||||||||||||||||||
| Class 1 | Class 2 | Class 2a | Class 3a | Class 1 | Class 2 | Class 1 | Class 1a | Class 2 | Class 2a | Class 3a | Class 1 | Class 2 | ||||||||||||||||||||||||||||||||||||||||
Per unit operating performance (1) | ||||||||||||||||||||||||||||||||||||||||||||||||||||
Net asset value, March 31, 2013 | $ | 114.20 | $ | 147.55 | $ | 123.46 | $ | 123.05 | $ | 81.86 | $ | 104.35 | ||||||||||||||||||||||||||||||||||||||||
Net asset value, June 30, 2012 | $ | 122.65 | $ | 108.13 | $ | 155.01 | $ | 128.99 | $ | 128.54 | $ | 86.29 | $ | 107.04 | ||||||||||||||||||||||||||||||||||||||
Net operating results: | ||||||||||||||||||||||||||||||||||||||||||||||||||||
Interest income | 0.05 | 0.06 | 0.05 | 0.05 | 0.31 | 0.40 | 0.01 | 0.01 | 0.02 | 0.01 | 0.01 | 0.21 | 0.26 | |||||||||||||||||||||||||||||||||||||||
Expenses | (1.61 | ) | (0.98 | ) | (0.82 | ) | (0.82 | ) | (1.26 | ) | (0.82 | ) | (3.30 | ) | (2.90 | ) | (2.99 | ) | (2.49 | ) | (2.48 | ) | (1.74 | ) | (1.35 | ) | ||||||||||||||||||||||||||
Net gain/(loss) on investments, net of non-controlling interests | (7.75 | ) | (10.09 | ) | (8.00 | ) | (7.97 | ) | 0.10 | 0.11 | 3.43 | 7.34 | 4.26 | 3.64 | 3.65 | 0.54 | 1.17 | |||||||||||||||||||||||||||||||||||
|
|
|
|
|
|
|
|
|
|
|
|
| ||||||||||||||||||||||||||||||||||||||||
Net income/(loss) | (9.31 | ) | (11.01 | ) | (8.77 | ) | (8.74 | ) | (0.85 | ) | (0.31 | ) | 0.14 | 4.45 | 1.29 | 1.16 | 1.18 | (0.99 | ) | 0.08 | ||||||||||||||||||||||||||||||||
|
|
|
|
|
|
|
|
|
|
|
|
| ||||||||||||||||||||||||||||||||||||||||
Net asset value, June 30, 2013 | $ | 104.89 | $ | 136.54 | $ | 114.69 | $ | 114.31 | $ | 81.01 | $ | 104.04 | ||||||||||||||||||||||||||||||||||||||||
Net asset value, September 30, 2012 | $ | 122.79 | $ | 112.58 | $ | 156.30 | $ | 130.15 | $ | 129.72 | $ | 85.30 | $ | 107.12 | ||||||||||||||||||||||||||||||||||||||
|
|
|
|
|
|
|
|
|
|
|
|
| ||||||||||||||||||||||||||||||||||||||||
Ratios to average net assets (3) | ||||||||||||||||||||||||||||||||||||||||||||||||||||
Net investment income/(loss) (8) | -4.80 | % | -1.79 | % | -1.79 | % | -1.79 | % | -4.64 | % | -1.63 | % | ||||||||||||||||||||||||||||||||||||||||
Net investment income/(loss) | -6.26 | % | -27.55 | % | -3.24 | % | -3.24 | % | -3.24 | % | -7.00 | % | -3.98 | % | ||||||||||||||||||||||||||||||||||||||
Expenses before incentive fees (6) | 4.75 | % | 1.73 | % | 1.73 | % | 1.73 | % | 6.15 | % | 3.14 | % | 4.88 | % | 26.34 | % | 1.86 | % | 1.86 | % | 6.24 | % | 7.92 | % | 4.91 | % | ||||||||||||||||||||||||||
Expenses after incentive fees (6) | 4.98 | % | 1.96 | % | 1.96 | % | 1.96 | % | 6.15 | % | 3.14 | % | 6.30 | % | 27.76 | % | 3.28 | % | 3.28 | % | 7.67 | % | 7.95 | % | 4.93 | % | ||||||||||||||||||||||||||
Total return before incentive fees (2) | -7.92 | % | -7.23 | % | -6.87 | % | -6.87 | % | -1.04 | % | -0.30 | % | 1.54 | % | 5.54 | % | 2.25 | % | 2.32 | % | 2.34 | % | -1.13 | % | 0.10 | % | ||||||||||||||||||||||||||
Total return after incentive fees (2) | -8.15 | % | -7.46 | % | -7.10 | % | -7.10 | % | -1.04 | % | -0.30 | % | 0.11 | % | 4.12 | % | 0.83 | % | 0.90 | % | 0.92 | % | -1.15 | % | 0.07 | % | ||||||||||||||||||||||||||
Incentive fee per share | 0.26 | 0.34 | 0.28 | 0.28 | — | — | ||||||||||||||||||||||||||||||||||||||||||||||
Incentive Fee to ANA | 0.23 | % | 0.23 | % | 0.23 | % | 0.23 | % | 0.00 | % | 0.00 | % | ||||||||||||||||||||||||||||||||||||||||
| Winton Series | Frontier Heritage Series (5) | Winton Series | Frontier Heritage Series (5) | |||||||||||||||||||||||||||||
| Class 1 | Class 2 | Class 1 | Class 2 | Class 1 | Class 2 | Class 1 | Class 2 | |||||||||||||||||||||||||
Per unit operating performance (1) | ||||||||||||||||||||||||||||||||
Net asset value, March 31, 2013 | $ | 136.53 | $ | 166.52 | $ | 101.63 | $ | 130.65 | ||||||||||||||||||||||||
Net asset value, June 30, 2012 | $ | 131.72 | $ | 157.12 | $ | 96.05 | $ | 120.78 | ||||||||||||||||||||||||
Net operating results: | ||||||||||||||||||||||||||||||||
Interest income | 0.32 | 0.39 | 0.19 | 0.24 | 0.38 | 0.46 | 0.13 | 0.16 | ||||||||||||||||||||||||
Expenses | (2.20 | ) | (1.42 | ) | (1.35 | ) | (0.76 | ) | (2.03 | ) | (1.23 | ) | (1.87 | ) | (1.39 | ) | ||||||||||||||||
Net gain/(loss) on investments, net of non-controlling interests | (1.84 | ) | (2.30 | ) | (2.39 | ) | (3.09 | ) | 1.66 | 1.93 | 4.49 | 5.58 | ||||||||||||||||||||
|
|
|
|
|
|
|
| |||||||||||||||||||||||||
Net income/(loss) | (3.72 | ) | (3.33 | ) | (3.55 | ) | (3.61 | ) | 0.01 | 1.16 | 2.75 | 4.35 | ||||||||||||||||||||
|
|
|
|
|
|
|
| |||||||||||||||||||||||||
Net asset value, June 30, 2013 | $ | 132.81 | $ | 163.19 | $ | 98.08 | $ | 127.04 | ||||||||||||||||||||||||
Net asset value, September 30, 2012 | $ | 131.73 | $ | 158.28 | $ | 98.80 | $ | 125.13 | ||||||||||||||||||||||||
|
|
|
|
|
|
|
| |||||||||||||||||||||||||
Ratios to average net assets (3) | ||||||||||||||||||||||||||||||||
Net investment income/(loss) | -5.45 | % | -2.45 | % | -4.59 | % | -1.57 | % | -4.98 | % | -1.95 | % | -7.19 | % | -4.04 | % | ||||||||||||||||
Expenses before incentive fees (6) | 6.37 | % | 3.37 | % | 5.34 | % | 2.32 | % | 6.13 | % | 3.10 | % | 7.72 | % | 4.57 | % | ||||||||||||||||
Expenses after incentive fees (6) | 6.37 | % | 3.37 | % | 5.34 | % | 2.32 | % | 6.13 | % | 3.10 | % | 7.72 | % | 4.57 | % | ||||||||||||||||
Total return before incentive fees (2) | -2.72 | % | -2.00 | % | -3.49 | % | -2.76 | % | 0.01 | % | 0.74 | % | 2.86 | % | 3.60 | % | ||||||||||||||||
Total return after incentive fees (2) | -2.72 | % | -2.00 | % | -3.49 | % | -2.76 | % | 0.01 | % | 0.74 | % | 2.86 | % | 3.60 | % | ||||||||||||||||
Incentive fee per share | — | — | — | — | ||||||||||||||||||||||||||||
Incentive Fee to ANA | 0.00 | % | 0.00 | % | 0.00 | % | 0.00 | % | ||||||||||||||||||||||||
| (1) | Interest income and expenses per unit are calculated by dividing these amounts by the average number of units outstanding during the period. The net gain/(loss) on investments, net of non-controlling interests is a balancing amount necessary to reconcile the change in net asset value per unit with the other per unit information. |
| (2) | Impact of incentive fee computed using average net assets, otherwise computed using average units outstanding during the period prior to the effects of any non-controlling |
| (3) | Annualized with the exception of incentive fees. |
| (4) | Formerly the Tiverton/Graham/Transtrend Series. |
| (5) | Formerly the Winton/Graham Series. |
| (6) | Expense ratios do not reflect interest allocated to the Managing Owner as such expenses are not included in the Statements of Operations of the Series, see footnote 6. |
| (7) | All remaining Class 1a Units were exchanged for Class 3a |
| (8) |
| Frontier Diversified Series | Frontier Masters Series | Frontier Long/Short Commodity Series | Frontier Diversified Series | Frontier Masters Series | Frontier Long/Short Commodity Series (8) | |||||||||||||||||||||||||||||||||||||||||||||||||||||||||||||||||||
| Class 1 | Class 2 | Class 1 | Class 2 | Class 1 | Class 2 | Class 3 | Class 1a | Class 2a | Class 1 | Class 2 | Class 1 | Class 2 | Class 1 | Class 2 | Class 3 | Class 1a | Class 2a | |||||||||||||||||||||||||||||||||||||||||||||||||||||||
Per unit operating performance (1) | ||||||||||||||||||||||||||||||||||||||||||||||||||||||||||||||||||||||||
Net asset value, December 31, 2011 | $ | 99.40 | $ | 103.96 | $ | 100.25 | $ | 104.83 | $ | 136.13 | $ | 161.97 | $ | 161.96 | $ | 121.71 | $ | 127.23 | $ | 99.40 | $ | 103.96 | $ | 100.25 | $ | 104.83 | $ | 136.13 | $ | 161.97 | $ | 161.96 | $ | 121.71 | $ | 127.23 | ||||||||||||||||||||||||||||||||||||
Net operating results: | ||||||||||||||||||||||||||||||||||||||||||||||||||||||||||||||||||||||||
Interest income | 0.87 | 0.91 | 1.00 | 1.05 | 1.35 | 1.64 | 1.64 | 1.23 | 1.29 | 1.29 | 1.35 | 1.46 | 1.54 | 2.01 | 2.06 | 2.41 | 1.83 | 2.15 | ||||||||||||||||||||||||||||||||||||||||||||||||||||||
Expenses | (4.23 | ) | (3.30 | ) | (3.80 | ) | (2.83 | ) | (6.62 | ) | (6.25 | ) | (6.25 | ) | (6.02 | ) | (4.92 | ) | (6.87 | ) | (5.51 | ) | (6.40 | ) | (5.00 | ) | (10.98 | ) | (8.71 | ) | (10.19 | ) | (9.98 | ) | (9.09 | ) | ||||||||||||||||||||||||||||||||||||
Net gain/(loss) on investments, net of non-controlling interests | 1.56 | 1.42 | 4.59 | 4.60 | (2.79 | ) | (3.16 | ) | (3.17 | ) | (1.66 | ) | (2.06 | ) | 4.00 | 3.85 | 9.61 | 9.79 | 8.24 | 9.96 | 11.15 | 9.86 | 10.36 | |||||||||||||||||||||||||||||||||||||||||||||||||
|
|
|
|
|
|
|
|
|
|
|
|
|
|
|
|
|
| |||||||||||||||||||||||||||||||||||||||||||||||||||||||
Net income/(loss) | (1.80 | ) | (0.97 | ) | 1.79 | 2.82 | (8.06 | ) | (7.77 | ) | (7.78 | ) | (6.45 | ) | (5.69 | ) | (1.58 | ) | (0.30 | ) | 4.67 | 6.34 | (0.72 | ) | 3.31 | 3.37 | 1.71 | 3.41 | ||||||||||||||||||||||||||||||||||||||||||||
|
|
|
|
|
|
|
|
|
|
|
|
|
|
|
|
|
| |||||||||||||||||||||||||||||||||||||||||||||||||||||||
Net asset value, June 30, 2012 | $ | 97.60 | $ | 102.99 | $ | 102.04 | $ | 107.65 | $ | 128.07 | $ | 154.20 | $ | 154.18 | $ | 115.26 | $ | 121.54 | ||||||||||||||||||||||||||||||||||||||||||||||||||||||
Net asset value, September 30, 2012 | $ | 97.82 | $ | 103.66 | $ | 104.92 | $ | 111.17 | $ | 135.41 | $ | 165.28 | $ | 165.33 | $ | 123.42 | $ | 130.64 | ||||||||||||||||||||||||||||||||||||||||||||||||||||||
|
|
|
|
|
|
|
|
|
|
|
|
|
|
|
|
|
| |||||||||||||||||||||||||||||||||||||||||||||||||||||||
Ratios to average net assets (3) | ||||||||||||||||||||||||||||||||||||||||||||||||||||||||||||||||||||||||
Net investment income/(loss) | -5.58 | % | -3.39 | % | -5.62 | % | -3.42 | % | -7.15 | % | -5.07 | % | -5.07 | % | -7.27 | % | -5.08 | % | -6.71 | % | -4.53 | % | -6.23 | % | -4.06 | % | -10.80 | % | -5.27 | % | -5.91 | % | -8.41 | % | -6.51 | % | ||||||||||||||||||||||||||||||||||||
Expenses before incentive fees (6) | 6.08 | % | 3.90 | % | 7.31 | % | 5.12 | % | 8.47 | % | 6.42 | % | 6.43 | % | 8.62 | % | 6.44 | % | 6.02 | % | 3.85 | % | 7.29 | % | 5.13 | % | 11.99 | % | 5.45 | % | 6.38 | % | 8.90 | % | 7.25 | % | ||||||||||||||||||||||||||||||||||||
Expenses after incentive fees (6) | 7.34 | % | 5.16 | % | 7.63 | % | 5.44 | % | 9.15 | % | 7.11 | % | 7.11 | % | 9.30 | % | 7.12 | % | 8.43 | % | 6.27 | % | 8.17 | % | 6.01 | % | 13.50 | % | 6.96 | % | 7.89 | % | 10.41 | % | 8.76 | % | ||||||||||||||||||||||||||||||||||||
Total return before incentive fees (2) | -0.55 | % | 0.33 | % | 2.10 | % | 3.01 | % | -5.24 | % | -4.12 | % | -4.12 | % | -4.62 | % | -3.79 | % | 0.82 | % | 2.12 | % | 5.54 | % | 6.93 | % | 0.98 | % | 3.56 | % | 3.59 | % | 2.92 | % | 4.19 | % | ||||||||||||||||||||||||||||||||||||
Total return after incentive fees (2) | -1.81 | % | -0.93 | % | 1.79 | % | 2.69 | % | -5.92 | % | -4.80 | % | -4.80 | % | -5.30 | % | -4.47 | % | -1.59 | % | -0.29 | % | 4.66 | % | 6.05 | % | -0.53 | % | 2.04 | % | 2.08 | % | 1.40 | % | 2.68 | % | ||||||||||||||||||||||||||||||||||||
| Balanced Series | Frontier Select Series (4) | Balanced Series (7) | Frontier Select Series (4) | Currency Series | ||||||||||||||||||||||||||||||||||||||||||||||||||||||||||||
| Class 1 | Class 1a | Class 2 | Class 2a | Class 3a | Class 1 | Class 2 | Class 1 | Class 1a | Class 2 | Class 2a | Class 3a | Class 1 | Class 2 | Class 1 | Class 2 | |||||||||||||||||||||||||||||||||||||||||||||||||
Per unit operating performance (1) | ||||||||||||||||||||||||||||||||||||||||||||||||||||||||||||||||
Net asset value, December 31, 2011 | $ | 124.50 | $ | 108.45 | $ | 155.02 | $ | 128.35 | $ | 128.36 | $ | 91.02 | $ | 111.84 | $ | 124.50 | $ | 108.45 | $ | 155.02 | $ | 128.35 | $ | 128.36 | $ | 91.02 | $ | 111.84 | $ | 70.48 | $ | 87.61 | ||||||||||||||||||||||||||||||||
Net operating results: | ||||||||||||||||||||||||||||||||||||||||||||||||||||||||||||||||
Interest income | 0.10 | 0.08 | 0.12 | 0.10 | 0.10 | 0.21 | 0.26 | 0.11 | 0.09 | 0.14 | 0.11 | 0.11 | 0.40 | 0.50 | 0.00 | 0.00 | ||||||||||||||||||||||||||||||||||||||||||||||||
Expenses | (4.68 | ) | (4.00 | ) | (3.57 | ) | (2.93 | ) | (2.97 | ) | (3.33 | ) | (2.50 | ) | (7.93 | ) | (6.87 | ) | (6.50 | ) | (5.37 | ) | (5.40 | ) | (5.07 | ) | (3.84 | ) | (1.90 | ) | (0.48 | ) | ||||||||||||||||||||||||||||||||
Net gain/(loss) on investments, net of non-controlling interests | 2.73 | 3.60 | 3.44 | 3.47 | 3.05 | (1.61 | ) | (2.56 | ) | 6.11 | 10.89 | 7.63 | 7.05 | 6.64 | (1.05 | ) | (1.37 | ) | (4.44 | ) | (5.54 | ) | ||||||||||||||||||||||||||||||||||||||||||
|
|
|
|
|
|
|
|
|
|
|
|
|
|
|
| |||||||||||||||||||||||||||||||||||||||||||||||||
Net income/(loss) | (1.85 | ) | (0.32 | ) | (0.01 | ) | 0.64 | 0.18 | (4.73 | ) | (4.80 | ) | (1.71 | ) | 4.13 | 1.28 | 1.80 | 1.36 | (5.72 | ) | (4.72 | ) | (6.34 | ) | (6.02 | ) | ||||||||||||||||||||||||||||||||||||||
|
|
|
|
|
|
|
|
|
|
|
|
|
|
|
| |||||||||||||||||||||||||||||||||||||||||||||||||
Net asset value, June 30, 2012 | $ | 122.65 | $ | 108.13 | $ | 155.01 | $ | 128.99 | $ | 128.54 | $ | 86.29 | $ | 107.04 | ||||||||||||||||||||||||||||||||||||||||||||||||||
Net asset value, September 30, 2012 | $ | 122.79 | $ | 112.58 | $ | 156.30 | $ | 130.15 | $ | 129.72 | $ | 85.30 | $ | 107.12 | $ | 64.14 | $ | 81.59 | ||||||||||||||||||||||||||||||||||||||||||||||
|
|
|
|
|
|
|
|
|
|
|
|
|
|
|
| |||||||||||||||||||||||||||||||||||||||||||||||||
Ratios to average net assets (3) | ||||||||||||||||||||||||||||||||||||||||||||||||||||||||||||||||
Net investment income/(loss) (7) | -6.08 | % | -5.99 | % | -3.11 | % | -3.10 | % | -3.12 | % | -6.77 | % | -3.89 | % | ||||||||||||||||||||||||||||||||||||||||||||||||||
Net investment income/(loss) | -7.47 | % | -9.21 | % | -4.53 | % | -4.52 | % | -4.53 | % | -6.78 | % | -3.92 | % | -3.59 | % | -0.72 | % | ||||||||||||||||||||||||||||||||||||||||||||||
Expenses before incentive fees (6) | 4.86 | % | 4.77 | % | 1.90 | % | 1.88 | % | 1.91 | % | 7.07 | % | 4.19 | % | 4.82 | % | 6.59 | % | 1.88 | % | 1.87 | % | 1.88 | % | 7.18 | % | 4.33 | % | 3.59 | % | 0.72 | % | ||||||||||||||||||||||||||||||||
Expenses after incentive fees (6) | 6.23 | % | 6.14 | % | 3.27 | % | 3.25 | % | 3.28 | % | 7.23 | % | 4.35 | % | 7.59 | % | 9.37 | % | 4.65 | % | 4.64 | % | 4.65 | % | 7.37 | % | 4.52 | % | 3.59 | % | 0.72 | % | ||||||||||||||||||||||||||||||||
Total return before incentive fees (2) | -0.11 | % | 1.08 | % | 1.37 | % | 1.87 | % | 1.51 | % | -5.04 | % | -4.13 | % | 1.40 | % | 6.58 | % | 3.60 | % | 4.17 | % | 3.83 | % | -6.10 | % | -4.03 | % | -9.00 | % | -6.87 | % | ||||||||||||||||||||||||||||||||
Total return after incentive fees (2) | -1.49 | % | -0.30 | % | -0.01 | % | 0.50 | % | 0.14 | % | -5.20 | % | -4.29 | % | -1.37 | % | 3.81 | % | 0.83 | % | 1.40 | % | 1.06 | % | -6.28 | % | -4.22 | % | -9.00 | % | -6.87 | % | ||||||||||||||||||||||||||||||||
| Winton Series | Frontier Heritage Series (5) | Winton Series | Frontier Heritage Series (5) | |||||||||||||||||||||||||||||
| Class 1 | Class 2 | Class 1 | Class 2 | Class 1 | Class 2 | Class 1 | Class 2 | |||||||||||||||||||||||||
Per unit operating performance (1) | ||||||||||||||||||||||||||||||||
Net asset value, December 31, 2011 | $ | 141.13 | $ | 165.82 | $ | 104.73 | $ | 129.70 | $ | 141.13 | $ | 165.82 | $ | 104.73 | $ | 129.70 | ||||||||||||||||
Net operating results: | ||||||||||||||||||||||||||||||||
Interest income | 0.74 | 0.88 | 0.20 | 0.25 | 1.12 | 1.33 | 0.33 | 0.41 | ||||||||||||||||||||||||
Expenses | (4.09 | ) | (2.40 | ) | (4.12 | ) | (3.20 | ) | (6.13 | ) | (3.63 | ) | (6.00 | ) | (4.61 | ) | ||||||||||||||||
Net gain/(loss) on investments, net of non-controlling interests | (6.06 | ) | (7.18 | ) | (4.76 | ) | (5.97 | ) | (4.40 | ) | (5.25 | ) | (0.26 | ) | (0.37 | ) | ||||||||||||||||
|
|
|
|
|
|
|
| |||||||||||||||||||||||||
Net income/(loss) | (9.41 | ) | (8.70 | ) | (8.68 | ) | (8.92 | ) | (9.40 | ) | (7.54 | ) | (5.93 | ) | (4.57 | ) | ||||||||||||||||
|
|
|
|
|
|
|
| |||||||||||||||||||||||||
Net asset value, June 30, 2012 | $ | 131.72 | $ | 157.12 | $ | 96.05 | $ | 120.78 | ||||||||||||||||||||||||
Net asset value, September 30, 2012 | $ | 131.73 | $ | 158.28 | $ | 98.80 | $ | 125.13 | ||||||||||||||||||||||||
|
|
|
|
|
|
|
| |||||||||||||||||||||||||
Ratios to average net assets (3) | ||||||||||||||||||||||||||||||||
Net investment income/(loss) | -4.78 | % | -1.85 | % | -7.54 | % | -4.59 | % | -4.72 | % | -1.84 | % | -7.22 | % | -4.32 | % | ||||||||||||||||
Expenses before incentive fees (6) | 5.84 | % | 2.92 | % | 7.93 | % | 4.98 | % | 5.78 | % | 2.91 | % | 7.63 | % | 4.74 | % | ||||||||||||||||
Expenses after incentive fees (6) | 5.84 | % | 2.92 | % | 7.93 | % | 4.98 | % | 5.78 | % | 2.91 | % | 7.63 | % | 4.74 | % | ||||||||||||||||
Total return before incentive fees (2) | -6.67 | % | -5.25 | % | -8.29 | % | -6.88 | % | -6.66 | % | -4.55 | % | -5.66 | % | -3.52 | % | ||||||||||||||||
Total return after incentive fees (2) | -6.67 | % | -5.25 | % | -8.29 | % | -6.88 | % | -6.66 | % | -4.55 | % | -5.66 | % | -3.52 | % | ||||||||||||||||
| (1) | Interest income and expenses per unit are calculated by dividing these amounts by the average number of units outstanding during the period. The net gain/(loss) on investments, net of non-controlling interests is a balancing amount necessary to reconcile the change in net asset value per unit with the other per unit information. |
| (2) | Impact of incentive fee computed using average net assets, otherwise computed using average units outstanding during the |
| (3) | Annualized with the exception of incentive fees. |
| (4) | Formerly the Tiverton/Graham/Transtrend Series. |
| (5) | Formerly the Winton/Graham Series. |
| (6) | Expense ratios do not reflect interest allocated to the Managing Owner as such expenses are not included in the Statements of Operations of the Series, see footnote 6. |
| (7) |
Per unit operating performance (1) Net asset value, March 31, 2012 Net operating results: Interest income Expenses Net gain/(loss) on investments, net of non-controlling interests Net income/(loss) Net asset value, June 30, 2012 Ratios to average net assets (3) Net investment income/(loss) (7) Expenses before incentive fees (6) Expenses after incentive fees (6) Total return before incentive fees (2) Total return after incentive fees (2) Frontier Diversified Series Frontier Masters Series Frontier Long/Short Commodity Series Class 1 Class 2 Class 1 Class 2 Class 1 Class 2 Class 3 Class 1a Class 2a $ 95.23 $ 100.04 $ 100.95 $ 106.02 $ 134.21 $ 160.88 $ 160.87 $ 120.55 $ 126.57 0.42 0.44 0.49 0.52 0.67 0.81 0.81 0.60 0.63 (2.75 ) (2.32 ) (1.97 ) (1.50 ) (3.65 ) (3.52 ) (3.52 ) (3.28 ) (2.77 ) 4.70 4.83 2.57 2.61 (3.16 ) (3.97 ) (3.98 ) (2.61 ) (2.89 ) 2.37 2.95 1.09 1.63 (6.14 ) (6.68 ) (6.69 ) (5.29 ) (5.03 ) $ 97.60 $ 102.99 $ 102.04 $ 107.65 $ 128.07 $ 154.20 $ 154.18 $ 115.26 $ 121.54 -5.81 % -3.52 % -5.38 % -3.24 % -7.19 % -5.06 % -5.06 % -7.21 % -5.06 % 6.31 % 4.02 % 7.19 % 5.05 % 8.61 % 6.49 % 6.49 % 8.64 % 6.49 % 7.59 % 5.30 % 7.34 % 5.21 % 9.19 % 7.07 % 7.07 % 9.22 % 7.07 % 3.77 % 4.23 % 1.24 % 6.79 % -3.99 % -3.57 % -3.58 % -3.81 % -3.39 % 2.49 % 2.95 % 1.08 % 1.54 % -4.57 % -4.15 % -4.16 % -4.39 % -3.97 %
| Balanced Series | Frontier Select Series (4) | |||||||||||||||||||||||||||
| Class 1 | Class 1a | Class 2 | Class 2a | Class 3a | Class 1 | Class 2 | ||||||||||||||||||||||
Per unit operating performance (1) | ||||||||||||||||||||||||||||
Net asset value, March 31, 2012 | $ | 119.12 | $ | 103.87 | $ | 149.44 | $ | 123.84 | $ | 123.85 | $ | 89.63 | $ | 110.92 | ||||||||||||||
Net operating results: | ||||||||||||||||||||||||||||
Interest income | 0.02 | 0.02 | 0.02 | 0.02 | 0.02 | 0.17 | 0.21 | |||||||||||||||||||||
Expenses | (3.14 | ) | (2.73 | ) | (2.80 | ) | (2.32 | ) | (2.32 | ) | (1.86 | ) | (1.52 | ) | ||||||||||||||
Net gain/(loss) on investments, net of non-controlling interests | 6.65 | 6.97 | 8.35 | 7.45 | 6.99 | (1.65 | ) | (2.57 | ) | |||||||||||||||||||
|
|
|
|
|
|
|
|
|
|
|
|
|
| |||||||||||||||
Net income/(loss) | 3.53 | 4.26 | 5.57 | 5.15 | 4.69 | (3.34 | ) | (3.88 | ) | |||||||||||||||||||
|
|
|
|
|
|
|
|
|
|
|
|
|
| |||||||||||||||
Net asset value, June 30, 2012 | $ | 122.65 | $ | 108.13 | $ | 155.01 | $ | 128.99 | $ | 128.54 | $ | 86.29 | $ | 107.04 | ||||||||||||||
|
|
|
|
|
|
|
|
|
|
|
|
|
| |||||||||||||||
Ratios to average net assets (3) | ||||||||||||||||||||||||||||
Net investment income/(loss) (7) | -6.33 | % | -6.31 | % | -3.24 | % | -3.24 | % | -3.24 | % | -7.07 | % | -4.24 | % | ||||||||||||||
Expenses before incentive fees (6) | 5.06 | % | 5.04 | % | 1.97 | % | 1.97 | % | 1.97 | % | 7.65 | % | 4.83 | % | ||||||||||||||
Expenses after incentive fees (6) | 6.40 | % | 6.37 | % | 3.30 | % | 3.30 | % | 3.31 | % | 7.82 | % | 5.00 | % | ||||||||||||||
Total return before incentive fees (2) | 4.30 | % | 5.44 | % | 5.06 | % | 5.49 | % | 5.12 | % | -3.56 | % | -3.33 | % | ||||||||||||||
Total return after incentive fees (2) | 2.96 | % | 4.10 | % | 3.73 | % | 4.16 | % | 3.79 | % | -3.73 | % | -3.50 | % | ||||||||||||||
| Winton Series | Frontier Heritage Series (5) | |||||||||||||||
| Class 1 | Class 2 | Class 1 | Class 2 | |||||||||||||
Per unit operating performance (1) | ||||||||||||||||
Net asset value, March 31, 2012 | $ | 138.00 | $ | 163.35 | $ | 104.37 | $ | 130.23 | ||||||||
Net operating results: | ||||||||||||||||
Interest income | 0.38 | 0.46 | 0.12 | 0.16 | ||||||||||||
Expenses | (2.02 | ) | (1.20 | ) | (2.07 | ) | (1.65 | ) | ||||||||
Net gain/(loss) on investments, net of non-controlling interests | (4.64 | ) | (5.49 | ) | (6.37 | ) | (7.96 | ) | ||||||||
|
|
|
|
|
|
|
| |||||||||
Net income/(loss) | (6.28 | ) | (6.23 | ) | (8.32 | ) | (9.45 | ) | ||||||||
|
|
|
|
|
|
|
| |||||||||
Net asset value, June 30, 2012 | $ | 131.72 | $ | 157.12 | $ | 96.05 | $ | 120.78 | ||||||||
|
|
|
|
|
|
|
| |||||||||
Ratios to average net assets (3) | ||||||||||||||||
Net investment income/(loss) (7) | -4.75 | % | -1.82 | % | -7.48 | % | -4.59 | % | ||||||||
Expenses before incentive fees (6) | 5.87 | % | 2.94 | % | 7.96 | % | 5.07 | % | ||||||||
Expenses after incentive fees (6) | 5.87 | % | 2.94 | % | 7.96 | % | 5.07 | % | ||||||||
Total return before incentive fees (2) | -4.55 | % | -3.81 | % | -7.97 | % | -7.26 | % | ||||||||
Total return after incentive fees (2) | -4.55 | % | -3.81 | % | -7.97 | % | -7.26 | % | ||||||||
8. Derivative Instruments and Hedging Activities
The Series’ primary business is to engage in speculative trading of a diversified portfolio of futures, forwards (including interbank foreign currencies), options contracts and other derivative instruments (including swap contracts). The Series do not enter into or hold positions for hedging purposes as defined under ASC 815,Derivatives and Hedging (“ASC 815”). The detail of the fair value of the Series’ derivatives by instrument types as of JuneSeptember 30, 2013 and December 31, 2012 is included in the Condensed Schedules of Investments. See Note 4 for further disclosure related to each Series’ position in swap contracts.
The following tables summarize the monthly averages of futures contracts bought and sold for each respective Series of the Trust:
For The Three Months Ended JuneSeptember 30, 2013
| Monthly average contracts: | Bought | Sold | Bought | Sold | ||||||||||||
Frontier Long/Short Commodity Series | 3,670 | 3,741 | 2,500 | 2,879 | ||||||||||||
Balanced Series | 6,978 | 7,692 | 3,338 | 3,090 | ||||||||||||
For The SixNine Months Ended JuneSeptember 30, 2013
| Monthly average contracts: | Bought | Sold | ||||||
Frontier Long/Short Commodity Series | 7,163 | 7,146 | ||||||
Balanced Series | 15,942 | 16,826 | ||||||
Diversified Series | 8 | 29 | ||||||
Frontier Long/Short Commodity Series Balanced Series Diversified SeriesMonthly average contracts: Bought Sold 9,663 10,026 19,280 19,916 8 29
For The Three Months Ended JuneSeptember 30, 2012
| Monthly average contracts: | Bought | Sold | Bought | Sold | ||||||||||||
Frontier Long/Short Commodity Series | 4,900 | 5,200 | 3,308 | 3,232 | ||||||||||||
Balanced Series | 22,800 | 24,800 | 16,100 | 15,192 | ||||||||||||
Frontier Masters Series | 600 | 850 | 728 | 692 | ||||||||||||
For The SixNine Months Ended JuneSeptember 30, 2012
| Monthly average contracts: | Bought | Sold | Bought | Sold | ||||||||||||
Frontier Long/Short Commodity Series | 9,500 | 10,800 | 12,808 | 14,032 | ||||||||||||
Balanced Series | 19,300 | 22,300 | 35,400 | 37,492 | ||||||||||||
Diversified Series | 900 | 700 | 1,628 | 1,392 | ||||||||||||
The following tables summarize the trading revenues for the nine and three months ended September 30, 2013 and 2012 by contract type:
Realized Trading Revenue from Futures, Forwards and Options
for the Three Months Ended JuneSeptember 30, 2013
| Frontier Long/Short | ||||||||||||
Type of contract | Commodity Series | Balanced Series | Diversified Series | |||||||||
Metals | $ | 32,204 | $ | 7,011,103 | $ | (141,927 | ) | |||||
Currencies | (609,122 | ) | (1,953,068 | ) | — | |||||||
Energies | 1,049,306 | (4,808,497 | ) | — | ||||||||
Agriculturals | (351,544 | ) | (2,116,456 | ) | — | |||||||
Interest rates | 1,441,317 | 2,643,275 | — | |||||||||
Stock indices | 222,432 | 4,059,147 | — | |||||||||
|
|
|
|
|
| |||||||
Realized trading income/(loss)(2) | $ | 1,784,593 | $ | 4,835,504 | $ | (141,927 | ) | |||||
|
|
|
|
|
| |||||||
Type of contract Metals Currencies Energies Agriculturals Interest rates Stock indices Realized trading income/(loss)(2) Realized Trading Revenue from Futures, Forwards and Options for the Nine Months Ended September, 2013 Type of contract Metals Currencies Energies Agriculturals Interest rates Stock indices Realized trading income/(loss)(2) Realized Trading Revenue from Futures, Forwards and Options Frontier Long/Short Commodity Series Balanced Series Diversified Series $ (578,871 ) $ (510,734 ) $ — (107,754 ) (763,525 ) — (4,807,731 ) 143,757 — (235,520 ) (602,859 ) — (933,919 ) 2,847,561 — 538,242 69,417 — $ (6,125,553 ) $ 1,183,617 $ — Frontier Long/Short Commodity Series Balanced Series Diversified Series $ (1,422,087 ) $ 3,773,562 $ (630,122 ) 611,059 (3,026,628 ) 1,300,655 (7,454,776 ) (4,634,133 ) (3,465 ) (756,506 ) (4,192,086 ) 8,936 745,377 (7,701,383 ) (88,186 ) 2,020,392 14,089,121 146,263 $ (6,256,541 ) $ (1,691,547 ) $ 734,081
for the Six Months Ended June 30, 2013
| Frontier Long/Short | ||||||||||||
Type of contract | Commodity Series | Balanced Series | Diversified Series | |||||||||
Metals | $ | (843,216 | ) | $ | 4,284,296 | $ | (630,122 | ) | ||||
Currencies | 718,813 | (2,263,103 | ) | 1,300,655 | ||||||||
Energies | (2,647,045 | ) | (4,777,890 | ) | (3,465 | ) | ||||||
Agriculturals | (520,986 | ) | (3,589,227 | ) | 8,936 | |||||||
Interest rates | 1,679,296 | (10,548,944 | ) | (88,186 | ) | |||||||
Stock indices | 1,482,150 | 14,019,704 | 146,263 | |||||||||
|
|
|
|
|
| |||||||
Realized trading income/(loss)(2) | $ | (130,988 | ) | $ | (2,875,164 | ) | $ | 734,081 | ||||
|
|
|
|
|
| |||||||
Net Change in Open Trade Equity from Futures, Forwards and Options
for the Three Months Ended JuneSeptember 30, 2013
| Frontier Long/Short | ||||||||||||
Type of contract | Commodity Series | Balanced Series | Diversified Series | |||||||||
Metals | $ | (96,233 | ) | $ | 1,695,301 | $ | 141,927 | |||||
Currencies | 95,841 | (2,201,380 | ) | — | ||||||||
Energies | (3,316,552 | ) | (326,412 | ) | — | |||||||
Agriculturals | (34,697 | ) | 891,699 | — | ||||||||
Interest rates | (1,436,420 | ) | (1,783,752 | ) | — | |||||||
Stock indices | (61,201 | ) | 845,525 | — | ||||||||
|
|
|
|
|
| |||||||
Change in unrealized trading income/(loss)(3) | $ | (4,849,262 | ) | $ | (879,019 | ) | $ | 141,927 | ||||
|
|
|
|
|
| |||||||
Net Change in Open Trade Equity from Futures, Forwards and Options
for the Six Months Ended June 30, 2013
| Frontier Long/Short | ||||||||||||
Type of contract | Commodity Series | Balanced Series | Diversified Series | |||||||||
Metals | $ | 11,852 | $ | (782,565 | ) | $ | — | |||||
Currencies | (79,163 | ) | 47,821 | — | ||||||||
Energies | 3,968,251 | (249,184 | ) | — | ||||||||
Agriculturals | (485,107 | ) | (314,017 | ) | — | |||||||
Interest rates | 193,720 | 660,515 | — | |||||||||
Stock indices | (166,426 | ) | (819,898 | ) | — | |||||||
|
|
|
|
|
| |||||||
Change in unrealized trading income/(loss)(3) | $ | 3,443,127 | $ | (1,457,328 | ) | $ | — | |||||
|
|
|
|
|
| |||||||
Net Change in Open Trade Equity from Futures, Forwards and Options
for the Nine Months Ended September 30, 2013
|
| |||||||||||
| Frontier Long/Short | ||||||||||||
Type of contract | Commodity Series | Balanced Series | Diversified Series | |||||||||
Metals | $ | 267,939 | $ | 3,276,949 | $ | 608,392 | ||||||
Currencies | (290,944 | ) | (2,720,964 | ) | (1,191,389 | ) | ||||||
Energies | 2,247,845 | (1,905,647 | ) | 2,210 | ||||||||
Agriculturals | (77,320 | ) | 192,134 | (21,226 | ) | |||||||
Interest rates | (1,557,340 | ) | 315,767 | 79,060 | ||||||||
Stock indices | (537,723 | ) | 584,436 | (43,824 | ) | |||||||
|
|
|
|
|
| |||||||
Change in unrealized trading income/(loss)(3) | $ | 52,457 | $ | (257,325 | ) | $ | (566,777 | ) | ||||
|
|
|
|
|
| |||||||
| Frontier Long/Short | ||||||||||||
Type of contract | Commodity Series | Balanced Series | Diversified0 Series | |||||||||
Metals | $ | 256,087 | $ | 4,059,514 | $ | 608,392 | ||||||
Currencies | (211,781 | ) | (2,768,785 | ) | (1,191,389 | ) | ||||||
Energies | (1,720,406 | ) | (1,656,463 | ) | 2,210 | |||||||
Agriculturals | 407,787 | 506,151 | (21,226 | ) | ||||||||
Interest rates | (1,751,060 | ) | (344,748 | ) | 79,060 | |||||||
Stock indices | (371,297 | ) | 1,404,334 | (43,824 | ) | |||||||
|
|
|
|
|
| |||||||
Change in unrealized trading income/(loss)(3) | $ | (3,390,670 | ) | $ | 1,200,003 | $ | (566,777 | ) | ||||
|
|
|
|
|
| |||||||
| (1) | The Frontier Diversified Series, Frontier Masters Series, Frontier Select Series (formerly |
| (2) | Amounts recorded in the Statements of Operations under Net realized gain(loss) on futures, forwards and options. |
| (3) | Amounts recorded in the Statements of Operations under Net change in open trade equity (deficit). |
Realized Trading Revenue from Futures, Forwards and Options
for the Three Months Ended JuneSeptember 30, 2012(1)
| Frontier Masters | Frontier Long/Short | |||||||||||
Type of contract | Series | Commodity Series | Balanced Series | |||||||||
Metals | $ | 99,291 | $ | (1,677,876 | ) | $ | 2,332,233 | |||||
Currencies | (473,164 | ) | (235,066 | ) | (2,388,145 | ) | ||||||
Energies | 14,790 | 34,352,451 | (4,231,063 | ) | ||||||||
Agriculturals | 425,957 | 2,686,329 | (520,012 | ) | ||||||||
Interest rates | 2,859,124 | 2,176,263 | 27,168,392 | |||||||||
Stock indices | (779,039 | ) | (1,724,817 | ) | (4,630,679 | ) | ||||||
|
|
|
|
|
| |||||||
Realized trading income/(loss)(2) | $ | 2,146,959 | $ | 35,577,284 | $ | 17,730,726 | ||||||
|
|
|
|
|
| |||||||
Realized Trading Revenue from Futures, Forwards and Options
for the Six Months Ended June 30, 2012(1)
| Frontier Masters | Frontier Long/Short | Frontier Long/Short | Frontier Masters | |||||||||||||||||||||
Type of contract | Series | Commodity Series | Balanced Series | Commodity Series | Series | Balanced Series | ||||||||||||||||||
Metals | $ | 816,013 | $ | (20,393,846 | ) | $ | 430,705 | $ | 1,035,617 | $ | (83,958 | ) | $ | (999,514 | ) | |||||||||
Currencies | (147,672 | ) | (8,733,333 | ) | (3,251,701 | ) | (223,060 | ) | 644,753 | 7,244,212 | ||||||||||||||
Energies | 181,404 | 30,002,301 | (4,673,106 | ) | (36,916,109 | ) | (1,030,886 | ) | (2,887,295 | ) | ||||||||||||||
Agriculturals | 689,127 | (4,184,798 | ) | (1,218,225 | ) | (1,784,729 | ) | (160,749 | ) | (153,297 | ) | |||||||||||||
Interest rates | 3,335,231 | (10,254,458 | ) | 25,905,238 | (463,226 | ) | 479,790 | 12,318,263 | ||||||||||||||||
Stock indices | (1,435,950 | ) | 15,426,518 | (2,887,837 | ) | 1,066,555 | 777,791 | 3,920,788 | ||||||||||||||||
|
|
|
|
|
| |||||||||||||||||||
Realized trading income/(loss)(2) | $ | 3,438,153 | $ | 1,862,384 | $ | 14,305,074 | $ | (37,284,952 | ) | $ | 626,741 | $ | 19,443,157 | |||||||||||
|
|
|
|
|
| |||||||||||||||||||
Realized Trading Revenue from Futures, Forwards and Options
for the Nine Months Ended September 30, 2012(1)
|
Realized Trading Revenue from Futures, Forwards and Options
for the Nine Months Ended September 30, 2012(1)
|
| ||||||||||||||||||||||
| Frontier Long/Short | Frontier Masters | |||||||||||||||||||||||
Type of contract | Commodity Series | Series | Balanced Series | |||||||||||||||||||||
Metals | $ | (19,358,229 | ) | $ | 732,055 | $ | (568,809 | ) | ||||||||||||||||
Currencies | (8,956,393 | ) | 497,081 | 3,992,511 | ||||||||||||||||||||
Energies | (6,913,808 | ) | (849,482 | ) | (7,560,401 | ) | ||||||||||||||||||
Agriculturals | (5,969,527 | ) | 528,378 | (1,371,522 | ) | |||||||||||||||||||
Interest rates | (10,717,684 | ) | 3,815,021 | 38,223,501 | ||||||||||||||||||||
Stock indices | 16,493,073 | (658,159 | ) | 1,032,951 | ||||||||||||||||||||
|
|
| ||||||||||||||||||||||
Realized trading income/(loss)(2) | $ | (35,422,568 | ) | $ | 4,064,894 | $ | 33,748,231 | |||||||||||||||||
|
|
| ||||||||||||||||||||||
Net Change in Open Trade Equity from Futures, Forwards and Options
for the Three Months Ended JuneSeptember 30, 2012(1)
| Frontier Long/Short | Frontier Masters | |||||||||||
Type of contract | Commodity Series | Series | Balanced Series | |||||||||
Metals | $ | 73,309 | $ | 1,459,679 | $ | 1,533,584 | ||||||
Currencies | 126,798 | (264,914 | ) | 3,530,131 | ||||||||
Energies | (530,107 | ) | (37,248,330 | ) | (708,342 | ) | ||||||
Agriculturals | (200,335 | ) | 2,054,984 | (1,493,002 | ) | |||||||
Interest rates | (98,472 | ) | (2,523,016 | ) | 1,398,865 | |||||||
Stock indices | 105,906 | 645,276 | 633,403 | |||||||||
|
|
|
|
|
| |||||||
Change in unrealized trading income/(loss)(3) | (522,901 | ) | $ | (35,876,321 | ) | $ | 4,894,639 | |||||
|
|
|
|
|
| |||||||
Net Change in Open Trade Equity from Futures, Forwards and Options
for the Six Months Ended June 30, 2012(1)
| Frontier Masters | Frontier Long/Short | Frontier Long/Short | Frontier Masters | |||||||||||||||||||||
Type of contract | Series | Commodity Series | Balanced Series | Commodity Series | Series | Balanced Series | ||||||||||||||||||
Metals | $ | 31,892 | $ | 5,226,482 | $ | 1,233,499 | $ | 977,265 | $ | 198,371 | $ | (1,564,940 | ) | |||||||||||
Currencies | (72,360 | ) | 17,848,325 | 2,087,126 | (49,765 | ) | (57,024 | ) | (2,430,043 | ) | ||||||||||||||
Energies | (601,387 | ) | (30,765,512 | ) | (1,224,801 | ) | 33,718,036 | (105,715 | ) | 192,441 | ||||||||||||||
Agriculturals | (222,467 | ) | 4,067,889 | (1,653,362 | ) | 6,164,516 | (8,816 | ) | (994,834 | ) | ||||||||||||||
Interest rates | (84,647 | ) | (3,780,373 | ) | 1,499,033 | (367,133 | ) | 210,079 | 4,121,352 | |||||||||||||||
Stock indices | 100,587 | 1,129,051 | 594,863 | (999,355 | ) | (395,190 | ) | (2,197,371 | ) | |||||||||||||||
|
|
|
|
|
| |||||||||||||||||||
Change in unrealized trading income/(loss)(3) | (848,382 | ) | $ | (6,274,138 | ) | $ | 2,536,358 | $ | 39,443,564 | $ | (158,295 | ) | $ | (2,873,395 | ) | |||||||||
|
|
|
|
|
| |||||||||||||||||||
Net Change in Open Trade Equity from Futures, Forwards and Options
for the Nine Months Ended September 30, 2012(1)
| Net Change in Open Trade Equity from Futures, Forwards and Options
for the Nine Months Ended September 30, 2012(1)
|
| ||||||||||||||||||||||
| Frontier Long/Short | Frontier Masters | |||||||||||||||||||||||
Type of contract | Commodity Series | Series | Balanced Series | |||||||||||||||||||||
Metals | $ | 6,203,747 | $ | 230,263 | $ | (331,441 | ) | |||||||||||||||||
Currencies | 17,798,560 | (129,384 | ) | (342,917 | ) | |||||||||||||||||||
Energies | 2,952,524 | (707,102 | ) | (1,032,360 | ) | |||||||||||||||||||
Agriculturals | 10,232,405 | (231,283 | ) | (2,648,196 | ) | |||||||||||||||||||
Interest rates | (4,147,506 | ) | 125,432 | 5,620,385 | ||||||||||||||||||||
Stock indices | 129,696 | (294,603 | ) | (1,602,508 | ) | |||||||||||||||||||
|
|
| ||||||||||||||||||||||
Change in unrealized trading income/(loss)(3) | $ | 33,169,426 | $ | (1,006,677 | ) | $ | (337,037 | ) | ||||||||||||||||
|
|
| ||||||||||||||||||||||
| (1) | The Frontier Diversified Series, |
| (2) | Amounts recorded in the Statements of Operations under Net realized gain(loss) on futures, forwards and options. |
| (3) | Amounts recorded in the Statements of Operations under Net change in open trade equity. |
Certain financial instruments and derivative instruments are eligible for offset in the statements of financial condition under U.S. GAAP. The Series’ open trade equity/(deficit), options written, and receivablereceivables from Futures Commissions Merchants (each, an “FCM”) are subject to master netting arrangements and collateral arrangements and meet the U.S. GAAP guidance to qualify for offset. A master netting arrangement with a counterparty creates a right of offset for amounts due to and from that same counterparty that is enforceable in the event of a default or bankruptcy. The Series’ policy is to recognize amounts subject to master netting arrangements on a net basis on the statements of financial condition.
The following tables present gross and net information about the Series’ assets and liabilities subject to master netting arrangements as disclosed on the statements of financial condition as of JuneSeptember 30, 2013 and December 31, 2012.
Offsetting of Derivative Assets and Liabilities
As of JuneSeptember 30, 2013
| Gross Amounts of recognized Derivative Assets | Gross Amounts of recognized Derivative Liabilities | Net Amounts of Derivative Assets and Liabilities Presented in the Statements of Financial Condition | ||||||||||
Frontier Long/Short Commodity Series | ||||||||||||
Open Trade Equity/(Deficit) | $ | 12,043,993 | $ | (14,751,210 | ) | $ | (2,707,217 | ) | ||||
Options Written | — | (320,050 | ) | (320,050 | ) | |||||||
Receivable from Futures Commissions Merchants | 21,217,269 | (7,074,763 | ) | 14,142,506 | ||||||||
Balanced Series | ||||||||||||
Open Trade Equity/(Deficit) | $ | 4,962,501 | $ | (4,525,623 | ) | $ | 436,878 | |||||
Options Written | — | (144,318 | ) | (144,318 | ) | |||||||
Receivable from Futures Commissions Merchants | 27,807,069 | (5,787,760 | ) | 22,019,309 | ||||||||
As of December 31, 2012
| Gross Amounts of recognized Derivative Assets | Gross Amounts of recognized Derivative Liabilities | Net Amounts of Derivative Assets and Liabilities Presented in the Statements of Financial Condition | Gross Amounts of recognized Derivative Assets | Gross Amounts of recognized Derivative Liabilities | Net Amounts of Derivative Assets and Liabilities Presented in the Statements of Financial Condition | |||||||||||||||||||
Frontier Long/Short Commodity Series | ||||||||||||||||||||||||
Open Trade Equity/(Deficit) | $ | 3,314,175 | $ | (4,133,710 | ) | $ | (819,535 | ) | $ | 324,075 | $ | (524,366 | ) | $ | (200,291 | ) | ||||||||
Options Written | — | (928,690 | ) | (928,690 | ) | — | (29,302 | ) | (29,302 | ) | ||||||||||||||
Receivable from Futures Commissions Merchants | 22,276,098 | (7,505,125 | ) | 14,770,973 | 11,641,316 | (4,719,275 | ) | 6,922,041 | ||||||||||||||||
Balanced Series | ||||||||||||||||||||||||
Open Trade Equity/(Deficit) | $ | 4,215,436 | $ | (4,887,947 | ) | $ | (672,511 | ) | $ | 954,671 | $ | (1,152,345 | ) | $ | (197,674 | ) | ||||||||
Options Written | — | (165,363 | ) | (165,363 | ) | — | (467,791 | ) | (467,791 | ) | ||||||||||||||
Receivable from Futures Commissions Merchants | 98,277,094 | (6,233,501 | ) | 92,043,593 | 26,647,861 | (5,699,593 | ) | 20,948,268 | ||||||||||||||||
| As of December 31, 2012 | ||||||||||||||||||||||||
| Gross Amounts of recognized Derivative Assets | Gross Amounts of recognized Derivative Liabilities | Net Amounts of Derivative Assets and Liabilities Presented in the Statements of Financial Condition | ||||||||||||||||||||||
| Frontier Long/Short Commodity Series | ||||||||||||||||||||||||
Open Trade Equity/(Deficit) | $ | 3,314,175 | $ | (4,133,710 | ) | $ | (819,535 | ) | ||||||||||||||||
Options Written | — | (928,690 | ) | (928,690 | ) | |||||||||||||||||||
Receivable from Futures Commissions Merchants | 22,276,098 | (7,505,125 | ) | 14,770,973 | ||||||||||||||||||||
| Balanced Series | ||||||||||||||||||||||||
Open Trade Equity/(Deficit) | $ | 4,215,436 | $ | (4,887,947 | ) | $ | (672,511 | ) | ||||||||||||||||
Options Written | — | (165,363 | ) | (165,363 | ) | |||||||||||||||||||
Receivable from Futures Commissions Merchants | 98,277,094 | (6,233,501 | ) | 92,043,593 | ||||||||||||||||||||
Trading Activities and Related Risks
The purchase and sale of futures and options on futures contracts require margin deposits with Futures Commission Merchants (each, an “FCM”).FCMs. Additional deposits may be necessary for any loss on contract value. The Commodity Exchange Act requires an FCM to segregate all customer transactions and assets from the FCM’s proprietary activities. A customer’s cash and other property (for example, U.S. Treasurytreasury bills) deposited with an FCM are considered commingled with all other customer funds subject to the FCM’s segregation requirements. In the event of an FCM’s insolvency, recovery may be limited to a pro rata share of segregated funds available. It is possible that the recovered amount could be less than the total of cash and other property deposited.
The term “off-balance sheet risk” refers to an unrecorded potential liability that, even though it does not appear on the statements of financial condition, may result in future obligation or loss in excess of the amount paid by the Series for a particular investment. Each Trading Company expects to trade in futures, options, forward and swap contracts and will therefore be a party to financial instruments with elements of off-balance sheet market and credit risk. In entering into these contracts, there exists a market risk that such contracts may be significantly influenced by market conditions, such as interest rate volatility, resulting in such contracts being less valuable. If the markets should move against all of the futures positions held by a Trading Company in respect of any Series at the same time, and if the Trading Advisor(s) of such Trading Company are unable to offset such futures interests positions, such Trading Company could lose all of its assets and the holders of Units of such Series would realize a 100% loss. The Managing Owner will seek to minimize market risk through real-time monitoring of open positions and the level of diversification of each Trading Advisor’s portfolio. It is anticipated that any Trading Advisor’s margin-to-equity ratio will typically not exceed approximately 35% although the actual ratio could be higher or lower from time to time.
In addition to market risk, trading futures, forward and swap contracts entails credit risk in that a counterparty will not be able to meet its obligations to a Trading Company. The counterparty for futures contracts traded in the United States and on most foreign exchanges is the clearinghouse associated with such exchange. In general, clearinghouses are backed by the corporate members of the clearinghouse who are required to share any financial burden resulting from the non-performance by one of their members and, as such, should significantly reduce this credit risk. In cases where the clearinghouse is not backed by the clearing members, like some foreign exchanges, it is normally backed by a consortium of banks or other financial institutions. Some non-U.S. exchanges, in contrast to U.S. exchanges, are principals’ markets in which performance is the responsibility only of the individual counterparty with whom the Trading Company has entered into the transaction, and not of the exchange or clearing corporation. In these kinds of markets, there is risk of bankruptcy or other failure or refusal to perform by the counterparty.
In the case of forward contracts traded on the interbank market and swaps, neither is traded on exchanges. The counterparty is generally a single bank or other financial institution, rather than a group of financial institutions; thus there may be a greater counterparty credit risk. The Managing Owner expects the Trading Advisors to trade only with those counterparties which it believes to be creditworthy. All positions of each Trading Company will be valued each day on a mark-to-market basis. There can be no assurance that any clearing member, clearinghouse or other counterparty will be able to meet its obligations to any Trading Company.
The Managing Owner has established procedures to actively monitor and minimize market and credit risks. The Limited Owners bear the risk of loss only to the extent of the market value of their respective investments and, in certain specific circumstances, distributions and redemptions received.
10. Indemnifications and Guarantees
The Trust has entered into agreements, which provide for the indemnification of futures clearing brokers, and commodity trading advisers, among others, against losses, costs, claims and liabilities arising from the performance of their individual obligations under such agreements, except for gross negligence or bad faith. The Trust has had no prior claims or payments pursuant to these agreements. The Trust’s individual maximum exposure under these arrangements is unknown, as this would involve future claims that may be made against the Trust that have not yet occurred. However, based on experience the Trust expects the risk of loss to be remote. Maximum exposure is unfulfilled obligations of the Series up to the amount of equity at risk with UBS of the referenced Series as allocated from the Trading Company. The Series have not recorded any liability for the guarantees in the accompanying financial statements as it expects any possibility of losses to be remote.
The Trust has guaranteed the obligations of the trading companiesTrading Companies under the customer agreements with UBS Securities as Clearing Broker. In the event that one Series of the Trust is unable to meet its obligations to UBS Securities, the assets of the other Series will be available to UBS Securities as part of the guarantee, but only to the extent of such Series’ pro rata allocation to the trading company.Trading Company. The Series have not recorded any liability for the indemnifications in the accompanying financial statement, as it expects any possibility of losses to be remote.
11. Subsequent Events
None.
The Frontier Fund
Consolidated Statements of Financial Condition
JuneSeptember 30, 2013 and December 31, 2012
| 6/30/2013 | 12/31/2012 | 9/30/2013 | 12/31/2012 | |||||||||||||
| (unaudited) | (unaudited) | |||||||||||||||
| ASSETS | ||||||||||||||||
Cash and cash equivalents | $ | 5,194,516 | $ | 17,094,782 | $ | 6,977,345 | $ | 17,094,782 | ||||||||
U.S. Treasury securities, at fair value | — | 18,001,322 | — | 18,001,322 | ||||||||||||
Custom time deposits | 269,529,099 | 311,468,033 | 235,460,358 | 311,468,033 | ||||||||||||
Receivable from futures commission merchants | 106,016,204 | 148,029,229 | 66,740,407 | 148,029,229 | ||||||||||||
Open trade equity, at fair value | 8,452,103 | 12,116,649 | 6,943,192 | 12,116,649 | ||||||||||||
Swap contracts, at fair value | 21,876,339 | 22,289,479 | 17,152,321 | 22,289,479 | ||||||||||||
Prepaid service fees | 73,666 | 140,203 | 38,307 | 140,203 | ||||||||||||
Interest receivable | 609 | 251,630 | 985 | 251,630 | ||||||||||||
Receivables from related parties | 161,795 | — | 3,420 | — | ||||||||||||
Other assets | 50 | 35,043 | 50 | 35,043 | ||||||||||||
|
|
|
| |||||||||||||
Total Assets | $ | 411,304,381 | $ | 529,426,370 | $ | 333,316,385 | $ | 529,426,370 | ||||||||
|
|
|
| |||||||||||||
| LIABILITIES & CAPITAL | ||||||||||||||||
LIABILITIES | ||||||||||||||||
Open trade deficit, at fair value | $ | — | $ | — | ||||||||||||
Written options, at fair value | $ | 2,376,367 | $ | 4,199,198 | 1,586,908 | 4,199,198 | ||||||||||
Pending owner additions | 41,064 | 160,672 | 95,106 | 160,672 | ||||||||||||
Owner redemptions payable | 1,994,477 | 1,430,638 | 1,533,440 | 1,430,638 | ||||||||||||
Incentive fees payable to Managing Owner | — | 732,119 | — | 732,119 | ||||||||||||
Management fees payable to Managing Owner | 698,964 | 1,003,663 | 601,625 | 1,003,663 | ||||||||||||
Interest payable to Managing Owner | 463,436 | 569,115 | 393,822 | 569,115 | ||||||||||||
Trading fees payable to Managing Owner | 487,886 | 602,333 | 398,688 | 602,333 | ||||||||||||
Service fees payable to Managing Owner | 502,668 | 652,500 | 436,778 | 652,500 | ||||||||||||
Payables to related parties | 33,137 | 38,925 | 10,884 | 38,925 | ||||||||||||
Other liabilities | 11,411 | 51,484 | 1,414 | 51,484 | ||||||||||||
|
|
|
| |||||||||||||
Total Liabilities | 6,609,410 | 9,440,647 | 5,058,665 | 9,440,647 | ||||||||||||
|
|
|
| |||||||||||||
CAPITAL | ||||||||||||||||
Managing Owner Units | 5,790,819 | 6,287,766 | 4,915,327 | 6,287,766 | ||||||||||||
Limited Owner Units | 398,904,152 | 513,697,957 | 323,342,393 | 513,697,957 | ||||||||||||
|
|
|
| |||||||||||||
Total Capital | 404,694,971 | 519,985,723 | 328,257,720 | 519,985,723 | ||||||||||||
|
|
|
| |||||||||||||
Total Liabilities and Capital | $ | 411,304,381 | $ | 529,426,370 | $ | 333,316,385 | $ | 529,426,370 | ||||||||
|
|
|
| |||||||||||||
The accompanying notes are an integral part of these consolidated financial statements.
The Frontier Fund
Consolidated Condensed Schedule of Investments
JuneSeptember 30, 2013 (Unaudited)
Description | Value | % of Total Capital (Net Asset Value) | Value | % of Total Capital (Net Asset Value) | ||||||||||||
LONG FUTURES CONTRACTS * | ||||||||||||||||
Various base metals futures contracts (Europe) | $ | 261,145 | 0.06 | % | $ | 6,997,426 | 2.13 | % | ||||||||
Various base metals futures contracts (U.S.) | 33,680 | 0.01 | % | 2,792 | 0.00 | % | ||||||||||
Various currency futures contracts (Far East) | (1,334 | ) | 0.00 | % | ||||||||||||
Various currency futures contracts (U.S.) | (1,533,630 | ) | -0.38 | % | 1,773,185 | 0.54 | % | |||||||||
Various energy futures contracts (U.S.) | (2,119,324 | ) | -0.52 | % | (1,119,566 | ) | -0.34 | % | ||||||||
Various energy futures contracts (Europe) | 19,780 | 0.01 | % | |||||||||||||
Various energy futures contracts (Far East) | (2,800 | ) | 0.00 | % | ||||||||||||
Various interest rates futures contracts (Canada) | 14,022 | 0.00 | % | 80,532 | 0.02 | % | ||||||||||
Various interest rates futures contracts (Europe) | (1,792,323 | ) | -0.44 | % | 1,027,305 | 0.31 | % | |||||||||
Various interest rates futures contracts (Far East) | 1,760 | 0.00 | % | 555,465 | 0.17 | % | ||||||||||
Various interest rates futures contracts (Oceanic) | 1,316 | 0.00 | % | 110,699 | 0.03 | % | ||||||||||
Various interest rates futures contracts (U.S.) | (2,667,730 | ) | -0.66 | % | 999,496 | 0.30 | % | |||||||||
Various precious metal futures contracts (Far East) | (4,376 | ) | 0.00 | % | ||||||||||||
Various precious metal futures contracts (U.S.) | 110,360 | 0.03 | % | (67,985 | ) | -0.02 | % | |||||||||
Various soft futures contracts (Canada) | (3,489 | ) | 0.00 | % | ||||||||||||
Various soft futures contracts (Europe) | 13,439 | 0.00 | % | 45,212 | 0.01 | % | ||||||||||
Various soft futures contracts (Far East) | (45,996 | ) | -0.01 | % | ||||||||||||
Various soft futures contracts (U.S.) | (1,092,693 | ) | -0.27 | % | (446,825 | ) | -0.14 | % | ||||||||
Various stock index futures contracts (Africa) | 11,856 | 0.00 | % | |||||||||||||
Various stock index futures contracts (Canada) | (1,084 | ) | 0.00 | % | (16,543 | ) | -0.01 | % | ||||||||
Various stock index futures contracts (Europe) | 43,033 | 0.01 | % | (650,446 | ) | -0.20 | % | |||||||||
Various stock index futures contracts (Far East) | 309,033 | 0.08 | % | (166,418 | ) | -0.05 | % | |||||||||
Various stock index futures contracts (Oceanic) | (822 | ) | 0.00 | % | (50,568 | ) | -0.02 | % | ||||||||
Various stock index futures contracts (U.S.) | (592,604 | ) | -0.15 | % | (865,840 | ) | -0.26 | % | ||||||||
|
|
|
| |||||||||||||
Total Long Futures Contracts | $ | (9,063,241 | ) | -2.24 | % | $ | 8,232,381 | 2.48 | % | |||||||
|
|
|
| |||||||||||||
OPTIONS PURCHASED * | ||||||||||||||||
Various base metals futures contracts (Europe) | $ | 6,668,785 | 1.65 | % | $ | 1,954,644 | 0.60 | % | ||||||||
Various currency futures contracts (U.S.) | 557,680 | 0.14 | % | |||||||||||||
Various energy futures contracts (U.S.) | 1,263,194 | 0.31 | % | 3,680 | 0.00 | % | ||||||||||
Various interest rates futures contracts (U.S.) | 30,188 | 0.01 | % | |||||||||||||
Various precious metal futures contracts (U.S.) | 158,760 | 0.05 | % | |||||||||||||
Various soft futures contracts (U.S.) | 1,358,386 | 0.34 | % | 385,991 | 0.12 | % | ||||||||||
Various stock index futures contracts (U.S.) | 1,660,224 | 0.41 | % | 607,233 | 0.19 | % | ||||||||||
|
|
|
| |||||||||||||
Total Options Purchased | $ | 11,508,269 | 2.85 | % | $ | 3,140,496 | 0.97 | % | ||||||||
|
|
|
| |||||||||||||
SHORT FUTURES CONTRACTS * | ||||||||||||||||
Various base metals futures contracts (Europe) | $ | 4,307,692 | 1.06 | % | $ | (5,397,548 | ) | -1.64 | % | |||||||
Various base metals futures contracts (U.S.) | 121,363 | 0.03 | % | (2,179 | ) | 0.00 | % | |||||||||
Various currency futures contracts (Far East) | 11,513 | 0.00 | % | |||||||||||||
Various currency futures contracts (U.S.) | 2,193,961 | 0.54 | % | (849,817 | ) | -0.26 | % | |||||||||
Various energy futures contracts (Europe) | 14,559 | 0.00 | % | (32,829 | ) | -0.01 | % | |||||||||
Various energy futures contracts (U.S.) | (1,684,351 | ) | -0.42 | % | 1,128,135 | 0.34 | % | |||||||||
Various interest rates futures contracts (Canada) | 53,986 | 0.01 | % | (118,726 | ) | -0.04 | % | |||||||||
Various interest rates futures contracts (Europe) | (305,931 | ) | -0.08 | % | (630,632 | ) | -0.19 | % | ||||||||
Various interest rates futures contracts (Far East) | (7,595 | ) | 0.00 | % | (143,487 | ) | -0.04 | % | ||||||||
Various interest rates futures contracts (Oceanic) | (68,115 | ) | -0.02 | % | (69,238 | ) | -0.02 | % | ||||||||
Various interest rates futures contracts (U.S.) | 696,049 | 0.17 | % | (811,364 | ) | -0.25 | % | |||||||||
Various precious metal futures contracts (U.S.) | 4,055,710 | 1.00 | % | 208,919 | 0.06 | % | ||||||||||
Various soft futures contracts (Canada) | 557 | 0.00 | % | 2,045 | 0.00 | % | ||||||||||
Various soft futures contracts (Europe) | 147,116 | 0.04 | % | 100,762 | 0.03 | % | ||||||||||
Various soft futures contracts (U.S.) | 2,119,822 | 0.52 | % | 1,386,530 | 0.42 | % | ||||||||||
Various stock index futures contracts (Africa) | 6,481 | 0.00 | % | |||||||||||||
Various stock index futures contracts (Canada) | 323 | 0.00 | % | |||||||||||||
Various stock index futures contracts (Europe) | (126,473 | ) | -0.03 | % | 1,068 | 0.00 | % | |||||||||
Various stock index futures contracts (Far East) | (267,090 | ) | -0.07 | % | 39,169 | 0.01 | % | |||||||||
Various stock index futures contracts (Oceanic) | (16,472 | ) | 0.00 | % | ||||||||||||
Various stock index futures contracts (U.S.) | (111,945 | ) | -0.03 | % | (36,084 | ) | -0.01 | % | ||||||||
|
|
|
| |||||||||||||
Total Short Futures Contracts | $ | 11,129,647 | 2.72 | % | $ | (5,213,763 | ) | -1.60 | % | |||||||
|
|
|
| |||||||||||||
CURRENCY FORWARDS * | ||||||||||||||||
Various currency forward contracts | $ | (5,122,572 | ) | -1.27 | % | $ | 784,078 | 0.24 | % | |||||||
|
|
|
| |||||||||||||
Total Currency Forwards | $ | (5,122,572 | ) | -1.27 | % | $ | 784,078 | 0.24 | % | |||||||
|
|
|
| |||||||||||||
Total Open Trade Equity | $ | 8,452,103 | 2.06 | % | $ | 6,943,192 | 2.09 | % | ||||||||
|
|
|
| |||||||||||||
OPTIONS WRITTEN * | ||||||||||||||||
Various base metals futures contracts (Europe) | $ | (1,126,947 | ) | -0.28 | % | $ | (606,485 | ) | -0.18 | % | ||||||
Various currency futures contracts (U.S.) | (82,650 | ) | -0.02 | % | (247,325 | ) | -0.08 | % | ||||||||
Various energy futures contracts (U.S.) | (56,030 | ) | -0.01 | % | ||||||||||||
Various precious metal futures contracts (U.S.) | (421,920 | ) | -0.10 | % | (215,530 | ) | -0.07 | % | ||||||||
Various soft futures contracts (U.S.) | (364,460 | ) | -0.09 | % | (49,615 | ) | -0.02 | % | ||||||||
Various stock index futures contracts (U.S.) | (324,360 | ) | -0.08 | % | (467,953 | ) | -0.14 | % | ||||||||
|
|
|
| |||||||||||||
Total Options Written | $ | (2,376,367 | ) | -0.58 | % | $ | (1,586,908 | ) | -0.49 | % | ||||||
|
|
|
| |||||||||||||
SWAPS (1) | ||||||||||||||||
Frontier Balanced RCW-1 Swap | $ | 16,811,679 | 4.15 | % | ||||||||||||
Frontier Brevan Howard DB Swap | 5,064,660 | 1.25 | % | |||||||||||||
Frontier XXXIV Balanced select swap (U.S.) | $ | 7,412,815 | 2.26 | % | ||||||||||||
Frontier Brevan Howard swap (U.S.) | 4,506,351 | 1.37 | % | |||||||||||||
Frontier XXXV Diversified select swap (U.S.) | 2,413,658 | 0.74 | % | |||||||||||||
Frontier XXXVII L/S select swap (U.S.) | 2,819,497 | 0.86 | % | |||||||||||||
|
|
|
| |||||||||||||
Total Swaps | $ | 21,876,339 | 5.40 | % | $ | 17,152,321 | 5.23 | % | ||||||||
|
|
|
| |||||||||||||
| (1) | See Notes to Financial Statements, Note 4. |
The accompanying notes are an integral part of these consolidated financial statements.
The Frontier Fund
Consolidated Condensed Schedule of Investments
December 31, 2012
Description | Value | % of Total Capital (Net Asset Value) | Value | % of Total Capital (Net Asset Value) | ||||||||||||
LONG FUTURES CONTRACTS * | ||||||||||||||||
Various stock index futures contracts (U.S.) | $ | (708,671 | ) | -0.14 | % | $ | (708,671 | ) | -0.14 | % | ||||||
Various stock index futures contracts (Oceanic) | 190,826 | 0.04 | % | 190,826 | 0.04 | % | ||||||||||
Various stock index futures contracts (Mexico) | 1,548 | 0.00 | % | 1,548 | 0.00 | % | ||||||||||
Various stock index futures contracts (Far East) | 3,549,518 | 0.68 | % | 3,549,518 | 0.68 | % | ||||||||||
Various stock index futures contracts (Europe) | (1,746,507 | ) | -0.34 | % | (1,746,507 | ) | -0.34 | % | ||||||||
Various stock index futures contracts (Canada) | 272,823 | 0.05 | % | 272,823 | 0.05 | % | ||||||||||
Various stock index futures contracts (Africa) | 97,909 | 0.02 | % | 97,909 | 0.02 | % | ||||||||||
Various soft futures contracts (U.S.) | (2,211,954 | ) | -0.43 | % | (2,211,954 | ) | -0.43 | % | ||||||||
Various soft futures contracts (Europe) | (145,288 | ) | -0.03 | % | (145,288 | ) | -0.03 | % | ||||||||
Various soft futures contracts (Canada) | (335 | ) | 0.00 | % | (335 | ) | 0.00 | % | ||||||||
Various precious metal futures contracts (U.S.) | (756,478 | ) | -0.15 | % | (756,478 | ) | -0.15 | % | ||||||||
Various interest rates futures contracts (U.S.) | (609,966 | ) | -0.12 | % | (609,966 | ) | -0.12 | % | ||||||||
Various interest rates futures contracts (Oceanic) | 298,169 | 0.06 | % | 298,169 | 0.06 | % | ||||||||||
Various interest rates futures contracts (Far East) | (428,542 | ) | -0.08 | % | (428,542 | ) | -0.08 | % | ||||||||
Various interest rates futures contracts (Europe) | 2,592,153 | 0.50 | % | 2,592,153 | 0.50 | % | ||||||||||
Various interest rates futures contracts (Canada) | (120,227 | ) | -0.02 | % | (120,227 | ) | -0.02 | % | ||||||||
Various energy futures contracts (U.S.) | 13,149,004 | 2.53 | % | 13,149,004 | 2.53 | % | ||||||||||
Various energy futures contracts (Far East) | 462 | 0.00 | % | 462 | 0.00 | % | ||||||||||
Various currency futures contracts (U.S.) | (2,156,861 | ) | -0.41 | % | (2,156,861 | ) | -0.41 | % | ||||||||
Various base metals futures contracts (U.S.) | (9,439 | ) | 0.00 | % | (9,439 | ) | 0.00 | % | ||||||||
Various base metals futures contracts (Europe) | 3,463,404 | 0.67 | % | 3,463,404 | 0.67 | % | ||||||||||
|
|
|
| |||||||||||||
Total Long Futures Contracts | $ | 14,721,548 | 2.83 | % | $ | 14,721,548 | 2.83 | % | ||||||||
|
|
|
| |||||||||||||
OPTIONS PURCHASED * | ||||||||||||||||
Various stock index futures contracts (U.S.) | $ | 439,170 | 0.08 | % | $ | 439,170 | 0.08 | % | ||||||||
Various soft futures contracts (U.S.) | 1,320,884 | 0.25 | % | 1,320,884 | 0.25 | % | ||||||||||
Various precious metals futures contracts (U.S.) | 711,000 | 0.14 | % | 711,000 | 0.14 | % | ||||||||||
Various energy futures contracts (U.S.) | 6,285,280 | 1.21 | % | 6,285,280 | 1.21 | % | ||||||||||
Various currency futures contracts (U.S.) | 2,901,488 | 0.56 | % | 2,901,488 | 0.56 | % | ||||||||||
Various base metals futures contracts (Europe) | 2,277,291 | 0.44 | % | 2,277,291 | 0.44 | % | ||||||||||
|
|
|
| |||||||||||||
Total Options Purchased | $ | 13,935,113 | 2.68 | % | $ | 13,935,113 | 2.68 | % | ||||||||
|
|
|
| |||||||||||||
SHORT FUTURES CONTRACTS * | ||||||||||||||||
Various base metals futures contracts (U.S.) | $ | (76,900 | ) | -0.01 | % | $ | (76,900 | ) | -0.01 | % | ||||||
Various base metals futures contracts (Europe) | (7,712,906 | ) | -1.48 | % | (7,712,906 | ) | -1.48 | % | ||||||||
Various currency futures contracts (U.S.) | 3,852,251 | 0.74 | % | 3,852,251 | 0.74 | % | ||||||||||
Various currency futures contracts (Canada) | - | 0.00 | % | — | 0.00 | % | ||||||||||
Various currencey futures contracts (Far East) | 684 | 0.00 | % | 684 | 0.00 | % | ||||||||||
Various stock index futures contracts (U.S.) | (373,552 | ) | -0.07 | % | (373,552 | ) | -0.07 | % | ||||||||
Various stock index futures contracts (Europe) | 86,644 | 0.02 | % | 86,644 | 0.02 | % | ||||||||||
Various stock index futures contracts (Far East) | (630,695 | ) | -0.12 | % | (630,695 | ) | -0.12 | % | ||||||||
Various stock index futures contracts (Canada) | (6,159 | ) | 0.00 | % | (6,159 | ) | 0.00 | % | ||||||||
Various soft futures contracts (U.S.) | 2,445,673 | 0.47 | % | 2,445,673 | 0.47 | % | ||||||||||
Various soft futures contracts (Europe) | 122,990 | 0.02 | % | 122,990 | 0.02 | % | ||||||||||
Various interest rates futures contracts (U.S.) | (385,887 | ) | -0.07 | % | (385,887 | ) | -0.07 | % | ||||||||
Various interest rates futures contracts (Oceanic) | (17,218 | ) | 0.00 | % | (17,218 | ) | 0.00 | % | ||||||||
Various interest rates futures contracts (Far East) | 197,000 | 0.04 | % | 197,000 | 0.04 | % | ||||||||||
Various interest rates futures contracts (Europe) | (1,273 | ) | 0.00 | % | (1,273 | ) | 0.00 | % | ||||||||
Various interest rates futures contracts (Canada) | 81,091 | 0.02 | % | 81,091 | 0.02 | % | ||||||||||
Various precious metal futures contracts (U.S.) | 476,388 | 0.09 | % | 476,388 | 0.09 | % | ||||||||||
Various energy futures contracts (U.S.) | (15,297,097 | ) | -2.94 | % | (15,297,097 | ) | -2.94 | % | ||||||||
Various energy futures contracts (Europe) | 7,109 | 0.00 | % | 7,109 | 0.00 | % | ||||||||||
|
|
|
| |||||||||||||
Total Short Futures Contracts | $ | (17,231,857 | ) | -3.29 | % | $ | (17,231,857 | ) | -3.29 | % | ||||||
|
|
|
| |||||||||||||
CURRENCY FORWARDS * | ||||||||||||||||
Various currency futures contracts | $ | 691,845 | 0.13 | % | $ | 691,845 | 0.13 | % | ||||||||
|
|
|
| |||||||||||||
Total Currency Forwards | $ | 691,845 | 0.13 | % | $ | 691,845 | 0.13 | % | ||||||||
|
|
|
| |||||||||||||
Total Open Trade Equity | $ | 12,116,649 | 2.35 | % | $ | 12,116,649 | 2.35 | % | ||||||||
|
|
|
| |||||||||||||
OPTIONS WRITTEN * | ||||||||||||||||
Various stock index futures contracts (U.S.) | $ | (165,363 | ) | -0.03 | % | $ | (165,363 | ) | -0.03 | % | ||||||
Various soft futures contracts (U.S.) | (447,693 | ) | -0.09 | % | (447,693 | ) | -0.09 | % | ||||||||
Various precious metal futures contracts (U.S.) | (540,330 | ) | -0.10 | % | (540,330 | ) | -0.10 | % | ||||||||
Various currency futures contracts (U.S.) | (1,340,750 | ) | -0.26 | % | (1,340,750 | ) | -0.26 | % | ||||||||
Various base metals futures contracts (Europe) | (261,172 | ) | -0.05 | % | ||||||||||||
Various base metals futures contracts(Europe) | (261,172 | ) | -0.05 | % | ||||||||||||
Various energy futures contracts (U.S.) | (1,443,890 | ) | -0.28 | % | (1,443,890 | ) | -0.28 | % | ||||||||
|
|
|
| |||||||||||||
Total Options Written | $ | (4,199,198 | ) | -0.81 | % | $ | (4,199,198 | ) | -0.81 | % | ||||||
|
|
|
| |||||||||||||
SWAPS (1) | ||||||||||||||||
Frontier Balanced RCW-1 Swap (U.S.) | $ | 17,785,733 | 3.42 | % | ||||||||||||
Frontier Balanced DB Swap (U.S.) | 2,702,247 | 0.52 | % | |||||||||||||
Frontier Currency DB Swap (U.S.) | 1,801,498 | 0.35 | % | |||||||||||||
Frontier Balanced RCW-1 Swap(U.S.) | $ | 17,785,733 | 3.42 | % | ||||||||||||
Frontier Balanced DB Swap(U.S.) | 2,702,247 | 0.52 | % | |||||||||||||
Frontier Currency DB Swap(U.S.) | 1,801,498 | 0.35 | % | |||||||||||||
|
|
|
| |||||||||||||
Total Swaps | $ | 22,289,478 | 4.29 | % | $ | 22,289,478 | 4.29 | % | ||||||||
|
|
|
| |||||||||||||
U.S. TREASURY SECURITIES | ||||||||||||||||
FACE VALUE | Fair Value | Fair Value | Fair Value | Fair Value | ||||||||||||||||
| $36,700,000 | U.S. Treasury Note 4.000% due 02/15/2015 (Cost $38,016,039) | $ | 18,001,322 | 3.46 | % | U.S. Treasury Note 4.000% due 02/15/2015 (Cost $38,016,039) | 18,001,322 | 3.46 | % | |||||||||||
|
|
|
| |||||||||||||||||
Total U.S. Treasury Securities | $ | 18,001,322 | 3.46 | % | Total U.S. Treasury Securities | 18,001,322 | 3.46 | % | ||||||||||||
|
|
|
| |||||||||||||||||
| * | Except for those items disclosed, no individual futures, forwards and option on futures contract position constituted greater than 1 percent of Net Asset Value. Accordingly, the number of contracts and expiration dates are not presented. |
| (1) | See Notes to the Consolidated Financial Statements, Note 4. |
The accompanying notes are an integral part of these consolidated financial statements.
The Frontier Fund
Consolidated Statements of Operations
For the Three Months Ended JuneSeptember 30, 2013 and JuneSeptember 30, 2012 (Unaudited)
| 6/30/2013 | 6/30/2012 | 9/30/2013 | 9/30/2012 | |||||||||||||
Investment income: | ||||||||||||||||
Interest - net | $ | 1,264,444 | $ | 1,406,920 | $ | 1,140,637 | $ | 1,377,089 | ||||||||
|
|
|
| |||||||||||||
Total Income | 1,264,444 | 1,406,920 | 1,140,637 | 1,377,089 | ||||||||||||
|
|
|
| |||||||||||||
Expenses: | ||||||||||||||||
Incentive Fees | 433,445 | 5,389,883 | — | 5,789,666 | ||||||||||||
Management Fees | 2,224,373 | 3,290,628 | 1,981,543 | 3,191,672 | ||||||||||||
Service Fees - Class 1 | 1,979,570 | 2,631,478 | 1,650,323 | 2,540,950 | ||||||||||||
Trading Fees | 1,585,219 | 1,983,352 | 1,281,476 | 1,987,736 | ||||||||||||
|
|
|
| |||||||||||||
Total Expenses | 6,222,607 | 13,295,341 | 4,913,342 | 13,510,024 | ||||||||||||
|
|
|
| |||||||||||||
Investment income/(loss) - net | (4,958,163 | ) | (11,888,421 | ) | (3,772,705 | ) | (12,132,935 | ) | ||||||||
|
|
|
| |||||||||||||
Realized and unrealized gain/(loss) on investments: | ||||||||||||||||
Net realized gain/(loss) on futures, forwards and options | (16,977,918 | ) | 49,258,596 | (18,537,056 | ) | (14,031,019 | ) | |||||||||
Net change in open trade equity/(deficit) | (3,856,110 | ) | (32,606,226 | ) | 2,716,062 | 36,395,403 | ||||||||||
Net realized gain/(loss) on swap contracts | (1,908,743 | ) | — | (1,646,391 | ) | — | ||||||||||
Net unrealized gain/(loss) on swap contracts | 231,605 | 682,682 | (2,600,517 | ) | 259,527 | |||||||||||
Net realized gain/(loss) on U.S. Treasury securities | — | 491,966 | — | — | ||||||||||||
Net unrealized gain/(loss) on U.S. Treasury securities | — | (649,773 | ) | — | (173,695 | ) | ||||||||||
Trading commissions | (1,642,520 | ) | (2,214,178 | ) | (1,106,569 | ) | (1,914,850 | ) | ||||||||
Net realized gain/(loss) on investment in Berkeley Quantitative Colorado Fund LLC | — | — | ||||||||||||||
Net unrealized gain/(loss) on investment in Berkeley Quantitative Colorado Fund LLC | — | 3,894 | ||||||||||||||
|
|
|
| |||||||||||||
Net gain/(loss) on investments | (24,153,686 | ) | 14,966,961 | (21,174,471 | ) | 20,535,366 | ||||||||||
|
|
|
| |||||||||||||
NET INCREASE/(DECREASE) IN CAPITAL RESULTING FROM OPERATIONS | $ | (29,111,849 | ) | $ | 3,078,540 | $ | (24,947,176 | ) | $ | 8,402,431 | ||||||
|
|
|
| |||||||||||||
The accompanying notes are an integral part of these consolidated financial statements.
The Frontier Fund
Consolidated Statements of Operations
For the SixNine Months Ended JuneSeptember 30, 2013 and JuneSeptember 30, 2012 (Unaudited)
| 6/30/2013 | 6/30/2012 | 9/30/2013 | 9/30/2012 | |||||||||||||
Investment income: | ||||||||||||||||
Interest - net | $ | 2,562,817 | $ | 2,957,625 | $ | 3,703,455 | $ | 4,334,714 | ||||||||
|
|
|
| |||||||||||||
Total Income | 2,562,817 | 2,957,625 | 3,703,455 | 4,334,714 | ||||||||||||
|
|
|
| |||||||||||||
Expenses: | ||||||||||||||||
Incentive Fees | 889,025 | 5,673,583 | 889,025 | 11,463,249 | ||||||||||||
Management Fees | 4,727,150 | 6,567,116 | 6,708,693 | 9,758,788 | ||||||||||||
Service Fees - Class 1 | 4,067,740 | 5,439,667 | 5,718,063 | 7,980,617 | ||||||||||||
Trading Fees | 3,251,764 | 4,031,386 | 4,533,240 | 6,019,122 | ||||||||||||
|
|
|
| |||||||||||||
Total Expenses | 12,935,679 | 21,711,752 | 17,849,021 | 35,221,776 | ||||||||||||
|
|
|
| |||||||||||||
Investment income/(loss) - net | (10,372,862 | ) | (18,754,127 | ) | (14,145,566 | ) | (30,887,062 | ) | ||||||||
|
|
|
| |||||||||||||
Realized and unrealized gain/(loss) on investments: | ||||||||||||||||
Net realized gain/(loss) on futures, forwards and options | (12,672,241 | ) | 19,524,518 | (31,209,297 | ) | 5,493,499 | ||||||||||
Net change in open trade equity/(deficit) | (1,136,263 | ) | (11,078,556 | ) | 1,579,799 | 25,316,847 | ||||||||||
Net realized gain/(loss) on swap contracts | (1,908,743 | ) | (525,237 | ) | (3,555,134 | ) | (525,237 | ) | ||||||||
Net unrealized gain/(loss) on swap contracts | (163,140 | ) | 1,278,911 | (2,763,657 | ) | 1,538,438 | ||||||||||
Net realized gain/(loss) on U.S. Treasury securities | 1,078,008 | 854,738 | 1,078,008 | 854,738 | ||||||||||||
Net unrealized gain/(loss) on U.S. Treasury securities | (1,154,477 | ) | (1,658,750 | ) | (1,157,776 | ) | (1,832,445 | ) | ||||||||
Trading commissions | (2,897,887 | ) | (4,136,787 | ) | (4,004,456 | ) | (6,051,637 | ) | ||||||||
Net realized gain/(loss) on investment in Berkeley Quantitative Colorado Fund LLC | — | (2,172,987 | ) | — | (2,172,987 | ) | ||||||||||
Net unrealized gain/(loss) on investment in Berkeley Quantitative Colorado Fund LLC | — | 2,084,880 | — | 2,084,880 | ||||||||||||
|
|
|
| |||||||||||||
Net gain/(loss) on investments | (18,854,743 | ) | 4,170,730 | (40,032,513 | ) | 24,706,096 | ||||||||||
|
|
|
| |||||||||||||
NET INCREASE/(DECREASE) IN CAPITAL RESULTING FROM OPERATIONS | $ | (29,227,605 | ) | $ | (14,583,397 | ) | $ | (54,178,079 | ) | $ | (6,180,966 | ) | ||||
|
|
|
| |||||||||||||
The accompanying notes are an integral part of these consolidated financial statements.
The Frontier Fund
Consolidated Statement of Changes in Owners’ Capital
For the SixNine Months Ended JuneSeptember 30, 2013 (Unaudited)
| Managing Owner | Limited Owners | Total | Managing Owner | Limited Owners | Total | |||||||||||||||||||
Owners’ Capital, December 31, 2012 | $ | 6,287,766 | $ | 513,697,957 | $ | 519,985,723 | $ | 6,287,766 | $ | 513,697,957 | $ | 519,985,723 | ||||||||||||
Sale of Units | 61,988 | 5,880,903 | 5,942,891 | 61,988 | 8,782,285 | 8,844,273 | ||||||||||||||||||
Redemption of Units | (61,990 | ) | (91,944,048 | ) | (92,006,038 | ) | (561,990 | ) | (145,832,207 | ) | (146,394,197 | ) | ||||||||||||
Net increase/(decrease) in Owners’ Capital resulting from operations | (496,945 | ) | (28,730,660 | ) | (29,227,605 | ) | (872,437 | ) | (53,305,642 | ) | (54,178,079 | ) | ||||||||||||
|
|
|
|
|
| |||||||||||||||||||
Owners’ Capital, June 30, 2013 | $ | 5,790,819 | $ | 398,904,152 | $ | 404,694,971 | ||||||||||||||||||
Owners’ Capital, September 30, 2013 | $ | 4,915,327 | $ | 323,342,393 | $ | 328,257,720 | ||||||||||||||||||
|
|
|
|
|
| |||||||||||||||||||
The consolidated Trust is not unitized as are the individual Series of the Trust
The accompanying notes are an integral part of these consolidated financial statements.
The Frontier Fund
Consolidated Statements of Cash Flows
For the SixNine Months Ended JuneSeptember 30, 2013 and 2012
(Unaudited)
| 2013 | 2012 | 2013 | 2012 | |||||||||||||
Cash Flows from Operating Activities: | ||||||||||||||||
Net increase/(decrease) in capital resulting from operations | $ | (29,227,605 | ) | $ | (14,583,397 | ) | $ | (54,178,079 | ) | $ | (6,180,966 | ) | ||||
Adjustments to reconcile net increase/(decrease) in capital resulting from operations to net cash provided by (used in) operating activities: | ||||||||||||||||
Change in: | ||||||||||||||||
Net change in open trade equity | 3,664,546 | 7,925,259 | 5,173,457 | (25,416,521 | ) | |||||||||||
Net change in options written | (1,822,831 | ) | 1,640,111 | (2,612,290 | ) | 1,285,103 | ||||||||||
Net change in allocation of total return swaps | 3,501 | |||||||||||||||
Net unrealized gain/(loss) on swap contracts | 163,140 | (1,278,911 | ) | 2,763,657 | (1,538,438 | ) | ||||||||||
Net realized gain/(loss) on swap contracts | 1,908,743 | 525,237 | 3,555,134 | 525,237 | ||||||||||||
Net unrealized gain/(loss) on U.S. Treasury securities | 1,154,477 | 1,658,750 | 1,157,776 | 1,832,445 | ||||||||||||
Net realized gain/(loss) on U.S. Treasuries securities | (1,078,008 | ) | (854,738 | ) | (1,078,008 | ) | (854,738 | ) | ||||||||
Net realized gain/(loss) on investment in Berkeley Colorado Quantitative Fund LLC | — | 2,172,987 | — | 2,172,987 | ||||||||||||
Net unrealized gain/loss on investment in Berkeley Colorado Quantitative Fund LLC | — | (2,084,880 | ) | — | (2,084,880 | ) | ||||||||||
(Purchases) sales of: | ||||||||||||||||
Sales of swap contracts | 4,341,257 | 10,362 | 20,694,866 | 9,812 | ||||||||||||
(Purchases) of swap contracts | (6,000,000 | ) | — | (21,880,000 | ) | — | ||||||||||
Sales of U.S. Treasury securities | 17,924,853 | 37,817,176 | 17,921,554 | 37,864,769 | ||||||||||||
Sales of custom time deposits | 41,938,934 | 25,151,234 | 76,007,675 | 25,000,000 | ||||||||||||
Interest rollover of custom time deposits | — | — | — | (2,897,700 | ) | |||||||||||
Sales of Berkeley Colorado Quantitative Fund LLC | — | 6,182,737 | — | 6,182,737 | ||||||||||||
Increase and/or decrease in: | ||||||||||||||||
Receivable from futures commission merchants | 42,013,025 | (29,230,081 | ) | 81,288,822 | 8,116,123 | |||||||||||
Control of ownership of trading companies | — | — | — | — | ||||||||||||
Contributions to trading companies | — | — | — | — | ||||||||||||
Distributions from trading companies | — | — | — | — | ||||||||||||
Prepaid service fees | 66,537 | 163,920 | 101,896 | 141,468 | ||||||||||||
Interest receivable | 251,021 | 533,154 | 250,645 | 901,235 | ||||||||||||
Receivable from related parties | (161,795 | ) | (8,994 | ) | (3,420 | ) | — | |||||||||
Other assets | 34,993 | (78,951 | ) | 34,993 | (230,951 | ) | ||||||||||
Incentive fees payable to Managing Owner | (732,119 | ) | 3,557,713 | (732,119 | ) | 3,953,375 | ||||||||||
Management fees payable to Managing Owner | (304,699 | ) | (108,704 | ) | (402,038 | ) | (113,885 | ) | ||||||||
Interest payable to Managing Owner | (105,679 | ) | (113,893 | ) | (175,293 | ) | (117,504 | ) | ||||||||
Trading fees payable to Managing Owner | (114,447 | ) | (34,619 | ) | (203,645 | ) | (129,642 | ) | ||||||||
Service fees payable to Managing Owner | (149,832 | ) | (79,800 | ) | (215,722 | ) | (41,149 | ) | ||||||||
Payables to related parties | (5,788 | ) | (1,733 | ) | (28,041 | ) | 42,580 | |||||||||
Other liabilities | (40,073 | ) | 50,882 | (50,070 | ) | 217,665 | ||||||||||
|
|
|
| |||||||||||||
Net cash provided by (used in) operating activities | 73,718,650 | 38,930,821 | 127,395,251 | 48,639,162 | ||||||||||||
|
|
|
| |||||||||||||
Cash Flows from Financing Activities: | ||||||||||||||||
Proceeds from sale of capital | 5,942,891 | 30,899,325 | 8,844,273 | 39,291,798 | ||||||||||||
Payment for redemption of capital | (92,006,038 | ) | (68,073,443 | ) | (146,394,197 | ) | (97,178,756 | ) | ||||||||
Pending owner additions | (119,608 | ) | (157,508 | ) | (65,566 | ) | 521,765 | |||||||||
Redemptions payable | 563,839 | (2,505,055 | ) | 102,802 | (2,346,525 | ) | ||||||||||
|
|
|
| |||||||||||||
Net cash provided by (used in) financing activities | (85,618,916 | ) | (39,836,681 | ) | (137,512,688 | ) | (59,711,718 | ) | ||||||||
|
|
|
| |||||||||||||
Net increase (decrease) in cash and cash equivalents | (11,900,266 | ) | (905,860 | ) | (10,117,437 | ) | (11,072,556 | ) | ||||||||
Cash and cash equivalents, beginning of period | 17,094,782 | 27,452,803 | 17,094,782 | 27,452,803 | ||||||||||||
|
|
|
| |||||||||||||
Cash and cash equivalents, end of period | $ | 5,194,516 | $ | 26,546,943 | $ | 6,977,345 | $ | 16,380,247 | ||||||||
|
|
|
| |||||||||||||
The accompanying notes are an integral part of these consolidated financial statements.
The Frontier Fund
Notes to Consolidated Financial Statements (Unaudited)
1. Organization and Purpose
The Frontier Fund, which is referred to in this report as “the Trust”, was formed on August 8, 2003, as a Delaware statutory trust. The Trust is a multi-advisor commodity pool, as described in Commodity Futures Trading Commission (the “CFTC”) Regulation § 4.10(d)(2). The Trust has authority to issue separate series, or each, a Series, of units of beneficial interest (the “Units”) pursuant to the requirements of the Delaware Statutory Trust Act, as amended (the “Trust Act”). The assets of each Series are valued and accounted for separately from the assets of other Series. The Trust is not registered as an investment company under the Investment Company Act of 1940, as amended (the “Investment Company Act”). It is managed by its Managing Owner, Equinox Fund Management, LLC.
Purchasers of Units are limited owners of the Trust (“Limited Owners”) with respect to beneficial interests of the Series’ Units purchased. The Trust Act provides that, except as otherwise provided in the amended and restated declaration of trust and trust agreement dated August 8, 2003, by and among the Managing Owner, Wilmington Trust Company as trustee and the unitholders from time to time (the “Trust Agreement”), unitholders in a Delaware statutory trust will have the same limitation of liability as do stockholders of private corporations organized under the General Corporation Law of the State of Delaware. The Trust Agreement confers substantially the same limited liability, and contains the same limited exceptions thereto, as would a limited partnership agreement for a Delaware limited partnership engaged in like transactions as the Trust. In addition, pursuant to the Trust Agreement, the Managing Owner of the Trust is liable for obligations of a Series in excess of that Series’ assets. Limited Owners do not have any such liability. The Managing Owner will make contributions to Series of the Trust necessary to maintain at least a 1% interest in the aggregate capital, profits and losses of all Series.
The Trust has been organized to pool assets of investor funds for the purpose of trading in the United States (“U.S.”) and international markets for currencies, interest rates, stock indices, agricultural and energy products, precious and base metals and other commodities. The Trust may also engage in futures contracts, forwards, option contracts and other interest in derivative instruments, including swap contracts (“Swaps”).
The Trust has eight (8)seven (7) separate and distinct Series of Units issued and outstanding: Frontier Diversified Series, Frontier Masters Series, Frontier Long/Short Commodity Series, Balanced Series, Currency Series (ceased trading on April 18, 2013), Frontier Select Series (formerly Tiverton/Graham/Transtrend Series), Winton Series, and Frontier Heritage Series (formerly Winton/Graham Series) (each a “Series” and collectively, the “Series”). The Currency Series ceased trading on April 18, 2013 and the TBG Institutional Series ceased trading on May 23, 2013. The Trust financial statements are comprised of unitized Series which are consolidated into the Trust financial statements. However, the consolidated Trust does not issue units.
The Trust, with respect to each Series:
engages in the speculative trading of a diversified portfolio of futures, forward (including interbank foreign currencies), options contracts and other derivative instruments (including swap contracts), and may, from time to time, engage in cash and spot transactions;
allocates funds to a limited liability trading company or companies (“Trading Company”). Except as otherwise described in these notes, each Trading Company has one-year renewable contracts with its own independent commodity trading advisor(s), or each, a Trading Advisor, that will manage all or a portion of such Trading Company’s assets and make the trading decisions for the assets of each Series vested in such Trading Company. Each Trading Company will segregate its assets from any other Trading Company;
maintains separate, distinct records for each Series, and accounts for the assets of each Series separately from the other Series;
calculates the Net Asset Value (“NAV”) of its Units for each Series separately from the other Series;
has an investment objective of increasing the value of each Series’ Units over the long term (capital appreciation), while controlling risk and volatility; further, to offer exposure to the investment programs of individual Trading Advisors and to specific instruments (currencies);
maintains each Series of Units in three or six sub-classes—Class 1, Class 1a, Class 2, Class 2a, Class 3, and Class 3a. Investors who have purchased Class 1 or Class 1a Units of any Series are charged a service fee of up to three percent (3.0%) annually of the NAV of each Unit purchased, for the benefit of Selling Agents selling such Class 1 or Class 1a Units. The initial service fee, which is amortized monthly at an annual rate of up to three percent (3.0%) of the average daily NAV of Class 1 or Class 1 a1a of such Series, is prepaid to Equinox Fund Management, LLC (the “Managing Owner”) by each Series, and paid to the selling agents by the Managing Owner in the month following sale; provided, however, that investors who redeem all or a portion of their Class 1 or Class 1 a1a Units of any Series during the first twelve (12) months following the effective date of their purchase are subject to a redemption fee of up to three percent (3.0%) of the NAV at which such investor redeemed to reimburse the Managing Owner for the then-unamortized balance of the prepaid initial service fee. With respect to Class 2 and Class 2a Units of any Series, the Managing Owner pays an ongoing service fee to
which such investor redeemed to reimburse the Managing Owner for the then-unamortized balance of the prepaid initial service fee. With respect to Class 2 and Class 2a Units of any Series, the Managing Owner pays an ongoing service fee to Selling Agents of up to one half percent (0.5%) annually of the NAV of each Class 2 or Class 2a Unit (of which 0.25% will be charged to Limited Owners holding Class 2 Units of the Frontier Diversified Series, and Frontier Masters Series or Class 2a Units of the Frontier Long/Short Commodity Series) sold until such Class 2 or Class 2a Units which are subject to the fee limitation are reclassified as Class 3 or Class 3a Units of the applicable Series. The Managing Owner may also pay Selling Agents certain additional fees and expenses for administrative and other services rendered and expenses incurred by such Selling Agents; and |
all payments made to Selling Agents who are members of the Financial Industry Regulatory Authority, Inc. (“FINRA”) and their associated persons that constitute underwriting compensation will be subject to the limitations set forth in Rule 2310(b)(4)(B)(ii) (formerly Rule 281 0(b)2810(b)(4)(B)(ii)) of the Conduct Rules of FINRA (“Rule 2310”). An investor’s Class 1 Units or Class 2 Units of any Series, or Class 1a Units or Class 2a Units of the Frontier Long/Short Commodity Series or Balanced Series will be classified as Class 3 or Class 3a Units of such Series, as applicable, when the Managing Owner determines that the fee limitation set forth in Rule 2310 with respect to such Units has been reached or will be reached. No service fees are paid with respect to Class 3 or Class 3a Units. Units of any Class in a Series may be redeemed, in whole or in part, on a daily basis, at the then current NAV per Unit for such Series on the day of the week after the date the Managing Owner is in receipt of a redemption request for at least one (1) Business Day to be received by the Managing Owner prior to 4:00 PM in New York.
The assets of any particular Series include only those funds and other assets that are paid to, held by or distributed to the Trust on account of and for the benefit of that Series. Under the “Inter-Series Limitation on Liability” expressly provided for under Section 3804(a) of the Trust Act, separate and distinct records of the cash and equivalents, although pooled for maximizing returns, is maintained in the books and records of each Series.
As of JuneSeptember 30, 2013, the Trust, with respect to the Frontier Diversified Series, Frontier Masters Series, Frontier Select Series (formerly Tiverton/Graham/Transtrend Series), Winton Series and Frontier Heritage Series (formerly Winton/Graham Series) separates Units into three separate Classes—Class 1, Class 2, and Class 3. The Trust, with respect to the Balanced Series and the Frontier Long/Short Commodity Series separates Units into six separate Classes—Class 1, Class 2, Class 3, Class 1a, Class 2a and Class 3a. It is expected that between 10% and 30% of each Series’ assets normally will be invested in one or more Trading Companies to be committed as margin for trading positions, but from time to time these percentages may be substantially more or less. The remainders of each Series’ assets are maintained at the Trust level for cash management. Each of the respective Series has invested monies into pooled cash management assets which have included purchases of certificates of deposit and custom time deposits. Each Series’ ownership in these investments is based on its percentage ownership in the pooled cash management assets on the reporting date.
Each Series of the Trust may invest a portion of its assets in a single Trading Company or in several different Trading Companies and may have multiple Trading Advisors that manage the assets invested in such Trading Companies.
During July 2012, Frontier Long/Short Commodity Series Class 1 Units and Balanced Series Class 1a Units ceased Trading Operations and all remaining Units were exchanged for Class 3 Units and Class 3a Units, respectively.
In November 2010, the Frontier Select Series (formerly Tiverton/Graham/Transtrend Series) of the Trust invested a portion of its assets in Berkeley Quantitative Colorado Fund LLC, an unaffiliated company, managed by an affiliate of Berkeley Quantitative L.P. Through this investment, Berkeley Quantitative L.P. became a commodity trading advisor to the Trust. The investment was liquidated March 20, 2012.
The Trust has entered into agreements, which provide for the indemnification of futures clearing brokers, currency trading companies, and commodity trading advisers, among others, against losses, costs, claims and liabilities arising from the performance of their individual obligations under such agreements, except for gross negligence or bad faith.
2. Significant Accounting Policies
The following are the significant accounting policies of the Trust.
Basis of Presentation—The Trust follows Generally Accepted Accounting Principles (“GAAP”), as established by the Financial Accounting Standards Board (the “FASB”), to ensure consistent reporting of financial condition, schedules of investments, results of operations, changes in capital and cash flows.
These financial statements should be read in conjunction with the audited financial statements and notes thereto included in our 2012 Annual Report on Form 10-K as filed with the SEC.
Consolidation—Each Series of the Trust invests in Trading Companies who authorize certain Trading Advisors to place trades and manage assets at pre-determined investment levels. The Trading Companies were organized by the Managing Owner for the purpose of investing in commodities interests and derivative instruments, and have no operating income or expenses, except for trading income and expenses, all of which is allocated to the Series. The Trading Companies and Series of the Trust are consolidated by the Trust.
Investment in Berkeley Quantitative Colorado Fund LLC—The Frontier Select Series (formerly Tiverton/Graham/Transtrend Series) of the Trust had an investment in the Berkeley Quantitative Colorado Fund LLC. The Berkeley Quantitative Colorado Fund LLC began operations on November 1, 2010. The Berkeley Quantitative Colorado Fund LLC was not consolidated into the financial statements of the Trust because the Trust has no control or transparency over the operations of the fund. This investment was shown on the consolidated statements of financial condition with the change in fair value shown in net unrealized gain/(loss) on the Berkeley Quantitative Colorado Fund LLC. This investment was liquidated on March 20, 2012.
Use of Estimates—The preparation of financial statements in conformity with GAAP may require the Managing Owner to make estimates and assumptions that affect the reported amounts of assets and liabilities and disclosure of contingent assets and liabilities at the date of the financial statements and the reported amounts of revenue and expenses during the reporting period. The valuation of swap contracts requires significant estimates as well as the valuation of certain other investments. Please refer to Note 3 for discussion of valuation methodology. Actual results could differ from these estimates and such differences could be material.
Cash and Cash Equivalents—Cash and cash equivalents include cash and overnight investments in interest-bearing demand deposits held at banks with original maturities of three months or less.
Interest Income—Aggregate interest income from all sources, including U.S. Treasury securities, custom time deposits and assets held at Futures Commission Merchants (“FCM”), up to the first two percentage points or 20% of the aggregate percentage yield (annualized) is paid to the Managing Owner. All interest not paid to the Managing Owner is interest income to the Trust.
U.S. Treasury Securities—U.S. Treasury Securities are reported at fair value as Level 1 inputs under ASC 820,Fair Value Measurements and Disclosures (“ASC 820”). The Trust values U.S. Treasury Securities at fair value and records the daily change in value in the consolidated statements of operations as net unrealized gain/(loss) on U.S. Treasury securities. Accrued interest is reported on the consolidated statements of financial condition as interest receivable. All U.S. Treasury Securities have been liquidated as of JuneSeptember 30, 2013.
Custom Time Deposits—Custom time deposits are structured deposit agreements with U.S. Bank National Association that earn a guaranteed fixed interest rate between 3.75%, mature nine months from the deposit date and are subject to automatic six-month rollovers through October 2015.2013. Custom time deposits were purchased on April 1, 2010, September 15, 2009, October 21, 2008 and October 30, 2008. Interest is paid monthly or at least every nine months. Unscheduled withdrawals will be subject to certain penalties and other costs of up to 1.0% of the amount deposited if withdrawn within the first nine months from the deposit date. The withdrawal fee is set at 0.225% for the period from nine months to one year subsequent to the deposit date and decreases by .05% increments for each year thereafter through the maturity date. In May 2011, July 2011, August 2011, and January 2012, October 2012, November 2012, April 2013, June 2013, July 2013 and JuneAugust 2013, the Trust, with respect to the Series, redeemed approximately $25 million, $25 million, $50 million, $25 million, $16 million, $5 million, $35 million, $20 million and $35$15 million, respectively, in custom time deposits held with U.S. Bank N.A which represented a full liquidation of the 2.17% investment tranche and an additional $65$100 million of the 3.75% tranche. Custom time deposits are allocated to each Series based on their percentage ownership in the pooled cash management assets as of the reporting date. The Trust values the custom time deposits at face value plus accrued interest as it is considered a deposit account under paragraph 7.50 of theInvestment Company Audit Guide, and accordingly, this deposit is not subject to ASC 820.
Credit Default Swaps— The Series of the Trust invested in credit default swaps for the purpose of mitigating part of the risk of concentration of deposits with U.S. Bank National Association to other major financial institutions. See Note 4. Credit Default Swaps were allocated to each Series based on their percentage ownership in the pooled cash management assets as of the reporting date. Credit Default Swaps were reported at fair value based upon counterparty value per the valuation policy. The Series of the Trust recorded the daily change in fair value in the statements of operations as net unrealized gain/(loss) on swap contracts. All Credit Default Swaps expired during March 2012.
Receivable From Futures Commission Merchants—The Trust deposits assets with a FCM subject to CFTC regulations and various exchange and broker requirements. Margin requirements are satisfied by the deposit of cash with such FCM. The Trust earns interest income on its assets deposited with the FCM.
Investment Transactions—Futures, options on futures, forward and swap contracts are recorded on a trade date basis and realized gains or losses are recognized when contracts are settled. Unrealized gains or losses on open contracts (the difference between contract trade price and market price) are reported in the consolidated statements of financial condition as a net unrealized gain or loss, as there exists a right of offset of unrealized gains or losses in accordance with FASB ASC 210,Balance Sheet (“ASC 210”).
Any change in net unrealized gain or loss from the preceding period is reported in the consolidated statements of operations. Fair value of exchange-traded contracts is based upon exchange settlement prices. Fair value of non-exchange-traded contracts is based on third party quoted dealer values on the interbank market. For U.S. Treasury securities, interest iwaswas recognized in the period earned and the instruments were marked-to-market daily based on third party information. Custom time deposits are valued at face value plus accrued interest and the interest income is recognized in the period earned. Transaction costs are recognized as incurred and reflected separately in the consolidated statements of operations.
Foreign currency transactions—The Series of the Trust’s functional currency is the U.S. Dollar, however, they transact business in currencies other than the U.S. Dollar. The Series of the Trust do not isolate that portion of the results of operations resulting from changes in foreign exchange rates on investments from fluctuations arising from changes in market prices of securities held. Such fluctuations are included with the net realized or unrealized gain or loss from investments.
Allocation of Earnings—Each Series of the Trust maintainsmay maintain three or six classes of Units—Class 1, Class 2, Class 3, Class 1a, Class 2a and Class 3a). All classes have identical voting, dividend, liquidation and other rights and the same terms and conditions, except that fees charged to a Class or Series differ as described below. Revenues, expenses (other than expenses attributable to a specific class), and realized and unrealized trading gains and losses of each Series are allocated daily to Class 1, Class 1a, Class 2, Class 2a, Class 3 and Class 3a Units based on each Class’ respective owners’ capital balances as applicable to the classes maintained by the Series.
Payments by the Managing Owner—The Managing Owner may make discretionary payments to the Trust related to a variety of factors, including investment losses to reimburse the effect of a loss on a portfolio investment which has been caused by a situation outside the Trust’s, or it’s affiliates’, direct control. Such payments will be made on a discretionary basis and will be disclosed in the consolidated statement of operations as a net increase from payments by managing owner.the Managing Owner. These payments are in accordance with the Trust agreement on a discretionary basis as determined by the Managing Owner.
Investments and Swaps—The Trust records investment transactions on a trade date basis and all investments are recorded at fair value, with changes in fair value reported as a component of realized and unrealized gains/(losses) on investments in the statements of operations. The Trust strategically investinvests a portion or all of theirits assets in total return Swaps, selected at the discretion of the Managing Owner. Swaps are privately negotiated contracts designed to provide investment returns linked to those produced by one or more underlying investment products or indices. In a typical Swap, two parties agree to exchange the returns (or differentials in rates of return) earned or realized on one or more particular predetermined investment or instrument. The gross returns to be exchanged or “swapped” between the parties are calculated with respect to a “notional amount” (i.e., the amount of value of the underlying asset used in computing the particular interest rate, return, or other amount to be exchanged) in a particular investment, or in a “basket” of securities. The valuation of swap contracts requires significant estimates. Swap contracts are reported utilizing Level 3 Inputs. The significant unobservable inputs used in the fair value measurement of the Trust’s Swap contracts are asset liquidity, debt valuation, credit risk, volatility, market risk, distributions, dividends, risk premiums, and other risk management tools. Significant increases (decreases) in any of those inputs in isolation would result in a significantly lower (higher) fair value measurement. Swap Contracts are reported at fair value based upon a weekly indicative value that is calculated by management using bid/ask prices from the counterparty. This fair value is corroborated by valuations provided by a third party pricing service. The third party pricing service utilizes a Black Scholes pricing model with input adjustments factoring in volatility and liquidity of the instruments. All valuation processes are monitored by the valuation committee of the Managing Owner. Please refer to Note 3Fair Value Measurements.
Income Taxes—The Trust applies the provisions of ASC 740Income Taxes(“ASC 740”), which provides guidance for how uncertain tax positions should be recognized, measured, presented and disclosed in the financial statements. This interpretation also provides guidance on derecognition, classification, interest and penalties, accounting in interim periods and disclosure. ASC 740 requires the evaluation of tax positions taken or expected to be taken in the course of preparing the Trust’s financial statements to determine whether the tax positions are “more-likely-than-not” of being sustained by the applicable tax authority. Tax positions with respect to tax at the Trust’s level not deemed to meet the “more-likely-than-not” threshold would be recorded as a tax benefit or expense in the current year. The Managing Owner has concluded there is no tax expense, interest or penalties to be recorded by the Trust for the years ended December 31, 2012, 2011 and 2010. The 2009 through 2012 tax years generally remain subject to examination by U.S. federal and most state tax authorities.
In the opinion of the Managing Owner, (i) the Trust is treated as a partnership for Federal income tax purposes and, assuming that at least 90% of the gross income of the Trust constitutes “qualifying income” within the meaning of Section 7704(d) of the Code, the Trust is not a publicly traded partnership treated as a corporation, and (ii) the discussion set forth in the Prospectus under the heading “Federal Income Tax Consequences” correctly summarizes the material Federal income tax consequences as of the date of the Prospectus to potential U.S. Limited Owners of the purchase, ownership and disposition of Units of the Trust.
Fees and Expenses—All management fees, incentive fees, service fees and trading fees of the Trust are paid to the Managing Owner. It is the responsibility of the Managing Owner to pay all Trading Advisor management and incentive fees, Selling Agent Service fees and all other operating expenses and continuing offering costs of the Trust.
Service Fees—The Trust maintainsmay maintain each Series of Units in three or six sub-classes—Class 1, Class 1a, Class 2, Class 2a, Class 3, and Class 3a. Investors who have purchased Class 1 or Class 1a Units of any Series are charged a service fee of up to three percent (3.0%) annually of the NAV of each Unit purchased, for the benefit of selling agents selling such Class 1 or Class 1a Units. The initial service fee, which is amortized monthly at an annual rate of up to three percent (3.0%) of the average daily NAV of Class 1 or Class 1a of such Series, is prepaid to the Managing Owner by each Series, and paid to the selling agents by the Managing Owner in the month following sale; provided, however, that investors who redeem all or a portion of their Class 1 or Class 1a Units of any Series during the first twelve (12) months following the effective date of their purchase are subject to a redemption fee of up to three percent (3.0%) of the NAV at which such investor redeemed to reimburse the Managing Owner for the then-unamortized balance of the
prepaid initial service fee. With respect to Class 2 and Class 2a Units of any Series, the Managing Owner pays an ongoing service fee to Selling Agents of up to one half percent (0.5%) annually of the NAV of each Class 2 or Class 2a Unit (of which 0.25% will be charged to Limited Owners holding Class 2 Units of the Frontier Diversified Series, and Frontier Masters Series or Class 2a Units of the Frontier Long/Short Commodity Series) sold until such Class 2 or Class 2a Units which are subject to the fee limitation are reclassified as Class 3 or Class 3a Units of the applicable Series for administrative purposes. The Managing Owner may also pay Selling Agents certain additional fees and expenses for administrative and other services rendered and expenses incurred by such Selling Agents.
These service fees are part of the offering costs of the Trust, which include registration and filing fees, legal and blue sky expenses, accounting and audit, printing, marketing support and other offering costs which are born by the Managing Owner. With respect to the service fees, the initial service fee (for the first 12 months) relating to a purchase of Class 1 and Class 1a Units by an investor is prepaid by the Managing Owner to the relevant selling agent in the month following such purchase and is reimbursed for such payment by the Series monthly in arrears in an amount based upon a corresponding percentage of NAV, calculated daily. Consequently, the Managing Owner bears the risk of the downside and enjoys the benefit of the upside potential of any difference between the amount of the initial service fee prepaid by it and the amount of the reimbursement thereof, which may result from variations in NAV over the following 12 months.
Pending Owner Additions—Funds received for new subscriptions and for additions to existing owner interests are recorded as capital additions at the NAV per unit of the second business day following receipt.
Recently Issued Accounting Pronouncements—In June of 2013, FASB issued ASU 2013-08 to (i) modify Topic 946 for determining whether an entity is an investment company; (ii) update the measurement requirements for noncontrolling interests in other investment companies; and (iii) require additional disclosures for investment companies under U.S. GAAP. This guidance is effective for annual and interim periods beginning on or after December 15, 2013. An entity should provide the disclosures required by those amendments retrospectively for all comparative periods presented. The adoption of this guidance is not expected to have a material impact on the financial positions or results of operations.
Offsetting of As of September 30, 2013 Frontier Long/Short Commodity Series Open Trade Equity/(Deficit) Options Written Receivable from Futures Commissions Merchants Open Trade Equity/(Deficit) Options Written Receivable from Futures Commissions Merchants Open Trade Equity/(Deficit) Options Written Receivable from Futures Commissions Merchants Open Trade Equity/(Deficit) Options Written Receivable from Futures Commissions Merchants Trading Activities and Related Risks The purchase and sale of futures and options on futures contracts require margin deposits with FCMs. Additional deposits may be necessary for any loss on contract value. The Commodity Exchange Act requires an The term “off-balance sheet risk” refers to an unrecorded potential liability that, even though it does not appear on the statements of financial condition, may result in future obligation or loss in excess of the amount paid by the Series for a particular investment. Each Trading Company expects to trade in futures, options, forward and swap contracts and will therefore be a party to financial instruments with elements of off-balance sheet market and credit risk. In entering into these contracts, there exists a market risk that such contracts may be significantly influenced by market conditions, such as interest rate volatility, resulting in such contracts being less valuable. If the markets should move against all of the futures positions held by a Trading Company in respect of any Series at the same time, and if the Trading Advisor(s) of such Trading Company are unable to offset such futures interests positions, such Trading Company could lose all of its assets and the holders of Units of such Series would realize a 100% loss. The Managing Owner will seek to minimize market risk through real-time monitoring of open positions and the level of diversification of each Trading Advisor’s portfolio. It is anticipated that any Trading Advisor’s margin-to-equity ratio will typically not exceed approximately 35% although the actual ratio could be higher or lower from time to time.Recently Adopted Accounting Pronouncements—In December2011, FASB issued new guidance thatDerivative Assets and Liabilities Gross Amounts of
recognized
Derivative Assets Gross Amounts of
recognized
Derivative Liabilities Net Amounts of
Derivative Assets
and Liabilities
Presented in the
Statements of
Financial Condition $ 324,075 $ (524,366 ) $ (200,291 ) — (29,302 ) (29,302 ) 11,641,316 (4,719,275 ) 6,922,041 Balanced Series $ 954,671 $ (1,152,345 ) $ (197,674 ) — (467,791 ) (467,791 ) 26,647,861 (5,699,593 ) 20,948,268 As of December 31, 2012 Gross Amounts of
recognized
Derivative Assets Gross Amounts of
recognized
Derivative Liabilities Net Amounts of
Derivative Assets
and Liabilities
Presented in the
Statements of
Financial Condition Frontier Long/Short Commodity Series $ 3,314,175 $ (4,133,710 ) $ (819,535 ) — (928,690 ) (928,690 ) 22,276,098 (7,505,125 ) 14,770,973 Balanced Series $ 4,215,436 $ (4,887,947 ) $ (672,511 ) — (165,363 ) (165,363 ) 98,277,094 (6,233,501 ) 92,043,593 entityFCM to disclose information about offsettingsegregate all customer transactions and related arrangementsassets from the FCM’s proprietary activities. A customer’s cash and other property (for example, U.S. treasury bills) deposited with an FCM are considered commingled with all other customer funds subject to enable usersthe FCM’s segregation requirements. In the event of an FCM’s insolvency, recovery may be limited to a pro rata share of segregated funds available. It is possible that the recovered amount could be less than the total of cash and other property deposited.
In addition to market risk, trading futures, forward and swap contracts entails credit risk in that a counterparty will not be able to meet its obligations to a Trading Company. The counterparty for futures contracts traded in the United States and on most foreign exchanges is the clearinghouse associated with such exchange. In general, clearinghouses are backed by the corporate members of the clearinghouse who are required to share any financial burden resulting from the non-performance by one of their members and, as such, should significantly reduce this credit risk. In cases where the clearinghouse is not backed by the clearing members, like some foreign exchanges, it is normally backed by a consortium of banks or other financial institutions. Some non-U.S. exchanges, in contrast to U.S. exchanges, are principals’ markets in which performance is the responsibility only of the individual counterparty with whom the Trading Company has entered into the transaction, and not of the exchange or clearing corporation. In these kinds of markets, there is risk of bankruptcy or other failure or refusal to perform by the counterparty.
In the case of forward contracts traded on the interbank market and swaps, neither is traded on exchanges. The counterparty is generally a single bank or other financial institution, rather than a group of financial institutions; thus there may be a greater counterparty credit risk. The Managing Owner expects the Trading Advisors to trade only with those counterparties which it believes to be creditworthy. All positions of each Trading Company will be valued each day on a mark-to-market basis. There can be no assurance that any clearing member, clearinghouse or other counterparty will be able to meet its obligations to any Trading Company.
The Managing Owner has established procedures to actively monitor and minimize market and credit risks. The Limited Owners bear the risk of loss only to the extent of the market value of their respective investments and, in certain specific circumstances, distributions and redemptions received.
10. Indemnifications and Guarantees
The Trust has entered into agreements, which provide for the indemnification of futures clearing brokers, and commodity trading advisers, among others, against losses, costs, claims and liabilities arising from the performance of their individual obligations under such agreements, except for gross negligence or bad faith. The Trust has had no prior claims or payments pursuant to these agreements. The Trust’s individual maximum exposure under these arrangements is unknown, as this would involve future claims that may be made against the Trust that have not yet occurred. However, based on experience the Trust expects the risk of loss to be remote. Maximum exposure is unfulfilled obligations of the Series up to the amount of equity at risk with UBS of the referenced Series as allocated from the Trading Company. The Series have not recorded any liability for the guarantees in the accompanying financial statements as it expects any possibility of losses to understandbe remote.
The Trust has guaranteed the effectobligations of those arrangements onthe Trading Companies under the customer agreements with UBS Securities as Clearing Broker. In the event that one Series of the Trust is unable to meet its financial position. FASB issued additional clarificationobligations to specify thatUBS Securities, the guidance appliesassets of the other Series will be available to UBS Securities as part of the guarantee, but only to derivatives, repurchase agreementsthe extent of such Series’ pro rata allocation to the Trading Company. The Series have not recorded any liability for the indemnifications in the accompanying financial statement, as it expects any possibility of losses to be remote.
11. Subsequent Events
None.
The Frontier Fund
Consolidated Statements of Financial Condition
September 30, 2013 and reverse repurchase agreements,December 31, 2012
| 9/30/2013 | 12/31/2012 | |||||||
| (unaudited) | ||||||||
| ASSETS | ||||||||
Cash and cash equivalents | $ | 6,977,345 | $ | 17,094,782 | ||||
U.S. Treasury securities, at fair value | — | 18,001,322 | ||||||
Custom time deposits | 235,460,358 | 311,468,033 | ||||||
Receivable from futures commission merchants | 66,740,407 | 148,029,229 | ||||||
Open trade equity, at fair value | 6,943,192 | 12,116,649 | ||||||
Swap contracts, at fair value | 17,152,321 | 22,289,479 | ||||||
Prepaid service fees | 38,307 | 140,203 | ||||||
Interest receivable | 985 | 251,630 | ||||||
Receivables from related parties | 3,420 | — | ||||||
Other assets | 50 | 35,043 | ||||||
|
|
|
| |||||
Total Assets | $ | 333,316,385 | $ | 529,426,370 | ||||
|
|
|
| |||||
| LIABILITIES & CAPITAL | ||||||||
LIABILITIES | ||||||||
Open trade deficit, at fair value | $ | — | $ | — | ||||
Written options, at fair value | 1,586,908 | 4,199,198 | ||||||
Pending owner additions | 95,106 | 160,672 | ||||||
Owner redemptions payable | 1,533,440 | 1,430,638 | ||||||
Incentive fees payable to Managing Owner | — | 732,119 | ||||||
Management fees payable to Managing Owner | 601,625 | 1,003,663 | ||||||
Interest payable to Managing Owner | 393,822 | 569,115 | ||||||
Trading fees payable to Managing Owner | 398,688 | 602,333 | ||||||
Service fees payable to Managing Owner | 436,778 | 652,500 | ||||||
Payables to related parties | 10,884 | 38,925 | ||||||
Other liabilities | 1,414 | 51,484 | ||||||
|
|
|
| |||||
Total Liabilities | 5,058,665 | 9,440,647 | ||||||
|
|
|
| |||||
CAPITAL | ||||||||
Managing Owner Units | 4,915,327 | 6,287,766 | ||||||
Limited Owner Units | 323,342,393 | 513,697,957 | ||||||
|
|
|
| |||||
Total Capital | 328,257,720 | 519,985,723 | ||||||
|
|
|
| |||||
Total Liabilities and Capital | $ | 333,316,385 | $ | 529,426,370 | ||||
|
|
|
| |||||
The accompanying notes are an integral part of these consolidated financial statements.
The Frontier Fund
Consolidated Condensed Schedule of Investments
September 30, 2013 (Unaudited)
Description | Value | % of Total Capital (Net Asset Value) | ||||||
LONG FUTURES CONTRACTS * | ||||||||
Various base metals futures contracts (Europe) | $ | 6,997,426 | 2.13 | % | ||||
Various base metals futures contracts (U.S.) | 2,792 | 0.00 | % | |||||
Various currency futures contracts (U.S.) | 1,773,185 | 0.54 | % | |||||
Various energy futures contracts (U.S.) | (1,119,566 | ) | -0.34 | % | ||||
Various energy futures contracts (Europe) | 19,780 | 0.01 | % | |||||
Various energy futures contracts (Far East) | (2,800 | ) | 0.00 | % | ||||
Various interest rates futures contracts (Canada) | 80,532 | 0.02 | % | |||||
Various interest rates futures contracts (Europe) | 1,027,305 | 0.31 | % | |||||
Various interest rates futures contracts (Far East) | 555,465 | 0.17 | % | |||||
Various interest rates futures contracts (Oceanic) | 110,699 | 0.03 | % | |||||
Various interest rates futures contracts (U.S.) | 999,496 | 0.30 | % | |||||
Various precious metal futures contracts (Far East) | (4,376 | ) | 0.00 | % | ||||
Various precious metal futures contracts (U.S.) | (67,985 | ) | -0.02 | % | ||||
Various soft futures contracts (Europe) | 45,212 | 0.01 | % | |||||
Various soft futures contracts (U.S.) | (446,825 | ) | -0.14 | % | ||||
Various stock index futures contracts (Africa) | 11,856 | 0.00 | % | |||||
Various stock index futures contracts (Canada) | (16,543 | ) | -0.01 | % | ||||
Various stock index futures contracts (Europe) | (650,446 | ) | -0.20 | % | ||||
Various stock index futures contracts (Far East) | (166,418 | ) | -0.05 | % | ||||
Various stock index futures contracts (Oceanic) | (50,568 | ) | -0.02 | % | ||||
Various stock index futures contracts (U.S.) | (865,840 | ) | -0.26 | % | ||||
|
|
|
| |||||
Total Long Futures Contracts | $ | 8,232,381 | 2.48 | % | ||||
|
|
|
| |||||
OPTIONS PURCHASED * | ||||||||
Various base metals futures contracts (Europe) | $ | 1,954,644 | 0.60 | % | ||||
Various energy futures contracts (U.S.) | 3,680 | 0.00 | % | |||||
Various interest rates futures contracts (U.S.) | 30,188 | 0.01 | % | |||||
Various precious metal futures contracts (U.S.) | 158,760 | 0.05 | % | |||||
Various soft futures contracts (U.S.) | 385,991 | 0.12 | % | |||||
Various stock index futures contracts (U.S.) | 607,233 | 0.19 | % | |||||
|
|
|
| |||||
Total Options Purchased | $ | 3,140,496 | 0.97 | % | ||||
|
|
|
| |||||
SHORT FUTURES CONTRACTS * | ||||||||
Various base metals futures contracts (Europe) | $ | (5,397,548 | ) | -1.64 | % | |||
Various base metals futures contracts (U.S.) | (2,179 | ) | 0.00 | % | ||||
Various currency futures contracts (Far East) | 11,513 | 0.00 | % | |||||
Various currency futures contracts (U.S.) | (849,817 | ) | -0.26 | % | ||||
Various energy futures contracts (Europe) | (32,829 | ) | -0.01 | % | ||||
Various energy futures contracts (U.S.) | 1,128,135 | 0.34 | % | |||||
Various interest rates futures contracts (Canada) | (118,726 | ) | -0.04 | % | ||||
Various interest rates futures contracts (Europe) | (630,632 | ) | -0.19 | % | ||||
Various interest rates futures contracts (Far East) | (143,487 | ) | -0.04 | % | ||||
Various interest rates futures contracts (Oceanic) | (69,238 | ) | -0.02 | % | ||||
Various interest rates futures contracts (U.S.) | (811,364 | ) | -0.25 | % | ||||
Various precious metal futures contracts (U.S.) | 208,919 | 0.06 | % | |||||
Various soft futures contracts (Canada) | 2,045 | 0.00 | % | |||||
Various soft futures contracts (Europe) | 100,762 | 0.03 | % | |||||
Various soft futures contracts (U.S.) | 1,386,530 | 0.42 | % | |||||
Various stock index futures contracts (Europe) | 1,068 | 0.00 | % | |||||
Various stock index futures contracts (Far East) | 39,169 | 0.01 | % | |||||
Various stock index futures contracts (U.S.) | (36,084 | ) | -0.01 | % | ||||
|
|
|
| |||||
Total Short Futures Contracts | $ | (5,213,763 | ) | -1.60 | % | |||
|
|
|
| |||||
CURRENCY FORWARDS * | ||||||||
Various currency forward contracts | $ | 784,078 | 0.24 | % | ||||
|
|
|
| |||||
Total Currency Forwards | $ | 784,078 | 0.24 | % | ||||
|
|
|
| |||||
Total Open Trade Equity | $ | 6,943,192 | 2.09 | % | ||||
|
|
|
| |||||
OPTIONS WRITTEN * | ||||||||
Various base metals futures contracts (Europe) | $ | (606,485 | ) | -0.18 | % | |||
Various currency futures contracts (U.S.) | (247,325 | ) | -0.08 | % | ||||
Various precious metal futures contracts (U.S.) | (215,530 | ) | -0.07 | % | ||||
Various soft futures contracts (U.S.) | (49,615 | ) | -0.02 | % | ||||
Various stock index futures contracts (U.S.) | (467,953 | ) | -0.14 | % | ||||
|
|
|
| |||||
Total Options Written | $ | (1,586,908 | ) | -0.49 | % | |||
|
|
|
| |||||
SWAPS (1) | ||||||||
Frontier XXXIV Balanced select swap (U.S.) | $ | 7,412,815 | 2.26 | % | ||||
Frontier Brevan Howard swap (U.S.) | 4,506,351 | 1.37 | % | |||||
Frontier XXXV Diversified select swap (U.S.) | 2,413,658 | 0.74 | % | |||||
Frontier XXXVII L/S select swap (U.S.) | 2,819,497 | 0.86 | % | |||||
|
|
|
| |||||
Total Swaps | $ | 17,152,321 | 5.23 | % | ||||
|
|
|
| |||||
| (1) | See Notes to Financial Statements, Note 4. |
The accompanying notes are an integral part of these consolidated financial statements.
The Frontier Fund
Consolidated Condensed Schedule of Investments
December 31, 2012
Description | Value | % of Total Capital (Net Asset Value) | ||||||
LONG FUTURES CONTRACTS * | ||||||||
Various stock index futures contracts (U.S.) | $ | (708,671 | ) | -0.14 | % | |||
Various stock index futures contracts (Oceanic) | 190,826 | 0.04 | % | |||||
Various stock index futures contracts (Mexico) | 1,548 | 0.00 | % | |||||
Various stock index futures contracts (Far East) | 3,549,518 | 0.68 | % | |||||
Various stock index futures contracts (Europe) | (1,746,507 | ) | -0.34 | % | ||||
Various stock index futures contracts (Canada) | 272,823 | 0.05 | % | |||||
Various stock index futures contracts (Africa) | 97,909 | 0.02 | % | |||||
Various soft futures contracts (U.S.) | (2,211,954 | ) | -0.43 | % | ||||
Various soft futures contracts (Europe) | (145,288 | ) | -0.03 | % | ||||
Various soft futures contracts (Canada) | (335 | ) | 0.00 | % | ||||
Various precious metal futures contracts (U.S.) | (756,478 | ) | -0.15 | % | ||||
Various interest rates futures contracts (U.S.) | (609,966 | ) | -0.12 | % | ||||
Various interest rates futures contracts (Oceanic) | 298,169 | 0.06 | % | |||||
Various interest rates futures contracts (Far East) | (428,542 | ) | -0.08 | % | ||||
Various interest rates futures contracts (Europe) | 2,592,153 | 0.50 | % | |||||
Various interest rates futures contracts (Canada) | (120,227 | ) | -0.02 | % | ||||
Various energy futures contracts (U.S.) | 13,149,004 | 2.53 | % | |||||
Various energy futures contracts (Far East) | 462 | 0.00 | % | |||||
Various currency futures contracts (U.S.) | (2,156,861 | ) | -0.41 | % | ||||
Various base metals futures contracts (U.S.) | (9,439 | ) | 0.00 | % | ||||
Various base metals futures contracts (Europe) | 3,463,404 | 0.67 | % | |||||
|
|
|
| |||||
Total Long Futures Contracts | $ | 14,721,548 | 2.83 | % | ||||
|
|
|
| |||||
OPTIONS PURCHASED * | ||||||||
Various stock index futures contracts (U.S.) | $ | 439,170 | 0.08 | % | ||||
Various soft futures contracts (U.S.) | 1,320,884 | 0.25 | % | |||||
Various precious metals futures contracts (U.S.) | 711,000 | 0.14 | % | |||||
Various energy futures contracts (U.S.) | 6,285,280 | 1.21 | % | |||||
Various currency futures contracts (U.S.) | 2,901,488 | 0.56 | % | |||||
Various base metals futures contracts (Europe) | 2,277,291 | 0.44 | % | |||||
|
|
|
| |||||
Total Options Purchased | $ | 13,935,113 | 2.68 | % | ||||
|
|
|
| |||||
SHORT FUTURES CONTRACTS * | ||||||||
Various base metals futures contracts (U.S.) | $ | (76,900 | ) | -0.01 | % | |||
Various base metals futures contracts (Europe) | (7,712,906 | ) | -1.48 | % | ||||
Various currency futures contracts (U.S.) | 3,852,251 | 0.74 | % | |||||
Various currency futures contracts (Canada) | — | 0.00 | % | |||||
Various currencey futures contracts (Far East) | 684 | 0.00 | % | |||||
Various stock index futures contracts (U.S.) | (373,552 | ) | -0.07 | % | ||||
Various stock index futures contracts (Europe) | 86,644 | 0.02 | % | |||||
Various stock index futures contracts (Far East) | (630,695 | ) | -0.12 | % | ||||
Various stock index futures contracts (Canada) | (6,159 | ) | 0.00 | % | ||||
Various soft futures contracts (U.S.) | 2,445,673 | 0.47 | % | |||||
Various soft futures contracts (Europe) | 122,990 | 0.02 | % | |||||
Various interest rates futures contracts (U.S.) | (385,887 | ) | -0.07 | % | ||||
Various interest rates futures contracts (Oceanic) | (17,218 | ) | 0.00 | % | ||||
Various interest rates futures contracts (Far East) | 197,000 | 0.04 | % | |||||
Various interest rates futures contracts (Europe) | (1,273 | ) | 0.00 | % | ||||
Various interest rates futures contracts (Canada) | 81,091 | 0.02 | % | |||||
Various precious metal futures contracts (U.S.) | 476,388 | 0.09 | % | |||||
Various energy futures contracts (U.S.) | (15,297,097 | ) | -2.94 | % | ||||
Various energy futures contracts (Europe) | 7,109 | 0.00 | % | |||||
|
|
|
| |||||
Total Short Futures Contracts | $ | (17,231,857 | ) | -3.29 | % | |||
|
|
|
| |||||
CURRENCY FORWARDS * | ||||||||
Various currency futures contracts | $ | 691,845 | 0.13 | % | ||||
|
|
|
| |||||
Total Currency Forwards | $ | 691,845 | 0.13 | % | ||||
|
|
|
| |||||
Total Open Trade Equity | $ | 12,116,649 | 2.35 | % | ||||
|
|
|
| |||||
OPTIONS WRITTEN * | ||||||||
Various stock index futures contracts (U.S.) | $ | (165,363 | ) | -0.03 | % | |||
Various soft futures contracts (U.S.) | (447,693 | ) | -0.09 | % | ||||
Various precious metal futures contracts (U.S.) | (540,330 | ) | -0.10 | % | ||||
Various currency futures contracts (U.S.) | (1,340,750 | ) | -0.26 | % | ||||
Various base metals futures contracts(Europe) | (261,172 | ) | -0.05 | % | ||||
Various energy futures contracts (U.S.) | (1,443,890 | ) | -0.28 | % | ||||
|
|
|
| |||||
Total Options Written | $ | (4,199,198 | ) | -0.81 | % | |||
|
|
|
| |||||
SWAPS (1) | ||||||||
Frontier Balanced RCW-1 Swap(U.S.) | $ | 17,785,733 | 3.42 | % | ||||
Frontier Balanced DB Swap(U.S.) | 2,702,247 | 0.52 | % | |||||
Frontier Currency DB Swap(U.S.) | 1,801,498 | 0.35 | % | |||||
|
|
|
| |||||
Total Swaps | $ | 22,289,478 | 4.29 | % | ||||
|
|
|
| |||||
U.S. TREASURY SECURITIES | ||||||||
FACE VALUE | Fair Value | Fair Value | ||||||||
| $36,700,000 | U.S. Treasury Note 4.000% due 02/15/2015 (Cost $38,016,039) | 18,001,322 | 3.46 | % | ||||||
|
|
|
| |||||||
Total U.S. Treasury Securities | 18,001,322 | 3.46 | % | |||||||
|
|
|
| |||||||
| * | Except for those items disclosed, no individual futures, forwards and option on futures contract position constituted greater than 1 percent of Net Asset Value. Accordingly, the number of contracts and expiration dates are not presented. |
| (1) | See Notes to the Consolidated Financial Statements, Note 4. |
The accompanying notes are an integral part of these consolidated financial statements.
The Frontier Fund
Consolidated Statements of Operations
For the Three Months Ended September 30, 2013 and securities borrowingSeptember 30, 2012 (Unaudited)
| 9/30/2013 | 9/30/2012 | |||||||
Investment income: | ||||||||
Interest - net | $ | 1,140,637 | $ | 1,377,089 | ||||
|
|
|
| |||||
Total Income | 1,140,637 | 1,377,089 | ||||||
|
|
|
| |||||
Expenses: | ||||||||
Incentive Fees | — | 5,789,666 | ||||||
Management Fees | 1,981,543 | 3,191,672 | ||||||
Service Fees - Class 1 | 1,650,323 | 2,540,950 | ||||||
Trading Fees | 1,281,476 | 1,987,736 | ||||||
|
|
|
| |||||
Total Expenses | 4,913,342 | 13,510,024 | ||||||
|
|
|
| |||||
Investment income/(loss) - net | (3,772,705 | ) | (12,132,935 | ) | ||||
|
|
|
| |||||
Realized and unrealized gain/(loss) on investments: | ||||||||
Net realized gain/(loss) on futures, forwards and options | (18,537,056 | ) | (14,031,019 | ) | ||||
Net change in open trade equity/(deficit) | 2,716,062 | 36,395,403 | ||||||
Net realized gain/(loss) on swap contracts | (1,646,391 | ) | — | |||||
Net unrealized gain/(loss) on swap contracts | (2,600,517 | ) | 259,527 | |||||
Net realized gain/(loss) on U.S. Treasury securities | — | — | ||||||
Net unrealized gain/(loss) on U.S. Treasury securities | — | (173,695 | ) | |||||
Trading commissions | (1,106,569 | ) | (1,914,850 | ) | ||||
|
|
|
| |||||
Net gain/(loss) on investments | (21,174,471 | ) | 20,535,366 | |||||
|
|
|
| |||||
NET INCREASE/(DECREASE) IN CAPITAL RESULTING FROM OPERATIONS | $ | (24,947,176 | ) | $ | 8,402,431 | |||
|
|
|
| |||||
The accompanying notes are an integral part of these consolidated financial statements.
The Frontier Fund
Consolidated Statements of Operations
For the Nine Months Ended September 30, 2013 and securities lending transactions thatSeptember 30, 2012 (Unaudited)
| 9/30/2013 | 9/30/2012 | |||||||
Investment income: | ||||||||
Interest - net | $ | 3,703,455 | $ | 4,334,714 | ||||
|
|
|
| |||||
Total Income | 3,703,455 | 4,334,714 | ||||||
|
|
|
| |||||
Expenses: | ||||||||
Incentive Fees | 889,025 | 11,463,249 | ||||||
Management Fees | 6,708,693 | 9,758,788 | ||||||
Service Fees - Class 1 | 5,718,063 | 7,980,617 | ||||||
Trading Fees | 4,533,240 | 6,019,122 | ||||||
|
|
|
| |||||
Total Expenses | 17,849,021 | 35,221,776 | ||||||
|
|
|
| |||||
Investment income/(loss) - net | (14,145,566 | ) | (30,887,062 | ) | ||||
|
|
|
| |||||
Realized and unrealized gain/(loss) on investments: | ||||||||
Net realized gain/(loss) on futures, forwards and options | (31,209,297 | ) | 5,493,499 | |||||
Net change in open trade equity/(deficit) | 1,579,799 | 25,316,847 | ||||||
Net realized gain/(loss) on swap contracts | (3,555,134 | ) | (525,237 | ) | ||||
Net unrealized gain/(loss) on swap contracts | (2,763,657 | ) | 1,538,438 | |||||
Net realized gain/(loss) on U.S. Treasury securities | 1,078,008 | 854,738 | ||||||
Net unrealized gain/(loss) on U.S. Treasury securities | (1,157,776 | ) | (1,832,445 | ) | ||||
Trading commissions | (4,004,456 | ) | (6,051,637 | ) | ||||
Net realized gain/(loss) on investment in Berkeley Quantitative Colorado Fund LLC | — | (2,172,987 | ) | |||||
Net unrealized gain/(loss) on investment in Berkeley Quantitative Colorado Fund LLC | — | 2,084,880 | ||||||
|
|
|
| |||||
Net gain/(loss) on investments | (40,032,513 | ) | 24,706,096 | |||||
|
|
|
| |||||
NET INCREASE/(DECREASE) IN CAPITAL RESULTING FROM OPERATIONS | $ | (54,178,079 | ) | $ | (6,180,966 | ) | ||
|
|
|
| |||||
The accompanying notes are either offsetan integral part of these consolidated financial statements.
The Frontier Fund
Consolidated Statement of Changes in accordance with specific criteriaOwners’ Capital
For the Nine Months Ended September 30, 2013 (Unaudited)
| Managing Owner | Limited Owners | Total | ||||||||||
Owners’ Capital, December 31, 2012 | $ | 6,287,766 | $ | 513,697,957 | $ | 519,985,723 | ||||||
Sale of Units | 61,988 | 8,782,285 | 8,844,273 | |||||||||
Redemption of Units | (561,990 | ) | (145,832,207 | ) | (146,394,197 | ) | ||||||
Net increase/(decrease) in Owners’ Capital resulting from operations | (872,437 | ) | (53,305,642 | ) | (54,178,079 | ) | ||||||
|
|
|
|
|
| |||||||
Owners’ Capital, September 30, 2013 | $ | 4,915,327 | $ | 323,342,393 | $ | 328,257,720 | ||||||
|
|
|
|
|
| |||||||
The consolidated Trust is not unitized as are the individual Series of the CodificationTrust
The accompanying notes are an integral part of these consolidated financial statements.
The Frontier Fund
Consolidated Statements of Cash Flows
For the Nine Months Ended September 30, 2013 and 2012
(Unaudited)
| 2013 | 2012 | |||||||
Cash Flows from Operating Activities: | ||||||||
Net increase/(decrease) in capital resulting from operations | $ | (54,178,079 | ) | $ | (6,180,966 | ) | ||
Adjustments to reconcile net increase/(decrease) in capital resulting from operations to net cash provided by (used in) operating activities: | ||||||||
Change in: | ||||||||
Net change in open trade equity | 5,173,457 | (25,416,521 | ) | |||||
Net change in options written | (2,612,290 | ) | 1,285,103 | |||||
Net change in allocation of total return swaps | 3,501 | |||||||
Net unrealized gain/(loss) on swap contracts | 2,763,657 | (1,538,438 | ) | |||||
Net realized gain/(loss) on swap contracts | 3,555,134 | 525,237 | ||||||
Net unrealized gain/(loss) on U.S. Treasury securities | 1,157,776 | 1,832,445 | ||||||
Net realized gain/(loss) on U.S. Treasuries securities | (1,078,008 | ) | (854,738 | ) | ||||
Net realized gain/(loss) on investment in Berkeley Colorado Quantitative Fund LLC | — | 2,172,987 | ||||||
Net unrealized gain/loss on investment in Berkeley Colorado Quantitative Fund LLC | — | (2,084,880 | ) | |||||
(Purchases) sales of: | ||||||||
Sales of swap contracts | 20,694,866 | 9,812 | ||||||
(Purchases) of swap contracts | (21,880,000 | ) | — | |||||
Sales of U.S. Treasury securities | 17,921,554 | 37,864,769 | ||||||
Sales of custom time deposits | 76,007,675 | 25,000,000 | ||||||
Interest rollover of custom time deposits | — | (2,897,700 | ) | |||||
Sales of Berkeley Colorado Quantitative Fund LLC | — | 6,182,737 | ||||||
Increase and/or decrease in: | ||||||||
Receivable from futures commission merchants | 81,288,822 | 8,116,123 | ||||||
Control of ownership of trading companies | — | — | ||||||
Contributions to trading companies | — | — | ||||||
Distributions from trading companies | — | — | ||||||
Prepaid service fees | 101,896 | 141,468 | ||||||
Interest receivable | 250,645 | 901,235 | ||||||
Receivable from related parties | (3,420 | ) | — | |||||
Other assets | 34,993 | (230,951 | ) | |||||
Incentive fees payable to Managing Owner | (732,119 | ) | 3,953,375 | |||||
Management fees payable to Managing Owner | (402,038 | ) | (113,885 | ) | ||||
Interest payable to Managing Owner | (175,293 | ) | (117,504 | ) | ||||
Trading fees payable to Managing Owner | (203,645 | ) | (129,642 | ) | ||||
Service fees payable to Managing Owner | (215,722 | ) | (41,149 | ) | ||||
Payables to related parties | (28,041 | ) | 42,580 | |||||
Other liabilities | (50,070 | ) | 217,665 | |||||
|
|
|
| |||||
Net cash provided by (used in) operating activities | 127,395,251 | 48,639,162 | ||||||
|
|
|
| |||||
Cash Flows from Financing Activities: | ||||||||
Proceeds from sale of capital | 8,844,273 | 39,291,798 | ||||||
Payment for redemption of capital | (146,394,197 | ) | (97,178,756 | ) | ||||
Pending owner additions | (65,566 | ) | 521,765 | |||||
Redemptions payable | 102,802 | (2,346,525 | ) | |||||
|
|
|
| |||||
Net cash provided by (used in) financing activities | (137,512,688 | ) | (59,711,718 | ) | ||||
|
|
|
| |||||
Net increase (decrease) in cash and cash equivalents | (10,117,437 | ) | (11,072,556 | ) | ||||
Cash and cash equivalents, beginning of period | 17,094,782 | 27,452,803 | ||||||
|
|
|
| |||||
Cash and cash equivalents, end of period | $ | 6,977,345 | $ | 16,380,247 | ||||
|
|
|
| |||||
The accompanying notes are an integral part of these consolidated financial statements.
The Frontier Fund
Notes to Consolidated Financial Statements (Unaudited)
1. Organization and Purpose
The Frontier Fund, which is referred to in this report as “the Trust”, was formed on August 8, 2003, as a Delaware statutory trust. The Trust is a multi-advisor commodity pool, as described in Commodity Futures Trading Commission (the “CFTC”) Regulation § 4.10(d)(2). The Trust has authority to issue separate series, or each, a Series, of units of beneficial interest (the “Units”) pursuant to the requirements of the Delaware Statutory Trust Act, as amended (the “Trust Act”). The assets of each Series are valued and accounted for separately from the assets of other Series. The Trust is not registered as an investment company under the Investment Company Act of 1940, as amended (the “Investment Company Act”). It is managed by its Managing Owner, Equinox Fund Management, LLC.
Purchasers of Units are limited owners of the Trust (“Limited Owners”) with respect to beneficial interests of the Series’ Units purchased. The Trust Act provides that, except as otherwise provided in the amended and restated declaration of trust and trust agreement dated August 8, 2003, by and among the Managing Owner, Wilmington Trust Company as trustee and the unitholders from time to time (the “Trust Agreement”), unitholders in a Delaware statutory trust will have the same limitation of liability as do stockholders of private corporations organized under the General Corporation Law of the State of Delaware. The Trust Agreement confers substantially the same limited liability, and contains the same limited exceptions thereto, as would a limited partnership agreement for a Delaware limited partnership engaged in like transactions as the Trust. In addition, pursuant to the Trust Agreement, the Managing Owner of the Trust is liable for obligations of a Series in excess of that Series’ assets. Limited Owners do not have any such liability. The Managing Owner will make contributions to Series of the Trust necessary to maintain at least a 1% interest in the aggregate capital, profits and losses of all Series.
The Trust has been organized to pool assets of investor funds for the purpose of trading in the United States (“U.S.”) and international markets for currencies, interest rates, stock indices, agricultural and energy products, precious and base metals and other commodities. The Trust may also engage in futures contracts, forwards, option contracts and other interest in derivative instruments, including swap contracts (“Swaps”).
The Trust has seven (7) separate and distinct Series of Units issued and outstanding: Frontier Diversified Series, Frontier Masters Series, Frontier Long/Short Commodity Series, Balanced Series, Frontier Select Series (formerly Tiverton/Graham/Transtrend Series), Winton Series, and Frontier Heritage Series (formerly Winton/Graham Series) (each a “Series” and collectively, the “Series”). The Currency Series ceased trading on April 18, 2013 and the TBG Institutional Series ceased trading on May 23, 2013. The Trust financial statements are comprised of unitized Series which are consolidated into the Trust financial statements. However, the consolidated Trust does not issue units.
The Trust, with respect to each Series:
engages in the speculative trading of a diversified portfolio of futures, forward (including interbank foreign currencies), options contracts and other derivative instruments (including swap contracts), and may, from time to time, engage in cash and spot transactions;
allocates funds to a limited liability trading company or companies (“Trading Company”). Except as otherwise described in these notes, each Trading Company has one-year renewable contracts with its own independent commodity trading advisor(s), or each, a Trading Advisor, that will manage all or a portion of such Trading Company’s assets and make the trading decisions for the assets of each Series vested in such Trading Company. Each Trading Company will segregate its assets from any other Trading Company;
maintains separate, distinct records for each Series, and accounts for the assets of each Series separately from the other Series;
calculates the Net Asset Value (“NAV”) of its Units for each Series separately from the other Series;
has an investment objective of increasing the value of each Series’ Units over the long term (capital appreciation), while controlling risk and volatility; further, to offer exposure to the investment programs of individual Trading Advisors and to specific instruments (currencies);
maintains each Series of Units in three or six sub-classes—Class 1, Class 1a, Class 2, Class 2a, Class 3, and Class 3a. Investors who have purchased Class 1 or Class 1a Units of any Series are charged a service fee of up to three percent (3.0%) annually of the NAV of each Unit purchased, for the benefit of Selling Agents selling such Class 1 or Class 1a Units. The initial service fee, which is amortized monthly at an annual rate of up to three percent (3.0%) of the average daily NAV of Class 1 or Class 1a of such Series, is prepaid to Equinox Fund Management, LLC (the “Managing Owner”) by each Series, and paid to the selling agents by the Managing Owner in the month following sale; provided, however, that investors who redeem all or a portion of their Class 1 or Class 1a Units of any Series during the first twelve (12) months following the effective date of their purchase are subject to a master netting arrangementredemption fee of up to three percent (3.0%) of the NAV at
which such investor redeemed to reimburse the Managing Owner for the then-unamortized balance of the prepaid initial service fee. With respect to Class 2 and Class 2a Units of any Series, the Managing Owner pays an ongoing service fee to Selling Agents of up to one half percent (0.5%) annually of the NAV of each Class 2 or Class 2a Unit (of which 0.25% will be charged to Limited Owners holding Class 2 Units of the Frontier Diversified Series, and Frontier Masters Series or Class 2a Units of the Frontier Long/Short Commodity Series) sold until such Class 2 or Class 2a Units which are subject to the fee limitation are reclassified as Class 3 or Class 3a Units of the applicable Series. The Managing Owner may also pay Selling Agents certain additional fees and expenses for administrative and other services rendered and expenses incurred by such Selling Agents; and |
all payments made to Selling Agents who are members of the Financial Industry Regulatory Authority, Inc. (“FINRA”) and their associated persons that constitute underwriting compensation will be subject to the limitations set forth in Rule 2310(b)(4)(B)(ii) (formerly Rule 2810(b)(4)(B)(ii)) of the Conduct Rules of FINRA (“Rule 2310”). An investor’s Class 1 Units or similar agreement. This guidance is effectiveClass 2 Units of any Series, or Class 1a Units or Class 2a Units of the Frontier Long/Short Commodity Series or Balanced Series will be classified as Class 3 or Class 3a Units of such Series, as applicable, when the Managing Owner determines that the fee limitation set forth in Rule 2310 with respect to such Units has been reached or will be reached. No service fees are paid with respect to Class 3 or Class 3a Units. Units of any Class in a Series may be redeemed, in whole or in part, on a daily basis, at the then current NAV per Unit for annual and interim periods beginning on or after January 1, 2013. An entity should provide the disclosures required by those amendments retrospectively for all comparative periods presented. The adoption of this guidance is not expected to have a material impactsuch Series on the Trust’s financial positionday of the week after the date the Managing Owner is in receipt of a redemption request for at least one (1) Business Day to be received by the Managing Owner prior to 4:00 PM in New York.
The assets of any particular Series include only those funds and other assets that are paid to, held by or resultsdistributed to the Trust on account of operations and for the benefit of that Series. Under the “Inter-Series Limitation on Liability” expressly provided for under Section 3804(a) of the Trust Act, separate and distinct records of the cash and equivalents, although pooled for maximizing returns, is discussedmaintained in Note 7.the books and records of each Series.
As of September 30, 2013, the Trust, with respect to the Frontier Diversified Series, Frontier Masters Series, Frontier Select Series (formerly Tiverton/Graham/Transtrend Series), Winton Series and Frontier Heritage Series (formerly Winton/Graham Series) separates Units into three separate Classes—Class 1, Class 2, and Class 3. The Trust, with respect to the Balanced Series and the Frontier Long/Short Commodity Series separates Units into six separate Classes—Class 1, Class 2, Class 3, Class 1a, Class 2a and Class 3a. It is expected that between 10% and 30% of each Series’ assets normally will be invested in one or more Trading Companies to be committed as margin for trading positions, but from time to time these percentages may be substantially more or less. The remainders of each Series’ assets are maintained at the Trust level for cash management. Each of the respective Series has invested monies into pooled cash management assets which have included purchases of certificates of deposit and custom time deposits. Each Series’ ownership in these investments is based on its percentage ownership in the pooled cash management assets on the reporting date.
Each Series of the Trust may invest a portion of its assets in a single Trading Company or in several different Trading Companies and may have multiple Trading Advisors that manage the assets invested in such Trading Companies.
During July 2012, Frontier Long/Short Commodity Series Class 1 Units and Balanced Series Class 1a Units ceased Trading Operations and all remaining Units were exchanged for Class 3 Units and Class 3a Units, respectively.
In November 2010, the Frontier Select Series (formerly Tiverton/Graham/Transtrend Series) of the Trust invested a portion of its assets in Berkeley Quantitative Colorado Fund LLC, an unaffiliated company, managed by an affiliate of Berkeley Quantitative L.P. Through this investment, Berkeley Quantitative L.P. became a commodity trading advisor to the Trust. The investment was liquidated March 20, 2012.
The Trust has entered into agreements, which provide for the indemnification of futures clearing brokers, currency trading companies, and commodity trading advisers, among others, against losses, costs, claims and liabilities arising from the performance of their individual obligations under such agreements, except for gross negligence or bad faith.
2. Significant Accounting Policies
The following are the significant accounting policies of the Trust.
Subsequent EventsBasis of Presentation—The Trust follows Generally Accepted Accounting Principles (“GAAP”), as established by the provisionsFinancial Accounting Standards Board (the “FASB”), to ensure consistent reporting of ASC 855,financial condition, schedules of investments, results of operations, changes in capital and cash flows.
These financial statements should be read in conjunction with the audited financial statements and notes thereto included in our 2012 Annual Report on Form 10-K as filed with the SEC.
Subsequent EventsConsolidation,—Each Series of the Trust invests in Trading Companies who authorize certain Trading Advisors to place trades and manage assets at pre-determined investment levels. The Trading Companies were organized by the Managing Owner for the purpose of investing in commodities interests and derivative instruments, and have no operating income or expenses, except for trading income and expenses, all of which establishes general standardsis allocated to the Series. The Trading Companies and Series of accounting forthe Trust are consolidated by the Trust.
Investment in Berkeley Quantitative Colorado Fund LLC—The Frontier Select Series (formerly Tiverton/Graham/Transtrend Series) of the Trust had an investment in the Berkeley Quantitative Colorado Fund LLC. The Berkeley Quantitative Colorado Fund LLC began operations on November 1, 2010. The Berkeley Quantitative Colorado Fund LLC was not consolidated into the financial statements of the Trust because the Trust has no control or transparency over the operations of the fund. This investment was shown on the consolidated statements of financial condition with the change in fair value shown in net unrealized gain/(loss) on the Berkeley Quantitative Colorado Fund LLC. This investment was liquidated on March 20, 2012.
Use of Estimates—The preparation of financial statements in conformity with GAAP may require the Managing Owner to make estimates and assumptions that affect the reported amounts of assets and liabilities and disclosure of events that occur aftercontingent assets and liabilities at the balance sheet date and up through the dateof the financial statements are issued. Refer to Note 10.
3. Fair Value Measurements
In connection withand the reported amounts of revenue and expenses during the reporting period. The valuation of swap contracts requires significant estimates as well as the valuation of investments the Trust applies ASC 820,Fair Value Measurement (“ASC 820”). ASC 820 provides clarification that when a quoted price in an active marketcertain other investments. Please refer to Note 3 for the identical asset or liability is not available, a reporting entity is required to measure fair value using certain techniques. ASC 820 also clarifies that when estimating the fair valuediscussion of an asset or liability, a reporting entity is not required to include a separate input or adjustment to other inputs relating to the existence of a restriction that prevents the transfer of an asset or liability. ASC 820 also clarifies that both a quoted price in an active market for the identical asset or liability at the measurement datevaluation methodology. Actual results could differ from these estimates and the quoted price for the identical asset or liability when traded as an asset in an active market when no adjustments to the quoted price of the asset are required are Level 1 fair value measurements.such differences could be material.
Level 1 InputsCash and Cash Equivalents—
Unadjusted quoted pricesCash and cash equivalents include cash and overnight investments in active markets for identical financial assets that the reporting entity has the ability to accessinterest-bearing demand deposits held at the measurement date.
Level 2 Inputs
Inputs other than quoted prices included in Level 1 that are observable for the financial assetbanks with original maturities of three months or liabilities, either directly or indirectly. These might include quoted prices for similar financial assets in active markets, quoted prices for identical or similar financial assets in markets that are not active, inputs other than quoted prices that are observable for the financial asset or inputs that are derived principally from or corroborated by market data by correlation or other means.
Level 3 Inputsless.
Unobservable inputs for determining the fair value of financial assets that reflect an entity’s own assumptions about the assumptions that market participants would use in pricing the financial asset.
The Trust uses the following methodologies to value instruments within its financial asset portfolio at fair value:
Trading Securities.Interest Income—These instruments includeAggregate interest income from all sources, including U.S. Treasury securities, custom time deposits and open trade equity positions (futures contracts) that are actively traded on public markets with quoted pricing for corroboration. assets held at Futures Commission Merchants (“FCM”), up to the first two percentage points or 20% of the aggregate percentage yield (annualized) is paid to the Managing Owner. All interest not paid to the Managing Owner is interest income to the Trust.
U.S. Treasury securities and futures contractsSecurities—U.S. Treasury Securities are reported at fair value usingas Level 1 inputs. Trading securities instruments further include open trade equity positions (trading optionsinputs under ASC 820,Fair Value Measurements and currency forwards)Disclosures (“ASC 820”). The Trust values U.S. Treasury Securities at fair value and records the daily change in value in the consolidated statements of operations as net unrealized gain/(loss) on U.S. Treasury securities. Accrued interest is reported on the consolidated statements of financial condition as interest receivable. All U.S. Treasury Securities have been liquidated as of September 30, 2013.
Custom Time Deposits—Custom time deposits are structured deposit agreements with U.S. Bank National Association that earn a guaranteed fixed interest rate between 3.75%, mature nine months from the deposit date and are quoted pricessubject to automatic six-month rollovers through October 2013. Custom time deposits were purchased on April 1, 2010, September 15, 2009, October 21, 2008 and October 30, 2008. Interest is paid monthly or at least every nine months. Unscheduled withdrawals will be subject to certain penalties and other costs of up to 1.0% of the amount deposited if withdrawn within the first nine months from the deposit date. The withdrawal fee is set at 0.225% for identical or similarthe period from nine months to one year subsequent to the deposit date and decreases by .05% increments for each year thereafter through the maturity date. In May 2011, July 2011, August 2011, January 2012, October 2012, November 2012, April 2013, June 2013, July 2013 and August 2013, the Trust, with respect to the Series, redeemed approximately $25 million, $25 million, $50 million, $25 million, $16 million, $5 million, $35 million, $20 million and $15 million, respectively, in custom time deposits held with U.S. Bank N.A which represented a full liquidation of the 2.17% investment tranche and an additional $100 million of the 3.75% tranche. Custom time deposits are allocated to each Series based on their percentage ownership in the pooled cash management assets that areas of the reporting date. The Trust values the custom time deposits at face value plus accrued interest as it is considered a deposit account under paragraph 7.50 of theInvestment Company Audit Guide, and accordingly, this deposit is not tradedsubject to ASC 820.
Credit Default Swaps— The Series of the Trust invested in credit default swaps for the purpose of mitigating part of the risk of concentration of deposits with U.S. Bank National Association to other major financial institutions. See Note 4. Credit Default Swaps were allocated to each Series based on active markets. Trading options and currency forwards aretheir percentage ownership in the pooled cash management assets as of the reporting date. Credit Default Swaps were reported at fair value using Level 2 inputs.
Swap Contracts. Certainbased upon counterparty value per the valuation policy. The Series of the Trust recorded the daily change in fair value in the statements of operations as net unrealized gain/(loss) on swap contracts. All Credit Default Swaps expired during March 2012.
Receivable From Futures Commission Merchants—The Trust deposits assets with a FCM subject to CFTC regulations and various exchange and broker requirements. Margin requirements are satisfied by the deposit of cash with such FCM. The Trust earns interest income on its assets deposited with the FCM.
Investment Transactions—Futures, options on futures, forward and swap contracts are recorded on a trade date basis and realized gains or losses are recognized when contracts are settled. Unrealized gains or losses on open contracts (the difference between contract trade price and market price) are reported in the consolidated statements of financial condition as a net unrealized gain or loss, as there exists a right of offset of unrealized gains or losses in accordance with FASB ASC 210,Balance Sheet (“ASC 210”).
Any change in net unrealized gain or loss from the preceding period is reported in the consolidated statements of operations. Fair value of exchange-traded contracts is based upon exchange settlement prices. Fair value of non-exchange-traded contracts is based on third party quoted dealer values on the interbank market. For U.S. Treasury securities, interest was recognized in the period earned and the instruments were marked-to-market daily based on third party information. Custom time deposits are valued at face value plus accrued interest and the interest income is recognized in the period earned. Transaction costs are recognized as incurred and reflected separately in the consolidated statements of operations.
Foreign currency transactions—The Series of the Trust’s functional currency is the U.S. Dollar, however, they transact business in currencies other than the U.S. Dollar. The Series of the Trust do not isolate that portion of the results of operations resulting from changes in foreign exchange rates on investments from fluctuations arising from changes in market prices of securities held. Such fluctuations are included with the net realized or unrealized gain or loss from investments.
Allocation of Earnings—Each Series of the Trust may maintain three or six classes of Units—Class 1, Class 2, Class 3, Class 1a, Class 2a and Class 3a). All classes have identical voting, dividend, liquidation and other rights and the same terms and conditions, except that fees charged to a Class or Series differ as described below. Revenues, expenses (other than expenses attributable to a specific class), and realized and unrealized trading gains and losses of each Series are allocated daily to Class 1, Class 1a, Class 2, Class 2a, Class 3 and Class 3a Units based on each Class’ respective owners’ capital balances as applicable to the classes maintained by the Series.
Payments by the Managing Owner—The Managing Owner may make discretionary payments to the Trust related to a variety of factors, including investment losses to reimburse the effect of a loss on a portfolio investment which has been caused by a situation outside the Trust’s, or it’s affiliates’, direct control. Such payments will be made on a discretionary basis and will be disclosed in the consolidated statement of operations as a net increase from payments by the Managing Owner. These payments are in accordance with the Trust agreement on a discretionary basis as determined by the Managing Owner.
Investments and Swaps—The Trust records investment transactions on a trade date basis and all investments are recorded at fair value, with changes in fair value reported as a component of realized and unrealized gains/(losses) on investments in the statements of operations. The Trust strategically investinvests a portion or all of theirits assets in total return Swaps, selected at the directiondiscretion of the Managing Owner. Swaps are privately negotiated contracts designed to provide investment returns linked to those produced by one or more underlying investment products or indices. In a typical Swap, two parties agree to exchange the returns (or differentials in rates of return) earned or realized on one or more particular predetermined investmentsinvestment or instruments.instrument. The gross returns to be exchanged or “swapped” between the parties are calculated with respect to a “notional amount” (i.e., the amount of value of the underlying asset used in computing the particular interest rate, return, or other amount to be exchanged) in a particular investment, or in a “basket” of securities. The valuation of swap contracts requires significant estimates. Swap contracts are reported utilizing Level 3 Inputs. The significant unobservable inputs used in the fair value measurement of the Trust’s Swap contracts are asset liquidity, debt valuation, credit risk, volatility, market risk, distributions, dividends, risk premiums, and other risk management tools. Significant increases (decreases) in any of those inputs in isolation would result in a significantly lower (higher) fair value measurement. Swap Contracts are reported at fair value based upon daily reportsa weekly indicative value that is calculated by management using bid/ask prices from the counterparty. The valuation of swap contracts requires significant estimates utilizing Level 3 InputsThis fair value is corroborated by management through the use ofvaluations provided by a third party pricing service (“pricing service”).service. The third party pricing service utilizing proprietary model-intensive methodologies, selects and implements theutilizes a Black Scholes pricing model appropriate for each swap valuation. The pricing service does not provide detailwith input adjustments factoring in volatility and liquidity of the pricing model to management. The Managing Owner through the Valuation Committee chartedinstruments. All valuation processes are monitored by the Executive Committeevaluation committee of the Managing Owner. Please refer to Note 3Fair Value Measurements.
Income Taxes—The Trust engages, via inquiryapplies the provisions of ASC 740Income Taxes(“ASC 740”), which provides guidance for how uncertain tax positions should be recognized, measured, presented and review of methodology documentation, with the service provider to gain an understanding of the valuation model selected; the components of the model, both observable and unobservable; and quality control testing procedures in place. The Valuation committee meets on a monthly basis and as needed to discuss any updates or changesdisclosed in the valuation process, reportingfinancial statements. This interpretation also provides guidance on derecognition, classification, interest and penalties, accounting in interim periods and disclosure. ASC 740 requires the evaluation of tax positions taken or expected to be taken in the Executive Committee. The pricing service’s methodology includes performancecourse of tolerance testing on its valuation modelspreparing the Trust’s financial statements to ensure consistency and reasonablenessdetermine whether the tax positions are “more-likely-than-not” of being sustained by the values derived. The tolerance testing includes valuingapplicable tax authority. Tax positions with respect to tax at the components ofTrust’s level not deemed to meet the product separately, i.e. underlying asset, volatility, financing rates, and so forth. The tolerance testing is part of“more-likely-than-not” threshold would be recorded as a tax benefit or expense in the initial valuation setup and throughout the ongoing daily valuation process. The pricing service also has several layers of quality control including: engineering / reverse engineering process to understand each swap and its’ subcomponent parts fully; comparative analysis against other valuations performed with similar composition and characteristics; review of output valuation against expectations based on observable price movements of underlying futures; and lastly, periodic review by senior financial engineer to ensure design and function of model is stable and perform as expected.
current year. The Managing Owner has chartered a valuation committeeconcluded there is no tax expense, interest or penalties to provide oversight ofbe recorded by the valuation processTrust for the Series.years ended December 31, 2012, 2011 and 2010. The valuation committee meets at least monthly2009 through 2012 tax years generally remain subject to discussexamination by U.S. federal and most state tax authorities.
In the valuation process and any valuation issues that may arise. The valuation committee is comprised of senior membersopinion of the Managing Owner’s management team with varying areas of expertiseOwner, (i) the Trust is treated as a partnership for Federal income tax purposes and, assuming that add value to the committee. The valuation committee reports to both the Managing Owner’s Investment Oversight and Risk Committee and the Trust’s Executive Committee. The committee further remains in communication with the Managing Owner’s Due Diligence Committee that provides ongoing counterparty risk monitoringat least 90% of the swap counterparties. The committee monitors daily pricing valuation provided bygross income of the swap counterpartyTrust constitutes “qualifying income” within the meaning of Section 7704(d) of the Code, the Trust is not a publicly traded partnership treated as a corporation, and daily valuation provided by(ii) the third party pricing service to ensurediscussion set forth in the change in fair value is reasonable and valuations are in accordance with current regulations and best practices. The committee may request a price challenge ifProspectus under the daily valuation provided by the counterparty valuations differs significantly from the valuation obtained by the pricing service. The Managing Owner’s valuation committee monitors some additional input factors such as liquidity, volatility, and counterparty risk in order to further review the valuations provide by the pricing service.
The following tableheading “Federal Income Tax Consequences” correctly summarizes the instruments that comprise the Trust’s financial asset portfolio, by Series, measured at fair value on a recurring basismaterial Federal income tax consequences as of June 30, 2013 and December 31, 2012, segregated by the level of valuation inputs within the fair value hierarchy utilized to measure fair value:
June 30, 2013 | Level 1 Inputs | Level 2 Inputs | Level 3 Inputs | Total Fair Value | ||||||||||||
Open Trade Equity (Deficit) | $ | 13,574,675 | $ | (5,122,572 | ) | $ | — | $ | 8,452,103 | |||||||
Swap Contracts | — | — | 21,876,339 | 21,876,339 | ||||||||||||
Written Options | — | (2,376,367 | ) | — | (2,376,367 | ) | ||||||||||
December 31, 2012 | Level 1 Inputs | Level 2 Inputs | Level 3 Inputs | Total Fair Value | ||||||||||||
Open Trade Equity (Deficit) | $ | (2,510,310 | ) | $ | 14,626,959 | $ | — | $ | 12,116,649 | |||||||
Swap Contracts | — | — | 22,289,478 | 22,289,478 | ||||||||||||
U.S. Treasury Securities | 18,001,322 | — | — | 18,001,322 | ||||||||||||
Written Options | — | (4,199,198 | ) | — | (4,199,198 | ) | ||||||||||
Balance of recurring Level 3 assets as of January 1, 2013 Total gains or losses (realized/unrealized): Included in earnings-realized Included in earnings-unrealized Purchases of investments Sales of investments Transfers in and/or out of Level 3 Balance of recurring Level 3 assets as of June 30, 2013 Balance of recurring Level 3 assets as of January 1, 2012 Total gains or losses (realized/unrealized): Included in earnings-realized Included in earnings-unrealized Purchases of investments Sales of investments Transfers in and/or out of Level 3 Balance of recurring Level 3 assets as of December 31, 2012 For the Six Months Ended
June 30, 2013 $ 22,289,479 (1,908,743 ) (163,140 ) 6,000,000 (4,341,257 ) — $ 21,876,339 For the Year Ended
December 31, 2012 $ 24,211,688 (525,237 ) (1,387,160 ) — (9,812 ) — $ 22,289,479
The Trust assesses the levels of the investments at each measurement date, and transfers between levels are recognized on the actual date of the event or change in circumstances that caused the transfer in accordance with the Trust’s accounting policy regarding the recognition of transfers between levelsProspectus to potential U.S. Limited Owners of the fair value hierarchy.purchase, ownership and disposition of Units of the Trust.
4. Swaps
In addition to authorizing Trading Advisors to manage pre-determined investment levels of futuresFees and forward contracts, certain SeriesExpenses—All management fees, incentive fees, service fees and trading fees of the Trust will strategically invest a portion or all of their assets in total return swaps, selected atare paid to the directionManaging Owner. It is the responsibility of the Managing Owner. Total return Swaps are privately negotiated contracts designedOwner to provide investment returns linked to those produced by one or more investment products or indices. In a typical total return Swap, two parties agree to exchange the returns (or differentials in rates of return) earned or realized on one or more particular predetermined investments or instruments. The gross returns to be exchanged or “swapped” between the parties are calculated with respect to a “notional amount” (i.e., the amount or valuepay all Trading Advisor management and incentive fees, Selling Agent Service fees and all other operating expenses and continuing offering costs of the underlying asset used in computing the particular interest rate, return, or other amount to be exchanged) in a particular investment, or in a “basket” of securities.Trust.
Service Fees—The Trust invested in Credit Default Swaps (“CDS”) with highly-rated counterparties as part of its portfolio. CDSs are over-the-counter investment instruments designed to mitigate counterparty risk and generally pay upon the happening of a credit default of a counterparty. The CDS were allocated tomay maintain each Series based on their percentage ownershipof Units in the pooled cash management assets at U.S. Bank National Association asthree or six sub-classes—Class 1, Class 1a, Class 2, Class 2a, Class 3, and Class 3a. Investors who have purchased Class 1 or Class 1a Units of any Series are charged a service fee of up to three percent (3.0%) annually of the reporting date. All Credit Default Swaps had expired asNAV of March 31, 2012.
each Unit purchased, for the benefit of selling agents selling such Class 1 or Class 1a Units. The Trust’s investment in Swaps will likely differ substantially over time dueinitial service fee, which is amortized monthly at an annual rate of up to cash flows, portfolio management decisions and market movements. The Swaps serve to diversify the investment holdingsthree percent (3.0%) of the Trust and to provide access to programs and advisors that would not be otherwise availableaverage daily NAV of Class 1 or Class 1a of such Series, is prepaid to the Trust, and are not used for hedging purposes.
The Managing Owner follows a procedure in selecting well-established financial institutions whichby each Series, and paid to the selling agents by the Managing Owner in its sole discretion, considersthe month following sale; provided, however, that investors who redeem all or a portion of their Class 1 or Class 1a Units of any Series during the first twelve (12) months following the effective date of their purchase are subject to be reputable, reliable, financially responsible and well establisheda redemption fee of up to act as swap counterparties. The procedure includes due diligence review of documentation on all new and existing financial institution counterparties prior to initiationthree percent (3.0%) of the relationship, and quarterly ongoing review during the relationship,NAV at which such investor redeemed to ensure that counterparties meet the Managing Owner’s minimum credit requirements, the counterparty average rating being no less than an investment grade rating as defined by the rating agencies. As of June 30, 2013 and December 31, 2012, approximately 5.3% and 4.0%, respectively, of the Trust’s assets were deposited with over-the-counter counterparties in order to initiate and maintain Swaps.
The Trust strategically invests assets in one or more swaps linked to certain underlying investments or indices at the direction of the Managing Owner. The Trading Company in which the assets of the Trust will be invested will not own any of the investments or indices referenced by any swap entered into by the Trust. In addition, neither the swap counterparty nor any advisor referenced by any such swap is a Trading Advisor to the Trust.
The Trust had invested in the following swaps as of and for the six months ended June 30, 2013:
| Total Return Swap | Balanced Series Option/Swap | Option | ||||||||||
Counterparty | DeutscheBank | Societe Generale | DeutscheBank | |||||||||
Notional Amount | $ | 40,000,000 | $ | 52,651,671 | $ | — | ||||||
Termination Date | 3/26/2018 | 11/21/2014 | 6/30/2016 | |||||||||
Investee Returns | On Default | Total Returns | Total Returns | |||||||||
Realized Gain/(Loss) | $ | — | $ | — | $ | (1,908,743 | ) | |||||
|
|
|
|
|
| |||||||
Unrealized Gain/(Loss) | $ | (935,340 | ) | $ | (974,054 | ) | $ | 1,746,254 | ||||
|
|
|
|
|
| |||||||
Fair Value as of 6/30/13 | $ | 5,064,660 | $ | 16,811,679 | $ | — | ||||||
|
|
|
|
|
| |||||||
The Trust had invested in the following swaps as of and for the year ended December 31, 2012:
| Credit Default Swap | Credit Default Swap | Option/Swap | Total Return Swap | |||||||||||||
Counterparty | BNP Paribas | Societe Generale | Societe Generale | DeutscheBank | ||||||||||||
Notional Amount | $ | — | $ | — | $ | 20,486,403 | $ | 23,551,287 | ||||||||
Termination Date | 3/20/2012 | 3/20/2012 | 11/21/2014 | 6/30/2016 | ||||||||||||
Investee Returns | On Default | On Default | Total Returns | Total Returns | ||||||||||||
Realized Gain/(Loss) | $ | (407,283 | ) | $ | (117,954 | ) | $ | — | $ | — | ||||||
|
|
|
|
|
|
|
| |||||||||
Unrealized Gain/(Loss) | $ | (215,874 | ) | $ | 117,954 | $ | 78,977 | $ | (1,378,028 | ) | ||||||
|
|
|
|
|
|
|
| |||||||||
Fair Value as of 12/31/2012 | $ | — | $ | — | $ | 17,785,733 | $ | 4,503,745 | ||||||||
|
|
|
|
|
|
|
| |||||||||
5. Transactions with Affiliates
The Managing Owner contributes funds to the Trust in order to have a 1% interest in the aggregate capital, profits and losses and in return will receive units designated as general units in the Series of the Trust in whichreimburse the Managing Owner invests such funds. The general units may only be purchased byfor the then-unamortized balance of the
prepaid initial service fee. With respect to Class 2 and Class 2a Units of any Series, the Managing Owner and may be subjectpays an ongoing service fee to no advisory fees or management advisory fees at reduced rates. Otherwise, the general units hold the same rights as the limited units. The Managing Owner is requiredSelling Agents of up to maintain at least a 1% interest (“Minimum Purchase Commitment”one half percent (0.5%) in the aggregate capital, profits and lossesannually of the Trust so long as it is acting as the Managing OwnerNAV of each Class 2 or Class 2a Unit (of which 0.25% will be charged to Limited Owners holding Class 2 Units of the Trust. Such contribution was made by the Managing Owner before trading commenced for the TrustFrontier Diversified Series, and will be maintained throughout the existence of the Trust, and the Managing Owner will make such purchases as are necessary to effect this requirement. Additionally, the Managing Owner agreed with certain regulatory bodies to maintain a 1% interest specifically in the BalancedFrontier Masters Series Class 1 a Units and Balanced Seriesor Class 2a Units aggregated, and each of the Frontier Long/Short Commodity Series, Frontier Diversified Series, and Frontier Masters Series. The 1% interest in these specific SeriesSeries) sold until such Class 2 or Class 2a Units which are subject to the fee limitation are reclassified as Class 3 or Class 3a Units of the Trust is included in computing the Minimum Purchase Commitment in aggregate capital. In addition to the general units the Managing Owner receives in respect of its Minimum Purchase Commitment, the Managing Owner may purchase limited units in anyapplicable Series as a Limited Owner. Principals of the Managing Owner or affiliates are allowed to own beneficial interests in the Trust, as well. All units purchased by the Managing Owner are held for investment purposes only and not for resale.administrative purposes. The Managing Owner may make purchases or redemptions at any time onalso pay Selling Agents certain additional fees and expenses for administrative and other services rendered and expenses incurred by such Selling Agents.
These service fees are part of the same terms as any Limited Owner. The Trust has and will continue to have certain relationships with the Managing Owner and its affiliates.
Expenses
Management Fees—Each Seriesoffering costs of the Trust, pays towhich include registration and filing fees, legal and blue sky expenses, accounting and audit, printing, marketing support and other offering costs which are born by the Managing Owner a monthly management fee equal to a certain percentage of such Series’ assets attributable to such Series (including notional assets), calculated on a daily basis. The annual rate of the management fee is 0.5% for the Balanced Series, 2.0% for the Winton Series, Frontier Long/Short Commodity Series Class 1 a and Class 2a and Frontier Masters Series, 0.75% for Frontier Diversified Series, 2.5% for the Frontier Heritage Series (formerly Winton/Graham Series) and Frontier Select Series (formerly Tiverton/Graham/Transtrend Series), and 3.5% for the Frontier Long/Short Commodity Series Class 1 and Class 2. The Managing Owner may pay all or a portion of such management fees to the Trading Advisor(s) for such Series.
Trading Fees—In connection with each Series’ trading activities of the Trust, the Frontier Long/Short Commodity Series (Classes 1, 2 and 3), Balanced Series, Currency Series, Frontier Select Series (formerly Tiverton/Graham/Transtrend Series), Winton Series and Frontier Heritage Series (formerly Winton/Graham Series) pays to the Managing Owner a trading fee, or FCM Fee, up to 0.75% of such Series’ NAV, calculated daily. The Frontier Diversified Series, Frontier Long/Short Commodity Series (Classes 1a and 2a) and Frontier Masters Series pays to the Managing Owner a trading fee, or FCM Fee, up to 2.25% and a custodial/due diligence fee of 0.12% of such Series’ NAV, calculated daily.
Incentive Fees—Some Series of the Trust pay to the Managing Owner an incentive fee of a certain percentage of new net trading profits generated by such Series, monthly or quarterly. Because the Balanced Series, Frontier Heritage Series (formerly Winton/Graham Series), Frontier Select Series (formerly Tiverton/Graham/Transtrend Series), and Frontier Long/Short Commodity Series may each employ multiple Trading Advisors, these Series will pay the Managing Owner a monthly incentive fee calculated on a Trading Advisor by Trading Advisor basis. It is therefore possible that in any given period the Series may pay incentive fees to the Managing Owner for one or more Trading Advisors while each of these Series as a whole experiences losses. The incentive fee is 25% for the Balanced Series and the Frontier Diversified Series and 20% for the Winton Series, Frontier Heritage Series (formerly Winton/Graham Series), Frontier Select Series (formerly Tiverton/Graham/Transtrend Series), Frontier Long/Short Commodity Series and Frontier Masters Series. The Managing Owner may pay all or a portion of such incentive fees to the Trading Advisor(s) for such Series.
Service Fees—In addition, with respect to Class 1 and Class 1a Units of each Series of the Trust, as applicable, the Series pays monthly or quarterly to the Managing Owner a service fee up to 3% annually, which the Managing Owner pays to selling agents of the Trust.
As of June 30, 2013, the Trust has a payable to the Managing Owner in the amounts of $0, $698,964, $463,436, $487,886 and $502,668 for incentive fees, management fees, interest, trading fees, and service fees, respectively.
As of December 31, 2012, the Trust has a payable to the Managing Owner in the amounts of $732,119, $1,003,663, $569,115, $602,333 and $652,500 for incentive fees, management fees, interest, trading fees, and trailing service fees, respectively.
For the three months ended June 30, 2013, the Trust paid the Managing Owner $433,445, $2,224,373, $1,979,570 and $1,585,219 for incentive fees, management fees, service fees, and trading fees, respectively.
For the three months ended June 30, 2012, the Trust paid the Managing Owner $5,389,883, $3,290,628, $2,631,478 and $1,983,352 for incentive fees, management fees, service fees, and trading fees, respectively.
For the six months ended June 30, 2013, the Trust paid the Managing Owner $889,025, $4,727,150, $4,067,740 and $3,251,764 for incentive fees, management fees, service fees, and trading fees, respectively.
For the six months ended June 30, 2012, the Trust paid the Managing Owner $5,673,583, $6,567,116, $5,439,667 and $4,031,386 for incentive fees, management fees, service fees, and trading fees, respectively.
Owner. With respect to the service fees, the initial service fee (for the first 12 months) relating to a purchase of Class 1 and Class 1a Units by an investor is prepaid by the Managing Owner to the relevant selling agent in the month following such purchase and is reimbursed thereforefor such payment by the Series monthly in arrears in an amount based upon a corresponding percentage of NAV, calculated daily. Consequently, the Managing Owner bears the risk of the downside and enjoys the benefit of the upside potential of any difference between the amount of the initial service fee prepaid by it and the amount of the reimbursement thereof, which may result from variations in NAV over the following 12 months. For
Pending Owner Additions—Funds received for new subscriptions and for additions to existing owner interests are recorded as capital additions at the six months ended June 30, 2013 amounts paid or owed to the Managing Owner for the difference in monthly service fees from the prepaid initial service fees were ($1,574). For the year ended December 31, 2012 amounts received or receivable from the Managing Owner for the difference in monthly service fees from the prepaid initial service fees were $2,096.
Aggregate interest income from all sources, including assets held at clearing brokers, up to 2% (annualized) is paid to the Managing Owner by the Balanced Series (Class 1 and Class 2 only), Winton Series, Select Series (formerly Berkeley/Graham/Tiverton Series), Currency Series and Frontier Heritage Series (formerly Winton/Graham Series). For the Frontier Diversified Series, Frontier Long/Short Commodity Series, Frontier Masters Series, and Balanced Series (Class 1a and Class 2a only), 20%NAV per unit of the total interest allocatedsecond business day following receipt.
Recently Issued Accounting Pronouncements—In June of 2013, FASB issued ASU 2013-08 to each Series(i) modify Topic 946 for determining whether an entity is paid toan investment company; (ii) update the Managing Owner. During the three months ended June 30, 2013measurement requirements for noncontrolling interests in other investment companies; and 2012 the Trust, with respect to the Series, paid $1,507,617 and $1,893,692, respectively, of such interest income to the Managing Owner. Such expenses are not included in the statements of operations of the Series. During the six months ended June 30, 2013 and 2012 the Trust, with respect to the Series, paid $3,089,699 and $3,907,894, respectively, of such interest income to the Managing Owner. Such expenses are not included in the statements of operations of the Series.
The Managing Owner paid to The Bornhoft Group Corporation, an affiliate of the Trust, a monthly fee of 0.25% (annualized) of the NAV of the Trust, for services in connection with the daily valuation of each Series and Class. The amount paid under this agreement was $77,196 and $465,830 for the three and six months ended June 30, 2012. As of April 20, 2012, the contract with The Bornhoft Group Corporation was amended to provide for an annual payment of $600,000(iii) require additional disclosures for investment companies under GAAP. This guidance is effective for annual and advisor services and 0.1% annuallyinterim periods beginning on or after December 15, 2013. An entity should provide the disclosures required by those amendments retrospectively for all comparative periods presented. The adoption of the trading level with the Balanced Series in lieu ofthis guidance is not expected to have a monthly service fee. The Managing Owner paid $274,246 and $657,374, respectively under this agreement for the three and six months ended June 30, 2013. The Managing Owner paid $324,029 under this agreement for the three and six months ended June 30, 2012.
Equinox Financial Group, LLC, an affiliate of the Trust, provides management services for the Managing Owner who paid $430,000 and $680,000, respectively, for the three and six months ended June 30, 2013.
Solon Capital, LLC, an affiliate of the Trust, provides product development and marketing services. For these services, the Managing Owner paid Solon Capital, LLC, $499,652 and $665,478, respectively, for the three months ended June 30, 2013 and 2012 and $1,047,744 and $1,365,020, respectively, for the six months ended June 30, 2013 and 2012.
Equinox Group Distributors LLC (formerly Bornhoft Group Securities Corporation), an affiliate under common control of the Managing Owner, serves as wholesaler of the Trust by marketing to broker/dealer organizations.
6. Financial Highlights
The following information presentsmaterial impact on the financial highlightspositions or results of the Trust for the three and six months ended June 30, 2013 and 2012. This data has been derived from the information presented in the consolidated financial statements.
| 2013 | 2012 | |||||||
Six Months Ended | ||||||||
Ratios to average net assets (1) | ||||||||
Net investment gain/(loss) (1) | -4.27 | % | -5.26 | % | ||||
Expenses before incentive fees (3) | -5.18 | % | -5.31 | % | ||||
Expenses after incentive fees (3) | -5.37 | % | -6.24 | % | ||||
Total return before incentive fees (2) | -6.04 | % | -1.46 | % | ||||
Total return after incentive fees (2) | -6.23 | % | -2.39 | % | ||||
| 2013 | 2012 | |||||||
Three Months Ended | ||||||||
Ratios to average net assets (1) | ||||||||
Net investment gain/(loss) (1) | -4.19 | % | -5.33 | % | ||||
Expenses before incentive fees (3) | -5.23 | % | -5.39 | % | ||||
Expenses after incentive fees (3) | -5.33 | % | -6.29 | % | ||||
Total return before incentive fees (2) | -6.46 | % | -1.42 | % | ||||
Total return after incentive fees (2) | -6.56 | % | -0.52 | % | ||||
The Trust financial highlights are calculated based upon the Trust’s consolidated financial statements. The consolidated Trust does not issue units and therefore the financial highlights do not disclose any unitized data.
7. Derivative Instruments and Hedging Activities
The Trust’s primary business is to engage in speculative trading of a diversified portfolio of futures, forwards (including interbank foreign currencies), options contracts and other derivative instruments (including swap contracts). The Trust does not enter into or hold positions for hedging purposes as defined under ASC 815. The detail of the fair value of the Trust’s derivatives by instrument types as of June 30, 2013 and December 31, 2012 is included in the Consolidated Condensed Schedules of Investments. See Note 4 for further disclosure related to the Trust’s positions in swap contracts.
For the three months ended June 30, 2013, the monthly average of futures contracts bought and sold was approximately 101,645 and 111,301, respectively. For the three months ended June 30, 2012, the monthly average of futures contracts bought and sold was approximately 29,700 and 33,800, respectively. For the six months ended June 30, 2013, the monthly average of futures contracts bought and sold was approximately 55,975 and 62,543, respectively. For the six months ended June 30, 2012, the monthly average of futures contracts bought and sold was approximately 28,300 and 30,850, respectively. The following tables summarize the trading revenues for the three and six months ended June 30, 2013 and 2012 by contract type:
Realized Trading Revenue from Futures, Forwards and Optionsoperations.
for the Three Months Ended June 30, 2013
Type of contract | ||||
Metals | $ | 10,793,629 | ||
Currencies | (14,334,634 | ) | ||
Energies | (5,877,152 | ) | ||
Agriculturals | (1,379,232 | ) | ||
Interest rates | (10,154,625 | ) | ||
Stock indices | 3,974,096 | |||
|
| |||
Realized trading income/(loss)(1) | $ | (16,977,918 | ) | |
|
| |||
Realized Trading Revenue from Futures, Forwards and Options
for the Six Months Ended June 30, 2013
Type of contract | ||||
Metals | $ | 5,862,091 | ||
Currencies | (6,757,507 | ) | ||
Energies | (11,446,766 | ) | ||
Agriculturals | (3,168,381 | ) | ||
Interest rates | (26,722,152 | ) | ||
Stock indices | 29,560,474 | |||
|
| |||
Realized trading income/(loss)(1) | $ | (12,672,241 | ) | |
|
| |||
Net Change in Open Trade Equity from Futures, Forwards and Options
for the Three Months Ended June 30, 2013
Type of contract | ||||
Metals | $ | 12,338,949 | ||
Currencies | (1,954,682 | ) | ||
Energies | (5,026,396 | ) | ||
Agriculturals | 368,254 | |||
Interest rates | (8,205,502 | ) | ||
Stock indices | (1,376,733 | ) | ||
|
| |||
Change in unrealized trading income/(loss)(1) | $ | (3,856,110 | ) | |
|
| |||
Net Change in Open Trade Equity from Futures, Forwards and Options
for the Six Months Ended June 30, 2013
Type of contract | ||||
Metals | $ | 15,894,969 | ||
Currencies | (5,658,782 | ) | ||
Energies | (4,459,698 | ) | ||
Agriculturals | 1,278,153 | |||
Interest rates | (6,112,416 | ) | ||
Stock indices | (2,078,489 | ) | ||
|
| |||
Change in unrealized trading income/(loss)(1) | $ | (1,136,263 | ) | |
|
| |||
Realized Trading Revenue from Futures, Forwards and Options
for the Three Months Ended June 30, 2012(1)
Type of contract | ||||
Metals | $ | 1,362,795 | ||
Currencies | (6,706,070 | ) | ||
Energies | 22,909,484 | |||
Agriculturals | 3,039,957 | |||
Interest rates | 45,940,658 | |||
Stock indices | (17,288,228 | ) | ||
|
| |||
Realized trading income/(loss)(1) | $ | 49,258,596 | ||
|
| |||
Realized Trading Revenue from Futures, Forwards and Options
for the Six Months Ended June 30, 2012(1)
Type of contract | ||||
Metals | $ | 3,980,957 | ||
Currencies | 4,289,317 | |||
Energies | (39,301,473 | ) | ||
Agriculturals | (33,318 | ) | ||
Interest rates | (1,443,830 | ) | ||
Stock indices | (97,879 | ) | ||
|
| |||
Realized trading income/(loss)(1) | $ | (32,606,226 | ) | |
|
| |||
Net Change in Open Trade Equity from Futures, Forwards and Options
for the Three Months Ended June 30, 2012(1)
Type of contract | ||||
Metals | $ | (15,142,145 | ) | |
Currencies | (14,201,587 | ) | ||
Energies | 19,072,628 | |||
Agriculturals | (3,020,414 | ) | ||
Interest rates | 34,976,693 | |||
Stock indices | (2,160,657 | ) | ||
|
| |||
Change in unrealized trading income/(loss)(1) | $ | 19,524,518 | ||
|
| |||
Net Change in Open Trade Equity from Futures, Forwards and Options
for the Six Months Ended June 30, 2012(1)
Type of contract | ||||
Metals | $ | 6,720,298 | ||
Currencies | 17,461,854 | |||
Energies | (34,586,957 | ) | ||
Agriculturals | 1,430,532 | |||
Interest rates | (2,358,221 | ) | ||
Stock indices | 253,938 | |||
|
| |||
Change in unrealized trading income/(loss)(1) | $ | (11,078,556 | ) | |
|
| |||
Certain financial instruments and derivative instruments are eligible for offset in the statements of financial condition under U.S. GAAP. The Trust’s open trade equity/(deficit), options written, and receivable from Futures Commissions Merchants are subject to master netting arrangements and collateral arrangements and meet the U.S. GAAP guidance to qualify for offset. A master netting arrangement with a counterparty creates a right of offset for amounts due to and from that same counterparty that is enforceable in the event of a default or bankruptcy. The Trust’s policy is to recognize amounts subject to master netting arrangements on a net basis on the statements of financial condition.
The following tables present gross and net information about the Trust’s assets and liabilities subject the master netting arrangements as disclosed on the statements of financial condition as of June 30, 2013 and December 31, 2012:
Offsetting of Derivative Assets and Liabilities
As of JuneSeptember 30, 2013
| Gross Amounts of recognized Derivative Assets | Gross Amounts of recognized Derivative Liabilities | Net Amounts of Derivative Assets and Liabilities Presented in the Statements of Financial Condition | ||||||||||
Open Trade Equity/(Deficit) | $ | 75,672,703 | $ | (67,220,600 | ) | $ | 8,452,103 | |||||
Options Written | — | (2,376,367 | ) | (2,376,367 | ) | |||||||
Receivable from Futures Commissions Merchants | 198,013,272 | (91,997,068 | ) | 106,016,204 | ||||||||
Frontier Long/Short Commodity Series Open Trade Equity/(Deficit) Options Written Receivable from Futures Commissions Merchants Open Trade Equity/(Deficit) Options Written Receivable from Futures Commissions Merchants Open Trade Equity/(Deficit) Options Written Receivable from Futures Commissions Merchants Open Trade Equity/(Deficit) Options Written Receivable from Futures Commissions Merchants Gross Amounts of
recognized
Derivative Assets Gross Amounts of
recognized
Derivative Liabilities Net Amounts of
Derivative Assets
and Liabilities
Presented in the
Statements of
Financial Condition $ 324,075 $ (524,366 ) $ (200,291 ) — (29,302 ) (29,302 ) 11,641,316 (4,719,275 ) 6,922,041 Balanced Series $ 954,671 $ (1,152,345 ) $ (197,674 ) — (467,791 ) (467,791 ) 26,647,861 (5,699,593 ) 20,948,268 As of December 31, 2012 Gross Amounts of
recognized
Derivative Assets Gross Amounts of
recognized
Derivative Liabilities Net Amounts of
Derivative Assets
and Liabilities
Presented in the
Statements of
Financial Condition Frontier Long/Short Commodity Series $ 3,314,175 $ (4,133,710 ) $ (819,535 ) — (928,690 ) (928,690 ) 22,276,098 (7,505,125 ) 14,770,973 Balanced Series $ 4,215,436 $ (4,887,947 ) $ (672,511 ) — (165,363 ) (165,363 ) 98,277,094 (6,233,501 ) 92,043,593
As of December 31, 2012
| Gross Amounts of recognized Derivative Assets | Gross Amounts of recognized Derivative Liabilities | Net Amounts of Derivative Assets and Liabilities Presented in the Statements of Financial Condition | ||||||||||
Open Trade Equity/(Deficit) | $ | 22,637,635 | $ | (10,520,986 | ) | $ | 12,116,649 | |||||
Options Written | — | (4,199,198 | ) | (4,199,198 | ) | |||||||
Receivable from Futures Commissions Merchants | 225,653,255 | (77,624,026 | ) | 148,029,229 | ||||||||
8. Trading Activities and Related Risks
The purchase and sale of futures and options on futures contracts require margin deposits with Futures Commission Merchants (each, an “FCM”).FCMs. Additional deposits may be necessary for any loss on contract value. The Commodity Exchange Act requires an FCM to segregate all customer transactions and assets from the FCM’s proprietary activities. A customer’s cash and other property (for example, U.S. treasury bills) deposited with an FCM are considered commingled with all other customer funds subject to the FCM’s segregation requirements. In the event of an FCM’s insolvency, recovery may be limited to a pro rata share of segregated funds available. It is possible that the recovered amount could be less than the total of cash and other property deposited.
The term “off-balance sheet risk” refers to an unrecorded potential liability that, even though it does not appear on the statements of financial condition, may result in future obligation or loss in excess of the amount paid by the Series for a particular investment. Each Trading Company expects to trade in futures, options, forward and swap contracts and will therefore be a party to financial instruments with elements of off-balance sheet market and credit risk. In entering into these contracts, there exists a market risk that such contracts may be significantly influenced by market conditions, such as interest rate volatility, resulting in such contracts being less valuable. If the markets should move against all of the futures positions held by a Trading Company in respect of any Series at the same time, and if the Trading Advisor(s) of such Trading Company are unable to offset such futures interests positions, such Trading Company could lose all of its assets and the holders of Units of such Series would realize a 100% loss. The Managing Owner will seek to minimize market risk through real-time monitoring of open positions and the level of diversification of each Trading Advisor’s portfolio. It is anticipated that any Trading Advisor’s margin-to-equity ratio will typically not exceed approximately 35% although the actual ratio could be higher or lower from time to time.
In addition to market risk, trading futures, forward and swap contracts entails credit risk in that a counterparty will not be able to meet its obligations to a Trading Company. The counterparty for futures contracts traded in the United States and on most foreign exchanges is the clearinghouse associated with such exchange. In general, clearinghouses are backed by the corporate members of the clearinghouse who are required to share any financial burden resulting from the non-performance by one of their members and, as such, should significantly reduce this credit risk. In cases where the clearinghouse is not backed by the clearing members, like some foreign exchanges, it is normally backed by a consortium of banks or other financial institutions. Some non-U.S. exchanges, in contrast to U.S. exchanges, are principals’ markets in which performance is the responsibility only of the individual counterparty with whom the Trading Company has entered into the transaction, and not of the exchange or clearing corporation. In these kinds of markets, there is risk of bankruptcy or other failure or refusal to perform by the counterparty.
In the case of forward contracts traded on the interbank market and swaps, neither is traded on exchanges. The counterparty is generally a single bank or other financial institution, rather than a group of financial institutions; thus there may be a greater counterparty credit risk. The Managing Owner expects the Trading Advisors to trade only with those counterparties which it believes to be creditworthy. All positions of each Trading Company will be valued each day on a mark-to-market basis. There can be no assurance that any clearing member, clearinghouse or other counterparty will be able to meet its obligations to any Trading Company.
The Managing Owner has established procedures to actively monitor and minimize market and credit risks. The Limited Owners bear the risk of loss only to the extent of the market value of their respective investments and, in certain specific circumstances, distributions and redemptions received.
10. Indemnifications and Guarantees
The Trust has entered into agreements, which provide for the indemnification of futures clearing brokers, and commodity trading advisers, among others, against losses, costs, claims and liabilities arising from the performance of their individual obligations under such agreements, except for gross negligence or bad faith. The Trust has had no prior claims or payments pursuant to these agreements. The Trust’s individual maximum exposure under these arrangements is unknown, as this would involve future claims that may be made against the Trust that have not yet occurred. However, based on experience the Trust expects the risk of loss to be remote. Maximum exposure is unfulfilled obligations of the Series up to the amount of equity at risk with UBS of the referenced Series as allocated from the Trading Company. The Series have not recorded any liability for the guarantees in the accompanying financial statements as it expects any possibility of losses to be remote.
The Trust has guaranteed the obligations of the Trading Companies under the customer agreements with UBS Securities as Clearing Broker. In the event that one Series of the Trust is unable to meet its obligations to UBS Securities, the assets of the other Series will be available to UBS Securities as part of the guarantee, but only to the extent of such Series’ pro rata allocation to the Trading Company. The Series have not recorded any liability for the indemnifications in the accompanying financial statement, as it expects any possibility of losses to be remote.
11. Subsequent Events
None.
The Frontier Fund
Consolidated Statements of Financial Condition
September 30, 2013 and December 31, 2012
| 9/30/2013 | 12/31/2012 | |||||||
| (unaudited) | ||||||||
| ASSETS | ||||||||
Cash and cash equivalents | $ | 6,977,345 | $ | 17,094,782 | ||||
U.S. Treasury securities, at fair value | — | 18,001,322 | ||||||
Custom time deposits | 235,460,358 | 311,468,033 | ||||||
Receivable from futures commission merchants | 66,740,407 | 148,029,229 | ||||||
Open trade equity, at fair value | 6,943,192 | 12,116,649 | ||||||
Swap contracts, at fair value | 17,152,321 | 22,289,479 | ||||||
Prepaid service fees | 38,307 | 140,203 | ||||||
Interest receivable | 985 | 251,630 | ||||||
Receivables from related parties | 3,420 | — | ||||||
Other assets | 50 | 35,043 | ||||||
|
|
|
| |||||
Total Assets | $ | 333,316,385 | $ | 529,426,370 | ||||
|
|
|
| |||||
| LIABILITIES & CAPITAL | ||||||||
LIABILITIES | ||||||||
Open trade deficit, at fair value | $ | — | $ | — | ||||
Written options, at fair value | 1,586,908 | 4,199,198 | ||||||
Pending owner additions | 95,106 | 160,672 | ||||||
Owner redemptions payable | 1,533,440 | 1,430,638 | ||||||
Incentive fees payable to Managing Owner | — | 732,119 | ||||||
Management fees payable to Managing Owner | 601,625 | 1,003,663 | ||||||
Interest payable to Managing Owner | 393,822 | 569,115 | ||||||
Trading fees payable to Managing Owner | 398,688 | 602,333 | ||||||
Service fees payable to Managing Owner | 436,778 | 652,500 | ||||||
Payables to related parties | 10,884 | 38,925 | ||||||
Other liabilities | 1,414 | 51,484 | ||||||
|
|
|
| |||||
Total Liabilities | 5,058,665 | 9,440,647 | ||||||
|
|
|
| |||||
CAPITAL | ||||||||
Managing Owner Units | 4,915,327 | 6,287,766 | ||||||
Limited Owner Units | 323,342,393 | 513,697,957 | ||||||
|
|
|
| |||||
Total Capital | 328,257,720 | 519,985,723 | ||||||
|
|
|
| |||||
Total Liabilities and Capital | $ | 333,316,385 | $ | 529,426,370 | ||||
|
|
|
| |||||
The accompanying notes are an integral part of these consolidated financial statements.
The Frontier Fund
Consolidated Condensed Schedule of Investments
September 30, 2013 (Unaudited)
Description | Value | % of Total Capital (Net Asset Value) | ||||||
LONG FUTURES CONTRACTS * | ||||||||
Various base metals futures contracts (Europe) | $ | 6,997,426 | 2.13 | % | ||||
Various base metals futures contracts (U.S.) | 2,792 | 0.00 | % | |||||
Various currency futures contracts (U.S.) | 1,773,185 | 0.54 | % | |||||
Various energy futures contracts (U.S.) | (1,119,566 | ) | -0.34 | % | ||||
Various energy futures contracts (Europe) | 19,780 | 0.01 | % | |||||
Various energy futures contracts (Far East) | (2,800 | ) | 0.00 | % | ||||
Various interest rates futures contracts (Canada) | 80,532 | 0.02 | % | |||||
Various interest rates futures contracts (Europe) | 1,027,305 | 0.31 | % | |||||
Various interest rates futures contracts (Far East) | 555,465 | 0.17 | % | |||||
Various interest rates futures contracts (Oceanic) | 110,699 | 0.03 | % | |||||
Various interest rates futures contracts (U.S.) | 999,496 | 0.30 | % | |||||
Various precious metal futures contracts (Far East) | (4,376 | ) | 0.00 | % | ||||
Various precious metal futures contracts (U.S.) | (67,985 | ) | -0.02 | % | ||||
Various soft futures contracts (Europe) | 45,212 | 0.01 | % | |||||
Various soft futures contracts (U.S.) | (446,825 | ) | -0.14 | % | ||||
Various stock index futures contracts (Africa) | 11,856 | 0.00 | % | |||||
Various stock index futures contracts (Canada) | (16,543 | ) | -0.01 | % | ||||
Various stock index futures contracts (Europe) | (650,446 | ) | -0.20 | % | ||||
Various stock index futures contracts (Far East) | (166,418 | ) | -0.05 | % | ||||
Various stock index futures contracts (Oceanic) | (50,568 | ) | -0.02 | % | ||||
Various stock index futures contracts (U.S.) | (865,840 | ) | -0.26 | % | ||||
|
|
|
| |||||
Total Long Futures Contracts | $ | 8,232,381 | 2.48 | % | ||||
|
|
|
| |||||
OPTIONS PURCHASED * | ||||||||
Various base metals futures contracts (Europe) | $ | 1,954,644 | 0.60 | % | ||||
Various energy futures contracts (U.S.) | 3,680 | 0.00 | % | |||||
Various interest rates futures contracts (U.S.) | 30,188 | 0.01 | % | |||||
Various precious metal futures contracts (U.S.) | 158,760 | 0.05 | % | |||||
Various soft futures contracts (U.S.) | 385,991 | 0.12 | % | |||||
Various stock index futures contracts (U.S.) | 607,233 | 0.19 | % | |||||
|
|
|
| |||||
Total Options Purchased | $ | 3,140,496 | 0.97 | % | ||||
|
|
|
| |||||
SHORT FUTURES CONTRACTS * | ||||||||
Various base metals futures contracts (Europe) | $ | (5,397,548 | ) | -1.64 | % | |||
Various base metals futures contracts (U.S.) | (2,179 | ) | 0.00 | % | ||||
Various currency futures contracts (Far East) | 11,513 | 0.00 | % | |||||
Various currency futures contracts (U.S.) | (849,817 | ) | -0.26 | % | ||||
Various energy futures contracts (Europe) | (32,829 | ) | -0.01 | % | ||||
Various energy futures contracts (U.S.) | 1,128,135 | 0.34 | % | |||||
Various interest rates futures contracts (Canada) | (118,726 | ) | -0.04 | % | ||||
Various interest rates futures contracts (Europe) | (630,632 | ) | -0.19 | % | ||||
Various interest rates futures contracts (Far East) | (143,487 | ) | -0.04 | % | ||||
Various interest rates futures contracts (Oceanic) | (69,238 | ) | -0.02 | % | ||||
Various interest rates futures contracts (U.S.) | (811,364 | ) | -0.25 | % | ||||
Various precious metal futures contracts (U.S.) | 208,919 | 0.06 | % | |||||
Various soft futures contracts (Canada) | 2,045 | 0.00 | % | |||||
Various soft futures contracts (Europe) | 100,762 | 0.03 | % | |||||
Various soft futures contracts (U.S.) | 1,386,530 | 0.42 | % | |||||
Various stock index futures contracts (Europe) | 1,068 | 0.00 | % | |||||
Various stock index futures contracts (Far East) | 39,169 | 0.01 | % | |||||
Various stock index futures contracts (U.S.) | (36,084 | ) | -0.01 | % | ||||
|
|
|
| |||||
Total Short Futures Contracts | $ | (5,213,763 | ) | -1.60 | % | |||
|
|
|
| |||||
CURRENCY FORWARDS * | ||||||||
Various currency forward contracts | $ | 784,078 | 0.24 | % | ||||
|
|
|
| |||||
Total Currency Forwards | $ | 784,078 | 0.24 | % | ||||
|
|
|
| |||||
Total Open Trade Equity | $ | 6,943,192 | 2.09 | % | ||||
|
|
|
| |||||
OPTIONS WRITTEN * | ||||||||
Various base metals futures contracts (Europe) | $ | (606,485 | ) | -0.18 | % | |||
Various currency futures contracts (U.S.) | (247,325 | ) | -0.08 | % | ||||
Various precious metal futures contracts (U.S.) | (215,530 | ) | -0.07 | % | ||||
Various soft futures contracts (U.S.) | (49,615 | ) | -0.02 | % | ||||
Various stock index futures contracts (U.S.) | (467,953 | ) | -0.14 | % | ||||
|
|
|
| |||||
Total Options Written | $ | (1,586,908 | ) | -0.49 | % | |||
|
|
|
| |||||
SWAPS (1) | ||||||||
Frontier XXXIV Balanced select swap (U.S.) | $ | 7,412,815 | 2.26 | % | ||||
Frontier Brevan Howard swap (U.S.) | 4,506,351 | 1.37 | % | |||||
Frontier XXXV Diversified select swap (U.S.) | 2,413,658 | 0.74 | % | |||||
Frontier XXXVII L/S select swap (U.S.) | 2,819,497 | 0.86 | % | |||||
|
|
|
| |||||
Total Swaps | $ | 17,152,321 | 5.23 | % | ||||
|
|
|
| |||||
| (1) | See Notes to Financial Statements, Note 4. |
The accompanying notes are an integral part of these consolidated financial statements.
The Frontier Fund
Consolidated Condensed Schedule of Investments
December 31, 2012
Description | Value | % of Total Capital (Net Asset Value) | ||||||
LONG FUTURES CONTRACTS * | ||||||||
Various stock index futures contracts (U.S.) | $ | (708,671 | ) | -0.14 | % | |||
Various stock index futures contracts (Oceanic) | 190,826 | 0.04 | % | |||||
Various stock index futures contracts (Mexico) | 1,548 | 0.00 | % | |||||
Various stock index futures contracts (Far East) | 3,549,518 | 0.68 | % | |||||
Various stock index futures contracts (Europe) | (1,746,507 | ) | -0.34 | % | ||||
Various stock index futures contracts (Canada) | 272,823 | 0.05 | % | |||||
Various stock index futures contracts (Africa) | 97,909 | 0.02 | % | |||||
Various soft futures contracts (U.S.) | (2,211,954 | ) | -0.43 | % | ||||
Various soft futures contracts (Europe) | (145,288 | ) | -0.03 | % | ||||
Various soft futures contracts (Canada) | (335 | ) | 0.00 | % | ||||
Various precious metal futures contracts (U.S.) | (756,478 | ) | -0.15 | % | ||||
Various interest rates futures contracts (U.S.) | (609,966 | ) | -0.12 | % | ||||
Various interest rates futures contracts (Oceanic) | 298,169 | 0.06 | % | |||||
Various interest rates futures contracts (Far East) | (428,542 | ) | -0.08 | % | ||||
Various interest rates futures contracts (Europe) | 2,592,153 | 0.50 | % | |||||
Various interest rates futures contracts (Canada) | (120,227 | ) | -0.02 | % | ||||
Various energy futures contracts (U.S.) | 13,149,004 | 2.53 | % | |||||
Various energy futures contracts (Far East) | 462 | 0.00 | % | |||||
Various currency futures contracts (U.S.) | (2,156,861 | ) | -0.41 | % | ||||
Various base metals futures contracts (U.S.) | (9,439 | ) | 0.00 | % | ||||
Various base metals futures contracts (Europe) | 3,463,404 | 0.67 | % | |||||
|
|
|
| |||||
Total Long Futures Contracts | $ | 14,721,548 | 2.83 | % | ||||
|
|
|
| |||||
OPTIONS PURCHASED * | ||||||||
Various stock index futures contracts (U.S.) | $ | 439,170 | 0.08 | % | ||||
Various soft futures contracts (U.S.) | 1,320,884 | 0.25 | % | |||||
Various precious metals futures contracts (U.S.) | 711,000 | 0.14 | % | |||||
Various energy futures contracts (U.S.) | 6,285,280 | 1.21 | % | |||||
Various currency futures contracts (U.S.) | 2,901,488 | 0.56 | % | |||||
Various base metals futures contracts (Europe) | 2,277,291 | 0.44 | % | |||||
|
|
|
| |||||
Total Options Purchased | $ | 13,935,113 | 2.68 | % | ||||
|
|
|
| |||||
SHORT FUTURES CONTRACTS * | ||||||||
Various base metals futures contracts (U.S.) | $ | (76,900 | ) | -0.01 | % | |||
Various base metals futures contracts (Europe) | (7,712,906 | ) | -1.48 | % | ||||
Various currency futures contracts (U.S.) | 3,852,251 | 0.74 | % | |||||
Various currency futures contracts (Canada) | — | 0.00 | % | |||||
Various currencey futures contracts (Far East) | 684 | 0.00 | % | |||||
Various stock index futures contracts (U.S.) | (373,552 | ) | -0.07 | % | ||||
Various stock index futures contracts (Europe) | 86,644 | 0.02 | % | |||||
Various stock index futures contracts (Far East) | (630,695 | ) | -0.12 | % | ||||
Various stock index futures contracts (Canada) | (6,159 | ) | 0.00 | % | ||||
Various soft futures contracts (U.S.) | 2,445,673 | 0.47 | % | |||||
Various soft futures contracts (Europe) | 122,990 | 0.02 | % | |||||
Various interest rates futures contracts (U.S.) | (385,887 | ) | -0.07 | % | ||||
Various interest rates futures contracts (Oceanic) | (17,218 | ) | 0.00 | % | ||||
Various interest rates futures contracts (Far East) | 197,000 | 0.04 | % | |||||
Various interest rates futures contracts (Europe) | (1,273 | ) | 0.00 | % | ||||
Various interest rates futures contracts (Canada) | 81,091 | 0.02 | % | |||||
Various precious metal futures contracts (U.S.) | 476,388 | 0.09 | % | |||||
Various energy futures contracts (U.S.) | (15,297,097 | ) | -2.94 | % | ||||
Various energy futures contracts (Europe) | 7,109 | 0.00 | % | |||||
|
|
|
| |||||
Total Short Futures Contracts | $ | (17,231,857 | ) | -3.29 | % | |||
|
|
|
| |||||
CURRENCY FORWARDS * | ||||||||
Various currency futures contracts | $ | 691,845 | 0.13 | % | ||||
|
|
|
| |||||
Total Currency Forwards | $ | 691,845 | 0.13 | % | ||||
|
|
|
| |||||
Total Open Trade Equity | $ | 12,116,649 | 2.35 | % | ||||
|
|
|
| |||||
OPTIONS WRITTEN * | ||||||||
Various stock index futures contracts (U.S.) | $ | (165,363 | ) | -0.03 | % | |||
Various soft futures contracts (U.S.) | (447,693 | ) | -0.09 | % | ||||
Various precious metal futures contracts (U.S.) | (540,330 | ) | -0.10 | % | ||||
Various currency futures contracts (U.S.) | (1,340,750 | ) | -0.26 | % | ||||
Various base metals futures contracts(Europe) | (261,172 | ) | -0.05 | % | ||||
Various energy futures contracts (U.S.) | (1,443,890 | ) | -0.28 | % | ||||
|
|
|
| |||||
Total Options Written | $ | (4,199,198 | ) | -0.81 | % | |||
|
|
|
| |||||
SWAPS (1) | ||||||||
Frontier Balanced RCW-1 Swap(U.S.) | $ | 17,785,733 | 3.42 | % | ||||
Frontier Balanced DB Swap(U.S.) | 2,702,247 | 0.52 | % | |||||
Frontier Currency DB Swap(U.S.) | 1,801,498 | 0.35 | % | |||||
|
|
|
| |||||
Total Swaps | $ | 22,289,478 | 4.29 | % | ||||
|
|
|
| |||||
U.S. TREASURY SECURITIES | ||||||||
FACE VALUE | Fair Value | Fair Value | ||||||||
| $36,700,000 | U.S. Treasury Note 4.000% due 02/15/2015 (Cost $38,016,039) | 18,001,322 | 3.46 | % | ||||||
|
|
|
| |||||||
Total U.S. Treasury Securities | 18,001,322 | 3.46 | % | |||||||
|
|
|
| |||||||
| * | Except for those items disclosed, no individual futures, forwards and option on futures contract position constituted greater than 1 percent of Net Asset Value. Accordingly, the number of contracts and expiration dates are not presented. |
| (1) | See Notes to the Consolidated Financial Statements, Note 4. |
The accompanying notes are an integral part of these consolidated financial statements.
The Frontier Fund
Consolidated Statements of Operations
For the Three Months Ended September 30, 2013 and September 30, 2012 (Unaudited)
| 9/30/2013 | 9/30/2012 | |||||||
Investment income: | ||||||||
Interest - net | $ | 1,140,637 | $ | 1,377,089 | ||||
|
|
|
| |||||
Total Income | 1,140,637 | 1,377,089 | ||||||
|
|
|
| |||||
Expenses: | ||||||||
Incentive Fees | — | 5,789,666 | ||||||
Management Fees | 1,981,543 | 3,191,672 | ||||||
Service Fees - Class 1 | 1,650,323 | 2,540,950 | ||||||
Trading Fees | 1,281,476 | 1,987,736 | ||||||
|
|
|
| |||||
Total Expenses | 4,913,342 | 13,510,024 | ||||||
|
|
|
| |||||
Investment income/(loss) - net | (3,772,705 | ) | (12,132,935 | ) | ||||
|
|
|
| |||||
Realized and unrealized gain/(loss) on investments: | ||||||||
Net realized gain/(loss) on futures, forwards and options | (18,537,056 | ) | (14,031,019 | ) | ||||
Net change in open trade equity/(deficit) | 2,716,062 | 36,395,403 | ||||||
Net realized gain/(loss) on swap contracts | (1,646,391 | ) | — | |||||
Net unrealized gain/(loss) on swap contracts | (2,600,517 | ) | 259,527 | |||||
Net realized gain/(loss) on U.S. Treasury securities | — | — | ||||||
Net unrealized gain/(loss) on U.S. Treasury securities | — | (173,695 | ) | |||||
Trading commissions | (1,106,569 | ) | (1,914,850 | ) | ||||
|
|
|
| |||||
Net gain/(loss) on investments | (21,174,471 | ) | 20,535,366 | |||||
|
|
|
| |||||
NET INCREASE/(DECREASE) IN CAPITAL RESULTING FROM OPERATIONS | $ | (24,947,176 | ) | $ | 8,402,431 | |||
|
|
|
| |||||
The accompanying notes are an integral part of these consolidated financial statements.
The Frontier Fund
Consolidated Statements of Operations
For the Nine Months Ended September 30, 2013 and September 30, 2012 (Unaudited)
| 9/30/2013 | 9/30/2012 | |||||||
Investment income: | ||||||||
Interest - net | $ | 3,703,455 | $ | 4,334,714 | ||||
|
|
|
| |||||
Total Income | 3,703,455 | 4,334,714 | ||||||
|
|
|
| |||||
Expenses: | ||||||||
Incentive Fees | 889,025 | 11,463,249 | ||||||
Management Fees | 6,708,693 | 9,758,788 | ||||||
Service Fees - Class 1 | 5,718,063 | 7,980,617 | ||||||
Trading Fees | 4,533,240 | 6,019,122 | ||||||
|
|
|
| |||||
Total Expenses | 17,849,021 | 35,221,776 | ||||||
|
|
|
| |||||
Investment income/(loss) - net | (14,145,566 | ) | (30,887,062 | ) | ||||
|
|
|
| |||||
Realized and unrealized gain/(loss) on investments: | ||||||||
Net realized gain/(loss) on futures, forwards and options | (31,209,297 | ) | 5,493,499 | |||||
Net change in open trade equity/(deficit) | 1,579,799 | 25,316,847 | ||||||
Net realized gain/(loss) on swap contracts | (3,555,134 | ) | (525,237 | ) | ||||
Net unrealized gain/(loss) on swap contracts | (2,763,657 | ) | 1,538,438 | |||||
Net realized gain/(loss) on U.S. Treasury securities | 1,078,008 | 854,738 | ||||||
Net unrealized gain/(loss) on U.S. Treasury securities | (1,157,776 | ) | (1,832,445 | ) | ||||
Trading commissions | (4,004,456 | ) | (6,051,637 | ) | ||||
Net realized gain/(loss) on investment in Berkeley Quantitative Colorado Fund LLC | — | (2,172,987 | ) | |||||
Net unrealized gain/(loss) on investment in Berkeley Quantitative Colorado Fund LLC | — | 2,084,880 | ||||||
|
|
|
| |||||
Net gain/(loss) on investments | (40,032,513 | ) | 24,706,096 | |||||
|
|
|
| |||||
NET INCREASE/(DECREASE) IN CAPITAL RESULTING FROM OPERATIONS | $ | (54,178,079 | ) | $ | (6,180,966 | ) | ||
|
|
|
| |||||
The accompanying notes are an integral part of these consolidated financial statements.
The Frontier Fund
Consolidated Statement of Changes in Owners’ Capital
For the Nine Months Ended September 30, 2013 (Unaudited)
| Managing Owner | Limited Owners | Total | ||||||||||
Owners’ Capital, December 31, 2012 | $ | 6,287,766 | $ | 513,697,957 | $ | 519,985,723 | ||||||
Sale of Units | 61,988 | 8,782,285 | 8,844,273 | |||||||||
Redemption of Units | (561,990 | ) | (145,832,207 | ) | (146,394,197 | ) | ||||||
Net increase/(decrease) in Owners’ Capital resulting from operations | (872,437 | ) | (53,305,642 | ) | (54,178,079 | ) | ||||||
|
|
|
|
|
| |||||||
Owners’ Capital, September 30, 2013 | $ | 4,915,327 | $ | 323,342,393 | $ | 328,257,720 | ||||||
|
|
|
|
|
| |||||||
The consolidated Trust is not unitized as are the individual Series of the Trust
The accompanying notes are an integral part of these consolidated financial statements.
The Frontier Fund
Consolidated Statements of Cash Flows
For the Nine Months Ended September 30, 2013 and 2012
(Unaudited)
| 2013 | 2012 | |||||||
Cash Flows from Operating Activities: | ||||||||
Net increase/(decrease) in capital resulting from operations | $ | (54,178,079 | ) | $ | (6,180,966 | ) | ||
Adjustments to reconcile net increase/(decrease) in capital resulting from operations to net cash provided by (used in) operating activities: | ||||||||
Change in: | ||||||||
Net change in open trade equity | 5,173,457 | (25,416,521 | ) | |||||
Net change in options written | (2,612,290 | ) | 1,285,103 | |||||
Net change in allocation of total return swaps | 3,501 | |||||||
Net unrealized gain/(loss) on swap contracts | 2,763,657 | (1,538,438 | ) | |||||
Net realized gain/(loss) on swap contracts | 3,555,134 | 525,237 | ||||||
Net unrealized gain/(loss) on U.S. Treasury securities | 1,157,776 | 1,832,445 | ||||||
Net realized gain/(loss) on U.S. Treasuries securities | (1,078,008 | ) | (854,738 | ) | ||||
Net realized gain/(loss) on investment in Berkeley Colorado Quantitative Fund LLC | — | 2,172,987 | ||||||
Net unrealized gain/loss on investment in Berkeley Colorado Quantitative Fund LLC | — | (2,084,880 | ) | |||||
(Purchases) sales of: | ||||||||
Sales of swap contracts | 20,694,866 | 9,812 | ||||||
(Purchases) of swap contracts | (21,880,000 | ) | — | |||||
Sales of U.S. Treasury securities | 17,921,554 | 37,864,769 | ||||||
Sales of custom time deposits | 76,007,675 | 25,000,000 | ||||||
Interest rollover of custom time deposits | — | (2,897,700 | ) | |||||
Sales of Berkeley Colorado Quantitative Fund LLC | — | 6,182,737 | ||||||
Increase and/or decrease in: | ||||||||
Receivable from futures commission merchants | 81,288,822 | 8,116,123 | ||||||
Control of ownership of trading companies | — | — | ||||||
Contributions to trading companies | — | — | ||||||
Distributions from trading companies | — | — | ||||||
Prepaid service fees | 101,896 | 141,468 | ||||||
Interest receivable | 250,645 | 901,235 | ||||||
Receivable from related parties | (3,420 | ) | — | |||||
Other assets | 34,993 | (230,951 | ) | |||||
Incentive fees payable to Managing Owner | (732,119 | ) | 3,953,375 | |||||
Management fees payable to Managing Owner | (402,038 | ) | (113,885 | ) | ||||
Interest payable to Managing Owner | (175,293 | ) | (117,504 | ) | ||||
Trading fees payable to Managing Owner | (203,645 | ) | (129,642 | ) | ||||
Service fees payable to Managing Owner | (215,722 | ) | (41,149 | ) | ||||
Payables to related parties | (28,041 | ) | 42,580 | |||||
Other liabilities | (50,070 | ) | 217,665 | |||||
|
|
|
| |||||
Net cash provided by (used in) operating activities | 127,395,251 | 48,639,162 | ||||||
|
|
|
| |||||
Cash Flows from Financing Activities: | ||||||||
Proceeds from sale of capital | 8,844,273 | 39,291,798 | ||||||
Payment for redemption of capital | (146,394,197 | ) | (97,178,756 | ) | ||||
Pending owner additions | (65,566 | ) | 521,765 | |||||
Redemptions payable | 102,802 | (2,346,525 | ) | |||||
|
|
|
| |||||
Net cash provided by (used in) financing activities | (137,512,688 | ) | (59,711,718 | ) | ||||
|
|
|
| |||||
Net increase (decrease) in cash and cash equivalents | (10,117,437 | ) | (11,072,556 | ) | ||||
Cash and cash equivalents, beginning of period | 17,094,782 | 27,452,803 | ||||||
|
|
|
| |||||
Cash and cash equivalents, end of period | $ | 6,977,345 | $ | 16,380,247 | ||||
|
|
|
| |||||
The accompanying notes are an integral part of these consolidated financial statements.
The Frontier Fund
Notes to Consolidated Financial Statements (Unaudited)
1. Organization and Purpose
The Frontier Fund, which is referred to in this report as “the Trust”, was formed on August 8, 2003, as a Delaware statutory trust. The Trust is a multi-advisor commodity pool, as described in Commodity Futures Trading Commission (the “CFTC”) Regulation § 4.10(d)(2). The Trust has authority to issue separate series, or each, a Series, of units of beneficial interest (the “Units”) pursuant to the requirements of the Delaware Statutory Trust Act, as amended (the “Trust Act”). The assets of each Series are valued and accounted for separately from the assets of other Series. The Trust is not registered as an investment company under the Investment Company Act of 1940, as amended (the “Investment Company Act”). It is managed by its Managing Owner, Equinox Fund Management, LLC.
Purchasers of Units are limited owners of the Trust (“Limited Owners”) with respect to beneficial interests of the Series’ Units purchased. The Trust Act provides that, except as otherwise provided in the amended and restated declaration of trust and trust agreement dated August 8, 2003, by and among the Managing Owner, Wilmington Trust Company as trustee and the unitholders from time to time (the “Trust Agreement”), unitholders in a Delaware statutory trust will have the same limitation of liability as do stockholders of private corporations organized under the General Corporation Law of the State of Delaware. The Trust Agreement confers substantially the same limited liability, and contains the same limited exceptions thereto, as would a limited partnership agreement for a Delaware limited partnership engaged in like transactions as the Trust. In addition, pursuant to the Trust Agreement, the Managing Owner of the Trust is liable for obligations of a Series in excess of that Series’ assets. Limited Owners do not have any such liability. The Managing Owner will make contributions to Series of the Trust necessary to maintain at least a 1% interest in the aggregate capital, profits and losses of all Series.
The Trust has been organized to pool assets of investor funds for the purpose of trading in the United States (“U.S.”) and international markets for currencies, interest rates, stock indices, agricultural and energy products, precious and base metals and other commodities. The Trust may also engage in futures contracts, forwards, option contracts and other interest in derivative instruments, including swap contracts (“Swaps”).
The Trust has seven (7) separate and distinct Series of Units issued and outstanding: Frontier Diversified Series, Frontier Masters Series, Frontier Long/Short Commodity Series, Balanced Series, Frontier Select Series (formerly Tiverton/Graham/Transtrend Series), Winton Series, and Frontier Heritage Series (formerly Winton/Graham Series) (each a “Series” and collectively, the “Series”). The Currency Series ceased trading on April 18, 2013 and the TBG Institutional Series ceased trading on May 23, 2013. The Trust financial statements are comprised of unitized Series which are consolidated into the Trust financial statements. However, the consolidated Trust does not issue units.
The Trust, with respect to each Series:
engages in the speculative trading of a diversified portfolio of futures, forward (including interbank foreign currencies), options contracts and other derivative instruments (including swap contracts), and may, from time to time, engage in cash and spot transactions;
allocates funds to a limited liability trading company or companies (“Trading Company”). Except as otherwise described in these notes, each Trading Company has one-year renewable contracts with its own independent commodity trading advisor(s), or each, a Trading Advisor, that will manage all or a portion of such Trading Company’s assets and make the trading decisions for the assets of each Series vested in such Trading Company. Each Trading Company will segregate its assets from any other Trading Company;
maintains separate, distinct records for each Series, and accounts for the assets of each Series separately from the other Series;
calculates the Net Asset Value (“NAV”) of its Units for each Series separately from the other Series;
has an investment objective of increasing the value of each Series’ Units over the long term (capital appreciation), while controlling risk and volatility; further, to offer exposure to the investment programs of individual Trading Advisors and to specific instruments (currencies);
maintains each Series of Units in three or six sub-classes—Class 1, Class 1a, Class 2, Class 2a, Class 3, and Class 3a. Investors who have purchased Class 1 or Class 1a Units of any Series are charged a service fee of up to three percent (3.0%) annually of the NAV of each Unit purchased, for the benefit of Selling Agents selling such Class 1 or Class 1a Units. The initial service fee, which is amortized monthly at an annual rate of up to three percent (3.0%) of the average daily NAV of Class 1 or Class 1a of such Series, is prepaid to Equinox Fund Management, LLC (the “Managing Owner”) by each Series, and paid to the selling agents by the Managing Owner in the month following sale; provided, however, that investors who redeem all or a portion of their Class 1 or Class 1a Units of any Series during the first twelve (12) months following the effective date of their purchase are subject to a redemption fee of up to three percent (3.0%) of the NAV at
which such investor redeemed to reimburse the Managing Owner for the then-unamortized balance of the prepaid initial service fee. With respect to Class 2 and Class 2a Units of any Series, the Managing Owner pays an ongoing service fee to Selling Agents of up to one half percent (0.5%) annually of the NAV of each Class 2 or Class 2a Unit (of which 0.25% will be charged to Limited Owners holding Class 2 Units of the Frontier Diversified Series, and Frontier Masters Series or Class 2a Units of the Frontier Long/Short Commodity Series) sold until such Class 2 or Class 2a Units which are subject to the fee limitation are reclassified as Class 3 or Class 3a Units of the applicable Series. The Managing Owner may also pay Selling Agents certain additional fees and expenses for administrative and other services rendered and expenses incurred by such Selling Agents; and |
all payments made to Selling Agents who are members of the Financial Industry Regulatory Authority, Inc. (“FINRA”) and their associated persons that constitute underwriting compensation will be subject to the limitations set forth in Rule 2310(b)(4)(B)(ii) (formerly Rule 2810(b)(4)(B)(ii)) of the Conduct Rules of FINRA (“Rule 2310”). An investor’s Class 1 Units or Class 2 Units of any Series, or Class 1a Units or Class 2a Units of the Frontier Long/Short Commodity Series or Balanced Series will be classified as Class 3 or Class 3a Units of such Series, as applicable, when the Managing Owner determines that the fee limitation set forth in Rule 2310 with respect to such Units has been reached or will be reached. No service fees are paid with respect to Class 3 or Class 3a Units. Units of any Class in a Series may be redeemed, in whole or in part, on a daily basis, at the then current NAV per Unit for such Series on the day of the week after the date the Managing Owner is in receipt of a redemption request for at least one (1) Business Day to be received by the Managing Owner prior to 4:00 PM in New York.
The assets of any particular Series include only those funds and other assets that are paid to, held by or distributed to the Trust on account of and for the benefit of that Series. Under the “Inter-Series Limitation on Liability” expressly provided for under Section 3804(a) of the Trust Act, separate and distinct records of the cash and equivalents, although pooled for maximizing returns, is maintained in the books and records of each Series.
As of September 30, 2013, the Trust, with respect to the Frontier Diversified Series, Frontier Masters Series, Frontier Select Series (formerly Tiverton/Graham/Transtrend Series), Winton Series and Frontier Heritage Series (formerly Winton/Graham Series) separates Units into three separate Classes—Class 1, Class 2, and Class 3. The Trust, with respect to the Balanced Series and the Frontier Long/Short Commodity Series separates Units into six separate Classes—Class 1, Class 2, Class 3, Class 1a, Class 2a and Class 3a. It is expected that between 10% and 30% of each Series’ assets normally will be invested in one or more Trading Companies to be committed as margin for trading positions, but from time to time these percentages may be substantially more or less. The remainders of each Series’ assets are maintained at the Trust level for cash management. Each of the respective Series has invested monies into pooled cash management assets which have included purchases of certificates of deposit and custom time deposits. Each Series’ ownership in these investments is based on its percentage ownership in the pooled cash management assets on the reporting date.
Each Series of the Trust may invest a portion of its assets in a single Trading Company or in several different Trading Companies and may have multiple Trading Advisors that manage the assets invested in such Trading Companies.
During July 2012, Frontier Long/Short Commodity Series Class 1 Units and Balanced Series Class 1a Units ceased Trading Operations and all remaining Units were exchanged for Class 3 Units and Class 3a Units, respectively.
In November 2010, the Frontier Select Series (formerly Tiverton/Graham/Transtrend Series) of the Trust invested a portion of its assets in Berkeley Quantitative Colorado Fund LLC, an unaffiliated company, managed by an affiliate of Berkeley Quantitative L.P. Through this investment, Berkeley Quantitative L.P. became a commodity trading advisor to the Trust. The investment was liquidated March 20, 2012.
The Trust has entered into agreements, which provide for the indemnification of futures clearing brokers, currency trading companies, and commodity trading advisers, among others, against losses, costs, claims and liabilities arising from the performance of their individual obligations under such agreements, except for gross negligence or bad faith.
2. Significant Accounting Policies
The following are the significant accounting policies of the Trust.
Basis of Presentation—The Trust follows Generally Accepted Accounting Principles (“GAAP”), as established by the Financial Accounting Standards Board (the “FASB”), to ensure consistent reporting of financial condition, schedules of investments, results of operations, changes in capital and cash flows.
These financial statements should be read in conjunction with the audited financial statements and notes thereto included in our 2012 Annual Report on Form 10-K as filed with the SEC.
Consolidation—Each Series of the Trust invests in Trading Companies who authorize certain Trading Advisors to place trades and manage assets at pre-determined investment levels. The Trading Companies were organized by the Managing Owner for the purpose of investing in commodities interests and derivative instruments, and have no operating income or expenses, except for trading income and expenses, all of which is allocated to the Series. The Trading Companies and Series of the Trust are consolidated by the Trust.
Investment in Berkeley Quantitative Colorado Fund LLC—The Frontier Select Series (formerly Tiverton/Graham/Transtrend Series) of the Trust had an investment in the Berkeley Quantitative Colorado Fund LLC. The Berkeley Quantitative Colorado Fund LLC began operations on November 1, 2010. The Berkeley Quantitative Colorado Fund LLC was not consolidated into the financial statements of the Trust because the Trust has no control or transparency over the operations of the fund. This investment was shown on the consolidated statements of financial condition with the change in fair value shown in net unrealized gain/(loss) on the Berkeley Quantitative Colorado Fund LLC. This investment was liquidated on March 20, 2012.
Use of Estimates—The preparation of financial statements in conformity with GAAP may require the Managing Owner to make estimates and assumptions that affect the reported amounts of assets and liabilities and disclosure of contingent assets and liabilities at the date of the financial statements and the reported amounts of revenue and expenses during the reporting period. The valuation of swap contracts requires significant estimates as well as the valuation of certain other investments. Please refer to Note 3 for discussion of valuation methodology. Actual results could differ from these estimates and such differences could be material.
Cash and Cash Equivalents—Cash and cash equivalents include cash and overnight investments in interest-bearing demand deposits held at banks with original maturities of three months or less.
Interest Income—Aggregate interest income from all sources, including U.S. Treasury securities, custom time deposits and assets held at Futures Commission Merchants (“FCM”), up to the first two percentage points or 20% of the aggregate percentage yield (annualized) is paid to the Managing Owner. All interest not paid to the Managing Owner is interest income to the Trust.
U.S. Treasury Securities—U.S. Treasury Securities are reported at fair value as Level 1 inputs under ASC 820,Fair Value Measurements and Disclosures (“ASC 820”). The Trust values U.S. Treasury Securities at fair value and records the daily change in value in the consolidated statements of operations as net unrealized gain/(loss) on U.S. Treasury securities. Accrued interest is reported on the consolidated statements of financial condition as interest receivable. All U.S. Treasury Securities have been liquidated as of September 30, 2013.
Custom Time Deposits—Custom time deposits are structured deposit agreements with U.S. Bank National Association that earn a guaranteed fixed interest rate between 3.75%, mature nine months from the deposit date and are subject to automatic six-month rollovers through October 2013. Custom time deposits were purchased on April 1, 2010, September 15, 2009, October 21, 2008 and October 30, 2008. Interest is paid monthly or at least every nine months. Unscheduled withdrawals will be subject to certain penalties and other costs of up to 1.0% of the amount deposited if withdrawn within the first nine months from the deposit date. The withdrawal fee is set at 0.225% for the period from nine months to one year subsequent to the deposit date and decreases by .05% increments for each year thereafter through the maturity date. In May 2011, July 2011, August 2011, January 2012, October 2012, November 2012, April 2013, June 2013, July 2013 and August 2013, the Trust, with respect to the Series, redeemed approximately $25 million, $25 million, $50 million, $25 million, $16 million, $5 million, $35 million, $20 million and $15 million, respectively, in custom time deposits held with U.S. Bank N.A which represented a full liquidation of the 2.17% investment tranche and an additional $100 million of the 3.75% tranche. Custom time deposits are allocated to each Series based on their percentage ownership in the pooled cash management assets as of the reporting date. The Trust values the custom time deposits at face value plus accrued interest as it is considered a deposit account under paragraph 7.50 of theInvestment Company Audit Guide, and accordingly, this deposit is not subject to ASC 820.
Credit Default Swaps— The Series of the Trust invested in credit default swaps for the purpose of mitigating part of the risk of concentration of deposits with U.S. Bank National Association to other major financial institutions. See Note 4. Credit Default Swaps were allocated to each Series based on their percentage ownership in the pooled cash management assets as of the reporting date. Credit Default Swaps were reported at fair value based upon counterparty value per the valuation policy. The Series of the Trust recorded the daily change in fair value in the statements of operations as net unrealized gain/(loss) on swap contracts. All Credit Default Swaps expired during March 2012.
Receivable From Futures Commission Merchants—The Trust deposits assets with a FCM subject to CFTC regulations and various exchange and broker requirements. Margin requirements are satisfied by the deposit of cash with such FCM. The Trust earns interest income on its assets deposited with the FCM.
Investment Transactions—Futures, options on futures, forward and swap contracts are recorded on a trade date basis and realized gains or losses are recognized when contracts are settled. Unrealized gains or losses on open contracts (the difference between contract trade price and market price) are reported in the consolidated statements of financial condition as a net unrealized gain or loss, as there exists a right of offset of unrealized gains or losses in accordance with FASB ASC 210,Balance Sheet (“ASC 210”).
Any change in net unrealized gain or loss from the preceding period is reported in the consolidated statements of operations. Fair value of exchange-traded contracts is based upon exchange settlement prices. Fair value of non-exchange-traded contracts is based on third party quoted dealer values on the interbank market. For U.S. Treasury securities, interest was recognized in the period earned and the instruments were marked-to-market daily based on third party information. Custom time deposits are valued at face value plus accrued interest and the interest income is recognized in the period earned. Transaction costs are recognized as incurred and reflected separately in the consolidated statements of operations.
Foreign currency transactions—The Series of the Trust’s functional currency is the U.S. Dollar, however, they transact business in currencies other than the U.S. Dollar. The Series of the Trust do not isolate that portion of the results of operations resulting from changes in foreign exchange rates on investments from fluctuations arising from changes in market prices of securities held. Such fluctuations are included with the net realized or unrealized gain or loss from investments.
Allocation of Earnings—Each Series of the Trust may maintain three or six classes of Units—Class 1, Class 2, Class 3, Class 1a, Class 2a and Class 3a). All classes have identical voting, dividend, liquidation and other rights and the same terms and conditions, except that fees charged to a Class or Series differ as described below. Revenues, expenses (other than expenses attributable to a specific class), and realized and unrealized trading gains and losses of each Series are allocated daily to Class 1, Class 1a, Class 2, Class 2a, Class 3 and Class 3a Units based on each Class’ respective owners’ capital balances as applicable to the classes maintained by the Series.
Payments by the Managing Owner—The Managing Owner may make discretionary payments to the Trust related to a variety of factors, including investment losses to reimburse the effect of a loss on a portfolio investment which has been caused by a situation outside the Trust’s, or it’s affiliates’, direct control. Such payments will be made on a discretionary basis and will be disclosed in the consolidated statement of operations as a net increase from payments by the Managing Owner. These payments are in accordance with the Trust agreement on a discretionary basis as determined by the Managing Owner.
Investments and Swaps—The Trust records investment transactions on a trade date basis and all investments are recorded at fair value, with changes in fair value reported as a component of realized and unrealized gains/(losses) on investments in the statements of operations. The Trust strategically invests a portion or all of its assets in total return Swaps, selected at the discretion of the Managing Owner. Swaps are privately negotiated contracts designed to provide investment returns linked to those produced by one or more underlying investment products or indices. In a typical Swap, two parties agree to exchange the returns (or differentials in rates of return) earned or realized on one or more particular predetermined investment or instrument. The gross returns to be exchanged or “swapped” between the parties are calculated with respect to a “notional amount” (i.e., the amount of value of the underlying asset used in computing the particular interest rate, return, or other amount to be exchanged) in a particular investment, or in a “basket” of securities. The valuation of swap contracts requires significant estimates. Swap contracts are reported utilizing Level 3 Inputs. The significant unobservable inputs used in the fair value measurement of the Trust’s Swap contracts are asset liquidity, debt valuation, credit risk, volatility, market risk, distributions, dividends, risk premiums, and other risk management tools. Significant increases (decreases) in any of those inputs in isolation would result in a significantly lower (higher) fair value measurement. Swap Contracts are reported at fair value based upon a weekly indicative value that is calculated by management using bid/ask prices from the counterparty. This fair value is corroborated by valuations provided by a third party pricing service. The third party pricing service utilizes a Black Scholes pricing model with input adjustments factoring in volatility and liquidity of the instruments. All valuation processes are monitored by the valuation committee of the Managing Owner. Please refer to Note 3Fair Value Measurements.
Income Taxes—The Trust applies the provisions of ASC 740Income Taxes(“ASC 740”), which provides guidance for how uncertain tax positions should be recognized, measured, presented and disclosed in the financial statements. This interpretation also provides guidance on derecognition, classification, interest and penalties, accounting in interim periods and disclosure. ASC 740 requires the evaluation of tax positions taken or expected to be taken in the course of preparing the Trust’s financial statements to determine whether the tax positions are “more-likely-than-not” of being sustained by the applicable tax authority. Tax positions with respect to tax at the Trust’s level not deemed to meet the “more-likely-than-not” threshold would be recorded as a tax benefit or expense in the current year. The Managing Owner has concluded there is no tax expense, interest or penalties to be recorded by the Trust for the years ended December 31, 2012, 2011 and 2010. The 2009 through 2012 tax years generally remain subject to examination by U.S. federal and most state tax authorities.
In the opinion of the Managing Owner, (i) the Trust is treated as a partnership for Federal income tax purposes and, assuming that at least 90% of the gross income of the Trust constitutes “qualifying income” within the meaning of Section 7704(d) of the Code, the Trust is not a publicly traded partnership treated as a corporation, and (ii) the discussion set forth in the Prospectus under the heading “Federal Income Tax Consequences” correctly summarizes the material Federal income tax consequences as of the date of the Prospectus to potential U.S. Limited Owners of the purchase, ownership and disposition of Units of the Trust.
Fees and Expenses—All management fees, incentive fees, service fees and trading fees of the Trust are paid to the Managing Owner. It is the responsibility of the Managing Owner to pay all Trading Advisor management and incentive fees, Selling Agent Service fees and all other operating expenses and continuing offering costs of the Trust.
Service Fees—The Trust may maintain each Series of Units in three or six sub-classes—Class 1, Class 1a, Class 2, Class 2a, Class 3, and Class 3a. Investors who have purchased Class 1 or Class 1a Units of any Series are charged a service fee of up to three percent (3.0%) annually of the NAV of each Unit purchased, for the benefit of selling agents selling such Class 1 or Class 1a Units. The initial service fee, which is amortized monthly at an annual rate of up to three percent (3.0%) of the average daily NAV of Class 1 or Class 1a of such Series, is prepaid to the Managing Owner by each Series, and paid to the selling agents by the Managing Owner in the month following sale; provided, however, that investors who redeem all or a portion of their Class 1 or Class 1a Units of any Series during the first twelve (12) months following the effective date of their purchase are subject to a redemption fee of up to three percent (3.0%) of the NAV at which such investor redeemed to reimburse the Managing Owner for the then-unamortized balance of the
prepaid initial service fee. With respect to Class 2 and Class 2a Units of any Series, the Managing Owner pays an ongoing service fee to Selling Agents of up to one half percent (0.5%) annually of the NAV of each Class 2 or Class 2a Unit (of which 0.25% will be charged to Limited Owners holding Class 2 Units of the Frontier Diversified Series, and Frontier Masters Series or Class 2a Units of the Frontier Long/Short Commodity Series) sold until such Class 2 or Class 2a Units which are subject to the fee limitation are reclassified as Class 3 or Class 3a Units of the applicable Series for administrative purposes. The Managing Owner may also pay Selling Agents certain additional fees and expenses for administrative and other services rendered and expenses incurred by such Selling Agents.
These service fees are part of the offering costs of the Trust, which include registration and filing fees, legal and blue sky expenses, accounting and audit, printing, marketing support and other offering costs which are born by the Managing Owner. With respect to the service fees, the initial service fee (for the first 12 months) relating to a purchase of Class 1 and Class 1a Units by an investor is prepaid by the Managing Owner to the relevant selling agent in the month following such purchase and is reimbursed for such payment by the Series monthly in arrears in an amount based upon a corresponding percentage of NAV, calculated daily. Consequently, the Managing Owner bears the risk of the downside and enjoys the benefit of the upside potential of any difference between the amount of the initial service fee prepaid by it and the amount of the reimbursement thereof, which may result from variations in NAV over the following 12 months.
Pending Owner Additions—Funds received for new subscriptions and for additions to existing owner interests are recorded as capital additions at the NAV per unit of the second business day following receipt.
Recently Issued Accounting Pronouncements—In June of 2013, FASB issued ASU 2013-08 to (i) modify Topic 946 for determining whether an entity is an investment company; (ii) update the measurement requirements for noncontrolling interests in other investment companies; and (iii) require additional disclosures for investment companies under GAAP. This guidance is effective for annual and interim periods beginning on or after December 15, 2013. An entity should provide the disclosures required by those amendments retrospectively for all comparative periods presented. The adoption of this guidance is not expected to have a material impact on the financial positions or results of operations.
Recently Adopted Accounting Pronouncements—In December of 2011, FASB issued new guidance that requires an entity to disclose information about offsetting and related arrangements to enable users of its financial statements to understand the effect of those arrangements on its financial position. FASB issued additional clarification to specify that the guidance applies only to derivatives, repurchase agreements and reverse repurchase agreements, and securities borrowing and securities lending transactions that are either offset in accordance with specific criteria of the Codification or subject to a master netting arrangement or similar agreement. This guidance is effective for annual and interim periods beginning on or after January 1, 2013. An entity should provide the disclosures required by those amendments retrospectively for all comparative periods presented. The adoption of this guidance is not expected to have a material impact on the Trust’s financial position or results of operations and is discussed in Note 7.
Subsequent Events—The Trust follows the provisions of ASC 855,Subsequent Events, which establishes general standards of accounting for and disclosure of events that occur after the balance sheet date and up through the date the financial statements are issued. Refer to Note 10.
3. Fair Value Measurements
In connection with the valuation of investments the Trust applies ASC 820,Fair Value Measurement (“ASC 820”). ASC 820 provides clarification that when a quoted price in an active market for the identical asset or liability is not available, a reporting entity is required to measure fair value using certain techniques. ASC 820 also clarifies that when estimating the fair value of an asset or liability, a reporting entity is not required to include a separate input or adjustment to other inputs relating to the existence of a restriction that prevents the transfer of an asset or liability. ASC 820 also clarifies that both a quoted price in an active market for the identical asset or liability at the measurement date and the quoted price for the identical asset or liability when traded as an asset in an active market when no adjustments to the quoted price of the asset are required are Level 1 fair value measurements.
Level 1 Inputs
Unadjusted quoted prices in active markets for identical financial assets that the reporting entity has the ability to access at the measurement date.
Level 2 Inputs
Inputs other than quoted prices included in Level 1 that are observable for the financial asset or liabilities, either directly or indirectly. These might include quoted prices for similar financial assets in active markets, quoted prices for identical or similar financial assets in markets that are not active, inputs other than quoted prices that are observable for the financial asset or inputs that are derived principally from or corroborated by market data by correlation or other means.
Level 3 Inputs
Unobservable inputs for determining the fair value of financial assets that reflect an entity’s own assumptions about the assumptions that market participants would use in pricing the financial asset.
The Trust uses the following methodologies to value instruments within its financial asset portfolio at fair value:
Trading Securities.These instruments include U.S. Treasury securities and open trade equity positions (futures contracts) that are actively traded on public markets with quoted pricing for corroboration. U.S. Treasury securities and futures contracts are reported at fair value using Level 1 inputs. Trading securities instruments further include open trade equity positions (trading options and currency forwards) that are quoted prices for identical or similar assets that are not traded on active markets. Trading options and currency forwards are reported at fair value using Level 2 inputs.
Swap Contracts. Certain Series of the Trust strategically invest a portion or all of their assets in total return Swaps, selected at the direction of the Managing Owner. Swaps are privately negotiated contracts designed to provide investment returns linked to those produced by one or more investment products or indices. In a typical Swap, two parties agree to exchange the returns (or differentials in rates of return) earned or realized on one or more particular predetermined investments or instruments. The gross returns to be exchanged or “swapped” between the parties are calculated with respect to a “notional amount” (i.e., the amount of value of the underlying asset used in computing the particular interest rate, return, or other amount to be exchanged) in a particular investment, or in a “basket” of securities. Swap contracts are reported at fair value based upon daily reports from the counterparty. The valuation of swap contracts requires significant estimates utilizing Level 3 Inputs corroborated by management through the use of a third party pricing service (“pricing service”). The pricing service, utilizing proprietary model-intensive methodologies, selects and implements the pricing model appropriate for each swap valuation. The pricing service does not provide detail of the pricing model to management. The Managing Owner through the valuation committee charted by the Executive Committee of the Trust, engages, via inquiry and review of methodology documentation, with the service provider to gain an understanding of the valuation model selected; the components of the model, both observable and unobservable; and quality control testing procedures in place. The valuation committee meets on a monthly basis and as needed to discuss any updates or changes in the valuation process, reporting to the Executive Committee. The pricing service’s methodology includes performance of tolerance testing on its valuation models to ensure consistency and reasonableness of the values derived. The tolerance testing includes valuing the components of the product separately, i.e. underlying asset, volatility, financing rates, and so forth. The tolerance testing is part of the initial valuation setup and throughout the ongoing daily valuation process. The pricing service also has several layers of quality control including: engineering / reverse engineering process to understand each swap and it’s subcomponent parts fully; comparative analysis against other valuations performed with similar composition and characteristics; review of output valuation against expectations based on observable price movements of underlying futures; and lastly, periodic review by senior financial engineer to ensure design and function of model is stable and perform as expected.
The Managing Owner has chartered a valuation committee to provide oversight of the valuation process for the Series. The valuation committee meets at least monthly to discuss the valuation process and any valuation issues that may arise. The valuation committee is comprised of senior members of the Managing Owner’s management team with varying areas of expertise that add value to the committee. The valuation committee reports to both the Managing Owner’s Investment Oversight and Risk Committee and the Trust’s Executive Committee. The committee further remains in communication with the Managing Owner’s Due Diligence Committee that provides ongoing counterparty risk monitoring of the swap counterparties. The committee monitors daily pricing valuation provided by the swap counterparty and daily valuation provided by the third party pricing service to ensure the change in fair value is reasonable and valuations are in accordance with current regulations and best practices. The committee may request a price challenge if the daily valuation provided by the counterparty valuations differs significantly from the valuation obtained by the pricing service. The Managing Owner’s valuation committee monitors some additional input factors such as liquidity, volatility, and counterparty risk in order to further review the valuations provide by the pricing service.
The following table summarizes the instruments that comprise the Trust’s financial asset portfolio, by Series, measured at fair value on a recurring basis as of September 30, 2013 and December 31, 2012, segregated by the level of valuation inputs within the fair value hierarchy utilized to measure fair value:
September 30, 2013 | Level 1 Inputs | Level 2 Inputs | Level 3 Inputs | Total Fair Value | ||||||||||||
Open Trade Equity (Deficit) | $ | 3,018,619 | $ | 3,924,573 | $ | — | $ | 6,943,192 | ||||||||
Swap Contracts | — | — | 17,152,321 | 17,152,321 | ||||||||||||
Written Options | — | (1,586,908 | ) | — | (1,586,908 | ) | ||||||||||
December 31, 2012 | Level 1 Inputs | Level 2 Inputs | Level 3 Inputs | Total Fair Value | ||||||||||||
Open Trade Equity (Deficit) | $ | (2,510,310 | ) | $ | 14,626,959 | $ | — | $ | 12,116,649 | |||||||
Swap Contracts | — | — | 22,289,478 | 22,289,478 | ||||||||||||
U.S. Treasury Securities | 18,001,322 | — | — | 18,001,322 | ||||||||||||
Written Options | — | (4,199,198 | ) | — | (4,199,198 | ) | ||||||||||
Balance of recurring Level 3 assets as of January 1, 2013 Total gains or losses (realized/unrealized): Included in earnings-realized Included in earnings-unrealized Purchases of investments Sales of investments Transfers in and/or out of Level 3 Net change in allocation of total return swap Balance of recurring Level 3 assets as of September 30, 2013 Balance of recurring Level 3 assets as of January 1, 2012 Total gains or losses (realized/unrealized): Included in earnings-realized Included in earnings-unrealized Purchases of investments Sales of investments Transfers in and/or out of Level 3 Balance of recurring Level 3 assets as of December 31, 2012 For the nine Months Ended
September 30, 2013 $ 22,289,479 (3,555,134 ) (2,763,657 ) 21,880,000 (20,694,866 ) — (3,501 ) $ 17,152,321 For the Year Ended
December 31, 2012 $ 24,211,688 — (525,237 ) (1,387,160 ) — (9,812 ) — $ 22,289,479
The Trust assesses the levels of the investments at each measurement date, and transfers between levels are recognized on the actual date of the event or change in circumstances that caused the transfer in accordance with the Trust’s accounting policy regarding the recognition of transfers between levels of the fair value hierarchy.
4. Swaps
In addition to authorizing Trading Advisors to manage pre-determined investment levels of futures and forward contracts, certain Series of the Trust will strategically invest a portion or all of their assets in total return swaps, selected at the direction of the Managing Owner. Total return Swaps are privately negotiated contracts designed to provide investment returns linked to those produced by one or more investment products or indices. In a typical total return Swap, two parties agree to exchange the returns (or differentials in rates of return) earned or realized on one or more particular predetermined investments or instruments. The gross returns to be exchanged or “swapped” between the parties are calculated with respect to a “notional amount” (i.e., the amount or value of the underlying asset used in computing the particular interest rate, return, or other amount to be exchanged) in a particular investment, or in a “basket” of securities.
The Trust invested in Credit Default Swaps (“CDS”) with highly-rated counterparties as part of its portfolio. CDSs are over-the-counter investment instruments designed to mitigate counterparty risk and generally pay upon the happening of a credit default of a counterparty. The CDS were allocated to each Series based on their percentage ownership in the pooled cash management assets at U.S. Bank National Association as of the reporting date. All Credit Default Swaps had expired as of March 31, 2012.
The Trust’s investment in Swaps will likely differ substantially over time due to cash flows, portfolio management decisions and market movements. The Swaps serve to diversify the investment holdings of the Trust and to provide access to programs and advisors that would not be otherwise available to the Trust, and are not used for hedging purposes.
The Managing Owner follows a procedure in selecting well-established financial institutions which the Managing Owner, in its sole discretion, considers to be reputable, reliable, financially responsible and well established to act as swap counterparties. The procedure includes due diligence review of documentation on all new and existing financial institution counterparties prior to initiation of the relationship, and quarterly ongoing review during the relationship, to ensure that counterparties meet the Managing Owner’s minimum credit requirements, the counterparty average rating being no less than an investment grade rating as defined by the rating agencies. As of September 30, 2013 and December 31, 2012, approximately 5.1% and 4.0%, respectively, of the Trust’s assets were deposited with over-the-counter counterparties in order to initiate and maintain Swaps.
The Trust strategically invests assets in one or more swaps linked to certain underlying investments or indices at the direction of the Managing Owner. The Trading Company in which the assets of the Trust will be invested will not own any of the investments or indices referenced by any swap entered into by the Trust. In addition, neither the swap counterparty nor any advisor referenced by any such swap is a Trading Advisor to the Trust.
The Trust had invested in the following swaps as of and for the nine months ended September 30, 2013:
| Total Return Swap | Total Return Swap | Total Return Swap | ||||||||||
Counterparty | DeutscheBank | DeutscheBank | DeutscheBank | |||||||||
Notional Amount | $ | 31,180,925 | $ | 54,591,769 | $ | 25,500,000 | ||||||
Termination Date | 3/26/2018 | 8/2/2018 | 8/2/2018 | |||||||||
Investee Returns | On Default | On Default | On Default | |||||||||
Realized Gain/(Loss) | $ | — | $ | — | $ | — | ||||||
|
|
|
|
|
| |||||||
Unrealized Gain/(Loss) | $ | (1,490,148 | ) | $ | (2,187,185 | ) | $ | (986,342 | ) | |||
|
|
|
|
|
| |||||||
Fair Value as of 9/30/2013 | $ | 4,506,351 | $ | 7,412,815 | $ | 2,413,658 | ||||||
|
|
|
|
|
| |||||||
| Total Return Swap | Balanced Series Option/Swap | Total Return Swap | ||||||||||
Counterparty | Deutsche Bank AG | Societe Generale | DeutscheBank | |||||||||
Notional Amount | 34,400,000 | $ | — | $ | — | |||||||
Termination Date | 8/7/2018 | 11/21/2014 | 6/30/2016 | |||||||||
Investee Returns | On Default | Total Returns | On Default | |||||||||
Realized Gain/(Loss) | — | $ | (1,645,980 | ) | $ | (1,909,154 | ) | |||||
|
|
|
| |||||||||
Unrealized Gain/(Loss) | (60,503 | ) | $ | 215,224 | $ | 1,745,297 | ||||||
|
|
|
|
|
| |||||||
Fair Value as of 9/30/2013 | 2,819,497 | $ | — | $ | — | |||||||
|
|
|
|
|
| |||||||
The Trust had invested in the following swaps as of and for the year ended December 31, 2012:
| Credit Default Swap | Credit Default Swap | Option/Swap | Total Return Swap | |||||||||||||
Counterparty | BNP Paribas | Societe Generale | Societe Generale | DeutscheBank | ||||||||||||
Notional Amount | $ | — | $ | — | $ | 20,486,403 | $ | 23,551,287 | ||||||||
Termination Date | 3/20/2012 | 3/20/2012 | 11/21/2014 | 6/30/2016 | ||||||||||||
Investee Returns | On Default | On Default | Total Returns | Total Returns | ||||||||||||
Realized Gain/(Loss) | $ | (407,283 | ) | $ | (117,954 | ) | $ | — | $ | — | ||||||
|
|
|
|
|
|
|
| |||||||||
Unrealized Gain/(Loss) | $ | (215,874 | ) | $ | 117,954 | $ | 78,977 | $ | (1,378,028 | ) | ||||||
|
|
|
|
|
|
|
| |||||||||
Fair Value as of 12/31/2012 | $ | — | $ | — | $ | 17,785,733 | $ | 4,503,745 | ||||||||
|
|
|
|
|
|
|
| |||||||||
5. Transactions with Affiliates
The Managing Owner contributes funds to the Trust in order to have a 1% interest in the aggregate capital, profits and losses and in return will receive units designated as general units in the Series of the Trust in which the Managing Owner invests such funds. The general units may only be purchased by the Managing Owner and may be subject to no advisory fees or management advisory fees at reduced rates. Otherwise, the general units hold the same rights as the limited units. The Managing Owner is required to maintain at least a 1% interest (“Minimum Purchase Commitment”) in the aggregate capital, profits and losses of the Trust so long as it is acting as the Managing Owner of the Trust. Such contribution was made by the Managing Owner before trading commenced for the Trust and will be maintained throughout the existence of the Trust, and the Managing Owner will make such purchases as are necessary to effect this requirement. Additionally, the Managing Owner agreed with certain regulatory bodies to maintain a 1% interest specifically in the Balanced Series Class 1a Units and Balanced Series Class 2a Units, aggregated, and each of the Frontier Long/Short Commodity Series, Frontier Diversified Series, and Frontier Masters Series. The 1% interest in these specific Series of the Trust is included in computing the Minimum Purchase Commitment in aggregate capital. In addition to the general units the Managing Owner receives in respect of its Minimum Purchase Commitment, the Managing Owner may purchase limited units in any Series as a Limited Owner. Principals of the Managing Owner or affiliates are allowed to own beneficial interests in the Trust, as well. All units purchased by the Managing Owner are held for investment purposes only and not for resale. The Managing Owner may make purchases or redemptions at any time on the same terms as any Limited Owner. The Trust has and will continue to have certain relationships with the Managing Owner and its affiliates.
Expenses
Management Fees—Each Series of the Trust pays to the Managing Owner a monthly management fee equal to a certain percentage of such Series’ assets attributable to such Series (including notional assets), calculated on a daily basis. The annual rate of the management fee is 0.5% for the Balanced Series, 2.0% for the Winton Series, Frontier Long/Short Commodity Series Class 1a and Class 2a and Frontier Masters Series, 0.75% for Frontier Diversified Series, 2.5% for the Frontier Heritage Series (formerly Winton/Graham Series) and Frontier Select Series (formerly Tiverton/Graham/Transtrend Series), and 3.5% for the Frontier Long/Short Commodity Series Class 1 and Class 2. The Managing Owner may pay all or a portion of such management fees to the Trading Advisor(s) for such Series.
Trading Fees—In connection with each Series’ trading activities of the Trust, the Frontier Long/Short Commodity Series (Classes 1, 2 and 3), Balanced Series, Frontier Select Series (formerly Tiverton/Graham/Transtrend Series), Winton Series and Frontier Heritage Series (formerly Winton/Graham Series) pays to the Managing Owner a trading fee, or FCM Fee, up to 0.75% of such Series’ NAV, calculated daily. The Frontier Diversified Series, Frontier Long/Short Commodity Series (Classes 1a and 2a) and Frontier Masters Series pays to the Managing Owner a trading fee, or FCM Fee, up to 2.25% and a custodial/due diligence fee of 0.12% of such Series’ NAV, calculated daily.
Incentive Fees—Some Series of the Trust pay to the Managing Owner an incentive fee of a certain percentage of new net trading profits generated by such Series, monthly or quarterly. Because the Balanced Series, Frontier Heritage Series (formerly Winton/Graham Series), Frontier Select Series (formerly Tiverton/Graham/Transtrend Series), and Frontier Long/Short Commodity Series may each employ multiple Trading Advisors, these Series will pay the Managing Owner a monthly incentive fee calculated on a Trading Advisor by Trading Advisor basis. It is therefore possible that in any given period the Series may pay incentive fees to the Managing Owner for one or more Trading Advisors while each of these Series as a whole experiences losses. The incentive fee is 25% for the Balanced Series and the Frontier Diversified Series and 20% for the Winton Series, Frontier Heritage Series (formerly Winton/Graham Series), Frontier Select Series (formerly Tiverton/Graham/Transtrend Series), Frontier Long/Short Commodity Series and Frontier Masters Series. The Managing Owner may pay all or a portion of such incentive fees to the Trading Advisor(s) for such Series.
Service Fees—In addition, with respect to Class 1 and Class 1a Units of each Series of the Trust, as applicable, the Series pays monthly or quarterly to the Managing Owner a service fee up to 3% annually, which the Managing Owner pays to selling agents of the Trust.
As of September 30, 2013, the Trust has a payable to the Managing Owner in the amounts of $0, $601,625, $393,822, $398,688 and $436,778 for incentive fees, management fees, interest, trading fees, and service fees, respectively.
As of December 31, 2012, the Trust has a payable to the Managing Owner in the amounts of $732,119, $1,003,663, $569, 115, $602,333 and $652,500 for incentive fees, management fees, interest, trading fees, and trailing service fees, respectively.
For the three months ended September 30, 2013, the Trust paid the Managing Owner $0, $1,981,543, $1,650,323 and $1,281,476 for incentive fees, management fees, service fees, and trading fees, respectively.
For the three months ended September 30, 2012, the Trust paid the Managing Owner $5,789,666, $3,191,672, $2,540,950 and $1,987,736 for incentive fees, management fees, service fees, and trading fees, respectively.
For the nine months ended September 30, 2013, the Trust paid the Managing Owner $889,025, $6,708,693, $5,718,063 and $4,533,240 for incentive fees, management fees, service fees, and trading fees, respectively.
For the nine months ended September 30, 2012, the Trust paid the Managing Owner $11,463,249, $9,758,788, $7,980,617 and $6,019,122 for incentive fees, management fees, service fees, and trading fees, respectively.
With respect to the service fees, the initial service fee (for the first 12 months) relating to a purchase of Units by an investor is prepaid by the Managing Owner to the relevant selling agent in the month following such purchase and is reimbursed therefore by the Series monthly in arrears in an amount based upon a corresponding percentage of NAV, calculated daily. Consequently, the Managing Owner bears the risk and enjoys the benefit of the upside potential of any difference between the amount of the initial service fee prepaid by it and the amount of the reimbursement thereof, which may result from variations in NAV over the following 12 months. For the nine months ended September 30, 2013 amounts paid or owed to the Managing Owner for the difference in monthly service fees from the prepaid initial service fees were ($6,469). For the year ended December 31, 2012 amounts received or receivable from the Managing Owner for the difference in monthly service fees from the prepaid initial service fees were $2,096.
Aggregate interest income from all sources, including assets held at clearing brokers, up to 2% (annualized) is paid to the Managing Owner by the Balanced Series (Class 1 and Class 2 only), Winton Series, Select Series (formerly Berkeley/Graham/Tiverton Series) and Frontier Heritage Series (formerly Winton/Graham Series). For the Frontier Diversified Series, Frontier Long/Short Commodity Series, Frontier Masters Series, and Balanced Series (Class 1a and Class 2a only), 20% of the total interest allocated to each Series is paid to the Managing Owner. During the three months ended September 30, 2013 and 2012 the Trust, with respect to the Series, paid $1,279,912 and $1,840,120, respectively, of such interest income to the Managing Owner. Such expenses are not included in the statements of operations of the Series. During the nine months ended September 30, 2013 and 2012 the Trust, with respect to the Series, paid $4,369,611 and $5,748,014, respectively, of such interest income to the Managing Owner. Such expenses are not included in the statements of operations of the Series. All other interest income is recorded on the respective Series statements of operations.
The Managing Owner paid to The Bornhoft Group Corporation, an affiliate of the Trust, a monthly fee of 0.25% (annualized) of the NAV of the Trust, for services in connection with the daily valuation of each Series and Class. The amount paid under this agreement was $77,196 and $465,858 for the three and nine months ended September 30, 2012. As of April 20, 2012, the contract with The Bornhoft Group Corporation was amended to provide for an annual payment of $600,000 for investment and advisor services and 0.1% annually of the trading level with the Balanced Series in lieu of a monthly service fee. The Managing Owner paid $232,150 and $889,524, respectively under this agreement for the three and nine months ended September 30, 2013.
Equinox Financial Group, LLC, an affiliate of the Trust, provides management services for the Managing Owner who paid $115,000 and $795,000, respectively, for the three and nine months ended September 30, 2013.
Solon Capital, LLC, an affiliate of the Trust, provides product development and marketing services. For these services, the Managing Owner paid Solon Capital, LLC, $412,265, and $665,478, respectively, for the three months ended September 30, 2013 and 2012 and $1,460,009, and $2,030,547, respectively, for the nine months ended September 30, 2013 and 2012.
Equinox Group Distributors LLC (formerly Bornhoft Group Securities Corporation), an affiliate under common control of the Managing Owner, serves as wholesaler of the Trust by marketing to broker/dealer organizations.
6. Financial Highlights
The following information presents the financial highlights of the Trust for the three and nine months ended September 30, 2013 and 2012. This data has been derived from the information presented in the consolidated financial statements.
| 2013 | 2012 | |||||||
| Nine Months Ended | ||||||||
Ratios to average net assets (1) | ||||||||
Net investment gain/(loss) (1) | -4.29 | % | -6.23 | % | ||||
Expenses before incentive fees (3) | -5.23 | % | -5.29 | % | ||||
Expenses after incentive fees (3) | -5.43 | % | -7.20 | % | ||||
Total return before incentive fees (2) | -12.28 | % | 0.88 | % | ||||
Total return after incentive fees (2) | -12.48 | % | -1.03 | % | ||||
| 2013 | 2012 | |||||||
| Three Months Ended | ||||||||
Ratios to average net assets (1) | ||||||||
Net investment gain/(loss) (1) | -4.08 | % | -5.43 | % | ||||
Expenses before incentive fees (3) | -5.32 | % | -5.28 | % | ||||
Expenses after incentive fees (3) | -5.32 | % | -6.28 | % | ||||
Total return before incentive fees (2) | -6.81 | % | 2.45 | % | ||||
Total return after incentive fees (2) | -6.81 | % | 1.45 | % | ||||
| (1) | Annualized with the exception of incentive fees. |
| (2) | Total returns are not annualized. |
| (3) | Expense ratios do not reflect interest allocated to the Managing Owner as such expenses are not included in the Statements of Operations of the Series. See footnore 5. |
The Trust financial highlights are calculated based upon the Trust’s consolidated financial statements. The consolidated Trust does not issue units and therefore the financial highlights do not disclose any unitized data.
7. Derivative Instruments and Hedging Activities
The Trust’s primary business is to engage in speculative trading of a diversified portfolio of futures, forwards (including interbank foreign currencies), options contracts and other derivative instruments (including swap contracts). The Trust does not enter into or hold positions for hedging purposes as defined under ASC 815. The detail of the fair value of the Trust’s derivatives by instrument types as of September 30, 2013 and December 31, 2012 is included in the Consolidated Condensed Schedules of Investments. See Note 4 for further disclosure related to the Trust’s positions in swap contracts.
For the three months ended September 30, 2013, the monthly average of futures contracts bought and sold was approximately 10,766 and 10,686, respectively. For the three months ended September 30, 2012, the monthly average of futures contracts bought and sold was approximately 20,100 and 19,100, respectively. For the nine months ended September 30, 2013, the monthly average of futures contracts bought and sold was approximately 66,741 and 73,229, respectively. For the nine months ended September 30, 2012, the monthly average of futures contracts bought and sold was approximately 49,800 and 52,900, respectively. The following tables summarize the trading revenues for the three and nine months ended September 30, 2013 and 2012 by contract type:
Net Change in Open Trade Equity from Futures, Forwards and Options
for the Three Months Ended September 30, 2013
Type of contract | ||||
Metals | $ | (9,845,278 | ) | |
Currencies | 5,886,547 | |||
Energies | 4,049,891 | |||
Agriculturals | (189,046 | ) | ||
Interest rates | 4,704,003 | |||
Stock indices | (1,890,055 | ) | ||
|
| |||
Change in unrealized trading income/(loss)(1) | $ | 2,716,062 | ||
|
| |||
Net Change in Open Trade Equity from Futures, Forwards and Options
for the Nine Months Ended September 30, 2013
Type of contract | ||||
Metals | $ | 6,049,692 | ||
Currencies | 227,765 | |||
Energies | (409,807 | ) | ||
Agriculturals | 1,089,106 | |||
Interest rates | (1,408,414 | ) | ||
Stock indices | (3,968,543 | ) | ||
|
| |||
Change in unrealized trading income/(loss)(1) | $ | 1,579,799 | ||
|
| |||
| (1) | Amounts recorded in the Consolidate Statement of Operations under net change in open trade equity (deficit), at fair value. |
Realized Trading Revenue from Futures, Forwards and Options
for the Three Months Ended September 30, 2013
Type of contract | ||||
Metals | $ | (1,256,538 | ) | |
Currencies | (12,540,668 | ) | ||
Energies | (4,070,454 | ) | ||
Agriculturals | (525,818 | ) | ||
Interest rates | (7,030,426 | ) | ||
Stock indices | 6,886,848 | |||
|
| |||
Realized trading income/(loss)(1) | $ | (18,537,056 | ) | |
|
| |||
Realized Trading Revenue from Futures, Forwards and Options
for the Nine Months Ended September 30, 2013
Type of contract | ||||
Metals | $ | 4,605,553 | ||
Currencies | (19,298,175 | ) | ||
Energies | (15,517,220 | ) | ||
Agriculturals | (3,694,199 | ) | ||
Interest rates | (33,752,578 | ) | ||
Stock indices | 36,447,322 | |||
|
| |||
Realized trading income/(loss)(1) | $ | (31,209,297 | ) | |
|
| |||
| (1) | Amounts recorded in the Consolidated Statements of Operations under net realized gain/(loss) on futures, forwards and options |
Realized Trading Revenue from Futures, Forwards and Options
for the Three Months Ended September 30, 2012(2)
Type of contract | ||||
Metals | $ | (649,307 | ) | |
Currencies | 7,835,846 | |||
Energies | (42,758,157 | ) | ||
Agriculturals | 324,580 | |||
Interest rates | 12,963,102 | |||
Stock indices | 8,252,917 | |||
|
| |||
Realized trading income/(loss)(1) | $ | (14,031,019 | ) | |
|
| |||
Net Change in Open Trade Equity from Futures, Forwards and Options
for the Three Months Ended September 30, 2012(2)
Type of contract | ||||
Metals | $ | (2,999,805 | ) | |
Currencies | (2,974,438 | ) | ||
Energies | 35,116,173 | |||
Agriculturals | 3,858,004 | |||
Interest rates | 8,135,147 | |||
Stock indices | (4,739,678 | ) | ||
|
| |||
Change in unrealized trading income/(loss)(2) | $ | 36,395,403 | ||
|
| |||
| (1) | In the Consolidated Statement of Operations under net realized gain/(loss) on futures, forwards and options |
| (2) | In the Consolidated Statement of Operations under net change in open trade equity (deficit), at fair value. |
Realized Trading Revenue from Futures, Forwards and Options
for the Nine Months Ended September 30, 2012(1)
Type of contract | ||||
Metals | $ | (15,791,452 | ) | |
Currencies | (6,365,741 | ) | ||
Energies | (23,685,527 | ) | ||
Agriculturals | (2,695,834 | ) | ||
Interest rates | 47,939,795 | |||
Stock indices | 6,092,258 | |||
|
| |||
Realized trading income/(loss)(1) | $ | 5,493,499 | ||
|
| |||
Net Change in Open Trade Equity from Futures, Forwards and Options
for the Nine Months Ended September 30, 2012(2)
Type of contract | ||||
Metals | $ | 3,720,493 | ||
Currencies | 14,487,416 | |||
Energies | 529,216 | |||
Agriculturals | 5,288,536 | |||
Interest rates | 5,776,926 | |||
Stock indices | (4,485,740 | ) | ||
|
| |||
Change in unrealized trading income/(loss)(2) | $ | 25,316,847 | ||
|
| |||
| (1) | In the Consolidated Statement of Operations under net realized gain/(loss) on futures, forwards and options |
| (2) | In the Consolidated Statement of Operations under net change in open trade equity (deficit), at fair value. |
Certain financial instruments and derivative instruments are eligible for offset in the statements of financial condition under GAAP. The Trust’s open trade equity/(deficit), options written, and receivables from Futures Commissions Merchants (each, an “FCM”) are subject to master netting arrangements and collateral arrangements and meet the GAAP guidance to qualify for offset. A master netting arrangement with a counterparty creates a right of offset for amounts due to and from that same counterparty that is enforceable in the event of a default or bankruptcy. The Trust’s policy is to recognize amounts subject to master netting arrangements on a net basis on the statements of financial condition.
The following tables present gross and net information about the Trust’s assets and liabilities subject the master netting arrangements as disclosed on the statements of financial condition as of September 30, 2013 and December 31, 2012:
Offsetting of Derivative Assets and Liabilities
As of September 30, 2013
| Gross Amounts of recognized Derivative Assets | Gross Amounts of recognized Derivative Liabilities | Net Amounts of Derivative Assets and Liabilities Presented in the Statements of Financial Condition | ||||||||||
Open Trade Equity/(Deficit) | $ | 7,790,953 | $ | (847,761 | ) | $ | 6,943,192 | |||||
Options Written | — | (1,586,908 | ) | (1,586,908 | ) | |||||||
Receivable from Futures Commissions Merchants | 150,657,924 | (83,917,517 | ) | 66,740,407 | ||||||||
As of December 31, 2012
| Gross Amounts of recognized Derivative Assets | Gross Amounts of recognized Derivative Liabilities | Net Amounts of Derivative Assets and Liabilities Presented in the Statements of Financial Condition | ||||||||||
Open Trade Equity/(Deficit) | $ | 22,637,635 | $ | (10,520,986 | ) | $ | 12,116,649 | |||||
Options Written | — | (4,199,198 | ) | (4,199,198 | ) | |||||||
Receivable from Futures Commissions Merchants | 225,653,255 | (77,624,026 | ) | 148,029,229 | ||||||||
8. Trading Activities and Related Risks
The purchase and sale of futures and options on futures contracts require margin deposits with FCMs. Additional deposits may be necessary for any loss on contract value. The Commodity Exchange Act requires an FCM to segregate all customer transactions and assets from the FCM’s proprietary activities. A customer’s cash and other property (for example, U.S. treasury bills) deposited with an FCM are considered commingled with all other customer funds subject to the FCM’s segregation requirements. In the event of an FCM’s insolvency, recovery may be limited to a pro rata share of segregated funds available. It is possible that the recovered amount could be less than the total of cash and other property deposited.
The term “off-balance sheet risk” refers to an unrecorded potential liability that, even though it does not appear on the statements of financial condition, may result in future obligation or loss in excess of the amount paid by the Series for a particular investment. Each Trading Company expects to trade in futures, options, forward and swap contracts and will therefore be a party to financial instruments with elements of off-balance sheet market and credit risk. In entering into these contracts, there exists a market risk that such contracts may be significantly influenced by market conditions, such as interest rate volatility, resulting in such contracts being less valuable. If the markets should move against all of the futures positions held by a Trading Company in respect of any Series at the same time, and if the Trading Advisor(s) of such Trading Company are unable to offset such futures interests positions, such Trading Company could lose all of its assets and the holders of Units of such Series would realize a 100% loss. The Managing Owner will seek to minimize market risk through real-time monitoring of open positions and the level of diversification of each Trading Advisor’s portfolio. It is anticipated that any Trading Advisor’s margin-to-equity ratio will typically not exceed approximately 35% although the actual ratio could be higher or lower from time to time.
In addition to market risk, trading futures, forward and swap contracts entails credit risk in that a counterparty will not be able to meet its obligations to a Trading Company. The counterparty for futures contracts traded in the United States and on most foreign exchanges is the clearinghouse associated with such exchange. In general, clearinghouses are backed by the corporate members of the clearinghouse who are required to share any financial burden resulting from the non-performance by one of their members and, as such, should significantly reduce this credit risk. In cases where the clearinghouse is not backed by the clearing members, like some foreign exchanges, it is normally backed by a consortium of banks or other financial institutions. Some non-U.S. exchanges, in contrast to U.S. exchanges, are principals’ markets in which performance is the responsibility only of the individual counterparty with whom the Trading Company has entered into the transaction, and not of the exchange or clearing corporation. In these kinds of markets, there is risk of bankruptcy or other failure or refusal to perform by the counterparty.
In the case of forward contracts traded on the interbank market and swaps, neither is traded on exchanges. The counterparty is generally a single bank or other financial institution, rather than a group of financial institutions; thus there may be a greater counterparty credit risk. The Managing Owner expects the Trading Advisors to trade only with those counterparties which it believes to be creditworthy. All positions of each Trading Company will be valued each day on a mark-to-market basis. There can be no assurance that any clearing member, clearinghouse or other counterparty will be able to meet its obligations to any Trading Company.
The Managing Owner has established procedures to actively monitor and minimize market and credit risks. The Limited Owners bear the risk of loss only to the extent of the market value of their respective investments and, in certain specific circumstances, distributions and redemptions received.
9. Indemnifications and Guarantees
The Trust has entered into agreements, which provide for the indemnification of futures clearing brokers, and commodity trading advisers, among others, against losses, costs, claims and liabilities arising from the performance of their individual obligations under such agreements, except for gross negligence or bad faith. The Trust has had no prior claims or payments pursuant to these agreements. The Trust’s individual maximum exposure under these arrangements is unknown, as this would involve future claims that may be made against the Trust that have not yet occurred. However, based on experience the Trust expects the risk of loss to be remote. Maximum exposure is unfulfilled obligations of the Trust up to the amount of equity at risk with UBS. The Trust has not recorded any liability for the guarantees in the accompanying financial statements as it expects any possibility of losses to be remote.
The Trust has guaranteed the obligations of the trading companies under the customer agreements with UBS Securities as Clearing Broker. In the event that one Series of the Trust is unable to meet its obligations to UBS Securities, the assets of the other Series will be available to UBS Securities as part of the guarantee, but only to the extent of such Series’ pro rata allocation to the trading company. The Trust has not recorded any liability for the indemnifications in the accompanying financial statements as it expects any possibility of losses to be remote.
10. Subsequent Events
None.
| Item 2. | MANAGEMENT’S DISCUSSION AND ANALYSIS OF FINANCIAL CONDITION AND RESULTS OF OPERATIONS |
Introduction
The following discussion and tables should be read in conjunction with our unaudited consolidated financial statements and notes thereto included in this quarterly report and our 2012 Annual Report on Form 10-K for the year ended December 31, 2012.
Overview
The Frontier Fund (the “Trust”), is a Delaware statutory trust formed on August 8, 2003. The Trust is a multi-advisor commodity pool, as described in CFTC Regulation § 4.10(d)(2). The Trust is authorized to issue multiple series (“Series”) of Units (the “Units”), pursuant to the requirements of the Trust Act. The assets of each Series are held and accounted for in separate and distinct records separately from the assets of other Series. The Trust is managed by Equinox Fund Management LLC (the “Managing Owner”), and its term will expire on December 31, 2053 (unless terminated earlier in certain circumstances).
The Trust, with respect to each Series of Units, engages in the speculative trading of a diversified portfolio of futures, forward (including interbank foreign currencies) and options contracts and other derivative instruments (including Swaps) and may, from time to time, engage in cash and spot transactions and allocates funds to an affiliated limited liability trading company (each a “Trading Company”). Each Trading Company has one-year renewable contracts with its own independent Trading Advisor(s) that will manage all or a portion of the applicable Trading Company’s assets, and make the trading decisions for the assets of each Series vested in such Trading Company. The assets of each Trading Company will be segregated from the assets of each other Trading Company. The Trust has an investment objective of increasing the value of the Units over the long term (capital appreciation), while controlling risk and volatility; further, to offer exposure to the investment programs of individual Trading Advisors and to specific instruments (currencies).
The Trust has eight (8)seven (7) separate and distinct Series of Units issued and outstanding: Frontier Diversified Series, Frontier Masters Series, Frontier Long/Short Commodity Series, Balanced Series, Currency Series (ceased trading on April 18, 2013), Frontier Select Series (formerly Tiverton/Graham/Transtrend Series), Winton Series, and Frontier Heritage Series (formerly Winton/Graham Series) (each a “Series” and collectively, the “Series”). The Currency Series ceased trading and liquidated on April 18, 2013 and the TBG Institutional Series ceased trading and liquidated on May 23, 2013. Each Series of Units has between two and six separate classes issued and/or outstanding – Class 1, Class 2, Class 3, Class 1a, Class 2a and Class 3a as applicable to the Series.
Critical Accounting Policies and Estimates
The financial statements of the Trust in this Quarterly Report on Form 10-Q have not been audited by an independent registered public accounting firm, but in the opinion of management, reflect all adjustments necessary for a fair presentation of the Trust’s financial position and results of operations. The financial statements have been prepared in accordance with U.S. generally accepted accounting principles (“GAAP”). These interim financial statements have been prepared in accordance with the instructions to Form 10-Q and Rule 10-01 of Regulation S-X and serve to update the Trust’s 2012 Annual Report on Form 10-K (“Form 10-K”). These financial statements do not include all of the information and notes necessary to constitute a complete set of financial statements under GAAP applicable to annual periods. Accordingly, they should be read in conjunction with the financial information contained in the Form 10-K. In the opinion of management, all adjustments necessary for a fair presentation have been included. The results of operations for the interim periods disclosed herein are not necessarily indicative of results that may be expected for the full year or any future period.
The Trust’s other significant accounting policies are described in detail in Note 2 of the financial statements.
Investment Transactions and Valuation
The Managing Owner has evaluated the nature and type of transactions processed and estimates that it makes in preparing the Trust’s financial statements and related disclosures underand has adoptedAccounting Standard Codification (“ASC”) 820,Fair Value Measurements and Disclosure, and implemented the framework for measuring fair value for assets and liabilities.
The Trust utilizes valuation techniques that are consistent with the market approach per the requirement of ASC 820 for the valuation of futures (exchange traded) contracts, forward (non-exchange traded) contracts, option contracts, swap contracts and other non-cash assets. The market approach uses prices and other relevant information generated by market transactions involving identical or comparable assets or liabilities. The Trust applies the valuation techniques in a consistent manner for each asset or liability. The Trust records all investments at fair value in its Statements of Financial Condition, with changes in fair value reported as a component of net gain/(loss) on investments in the Statements of Operations.
Inputs to valuation techniques refer to the assumptions that market participants would use in pricing the assets or liabilities. Inputs may be observable, meaning those that reflect the assumptions market participants would use in pricing the financial asset or liability based on market data obtained from independent sources, or unobservable, meaning those that reflect the reporting entity’s own assumptions about the assumptions market participants would use in pricing the financial asset or liability based on the best information available in the circumstances.
In addition, the Trust monitors counterparty credit risk and incorporates any identified risk factors when assigning input levels to underlying financial assets or liabilities. In that regard ASC 820 establishes a fair value hierarchy for valuation inputs that gives the highest priority to quoted prices in active markets for identical financial assets and the lowest priority to unobservable inputs. A full disclosure of the fair value hierarchy is presented in Note 3 of the financial statements—Fair Value Measurements.
Selection and Replacement of Trading Advisors
The managing ownerManaging Owner is responsible for the selection, retention and termination of the trading advisors and swap reference trading programs on behalf of each series. The actual allocation among trading advisors for each series will vary based upon the relative trading performance of the trading advisors and/or reference programs, and the managing ownerManaging Owner may otherwise vary such percentages from time to time in its sole discretion. The managing ownerManaging Owner will adjust its allocations and rebalance the portfolio of any series among trading advisors to maintain weightings that it believes will most likely achieve capital growth within the investment guidelines of the relevant series.
The managing ownerManaging Owner utilizes certain quantitative and qualitative analysis in connection with the identification, evaluation and selection of the trading advisors. The managing owner’sManaging Owner’s proprietary and commercial analytical software programs and comprehensive trading advisor database provide the quantitative basis for the trading advisor selection, portfolio implementation process, and ongoing risk management, monitoring, and review.
In 1983, Richard Bornhoft, the Chief Investment Officer of the managing owner,Managing Owner, began compiling its proprietary database of the leading United States and internationally based alternative investment programs. Trading advisors are monitored and performance data is entered on a daily, monthly, quarterly or bi-annual basis according to internal ranking systems.
The managing owner’sManaging Owner’s research department is continually refining ways to assimilate vast amounts of trading advisor performance data and due-diligence information. The proprietary and commercial database of alternative investment programs is always increasing. Research team members regularly interact with trading advisors throughout the due diligence and monitoring process. Only those programs that have met strict quantitative and qualitative review are considered as potential managers of client assets. Following is a summary of the quantitative and qualitative analysis:
Quantitative Analysis
The managing owner’sManaging Owner analytical software system applies a variety of statistical measures towards the evaluation of current and historical advisor performance data. Statistical measures include but are not limited to: (1) risk/reward analysis, (2) time window analysis, (3) risk analysis, (4) correlation analysis, (5) statistical overlays and (6) performance cycle analysis.
Qualitative Analysis
Although quantitative analysis statistically identifies the top performing trading advisors, qualitative analysis plays a major role in the trading advisor evaluation and final selection process. Each trading advisor in the managing owner’sManaging Owner’s top decile universe initially undergoes extensive qualitative review by the managing owner’sManaging Owner’s research department, as well as continual monitoring. This analysis generally includes, but is not limited to: (1) preliminary information and due diligence, (2) background review, (3) onsite due diligence, (4) extensive due diligence questionnaires and (5) written review and periodic updates. This information allows a thorough review of each trading advisor’s trading philosophy, trading systems and corporate structure.
Multi-Manager Approach
A multi-manager approach to portfolio management provides diversification of trading advisors and access to broader global markets. Multiple trading advisors can provide diversification across trading methodologies, trading time horizons, and markets traded. Additionally, multi-manager portfolios tend to provide a greater level of professional management with ongoing risk management and review. The result can be more consistent returns with lower volatility.
The trading system of each of the major commodity trading advisors used by the Trading Companies is as follows:
Major Commodity Trading Advisor | Trading System Style | |||
Beach Horizon LLP | Systematic | |||
Cantab Capital Partners LLP | Systematic | |||
| Systematic | |||
| Systematic | |||
Fort LP | Systematic | |||
Global Advisors (Jersey) Limited | Systematic | |||
Mesirow Financial Commodities Management, LLC | Discretionary | |||
Quantitative Investment Management, LLC | Systematic | |||
QuantMetrics Capital Management LLP | Systematic | |||
Quest Partners LLC | Systematic | |||
Red Oak Commodity Advisors, Inc. | Discretionary | |||
Rosetta Capital Management, LLC | Discretionary | |||
Skyline Management, Inc. | Discretionary | |||
Tiverton Trading | Discretionary | |||
Transtrend B.V. | Systematic | |||
Winton Capital Management Ltd. | Systematic | |||
As of JuneSeptember 30, 2013, the allocation of the assets of each applicable Series of the Trust between the Trading Advisors was as follows:
| Allocation as of June 30, 2013 (expressed as a percentage of aggregate notional exposure to commodity trading programs) | Allocation as of September 30, 2013 (expressed as a percentage of aggregate notional exposure to commodity trading programs) | |||||||||||||||||||||||||||||||||||||||||||||||||||||||
Advisor | Frontier Diversified Series | Frontier Long/Short Commodity Series | Frontier Masters Series | Balanced Series | Frontier Select Series* | Winton Series | Frontier Heritage Series** | Frontier Diversified Series | Frontier Long/Short Commodity Series | Frontier Masters Series | Balanced Series | Frontier Select Series | Winton Series | Frontier Heritage Series | ||||||||||||||||||||||||||||||||||||||||||
Beach Horizon LLP | 13 | % | 13 | % | — | 7 | % | — | — | — | — | — | % | — | 2 | % | — | — | — | |||||||||||||||||||||||||||||||||||||
Cantab Capital Partners LLP | 21 | % | — | 26 | % | 17 | % | — | — | — | 13 | % | — | 26 | % | 11 | % | — | — | — | ||||||||||||||||||||||||||||||||||||
Doherty Trading Advisors | — | — | — | 4 | % | — | — | — | ||||||||||||||||||||||||||||||||||||||||||||||||
Emil Van Essen LLC | — | 7 | % | 3 | % | — | — | — | ||||||||||||||||||||||||||||||||||||||||||||||||
Fort LP | — | — | — | 13 | % | — | — | — | ||||||||||||||||||||||||||||||||||||||||||||||||
Global Advisors (Jersey) Limited | — | 14 | % | — | — | — | — | — | — | 8 | % | — | — | — | — | — | ||||||||||||||||||||||||||||||||||||||||
Brevan Howard Systematic Trading | 2 | % | — | — | — | 26 | % | — | 45 | % | ||||||||||||||||||||||||||||||||||||||||||||||
Mesirow Financial Commodities Management, LLC | 5 | % | 14 | % | — | — | — | — | — | 6 | % | 11 | % | — | — | — | — | — | ||||||||||||||||||||||||||||||||||||||
Quantitative Investment Management, LLC | 11 | % | — | — | 19 | % | — | — | — | 9 | % | — | — | 12 | % | — | — | — | ||||||||||||||||||||||||||||||||||||||
QuantMetrics Capital Management LLP | 8 | % | — | — | — | — | — | — | 10 | % | — | — | 10 | % | — | — | — | |||||||||||||||||||||||||||||||||||||||
Quest Partners LLC | 8 | % | ||||||||||||||||||||||||||||||||||||||||||||||||||||||
Red Oak Commodity Advisors, Inc. | — | 16 | % | — | — | — | — | — | — | 10 | % | — | — | — | — | — | ||||||||||||||||||||||||||||||||||||||||
Rosetta Capital Management, LLC | — | 11 | % | — | — | — | — | — | — | 9 | % | — | — | — | — | — | ||||||||||||||||||||||||||||||||||||||||
Skyline Management, Inc. | — | 10 | % | — | — | — | — | — | — | 10 | % | — | — | — | — | — | ||||||||||||||||||||||||||||||||||||||||
Tiverton Trading | 17 | % | — | 22 | % | 13 | % | 42 | % | — | — | 13 | % | — | 23 | % | 10 | % | 41 | % | — | — | ||||||||||||||||||||||||||||||||||
Transtrend B.V. | — | — | 28 | % | — | 32 | % | — | — | — | — | 25 | % | — | 32 | % | — | — | ||||||||||||||||||||||||||||||||||||||
Winton Capital Management Ltd. | 13 | % | — | 24 | % | 14 | % | — | 100 | % | 55 | % | 11 | % | — | 26 | % | 12 | % | — | 100 | % | 55 | % | ||||||||||||||||||||||||||||||||
| * | Formerly the Tiverton/Graham/Transtrend Series. Formerly Tiverton/Graham/Transtrend Series. |
| ** | Formerly the Winton/Graham Series. Formerly Tiverton/Graham/Transtrend Series. |
Liquidity and Capital Resources
The Trust will raise additional capital only through the sale of Units offered pursuant to the continuing offering, and does not intend to raise any capital through borrowing. Due to the nature of the Trust’s business, it makes no capital expenditures and has no capital assets that are not operating capital or assets.
The Managing Owner is responsible for the payment of all of the ordinary expenses associated with the organization of the Trust and the offering of each Series of Units, except for the initial and ongoing service fee, if any, and no Series will be required to reimburse these expenses. As a result, 100% of each Series’ offering proceeds are initially available for that Series’ trading activities.
A portion of each Trading Company’s assets is used as margin to maintain that Trading Company’s forward currency contract positions, and another portion is deposited in cash in segregated accounts in the name of each Trading Company maintained for each Trading Company at the clearing brokers in accordance with CFTC segregation requirements. At JuneSeptember 30, 2013, cash deposited at the clearing brokers was $22,019,309$20,948,268 for the Balanced Series and $14,142,506$6,922,041 for the Frontier Long/Short Commodity Series. At December 31, 2012, cash deposited at the clearing brokers was $92,043,593 for the Balanced Series and $14,770,973 for the Frontier Long/Short Commodity Series. The clearing brokers are expected to credit each Trading Company with approximately 80%-100% of the interest earned on its average net assets on deposit with the clearing brokers each month. Currently, with the Federal Funds target rate at 0.00% to 0.25%, this amount is estimated to be 0.00%. In an attempt to increase interest income earned, the Managing Owner also may invest the non-margin assets in U.S. government securities which include any security issued or guaranteed as to principal or interest by the U.S., or by a person controlled by or supervised by and acting as an instrumentality of the government of the U.S. pursuant to authority granted by Congress or any certificate of deposit for any of the foregoing, including U.S. treasury bonds, U.S. treasury bills and issues of agencies of the U.S. government, and certain cash items such as money market funds, certificates of deposit (under nine months) and time deposits. Aggregate interest income from all sources, including assets held at clearing brokers, up to 2% (annualized) is paid to the Managing Owner by the Balanced Series (Class 1 and Class 2 only), Winton Series, Frontier Select Series (formerly Tiverton/Graham/Transtrend Series), Currency Series, and Frontier Heritage Series (formerly Winton/Graham Series). For the Balanced Series (Class 1a and Class 2a only) and Frontier Long/Short Commodity Series 20% of the total interest allocated to each Series is paid to the Managing Owner. Such expenses are not included in the statements of operations of the series.
Approximately 10% to 30% of the Trust’s assets are expected to be committed as required margin for futures contracts and forwards and options trading and held by the respective broker, although the amount committed may vary significantly. Such assets are maintained in the form of cash or U.S. treasury bills in segregated accounts with the futures broker pursuant to the Commodity Exchange Act and regulations there under. Approximately 2% to 6% of the Trust’s assets are expected to be deposited with over-the-counter counterparties in order to initiate and maintain forward and swap contracts. Such assets are not held in segregation or otherwise regulated under the Commodity Exchange Act, unless such over-the-counter counterparty is registered as a futures commission merchant. These assets are held in either U.S. government securities or short-term time deposits with U.S.-regulated bank affiliates of the over-the-counter counterparties. The remaining approximately 74% to 88% of the Trust’s assets will normally be invested in cash equivalents and short-term investments, such as money market funds and time deposits and held by the clearing broker, the over-the-counter counterparties and by U.S. federally chartered banks. As of JuneSeptember 30, 2013, total cash and cash equivalents and custom time deposits held at banking institutions were $53,570,120$46,349,605 for the Frontier Diversified Series, $31,693,775$29,008,804 for the Frontier Masters Series, $32,216,810$24,290,178 for the Frontier Long/Short Commodity Series, $92,366,437$85,448,482 for the Balanced Series, $17,118,300$15,080,311 for the Frontier Select Series (formerly Tiverton/Graham/Transtrend Series), $32,810,378$30,071,055 for the Winton Series, and $14,920,766$12,159,938 for the Frontier Heritage Series (formerly Winton/Graham Series). As of December 31, 2012, total cash and cash equivalents and custom time deposits held at banking institutions were $69,557,079 for the Frontier Diversified Series, $43,037,890 for the Frontier Long/Short Commodity Series, $39,831,538 for the Frontier Masters Series, $107,090,046 for the Balanced Series, $17,301,848 for the Frontier Select Series (formerly the Tiverton/Graham/Transtrend Series), $32,541,850 for the Winton Series, and $13,964,174 for the Frontier Heritage Series (formerly the Winton/Graham Series). During the sixnine months of 2013, the Trust experienced redemptions in excess of subscriptions due primarily to five of the eight Series being closed to new investments and to the termination of a selling agent relationship. The Managing Owner does not expect any impact on the investment mix of any Series due to the high level of liquidity maintained in the Trust.
As a commodity pool, the Trust has large cash positions. Such cash positions are used to pay margin for the trading of futures, forwards and options, and also to pay redemptions. Generally, the Trust has not been forced to liquidate positions to fund redemptions. During the period ending JuneSeptember 30, 2013, the Trust was able to pay all redemptions.
There are no other known trends or demands, commitments, events or uncertainties that will result in or that are reasonably likely to result in the Trust’s liquidity increasing or decreasing in any material way. There are no known material trends, favorable or unfavorable in the Trust’s capital resources.
Off-Balance Sheet Risk
The term “off-balance sheet risk” refers to an unrecorded potential liability that, even though it does not appear on the balance sheet, may result in future obligation or loss. Each Trading Company trades in futures, forward and swap contracts and is therefore a party to financial instruments with elements of off-balance sheet market and credit risk. In entering into these contracts there exists a market risk that such contracts may be significantly influenced by market conditions, such as interest rate volatility, resulting in such contracts being less valuable. If the markets should move against all of the futures interests positions held by a Trading Company in respect of any Series at the same time, and if the Trading Advisor(s) of such Trading Company are unable to offset such futures interests positions, such Trading Company could lose all of its assets and the holders of Units of such Series would realize a 100% loss. The
Managing Owner seeks to minimize market risk through real-time monitoring of open positions and the level of diversification of each Trading Advisor’s portfolio. It is anticipated that any Trading Advisor’s margin-to-equity ratio will typically not exceed approximately 35% although the actual ratio could be higher or lower from time to time.
In addition to market risk, trading futures, forward and swap contracts entails credit risk which is the risk that a counterparty will not be able to meet its obligations to a Trading Company. The counterparty for futures contracts traded in the U.S. and on most foreign exchanges is the clearinghouse associated with such exchange. In general, clearinghouses are backed by the corporate members of the clearinghouse who are required to share any financial burden resulting from the non-performance by one of their members and, as such, should significantly reduce this credit risk. In cases where the clearinghouse is not backed by the clearing members, like some foreign exchanges, it is normally backed by a consortium of banks or other financial institutions. Some non-U.S. exchanges, in contrast to U.S. exchanges are principals’ markets in which performance is the responsibility only of the individual counterparty with whom the Trading Company has entered into the transaction with and not of the exchange or clearing corporation. In these kinds of markets, there is risk of bankruptcy or other failure or refusal to perform by the counterparty.
In the case of forward contracts traded on the interbank market and swaps, neither is traded on an exchange. The counterparty is generally a single bank or other financial institution, rather than a group of financial institutions; thus, there may be a greater counterparty credit risk. The Managing Owner expects the Trading Advisors to trade only with those counterparties which it believes to be creditworthy. All positions of each Trading Company are valued each day on a mark-to-market basis. There can be no assurance that any clearing member, clearinghouse or other counterparty will be able to meet its obligations to any Trading Company.
The Trust has entered into agreements, which provide for the indemnification of futures clearing brokers, currency trading companies, and commodity trading advisers, among others, against losses, costs, claims and liabilities arising from the performance of their individual obligations under such agreements, except for gross negligence or bad faith. The Trust has had no prior claims or payments pursuant to these agreements. The Trust’s individual maximum exposure under these arrangements is unknown, as this would involve future claims that may be made against the Trust that have not yet occurred. However, based on experience the Trust expects the risk of loss to be remote.
Disclosure of Contractual Obligations
The business of the Trust is the speculative trading of commodity interests. The majority of the Trust’s futures and forward positions, which may be categorized as “purchase obligations” under Item 303 of Regulation S-K, are short-term. That is, they are held for less than one year. Because the Trust does not enter into other long-term debt obligations, capital lease obligations, operating lease obligations or other long-term liabilities that would otherwise be reflected on the Trust’s Statement of Financial Condition, a table of contractual obligations has not been presented.
Results of Operations
Series Returns and Other Information
The returns for each Series and Class of Units for the three and sixnine months ended JuneSeptember 30, 2013 and JuneSeptember 30, 2012, and related information, are discussed below. The activities of the Trust on a consolidated basis are explained through the activity of the underlying Series. Please refer to the discussion of the Series activities in relation to the Trust on a consolidated basis.
Each Series had exposure to commodity interest positions within one or more sectors during fiscal 2013 and 2012. The performance of each Series was impacted over the course of the periods by, among other things, the relative performance of the relevant sector or sectors and the commodities within those sectors, the changing allocations among, and the specific positions taken by the Series’ Trading Advisors in, the relevant sector(s) and commodities, and the timing of entries and exits. For certain of the Series, a sector attribution chart has been included at the end of the relevant discussion. Each chart depicts the performance of the relevant Series’ positions within each of the relevant sectors (determined by the Managing Owner using monthly gross return and NAV figures, with various adjustments to net out a proportional allocation of the fees and expenses chargeable to the Series) during the periods presented.
Three Months Ended JuneSeptember 30, 2013 Compared to Three Months Ended JuneSeptember 30, 2012.
Frontier Diversified Series
The Frontier Diversified Series—Class 1 NAV lost 8.7% and gained 0.2%, respectively, for the three months ended September 30, 2013 and 2012, net of fees and expenses; the Frontier Diversified Series—Class 2 NAV lost 8.3% and gained 0.7%, respectively for the three months ended September 30, 2013 and 2012, net of fees and expenses.
For the three months ended September 30, 2013, the Frontier Diversified Series recorded net loss on investments of $6,696,322, net investment income of $399,992, and total expenses of $1,035,481, resulting in a net decrease in Owners’ capital from operations of $7,331,811. For the three months ended September 30, 2012, the Frontier Diversified Series recorded net gain on investments of $3,088,069, net investment income of $524,861, and total expenses of $3,002,858, resulting in a net increase in Owners’ capital from operations of $610,072.
Please see additional discussion under “Nine Months Ended September 30, 2013 Compared to Nine Months Ended September 30, 2012 – Frontier Diversified Series.”
Frontier Masters Series
The Frontier Masters Series – Class 1 NAV lost 7.3% and 2.8%, respectively, for the three months ended September 30, 2013 and 2012, net of fees and expenses; the Frontier Masters Series – Class 2 NAV lost 6.8% and 3.3%, respectively for the three months ended September 30, 2013 and 2012, net of fees and expenses.
For the three months ended September 30, 2013, the Frontier Masters Series recorded net loss on investments of $2,509,310, net investment income of $192,004, and total expenses of $724,530, resulting in a net decrease in Owners’ capital from operations of $3,041,836. For the three months ended September 30, 2012, the Frontier Masters Series recorded net gain on investments of $2,798,459, net investment income of $251,275, and total expenses of $1,318,639, resulting in a net increase in Owners’ capital from operations of $1,582,386, after non-controlling interests of ($148,709).
Please see additional discussion under “Nine Months Ended September 30, 2013 Compared to Nine Months Ended September 30, 2012 – Frontier Masters Series.”
Frontier Long/Short Commodity Series
The Frontier Long/Short Commodity Series – Class 1 NAV lost 5.7%, for the three months ended September 30, 2012, net of fees and expenses; the Frontier Long/Short Commodity Series – Class 2 NAV lost 6.2% and gained 7.2%, respectively, for the three months ended September 30, 2013 and 2012, net of fees and expenses; the Frontier Long/Short Commodity Series – Class 3 NAV lost 6.2% and gained 7.2%, respectively for the three month period ended September 30, 2013 and 2012, net of fees and expenses; the Frontier Long/Short Commodity Series – Class 1a NAV lost 6.3% and gained 7.1%, respectively, for the three month period ended September 30, 2013 and 2012, net of fees and expenses; the Frontier Long/Short Commodity Series – Class 2a NAV lost 5.9% and gained 7.5%, respectively, for the three month period ended September 30, 2013 and 2012, net of fees and expenses; the Frontier Long/Short Commodity Series Class 3a NAV lost 5.8%, for the three month period ended September 30, 2013, net of fees and expenses.
For the three months ended September 30, 2013, the Frontier Long/Short Commodity Series recorded net loss on investments of $3,403,485, net investment income of $249,355, and total expenses of $736,011, resulting in a net decrease in Owners’ capital from operations of $2,283,631, after non-controlling interests of ($1,606,510). For the three months ended September 30, 2012, the Frontier Long/Short Commodity Series recorded net gain on investments of $985,593, net investment income of $336,190, and total expenses of $1,833,637, resulting in a net decrease in Owners’ capital from operations of $4,804,594, after non-controlling interests of $5,316,448.
Please see additional discussion under “Nine Months Ended September 30, 2013 Compared to Nine Months Ended September 30, 2012 – Frontier Long/Short Commodity Series.”
Balanced Series
The Balanced Series – Class 1 NAV lost 6.8% and gained 0.1%, respectively, for the three months ended September 30, 2013 and 2012, net of fees and expenses; the Balanced Series – Class 1a NAV gained 4.1%, for the three months ended September 30, 2012, net of fees and expenses; the Balanced Series – Class 2 NAV lost -6.1% and gained 0.8%, respectively, for the three months ended September 30, 2013 and 2012, net of fees and expenses; the Balanced Series – Class 2a NAV lost 5.7% and gained 0.9%, respectively, for the three months ended September 30, 2013 and 2012, net of fees and expenses; the Balanced Series – Class 3a NAV lost -5.7% and gained 0.9% for the three months ended September 30, 2013 and 2012, respectively, net of fees and expenses.
For the three months ended September 30, 2013, the Balanced Series recorded net loss on investments of $9,721,779, net investment income of $123,819, and total expenses of $1,337,925, resulting in a net decrease in Owners’ capital from operations of $9,721,779 after non-controlling interests of ($1,528,637). For the three months ended September 30, 2012, the Balanced Series recorded net gain on investments of $12,592,196, net investment income of $22,120, and total expenses of $5,553,832, resulting in a net increase in Owners’ capital from operations of $893,203 after non-controlling interests of ($6,167,281).
Please see additional discussion under “Nine Months Ended September 30, 2013 Compared to Nine Months Ended September 30, 2012 – Balanced Series.”
Frontier Select Series (formerly Tiverton/Graham/Transtrend Series)
The Frontier Select Series – Class 1 NAV lost -6.2% and 1.2%, respectively, for the three months ended September 30, 2013 and 2012, net of fees and expenses; the Frontier Select Series – Class 2 NAV lost 5.4% and 0.1%, respectively for the three months ended September 30, 2013 and 2012, net of fees and expenses.
For the three months ended September 30, 2013, the Frontier Select Series recorded net loss on investments of $1,021,631, net investment income of $68,662, and total expenses of $322,765, resulting in a net decrease in Owners’ capital from operations of $1,275,734. For the three months ended September 30, 2012, the Frontier Select Series recorded net gain on investments of $310,424, net investment income of $75,086, and total expenses of $607,981, resulting in a net decrease in Owners’ capital from operations of $222,471.
Please see additional discussion under “Nine Months Ended September 30, 2013 Compared to Nine Months Ended September 30, 2012 – Frontier Select Series.”
Winton Series
The Winton Series – Class 1 NAV lost 2.4% and 0.0%, respectively, for the three months ended September 30, 2013 and 2011, net of fees and expenses; the Winton Series – Class 2 NAV lost -1.6% and 0.7%, respectively, for the three months ended September 30, 2013 and 2012, net of fees and expenses.
For the three months ended September 30, 2013, the Winton Series recorded net loss on investments of $380,598, net investment income of $66,92, and total expenses of $548,777, resulting in a net decrease in Owners’ capital from operations of $862,383. For the three months ended September 30, 2012, the Winton Series recorded net gain on investments of $583,943, net investment income of $127,814, and total expenses of $602,347, resulting in a net increase in Owners’ capital from operations of $109,410.
Please see additional discussion under “Nine Months Ended September 30, 2013 Compared to Nine Months Ended September 30, 2012 – Winton Series.”
Frontier Heritage Series (formerly Winton/Graham Series)
The Frontier Heritage Series – Class 1 NAV lost 2.6% and gained 2.9%, respectively, for the three months ended September 30, 2013 and 2012 net of fees and expenses; the Winton/Graham Series – Class 2 NAV lost 1.8% and gained 3.6%, respectively for the three months ended September 30, 2013 and 2012, net of fees and expenses.
For the three months ended September 30, 2013, the Frontier Heritage Series recorded net loss on investments of $249,447, net investment income of $29,602, and total expenses of $207,326, resulting in a net decrease in Owners’ capital from operations of $427,171. For the three months ended September 30, 2012, the Frontier Heritage Series recorded net gain on investments of $1,177,718, net investment income of $31,821, and total expenses of $425,439, resulting in a net increase in Owners’ capital from operations of $784,100.
Please see additional discussion under “Nine Months Ended September 30, 2013 Compared to Nine Months Ended September 30, 2012 – Frontier Heritage Series.”
Nine Months Ended September 30, 2013 Compared to Nine Months Ended September 30, 2012.
Frontier Diversified Series
2013
The Frontier Diversified Series – Class 1 NAV lost 8.25%-17.24% for the threenine months ended JuneSeptember 30, 2013, net of fees and expenses; the Frontier Diversified Series – Class 2 NAV lost 7.84%-16.14% for the threenine months ended JuneSeptember 30, 2013, net of fees and expenses.
For the threenine months ended JuneSeptember 30, 2013 the Frontier Diversified Series recorded a net loss on investments of $7,089,299,$13,898,938, net investment income of $462,159,$1,338,676, and total expenses of $1,293,002,$3,865,332, resulting in a net decrease in Owners’ capital from operations of $7,920,142. The NAV per Unit, Class 1, decreased from $93.21 at March 31, 2013, to $85.55 as of June 30, 2013. The NAV per Unit, Class 2, decreased from $99.64 at March 31, 2013, to $91.85 as of June 30, 2013. Total Class 1 subscriptions and redemptions for the period were $579,744 and $5,428,635, respectively. Total Class 2 subscriptions and redemptions for the period were $431,750 and $5,992,906, respectively. Ending capital at June 30, 2013, was $45,238,450 for Class 1 and $44,531,683 for Class 2. Ending capital at March 31, 2013, was $54,151,338 for Class 1 and $53,948,984 for Class 2.
The Frontier Diversified Series may have both long and short exposure to the Interest Rates, Currencies, Stock Indices, Energies, Metals, and Commodities sectors.
| | |
| |
Two of the six sectors traded in the Frontier Diversified Series were profitable in Q2 2013. Stock Indices and Metals were profitable while Interest Rates, Currencies, Agriculturals and Energies finished negative for the quarter.
The Stock Indices and Metals sectors are positive YTD while Interest Rates, Currencies, Agriculturals and Energies are negative YTD.
In terms of major CTA performance, One of the eight major CTAs in the Frontier Diversified Series was profitable in Q2 2013 . Tiverton was profitable while Cantab, QIM, Beach Horizon, Mesirow, Quantmetrics, Brevan Howard and Winton finished negative in the quarter. In terms of YTD performance Mesirow, Tiverton and Winton are positive YTD while Cantab, QIM, Quantmetrics, Beach Horizon and Brevan Howard are negative YTD.
2012
The Frontier Diversified Series – Class 1 NAV gained 2.5%, for the three months ended June 30, 2012, net of fees and expenses; the Frontier Diversified Series – Class 2 NAV gained 3.0% for the three months ended June 30, 2012, net of fees and expenses.
For the three months ended June 30, 2012, the Frontier Diversified Series recorded net gain on investments of $6,100,289, net investment income of $545,961, and total expenses of $3,224,069, resulting in a net increase in Owners’ capital from operations of $3,422,181. The NAV per Unit, Class 1, decreased from $95.23 at March 31, 2012, to $97.60 as of June 30, 2012. The NAV per Unit, Class 2, decreased from $100.04 at March 31, 2012, to $102.99 as of June 30, 2012. Total Class 1 subscriptions and redemptions for the period were $1,784,124 and $5,051,617, respectively. Total Class 2 subscriptions and redemptions for the period were $2,008,495 and $2,867,757, respectively. Ending capital at June 30, 2012, was $66,465,756 for Class 1 and $58,580,116 for Class 2. Ending capital at March 31, 2012, was $68,071,953 for Class 1 and $57,678,493 for Class 2.
The Frontier Diversified Series may have both long and short exposure to the Interest Rates, Currencies, Stock Indices, Energies, Metals, and Commodities sectors.
Frontier Diversified Series
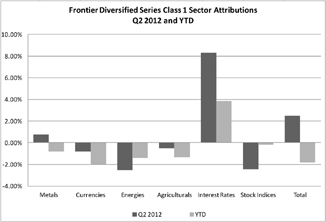 | 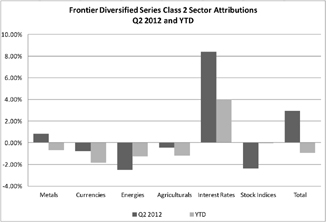 | |
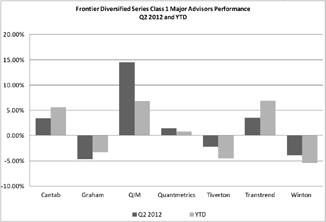 | 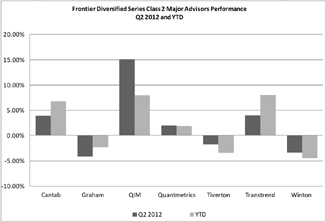 |
Two of the six sectors traded in the Frontier Diversified Series were profitable in Q2 2012. Metals and Interest Rates were profitable while Stock Indices, Currencies, Agriculturals and Energies finished negative for the quarter.
In terms of major CTA performance, four of the seven major CTAs in the Frontier Diversified Series were profitable in Q2 2012. Cantab, Quantmetrics, QIM and Transtrend were profitable while Graham, Tiverton and Winton finished negative for the quarter.
Frontier Masters Series
2013
The Frontier Masters Series – Class 1 NAV lost 6.76% for the three months ended June 30, 2013, net of fees and expenses; the Frontier Masters Series – Class 2 NAV lost 6.34% for the three months ended June 30, 2013, net of fees and expenses.
For the three months ended June 30, 2013 the Frontier Masters Series recorded a net loss on investments of $2,575,152, net investment income of $224,184, and total expenses of $795,435, resulting in a net decrease in Owners’ capital from operations of $3,146,403. The NAV per Unit, Class 1, decreased from $101.64 at March 31, 2013, to $94.74 as of June 30, 2013. The NAV per Unit, Class 2, decreased from $108.60 at March 31, 2013, to $101.71 as of June 30, 2013. Total Class 1 subscriptions and redemptions for the period were $501,889 and $1,512,505, respectively. Total Class 2 subscriptions and redemptions for the period were $10,000 and $1,316,272, respectively. Ending capital at June 30, 2013, was $30,720,823 for Class 1 and $13,671,045 for Class 2. Ending capital at March 31, 2013, was $33,943,369 for Class 1 and $15,911,790 for Class 2.
The Frontier Masters Series may have both long and short exposure to the Interest Rates, Currencies, Stock Indices, Energies, Metals, and Commodities sectors.
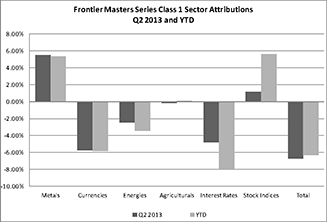 | 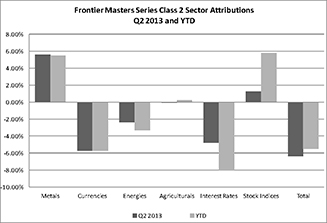 | |
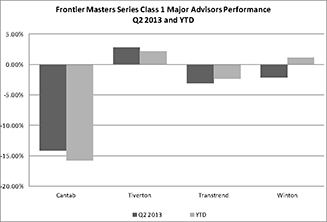 |  |
Two of the six sectors traded in the Frontier Masters Series were profitable in Q2 2013. Metals and Stock Indices were positive while Currencies, Interest Rates, Energies and Agriculturals were negative for the quarter.
Metals, Agriculturals and Stock Indices are positive for the year while Interest Rates, Energies and Currencies are negative for the year.
In terms of major CTA performance, Tiverton finished positive for the quarter while Cantab, Transtrend and Winton finished negative for the quarter. Tiverton and Winton are positive YTD while Cantab and Transtrend are negative YTD.
2012
The Frontier Masters Series – Class 1 NAV gained 1.1% for the three months ended June 30, 2012, net of fees and expenses; the Frontier Masters Series – Class 2 NAV gained 1.5% for the three months ended June 30, 2012, net of fees and expenses.
For the three months ended June 30, 2012, the Frontier Masters Series recorded net gain on investments of $1,870,660, net investment income of $261,367, and total expenses of $945,962, resulting in a net increase in Owners’ capital from operations of $629,198, after non-controlling interests of ($556,867). The NAV per Unit, Class 1, increased from $100.95 at March 31, 2012, to $102.04 as of June 30, 2012. The NAV per Unit, Class 2, increased from $106.02 at March 31, 2012, to $107.65 as of June 30, 2012. Total Class 1 subscriptions and redemptions for the period were $1,984,416 and $979,842, respectively. Total Class 2 subscriptions and redemptions for the period were $248,006 and $652,806, respectively. Ending capital at June 30, 2012, was $36,383,500 for Class 1 and $18,178,556 for Class 2. Ending capital at December 31, 2011, was $35,022,932 for Class 1 and $18,310,152 for Class 2.
The Frontier Masters Series may have both long and short exposure to the Interest Rates, Currencies, Stock Indices, Energies, Metals, and Commodities sectors.
Frontier Masters Series
 | 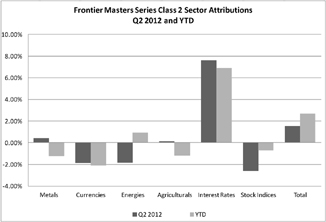 | |
 |  |
Three of the six sectors traded in the Frontier Masters Series were profitable in Q2 2012. Metals, Interest Rates and Agriculturals were positive while Energies, Currencies and Stock Indices were negative for the quarter.
In terms of major CTA performance, two of the four major CTAs in the Frontier Masters Series were profitable during the quarter. Cantab and Transtrend were positive while Winton and Tiverton finished negative for the quarter.
Frontier Long/Short Commodity Series
2013
The Frontier Long/Short Commodity Series – Class 2 NAV lost 7.34% for the three months ended June 30, 2013, net of fees and expenses; the Frontier Long/Short Commodity Series – Class 3 NAV lost 7.34% for the three months ended June 30, 2013, net of fees and expenses; the Frontier Long/Short Commodity Series – Class 1a NAV 7.47% for the three months ended June 30, 2013, net of fees and expenses; the Frontier Long/Short Commodity Series – Class 2a NAV lost 7.07% for the three months ended June 30, 2013, net of fees and expenses; the Frontier Long/Short Commodity Series – Class 3a NAV lost 2.24% for the period ended June 30, 2013, net of fees and expenses.
For the three months ended June 30, 2013, the Frontier Long/Short Commodity Series recorded net loss on investments of $3,603,745, net investment income of $288,183, and total expenses of $869,367, resulting in a net decrease in Owners’ capital from operations of $3,329,202, after non-controlling interests of $855,727. The NAV per Unit, Class 2, decreased from $145.11 at March 31, 2013, to $134.46 as of June 30, 2013. The NAV per Unit, Class 3, decreased from $145.14 at March 31, 2013, to $134.49 as of June 30, 2013. The NAV per Unit, Class 1a, decreased from $107.97 at March 31, 2013, to $99.90 as of June 30, 2013. The NAV per Unit, Class 2a, decreased from $115.29 at March 31, 2013, to $107.14 as of June 30, 2013. The NAV per Unit, Class 3a, decreased from $109.60 at June 17, 2013 (Inception) to $107.14 as of June 30, 2013. Total Class 2 redemptions for the period were $573,095. There were no subscriptions. Total Class 3 redemptions for the period were $2,032,280. There were no subscriptions. Total Class 1a subscriptions
and redemptions for the period were $284,877 and $1,734,830, respectively. Total Class 2a subscriptions and redemptions for the period were $5,000 and $1,971,429, respectively. Ending capital at June 30, 2013, was $4,750,431 for Class 2, $13,159,058 for Class 3, $14,941,599 for Class 1a, $7,499,957 for Class 2a and $34,379 for Class 3a. Ending capital at March 31, 2013, was $5,702,855 for Class 2, $16,256,087 for Class 3, $17,621,991 for Class 1a and $10,120,282 for Class 2a.
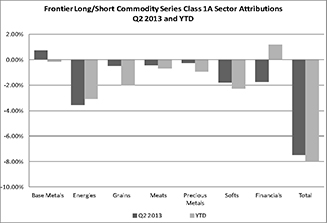 | 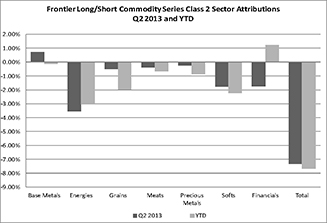 | |
 | 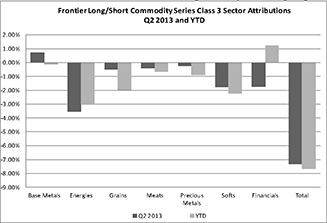 | |
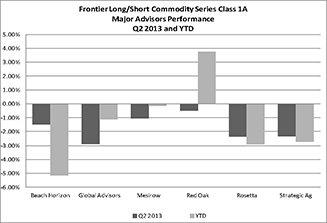 | 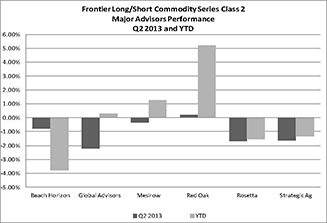 |
 |  |
One of the seven sectors traded in the Frontier Long/Short Commodity Series was profitable in Q2 2013. Base Metals finished positive for the quarter while Energies, Financials, Grains, Meats, Precious Metals and Softs finished negative for the quarter.
Financials are positive YTD while Energies, Base Metals, Grains, Meats, Precious Metals and Softs are negative YTD.
In terms of major CTA performance, one of the six major CTAs in the Frontier Long/Short Commodity Series was profitable in Q2 2013. Red Oak finished positive for the quarter while Global Advisors, Beach Horizon, Rosetta, Strategic Ag and Mesirow were negative for the quarter.
Global Advisors, Mesirow and Red Oak are positive YTD while Beach Horizon, Rosetta and Strategic Ag are negative YTD.
The Frontier Long/Short Commodity Series may have both long and short exposure to the Interest Rates, Currencies, Stock Indices, Energies, Metals, and Commodities sectors, although the majority of the exposure will typically be in the Energies, Metals, and Commodities sectors.
2012
The Frontier Long/Short Commodity Series – Class 1 NAV lost 4.6% for the three months ended June 30, 2012, net of fees and expenses; the Frontier Long/Short Commodity Series – Class 2 NAV lost 4.2% for the three months ended June 30, 2012, net of fees and expenses; the Frontier Long/Short Commodity Series – Class 3 NAV lost 4.2% for the three months ended June 30, 2012, net of fees and expenses; the Frontier Long/Short Commodity Series – Class 1a NAV lost 4.4% for the three months ended June 30, 2012, net of fees and expenses; the Frontier Long/Short Commodity Series – Class 2a NAV lost 4.0% for the three months ended June 30, 2012, net of fees and expenses.
For the three months ended June 30, 2012, the Frontier Long/Short Commodity Series recorded net loss on investments of $938,042, net investment income of $348,055, and total expenses of $1,635,663, resulting in a net decrease in Owners’ capital from operations of $2,927,896, after non-controlling interests of ($702,246). The NAV per Unit, Class 1, decreased from $134.21 at March 31, 2012, to $128.07 as of June 30, 2012. The NAV per Unit, Class 2, decreased from $160.88 at March 31, 2012, to $154.20 as of June 30, 2012. The NAV per Unit, Class 3, decreased from $160.87 at March 31, 2012, to $154.18 as of June 30, 2012. The NAV per Unit, Class 1a, decreased from $120.55 at March 31, 2012, to $115.26 as of June 30, 2012. The NAV per Unit, Class 2a, decreased from $126.57 at March 31, 2012, to $121.54 as of June 30, 2012. Total Class 1 subscriptions and redemptions for the period were $3,616 and $975,091, respectively. Total Class 2 redemptions for the period were $210,496. There were no subscriptions. Total Class 3 subscriptions and redemptions for the period were $858,421 and $1,997,496, respectively. Total Class 1a subscriptions and redemptions for the period were $1,012,507 and $646,287, respectively. Total Class 2a subscriptions and redemptions for the period were $1,765,850 and $251,431, respectively. Ending capital at June 30, 2012, was $417,015 for Class 1, $8,383,574 for Class 2, $25,411,238 for Class 3, $19,564,499 for Class 1a and $12,509,571 for Class 2a. Ending capital at March 31, 2012 was $1,449,541 for Class 1, $8,958,148 for Class 2, $27,652,652 for Class 3, $20,092,488 for Class 1a and $11,501,371 for Class 2a.
The Frontier Long/Short Commodity Series may have both long and short exposure to the Interest Rates, Currencies, Stock Indices, Energies, Metals, and Commodities sectors, although the majority of the exposure will typically be in the Energies, Metals, and Commodities sectors.
Frontier Long/Short Commodity Series
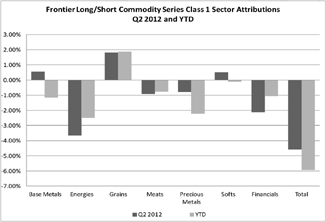 |  | |
 |  | |
 |  |
 |  | |
 |  |
Three of the seven sectors traded in the Frontier Long/Short Commodity Series were profitable in Q2 2012. Base Metals, Grains and Softs were positive while Precious Metals, Energies, Meats and Financials were negative for the quarter.
In terms of major CTA performance, one of the six major CTAs in the Frontier Long/Short Commodity Series was profitable in Q2 2012. Rosetta finished positive while Beach Horizon, Global Advisors, Strategic Ag, Red Oak and Mesirow were negative for the quarter.
Balanced Series
2013
The Balanced Series – Class 1 NAV lost 8.15% for the three months ended June 30, 2013, net of fees and expenses; the Balanced Series – Class 2 NAV lost 7.46% for the three months ended June 30, 2013, net of fees and expenses; the Balanced Series – Class 2a NAV lost 7.10% for the three months ended June 30, 2013, net of fees and expenses; the Balanced Series – Class 3a NAV lost 7.10% for the three months ended June 30, 2013, net of fees and expenses.
For the three months ended June 30, 2013, the Balanced Series recorded net loss on investments of $8,942,702, net investment income of $75,270, and total expenses of $2,071,491, resulting in a net decrease in Owners’ capital from operations of $13,129,934 after non- controlling interests of $2,191,011. The NAV per Unit, Class 1, decreased from $114.20 at March 31, 2013, to $104.89 at June 30, 2013. The NAV per Unit, Class 2, decreased from $147.55 at March 31, 2013, to $136.54 at June 30, 2013. For Class 2a, the NAV per Unit decreased from $123.46 at March 31, 2013, to $114.69 at June 30, 2013. For Class 3a, the NAV per Unit decreased from $123.05 at March 31, 2013, to $114.31at June 30, 2013. Total Class 1 subscriptions and redemptions for the period were $75,683 and $11,942,286, respectively. Total Class 2 subscriptions and redemptions for the period were $3,836 and $5,273,677, respectively. Total Class 2a redemptions for the period were $77,242. There were no subscriptions. Total Class 3a redemptions for the period were $175,416. There were no subscriptions. Ending capital at June 30, 2013, was $108,082,752 for Class 1, $40,246,655 for Class 2, $769,852 for Class 2a and $2,597,739 for Class 3a. Ending capital at March 31, 2013, was $129,567,330 for Class 1, $48,774,407 for Class 2, $906,350 for Class 2a and $2,967,747 for Class 3a.
The Balanced Series may have both long and short exposure to the Interest Rates, Currencies, Stock Indices, Energies, Metals, and Commodities sectors.
 |  | |
 | 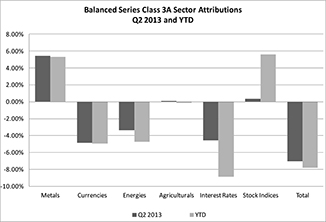 | |
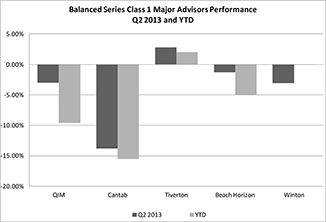 |  | |
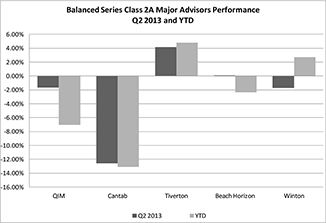 | 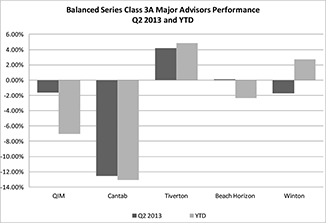 |
Three of the six sectors traded in the Balanced Series were profitable in Q2 2013. The Stock Indices, Metals and Agriculturals were profitable while Interest Rates, Currencies and Energies finished negative for the quarter.
The Metals and Stock Indices sectors are positive YTD while Interest Rates, Agriculturals, Currencies and Energies are negative YTD.
In terms of major CTA performance, Tiverton was positive for the quarter. Tiverton and Winton are positive YTD. Beach, Cantab, QIM and Winton finished negative for the quarter. QIM, Cantab and Beach Horizon are negative YTD.
2012
The Balanced Series – Class 1 NAV gained 3.0% for the three months ended June 30, 2012, net of fees and expenses; the Balanced Series – Class 1a NAV gained 4.1% for the three months ended June 30, 2012, net of fees and expenses; the Balanced Series – Class 2 NAV gained 3.7% for the three months ended June 30, 2012, net of fees and expenses; the Balanced Series – Class 2a NAV gained 4.2% for the three months ended June 30, 2012, net of fees and expenses; the Balanced Series – Class 3a NAV gained 3.8% for the three months ended June 30, 2012, net of fees and expenses.
For the three months ended June 30, 2012, the Balanced Series recorded net gain on investments of $20,087,572, net investment income of $35,188, and total expenses of $5,474,886, resulting in a net increase in Owners’ capital from operations of $7,375,812 after non-controlling interests of ($7,272,062). The NAV per Unit, Class 1, increased from $119.12 at March 31, 2012, to $122.65 at June 30, 2012. For Class 1a, the NAV per Unit increased from $103.87 at March 31, 2012, to $108.13 at June 30, 2012. The NAV per Unit, Class 2, increased from $149.44 at March 31, 2012, to $155.01 at June 30, 2012. For Class 2a, the NAV per Unit increased from $123.84 at March 31, 2012, to $128.99 at June 30, 2012. For Class 3a, the NAV per Unit increased from $123.85 at March 31, 2012, to $128.54 at June 30, 2012. Total Class 1 subscriptions and redemptions for the period were $118,925 and $8,018,675, respectively. Total Class 1a subscriptions and redemptions for the period were $143 and $252,069, respectively. Total Class 2 subscriptions and redemptions for the period were $3,937 and $3,284,044, respectively. Total Class 2a redemptions for the period were $487,201. There were no subscriptions. Total Class 3a subscriptions and redemptions for the period were $246,832 and $487,756, respectively. Ending capital at June 30, 2012, was $164,804,193 for Class 1, $249,991 for Class 1a, $57,348,959 for Class 2, $1,111,687 for Class 2a and $4,040,685 for Class 3a. At March 31, 2012, ending capital was $167,728,802 for Class 1, $480,341 for Class 1a, $58,468,021 for Class 2, $1,526,349 for Class 2a, and $4,136,098 for Class 3a.
The Balanced Series may have both long and short exposure to the Interest Rates, Currencies, Stock Indices, Energies, Metals, and Commodities sectors.
Balanced Series
 |  |
 |  | |
 |  | |
 |  | |
 |  |
Two of the six sectors traded in the Balanced Series were profitable in Q2 2012. Metals and Interest Rates were profitable while Stock Indices, Currencies, Agriculturals and Energies finished negative for the quarter.
In terms of major CTA performance, two of the five major CTAs in the Balanced Series were profitable in Q2 2012. QIM and Cantab were profitable while Winton, Tiverton and Beach Horizon finished negative for the quarter.
Frontier Select Series (formerly Tiverton/Graham/Transtrend Series)
2013
The Frontier Select Series – Class 1 NAV lost 1.04% for the three months ended June 30, 2013, net of fees and expenses; the Frontier Select Series – Class 2 NAV lost 0.30% for the three months ended June 30, 2013, net of fees and expenses.
For the three months ended June 30, 2013, the Frontier Select Series recorded net gain on investments of $31,845, net investment income of $87,463, and total expenses of $334,428, resulting in a net decrease in Owners’ capital from operations of $215,120. The NAV per Unit, Class 1, increased from $81.86 at March 31, 2013, to $81.01 as of June 30, 2013. The NAV per Unit, Class 2, increased from $104.35 at March 31, 2013, to $104.04 as of June 30, 2013. Total Class 1 subscriptions and redemptions for the period were $4,345 and $1,866,358, respectively. Total Class 2 redemptions for the period were $198,703. There were no subscriptions. Ending capital at June 30, 2013, was $19,323,354 for Class 1 and $2,739,675 for Class 2. Ending capital at March 31, 2013, was $21,393,158 for Class 1 and $2,945,707 for Class 2.
The Frontier Select Series may have both long and short exposure to the Interest Rates, Currencies, Stock Indices, Energies, Metals, and Commodities sectors.
 | 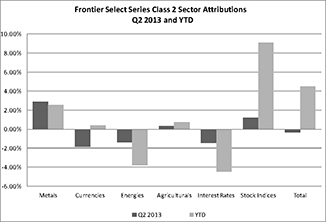 | |
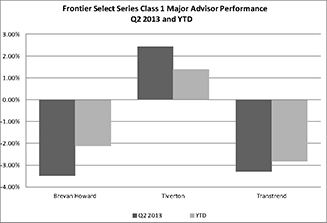 | 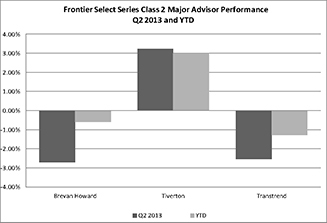 |
Three of the six sectors traded in the Frontier Select Series were profitable in Q2 2013. Metals, Agriculturals and Stock Indices were positive while Interest Rates, Currencies and Energies were negative for the quarter.
Currencies, Metals, Agriculturals and Stock Indices are positive YTD while Interest Rates and Energies are negative YTD.
In terms of major CTA performance Tiverton finished positive for the quarter and is positive YTD while Brevan Howard and Transtrend finished negative for the quarter and are negative YTD.
The “Tiverton/Graham/Transtrend Series” name was changed to the “Frontier Select Series.” Graham was replaced by Brevan Howard as a major advisor in the Frontier Select Series.
2012
The Frontier Select Series – Class 1 NAV lost 3.7% for the three months ended June 30, 2012, net of fees and expenses; the Frontier Select Series – Class 2 NAV lost 3.5% for the three months ended June 30, 2012, net of fees and expenses.
For the three months ended June 30, 2012, the Frontier Select Series recorded net loss on investments of $648,067, net investment income of $65,518, and total expenses of $696,960, resulting in a net decrease in Owners’ capital from operations of $1,279,509. The NAV per Unit, Class 1, decreased from $89.63 at March 31, 2012, to $86.29 as of June 30, 2012. The NAV per Unit, Class 2, decreased from $110.92 at March 31, 2012, to $107.04 as of June 30, 2012. Total Class 1 subscriptions and redemptions for the period were $8,542 and $2,080,907, respectively. Total Class 2 redemptions for the period were $116,973. There were no subscriptions. Ending capital at June 30, 2012, was $28,912,334 for Class 1 and $3,898,644 for Class 2. Ending capital at March 31, 2012, was $32,122,523 for Class 1 and $4,157,302 for Class 2.
The Frontier Select Series may have both long and short exposure to the Interest Rates, Currencies, Stock Indices, Energies, Metals, and Commodities sectors.
Frontier Select Series (formerly Tiverton/Graham/Transtrend Series)
 | 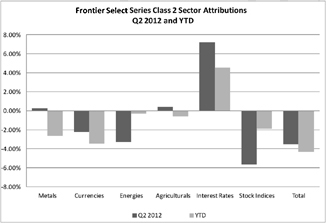 | |
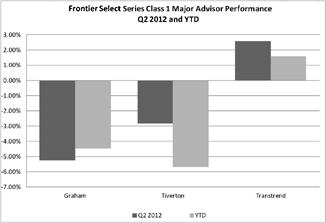 |  |
Three of the six sectors traded in the Frontier Select Series were profitable in Q2 2012. Metals, Agriculturals and Interest Rates were positive while Stock Indices, Currencies and Energies were negative for the quarter.
In terms of major CTA performance Transtrend finished positive while Tiverton and Graham finished negative for the quarter.
Winton Series
2013
The Winton Series – Class 1 NAV lost 2.72% for the three months ended June 30, 2013, net of fees and expenses; the Winton Series – Class 2 NAV lost 2.00% for the three months ended June 30, 2013, net of fees and expenses.
For the three months ended June 30, 2013, the Winton Series recorded net loss on investments of $529,952, net investment income of $94,585, and total expenses of $571,933, resulting in a net decrease in Owners’ capital from operations of $1,007,300. The NAV per Unit, Class 1, decreased from $136.53 at March 31, 2013, to $132.81 as of June 30, 2013. The NAV per Unit, Class 2, decreased from $166.52 at March 31, 2013, to $163.19 as of June 30, 2013. Total Class 1 subscriptions for the period were $47,149 and redemptions were $1,000,918. Total Class 2 redemptions for the period were $168,928. There were no subscriptions. Ending capital at June 30, 2013, was $28,506,866 for Class 1 and $10,353,328 for Class 2. Ending capital at March 31, 2013, was $30,262,765 for Class 1 and $10,727,426 for Class 2.
 |  |
Two of the six sectors traded in the Winton Series were profitable in Q2 2013. Metals and Stock Indices were positive while Currencies, Agriculturals, Energies and Interest Rates were negative for the quarter.
Metals, Agriculturals and Stock Indices are positive YTD while Currencies, Energies and Interest Rates are negative YTD.
The Winton Series may have both long and short exposure to the Interest Rates, Currencies, Stock Indices, Energies, Metals, and Commodities sectors.
2012
The Winton Series – Class 1 NAV lost 4.6% for the three months ended June 30, 2012, net of fees and expenses; the Winton Series – Class 2 NAV lost 3.8% for the three months ended June 30, 2012, net of fees and expenses.
For the three months ended June 30, 2012, the Winton Series recorded net loss on investments of $1,599,658, net investment income of $132,557, and total expenses of $613,194, resulting in a net decrease in Owners’ capital from operations of $2,080,295. The NAV per Unit, Class 1, decreased from $138.00 at March 31, 2012, to $131.72 as of June 30, 2012. The NAV per Unit, Class 2, decreased from $163.35 at March 31, 2012, to $157.12 as of June 30, 2012. Total Class 1 subscriptions for the period were $52,858 and redemptions were $835,659. Total Class 2 redemptions for the period were $463,695. There were no subscriptions. Ending capital at June 30, 2012, was $34,178,150 for Class 1 and $10,631,266 for Class 2. Ending capital at March 31, 2012, was $36,610,938 for Class 1 and $11,525,269 for Class 2.
The Winton Series may have both long and short exposure to the Interest Rates, Currencies, Stock Indices, Energies, Metals, and Commodities sectors.
Winton Series
 | 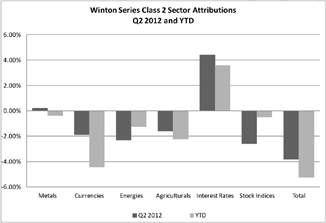 |
Two of the six sectors traded in the Winton Series were profitable in Q2 2012. Metals and Interest Rates were positive while Stock Indices, Currencies, Agriculturals and Energies were negative for the quarter.
Frontier Heritage Series (formerly Winton/Graham Series)
2013
The Frontier Heritage Series – Class 1 NAV lost 3.49% for the three months ended June 30, 2013, net of fees and expenses; the Frontier Heritage Series – Class 2 NAV lost 2.76% for the three months ended June 30, 2013, net of fees and expenses.
For the three months ended June 30, 2013, the Frontier Heritage Series recorded net loss on investments of $414,134, net investment income of $35,758, and total expenses of $227,596, resulting in a net decrease in Owners’ capital from operations of $605,972. The NAV per Unit, Class 1, decreased from $101.63 at March 31, 2013, to $98.08 as of June 30, 2013. The NAV per Unit, Class 2, decreased from $130.65 at March 31, 2013, to $127.04 as of June 30, 2013. Total Class 1 subscriptions for the period were $11,676 and redemptions were $1,993,164. Total Class 2 redemptions for the period were $112,013. There were no subscriptions. Ending capital at June 30, 2013, was $13,877,265 for Class 1 and $3,605,870 for Class 2. Ending capital at March 31, 2013, was $16,362,182 for Class 1 and $3,820,426 for Class 2.
The Frontier Heritage Series may have both long and short exposure to the Interest Rates, Currencies, Stock Indices, Energies, Metals, and Commodities sectors.
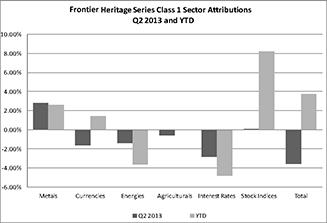 | 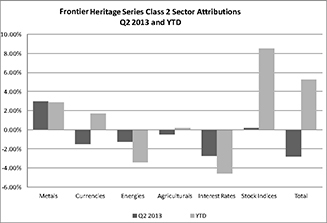 |
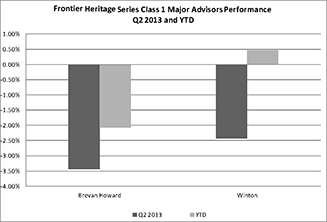 | 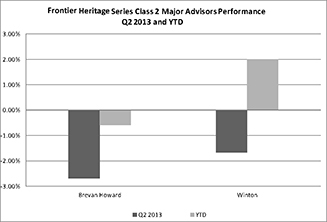 |
Two of the six sectors traded in the Frontier Heritage Series were profitable in Q2 2013. Metals and Stock Indices were positive while Agriculturals, Interest Rates, Currencies and Energies were negative for the quarter.
Currencies, Metals, Agriculturals and Stock Indices are positive YTD while Interest Rates and Energies are negative YTD.
In terms of major CTA performance, both Brevan Howard and Winton finished negative for the quarter . Winton is positive YTD while Brevan Howard is negative YTD.
In terms of major CTA performance, both Brevan Howard and Winton finished positive for the quarter and are positive YTD.
The “Winton/Graham Series” name was changed to the “Frontier Heritage Series.” Graham was replaced by Brevan Howard as a major advisor in the Frontier Heritage Series.
2012
The Frontier Heritage Series – Class 1 NAV lost 8.0% for the three months ended June 30, 2012, net of fees and expenses; the Frontier Heritage Series – Class 2 NAV lost 7.3% for the three months ended June 30, 2012, net of fees and expenses.
For the three months ended June 30, 2012, the Frontier Heritage Series recorded net loss on investments of $1,646,353, net investment income of $32,021, and total expenses of $498,075, resulting in a net decrease in Owners’ capital from operations of $2,112,407. The NAV per Unit, Class 1, decreased from $104.37 at March 31, 2012, to $96.05 as of June 30, 2012. The NAV per Unit, Class 2, decreased from $130.23 at March 31, 2012, to $120.78 as of June 30, 2012. Total Class 1 subscriptions for the period were $15,799 and redemptions were $1,034,117. Total Class 2 redemptions for the period were $284,069. There were no subscriptions. Ending capital at June 30, 2012, was $19,729,727 for Class 1 and $4,592,671 for Class 2. Ending capital at March 31, 2012, was $22,496,784 for Class 1 and $5,240,408 for Class 2.
The Frontier Heritage Series may have both long and short exposure to the Interest Rates, Currencies, Stock Indices, Energies, Metals, and Commodities sectors.
Frontier Heritage Series (formerly Winton/Graham Series)
 | 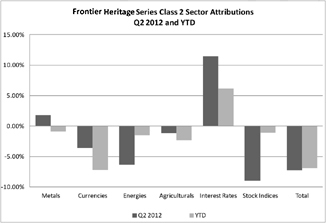 | |
 | 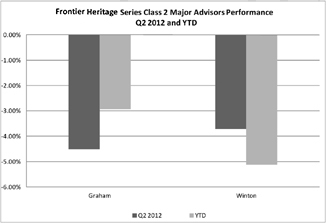 |
Two of the six sectors traded in the Frontier Heritage Series were profitable in Q2 2012. Metals and Interest Rates were positive while Stock Indices, Energies, Agriculturals and Currencies were negative for the quarter.
In terms of major CTA performance, both Graham and Winton were negative for the quarter.
Six Months Ended June 30, 2013 Compared to Six Months Ended June 30, 2012.
Frontier Diversified Series
2013
The Frontier Diversified Series – Class 1 NAV lost 9.38% for the six months ended June 30, 2013, net of fees and expenses; the Frontier Diversified Series – Class 2 NAV lost 8.59% for the six months ended June 30, 2012, net of fees and expenses.
For the six months ended June 30, 2013 the Frontier Diversified Series recorded a net loss on investments of $7,202,316, net investment income of $938,684, and total expenses of $2,829,851, resulting in a net decrease in Owners’ capital from operations of $9,093,483.$16,425,594. The NAV per Unit, Class 1, decreased from $94.40 at December 31, 2012, to $85.55$78.13 as of JuneSeptember 30, 2013. The NAV per Unit, Class 2, decreased from $100.48 at December 31, 2012, to $91.85$84.26 as of JuneSeptember 30, 2013. Total Class 1 subscriptions and redemptions for the period were $1,276,358$1,463,020 and $10,253,451,$18,058,110, respectively. Total Class 2 subscriptions and redemptions for the period were $1,277,401$2,709,517 and $8,618,264,$16,887,983, respectively. Ending capital at JuneSeptember 30, 2013, was $45,238,450$33,842,947 for Class 1 and $44,531,683$34,139,475 for Class 2. Ending capital at December 31, 2012, was $58,999,936 for Class 1 and $56,181,636 for Class 2.
The Frontier Diversified Series may have both long and short exposure to the Interest Rates, Currencies, Stock Indices, Energies, Metals, and Commodities sectors.
 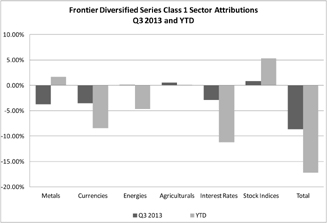 | 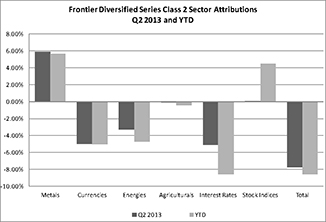 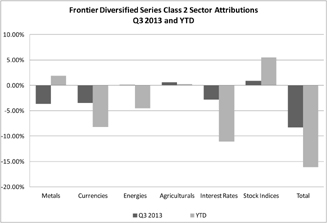 | |
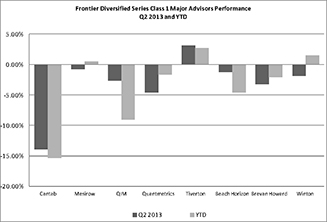 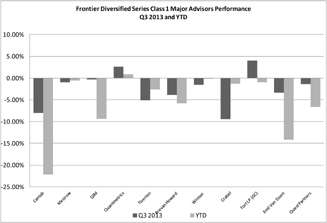 | 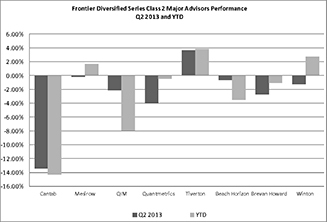 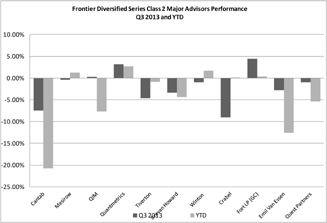 |
TwoThree of the six sectors traded in the Frontier Diversified Series were profitable in Q23Q 2013. Stock Indices, Agriculturals and MetalsEnergies were profitable while Interest Rates, Currencies Agriculturals and EnergiesMetals finished negative for the quarter.
The Stock Indices, Agriculturals and Metals sectors are positive YTD while Interest Rates, Currencies Agriculturals and Energies are negative YTD.
In terms of major CTA performance One ofQIM, Quantmetrics and Fort (GC) finished positive for the eight major CTAs in the Frontier Diversified Series was profitable in Q2 2013 .quarter. Cantab, Mesirow, Tiverton, was profitable while Cantab, QIM, Beach Horizon, Mesirow, Quantmetrics, Brevan Howard, Winton, Crabel, Emil Van Essen and WintonQuest Partners finished negative infor the quarter. In terms of YTD performance Mesirow, TivertonQuantmetrics, Winton, Crabel and WintonFort (GC) are positive YTD while Cantab, QIM, Quantmetrics, Beach Horizon andTiverton, Brevan Howard, Emil Van Essen and Quest Partners are negative YTD.
Graham was replaced by Brevan Howard as a major advisor in the Diversified Series. Mesirow was added as a major advisor to the Diversified Series.
2012
The Frontier Diversified Series – Class 1 NAV lost 1.8%1.2% for the sixnine months ended JuneSeptember 30, 2012, net of fees and expenses; the Frontier Diversified Series – Class 2 NAV lost 0.9%0.3% for the sixnine months ended JuneSeptember 30, 2012, net of fees and expenses.
For the sixnine months ended JuneSeptember 30, 2012 the Frontier Diversified Series recorded a net gain on investments of $1,855,107,$4,943,176, net investment income of $1,143,240,$1,668,101, and total expenses of $4,911,494,$7,914,352, resulting in a net decrease in Owners’ capital from operations of $1,913,147.$1,303,075. The NAV per Unit, Class 1, decreased from $99.40 at December 31, 2011, to $97.60$97.82 as of JuneSeptember 30, 2012. The NAV per Unit, Class 2, decreased from $103.96 at December 31, 2011, to $102.99$103.66 as of JuneSeptember 30, 2012. Total Class 1 subscriptions and redemptions for the period were $3,659,657$4,342,057 and $8,272,003,$11,099,447, respectively. Total Class 2 subscriptions and redemptions for the period were $4,125,255$5,461,913 and $6,527,494,$10,702,689, respectively. Ending capital at JuneSeptember 30, 2012, was $66,465,756$64,525,103 for Class 1 and $58,580,116$56,147,260 for Class 2. Ending capital at December 31, 2011, was $72,424,906 for Class 1 and $61,548,698 for Class 2.
The Frontier Diversified Series may have both long and short exposure to the Interest Rates, Currencies, Stock Indices, Energies, Metals, and Commodities sectors.
Frontier Diversified Series
 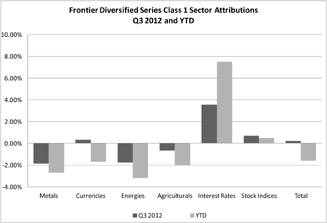 |  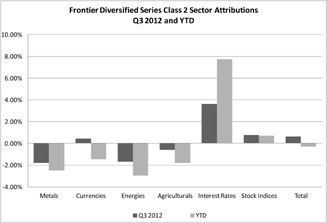 | |
 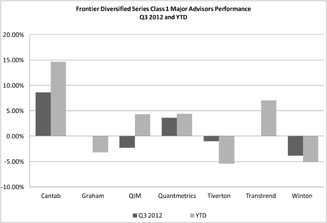 |  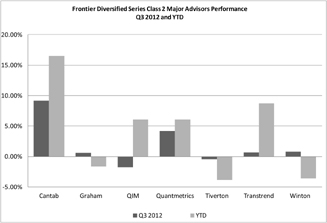 |
TwoThree of the six sectors traded in the Frontier Diversified Series were profitable in Q23Q 2012. MetalsCurrencies, Stock Indices and Interest Rates were profitable while Stock Indices, Currencies,Metals, Agriculturals and Energies finished negative for the quarter. One
Two of the six sectors traded in the Frontier Diversified Series isare profitable year to date. The Interest Rates sector isand Stock Indices sectors are profitable while Stock Indices, Currencies, Metals, Agriculturals and Energies are negative year to date.
In terms of major CTA performance, fourfive of the seven major CTAs in the Frontier Diversified Series were profitable in Q23Q 2012. Cantab, Graham, Quantmetrics, QIMWinton and Transtrend were profitable while Graham, Tiverton and WintonQIM finished negative for the quarter. Four of the seven major CTAs in the Frontier Diversified Series are profitable year to date. Cantab, QIM, Quantmetrics Transtrend, QIM and CantabTranstrend are profitable while Tiverton, Graham Tiverton and Winton are negative year to date.
Frontier Masters Series
2013
The Frontier Masters Series – Class 1 NAV lost 6.30%13.09% for the sixnine months ended JuneSeptember 30, 2013, net of fees and expenses; the Frontier Masters Series – Class 2 NAV gained 5.48%lost 11.95% for the sixnine months ended JuneSeptember 30, 2013, net of fees and expenses.
For the sixnine months ended JuneSeptember 30, 2013 the Frontier Masters Series recorded a net loss on investments of $1,692,118,$4,204,428, net investment income of $455,372,$647,376, and total expenses of $1,588,128,$2,312,658, resulting in a net decrease in Owners’ capital from operations of $2,824,874.$5,869,710. The NAV per Unit, Class 1, decreased from $101.11 at December 31, 2012, to $94.74$87.87 as of JuneSeptember 30, 2013. The NAV per Unit, Class 2, increaseddecreased from $107.61 at December 31, 2012, to $101.71$94.75 as of JuneSeptember 30, 2013. Total Class 1 subscriptions and redemptions for the period were $1,650,028$2,545,424 and $3,488,791,$6,636,880, respectively. Total Class 2 subscriptions and redemptions for the period were $482,028$594,083 and $2,912,736,$4,558,265, respectively. Ending capital at JuneSeptember 30, 2013, was $30,720,823$26,810,277 for Class 1 and $13,671,045$11,250,533 for Class 2. Ending capital at December 31, 2012, was $34,603,499 for Class 1 and $16,882,659 for Class 2.
The Frontier Masters Series may have both long and short exposure to the Interest Rates, Currencies, Stock Indices, Energies, Metals, and Commodities sectors.
 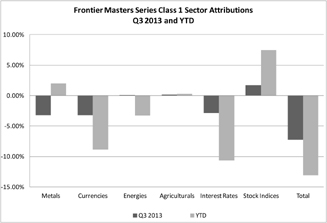 | 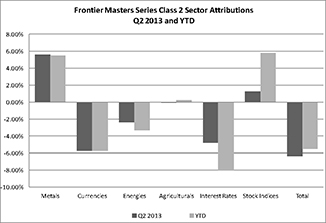 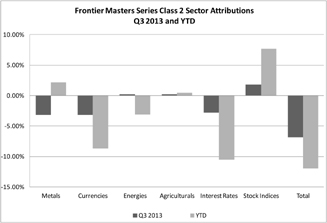 | |
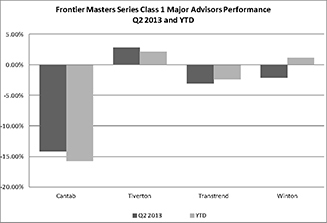 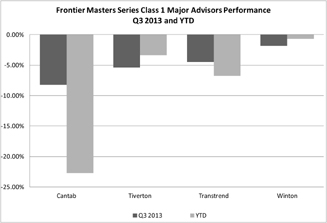 | 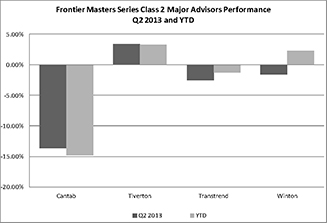 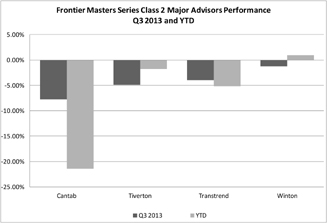 |
TwoThree of the six sectors traded in the Frontier Masters Series were profitable in Q23Q 2013. MetalsStock Indices, Agriculturals and Stock IndicesEnergies were positive while Currencies, Interest Rates Energies and AgriculturalsMetals were negative for the quarter.
Metals, Agriculturals and Stock Indices are positive for the year while Interest Rates, Energies and Currencies are negative for the year.
In terms of major CTA performance Cantab, Tiverton, finished positive for the quarter while Cantab, Transtrend and Winton finished negative for the quarter. In terms of YTD performance Winton is positive while Tiverton, Transtrend and Winton are positive YTD while Cantab and Transtrend are negative YTD.
2012
The Frontier Masters Series – Class 1 NAV gained 1.8%4.7% for the sixnine months ended JuneSeptember 30, 2012, net of fees and expenses; the Frontier Masters Series – Class 2 NAV gained 2.7%6.1% for the sixnine months ended JuneSeptember 30, 2012, net of fees and expenses.
For the sixnine months ended JuneSeptember 30, 2012 the Frontier Masters Series recorded a net gain on investments of $2,875,675,$5,674,134, net investment income of $529,226,$780,501, and total expenses of $1,803,469,$3,122,108, resulting in a net increase in Owners’ capital from operations of $1,074,044$2,656,430 after non-controlling interests of ($527,388)676,097). The NAV per Unit, Class 1, increased from $100.25 at December 31, 2011, to $102.04$104.92 as of JuneSeptember 30, 2012. The NAV per Unit, Class 2, increased from $104.83 at December 31, 2011, to $107.65$111.17 as of JuneSeptember 30, 2012. Total Class 1 subscriptions and redemptions for the period were $3,789,952$6,542,621 and $2,084,976,$2,699,710, respectively. Total Class 2 subscriptions and redemptions for the period were $462,006$1,584,876 and $1,503,967,$3,051,076, respectively. Ending capital at JuneSeptember 30, 2012, was $36,383,500$39,500,593 for Class 1 and $18,178,556$18,357,545 for Class 2. Ending capital at December 31, 2011, was $34,090,136 for Class 1 and $18,734,861 for Class 2.
The Frontier Masters Series may have both long and short exposure to the Interest Rates, Currencies, Stock Indices, Energies, Metals, and Commodities sectors.
Frontier Masters Series
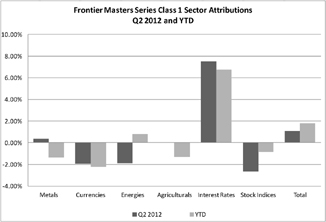 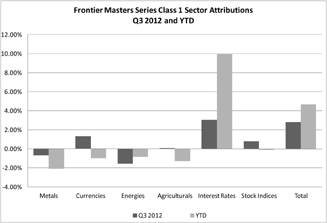 |  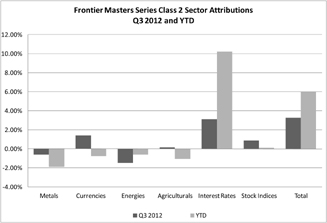 | |
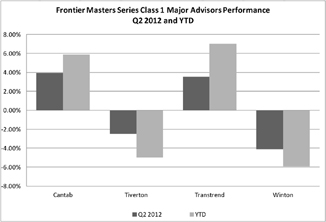  | 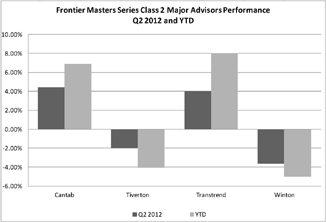 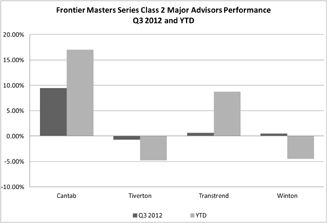 |
ThreeFour of the six sectors traded in the Frontier Masters Series were profitable in Q23Q 2012. Metals,Currencies, Agriculturals, Interest Rates and AgriculturalsStock Indices were positive while Energies Currencies and Stock IndicesMetals were negative for the quarter.
Two of the six sectors traded in the Frontier Masters Series are profitable year to date. Interest Rates and EnergiesStock Indices are profitable while Stock Indices,Energies, Currencies, Metals and Agriculturals are negative year to date.
In terms of major CTA performance, twothree of the four major CTAs in the Frontier Masters Series were profitable during the quarter. Cantab, Transtrend and TranstrendWinton were positive while Winton and Tiverton finished negative for the quarter. Two of the four major CTAs in the Frontier Masters Series are profitable year to date. Cantab and Transtrend are profitable while Tiverton and Winton are negative year to date.
Frontier Long/Short Commodity Series
2013
The Frontier Long/Short Commodity Series –Class 2 NAV lost 7.68%13.43% for the sixnine months ended JuneSeptember 30, 2013, net of fees and expenses; the Frontier Long/Short Commodity Series – Class 3 NAV lost 7.69%13.43% for the sixnine months ended JuneSeptember 30, 2013, net of fees and expenses; the Frontier Long/Short Commodity Series – Class 1a NAV lost 7.99%13.80% for the sixnine months ended JuneSeptember 30, 2013, net of fees and expenses; the Frontier Long/Short Commodity Series – Class 2a NAV lost 7.20%12.65% for the sixnine months ended JuneSeptember 30, 2013, net of fees and expenses– Class 3a NAV lost 2.24%7.93% for the sixnine months ended JuneSeptember 30, 2013, net of fees and expenses.
For the sixnine months ended JuneSeptember 30, 2013, the Frontier Long/Short Commodity Series recorded net loss on investments of $4,975,201,$8,378,686, net investment income of $585,282,$834,637, and total expenses of $1,815,455,$2,551,466, resulting in a net decrease in Owners’ capital from operations of $3,523,930,$5,807,561, after non-controlling interests of $2,681,444.$4,287,954. The NAV per Unit, Class 2, decreased from $145.65 at December 31, 2012, to $134.46$126.09 as of JuneSeptember 30, 2013. The NAV per Unit, Class 3, decreased from $145.69 at December 31, 2012, to $134.49$126.12 as of JuneSeptember 30, 2012. The NAV per Unit, Class 1a, decreased from $108.58 at December 31, 2012, to $99.90$93.60 as of JuneSeptember 30, 2013. The NAV per Unit, Class 2a decreased from $115.45 at December 31, 2012, to $107.15$100.84 as of JuneSeptember 30, 2013. The NAV per Unit, Class 3a, decreased from $109.60 at JuneSeptember 17, 2013 (Inception), to $107.15$100.91 as of JuneSeptember 30, 2013. Total Class 2 redemptions for the period were
$1,741,073. $2,265,262. There were no subscriptions. Total Class 3 redemptions for the period were $5,482,870, respectively.$6,530,834. There were no subscriptions. Total Class 1a subscriptions and redemptions for the period were $639,187$676,187 and $3,357,302,$6,223,643, respectively. Total Class 2a subscriptions and redemptions for the period were $226,400$251,400 and $2,935,637,$5,811,078, respectively. Total Class 3a subscriptions for the period were $35,168.$133,866. There were no Class 3a redemptions. Ending capital at JuneSeptember 30, 2013, was $4,750,431$3,936,336 for Class 2, $13,159,058$11,321,675 for Class 3, $14,941,599$11,243,674 for Class 1a, $7,499,957$4,306,663 for Class 2a and $34,379$128,218 for Class 3a. Ending capital at December 31, 2012, was $6,898,785 for Class 2, $19,761,047 for Class 3, $18,983,538 for Class 1a and $10,882,111 for Class 2a.
The Frontier Long/Short Commodity Series may have both long and short exposure to the Interest Rates, Currencies, Stock Indices, Energies, Metals, and Commodities sectors, although the majority of the exposure will typically be in the Energies, Metals, and Commodities sectors. negative YTD.
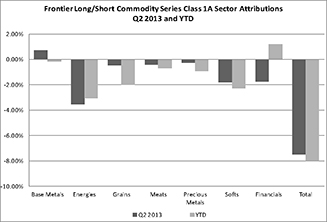 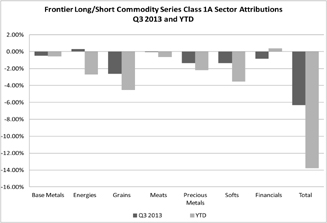 | 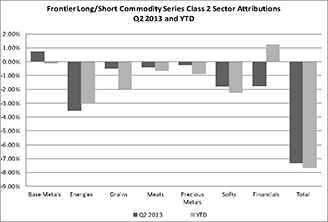 | |
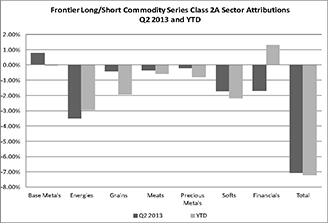 | 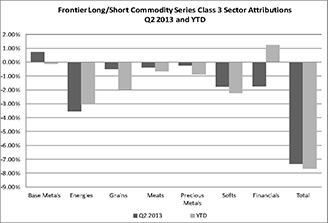 | |
 |  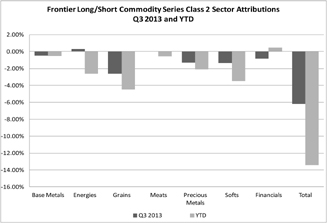 |
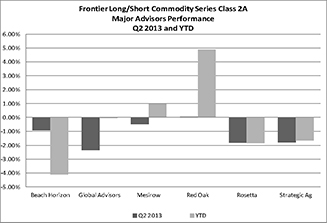 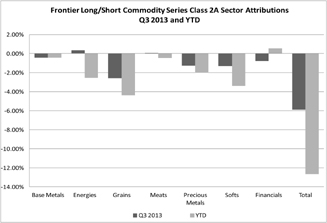 | 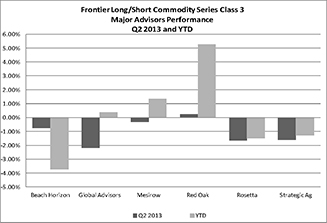 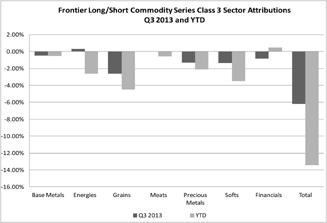 | |
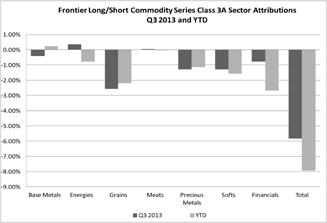 | ||
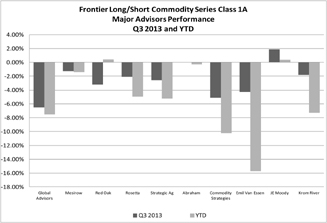 | 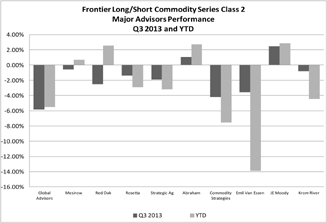 | |
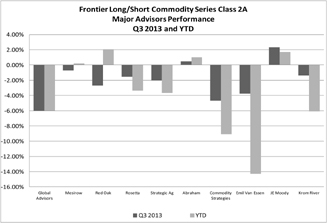 |  |
One
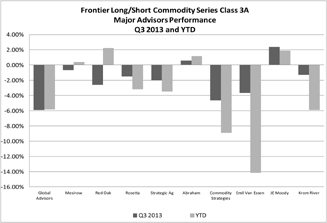
Two of the seven sectors traded in the Frontier Long/Short Commodity Series was profitable in Q23Q 2013. Base MetalsEnergies and Meats finished positive for the quarter while Energies,Base Metals, Financials, Grains, Meats, Precious Metals and Softs finished negative for the quarter.
Financials are positive YTD while Energies, Base Metals, Grains, Meats, Precious Metals and Softs are negative YTD.
In terms of major CTA performance one of the six major CTAs in the Frontier Long/Short Commodity Series was profitable in Q2 2013. Red OakAbraham and JE Moody finished positive for the quarter while Global Advisors, Beach Horizon,Mesirow, Red Oak, Rosetta, Strategic Ag, Commodity Strategies, Emil Van Essen and MesirowKrom River were negative for the quarter.
Global Advisors,In terms of YTD performance Mesirow, and Red Oak, Abraham, and JE Moody are positive YTD while Beach Horizon,Global Advisors, Rosetta, and Strategic Ag, Commodity Strategies, Emil Van Essen and Krom River are negative YTD.
2012
The Frontier Long/Short Commodity Series – Series—Class 1 NAV lost 5.9%0.5% for the sixnine months ended JuneSeptember 30, 2012, net of fees and expenses; the Frontier Long/Short Commodity Series – Series—Class 2 NAV lost 4.8%gained 2.0% for the sixnine months ended JuneSeptember 30, 2012, net of fees and expenses; the Frontier Long/Short Commodity Series – Series—Class 3 NAV lost 4.8%gained 2.1% for the sixnine months ended JuneSeptember 30, 2012, net of fees and expenses; the Frontier Long/Short Commodity Series – Series—Class 1a NAV lost 5.3%gained 1.4% for the sixnine months ended JuneSeptember 30, 2012, net of fees and expenses; the Frontier Long/Short Commodity Series – Series—Class 2a NAV lost 4.5%gained 2.7% for the sixnine months ended JuneSeptember 30, 2012, net of fees and expenses.
For the sixnine months ended JuneSeptember 30, 2012, the Frontier Long/Short Commodity Series recorded net loss on investments of $6,670,177,$5,684,584, net investment income of $711,631,$1,047,821, and total expenses of $2,956,133,$4,789,770, resulting in a net decreaseincrease in Owners’ capital from operations of $3,460,839,$1,343,755, after non-controlling interests of $5,453,840.$10,770,288. The NAV per Unit, Class 1, decreased from $136.13 at December 31, 2011, to $128.07$135.41 as of JuneSeptember 30, 2012. The NAV per Unit, Class 2, decreasedincreased from $161.97 at December 31, 2011, to $154.20$165.28 as of JuneSeptember 30, 2012. The NAV per Unit, Class 3, decreasedincreased from $161.96 at December 31, 2011, to $154.18$165.33 as of JuneSeptember 30, 2012. The NAV per Unit, Class 1a, decreasedincreased from $121.71 at December 31, 2011, to $115.26$123.42 as of JuneSeptember 30, 2012. The NAV per Unit, Class 2a, decreasedincreased from $127.23 at December 31, 2011, to $121.54$130.64 as of JuneSeptember 30, 2012. Total Class 1 subscriptions and redemptions for the period were $9,089$9,530 and $3,665,155,$4,103,565, respectively. Total Class 2 redemptions for the period were $380,536.$403,979. There were no subscriptions. Total Class 3 subscriptions and redemptions for the period were $3,487,095$3,925,506 and $4,588,095,$7,604,158, respectively. Total Class 1a subscriptions and redemptions for the period were $2,867,314$3,763,103 and $1,108,821,$1,759,072, respectively. Total Class 2a subscriptions and redemptions for the period were $2,634,003$3,322,503 and $468,884,$2,211,990, respectively. Ending capital at JuneSeptember 30, 2012, was $417,015$0 for Class 1, $8,383,574$8,962,935 for Class 2, $25,411,238$24,676,215 for Class 3, $19,564,499$21,208,126 for Class 1a and $12,509,571$12,395,083 for Class 2a. Ending capital at December 31, 2011, was $4,159,047 for Class 1, $9,188,762 for Class 2, $27,810,058 for Class 3, $18,891,395 for Class 1a and $10,911,464 for Class 2a.
The Frontier Long/Short Commodity Series may have both long and short exposure to the Interest Rates, Currencies, Stock Indices, Energies, Metals, and Commodities sectors, although the majority of the exposure will typically be in the Energies, Metals, and Commodities sectors.
Frontier Long/Short Commodity Series
 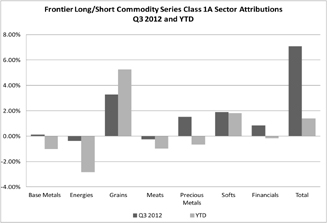 |   | |
 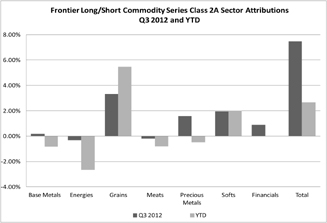 |   | |
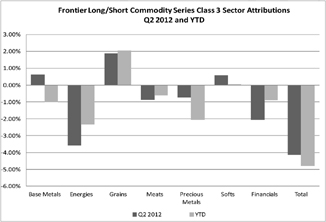 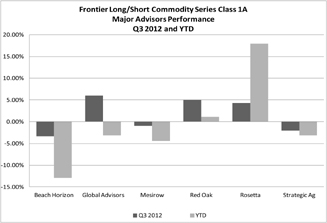 | 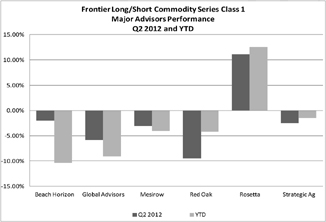 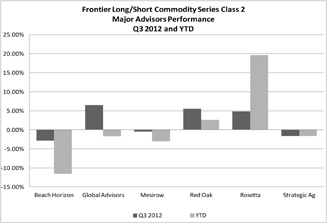 | |
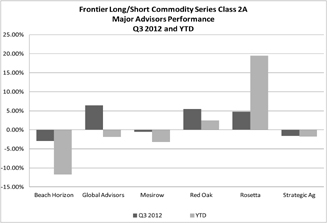 | 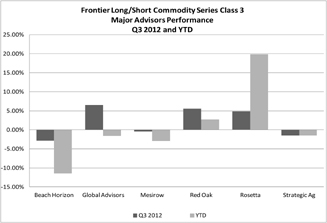 |
 | 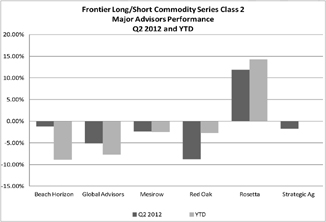 | |
 |  |
ThreeFive of the seven sectors traded in the Frontier Long/Short Commodity Series were profitable in Q23Q 2012. Base Metals, Grains, Precious Metals, Financials and Softs were positive while Precious Metals, Energies Meats and FinancialsMeats were negative for the quarter.
Two of the seven sectors traded in the Frontier Long/Short Commodity Series are profitable year to date. The Grains and Softs sectors are profitable while the Base Metals, Energies, Metals,Meats, Precious Metals and Financial sectors are negative year to date.
In terms of major CTA performance, onethree of the six major CTAs in the Frontier Long/Short Commodity Series was profitable in Q23Q 2012. Global Advisors, Red Oak and Rosetta finished positive while Beach Horizon, Global Advisors, Strategic Ag Red Oak and Mesirow were negative for the quarter. One
Two of the six major CTAs in the Frontier Long/Short Commodity Series isare profitable year to date. Red Oak and Rosetta isare profitable while Beach Horizon, Global Advisors, Mesirow Red Oak and Strategic Ag are negative year to date.
The Frontier Long/Short Commodity Series Class 1 ceased trading operations in July, 2012.
Balanced Series
2013
The Balanced Series – Class 1 NAV lost 9.83%15.99% for the sixnine months ended JuneSeptember 30, 2013, net of fees and expenses; the Balanced Series – Class 2 NAV lost 8.49%14.07% for the sixnine months ended JuneSeptember 30, 2013, net of fees and expenses; the Balanced Series – Class 2a NAV lost 8.02%12.67% for the sixnine months ended JuneSeptember 30, 2013, net of fees and expenses; the Balanced Series – Class 3a NAV lost 7.78%13.08% for the sixnine months ended JuneSeptember 30, 2013, net of fees and expenses.
For the sixnine months ended JuneSeptember 30, 2013, the Balanced Series recorded net loss on investments of $12,914,896,$22,951,206, net investment income of $122,551,$246,370, and total expenses of $4,163,030,$5,500,955, resulting in a net decrease in Owners’ capital from operations of $16,342,353$26,064,132 after non- controlling interests of $613,022.$2,141,659. The NAV per Unit, Class 1, decreased from $116.32 at December 31, 2012, to $104.89$97.72 at JuneSeptember 30, 2013. The NAV per Unit, Class 2, decreased from $149.20 at December 31, 2012, to $136.54$128.20 at JuneSeptember 30, 2013. For Class 2a, the NAV per Unit increased from $124.36 at December 31, 2012, to $114.69$108.11 at JuneSeptember 30, 2013. For Class 3a, the NAV per Unit decreased from $123.96 at December 31, 2012, to $114.31$107.75 at JuneSeptember 30, 2013. Total Class 1 subscriptions and redemptions for the period were $168,617$223,025 and $23,762,099,$38,380,811, respectively. Total Class 2 subscriptions and redemptions for the period were $7,692$11,513 and $7,401,144,$13,500,845, respectively. Total Class 2a redemptions for the period were $172,020.$257,150. There were no subscriptions. Total Class 3a redemptions for the period were $954,645.$1,105,541. There were no subscriptions. Ending capital at JuneSeptember 30, 2013, was $108,082,752$86,381,929 for Class 1, $40,246,655$31,757,424 for Class 2, $769,852$640,531 for Class 2a and $2,597,739$2,298,925 for Class 3a. At December 31, 2012, ending capital was $143,906,872 for Class 1, $51,459,568 for Class 2, $1,009,520 for Class 2a, and $3,776,790 for Class 3a.
The Balanced Series may have both long and short exposure to the Interest Rates, Currencies, Stock Indices, Energies, Metals, and Commodities sectors.
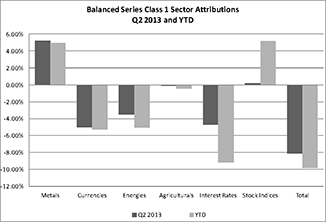 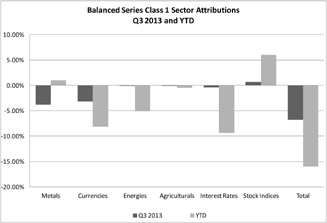 | 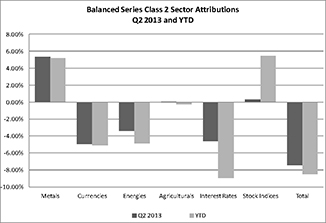 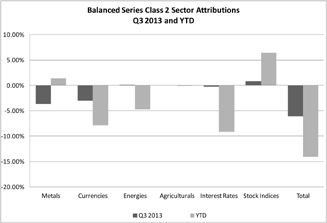 | |
  | 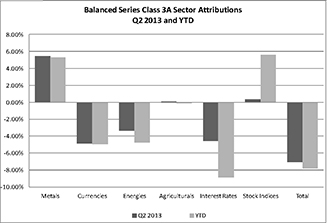 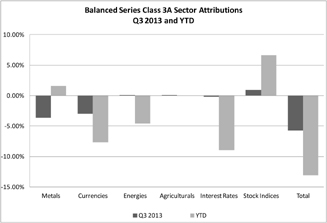 | |
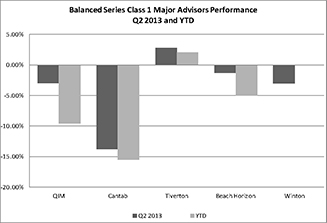 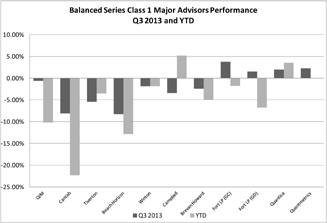 |   |
  |   |
ThreeTwo of the six sectors traded in the Balanced Series were profitable in Q23Q 2013. The Stock Indices Metals and AgriculturalsEnergies were profitable while Metals, Currencies, Agriculturals and Interest Rates Currencies and Energies finished negative for the quarter.
The Metals and Stock Indices sectors are positive YTD while Interest Rates, Agriculturals, Currencies and Energies are negative YTD.
In terms of major CTA performance Tiverton wasFort, QIM, Quantica and Quantmetrics finished positive for the quarter. TivertonWinton, Campbell, Fort (GC), Quantica and WintonQuantmetrics are positive YTD. Cantab, Tiverton, Beach Cantab, QIMHorizon, Winton, Campbell and WintonBrevan Howard finished negative for the quarter. QIM, Cantab, andTiverton, Beach Horizon, Brevan Howard and Fort (GD) are negative YTD.
2012
The Balanced Series – Class 1 NAV lost 1.5%1.4% for the sixnine months ended JuneSeptember 30, 2012, net of fees and expenses; the Balanced Series – Class 1a NAV lost 0.3%gained 3.8% for the sixnine months ended JuneSeptember 30, 2012, net of fees and expenses; the Balanced Series – Class 2 NAV lost 0.0%gained 0.8% for the sixnine months ended JuneSeptember 30, 2012, net of fees and expenses; the Balanced Series – Class 2a NAV gained 0.5%1.4% for the sixnine months ended JuneSeptember 30, 2012, net of fees and expenses; the Balanced Series – Class 3a NAV gained 0.1%1.1% for the sixnine months ended JuneSeptember 30, 2012, net of fees and expenses.
For the sixnine months ended JuneSeptember 30, 2012, the Balanced Series recorded net gain on investments of $9,349,863,$21,942,059, net investment income of $186,736,$208,856, and total expenses of $8,160,904,$13,714,736, resulting in a net decrease in Owners’ capital from operations of $2,853,457$1,960,254 after non- controlling interests of ($4,229,152)10,396,433). The NAV per Unit, Class 1, decreased from $124.50 at December 31, 2011, to $122.65$122.79 at JuneSeptember 30, 2012. For Class 1a, the NAV per Unit decreasedincreased from $108.45 at December 31, 2011, to $108.13$112.58 at JuneSeptember 30, 2012. The NAV per Unit, Class 2, decreasedincreased from $155.02 at December 31, 2011, to $155.01$156.30 at JuneSeptember 30, 2012. For Class 2a, the NAV per Unit increased from $128.35 at December 31, 2011, to $128.99$130.15 at JuneSeptember 30, 2012. For Class 3a, the NAV per Unit increased from $128.36 at December 31, 2011, to $128.54$129.72 at JuneSeptember 30, 2012. Total Class 1 subscriptions and redemptions for the period were $243,828$367,799 and $16,465,726,$22,241,622, respectively. Total Class 1a subscriptions and redemptions for the period were $414$482 and $2,263,742,$2,524,092, respectively. Total Class 2 subscriptions and redemptions for the period were $7,927$11,968 and $5,962,591,$7,771,998, respectively. Total Class 2a redemptions for the period were $1,672,175.$1,675,156. There were no subscriptions. Total Class 3a subscriptions and redemptions for the period were $2,004,252$2,264,602 and $915,291,$1,186,627, respectively. Ending capital at JuneSeptember 30, 2012, was $164,804,193$159,486,336 for Class 1, $249,991$0 for Class 1a, $57,348,959$56,046,060 for Class 2, $1,111,687$1,118,686 for Class 2a and $4,040,685$4,066,096 for Class 3a. At December 31, 2011, ending capital was $183,785,318 for Class 1, $2,536,559 for Class 1a, $63,372,567 for Class 2, $2,784,830 for Class 2a, and $2,952,802 for Class 3a.
The Balanced Series, through Frontier Trading Company XVII, LLC has invested in a swapSwap whereby the Balanced Series obtains exposure to the performance of additional currency programs held by a counterparty to the swapSwap for the purpose of further diversification among trading advisors.
The Balanced Series may have both long and short exposure to the Interest Rates, Currencies, Stock Indices, Energies, Metals, and Commodities sectors.
Balanced Series
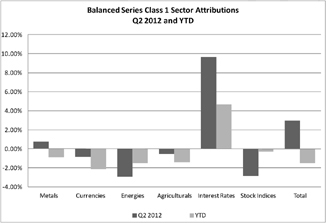 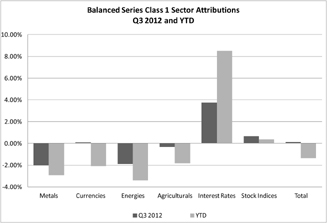 |  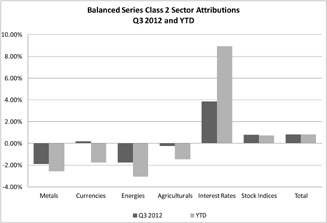 | |
  | 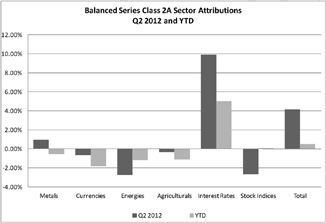 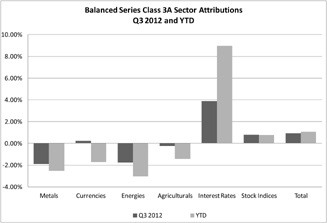 | |
  | 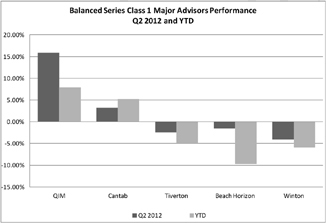 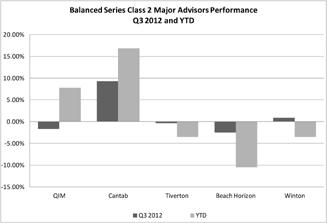 | |
 |  |
 | 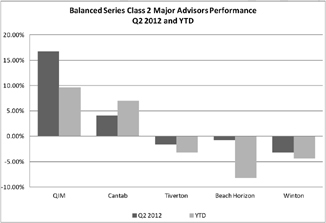 | |
 |  |
TwoThree of the six sectors traded in the Balanced Series were profitable in Q23Q 2012. MetalsCurrencies, Stock Indices and Interest Rates were profitable while Stock Indices, Currencies,Metals, Agriculturals and Energies finished negative for the quarter. One
Two of the six sectors traded in the Balanced Series isare profitable year to date. The Interest Rates sector isand Stock Indices sectors are profitable while Stock Indices, Currencies, Metals, Agriculturals and Energies are negative year to date.
In terms of major CTA performance, two of the five major CTAs in the Balanced Series were profitable in Q23Q 2012. QIMWinton and Cantab were profitable while Winton,QIM, Tiverton and Beach Horizon finished negative for the quarter.
Two of the five major CTAs in the Balanced Series are profitable year to date. QIM and Cantab are profitable while Tiverton, Beach Horizon and Winton are negative year to date.
The Balanced Series Class 1A ceased trading operations in July, 2012.
Frontier Select Series (formerly Tiverton/Graham/Transtrend Series)
2013
The Frontier Select Series (formerly Tiverton/Graham/Transtrend Series) – Class 1 NAV gained 2.99%lost 3.36% for the sixnine months ended JuneSeptember 30, 2013, net of fees and expenses; the Frontier Select Series (formerly Tiverton/Graham/Transtrend Series) – Class 2 NAV gained 4.51%lost 1.17% for the sixnine months ended JuneSeptember 30, 2013, net of fees and expenses.
For the sixnine months ended JuneSeptember 30, 2013, the Frontier Select Series (formerly Tiverton/Graham/Transtrend Series) recorded net gainloss on investments of $1,354,736,$333,105, net investment income of $178,057,$246,719, and total expenses of $746,269,$1,069,034, resulting in a net increasedecrease in Owners’ capital from operations of $786,524.$489,210. The NAV per Unit, Class 1, increaseddecreased from $78.66 at December 31, 2012, to $81.01$76.02 as of JuneSeptember 30, 2013. The NAV per Unit, Class 2, increaseddecreased from $99.55 at December 31, 2012, to $104.04$98.39 as of JuneSeptember 30, 2013. Total Class 1 subscriptions and redemptions for the period were $8,725$12,067 and $3,608,609,$4,788,445, respectively. Total Class 2 redemptions for the period were $468,252.$805,617. There were no subscriptions. Ending capital at JuneSeptember 30, 2013, was $19,323,354$17,006,881 for Class 1 and $2,739,675$2,266,555 for Class 2. Ending capital at December 31, 2012, was $22,266,758 for Class 1 and $3,077,883 for Class 2.
The Frontier Select Series (formerly Tiverton/Graham/Transtrend Series) may have both long and short exposure to the Interest Rates, Currencies, Stock Indices, Energies, Metals, and Commodities sectors.
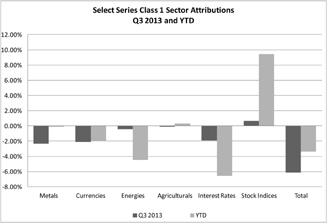 | 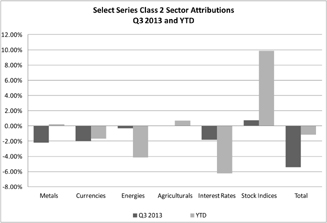 |
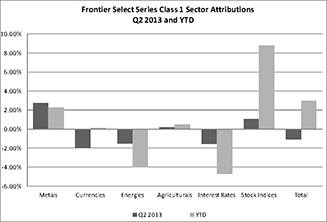 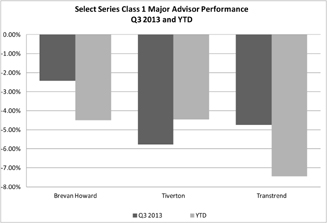 | 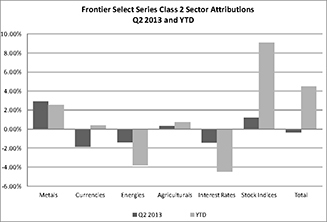 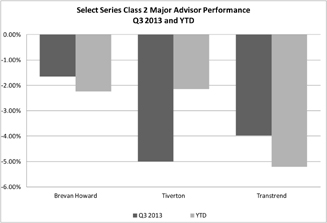 |
ThreeTwo of the six sectors traded in the Frontier Select Series were profitable in Q23Q 2013. Metals, Agriculturals and Stock Indices were positive while Metals, Interest Rates, Currencies and Energies were negative for the quarter.
Currencies, Metals, Agriculturals and Stock Indices are positive YTD while Currencies, Interest Rates and Energies are negative YTD.
In terms of major CTA performance Tiverton finished positive for the quarter and is positive YTD while Brevan Howard, Tiverton and Transtrend finished negative for the quarter and are negative YTD.
The “Tiverton/Graham/Transtrend Series” name was changed to the “Frontier Select Series.” Graham was replaced by Brevan Howard as a major advisor in the Frontier Select Series.
2012
The Frontier Select Series – Class 1 NAV lost 5.2%6.3% for the sixnine months ended JuneSeptember 30, 2012, net of fees and expenses; the Frontier SelectTiverton/Graham/Transtrend Series – Class 2 NAV lost 4.3%4.2% for the sixnine months ended JuneSeptember 30, 2012, net of fees and expenses.
For the sixnine months ended JuneSeptember 30, 2012, the Frontier Select Series recorded net loss on investments of $618,415,$307,991, net investment income of $83,962,$159,048, and total expenses of $1,295,149,$1,903,130, resulting in a net decrease in Owners’ capital from operations of $1,829,602.$2,052,073. The NAV per Unit, Class 1, decreased from $91.02 at December 31, 2011, to $86.29$85.30 as of JuneSeptember 30, 2012. The NAV per Unit, Class 2, decreased from $111.84 at December 31, 2011, to $107.04$107.12 as of JuneSeptember 30, 2012. Total Class 1 subscriptions and redemptions for the period were $18,031$26,014 and $4,631,745,$7,239,792, respectively. Total Class 2 redemptions for the period were $359,678.$624,933. There were no subscriptions. Ending capital at JuneSeptember 30, 2012, was $28,912,334$26,076,936 for Class 1 and $3,898,644$3,646,252 for Class 2. Ending capital at December 31, 2011, was $35,180,631 for Class 1 and $4,433,341 for Class 2.
The Frontier Select Series may have both long and short exposure to the Interest Rates, Currencies, Stock Indices, Energies, Metals, and Commodities sectors.
Frontier Select Series (formerly Tiverton/Graham/Transtrend Series)
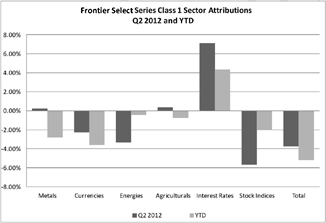 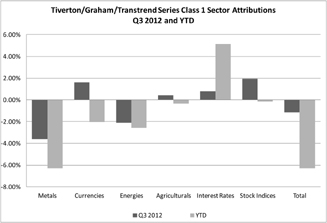 |  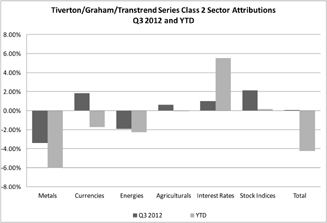 |
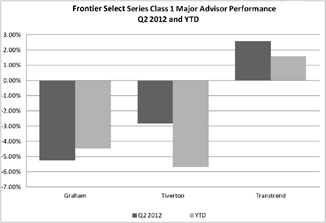 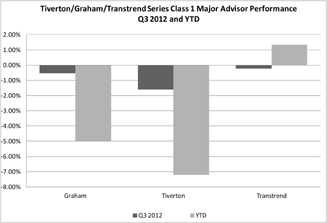 | 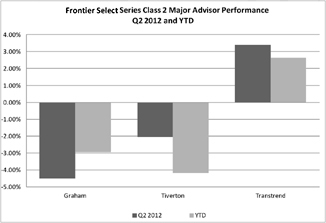  |
ThreeFour of the sixnine sectors traded in the Frontier SelectTiverton/Graham/Transtrend Series were profitable in Q23Q 2012. Metals,Currencies, Agriculturals, Stock Indices and Interest Rates were positive while Stock Indices, CurrenciesMetals and Energies were negative for the quarter. One
Two of the sixnine sectors traded in the Frontier SelectTiverton/Graham/Transtrend Series is profitable year to date. The Interest Rates sector isand Stock Indices sectors are profitable while Stock Indices, Currencies, Metals, Agriculturals and Energies are negative year to date.
In terms of major CTA performance Graham and Transtrend finished positive while Tiverton and Graham finished negative for the quarter. One of the three major CTAs in the Frontier SelectTiverton/Graham/Transtrend Series is profitable year to date. Transtrend is profitable while Tiverton and Graham are negative year to date.
Winton Series
2013
The Winton Series – Class 1 NAV gained 1.59%lost .85% for the sixnine months ended JuneSeptember 30, 2013, net of fees and expenses; the Winton Series – Class 2 NAV gained 3.09%1.40% for the sixnine months ended JuneSeptember 30, 2013, net of fees and expenses.
For the sixnine months ended JuneSeptember 30, 2013, the Winton Series recorded net gain on investments of $1,781,248,$1,400,650, net investment income of $204,611,$271,603, and total expenses of $1,121,735,$1,670,512, resulting in a net increase in Owners’ capital from operations of $864,124.$1,741. The NAV per Unit, Class 1, decreased from $130.73 at December 31, 2012, to $132.81$129.62 as of JuneSeptember 30, 2013. The NAV per Unit, Class 2, decreasedincreased from $158.30 at December 31, 2012, to $163.19$160.51 as of JuneSeptember 30, 2013. Total Class 1 subscriptions for the period were $91,099$134,791 and redemptions were $2,768,291.$4,031,879. Total Class 2 redemptions for the period were $286,272.$686,020. There were no subscriptions. Ending capital at JuneSeptember 30, 2013, was $28,506,866$26,594,221 for Class 1 and $10,353,328$9,783,946 for Class 2. Ending capital at December 31, 2012, was $30,645,208 for Class 1 and $10,314,326 for Class 2.
The Winton Series may have both long and short exposure to the Interest Rates, Currencies, Stock Indices, Energies, Metals, and Commodities sectors.
  |  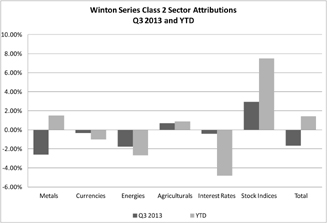 |
Two of the six sectors traded in the Winton Series were profitable in Q23Q 2013. MetalsAgriculturals and Stock Indices were positive while Currencies, Agriculturals,Metals, Energies and Interest Rates were negative for the quarter.
Metals, Agriculturals and Stock Indices are positive YTD while Currencies, Energies and Interest Rates are negative YTD.
2012
The Winton Series – Class 1 NAV lost 6.7% for the sixnine months ended JuneSeptember 30, 2012, net of fees and expenses; the Winton Series – Class 2 NAV lost 5.3%4.5% for the sixnine months ended JuneSeptember 30, 2012, net of fees and expenses.
For the sixnine months ended JuneSeptember 30, 2012, the Winton Series recorded net loss on investments of $2,097,276,$1,513,333, net investment income of $258,693,$386,507, and total expenses of $1,254,654,$1,857,001, resulting in a net decrease in Owners’ capital from operations of $3,093,237.$2,983,827. The NAV per Unit, Class 1, decreased from $141.13 at December 31, 2011, to $131.72$131.73 as of JuneSeptember 30, 2012. The NAV per Unit, Class 2, decreased from $165.82 at December 31, 2011, to $157.12$158.28 as of JuneSeptember 30, 2012. Total Class 1 subscriptions for the period were $107,528$158,451 and redemptions were $1,786,093.$3,104,434. Total Class 2 redemptions for the period were $466,906.$677,556. There were no subscriptions. Ending capital at JuneSeptember 30, 2012, was $34,178,150$32,937,034 for Class 1 and $10,631,266$10,503,724 for Class 2. Ending capital at December 31, 2011, was $38,345,799 for Class 1 and $11,702,325 for Class 2.
The Winton Series may have both long and short exposure to the Interest Rates, Currencies, Stock Indices, Energies, Metals, and Commodities sectors.
Winton Series
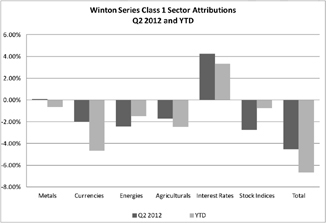 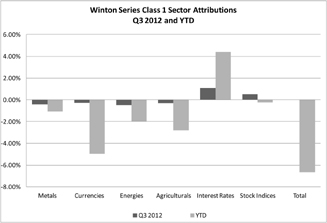 |  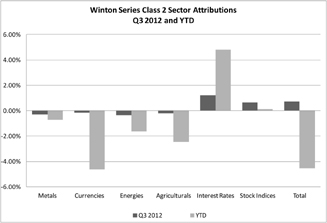 |
Two of the sixnine sectors traded in the Winton Series were profitable in Q23Q 2012. MetalsStock Indices and Interest Rates were positive while Stock Indices,Metals, Currencies, Agriculturals and Energies were negative for the quarter. One
Two of the sixnine sectors traded in the Winton Series is profitable year to date. The Stock Indices and Interest Rates sector issectors are profitable while Stock Indices, Currencies, Metals, Agriculturals and Energies are negative year to date.
Frontier Heritage Series (formerly Winton/Graham Series)
2013
The Frontier Heritage Series (formerly Winton/Graham Series) – Class 1 NAV gained 3.73%1.06% for the sixnine months ended JuneSeptember 30, 2013, net of fees and expenses; the Frontier Heritage Series (formerly Winton/Graham Series) – Class 2 NAV gained 5.28%3.36% for the sixnine months ended JuneSeptember 30, 2013, net of fees and expenses.
For the sixnine months ended JuneSeptember 30, 2013, the Frontier Heritage Series (formerly Winton/Graham Series) recorded net gainloss on investments of $1,345,719,$1,096,272, net investment income of $72,996,$102,598, and total expenses of $523,679,$731,005, resulting in a net increase in Owners’ capital from operations of $895,036.$467,865. The NAV per Unit, Class 1, increased from $94.55 at December 31, 2012, to $98.08$95.55 as of JuneSeptember 30, 2013. The NAV per Unit, Class 2, increased from $120.67 at December 31, 2012, to $127.04$124.72 as of JuneSeptember 30, 2013. Total Class 1 subscriptions for the period were $23,085$32,332 and redemptions were $3,512,281.$5,066,082. Total Class 2 redemptions for the period were $676,244.$1,181,705. There were no subscriptions. Ending capital at JuneSeptember 30, 2013, was $13,877,265$11,974,513 for Class 1 and $3,605,870$3,031,436 for Class 2. Ending capital at December 31, 2012, was $16,680,498 for Class 1 and $4,073,041 for Class 2.
The Frontier Heritage Series (formerly Winton/Graham Series) may have both long and short exposure to the Interest Rates, Currencies, Stock Indices, Energies, Metals, and Commodities sectors.
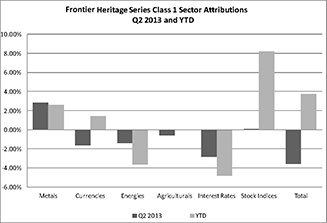 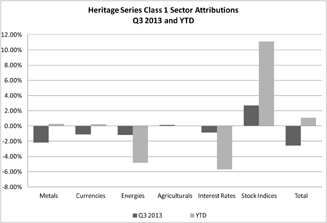 |  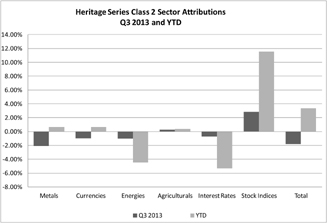 | |
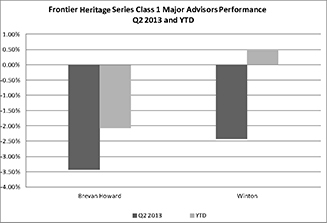 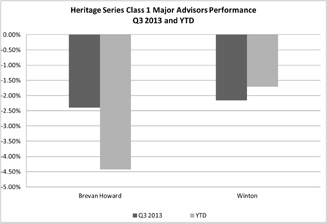 |  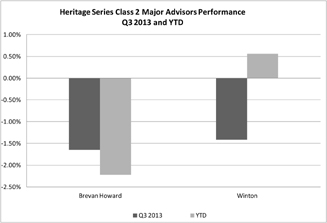 |
Two of the six sectors traded in the Frontier Heritage Series were profitable in Q23Q 2013. MetalsAgriculturals and Stock Indices were positive while Agriculturals,Metals, Interest Rates, Currencies and Energies were negative for the quarter.
Currencies, Metals, Agriculturals and Stock Indices are positive YTD while Interest Rates and Energies are negative YTD.
In terms of major CTA performance, both Brevan Howard and Winton finished negative for the quarter .quarter. Winton is positive YTD whileand Brevan Howard is negative YTD.
The “Winton/Graham Series” name was changed to the “Frontier Heritage Series.” Graham was replaced by Brevan Howard as a major advisor in the Frontier Heritage Series.
2012
The Frontier Heritage Series – Class 1 NAV lost 8.3%5.7% for the sixnine months ended JuneSeptember 30, 2012, net of fees and expenses; the Frontier Heritage Series – Class 2 NAV lost 6.9%3.5% for the sixnine months ended JuneSeptember 30, 2012, net of fees and expenses.
For the sixnine months ended JuneSeptember 30, 2012, the Frontier Heritage Series recorded net lossgain on investments of $1,161,830,$15,888, net investment income of $53,990,$85,811, and total expenses of $1,030,518,$1,455,957, resulting in a net decrease in Owners’ capital from operations of $2,138,358.$1,354,258. The NAV per Unit, Class 1, decreased from $104.73 at December 31, 2011, to $96.05$98.80 as of JuneSeptember 30, 2012. The NAV per Unit, Class 2, decreased from $129.70 at December 31, 2011, to $120.78$125.13 as of JuneSeptember 30, 2012. Total Class 1 subscriptions for the period were $31,984$47,245 and redemptions were $3,272,198.$4,355,759. Total Class 2 redemptions for the period were $1,072,717.$1,273,542. There were no subscriptions. Ending capital at JuneSeptember 30, 2012, was $19,729,727$19,275,024 for Class 1 and $4,592,671$4,562,349 for Class 2. Ending capital at December 31, 2011, was $24,783,519 for Class 1 and $5,990,168 for Class 2.
The Frontier Heritage Series may have both long and short exposure to the Interest Rates, Currencies, Stock Indices, Energies, Metals, and Commodities sectors.
Frontier Heritage Series (formerly Winton/Graham Series)
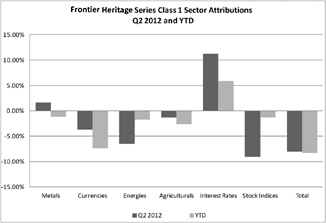 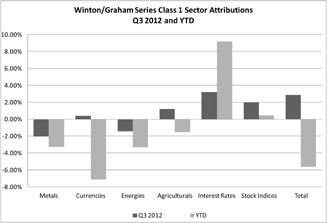 |  | |
 |   |
TwoFour of the sixnine sectors traded in the Frontier Heritage Series were profitable in Q23Q 2012. MetalsCurrencies, Agriculturals, Stock Indices and Interest Rates were positive while Stock Indices,Metals and Energies Agriculturals and Currencies were negative for the quarter.
In termsTwo of major CTA performance, both Grahamthe nine sectors traded in the Frontier Heritage Series are profitable year to date. The Interest Rates and Winton werethe Stock Indices sectors are profitable while Currencies, Metals, Agriculturals and Energies are negative for the quarter.year to date.
| ITEM 3. | QUANTITATIVE AND QUALITATIVE DISCLOSURES ABOUT MARKET RISK |
The Series are speculative commodity pools. The market sensitive instruments which are held by the Trading Companies in which the Series are invested are acquired for speculative trading purposes, and all or a substantial amount of the Series’ assets are subject to the risk of trading loss. Unlike an operating company, the risk of market sensitive instruments is integral, not incidental, to the Series’ main line of business.
Market movements result in frequent changes in the fair market value of each Trading Company’s open positions and, consequently, in each Series of the Trust’s earnings and cash flow. The Trading Companies’ and consequently the Series’ market risk is influenced by a wide variety of factors, including the level and volatility of exchange rates, interest rates, equity price levels, the market value of financial instruments and contracts, the diversification effects among the open positions and the liquidity of the markets in which trades are made.
Each Trading Company rapidly acquires and liquidates both long and short positions in a wide range of different markets. Consequently, it is not possible to predict how a particular future market scenario will affect performance, and the past performance for any Series is not necessarily indicative of the future results of such Series.
The Trading Companies’ and consequently the Series’ primary market risk exposures as well as the strategies used and to be used by the Trading Advisors for managing such exposures are subject to numerous uncertainties, contingencies and risks, any one of which could cause the actual results of the Trust’s and the Managing Owner’s risk controls to differ materially from the objectives of such strategies. Government interventions, defaults and expropriations, illiquid markets, the emergence of dominant fundamental factors, political upheavals, changes in historical price relationships, an influx of new market participants, increased regulation and many other factors could result in material losses as well as in material changes to the risk exposures and the risk management strategies of the Trading Companies and consequently the Trust. There can be no assurance that the Trading Companies’ current market exposure and/or risk management strategies will not change materially or that any such strategies will be effective in either the short-term or long-term. Investors must be prepared to lose all or substantially all of their investment in a Series.
Quantitative Market Risk
Trading Risk
The Series’ approximate risk exposure in the various market sectors traded by its trading advisors is quantified below in terms of value at risk. Due to the Series’ mark-to-market accounting, any loss in the fair value of the Series’ (through the Trading Companies) open positions is directly reflected in the Series’ earnings, realized or unrealized.
Exchange maintenance margin requirements have been used by the Trust as the measure of its value at risk. Maintenance margin requirements are set by exchanges to equal or exceed the maximum losses reasonably expected to be incurred in the fair value of any given contract in 95% to 99% of any one-day interval. The maintenance margin levels are established by brokers, dealers and exchanges using historical price studies as well as an assessment of current market volatility and economic fundamentals to provide a probabilistic estimate of the maximum expected near-term one-day price fluctuation. Maintenance margin has been used rather than the more generally available initial margin, because initial margin includes a credit risk component that is not relevant to value at risk.
In the case of market sensitive instruments that are not exchange-traded, including currencies and some energy products and metals, the margin requirements for the equivalent futures positions have been used as value at risk. In those cases in which a futures- equivalent margin is not available, dealers’ margins have been used.
In the case of contracts denominated in foreign currencies, the value at risk figures include foreign currency margin amounts converted into U.S. Dollars with an incremental adjustment to reflect the exchange rate risk inherent to the Series, which is valued in U.S. Dollars, in expressing value at risk in a functional currency other than U.S. Dollars.
In quantifying each Series’ value at risk, 100% positive correlation in the different positions held in each market risk category has been assumed. Consequently, the margin requirements applicable to the open contracts have simply been aggregated to determine each trading category’s aggregate value at risk. The diversification effects resulting from the fact that the Series’ positions held through the Trading Companies are rarely, if ever, 100% positively correlated have not been reflected.
Value at Risk by Market Sectors
The following table presents the trading value at risk associated with each Series’ exposure to open positions (as held by the Trading Companies) by market sector as of JuneSeptember 30, 2013 and December 31, 2012. All open position trading risk exposures of the Series have been included in calculating the figures set forth below.
Frontier Diversified Series (1)
MARKET SECTOR | June 30, 2013 | December 31, 2012 | September 30, 2013 | December 31, 2012 | ||||||||||||||||||||||||||||
| VALUE AT RISK | % OF TOTAL CAPITALIZATION | VALUE AT RISK | % OF TOTAL CAPITALIZATION | VALUE AT RISK | % OF TOTAL CAPITALIZATION | VALUE AT RISK | % OF TOTAL CAPITALIZATION | |||||||||||||||||||||||||
Interest Rates | $ | 3,045,742 | 3.40 | % | $ | 10,668,213 | 9.30 | % | $ | 2,114,559 | 3.10 | % | $ | 10,668,213 | 9.30 | % | ||||||||||||||||
Currencies | 9,709,050 | 10.80 | % | 6,944,890 | 6.00 | % | $ | 4,718,564 | 6.90 | % | $ | 6,944,890 | 6.00 | % | ||||||||||||||||||
Stock Indices | 2,842,806 | 3.20 | % | 6,884,232 | 6.00 | % | $ | 3,638,607 | 5.40 | % | $ | 6,884,232 | 6.00 | % | ||||||||||||||||||
Metals | 1,030,652 | 1.20 | % | 529,904 | 0.50 | % | $ | 200,396 | 0.30 | % | $ | 529,904 | 0.50 | % | ||||||||||||||||||
Agriculturals/Softs | 2,691,273 | 3.00 | % | 2,106,237 | 1.80 | % | $ | 1,629,322 | 2.40 | % | $ | 2,106,237 | 1.80 | % | ||||||||||||||||||
Energy | 970,239 | 1.10 | % | 826,602 | 0.70 | % | $ | 336,587 | 0.50 | % | $ | 826,602 | 0.70 | % | ||||||||||||||||||
|
|
|
| |||||||||||||||||||||||||||||
Total: | $ | 20,289,763 | 22.60 | % | $ | 27,960,078 | 24.30 | % | $ | 12,638,035 | 18.60 | % | $ | 27,960,078 | 24.30 | % | ||||||||||||||||
|
|
|
| |||||||||||||||||||||||||||||
Frontier Long/Short Commodity Series (1)
MARKET SECTOR | June 30, 2013 | December 31, 2012 | September 30, 2013 | December 31, 2012 | ||||||||||||||||||||||||||||
| VALUE AT RISK | % OF TOTAL CAPITALIZATION | VALUE AT RISK | % OF TOTAL CAPITALIZATION | VALUE AT RISK | % OF TOTAL CAPITALIZATION | VALUE AT RISK | % OF TOTAL CAPITALIZATION | |||||||||||||||||||||||||
Interest Rates | $ | 454,141 | 1.00 | % | $ | 1,456,457 | 2.60 | % | $ | 41,522 | 0.10 | % | $ | 1,456,457 | 2.60 | % | ||||||||||||||||
Currencies | 489,519 | 1.10 | % | 649,353 | 1.10 | % | $ | 377,849 | 1.10 | % | $ | 649,353 | 1.10 | % | ||||||||||||||||||
Stock Indices | 543,384 | 1.20 | % | 915,438 | 1.60 | % | $ | 220,915 | 0.60 | % | $ | 915,438 | 1.60 | % | ||||||||||||||||||
Metals | 376,222 | 0.90 | % | 430,652 | 0.80 | % | $ | 104,942 | 0.30 | % | $ | 430,652 | 0.80 | % | ||||||||||||||||||
Agriculturals/Softs | 1,974,538 | 4.40 | % | 2,128,861 | 3.80 | % | $ | 1,418,836 | 4.00 | % | $ | 2,128,861 | 3.80 | % | ||||||||||||||||||
Energy | 2,188,335 | 4.90 | % | 1,768,300 | 3.10 | % | $ | 254,624 | 0.70 | % | $ | 1,768,300 | 3.10 | % | ||||||||||||||||||
|
|
|
| |||||||||||||||||||||||||||||
Total: | $ | 6,026,139 | 13.50 | % | $ | 7,349,062 | 13.00 | % | $ | 2,418,688 | 6.80 | % | $ | 7,349,062 | 13.00 | % | ||||||||||||||||
|
|
|
| |||||||||||||||||||||||||||||
Frontier Masters Series
MARKET SECTOR | June 30, 2013 | December 31, 2012 | ||||||||||||||
| VALUE AT RISK | % OF TOTAL CAPITALIZATION | VALUE AT RISK | % OF TOTAL CAPITALIZATION | |||||||||||||
Interest Rates | $ | 932,426 | 2.10 | % | $ | 2,289,229 | 4.40 | % | ||||||||
Currencies | 6,812,779 | 15.40 | % | 2,293,953 | 4.50 | % | ||||||||||
Stock Indices | 822,239 | 1.90 | % | 1,147,721 | 2.20 | % | ||||||||||
Metals | 413,281 | 0.90 | % | 74,930 | 0.10 | % | ||||||||||
Agriculturals/Softs | 567,651 | 1.30 | % | 182,665 | 0.40 | % | ||||||||||
Energy | 146,937 | 0.30 | % | 83,701 | 0.20 | % | ||||||||||
|
|
|
| |||||||||||||
Total: | $ | 9,695,313 | 21.80 | % | $ | 6,072,199 | 11.80 | % | ||||||||
|
|
|
| |||||||||||||
MARKET SECTOR Interest Rates Currencies Stock Indices Metals Agriculturals/Softs Energy Total: September 30, 2013 December 31, 2012 VALUE % OF TOTAL VALUE % OF TOTAL AT RISK CAPITALIZATION AT RISK CAPITALIZATION $ 946,740 2.50 % $ 2,289,229 4.40 % $ 2,005,911 5.30 % $ 2,293,953 4.50 % $ 732,721 2.00 % $ 1,147,721 2.20 % $ 90,483 0.20 % $ 74,930 0.10 % $ 434,010 1.20 % $ 182,665 0.40 % $ 110,905 0.30 % $ 83,701 0.20 %�� $ 4,320,770 11.50 % $ 6,072,199 11.80 %
Balanced Series (1):
| June 30, 2013 | December 31, 2012 | September 30, 2013 | December 31, 2012 | |||||||||||||||||||||||||||||
MARKET SECTOR | VALUE AT RISK | % OF TOTAL CAPITALIZATION | VALUE AT RISK | % OF TOTAL CAPITALIZATION | VALUE AT RISK | % OF TOTAL CAPITALIZATION | VALUE AT RISK | % OF TOTAL CAPITALIZATION | ||||||||||||||||||||||||
Interest Rates | $ | 4,623,636 | 2.80 | % | $ | 21,555,846 | 10.80 | % | $ | 2,964,663 | 1.80 | % | $ | 21,555,846 | 10.80 | % | ||||||||||||||||
Currencies | 13,576,883 | 8.20 | % | 15,370,708 | 7.70 | % | $ | 8,677,334 | 5.20 | % | $ | 15,370,708 | 7.70 | % | ||||||||||||||||||
Stock Indices | 4,520,873 | 2.70 | % | 13,812,873 | 6.90 | % | $ | 4,934,732 | 3.0 | % | $ | 13,812,873 | 6.90 | % | ||||||||||||||||||
Metals | 1,541,914 | 0.90 | % | 1,031,714 | 0.50 | % | $ | 247,584 | 0.10 | % | $ | 1,031,714 | 0.50 | % | ||||||||||||||||||
Agriculturals/Softs | 4,265,789 | 2.60 | % | 4,076,766 | 2.00 | % | $ | 1,771,934 | 1.10 | % | $ | 4,076,766 | 2.00 | % | ||||||||||||||||||
Energy | 1,310,069 | 0.80 | % | 1,493,380 | 0.70 | % | $ | 379,774 | 0.20 | % | $ | 1,493,380 | 0.70 | % | ||||||||||||||||||
|
|
|
| |||||||||||||||||||||||||||||
Total: | $ | 29,839,163 | 18.00 | % | $ | 57,341,288 | 28.60 | % | $ | 18,976,021 | 11.40 | % | $ | 57,341,288 | 28.60 | % | ||||||||||||||||
|
|
|
| |||||||||||||||||||||||||||||
Frontier Select Series (formerly Frontier Select Series (formerly Tiverton/Graham/Transtrend Series)):
| June 30, 2013 | December 31, 2012 | |||||||||||||||||||||||||||||||
| VALUE | % OF TOTAL | VALUE | % OF TOTAL | September 30, 2013 | December 31, 2012 | |||||||||||||||||||||||||||
MARKET SECTOR | AT RISK | CAPITALIZATION | AT RISK | CAPITALIZATION | VALUE AT RISK | % OF TOTAL CAPITALIZATION | VALUE AT RISK | % OF TOTAL CAPITALIZATION | ||||||||||||||||||||||||
Interest Rates | $ | 56,595 | 0.30 | % | $ | 1,108,185 | 4.40 | % | $ | 76,503 | 0.40 | % | $ | 1,108,185 | 4.40 | % | ||||||||||||||||
Currencies | 3,561,273 | 16.10 | % | 1,324,364 | 5.20 | % | $ | 458,982 | 2.40 | % | $ | 1,324,364 | 5.20 | % | ||||||||||||||||||
Stock Indices | 196,008 | 0.90 | % | 864,109 | 3.40 | % | 0.00 | % | $ | 864,109 | 3.40 | % | ||||||||||||||||||||
Metals | 146,657 | 0.70 | % | 71,543 | 0.30 | % | $ | 18,392 | 0.10 | % | $ | 71,543 | 0.30 | % | ||||||||||||||||||
Agriculturals/Softs | 76,806 | 0.40 | % | 206,823 | 0.80 | % | $ | 82,473 | 0.40 | % | $ | 206,823 | 0.80 | % | ||||||||||||||||||
Energy | 11,530 | 0.10 | % | 116,831 | 0.50 | % | $ | 19,822 | 0.10 | % | $ | 116,831 | 0.50 | % | ||||||||||||||||||
|
|
|
| |||||||||||||||||||||||||||||
Total: | $ | 4,048,868 | 18.40 | % | $ | 3,691,855 | 14.60 | % | $ | 656,172 | 3.40 | % | $ | 3,691,855 | 14.60 | % | ||||||||||||||||
|
|
|
| |||||||||||||||||||||||||||||
Winton Series:
MARKET SECTOR | September 30, 2013 | December 31, 2012 | ||||||||||||||||||||||||||||||
| June 30, 2013 | December 31, 2012 | VALUE | % OF TOTAL | VALUE | % OF TOTAL | |||||||||||||||||||||||||||
| VALUE AT RISK | % OF TOTAL CAPITALIZATION | VALUE AT RISK | % OF TOTAL CAPITALIZATION | AT RISK | CAPITALIZATION | AT RISK | CAPITALIZATION | |||||||||||||||||||||||||
Interest Rates | $ | 407,601 | 1.10 | % | $ | 1,355,328 | 3.30 | % | $ | 713,567 | 2.00 | % | $ | 1,355,328 | 3.30 | % | ||||||||||||||||
Currencies | 2,860,147 | 7.40 | % | 2,941,414 | 7.20 | % | $ | 3,744,989 | 10.30 | % | $ | 2,941,414 | 7.20 | % | ||||||||||||||||||
Stock Indices | 638,024 | 1.60 | % | 992,759 | 2.40 | % | $ | 1,154,713 | 3.20 | % | $ | 992,759 | 2.40 | % | ||||||||||||||||||
Metals | 236,665 | 0.60 | % | 70,872 | 0.20 | % | $ | 80,919 | 0.20 | % | $ | 70,872 | 0.20 | % | ||||||||||||||||||
Agriculturals/Softs | 641,489 | 1.70 | % | 241,874 | 0.60 | % | $ | 499,606 | 1.40 | % | $ | 241,874 | 0.60 | % | ||||||||||||||||||
Energy | 206,779 | 0.50 | % | 85,535 | 0.20 | % | $ | 92,377 | 0.30 | % | $ | 85,535 | 0.20 | % | ||||||||||||||||||
|
|
|
| |||||||||||||||||||||||||||||
Total: | $ | 4,990,706 | 12.80 | % | $ | 5,687,781 | 13.90 | % | $ | 6,286,171 | 17.40 | % | $ | 5,687,781 | 13.90 | % | ||||||||||||||||
|
|
|
| |||||||||||||||||||||||||||||
Frontier Heritage Series (formerly Winton/Graham Series):
| June 30, 2013 | December 31, 2012 | |||||||||||||||||||||||||||||||
| VALUE | % OF TOTAL | VALUE | % OF TOTAL | September 30, 2013 | December 31, 2012 | |||||||||||||||||||||||||||
MARKET SECTOR | AT RISK | CAPITALIZATION | AT RISK | CAPITALIZATION | VALUE AT RISK | % OF TOTAL CAPITALIZATION | VALUE AT RISK | % OF TOTAL CAPITALIZATION | ||||||||||||||||||||||||
Interest Rates | $ | 91,507 | 0.50 | % | $ | 1,660,955 | 8.00 | % | $ | 160,085 | 1.10 | % | $ | 1,660,955 | 8.00 | % | ||||||||||||||||
Currencies | 642,105 | 3.70 | % | 2,207,110 | 10.60 | % | $ | 840,167 | 5.60 | % | $ | 2,207,110 | 10.60 | % | ||||||||||||||||||
Stock Indices | 143,237 | 0.80 | % | 1,031,543 | 5.00 | % | $ | 259,053 | 1.70 | % | $ | 1,031,543 | 5.00 | % | ||||||||||||||||||
Metals | 53,132 | 0.30 | % | 104,133 | 0.50 | % | $ | 18,154 | 0.10 | % | $ | 104,133 | 0.50 | % | ||||||||||||||||||
Agriculturals/Softs | 144,015 | 0.82 | % | 311,136 | 1.50 | % | $ | 112,084 | 0.80 | % | $ | 311,136 | 1.50 | % | ||||||||||||||||||
Energy | 46,422 | 0.30 | % | 161,051 | 0.80 | % | $ | 20,724 | 0.10 | % | $ | 161,051 | 0.80 | % | ||||||||||||||||||
|
|
|
| |||||||||||||||||||||||||||||
Total: | $ | 1,120,417 | 6.40 | % | $ | 5,475,927 | 26.40 | % | $ | 1,410,267 | 9.40 | % | $ | 5,475,927 | 26.40 | % | ||||||||||||||||
|
|
|
| |||||||||||||||||||||||||||||
| (1) | As of |
Material Limitations on Value at Risk as an Assessment of Market Risk
The face value of the market sector instruments held on behalf of the Series is typically many times the applicable maintenance margin requirement, which generally ranges between approximately 1% and 10% of contract face value, as well as many times the capitalization of the Series. The magnitude of each Series’ open positions creates a risk of ruin not typically found in most other investment vehicles. Because of the size of their positions, certain market conditions, although unusual, but historically recurring from time to time, could cause a Series to incur severe losses over a short period of time. The value at risk table above, as well as the past performance of the Series, gives no indication of this risk of ruin.
Non-Trading Risk
The Series have non-trading market risk on their foreign cash balances not needed for margin. However, these balances, as well as the market risk they represent, are immaterial. The Series also have non-trading market risk as a result of investing a portion of their available assets in U.S. government securities which include any security issued or guaranteed as to principal or interest by the U.S., or by a person controlled by or supervised by and acting as an instrumentality of the government of the U.S. pursuant to authority granted by Congress of the U.S. or any certificate of deposit for any of the foregoing, including U.S. treasury bonds, U.S. treasury bills and issues of agencies of the U.S. government, and certain cash items such as money market funds, certificates of deposit (under nine months) and time deposits. The market risk represented by these investments is also immaterial.
Qualitative Market Risk
The following are the primary trading risk exposures of the Series of the Trust as of JuneSeptember 30, 2013, by market sector.
Interest rates
Interest rate risk is one of the principal market exposures of each Series. Interest rate movements directly affect the price of interest rate futures positions held and indirectly the value of a Trading Company’s stock index and currency positions. Interest rate movements in one country as well as relative interest rate movements between countries materially impact profitability. The primary interest rate exposure is to interest rate fluctuations in the U.S. and the other G-7 countries. However, the Trading Companies also may take futures positions on the government debt of smaller nations. The Managing Owner anticipates that G-7 interest rates will remain the primary market exposure of each Trading Company and accordingly of each Series for the foreseeable future. The changes in interest rates which are expected to have the most effect on the Series are changes in long-term, as opposed to short-term rates. Most of the speculative positions to be held by the Trading Companies will be in medium- to long-term instruments. Consequently, even a material change in short-term rates is expected to have little effect on the Series if the medium- to long-term rates remain steady. Aggregate interest income from all sources, including assets held at clearing brokers, up to 2% (annualized) is paid to the Managing Owner by the Balanced Series (Class 1 and Class 2 only), Winton Series, Frontier Select Series Series (formerly Tiverton/Graham/Transtrend Series), Currency Series and Frontier Heritage Series (formerly Winton/Graham Series). For the Frontier Diversified Series, Frontier Long/Short Commodity Series, Frontier Masters Series and Balanced Series (Class 1a and Class 2a only), 20% of the total interest allocated to each Series is paid to the Managing Owner. In addition, if interest rates fall below 0.75%, the Managing Owner is paid the difference between the Trust’s annualized interest income that is allocated to each of such Series and 0.75%. Interest income above what is paid to the Managing Owner is retained by the Series.
Currencies
Exchange rate risk is a significant market exposure of each Series of the Trust in general and the Currency Series in particular.general. For each Series of the Trust in general, and the Currency Series in particular, currency exposure is to exchange rate fluctuations, primarily fluctuations that disrupt the historical pricing relationships between different currencies and currency pairs. These fluctuations are influenced by interest rate changes as well as political and general economic conditions. The Trading Advisors on behalf of a Series trade in a large number of currencies, including cross-rates, which are positions between two currencies other than the U.S. Dollar. The Managing Owner does not anticipate that the risk profile of the Series’ currency sector will change significantly in the future.
Stock Indices
For each Series (other than the Currency Series), its primary equity exposure is equity price risk in the G-7 countries as well as other smaller jurisdictions. Each Series of the Trust (other than the Currency Series) is primarily exposed to the risk of adverse price trends or static markets in the major U.S., European and Japanese indices.
Metals
For each Series, (other than the Currency Series), its metals market exposure is fluctuations in the price of both precious metals, including gold and silver, as well as base metals including aluminum, copper, nickel and zinc. Some metals, such as gold, are used as surrogate stores of value, in place of hard currency, and thus have an associated currency or interest rate risk associated with them relative to their price in a specific currency. Other metals, such as silver, platinum, copper and steel, have substantial industrial applications, and may be subject to forces affecting industrial production and demand.
Agriculturals/Softs
Each Series (other than the Currency Series) may also invest in raw commodities and may thus have exposure to agricultural price movements, which are often directly affected by severe or unexpected weather conditions or by political events in countries that comprise significant sources of commodity supply.
Energy
For each Series (other than the Currency Series), its primary energy market exposure is in oil, gas and other energy product price movements, often resulting from political developments and ongoing conflicts in the Middle East. Oil and gas prices can be volatile and substantial profits and losses have been and are expected to continue to be experienced in this market.
Other Trading Risks
As a result of leverage, small changes in the price of a Trading Company’s positions may result in substantial losses for a Series. Futures, forwards and options are typically traded on margin. This means that a small amount of capital can be used to invest in contracts of much greater total value. The resulting leverage means that a relatively small change in the market price of a contract can produce a substantial loss. Like other leveraged investments, any purchase or sale of a contract may result in losses in excess of the amount invested in that contract. The Trading Companies may lose more than their initial margin deposits on a trade.
The Trading Companies’ trading is subject to execution risks. Market conditions may make it impossible for the Trading Advisors to execute a buy or sell order at the desired price, or to close out an open position. Daily price fluctuation limits are established by the exchanges and approved by the CFTC. When the market price of a contract reaches its daily price fluctuation limit, no trades can be executed at prices outside the limit. The holder of a contract may therefore be locked into an adverse price movement for several days or more and lose considerably more than the initial margin put up to establish the position. Thinly traded or illiquid markets also can make it difficult or impossible to execute trades. The Trading Advisor’s positions are subject to speculative limits. The CFTC and domestic exchanges have established speculative position limits on the maximum futures position which any person, or group of persons acting in concert, may hold or control in particular futures contracts or options on futures contracts traded on U.S. commodity exchanges. Under current regulations, other accounts of the Trading Advisors are combined with the positions held by them on behalf of the applicable Trading Company for position limit purposes. This trading could preclude additional trading in these commodities by the Trading Advisors for the accounts of the Series.
Systematic strategies do not consider fundamental types of data and do not have the benefit of discretionary decision making. The assets of the Series are allocated to Trading Advisors that rely on technical, systematic strategies that do not take into account factors external to the market itself (although certain of these strategies may have minor discretionary elements incorporated into their systematic strategy). The widespread use of technical trading systems frequently results in numerous trading advisors attempting to execute similar trades at or about the same time, altering trading patterns and affecting market liquidity. Furthermore, the profit potential of trend-following systems may be diminished by the changing character of the markets, which may make historical price data (on which technical programs are based) only marginally relevant to future market patterns. Systematic strategies are developed on the basis of a statistical analysis of market prices. Consequently, any factor external to the market itself that dominates prices that a discretionary decision maker may take into account may cause major losses for a systematic strategy. For example, a pending political or economic event may be very likely to cause a major price movement, but a systematic strategy may continue to maintain positions indicated by its trading method that might incur major losses if the event proved to be adverse.
However, because certain of the Trading Advisors’ strategies involve some discretionary aspects in addition to their technical factors, certain of the Trading Advisors may occasionally use discretion in investing the assets of a Trading Company. For example, the Trading Advisors often use discretion in selecting contracts and markets to be followed. In exercising such discretion, such Trading Advisor may take positions opposite to those recommended by the Trading Advisor’s trading system or signals. Discretionary decision making may also result in a Trading Advisor failing to capitalize on certain price trends or making unprofitable trades in a situation
where another trader relying solely on a systematic approach might not have done so. Furthermore, such use of discretion may not enable the relevant Series of the Trust to avoid losses, and in fact, such use of discretion may cause such Series to forego profits which it may have otherwise earned had such discretion not been used.
Qualitative Disclosures Regarding Means of Managing Risk Exposure
The means by which the Managing Owner attempts to manage the risk of the Trust’s open positions is essentially the same in all market categories traded. The Managing Owner applies risk management policies to trading which generally are designed to limit the total exposure of assets under management. In addition, the Managing Owner follows diversification guidelines which are often formulated in terms of the balanced volatility between markets and correlated groups.
| ITEM 4. | CONTROLS AND PROCEDURES |
Evaluation of disclosure controlsDisclosure Controls and proceduresProcedures
Under the supervision and with the participation of the management of the Managing Owner, including its Chief Executive Officer and Chief Financial Officer, the Trust evaluated the effectiveness of the design and operation of the disclosure controls and procedures (as defined in Rule 13a-15(e) under the Securities Exchange Act of 1934, as amended (the “Exchange Act”), for the Trust and each Series as of JuneSeptember 30, 2013 (the “Evaluation Date”). Any control system, no matter how well designed and operated, can provide only reasonable (not absolute) assurance that its objectives will be met. Furthermore, no evaluation of controls can provide absolute assurance that all control issues and instances of fraud, if any, have been detected. Based upon our evaluation, the Chief Executive Officer and Chief Financial Officer of the Managing Owner concluded that, as of the Evaluation Date, the disclosure controls and procedures for the Trust and each Series were effective to provide reasonable assurance that they are timely alerted to the material information relating to the Trust and each Series required to be included in the Trust’s periodic SEC filings.
Changes in Internal Control Over Financial Reporting
There were no changes in the Trust’s internal control over financial reporting during the sixnine months ended JuneSeptember 30, 2013, that have materially affected, or are reasonably likely to materially affect, the Trust’s internal control over financial reporting.
Scope of Exhibit 31 Certifications
The certifications of the Chief Executive Officer and the Chief Financial Officer of the Managing Owner included as Exhibits 31.1 and 31.2, respectively, to this Form 10-Q apply not only to the Trust as a whole but also to each Series individually.
| ITEM 1. | LEGAL PROCEEDINGS. |
None
| ITEM 1A. | RISK FACTORS. |
The section entitled “Risk Factors” beginning on page 20 of the Prospectus filed pursuant to Rule 424(b)(3) (File No. 333-185695) is incorporated by reference into this section.
| ITEM 2. | UNREGISTERED SALES OF EQUITY SECURITIES AND USE OF PROCEEDS. |
The following table provides information regarding the sale of unregistered Units by the Registrant for the three months ended JuneSeptember 30, 2013. The number of Units listed below for each transaction is the aggregate number of Units in the particular Series of the Trust purchased in such transaction. The consideration listed below for each transaction is, except as otherwise noted, the aggregate amount of cash paid for the Units purchased. For each transaction reported below, the price per Unit was NAV per Unit at the time of the transaction and the Managing Owner of the Trust was the purchaser of the Units. No underwriting discount or sales commission was paid or received with respect to any of the transactions reported below. The Registrant claims an exemption from registration of each of the transactions listed below under Section 4(2) of the Securities Act, as a sale by an issuer not involving a public offering.
SERIES | DATE | UNITS | CONSIDERATION | |||
NONE |
One hundred percent of the offering proceeds from the sale of Units are initially available for the Series’ trading activities.
| ITEM 3. | DEFAULTS UPON SENIOR SECURITIES. |
None
| ITEM 4. | MINE SAFETY DISCLOSURES. |
Not applicable.
| ITEM 5. | OTHER INFORMATION. |
None
| ITEM 6. | EXHIBITS. |
Exhibits (numbered in accordance with Item 601 of Regulation S-K)
| 4.1 | Declaration of Trust and Amended and Restated Trust Agreement of the Registrant (annexed to the prospectus as Exhibit A) **** | |
| 31.1 | Certification of Principal Executive Officer of the Managing Owner pursuant to Rules 1 3a-14(a) and 15(d)-14(a) of the Securities Exchange Act of 1934 (furnished herewith) | |
| 31.2 | Certification of Principal Financial Officer of the Managing Owner pursuant to Rules 1 3a-14(a) and 1 5(d)-14(a) of the Securities Exchange Act of 1934 (furnished herewith) | |
| 32.1 | Certification pursuant to 18 U.S.C. Section 1350, as enacted by Section 906 of The Sarbanes- Oxley Act of 2002. (furnished herewith) | |
| 32.2 | Certification pursuant to 18 U.S.C. Section 1350, as enacted by Section 906 of The Sarbanes- Oxley Act of 2002. (furnished herewith) | |
| 32.3 | Certification pursuant to 18 U.S.C. Section 1350, as enacted by Section 906 of The Sarbanes- Oxley Act of 2002. (furnished herewith) | |
| 32.4 | Certification pursuant to 18 U.S.C. Section 1350, as enacted by Section 906 of The Sarbanes- Oxley Act of 2002. (furnished herewith) | |
| 32.5 | Certification pursuant to 18 U.S.C. Section 1350, as enacted by Section 906 of The Sarbanes- Oxley Act of 2002. (furnished herewith) | |
| 32.6 | Certification pursuant to 18 U.S.C. Section 1350, as enacted by Section 906 of The Sarbanes- Oxley Act of 2002. (furnished herewith) | |
| 32.7 | Certification pursuant to 18 U.S.C. Section 1350, as enacted by Section 906 of The Sarbanes- Oxley Act of 2002. (furnished herewith) | |
| 32.8 | Certification pursuant to 18 U.S.C. Section 1350, as enacted by Section 906 of The Sarbanes- Oxley Act of 2002. (furnished herewith) | |
| 101 | Financials in XBRL format | |
| **** | Previously filed and incorporated by reference from the Prospectus filed pursuant to Rule 424(b)(3) filed May |
Pursuant to the requirements of the Securities Exchange Act of 1934, the registrant has duly caused this report to be signed on its behalf by the undersigned thereunto duly authorized.
| The Frontier Fund | ||||
| (Registrant) | ||||
| Date: | ||||
| By: | /s/ ROBERT J. ENCK | |||
| Robert J. Enck | ||||
| President and Chief Executive Officer of Equinox Fund Management, LLC, the Managing Owner of The Frontier Fund | ||||
SIGNATURES
Pursuant to the requirements of the Securities Exchange Act of 1934, the registrant has duly caused this report to be signed on its behalf by the undersigned thereunto duly authorized.
| Balanced Series, | ||||
a Series of The Frontier Fund (Registrant) | ||||
| Date: | ||||
| By: | /s/ ROBERT J. ENCK | |||
| Robert J. Enck | ||||
| President and Chief Executive Officer of Equinox Fund Management, LLC, the Managing Owner of The Frontier Fund | ||||
SIGNATURES
Pursuant to the requirements of the Securities Exchange Act of 1934, the registrant has duly caused this report to be signed on its behalf by the undersigned thereunto duly authorized.
| Frontier Heritage Series (formerly Winton/Graham Series), | ||||
| a Series of The Frontier Fund | ||||
| (Registrant) | ||||
| Date: | ||||
| By: | /s/ ROBERT J. ENCK | |||
| Robert J. Enck | ||||
| President and Chief Executive Officer of Equinox Fund Management, LLC, the Managing Owner of The Frontier Fund | ||||
SIGNATURES
Pursuant to the requirements of the Securities Exchange Act of 1934, the registrant has duly caused this report to be signed on its behalf by the undersigned thereunto duly authorized.
| Winton Series, | ||||
| a Series of The Frontier Fund | ||||
| (Registrant) | ||||
| Date: | ||||
| By: | /s/ ROBERT J. ENCK | |||
| Robert J. Enck | ||||
| President and Chief Executive Officer of Equinox Fund Management, LLC, the Managing Owner of The Frontier Fund | ||||
SIGNATURES
Pursuant to the requirements of the Securities Exchange Act of 1934, the registrant has duly caused this report to be signed on its behalf by the undersigned thereunto duly authorized.
Frontier Select Series (formerly Tiverton/Graham/Transtrend Series), | ||||
a Series of The Frontier Fund (Registrant) | ||||
| Date: | ||||
| By: | /s/ ROBERT J. ENCK | |||
| Robert J. Enck | ||||
| President and Chief Executive Officer of Equinox Fund Management, LLC, the Managing Owner of The Frontier Fund | ||||
SIGNATURES
Pursuant to the requirements of the Securities Exchange Act of 1934, the registrant has duly caused this report to be signed on its behalf by the undersigned thereunto duly authorized.
| Frontier Long/Short Commodity Series, | ||||
| a Series of The Frontier Fund | ||||
| (Registrant) | ||||
| Date: | ||||
| By: | /s/ ROBERT J. ENCK | |||
| Robert J. Enck | ||||
President and Chief Executive Officer of Equinox Fund Management, LLC, the Managing Owner of The Frontier Fund | ||||
SIGNATURES
Pursuant to the requirements of the Securities Exchange Act of 1934, the registrant has duly caused this report to be signed on its behalf by the undersigned thereunto duly authorized.
| Frontier Diversified Series, | ||||
| a Series of The Frontier Fund | ||||
| (Registrant) | ||||
| Date: | ||||
| By: | /s/ ROBERT J. ENCK | |||
| Robert J. Enck | ||||
President and Chief Executive Officer of Equinox Fund Management, LLC, the Managing Owner of The Frontier Fund | ||||
SIGNATURES
Pursuant to the requirements of the Securities Exchange Act of 1934, the registrant has duly caused this report to be signed on its behalf by the undersigned thereunto duly authorized.
| Frontier Masters Series, | ||||
| a Series of The Frontier Fund | ||||
| (Registrant) | ||||
| Date: | ||||
| By: | /s/ ROBERT J. ENCK | |||
| Robert J. Enck | ||||
President and Chief Executive Officer of Equinox Fund Management, LLC, the Managing Owner of The Frontier Fund | ||||
130119