UNITED STATES
SECURITIES AND EXCHANGE COMMISSION
WASHINGTON, DC 20549
FORM 10-Q
| x | QUARTERLY REPORT PURSUANT TO SECTION 13 OR 15(d) OF THE SECURITIES EXCHANGE ACT OF 1934 |
For the Period Ended March 31,June 30, 2015
OR
| ¨ | TRANSITION REPORT PURSUANT TO SECTION 13 OR 15(d) OF THE SECURITIES EXCHANGE ACT OF 1934 |
Commission File Number 000-51274
EQUINOX FRONTIER FUNDS
EQUINOX FRONTIER DIVERSIFIED FUND;
EQUINOX FRONTIER LONG/SHORT COMMODITY FUND;
EQUINOX FRONTIER MASTERS FUND;
EQUINOX FRONTIER BALANCED FUND;
EQUINOX FRONTIER SELECT FUND;
EQUINOX FRONTIER WINTON FUND;
EQUINOX FRONTIER HERITAGE FUND
(Exact Name of Registrant as specified in its Charter)
| Delaware | 36-6815533 | |
(State of Organization) | (IRS Employer Identification No.) |
c/o Equinox Fund Management, LLC
1775 Sherman Street, Suite 2500
Denver, Colorado 80203
(Address of Principal Executive Offices)
(303) 837-0600
(Registrant’s Telephone Number)
Securities to be registered pursuant to Section 12(b) of the Act: None
Securities registered pursuant to Section 12(g) of the Act:
Equinox Frontier Diversified Fund Class 1, Class 2 and Class 3 Units;
Equinox Frontier Long/Short Commodity Fund Class 1, Class 2, Class 3, Class 1a, Class 2a and Class 3a Units;
Equinox Frontier Masters Fund Class 1, Class 2 and Class 3 Units;
Equinox Frontier Balanced Fund Class 1, Class 2, Class 3, Class 1a, Class 2a and Class 3a Units;
Equinox Frontier Select Fund Class 1, Class 2 and Class 23 Units;
Equinox Frontier Winton Fund Class 1, Class 2 and Class 23 Units;
Equinox Frontier Heritage Fund Class 1, Class 2 and Class 23 Units
Indicate by check mark whether the registrant: (1) has filed all reports required to be filed by Section 13 or 15(d) of the Securities Exchange Act of 1934 during the preceding 12 months (or for such shorter period that the registrant was required to file such reports), and (2) has been subject to such filing requirements for the past 90 days. Yes x No ¨
Indicate by check mark whether the registrant has submitted electronically and posted on its corporate Web site, if any, every Interactive Data File required to be submitted and posted pursuant to Rule 405 of Regulation S-T (§232.405 of this chapter) during the preceding 12 months (or for such shorter period that the registrant was required to submit and post such files) Yes x No ¨
Indicate by check mark whether the registrant is a large accelerated filer, an accelerated filer, a non-accelerated filer, or a smaller reporting company. See the definitions of “large accelerated filer,” “accelerated filer” and “smaller reporting company” in Rule 12b-2 of the Exchange Act.
| Large Accelerated Filer | ¨ | Accelerated Filer | ¨ | |||
| Non-Accelerated Filer | x (Do not check if a smaller reporting company) | Smaller reporting company | ¨ | |||
Indicate by check mark whether the registrant is a shell company (as defined in Rule 12b-21 2b-2 of the Exchange Act). Yes ¨ No x
Item 1. | |||||||
Statements of Financial Condition as of | 4 | ||||||
Condensed Schedules of Investments as of | 7 | ||||||
Statements of Cash Flows for the | |||||||
Trust Financial Statements (1) | |||||||
Item 2. | Management’s Discussion and Analysis of Financial Condition and Results of Operations | ||||||
Item 3. | |||||||
Item 4. | |||||||
Item 1. | |||||||
Item 1A. | |||||||
Item 2. | |||||||
Item 3. | |||||||
Item 4. | |||||||
Item 5. | |||||||
Item 6. | |||||||
| 117 | |||||||
| (1) | These financial statements represent the consolidated financial statements of the Series of the Trust. |
Special Note About Forward-Looking Statements
THIS REPORT CONTAINS STATEMENTS WHICH CONSTITUTE FORWARD-LOOKING STATEMENTS WITHIN THE MEANING OF THE PRIVATE SECURITIES LITIGATION REFORM ACT OF 1995 AND OTHER FEDERAL SECURITIES LAWS. THESE FORWARD-LOOKING STATEMENTS REFLECT THE MANAGING OWNER’S CURRENT EXPECTATIONS ABOUT THE FUTURE RESULTS, PERFORMANCE, PROSPECTS AND OPPORTUNITIES OF THE TRUST. THE MANAGING OWNER HAS TRIED TO IDENTIFY THESE FORWARD-LOOKING STATEMENTS BY USING WORDS SUCH AS “MAY,” “WILL,” “EXPECT,” “ANTICIPATE,” “BELIEVE,” “INTEND,” “SHOULD,” “ESTIMATE” OR THE NEGATIVE OF THOSE TERMS OR SIMILAR EXPRESSIONS. THESE FORWARD-LOOKING STATEMENTS ARE BASED ON INFORMATION CURRENTLY AVAILABLE TO THE MANAGING OWNER AND ARE SUBJECT TO A NUMBER OF RISKS, UNCERTAINTIES AND OTHER FACTORS, BOTH KNOWN, SUCH AS THOSE DESCRIBED IN THE “RISK FACTORS” SECTION UNDER ITEM 1A AND ELSEWHERE IN THIS REPORT, AND UNKNOWN, THAT COULD CAUSE THE TRUST’S ACTUAL RESULTS, PERFORMANCE, PROSPECTS OR OPPORTUNITIES TO DIFFER MATERIALLY FROM THOSE EXPRESSED IN, OR IMPLIED BY, THESE FORWARD-LOOKING STATEMENTS.
YOU SHOULD NOT PLACE UNDUE RELIANCE ON ANY FORWARD-LOOKING STATEMENTS. EXCEPT AS EXPRESSLY REQUIRED BY THE FEDERAL SECURITIES LAWS, THE MANAGING OWNER UNDERTAKES NO OBLIGATION TO PUBLICLY UPDATE OR REVISE ANY FORWARD-LOOKING STATEMENTS OR THE RISKS, UNCERTAINTIES OR OTHER FACTORS DESCRIBED HEREIN, AS A RESULT OF NEW INFORMATION, FUTURE EVENTS OR CHANGED CIRCUMSTANCES OR FOR ANY OTHER REASON AFTER THE DATE OF THIS REPORT.
UNLESS EXPRESSLY STATED OTHERWISE, ALL INFORMATION IN THIS REPORT IS AS OF MARCH 31,JUNE 30, 2015, AND THE MANAGING OWNER UNDERTAKES NO OBLIGATION TO UPDATE THIS INFORMATION.
| ITEM 1. | Financial Statements |
The Series of Equinox Frontier Funds
Statements of Financial Condition
March 31,June 30, 2015 (Unaudited) and December 31, 2014
| Equinox Frontier Diversified Fund | Equinox Frontier Masters Fund | Equinox Frontier Long/Short Commodity Fund | ||||||||||||||||||||||||||||||||||||||||||||||
| 3/31/2015 | 12/31/2014 | 3/31/2015 | 12/31/2014 | 3/31/2015 | 12/31/2014 | Equinox Frontier Diversified Fund | Equinox Frontier Masters Fund | Equinox Frontier Long/Short Commodity Fund | ||||||||||||||||||||||||||||||||||||||||
| 6/30/2015 | 12/31/2014 | 6/30/2015 | 12/31/2014 | 6/30/2015 | 12/31/2014 | |||||||||||||||||||||||||||||||||||||||||||
| ASSETS | ||||||||||||||||||||||||||||||||||||||||||||||||
Cash and cash equivalents | $ | 2,117,560 | $ | 4,210,638 | $ | 896,661 | $ | 2,199,066 | $ | 600,918 | $ | 1,110,779 | $ | 4,827,779 | $ | 4,210,638 | $ | 1,978,484 | $ | 2,199,066 | $ | 1,119,846 | $ | 1,110,779 | ||||||||||||||||||||||||
U.S. Treasury securities, at fair value | 36,701,926 | 31,051,659 | 15,541,089 | 16,217,173 | 10,415,223 | 8,191,519 | 29,071,240 | 31,051,659 | 11,913,754 | 16,217,173 | 6,743,330 | 8,191,519 | ||||||||||||||||||||||||||||||||||||
Open trade equity, at fair value | 2,569,506 | 3,215,206 | — | — | — | — | — | 3,215,206 | — | — | — | — | ||||||||||||||||||||||||||||||||||||
Options purchased, at fair value | 325,003 | 288,413 | — | — | — | — | 374,470 | 288,413 | — | — | — | — | ||||||||||||||||||||||||||||||||||||
Receivable from futures commission merchants | 19,513,460 | 22,731,129 | — | — | — | — | 14,670,707 | 22,731,129 | — | — | — | — | ||||||||||||||||||||||||||||||||||||
Swap contracts, at fair value | 9,559,124 | 6,570,408 | — | — | 5,301,972 | 3,633,060 | 7,615,169 | 6,570,408 | — | — | 4,304,209 | 3,633,060 | ||||||||||||||||||||||||||||||||||||
Investments in unconsolidated trading companies, at fair value | 6,464,972 | 6,594,379 | 10,915,655 | 7,901,978 | 3,000,921 | 3,814,854 | 6,198,464 | 6,594,379 | 8,767,520 | 7,901,978 | 3,896,994 | 3,814,854 | ||||||||||||||||||||||||||||||||||||
Prepaid service fees - Class 1 | 14,584 | 9,534 | 7,735 | 6,003 | 183 | 505 | 23,618 | 9,534 | 5,889 | 6,003 | 410 | 505 | ||||||||||||||||||||||||||||||||||||
Interest receivable | 209,915 | 477,250 | 88,886 | 249,250 | 59,567 | 125,900 | 498,272 | 477,250 | 204,198 | 249,250 | 115,577 | 125,900 | ||||||||||||||||||||||||||||||||||||
Receivable from related parties | — | — | 2,452 | 3,050 | 2,274 | 2,612 | — | — | 2,976 | 3,050 | 2,082 | 2,612 | ||||||||||||||||||||||||||||||||||||
Other assets | — | 249,997 | — | — | — | — | — | 249,997 | — | — | — | — | ||||||||||||||||||||||||||||||||||||
|
|
|
|
|
|
|
|
|
|
|
| |||||||||||||||||||||||||||||||||||||
Total Assets | $ | 77,476,050 | $ | 75,398,613 | $ | 27,452,478 | $ | 26,576,520 | $ | 19,381,058 | $ | 16,879,229 | $ | 63,279,719 | $ | 75,398,613 | $ | 22,872,821 | $ | 26,576,520 | $ | 16,182,448 | $ | 16,879,229 | ||||||||||||||||||||||||
|
|
|
|
|
| |||||||||||||||||||||||||||||||||||||||||||
|
|
|
|
|
| |||||||||||||||||||||||||||||||||||||||||||
| LIABILITIES & CAPITAL | ||||||||||||||||||||||||||||||||||||||||||||||||
LIABILITIES | ||||||||||||||||||||||||||||||||||||||||||||||||
Open trade deficit, at fair value | $ | — | $ | — | $ | — | $ | — | $ | — | $ | — | $ | 571,551 | $ | — | $ | — | $ | — | $ | — | $ | — | ||||||||||||||||||||||||
Options written, at fair value | 107,167 | 253,018 | — | — | — | — | 219,660 | 253,018 | — | — | — | — | ||||||||||||||||||||||||||||||||||||
Pending owner additions | 1,807 | 1,527 | 2,295 | 2,056 | — | — | 1,320 | 1,527 | 1,566 | 2,056 | — | — | ||||||||||||||||||||||||||||||||||||
Owner redemptions payable | 207,963 | 57,953 | 37,184 | — | 10,643 | 19,578 | — | 57,953 | — | — | 796 | 19,578 | ||||||||||||||||||||||||||||||||||||
Incentive fees payable to Managing Owner | 1,634,242 | 2,387,825 | 535,301 | 722,043 | 239,216 | 158,660 | 4,000 | 2,387,825 | 41,071 | 722,043 | 40,149 | 158,660 | ||||||||||||||||||||||||||||||||||||
Management fees payable to Managing Owner | 88,283 | 86,486 | 67,463 | 64,497 | 43,562 | 45,361 | 83,476 | 86,486 | 60,312 | 64,497 | 45,710 | 45,361 | ||||||||||||||||||||||||||||||||||||
Interest payable to Managing Owner | 17,078 | 16,168 | 6,125 | 6,898 | 4,460 | 3,713 | 15,798 | 16,168 | 5,738 | 6,898 | 3,616 | 3,713 | ||||||||||||||||||||||||||||||||||||
Service fees payable to Managing Owner | 33,996 | 34,905 | 21,211 | 17,260 | 11,078 | 10,562 | 36,650 | 34,905 | 15,452 | 17,260 | 9,149 | 10,562 | ||||||||||||||||||||||||||||||||||||
Trading fees payable to Managing Owner | 143,660 | 132,984 | 56,844 | 55,912 | 25,446 | 24,436 | 124,327 | 132,984 | 50,813 | 55,912 | 21,626 | 24,436 | ||||||||||||||||||||||||||||||||||||
Payables to related parties | 3,506 | 2,371 | — | — | — | — | 3,544 | 2,371 | — | — | — | — | ||||||||||||||||||||||||||||||||||||
Other liabilities | — | — | — | — | — | — | — | — | — | — | — | — | ||||||||||||||||||||||||||||||||||||
|
|
|
|
|
|
|
|
|
|
|
| |||||||||||||||||||||||||||||||||||||
Total Liabilities | 2,237,702 | 2,973,237 | 726,423 | 868,666 | 334,405 | 262,310 | 1,060,326 | 2,973,237 | 174,952 | 868,666 | 121,046 | 262,310 | ||||||||||||||||||||||||||||||||||||
|
|
|
|
|
| |||||||||||||||||||||||||||||||||||||||||||
|
|
|
|
|
| |||||||||||||||||||||||||||||||||||||||||||
CAPITAL | ||||||||||||||||||||||||||||||||||||||||||||||||
Managing Owner Units - Class 1 | — | — | — | — | — | — | — | — | — | — | — | — | ||||||||||||||||||||||||||||||||||||
Managing Owner Units - Class 2 | 2,942,625 | 2,516,879 | 799,673 | 723,207 | 511,807 | 426,377 | 2,594,028 | 2,516,879 | 688,269 | 723,207 | 456,774 | 426,377 | ||||||||||||||||||||||||||||||||||||
Managing Owner Units - Class 2a | — | — | — | — | 296,641 | 247,434 | — | — | — | — | 264,519 | 247,434 | ||||||||||||||||||||||||||||||||||||
Managing Owner Units - Class 3 | 37,006 | 31,632 | 36,225 | 32,741 | — | — | 32,642 | 31,632 | 31,198 | 32,741 | — | — | ||||||||||||||||||||||||||||||||||||
Managing Owner Units - Class 3a | — | — | — | — | 14,668 | 12,228 | — | — | — | — | 13,088 | 12,228 | ||||||||||||||||||||||||||||||||||||
Limited Owner Units - Class 1 | 20,268,019 | 19,195,036 | 12,259,432 | 11,850,911 | — | — | 15,940,760 | 19,195,036 | 9,077,720 | 11,850,911 | — | — | ||||||||||||||||||||||||||||||||||||
Limited Owner Units - Class 1a | — | — | — | — | 6,448,293 | 5,776,906 | — | — | — | — | 5,306,714 | 5,776,906 | ||||||||||||||||||||||||||||||||||||
Limited Owner Units - Class 2 | 33,113,368 | 32,707,413 | 8,748,881 | 8,145,536 | 935,888 | 820,104 | 29,124,659 | 32,707,413 | 7,316,511 | 8,145,536 | 705,224 | 820,104 | ||||||||||||||||||||||||||||||||||||
Limited Owner Units - Class 2a | — | — | — | — | 1,628,091 | 1,455,117 | — | — | — | — | 1,284,389 | 1,455,117 | ||||||||||||||||||||||||||||||||||||
Limited Owner Units - Class 3 | 7,832,414 | 5,556,649 | 4,881,844 | 4,955,459 | 8,438,115 | 7,233,099 | 7,434,967 | 5,556,649 | 5,584,171 | 4,955,459 | 7,309,331 | 7,233,099 | ||||||||||||||||||||||||||||||||||||
Limited Owner Units - Class 3a | — | — | — | — | 773,150 | 645,654 | — | — | — | — | 721,363 | 645,654 | ||||||||||||||||||||||||||||||||||||
|
|
|
|
|
|
|
|
|
|
|
| |||||||||||||||||||||||||||||||||||||
Total Owners’ Capital | 64,193,432 | 60,007,609 | 26,726,055 | 25,707,854 | 19,046,653 | 16,616,919 | 55,127,056 | 60,007,609 | 22,697,869 | 25,707,854 | 16,061,402 | 16,616,919 | ||||||||||||||||||||||||||||||||||||
|
|
|
|
|
| |||||||||||||||||||||||||||||||||||||||||||
|
|
|
|
|
| |||||||||||||||||||||||||||||||||||||||||||
Non-Controlling Interests | 11,044,916 | 12,417,767 | — | — | — | — | 7,092,337 | 12,417,767 | — | — | — | — | ||||||||||||||||||||||||||||||||||||
|
|
|
|
|
|
|
|
|
|
|
| |||||||||||||||||||||||||||||||||||||
Total Capital | 75,238,348 | 72,425,376 | 26,726,055 | 25,707,854 | 19,046,653 | 16,616,919 | 62,219,393 | 72,425,376 | 22,697,869 | 25,707,854 | 16,061,402 | 16,616,919 | ||||||||||||||||||||||||||||||||||||
|
|
|
|
|
|
|
|
|
|
|
| |||||||||||||||||||||||||||||||||||||
Total Liabilities and Capital | $ | 77,476,050 | $ | 75,398,613 | $ | 27,452,478 | $ | 26,576,520 | $ | 19,381,058 | $ | 16,879,229 | $ | 63,279,719 | $ | 75,398,613 | $ | 22,872,821 | $ | 26,576,520 | $ | 16,182,448 | $ | 16,879,229 | ||||||||||||||||||||||||
|
|
|
|
|
| |||||||||||||||||||||||||||||||||||||||||||
|
|
|
|
|
| |||||||||||||||||||||||||||||||||||||||||||
Units Outstanding | ||||||||||||||||||||||||||||||||||||||||||||||||
Class 1 | 153,947 | 169,725 | 95,494 | 101,632 | N/A | N/A | 137,951 | 169,725 | 82,514 | 101,632 | N/A | N/A | ||||||||||||||||||||||||||||||||||||
Class 1a | N/A | N/A | N/A | N/A | 53,422 | 57,130 | N/A | N/A | N/A | N/A | 49,518 | 57,130 | ||||||||||||||||||||||||||||||||||||
Class 2 | 247,362 | 282,534 | 67,189 | 69,003 | 8,721 | 9,013 | 246,850 | 282,534 | 65,443 | 69,003 | 7,843 | 9,013 | ||||||||||||||||||||||||||||||||||||
Class 2a | N/A | N/A | N/A | N/A | 14,419 | 15,291 | N/A | N/A | N/A | N/A | 13,013 | 15,291 | ||||||||||||||||||||||||||||||||||||
Class 3 | 58,480 | 48,583 | 37,335 | 41,897 | 50,814 | 52,285 | 62,912 | 48,583 | 49,497 | 41,897 | 49,320 | 52,285 | ||||||||||||||||||||||||||||||||||||
Class 3a | N/A | N/A | N/A | N/A | 5,876 | 5,886 | N/A | N/A | N/A | N/A | 6,139 | 5,886 | ||||||||||||||||||||||||||||||||||||
Net Asset Value per Unit | ||||||||||||||||||||||||||||||||||||||||||||||||
Class 1 | $ | 131.66 | $ | 113.09 | $ | 128.38 | $ | 116.61 | N/A | N/A | $ | 115.55 | $ | 113.09 | $ | 110.01 | $ | 116.61 | N/A | N/A | ||||||||||||||||||||||||||||
Class 1a | N/A | N/A | N/A | N/A | $ | 120.70 | $ | 101.12 | N/A | N/A | N/A | N/A | $ | 107.17 | $ | 101.12 | ||||||||||||||||||||||||||||||||
Class 2 | $ | 145.76 | $ | 124.67 | $ | 142.12 | $ | 128.53 | $ | 166.20 | $ | 138.30 | $ | 128.49 | $ | 124.67 | $ | 122.32 | $ | 128.53 | $ | 148.16 | $ | 138.30 | ||||||||||||||||||||||||
Class 2a | N/A | N/A | N/A | N/A | $ | 133.49 | $ | 111.35 | N/A | N/A | N/A | N/A | $ | 119.03 | $ | 111.35 | ||||||||||||||||||||||||||||||||
Class 3 | $ | 134.57 | $ | 115.03 | $ | 131.73 | $ | 119.06 | $ | 166.06 | $ | 138.34 | $ | 118.70 | $ | 115.03 | $ | 113.45 | $ | 119.06 | $ | 148.20 | $ | 138.34 | ||||||||||||||||||||||||
Class 3a | N/A | N/A | N/A | N/A | $ | 134.09 | $ | 111.77 | N/A | N/A | N/A | N/A | $ | 119.64 | $ | 111.77 | ||||||||||||||||||||||||||||||||
The accompanying notes are an integral part of these financial statements.
The Series of Equinox Frontier Funds
Statements of Financial Condition
March 31,June 30, 2015 (Unaudited) and December 31, 2014
| Equinox Frontier Balanced Fund | Equinox Frontier Select Fund | Equinox Frontier Balanced Fund | Equinox Frontier Select Fund | |||||||||||||||||||||||||||||
| 3/31/2015 | 12/31/2014 | 3/31/2015 | 12/31/2014 | 6/30/2015 | 12/31/2014 | 6/30/2015 | 12/31/2014 | |||||||||||||||||||||||||
ASSETS | ||||||||||||||||||||||||||||||||
Cash and cash equivalents | $ | 3,273,398 | $ | 5,644,510 | $ | 207,627 | $ | 878,280 | $ | 7,863,320 | $ | 5,644,510 | $ | 401,143 | $ | 878,280 | ||||||||||||||||
U.S. Treasury securities, at fair value | 56,735,098 | 41,625,860 | 3,598,631 | 6,476,939 | 47,350,232 | 41,625,860 | 2,415,549 | 6,476,939 | ||||||||||||||||||||||||
Receivable from futures commission merchants | 11,166,903 | 22,689,948 | 14,715,637 | — | 9,422,019 | 22,689,948 | 12,410,448 | — | ||||||||||||||||||||||||
Open trade equity, at fair value | 268,978 | 3,297,549 | 958,673 | — | — | 3,297,549 | 55,956 | — | ||||||||||||||||||||||||
Options purchased, at fair value | — | — | — | — | — | — | — | — | ||||||||||||||||||||||||
Swap contracts, at fair value | 23,473,632 | 18,246,954 | — | — | 18,491,634 | 18,246,954 | — | — | ||||||||||||||||||||||||
Investments in unconsolidated trading companies, at fair value | 17,442,848 | 18,343,927 | 4,733,469 | 8,102,141 | 14,333,796 | 18,343,927 | 4,013,269 | 8,102,141 | ||||||||||||||||||||||||
Interest receivable | 324,494 | 639,769 | 20,582 | 99,547 | 811,568 | 639,769 | 41,402 | 99,547 | ||||||||||||||||||||||||
Prepaid service fees | — | — | — | — | — | — | — | — | ||||||||||||||||||||||||
Other assets | 11 | 250,013 | — | — | 10 | 250,013 | — | — | ||||||||||||||||||||||||
|
|
|
|
|
|
|
| |||||||||||||||||||||||||
Total Assets | $ | 112,685,362 | $ | 110,738,530 | $ | 24,234,619 | $ | 15,556,907 | $ | 98,272,579 | $ | 110,738,530 | $ | 19,337,767 | $ | 15,556,907 | ||||||||||||||||
|
|
|
| |||||||||||||||||||||||||||||
|
|
|
| |||||||||||||||||||||||||||||
LIABILITIES & CAPITAL | ||||||||||||||||||||||||||||||||
LIABILITIES | ||||||||||||||||||||||||||||||||
Open trade deficit, at fair value | $ | — | $ | — | $ | — | $ | — | $ | 778,963 | $ | — | $ | — | $ | — | ||||||||||||||||
Options written, at fair value | — | — | — | — | — | — | — | — | ||||||||||||||||||||||||
Pending owner additions | 20,874 | 18,002 | 1,872 | 1,485 | 17,442 | 18,002 | 1,411 | 1,485 | ||||||||||||||||||||||||
Owner redemptions payable | 21,251 | 22,793 | 15,308 | 15,432 | 9,088 | 22,793 | — | 15,432 | ||||||||||||||||||||||||
Incentive fees payable to Managing Owner | 1,486,957 | 1,793,318 | 158,971 | 185,791 | 9,517 | 1,793,318 | — | 185,791 | ||||||||||||||||||||||||
Management fees payable to Managing Owner | 93,825 | 101,208 | 28,962 | 27,835 | 91,646 | 101,208 | 26,065 | 27,835 | ||||||||||||||||||||||||
Interest payable to Managing Owner | 111,110 | 84,976 | 7,379 | 13,263 | 101,040 | 84,976 | 6,451 | 13,263 | ||||||||||||||||||||||||
Service fees payable to Managing Owner | 176,661 | 167,151 | 35,716 | 32,520 | 156,201 | 167,151 | 29,617 | 32,520 | ||||||||||||||||||||||||
Trading fees payable to Managing Owner | 71,244 | 66,037 | 10,852 | 10,119 | 65,193 | 66,037 | 9,285 | 10,119 | ||||||||||||||||||||||||
Payables to related parties | 17,396 | 14,934 | 1,081 | 984 | 19,434 | 14,934 | 1,195 | 984 | ||||||||||||||||||||||||
Other liabilities | — | — | — | — | — | — | — | — | ||||||||||||||||||||||||
|
|
|
|
|
|
|
| |||||||||||||||||||||||||
Total Liabilities | 1,999,318 | 2,268,419 | 260,141 | 287,429 | 1,248,524 | 2,268,419 | 74,024 | 287,429 | ||||||||||||||||||||||||
|
|
|
| |||||||||||||||||||||||||||||
|
|
|
| |||||||||||||||||||||||||||||
CAPITAL | ||||||||||||||||||||||||||||||||
Managing Owner Units - Class 2 | 1,624,326 | 1,425,355 | 10,125 | 9,052 | 1,449,802 | 1,425,355 | 8,389 | 9,052 | ||||||||||||||||||||||||
Managing Owner Units - Class 2a | 216,243 | 189,344 | — | — | 193,476 | 189,344 | — | — | ||||||||||||||||||||||||
Limited Owner Units - Class 1 | 78,309,904 | 72,098,275 | 14,900,908 | 13,663,563 | 68,562,471 | 72,098,275 | 12,000,655 | 13,663,563 | ||||||||||||||||||||||||
Limited Owner Units - Class 1AP | 842,256 | 748,275 | 54,412 | 47,785 | 724,876 | 748,275 | 45,084 | 47,785 | ||||||||||||||||||||||||
Limited Owner Units - Class 2 | 25,006,886 | 22,125,342 | 1,651,866 | 1,549,078 | 22,025,164 | 22,125,342 | 1,298,229 | 1,549,078 | ||||||||||||||||||||||||
Limited Owner Units - Class 2a | 402,173 | 410,943 | — | — | 359,830 | 410,943 | — | — | ||||||||||||||||||||||||
Limited Owner Units - Class 3a | 2,837,703 | 2,528,303 | — | — | 2,534,161 | 2,528,303 | — | — | ||||||||||||||||||||||||
|
|
|
|
|
|
|
| |||||||||||||||||||||||||
Total Owners’ Capital | 109,239,491 | 99,525,837 | 16,617,311 | 15,269,478 | 95,849,780 | 99,525,837 | 13,352,357 | 15,269,478 | ||||||||||||||||||||||||
|
|
|
| |||||||||||||||||||||||||||||
|
|
|
| |||||||||||||||||||||||||||||
Non-Controlling Interests | 1,446,553 | 8,944,274 | 7,357,167 | — | 1,174,275 | 8,944,274 | 5,911,386 | — | ||||||||||||||||||||||||
|
|
|
|
|
|
|
| |||||||||||||||||||||||||
Total Capital | 110,686,044 | 108,470,111 | 23,974,478 | 15,269,478 | 97,024,055 | 108,470,111 | 19,263,743 | 15,269,478 | ||||||||||||||||||||||||
|
|
|
|
|
|
|
| |||||||||||||||||||||||||
Total Liabilities and Capital | $ | 112,685,362 | $ | 110,738,530 | $ | 24,234,619 | $ | 15,556,907 | $ | 98,272,579 | $ | 110,738,530 | $ | 19,337,767 | $ | 15,556,907 | ||||||||||||||||
|
|
|
| |||||||||||||||||||||||||||||
|
|
|
| |||||||||||||||||||||||||||||
Units Outstanding | ||||||||||||||||||||||||||||||||
Class 1 | 526,293 | 548,117 | 140,357 | 142,913 | 520,129 | 548,117 | 137,450 | 142,913 | ||||||||||||||||||||||||
Class 1AP | 5,549 | 5,618 | 503 | 494 | 5,351 | 5,618 | 503 | 494 | ||||||||||||||||||||||||
Class 2 | 130,433 | 131,447 | 11,564 | 12,128 | 128,815 | 131,447 | 10,973 | 12,128 | ||||||||||||||||||||||||
Class 2a | 3,539 | 3,923 | N/A | N/A | 3,539 | 3,923 | N/A | N/A | ||||||||||||||||||||||||
Class 3a | 16,291 | 16,577 | N/A | N/A | 16,261 | 16,577 | N/A | N/A | ||||||||||||||||||||||||
Net Asset Value per Unit | ||||||||||||||||||||||||||||||||
Class 1 | $ | 148.80 | $ | 131.54 | $ | 106.16 | $ | 95.61 | $ | 131.82 | $ | 131.54 | $ | 87.31 | $ | 95.61 | ||||||||||||||||
Class 1AP | $ | 151.80 | $ | 133.20 | $ | 108.31 | $ | 96.82 | $ | 135.49 | $ | 133.20 | $ | 89.74 | $ | 96.82 | ||||||||||||||||
Class 2 | $ | 204.17 | $ | 179.16 | $ | 143.73 | $ | 128.48 | $ | 182.24 | $ | 179.16 | $ | 119.09 | $ | 128.48 | ||||||||||||||||
Class 2a | $ | 174.76 | $ | 153.02 | N/A | N/A | $ | 156.36 | $ | 153.02 | N/A | N/A | ||||||||||||||||||||
Class 3a | $ | 174.19 | $ | 152.52 | N/A | N/A | $ | 155.85 | $ | 152.52 | N/A | N/A | ||||||||||||||||||||
The accompanying notes are an integral part of these financial statements.
The Series of Equinox Frontier Funds
Statements of Financial Condition
March 31,June 30, 2015 (Unaudited) and December 31, 2014
| Equinox Frontier Winton Fund | Equinox Frontier Heritage Fund | Equinox Frontier Winton Fund | Equinox Frontier Heritage Fund | |||||||||||||||||||||||||||||
| 3/31/2015 | 12/31/2014 | 3/31/2015 | 12/31/2014 | 6/30/2015 | 12/31/2014 | 6/30/2015 | 12/31/2014 | |||||||||||||||||||||||||
ASSETS | ||||||||||||||||||||||||||||||||
Cash and cash equivalents | $ | 1,892,129 | $ | 4,012,974 | $ | 427,180 | $ | 921,598 | $ | 4,254,223 | $ | 4,012,974 | $ | 947,643 | $ | 921,598 | ||||||||||||||||
U.S. Treasury securities, at fair value | 32,794,705 | 29,593,974 | 7,403,953 | 6,796,392 | 25,617,478 | 29,593,974 | 5,706,384 | 6,796,392 | ||||||||||||||||||||||||
Investments in unconsolidated trading companies, at fair value | 8,972,672 | 7,479,658 | 1,723,907 | 1,543,386 | 6,749,039 | 7,479,658 | 1,398,043 | 1,543,386 | ||||||||||||||||||||||||
Swap contracts, at fair value | — | — | 9,600,330 | 7,540,465 | — | — | 7,809,251 | 7,540,465 | ||||||||||||||||||||||||
Interest receivable | 187,568 | 454,845 | 42,346 | 104,457 | 439,076 | 454,845 | 97,804 | 104,457 | ||||||||||||||||||||||||
Other assets | — | — | — | — | — | — | — | — | ||||||||||||||||||||||||
|
|
|
|
|
|
|
| |||||||||||||||||||||||||
Total Assets | $ | 43,847,074 | $ | 41,541,451 | $ | 19,197,716 | $ | 16,906,298 | $ | 37,059,816 | $ | 41,541,451 | $ | 15,959,125 | $ | 16,906,298 | ||||||||||||||||
|
|
|
| |||||||||||||||||||||||||||||
|
|
|
| |||||||||||||||||||||||||||||
LIABILITIES & CAPITAL | ||||||||||||||||||||||||||||||||
LIABILITIES | ||||||||||||||||||||||||||||||||
Pending owner additions | $ | 16,314 | $ | 15,503 | $ | 3,941 | $ | 3,381 | $ | 14,095 | $ | 15,503 | $ | 3,334 | $ | 3,381 | ||||||||||||||||
Owner redemptions payable | — | 21,902 | 2,673 | 21,408 | — | 21,902 | — | 21,408 | ||||||||||||||||||||||||
Incentive fees payable to Managing Owner | 715,409 | 1,178,364 | 132,678 | 239,327 | — | 1,178,364 | — | 239,327 | ||||||||||||||||||||||||
Management fees payable to Managing Owner | 115,137 | 114,823 | 27,355 | 27,944 | 102,252 | 114,823 | 23,699 | 27,944 | ||||||||||||||||||||||||
Interest payable to Managing Owner | 66,427 | 63,722 | 14,885 | 14,543 | 61,319 | 63,722 | 13,738 | 14,543 | ||||||||||||||||||||||||
Service fees payable to Managing Owner | 53,254 | 52,753 | 23,142 | 20,964 | 46,288 | 52,753 | 19,744 | 20,964 | ||||||||||||||||||||||||
Trading fees payable to Managing Owner | 27,597 | 26,690 | 9,353 | 8,676 | 24,963 | 26,690 | 8,305 | 8,676 | ||||||||||||||||||||||||
Payables to related parties | 20,681 | 16,461 | 3,464 | 3,178 | 24,445 | 16,461 | 3,773 | 3,178 | ||||||||||||||||||||||||
Other liabilities | — | — | — | — | — | — | — | — | ||||||||||||||||||||||||
|
|
|
|
|
|
|
| |||||||||||||||||||||||||
Total Liabilities | 1,014,819 | 1,490,218 | 217,491 | 339,421 | 273,362 | 1,490,218 | 72,593 | 339,421 | ||||||||||||||||||||||||
|
|
|
| |||||||||||||||||||||||||||||
|
|
|
| |||||||||||||||||||||||||||||
CAPITAL | ||||||||||||||||||||||||||||||||
Managing Owner Units - Class 2 | 51,380 | 46,764 | 86,468 | 75,621 | 44,739 | 46,764 | 74,291 | 75,621 | ||||||||||||||||||||||||
Limited Owner Units - Class 1 | 28,350,789 | 26,870,878 | 10,838,892 | 9,761,819 | 24,319,904 | 26,870,878 | 9,141,028 | 9,761,819 | ||||||||||||||||||||||||
Limited Owner Units - Class 1AP | 41,798 | 38,042 | 68,083 | 58,378 | 36,395 | 38,042 | 58,494 | 58,378 | ||||||||||||||||||||||||
Limited Owner Units - Class 2 | 14,388,288 | 13,095,549 | 3,481,025 | 3,131,561 | 12,385,416 | 13,095,549 | 2,973,068 | 3,131,561 | ||||||||||||||||||||||||
|
|
|
|
|
|
|
| |||||||||||||||||||||||||
Total Owners’ Capital | 42,832,255 | 40,051,233 | 14,474,468 | 13,027,379 | 36,786,454 | 40,051,233 | 12,246,881 | 13,027,379 | ||||||||||||||||||||||||
|
|
|
| |||||||||||||||||||||||||||||
|
|
|
| |||||||||||||||||||||||||||||
Non-Controlling Interests | — | — | 4,505,757 | 3,539,498 | — | — | 3,639,651 | 3,539,498 | ||||||||||||||||||||||||
|
|
|
|
|
|
|
| |||||||||||||||||||||||||
Total Capital | 42,832,255 | 40,051,233 | 18,980,225 | 16,566,877 | 36,786,454 | 40,051,233 | 15,886,532 | 16,566,877 | ||||||||||||||||||||||||
|
|
|
|
|
|
|
| |||||||||||||||||||||||||
Total Liabilities and Capital | $ | 43,847,074 | $ | 41,541,451 | $ | 19,197,716 | $ | 16,906,298 | $ | 37,059,816 | $ | 41,541,451 | $ | 15,959,125 | $ | 16,906,298 | ||||||||||||||||
|
|
|
| |||||||||||||||||||||||||||||
|
|
|
| |||||||||||||||||||||||||||||
Units Outstanding | ||||||||||||||||||||||||||||||||
Class 1 | 147,741 | 152,717 | 73,298 | 74,927 | 146,641 | 152,717 | 72,489 | 74,927 | ||||||||||||||||||||||||
Class 1AP | 214 | 214 | 452 | 443 | 214 | 214 | 452 | 443 | ||||||||||||||||||||||||
Class 2 | 58,093 | 58,093 | 17,670 | 18,164 | 57,432 | 58,093 | 17,568 | 18,164 | ||||||||||||||||||||||||
Net Asset Value per Unit | ||||||||||||||||||||||||||||||||
Class 1 | $ | 191.90 | $ | 175.95 | $ | 147.87 | $ | 130.28 | $ | 165.85 | $ | 175.95 | $ | 126.10 | $ | 130.28 | ||||||||||||||||
Class 1AP | $ | 195.77 | $ | 178.18 | $ | 150.86 | $ | 131.93 | $ | 170.46 | $ | 178.18 | $ | 129.61 | $ | 131.93 | ||||||||||||||||
Class 2 | $ | 248.56 | $ | 226.23 | $ | 201.89 | $ | 176.56 | $ | 216.43 | $ | 226.23 | $ | 173.45 | $ | 176.56 | ||||||||||||||||
The accompanying notes are an integral part of these financial statements.
The Series of Equinox Frontier Funds
CondensedConsolidated Schedule of Investments (Unaudited)
March 31,June 30, 2015
| Equinox Frontier Diversified Fund | Equinox Frontier Masters Fund | Equinox Frontier Long/Short Commodity Fund | ||||||||||||||||||||||||||
Description | Value | % of Total Capital (Net Asset Value) | Value | % of Total Capital (Net Asset Value) | Value | % of Total Capital (Net Asset Value) | ||||||||||||||||||||||
| LONG FUTURES CONTRACTS* | |||||||||||||||||||||||||||
Various base metals futures contracts (Europe) | $ | (36,706 | ) | -0.05 | % | $ | — | 0.00 | % | $ | — | 0.00 | % | |||||||||||||||
Various base metals futures contracts (U.S.) | — | 0.00 | % | — | 0.00 | % | — | 0.00 | % | |||||||||||||||||||
Various currency futures contracts (U.S.) | 215,709 | 0.29 | % | — | 0.00 | % | — | 0.00 | % | |||||||||||||||||||
Various energy futures contracts (Europe) | — | 0.00 | % | — | 0.00 | % | — | 0.00 | % | |||||||||||||||||||
Various energy futures contracts (Far East) | — | 0.00 | % | — | 0.00 | % | — | 0.00 | % | |||||||||||||||||||
Various energy futures contracts (U.S.) | (5,591 | ) | -0.01 | % | — | 0.00 | % | — | 0.00 | % | ||||||||||||||||||
Various interest rates futures contracts (Canada) | 16,254 | 0.02 | % | — | 0.00 | % | — | 0.00 | % | |||||||||||||||||||
Various interest rates futures contracts (Europe) | 469,384 | 0.62 | % | — | 0.00 | % | — | 0.00 | % | |||||||||||||||||||
Various interest rates futures contracts (Far East) | (67,926 | ) | -0.09 | % | — | 0.00 | % | — | 0.00 | % | ||||||||||||||||||
Various interest rates futures contracts (Oceanic) | 436,284 | 0.58 | % | — | 0.00 | % | — | 0.00 | % | |||||||||||||||||||
Various interest rates futures contracts (U.S.) | 429,516 | 0.57 | % | — | 0.00 | % | — | 0.00 | % | |||||||||||||||||||
Various soft futures contracts (Canada) | — | 0.00 | % | — | 0.00 | % | — | 0.00 | % | |||||||||||||||||||
Various soft futures contracts (Europe) | (35,358 | ) | -0.05 | % | — | 0.00 | % | — | 0.00 | % | ||||||||||||||||||
Various soft futures contracts (Far East) | (9,269 | ) | -0.01 | % | — | 0.00 | % | — | 0.00 | % | ||||||||||||||||||
Various soft futures contracts (U.S.) | 14,570 | 0.02 | % | — | 0.00 | % | — | 0.00 | % | |||||||||||||||||||
Various stock index futures contracts (Africa) | — | 0.00 | % | — | 0.00 | % | — | 0.00 | % | |||||||||||||||||||
Various stock index futures contracts (Canada) | (5,631 | ) | -0.01 | % | — | 0.00 | % | — | 0.00 | % | ||||||||||||||||||
Various stock index futures contracts (Europe) | (26,228 | ) | -0.03 | % | — | 0.00 | % | — | 0.00 | % | ||||||||||||||||||
Various stock index futures contracts (Far East) | 80,700 | 0.11 | % | — | 0.00 | % | — | 0.00 | % | |||||||||||||||||||
Various stock index futures contracts (Mexico) | — | 0.00 | % | — | 0.00 | % | — | 0.00 | % | |||||||||||||||||||
Various stock index futures contracts (Oceanic) | 7,777 | 0.01 | % | — | 0.00 | % | — | 0.00 | % | |||||||||||||||||||
Various stock index futures contracts (U.S.) | 570,892 | 0.76 | % | — | 0.00 | % | — | 0.00 | % | |||||||||||||||||||
Various precious metal futures contracts (U.S.) | (3,670 | ) | 0.00 | % | — | 0.00 | % | — | 0.00 | % | ||||||||||||||||||
Various precious metal futures contracts (Far East) | — | 0.00 | % | — | 0.00 | % | — | 0.00 | % | |||||||||||||||||||
Various soft futures contracts (Africa) | — | 0.00 | % | — | 0.00 | % | — | 0.00 | % | |||||||||||||||||||
|
|
|
|
|
|
|
|
|
|
|
| |||||||||||||||||
Total Long Futures Contracts | $ | 2,050,707 | 2.73 | % | $ | — | 0.00 | % | $ | — | 0.00 | % | ||||||||||||||||
|
|
|
|
|
|
|
|
|
|
|
| |||||||||||||||||
| SHORT FUTURES CONTRACTS* | |||||||||||||||||||||||||||
Various base metals futures contracts (Europe) | $ | 29,419 | 0.04 | % | $ | — | 0.00 | % | $ | — | 0.00 | % | ||||||||||||||||
Various base metals futures contracts (U.S.) | (6,768 | ) | -0.01 | % | — | 0.00 | % | — | 0.00 | % | ||||||||||||||||||
Various currency futures contracts (Far East) | — | 0.00 | % | — | 0.00 | % | — | 0.00 | % | |||||||||||||||||||
Various currency futures contracts (U.S.) | 142,403 | 0.19 | % | — | 0.00 | % | — | 0.00 | % | |||||||||||||||||||
Various energy futures contracts (Europe) | — | 0.00 | % | — | 0.00 | % | — | 0.00 | % | |||||||||||||||||||
Various energy futures contracts (Far East) | — | 0.00 | % | — | 0.00 | % | — | 0.00 | % | |||||||||||||||||||
Various energy futures contracts (U.S.) | 61,926 | 0.08 | % | — | 0.00 | % | — | 0.00 | % | |||||||||||||||||||
Various interest rates futures contracts (Canada) | — | 0.00 | % | — | 0.00 | % | — | 0.00 | % | |||||||||||||||||||
Various interest rates futures contracts (Europe) | (46,283 | ) | -0.06 | % | — | 0.00 | % | — | 0.00 | % | ||||||||||||||||||
Various interest rates futures contracts (Far East) | — | 0.00 | % | — | 0.00 | % | — | 0.00 | % | |||||||||||||||||||
Various interest rates futures contracts (U.S.) | — | 0.00 | % | — | 0.00 | % | — | 0.00 | % | |||||||||||||||||||
Various soft futures contracts (Europe) | 89,850 | 0.12 | % | — | 0.00 | % | — | 0.00 | % | |||||||||||||||||||
Various soft futures contracts (Oceanic) | — | 0.00 | % | — | 0.00 | % | — | 0.00 | % | |||||||||||||||||||
Various soft futures contracts (U.S.) | 319,904 | 0.43 | % | — | 0.00 | % | — | 0.00 | % | |||||||||||||||||||
Various stock index futures contracts (Europe) | 2,240 | 0.00 | % | — | 0.00 | % | — | 0.00 | % | |||||||||||||||||||
Various stock index futures contracts (Far East) | 21,302 | 0.03 | % | — | 0.00 | % | — | 0.00 | % | |||||||||||||||||||
Various stock index futures contracts (U.S.) | (75,339 | ) | -0.10 | % | — | 0.00 | % | — | 0.00 | % | ||||||||||||||||||
Various precious metal futures contracts (U.S.) | 76,710 | 0.10 | % | — | 0.00 | % | — | 0.00 | % | |||||||||||||||||||
Various precious metal futures contracts (Far East) | — | 0.00 | % | — | 0.00 | % | — | 0.00 | % | |||||||||||||||||||
|
|
|
|
|
|
|
|
|
|
|
| |||||||||||||||||
Total Short Futures Contracts | $ | 615,364 | 0.82 | % | $ | — | 0.00 | % | $ | — | 0.00 | % | ||||||||||||||||
|
|
|
|
|
|
|
|
|
|
|
| |||||||||||||||||
| CURRENCY FORWARDS* | |||||||||||||||||||||||||||
Various currency forwards contracts (NA) | $ | (96,565 | ) | -0.13 | % | $ | — | 0.00 | % | $ | — | 0.00 | % | |||||||||||||||
|
|
|
|
|
|
|
|
|
|
|
| |||||||||||||||||
Total Currency Forwards | $ | (96,565 | ) | -0.13 | % | $ | — | 0.00 | % | $ | — | 0.00 | % | |||||||||||||||
|
|
|
|
|
|
|
|
|
|
|
| |||||||||||||||||
Total Open Trade Equity (Deficit) | $ | 2,569,506 | 3.42 | % | $ | — | 0.00 | % | $ | — | 0.00 | % | ||||||||||||||||
|
|
|
|
|
|
|
|
|
|
|
| |||||||||||||||||
| OPTIONS PURCHASED | |||||||||||||||||||||||||||
Various energy futures contracts (U.S.) | $ | — | 0.00 | % | $ | — | 0.00 | % | $ | — | 0.00 | % | ||||||||||||||||
Various soft futures contracts (U.S.) | — | 0.00 | % | — | 0.00 | % | — | 0.00 | % | |||||||||||||||||||
Various stock index futures contracts (U.S.) | 325,003 | 0.43 | % | — | 0.00 | % | — | 0.00 | % | |||||||||||||||||||
|
|
|
|
|
|
|
|
|
|
|
| |||||||||||||||||
Total Options Purchased | $ | 325,003 | 0.43 | % | $ | — | 0.00 | % | $ | — | 0.00 | % | ||||||||||||||||
|
|
|
|
|
|
|
|
|
|
|
| |||||||||||||||||
| OPTIONS WRITTEN* | |||||||||||||||||||||||||||
Various energy futures contracts (U.S.) | $ | — | 0.00 | % | $ | — | 0.00 | % | $ | — | 0.00 | % | ||||||||||||||||
Various soft futures contracts (U.S.) | — | 0.00 | % | — | 0.00 | % | — | 0.00 | % | |||||||||||||||||||
Various stock index futures contracts (U.S.) | (107,167 | ) | -0.14 | % | — | 0.00 | % | — | 0.00 | % | ||||||||||||||||||
|
|
|
|
|
|
|
|
|
|
|
| |||||||||||||||||
Total Options Written | $ | (107,167 | ) | -0.14 | % | $ | — | 0.00 | % | $ | — | 0.00 | % | |||||||||||||||
|
|
|
|
|
|
|
|
|
|
|
| |||||||||||||||||
| SWAPS (1) | |||||||||||||||||||||||||||
Frontier XXXV Diversified Select Swap (U.S.) | $ | 9,559,124 | 12.71 | % | — | 0.00 | % | $ | — | 0.00 | % | |||||||||||||||||
Frontier XXXVII L/S Select Swap (U.S.) | — | 0.00 | % | — | 0.00 | % | 5,301,972 | 27.84 | % | |||||||||||||||||||
|
|
|
|
|
|
|
|
|
|
|
| |||||||||||||||||
Total Swaps | $ | 9,559,124 | 12.71 | % | $ | — | 0.00 | % | $ | 5,301,972 | 27.84 | % | ||||||||||||||||
|
|
|
|
|
|
|
|
|
|
|
| |||||||||||||||||
| U.S. TREASURY SECURITIES (2) | |||||||||||||||||||||||||||
FACE VALUE | Value | Value | Value | |||||||||||||||||||||||||
| $ | 15,000,000 | US Treasury Note 2.250% due 11/15/2024 (Cost $14,966,695) | $ | 26,640,892 | 35.41 | % | $ | 11,280,838 | 42.21 | % | $ | 7,560,116 | 39.69 | % | ||||||||||||||
| $ | 85,000,000 | US Treasury Note 6.000% due 02/15/2026 (Cost $113,142,577) | 6,591,039 | 8.76 | % | 2,790,914 | 10.44 | % | 1,870,396 | 9.82 | % | |||||||||||||||||
| $ | 20,000,000 | US Treasury Note 6.875% due 08/15/2025 (Cost $28,012,500) | 3,469,995 | 4.61 | % | 1,469,337 | 5.50 | % | 984,711 | 5.17 | % | |||||||||||||||||
|
|
|
|
|
|
|
|
|
|
|
| |||||||||||||||||
| $ | 36,701,926 | 48.78 | % | $ | 15,541,089 | 58.15 | % | $ | 10,415,223 | 54.68 | % | |||||||||||||||||
|
|
|
|
|
|
|
|
|
|
|
| |||||||||||||||||
Additional Disclosure on U.S. Treasury Securities | Face Value | Face Value | Face Value | |||||||||||||||||||||||||
US Treasury Note 2.250% due 11/15/2024 (2) | $ | 19,116,686 | $ | 8,094,782 | $ | 5,424,907 | ||||||||||||||||||||||
US Treasury Note 6.000% due 02/15/2026 (2) | 4,498,043 | 1,904,655 | 1,276,449 | |||||||||||||||||||||||||
US Treasury Note 6.875% due 08/15/2025 (2) | 3,373,533 | 1,428,491 | 957,337 | |||||||||||||||||||||||||
|
|
|
|
|
| |||||||||||||||||||||||
| $ | 26,988,262 | $ | 11,427,928 | $ | 7,658,693 | |||||||||||||||||||||||
|
|
|
|
|
| |||||||||||||||||||||||
Additional Disclosure on U.S. Treasury Securities | Cost | Cost | Cost | |||||||||||||||||||||||||
US Treasury Note 2.250% due 11/15/2024 (2) | $ | 25,446,011 | $ | 10,774,877 | $ | 7,221,035 | ||||||||||||||||||||||
US Treasury Note 6.000% due 02/15/2026 (2) | 6,300,072 | 2,667,707 | 1,787,826 | |||||||||||||||||||||||||
US Treasury Note 6.875% due 08/15/2025 (2) | 3,366,042 | 1,425,319 | 955,211 | |||||||||||||||||||||||||
|
|
|
|
|
| |||||||||||||||||||||||
| $ | 35,112,125 | $ | 14,867,903 | $ | 9,964,072 | |||||||||||||||||||||||
|
|
|
|
|
| |||||||||||||||||||||||
| Equinox Frontier Diversified Fund | Equinox Frontier Masters Fund | Equinox Frontier Long/Short Commodity Fund | ||||||||||||||||||||||||
Description | Fair Value | % of Total Capital (Net Asset Value) | Fair Value | % of Total Capital (Net Asset Value) | Fair Value | % of Total Capital (Net Asset Value) | ||||||||||||||||||||
LONG FUTURES CONTRACTS | ||||||||||||||||||||||||||
Various base metals futures contracts (Europe) | $ | (291,308 | ) | -0.47 | % | $ | — | 0.00 | % | $ | — | 0.00 | % | |||||||||||||
Various currency futures contracts (U.S.) | (50,148 | ) | -0.08 | % | — | 0.00 | % | — | 0.00 | % | ||||||||||||||||
Various energy futures contracts (U.S.) | 15,485 | 0.02 | % | — | 0.00 | % | — | 0.00 | % | |||||||||||||||||
Various interest rates futures contracts (Canada) | 64,131 | 0.10 | % | — | 0.00 | % | — | 0.00 | % | |||||||||||||||||
Various interest rates futures contracts (Europe) | 4,429 | 0.01 | % | — | 0.00 | % | — | 0.00 | % | |||||||||||||||||
Various interest rates futures contracts (Far East) | 2,824 | 0.00 | % | — | 0.00 | % | — | 0.00 | % | |||||||||||||||||
Various interest rates futures contracts (Oceanic) | 4,440 | 0.01 | % | — | 0.00 | % | — | 0.00 | % | |||||||||||||||||
Various interest rates futures contracts (U.S.) | (37,598 | ) | -0.06 | % | — | 0.00 | % | — | 0.00 | % | ||||||||||||||||
Various soft futures contracts (Europe) | 69,416 | 0.11 | % | — | 0.00 | % | — | 0.00 | % | |||||||||||||||||
Various soft futures contracts (Far East) | (37,878 | ) | -0.06 | % | — | 0.00 | % | — | 0.00 | % | ||||||||||||||||
Various soft futures contracts (U.S.) | 171,928 | 0.28 | % | — | 0.00 | % | — | 0.00 | % | |||||||||||||||||
Various stock index futures contracts (Europe) | (96,010 | ) | -0.15 | % | — | 0.00 | % | — | 0.00 | % | ||||||||||||||||
Various stock index futures contracts (Far East) | (43,706 | ) | -0.07 | % | — | 0.00 | % | — | 0.00 | % | ||||||||||||||||
Various stock index futures contracts (U.S.) | (369,243 | ) | -0.59 | % | — | 0.00 | % | — | 0.00 | % | ||||||||||||||||
|
|
|
|
|
|
|
|
|
|
|
| |||||||||||||||
Total Long Futures Contracts | $ | (593,238 | ) | -0.95 | % | $ | — | 0.00 | % | $ | — | 0.00 | % | |||||||||||||
|
|
|
|
|
|
|
|
|
|
|
| |||||||||||||||
SHORT FUTURES CONTRACTS | ||||||||||||||||||||||||||
Various base metals futures contracts (Europe) | $ | 210,919 | 0.34 | % | $ | — | 0.00 | % | $ | — | 0.00 | % | ||||||||||||||
Various base metals futures contracts (U.S.) | (1,607 | ) | 0.00 | % | — | 0.00 | % | — | 0.00 | % | ||||||||||||||||
Various currency futures contracts (U.S.) | 49,895 | 0.08 | % | — | 0.00 | % | — | 0.00 | % | |||||||||||||||||
Various energy futures contracts (U.S.) | (52,105 | ) | -0.08 | % | — | 0.00 | % | — | 0.00 | % | ||||||||||||||||
Various interest rates futures contracts (Canada) | (440 | ) | 0.00 | % | — | 0.00 | % | — | 0.00 | % | ||||||||||||||||
Various interest rates futures contracts (Europe) | (72,587 | ) | -0.12 | % | — | 0.00 | % | — | 0.00 | % | ||||||||||||||||
Various interest rates futures contracts (Oceanic) | 38 | 0.00 | % | — | 0.00 | % | — | 0.00 | % | |||||||||||||||||
Various interest rates futures contracts (U.S.) | (19,502 | ) | -0.03 | % | — | 0.00 | % | — | 0.00 | % | ||||||||||||||||
Various precious metal futures contracts (U.S.) | 147,760 | 0.24 | % | — | 0.00 | % | — | 0.00 | % | |||||||||||||||||
Various soft futures contracts (Europe) | (37,500 | ) | -0.06 | % | — | 0.00 | % | — | 0.00 | % | ||||||||||||||||
Various soft futures contracts (U.S.) | (307,586 | ) | -0.49 | % | — | 0.00 | % | — | 0.00 | % | ||||||||||||||||
Various stock index futures contracts (Europe) | 38,769 | 0.06 | % | — | 0.00 | % | — | 0.00 | % | |||||||||||||||||
Various stock index futures contracts (Far East) | (64,926 | ) | -0.10 | % | — | 0.00 | % | — | 0.00 | % | ||||||||||||||||
Various stock index futures contracts (U.S.) | 233,381 | 0.38 | % | — | 0.00 | % | — | 0.00 | % | |||||||||||||||||
|
|
|
|
|
|
|
|
|
|
|
| |||||||||||||||
Total Short Futures Contracts | $ | 124,509 | 0.22 | % | $ | — | 0.00 | % | $ | — | 0.00 | % | ||||||||||||||
|
|
|
|
|
|
|
|
|
|
|
| |||||||||||||||
CURRENCY FORWARDS | ||||||||||||||||||||||||||
Various currency forwards contracts (NA) | $ | (102,822 | ) | -0.17 | % | $ | — | 0.00 | % | $ | — | 0.00 | % | |||||||||||||
|
|
|
|
|
|
|
|
|
|
|
| |||||||||||||||
Total Currency Forwards | $ | (102,822 | ) | -0.17 | % | $ | — | 0.00 | % | $ | — | 0.00 | % | |||||||||||||
|
|
|
|
|
|
|
|
|
|
|
| |||||||||||||||
Total Open Trade Equity (Deficit) | $ | (571,551 | ) | -0.90 | % | $ | — | 0.00 | % | $ | — | 0.00 | % | |||||||||||||
|
|
|
|
|
|
|
|
|
|
|
| |||||||||||||||
OPTIONS PURCHASED | ||||||||||||||||||||||||||
Various stock index futures contracts (U.S.) | $ | 374,470 | 0.60 | % | $ | — | 0.00 | % | $ | — | 0.00 | % | ||||||||||||||
|
|
|
|
|
|
|
|
|
|
|
| |||||||||||||||
Total Options Purchased | $ | 374,470 | 0.60 | % | $ | — | 0.00 | % | $ | — | 0.00 | % | ||||||||||||||
|
|
|
|
|
|
|
|
|
|
|
| |||||||||||||||
OPTIONS WRITTEN | ||||||||||||||||||||||||||
Various stock index futures contracts (U.S.) | $ | (219,660 | ) | -0.35 | % | $ | — | 0.00 | % | $ | — | 0.00 | % | |||||||||||||
|
|
|
|
|
|
|
|
|
|
|
| |||||||||||||||
Total Options Written | $ | (219,660 | ) | -0.35 | % | $ | — | 0.00 | % | $ | — | 0.00 | % | |||||||||||||
|
|
|
|
|
|
|
|
|
|
|
| |||||||||||||||
SWAPS (1) | ||||||||||||||||||||||||||
Frontier XXXV Diversified select swap (U.S.) | $ | 7,615,169 | 12.24 | % | — | 0.00 | % | $ | — | 0.00 | % | |||||||||||||||
Frontier XXXVII L/S select swap (U.S.) | — | 0.00 | % | — | 0.00 | % | 4,304,209 | 26.80 | % | |||||||||||||||||
|
|
|
|
|
|
|
|
|
|
|
| |||||||||||||||
Total Swaps | $ | 7,615,169 | 12.24 | % | $ | — | 0.00 | % | $ | 4,304,209 | 26.80 | % | ||||||||||||||
|
|
|
|
|
|
|
|
|
|
|
| |||||||||||||||
U.S. TREASURY SECURITIES (2) | ||||||||||||||||||||||||||
FACE VALUE | Fair Value | Fair Value | Fair Value | |||||||||||||||||||||||
$75,000,000 | US Treasury Note 6.000% due 02/15/2026 (Cost $99,934,764) | $ | 22,693,752 | 36.47 | % | $ | 9,300,180 | 40.97 | % | $ | 5,264,015 | 32.77 | % | |||||||||||||
$20,000,000 | US Treasury Note 6.875% due 08/15/2025 (Cost $28,012,500) | 6,377,488 | 10.25 | % | 2,613,574 | 11.51 | % | 1,479,315 | 9.21 | % | ||||||||||||||||
|
|
|
|
|
|
|
|
|
|
|
| |||||||||||||||
| $ | 29,071,240 | 46.72 | % | $ | 11,913,754 | 52.48 | % | $ | 6,743,330 | 41.98 | % | |||||||||||||||
|
|
|
|
|
|
|
|
|
|
|
| |||||||||||||||
Additional Disclosure on U.S. Treasury Securities | Face Value | Face Value | Face Value | |||||||||||
US Treasury Note 6.000% due 02/15/2026 (2) | $ | 16,925,769 | $ | 6,936,389 | $ | 3,926,081 | ||||||||
US Treasury Note 6.875% due 08/15/2025 (2) | 4,513,538 | 1,849,704 | 1,046,955 | |||||||||||
|
|
|
|
|
| |||||||||
| $ | 21,439,307 | $ | 8,786,093 | $ | 4,973,036 | |||||||||
|
|
|
|
|
| |||||||||
Additional Disclosure on U.S. Treasury Securities | Cost | Cost | Cost | |||||||||||
US Treasury Note 6.000% due 02/15/2026 (2) | $ | 25,533,667 | $ | 10,464,012 | $ | 5,922,759 | ||||||||
US Treasury Note 6.875% due 08/15/2025 (2) | 6,321,774 | 2,590,741 | 1,466,391 | |||||||||||
|
|
|
|
|
| |||||||||
| $ | 31,855,441 | $ | 13,054,753 | $ | 7,389,150 | |||||||||
|
|
|
|
|
| |||||||||
| * | Except for those items disclosed, no individual futures, forwards and option on futures contract position constituted greater than 1 percent of Net Asset Value. Accordingly, the number of contracts and expiration dates are not presented. |
| (1) | See Note 4 to the Financial Statements. |
| (2) | Assets have been allocated to each Series based upon ownership in the cash management pool. See Note 2. |
The accompanying notes are an integral part of these financial statements.
The Series of Equinox Frontier Funds
CondensedConsolidated Schedule of Investments (Unaudited)
March 31,June 30, 2015
| Equinox Frontier Balanced Fund | Equinox Frontier Select Fund | Equinox Frontier Balanced Fund | Equinox Frontier Select Fund | |||||||||||||||||||||||||||||||||||
Description | Description | Value | % of Total Capital (Net Asset Value) | Value | % of Total Capital (Net Asset Value) | Description | Fair Value | % of Total Capital (Net Asset Value) | Fair Value | % of Total Capital (Net Asset Value) | ||||||||||||||||||||||||||||
LONG FUTURES CONTRACTS | LONG FUTURES CONTRACTS | |||||||||||||||||||||||||||||||||||||
Various base metals futures contracts (Europe) | $ | (527,678 | ) | -0.54 | % | $ | (945,175 | ) | -4.91 | % | ||||||||||||||||||||||||||||
Various currency futures contracts (Singapore) | — | 0.00 | % | (364 | ) | 0.00 | % | |||||||||||||||||||||||||||||||
Various currency futures contracts (U.S.) | (46,926 | ) | -0.05 | % | (31,965 | ) | -0.17 | % | ||||||||||||||||||||||||||||||
Various energy futures contracts (Europe) | — | 0.00 | % | 7,576 | 0.04 | % | ||||||||||||||||||||||||||||||||
Various energy futures contracts (Far East) | (2,367 | ) | 0.00 | % | — | 0.00 | % | |||||||||||||||||||||||||||||||
Various energy futures contracts (U.S.) | (153,601 | ) | -0.16 | % | 10,841 | 0.06 | % | |||||||||||||||||||||||||||||||
Various interest rates futures contracts (Canada) | 44,461 | 0.05 | % | — | 0.00 | % | ||||||||||||||||||||||||||||||||
Various interest rates futures contracts (Europe) | 12,519 | 0.01 | % | 2,616 | 0.01 | % | ||||||||||||||||||||||||||||||||
Various interest rates futures contracts (Far East) | 21,602 | 0.02 | % | 4,188 | 0.02 | % | ||||||||||||||||||||||||||||||||
Various interest rates futures contracts (Oceanic) | 636 | 0.00 | % | (3,153 | ) | -0.02 | % | |||||||||||||||||||||||||||||||
Various interest rates futures contracts (U.S.) | 121,458 | 0.13 | % | 45,209 | 0.23 | % | ||||||||||||||||||||||||||||||||
Various precious metal futures contracts (Far East) | (3,224 | ) | 0.00 | % | (906 | ) | 0.00 | % | ||||||||||||||||||||||||||||||
Various precious metal futures contracts (U.S.) | (35,955 | ) | -0.04 | % | — | 0.00 | % | |||||||||||||||||||||||||||||||
Various soft futures contract (Europe) | (970 | ) | 0.00 | % | — | 0.00 | % | |||||||||||||||||||||||||||||||
Various soft futures contracts (Africa) | — | 0.00 | % | (454 | ) | 0.00 | % | |||||||||||||||||||||||||||||||
Various soft futures contracts (Canada) | 12,047 | 0.01 | % | 1,178 | 0.01 | % | ||||||||||||||||||||||||||||||||
Various soft futures contracts (Europe) | 28,604 | 0.03 | % | 29,280 | 0.15 | % | ||||||||||||||||||||||||||||||||
Various soft futures contracts (Oceanic) | — | 0.00 | % | (431 | ) | 0.00 | % | |||||||||||||||||||||||||||||||
Various soft futures contracts (U.S.) | 479,697 | 0.49 | % | 76,239 | 0.40 | % | ||||||||||||||||||||||||||||||||
Various stock index futures contracts (Africa) | — | 0.00 | % | (1,893 | ) | -0.01 | % | |||||||||||||||||||||||||||||||
Various stock index futures contracts (Canada) | (16,733 | ) | -0.02 | % | — | 0.00 | % | |||||||||||||||||||||||||||||||
Various stock index futures contracts (Europe) | (169,832 | ) | -0.18 | % | (8,607 | ) | -0.04 | % | ||||||||||||||||||||||||||||||
Various stock index futures contracts (Far East) | (162,496 | ) | -0.17 | % | (25,716 | ) | -0.13 | % | ||||||||||||||||||||||||||||||
Various stock index futures contracts (Mexico) | 184 | 0.00 | % | 118 | 0.00 | % | ||||||||||||||||||||||||||||||||
Various stock index futures contracts (Oceanic) | (6,474 | ) | -0.01 | % | — | 0.00 | % | |||||||||||||||||||||||||||||||
Various stock index futures contracts (U.S.) | (413,569 | ) | -0.43 | % | (113,462 | ) | -0.59 | % | ||||||||||||||||||||||||||||||
|
|
|
| |||||||||||||||||||||||||||||||||||
Total Long Futures Contracts | $ | (818,617 | ) | -0.86 | % | $ | (954,881 | ) | -4.95 | % | ||||||||||||||||||||||||||||
|
|
|
| |||||||||||||||||||||||||||||||||||
SHORT FUTURES CONTRACTS | SHORT FUTURES CONTRACTS | |||||||||||||||||||||||||||||||||||||
| LONG FUTURES CONTRACTS* | Various base metals futures contracts (Europe) | $ | 472,034 | 0.49 | % | $ | 1,098,409 | 5.70 | % | ||||||||||||||||||||||||||||
Various base metals futures contracts (Europe) | $ | (93,540 | ) | -0.08 | % | $ | (1,152,110 | ) | -4.81 | % | Various base metals futures contracts (U.S.) | 7,838 | 0.01 | % | 20,730 | 0.11 | % | |||||||||||||||||||||
Various base metals futures contracts (U.S.) | (6,350 | ) | -0.01 | % | — | 0.00 | % | Various currency futures contracts (U.S.) | 97,275 | 0.10 | % | (92,798 | ) | -0.48 | % | |||||||||||||||||||||||
Various currency futures contracts (U.S.) | (26,218 | ) | -0.02 | % | (4,153 | ) | -0.02 | % | Various energy futures contracts (Europe) | — | 0.00 | % | (149 | ) | 0.00 | % | ||||||||||||||||||||||
Various energy futures contracts (Europe) | — | 0.00 | % | 4,391 | 0.02 | % | Various energy futures contracts (Far East) | 4,164 | 0.00 | % | (1,740 | ) | -0.01 | % | ||||||||||||||||||||||||
Various energy futures contracts (Far East) | (405 | ) | 0.00 | % | — | 0.00 | % | Various energy futures contracts (U.S.) | 38,884 | 0.04 | % | (43,047 | ) | -0.22 | % | |||||||||||||||||||||||
Various energy futures contracts (U.S.) | (171,535 | ) | -0.15 | % | 836 | 0.00 | % | Various interest rates futures contracts (Canada) | (1,393 | ) | 0.00 | % | (5,002 | ) | -0.03 | % | ||||||||||||||||||||||
Various interest rates futures contracts (Canada) | (33,025 | ) | -0.03 | % | 7,197 | 0.03 | % | Various interest rates futures contracts (Europe) | 8,798 | 0.01 | % | 11,917 | 0.06 | % | ||||||||||||||||||||||||
Various interest rates futures contracts (Europe) | 389,098 | 0.35 | % | 76,221 | 0.32 | % | Various interest rates futures contracts (Far East) | 214 | 0.00 | % | — | 0.00 | % | |||||||||||||||||||||||||
Various interest rates futures contracts (Far East) | (84,086 | ) | -0.08 | % | (15,899 | ) | -0.07 | % | Various interest rates futures contracts (Oceanic) | 13,172 | 0.01 | % | (1,504 | ) | -0.01 | % | ||||||||||||||||||||||
Various interest rates futures contracts (Oceanic) | 191,292 | 0.17 | % | 27,788 | 0.12 | % | Various interest rates futures contracts (U.S.) | (44,189 | ) | -0.05 | % | 54,062 | 0.28 | % | ||||||||||||||||||||||||
Various interest rates futures contracts (U.S.) | 578,657 | 0.52 | % | 138,462 | 0.58 | % | Various precious metal futures contracts (Far East) | 4,829 | 0.00 | % | — | 0.00 | % | |||||||||||||||||||||||||
Various soft futures contracts (Canada) | (758 | ) | 0.00 | % | (342 | ) | 0.00 | % | Various precious metal futures contracts (U.S.) | 19,350 | 0.02 | % | 180,010 | 0.93 | % | |||||||||||||||||||||||
Various soft futures contracts (Europe) | (1,332 | ) | 0.00 | % | (3,730 | ) | -0.02 | % | Various soft futures contract (Europe) | — | 0.00 | % | (800 | ) | 0.00 | % | ||||||||||||||||||||||
Various soft futures contracts (Far East) | (4,687 | ) | 0.00 | % | — | 0.00 | % | Various soft futures contracts (Europe) | (33,452 | ) | -0.03 | % | (5,913 | ) | -0.03 | % | ||||||||||||||||||||||
Various soft futures contracts (U.S.) | (361,104 | ) | -0.33 | % | (33,468 | ) | -0.14 | % | Various soft futures contracts (Far East) | 2,939 | 0.00 | % | — | 0.00 | % | |||||||||||||||||||||||
Various stock index futures contracts (Africa) | (153 | ) | 0.00 | % | (940 | ) | 0.00 | % | Various soft futures contracts (U.S.) | (385,677 | ) | -0.40 | % | (275,325 | ) | -1.43 | % | |||||||||||||||||||||
Various stock index futures contracts (Canada) | (1,118 | ) | 0.00 | % | 3,120 | 0.01 | % | Various stock index futures contracts (Africa) | 389 | 0.00 | % | — | 0.00 | % | ||||||||||||||||||||||||
Various stock index futures contracts (Europe) | 32,706 | 0.03 | % | 62,255 | 0.26 | % | Various stock index futures contracts (Canada) | 5,688 | 0.01 | % | — | 0.00 | % | |||||||||||||||||||||||||
Various stock index futures contracts (Far East) | 81,531 | 0.07 | % | 59,875 | 0.25 | % | Various stock index futures contracts (Europe) | 871 | 0.00 | % | 88 | 0.00 | % | |||||||||||||||||||||||||
Various stock index futures contracts (Mexico) | (272 | ) | 0.00 | % | — | 0.00 | % | Various stock index futures contracts (Far East) | 3,125 | 0.00 | % | 8,561 | 0.04 | % | ||||||||||||||||||||||||
Various stock index futures contracts (Oceanic) | (3,404 | ) | 0.00 | % | 3,081 | 0.01 | % | Various stock index futures contracts (Oceanic) | 26,744 | 0.03 | % | 6,243 | 0.03 | % | ||||||||||||||||||||||||
Various stock index futures contracts (U.S.) | (297,408 | ) | -0.27 | % | (3,521 | ) | -0.01 | % | Various stock index futures contracts (U.S.) | 25,654 | 0.03 | % | 31,562 | 0.16 | % | |||||||||||||||||||||||
Various precious metal futures contracts (U.S.) | 21,130 | 0.02 | % | — | 0.00 | % |
|
|
|
| ||||||||||||||||||||||||||||
Various precious metal futures contracts (Far East) | (649 | ) | 0.00 | % | — | 0.00 | % | Total Short Futures Contracts | $ | 267,257 | 0.27 | % | $ | 985,304 | 5.10 | % | ||||||||||||||||||||||
Various soft futures contracts (Africa) | — | 0.00 | % | (595 | ) | 0.00 | % |
|
|
|
| |||||||||||||||||||||||||||
|
|
|
| CURRENCY FORWARDS | ||||||||||||||||||||||||||||||||||
Total Long Futures Contracts | $ | 208,370 | 0.19 | % | $ | (831,532 | ) | -3.47 | % | Various currency forwards contracts (NA) | $ | (227,603 | ) | -0.23 | % | $ | 25,533 | 0.13 | % | |||||||||||||||||||
|
|
|
|
|
|
|
| |||||||||||||||||||||||||||||||
| SHORT FUTURES CONTRACTS* | Total Currency Forwards | $(227,603) | -0.23% | $25,533 | 0.13% | ||||||||||||||||||||||||||||||||
Various base metals futures contracts (Europe) | $ | 94,720 | 0.09 | % | $ | 1,401,538 | 5.85 | % |
|
|
|
| ||||||||||||||||||||||||||
Various base metals futures contracts (U.S.) | (2,738 | ) | 0.00 | % | (5,813 | ) | -0.02 | % | Total Open Trade Equity (Deficit) | $(778,963) | -0.82% | $55,956 | 0.28% | |||||||||||||||||||||||||
Various currency futures contracts (Far East) | — | 0.00 | % | 7,405 | 0.03 | % |
|
|
|
| ||||||||||||||||||||||||||||
Various currency futures contracts (U.S.) | (63,676 | ) | -0.06 | % | (1,423 | ) | -0.01 | % | SWAPS (1) | |||||||||||||||||||||||||||||
Various energy futures contracts (Europe) | — | 0.00 | % | (717 | ) | 0.00 | % | Frontier XXXIV Balanced select swap (U.S.) | $18,491,634 | 19.06% | $— | 0.00% | ||||||||||||||||||||||||||
Various energy futures contracts (Far East) | (3,026 | ) | 0.00 | % | 500 | 0.00 | % |
|
|
|
| |||||||||||||||||||||||||||
Various energy futures contracts (U.S.) | 146,808 | 0.13 | % | 52,411 | 0.22 | % | Total Swaps | $18,491,634 | 19.06% | $— | 0.00% | |||||||||||||||||||||||||||
Various interest rates futures contracts (Canada) | — | 0.00 | % | — | 0.00 | % |
|
|
|
| ||||||||||||||||||||||||||||
Various interest rates futures contracts (Europe) | (142,979 | ) | -0.13 | % | (1,814 | ) | -0.01 | % | ||||||||||||||||||||||||||||||
U.S. TREASURY SECURITIES (2) | U.S. TREASURY SECURITIES (2) | |||||||||||||||||||||||||||||||||||||
FACE VALUE | FACE VALUE | Fair Value | Fair Value | |||||||||||||||||||||||||||||||||||
$75,000,000 | US Treasury Note 6.000% due 02/15/2026 (Cost $99,934,764) | $ | 36,962,801 | 38.10 | % | $ | 1,885,640 | 9.79 | % | |||||||||||||||||||||||||||||
$20,000,000 | US Treasury Note 6.875% due 08/15/2025 (Cost $28,012,500) | 10,387,431 | 10.71 | % | 529,909 | 2.75 | % | |||||||||||||||||||||||||||||||
Various interest rates futures contracts (Far East) | 645 | 0.00 | % | — | 0.00 | % |
|
|
|
| ||||||||||||||||||||||||||||
Various interest rates futures contracts (U.S.) | (38,619 | ) | -0.03 | % | 16,340 | 0.07 | % | $ | 47,350,232 | 48.81 | % | $ | 2,415,549 | 12.54 | % | |||||||||||||||||||||||
Various soft futures contracts (Europe) | 45,910 | 0.04 | % | 15,828 | 0.07 | % |
|
|
|
| ||||||||||||||||||||||||||||
Various soft futures contracts (Oceanic) | — | 0.00 | % | (511 | ) | 0.00 | % | |||||||||||||||||||||||||||||||
Various soft futures contracts (U.S.) | 206,527 | 0.19 | % | 363,049 | 1.51 | % | ||||||||||||||||||||||||||||||||
Various stock index futures contracts (Europe) | — | 0.00 | % | (1,016 | ) | 0.00 | % | |||||||||||||||||||||||||||||||
Various stock index futures contracts (Far East) | 4,284 | 0.00 | % | 2,448 | 0.01 | % | ||||||||||||||||||||||||||||||||
Various stock index futures contracts (U.S.) | 64,336 | 0.06 | % | (26,293 | ) | -0.11 | % | |||||||||||||||||||||||||||||||
Various precious metal futures contracts (U.S.) | (2,985 | ) | 0.00 | % | (28,740 | ) | -0.12 | % | ||||||||||||||||||||||||||||||
Various precious metal futures contracts (Far East) | 4,637 | 0.00 | % | — | 0.00 | % | ||||||||||||||||||||||||||||||||
|
|
|
| |||||||||||||||||||||||||||||||||||
Total Short Futures Contracts | $ | 313,844 | 0.29 | % | $ | 1,793,192 | 7.49 | % | ||||||||||||||||||||||||||||||
|
|
|
| |||||||||||||||||||||||||||||||||||
| CURRENCY FORWARDS* | |||||||||||||||||||||||||||||||||||||
Various currency forwards contracts (NA) | $ | (253,236 | ) | -0.23 | % | $ | (2,987 | ) | -0.01 | % | ||||||||||||||||||||||||||||
|
|
|
| |||||||||||||||||||||||||||||||||||
Total Currency Forwards | $ | (253,236 | ) | -0.23 | % | $ | (2,987 | ) | -0.01 | % | ||||||||||||||||||||||||||||
|
|
|
| |||||||||||||||||||||||||||||||||||
Total Open Trade Equity (Deficit) | $ | 268,978 | 0.25 | % | $ | 958,673 | 4.01 | % | ||||||||||||||||||||||||||||||
|
|
|
| |||||||||||||||||||||||||||||||||||
| OPTIONS PURCHASED* | |||||||||||||||||||||||||||||||||||||
Various energy futures contracts (U.S.) | $ | — | 0.00 | % | $ | — | 0.00 | % | ||||||||||||||||||||||||||||||
Various soft futures contracts (U.S.) | — | 0.00 | % | — | 0.00 | % | ||||||||||||||||||||||||||||||||
Various stock index futures contracts (U.S.) | — | 0.00 | % | — | 0.00 | % | ||||||||||||||||||||||||||||||||
|
|
|
| |||||||||||||||||||||||||||||||||||
Total Options Purchased | $ | — | 0.00 | % | $ | — | 0.00 | % | ||||||||||||||||||||||||||||||
|
|
|
| |||||||||||||||||||||||||||||||||||
| OPTIONS WRITTEN* | |||||||||||||||||||||||||||||||||||||
Various energy futures contracts (U.S.) | $ | — | 0.00 | % | $ | — | 0.00 | % | ||||||||||||||||||||||||||||||
Various soft futures contracts (U.S.) | — | 0.00 | % | — | 0.00 | % | ||||||||||||||||||||||||||||||||
Various stock index futures contracts (U.S.) | — | 0.00 | % | — | 0.00 | % | ||||||||||||||||||||||||||||||||
|
|
|
| |||||||||||||||||||||||||||||||||||
Total Options Written | $ | — | 0.00 | % | $ | — | 0.00 | % | ||||||||||||||||||||||||||||||
|
|
|
| |||||||||||||||||||||||||||||||||||
| SWAPS (1) | |||||||||||||||||||||||||||||||||||||
Frontier XXXIV Balanced Select Swap (U.S.) | $ | 23,473,632 | 21.21 | % | $ | — | 0.00 | % | ||||||||||||||||||||||||||||||
|
|
|
| |||||||||||||||||||||||||||||||||||
Total Swaps | $ | 23,473,632 | 21.21 | % | $ | — | 0.00 | % | ||||||||||||||||||||||||||||||
|
|
|
| |||||||||||||||||||||||||||||||||||
| U.S. TREASURY SECURITIES (2) | |||||||||||||||||||||||||||||||||||||
FACE VALUE | Value | Value | ||||||||||||||||||||||||||||||||||||
| $15,000,000 | US Treasury Note 2.250% due 11/15/2024 (Cost $14,966,695) | $ | 41,182,408 | 37.21 | % | $ | 2,612,146 | 10.90 | % | |||||||||||||||||||||||||||||
Additional Disclosure on U.S. Treasury Securities | Additional Disclosure on U.S. Treasury Securities | Face Value | Face Value | |||||||||||||||||||||||||||||||||||
| $85,000,000 | US Treasury Note 6.000% due 02/15/2026 (Cost $113,142,577) | 10,188,655 | 9.21 | % | 646,253 | 2.70 | % | US Treasury Note 6.000% due 02/15/2026 (2) | $27,568,106 | $1,406,374 | ||||||||||||||||||||||||||||
| $20,000,000 | US Treasury Note 6.875% due 08/15/2025 (Cost $28,012,500) | 5,364,035 | 4.85 | % | 340,232 | 1.42 | % | US Treasury Note 6.875% due 08/15/2025 (2) | 7,351,495 | 375,033 | ||||||||||||||||||||||||||||
|
|
|
|
|
| |||||||||||||||||||||||||||||||||
| $ | 56,735,098 | 51.27 | % | $ | 3,598,631 | 15.02 | % | $ | 34,919,601 | $ | 1,781,407 | |||||||||||||||||||||||||||
|
|
|
|
|
| |||||||||||||||||||||||||||||||||
Additional Disclosure on U.S. Treasury Securities | Additional Disclosure on U.S. Treasury Securities | Face Value | Face Value | Additional Disclosure on U.S. Treasury Securities | Cost | Cost | ||||||||||||||||||||||||||||||||
US Treasury Note 2.250% due 11/15/2024 (2) | $ | 29,551,228 | $ | 1,874,395 | US Treasury Note 6.000% due 02/15/2026 (2) | $41,588,353 | $2,121,610 | |||||||||||||||||||||||||||||||
US Treasury Note 6.000% due 02/15/2026 (2) | 6,953,230 | 441,034 | US Treasury Note 6.875% due 08/15/2025 (2) | 10,296,688 | 525,281 | |||||||||||||||||||||||||||||||||
US Treasury Note 6.875% due 08/15/2025 (2) | 5,214,923 | 330,776 |
|
| ||||||||||||||||||||||||||||||||||
|
| $ | 51,885,041 | $ | 2,646,891 | |||||||||||||||||||||||||||||||||
| $ | 41,719,381 | $ | 2,646,205 |
|
| |||||||||||||||||||||||||||||||||
|
| |||||||||||||||||||||||||||||||||||||
Additional Disclosure on U.S. Treasury Securities | Cost | Cost | ||||||||||||||||||||||||||||||||||||
US Treasury Note 2.250% due 11/15/2024 (2) | $ | 39,335,317 | $ | 2,494,986 | ||||||||||||||||||||||||||||||||||
US Treasury Note 6.000% due 02/15/2026 (2) | 9,738,868 | 617,723 | ||||||||||||||||||||||||||||||||||||
US Treasury Note 6.875% due 08/15/2025 (2) | 5,203,344 | 330,041 | ||||||||||||||||||||||||||||||||||||
|
| |||||||||||||||||||||||||||||||||||||
| $ | 54,277,529 | $ | 3,442,750 | |||||||||||||||||||||||||||||||||||
|
| |||||||||||||||||||||||||||||||||||||
| * | Except for those items disclosed, no individual futures, forwards and option on futures contract position constituted greater than 1 percent of Net Asset Value. Accordingly, the number of contracts and expiration dates are not presented. |
| (1) | See Note 4 to the Financial Statements. |
| (2) | Assets have been allocated to each Series based upon ownership in the cash management pool. See Note 2. |
The accompanying notes are an integral part of these financial statements.
The Series of Equinox Frontier Funds
CondensedConsolidated Schedule of Investments (Unaudited)
March 31,June 30, 2015
| Equinox Frontier Balanced Fund | Equinox Frontier Select Fund | |||||||||||||||||
Description | Value | % of Total Capital (Net Asset Value) | Value | % of Total Capital (Net Asset Value) | ||||||||||||||
LONG FUTURES CONTRACTS* | ||||||||||||||||||
Various base metals futures contracts (Europe) | $ | (93,540 | ) | -0.08 | % | $ | (1,152,110 | ) | -4.81 | % | ||||||||
Various base metals futures contracts (U.S.) | (6,350 | ) | -0.01 | % | — | 0.00 | % | |||||||||||
Various currency futures contracts (U.S.) | (26,218 | ) | -0.02 | % | (4,153 | ) | -0.02 | % | ||||||||||
Various energy futures contracts (Europe) | — | 0.00 | % | 4,391 | 0.02 | % | ||||||||||||
Various energy futures contracts (Far East) | (405 | ) | 0.00 | % | — | 0.00 | % | |||||||||||
Various energy futures contracts (U.S.) | (171,535 | ) | -0.15 | % | 836 | 0.00 | % | |||||||||||
Various interest rates futures contracts (Canada) | (33,025 | ) | -0.03 | % | 7,197 | 0.03 | % | |||||||||||
Various interest rates futures contracts (Europe) | 389,098 | 0.35 | % | 76,221 | 0.32 | % | ||||||||||||
Various interest rates futures contracts (Far East) | (84,086 | ) | -0.08 | % | (15,899 | ) | -0.07 | % | ||||||||||
Various interest rates futures contracts (Oceanic) | 191,292 | 0.17 | % | 27,788 | 0.12 | % | ||||||||||||
Various interest rates futures contracts (U.S.) | 578,657 | 0.52 | % | 138,462 | 0.58 | % | ||||||||||||
Various soft futures contracts (Canada) | (758 | ) | 0.00 | % | (342 | ) | 0.00 | % | ||||||||||
Various soft futures contracts (Europe) | (1,332 | ) | 0.00 | % | (3,730 | ) | -0.02 | % | ||||||||||
Various soft futures contracts (Far East) | (4,687 | ) | 0.00 | % | — | 0.00 | % | |||||||||||
Various soft futures contracts (U.S.) | (361,104 | ) | -0.33 | % | (33,468 | ) | -0.14 | % | ||||||||||
Various stock index futures contracts (Africa) | (153 | ) | 0.00 | % | (940 | ) | 0.00 | % | ||||||||||
Various stock index futures contracts (Canada) | (1,118 | ) | 0.00 | % | 3,120 | 0.01 | % | |||||||||||
Various stock index futures contracts (Europe) | 32,706 | 0.03 | % | 62,255 | 0.26 | % | ||||||||||||
Various stock index futures contracts (Far East) | 81,531 | 0.07 | % | 59,875 | 0.25 | % | ||||||||||||
Various stock index futures contracts (Mexico) | (272 | ) | 0.00 | % | — | 0.00 | % | |||||||||||
Various stock index futures contracts (Oceanic) | (3,404 | ) | 0.00 | % | 3,081 | 0.01 | % | |||||||||||
Various stock index futures contracts (U.S.) | (297,408 | ) | -0.27 | % | (3,521 | ) | -0.01 | % | ||||||||||
Various precious metal futures contracts (U.S.) | 21,130 | 0.02 | % | — | 0.00 | % | ||||||||||||
Various precious metal futures contracts (Far East) | (649 | ) | 0.00 | % | — | 0.00 | % | |||||||||||
Various soft futures contracts (Africa) | — | 0.00 | % | (595 | ) | 0.00 | % | |||||||||||
|
|
|
|
|
|
|
| |||||||||||
Total Long Futures Contracts | $ | 208,370 | 0.19 | % | $ | (831,532 | ) | -3.47 | % | |||||||||
|
|
|
|
|
|
|
| |||||||||||
SHORT FUTURES CONTRACTS* | ||||||||||||||||||
Various base metals futures contracts (Europe) | $ | 94,720 | 0.09 | % | $ | 1,401,538 | 5.85 | % | ||||||||||
Various base metals futures contracts (U.S.) | (2,738 | ) | 0.00 | % | (5,813 | ) | -0.02 | % | ||||||||||
Various currency futures contracts (Far East) | — | 0.00 | % | 7,405 | 0.03 | % | ||||||||||||
Various currency futures contracts (U.S.) | (63,676 | ) | -0.06 | % | (1,423 | ) | -0.01 | % | ||||||||||
Various energy futures contracts (Europe) | — | 0.00 | % | (717 | ) | 0.00 | % | |||||||||||
Various energy futures contracts (Far East) | (3,026 | ) | 0.00 | % | 500 | 0.00 | % | |||||||||||
Various energy futures contracts (U.S.) | 146,808 | 0.13 | % | 52,411 | 0.22 | % | ||||||||||||
Various interest rates futures contracts (Canada) | — | 0.00 | % | — | 0.00 | % | ||||||||||||
Various interest rates futures contracts (Europe) | (142,979 | ) | -0.13 | % | (1,814 | ) | -0.01 | % | ||||||||||
Various interest rates futures contracts (Far East) | 645 | 0.00 | % | — | 0.00 | % | ||||||||||||
Various interest rates futures contracts (U.S.) | (38,619 | ) | -0.03 | % | 16,340 | 0.07 | % | |||||||||||
Various soft futures contracts (Europe) | 45,910 | 0.04 | % | 15,828 | 0.07 | % | ||||||||||||
Various soft futures contracts (Oceanic) | — | 0.00 | % | (511 | ) | 0.00 | % | |||||||||||
Various soft futures contracts (U.S.) | 206,527 | 0.19 | % | 363,049 | 1.51 | % | ||||||||||||
Various stock index futures contracts (Europe) | — | 0.00 | % | (1,016 | ) | 0.00 | % | |||||||||||
Various stock index futures contracts (Far East) | 4,284 | 0.00 | % | 2,448 | 0.01 | % | ||||||||||||
Various stock index futures contracts (U.S.) | 64,336 | 0.06 | % | (26,293 | ) | -0.11 | % | |||||||||||
Various precious metal futures contracts (U.S.) | (2,985 | ) | 0.00 | % | (28,740 | ) | -0.12 | % | ||||||||||
Various precious metal futures contracts (Far East) | 4,637 | 0.00 | % | — | 0.00 | % | ||||||||||||
|
|
|
|
|
|
|
| |||||||||||
Total Short Futures Contracts | $ | 313,844 | 0.29 | % | $ | 1,793,192 | 7.49 | % | ||||||||||
|
|
|
|
|
|
|
| |||||||||||
CURRENCY FORWARDS* | ||||||||||||||||||
Various currency forwards contracts (NA) | $ | (253,236 | ) | -0.23 | % | $ | (2,987 | ) | -0.01 | % | ||||||||
|
|
|
|
|
|
|
| |||||||||||
Total Currency Forwards | $ | (253,236 | ) | -0.23 | % | $ | (2,987 | ) | -0.01 | % | ||||||||
|
|
|
|
|
|
|
| |||||||||||
Total Open Trade Equity (Deficit) | $ | 268,978 | 0.25 | % | $ | 958,673 | 4.01 | % | ||||||||||
|
|
|
|
|
|
|
| |||||||||||
OPTIONS PURCHASED* | ||||||||||||||||||
Various energy futures contracts (U.S.) | $ | — | 0.00 | % | $ | — | 0.00 | % | ||||||||||
Various soft futures contracts (U.S.) | — | 0.00 | % | — | 0.00 | % | ||||||||||||
Various stock index futures contracts (U.S.) | — | 0.00 | % | — | 0.00 | % | ||||||||||||
|
|
|
|
|
|
|
| |||||||||||
Total Options Purchased | $ | — | 0.00 | % | $ | — | 0.00 | % | ||||||||||
|
|
|
|
|
|
|
| |||||||||||
OPTIONS WRITTEN* | ||||||||||||||||||
Various energy futures contracts (U.S.) | $ | — | 0.00 | % | $ | — | 0.00 | % | ||||||||||
Various soft futures contracts (U.S.) | — | 0.00 | % | — | 0.00 | % | ||||||||||||
Various stock index futures contracts (U.S.) | — | 0.00 | % | — | 0.00 | % | ||||||||||||
|
|
|
|
|
|
|
| |||||||||||
Total Options Written | $ | — | 0.00 | % | $ | — | 0.00 | % | ||||||||||
|
|
|
|
|
|
|
| |||||||||||
SWAPS (1) | ||||||||||||||||||
Frontier XXXIV Balanced Select Swap (U.S.) | $ | 23,473,632 | 21.21 | % | $ | — | 0.00 | % | ||||||||||
|
|
|
|
|
|
|
| |||||||||||
Total Swaps | $ | 23,473,632 | 21.21 | % | $ | — | 0.00 | % | ||||||||||
|
|
|
|
|
|
|
| |||||||||||
U.S. TREASURY SECURITIES (2) | ||||||||||||||||||
| FACE VALUE | Value | Value | ||||||||||||||||
$15,000,000 | US Treasury Note 2.250% due 11/15/2024 (Cost $14,966,695) | $ | 41,182,408 | 37.21 | % | $ | 2,612,146 | 10.90 | % | |||||||||
$85,000,000 | US Treasury Note 6.000% due 02/15/2026 (Cost $113,142,577) | 10,188,655 | 9.21 | % | 646,253 | 2.70 | % | |||||||||||
$20,000,000 | US Treasury Note 6.875% due 08/15/2025 (Cost $28,012,500) | 5,364,035 | 4.85 | % | 340,232 | 1.42 | % | |||||||||||
|
|
|
|
|
|
|
| |||||||||||
| $ | 56,735,098 | 51.27 | % | $ | 3,598,631 | 15.02 | % | |||||||||||
|
|
|
|
|
|
|
| |||||||||||
Additional Disclosure on U.S. Treasury Securities | Face Value | Face Value | ||||||||||||||||
US Treasury Note 2.250% due 11/15/2024(2) | $ | 29,551,228 | $ | 1,874,395 | ||||||||||||||
US Treasury Note 6.000% due 02/15/2026(2) | 6,953,230 | 441,034 | ||||||||||||||||
US Treasury Note 6.875% due 08/15/2025(2) | 5,214,923 | 330,776 | ||||||||||||||||
|
|
|
| |||||||||||||||
| $ | 41,719,381 | $ | 2,646,205 | |||||||||||||||
|
|
|
| |||||||||||||||
Additional Disclosure on U.S. Treasury Securities | Cost | Cost | ||||||||||||||||
US Treasury Note 2.250% due 11/15/2024(2) | $ | 39,335,317 | $ | 2,494,986 | ||||||||||||||
US Treasury Note 6.000% due 02/15/2026(2) | 9,738,868 | 617,723 | ||||||||||||||||
US Treasury Note 6.875% due 08/15/2025(2) | 5,203,344 | 330,041 | ||||||||||||||||
|
|
|
| |||||||||||||||
| $ | 54,277,529 | $ | 3,442,750 | |||||||||||||||
|
|
|
| |||||||||||||||
The accompanying notes are an integral part of these financial statements.
The Series of Equinox Frontier Funds
Condensed Schedule of Investments (Unaudited)
March 31, 2015
| Equinox Frontier Winton Fund | Equinox Frontier Heritage Fund | Equinox Frontier Winton Fund | Equinox Frontier Heritage Fund | |||||||||||||||||||||||||||||||||||
Description | Description | Value | % of Total Capital (Net Asset Value) | Value | % of Total Capital (Net Asset Value) | Description | Fair Value | % of Total Capital (Net Asset Value) | Fair Value | % of Total Capital (Net Asset Value) | ||||||||||||||||||||||||||||
SWAPS (1) | SWAPS (1) | |||||||||||||||||||||||||||||||||||||
| SWAPS (1) | Frontier Brevan Howard swap (U.S.) | $— | 0.00% | $7,809,251 | 49.16% | ||||||||||||||||||||||||||||||||
Frontier Brevan Howard swap (U.S.) | — | 0.00 | % | $ | 9,600,330 | 50.58 | % |
|
|
|
| |||||||||||||||||||||||||||
|
|
|
| Total Swaps | $— | 0.00% | $7,809,251 | 49.16% | ||||||||||||||||||||||||||||||
Total Swaps | — | 0.00 | % | $ | 9,600,330 | 50.58 | % |
|
|
|
| |||||||||||||||||||||||||||
|
|
|
| |||||||||||||||||||||||||||||||||||
| U.S. TREASURY SECURITIES (2) | |||||||||||||||||||||||||||||||||||||
U.S. TREASURY SECURITIES (2) | U.S. TREASURY SECURITIES (2) | |||||||||||||||||||||||||||||||||||||
FACE VALUE | FACE VALUE | Value | Value | FACE VALUE | Fair Value | Fair Value | ||||||||||||||||||||||||||||||||
| $ | 15,000,000 | US Treasury Note 2.250% due 11/15/2024 (Cost $14,966,695) | $ | 23,804,751 | 55.58 | % | $ | 5,374,320 | 28.32 | % | ||||||||||||||||||||||||||||
| $ | 85,000,000 | US Treasury Note 6.000% due 02/15/2026 (Cost $113,142,577) | 5,889,369 | 13.75 | % | 1,329,623 | 7.01 | % | ||||||||||||||||||||||||||||||
| $ | 20,000,000 | US Treasury Note 6.875% due 08/15/2025 (Cost $28,012,500) | 3,100,585 | 7.24 | % | 700,010 | 3.69 | % | ||||||||||||||||||||||||||||||
$75,000,000 | US Treasury Note 6.000% due 02/15/2026 (Cost $99,934,764) | $ | 19,997,657 | 54.36 | % | $ | 4,454,549 | 28.04 | % | |||||||||||||||||||||||||||||
$20,000,000 | US Treasury Note 6.875% due 08/15/2025 (Cost $28,012,500) | 5,619,821 | 15.28 | % | 1,251,835 | 7.88 | % | |||||||||||||||||||||||||||||||
|
|
|
|
|
|
|
| |||||||||||||||||||||||||||||||
| $ | 32,794,705 | 76.57 | % | $ | 7,403,953 | 39.02 | % | $ | 25,617,478 | 69.64 | % | $ | 5,706,384 | 35.92 | % | |||||||||||||||||||||||
|
|
|
|
|
|
|
| |||||||||||||||||||||||||||||||
Additional Disclosure on U.S. Treasury Securities | Additional Disclosure on U.S. Treasury Securities | Face Value | Face Value | Additional Disclosure on U.S. Treasury Securities | Face Value | Face Value | ||||||||||||||||||||||||||||||||
US Treasury Note 2.250% due 11/15/2024 (2) | $ | 17,081,557 | $ | 3,856,447 | ||||||||||||||||||||||||||||||||||
US Treasury Note 6.000% due 02/15/2026 (2) | 4,019,190 | 907,399 | US Treasury Note 6.000% due 02/15/2026 (2) | $ | 14,914,929 | $ | 3,322,354 | |||||||||||||||||||||||||||||||
US Treasury Note 6.875% due 08/15/2025 (2) | 3,014,392 | 680,550 | US Treasury Note 6.875% due 08/15/2025 (2) | 3,977,314 | 885,961 | |||||||||||||||||||||||||||||||||
|
|
|
| |||||||||||||||||||||||||||||||||||
| $ | 24,115,139 | $ | 5,444,396 | $ | 18,892,243 | $ | 4,208,315 | |||||||||||||||||||||||||||||||
|
|
|
| |||||||||||||||||||||||||||||||||||
Additional Disclosure on U.S. Treasury Securities | Additional Disclosure on U.S. Treasury Securities | Cost | Cost | Additional Disclosure on U.S. Treasury Securities | Cost | Cost | ||||||||||||||||||||||||||||||||
US Treasury Note 2.250% due 11/15/2024 (2) | $ | 22,737,074 | $ | 5,133,276 | US Treasury Note 6.000% due 02/15/2026 (2) | $ | 22,500,180 | $ | 5,011,996 | |||||||||||||||||||||||||||||
US Treasury Note 6.000% due 02/15/2026 (2) | 5,629,378 | 1,270,926 | US Treasury Note 6.875% due 08/15/2025 (2) | 5,570,726 | 1,240,899 | |||||||||||||||||||||||||||||||||
US Treasury Note 6.875% due 08/15/2025 (2) | 3,007,700 | 679,037 |
|
| ||||||||||||||||||||||||||||||||||
|
| $ | 28,070,906 | $ | 6,252,895 | |||||||||||||||||||||||||||||||||
| $ | 31,374,152 | $ | 7,083,239 |
|
| |||||||||||||||||||||||||||||||||
|
| |||||||||||||||||||||||||||||||||||||
| (1) | See Note 4 to the Financial Statements. |
| (2) | Assets have been allocated to each Series based upon ownership in the cash management pool. See Note 2. |
The accompanying notes are an integral part of these financial statements.
The Series of Equinox Frontier Funds
Condensed Schedule of Investments
December 31, 2014
| Equinox Frontier Diversified Fund | Equinox Frontier Masters Fund | Equinox Frontier Long/Short Commodities Fund | Equinox Frontier Diversified Fund | Equinox Frontier Masters Fund | Equinox Frontier Long/Short Commodity Fund | |||||||||||||||||||||||||||||||||||||||||||||||||
Description | Description | Value | % of Total Capital (Net Asset Value) | Value | % of Total Capital (Net Asset Value) | Value | % of Total Capital (Net Asset Value) | Description | Value | % of Total Capital (Net Asset Value) | Value | % of Total Capital (Net Asset Value) | Value | % of Total Capital (Net Asset Value) | ||||||||||||||||||||||||||||||||||||||||
LONG FUTURES CONTRACTS * | LONG FUTURES CONTRACTS * | |||||||||||||||||||||||||||||||||||||||||||||||||||||
Various base metals futures contracts (Europe) | $ | (312,320 | ) | -0.43 | % | $ | — | 0.00 | % | $ | — | 0.00 | % | |||||||||||||||||||||||||||||||||||||||||
Various base metals futures contracts (U.S.) | (48,075 | ) | -0.07 | % | — | 0.00 | % | — | 0.00 | % | ||||||||||||||||||||||||||||||||||||||||||||
Various currency futures contracts (U.S.) | 560,666 | 0.77 | % | — | 0.00 | % | — | 0.00 | % | |||||||||||||||||||||||||||||||||||||||||||||
Various energy futures contracts (Europe) | — | 0.00 | % | — | 0.00 | % | — | 0.00 | % | |||||||||||||||||||||||||||||||||||||||||||||
Various energy futures contracts (Far East) | — | 0.00 | % | — | 0.00 | % | — | 0.00 | % | |||||||||||||||||||||||||||||||||||||||||||||
Various energy futures contracts (U.S.) | 10,206 | 0.01 | % | — | 0.00 | % | — | 0.00 | % | |||||||||||||||||||||||||||||||||||||||||||||
Various interest rates futures contracts (Canada) | 79,701 | 0.11 | % | — | 0.00 | % | — | 0.00 | % | |||||||||||||||||||||||||||||||||||||||||||||
Various interest rates futures contracts (Europe) | 676,493 | 0.93 | % | — | 0.00 | % | — | 0.00 | % | |||||||||||||||||||||||||||||||||||||||||||||
Various interest rates futures contracts (Far East) | 208,691 | 0.29 | % | — | 0.00 | % | — | 0.00 | % | |||||||||||||||||||||||||||||||||||||||||||||
Various interest rates futures contracts (Oceanic) | 299,804 | 0.41 | % | — | 0.00 | % | — | 0.00 | % | |||||||||||||||||||||||||||||||||||||||||||||
Various interest rates futures contracts (U.S.) | 289,361 | 0.40 | % | — | 0.00 | % | — | 0.00 | % | |||||||||||||||||||||||||||||||||||||||||||||
Various precious metal futures contracts (Far East) | — | 0.00 | % | — | 0.00 | % | — | 0.00 | % | |||||||||||||||||||||||||||||||||||||||||||||
Various precious metal futures contracts (U.S.) | (60,655 | ) | -0.08 | % | — | 0.00 | % | — | 0.00 | % | ||||||||||||||||||||||||||||||||||||||||||||
Various soft futures contracts (Canada) | — | 0.00 | % | — | 0.00 | % | — | 0.00 | % | |||||||||||||||||||||||||||||||||||||||||||||
Various soft futures contracts (Europe) | 2,809 | 0.00 | % | — | 0.00 | % | — | 0.00 | % | |||||||||||||||||||||||||||||||||||||||||||||
Various soft futures contracts (Oceanic) | — | 0.00 | % | — | 0.00 | % | — | 0.00 | % | |||||||||||||||||||||||||||||||||||||||||||||
Various soft futures contracts (U.S.) | (89,038 | ) | -0.12 | % | — | 0.00 | % | — | 0.00 | % | ||||||||||||||||||||||||||||||||||||||||||||
Various stock index futures contracts (Canada) | 33,439 | 0.08 | % | — | 0.00 | % | — | 0.00 | % | |||||||||||||||||||||||||||||||||||||||||||||
Various stock index futures contracts (Europe) | (44,720 | ) | -0.06 | % | — | 0.00 | % | — | 0.00 | % | ||||||||||||||||||||||||||||||||||||||||||||
Various stock index futures contracts (Far East) | 14,786 | 0.02 | % | — | 0.00 | % | — | 0.00 | % | |||||||||||||||||||||||||||||||||||||||||||||
Various stock index futures contracts (Oceanic) | 35,072 | 0.08 | % | — | 0.00 | % | — | 0.00 | % | |||||||||||||||||||||||||||||||||||||||||||||
Various stock index futures contracts (U.S.) | 370,308 | 0.51 | % | — | 0.00 | % | — | 0.00 | % | |||||||||||||||||||||||||||||||||||||||||||||
|
|
|
|
|
| |||||||||||||||||||||||||||||||||||||||||||||||||
Total Long Futures Contracts | $ | 2,026,528 | 2.85 | % | $ | — | 0.00 | % | $ | — | 0.00 | % | ||||||||||||||||||||||||||||||||||||||||||
|
|
|
|
|
| |||||||||||||||||||||||||||||||||||||||||||||||||
SHORT FUTURES CONTRACTS * | SHORT FUTURES CONTRACTS * | |||||||||||||||||||||||||||||||||||||||||||||||||||||
| LONG FUTURES CONTRACTS * | Various base metals futures contracts (Europe) | $ | 251,789 | 0.35 | % | $ | — | 0.00 | % | $ | — | 0.00 | % | ||||||||||||||||||||||||||||||||||||||||
Various base metals futures contracts (Europe) | $ | (312,320 | ) | -0.43 | % | $ | — | 0.00 | % | $ | — | 0.00 | % | Various base metals futures contracts (U.S.) | 50,963 | 0.07 | % | — | 0.00 | % | — | 0.00 | % | |||||||||||||||||||||||||||||||
Various base metals futures contracts (U.S.) | (48,075 | ) | -0.07 | % | — | 0.00 | % | — | 0.00 | % | Various currency futures contracts (Far East) | — | 0.00 | % | — | 0.00 | % | — | 0.00 | % | ||||||||||||||||||||||||||||||||||
Various currency futures contracts (U.S.) | 560,666 | 0.77 | % | — | 0.00 | % | — | 0.00 | % | Various currency futures contracts (U.S.) | 360,124 | 0.50 | % | — | 0.00 | % | — | 0.00 | % | |||||||||||||||||||||||||||||||||||
Various energy futures contracts (Europe) | — | 0.00 | % | — | 0.00 | % | — | 0.00 | % | Various energy futures contracts (Europe) | — | 0.00 | % | — | 0.00 | % | — | 0.00 | % | |||||||||||||||||||||||||||||||||||
Various energy futures contracts (Far East) | — | 0.00 | % | — | 0.00 | % | — | 0.00 | % | Various energy futures contracts (Far East) | — | 0.00 | % | — | 0.00 | % | — | 0.00 | % | |||||||||||||||||||||||||||||||||||
Various energy futures contracts (U.S.) | 10,206 | 0.01 | % | — | 0.00 | % | — | 0.00 | % | Various energy futures contracts (U.S.) | 356,351 | 0.49 | % | — | 0.00 | % | — | 0.00 | % | |||||||||||||||||||||||||||||||||||
Various interest rates futures contracts (Canada) | 79,701 | 0.11 | % | — | 0.00 | % | — | 0.00 | % | Various interest rates futures contracts (Canada) | 12,112 | 0.02 | % | — | 0.00 | % | — | 0.00 | % | |||||||||||||||||||||||||||||||||||
Various interest rates futures contracts (Europe) | 676,493 | 0.93 | % | — | 0.00 | % | — | 0.00 | % | Various interest rates futures contracts (Europe) | (14,958 | ) | -0.02 | % | — | 0.00 | % | — | 0.00 | % | ||||||||||||||||||||||||||||||||||
Various interest rates futures contracts (Far East) | 208,691 | 0.29 | % | — | 0.00 | % | — | 0.00 | % | Various interest rates futures contracts (Far East) | — | 0.00 | % | — | 0.00 | % | — | 0.00 | % | |||||||||||||||||||||||||||||||||||
Various interest rates futures contracts (Oceanic) | 299,804 | 0.41 | % | — | 0.00 | % | — | 0.00 | % | Various interest rates futures contracts (Oceanic) | — | 0.00 | % | — | 0.00 | % | — | 0.00 | % | |||||||||||||||||||||||||||||||||||
Various interest rates futures contracts (U.S.) | 289,361 | 0.40 | % | — | 0.00 | % | — | 0.00 | % | Various interest rates futures contracts (U.S.) | (128 | ) | 0.00 | % | — | 0.00 | % | — | 0.00 | % | ||||||||||||||||||||||||||||||||||
Various precious metal futures contracts (Far East) | — | 0.00 | % | — | 0.00 | % | — | 0.00 | % | Various precious metal futures contracts (Far East) | — | 0.00 | % | — | 0.00 | % | — | 0.00 | % | |||||||||||||||||||||||||||||||||||
Various precious metal futures contracts (U.S.) | (60,655 | ) | -0.08 | % | — | 0.00 | % | — | 0.00 | % | Various precious metal futures contracts (U.S.) | 7,685 | 0.01 | % | — | 0.00 | % | — | 0.00 | % | ||||||||||||||||||||||||||||||||||
Various soft futures contracts (Canada) | — | 0.00 | % | — | 0.00 | % | — | 0.00 | % | Various soft futures contracts (Canada) | — | 0.00 | % | — | 0.00 | % | — | 0.00 | % | |||||||||||||||||||||||||||||||||||
Various soft futures contracts (Europe) | 2,809 | 0.00 | % | — | 0.00 | % | — | 0.00 | % | Various soft futures contracts (Europe) | 92,535 | 0.13 | % | — | 0.00 | % | — | 0.00 | % | |||||||||||||||||||||||||||||||||||
Various soft futures contracts (Oceanic) | — | 0.00 | % | — | 0.00 | % | — | 0.00 | % | Various soft futures contracts (Far East) | — | 0.00 | % | — | 0.00 | % | — | 0.00 | % | |||||||||||||||||||||||||||||||||||
Various soft futures contracts (U.S.) | (89,038 | ) | -0.12 | % | — | 0.00 | % | — | 0.00 | % | Various soft futures contracts (U.S.) | 78,930 | 0.11 | % | — | 0.00 | % | — | 0.00 | % | ||||||||||||||||||||||||||||||||||
Various stock index futures contracts (Canada) | 33,439 | 0.08 | % | — | 0.00 | % | — | 0.00 | % | Various stock index futures contracts (Africa) | — | 0.00 | % | — | 0.00 | % | — | 0.00 | % | |||||||||||||||||||||||||||||||||||
Various stock index futures contracts (Europe) | (44,720 | ) | -0.06 | % | — | 0.00 | % | — | 0.00 | % | Various stock index futures contracts (Europe) | (24,501 | ) | -0.03 | % | — | 0.00 | % | — | 0.00 | % | |||||||||||||||||||||||||||||||||
Various stock index futures contracts (Far East) | 14,786 | 0.02 | % | — | 0.00 | % | — | 0.00 | % | Various stock index futures contracts (Far East) | (28,299 | ) | -0.04 | % | — | 0.00 | % | — | 0.00 | % | ||||||||||||||||||||||||||||||||||
Various stock index futures contracts (Oceanic) | 35,072 | 0.08 | % | — | 0.00 | % | — | 0.00 | % | Various stock index futures contracts (Mexico) | — | 0.00 | % | — | 0.00 | % | — | 0.00 | % | |||||||||||||||||||||||||||||||||||
Various stock index futures contracts (U.S.) | 370,308 | 0.51 | % | — | 0.00 | % | — | 0.00 | % | Various stock index futures contracts (Oceanic) | — | 0.00 | % | — | 0.00 | % | — | 0.00 | % | |||||||||||||||||||||||||||||||||||
|
|
|
|
|
| Various stock index futures contracts (U.S.) | 2,837 | 0.00 | % | — | 0.00 | % | — | 0.00 | % | |||||||||||||||||||||||||||||||||||||||
Total Long Futures Contracts | $ | 2,026,528 | 2.85 | % | $ | — | 0.00 | % | $ | — | 0.00 | % |
|
|
|
|
|
| ||||||||||||||||||||||||||||||||||||
|
|
|
|
|
| Total Short Futures Contracts | $ | 1,145,440 | 1.59 | % | $ | — | 0.00 | % | $ | — | 0.00 | % | ||||||||||||||||||||||||||||||||||||
| SHORT FUTURES CONTRACTS * |
|
|
|
|
|
| |||||||||||||||||||||||||||||||||||||||||||||||
CURRENCY FORWARDS * | CURRENCY FORWARDS * | |||||||||||||||||||||||||||||||||||||||||||||||||||||
Various base metals futures contracts (Europe) | $ | 251,789 | 0.35 | % | $ | — | 0.00 | % | $ | — | 0.00 | % | Various currency forwards contracts (NA) | $ | 43,238 | 0.06 | % | $ | — | 0.00 | % | $ | — | 0.00 | % | |||||||||||||||||||||||||||||
Various base metals futures contracts (U.S.) | 50,963 | 0.07 | % | — | 0.00 | % | — | 0.00 | % |
|
|
|
|
|
| |||||||||||||||||||||||||||||||||||||||
Various currency futures contracts (Far East) | — | 0.00 | % | — | 0.00 | % | — | 0.00 | % | Total Currency Forwards | $ | 43,238 | 0.06 | % | $ | — | 0.00 | % | $ | — | 0.00 | % | ||||||||||||||||||||||||||||||||
Various currency futures contracts (U.S.) | 360,124 | 0.50 | % | — | 0.00 | % | — | 0.00 | % |
|
|
|
|
|
| |||||||||||||||||||||||||||||||||||||||
Various energy futures contracts (Europe) | — | 0.00 | % | — | 0.00 | % | — | 0.00 | % | Total Open Trade Equity (Deficit) | $ | 3,215,206 | 4.50 | % | $ | — | 0.00 | % | $ | — | 0.00 | % | ||||||||||||||||||||||||||||||||
Various energy futures contracts (Far East) | — | 0.00 | % | — | 0.00 | % | — | 0.00 | % |
|
|
|
|
|
| |||||||||||||||||||||||||||||||||||||||
OPTIONS PURCHASED * | OPTIONS PURCHASED * | |||||||||||||||||||||||||||||||||||||||||||||||||||||
Various energy futures contracts (U.S.) | 356,351 | 0.49 | % | — | 0.00 | % | — | 0.00 | % | Various energy futures contracts (U.S.) | $ | — | 0.00 | % | $ | — | 0.00 | % | $ | — | 0.00 | % | ||||||||||||||||||||||||||||||||
Various interest rates futures contracts (Canada) | 12,112 | 0.02 | % | — | 0.00 | % | — | 0.00 | % | Various soft futures contracts (U.S.) | — | 0.00 | % | — | 0.00 | % | — | 0.00 | % | |||||||||||||||||||||||||||||||||||
Various interest rates futures contracts (Europe) | (14,958 | ) | -0.02 | % | — | 0.00 | % | — | 0.00 | % | Various stock index futures contracts (U.S.) | 288,413 | 0.40 | % | — | 0.00 | % | — | 0.00 | % | ||||||||||||||||||||||||||||||||||
Various interest rates futures contracts (Far East) | — | 0.00 | % | — | 0.00 | % | — | 0.00 | % |
|
|
|
|
|
| |||||||||||||||||||||||||||||||||||||||
Various interest rates futures contracts (Oceanic) | — | 0.00 | % | — | 0.00 | % | — | 0.00 | % | Total Options Purchased | $ | 288,413 | 0.40 | % | $ | — | 0.00 | % | $ | — | 0.00 | % | ||||||||||||||||||||||||||||||||
Various interest rates futures contracts (U.S.) | (128 | ) | 0.00 | % | — | 0.00 | % | — | 0.00 | % |
|
|
|
|
|
| ||||||||||||||||||||||||||||||||||||||
OPTIONS WRITTEN * | OPTIONS WRITTEN * | |||||||||||||||||||||||||||||||||||||||||||||||||||||
Various precious metal futures contracts (Far East) | — | 0.00 | % | — | 0.00 | % | — | 0.00 | % | Various energy futures contracts (U.S.) | $ | — | 0.00 | % | $ | — | 0.00 | % | $ | — | 0.00 | % | ||||||||||||||||||||||||||||||||
Various precious metal futures contracts (U.S.) | 7,685 | 0.01 | % | — | 0.00 | % | — | 0.00 | % | Various soft futures contracts (U.S.) | — | 0.00 | % | — | 0.00 | % | — | 0.00 | % | |||||||||||||||||||||||||||||||||||
Various soft futures contracts (Canada) | — | 0.00 | % | — | 0.00 | % | — | 0.00 | % | Various stock index futures contracts (U.S.) | (253,018 | ) | -0.35 | % | — | 0.00 | % | — | 0.00 | % | ||||||||||||||||||||||||||||||||||
Various soft futures contracts (Europe) | 92,535 | 0.13 | % | — | 0.00 | % | — | 0.00 | % |
|
|
|
|
|
| |||||||||||||||||||||||||||||||||||||||
Various soft futures contracts (Far East) | — | 0.00 | % | — | 0.00 | % | — | 0.00 | % | Total Options Written | $ | (253,018 | ) | -0.35 | % | $ | — | 0.00 | % | $ | — | 0.00 | % | |||||||||||||||||||||||||||||||
Various soft futures contracts (U.S.) | 78,930 | 0.11 | % | — | 0.00 | % | — | 0.00 | % |
|
|
|
|
|
| |||||||||||||||||||||||||||||||||||||||
SWAPS (1) | SWAPS (1) | |||||||||||||||||||||||||||||||||||||||||||||||||||||
Various stock index futures contracts (Africa) | — | 0.00 | % | — | 0.00 | % | — | 0.00 | % | Frontier XXXV Diversified select swap (U.S.) | $ | 6,570,408 | 9.07 | % | — | 0.00 | % | $ | — | 0.00 | % | |||||||||||||||||||||||||||||||||
Various stock index futures contracts (Europe) | (24,501 | ) | -0.03 | % | — | 0.00 | % | — | 0.00 | % | Frontier XXXVII L/S select swap (U.S.) | — | 0.00 | % | — | 0.00 | % | 3,633,060 | 21.86 | % | ||||||||||||||||||||||||||||||||||
Various stock index futures contracts (Far East) | (28,299 | ) | -0.04 | % | — | 0.00 | % | — | 0.00 | % |
|
|
|
|
|
| ||||||||||||||||||||||||||||||||||||||
Various stock index futures contracts (Mexico) | — | 0.00 | % | — | 0.00 | % | — | 0.00 | % | Total Swaps | $ | 6,570,408 | 9.07 | % | $ | — | 0.00 | % | $ | 3,633,060 | 21.86 | % | ||||||||||||||||||||||||||||||||
Various stock index futures contracts (Oceanic) | — | 0.00 | % | — | 0.00 | % | — | 0.00 | % |
|
|
|
|
|
| |||||||||||||||||||||||||||||||||||||||
Various stock index futures contracts (U.S.) | 2,837 | 0.00 | % | — | 0.00 | % | — | 0.00 | % | |||||||||||||||||||||||||||||||||||||||||||||
|
|
|
|
|
| |||||||||||||||||||||||||||||||||||||||||||||||||
Total Short Futures Contracts | $ | 1,145,440 | 1.59 | % | $ | — | 0.00 | % | $ | — | 0.00 | % | ||||||||||||||||||||||||||||||||||||||||||
|
|
|
|
|
| |||||||||||||||||||||||||||||||||||||||||||||||||
| CURRENCY FORWARDS * | |||||||||||||||||||||||||||||||||||||||||||||||||||||
Various currency forwards contracts (NA) | $ | 43,238 | 0.06 | % | $ | — | 0.00 | % | $ | — | 0.00 | % | ||||||||||||||||||||||||||||||||||||||||||
|
|
|
|
|
| |||||||||||||||||||||||||||||||||||||||||||||||||
Total Currency Forwards | $ | 43,238 | 0.06 | % | $ | — | 0.00 | % | $ | — | 0.00 | % | ||||||||||||||||||||||||||||||||||||||||||
|
|
|
|
|
| |||||||||||||||||||||||||||||||||||||||||||||||||
Total Open Trade Equity (Deficit) | $ | 3,215,206 | 4.50 | % | $ | — | 0.00 | % | $ | — | 0.00 | % | ||||||||||||||||||||||||||||||||||||||||||
|
|
|
|
|
| |||||||||||||||||||||||||||||||||||||||||||||||||
| OPTIONS PURCHASED * | |||||||||||||||||||||||||||||||||||||||||||||||||||||
Various energy futures contracts (U.S.) | $ | — | 0.00 | % | $ | — | 0.00 | % | $ | — | 0.00 | % | ||||||||||||||||||||||||||||||||||||||||||
Various soft futures contracts (U.S.) | — | 0.00 | % | — | 0.00 | % | — | 0.00 | % | |||||||||||||||||||||||||||||||||||||||||||||
Various stock index futures contracts (U.S.) | 288,413 | 0.40 | % | — | 0.00 | % | — | 0.00 | % | |||||||||||||||||||||||||||||||||||||||||||||
|
|
|
|
|
| |||||||||||||||||||||||||||||||||||||||||||||||||
Total Options Purchased | $ | 288,413 | 0.40 | % | $ | — | 0.00 | % | $ | — | 0.00 | % | ||||||||||||||||||||||||||||||||||||||||||
|
|
|
|
|
| |||||||||||||||||||||||||||||||||||||||||||||||||
| OPTIONS WRITTEN * | |||||||||||||||||||||||||||||||||||||||||||||||||||||
Various energy futures contracts (U.S.) | $ | — | 0.00 | % | $ | — | 0.00 | % | $ | — | 0.00 | % | ||||||||||||||||||||||||||||||||||||||||||
Various soft futures contracts (U.S.) | — | 0.00 | % | — | 0.00 | % | — | 0.00 | % | |||||||||||||||||||||||||||||||||||||||||||||
Various stock index futures contracts (U.S.) | (253,018 | ) | -0.35 | % | — | 0.00 | % | — | 0.00 | % | ||||||||||||||||||||||||||||||||||||||||||||
|
|
|
|
|
| |||||||||||||||||||||||||||||||||||||||||||||||||
Total Options Written | $ | (253,018 | ) | -0.35 | % | $ | — | 0.00 | % | $ | — | 0.00 | % | |||||||||||||||||||||||||||||||||||||||||
|
|
|
|
|
| |||||||||||||||||||||||||||||||||||||||||||||||||
| SWAPS (1) | |||||||||||||||||||||||||||||||||||||||||||||||||||||
Frontier XXXV Diversified select swap (U.S.) | $ | 6,570,408 | 9.07 | % | — | 0.00 | % | $ | — | 0.00 | % | |||||||||||||||||||||||||||||||||||||||||||
Frontier XXXVII L/S select swap (U.S.) | — | 0.00 | % | — | 0.00 | % | 3,633,060 | 21.86 | % | |||||||||||||||||||||||||||||||||||||||||||||
|
|
|
|
|
| |||||||||||||||||||||||||||||||||||||||||||||||||
Total Swaps | $ | 6,570,408 | 9.07 | % | $ | — | 0.00 | % | $ | 3,633,060 | 21.86 | % | ||||||||||||||||||||||||||||||||||||||||||
|
|
|
|
|
| |||||||||||||||||||||||||||||||||||||||||||||||||
| U.S. TREASURY SECURITIES (2) | |||||||||||||||||||||||||||||||||||||||||||||||||||||
U.S. TREASURY SECURITIES (2) | U.S. TREASURY SECURITIES (2) | |||||||||||||||||||||||||||||||||||||||||||||||||||||
FACE VALUE | FACE VALUE | Fair Value | Fair Value | Fair Value | FACE VALUE | Fair Value | Fair Value | Fair Value | ||||||||||||||||||||||||||||||||||||||||||||||
| $ | 15,000,000 | US Treasury Note 2.250% due 11/15/2024 (Cost $14,966,695) | $ | 21,289,585 | 29.40 | % | $ | 11,118,790 | 43.25 | % | $ | 5,616,255 | 33.80 | % | ||||||||||||||||||||||||||||||||||||||||
| $ | 75,000,000 | US Treasury Note 6.000% due 02/15/2026 (Cost $99,579,227) | 6,411,385 | 8.85 | % | 3,348,438 | 13.02 | % | 1,691,342 | 10.18 | % | |||||||||||||||||||||||||||||||||||||||||||
| $ | 20,000,000 | US Treasury Note 6.875% due 08/15/2025 (Cost $28,322,622) | 3,350,689 | 4.63 | % | 1,749,945 | 6.81 | % | 883,922 | 5.32 | % | |||||||||||||||||||||||||||||||||||||||||||
$15,000,000 | US Treasury Note 2.250% due 11/15/2024 (Cost $14,966,695) | $ | 21,289,585 | 29.40 | % | $ | 11,118,790 | 43.25 | % | $ | 5,616,255 | 33.80 | % | |||||||||||||||||||||||||||||||||||||||||
$75,000,000 | US Treasury Note 6.000% due 02/15/2026 (Cost $99,579,227) | 6,411,385 | 8.85 | % | 3,348,438 | 13.02 | % | 1,691,342 | 10.18 | % | ||||||||||||||||||||||||||||||||||||||||||||
$20,000,000 | US Treasury Note 6.875% due 08/15/2025 (Cost $28,322,622) | 3,350,689 | 4.63 | % | 1,749,945 | 6.81 | % | 883,922 | 5.32 | % | ||||||||||||||||||||||||||||||||||||||||||||
|
|
|
|
|
|
|
|
|
|
|
| |||||||||||||||||||||||||||||||||||||||||||
| $ | 31,051,659 | 42.88 | % | $ | 16,217,173 | 63.08 | % | $ | 8,191,519 | 49.30 | % | $ | 31,051,659 | 42.88 | % | $ | 16,217,173 | 63.08 | % | $ | 8,191,519 | 49.30 | % | |||||||||||||||||||||||||||||||
|
|
|
|
|
|
|
|
|
|
|
| |||||||||||||||||||||||||||||||||||||||||||
Additional Disclosure on U.S. Treasury Securities | Additional Disclosure on U.S. Treasury Securities | Face Value | Face Value | Face Value | Additional Disclosure on U.S. Treasury Securities | Face Value | Face Value | Face Value | ||||||||||||||||||||||||||||||||||||||||||||||
US Treasury Note 2.250% due 11/15/2024 (2) | $ | 16,640,343 | $ | 8,690,657 | $ | 4,389,772 | US Treasury Note 2.250% due 11/15/2024 (2) | $ | 16,640,343 | $ | 8,690,657 | $ | 4,389,772 | |||||||||||||||||||||||||||||||||||||||||
US Treasury Note 6.000% due 02/15/2026 (2) | 4,437,425 | 2,317,508 | 1,170,606 | US Treasury Note 6.000% due 02/15/2026 (2) | 4,437,425 | 2,317,508 | 1,170,606 | |||||||||||||||||||||||||||||||||||||||||||||||
US Treasury Note 6.875% due 08/15/2025 (2) | 3,328,068 | 1,738,131 | 877,954 | US Treasury Note 6.875% due 08/15/2025 (2) | 3,328,068 | 1,738,131 | 877,954 | |||||||||||||||||||||||||||||||||||||||||||||||
|
|
|
|
|
| |||||||||||||||||||||||||||||||||||||||||||||||||
| $ | 24,405,836 | $ | 12,746,296 | $ | 6,438,332 | $ | 24,405,836 | $ | 12,746,296 | $ | 6,438,332 | |||||||||||||||||||||||||||||||||||||||||||
|
|
|
|
|
| |||||||||||||||||||||||||||||||||||||||||||||||||
Additional Disclosure on U.S. Treasury Securities | Additional Disclosure on U.S. Treasury Securities | Cost | Cost | Cost | Additional Disclosure on U.S. Treasury Securities | Cost | Cost | Cost | ||||||||||||||||||||||||||||||||||||||||||||||
US Treasury Note 2.250% due 11/15/2024 (2) | $ | 22,093,766 | $ | 11,538,785 | $ | 5,828,400 | US Treasury Note 2.250% due 11/15/2024 (2) | $ | 22,093,766 | $ | 11,538,785 | $ | 5,828,400 | |||||||||||||||||||||||||||||||||||||||||
US Treasury Note 6.000% due 02/15/2026 (2) | 6,283,975 | 3,281,896 | 1,657,731 | US Treasury Note 6.000% due 02/15/2026 (2) | 6,283,975 | 3,281,896 | 1,657,731 | |||||||||||||||||||||||||||||||||||||||||||||||
US Treasury Note 6.875% due 08/15/2025 (2) | 3,320,679 | 1,734,272 | 876,005 | US Treasury Note 6.875% due 08/15/2025 (2) | 3,320,679 | 1,734,272 | 876,005 | |||||||||||||||||||||||||||||||||||||||||||||||
|
|
|
|
|
| |||||||||||||||||||||||||||||||||||||||||||||||||
| $ | 31,698,420 | $ | 16,554,953 | $ | 8,362,136 | $ | 31,698,420 | $ | 16,554,953 | $ | 8,362,136 | |||||||||||||||||||||||||||||||||||||||||||
|
|
|
|
|
| |||||||||||||||||||||||||||||||||||||||||||||||||
| * | Except for those items disclosed, no individual futures, forwards and option on futures contract position constituted greater than 1 percent of Net Asset Value. Accordingly, the number of contracts and expiration dates are not presented. |
| (1) | See Note 4 to the Financial Statements. |
| (2) | Assets have been allocated to each Series based upon ownership in the cash management pool. See Note 2. |
The accompanying notes are an integral part of these financial statements.
The Series of Equinox Frontier Funds
Condensed Schedule of Investments
December 31, 2014
| Equinox Frontier Balanced Fund | Equinox Frontier Select Fund | |||||||||||||||||||
Description | Value | % of Total Capital (Net Asset Value) | Value | % of Total Capital (Net Asset Value) | ||||||||||||||||
| LONG FUTURES CONTRACTS * | |||||||||||||||||||
Various base metals futures contracts (Europe) | $ | (3,493,625 | ) | -3.22 | % | $ | — | 0.00 | % | |||||||||||
Various base metals futures contracts (U.S.) | (13,775 | ) | -0.01 | % | — | 0.00 | % | |||||||||||||
Various currency futures contracts (U.S.) | (254,409 | ) | -0.23 | % | — | 0.00 | % | |||||||||||||
Various energy futures contracts (Europe) | (12,920 | ) | -0.01 | % | — | 0.00 | % | |||||||||||||
Various energy futures contracts (Far East) | (2,738 | ) | 0.00 | % | — | 0.00 | % | |||||||||||||
Various energy futures contracts (U.S.) | (1,406,837 | ) | -1.30 | % | — | 0.00 | % | |||||||||||||
Various interest rates futures contracts (Canada) | 84,291 | 0.08 | % | — | 0.00 | % | ||||||||||||||
Various interest rates futures contracts (Europe) | 1,312,057 | 1.21 | % | — | 0.00 | % | ||||||||||||||
Various interest rates futures contracts (Far East) | 217,701 | 0.20 | % | — | 0.00 | % | ||||||||||||||
Various interest rates futures contracts (Oceanic) | 164,422 | 0.15 | % | — | 0.00 | % | ||||||||||||||
Various interest rates futures contracts (U.S.) | 298,985 | 0.28 | % | — | 0.00 | % | ||||||||||||||
Various precious metal futures contracts (Far East) | 6,195 | 0.01 | % | — | 0.00 | % | ||||||||||||||
Various precious metal futures contracts (U.S.) | (57,380 | ) | -0.05 | % | — | 0.00 | % | |||||||||||||
Various soft futures contracts (Canada) | (1,360 | ) | 0.00 | % | — | 0.00 | % | |||||||||||||
Various soft futures contracts (Europe) | 8,013 | 0.01 | % | — | 0.00 | % | ||||||||||||||
Various soft futures contracts (Oceanic) | (864 | ) | 0.00 | % | — | 0.00 | % | |||||||||||||
Various soft futures contracts (U.S.) | (208,634 | ) | -0.19 | % | — | 0.00 | % | |||||||||||||
Various stock index futures contracts (Canada) | 17,918 | 0.02 | % | — | 0.00 | % | ||||||||||||||
Various stock index futures contracts (Europe) | 231,293 | 0.21 | % | — | 0.00 | % | ||||||||||||||
Various stock index futures contracts (Far East) | (6,494 | ) | -0.01 | % | — | 0.00 | % | |||||||||||||
Various stock index futures contracts (Oceanic) | (1,389 | ) | 0.00 | % | — | 0.00 | % | |||||||||||||
Various stock index futures contracts (U.S.) | 337,695 | 0.31 | % | — | 0.00 | % | ||||||||||||||
|
|
|
|
|
|
|
| |||||||||||||
Total Long Futures Contracts | $ | (2,781,855 | ) | -2.54 | % | $ | — | 0.00 | % | |||||||||||
|
|
|
|
|
|
|
| |||||||||||||
| SHORT FUTURES CONTRACTS * | |||||||||||||||||||
Various base metals futures contracts (Europe) | $ | 3,165,035 | 2.92 | % | $ | — | 0.00 | % | ||||||||||||
Various base metals futures contracts (U.S.) | 19,963 | 0.02 | % | — | 0.00 | % | ||||||||||||||
Various currency futures contracts (Far East) | (3,383 | ) | 0.00 | % | — | 0.00 | % | |||||||||||||
Various currency futures contracts (U.S.) | 462,616 | 0.43 | % | — | 0.00 | % | ||||||||||||||
Various energy futures contracts (Europe) | 49,517 | 0.05 | % | — | 0.00 | % | ||||||||||||||
Various energy futures contracts (Far East) | 5,389 | 0.00 | % | — | 0.00 | % | ||||||||||||||
Various energy futures contracts (U.S.) | 2,602,685 | 2.40 | % | — | 0.00 | % | ||||||||||||||
Various interest rates futures contracts (Canada) | 11 | 0.00 | % | — | 0.00 | % | ||||||||||||||
Various interest rates futures contracts (Europe) | (261,457 | ) | -0.24 | % | — | 0.00 | % | |||||||||||||
Various interest rates futures contracts (Far East) | — | 0.00 | % | — | 0.00 | % | ||||||||||||||
Various interest rates futures contracts (Oceanic) | (1,673 | ) | 0.00 | % | — | 0.00 | % | |||||||||||||
Various interest rates futures contracts (U.S.) | (20,699 | ) | -0.02 | % | — | 0.00 | % | |||||||||||||
Various precious metal futures contracts (Far East) | (1,052 | ) | 0.00 | % | — | 0.00 | % | |||||||||||||
Various precious metal futures contracts (U.S.) | 112,155 | 0.10 | % | — | 0.00 | % | ||||||||||||||
Various soft futures contracts (Canada) | — | 0.00 | % | — | 0.00 | % | ||||||||||||||
Various soft futures contracts (Europe) | 19,813 | 0.02 | % | — | 0.00 | % | ||||||||||||||
Various soft futures contracts (Far East) | (4,709 | ) | 0.00 | % | — | 0.00 | % | |||||||||||||
Various soft futures contracts (U.S.) | 438,427 | 0.40 | % | — | 0.00 | % | ||||||||||||||
Various stock index futures contracts (Africa) | (4,181 | ) | 0.00 | % | — | 0.00 | % | |||||||||||||
Various stock index futures contracts (Europe) | (13,338 | ) | -0.01 | % | — | 0.00 | % | |||||||||||||
Various stock index futures contracts (Far East) | 129 | 0.00 | % | — | 0.00 | % | ||||||||||||||
Various stock index futures contracts (Mexico) | (4,380 | ) | 0.00 | % | — | 0.00 | % | |||||||||||||
Various stock index futures contracts (Oceanic) | (9,866 | ) | -0.01 | % | — | 0.00 | % | |||||||||||||
Various stock index futures contracts (U.S.) | (51,856 | ) | -0.05 | % | — | 0.00 | % | |||||||||||||
|
|
|
|
|
|
|
| |||||||||||||
Total Short Futures Contracts | $ | 6,499,146 | 6.01 | % | $ | — | 0.00 | % | ||||||||||||
|
|
|
|
|
|
|
| |||||||||||||
| CURRENCY FORWARDS * | |||||||||||||||||||
Various currency forwards contracts (NA) | $ | (419,742 | ) | -0.39 | % | $ | — | 0.00 | % | |||||||||||
|
|
|
|
|
|
|
| |||||||||||||
Total Currency Forwards | $ | (419,742 | ) | -0.39 | % | $ | — | 0.00 | % | |||||||||||
|
|
|
|
|
|
|
| |||||||||||||
Total Open Trade Equity (Deficit) | $ | 3,297,549 | 3.08 | % | $ | — | 0.00 | % | ||||||||||||
|
|
|
|
|
|
|
| |||||||||||||
| OPTIONS PURCHASED * | |||||||||||||||||||
Frontier XXXIV Balanced Select Swap (U.S.) | $ | 18,246,954 | 16.82 | % | $ | — | 0.00 | % | ||||||||||||
|
|
|
|
|
|
|
| |||||||||||||
Total Swaps | $ | 18,246,954 | 16.82 | % | $ | — | 0.00 | % | ||||||||||||
|
|
|
|
|
|
|
| |||||||||||||
| U.S. TREASURY SECURITIES (2) | |||||||||||||||||||
FACE VALUE | Value | Value | ||||||||||||||||||
| $ | 15,000,000 | US Treasury Note 2.250% due 11/15/2024 (Cost $14,966,695) | $ | 28,539,451 | 26.31 | % | $ | 4,440,708 | 29.08 | % | ||||||||||
| $ | 75,000,000 | US Treasury Note 6.000% due 02/15/2026 (Cost $99,579,227) | 8,594,691 | 7.92 | % | 1,337,325 | 8.76 | % | ||||||||||||
| $ | 20,000,000 | US Treasury Note 6.875% due 08/15/2025 (Cost $28,322,622) | 4,491,718 | 4.14 | % | 698,906 | 4.58 | % | ||||||||||||
|
|
|
|
|
|
|
| |||||||||||||
| $ | 41,625,860 | 38.37 | % | $ | 6,476,939 | 42.42 | % | |||||||||||||
|
|
|
|
|
|
|
| |||||||||||||
Additional Disclosure on U.S. Treasury Securities | Face Value | Face Value | ||||||||||||||||||
US Treasury Note 2.250% due 11/15/2024 (2) | $ | 22,306,974 | $ | 3,470,942 | ||||||||||||||||
US Treasury Note 6.000% due 02/15/2026 (2) | 5,948,526 | 925,584 | ||||||||||||||||||
US Treasury Note 6.875% due 08/15/2025 (2) | 4,461,395 | 694,188 | ||||||||||||||||||
|
|
|
| |||||||||||||||||
| $ | 32,716,895 | $ | 5,090,714 | |||||||||||||||||
|
|
|
| |||||||||||||||||
Additional Disclosure on U.S. Treasury Securities | Cost | Cost | ||||||||||||||||||
US Treasury Note 2.250% due 11/15/2024 (2) | $ | 29,617,482 | $ | 4,608,448 | ||||||||||||||||
US Treasury Note 6.000% due 02/15/2026 (2) | 8,423,893 | 1,310,749 | ||||||||||||||||||
US Treasury Note 6.875% due 08/15/2025 (2) | 4,451,489 | 692,647 | ||||||||||||||||||
|
|
|
| |||||||||||||||||
| $ | 42,492,864 | $ | 6,611,844 | |||||||||||||||||
|
|
|
| |||||||||||||||||
| Equinox Frontier Balanced Fund | Equinox Frontier Select Fund | |||||||||||||||||
| % of Total Capital | % of Total Capital | |||||||||||||||||
Description | Value | (Net Asset Value) | Value | (Net Asset Value) | ||||||||||||||
LONG FUTURES CONTRACTS * | ||||||||||||||||||
Various base metals futures contracts (Europe) | $ | (3,493,625 | ) | -3.22 | % | $ | — | 0.00 | % | |||||||||
Various base metals futures contracts (U.S.) | (13,775 | ) | -0.01 | % | — | 0.00 | % | |||||||||||
Various currency futures contracts (U.S.) | (254,409 | ) | -0.23 | % | — | 0.00 | % | |||||||||||
Various energy futures contracts (Europe) | (12,920 | ) | -0.01 | % | — | 0.00 | % | |||||||||||
Various energy futures contracts (Far East) | (2,738 | ) | 0.00 | % | — | 0.00 | % | |||||||||||
Various energy futures contracts (U.S.) | (1,406,837 | ) | -1.30 | % | — | 0.00 | % | |||||||||||
Various interest rates futures contracts (Canada) | 84,291 | 0.08 | % | — | 0.00 | % | ||||||||||||
Various interest rates futures contracts (Europe) | 1,312,057 | 1.21 | % | — | 0.00 | % | ||||||||||||
Various interest rates futures contracts (Far East) | 217,701 | 0.20 | % | — | 0.00 | % | ||||||||||||
Various interest rates futures contracts (Oceanic) | 164,422 | 0.15 | % | — | 0.00 | % | ||||||||||||
Various interest rates futures contracts (U.S.) | 298,985 | 0.28 | % | — | 0.00 | % | ||||||||||||
Various precious metal futures contracts (Far East) | 6,195 | 0.01 | % | — | 0.00 | % | ||||||||||||
Various precious metal futures contracts (U.S.) | (57,380 | ) | -0.05 | % | — | 0.00 | % | |||||||||||
Various soft futures contracts (Canada) | (1,360 | ) | 0.00 | % | — | 0.00 | % | |||||||||||
Various soft futures contracts (Europe) | 8,013 | 0.01 | % | — | 0.00 | % | ||||||||||||
Various soft futures contracts (Oceanic) | (864 | ) | 0.00 | % | — | 0.00 | % | |||||||||||
Various soft futures contracts (U.S.) | (208,634 | ) | -0.19 | % | — | 0.00 | % | |||||||||||
Various stock index futures contracts (Canada) | 17,918 | 0.02 | % | — | 0.00 | % | ||||||||||||
Various stock index futures contracts (Europe) | 231,293 | 0.21 | % | — | 0.00 | % | ||||||||||||
Various stock index futures contracts (Far East) | (6,494 | ) | -0.01 | % | — | 0.00 | % | |||||||||||
Various stock index futures contracts (Oceanic) | (1,389 | ) | 0.00 | % | — | 0.00 | % | |||||||||||
Various stock index futures contracts (U.S.) | 337,695 | 0.31 | % | — | 0.00 | % | ||||||||||||
|
|
|
|
|
|
|
| |||||||||||
Total Long Futures Contracts | $ | (2,781,855 | ) | -2.54 | % | $ | — | 0.00 | % | |||||||||
|
|
|
|
|
|
|
| |||||||||||
SHORT FUTURES CONTRACTS * | ||||||||||||||||||
Various base metals futures contracts (Europe) | $ | 3,165,035 | 2.92 | % | $ | — | 0.00 | % | ||||||||||
Various base metals futures contracts (U.S.) | 19,963 | 0.02 | % | — | 0.00 | % | ||||||||||||
Various currency futures contracts (Far East) | (3,383 | ) | 0.00 | % | — | 0.00 | % | |||||||||||
Various currency futures contracts (U.S.) | 462,616 | 0.43 | % | — | 0.00 | % | ||||||||||||
Various energy futures contracts (Europe) | 49,517 | 0.05 | % | — | 0.00 | % | ||||||||||||
Various energy futures contracts (Far East) | 5,389 | 0.00 | % | — | 0.00 | % | ||||||||||||
Various energy futures contracts (U.S.) | 2,602,685 | 2.40 | % | — | 0.00 | % | ||||||||||||
Various interest rates futures contracts (Canada) | 11 | 0.00 | % | — | 0.00 | % | ||||||||||||
Various interest rates futures contracts (Europe) | (261,457 | ) | -0.24 | % | — | 0.00 | % | |||||||||||
Various interest rates futures contracts (Far East) | — | 0.00 | % | — | 0.00 | % | ||||||||||||
Various interest rates futures contracts (Oceanic) | (1,673 | ) | 0.00 | % | — | 0.00 | % | |||||||||||
Various interest rates futures contracts (U.S.) | (20,699 | ) | -0.02 | % | — | 0.00 | % | |||||||||||
Various precious metal futures contracts (Far East) | (1,052 | ) | 0.00 | % | — | 0.00 | % | |||||||||||
Various precious metal futures contracts (U.S.) | 112,155 | 0.10 | % | — | 0.00 | % | ||||||||||||
Various soft futures contracts (Canada) | — | 0.00 | % | — | 0.00 | % | ||||||||||||
Various soft futures contracts (Europe) | 19,813 | 0.02 | % | — | 0.00 | % | ||||||||||||
Various soft futures contracts (Far East) | (4,709 | ) | 0.00 | % | — | 0.00 | % | |||||||||||
Various soft futures contracts (U.S.) | 438,427 | 0.40 | % | — | 0.00 | % | ||||||||||||
Various stock index futures contracts (Africa) | (4,181 | ) | 0.00 | % | — | 0.00 | % | |||||||||||
Various stock index futures contracts (Europe) | (13,338 | ) | -0.01 | % | — | 0.00 | % | |||||||||||
Various stock index futures contracts (Far East) | 129 | 0.00 | % | — | 0.00 | % | ||||||||||||
Various stock index futures contracts (Mexico) | (4,380 | ) | 0.00 | % | — | 0.00 | % | |||||||||||
Various stock index futures contracts (Oceanic) | (9,866 | ) | -0.01 | % | — | 0.00 | % | |||||||||||
Various stock index futures contracts (U.S.) | (51,856 | ) | -0.05 | % | — | 0.00 | % | |||||||||||
|
|
|
|
|
|
|
| |||||||||||
Total Short Futures Contracts | $ | 6,499,146 | 6.01 | % | $ | — | 0.00 | % | ||||||||||
|
|
|
|
|
|
|
| |||||||||||
CURRENCY FORWARDS * | ||||||||||||||||||
Various currency forwards contracts (NA) | $ | (419,742 | ) | -0.39 | % | $ | — | 0.00 | % | |||||||||
|
|
|
|
|
|
|
| |||||||||||
Total Currency Forwards | $ | (419,742 | ) | -0.39 | % | $ | — | 0.00 | % | |||||||||
|
|
|
|
|
|
|
| |||||||||||
Total Open Trade Equity (Deficit) | $ | 3,297,549 | 3.08 | % | $ | — | 0.00 | % | ||||||||||
|
|
|
|
|
|
|
| |||||||||||
OPTIONS PURCHASED * | ||||||||||||||||||
Frontier XXXIV Balanced Select Swap (U.S.) | $ | 18,246,954 | 16.82 | % | $ | — | 0.00 | % | ||||||||||
|
|
|
|
|
|
|
| |||||||||||
Total Swaps | $ | 18,246,954 | 16.82 | % | $ | — | 0.00 | % | ||||||||||
|
|
|
|
|
|
|
| |||||||||||
U.S. TREASURY SECURITIES (2) | ||||||||||||||||||
FACE VALUE | Value | Value | ||||||||||||||||
$15,000,000 | US Treasury Note 2.250% due 11/15/2024 (Cost $14,966,695) | $ | 28,539,451 | 26.31 | % | $ | 4,440,708 | 29.08 | % | |||||||||
$75,000,000 | US Treasury Note 6.000% due 02/15/2026 (Cost $99,579,227) | 8,594,691 | 7.92 | % | 1,337,325 | 8.76 | % | |||||||||||
$20,000,000 | US Treasury Note 6.875% due 08/15/2025 (Cost $28,322,622) | 4,491,718 | 4.14 | % | 698,906 | 4.58 | % | |||||||||||
|
|
|
|
|
|
|
| |||||||||||
| $ | 41,625,860 | 38.37 | % | $ | 6,476,939 | 42.42 | % | |||||||||||
|
|
|
|
|
|
|
| |||||||||||
Additional Disclosure on U.S. Treasury Securities | Face Value | Face Value | ||||||||||||||||
US Treasury Note 2.250% due 11/15/2024 (2) | $ | 22,306,974 | $ | 3,470,942 | ||||||||||||||
US Treasury Note 6.000% due 02/15/2026 (2) | 5,948,526 | 925,584 | ||||||||||||||||
US Treasury Note 6.875% due 08/15/2025 (2) | 4,461,395 | 694,188 | ||||||||||||||||
|
|
|
| |||||||||||||||
| $ | 32,716,895 | $ | 5,090,714 | |||||||||||||||
|
|
|
| |||||||||||||||
Additional Disclosure on U.S. Treasury Securities | Cost | Cost | ||||||||||||||||
US Treasury Note 2.250% due 11/15/2024 (2) | $ | 29,617,482 | $ | 4,608,448 | ||||||||||||||
US Treasury Note 6.000% due 02/15/2026 (2) | 8,423,893 | 1,310,749 | ||||||||||||||||
US Treasury Note 6.875% due 08/15/2025 (2) | 4,451,489 | 692,647 | ||||||||||||||||
|
|
|
| |||||||||||||||
| $ | 42,492,864 | $ | 6,611,844 | |||||||||||||||
|
|
|
| |||||||||||||||
| * | Except for those items disclosed, no individual futures, forwards and option on futures contract position constituted greater than 1 percent of Net Asset Value. Accordingly, the number of contracts and expiration dates are not presented. |
| (1) | See Note 4 to the Financial Statements. |
| (2) | Assets have been allocated to each Series based upon ownership in the cash management pool. See Note 2. |
The accompanying notes are an integral part of these financial statements.
The Series of Equinox Frontier Funds
Condensed Schedule of Investments
December 31, 2014
| Equinox Frontier Winton Fund | Equinox Frontier Heritage Fund | |||||||||||||||||||
Description | Value | % of Total Capital (Net Asset Value) | Value | % of Total Capital (Net Asset Value) | ||||||||||||||||
Swaps (1) | ||||||||||||||||||||
Brevan Howard Total Return Swap | $ | — | 0.00 | % | $ | 7,540,465 | 45.52 | % | ||||||||||||
|
|
|
|
|
|
|
| |||||||||||||
Total Swaps | $ | — | 0.00 | % | $ | 7,540,465 | 45.52 | % | ||||||||||||
|
|
|
|
|
|
|
| |||||||||||||
| U.S. TREASURY SECURITIES (2) | |||||||||||||||||||
FACE VALUE | Fair Value | Fair Value | ||||||||||||||||||
| $ | 15,000,000 | US Treasury Note 2.250% due 11/15/2024 (Cost $14,966,695) | $ | 20,290,169 | 50.66 | % | $ | 4,659,730 | 28.13 | % | ||||||||||
| $ | 75,000,000 | US Treasury Note 6.000% due 02/15/2026 (Cost $99,579,227) | 6,110,410 | 15.26 | % | 1,403,284 | 8.47 | % | ||||||||||||
| $ | 20,000,000 | US Treasury Note 6.875% due 08/15/2025 (Cost $28,322,622) | 3,193,395 | 7.97 | % | 733,378 | 4.43 | % | ||||||||||||
|
|
|
|
|
|
|
| |||||||||||||
| $ | 29,593,974 | 73.89 | % | $ | 6,796,392 | 41.03 | % | |||||||||||||
|
|
|
|
|
|
|
| |||||||||||||
Additional Disclosure on U.S. Treasury Securities | Face Value | Face Value | ||||||||||||||||||
US Treasury Note 2.250% due 11/15/2024 (2) | $ | 15,859,181 | $ | 3,642,134 | ||||||||||||||||
US Treasury Note 6.000% due 02/15/2026 (2) | 4,229,115 | 971,236 | ||||||||||||||||||
US Treasury Note 6.875% due 08/15/2025 (2) | 3,171,836 | 728,427 | ||||||||||||||||||
|
|
|
| |||||||||||||||||
| $ | 23,260,132 | $ | 5,341,797 | |||||||||||||||||
|
|
|
| |||||||||||||||||
Additional Disclosure on U.S. Treasury Securities | Cost | Cost | ||||||||||||||||||
US Treasury Note 2.250% due 11/15/2024 (2) | $ | 21,056,599 | $ | 4,835,746 | ||||||||||||||||
US Treasury Note 6.000% due 02/15/2026 (2) | 5,988,981 | 1,375,397 | ||||||||||||||||||
US Treasury Note 6.875% due 08/15/2025 (2) | 3,164,794 | 726,809 | ||||||||||||||||||
|
|
|
| |||||||||||||||||
| $ | 30,210,374 | $ | 6,937,952 | |||||||||||||||||
|
|
|
| |||||||||||||||||
| Equinox Frontier Winton Fund | Equinox Frontier Heritage Fund | |||||||||||||||||
| % of Total Capital | % of Total Capital | |||||||||||||||||
Description | Value | (Net Asset Value) | Value | (Net Asset Value) | ||||||||||||||
Swaps (1) | ||||||||||||||||||
Brevan Howard Total Return Swap | $ | — | 0.00 | % | $ | 7,540,465 | 45.52 | % | ||||||||||
|
|
|
|
|
|
|
| |||||||||||
Total Swaps | $ | — | 0.00 | % | $ | 7,540,465 | 45.52 | % | ||||||||||
|
|
|
|
|
|
|
| |||||||||||
U.S. TREASURY SECURITIES (2) | ||||||||||||||||||
FACE VALUE | Fair Value | Fair Value | ||||||||||||||||
$15,000,000 | US Treasury Note 2.250% due 11/15/2024 (Cost $14,966,695) | $ | 20,290,169 | 50.66 | % | $ | 4,659,730 | 28.13 | % | |||||||||
$75,000,000 | US Treasury Note 6.000% due 02/15/2026 (Cost $99,579,227) | 6,110,410 | 15.26 | % | 1,403,284 | 8.47 | % | |||||||||||
$20,000,000 | US Treasury Note 6.875% due 08/15/2025 (Cost $28,322,622) | 3,193,395 | 7.97 | % | 733,378 | 4.43 | % | |||||||||||
|
|
|
|
|
|
|
| |||||||||||
| $ | 29,593,974 | 73.89 | % | $ | 6,796,392 | 41.03 | % | |||||||||||
|
|
|
|
|
|
|
| |||||||||||
Additional Disclosure on U.S. Treasury Securities | Face Value | Face Value | ||||||||||||||||
US Treasury Note 2.250% due 11/15/2024 (2) | $ | 15,859,181 | $ | 3,642,134 | ||||||||||||||
US Treasury Note 6.000% due 02/15/2026 (2) | 4,229,115 | 971,236 | ||||||||||||||||
US Treasury Note 6.875% due 08/15/2025 (2) | 3,171,836 | 728,427 | ||||||||||||||||
|
|
|
| |||||||||||||||
| $ | 23,260,132 | $ | 5,341,797 | |||||||||||||||
|
|
|
| |||||||||||||||
Additional Disclosure on U.S. Treasury Securities | Cost | Cost | ||||||||||||||||
US Treasury Note 2.250% due 11/15/2024 (2) | $ | 21,056,599 | $ | 4,835,746 | ||||||||||||||
US Treasury Note 6.000% due 02/15/2026 (2) | 5,988,981 | 1,375,397 | ||||||||||||||||
US Treasury Note 6.875% due 08/15/2025 (2) | 3,164,794 | 726,809 | ||||||||||||||||
|
|
|
| |||||||||||||||
| $ | 30,210,374 | $ | 6,937,952 | |||||||||||||||
|
|
|
| |||||||||||||||
| (1) | See Note 4 to the Financial Statements. |
| (2) | Assets have been allocated to each Series based upon ownership in the cash management pool. See Note 2. |
The accompanying notes are an integral part of these financial statements.
The Series of Equinox Frontier Funds
Statements of Operations
For the Three Months Ended March 31,June 30, 2015 and 2014
(Unaudited)
| Equinox Frontier Diversified Fund | Equinox Frontier Masters Fund | Equinox Frontier Long/Short Commodity Fund | ||||||||||||||||||||||||||||||||||||||||||||||
| 3/31/2015 | 3/31/2014 | 3/31/2015 | 3/31/2014 | 3/31/2015 | 3/31/2014 | Equinox Frontier Diversified Fund | Equinox Frontier Masters Fund | Equinox Frontier Long/Short Commodity Fund | ||||||||||||||||||||||||||||||||||||||||
| 6/30/2015 | 6/30/2014 | 6/30/2015 | 6/30/2014 | 6/30/2015 | 6/30/2014 | |||||||||||||||||||||||||||||||||||||||||||
Investment income: | ||||||||||||||||||||||||||||||||||||||||||||||||
Interest - net | $ | 169,258 | $ | 164,878 | $ | 71,164 | $ | 95,272 | $ | 47,058 | $ | 69,247 | $ | 155,143 | $ | 135,499 | $ | 68,655 | $ | 71,429 | $ | 43,133 | $ | 47,605 | ||||||||||||||||||||||||
|
|
|
|
|
|
|
|
|
|
|
| |||||||||||||||||||||||||||||||||||||
Total Income | 169,258 | 164,878 | 71,164 | 95,272 | 47,058 | 69,247 | 155,143 | 135,499 | 68,655 | 71,429 | 43,133 | 47,605 | ||||||||||||||||||||||||||||||||||||
|
|
|
|
|
| |||||||||||||||||||||||||||||||||||||||||||
|
|
|
|
|
| |||||||||||||||||||||||||||||||||||||||||||
Expenses: | ||||||||||||||||||||||||||||||||||||||||||||||||
Incentive Fees | 1,634,242 | 432,084 | 535,302 | 13,712 | 239,217 | — | 4,000 | 954,829 | 41,072 | 168,094 | 40,149 | — | ||||||||||||||||||||||||||||||||||||
Management Fees | 246,304 | 276,556 | 178,660 | 277,080 | 123,036 | 286,630 | 243,004 | 271,073 | 182,496 | 230,233 | 131,237 | 223,050 | ||||||||||||||||||||||||||||||||||||
Service Fees - Class 1 | 121,918 | 148,411 | 65,178 | 104,283 | 31,900 | 38,564 | 108,250 | 125,184 | 60,813 | 76,310 | 29,629 | 30,304 | ||||||||||||||||||||||||||||||||||||
Trading Fees | 370,802 | 342,565 | 153,633 | 175,915 | 68,928 | 81,977 | 351,096 | 307,242 | 147,701 | 147,195 | 65,150 | 64,027 | ||||||||||||||||||||||||||||||||||||
|
|
|
|
|
|
|
|
|
|
|
| |||||||||||||||||||||||||||||||||||||
Total Expenses | 2,373,266 | 1,199,616 | 932,773 | 570,990 | 463,081 | 407,171 | 706,350 | 1,658,328 | 432,082 | 621,832 | 266,165 | 317,381 | ||||||||||||||||||||||||||||||||||||
|
|
|
|
|
|
|
|
|
|
|
| |||||||||||||||||||||||||||||||||||||
Investment (loss) - net | (2,204,008 | ) | (1,034,738 | ) | (861,609 | ) | (475,718 | ) | (416,023 | ) | (337,924 | ) | (551,207 | ) | (1,522,829 | ) | (363,427 | ) | (550,403 | ) | (223,032 | ) | (269,776 | ) | ||||||||||||||||||||||||
|
|
|
|
|
| |||||||||||||||||||||||||||||||||||||||||||
|
|
|
|
|
| |||||||||||||||||||||||||||||||||||||||||||
Realized and unrealized gain/(loss) on investments: | ||||||||||||||||||||||||||||||||||||||||||||||||
Net realized gain/(loss) on futures, forwards and options | 8,401,169 | 325,864 | — | — | — | (2,436,495 | ) | 480,498 | — | — | — | — | (144,365 | ) | ||||||||||||||||||||||||||||||||||
Net change in open trade equity/(deficit) | (127,891 | ) | (83,337 | ) | — | — | — | (805,786 | ) | (3,084,315 | ) | — | — | — | — | 1,767,132 | ||||||||||||||||||||||||||||||||
Net realized gain/(loss) on swap contracts | — | — | — | — | — | — | — | — | — | — | — | — | ||||||||||||||||||||||||||||||||||||
Net unrealized gain/(loss) on swap contracts | 2,988,716 | (579,402 | ) | — | — | 668,912 | (424,783 | ) | (1,943,955 | ) | 188,167 | — | — | (997,763 | ) | 186,322 | ||||||||||||||||||||||||||||||||
Net realized gain/(loss) on U.S. Treasury securities | — | (110,584 | ) | — | (62,525 | ) | — | (48,820 | ) | 133,349 | (17,129 | ) | 56,105 | (9,105 | ) | 33,884 | (6,059 | ) | ||||||||||||||||||||||||||||||
Net unrealized gain/(loss) on U.S. Treasury securities | 684,086 | 1,348,616 | 344,244 | 776,321 | 128,767 | 581,928 | (1,267,982 | ) | 535,347 | (572,666 | ) | 284,576 | (345,884 | ) | 192,801 | |||||||||||||||||||||||||||||||||
Trading commissions | (184,318 | ) | (6,385 | ) | — | — | — | (407,275 | ) | (182,250 | ) | — | — | — | — | (8,038 | ) | |||||||||||||||||||||||||||||||
Change in fair value of investments in unconsolidated trading companies | 3,472,709 | (2,479,300 | ) | 3,095,759 | (1,853,437 | ) | 1,934,525 | (545,646 | ) | (1,411,843 | ) | 3,363,720 | (2,913,886 | ) | 1,844,351 | (512,304 | ) | (466,714 | ) | |||||||||||||||||||||||||||||
|
|
|
|
|
|
|
|
|
|
|
| |||||||||||||||||||||||||||||||||||||
Net gain/(loss) on investments | 15,234,471 | (1,584,528 | ) | 3,440,003 | (1,139,641 | ) | 2,732,204 | (4,086,877 | ) | (7,276,498 | ) | 4,070,105 | (3,430,447 | ) | 2,119,822 | (1,822,067 | ) | 1,521,079 | ||||||||||||||||||||||||||||||
|
|
|
|
|
|
|
|
|
|
|
| |||||||||||||||||||||||||||||||||||||
NET INCREASE/(DECREASE) IN CAPITAL RESULTING FROM OPERATIONS | 13,030,463 | (2,619,266 | ) | 2,578,394 | (1,615,359 | ) | 2,316,181 | (4,424,801 | ) | |||||||||||||||||||||||||||||||||||||||
|
|
|
|
|
| |||||||||||||||||||||||||||||||||||||||||||
NET INCREASE/(DECREASE) IN CAPITAL | ||||||||||||||||||||||||||||||||||||||||||||||||
RESULTING FROM OPERATIONS | (7,827,705 | ) | 2,547,276 | (3,793,874 | ) | 1,569,419 | (2,045,099 | ) | 1,251,303 | |||||||||||||||||||||||||||||||||||||||
|
|
|
|
|
| |||||||||||||||||||||||||||||||||||||||||||
Less: Operations attributable to non-controlling interests | 3,313,397 | 325,371 | — | — | — | (1,906,446 | ) | (322,342 | ) | — | — | — | — | 1,139,624 | ||||||||||||||||||||||||||||||||||
|
|
|
|
|
|
|
|
|
|
|
| |||||||||||||||||||||||||||||||||||||
NET INCREASE/(DECREASE) IN CAPITAL RESULTING FROM | ||||||||||||||||||||||||||||||||||||||||||||||||
OPERATIONS ATTRIBUTABLE TO CONTROLLING INTERESTS | $ | (7,505,363 | ) | $ | 2,547,276 | $ | (3,793,874 | ) | $ | 1,569,419 | $ | (2,045,099 | ) | $ | 111,679 | |||||||||||||||||||||||||||||||||
|
|
|
|
|
| |||||||||||||||||||||||||||||||||||||||||||
NET INCREASE/(DECREASE) IN CAPITAL RESULTING FROM OPERATIONS ATTRIBUTABLE TO CONTROLLING INTERESTS | $ | 9,717,066 | $ | (2,944,637 | ) | $ | 2,578,394 | $ | (1,615,359 | ) | $ | 2,316,181 | $ | (2,518,355 | ) | |||||||||||||||||||||||||||||||||
|
|
|
|
|
| |||||||||||||||||||||||||||||||||||||||||||
NET INCREASE/(DECREASE) IN CAPITAL RESULTING FROM OPERATIONS ATTRIBUTABLE TO CONTROLLING INTERESTS PER UNIT | ||||||||||||||||||||||||||||||||||||||||||||||||
NET INCREASE/(DECREASE) IN CAPITAL RESULTING FROM OPERATIONS | ||||||||||||||||||||||||||||||||||||||||||||||||
ATTRIBUTABLE TO CONTROLLING INTERESTS PER UNIT | ||||||||||||||||||||||||||||||||||||||||||||||||
Class 1 | $ | 18.57 | $ | (4.33 | ) | $ | 11.77 | $ | (4.53 | ) | N/A | N/A | $ | (16.11 | ) | $ | 4.00 | $ | (18.37 | ) | $ | 5.67 | N/A | N/A | ||||||||||||||||||||||||
Class 1a | N/A | N/A | N/A | N/A | $ | 19.58 | $ | (10.31 | ) | N/A | N/A | N/A | N/A | $ | (13.53 | ) | $ | 0.34 | ||||||||||||||||||||||||||||||
Class 2 | $ | 21.09 | $ | (4.30 | ) | $ | 13.59 | $ | (4.50 | ) | $ | 27.90 | $ | (13.78 | ) | $ | (17.27 | ) | $ | 4.76 | $ | (19.80 | ) | $ | 6.61 | $ | (18.04 | ) | $ | 0.69 | ||||||||||||||||||
Class 2a | N/A | N/A | N/A | N/A | $ | 22.14 | $ | (10.78 | ) | N/A | N/A | N/A | N/A | $ | (14.46 | ) | $ | 0.76 | ||||||||||||||||||||||||||||||
Class 3 | $ | 19.54 | $ | (1.29 | ) | $ | 12.67 | $ | (4.11 | ) | $ | 27.72 | $ | (13.79 | ) | $ | (15.87 | ) | $ | 4.45 | $ | (18.28 | ) | $ | 6.17 | $ | (17.86 | ) | $ | 0.69 | ||||||||||||||||||
Class 3a | N/A | N/A | N/A | N/A | $ | 22.32 | $ | (10.73 | ) | N/A | N/A | N/A | N/A | $ | (14.45 | ) | $ | 0.82 | ||||||||||||||||||||||||||||||
The accompanying notes are an integral part of these financial statements.
The Series of the Equinox Frontier Funds
Statements of Operations
For the Three Months Ended March 31,June 30, 2015 and 2014
(Unaudited)
| Equinox Frontier Balanced Fund | Equinox Frontier Select Fund | |||||||||||||||
| 3/31/2015 | 3/31/2014 | 3/31/2015 | 3/31/2014 | |||||||||||||
Investment income: | ||||||||||||||||
Interest - net | $ | 7,190 | $ | 8,530 | $ | — | $ | — | ||||||||
|
|
|
|
|
|
|
| |||||||||
Total Income/(loss) | 7,190 | 8,530 | — | — | ||||||||||||
|
|
|
|
|
|
|
| |||||||||
Expenses: | ||||||||||||||||
Incentive Fees | 1,486,957 | 551,286 | 158,971 | — | ||||||||||||
Management Fees | 259,595 | 290,385 | 80,072 | 138,438 | ||||||||||||
Service Fees - Class 1 | 562,801 | 549,448 | 106,901 | 105,588 | ||||||||||||
Trading Fees | 195,344 | 187,399 | 29,893 | 29,402 | ||||||||||||
|
|
|
|
|
|
|
| |||||||||
Total Expenses | 2,504,697 | 1,578,518 | 375,837 | 273,428 | ||||||||||||
|
|
|
|
|
|
|
| |||||||||
Investment (loss) - net | (2,497,507 | ) | (1,569,988 | ) | (375,837 | ) | (273,428 | ) | ||||||||
|
|
|
|
|
|
|
| |||||||||
Realized and unrealized gain/(loss) on investments: | ||||||||||||||||
Net realized gain/(loss) on futures, forwards and options | 6,275,679 | 3,619,162 | 2,285,627 | — | ||||||||||||
Net change in open trade equity/(deficit) | (1,365,815 | ) | (2,159,164 | ) | (704,083 | ) | — | |||||||||
Net realized gain/(loss) on swap contracts | — | — | — | — | ||||||||||||
Net unrealized gain/(loss) on swap contracts | 5,226,678 | (1,485,685 | ) | — | — | |||||||||||
Net realized gain/(loss) on U.S. Treasury securities | — | (194,409 | ) | — | (30,381 | ) | ||||||||||
Net unrealized gain/(loss) on U.S. Treasury securities | 737,851 | 2,447,648 | 159,412 | 357,469 | ||||||||||||
Trading commissions | (141,905 | ) | (287,160 | ) | (32,172 | ) | — | |||||||||
Change in fair value of investments in unconsolidated trading companies | 5,522,449 | (4,082,223 | ) | 1,032,449 | (1,097,426 | ) | ||||||||||
|
|
|
|
|
|
|
| |||||||||
Net gain/(loss) on investments | 16,254,937 | (2,141,831 | ) | 2,741,233 | (770,338 | ) | ||||||||||
|
|
|
|
|
|
|
| |||||||||
NET INCREASE/(DECREASE) IN CAPITAL RESULTING FROM OPERATIONS | 13,757,430 | (3,711,819 | ) | 2,365,396 | (1,043,766 | ) | ||||||||||
|
|
|
|
|
|
|
| |||||||||
Less: Operations attributable to non-controlling interests | 830,142 | 453,538 | 682,333 | — | ||||||||||||
|
|
|
|
|
|
|
| |||||||||
NET INCREASE/(DECREASE) IN CAPITAL RESULTING FROM OPERATIONS ATTRIBUTABLE TO CONTROLLING INTERESTS | $ | 12,927,288 | $ | (4,165,357 | ) | $ | 1,683,063 | $ | (1,043,766 | ) | ||||||
|
|
|
|
|
|
|
| |||||||||
NET INCREASE/(DECREASE) IN CAPITAL RESULTING FROM OPERATIONS ATTRIBUTABLE TO CONTROLLING INTERESTS PER UNIT | ||||||||||||||||
Class 1 | $ | 17.26 | $ | (4.30 | ) | $ | 10.55 | $ | (4.85 | ) | ||||||
Class 1AP | $ | 18.60 | N/A | $ | 11.49 | N/A | ||||||||||
Class 2 | $ | 25.01 | $ | (4.68 | ) | $ | 15.25 | $ | (5.59 | ) | ||||||
Class 2a | $ | 21.74 | $ | (3.63 | ) | N/A | N/A | |||||||||
Class 3a | $ | 21.67 | $ | (3.61 | ) | N/A | N/A | |||||||||
| Equinox Frontier Balanced Fund | Equinox Frontier Select Fund | |||||||||||||||
| 6/30/2015 | 6/30/2014 | 6/30/2015 | 6/30/2014 | |||||||||||||
Investment income: | ||||||||||||||||
Interest - net | $ | 8,003 | $ | 6,543 | $ | — | $ | — | ||||||||
|
|
|
|
|
|
|
| |||||||||
Total Income/(loss) | 8,003 | 6,543 | — | — | ||||||||||||
|
|
|
|
|
|
|
| |||||||||
Expenses: | ||||||||||||||||
Incentive Fees | 9,517 | 902,054 | — | 26,677 | ||||||||||||
Management Fees | 267,377 | 264,152 | 78,206 | 140,286 | ||||||||||||
Service Fees - Class 1 | 556,081 | 492,255 | 101,967 | 97,799 | ||||||||||||
Trading Fees | 194,144 | 167,758 | 28,454 | 27,150 | ||||||||||||
|
|
|
|
|
|
|
| |||||||||
Total Expenses | 1,027,119 | 1,826,219 | 208,627 | 291,912 | ||||||||||||
|
|
|
|
|
|
|
| |||||||||
Investment (loss) - net | (1,019,116 | ) | (1,819,676 | ) | (208,627 | ) | (291,912 | ) | ||||||||
|
|
|
|
|
|
|
| |||||||||
Realized and unrealized gain/(loss) on investments: | ||||||||||||||||
Net realized gain/(loss) on futures, forwards and options | (2,682,859 | ) | 4,111,434 | (2,163,972 | ) | — | ||||||||||
Net change in open trade equity/(deficit) | (1,047,941 | ) | 623,763 | (902,659 | ) | — | ||||||||||
Net realized gain/(loss) on swap contracts | — | — | — | — | ||||||||||||
Net unrealized gain/(loss) on swap contracts | (4,981,998 | ) | 856,058 | — | — | |||||||||||
Net realized gain/(loss) on U.S. Treasury securities | 215,325 | (31,461 | ) | 12,618 | (4,607 | ) | ||||||||||
Net unrealized gain/(loss) on U.S. Treasury securities | (2,126,900 | ) | 967,127 | (126,672 | ) | 138,584 | ||||||||||
Trading commissions | (124,528 | ) | (345,203 | ) | (33,722 | ) | — | |||||||||
Change in fair value of investments in unconsolidated trading companies | (854,236 | ) | 197,789 | (856,713 | ) | 768,926 | ||||||||||
|
|
|
|
|
|
|
| |||||||||
Net gain/(loss) on investments | (11,603,137 | ) | 6,379,507 | (4,071,120 | ) | 902,903 | ||||||||||
|
|
|
|
|
|
|
| |||||||||
NET INCREASE/(DECREASE) IN CAPITAL RESULTING FROM OPERATIONS | (12,622,253 | ) | 4,559,831 | (4,279,747 | ) | 610,991 | ||||||||||
|
|
|
|
|
|
|
| |||||||||
Less: Operations attributable to non-controlling interests | (473,996 | ) | 2,854,321 | (1,366,570 | ) | — | ||||||||||
|
|
|
|
|
|
|
| |||||||||
NET INCREASE/(DECREASE) IN CAPITAL RESULTING FROM OPERATIONS ATTRIBUTABLE TO CONTROLLING INTERESTS | $ | (12,148,257 | ) | $ | 1,705,510 | $ | (2,913,177 | ) | $ | 610,991 | ||||||
|
|
|
|
|
|
|
| |||||||||
NET INCREASE/(DECREASE) IN CAPITAL RESULTING FROM OPERATIONS ATTRIBUTABLE TO CONTROLLING INTERESTS PER UNIT | ||||||||||||||||
Class 1 | $ | (16.98 | ) | $ | 1.87 | $ | (18.85 | ) | $ | 3.22 | ||||||
Class 1AP | $ | (16.31 | ) | N/A | $ | (18.57 | ) | N/A | ||||||||
Class 2 | $ | (21.93 | ) | $ | 3.54 | $ | (24.64 | ) | $ | 5.01 | ||||||
Class 2a | $ | (18.40 | ) | $ | 3.30 | N/A | N/A | |||||||||
Class 3a | $ | (18.34 | ) | $ | 3.29 | N/A | N/A | |||||||||
The accompanying notes are an integral part of these financial statements.
The Series of Equinox Frontier Funds
Statements of Operations
For the Three Months Ended June 30, 2015 and 2014
(Unaudited)
| Equinox Frontier Winton Fund | Equinox Frontier Heritage Fund | |||||||||||||||
| 6/30/2015 | 6/30/2014 | 6/30/2015 | 6/30/2014 | |||||||||||||
Investment income: | ||||||||||||||||
Interest - net | $ | 27 | $ | — | $ | — | $ | — | ||||||||
|
|
|
|
|
|
|
| |||||||||
Total Income | 27 | — | — | — | ||||||||||||
|
|
|
|
|
|
|
| |||||||||
Expenses: | ||||||||||||||||
Incentive Fees | — | 415,629 | — | 86,999 | ||||||||||||
Management Fees | 307,212 | 287,648 | 70,986 | 81,966 | ||||||||||||
Service Fees - Class 1 | 198,125 | 177,981 | 74,974 | 65,875 | ||||||||||||
Trading Fees | 74,984 | 64,049 | 25,063 | 21,279 | ||||||||||||
|
|
|
|
|
|
|
| |||||||||
Total Expenses | 580,321 | 945,307 | 171,023 | 256,119 | ||||||||||||
|
|
|
|
|
|
|
| |||||||||
Investment (loss) - net | (580,294 | ) | (945,307 | ) | (171,023 | ) | (256,119 | ) | ||||||||
|
|
|
|
|
|
|
| |||||||||
Realized and unrealized gain/(loss) on investments: | ||||||||||||||||
Net realized gain/(loss) on futures, forwards and options | — | — | — | — | ||||||||||||
Net change in open trade equity/(deficit) | — | — | — | — | ||||||||||||
Net realized gain/(loss) on swap contracts | — | — | — | — | ||||||||||||
Net unrealized gain/(loss) on swap contracts | — | — | (1,791,079 | ) | 745,910 | |||||||||||
Net realized gain/(loss) on U.S. Treasury securities | 111,546 | (14,220 | ) | 25,632 | (4,016 | ) | ||||||||||
Net unrealized gain/(loss) on U.S. Treasury securities | (1,170,077 | ) | 457,602 | (265,944 | ) | 122,590 | ||||||||||
Trading commissions | — | — | — | (3,500 | ) | |||||||||||
Change in fair value of investments in unconsolidated trading companies | (4,061,244 | ) | 2,553,073 | (739,054 | ) | 557,360 | ||||||||||
|
|
|
|
|
|
|
| |||||||||
Net gain/(loss) on investments | (5,119,775 | ) | 2,996,455 | (2,770,445 | ) | 1,418,344 | ||||||||||
|
|
|
|
|
|
|
| |||||||||
NET INCREASE/(DECREASE) IN CAPITAL RESULTING FROM OPERATIONS | (5,700,069 | ) | 2,051,148 | (2,941,468 | ) | 1,162,225 | ||||||||||
|
|
|
|
|
|
|
| |||||||||
Less: Operations attributable to non-controlling interests | — | — | (839,599 | ) | 329,960 | |||||||||||
|
|
|
|
|
|
|
| |||||||||
NET INCREASE/(DECREASE) IN CAPITAL RESULTING FROM OPERATIONS ATTRIBUTABLE TO CONTROLLING INTERESTS | $ | (5,700,069 | ) | $ | 2,051,148 | $ | (2,101,869 | ) | $ | 832,265 | ||||||
|
|
|
|
|
|
|
| |||||||||
NET INCREASE/(DECREASE) IN CAPITAL RESULTING FROM OPERATIONS ATTRIBUTABLE TO CONTROLLING INTERESTS PER UNIT | ||||||||||||||||
Class 1 | $ | (26.05 | ) | $ | 8.14 | $ | (21.77 | ) | $ | 7.02 | ||||||
Class 1AP | $ | (25.31 | ) | N/A | $ | (21.25 | ) | N/A | ||||||||
Class 2 | $ | (32.13 | ) | $ | 11.59 | $ | (28.44 | ) | $ | 10.31 | ||||||
The accompanying notes are an integral part of these financial statements.
The Series of Equinox Frontier Funds
Statements of Operations
For the Six Months Ended June 30, 2015 and 2014
(Unaudited)
| Equinox Frontier Diversified Fund | Equinox Frontier Masters Fund | Equinox Frontier Long/Short Commodity Fund | ||||||||||||||||||||||
| 6/30/2015 | 6/30/2014 | 6/30/2015 | 6/30/2014 | 6/30/2015 | 6/30/2014 | |||||||||||||||||||
Investment income: | ||||||||||||||||||||||||
Interest - net | $ | 324,401 | $ | 300,377 | $ | 139,819 | $ | 166,701 | $ | 90,191 | $ | 116,852 | ||||||||||||
|
|
|
|
|
|
|
|
|
|
|
| |||||||||||||
Total Income | 324,401 | 300,377 | 139,819 | 166,701 | 90,191 | 116,852 | ||||||||||||||||||
|
|
|
|
|
|
|
|
|
|
|
| |||||||||||||
Expenses: | ||||||||||||||||||||||||
Incentive Fees | 1,638,242 | 1,386,913 | 576,374 | 181,806 | 279,366 | — | ||||||||||||||||||
Management Fees | 489,308 | 547,629 | 361,156 | 507,313 | 254,273 | 509,680 | ||||||||||||||||||
Service Fees - Class 1 | 230,168 | 273,595 | 125,991 | 180,593 | 61,529 | 68,868 | ||||||||||||||||||
Trading Fees | 721,898 | 649,807 | 301,334 | 323,110 | 134,078 | 146,001 | ||||||||||||||||||
|
|
|
|
|
|
|
|
|
|
|
| |||||||||||||
Total Expenses | 3,079,616 | 2,857,944 | 1,364,855 | 1,192,822 | 729,246 | 724,549 | ||||||||||||||||||
|
|
|
|
|
|
|
|
|
|
|
| |||||||||||||
Investment (loss) - net | (2,755,215 | ) | (2,557,567 | ) | (1,225,036 | ) | (1,026,121 | ) | (639,055 | ) | (607,697 | ) | ||||||||||||
|
|
|
|
|
|
|
|
|
|
|
| |||||||||||||
Realized and unrealized gain/(loss) on investments: | ||||||||||||||||||||||||
Net realized gain/(loss) on futures, forwards and options | 8,881,667 | 325,885 | — | — | — | (2,580,860 | ) | |||||||||||||||||
Net change in open trade equity/(deficit) | (3,212,206 | ) | (83,337 | ) | — | — | — | 961,346 | ||||||||||||||||
Net realized gain/(loss) on swap contracts | — | — | — | — | — | — | ||||||||||||||||||
Net unrealized gain/(loss) on swap contracts | 1,044,760 | (391,235 | ) | — | — | (328,851 | ) | (238,462 | ) | |||||||||||||||
Net realized gain/(loss) on U.S. Treasury securities | 133,349 | (127,713 | ) | 56,105 | (71,630 | ) | 33,884 | (54,879 | ) | |||||||||||||||
Net unrealized gain/(loss) on U.S. Treasury securities | (583,896 | ) | 1,883,962 | (228,422 | ) | 1,060,897 | (217,116 | ) | 774,729 | |||||||||||||||
Trading commissions | (366,567 | ) | (6,386 | ) | — | — | — | (415,314 | ) | |||||||||||||||
Change in fair value of investments in unconsolidated trading companies | 2,060,866 | 884,399 | 181,873 | (9,085 | ) | 1,422,221 | (1,012,360 | ) | ||||||||||||||||
|
|
|
|
|
|
|
|
|
|
|
| |||||||||||||
Net gain/(loss) on investments | 7,957,973 | 2,485,576 | 9,556 | 980,182 | 910,138 | (2,565,800 | ) | |||||||||||||||||
|
|
|
|
|
|
|
|
|
|
|
| |||||||||||||
NET INCREASE/(DECREASE) IN CAPITAL RESULTING FROM OPERATIONS | 5,202,758 | (71,992 | ) | (1,215,480 | ) | (45,939 | ) | 271,083 | (3,173,497 | ) | ||||||||||||||
|
|
|
|
|
|
|
|
|
|
|
| |||||||||||||
Less: Operations attributable to non-controlling interests | 2,991,055 | 325,371 | — | — | — | (766,822 | ) | |||||||||||||||||
|
|
|
|
|
|
|
|
|
|
|
| |||||||||||||
NET INCREASE/(DECREASE) IN CAPITAL RESULTING FROM OPERATIONS ATTRIBUTABLE TO CONTROLLING INTERESTS | $ | 2,211,703 | $ | (397,362 | ) | $ | (1,215,480 | ) | $ | (45,939 | ) | $ | 271,083 | $ | (2,406,675 | ) | ||||||||
|
|
|
|
|
|
|
|
|
|
|
| |||||||||||||
NET INCREASE/(DECREASE) IN CAPITAL RESULTING FROM OPERATIONS ATTRIBUTABLE TO CONTROLLING INTERESTS PER UNIT | ||||||||||||||||||||||||
Class 1 | $ | 2.46 | $ | (0.33 | ) | $ | (6.60 | ) | $ | 1.14 | N/A | N/A | ||||||||||||
Class 1a | N/A | N/A | N/A | N/A | $ | 6.05 | $ | (9.97 | ) | |||||||||||||||
Class 2 | $ | 3.82 | $ | 0.46 | $ | (6.21 | ) | $ | 2.11 | $ | 9.86 | $ | (13.09 | ) | ||||||||||
Class 2a | N/A | N/A | N/A | N/A | $ | 7.68 | $ | (10.02 | ) | |||||||||||||||
Class 3 | $ | 3.67 | $ | 3.16 | $ | (5.61 | ) (1) | $ | 2.06 | $ | 9.86 | $ | (13.10 | ) | ||||||||||
Class 3a | N/A | N/A | N/A | N/A | $ | 7.87 | $ | (9.91 | ) | |||||||||||||||
| (1) | Class 3 operations began February 25, 2014. |
The accompanying notes are an integral part of these financial statements.
The Series of the Equinox Frontier Funds
Statements of Operations
For the ThreeSix Months Ended March 31,June 30, 2015 and 2014
(Unaudited)
| Equinox Frontier Winton Fund | Equinox Frontier Heritage Fund | |||||||||||||||||||||||||||||||
| 3/31/2015 | 3/31/2014 | 3/31/2015 | 3/31/2014 | Equinox Frontier Balanced Fund | Equinox Frontier Select Fund | |||||||||||||||||||||||||||
| 6/30/2015 | 6/30/2014 | 6/30/2015 | 6/30/2014 | |||||||||||||||||||||||||||||
Investment income: | ||||||||||||||||||||||||||||||||
Interest - net | $ | — | $ | 41 | $ | — | $ | — | $ | 15,193 | $ | 15,073 | $ | — | $ | — | ||||||||||||||||
|
|
|
|
|
|
|
| |||||||||||||||||||||||||
Total Income | — | 41 | — | — | ||||||||||||||||||||||||||||
|
|
|
| |||||||||||||||||||||||||||||
Total Income/(loss) | 15,193 | 15,073 | — | — | ||||||||||||||||||||||||||||
|
|
|
| |||||||||||||||||||||||||||||
Expenses: | ||||||||||||||||||||||||||||||||
Incentive Fees | 715,409 | — | 132,676 | — | 1,496,474 | 1,453,340 | 158,971 | 26,677 | ||||||||||||||||||||||||
Management Fees | 323,105 | 280,373 | 77,898 | 80,009 | 526,972 | 554,537 | 158,278 | 278,724 | ||||||||||||||||||||||||
Service Fees - Class 1 | 205,337 | 182,964 | 77,017 | 72,725 | 1,118,882 | 1,041,703 | 208,868 | 203,387 | ||||||||||||||||||||||||
Trading Fees | 76,976 | 64,595 | 25,691 | 23,099 | 389,488 | 355,157 | 58,347 | 56,552 | ||||||||||||||||||||||||
|
|
|
|
|
|
|
| |||||||||||||||||||||||||
Total Expenses | 1,320,827 | 527,932 | 313,282 | 175,833 | 3,531,816 | 3,404,737 | 584,464 | 565,340 | ||||||||||||||||||||||||
|
|
|
|
|
|
|
| |||||||||||||||||||||||||
Investment (loss) - net | (1,320,827 | ) | (527,891 | ) | (313,282 | ) | (175,833 | ) | (3,516,623 | ) | (3,389,664 | ) | (584,464 | ) | (565,340 | ) | ||||||||||||||||
|
|
|
| |||||||||||||||||||||||||||||
|
|
|
| |||||||||||||||||||||||||||||
Realized and unrealized gain/(loss) on investments: | ||||||||||||||||||||||||||||||||
Net realized gain/(loss) on futures, forwards and options | — | — | — | — | 3,592,820 | 7,730,596 | 121,655 | — | ||||||||||||||||||||||||
Net change in open trade equity/(deficit) | — | — | — | — | (2,413,756 | ) | (1,535,401 | ) | (1,606,742 | ) | — | |||||||||||||||||||||
Net realized gain/(loss) on swap contracts | — | — | — | — | — | — | — | — | ||||||||||||||||||||||||
Net unrealized gain/(loss) on swap contracts | — | — | 2,059,865 | (1,208,563 | ) | 244,680 | (630,474 | ) | — | — | ||||||||||||||||||||||
Net realized gain/(loss) on U.S. Treasury securities | — | (83,129 | ) | — | (24,819 | ) | 215,325 | (225,870 | ) | 12,618 | (34,988 | ) | ||||||||||||||||||||
Net unrealized gain/(loss) on U.S. Treasury securities | 553,885 | 972,190 | 126,818 | 300,004 | (1,389,049 | ) | 3,414,775 | 32,740 | 496,053 | |||||||||||||||||||||||
Trading commissions | — | — | — | — | (266,438 | ) | (631,520 | ) | (65,896 | ) | — | |||||||||||||||||||||
Change in fair value of investments in unconsolidated trading companies | 4,443,233 | (992,259 | ) | 861,401 | (303,201 | ) | 4,668,213 | (3,884,435 | ) | 175,736 | (328,501 | ) | ||||||||||||||||||||
|
|
|
|
|
|
|
| |||||||||||||||||||||||||
Net gain/(loss) on investments | 4,997,118 | (103,198 | ) | 3,048,084 | (1,236,579 | ) | 4,651,795 | 4,237,671 | (1,329,889 | ) | 132,564 | |||||||||||||||||||||
|
|
|
| |||||||||||||||||||||||||||||
|
|
|
| |||||||||||||||||||||||||||||
NET INCREASE/(DECREASE) IN CAPITAL RESULTING FROM OPERATIONS | 3,676,291 | (631,089 | ) | 2,734,802 | (1,412,412 | ) | 1,135,172 | 848,007 | (1,914,353 | ) | (432,776 | ) | ||||||||||||||||||||
|
|
|
|
|
|
|
| |||||||||||||||||||||||||
Less: Operations attributable to non-controlling interests | — | — | 967,115 | (537,994 | ) | 356,146 | 3,307,859 | (684,237 | ) | — | ||||||||||||||||||||||
|
|
|
| |||||||||||||||||||||||||||||
|
|
|
| |||||||||||||||||||||||||||||
NET INCREASE/(DECREASE) IN CAPITAL RESULTING FROM OPERATIONS ATTRIBUTABLE TO CONTROLLING INTERESTS | $ | 3,676,291 | $ | (631,089 | ) | $ | 1,767,687 | $ | (874,418 | ) | $ | 779,026 | $ | (2,459,852 | ) | $ | (1,230,116 | ) | $ | (432,776 | ) | |||||||||||
|
|
|
|
|
|
|
| |||||||||||||||||||||||||
NET INCREASE/(DECREASE) IN CAPITAL RESULTING FROM OPERATIONS ATTRIBUTABLE TO CONTROLLING INTERESTS PER UNIT | ||||||||||||||||||||||||||||||||
Class 1 | $ | 15.95 | $ | (2.66 | ) | $ | 17.59 | $ | (6.64 | ) | $ | 0.28 | $ | (2.43 | ) | $ | (8.30 | ) | $ | (1.63 | ) | |||||||||||
Class 1AP | $ | 17.59 | N/A | $ | 18.93 | N/A | ||||||||||||||||||||||||||
Class 1AP (1) | $ | 2.29 | N/A | $ | (7.08 | ) | N/A | |||||||||||||||||||||||||
Class 2 | $ | 22.33 | $ | (2.05 | ) | $ | 25.33 | $ | (7.80 | ) | $ | 3.08 | $ | (1.14 | ) | $ | (9.39 | ) | $ | (0.58 | ) | |||||||||||
Class 2a | $ | 3.34 | $ | (0.32 | ) | N/A | N/A | |||||||||||||||||||||||||
Class 3a | $ | 3.33 | $ | (0.32 | ) | N/A | N/A | |||||||||||||||||||||||||
| (1) | Class 1AP began trading July 31, 2014 |
The accompanying notes are an integral part of these financial statements.
The Series of the Equinox Frontier Funds
Statements of Operations
For the Six Months Ended June 30, 2015 and 2014
(Unaudited)
| Equinox Frontier Winton Fund | Equinox Frontier Heritage Fund | |||||||||||||||
| 6/30/2015 | 6/30/2014 | 6/30/2015 | 6/30/2014 | |||||||||||||
Investment income: | ||||||||||||||||
Interest - net | $ | 27 | $ | 41 | $ | — | $ | — | ||||||||
|
|
|
|
|
|
|
| |||||||||
Total Income | 27 | 41 | — | — | ||||||||||||
|
|
|
|
|
|
|
| |||||||||
Expenses: | ||||||||||||||||
Incentive Fees | 715,409 | 415,629 | 132,676 | 86,999 | ||||||||||||
Management Fees | 630,317 | 568,021 | 148,884 | 161,975 | ||||||||||||
Service Fees - Class 1 | 403,462 | 360,945 | 151,991 | 138,600 | ||||||||||||
Trading Fees | 151,960 | 128,644 | 50,754 | 44,378 | ||||||||||||
|
|
|
|
|
|
|
| |||||||||
Total Expenses | 1,901,148 | 1,473,239 | 484,305 | 431,952 | ||||||||||||
|
|
|
|
|
|
|
| |||||||||
Investment (loss) - net | (1,901,121 | ) | (1,473,198 | ) | (484,305 | ) | (431,952 | ) | ||||||||
|
|
|
|
|
|
|
| |||||||||
Realized and unrealized gain/(loss) on investments: | ||||||||||||||||
Net realized gain/(loss) on futures, forwards and options | — | — | — | — | ||||||||||||
Net change in open trade equity/(deficit) | — | — | — | — | ||||||||||||
Net realized gain/(loss) on swap contracts | — | — | — | — | ||||||||||||
Net unrealized gain/(loss) on swap contracts | — | — | 268,786 | (462,653 | ) | |||||||||||
Net realized gain/(loss) on U.S. Treasury securities | 111,546 | (97,349 | ) | 25,632 | (28,835 | ) | ||||||||||
Net unrealized gain/(loss) on U.S. Treasury securities | (616,192 | ) | 1,429,792 | (139,125 | ) | 422,594 | ||||||||||
Trading commissions | — | — | — | (3,500 | ) | |||||||||||
Change in fair value of investments in unconsolidated trading companies | 381,989 | 1,560,816 | 122,347 | 254,158 | ||||||||||||
|
|
|
|
|
|
|
| |||||||||
Net gain/(loss) on investments | (122,657 | ) | 2,893,259 | 277,640 | 181,764 | |||||||||||
|
|
|
|
|
|
|
| |||||||||
NET INCREASE/(DECREASE) IN CAPITAL RESULTING FROM OPERATIONS | (2,023,778 | ) | 1,420,061 | (206,665 | ) | (250,188 | ) | |||||||||
|
|
|
|
|
|
|
| |||||||||
Less: Operations attributable to non-controlling interests | — | — | 127,516 | (208,034 | ) | |||||||||||
|
|
|
|
|
|
|
| |||||||||
NET INCREASE/(DECREASE) IN CAPITAL RESULTING FROM OPERATIONS ATTRIBUTABLE TO CONTROLLING INTERESTS | $ | (2,023,778 | ) | $ | 1,420,061 | $ | (334,181 | ) | $ | (42,154 | ) | |||||
|
|
|
|
|
|
|
| |||||||||
NET INCREASE/(DECREASE) IN CAPITAL RESULTING FROM OPERATIONS ATTRIBUTABLE TO CONTROLLING INTERESTS PER UNIT | ||||||||||||||||
Class 1 | $ | (10.10 | ) | $ | 5.48 | $ | (4.18 | ) | $ | 0.53 | ||||||
Class 1AP (1) | $ | (7.72 | ) | N/A | $ | (2.32 | ) | N/A | ||||||||
Class 2 | $ | (9.80 | ) | $ | 9.55 | $ | (3.11 | ) | $ | 2.72 | ||||||
| (1) | Class 1AP began trading July 31, 2014 |
The accompanying notes are an integral part of these financial statements.
The Series of Equinox Frontier Funds
Statements of Changes in Owners’ Capital
For the ThreeSix Months Ended March 31,June 30, 2015
(Unaudited)
| Equinox Frontier Diversified Fund | Equinox Frontier Masters Fund | |||||||||||||||||||||||||||||||||||||||||||||||||||||||||||||||||||||||||||||||||||||||||||||||||||||||||||||||
| Class 1 | Class 2 | Class 2 | Class 3 | Class 3 | Class 1 | Class 2 | Class 2 | Class 3 | Class 3 | Equinox Frontier Diversified Fund | Equinox Frontier Masters Fund | |||||||||||||||||||||||||||||||||||||||||||||||||||||||||||||||||||||||||||||||||||||||||||||||||||||
| Limited Owners | Managing Owner | Limited Owners | Managing Owner | Limited Owners | Non- Controlling | Total | Limited Owners | Managing Owner | Limited Owners | Managing Owner | Limited Owners | Non- Controlling | Total | Class 1 | Class 2 | Class 2 | Class 3 | Class 3 | Class 1 | Class 2 | Class 2 | Class 3 | Class 3 | |||||||||||||||||||||||||||||||||||||||||||||||||||||||||||||||||||||||||||||||||||||||||
Limited Owners | Managing Owner | Limited Owners | Managing Owner | Limited Owners | Non-Controlling Interests | Total | Limited Owners | Managing Owner | Limited Owners | Managing Owner | Limited Owners | Non-Controlling Interests | Total | |||||||||||||||||||||||||||||||||||||||||||||||||||||||||||||||||||||||||||||||||||||||||||||||||||
Owners’ Capital, December 31, 2014 | $ | 19,195,036 | $ | 2,516,879 | $ | 32,707,413 | $ | 31,632 | $ | 5,556,649 | $ | 12,417,767 | $ | 72,425,376 | $ | 11,850,911 | $ | 723,207 | $ | 8,145,536 | $ | 32,741 | $ | 4,955,459 | $ | — | $ | 25,707,854 | $ | 19,195,036 | $ | 2,516,879 | $ | 32,707,413 | $ | 31,632 | $ | 5,556,649 | $ | 12,417,767 | $ | 72,425,376 | $ | 11,850,911 | $ | 723,207 | $ | 8,145,536 | $ | 32,741 | $ | 4,955,459 | $ | — | $ | 25,707,854 | ||||||||||||||||||||||||||||||||||||||||||||||||||||||||
Sale of Units | 487,852 | — | 759,658 | — | 1,813,483 | — | 3,060,993 | 197,260 | — | 5,000 | — | 663,443 | — | 865,703 | 1,270,579 | — | 1,189,861 | — | 3,413,792 | — | 5,874,232 | 989,895 | — | 10,000 | — | 2,498,048 | — | 3,497,943 | ||||||||||||||||||||||||||||||||||||||||||||||||||||||||||||||||||||||||||||||||||||
Redemption of Units | (2,417,127 | ) | — | (5,722,101 | ) | — | (597,357 | ) | — | (8,736,585 | ) | (950,034 | ) | — | (247,295 | ) | — | (1,228,567 | ) | — | (2,425,896 | ) | (5,313,927 | ) | — | (6,218,435 | ) | — | (1,578,475 | ) | — | (13,110,837 | ) | (3,183,426 | ) | — | (483,171 | ) | — | (1,625,851 | ) | — | (5,292,448 | ) | ||||||||||||||||||||||||||||||||||||||||||||||||||||||||||||||||||||
Change in control of ownership - Trading Companies | — | — | — | — | — | (4,686,248 | ) | (4,686,248 | ) | — | — | — | — | — | — | — | — | — | — | — | — | (8,316,485 | ) | (8,316,485 | ) | — | — | — | — | — | — | — | ||||||||||||||||||||||||||||||||||||||||||||||||||||||||||||||||||||||||||||||||
Operations attributable to non-controlling interests | — | — | — | — | — | 3,313,397 | 3,313,397 | — | — | — | — | — | — | — | — | — | — | — | — | 2,991,055 | 2,991,055 | — | — | — | — | — | — | — | ||||||||||||||||||||||||||||||||||||||||||||||||||||||||||||||||||||||||||||||||||||
Payment made by the Managing Owner | 47,134 | 82,416 | 14,799 | 144,349 | — | — | — | — | — | — | — | 47,134 | — | 82,416 | — | 14,799 | — | 144,349 | — | — | — | — | — | — | — | |||||||||||||||||||||||||||||||||||||||||||||||||||||||||||||||||||||||||||||||||||||||
Net increase/(decrease) in Owners’ Capital resulting from operations | 2,955,124 | 425,746 | 5,285,982 | 5,374 | 1,044,840 | — | 9,717,066 | 1,161,295 | 76,466 | 845,640 | 3,484 | 491,509 | — | 2,578,394 | ||||||||||||||||||||||||||||||||||||||||||||||||||||||||||||||||||||||||||||||||||||||||||||||||||
Net increase/(decrease) in Owners’ | ||||||||||||||||||||||||||||||||||||||||||||||||||||||||||||||||||||||||||||||||||||||||||||||||||||||||||||||||
Capital resulting from operations | 741,938 | 77,149 | 1,363,404 | 1,010 | 28,202 | — | 2,211,703 | (579,660 | ) | (34,938 | ) | (355,854 | ) | (1,543 | ) | (243,485 | ) | — | (1,215,480 | ) | ||||||||||||||||||||||||||||||||||||||||||||||||||||||||||||||||||||||||||||||||||||||||||||
|
|
|
|
|
|
|
|
|
|
|
|
|
|
|
|
|
|
|
|
|
|
|
|
|
|
|
| |||||||||||||||||||||||||||||||||||||||||||||||||||||||||||||||||||||||||||||||||||||
Owners’ Capital, March 31, 2015 | $ | 20,268,019 | $ | 2,942,625 | $ | 33,113,368 | $ | 37,006 | $ | 7,832,414 | $ | 11,044,916 | $ | 75,238,348 | $ | 12,259,432 | $ | 799,673 | $ | 8,748,881 | $ | 36,225 | $ | 4,881,844 | $ | — | $ | 26,726,055 | ||||||||||||||||||||||||||||||||||||||||||||||||||||||||||||||||||||||||||||||||||||
|
|
|
|
|
|
|
|
|
|
|
|
|
| |||||||||||||||||||||||||||||||||||||||||||||||||||||||||||||||||||||||||||||||||||||||||||||||||||
Owners’ Capital, June 30, 2015 | $ | 15,940,760 | $ | 2,594,028 | $ | 29,124,659 | $ | 32,642 | $ | 7,434,967 | $ | 7,092,337 | $ | 62,219,393 | $ | 9,077,720 | $ | 688,269 | $ | 7,316,511 | $ | 31,198 | $ | 5,584,171 | $ | — | $ | 22,697,869 | ||||||||||||||||||||||||||||||||||||||||||||||||||||||||||||||||||||||||||||||||||||
|
|
|
|
|
|
|
|
|
|
|
|
|
| |||||||||||||||||||||||||||||||||||||||||||||||||||||||||||||||||||||||||||||||||||||||||||||||||||
Owners’ Capital - Units, December 31, 2014 | 169,725 | 14,576 | 267,958 | 275 | 48,308 | 101,632 | 5,627 | 63,376 | 275 | 41,622 | 169,725 | 14,576 | 267,958 | 275 | 48,308 | 101,632 | 5,627 | 63,376 | 275 | 41,622 | ||||||||||||||||||||||||||||||||||||||||||||||||||||||||||||||||||||||||||||||||||||||||||||
Sale of Units | 3,917 | — | 5,418 | — | 14,621 | 1,567 | — | 38 | — | 5,243 | 10,551 | — | 8,618 | — | 26,878 | 7,886 | — | 77 | — | 20,733 | ||||||||||||||||||||||||||||||||||||||||||||||||||||||||||||||||||||||||||||||||||||||||||||
Redemption of Units | (19,695 | ) | — | (40,590 | ) | — | (4,724 | ) | (7,705 | ) | — | (1,852 | ) | — | (9,805 | ) | (42,325 | ) | — | (44,302 | ) | — | (12,549 | ) | (27,004 | ) | — | (3,637 | ) | — | (13,133 | ) | ||||||||||||||||||||||||||||||||||||||||||||||||||||||||||||||||||||||||||||||||
|
|
|
|
|
|
|
|
|
|
|
|
|
|
|
|
|
|
|
| |||||||||||||||||||||||||||||||||||||||||||||||||||||||||||||||||||||||||||||||||||||||||||||
Owners’ Capital - Units, March 31, 2015 | 153,947 | 14,576 | 232,786 | 275 | 58,205 | 95,494 | 5,627 | 61,562 | 275 | 37,060 | ||||||||||||||||||||||||||||||||||||||||||||||||||||||||||||||||||||||||||||||||||||||||||||||||||||||
|
|
|
|
|
|
|
|
|
| |||||||||||||||||||||||||||||||||||||||||||||||||||||||||||||||||||||||||||||||||||||||||||||||||||||||
Owners’ Capital - Units, June 30, 2015 | 137,951 | 14,576 | 232,274 | 275 | 62,637 | 82,514 | 5,627 | 59,816 | 275 | 49,222 | ||||||||||||||||||||||||||||||||||||||||||||||||||||||||||||||||||||||||||||||||||||||||||||||||||||||
|
|
|
|
|
|
|
|
|
| |||||||||||||||||||||||||||||||||||||||||||||||||||||||||||||||||||||||||||||||||||||||||||||||||||||||
| (1) | (1) | (1) | (1) | (1) | (1) | (1) | (1) | |||||||||||||||||||||||||||||||||||||||||||||||||||||||||||||||||||||||||||||||||||||||||||||||||||||||||
Net asset value per unit at December 31, 2014 | $ | 113.09 | $ | 124.67 | $ | 115.03 | $ | 116.61 | $ | 128.53 | $ | 119.06 | $ | 113.09 | $ | 124.67 | $ | 115.03 | $ | 116.61 | $ | 128.53 | $ | 119.06 | ||||||||||||||||||||||||||||||||||||||||||||||||||||||||||||||||||||||||||||||||||||||||
Change in net asset value per unit for the three months ended March 31, 2015 | 18.57 | 21.09 | 19.54 | 11.77 | 13.59 | 12.67 | ||||||||||||||||||||||||||||||||||||||||||||||||||||||||||||||||||||||||||||||||||||||||||||||||||||||||||
Change in net asset value per unit for the six months ended June 30, 2015 | 2.46 | 3.82 | 3.67 | (6.60 | ) | (6.21 | ) | (5.61 | ) | |||||||||||||||||||||||||||||||||||||||||||||||||||||||||||||||||||||||||||||||||||||||||||||||||||||||
|
|
|
|
|
|
|
|
|
|
|
| |||||||||||||||||||||||||||||||||||||||||||||||||||||||||||||||||||||||||||||||||||||||||||||||||||||
Net asset value per unit at June 30, 2015 | $ | 115.55 | $ | 128.49 | $ | 118.70 | $ | 110.01 | $ | 122.32 | $ | 113.45 | ||||||||||||||||||||||||||||||||||||||||||||||||||||||||||||||||||||||||||||||||||||||||||||||||||||
|
|
|
|
|
| |||||||||||||||||||||||||||||||||||||||||||||||||||||||||||||||||||||||||||||||||||||||||||||||||||||||||||
Net asset value per unit at March 31, 2015 | $ | 131.66 | $ | 145.76 | $ | 134.57 | $ | 128.38 | $ | 142.12 | $ | 131.73 | ||||||||||||||||||||||||||||||||||||||||||||||||||||||||||||||||||||||||||||||||||||||||||||||||||||
|
|
|
|
|
| |||||||||||||||||||||||||||||||||||||||||||||||||||||||||||||||||||||||||||||||||||||||||||||||||||||||||||
| (1) | Values are for both the Managing Owner and Limited Owners. |
The accompanying notes are an integral part of these financial statements.
The Series of Equinox Frontier Funds
Statements of Changes in Owners’ Capital
For the ThreeSix Months Ended March 31,June 30, 2015
(Unaudited)
| Equinox Frontier Long/Short Commodity Fund | ||||||||||||||||||||||||||||||||||||||||||||||||||||||||||||||||||||||||
| Class 2 | Class 3 | Class 1a | Class 2a | Class 3a | Equinox Frontier Long/Short Commodity Fund | |||||||||||||||||||||||||||||||||||||||||||||||||||||||||||||||||||
| Managing Owner | Limited Owners | Limited Owners | Limited Owners | Managing Owner | Limited Owners | Managing Owner | Limited Owners | Total | Class 2 | Class 3 | Class 1a | Class 2a | Class 3a | |||||||||||||||||||||||||||||||||||||||||||||||||||||||||||
| Managing Owner | Limited Owners | Limited Owners | Limited Owners | Managing Owner | Limited Owners | Managing Owner | Limited Owners | Total | ||||||||||||||||||||||||||||||||||||||||||||||||||||||||||||||||
Owners’ Capital, December 31, 2014 | $ | 426,377 | $ | 820,104 | $ | 7,233,099 | $ | 5,776,906 | $ | 247,434 | $ | 1,455,117 | $ | 12,228 | $ | 645,654 | $ | 16,616,919 | $ | 426,377 | $ | 820,104 | $ | 7,233,099 | $ | 5,776,906 | $ | 247,434 | $ | 1,455,117 | $ | 12,228 | $ | 645,654 | $ | 16,616,919 | ||||||||||||||||||||||||||||||||||||
Sale of Units | — | — | — | — | — | 5,000 | — | 41,303 | 46,303 | — | — | — | 23,000 | — | 5,000 | — | 120,785 | 148,785 | ||||||||||||||||||||||||||||||||||||||||||||||||||||||
Redemption of Units | — | (46,260 | ) | (226,216 | ) | (414,752 | ) | — | (109,918 | ) | — | (42,766 | ) | (839,912 | ) | — | (181,144 | ) | (454,734 | ) | (874,536 | ) | — | (281,680 | ) | — | (90,453 | ) | (1,882,547 | ) | ||||||||||||||||||||||||||||||||||||||||||
Payment made by the Managing Owner | 69,364 | 397,940 | 312,393 | 90,860 | 36,605 | 907,162 | — | 69,364 | 397,940 | 312,393 | — | 90,860 | — | 36,605 | 907,162 | |||||||||||||||||||||||||||||||||||||||||||||||||||||||||
Net increase/(decrease) in Owners’ Capital resulting from operations attributable to controlling interests | 85,430 | 92,680 | 1,033,292 | 773,746 | 49,207 | 187,032 | 2,440 | 92,354 | 2,316,181 | |||||||||||||||||||||||||||||||||||||||||||||||||||||||||||||||
Net increase/(decrease) in Owners’ | — | |||||||||||||||||||||||||||||||||||||||||||||||||||||||||||||||||||||||
Capital resulting from operations attributable to controlling interests | 30,397 | (3,100 | ) | 133,026 | 68,951 | 17,085 | 15,092 | 860 | 8,772 | 271,083 | ||||||||||||||||||||||||||||||||||||||||||||||||||||||||||||||
|
|
|
|
|
|
|
|
|
|
|
|
|
|
|
|
|
| |||||||||||||||||||||||||||||||||||||||||||||||||||||||
Owners’ Capital, March 31, 2015 | $ | 511,807 | $ | 935,888 | $ | 8,438,115 | $ | 6,448,293 | $ | 296,641 | $ | 1,628,091 | $ | 14,668 | $ | 773,150 | $ | 19,046,653 | ||||||||||||||||||||||||||||||||||||||||||||||||||||||
|
|
|
|
|
|
|
|
| ||||||||||||||||||||||||||||||||||||||||||||||||||||||||||||||||
Owners’ Capital, June 30, 2015 | $ | 456,774 | $ | 705,224 | $ | 7,309,331 | $ | 5,306,714 | $ | 264,519 | $ | 1,284,389 | $ | 13,088 | $ | 721,363 | $ | 16,061,402 | ||||||||||||||||||||||||||||||||||||||||||||||||||||||
|
|
|
|
|
|
|
|
| ||||||||||||||||||||||||||||||||||||||||||||||||||||||||||||||||
Owners’ Capital - Units, December 31, 2014 | 3,083 | 5,930 | 52,285 | 57,130 | 2,222 | 13,069 | 109 | 5,777 | 3,083 | 5,930 | 52,285 | 57,130 | 2,222 | 13,069 | 109 | 5,777 | ||||||||||||||||||||||||||||||||||||||||||||||||||||||||
Sale of Units | — | — | — | — | — | 40 | — | 316 | — | — | — | 211 | — | 40 | — | 969 | ||||||||||||||||||||||||||||||||||||||||||||||||||||||||
Redemption of Units | — | (292 | ) | (1,471 | ) | (3,708 | ) | — | (912 | ) | — | (326 | ) | — | (1,170 | ) | (2,965 | ) | (7,823 | ) | — | (2,318 | ) | — | (716 | ) | ||||||||||||||||||||||||||||||||||||||||||||||
|
|
|
|
|
|
|
|
|
|
|
|
|
|
|
| |||||||||||||||||||||||||||||||||||||||||||||||||||||||||
Owners’ Capital - Units, March 31, 2015 | 3,083 | 5,638 | 50,814 | 53,422 | 2,222 | 12,197 | 109 | 5,767 | ||||||||||||||||||||||||||||||||||||||||||||||||||||||||||||||||
|
|
|
|
|
|
|
| |||||||||||||||||||||||||||||||||||||||||||||||||||||||||||||||||
Owners’ Capital - Units, June 30, 2015 | 3,083 | 4,760 | 49,320 | 49,518 | 2,222 | 10,791 | 109 | 6,030 | ||||||||||||||||||||||||||||||||||||||||||||||||||||||||||||||||
|
|
|
|
|
|
|
| |||||||||||||||||||||||||||||||||||||||||||||||||||||||||||||||||
| (1) | (1) | (1) | (1) | (1) | (1) | |||||||||||||||||||||||||||||||||||||||||||||||||||||||||||||||||||
Net asset value per unit at December 31, 2014 | $ | 138.30 | $ | 138.34 | $ | 101.12 | $ | 111.35 | $ | 111.77 | $ | 138.30 | $ | 138.34 | $ | 101.12 | $ | 111.35 | $ | 111.77 | ||||||||||||||||||||||||||||||||||||||||||||||||||||
Change in net asset value per unit for the three months ended March 31, 2015 | 27.90 | 27.72 | 19.58 | 22.14 | 22.32 | |||||||||||||||||||||||||||||||||||||||||||||||||||||||||||||||||||
Change in net asset value per unit for the six months ended June 30, 2015 | 9.86 | 9.86 | 6.05 | 7.68 | 7.87 | |||||||||||||||||||||||||||||||||||||||||||||||||||||||||||||||||||
|
|
|
|
|
|
|
|
|
| |||||||||||||||||||||||||||||||||||||||||||||||||||||||||||||||
Net asset value per unit at June 30, 2015 | $ | 148.16 | $ | 148.20 | $ | 107.17 | $ | 119.03 | $ | 119.64 | ||||||||||||||||||||||||||||||||||||||||||||||||||||||||||||||
|
|
|
|
| ||||||||||||||||||||||||||||||||||||||||||||||||||||||||||||||||||||
Net asset value per unit at March 31, 2015 | $ | 166.20 | $ | 166.06 | $ | 120.70 | $ | 133.49 | $ | 134.09 | ||||||||||||||||||||||||||||||||||||||||||||||||||||||||||||||
|
|
|
|
| ||||||||||||||||||||||||||||||||||||||||||||||||||||||||||||||||||||
| (1) | Values are for both the Managing Owner and Limited Owners. |
The accompanying notes are an integral part of these financial statements.
The Series of Equinox Frontier Funds
Statements of Changes in Owners’ Capital
For the ThreeSix Months Ended March 31,June 30, 2015
(Unaudited)
| Equinox Frontier Balanced Fund | ||||||||||||||||||||||||||||||||||||||||||||||||||||||||||||||||||||||||
| Class 1 | Class 1AP | Class 2 | Class 2a | Class 3a | Equinox Frontier Balanced Fund | |||||||||||||||||||||||||||||||||||||||||||||||||||||||||||||||||||
| Limited Owners | Limited Owners | Managing Owner | Limited Owners | Managing Owner | Limited Owners | Limited Owners | Non-Controlling Interests | Total | Class 1 | Class 1AP | Class 2 | Class 2a | Class 3a | |||||||||||||||||||||||||||||||||||||||||||||||||||||||||||
| Limited Owners | Limited Owners | Managing Owner | Limited Owners | Managing Owner | Limited Owners | Limited Owners | Non-Controlling Interests | Total | ||||||||||||||||||||||||||||||||||||||||||||||||||||||||||||||||
Owners’ Capital, December 31, 2014 | $ | 72,098,275 | $ | 748,275 | $ | 1,425,355 | $ | 22,125,342 | $ | 189,344 | $ | 410,943 | $ | 2,528,303 | $ | 8,944,274 | $ | 108,470,111 | $ | 72,098,275 | $ | 748,275 | $ | 1,425,355 | $ | 22,125,342 | $ | 189,344 | $ | 410,943 | $ | 2,528,303 | $ | 8,944,274 | $ | 108,470,111 | ||||||||||||||||||||||||||||||||||||
Sale of Units | 56,154 | 1,457 | — | 4,315 | — | — | — | — | 61,926 | 117,365 | 1,457 | — | 9,409 | — | — | — | — | 128,231 | ||||||||||||||||||||||||||||||||||||||||||||||||||||||
Redemption of Units | (3,119,131 | ) | (11,615 | ) | — | (196,584 | ) | — | (60,850 | ) | (47,479 | ) | — | (3,435,659 | ) | (4,065,683 | ) | (39,001 | ) | — | (524,931 | ) | — | (60,850 | ) | (52,948 | ) | — | (4,743,413 | ) | ||||||||||||||||||||||||||||||||||||||||||
Change in control of ownership - Trading Companies | — | — | — | — | — | — | — | (8,327,863 | ) | (8,327,863 | ) | — | — | — | — | — | — | — | (8,126,145 | ) | (8,126,145 | ) | ||||||||||||||||||||||||||||||||||||||||||||||||||
Contributions | — | — | — | — | — | — | — | — | — | — | — | — | — | — | — | — | — | — | ||||||||||||||||||||||||||||||||||||||||||||||||||||||
Distributions | — | — | — | — | — | — | — | — | — | — | — | — | — | — | — | — | — | — | ||||||||||||||||||||||||||||||||||||||||||||||||||||||
Payment made by the Managing Owner | 115,486 | 1,222 | 38,375 | 885 | 4,131 | 160,099 | 115,486 | 1,222 | — | 38,375 | — | 885 | 4,131 | — | 160,099 | |||||||||||||||||||||||||||||||||||||||||||||||||||||||||
Operations attributable to non-controlling interests | — | — | — | — | — | — | — | 830,142 | 830,142 | — | — | — | — | — | — | — | 356,146 | 356,146 | ||||||||||||||||||||||||||||||||||||||||||||||||||||||
Net increase/(decrease) in Owners’ Capital resulting from operations attributable to controlling interests | 9,159,120 | 102,917 | 198,971 | 3,035,438 | 26,899 | 51,195 | 352,748 | — | 12,927,288 | |||||||||||||||||||||||||||||||||||||||||||||||||||||||||||||||
Net increase/(decrease) in Owners’ | ||||||||||||||||||||||||||||||||||||||||||||||||||||||||||||||||||||||||
Capital resulting from operations attributable to controlling interests | 297,028 | 12,923 | 24,447 | 376,969 | 4,132 | 8,852 | 54,675 | — | 779,026 | |||||||||||||||||||||||||||||||||||||||||||||||||||||||||||||||
|
|
|
|
|
|
|
|
|
|
|
|
|
|
|
|
|
| |||||||||||||||||||||||||||||||||||||||||||||||||||||||
Owners’ Capital, March 31, 2015 | $ | 78,309,904 | $ | 842,256 | $ | 1,624,326 | $ | 25,006,886 | $ | 216,243 | $ | 402,173 | $ | 2,837,703 | $ | 1,446,553 | $ | 110,686,044 | ||||||||||||||||||||||||||||||||||||||||||||||||||||||
|
|
|
|
|
|
|
|
| ||||||||||||||||||||||||||||||||||||||||||||||||||||||||||||||||
Owners’ Capital, June 30, 2015 | $ | 68,562,471 | $ | 724,876 | $ | 1,449,802 | $ | 22,025,164 | $ | 193,476 | $ | 359,830 | $ | 2,534,161 | $ | 1,174,275 | $ | 97,024,055 | ||||||||||||||||||||||||||||||||||||||||||||||||||||||
|
|
|
|
|
|
|
|
| ||||||||||||||||||||||||||||||||||||||||||||||||||||||||||||||||
Owners’ Capital - Units, December 31, 2014 | 548,117 | 5,618 | 7,956 | 123,491 | 1,237 | 2,686 | 16,577 | 548,117 | 5,618 | 7,956 | 123,491 | 1,237 | 2,686 | 16,577 | ||||||||||||||||||||||||||||||||||||||||||||||||||||||||||
Sale of Units | 398 | 10 | — | 23 | — | — | — | 830 | 10 | — | 48 | — | — | — | ||||||||||||||||||||||||||||||||||||||||||||||||||||||||||
Redemption of Units | (22,222 | ) | (79 | ) | — | (1,037 | ) | — | (384 | ) | (286 | ) | (28,818 | ) | (277 | ) | — | (2,680 | ) | — | (384 | ) | (316 | ) | ||||||||||||||||||||||||||||||||||||||||||||||||
|
|
|
|
|
|
|
|
|
|
|
|
|
| |||||||||||||||||||||||||||||||||||||||||||||||||||||||||||
Owners’ Capital - Units, March 31, 2015 | 526,293 | 5,549 | 7,956 | 122,477 | 1,237 | 2,302 | 16,291 | |||||||||||||||||||||||||||||||||||||||||||||||||||||||||||||||||
|
|
|
|
|
|
| ||||||||||||||||||||||||||||||||||||||||||||||||||||||||||||||||||
Owners’ Capital - Units, June 30, 2015 | 520,129 | 5,351 | 7,956 | 120,859 | 1,237 | 2,302 | 16,261 | |||||||||||||||||||||||||||||||||||||||||||||||||||||||||||||||||
|
|
|
|
|
|
| ||||||||||||||||||||||||||||||||||||||||||||||||||||||||||||||||||
| (1) | (1) | (1 | ) | (1 | ) | |||||||||||||||||||||||||||||||||||||||||||||||||||||||||||||||||||
Net asset value per unit at December 31, 2014 | $ | 131.54 | $ | 133.20 | $ | 179.16 | $ | 153.02 | $ | 152.52 | $ | 131.54 | $ | 133.20 | $ | 179.16 | $ | 153.02 | $ | 152.52 | ||||||||||||||||||||||||||||||||||||||||||||||||||||
Change in net asset value per unit for the three months ending March 31, 2015 | 17.26 | 18.60 | 25.01 | 21.74 | 21.67 | |||||||||||||||||||||||||||||||||||||||||||||||||||||||||||||||||||
Change in net asset value per unit for the six months ending June 30, 2015 | 0.28 | 2.29 | 3.08 | 3.34 | 3.33 | |||||||||||||||||||||||||||||||||||||||||||||||||||||||||||||||||||
|
|
|
|
|
|
|
|
|
| |||||||||||||||||||||||||||||||||||||||||||||||||||||||||||||||
Net asset value per unit at June 30, 2015 | $ | 131.82 | $ | 135.49 | $ | 182.24 | $ | 156.36 | $ | 155.85 | ||||||||||||||||||||||||||||||||||||||||||||||||||||||||||||||
|
|
|
|
| ||||||||||||||||||||||||||||||||||||||||||||||||||||||||||||||||||||
Net asset value per unit at March 31, 2015 | $ | 148.80 | $ | 151.80 | $ | 204.17 | $ | 174.76 | $ | 174.19 | ||||||||||||||||||||||||||||||||||||||||||||||||||||||||||||||
|
|
|
|
| ||||||||||||||||||||||||||||||||||||||||||||||||||||||||||||||||||||
| (1) | Values are for both the Managing Owner and Limited Owners. |
The accompanying notes are an integral part of these financial statements.
The Series of Equinox Frontier Funds
Statements of Changes in Owners’ Capital
For the ThreeSix Months Ending March 31,June 30, 2015
(Unaudited)
| Equinox Frontier Select Fund | Equinox Frontier Winton Fund | Equinox Frontier Heritage Fund | ||||||||||||||||||||||||||||||||||||||||||||||||||||||||||||||||||
| Class 1 | Class 1AP | Class 2 | Class 1 | Class 1AP | Class 2 | Class 1 | Class 1AP | Class 2 | ||||||||||||||||||||||||||||||||||||||||||||||||||||||||||||
| Limited Owners | Limited Owners | Managing Owner | Limited Owners | Non-Controlling Interests | Total | Limited Owners | Limited Owners | Managing Owner | Limited Owners | Total | Limited Owners | Limited Owners | Managing Owner | Limited Owners | Non-Controlling Interests | Total | ||||||||||||||||||||||||||||||||||||||||||||||||||||
Owners’ Capital, December 31, 2014 | $ | 13,663,563 | $ | 47,785 | $ | 9,052 | $ | 1,549,078 | $ | — | $ | 15,269,478 | $ | 26,870,878 | $ | 38,042 | $ | 46,764 | $ | 13,095,549 | $ | 40,051,233 | $ | 9,761,819 | $ | 58,378 | $ | 75,621 | $ | 3,131,561 | $ | 3,539,498 | $ | 16,566,877 | ||||||||||||||||||||||||||||||||||
Sale of Units | 4,734 | 930 | — | — | — | 5,664 | 45,490 | — | — | — | 45,490 | 10,456 | 1,288 | — | — | — | 11,744 | |||||||||||||||||||||||||||||||||||||||||||||||||||
Redemption of Units | (261,695 | ) | — | — | (79,199 | ) | — | (340,894 | ) | (940,759 | ) | — | — | — | (940,759 | ) | (238,356 | ) | — | — | (93,986 | ) | — | (332,342 | ) | |||||||||||||||||||||||||||||||||||||||||||
Change in control of ownership - Trading Companies | — | — | — | — | 6,674,834 | 6,674,834 | — | — | — | — | — | — | — | — | — | (856 | ) | (856 | ) | |||||||||||||||||||||||||||||||||||||||||||||||||
Operations attributable to non-controlling interests | — | — | — | — | 682,333 | 682,333 | — | — | — | — | — | — | — | — | — | 967,115 | 967,115 | |||||||||||||||||||||||||||||||||||||||||||||||||||
Net increase/(decrease) in Owners’ Capital resulting from operations attributable to controlling interests | 1,494,306 | 5,697 | 1,073 | 181,987 | — | 1,683,063 | 2,375,180 | 3,756 | 4,616 | 1,292,739 | 3,676,291 | 1,304,973 | 8,417 | 10,847 | 443,450 | — | 1,767,687 | |||||||||||||||||||||||||||||||||||||||||||||||||||
|
|
|
|
|
|
|
|
|
|
|
|
|
|
|
|
|
|
|
|
|
|
|
|
|
|
|
|
|
|
|
|
|
| |||||||||||||||||||||||||||||||||||
Owners’ Capital, March 31, 2015 | $ | 14,900,908 | $ | 54,412 | $ | 10,125 | $ | 1,651,866 | $ | 7,357,167 | $ | 23,974,478 | $ | 28,350,789 | $ | 41,798 | $ | 51,380 | $ | 14,388,288 | $ | 42,832,255 | $ | 10,838,892 | $ | 68,083 | $ | 86,468 | $ | 3,481,025 | $ | 4,505,757 | $ | 18,980,225 | ||||||||||||||||||||||||||||||||||
|
|
|
|
|
|
|
|
|
|
|
|
|
|
|
|
|
|
|
|
|
|
|
|
|
|
|
|
|
|
|
|
|
| |||||||||||||||||||||||||||||||||||
Owners’ Capital - Units, December 31, 2014 | 142,913 | 494 | 70 | 12,058 | 152,717 | 214 | 207 | 57,886 | 74,927 | 443 | 428 | 17,736 | ||||||||||||||||||||||||||||||||||||||||||||||||||||||||
Sale of Units | 47 | 9 | — | — | 249 | — | — | — | 75 | 9 | — | — | ||||||||||||||||||||||||||||||||||||||||||||||||||||||||
Redemption of Units | (2,603 | ) | — | — | (564 | ) | (5,225 | ) | — | — | — | (1,704 | ) | — | — | (494 | ) | |||||||||||||||||||||||||||||||||||||||||||||||||||
|
|
|
|
|
|
|
|
|
|
|
|
|
|
|
|
|
|
|
|
|
|
|
| |||||||||||||||||||||||||||||||||||||||||||||
Owners’ Capital - Units, March 31, 2015 | 140,357 | 503 | 70 | 11,494 | 147,741 | 214 | 207 | 57,886 | 73,298 | 452 | 428 | 17,242 | ||||||||||||||||||||||||||||||||||||||||||||||||||||||||
|
|
|
|
|
|
|
|
|
|
|
|
|
|
|
|
|
|
|
|
|
|
|
| |||||||||||||||||||||||||||||||||||||||||||||
| (1) | (1) | (1) | ||||||||||||||||||||||||||||||||||||||||||||||||||||||||||||||||||
Net asset value per unit at December 31, 2014 | $ | 95.61 | $ | 96.82 | $ | 128.48 | $ | 175.95 | $ | 178.18 | $ | 226.23 | $ | 130.28 | $ | 131.93 | $ | 176.56 | ||||||||||||||||||||||||||||||||||||||||||||||||||
Change in net asset value per unit for the three months ended March 31, 2015 | 10.55 | 11.49 | 15.25 | 15.95 | 17.59 | 22.33 | 17.59 | 18.93 | 25.33 | |||||||||||||||||||||||||||||||||||||||||||||||||||||||||||
|
|
|
|
|
|
|
|
|
|
|
|
|
|
|
|
|
| |||||||||||||||||||||||||||||||||||||||||||||||||||
Net asset value per unit at March 31, 2015 | $ | 106.16 | $ | 108.31 | $ | 143.73 | $ | 191.90 | $ | 195.77 | $ | 248.56 | $ | 147.87 | $ | 150.86 | $ | 201.89 | ||||||||||||||||||||||||||||||||||||||||||||||||||
|
|
|
|
|
|
|
|
|
|
|
|
|
|
|
|
|
| |||||||||||||||||||||||||||||||||||||||||||||||||||
| Equinox Frontier Select Fund | Equinox Frontier Winton Fund | Equinox Frontier Heritage Fund | ||||||||||||||||||||||||||||||||||||||||||||||||||||||||||||||||||
| Class 1 | Class 1AP | Class 2 | Non- Controlling | Class 1 | Class 1AP | Class 2 | Class 1 | Class 1AP | Class 2 | Non- Controlling | ||||||||||||||||||||||||||||||||||||||||||||||||||||||||||
| Limited Owners | Limited Owners | Managing Owner | Limited Owners | Total | Limited Owners | Limited Owners | Managing Owner | Limited Owners | Total | Limited Owners | Limited Owners | Managing Owner | Limited Owners | Total | ||||||||||||||||||||||||||||||||||||||||||||||||||||||
Owners’ Capital, December 31, 2014 | $ | 13,663,563 | $ | 47,785 | $ | 9,052 | $ | 1,549,078 | $ | — | $ | 15,269,478 | $ | 26,870,878 | $ | 38,042 | $ | 46,764 | $ | 13,095,549 | $ | 40,051,233 | $ | 9,761,819 | $ | 58,378 | $ | 75,621 | $ | 3,131,561 | $ | 3,539,498 | $ | 16,566,877 | ||||||||||||||||||||||||||||||||||
Sale of Units | 10,068 | 930 | — | — | — | 10,998 | 93,346 | — | — | — | 93,346 | 21,905 | 1,288 | — | — | — | 23,193 | |||||||||||||||||||||||||||||||||||||||||||||||||||
Redemption of Units | (545,555 | ) | — | — | (152,448 | ) | — | (698,003 | ) | (1,185,987 | ) | — | — | (148,360 | ) | (1,334,347 | ) | (356,862 | ) | — | — | (112,648 | ) | — | (469,510 | ) | ||||||||||||||||||||||||||||||||||||||||||
Change in control of ownership - Trading Companies | — | — | — | — | 6,595,623 | 6,595,623 | — | — | — | — | — | — | — | — | — | (27,363 | ) | (27,363 | ) | |||||||||||||||||||||||||||||||||||||||||||||||||
Operations attributable to non-controlling interests | — | — | — | — | (684,237 | ) | (684,237 | ) | — | — | — | — | — | — | — | — | — | 127,516 | 127,516 | |||||||||||||||||||||||||||||||||||||||||||||||||
Net increase/(decrease) in Owners’ | ||||||||||||||||||||||||||||||||||||||||||||||||||||||||||||||||||||
Capital resulting from operations attributable to controlling interests | (1,127,421 | ) | (3,631 | ) | (663 | ) | (98,401 | ) | — | (1,230,116 | ) | (1,458,333 | ) | (1,647 | ) | (2,025 | ) | (561,773 | ) | (2,023,778 | ) | (285,834 | ) | (1,172 | ) | (1,330 | ) | (45,845 | ) | — | (334,181 | ) | ||||||||||||||||||||||||||||||||||||
|
|
|
|
|
|
|
|
|
|
|
|
|
|
|
|
|
|
|
|
|
|
|
|
|
|
|
|
|
|
|
|
|
| |||||||||||||||||||||||||||||||||||
Owners’ Capital, June 30, 2015 | $ | 12,000,655 | $ | 45,084 | $ | 8,389 | $ | 1,298,229 | $ | 5,911,386 | $ | 19,263,743 | $ | 24,319,904 | $ | 36,395 | $ | 44,739 | $ | 12,385,416 | $ | 36,786,454 | $ | 9,141,028 | $ | 58,494 | $ | 74,291 | $ | 2,973,068 | $ | 3,639,651 | $ | 15,886,532 | ||||||||||||||||||||||||||||||||||
|
|
|
|
|
|
|
|
|
|
|
|
|
|
|
|
|
|
|
|
|
|
|
|
|
|
|
|
|
|
|
|
|
| |||||||||||||||||||||||||||||||||||
Owners’ Capital - Units, December 31, 2014 | 142,913 | 494 | 70 | 12,058 | 152,717 | 214 | 207 | 57,886 | 74,927 | 443 | 428 | 17,736 | ||||||||||||||||||||||||||||||||||||||||||||||||||||||||
Sale of Units | 101 | 9 | — | — | 515 | — | — | — | 158 | 9 | — | — | ||||||||||||||||||||||||||||||||||||||||||||||||||||||||
Redemption of Units | (5,564 | ) | — | — | (1,155 | ) | (6,591 | ) | — | — | (661 | ) | (2,596 | ) | — | — | (596 | ) | ||||||||||||||||||||||||||||||||||||||||||||||||||
|
|
|
|
|
|
|
|
|
|
|
|
|
|
|
|
|
|
|
|
|
|
|
| |||||||||||||||||||||||||||||||||||||||||||||
Owners’ Capital - Units, June 30, 2015 | 137,450 | 503 | 70 | 10,903 | 146,641 | 214 | 207 | 57,225 | 72,489 | 452 | 428 | 17,140 | ||||||||||||||||||||||||||||||||||||||||||||||||||||||||
|
|
|
|
|
|
|
|
|
|
|
|
|
|
|
|
|
|
|
|
|
|
|
| |||||||||||||||||||||||||||||||||||||||||||||
| (1) | (1) | (1) | ||||||||||||||||||||||||||||||||||||||||||||||||||||||||||||||||||
Net asset value per unit at December 31, 2014 | $ | 95.61 | $ | 96.82 | $ | 128.48 | $ | 175.95 | $ | 178.18 | $ | 226.23 | $ | 130.28 | $ | 131.93 | $ | 176.56 | ||||||||||||||||||||||||||||||||||||||||||||||||||
Change in net asset value per unit for the six months ended June 30, 2015 | (8.30 | ) | (7.08 | ) | (9.39 | ) | (10.10 | ) | (7.72 | ) | (9.80 | ) | (4.18 | ) | (2.32 | ) | (3.11 | ) | ||||||||||||||||||||||||||||||||||||||||||||||||||
|
|
|
|
|
|
|
|
|
|
|
|
|
|
|
|
|
| |||||||||||||||||||||||||||||||||||||||||||||||||||
Net asset value per unit at June 30, 2015 | $ | 87.31 | $ | 89.74 | $ | 119.09 | $ | 165.85 | $ | 170.46 | $ | 216.43 | $ | 126.10 | $ | 129.61 | $ | 173.45 | ||||||||||||||||||||||||||||||||||||||||||||||||||
|
|
|
|
|
|
|
|
|
|
|
|
|
|
|
|
|
| |||||||||||||||||||||||||||||||||||||||||||||||||||
| (1) | Values are for both the Managing Owner and Limited Owners. |
The accompanying notes are an integral part of these financial statements.
The Series of Equinox Frontier Funds
Statements of Cash Flows
For the ThreeSix Months Ended March 31,June 30, 2015 and 2014
(Unaudited)
| Equinox Frontier Diversified Fund | Equinox Frontier Masters Fund | Equinox Frontier Long/Short Commodity Fund | ||||||||||||||||||||||||||||||||||||||||||||||
| 3/31/2015 | 3/31/2014 | 3/31/2015 | 3/31/2014 | 3/31/2015 | 3/31/2014 | Equinox Frontier Diversified Fund | Equinox Frontier Masters Fund | Equinox Frontier Long/Short Commodity Fund | ||||||||||||||||||||||||||||||||||||||||
| 6/30/2015 | 6/30/2014 | 6/30/2015 | 6/30/2014 | 6/30/2015 | 6/30/2014 | |||||||||||||||||||||||||||||||||||||||||||
Cash Flows from Operating Activities: | ||||||||||||||||||||||||||||||||||||||||||||||||
Net increase/(decrease) in capital resulting from operations | $ | 13,030,463 | $ | (2,619,266 | ) | $ | 2,578,394 | $ | (1,615,359 | ) | $ | 2,316,181 | $ | (4,424,801 | ) | $ | 2,211,703 | $ | (71,992 | ) | $ | (1,215,480 | ) | $ | (45,939 | ) | $ | 271,083 | $ | (3,173,497 | ) | |||||||||||||||||
Adjustments to reconcile net increase/(decrease) in capital resulting from operations to net cash provided by (used in) operating activities: | ||||||||||||||||||||||||||||||||||||||||||||||||
Change in: | ||||||||||||||||||||||||||||||||||||||||||||||||
Net change in open trade equity/(deficit), at fair value | 645,700 | — | — | — | — | (217,385 | ) | 3,786,757 | — | — | — | — | (191,069 | ) | ||||||||||||||||||||||||||||||||||
Net change in options purchased, at fair value | (36,590 | ) | — | — | — | — | (1,769,922 | ) | (86,056 | ) | — | — | — | — | 98,740 | |||||||||||||||||||||||||||||||||
Net change in options written, at fair value | (145,851 | ) | — | — | — | — | 1,130,558 | (33,358 | ) | — | — | — | — | (172,650 | ) | |||||||||||||||||||||||||||||||||
Net change in ownership allocation of U.S. Treasury securities | (178,938 | ) | 544,792 | 3,311,932 | 1,906,051 | (699,172 | ) | 1,780,329 | 102,792 | (3,148,617 | ) | 3,692,889 | 3,061,783 | 947,060 | 2,706,178 | |||||||||||||||||||||||||||||||||
Net realized (gain) on swap contracts | — | — | — | — | — | — | — | — | — | — | — | — | ||||||||||||||||||||||||||||||||||||
Net unrealized (gain)/loss on swap contracts | (2,988,716 | ) | 579,402 | — | — | (668,912 | ) | 424,783 | (1,044,760 | ) | 391,235 | — | — | 328,851 | 238,462 | |||||||||||||||||||||||||||||||||
Net unrealized (gain)/loss on U.S. Treasury securities | (684,086 | ) | (1,348,616 | ) | (344,244 | ) | (776,321 | ) | (128,767 | ) | (581,928 | ) | 583,896 | (1,883,962 | ) | 228,422 | (1,060,897 | ) | 217,117 | (774,729 | ) | |||||||||||||||||||||||||||
Net realized (gain)/loss on U.S. Treasury securities | — | 110,584 | — | 62,525 | — | 48,820 | (133,349 | ) | 127,713 | (56,105 | ) | 71,630 | (33,884 | ) | 54,879 | |||||||||||||||||||||||||||||||||
(Purchases) sales of: | ||||||||||||||||||||||||||||||||||||||||||||||||
Sales of U.S. Treasury securities | — | 9,588,033 | — | 5,408,075 | — | 4,227,410 | 6,214,322 | 14,517,974 | 2,729,817 | 8,028,811 | 1,713,661 | 5,971,219 | ||||||||||||||||||||||||||||||||||||
Purchase of U.S. Treasury securities | (4,787,243 | ) | — | (2,291,604 | ) | — | (1,395,765 | ) | — | (4,787,243 | ) | — | (2,291,604 | ) | — | (1,395,765 | ) | — | ||||||||||||||||||||||||||||||
Purchase of Swap contracts | — | — | — | — | (1,000,000 | ) | — | — | — | — | — | (1,000,000 | ) | — | ||||||||||||||||||||||||||||||||||
Increase and/or decrease in: | ||||||||||||||||||||||||||||||||||||||||||||||||
Receivable from futures commission merchants | 3,217,669 | — | — | — | — | 1,545,086 | 8,060,422 | — | — | — | — | 7,836,808 | ||||||||||||||||||||||||||||||||||||
Change in control of ownership - trading companies | (4,686,248 | ) | (325,371 | ) | — | — | — | 2,079,617 | (5,325,430 | ) | (325,371 | ) | — | — | — | (2,462,220 | ) | |||||||||||||||||||||||||||||||
Investments in unconsolidated trading companies, at fair value | 129,407 | (906,402 | ) | (3,013,677 | ) | (491,687 | ) | 813,933 | 165,450 | 395,915 | 3,087,509 | (865,542 | ) | (172,000 | ) | (82,140 | ) | (2,457,886 | ) | |||||||||||||||||||||||||||||
Prepaid service fees - Class 1 | (5,050 | ) | 1,167 | (1,732 | ) | 6,840 | 322 | 1,854 | (14,084 | ) | (1,665 | ) | 114 | 9,544 | 95 | 2,002 | ||||||||||||||||||||||||||||||||
Interest receivable | 267,335 | 365,202 | 160,364 | 230,960 | 66,333 | 170,111 | (21,022 | ) | 32,060 | 45,052 | 91,642 | 10,323 | 77,778 | |||||||||||||||||||||||||||||||||||
Receivable from related parties | — | 1,035 | 598 | (14,714 | ) | 338 | (22 | ) | — | 1,035 | 74 | (1,206 | ) | 530 | (128 | ) | ||||||||||||||||||||||||||||||||
Other assets | 249,997 | — | — | — | — | — | 249,997 | — | — | — | — | — | ||||||||||||||||||||||||||||||||||||
Incentive fees payable to Managing Owner | (753,583 | ) | (143,466 | ) | (186,742 | ) | 13,712 | 80,556 | — | (2,383,825 | ) | 379,279 | (680,972 | ) | 168,094 | (118,511 | ) | — | ||||||||||||||||||||||||||||||
Management fees payable to Managing Owner | 1,797 | (10,941 | ) | 2,966 | (21,104 | ) | (1,799 | ) | (8,283 | ) | (3,010 | ) | (15,618 | ) | (4,185 | ) | (28,933 | ) | 349 | (44,175 | ) | |||||||||||||||||||||||||||
Interest payable to Managing Owner | 910 | (2,745 | ) | (773 | ) | (1,982 | ) | 747 | (2,848 | ) | (370 | ) | (4,543 | ) | (1,160 | ) | (3,798 | ) | (97 | ) | (3,948 | ) | ||||||||||||||||||||||||||
Trading fees payable to Managing Owner | 10,676 | (16,034 | ) | 932 | (14,501 | ) | 1,010 | (10,056 | ) | (8,657 | ) | (25,282 | ) | (5,099 | ) | (21,589 | ) | (2,810 | ) | (14,458 | ) | |||||||||||||||||||||||||||
Service fees payable to Managing Owner | (909 | ) | (7,205 | ) | 3,951 | (8,034 | ) | 516 | (3,747 | ) | 1,745 | (11,281 | ) | (1,808 | ) | (16,297 | ) | (1,413 | ) | (5,090 | ) | |||||||||||||||||||||||||||
Payables to related parties | 1,135 | — | — | — | — | — | 1,172 | — | — | — | — | — | ||||||||||||||||||||||||||||||||||||
Other liabilities | — | 1,440 | — | — | (1 | ) | — | — | 1,813 | — | — | — | — | |||||||||||||||||||||||||||||||||||
|
|
|
|
|
|
|
|
|
|
|
| |||||||||||||||||||||||||||||||||||||
Net cash provided by (used in) operating activities | 3,287,875 | 5,811,609 | 220,365 | 4,684,461 | (614,480 | ) | 4,555,026 | 7,767,557 | 13,050,287 | 1,574,413 | 10,080,825 | 854,449 | 7,686,216 | |||||||||||||||||||||||||||||||||||
|
|
|
|
|
| |||||||||||||||||||||||||||||||||||||||||||
|
|
|
|
|
| |||||||||||||||||||||||||||||||||||||||||||
Cash Flows from Financing Activities: | ||||||||||||||||||||||||||||||||||||||||||||||||
Proceeds from sale of units | 3,060,993 | 1,303,503 | 865,703 | 752,596 | 46,303 | 303,597 | 5,874,232 | 2,717,767 | 3,497,943 | 2,939,625 | 148,785 | 401,977 | ||||||||||||||||||||||||||||||||||||
Payment for redemption of units | (8,736,585 | ) | (7,763,286 | ) | (2,425,896 | ) | (5,960,619 | ) | (839,912 | ) | (5,208,551 | ) | (13,110,837 | ) | (13,973,647 | ) | (5,292,448 | ) | (12,287,701 | ) | (1,882,547 | ) | (7,567,551 | ) | ||||||||||||||||||||||||
Payment made by the Managing Owner | 144,349 | — | — | — | 907,163 | — | 144,349 | — | — | — | 907,162 | — | ||||||||||||||||||||||||||||||||||||
Pending owner additions | 280 | 12,002 | 239 | (42 | ) | — | — | (207 | ) | (1,463 | ) | (490 | ) | (18 | ) | — | — | |||||||||||||||||||||||||||||||
Owner redemptions payable | 150,010 | (70,610 | ) | 37,184 | 45,129 | (8,935 | ) | (22,293 | ) | (57,953 | ) | 335,367 | — | (3,102 | ) | (18,782 | ) | (91,056 | ) | |||||||||||||||||||||||||||||
|
|
|
|
|
|
|
|
|
|
|
| |||||||||||||||||||||||||||||||||||||
Net cash provided by (used in) financing activities | (5,380,953 | ) | (6,518,391 | ) | (1,522,770 | ) | (5,162,936 | ) | 104,619 | (4,927,247 | ) | (7,150,416 | ) | (10,921,976 | ) | (1,794,995 | ) | (9,351,196 | ) | (845,382 | ) | (7,256,630 | ) | |||||||||||||||||||||||||
|
|
|
|
|
| |||||||||||||||||||||||||||||||||||||||||||
|
|
|
|
|
| |||||||||||||||||||||||||||||||||||||||||||
Net increase (decrease) in cash and cash equivalents | (2,093,078 | ) | (706,782 | ) | (1,302,405 | ) | (478,475 | ) | (509,861 | ) | (372,221 | ) | 617,141 | 2,128,311 | (220,582 | ) | 729,629 | 9,067 | 429,586 | |||||||||||||||||||||||||||||
Cash and cash equivalents, beginning of period | 4,210,638 | 1,827,897 | 2,199,066 | 1,125,954 | 1,110,779 | 810,418 | 4,210,638 | 1,827,897 | 2,199,066 | 1,125,954 | 1,110,779 | 810,418 | ||||||||||||||||||||||||||||||||||||
|
|
|
|
|
|
|
|
|
|
|
| |||||||||||||||||||||||||||||||||||||
Cash and cash equivalents, end of period | $ | 2,117,560 | $ | 1,121,115 | $ | 896,661 | $ | 647,479 | $ | 600,918 | $ | 438,197 | $ | 4,827,779 | $ | 3,956,208 | $ | 1,978,484 | $ | 1,855,563 | $ | 1,119,846 | $ | 1,240,004 | ||||||||||||||||||||||||
|
|
|
|
|
|
|
|
|
|
|
| |||||||||||||||||||||||||||||||||||||
The accompanying notes are an integral part of these financial statements.
The Series of Equinox Frontier Funds
Statements of Cash Flows
For the ThreeSix Months Ended March 31,June 30, 2015 and 2014
(Unaudited)
| Equinox Frontier Balanced Fund | Equinox Frontier Select Fund | Equinox Frontier Balanced Fund | Equinox Frontier Select Fund | |||||||||||||||||||||||||||||
| 3/31/2015 | 3/31/2014 | 3/31/2015 | 3/31/2014 | 6/30/2015 | 6/30/2014 | 6/30/2015 | 6/30/2014 | |||||||||||||||||||||||||
Cash Flows from Operating Activities: | ||||||||||||||||||||||||||||||||
Net increase/(decrease) in capital resulting from operations | $ | 13,757,430 | $ | (3,711,819 | ) | $ | 2,365,396 | $ | (1,043,766 | ) | $ | 779,026 | $ | 848,007 | $ | (1,230,116 | ) | $ | (432,776 | ) | ||||||||||||
Adjustments to reconcile net increase/(decrease) in capital resulting from operations to net cash provided by (used in) operating activities: | ||||||||||||||||||||||||||||||||
Change in: | ||||||||||||||||||||||||||||||||
Net change in open trade equity, at fair value | 3,028,571 | 1,550,802 | (958,673 | ) | — | 4,076,512 | 1,631,455 | (55,956 | ) | — | ||||||||||||||||||||||
Net change in options purchased, at fair value | — | (37,228 | ) | — | — | — | 165,915 | — | — | |||||||||||||||||||||||
Net change in options written, at fair value | — | (114,446 | ) | — | — | — | (183,856 | ) | — | — | ||||||||||||||||||||||
Net change in ownership allocation of U.S. Treasury securities | (8,010,664 | ) | 125,990 | 3,949,649 | 326,279 | (10,786,387 | ) | 1,384,849 | 4,418,169 | 551,952 | ||||||||||||||||||||||
Net unrealized (gain)/loss on swap contracts | (5,226,678 | ) | 1,485,685 | — | — | (244,680 | ) | — | — | — | ||||||||||||||||||||||
Net realized (gain)/loss on swap contracts | — | — | — | — | — | 630,474 | — | — | ||||||||||||||||||||||||
Net unrealized (gain)/loss on U.S. Treasury securities | (737,851 | ) | (2,447,648 | ) | (159,412 | ) | (357,469 | ) | 1,389,049 | (3,414,775 | ) | (32,740 | ) | (496,053 | ) | |||||||||||||||||
Net realized (gain)/loss on U.S. Treasury securities | — | 194,409 | — | 30,381 | (215,325 | ) | 225,870 | (12,618 | ) | 34,988 | ||||||||||||||||||||||
(Purchases) sales of: | ||||||||||||||||||||||||||||||||
Sales of U.S. Treasury securities | — | 17,026,142 | — | 2,630,713 | 10,249,014 | 26,111,089 | 600,508 | 3,956,690 | ||||||||||||||||||||||||
Purchases of U.S. Treasury securities | (6,360,723 | ) | — | (911,929 | ) | (6,360,723 | ) | — | (911,929 | ) | — | |||||||||||||||||||||
Increase and/or decrease in: | ||||||||||||||||||||||||||||||||
Receivable from futures commission merchants | 11,523,045 | (1,894,177 | ) | (14,715,637 | ) | — | 13,267,929 | 10,787,977 | (12,410,448 | ) | — | |||||||||||||||||||||
Change in control of ownership - trading companies | (8,327,863 | ) | 4,077,939 | 6,674,834 | — | (7,769,999 | ) | (8,927,933 | ) | 5,911,386 | — | |||||||||||||||||||||
Investments in unconsolidated trading companies, at fair value | 901,079 | 1,011,247 | 3,368,672 | (300,837 | ) | 4,010,131 | (5,848,870 | ) | 4,088,872 | (455,524 | ) | |||||||||||||||||||||
Prepaid service fees - Class 1 | — | 185 | — | — | — | 234 | — | — | ||||||||||||||||||||||||
Interest receivable | 315,275 | 652,079 | 78,965 | 100,069 | (171,799 | ) | 178,389 | 58,145 | 33,530 | |||||||||||||||||||||||
Receivable from other series | — | — | — | — | — | — | — | — | ||||||||||||||||||||||||
Receivable from related parties | — | — | — | — | — | — | — | — | ||||||||||||||||||||||||
Other assets | 250,000 | 465 | — | — | 250,003 | 45 | — | — | ||||||||||||||||||||||||
Incentive fees payable to Managing Owner | (306,361 | ) | (140,639 | ) | (26,820 | ) | — | (1,783,801 | ) | 210,121 | (185,791 | ) | 26,677 | |||||||||||||||||||
Management fees payable to Managing Owner | (7,383 | ) | (13,847 | ) | 1,127 | (2,052 | ) | (9,562 | ) | (24,391 | ) | (1,770 | ) | (1,557 | ) | |||||||||||||||||
Interest payable to Managing Owner | 26,134 | (29,295 | ) | (5,884 | ) | (5,039 | ) | 16,064 | (51,818 | ) | (6,812 | ) | (8,194 | ) | ||||||||||||||||||
Trading fees payable to Managing Owner | 5,207 | (11,114 | ) | 733 | (1,804 | ) | (844 | ) | (17,116 | ) | (834 | ) | (2,307 | ) | ||||||||||||||||||
Service fees payable to Managing Owner | 9,510 | (22,168 | ) | 3,196 | (4,889 | ) | (10,950 | ) | (43,842 | ) | (2,903 | ) | (7,625 | ) | ||||||||||||||||||
Payables to related parties | 2,462 | 2,934 | 97 | 161 | 4,500 | 5,004 | 211 | 269 | ||||||||||||||||||||||||
Other liabilities | — | — | — | — | — | — | — | — | ||||||||||||||||||||||||
|
|
|
|
|
|
|
| |||||||||||||||||||||||||
Net cash provided by (used in) operating activities | 841,190 | 17,705,496 | (335,686 | ) | 1,371,747 | 6,688,158 | 23,666,828 | 225,374 | 3,200,070 | |||||||||||||||||||||||
|
|
|
| |||||||||||||||||||||||||||||
|
|
|
| |||||||||||||||||||||||||||||
Cash Flows from Financing Activities: | ||||||||||||||||||||||||||||||||
Proceeds from sale of units | 61,926 | 43,169 | 5,664 | 2,594 | 128,231 | 83,053 | 10,998 | 4,943 | ||||||||||||||||||||||||
Payment for redemption of units | (3,435,656 | ) | (10,919,584 | ) | (340,894 | ) | (1,542,977 | ) | (4,743,413 | ) | (20,064,605 | ) | (698,003 | ) | (2,846,634 | ) | ||||||||||||||||
Payment made by the Managing Owner | 160,098 | — | — | — | 160,099 | — | — | — | ||||||||||||||||||||||||
Pending owner additions | 2,872 | (1,774 | ) | 387 | (164 | ) | (560 | ) | (2,731 | ) | (74 | ) | (153 | ) | ||||||||||||||||||
Owner redemptions payable | (1,542 | ) | (557,253 | ) | (124 | ) | (31,088 | ) | (13,705 | ) | (821,324 | ) | (15,432 | ) | 17,098 | |||||||||||||||||
|
|
|
|
|
|
|
| |||||||||||||||||||||||||
Net cash provided by (used in) financing activities | (3,212,302 | ) | (11,435,442 | ) | (334,967 | ) | (1,571,635 | ) | (4,469,348 | ) | (20,805,607 | ) | (702,511 | ) | (2,824,746 | ) | ||||||||||||||||
|
|
|
| |||||||||||||||||||||||||||||
|
|
|
| |||||||||||||||||||||||||||||
Net increase (decrease) in cash and cash equivalents | (2,371,112 | ) | 6,270,054 | (670,653 | ) | (199,888 | ) | 2,218,810 | 2,861,221 | (477,137 | ) | 375,324 | ||||||||||||||||||||
Cash and cash equivalents, beginning of period | 5,644,510 | 3,292,570 | 878,280 | 494,931 | 5,644,510 | 3,292,570 | 878,280 | 494,931 | ||||||||||||||||||||||||
|
|
|
|
|
|
|
| |||||||||||||||||||||||||
Cash and cash equivalents, end of period | $ | 3,273,398 | $ | 9,562,624 | $ | 207,627 | $ | 295,043 | $ | 7,863,320 | $ | 6,153,791 | $ | 401,143 | $ | 870,255 | ||||||||||||||||
|
|
|
|
|
|
|
| |||||||||||||||||||||||||
The accompanying notes are an integral part of these financial statements.
The Series of Equinox Frontier Funds
Statements of Cash Flows
For the ThreeSix Months Ended March 31,June 30, 2015 and 2014
(Unaudited)
| Equinox Frontier Winton Fund | Equinox Frontier Heritage Fund | |||||||||||||||||||||||||||||||
| 3/31/2015 | 3/31/2014 | 3/31/2015 | 3/31/2014 | Equinox Frontier Winton Fund | Equinox Frontier Heritage Fund | |||||||||||||||||||||||||||
| 6/30/2015 | 6/30/2014 | 6/30/2015 | 6/30/2014 | |||||||||||||||||||||||||||||
Cash Flows from Operating Activities: | ||||||||||||||||||||||||||||||||
Net increase/(decrease) in capital resulting from operations | $ | 3,676,291 | $ | (631,089 | ) | $ | 2,734,802 | $ | (1,412,412 | ) | $ | (2,023,778 | ) | $ | 1,420,061 | $ | (334,181 | ) | $ | (250,188 | ) | |||||||||||
Adjustments to reconcile net increase/(decrease) in capital resulting from operations to net cash provided by (used in) operating activities: | ||||||||||||||||||||||||||||||||
Change in: | ||||||||||||||||||||||||||||||||
Net change in open trade equity, at fair value | — | — | — | — | — | — | — | — | ||||||||||||||||||||||||
Net change in ownership allocation of U.S. Treasury securities | 1,797,790 | (4,057,168 | ) | 524,232 | (273,040 | ) | 2,175,647 | (3,994,960 | ) | 687,650 | 302,509 | |||||||||||||||||||||
Net unrealized (gain)/loss on swap contracts | — | — | (2,059,865 | ) | 1,208,563 | — | — | (268,786 | ) | 462,653 | ||||||||||||||||||||||
Net realized (gain)/loss on swap contracts | — | — | — | — | — | — | — | — | ||||||||||||||||||||||||
Net unrealized (gain) loss on U.S. Treasury securities, at fair value | (553,885 | ) | (972,190 | ) | (126,818 | ) | (300,004 | ) | 616,192 | (1,429,792 | ) | 139,126 | (422,594 | ) | ||||||||||||||||||
Net realized (gain) loss on U.S. Treasury securities, at fair value | — | 83,129 | — | 24,819 | (111,546 | ) | 97,349 | (25,632 | ) | 28,835 | ||||||||||||||||||||||
(Purchases) sale of: | ||||||||||||||||||||||||||||||||
Sales of U.S. Treasury Securities | — | 7,256,341 | — | 2,160,943 | 5,740,839 | 11,348,872 | 1,293,839 | 3,316,905 | ||||||||||||||||||||||||
Purchases of U.S. Treasury Securities | (4,444,636 | ) | (1,004,975 | ) | (4,444,636 | ) | — | (1,004,975 | ) | — | ||||||||||||||||||||||
Increase and/or decrease in: | ||||||||||||||||||||||||||||||||
Change in control of ownership of trading companies | — | — | (856 | ) | 855 | — | — | 100,153 | 855 | |||||||||||||||||||||||
Investments in unconsolidated trading companies, at fair value | (1,493,014 | ) | (577,839 | ) | (180,521 | ) | (95,628 | ) | 730,619 | (2,247,207 | ) | 145,343 | (480,022 | ) | ||||||||||||||||||
Interest receivable | 267,277 | 242,710 | 62,111 | 82,302 | 15,769 | 6,900 | 6,653 | 24,563 | ||||||||||||||||||||||||
Receivable from related parties | — | — | — | — | — | — | — | — | ||||||||||||||||||||||||
Other assets | — | — | — | — | — | — | — | — | ||||||||||||||||||||||||
Incentive fees payable to Managing Owner | (462,955 | ) | (100,260 | ) | (106,649 | ) | (3,220 | ) | (1,178,364 | ) | 315,369 | (239,327 | ) | 71,588 | ||||||||||||||||||
Management fees payable to Managing Owner | 314 | (31,751 | ) | (589 | ) | (1,135 | ) | (12,571 | ) | (28,976 | ) | (4,245 | ) | (384 | ) | |||||||||||||||||
Interest payable to Managing Owner | 2,705 | (6,143 | ) | 342 | (4,261 | ) | (2,403 | ) | (10,769 | ) | (805 | ) | (6,906 | ) | ||||||||||||||||||
Trading fees payable to Managing Owner | 907 | (1,930 | ) | 677 | (1,609 | ) | (1,727 | ) | (2,019 | ) | (371 | ) | (1,961 | ) | ||||||||||||||||||
Service fees payable to Managing Owner | 501 | (3,867 | ) | 2,178 | (3,721 | ) | (6,465 | ) | (4,913 | ) | (1,220 | ) | (6,039 | ) | ||||||||||||||||||
Payables to related parties | 4,220 | 3,282 | 286 | 1,170 | 7,984 | 5,133 | 595 | 1,386 | ||||||||||||||||||||||||
Other liabilities | — | — | — | — | — | — | — | 3,500 | ||||||||||||||||||||||||
|
|
|
|
|
|
|
| |||||||||||||||||||||||||
Net cash provided by (used in) operating activities | (1,204,485 | ) | 1,203,225 | (155,645 | ) | 1,383,622 | 1,505,560 | 5,475,048 | 493,817 | 3,044,700 | ||||||||||||||||||||||
|
|
|
| |||||||||||||||||||||||||||||
|
|
|
| |||||||||||||||||||||||||||||
Cash Flows from Financing Activities: | ||||||||||||||||||||||||||||||||
Proceeds from sale of units | 45,490 | 33,929 | 11,744 | 6,040 | 93,346 | 67,734 | 23,193 | 11,982 | ||||||||||||||||||||||||
Payment for redemption of units | (940,759 | ) | (1,550,061 | ) | (332,342 | ) | (1,535,404 | ) | (1,334,347 | ) | (3,788,762 | ) | (469,510 | ) | (2,700,710 | ) | ||||||||||||||||
Pending owner additions | 811 | (330 | ) | 560 | (883 | ) | (1,408 | ) | (1,268 | ) | (47 | ) | (796 | ) | ||||||||||||||||||
Owner redemptions payable | (21,902 | ) | (40,167 | ) | (18,735 | ) | — | (21,902 | ) | (76,900 | ) | (21,408 | ) | — | ||||||||||||||||||
|
|
|
|
|
|
|
| |||||||||||||||||||||||||
Net cash provided by (used in) financing activities | (916,360 | ) | (1,556,629 | ) | (338,773 | ) | (1,530,247 | ) | (1,264,311 | ) | (3,799,196 | ) | (467,772 | ) | (2,689,524 | ) | ||||||||||||||||
|
|
|
| |||||||||||||||||||||||||||||
|
|
|
| |||||||||||||||||||||||||||||
Net increase (decrease) in cash and cash equivalents | (2,120,845 | ) | (353,404 | ) | (494,418 | ) | (146,625 | ) | 241,249 | 1,675,852 | 26,045 | 355,176 | ||||||||||||||||||||
Cash and cash equivalents, beginning of period | 4,012,974 | 1,325,731 | 921,598 | 424,001 | 4,012,974 | 1,325,731 | 921,598 | 424,001 | ||||||||||||||||||||||||
|
|
|
|
|
|
|
| |||||||||||||||||||||||||
Cash and cash equivalents, end of period | $ | 1,892,129 | $ | 972,327 | $ | 427,180 | $ | 277,376 | $ | 4,254,223 | $ | 3,001,583 | $ | 947,643 | $ | 779,177 | ||||||||||||||||
|
|
|
|
|
|
|
| |||||||||||||||||||||||||
The accompanying notes are an integral part of these financial statements.
The Series of Equinoxthe Frontier FundsFund
Notes to Financial Statements (Unaudited)
1. Organization and Purpose
Equinox Frontier Funds, which is referred to in this report as the “Trust”, was formed on August 8, 2003, as a Delaware statutory trust. Please refer to the consolidated financial statements of the Trust included within this periodic report. The Trust is amulti-advisor commodity pool, as described in Commodity Futures Trading Commission (the “CFTC”) Regulation § 4.10(d)(2). The Trust has authority to issue separate series, or each, a Series, of units of beneficial interest (the “Units”) pursuant to the requirements of the Delaware Statutory Trust Act, as amended (the “Trust Act”). The assets of each Series are valued and accounted for separately from the assets of other Series. The Trust is not registered as an investment company under the Investment Company Act of 1940, as amended (the “Investment Company Act”). It is managed by its managing owner, Equinox Fund Management, LLC (the “Managing Owner”).
Purchasers of Units are limited owners of the Trust (“Limited Owners”) with respect to beneficial interests of the Series’ Units purchased. The Trust Act provides that, except as otherwise provided in the second amended and restated declaration of trust and trust agreement dated December 9, 2013, by and among the Managing Owner, Wilmington Trust Company as trustee and the unitholders, as may be amended from time to time (the “Trust Agreement”), unitholders in a Delaware statutory trust will have the same limitation of liability as do stockholders of private corporations organized under the General Corporation Law of the State of Delaware. The Trust Agreement confers substantially the same limited liability, and contains the same limited exceptions thereto, as would a limited partnership agreement for a Delaware limited partnership engaged in like transactions as the Trust. In addition, pursuant to the Trust Agreement, the Managing Owner of the Trust is liable for obligations of a Series in excess of that Series’ assets. Limited Owners do not have any such liability. The Managing Owner will make contributions to the Series of the Trust necessary to maintain at least a 1% interest in the aggregate capital, profits and losses of the combined Series of the Trust.
The Trust, in relation to the Series, has been organized to pool assets of investor funds for the purpose of trading in the United States (“U.S.”) and international markets for currencies, interest rates, stock indices, agricultural and energy products, precious and base metals and other commodities. The Trust, in relation to the Series, may also engage in futures contracts, forwards, option contracts and other interest in derivative instruments, including swap contracts (“Swaps”).
The Trust has seven (7) separate and distinct Series of Units issued and outstanding: Equinox Frontier Diversified Fund, Equinox Frontier Masters Fund, Equinox Frontier Long/Short Commodity Fund, Equinox Frontier Balanced Fund, Equinox Frontier Select Fund, Equinox Frontier Winton Fund, and Equinox Frontier Heritage Fund (each a “Series” and collectively, the “Series”). The Trust, with respect to the Series, may issue additional Series of Units.
The Trust, with respect to each Series:
maintains each Series of Units in three to six sub-classes—classes—Class 1, Class 1a, Class 2, Class 2a, Class 3, and Class 3a. Investors who have purchased Class 1 or Class 1a Units of any Series are charged a service fee of up to three percent (3.0%) annually of the NAV of each Unit purchased, for the benefit of selling agents selling such Class 1 or Class 1a Units.
The initial service fee, which is amortized monthly at an annual rate of up to three percent (3.0%) of the average daily NAV of Class 1 or Class 1a of such Series, is prepaid to the Managing Owner by each Series, and paid to the selling agents by the Managing Owner in the month following sale; provided, however, that investors who redeem all or a portion of their Class 1 and Class 1a Units of any Series during the first twelve (12) months following the effective date of their purchase are subject to a redemption fee of up to three percent (3.0%) of the NAV at which such investor redeemed to reimburse the Managing Owner for the then-unamortized balance of the prepaid initial service fee. With respect to Class 2 and Class 2a Units of any Series, the Managing Owner pays an ongoing service fee to selling agents of up to one half percent (0.5%) annually of the NAV of each Class 2 or Class 2a Unit (of which 0.25% will be charged to Limited Owners holding Class 2 Units of the Equinox Frontier Diversified Fund, and Equinox Frontier Masters Fund or Class 2a Units of the Equinox Frontier Long/Short Commodity Fund sold) until such Class 2 or Class 2a Units which are subject to the fee limitation are reclassified as Class 3 or Class 3a Units of the applicable Series. Class 1AP was created as a sub-class of Class 1 and it has been presented separately because the fees applicable to it are different from those applicable to Class 1. Currently the service fee is not charged to Class 1AP investors. The Managing Owner may also pay selling agents certain additional fees and expenses for administrative and other services rendered and expenses incurred by such selling agents; and |
The assets of any particular Series include only those funds and other assets that are paid to, held by or distributed to the Trust, with respect to the Series, on account of and for the benefit of that Series. Under the “Inter-Series Limitation on Liability” expressly provided for under Section 3804(a) of the Trust Act, separate and distinct records of the cash and equivalents, although pooled for maximizing returns, are maintained in the books and records of each Series.
As of March 31,June 30, 2015, the Trust, with respect to the Equinox Frontier Diversified Fund, Equinox Frontier Masters Fund, Equinox Frontier Select Fund, Equinox Frontier Winton Fund and Equinox Frontier Heritage Fund separates Units into three separate Classes—Class 1, Class 2, and Class 3. The Trust, with respect to the Equinox Frontier Balanced Fund and the Equinox Frontier Long/Short Commodity Fund separates Units into a maximum of six separate Classes—Class 1, Class 2, Class 3, Class 1a, Class 2a and Class 3a. It is expected that between 10% and 30% of each Series’ assets normally will be invested in one or more Trading Companies to be committed as margin for trading positions, but from time to time these percentages may be substantially more or less. The remainders of each Series’ assets are maintained at the Trust level for cash management. Each of the respective Series has invested monies into pooled cash management assets which have included purchases of U.S. Treasury Securities Each Series’ ownership in these investments is based on its percentage ownership in the pooled cash management assets on the reporting date.
As of March 31,June 30, 2015, Equinox Frontier Winton Fund has invested a portion of its assets in a single Trading Company, and a single Trading Advisor manages 100% of the assets invested in such Trading Company. Each of the remaining Series has invested a portion of its assets in several different Trading Companies and one or more Trading Advisors may manage the assets invested in such Trading Companies.
The Trust has entered into agreements, which provide for the indemnification of futures clearing brokers, currency trading companies, and commodity trading advisers, among others, against losses, costs, claims and liabilities arising from the performance of their individual obligations under such agreements, except for gross negligence or bad faith.
On November 26, 2014, the Trust’s portfolio management team approved an allocation change in an Emil Van Essen trading program that was not fully implemented as intended. As a result, certain series who invested in Emil Van Essen were not allocated sufficient gains and certain other series who invested in Emil Van Essen suffered greater losses. In January 2015, the Managing Owner determined to make a payment to the affected investors within the Equinox Frontier Balanced Fund, Equinox Frontier Diversified Fund and Equinox Frontier Long/Short Commodity Fund, in the aggregate amount of $1,247,752$1,211,610 to reimburse the effect of the missed gain or higher loss on such investors in the series, and such amount was recorded in the Statements of Changes in Owners’ Capital as Payment Made by the Managing Owner.
2. Significant Accounting Policies
The following are the significant accounting policies of the Series of the Trust.
Basis of Presentation—The Series of the Trust follow U.S. Generally Accepted Accounting Principles (“GAAP”), as established by the Financial Accounting Standards Board (the “FASB”), to ensure consistent reporting of financial condition, condensed schedules of investments, results of operations, changes in capital and cash flows. The Trust is an investment company following accounting and reporting guidance in Accounting Standards Codification (“ASC”) 946.
Consolidation—The Series, through investing in the Trading Companies, authorize certain Trading Advisors to place trades and manage assets at pre-determined investment levels. The Trading Companies were organized by the Managing Owner for the purpose of investing in commodities interests and derivative instruments, and have no operating income or expenses, except for trading income and expenses, all of which is allocated to the Series. Trading Companies in which a Series has a controlling and majority equity interest are consolidated by such Series. Investments in Trading Companies in which a Series does not have a controlling and majority interest are accounted for under the equity method, which approximates fair value. Fair value represents the proportionate share of the Series’ interest in the NAV in a Trading Company. The equity interest held by Series of the Trust is shown as investments in unconsolidated trading companies in the statements of financial condition. The income or loss attributable thereto in proportion of investment level is shown in the statements of operations as change in fair value of investments in unconsolidated trading companies.
As of March 31,June 30, 2015, the consolidated balance sheet of Equinox Frontier Balanced Fund included the assets and liabilities of its majority owned Trading Companies. These Trading Companies include Frontier Trading Company XIV, LLC, Frontier Trading Company XXIII, LLC, Frontier Trading Company XXIX, LLC and Frontier Trading Company XXXIV, LLC.
For the threesix months ended March 31,June 30, 2015, the consolidated income statement of Equinox Frontier Balanced Fund included the earnings of its majority owned Trading Companies listed above.
As of March 31,June 30, 2015, the consolidated balance sheet of Equinox Frontier Long/Short Commodity Fund included the assets and liabilities of its majority owned Trading Company, Frontier Trading Company XXXVII, LLC.
For the threesix months ended March 31,June 30, 2015, the consolidated income statement of Equinox Frontier Long/Short Commodity Fund included the earnings of its majority owned Trading Companies listed aboveabove.
As of March 31,June 30, 2015, the consolidated balance sheet of Equinox Frontier Diversified Fund included the assets and liabilities of its majority owned Frontier Trading Company I, LLC and, Frontier Trading Company XXXV, LLC.
For the threesix months ended March 31,June 30, 2015, the consolidated income statement of Equinox Frontier Diversified Fund included the earnings of its majority owned Trading Companies listed above.
As of and for the threesix months ended March 31,June 30, 2015, the consolidated balance sheet and income statement of Equinox Frontier Heritage Fund included the assets, liabilities and earnings of its majority owned Trading Company, Frontier Trading Company XXXIX, LLC.
As of and for the threesix months ended March 31,June 30, 2015, the consolidated balance sheet and income statement of Equinox Frontier Select Fund included the assets, liabilities and earnings of its majority owned Trading Company, Frontier Trading Company XV, LLC except for the earnings from January 1, 2015 to January 2, 2015.
Each of the Series has invested in Frontier Trading Company XXXVIII, LLC on the same basis as its ownership in the cash pool. Frontier Trading Company XXXVIII, LLC assets, liabilities and earnings are allocated to all the Series of the Trust based on their proportionate share of the cash pool.
Use of Estimates—The preparation of financial statements in conformity with GAAP may require the Managing Owner to make estimates and assumptions that affect the reported amounts of assets and liabilities and disclosure of contingent assets and liabilities at the date of the financial statements and the reported amounts of revenue and expenses during the reporting period. The valuation of swap contracts requires significant estimates as well as the valuation of certain other investments. Please refer to Note 3 for discussion of valuation methodology. Actual results could differ from these estimates, and such differences could be material.
Cash and Cash Equivalents—Cash and cash equivalents include cash and overnight investments in interest-bearing demand deposits held at banks with original maturities of threesix months or less. This cash is not restricted.
Interest Income—Aggregate interest income from all sources, including U.S. Treasuries and assets held at a futures commission merchant (“FCM”), of up to two percentage points of the aggregate percentage yield (annualized) of net asset value less any fair market value related to swaps, is paid to the Managing Owner by the Equinox Frontier Balanced Fund (Class 1, and Class 2 only), Equinox Frontier Select Fund, Equinox Frontier Winton Fund and Equinox Frontier Heritage Fund. For the Equinox Frontier Diversified Fund, Equinox Frontier Long/Short Commodity Fund, Equinox Frontier Masters Fund and Equinox Frontier Balanced Fund (Class 1a, Class 2a and Class 3a only), 20% of the total interest allocated to each Series is paid to the Managing Owner. All interest not paid to the Managing Owner is interest income to the Series, and shown net on the statement of operations.
U.S. Treasury Securities are pooled for purposes of maximizing returns on these assets to investors of all Series. Interest income from pooled cash management assets is recognized on the accrual basis and allocated daily to each Series based upon its daily proportion of ownership of the pool.
U.S. Treasury Securities—U.S. Treasury Securities are allocated to all Series of the Trust based on each Series’ percentage ownership in the pooled cash management assets as of the reporting date. They are reported at fair value as Level 1 inputs under ASC 820,Fair Value Measurements and Disclosures (“ASC 820”). The Series of the Trust valued U.S. Treasury Securities at fair value and recorded the daily change in value in the statements of operations as net unrealized gain/(loss) on U.S. Treasury securities. Accrued interest is reported on the statements of financial condition as interest receivable.
Receivable From Futures Commission Merchants—The Series of the Trust deposit assets with a FCM subject to CFTC regulations and various exchange and broker requirements. Margin requirements are satisfied by the deposit of cash with such FCM. The Trust, with respect to the Series, earns interest income on its assets deposited with the FCM.
Investment Transactions—Futures, options on futures, forward and swap contracts are recorded on a trade date basis and realized gains or losses are recognized when contracts are settled. Unrealized gains or losses on open contracts (the difference between contract trade price and market price) are reported in the statements of financial condition as open trade equity (deficit) as there exists a right of offset of unrealized gains or losses in accordance with ASC 210,Balance Sheet (“ASC 210”) and Accounting Standards Update (ASU) 2013-01,Balance Sheet (Topic 210).
Any change in net unrealized gain or loss from the preceding period is reported in the statements of operations. Fair value of exchange-traded contracts is based upon exchange settlement prices. Fair value of non-exchange-traded contracts is based on third party quoted dealer values on the interbank market. For U.S. Treasury securities, interest is recognized in the period earned and the instruments are marked-to-market daily based on third party information. Transaction costs are recognized as incurred and reflected separately in the statements of operations.
Foreign Currency Transactions—The Series’ functional currency is the U.S. dollar, however, they transact business in currencies other than the U.S. dollar. The Series do not isolate that portion of the results of operations resulting from changes in foreign exchange rates on investments from fluctuations arising from changes in market prices of securities held. Such fluctuations are included with the net realized or unrealized gain or loss from investments.
Allocation of Earnings—Each Series of the Trust may maintain between three or six classes of Units—Class 1, Class 2, Class 3, Class 1a, Class 2a and Class 3a). All classes have identical voting, dividend, liquidation and other rights and the same terms and conditions, except that fees charged to a Class or Series differ as described below. Revenues, expenses (other than expenses attributable to a specific class), and realized and unrealized trading gains and losses of each Series are allocated daily to Class 1, Class 1a, Class 2, Class 2a, Class 3 and Class 3a Units based on each Class’ respective owners’ capital balances as applicable to the classes maintained by the Series.
Each Series allocates funds to an affiliated Trading Company, or Companies, of the Trust. Each Trading Company allocates all of its daily trading gains or losses to the Series in proportion to each Series’ ownership trading level interest in the Trading Company, adjusted on a daily basis (except for Trading Advisors and other investments such as Swaps that are directly allocated to a specific series). The value of all open contracts and cash held at clearing brokers is similarly allocated to the Series in proportion to each Series’ funds allocated to the Trading Company, or Companies.
Investments and Swaps—The Trust, with respect to the Series, records investment transactions on a trade date basis and at fair value, with changes in fair value reported as a component of realized and unrealized gains/(losses) on investments in the statements of operations. Certain Series of the Trust strategically invest a portion or all of their assets in total return Swaps, selected at the discretion of the Managing Owner. Swaps are privately negotiated contracts designed to provide investment returns linked to those produced by one or more underlying investment products or indices. In a typical Swap, two parties agree to exchange the returns (or differentials in rates of return) earned or realized on one or more particular predetermined investments or instruments. The gross returns to be exchanged or “swapped” between the parties are calculated with respect to a “notional amount” (i.e., the amount of value of the underlying asset used in computing the particular interest rate, return, or other amount to be exchanged) in a particular investment, or in a “basket” of securities. The valuation of swap contracts requires significant estimates. Swap contracts are reported at fair value based upon daily reports from the counterparty. The Managing Ownercounterparty values the investments based on the CTA’s estimated position information on a same-trading day basis. The Managing Owner reviews and approves current day pricing of the CTA positions, as received from the counterparty which includes intra-day volatility and volume and daily index performance, that is used to determine a daily fair value NAV for the swap contracts. This fair value is corroborated by valuations provided by a third party pricing service on
a daily basis. The pricing service, utilizing proprietary model-intensive methodologies, selects and implements the pricing model appropriate for each swap valuation. The pricing service does not provide detail of the pricing model to management. The Managing Owner engages, via inquiry and review of methodology documentation, with the service provider to gain an understanding of the valuation model selected, the components of the model, both observable and unobservable; and quality control testing procedures in place.
Income Taxes—The Trust, with respect to the Series, applies the provisions of ASC 740Income Taxes (“ASC 740”), which provides guidance for how uncertain tax positions should be recognized, measured, presented and disclosed in the financial statements. This interpretation also provides guidance on derecognition, classification, interest and penalties, accounting in interim periods and disclosure. ASC 740 requires the evaluation of tax positions taken or expected to be taken in the course of preparing the Trust, with respect to the Series’, financial statements to determine whether the tax positions are “more-likely-than-not” of being sustained by the applicable tax authority. Tax positions with respect to tax at the Trust’s level not deemed to meet the “more-likely-than-not” threshold would be recorded as a tax benefit or expense in the current year. The Managing Owner has concluded there is no tax expense, interest or penalties to be recorded by the Trust, with respect to the Series. The 2011 through 2014 tax years generally remain subject to examination by U.S. federal and most state tax authorities.
In the opinion of the Managing Owner, (i) the Trust, with respect to the Series, is treated as a partnership for federal income tax purposes and, assuming that at least 90% of the gross income of the Trust constitutes “qualifying income” within the meaning of Section 7704(d) of the Code, the Trust is not a publicly traded partnership treated as a corporation, and (ii) the discussion set forth in the Prospectus under the heading “Federal Income Tax Consequences” correctly summarizes the material federal income tax consequences as of the date of the Prospectus to potential U.S. Limited Owners of the purchase, ownership and disposition of Units of the Trust.
Fees and Expenses—All management fees, incentive fees, service fees and trading fees of the Trust, with respect to the Series, are paid to the Managing Owner. It is the responsibility of the Managing Owner to pay all Trading Advisor management and incentive fees, selling agent service fees and all other operating expenses and continuing offering costs of the Trust, with respect to the Series.
Service Fees—The Trust may maintain each Series of Units in three to six sub-classes—classes—Class 1, Class 1a, Class 2, Class 2a, Class 3, and Class 3a. Investors who have purchased Class 1 or Class 1a Units of any Series are charged a service fee of up to three percent (3.0%) annually of the NAV of each Unit purchased, for the benefit of selling agents selling such Class 1 or Class 1a Units. The initial service fee, which is amortized monthly at an annual rate of up to three percent (3.0%) of the average daily NAV of Class 1 or Class 1a of such Series, is prepaid to the Managing Owner by each Series, and paid to the selling agents by the Managing Owner in the month following sale; provided, however, that investors who redeem all or a portion of their Class 1 or Class 1a Units of any Series during the first twelve (12) months following the effective date of their purchase are subject to a redemption fee of up to three percent (3.0%) of the NAV at which such investor redeemed to reimburse the Managing Owner for the then-unamortized balance of the prepaid initial service fee. With respect to Class 2 and Class 2a Units of any Series, the Managing Owner pays an ongoing service fee to selling agents of up to one half percent (0.5%) annually of the NAV of each Class 2 or Class 2a Unit (of which 0.25% will be charged to Limited Owners holding Class 2 Units of the Equinox Frontier Diversified Fund and Equinox Frontier Masters Fund or Class 2a Units of the Equinox Frontier Long/Short Commodity Fund sold) until such Class 2 or Class 2a Units which are subject to the fee limitation are reclassified as Class 3 or Class 3a Units of the applicable Series for administrative purposes. The Managing Owner may also pay selling agents certain additional fees and expenses for administrative and other services rendered and expenses incurred by such selling agents.
These service fees are part of the offering costs of the Trust, with respect to the Series, which include registration and filing fees, legal and blue sky expenses, accounting and audit, printing, marketing support and other offering costs which are borne by the Managing Owner. With respect to the service fees, the initial service fee (for the first 12 months) relating to a purchase of Class 1 and Class 1a Units by an investor is prepaid by the Managing Owner to the relevant selling agent in the month following such purchase and is reimbursed for such payment by the Series monthly in arrears in an amount based upon a corresponding percentage of NAV, calculated daily. Consequently, the Managing Owner bears the risk of the downside and the benefit of the upside potential of any difference between the amount of the initial service fee prepaid by it and the amount of the reimbursement thereof, which may result from variations in NAV over the following 12 months.
Pending Owner Additions—Funds received for new subscriptions and for additions to existing owner interests are recorded as capital additions at the NAV per unit of the second business day following receipt.
Recently Adopted Accounting Pronouncements—In September of 2013, FASB issued ASU 2013-08 to (i) modify Topic 946 for determining whether an entity is an investment company; (ii) update the measurement requirements for noncontrolling interests in other investment companies; and (iii) require additional disclosures for investment companies under GAAP. This guidance is effective for annual and interim periods beginning on or after December 15, 2013. An entity should provide the disclosures required by those amendments retrospectively for all comparative periods presented. The adoption of this guidance did not have a material impact on the financial positions or results of operations.
Recently Issued Accounting Pronouncements—Recently Issued Accounting Pronouncements—In May of 2015, the Financial Accounting Standards Board (FASB) issued Accounting Standards Update (ASU) 2015-07,Fair Value Measurement (Topic 820): Disclosures for Investments in Certain Entities That Calculate Net Asset Value per Share (or Its Equivalent) (a consensus of the FASB Emerging Issues Task Force). This ASU removes the requirement to categorize within the fair value hierarchy investments for which fair values are measured at NAV using the practical expedient. The ASU also removes the requirement to make certain disclosures for all investments that are eligible to be measured at fair value using the NAV per share practical expedient. Rather, those disclosures are limited to investments for which the entity has elected to measure the fair value using that practical expedient. The ASU is effective for public business entities for fiscal years beginning after December 15, 2015 and interim periods within those fiscal years. For all other entities, the ASU is effective for fiscal years beginning after December 15, 2016 and interim periods within those fiscal years. A reporting entity should apply the amendments retrospectively to all periods presented. Earlier application is permitted.
In February, 2015, the FASB issued Accounting Standards Update (ASU)No. 2015-02, Consolidation (Topic 810): Amendments to the Consolidation Analysis. ASU 2015-02 provides guidance on the consolidation evaluation for reporting organizations that are required to evaluate whether they should consolidate certain legal entities such as limited partnerships, limited liability corporations, and securitization structures (collateralized debt obligations, collateralized loan obligations, and mortgage-backed security transactions). ASU 2015-02 is effective for periods beginning after December 15, 2015. The adoption of ASU 2015-02 is not expected to have a material effect on the Trust’s financial statements. Early adoption is
permitted. In May 2014 the FASB issued a final standard on revenue from contracts with customers. The standard, issued as FASB ASU 2014-09, “Revenue from Contracts with Customers” (“ASU 2014-09”), outlines a single comprehensive model for entities to use in accounting for revenue arising from contracts with customers and supersedes most current revenue recognition guidance. The ASU is effective for interim and annual reporting periods beginning after December 15, 2016. Early adoption is not permitted. A full retrospective or modified retrospective approach may be taken to adopt the guidance in the ASU. The Trust is currently evaluating the impact of the provisions of ASU 2014-09 on its consolidated financial position, results of operations and related disclosures.
Subsequent Events—The Trust, with respect to the Series, follows the provisions of ASC 855,Subsequent Events, which establishes general standards of accounting for and disclosure of events that occur after the balance sheet date and up through the date the financial statements are issued.
3. Fair Value Measurements
In connection with the valuation of investments the Series apply ASC 820,Fair Value Measurement (“ASC 820”). ASC 820 provides clarification that when a quoted price in an active market for the identical asset or liability is not available, a reporting entity is required to measure fair value using certain techniques. ASC 820 also clarifies that when estimating the fair value of an asset or liability, a reporting entity is not required to include a separate input or adjustment to other inputs relating to the existence of a restriction that prevents the transfer of an asset or liability. ASC 820 also clarifies that both a quoted price in an active market for the identical asset or liability at the measurement date and the quoted price for the identical asset or liability when traded as an asset in an active market when no adjustments to the quoted price of the asset are required are Level 1 fair value measurements.
Level 1 Inputs
Unadjusted quoted prices in active markets for identical financial assets that the reporting entity has the ability to access at the measurement date.
Level 2 Inputs
Inputs other than quoted prices included in Level 1 that are observable for the financial assetsasset or liabilities, either directly or indirectly. These might include quoted prices for similar financial assets in active markets, quoted prices for identical or similar financial assets in markets that are not active, inputs other than quoted prices that are observable for the financial assetsasset or inputs that are derived principally from or corroborated by market data by correlation or other means.
Level 3 Inputs
Unobservable inputs for determining the fair value of financial assets that reflect an entity’s own assumptions about the assumptions that market participants would use in pricing the financial asset.
The Trust, with respect to the Series, uses the following methodologies to value instruments within its financial asset portfolio at fair value:
Trading Securities. These instruments include U.S. Treasury securities and open trade equity positions (futures contracts) that are actively traded on public markets with quoted pricing for corroboration. U.S. Treasury securities and futures contracts, are reported at fair value using Level 1 inputs. Trading securities instruments further include open trade equity positions (trading options and currency forwards) that are quoted prices for identical or similar assets that are not traded on active markets. Trading options and currency forwards are reported at fair value using Level 2 inputs.
Swap Contracts. Certain Series of the Trust strategically invest a portion or all of their assets in total return Swaps, selected at the direction of the Managing Owner. Swaps are privately negotiated contracts designed to provide investment returns linked to those produced by one or more investment products or indices. In a typical Swap, two parties agree to exchange the returns (or differentials in rates of return) earned or realized on one or more particular predetermined investments or instruments. The gross returns to be exchanged or “swapped” between the parties are calculated with respect to a “notional amount” (i.e., the amount of value of the underlying asset used in computing the particular interest rate, return, or other amount to be exchanged) in a particular investment, or in a “basket” of securities. Swap contracts are reported at fair value basedbasis upon daily reports from the counterparty. The Managing Ownercounterparty values the investments based on the CTA’s estimated position information on a same-trading day basis. The Managing Owner reviews and approves current day pricing of the CTA positions, as received from the
counterparty which includes intra-day volatility and volume and daily index performance, that is used to determine a daily fair value NAV for the swap contracts. The fair value is corroborated through the use of a third party pricing service (“pricing service”). The valuation requires significant estimates utilizing Level 3 inputs, corroborated by management through the use of a third party pricing service.service (“pricing service”). The pricing service, utilizing proprietary model-intensive methodologies, selects and implements the pricing model appropriate for each swap valuation. The pricing service does not provide detail of the pricing model to management. The Managing Owner engages, via inquiry and review of methodology documentation, with the service provider to gain an understanding of the valuation model selected, the components of the model, both observable and unobservable,unobservable; and quality control testing procedures in place. The pricing service’s methodology includes performance of tolerance testing on its valuation
models to ensure consistency and reasonableness of the values derived. The tolerance testing includes valuing the components of the product separately, e.g.i.e. underlying asset, volatility, financing rates, and so forth. The tolerance testing is part of the initial valuation setup and the ongoing daily valuation process. The pricing service also has several layers of quality control including: engineering / reverse engineering process to understand each Swap and its subcomponent parts fully; comparative analysis against other valuations performed with similar composition and characteristics; review of output valuation against expectations based on observable price movements of underlying futures; and lastly, periodic review by senior a senior financial engineer to ensure the design and function of the model is stable and performs as expected.
The Managing Owner has chartered a valuation committee to provide oversight of the valuation process for the Series. The valuation committee meets at least monthly to discuss the valuation process and any valuation issues that may arise. The valuation committee is comprised of senior members of the Managing Owner’s management team with varying areas of expertise that add value to the committee. The valuation committee reports to both the Managing Owner’s Management CommitteeCommitee and the Trust’s Executive Committee. The committee further remains in communication with the Managing Owner’s Due Diligence Committee that provides ongoing counterparty risk monitoring of the swap counterparties. The committee’s designeecommittee monitors daily pricing provided by the swap counterparty and daily valuation provided by the third party pricing service. The valuation committee may request a price challenge if the daily valuation provided by the counterparty valuations differs significantly from the valuation obtained by the pricing service. The Managing Owner’s valuation committee monitors some additional input factors such as liquidity, volatility, and counterparty risk in order to further review the valuations provided by the pricing service.
Investment in Unconsolidated Trading Companies. This investment represents the fair value of the allocation of cash, futures, forwards, options and swaps to each respective Series relative to its trading allocations from unconsolidated Trading Companies. AThe Series may redeem itstheir investment in any of the Trading Companiestrading companies on a daily basis at the Trading Company’s stated net asset value. Each ofvalue and therefore the inputs qualify for Level 2. However, as the Series, all of which are under the same management as the Trading Companies, hashave access to the underlying positions of the Trading Companies, and as such, the level determination isare reflected on that look-through basis. Any redemption of an investmentAs such, the Series report investments in aunconsolidated Trading Company classified as Level 3 will reflect that classificationCompanies at fair value using the corresponding inputs of the underlying investment owned bysecurities of the Trading Companies which results in the Series reporting the corresponding Level determination from the inputs of the Trading Company.
The following table summarizes the instruments that comprise the Trust, with respect to the Series, financial asset portfolio, by Series, measured at fair value on a recurring basis as of March 31,June 30, 2015 and December 31, 2014 segregated by the level of valuation inputs within the fair value hierarchy utilized to measure fair value:
March 31, 2015 | Level 1 Inputs | Level 2 Inputs | Level 3 Inputs | Total Fair Value | ||||||||||||||||||||||||||||
June 30, 2015 | Level 1 Inputs | Level 2 Inputs | Level 3 Inputs | Total Fair Value | ||||||||||||||||||||||||||||
Equinox Frontier Diversified Fund | ||||||||||||||||||||||||||||||||
Investment in Unconsolidated Trading Companies | $ | 6,410,903 | $ | 54,069 | $ | — | $ | 6,464,972 | $ | 5,899,789 | $ | 298,675 | $ | — | $ | 6,198,464 | ||||||||||||||||
Open Trade Equity (Deficit) | 2,569,506 | — | — | 2,569,506 | (571,551 | ) | — | — | (571,551 | ) | ||||||||||||||||||||||
Options Purchased | — | 325,003 | — | 325,003 | — | 374,470 | — | 374,470 | ||||||||||||||||||||||||
Options Written | — | (107,167 | ) | — | (107,167 | ) | — | (219,660 | ) | — | (219,660 | ) | ||||||||||||||||||||
Swap Contracts | — | — | 9,559,124 | 9,559,124 | — | — | 7,615,169 | 7,615,169 | ||||||||||||||||||||||||
U.S. Treasury Securities | 36,701,926 | — | — | 36,701,926 | 29,071,240 | — | — | 29,071,240 | ||||||||||||||||||||||||
Equinox Frontier Masters Fund | ||||||||||||||||||||||||||||||||
Investment in Unconsolidated Trading Companies | 10,877,100 | 38,555 | — | 10,915,655 | 8,598,866 | 168,654 | — | 8,767,520 | ||||||||||||||||||||||||
U.S. Treasury Securities | 15,541,089 | — | — | 15,541,089 | 11,913,754 | — | — | 11,913,754 | ||||||||||||||||||||||||
Equinox Frontier Long/Short Commodity Fund | ||||||||||||||||||||||||||||||||
Swap Contracts | — | — | 5,301,972 | 5,301,972 | — | — | 4,304,209 | 4,304,209 | ||||||||||||||||||||||||
Investment in Unconsolidated Trading Companies | 2,974,731 | 26,190 | — | 3,000,921 | 3,516,988 | 380,006 | — | 3,896,994 | ||||||||||||||||||||||||
U.S. Treasury Securities | 10,415,223 | — | — | 10,415,223 | 6,743,330 | — | — | 6,743,330 | ||||||||||||||||||||||||
Equinox Frontier Balanced Fund | ||||||||||||||||||||||||||||||||
Open Trade Equity (Deficit) | 268,978 | — | — | 268,978 | (778,963 | ) | — | — | (778,963 | ) | ||||||||||||||||||||||
Swap Contracts | — | — | 23,473,632 | 23,473,632 | — | — | 18,491,634 | 18,491,634 | ||||||||||||||||||||||||
Investment in Unconsolidated Trading Companies | 17,317,496 | 125,352 | — | 17,442,848 | 13,892,904 | 440,892 | — | 14,333,796 | ||||||||||||||||||||||||
U.S. Treasury Securities | 56,735,098 | — | — | 56,735,098 | 47,350,232 | — | — | 47,350,232 | ||||||||||||||||||||||||
Equinox Frontier Select Fund | — | — | ||||||||||||||||||||||||||||||
Open Trade Equity (Deficit) | 958,673 | — | — | 958,673 | 55,956 | — | — | 55,956 | ||||||||||||||||||||||||
Investment in Unconsolidated Trading Companies | 227,712 | — | 4,505,757 | 4,733,469 | 373,618 | — | 3,639,651 | 4,013,269 | ||||||||||||||||||||||||
U.S. Treasury Securities | 3,598,631 | — | — | 3,598,631 | 2,415,549 | — | — | 2,415,549 | ||||||||||||||||||||||||
Equinox Frontier Winton Fund | ||||||||||||||||||||||||||||||||
Investment in Unconsolidated Trading Companies | 8,846,299 | 126,373 | — | 8,972,672 | 6,544,957 | 204,082 | — | 6,749,039 | ||||||||||||||||||||||||
U.S. Treasury Securities | 32,794,705 | — | — | 32,794,705 | 25,617,478 | — | 25,617,478 | |||||||||||||||||||||||||
Equinox Frontier Heritage Fund | ||||||||||||||||||||||||||||||||
Swap Contracts | — | — | 9,600,330 | 9,600,330 | — | — | 7,809,251 | 7,809,251 | ||||||||||||||||||||||||
Investment in Unconsolidated Trading Companies | 1,701,180 | 22,727 | — | 1,723,907 | 1,361,243 | 36,800 | — | 1,398,043 | ||||||||||||||||||||||||
U.S. Treasury Securities | 7,403,953 | — | — | 7,403,953 | 5,706,384 | — | — | 5,706,384 | ||||||||||||||||||||||||
December 31, 2014 | Level 1 Inputs | Level 2 Inputs | Level 3 Inputs | Total Fair Value | ||||||||||||
Equinox Frontier Diversified Fund | ||||||||||||||||
Investments in Unconsolidated Trading Companies | $ | 6,631,887 | $ | (37,508 | ) | $ | — | $ | 6,594,379 | |||||||
Open Trade Equity (Deficit) | 3,171,968 | 43,238 | — | 3,215,206 | ||||||||||||
Options Purchased | — | 288,413 | — | 288,413 | ||||||||||||
Options Written | — | (253,018 | ) | — | (253,018 | ) | ||||||||||
Swap Contracts | — | — | 6,570,408 | 6,570,408 | ||||||||||||
U.S. Treasury Securities | 31,051,659 | — | — | 31,051,659 | ||||||||||||
Equinox Frontier Masters Fund | ||||||||||||||||
Investments in Unconsolidated Trading Companies | 7,942,166 | (40,188 | ) | — | 7,901,978 | |||||||||||
U.S. Treasury Securities | 16,217,173 | — | — | 16,217,173 | ||||||||||||
Equinox Frontier Long/Short Commodity Fund | ||||||||||||||||
Investments in Unconsolidated Trading Companies | 3,789,466 | 25,388 | — | 3,814,854 | ||||||||||||
Swap Contracts | — | — | 3,633,060 | 3,633,060 | ||||||||||||
U.S. Treasury Securities | 8,191,519 | — | — | 8,191,519 | ||||||||||||
Equinox Frontier Balanced Fund | ||||||||||||||||
Open Trade Equity (Deficit) | 3,717,291 | (419,742 | ) | — | 3,297,549 | |||||||||||
Investments in Unconsolidated Trading Companies | 18,354,685 | (10,758 | ) | — | 18,343,927 | |||||||||||
Swap Contracts | — | — | 18,246,954 | 18,246,954 | ||||||||||||
U.S. Treasury Securities | 41,625,860 | — | — | 41,625,860 | ||||||||||||
Equinox Frontier Select Fund | ||||||||||||||||
Investments in Unconsolidated Trading Companies | 4,591,569 | (28,926 | ) | 3,539,498 | 8,102,141 | |||||||||||
U.S. Treasury Securities | 6,476,939 | — | — | 6,476,939 | ||||||||||||
Equinox Frontier Winton Fund | ||||||||||||||||
Investments in Unconsolidated Trading Companies | 7,656,170 | (176,512 | ) | — | 7,479,658 | |||||||||||
U.S. Treasury Securities | 29,593,974 | — | 29,593,974 | |||||||||||||
Equinox Frontier Heritage Fund | ||||||||||||||||
Investments in Unconsolidated Trading Companies | 1,576,952 | (33,566 | ) | — | 1,543,386 | |||||||||||
Swap Contracts | — | — | 7,540,465 | 7,540,465 | ||||||||||||
U.S. Treasury Securities | 6,796,392 | — | 6,796,392 | |||||||||||||
The changes in Level 3 assets measured at fair value on a recurring basis are summarized in the following tables. Swap contract asset gains and losses (realized/unrealized) included in earnings are classified in “realized and unrealized gain (loss) on investments – net unrealized gain/(loss) on swap contracts” on the statements of operations. Investment in unconsolidated trading company asset gains and losses (realized/unrealized) included in earnings are classified in “Change in fair value of investments in unconsolidated trading companies.” During the threesix months ended March 31,June 30, 2015 and year ended December 31, 2014, all identified Level 3 assets are components of the Equinox Frontier Diversified Fund, Equinox Frontier Long/Short Commodity Fund, Equinox Frontier Balanced Fund, Equinox Frontier Select Fund, and Equinox Frontier Heritage Fund.
For the ThreeSix Months Ended March 31,June 30, 2015
Swaps:
| Equinox Frontier Diversified Fund | Equinox Frontier Long/Short Commodity Fund | Equinox Frontier Balanced Fund | Equinox Frontier Diversified Fund | Equinox Frontier Long/Short Commodity Fund | Equinox Frontier Balanced Fund | |||||||||||||||||||
Balance of recurring Level 3 assets as of January 1, 2015 | $ | 6,570,408 | $ | 3,633,060 | $ | 18,246,954 | $ | 6,570,408 | $ | 3,633,060 | $ | 18,246,954 | ||||||||||||
Total gains or losses (realized/unrealized): | ||||||||||||||||||||||||
Included in earnings-realized | — | — | — | — | ||||||||||||||||||||
Included in earnings-unrealized | 2,988,716 | 668,912 | 5,226,678 | 1,044,761 | (328,851 | ) | 244,680 | |||||||||||||||||
Purchases of investments | — | 1,000,000 | — | — | 1,000,000 | — | ||||||||||||||||||
Sales of investments | — | — | — | — | ||||||||||||||||||||
Change in ownership allocation of total return swaps | — | — | — | — | — | — | ||||||||||||||||||
Transfers in and/or out of Level 3 | — | — | — | — | — | — | ||||||||||||||||||
|
|
|
|
|
| |||||||||||||||||||
Balance of recurring Level 3 assets as of March 31, 2015 | $ | 9,559,124 | $ | 5,301,972 | $ | 23,473,632 | ||||||||||||||||||
Balance of recurring Level 3 assets as of June 30, 2015 | $ | 7,615,169 | $ | 4,304,209 | $ | 18,491,634 | ||||||||||||||||||
|
|
|
|
|
| |||||||||||||||||||
| Equinox Frontier Heritage Fund | Equinox Frontier Heritage Fund | |||||||
Balance of recurring Level 3 assets as of January 1, 2015 | $ | 7,540,465 | $ | 7,540,465 | ||||
Total gains or losses (realized/unrealized): | ||||||||
Included in earnings-realized | — | — | ||||||
Included in earnings-unrealized | 2,059,865 | 268,786 | ||||||
Purchases of investments | — | — | ||||||
Sales of investments | — | — | ||||||
Change in ownership allocation of total return swaps | — | — | ||||||
Transfers in and/or out of Level 3 | — | — | ||||||
|
| |||||||
Balance of recurring Level 3 assets as of March 31, 2015 | $ | 9,600,330 | ||||||
Balance of recurring Level 3 assets as of June 30, 2015 | $ | 7,809,251 | ||||||
|
| |||||||
Investments in Unconsolidated Trading Companies:
| Equinox Frontier Select Fund | ||||||||
| Equinox Frontier Select Fund | ||||||||
Balance of recurring Level 3 assets as of January 1, 2015 | $ | 3,539,498 | $ | 3,539,498 | ||||
Change in fair value of investments in unconsolidated trading companies | 966,259 | 100,153 | ||||||
Proceeds from sales of investments of unconsolidated trading companies | — | — | ||||||
Purchases of investments of unconsolidated trading companies | — | — | ||||||
Change in ownership allocation | — | — | ||||||
Transfers in and/or out of Level 3 | — | — | ||||||
|
| |||||||
Balance of recurring Level 3 assets as of March 31, 2015 | $ | 4,505,757 | ||||||
Balance of recurring Level 3 assets as of June 30, 2015 | $ | 3,639,651 | ||||||
|
| |||||||
For the Year Ended December 31, 2014
Swaps:
| Equinox Frontier Diversified Fund | Equinox Frontier Long/Short Commodity Fund | Equinox Frontier Balanced Fund | Equinox Frontier Diversified Fund | Equinox Frontier Long/Short Commodity Fund | Equinox Frontier Balanced Fund | |||||||||||||||||||
Balance of recurring Level 3 assets as of January 1, 2014 | $ | 3,437,632 | $ | 2,456,546 | $ | 10,122,003 | $ | 3,437,632 | $ | 2,456,546 | $ | 10,122,003 | ||||||||||||
Total gains or losses (realized/unrealized): | ||||||||||||||||||||||||
Included in earnings-realized | — | — | — | — | ||||||||||||||||||||
Included in earnings-unrealized | 3,132,776 | 1,176,514 | 8,124,951 | 3,132,776 | 1,176,514 | 8,124,951 | ||||||||||||||||||
Purchases of investments | — | — | — | — | — | — | ||||||||||||||||||
Sales of investments | — | — | — | — | ||||||||||||||||||||
Change in ownership allocation of total return swaps | — | — | — | — | — | — | ||||||||||||||||||
Transfers in and/or out of Level 3 | — | — | — | — | — | — | ||||||||||||||||||
|
|
|
|
|
| |||||||||||||||||||
Balance of recurring Level 3 assets as of December 31, 2014 | $ | 6,570,408 | $ | 3,633,060 | $ | 18,246,954 | $ | 6,570,408 | $ | 3,633,060 | $ | 18,246,954 | ||||||||||||
|
|
|
|
|
| |||||||||||||||||||
| Equinox Frontier Heritage Fund | ||||||||
| Equinox Frontier Heritage Fund |
| |||||||
Balance of recurring Level 3 assets as of January 1, 2014 | $ | 5,435,184 | $ | 5,435,184 | ||||
Total gains or losses (realized/unrealized): | ||||||||
Included in earnings-realized | — | — | ||||||
Included in earnings-unrealized | 2,105,281 | 2,105,281 | ||||||
Purchases of investments | — | — | ||||||
Sales of investments | — | — | ||||||
Change in ownership allocation of total return swaps | — | — | ||||||
Transfers in and/or out of Level 3 | — | — | ||||||
|
| |||||||
Balance of recurring Level 3 assets as of December 31, 2014 | $ | 7,540,465 | $ | 7,540,465 | ||||
|
| |||||||
Investments in Unconsolidated Trading Companies:
| Equinox Frontier Select Fund | ||||||||
| Equinox Frontier Select Fund | ||||||||
Balance of recurring Level 3 assets as of January 1, 2014 | $ | 2,415,637 | $ | 2,415,637 | ||||
Change in fair value of investments in unconsolidated trading companies | 1,123,861 | 1,123,861 | ||||||
Proceeds from sales of investments of unconsolidated trading companies | — | — | ||||||
Purchases of investments of unconsolidated trading companies | — | — | ||||||
Change in ownership allocation | — | — | ||||||
Transfers in and/or out of Level 3 | — | — | ||||||
|
| |||||||
Balance of recurring Level 3 assets as of December 31, 2014 | $ | 3,539,498 | $ | 3,539,498 | ||||
|
| |||||||
The Series of the Trust assess the levels of the investments at each measurement date, and transfers between levels are recognized on the actual date of the event or change in circumstances that caused the transfer in accordance with the Series’ accounting policy regarding the recognition of transfers between levels of the fair value hierarchy. During the threesix months ended March 31,June 30, 2015 and year ended December 31, 2014, the Trust did not transfer any assets between Levels 1, 2 or 3.
The amounts reflected in the change in ownership allocation result from changes in ownership in the underlying Trading Companies at the Series level, which have resulted in changes in consolidation or de-consolidation by the Series. The ownership in the Trading Companies is accounted for under the equity method, which approximates fair value.
The total change in unrealized appreciation (depreciation) included in the statements of operations attributable to level 3 investments still held at March 31,June 30, 2015.
| Equinox Frontier Diversified Fund | Equinox Frontier Long/Short Commodity Fund | Equinox Frontier Balanced Fund (3) | Equinox Frontier Heritage Fund | |||||||||||||
Swaps | $ | 2,988,715 | $ | 668,912 | $ | 5,226,678 | $ | 2,059,865 | ||||||||
| Equinox Frontier Diversified Fund | Equinox Frontier Long/Short Commodity Fund | Equinox Frontier Balanced Fund | Equinox Frontier Heritage Fund | |||||||||||||
Swaps | $ | 1,044,760 | $ | (328,851 | ) | $ | 244,680 | $ | 268,786 | |||||||
The total change in unrealized appreciation (depreciation) included in the statements of operations attributable to level 3 investments still held at December 31, 2014.
| Equinox Frontier Diversified Fund | Equinox Frontier Long/Short Commodity Fund | Equinox Frontier Balanced Fund (3) | Equinox Frontier Heritage Fund | |||||||||||||
Swaps | $ | 3,132,776 | $ | 1,176,514 | $ | 8,120,996 | $ | 2,105,281 | ||||||||
| Equinox Frontier Diversified Fund | Equinox Frontier Long/Short Commodity Fund | Equinox Frontier Balanced Fund | Equinox Frontier Heritage Fund | |||||||||||||
Swaps | $ | 3,132,776 | $ | 1,176,514 | $ | 8,120,996 | $ | 2,105,281 | ||||||||
4. Swaps
In addition to authorizing Trading Advisors to manage pre-determined investment levels of futures and forward contracts, certain Series of the Trust will strategically invest a portion or all of their assets in total return Swaps, selected at the direction of the Managing Owner. Total return Swaps are privately negotiated contracts designed to provide investment returns linked to those produced by one or more investment products or indices. In a typical total return Swap, two parties agree to exchange the returns (or differentials in rates of return) earned or realized on one or more particular predetermined investments or instruments. The gross returns to be exchanged or “swapped” between the parties are calculated with respect to a “notional amount” (i.e., the amount or value of the underlying asset used in computing the particular interest rate, return, or other amount to be exchanged) in a particular investment, or in a “basket” of securities.
Each Series’ investment in Swaps will likely differ substantially over time due to cash flows, portfolio management decisions and market movements. The Swaps serve to diversify the investment holdings of each Series and to provide access to programs and advisors that would not be otherwise available to the Series, and are not used for hedging purposes.
The Managing Owner follows a procedure in selecting well-established financial institutions which the Managing Owner, in its sole discretion, considers to be reputable, reliable, financially responsible and well established to act as swap counterparties. The procedure includes due diligence review of documentation on all new and existing financial institution counterparties prior to initiation of the relationship, and quarterly ongoing review during the relationship, to ensure that counterparties meet the Managing Owner’s minimum credit requirements, the counterparty average rating being no less than an investment grade rating as defined by the rating agencies. As
of March 31,June 30, 2015 and December 31, 2014, approximately 7.9% or $25,062,0618.3% and 4.9% or $14,117,887,7.0%, respectively, of the Trust’s assets were investeddeposited with over-the-counter counterparties in order to initiate and maintain Swaps and is recorded as Swap Contracts, at fair valuecash and cash equivalents on the Statements of Financial Condition of the Trust. This cash held with the counterparty is not restricted.
The Series may strategically invest assets in one or more Swaps linked to certain underlying investments or indices at the direction of the Managing Owner. The Trading Company in which the assets of these Series will be invested will not own any of the investments or indices referenced by any Swap entered into by these Series. In addition, neither the swap counterparty to the Trading Company of these Series nor any advisor referenced by any such Swap is a Trading Advisor to these Series.
The Series had invested in the following Swaps as of and for the threesix months ended March 31,June 30, 2015:
| Equinox Frontier Balanced Fund | Equinox Frontier Diversified Fund | Equinox Frontier Long/Short Commodity Fund | Equinox Frontier Heritage Fund | Equinox Frontier Balanced Fund | Equinox Frontier Diversified Fund | Equinox Frontier Long/Short Commodity Fund | Equinox Frontier Heritage Fund | |||||||||||||||||
| Total Return Swap | Total Return Swap | Total Return Swap | Total Return Swap | Total Return Swap | Total Return Swap | Total Return Swap | Total Return Swap | |||||||||||||||||
Counterparty | DeutscheBank AG | DeutscheBank AG | DeutscheBank AG | DeutscheBank AG | DeutscheBank AG | DeutscheBank AG | DeutscheBank AG | DeutscheBank AG | ||||||||||||||||
Notional Amount | $70,910,098 | $38,500,000 | $12,090,513 | $17,663,283 | $ | 62,910,098 | $ | 30,500,000 | $ | 10,090,513 | $ | 15,663,283 | ||||||||||||
Termination Date | 8/2/2018 | 8/2/2018 | 8/7/2018 | 3/26/2018 | 8/2/2018 | 8/2/2018 | 8/7/2018 | 3/26/2018 | ||||||||||||||||
Cash Collateral | $9,600,000 | $3,400,000 | $3,880,000 | $5,993,000 | $ | 9,600,000 | $ | 3,400,000 | $ | 3,880,000 | $ | 5,993,000 | ||||||||||||
Swap Value | $13,873,632 | $6,159,124 | $1,421,972 | $3,607,330 | $ | 8,891,634 | $ | 4,215,169 | $ | 424,209 | $ | 1,816,251 | ||||||||||||
Investee Returns | Total Returns | Total Returns | Total Returns | Total Returns | Total Returns | Total Returns | Total Returns | Total Returns | ||||||||||||||||
Realized Gain/(Loss) | $0 | $0 | $0 | $0 | $ | 0 | $ | 0 | $ | 0 | $ | 0 | ||||||||||||
|
|
|
|
|
|
|
| |||||||||||||||||
Change in Unrealized Gain/(Loss) | $5,226,678 | $2,988,715 | $668,912 | $2,059,865 | $ | 244,680 | $ | 1,044,760 | ($ | 328,851 | ) | $ | 268,786 | |||||||||||
|
|
|
|
|
|
|
| |||||||||||||||||
Fair Value as of 12/31/2014 | $23,473,632 | $9,559,124 | $5,301,972 | $9,600,330 | ||||||||||||||||||||
Fair Value as of 6/30/2015 | $ | 18,491,634 | $ | 7,615,169 | $ | 4,304,209 | $ | 7,809,251 | ||||||||||||||||
|
|
|
|
|
|
|
| |||||||||||||||||
The Series havehad invested in the following Swaps as of and for the year ended December 31, 2014:
| Equinox Frontier Balanced Fund | Equinox Frontier Diversified Fund | Equinox Frontier Long/Short Commodity Fund | Equinox Frontier Heritage Fund | Equinox Frontier Balanced Fund | Equinox Frontier Diversified Fund | Equinox Frontier Long/Short Commodity Fund | Equinox Frontier Heritage Fund | |||||||||||||||||
| Total Return Swap | Total Return Swap | Total Return Swap | Total Return Swap | Total Return Swap | Total Return Swap | Total Return Swap | Total Return Swap | |||||||||||||||||
Counterparty | DeutscheBank AG | DeutscheBank AG | DeutscheBank AG | DeutscheBank AG | DeutscheBank AG | DeutscheBank AG | DeutscheBank AG | DeutscheBank AG | ||||||||||||||||
Notional Amount | $67,610,098 | $35,500,000 | $13,590,513 | $17,663,283 | $ | 67,610,098 | $ | 35,500,000 | $ | 13,590,513 | $ | 17,663,283 | ||||||||||||
Termination Date | 8/2/2018 | 8/2/2018 | 8/7/2018 | 3/26/2018 | 8/2/2018 | 8/2/2018 | 8/7/2018 | 3/26/2018 | ||||||||||||||||
Cash Collateral | $9,600,000 | $3,400,000 | $2,880,000 | $5,993,000 | $ | 9,600,000 | $ | 3,400,000 | $ | 2,880,000 | $ | 5,993,000 | ||||||||||||
Swap Value | $8,646,954 | $3,170,408 | $753,060 | $1,547,465 | $ | 8,646,954 | $ | 3,170,408 | $ | 753,060 | $ | 1,547,465 | ||||||||||||
Investee Returns | Total Returns | Total Returns | Total Returns | Total Returns | Total Returns | Total Returns | Total Returns | Total Returns | ||||||||||||||||
Realized Gain/(Loss) | $0 | $0 | $0 | $0 | $ | 0 | $ | 0 | $ | 0 | $ | 0 | ||||||||||||
|
|
|
|
|
|
|
| |||||||||||||||||
Change in Unrealized Gain/(Loss) | $8,120,996 | $3,132,777 | $1,176,514 | $2,105,281 | $ | 8,120,996 | $ | 3,132,777 | $ | 1,176,514 | $ | 2,105,281 | ||||||||||||
|
|
|
|
|
|
|
| |||||||||||||||||
Fair Value as of 3/31/2015 | $18,246,954 | $6,570,408 | $3,633,060 | $7,540,465 | ||||||||||||||||||||
Fair Value as of 12/31/2014 | $ | 18,246,955 | $ | 6,570,409 | $ | 3,633,060 | $ | 7,540,466 | ||||||||||||||||
|
|
|
|
|
|
|
| |||||||||||||||||
5. Investments in Unconsolidated Trading Companies
Investments in unconsolidated trading companies represent cash and open trade equity invested in the Trading Companies by each Series and cumulative trading profits or losses allocated to each Series by the Trading Companies. Trading Companies allocate trading profits or losses on the basis of the proportion of each Series’ capital allocated for trading to each respective Trading Company, which bears no relationship to the amount of cash invested by a Series in the Trading Company. The Trading Companies are valued using the equity method of accounting, which approximates fair value.
The following table summarizes each of the Series’ investments in unconsolidated Trading Companies as of March 31,June 30, 2015 and December 31, 2014:
| As of March 31, 2015 | As of December 31, 2014 | |||||||||||||||
| Percentage of Series Net Assets Invested in Unconsolidated Trading Companies | Fair Value | Percentage of Series Net Assets Invested in Unconsolidated Trading Companies | Fair Value | |||||||||||||
Series | ||||||||||||||||
Equinox Frontier Diversified Fund — | 8.59 | % | $ | 6,464,972 | 9.11 | % | $ | 6,594,379 | ||||||||
Equinox Frontier Masters Fund — | 40.84 | % | $ | 10,915,655 | 30.74 | % | $ | 7,901,978 | ||||||||
Equinox Frontier Long/Short Commodity Fund — | 15.76 | % | $ | 3,000,921 | 22.96 | % | $ | 3,814,854 | ||||||||
Equinox Frontier Balanced Fund — | 15.76 | % | $ | 17,442,848 | 16.92 | % | $ | 18,343,927 | ||||||||
Equinox Frontier Select Fund — | 19.74 | % | $ | 4,733,469 | 53.06 | % | $ | 8,102,141 | ||||||||
Equinox Frontier Winton Fund — | 20.95 | % | $ | 8,972,672 | 18.68 | % | $ | 7,479,658 | ||||||||
Equinox Frontier Heritage Fund — | 9.08 | % | $ | 1,723,907 | 9.32 | % | $ | 1,543,386 | ||||||||
Series Equinox Frontier Diversified Fund — Equinox Frontier Masters Fund — Equinox Frontier Long/Short Commodity Fund — Equinox Frontier Balanced Fund — Equinox Frontier Select Fund — Equinox Frontier Winton Fund — Equinox Frontier Heritage Fund — As of June 30, 2015 As of December 31, 2014 Percentage of
Series Net
Assets Invested
in Unconsolidated
Trading Companies Fair Value Percentage of
Series Net
Assets Invested
in Unconsolidated
Trading Companies Fair Value
Frontier Trading Companies I, II, VII, IX, XIV, XV, XXXIII and XXXVIII 9.96 % $ 6,198,464 9.11 % $ 6,594,379
Frontier Trading Companies II, XIV, XV and XXXVIII 38.63 % $ 8,767,520 30.74 % $ 7,901,978
Frontier Trading Companies I and XXXVIII 24.26 % $ 3,896,994 22.96 % $ 3,814,854
Frontier Trading Companies II, VII, XV and XXXVIII 14.77 % $ 14,333,796 16.92 % $ 18,343,927
Frontier Trading Companies XV, XXXVIII and XXXIX 20.83 % $ 4,013,269 53.06 % $ 8,102,141
Frontier Trading Company II and XXXVIII 18.35 % $ 6,749,039 18.68 % $ 7,479,658
Frontier Trading Companies II and XXXVIII 8.80 % $ 1,398,043 9.32 % $ 1,543,386
The following tables summarize each of the Series’ equity in earnings from unconsolidated Trading Companies for the three and six months ended March 31,June 30, 2015 and 2014.
Equinox Frontier Diversified Fund Frontier Trading Company I LLC Frontier Trading Company II LLC Frontier Trading Company V LLC Frontier Trading Company VI LLC Frontier Trading Company VII, LLC Frontier Trading Company IX, LLC Frontier Trading Company XIV, LLC Frontier Trading Company XV, LLC Frontier Trading Company XVIII, LLC Frontier Trading Company XXI, LLC Frontier Trading Company XXIII, LLC Frontier Trading Company XXXVIII, LLC Frontier Trading Company XXXIX, LLC Total Equinox Frontier Masters Fund Frontier Trading Company I LLC Frontier Trading Company II LLC Frontier Trading Company XIV, LLC Frontier Trading Company XV, LLC Frontier Trading Company VII, LLC Frontier Trading Company XXXVIII, LLC Total Equinox Frontier Long/Short Commodity Fund Frontier Trading Company I LLC Frontier Trading Companies VII, LLC Frontier Trading Companies XVIII, LLC Frontier Trading Companies XXIII, LLC Frontier Trading Company XXXVIII, LLC Total Equinox Frontier Balanced Fund Frontier Trading Company I LLC Frontier Trading Company II LLC Frontier Trading Company V LLC Frontier Trading Company VII, LLC Frontier Trading Company XIV, LLC Frontier Trading Company XV, LLC Frontier Trading Company XVI, LLC Frontier Trading Company XVIII, LLC Frontier Trading Company XXIII, LLC Frontier Trading Company XXXVIII, LLC Frontier Trading Company XXXIX, LLC Total Equinox Frontier Select Fund Frontier Trading Company V LLC Frontier Trading Company VI LLC Frontier Trading Company XV, LLC Frontier Trading Company XXI, LLC Frontier Trading Company XXXVIII, LLC Frontier Trading Company XXXIX, LLC Total Equinox Frontier Winton Fund Frontier Trading Company II LLC Frontier Trading Company XXXVIII ,LLC Total Equinox Frontier Heritage Fund Frontier Trading Company II LLC Frontier Trading Company V LLC Frontier Trading Company XXXVIII, LLC Frontier Trading Company XXXIX, LLC Total Three Months Ended June 30, 2015 Three Months Ended June 30, 2014 Trading
Commissions Realized
Gain/(Loss) Change in
Unrealized
Gain/(Loss) Net Income
(Loss) Trading
Commissions Realized
Gain/(Loss) Change in
Unrealized
Gain/(Loss) Net Income
(Loss) $ — $ — $ — $ — $ (77,867 ) $ 950,477 $ 1,028,045 $ 1,900,655 (4,246 ) (685,823 ) (420,717 ) (1,110,786 ) (4,241 ) 865,388 (8,894 ) 852,253 — — — — — — — — — — — — — — — — (85,942 ) (1,382,324 ) 1,810,489 342,223 (96,234 ) (663,204 ) 608,781 (150,657 ) — — — — — — — — — — — (41,516 ) 249,214 263,796 471,494 — — — — (12,052 ) (487,276 ) 155,923 (343,405 ) — — — — — — — — — — — — — — — — (17,919 ) (151,523 ) (304,555 ) (473,997 ) (11,949 ) 789,665 92,152 869,868 (10,482 ) 77,904 (236,705 ) (169,283 ) — — — — — — — (11,766 ) (127,320 ) (97,402 ) (236,488 ) $ (118,589 ) $ (2,141,766 ) $ 848,512 $ (1,411,843 ) $ (255,625 ) $ 1,576,944 $ 2,042,401 $ 3,363,720 $ (6,561 ) $ (78,343 ) $ (920,425 ) $ (1,005,329 ) $ (8,994 ) $ 441,002 $ 166,625 $ 598,633 (2,613 ) (420,988 ) (264,127 ) $ (687,728 ) (3,095 ) 627,805 (8,751 ) 615,959 — — — — (36,029 ) 189,278 214,868 368,117 (14,857 ) (979,930 ) (372,004 ) (1,366,791 ) (24,092 ) 125,464 287,803 389,175 (50,573 ) (775,283 ) 1,063,371 237,515 (4,586 ) 35,342 (122,309 ) (91,553 ) (6,083 ) (78,704 ) (42,756 ) (127,533 ) $ (79,190 ) $ (2,219,202 ) $ (615,494 ) $ (2,913,886 ) $ (78,293 ) $ 1,304,845 $ 617,789 $ 1,844,351 $ — $ — $ — $ — $ — $ — $ — $ — (63,635 ) (1,450,691 ) 1,054,760 (459,566 ) (79,249 ) (199,250 ) 450,592 172,093 — — — — (9,017 ) (338,735 ) (291,055 ) (638,807 ) — — — — — — — — (2,865 ) 19,681 (69,554 ) (52,738 ) — — — — $ (66,500 ) $ (1,431,010 ) $ 985,206 $ (512,304 ) $ (88,266 ) $ (537,985 ) $ 159,537 $ (466,714 ) $ (83,797 ) $ 975,639 $ (208,851 ) 682,991 $ (263,573 ) $ 1,115,464 $ (362,505 ) 489,386 (5,791 ) (937,794 ) (560,595 ) (1,504,180 ) (12,088 ) (686,492 ) 1,317,845 619,265 — — — — — (97,027 ) (1,669,662 ) 2,061,923 295,234 36,410 685,775 (1,108,643 ) (386,458 ) — — — — (23,141 ) 99,184 (416,179 ) (340,136 ) (231 ) (492,925 ) 493,274 118 22,806 (867,989 ) 1,231,415 386,232 — — — — — — — — — — — — — — — (17,308 ) 134,812 (445,903 ) (328,399 ) (768,673 ) 1,833,086 (991,089 ) 73,324 — — — — (75,543 ) (1,180,680 ) 612,399 (643,824 ) $ (204,154 ) $ (1,989,930 ) $ 1,339,848 $ (854,236 ) $ (1,083,802 ) $ 998,348 $ 283,243 $ 197,789 $ — $ — $ — $ — $ — $ — $ — $ — — — — — — — — — — (2 ) (2 ) (31,676 ) 106,074 415,981 490,379 (967,125 ) (967,125 ) — — — (2,577 ) 7,618 (23,723 ) (17,104 ) (2,970 ) (33,431 ) (15,011 ) (51,412 ) 127,518 127,518 (1,556 ) — 331,515 329,959 $ (2,577 ) $ 7,618 $ (863,332 ) $ (856,713 ) $ (36,202 ) $ 72,643 $ 732,485 $ 768,926 $ (14,911 ) $ (2,419,574 ) $ (1,407,788 ) $ (3,842,273 ) $ (13,657 ) $ 2,787,074 $ (31,073 ) $ 2,742,344 (9,599 ) 73,551 (282,923 ) $ (218,971 ) (9,787 ) (105,773 ) (73,711 ) (189,271 ) $ (24,510 ) $ (2,346,023 ) $ (1,690,711 ) $ (4,061,244 ) $ (23,444 ) $ 2,681,301 $ (104,784 ) $ 2,553,073 $ (2,685 ) $ (435,646 ) $ (252,853 ) $ (691,184 ) $ (3,057 ) $ 623,800 $ (6,880 ) $ 613,593 — — — — — — — — (2,163 ) 16,512 (62,218 ) (47,870 ) (2,639 ) (32,058 ) (21,536 ) (56,233 ) — — — — — — — — $ (4,848 ) $ (419,134 ) $ (315,071 ) $ (739,054 ) $ (5,696 ) $ 591,742 $ (28,416 ) $ 557,360
| Three Months Ended March 31, 2015 | Three Months Ended March 31, 2014 | Six Months Ended June 30, 2015 | Six Months Ended June 30, 2014 | |||||||||||||||||||||||||||||||||||||||||||||||||||||||||||||
| Trading Commissions | Realized Gain/(Loss) | Change in Unrealized Gain/(Loss) | Net Income (Loss) | Trading Commissions | Realized Gain/(Loss) | Change in Unrealized Gain/(Loss) | Net Income (Loss) | Trading Commissions | Realized Gain/(Loss) | Change in Unrealized Gain/(Loss) | Net Income (Loss) | Trading Commissions | Realized Gain/(Loss) | Change in Unrealized Gain/(Loss) | Net Income (Loss) | |||||||||||||||||||||||||||||||||||||||||||||||||
Trading Company | ||||||||||||||||||||||||||||||||||||||||||||||||||||||||||||||||
Equinox Frontier Diversified Fund — | ||||||||||||||||||||||||||||||||||||||||||||||||||||||||||||||||
Equinox Frontier Diversified Fund | ||||||||||||||||||||||||||||||||||||||||||||||||||||||||||||||||
Frontier Trading Company I LLC | $ | — | $ | — | $ | — | $ | — | $ | (70,393 | ) | $ | 1,144,628 | $ | (601,231 | ) | $ | 473,004 | $ | — | $ | — | $ | — | $ | — | $ | (148,260 | ) | $ | 2,095,105 | $ | 421,786 | $ | 2,368,631 | |||||||||||||||||||||||||||||
Frontier Trading Company II LLC | (4,083 | ) | 1,333,292 | (127,311 | ) | 1,201,898 | (4,751 | ) | 266,640 | (284,827 | ) | (22,938 | ) | (8,329 | ) | 647,469 | (548,028 | ) | 91,112 | (8,992 | ) | 1,132,028 | (293,721 | ) | 829,315 | |||||||||||||||||||||||||||||||||||||||
Frontier Trading Company XIV LLC | — | — | — | — | — | |||||||||||||||||||||||||||||||||||||||||||||||||||||||||||
Frontier Trading Company V LLC | — | — | — | — | — | — | — | — | ||||||||||||||||||||||||||||||||||||||||||||||||||||||||
Frontier Trading Company VI LLC | — | — | — | — | — | — | — | — | ||||||||||||||||||||||||||||||||||||||||||||||||||||||||
Frontier Trading Company VII, LLC | (82,381 | ) | 2,108,509 | (1,223,126 | ) | 803,002 | (152,103 | ) | (617,460 | ) | (238,109 | ) | (1,007,672 | ) | (168,323 | ) | 726,185 | 587,363 | 1,145,225 | (248,337 | ) | (1,280,664 | ) | 370,672 | (1,158,329 | ) | ||||||||||||||||||||||||||||||||||||||
Frontier Trading Company IX, LLC | — | — | — | — | — | — | — | |||||||||||||||||||||||||||||||||||||||||||||||||||||||||
Frontier Trading Company XIV, LLC | — | — | — | — | (59,609 | ) | (628,000 | ) | 64,707 | (622,902 | ) | — | — | — | — | (101,125 | ) | (378,786 | ) | 323,498 | (156,413 | ) | ||||||||||||||||||||||||||||||||||||||||||
Frontier Trading Company XV, LLC | — | — | — | — | (15,711 | ) | 659,867 | (952,930 | ) | (308,774 | ) | — | — | — | — | (27,763 | ) | 172,591 | (786,997 | ) | (642,169 | ) | ||||||||||||||||||||||||||||||||||||||||||
Frontier Trading Company XVIII, LLC | — | — | — | — | — | — | — | — | ||||||||||||||||||||||||||||||||||||||||||||||||||||||||
Frontier Trading Company XXI, LLC | — | — | — | — | — | — | — | — | ||||||||||||||||||||||||||||||||||||||||||||||||||||||||
Frontier Trading Company XXIII, LLC | (19,782 | ) | 872,609 | (26,219 | ) | 826,608 | (12,201 | ) | 283,424 | 95,506 | 366,729 | (37,701 | ) | 721,086 | (330,774 | ) | 352,611 | (24,150 | ) | 1,073,089 | 187,658 | 1,236,597 | ||||||||||||||||||||||||||||||||||||||||||
Frontier Trading Company XXXVIII, LLC | (7,008 | ) | 875,067 | (226,858 | ) | 641,201 | (12,407 | ) | (766,684 | ) | (577,656 | ) | (1,356,747 | ) | ||||||||||||||||||||||||||||||||||||||||||||||||||
|
|
|
|
|
|
|
| |||||||||||||||||||||||||||||||||||||||||||||||||||||||||
Total | $ | (113,254 | ) | $ | 5,189,477 | $ | (1,603,514 | ) | $ | 3,472,709 | $ | (327,175 | ) | $ | 342,415 | $ | (2,494,540 | ) | $ | (2,479,300 | ) | |||||||||||||||||||||||||||||||||||||||||||
|
|
|
|
|
|
|
| |||||||||||||||||||||||||||||||||||||||||||||||||||||||||
Equinox Frontier Masters Fund — | ||||||||||||||||||||||||||||||||||||||||||||||||||||||||||||||||
Frontier Trading Company I LLC | $ | (3,974 | ) | $ | 1,259,037 | $ | (138,423 | ) | $ | 1,116,640 | $ | (5,656 | ) | $ | (356,517 | ) | $ | 490,064 | $ | 127,891 | ||||||||||||||||||||||||||||||||||||||||||||
Frontier Trading Company II LLC | (2,329 | ) | 752,839 | (71,107 | ) | 679,403 | (3,710 | ) | 214,076 | (241,479 | ) | (31,113 | ) | |||||||||||||||||||||||||||||||||||||||||||||||||||
Frontier Trading Company XIV, LLC | — | — | — | — | (59,109 | ) | (623,196 | ) | (1,706 | ) | (684,011 | ) | ||||||||||||||||||||||||||||||||||||||||||||||||||||
Frontier Trading Company XV, LLC | (14,122 | ) | 1,127,983 | (429,920 | ) | 683,941 | (29,455 | ) | 680,449 | (1,157,896 | ) | (506,902 | ) | |||||||||||||||||||||||||||||||||||||||||||||||||||
Frontier Trading Company VII, LLC | (35,943 | ) | 3,411,269 | (3,011,878 | ) | 363,448 | — | — | — | — | ||||||||||||||||||||||||||||||||||||||||||||||||||||||
Frontier Trading Company XXXVIII, LLC | (2,805 | ) | 298,322 | (43,190 | ) | 252,327 | (7,070 | ) | (418,640 | ) | (333,592 | ) | (759,302 | ) | ||||||||||||||||||||||||||||||||||||||||||||||||||
|
|
|
|
|
|
|
| |||||||||||||||||||||||||||||||||||||||||||||||||||||||||
Total | $ | (59,173 | ) | $ | 6,849,450 | $ | (3,694,518 | ) | $ | 3,095,759 | $ | (105,000 | ) | $ | (503,828 | ) | $ | (1,244,609 | ) | $ | (1,853,437 | ) | ||||||||||||||||||||||||||||||||||||||||||
|
|
|
|
|
|
|
| |||||||||||||||||||||||||||||||||||||||||||||||||||||||||
Equinox Frontier Long/Short Commodity Fund | ||||||||||||||||||||||||||||||||||||||||||||||||||||||||||||||||
Frontier Trading Companies VII, LLC | (84,768 | ) | 2,757,328 | (928,844 | ) | 1,743,716 | — | — | — | — | ||||||||||||||||||||||||||||||||||||||||||||||||||||||
Frontier Trading Company XXXVIII, LLC | (1,968 | ) | 256,376 | (63,599 | ) | 190,809 | (4,943 | ) | (293,160 | ) | (247,543 | ) | (545,646 | ) | ||||||||||||||||||||||||||||||||||||||||||||||||||
|
|
|
|
|
|
|
| |||||||||||||||||||||||||||||||||||||||||||||||||||||||||
Total | $ | (86,736 | ) | $ | 3,013,704 | $ | (992,443 | ) | $ | 1,934,525 | $ | (4,943 | ) | $ | (293,160 | ) | $ | (247,543 | ) | $ | (545,646 | ) | ||||||||||||||||||||||||||||||||||||||||||
|
|
|
|
|
|
|
| |||||||||||||||||||||||||||||||||||||||||||||||||||||||||
Equniox Frontier Balanced Fund — | ||||||||||||||||||||||||||||||||||||||||||||||||||||||||||||||||
Frontier Trading Company I, LLC | $ | (89,859 | ) | $ | 2,048,945 | $ | 237,670 | $ | 2,196,756 | $ | (2,356 | ) | $ | 224,161 | $ | 103,565 | $ | 325,370 | ||||||||||||||||||||||||||||||||||||||||||||||
Frontier Trading Company II LLC | (5,197 | ) | 1,686,860 | (159,819 | ) | 1,521,844 | (6,746 | ) | 422,192 | (533,681 | ) | (118,235 | ) | |||||||||||||||||||||||||||||||||||||||||||||||||||
Frontier Trading Company XIV LLC | — | — | — | — | (75,543 | ) | (1,180,680 | ) | 610,861 | (645,362 | ) | |||||||||||||||||||||||||||||||||||||||||||||||||||||
Frontier Trading Company VII, LLC | (92,052 | ) | 2,316,304 | (1,347,583 | ) | 876,669 | (135,914 | ) | (619,532 | ) | (143,328 | ) | (898,774 | ) | ||||||||||||||||||||||||||||||||||||||||||||||||||
Frontier Trading Company XV, LLC | 107 | 275,900 | (275,956 | ) | 51 | (22,806 | ) | 867,989 | (1,231,415 | ) | (386,232 | ) | ||||||||||||||||||||||||||||||||||||||||||||||||||||
Frontier Trading Company XXXVIII, LLC | (9,702 | ) | 1,220,917 | (284,086 | ) | 927,129 | (21,974 | ) | (1,329,333 | ) | (1,006,147 | ) | (2,357,454 | ) | (17,490 | ) | 952,971 | (463,563 | ) | 471,918 | (24,173 | ) | (894,004 | ) | (675,056 | ) | (1,593,233 | ) | ||||||||||||||||||||||||||||||||||||
Frontier Trading Company XXXIX, LLC | — | — | — | — | — | — | (1,536 | ) | (1,536 | ) | — | — | — | — | — | — | — | — | ||||||||||||||||||||||||||||||||||||||||||||||
|
|
|
|
|
|
|
|
|
|
|
|
|
|
|
| |||||||||||||||||||||||||||||||||||||||||||||||||
Total | $ | (196,703 | ) | $ | 7,548,926 | $ | (1,829,774 | ) | $ | 5,522,449 | $ | (265,339 | ) | $ | (1,615,203 | ) | $ | (2,201,681 | ) | $ | (4,082,223 | ) | $ | (231,843 | ) | $ | 3,047,711 | $ | (755,002 | ) | $ | 2,060,866 | $ | (582,800 | ) | $ | 1,919,359 | $ | (452,160 | ) | $ | 884,399 | ||||||||||||||||||||||
|
|
|
|
|
|
|
|
|
|
|
|
|
|
|
| |||||||||||||||||||||||||||||||||||||||||||||||||
Equniox Frontier Frontier Select Fund — | ||||||||||||||||||||||||||||||||||||||||||||||||||||||||||||||||
Equinox Frontier Masters Fund | ||||||||||||||||||||||||||||||||||||||||||||||||||||||||||||||||
Frontier Trading Company I LLC | $ | (10,535 | ) | $ | 1,180,694 | $ | (1,058,847 | ) | $ | 111,312 | $ | (14,650 | ) | $ | 84,485 | $ | 656,689 | $ | 726,524 | |||||||||||||||||||||||||||||||||||||||||||||
Frontier Trading Company II LLC | (4,942 | ) | 331,851 | (335,234 | ) | $ | (8,325 | ) | (6,805 | ) | 841,881 | (248,924 | ) | 586,152 | ||||||||||||||||||||||||||||||||||||||||||||||||||
Frontier Trading Company XIV, LLC | (28,979 | ) | 148,053 | (801,924 | ) | (682,850 | ) | (95,138 | ) | (433,918 | ) | 213,162 | (315,894 | ) | ||||||||||||||||||||||||||||||||||||||||||||||||||
Frontier Trading Company XV, LLC | — | (195 | ) | 2,175 | 1,980 | (29,250 | ) | 712,977 | (899,389 | ) | (215,662 | ) | (86,516 | ) | 2,635,986 | (1,948,507 | ) | 600,963 | (53,547 | ) | 805,913 | (875,590 | ) | (123,224 | ) | |||||||||||||||||||||||||||||||||||||||
Frontier Trading Company XXXIX, LLC | — | — | 967,125 | 967,125 | — | — | (536,455 | ) | (536,455 | ) | ||||||||||||||||||||||||||||||||||||||||||||||||||||||
Frontier Trading Company XXXVIII, LLC | 780 | 56,689 | 7,435 | 63,344 | (3,264 | ) | (193,892 | ) | (148,153 | ) | (345,309 | ) | (7,391 | ) | 333,664 | (165,500 | ) | 160,773 | (13,153 | ) | (497,344 | ) | (372,146 | ) | (882,643 | ) | ||||||||||||||||||||||||||||||||||||||
|
|
|
|
|
|
|
|
|
|
|
|
|
|
|
| |||||||||||||||||||||||||||||||||||||||||||||||||
Total | $ | 780 | $ | 56,494 | $ | 976,735 | $ | 1,032,449 | $ | (32,514 | ) | $ | 519,085 | $ | (1,583,997 | ) | $ | (1,097,426 | ) | $ | (138,363 | ) | $ | 4,630,248 | $ | (4,310,012 | ) | $ | 181,873 | $ | (183,293 | ) | $ | 801,017 | $ | (626,809 | ) | $ | (9,085 | ) | ||||||||||||||||||||||||
|
|
|
|
|
|
|
|
|
|
|
|
|
|
|
| |||||||||||||||||||||||||||||||||||||||||||||||||
Equniox Frontier Winton Fund — | ||||||||||||||||||||||||||||||||||||||||||||||||||||||||||||||||
Frontier Trading Company II LLC | $ | (13,273 | ) | $ | 4,309,466 | $ | (409,695 | ) | $ | 3,886,498 | $ | (13,950 | ) | $ | 877,058 | $ | (885,581 | ) | $ | (22,473 | ) | |||||||||||||||||||||||||||||||||||||||||||
Equinox Frontier Long/Short Commodity Fund | ||||||||||||||||||||||||||||||||||||||||||||||||||||||||||||||||
Frontier Trading Company I LLC | $ | — | $ | — | $ | — | $ | — | $ | — | $ | — | $ | — | $ | — | ||||||||||||||||||||||||||||||||||||||||||||||||
Frontier Trading Companies VII, LLC | (148,403 | ) | 1,306,637 | 125,916 | 1,284,150 | (84,192 | ) | (492,410 | ) | 202,711 | (373,891 | ) | ||||||||||||||||||||||||||||||||||||||||||||||||||||
Frontier Trading Companies XVIII, LLC | — | — | — | — | — | — | — | — | ||||||||||||||||||||||||||||||||||||||||||||||||||||||||
Frontier Trading Companies XXIII, LLC | — | — | — | — | — | — | — | — | ||||||||||||||||||||||||||||||||||||||||||||||||||||||||
Frontier Trading Company XXXVIII, LLC | (5,886 | ) | 674,550 | (111,929 | ) | 556,735 | (9,539 | ) | (564,895 | ) | (395,351 | ) | (969,785 | ) | (4,833 | ) | 276,057 | (133,153 | ) | 138,071 | (9,017 | ) | (338,735 | ) | (290,717 | ) | (638,469 | ) | ||||||||||||||||||||||||||||||||||||
|
|
|
|
|
|
|
|
|
|
|
|
|
|
|
| |||||||||||||||||||||||||||||||||||||||||||||||||
Total | $ | (19,159 | ) | $ | 4,984,016 | $ | (521,624 | ) | $ | 4,443,233 | $ | (23,489 | ) | $ | 312,163 | $ | (1,280,932 | ) | $ | (992,258 | ) | $ | (153,236 | ) | $ | 1,582,694 | $ | (7,237 | ) | $ | 1,422,221 | $ | (93,209 | ) | $ | (831,145 | ) | $ | (88,006 | ) | $ | (1,012,360 | ) | |||||||||||||||||||||
|
|
|
|
|
|
|
|
|
|
|
|
|
|
|
| |||||||||||||||||||||||||||||||||||||||||||||||||
Equniox Frontier Heritage Fund — | ||||||||||||||||||||||||||||||||||||||||||||||||||||||||||||||||
Equinox Frontier Balanced Fund | ||||||||||||||||||||||||||||||||||||||||||||||||||||||||||||||||
Frontier Trading Company I LLC | $ | (173,656 | ) | $ | 3,024,584 | $ | 28,819 | 2,879,747 | $ | (21,190 | ) | $ | (40,139 | ) | $ | 887,729 | 826,400 | |||||||||||||||||||||||||||||||||||||||||||||||
Frontier Trading Company II LLC | $ | (2,502 | ) | $ | 816,543 | $ | (78,076 | ) | $ | 735,965 | $ | (3,125 | ) | $ | 196,488 | $ | (198,569 | ) | $ | (5,206 | ) | (10,988 | ) | 749,066 | (720,413 | ) | 17,665 | (12,125 | ) | 1,514,527 | (547,779 | ) | 954,623 | |||||||||||||||||||||||||||||||
Frontier Trading Company V LLC | — | — | — | — | — | — | — | — | ||||||||||||||||||||||||||||||||||||||||||||||||||||||||
Frontier Trading Company VII, LLC | (189,079 | ) | 646,642 | 714,340 | 1,171,903 | (237,492 | ) | (1,772,506 | ) | 684,757 | (1,325,241 | ) | ||||||||||||||||||||||||||||||||||||||||||||||||||||
Frontier Trading Company XIV, LLC | — | — | — | — | (75,543 | ) | (1,180,680 | ) | 610,861 | (645,362 | ) | |||||||||||||||||||||||||||||||||||||||||||||||||||||
Frontier Trading Company XV, LLC | (124 | ) | (217,025 | ) | 217,318 | 169 | (44,315 | ) | (299,183 | ) | (581,076 | ) | (924,574 | ) | ||||||||||||||||||||||||||||||||||||||||||||||||||
Frontier Trading Company XVI, LLC | — | — | — | — | — | — | — | — | ||||||||||||||||||||||||||||||||||||||||||||||||||||||||
Frontier Trading Company XVIII, LLC | — | — | — | — | — | — | — | — | ||||||||||||||||||||||||||||||||||||||||||||||||||||||||
Frontier Trading Company XXIII, LLC | — | — | — | — | — | — | — | — | ||||||||||||||||||||||||||||||||||||||||||||||||||||||||
Frontier Trading Company XXXVIII, LLC | (1,325 | ) | 150,850 | (24,089 | ) | 125,436 | (2,805 | ) | (167,218 | ) | (127,972 | ) | (297,995 | ) | (27,010 | ) | 1,355,729 | (729,990 | ) | 598,729 | (42,486 | ) | (1,584,456 | ) | (1,141,801 | ) | (2,768,743 | ) | ||||||||||||||||||||||||||||||||||||
Frontier Trading Company XXXIX, LLC | — | — | — | — | — | — | (1,538 | ) | (1,538 | ) | ||||||||||||||||||||||||||||||||||||||||||||||||||||||
|
|
|
|
|
|
|
|
|
|
|
|
|
|
|
| |||||||||||||||||||||||||||||||||||||||||||||||||
Total | $ | (3,827 | ) | $ | 967,393 | $ | (102,165 | ) | $ | 861,401 | $ | (5,930 | ) | $ | 29,270 | $ | (326,541 | ) | $ | (303,201 | ) | $ | (400,857 | ) | $ | 5,558,996 | $ | (489,926 | ) | $ | 4,668,213 | $ | (433,151 | ) | $ | (3,362,437 | ) | $ | (88,847 | ) | $ | (3,884,435 | ) | |||||||||||||||||||||
|
|
|
|
|
|
|
|
|
|
|
|
|
|
|
| |||||||||||||||||||||||||||||||||||||||||||||||||
Equinox Frontier Select Fund | ||||||||||||||||||||||||||||||||||||||||||||||||||||||||||||||||
Frontier Trading Company V LLC | $ | — | $ | — | $ | — | $ | — | $ | — | $ | — | $ | — | $ | — | ||||||||||||||||||||||||||||||||||||||||||||||||
Frontier Trading Company VI LLC | — | — | — | — | — | — | — | — | ||||||||||||||||||||||||||||||||||||||||||||||||||||||||
Frontier Trading Company XV, LLC | — | (195 | ) | 2,173 | 1,978 | (60,926 | ) | 819,051 | (483,409 | ) | 274,716 | |||||||||||||||||||||||||||||||||||||||||||||||||||||
Frontier Trading Company XXI, LLC | — | — | — | — | — | — | — | — | ||||||||||||||||||||||||||||||||||||||||||||||||||||||||
Frontier Trading Company XXXVIII, LLC | (1,797 | ) | 64,307 | (16,288 | ) | 46,222 | (6,234 | ) | (227,323 | ) | (163,164 | ) | (396,721 | ) | ||||||||||||||||||||||||||||||||||||||||||||||||||
Frontier Trading Company XXXIX, LLC | 127,536 | 127,536 | (1,556 | ) | — | (204,940 | ) | (206,496 | ) | |||||||||||||||||||||||||||||||||||||||||||||||||||||||
|
|
|
|
|
|
|
| |||||||||||||||||||||||||||||||||||||||||||||||||||||||||
Total | $ | (1,797 | ) | $ | 64,112 | $ | 113,421 | $ | 175,736 | $ | (68,716 | ) | $ | 591,728 | $ | (851,513 | ) | $ | (328,501 | ) | ||||||||||||||||||||||||||||||||||||||||||||
|
|
|
|
|
|
|
| |||||||||||||||||||||||||||||||||||||||||||||||||||||||||
Equinox Frontier Winton Fund | ||||||||||||||||||||||||||||||||||||||||||||||||||||||||||||||||
Frontier Trading Company II LLC | $ | (28,184 | ) | $ | 1,889,892 | $ | (1,817,483 | ) | $ | 44,225 | $ | (27,607 | ) | $ | 3,664,132 | $ | (917,278 | ) | $ | 2,719,247 | ||||||||||||||||||||||||||||||||||||||||||||
Frontier Trading Company XXXVIII ,LLC | (15,485 | ) | 748,101 | (394,852 | ) | $ | 337,764 | (19,326 | ) | (670,668 | ) | (468,437 | ) | (1,158,431 | ) | |||||||||||||||||||||||||||||||||||||||||||||||||
|
|
|
|
|
|
|
| |||||||||||||||||||||||||||||||||||||||||||||||||||||||||
Total | $ | (43,669 | ) | $ | 2,637,993 | $ | (2,212,335 | ) | $ | 381,989 | $ | (46,933 | ) | $ | 2,993,464 | $ | (1,385,715 | ) | $ | 1,560,816 | ||||||||||||||||||||||||||||||||||||||||||||
|
|
|
|
|
|
|
| |||||||||||||||||||||||||||||||||||||||||||||||||||||||||
Equinox Frontier Heritage Fund | ||||||||||||||||||||||||||||||||||||||||||||||||||||||||||||||||
Frontier Trading Company II LLC | $ | (5,187 | ) | $ | 380,897 | $ | (330,929 | ) | $ | 44,781 | $ | (6,182 | ) | $ | 820,288 | $ | (205,585 | ) | $ | 608,521 | ||||||||||||||||||||||||||||||||||||||||||||
Frontier Trading Company V LLC | — | — | — | — | — | — | — | — | ||||||||||||||||||||||||||||||||||||||||||||||||||||||||
Frontier Trading Company XXXVIII, LLC | (3,489 | ) | 167,362 | (86,307 | ) | 77,566 | (5,444 | ) | (199,276 | ) | (149,643 | ) | (354,363 | ) | ||||||||||||||||||||||||||||||||||||||||||||||||||
Frontier Trading Company XXXIX, LLC | — | — | — | — | — | — | — | — | ||||||||||||||||||||||||||||||||||||||||||||||||||||||||
|
|
|
|
|
|
|
| |||||||||||||||||||||||||||||||||||||||||||||||||||||||||
Total | $ | (8,676 | ) | $ | 548,259 | $ | (417,236 | ) | $ | 122,347 | $ | (11,626 | ) | $ | 621,012 | $ | (355,228 | ) | $ | 254,158 | ||||||||||||||||||||||||||||||||||||||||||||
|
|
|
|
|
|
|
| |||||||||||||||||||||||||||||||||||||||||||||||||||||||||
The statements of financial condition as of March 31,June 30, 2015 and December 31, 2014 and the Condensed Statement of Income for the three and six months ended March 31,June 30, 2015 and 2014 for the unconsolidated Trading Companies are as follows:
Statements of Financial Condition - March 31, 2015 | Frontier Trading Company II LLC | Frontier Trading Company VII LLC | Frontier Trading Company XXXVIII LLC | |||||||||||||||||||||
Statements of Financial Condition - June 30, 2015 | Frontier Trading Company II LLC | Frontier Trading Company VII LLC | Frontier Trading Company XXXVIII LLC | |||||||||||||||||||||
Receivable from commission merchants | $ | 14,613,881 | $ | 11,114,148 | $ | 3,492,655 | $ | 12,124,771 | $ | 6,069,994 | $ | 6,984,925 | ||||||||||||
Open trade equity/(deficit) | 2,627,378 | (3,570,879 | ) | 622,727 | (278,805 | ) | 3,259,443 | (620,620 | ) | |||||||||||||||
Interest receivable/(payable) | 407 | (128 | ) | (138 | ) | 78 | (40 | ) | 277 | |||||||||||||||
|
|
|
|
|
| |||||||||||||||||||
Total net asset value | $ | 17,241,666 | $ | 7,543,141 | $ | 4,115,244 | ||||||||||||||||||
|
|
| ||||||||||||||||||||||
Total assets | $ | 11,846,044 | $ | 9,329,397 | $ | 6,364,582 | ||||||||||||||||||
|
|
| ||||||||||||||||||||||
Members’ equity | $ | 17,241,666 | $ | 7,543,141 | $ | 4,115,244 | $ | 11,846,044 | $ | 9,329,397 | $ | 6,364,582 | ||||||||||||
|
|
|
|
|
| |||||||||||||||||||
Condensed Statement of Income - For the Three Months | Frontier Trading Company II LLC | Frontier Trading Company VII LLC | Frontier Trading Company XXXVIII LLC | |||||||||||||||||||||
Interest income | $ | (1,243 | ) | $ | 479 | $ | 707 | |||||||||||||||||
Net realized gain/(loss) on investments, less | (3,431,043 | ) | (8,596,912 | ) | (2,837,649 | ) | ||||||||||||||||||
Change in open trade equity/(deficit) | (955,908 | ) | 3,773,587 | 1,391,567 | ||||||||||||||||||||
|
|
| ||||||||||||||||||||||
Net income/(loss) | $ | (4,388,194 | ) | $ | (4,822,846 | ) | $ | (1,445,375 | ) | |||||||||||||||
|
|
| ||||||||||||||||||||||
Condensed Statement of Income - For the Six Months | Frontier Trading Company II LLC | Frontier Trading Company VII LLC | Frontier Trading Company XXXVIII LLC | |||||||||||||||||||||
Interest income | $ | (1,630 | ) | $ | 589 | $ | 707 | |||||||||||||||||
Net realized gain/(loss) on investments, less | (3,941,511 | ) | (5,937,702 | ) | (3,827,270 | ) | ||||||||||||||||||
Change in open trade equity/(deficit) | 3,752,063 | 523,855 | 1,996,206 | |||||||||||||||||||||
|
|
| ||||||||||||||||||||||
Net income/(loss) | $ | (191,078 | ) | $ | (5,413,258 | ) | $ | (1,830,357 | ) | |||||||||||||||
|
|
| ||||||||||||||||||||||
Statements of Financial Condition - | Frontier Trading Company I LLC | Frontier Trading Company II LLC | Frontier Trading Company VII LLC | Frontier Trading Company XXXVIII LLC | ||||||||||||
Receivable from commission merchants | $ | 22,731,131 | $ | 10,851,264 | $ | 6,694,318 | $ | 2,944,692 | ||||||||
Open trade equity/(deficit) | 3,215,205 | 3,473,284 | 3,469,339 | 1,369,043 | ||||||||||||
Options purchased (written) | 35,396 | — | 76,655 | — | ||||||||||||
Interest receivable/(payable) | (2,027 | ) | 421 | (170 | ) | (52 | ) | |||||||||
|
|
|
|
|
|
|
| |||||||||
Total net asset value | $ | 25,979,705 | $ | 14,324,969 | $ | 10,240,142 | $ | 4,313,683 | ||||||||
|
|
|
|
|
|
|
| |||||||||
Members’ equity | $ | 25,979,705 | $ | 14,324,969 | $ | 10,240,142 | $ | 4,313,683 | ||||||||
|
|
|
|
|
|
|
| |||||||||
Condensed Statement of Income - For the Three Months | Frontier Trading Company II LLC | Frontier Trading Company VII LLC | Frontier Trading Company XXXVIII LLC | |||||||||||||||||||||||||||||
Statements of Financial Condition - December 31, 2014 | Frontier Trading Company I LLC | Frontier Trading Company II LLC | Frontier Trading Company VII LLC | Frontier Trading Company XV LLC | Frontier Trading Company XXXVIII LLC | |||||||||||||||||||||||||||
Receivable from commission merchants | $ | 13,015,321 | | $ | 18,121,232 | $ | 1,834,790 | $ | 11,072,355 | $ | 4,826,699 | |||||||||||||||||||||
Open trade equity/(deficit) | 2,937,971 | 2,107,459 | 3,617,656 | 3,510,148 | 256,729 | |||||||||||||||||||||||||||
Interest receivable/(payable) | (2,291 | ) | 607 | (160 | ) | 817 | 7 | |||||||||||||||||||||||||
Total assets | $ | 15,951,001 | | $ | 20,229,298 | $ | 5,452,286 | $ | 14,583,320 | $ | 5,083,435 | |||||||||||||||||||||
|
|
|
|
| ||||||||||||||||||||||||||||
Members’ equity | $ | 15,951,001 | | $ | 20,229,298 | $ | 5,452,286 | $ | 14,583,320 | $ | 5,083,435 | |||||||||||||||||||||
|
|
|
|
| ||||||||||||||||||||||||||||
Condensed Statement of Income - For the Three Months Ended June 30, 2014 | Frontier Trading Company I LLC | Frontier Trading Company II LLC | Frontier Trading Company VII LLC | Frontier Trading Company XV LLC | Frontier Trading Company XXXVIII LLC | |||||||||||||||||||||||||||
Interest income | $ | (992 | ) | $ | 438 | $ | 430 | $ | 12,520 | $ | (1,560 | ) | $ | 857 | $ | 2,012 | $ | 497 | ||||||||||||||
Net realized gain/(loss) on investments, less commissions | (8,874,767 | ) | (11,505,782 | ) | (3,512,349 | ) | ||||||||||||||||||||||||||
Net realized gain/(loss) on investments, less | (4,217,338 | ) | (5,965,412 | ) | 5,454,372 | 1,510,226 | 735,318 | |||||||||||||||||||||||||
Change in open trade equity/(deficit) | 849,059 | 6,507,341 | 755,355 | (312,487 | ) | 69,697 | (1,329,358 | ) | (1,504,440 | ) | 431,576 | |||||||||||||||||||||
|
|
| ||||||||||||||||||||||||||||||
|
|
|
|
| ||||||||||||||||||||||||||||
Net income/(loss) | $ | (8,026,700 | ) | $ | (4,998,003 | ) | $ | (2,756,564 | ) | $ | (4,517,305 | ) | $ | (5,897,275 | ) | $ | 4,125,871 | $ | 7,798 | $ | 1,167,391 | |||||||||||
|
|
|
|
|
|
|
| |||||||||||||||||||||||||
Condensed Statement of Income - For the Three Months | Frontier Trading Company II LLC | Frontier Trading Company XV LLC | Frontier Trading Company XXXVIII LLC | |||||||||||||||||||||||||||||
Condensed Statement of Income - For the Six Months Ended June 30, 2014 | Frontier Trading Company I LLC | Frontier Trading Company II LLC | Frontier Trading Company VII LLC | Frontier Trading Company XV LLC | Frontier Trading Company XXXVIII LLC | |||||||||||||||||||||||||||
Interest income | $ | (960 | ) | $ | 225 | $ | 1,419 | $ | 12,520 | $ | (2,520 | ) | $ | 857 | $ | 2,237 | $ | 1,916 | ||||||||||||||
Net realized gain/(loss) on investments, less commissions | (1,944,172 | ) | (2,824,060 | ) | 3,795,824 | |||||||||||||||||||||||||||
Net realized gain/(loss) on investments, less | (4,217,338 | ) | (7,909,584 | ) | 5,454,372 | (1,313,834 | ) | 4,531,142 | ||||||||||||||||||||||||
Change in open trade equity/(deficit) | 2,144,137 | 4,241,630 | 2,832,210 | (312,487 | ) | 2,213,834 | (1,329,358 | ) | 2,737,190 | 3,263,786 | ||||||||||||||||||||||
|
|
| ||||||||||||||||||||||||||||||
|
|
|
|
| ||||||||||||||||||||||||||||
Net income/(loss) | $ | 199,005 | $ | 1,417,795 | $ | 6,629,453 | $ | (4,517,305 | ) | $ | (5,698,270 | ) | $ | 4,125,871 | $ | 1,425,593 | $ | 7,796,844 | ||||||||||||||
|
|
|
|
|
|
|
| |||||||||||||||||||||||||
6. Transactions with Affiliates
The Managing Owner contributes funds to the Trust, with respect to the Series, in order to have a 1% interest in the aggregate capital, profits and losses of all Series and in return will receive units designated as general units in the Series in which the Managing Owner invests such funds. The general units may only be purchased by the Managing Owner and may be subject to no advisory fees or advisory fees at reduced rates. Otherwise, the general units hold the same rights as the limited units. The Managing Owner is required
to maintain at least a 1% interest (“Minimum Purchase Commitment”) in the aggregate capital, profits and losses of all Series so long as it is acting as the Managing Owner of the Trust. Such contribution was made by the Managing Owner before trading commenced for the Trust and will be maintained throughout the existence of the Trust, and the Managing Owner will make such purchases as are necessary to effect this requirement. Additionally, the Managing Owner agreed with certain regulatory bodies to maintain a 1% interest specifically in the Equinox Frontier Balanced Fund Class 1a and 2a Units, aggregated, and each of the Equinox Frontier Long/Short Commodity Fund, Equinox Frontier Diversified Fund and Equinox Frontier Masters Fund. The 1% interest in these specific Series is included in computing the Minimum Purchase Commitment in aggregate capital. In addition to the general units the Managing Owner receives in respect of its Minimum Purchase Commitment, the Managing Owner may purchase limited units in any Series as a Limited Owner. Principals of the Managing Owner or affiliates are allowed to own beneficial interests in the Trust, with respect to the Series, as well. All Units purchased by the Managing Owner are held for investment purposes only and not for resale. The Managing Owner may make purchases or redemptions at any time on the same terms as any Limited Owner. The Trust has and will continue to have certain relationships with the Managing Owner and its affiliates.
Expenses
Management Fees—Each Series of Units pays to the Managing Owner a monthly management fee equal to a percentage of the nominal assets of such Series, calculated on a daily basis. The total amount of assets of a series allocated to trading advisors and/or reference programs, including (i) actual funds deposited in accounts directed by the trading advisors or deposited as margin in respect of swaps or other derivative instruments referencing a reference program plus (ii) any notional equity allocated to the trading advisors and any reference programs, is referred to herein as the “nominal assets” of the series. The annual rate of the management fee is: 0.5%
for the Equinox Frontier Balanced Fund Class 1, Class 2 and Class 3, 1.0% for the Equinox Frontier Balanced Fund Class 1a, Class 2a and Class 3a, 2.0% for the Equinox Frontier Winton Fund, Equinox Frontier Long/Short Commodity Fund Class 1a, Class 2a, and Class 3a and Equinox Frontier Masters Fund, 0.75% for Equinox Frontier Diversified Fund, 2.5% for the Equinox Frontier Heritage Fund and Equinox Frontier Select Fund, and 3.5% for the Equinox Frontier Long/Short Commodity Fund Class 1, Class 2 and Class 3. The Managing Owner may pay all or a portion of such management fees to the Trading Advisor(s) and/or waive (up to the percentage specified) any such management fee to the extent any related management fee is paid by a trading company or estimated management fee is embedded in a swap or other derivative instrument. Any management fee embedded in a swap or other derivative instrument may be greater or less than the management fee that would otherwise be charged to the series by the Managing Owner. As of the date of this Form 10-K, the trading advisor for a series that has invested in a swap has not received any management fees directly from the series for such swap, and instead the relevant trading advisor receives compensation via the fees embedded in the swap.
The management fee as a percentage of the applicable series’ net asset value will be greater than the percentage indicated above to the extent that the nominal assets of the series exceeds its net asset value. The managing owner expects that the nominal assets of each series will generally be maintained at a level in excess of the net asset value of such series and such excess may be substantial to the extent the managing owner deems necessary to achieve the desired level of volatility.
Trading Fees—In connection with each Series’ trading activities, the Equinox Frontier Long/Short Commodity Fund (Classes 1, 2 and 3), Equinox Frontier Balanced Fund, Equinox Frontier Select Fund, Equinox Frontier Winton Fund and Equinox Frontier Heritage Fund pays to the Managing Owner a trading fee, or FCM Fee, up to 0.75% of such Series’ NAV, calculated daily. The Equinox Frontier Diversified Fund, Equinox Frontier Long/Short Commodity Fund (Classes 1a, 2a and 2a)3a) and Equinox Frontier Masters Fund pays to the Managing Owner a trading fee, or FCM Fee, up to 2.25% and a custodial/due diligence fee of 0.12% of such Series’ NAV, calculated daily.
Incentive Fees—Some Series pay to the Managing Owner an incentive fee of a certain percentage of new net trading profits generated by such Series, monthly or quarterly. Because the Equinox Frontier Balanced Fund, Equinox Frontier Heritage Fund, Equinox Frontier Select Fund, and Equinox Frontier Long/Short Commodity Fund may each employ multiple Trading Advisors, these Series will pay the Managing Owner a monthly incentive fee calculated on a Trading Advisor by Trading Advisor basis. It is therefore possible that in any given period the Series may pay incentive fees to the Managing Owner for one or more Trading Advisors while each of these Series as a whole experiences losses. The incentive fee is 25% for the Equinox Frontier Balanced Fund and the Equinox Frontier Diversified Fund and 20% for the Equinox Frontier Winton Fund, Equinox Frontier Heritage Fund, Equinox Frontier Select Fund, Equinox Frontier Long/Short Commodity Fund and Equinox Frontier Masters Fund. The Managing Owner may pay all or a portion of such incentive fees to the Trading Advisor(s) for such Series.
Service Fees—In addition, with respect to Class 1 and Class 1a Units of each Series, as applicable, the Series pays monthly or service fees to the Managing Owner of up to 3% of NAV annually, which the Managing Owner pays to selling agents of the Trust, with respect to the Series.
The following table summarizes fees earned by the Managing Owner for the three and six months ended March 31,June 30, 2015 and 2014:
Three Months Ended March 31, 2015 | Incentive Fee | Management Fee | Service Fee | Trading Fee | ||||||||||||
Equinox Frontier Diversified Fund | $ | 1,634,242 | $ | 246,304 | $ | 121,918 | $ | 370,802 | ||||||||
Equinox Frontier Masters Fund | 535,302 | 178,660 | 65,178 | 153,633 | ||||||||||||
Equinox Frontier Long/Short Commodity Fund | 239,217 | 123,036 | 31,900 | 68,928 | ||||||||||||
Equinox Frontier Balanced Fund | 1,486,957 | 259,595 | 562,801 | 195,344 | ||||||||||||
Equinox Frontier Select Fund | 158,971 | 80,072 | 106,901 | 29,893 | ||||||||||||
Equinox Frontier Winton Fund | 715,409 | 323,105 | 205,337 | 76,976 | ||||||||||||
Equinox Frontier Heritage Fund | 132,676 | 77,898 | 77,017 | 25,691 | ||||||||||||
Three Months Ended March 31, 2014 | Incentive Fee | Management Fee | Service Fee | Trading Fee | ||||||||||||||||||||||||||||
Three Months Ended June 30, 2015 | Incentive Fee | Management Fee | Service Fee | Trading Fee | ||||||||||||||||||||||||||||
Equinox Frontier Diversified Fund | $ | 432,084 | $ | 276,556 | $ | 148,411 | $ | 342,565 | $ | 4,000 | $ | 243,004 | $ | 108,250 | $ | 351,096 | ||||||||||||||||
Equinox Frontier Masters Fund | 13,712 | 277,080 | 104,283 | 175,915 | 41,072 | 182,496 | 60,813 | 147,701 | ||||||||||||||||||||||||
Equinox Frontier Long/Short Commodity Fund | — | 286,630 | 38,564 | 81,977 | 40,149 | 131,237 | 29,629 | 65,150 | ||||||||||||||||||||||||
Equinox Frontier Balanced Fund | 551,286 | 290,385 | 549,448 | 187,399 | 9,517 | 267,377 | 556,081 | 194,144 | ||||||||||||||||||||||||
Equinox Frontier Select Fund | — | 138,438 | 105,588 | 29,402 | — | 78,206 | 101,967 | 28,454 | ||||||||||||||||||||||||
Equinox Frontier Winton Fund | — | 280,373 | 182,964 | 64,595 | — | 307,212 | 198,125 | 74,984 | ||||||||||||||||||||||||
Equinox Frontier Heritage Fund | — | 80,009 | 72,725 | 23,099 | — | 70,986 | 74,974 | 25,063 | ||||||||||||||||||||||||
Three Months Ended June 30, 2014 | Incentive Fee | Management Fee | Service Fee | Trading Fee | ||||||||||||||||||||||||||||
Equinox Frontier Diversified Fund | $ | 954,829 | $ | 271,073 | $ | 125,184 | $ | 307,242 | ||||||||||||||||||||||||
Equinox Frontier Masters Fund | 168,094 | 230,233 | 76,310 | 147,195 | ||||||||||||||||||||||||||||
Equinox Frontier Long/Short Commodity Fund | — | 223,050 | 30,304 | 64,027 | ||||||||||||||||||||||||||||
Equinox Frontier Balanced Fund | 902,054 | 264,152 | 492,255 | 167,758 | ||||||||||||||||||||||||||||
Equinox Frontier Select Fund | 26,677 | 140,286 | 97,799 | 27,150 | ||||||||||||||||||||||||||||
Equinox Frontier Winton Fund | 415,629 | 287,648 | 177,981 | 64,049 | ||||||||||||||||||||||||||||
Equinox Frontier Heritage Fund | 86,999 | 81,966 | 65,875 | 21,279 | ||||||||||||||||||||||||||||
Six Months Ended June 30, 2015 | Incentive Fee | Management Fee | Service Fee | Trading Fee | ||||||||||||||||||||||||||||
Equinox Frontier Diversified Fund | $ | 1,638,242 | $ | 489,308 | $ | 230,168 | $ | 721,898 | ||||||||||||||||||||||||
Equinox Frontier Masters Fund | 576,374 | 361,156 | 125,991 | 301,334 | ||||||||||||||||||||||||||||
Equinox Frontier Long/Short Commodity Fund | 279,366 | 254,273 | 61,529 | 134,078 | ||||||||||||||||||||||||||||
Equinox Frontier Balanced Fund | 1,496,474 | 526,972 | 1,118,882 | 389,488 | ||||||||||||||||||||||||||||
Equinox Frontier Select Fund | 158,971 | 158,278 | 208,868 | 58,347 | ||||||||||||||||||||||||||||
Equinox Frontier Winton Fund | 715,409 | 630,317 | 403,462 | 151,960 | ||||||||||||||||||||||||||||
Equinox Frontier Heritage Fund | 132,676 | 148,884 | 151,991 | 50,754 | ||||||||||||||||||||||||||||
Six Months Ended June 30, 2014 | Incentive Fee | Management Fee | Service Fee | Trading Fee | ||||||||||||||||||||||||||||
Equinox Frontier Diversified Fund | $ | 1,386,913 | $ | 547,629 | $ | 273,595 | $ | 649,807 | ||||||||||||||||||||||||
Equinox Frontier Masters Fund | 181,806 | 507,313 | 180,593 | 323,110 | ||||||||||||||||||||||||||||
Equinox Frontier Long/Short Commodity Fund | — | 509,680 | 68,868 | 146,001 | ||||||||||||||||||||||||||||
Equinox Frontier Balanced Fund | 1,453,340 | 554,537 | 1,041,703 | 355,157 | ||||||||||||||||||||||||||||
Equinox Frontier Select Fund | 26,677 | 278,724 | 203,387 | 56,552 | ||||||||||||||||||||||||||||
Equinox Frontier Winton Fund | 415,629 | 568,021 | 360,945 | 128,644 | ||||||||||||||||||||||||||||
Equinox Frontier Heritage Fund | 86,999 | 161,975 | 138,600 | 44,378 | ||||||||||||||||||||||||||||
The following table summarizes amountsfees payable to the Managing Owner as of March 31,June 30, 2015 and December 31, 2014.2014:
As of March 31, 2015 | ||||||||||||||||||||
| Incentive Fees | Management Fees | Interest Fees | Service Fees | Trading Fees | ||||||||||||||||
Equinox Frontier Diversified Fund | $ | 1,634,242 | $ | 88,283 | $ | 17,078 | $ | 33,996 | $ | 143,660 | ||||||||||
Equinox Frontier Masters Fund | 535,301 | 67,463 | 6,125 | 21,211 | 56,844 | |||||||||||||||
Equinox Frontier Long/Short Commodity Fund | 239,216 | 43,562 | 4,460 | 11,078 | 25,446 | |||||||||||||||
Equinox Frontier Balanced Fund | 1,486,957 | 93,825 | 111,110 | 176,661 | 71,244 | |||||||||||||||
Equinox Frontier Select Fund | 158,971 | 28,962 | 7,379 | 35,716 | 10,852 | |||||||||||||||
Equinox Frontier Winton Fund | 715,409 | 115,137 | 66,427 | 53,254 | 27,597 | |||||||||||||||
Equinox Frontier Heritage Fund | 132,678 | 27,355 | 14,885 | 23,142 | 9,353 | |||||||||||||||
As of December 31, 2014 | ||||||||||||||||||||||||||||||||||||||||
| Incentive Fees | Management Fees | Interest Fees | Service Fees | Trading Fees | ||||||||||||||||||||||||||||||||||||
As of June 30, 2015 | ||||||||||||||||||||||||||||||||||||||||
| Incentive Fees | Management Fees | Interest Fees | Service Fees | Trading Fees | ||||||||||||||||||||||||||||||||||||
Equinox Frontier Diversified Fund | $ | 2,387,825 | $ | 86,486 | $ | 16,168 | $ | 34,905 | $ | 132,984 | $ | 4,000 | $ | 83,476 | $ | 15,798 | $ | 36,650 | $ | 124,327 | ||||||||||||||||||||
Equinox Frontier Masters Fund | 722,043 | 64,497 | 6,898 | 17,260 | 55,912 | 41,071 | 60,312 | 5,738 | 15,452 | 50,813 | ||||||||||||||||||||||||||||||
Equinox Frontier Long/Short Commodity Fund | 158,660 | 45,361 | 3,713 | 10,562 | 24,436 | 40,149 | 45,710 | 3,616 | 9,149 | 21,626 | ||||||||||||||||||||||||||||||
Equinox Frontier Balanced Fund | 1,793,318 | 101,208 | 84,976 | 167,151 | 66,037 | 9,517 | 91,646 | 101,040 | 156,201 | 65,193 | ||||||||||||||||||||||||||||||
Equinox Frontier Select Fund | 185,791 | 27,835 | 13,263 | 32,520 | 10,119 | — | 26,065 | 6,451 | 29,617 | 9,285 | ||||||||||||||||||||||||||||||
Equinox Frontier Winton Fund | 1,178,364 | 114,823 | 63,722 | 52,753 | 26,690 | — | 102,252 | 61,319 | 46,288 | 24,963 | ||||||||||||||||||||||||||||||
Equinox Frontier Heritage Fund | 239,327 | 27,944 | 14,543 | 20,964 | 8,676 | — | 23,699 | 13,738 | 19,744 | 8,305 | ||||||||||||||||||||||||||||||
As of December 31, 2014 | ||||||||||||||||||||||||||||||||||||||||
| Incentive Fees | Management Fees | Interest Fees | Service Fees | Trading Fees | ||||||||||||||||||||||||||||||||||||
Equinox Frontier Diversified Fund | $ | 2,387,825 | $ | 86,486 | $ | 16,168 | $ | 34,905 | $ | 132,984 | ||||||||||||||||||||||||||||||
Equinox Frontier Masters Fund | 722,043 | 64,497 | 6,898 | 17,260 | 55,912 | |||||||||||||||||||||||||||||||||||
Equinox Frontier Long/Short Commodity Fund | 158,660 | 45,361 | 3,713 | 10,562 | 24,436 | |||||||||||||||||||||||||||||||||||
Equinox Frontier Balanced Fund | 1,793,318 | 101,208 | 84,976 | 167,151 | 66,037 | |||||||||||||||||||||||||||||||||||
Equinox Frontier Select Fund | 185,791 | 27,835 | 13,263 | 32,520 | 10,119 | |||||||||||||||||||||||||||||||||||
Equinox Frontier Winton Fund | 1,178,364 | 114,823 | 63,722 | 52,753 | 26,690 | |||||||||||||||||||||||||||||||||||
Equinox Frontier Heritage Fund | 239,327 | 27,944 | 14,543 | 20,964 | 8,676 | |||||||||||||||||||||||||||||||||||
With respect to the service fees, the initial service fee (for the first 12 months) relating to a purchase of Units by an investor is prepaid by the Managing Owner to the relevant selling agent in the month following such purchase and is reimbursed therefore by the Series monthly in arrears in an amount based upon a corresponding percentage of NAV, calculated daily. Consequently, the Managing Owner bears the risk and the benefit of the upside potential of any difference between the amount of the initial service fee prepaid by it and the amount of the reimbursement thereof, which may result from variations in NAV over the following 12 months.
For the threesix months ended March 31,June 30, 2015, amounts paid or owed to the Managing Owner for the difference in monthly service fees from prepaid initial service fees were $2,462$4,500 for the Equinox Frontier Balanced Fund, ($338)$530 for the Equinox Frontier Long/Short Commodity Fund, $1,133$1,173 for the Equinox Frontier Diversified Fund, $97$211 for the Equinox Frontier Select Fund, $286$595 for the Equinox Frontier Heritage Fund, $4,220$7,984 for the Equinox Frontier Winton Fund and ($598)$74 for the Equinox Frontier Masters Fund.
For the threesix months ended March 31,June 30, 2014, amounts paid or owed to the Managing Owner for the difference in monthly service fees from prepaid initial service fees were ($2,936) for the Equinox Frontier Balanced Fund, $21 for the Equinox Frontier Long/Short Commodity Fund, ($2,476) for the Equinox Frontier Diversified Fund, ($160) for the Equinox Frontier Select Fund, ($1,171) for the Equinox Frontier Heritage Fund, ($3,280) for the Equinox Frontier Winton Fund and $1,264 for the Equinox Frontier Masters Fund.
Aggregate interest income from all sources, including U.S. Treasury Securities assets net of premiums and cash held at clearing brokers, of up to the first 2% (annualized) is paid to the Managing Owner by the Equinox Frontier Balanced Fund (Class 1, and Class 2 only), Equinox Frontier Winton Fund, Equinox Frontier Select Fund, and Equinox Frontier Heritage Fund. For the Equinox Frontier Diversified Fund, Equinox Frontier Long/Short Commodity Fund, Equinox Frontier Masters Fund, and Equinox Frontier Balanced Fund (Class 1a and Class 2a only), 20% of the total interest allocated to each Series is paid to the Managing Owner.
The following table outlines the interest paid by each Series to the Managing Owner and its ratio to average net assets for the three and six months ended March 31,June 30, 2015 and 2014:
| 2015 | 2014 | 2015 | 2014 | |||||||||||||
| Gross Amount Paid to the Managing Owner | Gross Amount Paid to the Managing Owner | Ratio to Average Net Assets | Ratio to Average Net Assets | |||||||||||||
Equinox Frontier Diversified Fund Class 1 | $ | 13,441 | $ | 18,329 | 0.07 | % | 0.07 | % | ||||||||
Equinox Frontier Diversified Fund Class 2 | 24,311 | 22,729 | 0.08 | % | 0.07 | % | ||||||||||
Equinox Frontier Diversified Fund Class 3 | 4,562 | 161 | 0.13 | % | 0.03 | % | ||||||||||
Equinox Frontier Masters Fund Class 1 | 8,161 | 15,782 | 0.07 | % | 0.08 | % | ||||||||||
Equinox Frontier Masters Fund Class 2 | 6,281 | 7,629 | 0.08 | % | 0.08 | % | ||||||||||
Equinox Frontier Masters Fund Class 3 | 3,349 | 407 | 0.11 | % | 0.08 | % | ||||||||||
Equinox Frontier Long/Short Commodity Fund Class 2 | 895 | 1,996 | 0.07 | % | 0.08 | % | ||||||||||
Equinox Frontier Long/Short Commodity Fund Class 3 | 5,174 | 6,853 | 0.07 | % | 0.08 | % | ||||||||||
Equinox Frontier Long/Short Commodity Fund Class 1a | 4,027 | 6,010 | 0.07 | % | 0.08 | % | ||||||||||
Equinox Frontier Long/Short Commodity Fund Class 2a | 1,188 | 2,152 | 0.07 | % | 0.08 | % | ||||||||||
Equinox Frontier Long/Short Commodity Fund Class 3a | 480 | 302 | 0.09 | % | 0.08 | % | ||||||||||
Equinox Frontier Balanced Fund Class 1 | 206,350 | 265,807 | 0.33 | % | 0.36 | % | ||||||||||
Equinox Frontier Balanced Fund Class 1AP | 2,192 | n/a | 0.01 | % | n/a | |||||||||||
Equinox Frontier Balanced Fund Class 2 | 69,007 | 87,195 | 0.34 | % | 0.36 | % | ||||||||||
Equinox Frontier Balanced Fund Class 2a | 322 | 341 | 0.06 | % | 0.07 | % | ||||||||||
Equinox Frontier Balanced Fund Class 3a | 1,475 | 1,584 | 0.07 | % | 0.07 | % | ||||||||||
Equinox Frontier Select Fund Class 1 | 24,071 | 50,021 | 0.19 | % | 0.35 | % | ||||||||||
Equinox Frontier Select Fund Class 1AP | 85 | n/a | 0.00 | % | n/a | |||||||||||
Equinox Frontier Select Fund Class 2 | 2,762 | 5,692 | 0.20 | % | 0.35 | % | ||||||||||
Equinox Frontier Winton Fund Class 1 | 122,407 | 112,028 | 0.53 | % | 0.45 | % | ||||||||||
Equinox Frontier Winton Fund Class 1AP | 177 | n/a | 0.01 | % | n/a | |||||||||||
Equinox Frontier Winton Fund Class 2 | 60,971 | 46,159 | 0.57 | % | 0.45 | % | ||||||||||
Equinox Frontier Heritage Fund Class 1 | 30,992 | 37,170 | 0.37 | % | 0.38 | % | ||||||||||
Equinox Frontier Heritage Fund Class 1AP | 188 | n/a | 0.01 | % | n/a | |||||||||||
Equinox Frontier Heritage Fund Class 2 | 10,169 | 10,045 | 0.38 | % | 0.38 | % | ||||||||||
|
|
|
| |||||||||||||
Total | $ | 603,037 | $ | 698,392 | ||||||||||||
|
|
|
| |||||||||||||
| 6/30/2015 | 6/30/2014 | 6/30/2015 | 6/30/2014 | |||||||||||||
| Gross Amount Paid to the Managing Owner | Gross Amount Paid to the Managing Owner | Ratio to Average Net Assets | Ratio to Average Net Assets | |||||||||||||
Equinox Frontier Diversified Fund Class 1 | $ | 11,399 | $ | 13,962 | 0.06 | % | 0.07 | % | ||||||||
Equinox Frontier Diversified Fund Class 2 | 22,235 | 19,214 | 0.06 | % | 0.07 | % | ||||||||||
Equinox Frontier Diversified Fund Class 3 | 5,152 | 699 | 0.07 | % | 0.06 | % | ||||||||||
Equinox Frontier Masters Fund Class 1 | 7,621 | 10,192 | 0.07 | % | 0.07 | % | ||||||||||
Equinox Frontier Masters Fund Class 2 | 6,063 | 6,395 | 0.07 | % | 0.07 | % | ||||||||||
Equinox Frontier Masters Fund Class 3 | 3,480 | 1,270 | 0.07 | % | 0.07 | % | ||||||||||
Equinox Frontier Long/Short Commodity Fund Class 2 | 801 | 860 | 0.06 | % | 0.07 | % | ||||||||||
Equinox Frontier Long/Short Commodity Fund Class 3 | 4,837 | 5,172 | 0.06 | % | 0.07 | % | ||||||||||
Equinox Frontier Long/Short Commodity Fund Class 1a | 3,600 | 4,191 | 0.06 | % | 0.07 | % | ||||||||||
Equinox Frontier Long/Short Commodity Fund Class 2a | 1,075 | 1,393 | 0.06 | % | 0.07 | % | ||||||||||
Equinox Frontier Long/Short Commodity Fund Class 3a | 469 | 286 | 0.06 | % | 0.07 | % | ||||||||||
Equinox Frontier Balanced Fund Class 1 | 224,354 | 214,182 | 0.30 | % | 0.33 | % | ||||||||||
Equinox Frontier Balanced Fund Class 1AP | 2,435 | N/A | 0.01 | % | N/A | |||||||||||
Equinox Frontier Balanced Fund Class 2 | 76,515 | 69,432 | 0.30 | % | 0.33 | % | ||||||||||
Equinox Frontier Balanced Fund Class 2a | 358 | 309 | 0.06 | % | 0.07 | % | ||||||||||
Equinox Frontier Balanced Fund Class 3a | 1,642 | 1,355 | 0.06 | % | 0.07 | % | ||||||||||
Equinox Frontier Select Fund Class 1 | 17,252 | 39,857 | 0.12 | % | 0.31 | % | ||||||||||
Equinox Frontier Select Fund Class 1AP | 64 | N/A | 0.00 | % | N/A | |||||||||||
Equinox Frontier Select Fund Class 2 | 1,941 | 4,400 | 0.12 | % | 0.31 | % | ||||||||||
Equinox Frontier Winton Fund Class 1 | 119,313 | 101,949 | 0.44 | % | 0.43 | % | ||||||||||
Equinox Frontier Winton Fund Class 1AP | 177 | N/A | 0.00 | % | N/A | |||||||||||
Equinox Frontier Winton Fund Class 2 | 42,458 | 44,763 | 0.31 | % | 0.43 | % | ||||||||||
Equinox Frontier Heritage Fund Class 1 | 30,474 | 30,529 | 0.30 | % | 0.35 | % | ||||||||||
Equinox Frontier Heritage Fund Class 1AP | 193 | N/A | 0.01 | % | N/A | |||||||||||
Equinox Frontier Heritage Fund Class 2 | 10,079 | 8,905 | 0.30 | % | 0.35 | % | ||||||||||
|
|
|
| |||||||||||||
Total | $ | 593,987 | $ | 579,315 | ||||||||||||
|
|
|
| |||||||||||||
Six Months Ended
| 6/30/2015 | 6/30/2014 | 6/30/2015 | 6/30/2014 | |||||||||||||
| Gross Amount Paid to the Managing Owner | Gross Amount Paid to the Managing Owner | Ratio to Average Net Assets | Ratio to Average Net Assets | |||||||||||||
Equinox Frontier Diversified Fund Class 1 | $ | 24,840 | $ | 32,290 | 0.13 | % | 0.15 | % | ||||||||
Equinox Frontier Diversified Fund Class 2 | 46,546 | 41,944 | 0.13 | % | 0.14 | % | ||||||||||
Equinox Frontier Diversified Fund Class 3 | 9,714 | 860 | 0.13 | % | 0.08 | % | ||||||||||
Equinox Frontier Masters Fund Class 1 | 15,782 | 25,974 | 0.14 | % | 0.18 | % | ||||||||||
Equinox Frontier Masters Fund Class 2 | 12,344 | 14,025 | 0.14 | % | 0.16 | % | ||||||||||
Equinox Frontier Masters Fund Class 3 | 6,829 | 1,677 | 0.14 | % | 0.09 | % | ||||||||||
Equinox Frontier Long/Short Commodity Fund Class 2 | 1,696 | 2,856 | 0.13 | % | 0.24 | % | ||||||||||
Equinox Frontier Long/Short Commodity Fund Class 3 | 10,011 | 12,025 | 0.13 | % | 0.17 | % | ||||||||||
Equinox Frontier Long/Short Commodity Fund Class 1a | 7,628 | 10,200 | 0.13 | % | 0.18 | % | ||||||||||
Equinox Frontier Long/Short Commodity Fund Class 2a | 2,263 | 3,544 | 0.13 | % | 0.18 | % | ||||||||||
Equinox Frontier Long/Short Commodity Fund Class 3a | 949 | 588 | 0.13 | % | 0.15 | % | ||||||||||
Equinox Frontier Balanced Fund Class 1 | 430,704 | 479,990 | 0.57 | % | 0.73 | % | ||||||||||
Equinox Frontier Balanced Fund Class 1AP | 4,627 | N/A | 0.02 | % | N/A | |||||||||||
Equinox Frontier Balanced Fund Class 2 | 145,522 | 156,628 | 0.57 | % | 0.74 | % | ||||||||||
Equinox Frontier Balanced Fund Class 2a | 680 | 650 | 0.12 | % | 0.14 | % | ||||||||||
Equinox Frontier Balanced Fund Class 3a | 3,118 | 2,939 | 0.11 | % | 0.14 | % | ||||||||||
Equinox Frontier Select Fund Class 1 | 41,323 | 89,879 | 0.29 | % | 0.69 | % | ||||||||||
Equinox Frontier Select Fund Class 1AP | 149 | N/A | 0.00 | % | N/A | |||||||||||
Equinox Frontier Select Fund Class 2 | 4,702 | 10,092 | 0.29 | % | 0.70 | % | ||||||||||
Equinox Frontier Winton Fund Class 1 | 241,720 | 213,976 | 0.89 | % | 0.90 | % | ||||||||||
Equinox Frontier Winton Fund Class 1AP | 354 | N/A | 0.01 | % | N/A | |||||||||||
Equinox Frontier Winton Fund Class 2 | 103,429 | 90,922 | 0.76 | % | 0.87 | % | ||||||||||
Equinox Frontier Heritage Fund Class 1 | 61,466 | 67,699 | 0.60 | % | 0.77 | % | ||||||||||
Equinox Frontier Heritage Fund Class 1AP | 381 | N/A | 0.01 | % | N/A | |||||||||||
Equinox Frontier Heritage Fund Class 2 | 20,247 | 18,948 | 0.60 | % | 0.74 | % | ||||||||||
|
|
|
| |||||||||||||
Total | $ | 1,197,024 | $ | 1,277,706 | ||||||||||||
|
|
|
| |||||||||||||
The Managing Owner, under an amended contract, paid to The Bornhoft Group Corporation, an affiliate of the Trust, an annual payment of $1,100,000 for the first year of the contract and $600,000 for the second year of the contract, and $300,000 for the third and final year for investment and advisor services and 0.1% annually thereafter of the trading level with the Equinox Frontier Balanced Fund in lieu of a monthly service fee. The Managing Owner paid $139,848 and $221,095 respectively under this agreement for the three months ended March 31,June 30, 2015 and 2014, respectively. These amounts have no impact on the Series’ financial statements. This contract will endended April 30, 2015.
Equinox Financial Group, LLC, an affiliate of the Trust, provides management services for the Managing Owner who paid $305,000$730,000 and $230,000, respectively,$241,667 for the six months ended June 30, 2015 and 2014, and $425,000 and $91,667 for the three months ended March 31, 2015 andJune 30, 2014, respectively. These amounts have no impact on the Series’ financial statements.
Solon Capital, LLC, an affiliate of the Trust, provides product development and marketing services. For these services, the Managing Owner paid Solon Capital, LLC, $316,272$623,715 and $208,417,$581,681, respectively, for the six months ended June 30, 2015 and 2014 and $307,442 and $272,694 for the three months ended March 31,June 30, 2015 and 2014.2014, respectively. These amounts have no impact on the Series’ financial statements.
Equinox Group Distributors LLC, an affiliate under common control of the Managing Owner, serves as wholesaler of the Trust by marketing to broker/dealer organizations.
7. Financial Highlights
The following information presents the financial highlights of the Trust, with respect to the Series, for the three and six months ended March 31,June 30, 2015 and 2014.
| Equinox Frontier Diversified Fund (5) | Equinox Frontier Masters Fund | Equinox Frontier Long/Short Commodity Fund | ||||||||||||||||||||||||||||||||||||||||||
| Class 1 | Class 2 | Class 3 | Class 1 | Class 2 | Class 3 | Class 2 | Class 3 | Class 1a | Class 2a | Class 3a | ||||||||||||||||||||||||||||||||||
Per unit operating performance (1) | ||||||||||||||||||||||||||||||||||||||||||||
Net asset value, December 31, 2014 | $ | 113.09 | $ | 124.67 | $ | 115.03 | $ | 116.61 | $ | 128.53 | $ | 119.06 | $ | 138.30 | $ | 138.34 | $ | 101.12 | $ | 111.35 | $ | 111.77 | ||||||||||||||||||||||
Net operating results: | ||||||||||||||||||||||||||||||||||||||||||||
Interest income | 0.34 | 0.37 | 0.34 | 0.34 | 0.37 | 0.34 | 0.40 | 0.40 | 0.29 | 0.33 | 0.33 | |||||||||||||||||||||||||||||||||
Expenses | (5.23 | ) | (4.95 | ) | (4.58 | ) | (4.79 | ) | (4.54 | ) | (4.21 | ) | (3.70 | ) | (3.71 | ) | (3.29 | ) | (2.98 | ) | (2.99 | ) | ||||||||||||||||||||||
Net gain/(loss) on investments, net of non-controlling interests | 23.46 | 25.67 | 23.78 | 16.22 | 17.76 | 16.54 | 31.20 | 31.03 | 22.58 | 24.79 | 24.98 | |||||||||||||||||||||||||||||||||
|
|
|
|
|
|
|
|
|
|
|
|
|
|
|
|
|
|
|
|
|
| |||||||||||||||||||||||
Net income/(loss) | 18.57 | 21.09 | 19.54 | 11.77 | 13.59 | 12.67 | 27.90 | 27.72 | 19.58 | 22.14 | 22.32 | |||||||||||||||||||||||||||||||||
|
|
|
|
|
|
|
|
|
|
|
|
|
|
|
|
|
|
|
|
|
| |||||||||||||||||||||||
Net asset value, March 31, 2015 | $ | 131.66 | $ | 145.76 | $ | 134.57 | $ | 128.38 | $ | 142.12 | $ | 131.73 | $ | 166.20 | $ | 166.06 | $ | 120.70 | $ | 133.49 | $ | 134.09 | ||||||||||||||||||||||
|
|
|
|
|
|
|
|
|
|
|
|
|
|
|
|
|
|
|
|
|
| |||||||||||||||||||||||
Ratios to average net assets (3) | ||||||||||||||||||||||||||||||||||||||||||||
Net investment income/(loss) | -8.00 | % | -5.53 | % | -5.53 | % | -8.34 | % | -6.12 | % | -6.12 | % | -4.59 | % | -4.59 | % | -6.69 | % | -4.59 | % | -4.41 | % | ||||||||||||||||||||||
Expenses before incentive fees (4) | 6.48 | % | 4.01 | % | 4.01 | % | 7.40 | % | 5.17 | % | 5.17 | % | 4.32 | % | 4.32 | % | 6.42 | % | 4.32 | % | 4.09 | % | ||||||||||||||||||||||
Expenses after incentive fees (4) | 9.10 | % | 6.63 | % | 6.63 | % | 9.45 | % | 7.23 | % | 7.23 | % | 5.65 | % | 5.65 | % | 7.75 | % | 5.65 | % | 5.47 | % | ||||||||||||||||||||||
Total return before incentive fees (2) | 19.04 | % | 19.53 | % | 19.60 | % | 12.15 | % | 12.63 | % | 12.70 | % | 21.50 | % | 21.36 | % | 20.69 | % | 21.21 | % | 21.35 | % | ||||||||||||||||||||||
Total return after incentive fees (2) | 16.42 | % | 16.92 | % | 16.99 | % | 10.09 | % | 10.57 | % | 10.64 | % | 20.17 | % | 20.04 | % | 19.36 | % | 19.88 | % | 19.97 | % | ||||||||||||||||||||||
| Equinox Frontier Balanced Fund (6) | Equinox Frontier Select Fund (6) | |||||||||||||||||||||||||||||||
| Class 1 | Class 1AP | Class 2 | Class 2a | Class 3a | Class 1 | Class 1AP | Class 2 | |||||||||||||||||||||||||
Per unit operating performance (1) | ||||||||||||||||||||||||||||||||
Net asset value, December 31, 2014 | $ | 131.54 | $ | 133.20 | $ | 179.16 | $ | 153.02 | $ | 152.52 | $ | 95.61 | $ | 96.82 | $ | 128.48 | ||||||||||||||||
Net operating results: | ||||||||||||||||||||||||||||||||
Interest income | 0.01 | 0.01 | 0.01 | 0.01 | 0.01 | 0.00 | 0.00 | 0.00 | ||||||||||||||||||||||||
Expenses | (3.68 | ) | (2.67 | ) | (3.59 | ) | (3.07 | ) | (3.06 | ) | (2.46 | ) | (1.73 | ) | (2.29 | ) | ||||||||||||||||
Net gain/(loss) on investments, net of non-controlling interests | 20.93 | 21.26 | 28.59 | 24.80 | 24.72 | 13.01 | 13.22 | 17.54 | ||||||||||||||||||||||||
|
|
|
|
|
|
|
|
|
|
|
|
|
|
|
| |||||||||||||||||
Net income/(loss) | 17.26 | 18.60 | 25.01 | 21.74 | 21.67 | 10.55 | 11.49 | 15.25 | ||||||||||||||||||||||||
|
|
|
|
|
|
|
|
|
|
|
|
|
|
|
| |||||||||||||||||
Net asset value, March 31, 2015 | $ | 148.80 | $ | 151.80 | $ | 204.17 | $ | 174.76 | $ | 174.19 | $ | 106.16 | $ | 108.31 | $ | 143.73 | ||||||||||||||||
|
|
|
|
|
|
|
|
|
|
|
|
|
|
|
| |||||||||||||||||
Ratios to average net assets (3) | ||||||||||||||||||||||||||||||||
Net investment income/(loss) | -6.17 | % | -3.14 | % | -3.14 | % | -3.14 | % | -3.14 | % | -6.75 | % | -3.75 | % | -3.75 | % | ||||||||||||||||
Expenses before incentive fees (4) | 4.78 | % | 1.76 | % | 1.76 | % | 1.76 | % | 1.76 | % | 5.77 | % | 2.76 | % | 2.76 | % | ||||||||||||||||
Expenses after incentive fees (4) | 6.19 | % | 3.17 | % | 3.17 | % | 3.17 | % | 3.17 | % | 6.75 | % | 3.75 | % | 3.75 | % | ||||||||||||||||
Total return before incentive fees (2) | 14.54 | % | 15.38 | % | 15.38 | % | 15.62 | % | 15.62 | % | 12.02 | % | 12.85 | % | 12.85 | % | ||||||||||||||||
Total return after incentive fees (2) | 13.12 | % | 13.96 | % | 13.96 | % | 14.21 | % | 14.21 | % | 11.03 | % | 11.87 | % | 11.87 | % | ||||||||||||||||
| Equinox Frontier Winton Fund (6) | Equinox Frontier Heritage Fund (6) | Equinox Frontier Diversified Fund | Equinox Frontier Masters Fund | Equinox Frontier Long/Short Commodity Fund | ||||||||||||||||||||||||||||||||||||||||||||||||||||||||||||||||||
| Class 1 | Class 1AP | Class 2 | Class 1 | Class 1AP | Class 2 | Class 1 | Class 2 | Class 3 | Class 1 | Class 2 | Class 3 | Class 2 | Class 3 | Class 1a | Class 2a | Class 3a | ||||||||||||||||||||||||||||||||||||||||||||||||||||||
Per unit operating performance (1) | ||||||||||||||||||||||||||||||||||||||||||||||||||||||||||||||||||||||
Net asset value, December 31, 2014 | $ | 175.95 | $ | 178.18 | $ | 226.23 | $ | 130.28 | $ | 131.93 | $ | 176.56 | ||||||||||||||||||||||||||||||||||||||||||||||||||||||||||
Net asset value, March 31, 2015 | $ | 131.66 | $ | 145.76 | $ | 134.57 | $ | 128.38 | $ | 142.12 | $ | 131.73 | $ | 166.20 | $ | 166.06 | $ | 120.70 | $ | 133.49 | $ | 134.09 | ||||||||||||||||||||||||||||||||||||||||||||||||
Net operating results: | ||||||||||||||||||||||||||||||||||||||||||||||||||||||||||||||||||||||
Interest income | 0.00 | 0.00 | 0.00 | 0.00 | 0.00 | 0.00 | 0.32 | 0.36 | 0.33 | 0.33 | 0.36 | 0.34 | 0.39 | 0.39 | 0.28 | 0.31 | 0.31 | |||||||||||||||||||||||||||||||||||||||||||||||||||||
Expenses | (6.31 | ) | (5.03 | ) | (6.38 | ) | (3.44 | ) | (2.43 | ) | (3.26 | ) | (2.02 | ) | (1.39 | ) | (1.28 | ) | (2.44 | ) | (1.97 | ) | (1.82 | ) | (2.12 | ) | (2.12 | ) | (2.11 | ) | (1.70 | ) | (1.71 | ) | ||||||||||||||||||||||||||||||||||||
Net gain/(loss) on investments, net of non-controlling interests | 22.26 | 22.62 | 28.71 | 21.03 | 21.36 | 28.59 | (14.41 | ) | (16.24 | ) | (14.92 | ) | (16.26 | ) | (18.19 | ) | (16.80 | ) | (16.31 | ) | (16.13 | ) | (11.70 | ) | (13.07 | ) | (13.05 | ) | ||||||||||||||||||||||||||||||||||||||||||
|
|
|
|
|
|
|
|
|
|
|
|
|
|
|
|
| ||||||||||||||||||||||||||||||||||||||||||||||||||||||
Net income/(loss) | 15.95 | 17.59 | 22.33 | 17.59 | 18.93 | 25.33 | (16.11 | ) | (17.27 | ) | (15.87 | ) | (18.37 | ) | (19.80 | ) | (18.28 | ) | (18.04 | ) | (17.86 | ) | (13.53 | ) | (14.46 | ) | (14.45 | ) | ||||||||||||||||||||||||||||||||||||||||||
|
|
|
|
|
|
|
|
|
|
|
|
|
|
|
|
| ||||||||||||||||||||||||||||||||||||||||||||||||||||||
Net asset value, March 31, 2015 | $ | 191.90 | $ | 195.77 | $ | 248.56 | $ | 147.87 | $ | 150.86 | $ | 201.89 | ||||||||||||||||||||||||||||||||||||||||||||||||||||||||||
|
|
|
|
|
| |||||||||||||||||||||||||||||||||||||||||||||||||||||||||||||||||
Net asset value, June 30, 2015 | $ | 115.55 | $ | 128.49 | $ | 118.70 | $ | 110.01 | $ | 122.32 | $ | 113.45 | $ | 148.16 | $ | 148.20 | $ | 107.17 | $ | 119.03 | $ | 119.64 | ||||||||||||||||||||||||||||||||||||||||||||||||
|
|
|
|
|
|
|
|
|
|
| ||||||||||||||||||||||||||||||||||||||||||||||||||||||||||||
Ratios to average net assets (3) | ||||||||||||||||||||||||||||||||||||||||||||||||||||||||||||||||||||||
Net investment income/(loss) | -8.63 | % | -5.63 | % | -5.63 | % | -7.00 | % | -3.99 | % | -3.99 | % | -5.46 | % | -2.97 | % | -2.97 | % | -6.56 | % | -4.36 | % | -4.36 | % | -3.82 | % | -3.82 | % | -5.89 | % | -3.82 | % | -3.79 | % | ||||||||||||||||||||||||||||||||||||
Expenses before incentive fees (4) | 6.91 | % | 3.90 | % | 3.90 | % | 6.05 | % | 3.03 | % | 3.03 | % | 6.50 | % | 4.01 | % | 4.01 | % | 7.50 | % | 5.30 | % | 5.30 | % | 4.59 | % | 4.59 | % | 6.67 | % | 4.59 | % | 4.55 | % | ||||||||||||||||||||||||||||||||||||
Expenses after incentive fees (4) | 8.63 | % | 5.63 | % | 5.63 | % | 7.00 | % | 3.99 | % | 3.99 | % | 6.51 | % | 4.02 | % | 4.02 | % | 7.67 | % | 5.46 | % | 5.46 | % | 4.83 | % | 4.83 | % | 6.90 | % | 4.83 | % | 4.80 | % | ||||||||||||||||||||||||||||||||||||
Total return before incentive fees (2) | 10.79 | % | 11.59 | % | 11.59 | % | 14.46 | % | 15.31 | % | 15.30 | % | -12.23 | % | -11.84 | % | -11.79 | % | -14.14 | % | -13.77 | % | -13.71 | % | -10.62 | % | -10.52 | % | -10.98 | % | -10.60 | % | -10.53 | % | ||||||||||||||||||||||||||||||||||||
Total return after incentive fees (2) | 9.07 | % | 9.87 | % | 9.87 | % | 13.50 | % | 14.35 | % | 14.35 | % | -12.24 | % | -11.85 | % | -11.79 | % | -14.31 | % | -13.93 | % | -13.88 | % | -10.85 | % | -10.76 | % | -11.21 | % | -10.83 | % | -10.78 | % | ||||||||||||||||||||||||||||||||||||
| Equinox Frontier Balanced Fund | Equinox Frontier Select Fund | |||||||||||||||||||||||||||||||||||||||||||||||||||||||||||||||||||||
| Class 1 | Class 1AP | Class 2 | Class 2a | Class 3a | Class 1 | Class 1AP | Class 2 | |||||||||||||||||||||||||||||||||||||||||||||||||||||||||||||||
Per unit operating performance (1) | ||||||||||||||||||||||||||||||||||||||||||||||||||||||||||||||||||||||
Net asset value, March 31, 2015 | $ | 148.80 | $ | 151.80 | $ | 204.17 | $ | 174.76 | $ | 174.19 | $ | 106.16 | $ | 108.31 | $ | 143.73 | ||||||||||||||||||||||||||||||||||||||||||||||||||||||
Net operating results: | ||||||||||||||||||||||||||||||||||||||||||||||||||||||||||||||||||||||
Interest income | 0.01 | 0.01 | 0.02 | 0.01 | 0.01 | 0.00 | 0.00 | 0.00 | ||||||||||||||||||||||||||||||||||||||||||||||||||||||||||||||
Expenses | (1.71 | ) | (0.66 | ) | (0.89 | ) | (0.76 | ) | (0.76 | ) | (1.42 | ) | (0.70 | ) | (0.93 | ) | ||||||||||||||||||||||||||||||||||||||||||||||||||||||
Net gain/(loss) on investments, net of non-controlling interests | (15.28 | ) | (15.66 | ) | (21.06 | ) | (17.65 | ) | (17.59 | ) | (17.43 | ) | (17.87 | ) | (23.71 | ) | ||||||||||||||||||||||||||||||||||||||||||||||||||||||
|
|
|
|
|
|
|
| |||||||||||||||||||||||||||||||||||||||||||||||||||||||||||||||
Net income/(loss) | (16.98 | ) | (16.31 | ) | (21.93 | ) | (18.40 | ) | (18.34 | ) | (18.85 | ) | (18.57 | ) | (24.64 | ) | ||||||||||||||||||||||||||||||||||||||||||||||||||||||
|
|
|
|
|
|
|
| |||||||||||||||||||||||||||||||||||||||||||||||||||||||||||||||
Net asset value, June 30, 2015 | $ | 131.82 | $ | 135.49 | $ | 182.24 | $ | 156.36 | $ | 155.85 | $ | 87.31 | $ | 89.74 | $ | 119.09 | ||||||||||||||||||||||||||||||||||||||||||||||||||||||
|
|
|
|
|
|
|
| |||||||||||||||||||||||||||||||||||||||||||||||||||||||||||||||
Ratios to average net assets (3) | ||||||||||||||||||||||||||||||||||||||||||||||||||||||||||||||||||||||
Net investment income/(loss) | -4.76 | % | -1.76 | % | -1.76 | % | -1.76 | % | -1.76 | % | -5.81 | % | -2.81 | % | -2.81 | % | ||||||||||||||||||||||||||||||||||||||||||||||||||||||
Expenses before incentive fees (4) | 4.78 | % | 1.78 | % | 1.78 | % | 1.78 | % | 1.78 | % | 5.81 | % | 2.81 | % | 2.81 | % | ||||||||||||||||||||||||||||||||||||||||||||||||||||||
Expenses after incentive fees (4) | 4.79 | % | 1.79 | % | 1.79 | % | 1.79 | % | 1.79 | % | 5.81 | % | 2.81 | % | 2.81 | % | ||||||||||||||||||||||||||||||||||||||||||||||||||||||
Total return before incentive fees (2) | -11.40 | % | -10.74 | % | -10.73 | % | -10.52 | % | -10.52 | % | -17.76 | % | -17.15 | % | -17.14 | % | ||||||||||||||||||||||||||||||||||||||||||||||||||||||
Total return after incentive fees (2) | -11.41 | % | -10.74 | % | -10.74 | % | -10.53 | % | -10.53 | % | -17.76 | % | -17.15 | % | -17.14 | % | ||||||||||||||||||||||||||||||||||||||||||||||||||||||
| Equinox Frontier Winton Fund | Equinox Frontier Heritage Fund | |||||||||||||||||||||||||||||||||||||||||||||||||||||||||||||||||||||
| Class 1 | Class 1AP | Class 2 | Class 1 | Class 1AP | Class 2 | |||||||||||||||||||||||||||||||||||||||||||||||||||||||||||||||||
Per unit operating performance (1) | ||||||||||||||||||||||||||||||||||||||||||||||||||||||||||||||||||||||
Net asset value, March 31, 2015 | $ | 191.90 | $ | 195.77 | $ | 248.56 | $ | 147.87 | $ | 150.86 | $ | 201.89 | ||||||||||||||||||||||||||||||||||||||||||||||||||||||||||
Net operating results: | ||||||||||||||||||||||||||||||||||||||||||||||||||||||||||||||||||||||
Interest income | 0.00 | 0.00 | 0.00 | 0.00 | 0.00 | 0.00 | ||||||||||||||||||||||||||||||||||||||||||||||||||||||||||||||||
Expenses | (3.06 | ) | (1.76 | ) | (2.23 | ) | (2.01 | ) | (1.01 | ) | (1.35 | ) | ||||||||||||||||||||||||||||||||||||||||||||||||||||||||||
Net gain/(loss) on investments, net of non-controlling interests | (22.99 | ) | (23.55 | ) | (29.90 | ) | (19.76 | ) | (20.24 | ) | (27.09 | ) | ||||||||||||||||||||||||||||||||||||||||||||||||||||||||||
|
|
|
|
|
| |||||||||||||||||||||||||||||||||||||||||||||||||||||||||||||||||
Net income/(loss) | (26.05 | ) | (25.31 | ) | (32.13 | ) | (21.77 | ) | (21.25 | ) | (28.44 | ) | ||||||||||||||||||||||||||||||||||||||||||||||||||||||||||
|
|
|
|
|
| |||||||||||||||||||||||||||||||||||||||||||||||||||||||||||||||||
Net asset value, June 30, 2015 | $ | 165.85 | $ | 170.46 | $ | 216.43 | $ | 126.10 | $ | 129.61 | $ | 173.45 | ||||||||||||||||||||||||||||||||||||||||||||||||||||||||||
|
|
|
|
|
| |||||||||||||||||||||||||||||||||||||||||||||||||||||||||||||||||
Ratios to average net assets (3) | ||||||||||||||||||||||||||||||||||||||||||||||||||||||||||||||||||||||
Net investment income/(loss) | -6.83 | % | -3.82 | % | -3.82 | % | -5.88 | % | -2.88 | % | -2.88 | % | ||||||||||||||||||||||||||||||||||||||||||||||||||||||||||
Expenses before incentive fees (4) | 6.83 | % | 3.82 | % | 3.82 | % | 5.88 | % | 2.88 | % | 2.88 | % | ||||||||||||||||||||||||||||||||||||||||||||||||||||||||||
Expenses after incentive fees (4) | 6.83 | % | 3.82 | % | 3.82 | % | 5.88 | % | 2.88 | % | 2.88 | % | ||||||||||||||||||||||||||||||||||||||||||||||||||||||||||
Total return before incentive fees (2) | -13.57 | % | -12.93 | % | -12.93 | % | -14.72 | % | -14.09 | % | -14.09 | % | ||||||||||||||||||||||||||||||||||||||||||||||||||||||||||
Total return after incentive fees (2) | -13.57 | % | -12.93 | % | -12.93 | % | -14.72 | % | -14.09 | % | -14.09 | % | ||||||||||||||||||||||||||||||||||||||||||||||||||||||||||
| (1) | Interest income and expenses per unit are calculated by dividing these amounts by the average number of units outstanding during the period. The net gain/(loss) on investments, net of non-controlling interests is a balancing amount necessary to reconcile the change in net asset value per unit with the other per unit information. |
| (2) | Impact of incentive fee computed using average net assets, otherwise computed using average units outstanding during the period prior to the effects of any non-controlling transactions. An owner’s total returns may vary from the above returns based on the timing of contributions and withdrawals. Total returns are not annualized. |
| (3) | Annualized with the exception of incentive fees. |
| (4) | Expense ratios do not reflect interest allocated to the Managing Owner as such expenses are not included in the Statements of Operations of the Series, see footnote 6. |
| Equinox Frontier Diversified Fund (5) | Equinox Frontier Masters Fund | Equinox Frontier Long/Short Commodity Fund | Equinox Frontier Diversified Fund | Equinox Frontier Masters Fund | Equinox Frontier Long/Short Commodity Fund | |||||||||||||||||||||||||||||||||||||||||||||||||||||||||||||||||||||||||||||||||||
| Class 1 | Class 2 | Class 3 | Class 1 | Class 2 | Class 3 | Class 2 | Class 3 | Class 1a | Class 2a | Class 3a | Class 1 | Class 2 | Class 3 | Class 1 | Class 2 | Class 3 | Class 2 | Class 3 | Class 1a | Class 2a | Class 3a | |||||||||||||||||||||||||||||||||||||||||||||||||||||||||||||||||||
Per unit operating performance (1) | ||||||||||||||||||||||||||||||||||||||||||||||||||||||||||||||||||||||||||||||||||||||||
Net asset value, December 31, 2013 | $ | 87.10 | $ | 94.35 | $ | 84.21 | $ | 91.83 | $ | 99.46 | $ | 91.91 | $ | 125.26 | $ | 125.30 | $ | 92.73 | $ | 100.34 | $ | 100.47 | ||||||||||||||||||||||||||||||||||||||||||||||||||||||||||||||||||
Net asset value, December 31, 2014 | $ | 113.09 | $ | 124.67 | $ | 115.03 | $ | 116.61 | $ | 128.53 | $ | 119.06 | $ | 138.30 | $ | 138.34 | $ | 101.12 | $ | 111.35 | $ | 111.77 | ||||||||||||||||||||||||||||||||||||||||||||||||||||||||||||||||||
Net operating results: | ||||||||||||||||||||||||||||||||||||||||||||||||||||||||||||||||||||||||||||||||||||||||
Interest income | 0.23 | 0.25 | 0.23 | 0.28 | 0.30 | 0.28 | 0.38 | 0.38 | 0.28 | 0.30 | 0.30 | 0.66 | 0.73 | 0.68 | 0.67 | 0.74 | 0.68 | 0.79 | 0.79 | 0.58 | 0.64 | 0.64 | ||||||||||||||||||||||||||||||||||||||||||||||||||||||||||||||||||
Expenses | (1.97 | ) | (1.62 | ) | (1.50 | ) | (1.82 | ) | (1.47 | ) | (1.36 | ) | (2.03 | ) | (2.02 | ) | (1.94 | ) | (1.62 | ) | (1.61 | ) | (7.34 | ) | (6.43 | ) | (5.94 | ) | (7.24 | ) | (6.53 | ) | (6.03 | ) | (5.86 | ) | (5.86 | ) | (5.42 | ) | (4.71 | ) | (4.73 | ) | ||||||||||||||||||||||||||||||||||||||||||||
Net gain/(loss) on investments, net of non-controlling interests | (2.59 | ) | (2.93 | ) | (0.02 | ) | (2.99 | ) | (3.34 | ) | (3.03 | ) | (12.13 | ) | (12.15 | ) | (8.65 | ) | (9.46 | ) | (9.42 | ) | 9.13 | 9.51 | 8.93 | (0.03 | ) | (0.42 | ) | (0.26 | ) | 14.93 | 14.93 | 10.90 | 11.76 | 11.96 | ||||||||||||||||||||||||||||||||||||||||||||||||||||
|
|
|
|
|
|
|
|
|
|
|
|
|
|
|
|
|
|
|
|
|
| |||||||||||||||||||||||||||||||||||||||||||||||||||||||||||||||||||
Net income/(loss) | (4.33 | ) | (4.30 | ) | (1.29 | ) | (4.53 | ) | (4.50 | ) | (4.11 | ) | (13.78 | ) | (13.79 | ) | (10.31 | ) | (10.78 | ) | (10.73 | ) | 2.46 | 3.82 | 3.67 | (6.60 | ) | (6.21 | ) | (5.61 | ) | 9.86 | 9.86 | 6.05 | 7.68 | 7.87 | ||||||||||||||||||||||||||||||||||||||||||||||||||||
|
|
|
|
|
|
|
|
|
|
|
|
|
|
|
|
|
|
|
|
|
| |||||||||||||||||||||||||||||||||||||||||||||||||||||||||||||||||||
Net asset value, March 31, 2014 | $ | 82.77 | $ | 90.05 | $ | 82.92 | $ | 87.30 | $ | 94.96 | $ | 87.80 | $ | 111.48 | $ | 111.51 | $ | 82.42 | $ | 89.56 | $ | 89.74 | ||||||||||||||||||||||||||||||||||||||||||||||||||||||||||||||||||
|
|
|
|
|
|
|
|
|
|
| ||||||||||||||||||||||||||||||||||||||||||||||||||||||||||||||||||||||||||||||
Net asset value, June 30, 2015 | $ | 115.55 | $ | 128.49 | $ | 118.70 | $ | 110.01 | $ | 122.32 | $ | 113.45 | $ | 148.16 | $ | 148.20 | $ | 107.17 | $ | 119.03 | $ | 119.64 | ||||||||||||||||||||||||||||||||||||||||||||||||||||||||||||||||||
|
|
|
|
|
|
|
|
|
|
| ||||||||||||||||||||||||||||||||||||||||||||||||||||||||||||||||||||||||||||||
Ratios to average net assets (3) | ||||||||||||||||||||||||||||||||||||||||||||||||||||||||||||||||||||||||||||||||||||||||
Net investment income/(loss) | -6.17 | % | -3.86 | % | -3.86 | % | -6.99 | % | -4.87 | % | -4.87 | % | -5.64 | % | -5.64 | % | -7.73 | % | -5.64 | % | -5.64 | % | -8.11 | % | -5.63 | % | -5.63 | % | -8.60 | % | -6.39 | % | -6.39 | % | -5.01 | % | -5.01 | % | -7.10 | % | -5.01 | % | -4.94 | % | ||||||||||||||||||||||||||||||||||||||||||||
Expenses before incentive fees (4) | 6.57 | % | 4.26 | % | 10.95 | % | 8.23 | % | 6.11 | % | 6.11 | % | 6.94 | % | 6.94 | % | 9.03 | % | 6.94 | % | 6.94 | % | 6.49 | % | 4.01 | % | 4.01 | % | 7.45 | % | 5.24 | % | 5.24 | % | 4.45 | % | 4.45 | % | 6.54 | % | 4.45 | % | 4.31 | % | ||||||||||||||||||||||||||||||||||||||||||||
Expenses after incentive fees (4) | 7.30 | % | 4.99 | % | 11.68 | % | 8.28 | % | 6.15 | % | 6.11 | % | 6.94 | % | 6.94 | % | 9.03 | % | 6.94 | % | 6.94 | % | 9.18 | % | 6.70 | % | 6.70 | % | 9.71 | % | 7.49 | % | 7.49 | % | 6.04 | % | 6.04 | % | 8.13 | % | 6.04 | % | 5.97 | % | ||||||||||||||||||||||||||||||||||||||||||||
Total return before incentive fees (2) | -4.24 | % | -3.82 | % | -0.80 | % | -4.89 | % | -4.48 | % | -4.43 | % | -11.00 | % | -11.01 | % | -11.12 | % | -10.74 | % | -10.68 | % | 4.86 | % | 5.75 | % | 5.88 | % | -3.40 | % | -2.57 | % | -2.45 | % | 8.72 | % | 8.72 | % | 7.57 | % | 8.49 | % | 8.70 | % | ||||||||||||||||||||||||||||||||||||||||||||
Total return after incentive fees (2) | -4.97 | % | -4.56 | % | -1.53 | % | -4.93 | % | -4.52 | % | -4.47 | % | -11.00 | % | -11.01 | % | -11.12 | % | -10.74 | % | -10.68 | % | 2.18 | % | 3.06 | % | 3.19 | % | -5.66 | % | -4.83 | % | -4.71 | % | 7.13 | % | 7.13 | % | 5.98 | % | 6.90 | % | 7.04 | % | ||||||||||||||||||||||||||||||||||||||||||||
| Equinox Frontier Balanced Fund | Equinox Frontier Select Fund | |||||||||||||||||||||||||||||||||||||||||||||||||||||||||||||||||||||||||||||||||||||||
| Class 1 | Class 1AP | Class 2 | Class 2a | Class 3a | Class 1 | Class 1AP | Class 2 | |||||||||||||||||||||||||||||||||||||||||||||||||||||||||||||||||||||||||||||||||
Per unit operating performance (1) | ||||||||||||||||||||||||||||||||||||||||||||||||||||||||||||||||||||||||||||||||||||||||
Net asset value, December 31, 2014 | $ | 131.54 | $ | 133.20 | $ | 179.16 | $ | 153.02 | $ | 152.52 | $ | 95.61 | $ | 96.82 | $ | 128.48 | ||||||||||||||||||||||||||||||||||||||||||||||||||||||||||||||||||||||||
Net operating results: | ||||||||||||||||||||||||||||||||||||||||||||||||||||||||||||||||||||||||||||||||||||||||
Interest income | 0.02 | 0.02 | 0.03 | 0.02 | 0.02 | 0.00 | 0.00 | 0.00 | ||||||||||||||||||||||||||||||||||||||||||||||||||||||||||||||||||||||||||||||||
Expenses | (5.40 | ) | (3.35 | ) | (4.51 | ) | (3.86 | ) | (3.84 | ) | (3.89 | ) | (2.44 | ) | (3.24 | ) | ||||||||||||||||||||||||||||||||||||||||||||||||||||||||||||||||||||||||
Net gain/(loss) on investments, net of non-controlling interests | 5.66 | 5.62 | 7.56 | 7.17 | 7.15 | (4.41 | ) | (4.64 | ) | (6.15 | ) | |||||||||||||||||||||||||||||||||||||||||||||||||||||||||||||||||||||||||||||
|
|
|
|
|
|
|
| |||||||||||||||||||||||||||||||||||||||||||||||||||||||||||||||||||||||||||||||||
Net income/(loss) | 0.28 | 2.29 | 3.08 | 3.34 | 3.33 | (8.30 | ) | (7.08 | ) | (9.39 | ) | |||||||||||||||||||||||||||||||||||||||||||||||||||||||||||||||||||||||||||||
|
|
|
|
|
|
|
| |||||||||||||||||||||||||||||||||||||||||||||||||||||||||||||||||||||||||||||||||
Net asset value, June 30, 2015 | $ | 131.82 | $ | 135.49 | $ | 182.24 | $ | 156.36 | $ | 155.85 | $ | 87.31 | $ | 89.74 | $ | 119.09 | ||||||||||||||||||||||||||||||||||||||||||||||||||||||||||||||||||||||||
|
|
|
|
|
|
|
| |||||||||||||||||||||||||||||||||||||||||||||||||||||||||||||||||||||||||||||||||
Ratios to average net assets (3) | ||||||||||||||||||||||||||||||||||||||||||||||||||||||||||||||||||||||||||||||||||||||||
Net investment income/(loss) | -6.18 | % | -3.17 | % | -3.17 | % | -3.17 | % | -3.17 | % | -6.80 | % | -3.80 | % | -3.80 | % | ||||||||||||||||||||||||||||||||||||||||||||||||||||||||||||||||||||||||
Expenses before incentive fees (4) | 4.78 | % | 1.77 | % | 1.77 | % | 1.77 | % | 1.77 | % | 5.79 | % | 2.79 | % | 2.79 | % | ||||||||||||||||||||||||||||||||||||||||||||||||||||||||||||||||||||||||
Expenses after incentive fees (4) | 6.21 | % | 3.20 | % | 3.20 | % | 3.20 | % | 3.20 | % | 6.80 | % | 3.80 | % | 3.80 | % | ||||||||||||||||||||||||||||||||||||||||||||||||||||||||||||||||||||||||
Total return before incentive fees (2) | 1.65 | % | 3.15 | % | 3.15 | % | 3.62 | % | 3.62 | % | -7.67 | % | -6.30 | % | -6.29 | % | ||||||||||||||||||||||||||||||||||||||||||||||||||||||||||||||||||||||||
Total return after incentive fees (2) | 0.21 | % | 1.72 | % | 1.72 | % | 2.18 | % | 2.18 | % | -8.68 | % | -7.31 | % | -7.31 | % | ||||||||||||||||||||||||||||||||||||||||||||||||||||||||||||||||||||||||
| Equinox Frontier Winton Fund | Equinox Frontier Heritage Fund | |||||||||||||||||||||||||||||||||||||||||||||||||||||||||||||||||||||||||||||||||||||||
| Class 1 | Class 1AP | Class 2 | Class 1 | Class 1AP | Class 2 | |||||||||||||||||||||||||||||||||||||||||||||||||||||||||||||||||||||||||||||||||||
Per unit operating performance (1) | ||||||||||||||||||||||||||||||||||||||||||||||||||||||||||||||||||||||||||||||||||||||||
Net asset value, December 31, 2014 | $ | 175.95 | $ | 178.18 | $ | 226.23 | $ | 130.28 | $ | 131.93 | $ | 176.56 | ||||||||||||||||||||||||||||||||||||||||||||||||||||||||||||||||||||||||||||
Net operating results: | ||||||||||||||||||||||||||||||||||||||||||||||||||||||||||||||||||||||||||||||||||||||||
Interest income | 0.00 | 0.00 | 0.00 | 0.00 | 0.00 | 0.00 | ||||||||||||||||||||||||||||||||||||||||||||||||||||||||||||||||||||||||||||||||||
Expenses | (9.39 | ) | (6.81 | ) | (8.65 | ) | (5.46 | ) | (3.45 | ) | (4.62 | ) | ||||||||||||||||||||||||||||||||||||||||||||||||||||||||||||||||||||||||||||
Net gain/(loss) on investments, net of non-controlling interests | (0.71 | ) | (0.91 | ) | (1.15 | ) | 1.28 | 1.13 | 1.51 | |||||||||||||||||||||||||||||||||||||||||||||||||||||||||||||||||||||||||||||||
|
|
|
|
|
| |||||||||||||||||||||||||||||||||||||||||||||||||||||||||||||||||||||||||||||||||||
Net income/(loss) | (10.10 | ) | (7.72 | ) | (9.80 | ) | (4.18 | ) | (2.32 | ) | (3.11 | ) | ||||||||||||||||||||||||||||||||||||||||||||||||||||||||||||||||||||||||||||
|
|
|
|
|
| |||||||||||||||||||||||||||||||||||||||||||||||||||||||||||||||||||||||||||||||||||
Net asset value, June 30, 2015 | $ | 165.85 | $ | 170.46 | $ | 216.43 | $ | 126.10 | $ | 129.61 | $ | 173.45 | ||||||||||||||||||||||||||||||||||||||||||||||||||||||||||||||||||||||||||||
|
|
|
|
|
| |||||||||||||||||||||||||||||||||||||||||||||||||||||||||||||||||||||||||||||||||||
Ratios to average net assets (3) | ||||||||||||||||||||||||||||||||||||||||||||||||||||||||||||||||||||||||||||||||||||||||
Net investment income/(loss) | -8.62 | % | -5.62 | % | -5.62 | % | -6.94 | % | -3.93 | % | -3.93 | % | ||||||||||||||||||||||||||||||||||||||||||||||||||||||||||||||||||||||||||||
Expenses before incentive fees (4) | 6.87 | % | 3.86 | % | 3.86 | % | 5.96 | % | 2.96 | % | 2.96 | % | ||||||||||||||||||||||||||||||||||||||||||||||||||||||||||||||||||||||||||||
Expenses after incentive fees (4) | 8.62 | % | 5.62 | % | 5.62 | % | 6.94 | % | 3.93 | % | 3.93 | % | ||||||||||||||||||||||||||||||||||||||||||||||||||||||||||||||||||||||||||||
Total return before incentive fees (2) | -3.99 | % | -2.58 | % | -2.58 | % | -2.23 | % | -0.78 | % | -0.79 | % | ||||||||||||||||||||||||||||||||||||||||||||||||||||||||||||||||||||||||||||
Total return after incentive fees (2) | -5.74 | % | -4.33 | % | -4.33 | % | -3.21 | % | -1.76 | % | -1.76 | % | ||||||||||||||||||||||||||||||||||||||||||||||||||||||||||||||||||||||||||||
| Equinox Frontier Balanced Fund | Equinox Frontier Select Fund | |||||||||||||||||||||||
| Class 1 | Class 2 | Class 2a | Class 3a | Class 1 | Class 2 | |||||||||||||||||||
Per unit operating performance (1) | ||||||||||||||||||||||||
Net asset value, December 31, 2013 | $ | 106.29 | $ | 140.49 | $ | 118.80 | $ | 118.41 | $ | 79.86 | $ | 104.14 | ||||||||||||
Net operating results: | ||||||||||||||||||||||||
Interest income | 0.01 | 0.00 | 0.37 | 0.37 | 0.00 | 0.00 | ||||||||||||||||||
Expenses | (1.81 | ) | (1.39 | ) | (1.17 | ) | (1.17 | ) | (1.36 | ) | (1.05 | ) | ||||||||||||
Net gain/(loss) on investments, net of non-controlling interests | (2.49 | ) | (3.29 | ) | (2.83 | ) | (2.81 | ) | (3.49 | ) | (4.54 | ) | ||||||||||||
|
|
|
|
|
|
|
|
|
|
|
| |||||||||||||
Net income/(loss) | (4.30 | ) | (4.68 | ) | (3.63 | ) | (3.61 | ) | (4.85 | ) | (5.59 | ) | ||||||||||||
|
|
|
|
|
|
|
|
|
|
|
| |||||||||||||
Net asset value, March 31, 2014 | $ | 101.99 | $ | 135.81 | $ | 115.17 | $ | 114.80 | $ | 75.01 | $ | 98.55 | ||||||||||||
|
|
|
|
|
|
|
|
|
|
|
| |||||||||||||
Ratios to average net assets (3) | ||||||||||||||||||||||||
Net investment income/(loss) | -5.42 | % | -2.42 | % | -1.17 | % | -1.17 | % | -7.28 | % | -4.28 | % | ||||||||||||
Expenses before incentive fees (4) | 4.91 | % | 1.91 | % | 1.91 | % | 1.91 | % | 7.28 | % | 4.28 | % | ||||||||||||
Expenses after incentive fees (4) | 5.46 | % | 2.46 | % | 2.46 | % | 2.46 | % | 7.28 | % | 4.28 | % | ||||||||||||
Total return before incentive fees (2) | -3.50 | % | -2.79 | % | -2.51 | % | -2.50 | % | -6.07 | % | -5.37 | % | ||||||||||||
Total return after incentive fees (2) | -4.05 | % | -3.33 | % | -3.06 | % | -3.05 | % | -6.07 | % | -5.37 | % | ||||||||||||
| Equinox Frontier Winton Fund | Equinox Frontier Heritage Fund | |||||||||||||||
| Class 1 | Class 2 | Class 1 | Class 2 | |||||||||||||
Per unit operating performance (1) | ||||||||||||||||
Net asset value, December 31, 2013 | $ | 139.59 | $ | 174.17 | $ | 102.05 | $ | 134.21 | ||||||||
Net operating results: | ||||||||||||||||
Interest income | 0.00 | 0.00 | 0.00 | 0.00 | ||||||||||||
Expenses | (2.35 | ) | (1.68 | ) | (1.52 | ) | (1.05 | ) | ||||||||
Net gain/(loss) on investments, net of non-controlling interests | (0.31 | ) | (0.37 | ) | (5.12 | ) | (6.75 | ) | ||||||||
|
|
|
|
|
|
|
| |||||||||
Net income/(loss) | (2.66 | ) | (2.05 | ) | (6.64 | ) | (7.80 | ) | ||||||||
|
|
|
|
|
|
|
| |||||||||
Net asset value, March 31, 2014 | $ | 136.93 | $ | 172.12 | $ | 95.41 | $ | 126.41 | ||||||||
|
|
|
|
|
|
|
| |||||||||
Ratios to average net assets (3) | ||||||||||||||||
Net investment income/(loss) | -7.01 | % | -4.01 | % | -6.35 | % | -3.35 | % | ||||||||
Expenses before incentive fees (4) | 7.01 | % | 4.01 | % | 6.35 | % | 3.35 | % | ||||||||
Expenses after incentive fees (4) | 7.01 | % | 4.01 | % | 6.35 | % | 3.35 | % | ||||||||
Total return before incentive fees (2) | -1.91 | % | -1.18 | % | -6.51 | % | -5.81 | % | ||||||||
Total return after incentive fees (2) | -1.91 | % | -1.18 | % | -6.51 | % | -5.81 | % | ||||||||
| (1) | Interest income and expenses per unit are calculated by dividing these amounts by the average number of units outstanding during the period. The net gain/(loss) on investments, net of non-controlling interests is a balancing amount necessary to reconcile the change in net asset value per unit with the other per unit information. |
| (2) | Impact of incentive fee computed using average net assets, otherwise computed using average units outstanding during the period prior to the effects of any non-controlling transactions. An owner’s total returns may vary from the above returns based on the timing of contributions and withdrawals. Total returns are not annualized. |
| (3) | Annualized with the exception of incentive fees. |
| (4) | Expense ratios do not reflect interest allocated to the Managing Owner as such expenses are not included in the Statements of Operations of the Series, see footnote 6. |
Per unit operating performance (1) Net asset value, March 31, 2014 Net operating results: Interest income Expenses Net gain/(loss) on investments, net of non-controlling interests Net income/(loss) Net asset value, June 30, 2014 Ratios to average net assets (3) Net investment income/(loss) Expenses before incentive fees (4) Expenses after incentive fees (4) Total return before incentive fees (2) Total return after incentive fees (2) Equinox Frontier Diversified Fund (5) Equinox Frontier Masters Fund Equinox Frontier Long/Short Commodity Fund Class 1 Class 2 Class 3 Class 1 Class 2 Class 3 Class 2 Class 3 Class 1a Class 2a Class 3a $ 82.77 $ 90.05 $ 82.92 $ 87.30 $ 94.96 $ 87.80 $ 111.48 $ 111.51 $ 82.42 $ 89.56 $ 89.74 0.22 0.24 0.22 0.25 0.28 0.26 0.32 0.32 0.24 0.26 0.26 (2.93 ) (2.66 ) (2.46 ) (2.42 ) (2.12 ) (1.97 ) (1.95 ) (1.95 ) (1.87 ) (1.57 ) (1.57 ) 6.71 7.18 6.69 7.84 8.45 7.88 2.32 2.32 1.97 2.07 2.13 4.00 4.76 4.45 5.67 6.61 6.17 0.69 0.69 0.34 0.76 0.82 $ 86.77 $ 94.81 $ 87.37 $ 92.97 $ 101.57 $ 93.97 $ 112.17 $ 112.20 $ 82.76 $ 90.32 $ 90.56 -7.61 % -5.26 % -5.26 % -7.78 % -5.61 % -5.61 % -5.80 % -5.80 % -7.89 % -5.80 % -5.80 % 6.82 % 4.47 % 4.47 % 8.26 % 6.09 % 6.09 % 6.96 % 6.96 % 9.04 % 6.96 % 6.96 % 8.65 % 6.31 % 4.47 % 8.93 % 6.77 % 6.09 % 6.96 % 6.96 % 9.04 % 6.96 % 6.96 % 6.67 % 7.12 % 5.37 % 7.17 % 7.64 % 7.03 % 0.62 % 0.62 % 0.41 % 0.85 % 0.91 % 4.83 % 5.29 % 5.37 % 6.49 % 6.96 % 7.03 % 0.62 % 0.62 % 0.41 % 0.85 % 0.91 %
| Equinox Frontier Balanced Fund | Equinox Frontier Select Fund | |||||||||||||||||||||||
| Class 1 | Class 2 | Class 2a | Class 3a | Class 1 | Class 2 | |||||||||||||||||||
Per unit operating performance (1) | ||||||||||||||||||||||||
Net asset value, March 31, 2014 | $ | 101.99 | $ | 135.81 | $ | 115.17 | $ | 114.80 | $ | 75.01 | $ | 98.55 | ||||||||||||
Net operating results: | ||||||||||||||||||||||||
Interest income | 0.01 | 0.01 | 0.01 | 0.01 | 0.00 | 0.00 | ||||||||||||||||||
Expenses | (2.27 | ) | (2.02 | ) | (1.72 | ) | (1.71 | ) | (1.58 | ) | (1.34 | ) | ||||||||||||
Net gain/(loss) on investments, net of non-controlling interests | 4.13 | 5.55 | 5.02 | 4.99 | 4.80 | 6.35 | ||||||||||||||||||
|
|
|
|
|
|
|
|
|
|
|
| |||||||||||||
Net income/(loss) | 1.87 | 3.54 | 3.31 | 3.29 | 3.22 | 5.01 | ||||||||||||||||||
|
|
|
|
|
|
|
|
|
|
|
| |||||||||||||
Net asset value, June 30, 2014 | $ | 103.86 | $ | 139.35 | $ | 118.48 | $ | 118.09 | $ | 78.23 | $ | 103.56 | ||||||||||||
|
|
|
|
|
|
|
|
|
|
|
| |||||||||||||
Ratios to average net assets (3) | ||||||||||||||||||||||||
Net investment income/(loss) | -5.91 | % | -2.91 | % | -2.91 | % | -2.91 | % | -7.82 | % | -4.81 | % | ||||||||||||
Expenses before incentive fees (4) | 4.94 | % | 1.93 | % | 1.93 | % | 1.93 | % | 7.63 | % | 4.63 | % | ||||||||||||
Expenses after incentive fees (4) | 5.94 | % | 2.94 | % | 2.94 | % | 2.94 | % | 7.82 | % | 4.81 | % | ||||||||||||
Total return before incentive fees (2) | 2.84 | % | 3.61 | % | 3.88 | % | 3.87 | % | 4.48 | % | 5.27 | % | ||||||||||||
Total return after incentive fees (2) | 1.83 | % | 2.61 | % | 2.87 | % | 2.87 | % | 4.29 | % | 5.08 | % | ||||||||||||
| Equinox Frontier Winton Fund | Equinox Frontier Heritage Fund | |||||||||||||||
| Class 1 | Class 2 | Class 1 | Class 2 | |||||||||||||
Per unit operating performance (1) | ||||||||||||||||
Net asset value, March 31, 2014 | $ | 136.93 | $ | 172.12 | $ | 95.41 | $ | 126.41 | ||||||||
Net operating results: | ||||||||||||||||
Interest income | 0.00 | 0.00 | 0.00 | 0.00 | ||||||||||||
Expenses | (4.21 | ) | (3.98 | ) | (2.38 | ) | (2.19 | ) | ||||||||
Net gain/(loss) on investments, net of non-controlling interests | 12.35 | 15.58 | 9.55 | 12.71 | ||||||||||||
|
|
|
|
|
|
|
| |||||||||
Net income/(loss) | 8.14 | 11.60 | 7.17 | 10.52 | ||||||||||||
|
|
|
|
|
|
|
| |||||||||
Net asset value, June 30, 2014 | $ | 145.07 | $ | 183.72 | $ | 102.58 | $ | 136.93 | ||||||||
|
|
|
|
|
|
|
| |||||||||
Ratios to average net assets (3) | ||||||||||||||||
Net investment income/(loss) | -8.34 | % | -5.34 | % | -7.41 | % | -4.41 | % | ||||||||
Expenses before incentive fees (4) | 7.13 | % | 4.12 | % | 6.65 | % | 3.64 | % | ||||||||
Expenses after incentive fees (4) | 8.34 | % | 5.34 | % | 7.41 | % | 4.41 | % | ||||||||
Total return before incentive fees (2) | 7.16 | % | 7.95 | % | 8.28 | % | 9.09 | % | ||||||||
Total return after incentive fees (2) | 5.94 | % | 6.74 | % | 7.51 | % | 8.32 | % | ||||||||
| (1) | Interest income and expenses per unit are calculated by dividing these amounts by the average number of units outstanding during the period. The net gain/(loss) on investments, net of non-controlling interests is a balancing amount necessary to reconcile the change in net asset value per unit with the other per unit information. |
| (2) | Impact of incentive fee computed using average net assets, otherwise computed using average units outstanding during the period prior to the effects of any non-controlling transactions. An owner’s total returns may vary from the above returns based on the timing of contributions and withdrawals. Total returns are not annualized. |
| (3) | Annualized with the exception of incentive fees. |
| (4) | Expense ratios do not reflect interest allocated to the Managing Owner as such expenses are not included in the Statements of Operations of the Series, see footnote 6. |
| (5) | Class 3 began operations on February 24, 2014. |
Per unit operating performance (1) Net asset value, December 31, 2013 Net operating results: Interest income Expenses Net gain/(loss) on investments, net of non-controlling interests Net income/(loss) Net asset value, June 30, 2014 Ratios to average net assets (3) Net investment income/(loss) Expenses before incentive fees (4) Expenses after incentive fees (4) Total return before incentive fees (2) Total return after incentive fees (2) Equinox Frontier Diversified Fund (5) Equinox Frontier Masters Fund Equinox Frontier Long/Short Commodity
Fund Class 1 Class 2 Class 3 Class 1 Class 2 Class 3 Class 2 Class 3 Class 1a Class 2a Class 3a $ 87.10 $ 94.35 $ 84.21 $ 91.83 $ 99.46 $ 91.91 $ 125.26 $ 125.30 $ 92.73 $ 100.34 $ 100.47 0.45 0.49 0.45 0.53 0.58 0.54 0.71 0.71 0.52 0.57 0.57 (4.84 ) (4.22 ) (3.88 ) (4.17 ) (3.53 ) (3.30 ) (4.01 ) (3.97 ) (3.82 ) (3.20 ) (3.18 ) 4.06 4.19 6.59 4.78 5.06 4.82 (9.79 ) (9.84 ) (6.67 ) (7.39 ) (7.30 ) (0.33 ) 0.46 3.16 1.14 2.11 2.06 (13.09 ) (13.10 ) (9.97 ) (10.02 ) (9.91 ) $ 86.77 $ 94.81 $ 87.37 $ 92.97 $ 101.57 $ 93.97 $ 112.17 $ 112.20 $ 82.76 $ 90.32 $ 90.56 -8.08 % -5.75 % -5.75 % -7.67 % -5.53 % -5.53 % -5.71 % -5.71 % -7.79 % -5.71 % -5.71 % 6.67 % 4.35 % 22.48 % 8.23 % 6.10 % 6.10 % 6.94 % 6.94 % 9.03 % 6.94 % 6.94 % 9.17 % 6.84 % 22.48 % 8.90 % 6.76 % 6.10 % 6.94 % 6.94 % 9.03 % 6.94 % 6.94 % 2.12 % 2.98 % 3.75 % 1.90 % 2.78 % 2.24 % -10.45 % -10.45 % -10.75 % -9.99 % -9.86 % -0.38 % 0.49 % 3.75 % 1.24 % 2.12 % 2.24 % -10.45 % -10.45 % -10.75 % -9.99 % -9.86 %
| Equinox Frontier Balanced Fund | Equinox Frontier Select Fund | |||||||||||||||||||||||
| Class 1 | Class 2 | Class 2a | Class 3a | Class 1 | Class 2 | |||||||||||||||||||
Per unit operating performance (1) | ||||||||||||||||||||||||
Net asset value, December 31, 2013 | $ | 106.29 | $ | 140.49 | $ | 118.80 | $ | 118.41 | $ | 79.86 | $ | 104.14 | ||||||||||||
Net operating results: | ||||||||||||||||||||||||
Interest income | 0.02 | 0.02 | 0.02 | 0.02 | 0.00 | 0.00 | ||||||||||||||||||
Expenses | (4.05 | ) | (3.37 | ) | (2.86 | ) | (2.85 | ) | (2.93 | ) | (2.37 | ) | ||||||||||||
Net gain/(loss) on investments, net of non-controlling interests | 1.60 | 2.21 | 2.52 | 2.51 | 1.30 | 1.79 | ||||||||||||||||||
|
|
|
|
|
|
|
|
|
|
|
| |||||||||||||
Net income/(loss) | (2.43 | ) | (1.14 | ) | (0.32 | ) | (0.32 | ) | (1.63 | ) | (0.58 | ) | ||||||||||||
|
|
|
|
|
|
|
|
|
|
|
| |||||||||||||
Net asset value, June 30, 2014 | $ | 103.86 | $ | 139.35 | $ | 118.48 | $ | 118.09 | $ | 78.23 | $ | 103.56 | ||||||||||||
|
|
|
|
|
|
|
|
|
|
|
| |||||||||||||
Ratios to average net assets (3) | ||||||||||||||||||||||||
Net investment income/(loss) | -6.41 | % | -3.41 | % | -3.41 | % | -3.41 | % | -7.62 | % | -4.62 | % | ||||||||||||
Expenses before incentive fees (4) | 4.92 | % | 1.92 | % | 1.92 | % | 1.92 | % | 7.45 | % | 4.45 | % | ||||||||||||
Expenses after incentive fees (4) | 6.45 | % | 3.44 | % | 3.44 | % | 3.44 | % | 7.62 | % | 4.62 | % | ||||||||||||
Total return before incentive fees (2) | -0.76 | % | 0.71 | % | 1.25 | % | 1.25 | % | -1.87 | % | -0.38 | % | ||||||||||||
Total return after incentive fees (2) | -2.29 | % | -0.81 | % | -0.27 | % | -0.27 | % | -2.04 | % | -0.56 | % | ||||||||||||
| Equinox Frontier Winton Fund | Equinox Frontier Heritage Fund | |||||||||||||||
| Class 1 | Class 2 | Class 1 | Class 2 | |||||||||||||
Per unit operating performance (1) | ||||||||||||||||
Net asset value, December 31, 2013 | $ | 139.59 | $ | 174.17 | $ | 102.05 | $ | 134.21 | ||||||||
Net operating results: | ||||||||||||||||
Interest income | 0.00 | 0.00 | 0.00 | 0.00 | ||||||||||||
Expenses | (6.51 | ) | (5.60 | ) | (3.85 | ) | (3.18 | ) | ||||||||
Net gain/(loss) on investments, net of non-controlling interests | 11.99 | 15.15 | 4.38 | 5.90 | ||||||||||||
|
|
|
|
|
|
|
| |||||||||
Net income/(loss) | 5.48 | 9.55 | 0.53 | 2.72 | ||||||||||||
|
|
|
|
|
|
|
| |||||||||
Net asset value, June 30, 2014 | $ | 145.07 | $ | 183.72 | $ | 102.58 | $ | 136.93 | ||||||||
|
|
|
|
|
|
|
| |||||||||
Ratios to average net assets (3) | ||||||||||||||||
Net investment income/(loss) | -8.27 | % | -5.27 | % | -7.22 | % | -4.22 | % | ||||||||
Expenses before incentive fees (4) | 7.06 | % | 4.06 | % | 6.49 | % | 3.49 | % | ||||||||
Expenses after incentive fees (4) | 8.27 | % | 5.27 | % | 7.22 | % | 4.22 | % | ||||||||
Total return before incentive fees (2) | 5.13 | % | 6.69 | % | 1.25 | % | 2.76 | % | ||||||||
Total return after incentive fees (2) | 3.93 | % | 5.48 | % | 0.52 | % | 2.03 | % | ||||||||
| (1) | Interest income and expenses per unit are calculated by dividing these amounts by the average number of units outstanding during the period. The net gain/(loss) on investments, net of non-controlling interests is a balancing amount necessary to reconcile the change in net asset value per unit with the other per unit information. |
| (2) | Impact of incentive fee computed using average net assets, otherwise computed using average units outstanding during the period prior to the effects of any non-controlling transactions. An owner’s total returns may vary from the above returns based on the timing of contributions and withdrawals. Total returns are not annualized. |
| (3) | Annualized with the exception of incentive fees. |
| (4) | Expense ratios do not reflect interest allocated to the Managing Owner as such expenses are not included in the Statements of Operations of the Series, see footnote 6. |
| (5) | Class 3 began operations on February 24, 2014. |
8. Derivative Instruments and Hedging Activities
The Series’ primary business is to engage in speculative trading of a diversified portfolio of futures, forwards (including interbank foreign currencies), options contracts and other derivative instruments (including swap contracts). The Series do not enter into or hold positions for hedging purposes as defined under ASC 815,Derivatives and Hedging (“ASC 815”). The detail of the fair value of the Series’ derivatives by instrument types as of March 31,June 30, 2015 and December 31, 2014 is included in the Condensed Schedules of Investments. See Note 4 for further disclosure related to each Series’ position in swap contracts.
The following tables summarize the monthly averages of futures contracts bought and sold for each respective Series of the Trust:
For the Three Months Ended March 31,June 30, 2015
Monthly average contracts:
| Bought | Sold | Bought | Sold | |||||||||||||
Equinox Frontier Select Fund | 546 | 584 | ||||||||||||||
Equinox Frontier Balanced Fund | 1,797 | 1,774 | 1,797 | 1,774 | ||||||||||||
Equinox Frontier Diversified Fund | 2,769 | 2,726 | 2,769 | 2,726 | ||||||||||||
Equinox Frontier Select Fund | 546 | 584 | ||||||||||||||
For the Three Months Ended March 31,June 30, 2014
Monthly average contracts:
| Bought | Sold | |||||||||||||||
| Bought | Sold | |||||||||||||||
Equinox Frontier Long/Short Commodity Fund | 3,519 | 3,829 | 67 | 66 | ||||||||||||
Equinox Frontier Balanced Fund | 4,255 | 4,213 | 3,740 | 3,748 | ||||||||||||
Equinox Frontier Masters Fund | 79 | 113 | ||||||||||||||
For the Six Months Ended June 30, 2015
Monthly average contracts:
| Bought | Sold | |||||||
Equinox Frontier Select Fund | 1,255 | 1,304 | ||||||
Equinox Frontier Balanced Fund | 4,039 | 3,985 | ||||||
Equinox Frontier Diversified Fund | 6,368 | 6,338 | ||||||
For the Six Months Ended June 30, 2014
Monthly average contracts:
| Bought | Sold | |||||||
Equinox Frontier Long/Short Commodity Fund | 3,593 | 3,902 | ||||||
Equinox Frontier Balanced Fund | 8,390 | 8,355 | ||||||
Equinox Frontier Masters Fund | 79 | 113 | ||||||
The following tables summarize the trading revenues for the three and six months ended March 31,June 30, 2015 and 2014 by contract type:
Realized Trading Revenue from Futures, Forwards and Options
for the YearThree Months Ended March 31,June 30, 2015
Type of contract | Equinox Frontier Select Fund | Equinox Frontier Balanced Fund | Equinox Frontier Diversified Fund | Equinox Frontier Select Fund | Equinox Frontier Balanced Fund | Equinox Frontier Diversified Fund | ||||||||||||||||||
Metals | $ | (545,578 | ) | $ | (373,850 | ) | $ | (480,274 | ) | $ | (201,265 | ) | $ | (370,488 | ) | $ | (145,932 | ) | ||||||
Currencies | 333,693 | 1,690,865 | 1,300,174 | (645,245 | ) | (1,169,704 | ) | 259,547 | ||||||||||||||||
Energies | 693,912 | 566,049 | 673,969 | (440,367 | ) | 119,419 | (612,864 | ) | ||||||||||||||||
Agriculturals | (27,708 | ) | 40,555 | 43,268 | (104,895 | ) | (75,520 | ) | (235,594 | ) | ||||||||||||||
Interest rates | 1,052,987 | 2,082,162 | 4,697,960 | (848,640 | ) | (1,397,750 | ) | 427,927 | ||||||||||||||||
Stock indices | 778,321 | 2,269,898 | 2,166,072 | 76,440 | 211,184 | 787,414 | ||||||||||||||||||
|
|
|
|
|
| |||||||||||||||||||
Realized trading income/(loss)(1) | $ | 2,285,627 | $ | 6,275,679 | $ | 8,401,169 | $ | (2,163,972 | ) | $ | (2,682,859 | ) | $ | 480,498 | ||||||||||
|
|
|
|
|
| |||||||||||||||||||
Realized Trading Revenue from Futures, Forwards and Options
for the YearThree Months Ended March 31,June 30, 2014
Type of contract | Equinox Frontier Long/Short Commodity Fund | Equinox Frontier Balanced Fund | Equinox Frontier Diversified Fund | Equinox Frontier Long/Short Commodity Fund | Equinox Frontier Balanced Fund | |||||||||||||||
Metals | $ | (81,704 | ) | $ | (669,721 | ) | $ | (5,850 | ) | $ | 21,000 | $ | (318,434 | ) | ||||||
Currencies | (278,672 | ) | 200,590 | (130,109 | ) | — | (391,938 | ) | ||||||||||||
Energies | (2,017,253 | ) | 42,957 | (783 | ) | 96,785 | (96,424 | ) | ||||||||||||
Agriculturals | 4,242 | 298,097 | (19,987 | ) | (257,049 | ) | (138,369 | ) | ||||||||||||
Interest rates | (227,164 | ) | 3,384,701 | 471,687 | 3,989 | 2,409,585 | ||||||||||||||
Stock indices | 164,056 | 362,538 | 10,906 | (9,090 | ) | 2,647,014 | ||||||||||||||
|
|
|
|
| ||||||||||||||||
Realized trading income/(loss)(1) | $ | (2,436,495 | ) | $ | 3,619,162 | $ | 325,864 | |||||||||||||
Realized trading income/(loss)(1) | $ | (144,365 | ) | $ | 4,111,434 | |||||||||||||||
|
|
|
|
| ||||||||||||||||
Realized Trading Revenue from Futures, Forwards and Options
for the Six Months Ended June 30, 2015
Type of contract | Equinox Frontier Select Fund | Equinox Frontier Balanced Fund | Equinox Frontier Diversified Fund | |||||||||
Metals | $ | (746,843 | ) | $ | (744,338 | ) | $ | (626,206 | ) | |||
Currencies | (311,552 | ) | 521,161 | 1,559,721 | ||||||||
Energies | 253,545 | 685,468 | 19,336 | |||||||||
Agriculturals | (132,603 | ) | (34,965 | ) | (192,326 | ) | ||||||
Interest rates | 206,485 | 712,111 | 5,125,887 | |||||||||
Stock indices | 852,623 | 2,453,383 | 2,995,255 | |||||||||
|
|
|
|
|
| |||||||
Realized trading income/(loss)(1) | $ | 121,655 | $ | 3,592,820 | $ | 8,881,667 | ||||||
|
|
|
|
|
| |||||||
Realized Trading Revenue from Futures, Forwards and Options
for the Six Months Ended June 30, 2014
| Type of contract | Equinox Frontier Long/Short Commodity Fund | Equinox Frontier Balanced Fund | Equinox Frontier Diversified Fund | |||||||||
Metals | $ | (60,704 | ) | $ | (988,064 | ) | $ | (5,850 | ) | |||
Currencies | (278,672 | ) | (191,348 | ) | (130,109 | ) | ||||||
Energies | (1,920,468 | ) | (53,467 | ) | (783 | ) | ||||||
Agriculturals | (252,807 | ) | 159,728 | (19,987 | ) | |||||||
Interest rates | (223,175 | ) | 5,794,195 | 471,687 | ||||||||
Stock indices | 154,966 | 3,009,552 | 10,927 | |||||||||
|
|
|
|
|
| |||||||
Realized trading income/(loss)(1) | $ | (2,580,860 | ) | $ | 7,730,596 | $ | 325,885 | |||||
|
|
|
|
|
| |||||||
| (1) | Amounts recorded in the Statements of Operations under Net realized gain(loss) on futures forwards and options. |
Net Change in Open Trade Equity from Futures, Forwards and Options
for the Three Months Ended March 31,June 30, 2015
Type of contract | Equinox Frontier Select Fund | Equinox Frontier Balanced Fund | Equinox Frontier Diversified Fund | Equinox Frontier Select Fund | Equinox Frontier Balanced Fund | Equinox Frontier Diversified Fund | ||||||||||||||||||
Metals | $ | 406,842 | $ | 84,744 | $ | 169,599 | $ | 138,192 | $ | (77,032 | ) | $ | 6,780 | |||||||||||
Currencies | 72,173 | (201,541 | ) | (702,482 | ) | (98,437 | ) | 165,879 | (364,623 | ) | ||||||||||||||
Energies | (660,346 | ) | (545,488 | ) | (310,222 | ) | (83,883 | ) | (84,762 | ) | (92,955 | ) | ||||||||||||
Agriculturals | 78,938 | (104,841 | ) | 294,460 | (516,454 | ) | 218,632 | (521,317 | ) | |||||||||||||||
Interest rates | (436,930 | ) | (247,430 | ) | (313,845 | ) | (139,963 | ) | (683,706 | ) | (1,291,495 | ) | ||||||||||||
Stock indices | (164,760 | ) | (351,259 | ) | 734,599 | (202,114 | ) | (586,952 | ) | (820,705 | ) | |||||||||||||
|
|
|
|
|
| |||||||||||||||||||
Change in unrealized trading income/(loss)(1) | $ | (704,083 | ) | $ | (1,365,815 | ) | $ | (127,891 | ) | $ | (902,659 | ) | $ | (1,047,941 | ) | $ | (3,084,315 | ) | ||||||
|
|
|
|
|
| |||||||||||||||||||
Net Change in Open Trade Equity from Futures, Forwards and Options
for the Three Months Ended March 31,June 30, 2014
Type of contract | Equinox Frontier Long/Short Commodity Fund | Equinox Frontier Masters Fund | Equinox Frontier Balanced Fund | Equinox Frontier Long/Short Commodity Fund | Equinox Frontier Balanced Fund | |||||||||||||||
Metals | $ | (215,309 | ) | $ | (249,447 | ) | $ | 73,476 | $ | 52,921 | $ | (4,268 | ) | |||||||
Currencies | 7,614 | (172,087 | ) | (195,840 | ) | (14,053 | ) | (18,442 | ) | |||||||||||
Energies | 1,579,466 | (11,266 | ) | (135,932 | ) | 51,961 | 219,801 | |||||||||||||
Agriculturals | (2,194,012 | ) | 167,631 | (73,196 | ) | 1,619,030 | 396,753 | |||||||||||||
Interest rates | 298,530 | (129,512 | ) | 55,085 | 24,050 | 1,252,653 | ||||||||||||||
Stock indices | (282,075 | ) | (1,764,483 | ) | 193,070 | 33,223 | (1,222,734 | ) | ||||||||||||
|
|
|
|
| ||||||||||||||||
Change in unrealized trading income/(loss)(1) | $ | (805,786 | ) | $ | (2,159,164 | ) | $ | (83,337 | ) | $ | 1,767,132 | $ | 623,763 | |||||||
|
|
|
|
| ||||||||||||||||
Net Change in Open Trade Equity from Futures, Forwards and Options
for the Six Months Ended June 30, 2015
Type of contract | Equinox Frontier Select Fund | Equinox Frontier Balanced Fund | Equinox Frontier Diversified Fund | |||||||||
Metals | $ | 545,034 | $ | 7,712 | $ | 176,379 | ||||||
Currencies | (26,264 | ) | (35,662 | ) | (1,067,105 | ) | ||||||
Energies | (744,229 | ) | (630,250 | ) | (403,177 | ) | ||||||
Agriculturals | (437,516 | ) | 113,791 | (226,857 | ) | |||||||
Interest rates | (576,893 | ) | (931,136 | ) | (1,605,340 | ) | ||||||
Stock indices | (366,874 | ) | (938,211 | ) | (86,106 | ) | ||||||
|
|
|
|
|
| |||||||
Change in unrealized trading income/(loss)(1) | $ | (1,606,742 | ) | $ | (2,413,756 | ) | $ | (3,212,206 | ) | |||
|
|
|
|
|
| |||||||
Net Change in Open Trade Equity from Futures, Forwards and Options
for the Six Months Ended June 30, 2014
Type of contract | Equinox Frontier Long/Short Commodity Fund | Equinox Frontier Balanced Fund | Equinox Frontier Diversified Fund | |||||||||
Metals | $ | (162,388 | ) | $ | (253,715 | ) | $ | 73,476 | ||||
Currencies | (6,439 | ) | (190,539 | ) | (195,840 | ) | ||||||
Energies | 1,631,427 | 208,535 | (135,932 | ) | ||||||||
Agriculturals | (574,982 | ) | 564,384 | (73,196 | ) | |||||||
Interest rates | 322,580 | 1,123,141 | 55,085 | |||||||||
Stock indices | (248,852 | ) | (2,987,207 | ) | 193,070 | |||||||
|
|
|
|
|
| |||||||
Change in unrealized trading income/(loss)(1) | $ | 961,346 | $ | (1,535,401 | ) | $ | (83,337 | ) | ||||
|
|
|
|
|
| |||||||
| (1) | Amounts recorded in the Statements of Operations under Net change in open trade equity (deficit). |
Certain financial instruments and derivative instruments are eligible for offset in the statements of financial condition under GAAP. The Series’ open trade equity/(deficit), options written, and receivables from FCMsfutures commissions merchants (each, an “FCM”) are subject to master netting arrangements and collateral arrangements and meet the U.S. GAAP guidance to qualify for offset. A master netting arrangement with a counterparty creates a right of offset for amounts due to and from that same counterparty that is enforceable in the event of a default or bankruptcy. The Series’ policy is to recognize amounts subject to master netting arrangements on a net basis on the statements of financial condition.
The following tables present gross and net information about the Series’ assets and liabilities subject to master netting arrangements as disclosed on the statements of financial condition as of March 31,June 30, 2015 and December 31, 2014.
| As of March 31, 2015 | Gross Amounts of recognized Derivative Assets | Gross Amounts offset in the Statements of Financial Condition | Net Amounts Presented in the Statements of Financial Condition | |||||||||||||||||||||
| As of June 30, 2015 | Gross Amounts of recognized Derivative Assets | Gross Amounts offset in the Statements of Financial Condition | Net Amounts Presented in the Statements of Financial Condition | |||||||||||||||||||||
Equinox Frontier Balanced Fund | ||||||||||||||||||||||||
Open Trade Equity/(Deficit) | $ | 895,618 | $ | (626,640 | ) | $ | 268,978 | $ | 116,357 | $ | (895,320 | ) | $ | (778,963 | ) | |||||||||
Swap Contracts | 23,473,632 | — | 23,473,632 | 18,491,634 | — | 18,491,634 | ||||||||||||||||||
Equinox Frontier Diversified Fund | ||||||||||||||||||||||||
Open Trade Equity/(Deficit) | $ | 2,761,393 | $ | (191,887 | ) | $ | 2,569,506 | $ | — | $ | (571,551 | ) | $ | (571,551 | ) | |||||||||
Options Purchased | 325,003 | — | 325,003 | 374,470 | — | 374,470 | ||||||||||||||||||
Options Written | — | (107,167 | ) | (107,167 | ) | — | (219,660 | ) | (219,660 | ) | ||||||||||||||
Swap Contracts | $ | 9,559,124 | $ | — | $ | 9,559,124 | $ | 7,615,169 | $ | — | 7,615,169 | |||||||||||||
Equinox Frontier Long/Short Commodity Fund | ||||||||||||||||||||||||
Swap Contracts | $ | 5,301,972 | $ | — | $ | 5,301,972 | $ | 4,304,209 | $ | — | 4,304,209 | |||||||||||||
Equinox Frontier Heritage Fund | ||||||||||||||||||||||||
Swap Contracts | $ | 9,600,330 | $ | — | $ | 9,600,330 | $ | 7,809,251 | $ | — | 7,809,251 | |||||||||||||
Equinox Frontier Select Fund | ||||||||||||||||||||||||
Open Trade Equity/(Deficit) | $ | 3,215,206 | $ | — | $ | 958,673 | $ | 153,408 | $ | (97,452 | ) | $ | 55,956 | |||||||||||
| As of December 31, 2014 | Gross Amounts of recognized Derivative Assets | Gross Amounts offset in the Statements of Financial Condition | Net Amounts Presented in the Statements of Financial Condition | Gross Amounts of recognized Derivative Assets | Gross Amounts offset in the Statements of Financial Condition | Net Amounts Presented in the Statements of Financial Condition | ||||||||||||||||||
Equinox Frontier Balanced Fund | ||||||||||||||||||||||||
Open Trade Equity/(Deficit) | $ | 4,281,391 | $ | (983,842 | ) | $ | 3,297,549 | $ | 4,281,391 | $ | (983,842 | ) | $ | 3,297,549 | ||||||||||
Swap Contracts | 18,246,954 | — | 18,246,954 | 18,246,954 | — | 18,246,954 | ||||||||||||||||||
Equinox Frontier Diversified Fund | ||||||||||||||||||||||||
Open Trade Equity/(Deficit) | $ | 3,215,206 | $ | — | $ | 3,215,206 | $ | 3,215,206 | $ | — | $ | 3,215,206 | ||||||||||||
Options Purchased | 288,413 | — | 288,413 | 288,413 | — | 288,413 | ||||||||||||||||||
Options Written | — | (253,018 | ) | (253,018 | ) | — | (253,018 | ) | (253,018 | ) | ||||||||||||||
Swap Contracts | 6,570,408 | — | 6,570,408 | 6,570,408 | — | 6,570,408 | ||||||||||||||||||
Equinox Frontier Long/Short Commodity Fund | ||||||||||||||||||||||||
Swap Contracts | $ | 3,633,060 | $ | — | $ | 3,633,060 | $ | 3,633,060 | $ | — | $ | 3,633,060 | ||||||||||||
Equinox Frontier Heritage Fund | ||||||||||||||||||||||||
Swap Contracts | $ | 7,540,465 | $ | — | $ | 7,540,465 | $ | 7,540,465 | $ | — | $ | 7,540,465 | ||||||||||||
9. Trading Activities and Related Risks
The purchase and sale of futures and options on futures contracts require margin deposits with FCMs. Additional deposits may be necessary for any loss on contract value. The Commodity Exchange Act requires an FCM to segregate all customer transactions and assets from the FCM’s proprietary activities. A customer’s cash and other property (for example, U.S. treasury bills) deposited with an FCM are considered commingled with all other customer funds subject to the FCM’s segregation requirements. In the event of an FCM’s insolvency, recovery may be limited to a pro rata share of segregated funds available. It is possible that the recovered amount could be less than the total of cash and other property deposited.
The term “off-balance sheet risk” refers to an unrecorded potential liability that, even though it does not appear on the statements of financial condition, may result in future obligation or loss in excess of the amount paid by the Series for a particular investment. Each Trading Company expects to trade in futures, options, forward and swap contracts and will therefore be a party to financial instruments with elements of off-balance sheet market and credit risk. In entering into these contracts, there exists a market risk that such contracts may be significantly influenced by market conditions, such as interest rate volatility, resulting in such contracts being less valuable. If the markets should move against all of the futures positions held by a Trading Company in respect of any Series at the same time, and if the Trading Advisor(s) of such Trading Company are unable to offset such futures interests positions, such Trading Company could lose all of its assets and the holders of Units of such Series would realize a 100% loss. The Managing Owner will seek to minimize market risk through real-time monitoring of open positions and the level of diversification of each Trading Advisor’s portfolio. It is anticipated that any Trading Advisor’s margin-to-equity ratio will typically not exceed approximately 35% although the actual ratio could be higher or lower from time to time.
In addition to market risk, trading futures, forward and swap contracts entails credit risk that a counterparty will not be able to meet its obligations to a Trading Company. The counterparty for futures contracts traded in the United States and on most foreign exchanges is
the clearinghouse associated with such exchange. In general, clearinghouses are backed by the corporate members of the clearinghouse who are required to share any financial burden resulting from the non-performance by one of their members and, as such, should significantly reduce this credit risk. In cases where the clearinghouse is not backed by the clearing members, like some foreign exchanges, it is normally backed by a consortium of banks or other financial institutions. Some non-U.S. exchanges, in contrast to U.S. exchanges, are principals’ markets in which performance is the responsibility only of the individual counterparty with whom the Trading Company has entered into the transaction, and not of the exchange or clearing corporation. In these kinds of markets, there is risk of bankruptcy or other failure or refusal to perform by the counterparty.
In the case of forward contracts traded on the interbank market and swaps, neither is traded on exchanges. The counterparty is generally a single bank or other financial institution, rather than a group of financial institutions; thus there may be a greater counterparty credit risk. The Managing Owner expects the Trading Advisors to trade only with those counterparties which it believes to be creditworthy. All positions of each Trading Company will be valued each day on a mark-to-market basis. There can be no assurance that any clearing member, clearinghouse or other counterparty will be able to meet its obligations to any Trading Company.
The Managing Owner has established procedures to actively monitor and minimize market and credit risks. The Limited Owners bear the risk of loss only to the extent of the market value of their respective investments and, in certain specific circumstances, distributions and redemptions received.
10. Indemnifications and Guarantees noted in Management Discussion and Analysis
The Trust has entered into agreements, which provide for the indemnification of futures clearing brokers, and commodity trading advisers, among others, against losses, costs, claims and liabilities arising from the performance of their individual obligations under such agreements, except for gross negligence or bad faith. The Trust has had no prior claims or payments pursuant to these agreements. The Trust’s individual maximum exposure under these arrangements is unknown, as this would involve future claims that may be made against the Trust that have not yet occurred. However, based on experience the Trust expects the risk of loss to be remote. Maximum exposure is unfulfilled obligations of the Series up to the amount of equity at risk with UBS of the referenced Series as allocated from the Trading Company. The Series have not recorded any liability for the guarantees in the accompanying financial statements as it expects any possibility of losses to be remote.
The Trust has guaranteed the obligations of the Trading Companies under the customer agreements with UBS Securities LLC as Clearing Broker. In the event that one Series of the Trust is unable to meet its obligations to UBS Securities LLC, the assets of the other Series will be available to UBS Securities LLC as part of the guarantee, but only to the extent of such Series’ pro rata allocation to the Trading Company. The Series have not recorded any liability for the indemnifications in the accompanying financial statement,statements, as it expects any possibility of losses to be remote.
11. Subsequent Events
Effective as of May 1, 2015, Mr. Richard E. Bornhoft no longer serves on the Executive Committee of the Managing Owner. As of May 1, 2015, the members of the Executive Committee are David DeMuth and Robert J. Enck.None.
Consolidated Statements of Financial Condition
March 31,June 30, 2015 (Unaudited) and December 31, 2014
| 3/31/15 | 12/31/14 | |||||||||||||||
| 6/30/15 | 12/31/14 | |||||||||||||||
| ASSETS | ||||||||||||||||
Cash and cash equivalents | $ | 9,415,473 | $ | 18,977,844 | $ | 21,392,438 | $ | 18,977,844 | ||||||||
U.S. Treasury securities, at fair value | 163,190,625 | 139,953,516 | 128,817,968 | 139,953,516 | ||||||||||||
Receivable from futures commission merchants | 74,616,685 | 65,911,348 | 61,682,864 | 65,911,348 | ||||||||||||
Open trade equity, at fair value | 3,400,773 | 14,824,422 | — | 14,824,422 | ||||||||||||
Options purchased, at fair value | 15,494,973 | 9,075,883 | 3,819,429 | 9,075,883 | ||||||||||||
Swap contracts, at fair value | 47,935,058 | 35,990,887 | 38,220,263 | 35,990,887 | ||||||||||||
Prepaid service fees | 22,502 | 16,042 | 29,917 | 16,042 | ||||||||||||
Interest receivable | 933,358 | 2,151,018 | 2,207,897 | 2,151,018 | ||||||||||||
Receivables from related parties | 4,726 | 5,661 | 5,058 | 5,661 | ||||||||||||
Other assets | 10 | 500,010 | 10 | 500,010 | ||||||||||||
|
|
|
| |||||||||||||
Total Assets | $ | 315,014,183 | $ | 287,406,631 | $ | 256,175,844 | $ | 287,406,631 | ||||||||
|
|
|
| |||||||||||||
| LIABILITIES & CAPITAL | ||||||||||||||||
LIABILITIES | ||||||||||||||||
Open trade deficit, at fair value | $ | — | $ | — | $ | 17,281 | $ | — | ||||||||
Written options, at fair value | 15,201,527 | 8,963,838 | 2,581,870 | 8,963,838 | ||||||||||||
Pending owner additions | 47,103 | 41,954 | 39,168 | 41,954 | ||||||||||||
Owner redemptions payable | 295,022 | 159,066 | 9,883 | 159,066 | ||||||||||||
Incentive fees payable to Managing Owner | 4,902,774 | 6,665,328 | 94,737 | 6,665,328 | ||||||||||||
Management fees payable to Managing Owner | 464,587 | 468,154 | 433,161 | 468,154 | ||||||||||||
Interest payable to Managing Owner | 227,324 | 203,086 | 207,941 | 203,086 | ||||||||||||
Trading fees payable to Managing Owner | 344,996 | 324,854 | 304,512 | 324,854 | ||||||||||||
Service fees payable to Managing Owner | 355,058 | 336,115 | 313,101 | 336,115 | ||||||||||||
Payables to related parties | 46,127 | 37,927 | 52,391 | 37,927 | ||||||||||||
Other liabilities | — | — | — | — | ||||||||||||
|
|
|
| |||||||||||||
Total Liabilities | 21,884,518 | 17,200,322 | 4,054,045 | 17,200,322 | ||||||||||||
|
| |||||||||||||||
|
| |||||||||||||||
CAPITAL | ||||||||||||||||
Managing Owner Units | 6,627,187 | 5,736,634 | 5,851,215 | 5,672,261 | ||||||||||||
Limited Owner Units | 286,502,478 | 264,469,675 | 246,270,584 | 264,534,048 | ||||||||||||
|
|
|
| |||||||||||||
Total Capital | 293,129,665 | 270,206,309 | 252,121,799 | 270,206,309 | ||||||||||||
|
| |||||||||||||||
|
| |||||||||||||||
Total Liabilities and Capital | $ | 315,014,183 | $ | 287,406,631 | $ | 256,175,844 | $ | 287,406,631 | ||||||||
|
|
|
| |||||||||||||
The accompanying notes are an integral part of these consolidated financial statements.
Consolidated Condensed Schedule of Investments
March 31,June 30, 2015 (Unaudited)
Description | Value | % of Total Capital (Net Asset Value) | ||||||||||
| LONG FUTURES CONTRACTS * | |||||||||||
Various base metals futures contracts (Europe) | $ | (1,325,116 | ) | -0.45 | % | |||||||
Various base metals futures contracts (U.S.) | (10,000 | ) | 0.00 | % | ||||||||
Various currency futures contracts (U.S.) | 220,063 | 0.08 | % | |||||||||
Various energy futures contracts (Europe) | 4,391 | 0.00 | % | |||||||||
Various energy futures contracts (Far East) | (405 | ) | 0.00 | % | ||||||||
Various energy futures contracts (U.S.) | (5,316,835 | ) | -1.81 | % | ||||||||
Various interest rates futures contracts (Canada) | (8,340 | ) | 0.00 | % | ||||||||
Various interest rates futures contracts (Europe) | 1,818,211 | 0.62 | % | |||||||||
Various interest rates futures contracts (Far East) | (183,801 | ) | -0.06 | % | ||||||||
Various interest rates futures contracts (Oceanic) | 816,835 | 0.28 | % | |||||||||
Various interest rates futures contracts (U.S.) | 2,755,627 | 0.94 | % | |||||||||
Various soft futures contracts (Canada) | (649 | ) | 0.00 | % | ||||||||
Various soft futures contracts (Europe) | (2,200 | ) | 0.00 | % | ||||||||
Various soft futures contracts (Far East) | (598 | ) | 0.00 | % | ||||||||
Various soft futures contracts (U.S.) | (2,783 | ) | 0.00 | % | ||||||||
Various stock index futures contracts (Africa) | (80,032 | ) | -0.03 | % | ||||||||
Various stock index futures contracts (Canada) | (13,956 | ) | 0.00 | % | ||||||||
Various stock index futures contracts (Europe) | (2,324,161 | ) | -0.79 | % | ||||||||
Various stock index futures contracts (Far East) | (1,502 | ) | 0.00 | % | ||||||||
Various stock index futures contracts (Mexico) | 1,140 | 0.00 | % | |||||||||
Various stock index futures contracts (Oceanic) | 246,912 | 0.08 | % | |||||||||
Various stock index futures contracts (U.S.) | 755,950 | 0.26 | % | |||||||||
Various precious metal futures contracts (U.S.) | (272 | ) | 0.00 | % | ||||||||
Various precious metal futures contracts (Far East) | 60,204 | 0.02 | % | |||||||||
Various soft futures contracts (Africa) | 213,172 | 0.07 | % | |||||||||
|
|
|
| |||||||||
Total Long Futures Contracts | $ | (2,378,145 | ) | -0.79 | % | |||||||
|
|
|
| |||||||||
| SHORT FUTURES CONTRACTS * | |||||||||||
Various base metals futures contracts (Europe) | $ | 1,314,266 | 0.45 | % | ||||||||
Various base metals futures contracts (U.S.) | (57,378 | ) | -0.02 | % | ||||||||
Various currency futures contracts (Far East) | 7,405 | 0.00 | % | |||||||||
Various currency futures contracts (U.S.) | (167,825 | ) | -0.06 | % | ||||||||
Various energy futures contracts (Europe) | (717 | ) | 0.00 | % | ||||||||
Various energy futures contracts (Far East) | (2,526 | ) | 0.00 | % | ||||||||
Various energy futures contracts (U.S.) | 3,027,788 | 1.03 | % | |||||||||
Various interest rates futures contracts (Canada) | 335 | 0.00 | % | |||||||||
Various interest rates futures contracts (Europe) | (294,697 | ) | -0.10 | % | ||||||||
Various interest rates futures contracts (Far East) | 9,046 | 0.00 | % | |||||||||
Various interest rates futures contracts (U.S.) | (802,889 | ) | -0.27 | % | ||||||||
Various soft futures contracts (Europe) | 4,637 | 0.00 | % | |||||||||
Various soft futures contracts (Oceanic) | (79,360 | ) | -0.03 | % | ||||||||
Various soft futures contracts (U.S.) | 187,803 | 0.06 | % | |||||||||
Various stock index futures contracts (Europe) | (511 | ) | 0.00 | % | ||||||||
Various stock index futures contracts (Far East) | 2,938,265 | 1.00 | % | |||||||||
Various stock index futures contracts (U.S.) | 1,224 | 0.00 | % | |||||||||
Various precious metal futures contracts (U.S.) | 28,034 | 0.01 | % | |||||||||
Various precious metal futures contracts (Far East) | (48,936 | ) | -0.02 | % | ||||||||
|
|
|
| |||||||||
Total Short Futures Contracts | $ | 6,063,964 | 2.05 | % | ||||||||
|
|
|
| |||||||||
| CURRENCY FORWARDS * | |||||||||||
Various currency forwards contracts (NA) | $ | (285,046 | ) | -0.10 | % | |||||||
|
|
|
| |||||||||
Total Currency Forwards | $ | (285,046 | ) | -0.10 | % | |||||||
|
|
|
| |||||||||
Total Open Trade Equity (Deficit) | $ | 3,400,773 | 1.16 | % | ||||||||
|
|
|
| |||||||||
| OPTIONS PURCHASED * | |||||||||||
Various energy futures contracts (U.S.) | $ | 8,161,080 | 2.78 | % | ||||||||
Crude Oil Settling 5/18/2015 (Number of Contracts: 2976) | 3,153,130 | 1.08 | % | |||||||||
Crude Oil Settling 4/20/2015 (Number of Contracts: 2976) | 3,687,630 | 1.26 | % | |||||||||
Various soft futures contracts (U.S.) | 168,130 | 0.06 | % | |||||||||
Various stock index futures contracts (U.S.) | 325,003 | 0.11 | % | |||||||||
|
|
|
| |||||||||
Total Options Purchased | $ | 15,494,973 | 5.29 | % | ||||||||
|
|
|
| |||||||||
| OPTIONS WRITTEN * | |||||||||||
Various energy futures contracts (U.S.) | $ | (14,807,819 | ) | -5.05 | % | |||||||
Various soft futures contracts (U.S.) | (286,540 | ) | -0.10 | % | ||||||||
Various stock index futures contracts (U.S.) | (107,168 | ) | -0.04 | % | ||||||||
|
|
|
| |||||||||
Total Options Written | $ | (15,201,527 | ) | -5.19 | % | |||||||
|
|
|
| |||||||||
| SWAPS (1) | |||||||||||
Frontier Brevan Howard Swap (U.S.) | $ | 9,600,330 | 3.28 | % | ||||||||
Frontier XXXIV Balanced Select Swap (U.S.) | 23,473,632 | 8.01 | % | |||||||||
Frontier XXXV Diversified Select Swap (U.S.) | 9,559,124 | 3.26 | % | |||||||||
Frontier XXXVII L/S Select Swap (U.S.) | 5,301,972 | 1.81 | % | |||||||||
|
|
|
| |||||||||
Total Swaps | $ | 47,935,058 | 16.36 | % | ||||||||
|
|
|
| |||||||||
| U.S. TREASURY SECURITIES | |||||||||||
FACE VALUE | Value | Value | ||||||||||
| $ | 15,000,000 | US Treasury Note 2.250% due 11/15/2024 (Cost $14,966,695) | $ | 15,428,906 | 5.26 | % | ||||||
| $ | 85,000,000 | US Treasury Note 6.000% due 02/15/2026 (Cost $113,142,577) | 118,455,469 | 40.41 | % | |||||||
| $ | 20,000,000 | US Treasury Note 6.875% due 08/15/2025 (Cost $28,012,500) | 29,306,250 | 10.00 | % | |||||||
|
|
|
| |||||||||
Total U.S. Treasury Securities | $ | 163,190,625 | 55.67 | % | ||||||||
|
|
|
| |||||||||
Description | Fair Value | % of Total Capital (Net Asset Value) | ||||||||
LONG FUTURES CONTRACTS * | ||||||||||
Various base metals futures contracts (Europe) | $ | (2,164,139 | ) | -0.86 | % | |||||
Various base metals futures contracts (U.S.) | 84,814 | 0.03 | % | |||||||
Various currency futures contracts (Singapore) | (364 | ) | 0.00 | % | ||||||
Various currency futures contracts (U.S.) | (106,166 | ) | -0.04 | % | ||||||
Various energy futures contracts (Europe) | 7,576 | 0.00 | % | |||||||
Various energy futures contracts (Far East) | (2,367 | ) | 0.00 | % | ||||||
Various energy futures contracts (U.S.) | 2,559,970 | 1.02 | % | |||||||
Various interest rates futures contracts (Canada) | 114,607 | 0.05 | % | |||||||
Various interest rates futures contracts (Europe) | (74,443 | ) | -0.03 | % | ||||||
Various interest rates futures contracts (Far East) | 42,359 | 0.02 | % | |||||||
Various interest rates futures contracts (Oceanic) | 10,587 | 0.00 | % | |||||||
Various interest rates futures contracts (U.S.) | 437,966 | 0.17 | % | |||||||
Various precious metal futures contracts (Far East) | (4,131 | ) | 0.00 | % | ||||||
Various precious metal futures contracts (U.S.) | (1,069,275 | ) | -0.42 | % | ||||||
Various soft futures contract (Europe) | (970 | ) | 0.00 | % | ||||||
Various soft futures contracts (Africa) | (454 | ) | 0.00 | % | ||||||
Various soft futures contracts (Canada) | 22,981 | 0.01 | % | |||||||
Various soft futures contracts (Europe) | 168,826 | 0.07 | % | |||||||
Various soft futures contracts (Far East) | (37,878 | ) | -0.02 | % | ||||||
Various soft futures contracts (Oceanic) | (431 | ) | 0.00 | % | ||||||
Various soft futures contracts (U.S.) | 2,046,472 | 0.81 | % | |||||||
Various stock index futures contracts (Africa) | (1,893 | ) | 0.00 | % | ||||||
Various stock index futures contracts (Canada) | (20,034 | ) | -0.01 | % | ||||||
Various stock index futures contracts (Europe) | (583,815 | ) | -0.23 | % | ||||||
Various stock index futures contracts (Far East) | (707,053 | ) | -0.28 | % | ||||||
Various stock index futures contracts (Mexico) | 302 | 0.00 | % | |||||||
Various stock index futures contracts (Oceanic) | (9,345 | ) | 0.00 | % | ||||||
Various stock index futures contracts (U.S.) | (1,400,916 | ) | -0.56 | % | ||||||
|
|
|
| |||||||
Total Long Futures Contracts | $ | (687,214 | ) | -0.27 | % | |||||
|
|
|
| |||||||
SHORT FUTURES CONTRACTS * | ||||||||||
Various base metals futures contracts (Europe) | $ | 2,047,404 | 0.81 | % | ||||||
Various base metals futures contracts (U.S.) | (55,018 | ) | -0.02 | % | ||||||
Various currency futures contracts (U.S.) | 291,247 | 0.12 | % | |||||||
Various energy futures contracts (Europe) | (149 | ) | 0.00 | % | ||||||
Various energy futures contracts (Far East) | 2,424 | 0.00 | % | |||||||
Various energy futures contracts (U.S.) | (1,618,118 | ) | -0.64 | % | ||||||
Various interest rates futures contracts (Canada) | (28,296 | ) | -0.01 | % | ||||||
Various interest rates futures contracts (Europe) | (462,927 | ) | -0.18 | % | ||||||
Various interest rates futures contracts (Far East) | (67,118 | ) | -0.03 | % | ||||||
Various interest rates futures contracts (Oceanic) | (33,365 | ) | -0.01 | % | ||||||
Various interest rates futures contracts (U.S.) | (34,253 | ) | -0.01 | % | ||||||
Various precious metal futures contracts (Far East) | 4,829 | 0.00 | % | |||||||
Various precious metal futures contracts (U.S.) | 1,786,770 | 0.71 | % | |||||||
Various soft futures contract (Europe) | (830 | ) | 0.00 | % | ||||||
Various soft futures contracts (Europe) | (78,844 | ) | -0.03 | % | ||||||
Various soft futures contracts (Far East) | 2,939 | 0.00 | % | |||||||
Various soft futures contracts (U.S.) | (1,332,886 | ) | -0.53 | % | ||||||
Various stock index futures contracts (Africa) | 294 | 0.00 | % | |||||||
Various stock index futures contracts (Canada) | 5,287 | 0.00 | % | |||||||
Various stock index futures contracts (Europe) | 39,728 | 0.02 | % | |||||||
Various stock index futures contracts (Far East) | (66,787 | ) | -0.03 | % | ||||||
Various stock index futures contracts (Oceanic) | 42,871 | 0.02 | % | |||||||
Various stock index futures contracts (U.S.) | 312,496 | 0.12 | % | |||||||
|
|
|
| |||||||
Total Short Futures Contracts | $ | 757,698 | 0.31 | % | ||||||
|
|
|
| |||||||
CURRENCY FORWARDS * | ||||||||||
Various currency forwards contracts (NA) | $ | (87,765 | ) | -0.03 | % | |||||
|
|
|
| |||||||
Total Currency Forwards | $ | (87,765 | ) | -0.03 | % | |||||
|
|
|
| |||||||
Total Open Trade Equity (Deficit) | $ | (17,281 | ) | 0.01 | % | |||||
|
|
|
| |||||||
OPTIONS PURCHASED * | ||||||||||
Various energy futures contracts (U.S.) | $ | 3,436,940 | 1.36 | % | ||||||
Various soft futures contracts (U.S.) | 8,020 | 0.00 | % | |||||||
Various stock index futures contracts (U.S.) | 374,469 | 0.15 | % | |||||||
|
|
|
| |||||||
Total Options Purchased | $ | 3,819,429 | 1.51 | % | ||||||
|
|
|
| |||||||
OPTIONS WRITTEN * | ||||||||||
Various energy futures contracts (U.S.) | $ | (2,300,699 | ) | -0.91 | % | |||||
Various soft futures contracts (U.S.) | (61,510 | ) | -0.02 | % | ||||||
Various stock index futures contracts (U.S.) | (219,661 | ) | -0.09 | % | ||||||
|
|
|
| |||||||
Total Options Written | $ | (2,581,870 | ) | -1.02 | % | |||||
|
|
|
| |||||||
SWAPS (1) | ||||||||||
Frontier Brevan Howard swap (U.S.) | $ | 7,809,251 | 3.10 | % | ||||||
Frontier XXXIV Balanced select swap (U.S.) | 18,491,634 | 7.33 | % | |||||||
Frontier XXXV Diversified select swap (U.S.) | 7,615,169 | 3.02 | % | |||||||
Frontier XXXVII L/S select swap (U.S.) | 4,304,209 | 1.71 | % | |||||||
|
|
|
| |||||||
Total Swaps | $ | 38,220,263 | 15.16 | % | ||||||
|
|
|
| |||||||
U.S. TREASURY SECURITIES | ||||||||||
FACE VALUE | Fair Value | Fair Value | ||||||||
$75,000,000 | US Treasury Note 6.000% due 02/15/2026 (Cost $99,934,764) | $ | 100,558,593 | 39.88 | % | |||||
$20,000,000 | US Treasury Note 6.875% due 08/15/2025 (Cost $28,012,500) | 28,259,375 | 11.21 | % | ||||||
|
|
|
| |||||||
Total U.S. Treasury Securities | $ | 128,817,968 | 51.09 | % | ||||||
|
|
|
| |||||||
| * | Except for those items disclosed, no individual futures, forwards and option on futures contract position constituted greater than 1 percent of Net Asset Value. Accordingly, the number of contracts and expiration dates are not presented. |
| (1) | See Notes to Financial Statements, Note 4. |
The accompanying notes are an integral part of these consolidated financial statements.
Equinox Frontier Funds
Consolidated Condensed Schedule of Investments
December 31, 2014
Description | Value | % of Total Capital (Net Asset Value) | ||||||||||
| LONG FUTURES CONTRACTS * | |||||||||||
Various base metals futures contracts (Europe) | $ | (4,211,885 | ) | -1.56 | % | |||||||
Various base metals futures contracts (U.S.) | (61,850 | ) | -0.02 | % | ||||||||
Various currency futures contracts (U.S.) | 300,870 | 0.11 | % | |||||||||
Various energy futures contracts (Europe) | (12,920 | ) | 0.00 | % | ||||||||
Various energy futures contracts (Far East) | (2,738 | ) | 0.00 | % | ||||||||
Various energy futures contracts (U.S.) | (24,310,145 | ) | -9.00 | % | ||||||||
Various interest rates futures contracts (Canada) | 184,352 | 0.07 | % | |||||||||
Various interest rates futures contracts (Europe) | 3,676,039 | 1.36 | % | |||||||||
Various interest rates futures contracts (Far East) | 585,956 | 0.22 | % | |||||||||
Various interest rates futures contracts (Oceanic) | 558,353 | 0.21 | % | |||||||||
Various interest rates futures contracts (U.S.) | 278,768 | 0.10 | % | |||||||||
Various precious metal futures contracts (Far East) | 6,195 | 0.00 | % | |||||||||
Various precious metal futures contracts (U.S.) | (113,453 | ) | -0.04 | % | ||||||||
Various soft futures contracts (Canada) | (1,360 | ) | 0.00 | % | ||||||||
Various soft futures contracts (Europe) | 33,841 | 0.01 | % | |||||||||
Various soft futures contracts (Oceanic) | (864 | ) | 0.00 | % | ||||||||
Various soft futures contracts (U.S.) | (2,494,615 | ) | -0.92 | % | ||||||||
Various stock index futures contracts (Canada) | 63,167 | 0.02 | % | |||||||||
Various stock index futures contracts (Europe) | 569,188 | 0.21 | % | |||||||||
Various stock index futures contracts (Far East) | 26,010 | 0.01 | % | |||||||||
Various stock index futures contracts (Oceanic) | 44,530 | 0.02 | % | |||||||||
Various stock index futures contracts (U.S.) | 1,412,847 | 0.52 | % | |||||||||
|
|
|
| |||||||||
Total Long Futures Contracts | $ | (23,469,714 | ) | -8.68 | % | |||||||
|
|
|
| |||||||||
| SHORT FUTURES CONTRACTS * | |||||||||||
Various base metals futures contracts (Europe) | $ | 3,745,111 | 1.39 | % | ||||||||
Various base metals futures contracts (U.S.) | 101,600 | 0.04 | % | |||||||||
Various currency futures contracts (Far East) | (3,383 | ) | 0.00 | % | ||||||||
Various currency futures contracts (U.S.) | 2,737,797 | 1.01 | % | |||||||||
Various energy futures contracts (Europe) | 49,517 | 0.02 | % | |||||||||
Various energy futures contracts (Far East) | 5,389 | 0.00 | % | |||||||||
Various energy futures contracts (U.S.) | 12,381,217 | 4.58 | % | |||||||||
Brent Crude Oil Last Day Settling 2/12/2015 (Number of Contracts: 229) | 2,871,660 | 1.06 | % | |||||||||
Crude Oil Settling 12/1/2015 (Number of Contracts: 718) | 11,036,122 | 4.08 | % | |||||||||
NYH RBOB Unleaded Gas Settling 12/30/2015 (Number of Contracts: 388) | 4,267,957 | 1.58 | % | |||||||||
Various interest rates futures contracts (Canada) | 6,583 | 0.00 | % | |||||||||
Various interest rates futures contracts (Europe) | (351,916 | ) | -0.13 | % | ||||||||
Various interest rates futures contracts (Far East) | (28,461 | ) | -0.01 | % | ||||||||
Various interest rates futures contracts (Oceanic) | (6,445 | ) | 0.00 | % | ||||||||
Various interest rates futures contracts (U.S.) | (602,696 | ) | -0.22 | % | ||||||||
Various precious metal futures contracts (Far East) | (1,052 | ) | 0.00 | % | ||||||||
Various precious metal futures contracts (U.S.) | 275,350 | 0.10 | % | |||||||||
Various soft futures contracts (Canada) | (194 | ) | 0.00 | % | ||||||||
Various soft futures contracts (Europe) | 117,563 | 0.04 | % | |||||||||
Various soft futures contracts (Far East) | (4,709 | ) | 0.00 | % | ||||||||
Various soft futures contracts (U.S.) | 2,823,283 | 1.04 | % | |||||||||
Various stock index futures contracts (Africa) | (8,891 | ) | 0.00 | % | ||||||||
Various stock index futures contracts (Europe) | (37,839 | ) | -0.01 | % | ||||||||
Various stock index futures contracts (Far East) | 6,134 | 0.00 | % | |||||||||
Various stock index futures contracts (Mexico) | (4,380 | ) | 0.00 | % | ||||||||
Various stock index futures contracts (Oceanic) | (9,866 | ) | 0.00 | % | ||||||||
Various stock index futures contracts (U.S.) | (138,941 | ) | -0.05 | % | ||||||||
|
|
|
| |||||||||
Total Short Futures Contracts | $ | 39,226,510 | 14.52 | % | ||||||||
|
|
|
| |||||||||
| CURRENCY FORWARDS * | |||||||||||
Various currency forwards contracts (NA) | $ | (932,374 | ) | -0.35 | % | |||||||
|
|
|
| |||||||||
Total Currency Forwards | $ | (932,374 | ) | -0.35 | % | |||||||
|
|
|
| |||||||||
Total Open Trade Equity (Deficit) | $ | 14,824,422 | 5.49 | % | ||||||||
|
|
|
| |||||||||
| OPTIONS PURCHASED * | |||||||||||
Various energy futures contracts (U.S.) | $ | 8,407,670 | 3.11 | % | ||||||||
Various soft futures contracts (U.S.) | 379,800 | 0.14 | % | |||||||||
Various stock index futures contracts (U.S.) | 288,413 | 0.11 | % | |||||||||
|
|
|
| |||||||||
Total Options Purchased | $ | 9,075,883 | 3.36 | % | ||||||||
|
|
|
| |||||||||
| OPTIONS WRITTEN * | |||||||||||
Various energy futures contracts (U.S.) | $ | (8,234,010 | ) | -3.05 | % | |||||||
Various soft futures contracts (U.S.) | (476,810 | ) | -0.18 | % | ||||||||
Various stock index futures contracts (U.S.) | (253,018 | ) | -0.09 | % | ||||||||
|
|
|
| |||||||||
Total Options Written | $ | (8,963,838 | ) | -3.32 | % | |||||||
|
|
|
| |||||||||
| SWAPS (1) | |||||||||||
Frontier XXXIV Balanced select swap (U.S.) | $ | 7,540,466 | 2.79 | % | ||||||||
Frontier Brevan Howard swap (U.S.) | 18,246,952 | 6.75 | % | |||||||||
Frontier XXXV Diversified select swap (U.S.) | 6,570,409 | 2.43 | % | |||||||||
Frontier XXXVII L/S select swap (U.S.) | 3,633,060 | 1.34 | % | |||||||||
|
|
|
| |||||||||
Total Swaps | $ | 35,990,887 | 13.31 | % | ||||||||
|
|
|
| |||||||||
| U.S. TREASURY SECURITIES | |||||||||||
FACE VALUE | Fair Value | Fair Value | ||||||||||
| $ | 15,000,000 | US Treasury Note 2.250% due 11/15/2024 (Cost $14,966,695) | $ | 15,101,953 | 5.59 | % | ||||||
| $ | 75,000,000 | US Treasury Note 6.000% due 02/15/2026 (Cost $99,579,227) | 95,954,688 | 35.51 | % | |||||||
| $ | 20,000,000 | US Treasury Note 6.875% due 08/15/2025 (Cost $28,322,622) | 28,896,875 | 10.69 | % | |||||||
|
|
|
| |||||||||
Total U.S. Treasury Securities | $ | 139,953,516 | 51.79 | % | ||||||||
|
|
|
| |||||||||
Description | Value | % of Total Capital (Net Asset Value) | ||||||||
LONG FUTURES CONTRACTS * | ||||||||||
Various base metals futures contracts (Europe) | $ | (4,211,885 | ) | -1.56 | % | |||||
Various base metals futures contracts (U.S.) | (61,850 | ) | -0.02 | % | ||||||
Various currency futures contracts (U.S.) | 300,870 | 0.11 | % | |||||||
Various energy futures contracts (Europe) | (12,920 | ) | 0.00 | % | ||||||
Various energy futures contracts (Far East) | (2,738 | ) | 0.00 | % | ||||||
Various energy futures contracts (U.S.) | (24,310,145 | ) | -9.00 | % | ||||||
Various interest rates futures contracts (Canada) | 184,352 | 0.07 | % | |||||||
Various interest rates futures contracts (Europe) | 3,676,039 | 1.36 | % | |||||||
Various interest rates futures contracts (Far East) | 585,956 | 0.22 | % | |||||||
Various interest rates futures contracts (Oceanic) | 558,353 | 0.21 | % | |||||||
Various interest rates futures contracts (U.S.) | 278,768 | 0.10 | % | |||||||
Various precious metal futures contracts (Far East) | 6,195 | 0.00 | % | |||||||
Various precious metal futures contracts (U.S.) | (113,453 | ) | -0.04 | % | ||||||
Various soft futures contracts (Canada) | (1,360 | ) | 0.00 | % | ||||||
Various soft futures contracts (Europe) | 33,841 | 0.01 | % | |||||||
Various soft futures contracts (Oceanic) | (864 | ) | 0.00 | % | ||||||
Various soft futures contracts (U.S.) | (2,494,615 | ) | -0.92 | % | ||||||
Various stock index futures contracts (Canada) | 63,167 | 0.02 | % | |||||||
Various stock index futures contracts (Europe) | 569,188 | 0.21 | % | |||||||
Various stock index futures contracts (Far East) | 26,010 | 0.01 | % | |||||||
Various stock index futures contracts (Oceanic) | 44,530 | 0.02 | % | |||||||
Various stock index futures contracts (U.S.) | 1,412,847 | 0.52 | % | |||||||
|
|
|
| |||||||
Total Long Futures Contracts | $ | (23,469,714 | ) | -8.68 | % | |||||
|
|
|
| |||||||
SHORT FUTURES CONTRACTS * | ||||||||||
Various base metals futures contracts (Europe) | $ | 3,745,111 | 1.39 | % | ||||||
Various base metals futures contracts (U.S.) | 101,600 | 0.04 | % | |||||||
Various currency futures contracts (Far East) | (3,383 | ) | 0.00 | % | ||||||
Various currency futures contracts (U.S.) | 2,737,797 | 1.01 | % | |||||||
Various energy futures contracts (Europe) | 49,517 | 0.02 | % | |||||||
Various energy futures contracts (Far East) | 5,389 | 0.00 | % | |||||||
Various energy futures contracts (U.S.) | 12,381,217 | 4.58 | % | |||||||
Brent Crude Oil Last Day Settling 2/12/2015 (Number of Contracts: 229) | 2,871,660 | 1.06 | % | |||||||
Crude Oil Settling 12/1/2015 (Number of Contracts: 718) | 11,036,122 | 4.08 | % | |||||||
NYH RBOB Unleaded Gas Settling 12/30/2015 (Number of Contracts: 388) | 4,267,957 | 1.58 | % | |||||||
Various interest rates futures contracts (Canada) | 6,583 | 0.00 | % | |||||||
Various interest rates futures contracts (Europe) | (351,916 | ) | -0.13 | % | ||||||
Various interest rates futures contracts (Far East) | (28,461 | ) | -0.01 | % | ||||||
Various interest rates futures contracts (Oceanic) | (6,445 | ) | 0.00 | % | ||||||
Various interest rates futures contracts (U.S.) | (602,696 | ) | -0.22 | % | ||||||
Various precious metal futures contracts (Far East) | (1,052 | ) | 0.00 | % | ||||||
Various precious metal futures contracts (U.S.) | 275,350 | 0.10 | % | |||||||
Various soft futures contracts (Canada) | (194 | ) | 0.00 | % | ||||||
Various soft futures contracts (Europe) | 117,563 | 0.04 | % | |||||||
Various soft futures contracts (Far East) | (4,709 | ) | 0.00 | % | ||||||
Various soft futures contracts (U.S.) | 2,823,283 | 1.04 | % | |||||||
Various stock index futures contracts (Africa) | (8,891 | ) | 0.00 | % | ||||||
Various stock index futures contracts (Europe) | (37,839 | ) | -0.01 | % | ||||||
Various stock index futures contracts (Far East) | 6,134 | 0.00 | % | |||||||
Various stock index futures contracts (Mexico) | (4,380 | ) | 0.00 | % | ||||||
Various stock index futures contracts (Oceanic) | (9,866 | ) | 0.00 | % | ||||||
Various stock index futures contracts (U.S.) | (138,941 | ) | -0.05 | % | ||||||
|
|
|
| |||||||
Total Short Futures Contracts | $ | 39,226,510 | 14.52 | % | ||||||
|
|
|
| |||||||
CURRENCY FORWARDS * | ||||||||||
Various currency forwards contracts (NA) | $ | (932,374 | ) | -0.35 | % | |||||
|
|
|
| |||||||
Total Currency Forwards | $ | (932,374 | ) | -0.35 | % | |||||
|
|
|
| |||||||
Total Open Trade Equity (Deficit) | $ | 14,824,422 | 5.49 | % | ||||||
|
|
|
| |||||||
OPTIONS PURCHASED * | ||||||||||
Various energy futures contracts (U.S.) | $ | 8,407,670 | 3.11 | % | ||||||
Various soft futures contracts (U.S.) | 379,800 | 0.14 | % | |||||||
Various stock index futures contracts (U.S.) | 288,413 | 0.11 | % | |||||||
|
|
|
| |||||||
Total Options Purchased | $ | 9,075,883 | 3.36 | % | ||||||
|
|
|
| |||||||
| OPTIONS WRITTEN * | ||||||||||
Various energy futures contracts (U.S.) | $ | (8,234,010 | ) | -3.05 | % | |||||
Various soft futures contracts (U.S.) | (476,810 | ) | -0.18 | % | ||||||
Various stock index futures contracts (U.S.) | (253,018 | ) | -0.09 | % | ||||||
|
|
|
| |||||||
Total Options Written | $ | (8,963,838 | ) | -3.32 | % | |||||
|
|
|
| |||||||
SWAPS (1) | ||||||||||
Frontier XXXIV Balanced select swap (U.S.) | $ | 7,540,466 | 2.79 | % | ||||||
Frontier Brevan Howard swap (U.S.) | 18,246,952 | 6.75 | % | |||||||
Frontier XXXV Diversified select swap (U.S.) | 6,570,409 | 2.43 | % | |||||||
Frontier XXXVII L/S select swap (U.S.) | 3,633,060 | 1.34 | % | |||||||
|
|
|
| |||||||
Total Swaps | $ | 35,990,887 | 13.31 | % | ||||||
|
|
|
| |||||||
| U.S. TREASURY SECURITIES | ||||||||||
FACE VALUE | Fair Value | Fair Value | ||||||||
$15,000,000 | US Treasury Note 2.250% due 11/15/2024 (Cost $14,966,695) | $ | 15,101,953 | 5.59 | % | |||||
$75,000,000 | US Treasury Note 6.000% due 02/15/2026 (Cost $99,579,227) | 95,954,688 | 35.51 | % | ||||||
$20,000,000 | US Treasury Note 6.875% due 08/15/2025 (Cost $28,322,622) | 28,896,875 | 10.69 | % | ||||||
|
|
|
| |||||||
| Total U.S. Treasury Securities | $ | 139,953,516 | 51.79 | % | ||||||
|
|
|
| |||||||
| * | Except for those items disclosed, no individual futures, forwards and option on futures contract position constituted greater than 1 percent of Net Asset Value. Accordingly, the number of contracts and expiration dates are not presented. |
| (1) | See Notes to Financial Statements, Note 4. |
The accompanying notes are an integral part of these consolidated financial statements.
Consolidated Statements of Operations
For the Three Months Ended March 31,June 30, 2015 and 2014
(Unaudited)
| 2015 | 2014 | |||||||||||||||
| 2015 | 2014 | |||||||||||||||
Investment income: | ||||||||||||||||
Interest - net | $ | 294,670 | $ | 338,223 | $ | 274,961 | $ | 261,329 | ||||||||
|
|
|
| |||||||||||||
Total Income | 294,670 | 338,223 | 274,961 | 261,329 | ||||||||||||
|
| |||||||||||||||
|
| |||||||||||||||
Expenses: | ||||||||||||||||
Incentive Fees | 4,902,774 | 997,327 | 94,738 | 2,554,722 | ||||||||||||
Management Fees | 1,288,670 | 1,629,685 | 1,280,518 | 1,498,648 | ||||||||||||
Service Fees - Class 1 | 1,171,052 | 1,202,157 | 1,129,839 | 1,065,882 | ||||||||||||
Trading Fees | 921,267 | 905,120 | 886,592 | 798,997 | ||||||||||||
|
|
|
| |||||||||||||
Total Expenses | 8,283,763 | 4,734,289 | 3,391,687 | 5,918,249 | ||||||||||||
|
|
|
| |||||||||||||
Investment income/(loss) - net | (7,989,093 | ) | (4,396,066 | ) | (3,116,726 | ) | (5,656,920 | ) | ||||||||
|
| |||||||||||||||
|
| |||||||||||||||
Realized and unrealized gain/(loss) on investments: | ||||||||||||||||
Net realized gain/(loss) on futures, forwards and options | 39,987,665 | 151,504 | (14,178,689 | ) | 5,361,595 | |||||||||||
Net change in open trade equity/(deficit) | (10,301,441 | ) | (11,027,953 | ) | (3,193,895 | ) | 5,985,923 | |||||||||
Net realized gain/(loss) on swap contracts | — | — | — | — | ||||||||||||
Net unrealized gain/(loss) on swap contracts | 10,944,171 | (3,699,063 | ) | (9,714,795 | ) | 1,976,879 | ||||||||||
Net realized gain/(loss) on U.S. Treasury securities | — | (554,668 | ) | 588,474 | (86,598 | ) | ||||||||||
Net unrealized gain/(loss) on U.S. Treasury securities | 2,735,063 | 6,785,205 | (5,876,125 | ) | 2,699,089 | |||||||||||
Trading commissions | (710,398 | ) | (1,053,641 | ) | (715,951 | ) | (850,912 | ) | ||||||||
|
|
|
| |||||||||||||
Net gain/(loss) on investments | 42,655,060 | (9,398,616 | ) | (33,090,981 | ) | 15,085,976 | ||||||||||
|
| |||||||||||||||
|
| |||||||||||||||
NET INCREASE/(DECREASE) IN CAPITAL RESULTING FROM OPERATIONS | $ | 34,665,967 | $ | (13,794,682 | ) | $ | (36,207,707 | ) | $ | 9,429,056 | ||||||
|
|
|
| |||||||||||||
The accompanying notes are an integral part of these consolidated financial statements.
Consolidated Statements of Operations
For the Six Months Ended June 30, 2015 and 2014
(Unaudited)
| 2015 | 2014 | |||||||
Investment income: | ||||||||
Interest - net | $ | 569,631 | $ | 599,552 | ||||
|
|
|
| |||||
Total Income | 569,631 | 599,552 | ||||||
|
|
|
| |||||
Expenses: | ||||||||
Incentive Fees | 4,997,512 | 3,552,049 | ||||||
Management Fees | 2,569,188 | 3,128,333 | ||||||
Service Fees - Class 1 | 2,300,891 | 2,268,039 | ||||||
Trading Fees | 1,807,859 | 1,704,117 | ||||||
|
|
|
| |||||
Total Expenses | 11,675,450 | 10,652,538 | ||||||
|
|
|
| |||||
Investment income/(loss) - net | (11,105,819 | ) | (10,052,986 | ) | ||||
|
|
|
| |||||
Realized and unrealized gain/(loss) on investments: | ||||||||
Net realized gain/(loss) on futures, forwards and options | 25,808,976 | 5,513,099 | ||||||
Net change in open trade equity/(deficit) | (13,495,336 | ) | (5,042,030 | ) | ||||
Net realized gain/(loss) on swap contracts | — | — | ||||||
Net unrealized gain/(loss) on swap contracts | 1,229,375 | (1,722,185 | ) | |||||
Net realized gain/(loss) on U.S. Treasury securities | 588,474 | (641,266 | ) | |||||
Net unrealized gain/(loss) on U.S. Treasury securities | (3,141,062 | ) | 9,484,294 | |||||
Trading commissions | (1,426,355 | ) | (1,904,552 | ) | ||||
|
|
|
| |||||
Net gain/(loss) on investments | 9,564,072 | 5,687,360 | ||||||
|
|
|
| |||||
NET INCREASE/(DECREASE) IN CAPITAL RESULTING FROM OPERATIONS | $ | (1,541,747 | ) | $ | (4,365,626 | ) | ||
|
|
|
| |||||
The accompanying notes are an integral part of these consolidated financial statements.
Consolidated Statement of Changes in Owners’ Capital
For the ThreeSix Months Ended March 31,June 30, 2015 (Unaudited)
| Managing Owner | Limited Owners | Total | ||||||||||||||||||||||
| Managing Owner | Limited Owners | Total | ||||||||||||||||||||||
Owners’ Capital, December 31, 2014 | $ | 5,736,634 | $ | 264,469,675 | $ | 270,206,309 | $ | 5,736,634 | $ | 264,469,675 | $ | 270,206,309 | ||||||||||||
Sale of Units | — | 4,097,823 | 4,097,823 | — | 9,776,731 | 9,776,731 | ||||||||||||||||||
Redemption of Units | — | (17,052,044 | ) | (17,052,044 | ) | — | (27,531,104 | ) | (27,531,104 | ) | ||||||||||||||
Payment made by the Managing Owner | — | 1,211,610 | 1,211,610 | — | 1,211,610 | 1,211,610 | ||||||||||||||||||
Net increase/(decrease) in Owners’ Capital resulting from operations | 890,553 | 33,775,414 | 34,665,967 | |||||||||||||||||||||
Net increase/(decrease) in Owners’ | ||||||||||||||||||||||||
Capital resulting from operations | 114,581 | (1,656,328 | ) | (1,541,747 | ) | |||||||||||||||||||
|
|
|
|
|
| |||||||||||||||||||
Owners’ Capital, June 30, 2015 | $ | 5,851,215 | $ | 246,270,584 | $ | 252,121,799 | ||||||||||||||||||
|
|
| ||||||||||||||||||||||
Owners’ Capital, March 31, 2015 | $ | 6,627,187 | $ | 286,502,478 | $ | 293,129,665 | ||||||||||||||||||
|
|
| ||||||||||||||||||||||
The consolidated Trust is not unitized as are the individual Series of the Trust
The accompanying notes are an integral part of these consolidated financial statements.
Consolidated Statements of Cash Flows
For the ThreeSix Months Ended March 31,June 30, 2015 and 2014 (Unaudited)
| 2015 | 2014 | |||||||||||||||
| 2015 | 2014 | |||||||||||||||
Cash Flows from Operating Activities: | ||||||||||||||||
Net increase/(decrease) in capital resulting from operations | $ | 34,665,967 | $ | (13,794,682 | ) | $ | (1,541,747 | ) | $ | (4,365,626 | ) | |||||
Adjustments to reconcile net increase/(decrease) in capital resulting from operations to net cash provided by (used in) operating activities: | ||||||||||||||||
Change in: | ||||||||||||||||
Net change in open trade equity | 11,423,649 | 11,953,750 | 14,841,703 | 4,160,411 | ||||||||||||
Net change in options purchased | (6,419,090 | ) | (3,516,654 | ) | 5,256,454 | (2,086,567 | ) | |||||||||
Net change in options written | 6,237,689 | 3,769,808 | (6,381,968 | ) | 537,577 | |||||||||||
Net change in allocation of total return swaps | — | — | — | — | ||||||||||||
Net unrealized (gain)/loss on swap contracts | (10,944,171 | ) | 3,699,063 | (1,229,376 | ) | 1,722,185 | ||||||||||
Net realized (gain)/loss on swap contracts | — | — | — | — | ||||||||||||
Net unrealized (gain)/loss on U.S. Treasury securities | (2,735,063 | ) | (6,785,205 | ) | 3,141,062 | (9,484,294 | ) | |||||||||
Net realized (gain)/loss on U.S. Treasuries securities | — | 554,668 | (588,474 | ) | 641,266 | |||||||||||
(Purchases) sales of: | ||||||||||||||||
Sales of swap contracts | — | — | — | — | ||||||||||||
(Purchases) of swap contracts | (1,000,000 | ) | — | (1,000,000 | ) | — | ||||||||||
Sales of U.S. Treasury securities | — | 48,655,772 | 28,542,000 | 74,122,949 | ||||||||||||
(Purchases) of U.S. Treasury securities | (21,196,875 | ) | — | (21,196,875 | ) | — | ||||||||||
U.S. Treasury interest and premium paid/amortized | 694,829 | — | 1,237,835 | — | ||||||||||||
Increase and/or decrease in: | ||||||||||||||||
Receivable from futures commission merchants | (8,705,337 | ) | (16,544,372 | ) | 4,228,484 | (272,327 | ) | |||||||||
Distributions from trading companies | — | — | — | — | ||||||||||||
Prepaid service fees | (6,460 | ) | 10,046 | (13,875 | ) | 10,115 | ||||||||||
Interest receivable | 1,217,660 | 1,843,432 | (56,879 | ) | 444,476 | |||||||||||
Receivable from related parties | 935 | 2,453 | 603 | 1,495 | ||||||||||||
Other assets | 500,000 | (13,403 | ) | 500,000 | 48 | |||||||||||
Incentive fees payable to Managing Owner | (1,762,554 | ) | (413,933 | ) | (6,570,591 | ) | 1,143,462 | |||||||||
Management fees payable to Managing Owner | (3,567 | ) | (61,277 | ) | (34,993 | ) | (116,199 | ) | ||||||||
Interest payable to Managing Owner | 24,238 | (52,269 | ) | 4,855 | (88,384 | ) | ||||||||||
Trading fees payable to Managing Owner | 20,142 | (57,050 | ) | (20,342 | ) | (84,734 | ) | |||||||||
Service fees payable to Managing Owner | 18,943 | (53,632 | ) | (23,014 | ) | (95,091 | ) | |||||||||
Payables to related parties | 8,200 | 6,285 | 14,464 | 11,796 | ||||||||||||
Other liabilities | — | — | — | 3,500 | ||||||||||||
|
|
|
| |||||||||||||
Net cash provided by (used in) operating activities | 2,039,135 | 29,202,800 | 19,109,326 | 66,206,058 | ||||||||||||
|
| |||||||||||||||
|
| |||||||||||||||
Cash Flows from Financing Activities: | ||||||||||||||||
Proceeds from sale of capital | 4,097,823 | 2,445,428 | 9,776,731 | 6,227,081 | ||||||||||||
Payment for redemption of capital | (17,052,044 | ) | (34,480,489 | ) | (27,531,104 | ) | (63,229,628 | ) | ||||||||
Payment made by the Managing Owner | 1,211,610 | 1,211,610 | — | |||||||||||||
Pending owner additions | 5,149 | 8,812 | (2,786 | ) | (6,430 | ) | ||||||||||
Redemptions payable | 135,956 | (664,301 | ) | (149,183 | ) | (640,243 | ) | |||||||||
|
|
|
| |||||||||||||
Net cash provided by (used in) financing activities | (11,601,506 | ) | (32,690,550 | ) | (16,694,732 | ) | (57,649,220 | ) | ||||||||
|
| |||||||||||||||
|
| |||||||||||||||
Net increase (decrease) in cash and cash equivalents | (9,562,371 | ) | (3,487,750 | ) | 2,414,594 | 8,556,838 | ||||||||||
Cash and cash equivalents, beginning of period | 18,977,844 | 9,302,857 | 18,977,844 | 9,302,857 | ||||||||||||
|
|
|
| |||||||||||||
Cash and cash equivalents, end of period | $ | 9,415,473 | $ | 5,815,107 | $ | 21,392,438 | $ | 17,859,695 | ||||||||
|
|
|
| |||||||||||||
The accompanying notes are an integral part of these consolidated financial statements.
Notes to Consolidated Financial Statements (Unaudited)
1. Organization and Purpose
Equinox Frontier Funds, which is referred to in this report as the “Trust”, was formed on August 8, 2003, as a Delaware statutory trust. The Trust is a multi-advisor commodity pool, as described in CFTC Regulation § 4.10(d)(2). The Trust has authority to issue separate Series of Units pursuant to the requirements of the Trust Act. The assets of each Series are valued and accounted for separately from the assets of other Series. The Trust is not registered as an investment company under the Investment Company Act. It is managed by the Managing Owner.
Purchasers of Units are Limited Owners of the Trust with respect to beneficial interests of the Series’ Units purchased. The Trust Act provides that, except as otherwise provided in the second amended and restated declaration of trust and trust agreement dated December 9, 2013, by and among the Managing Owner, Wilmington Trust Company as trustee and the unitholders, as amended from time to time (the “Trust Agreement”), unitholders in a Delaware statutory trust will have the same limitation of liability as do stockholders of private corporations organized under the General Corporation Law of the State of Delaware. The Trust Agreement confers substantially the same limited liability, and contains the same limited exceptions thereto, as would a limited partnership agreement for a Delaware limited partnership engaged in like transactions as the Trust. In addition, pursuant to the Trust Agreement, the Managing Owner of the Trust is liable for obligations of a Series in excess of that Series’ assets. Limited Owners do not have any such liability. The Managing Owner will make contributions to the Series of the Trust necessary to maintain at least a 1% interest in the aggregate capital, profits and losses of all Series.
The Trust has been organized to pool investor funds for the purpose of trading in the U.S. and international markets for currencies, interest rates, stock indices, agricultural and energy products, precious and base metals and other commodities. The Trust may also engage in futures contracts, forwards, option contracts and other interest in derivative instruments, including swap contracts (“Swaps”).
The Trust has seven (7) separate and distinct Series of Units issued and outstanding: Equinox Frontier Diversified Fund, Equinox Frontier Masters Fund, Equinox Frontier Long/Short Commodity Fund, Equinox Frontier Balanced Fund, Equinox Frontier Select Fund, Equinox Frontier Winton Fund, and Equinox Frontier Heritage Fund. The Trust financial statements are comprised of unitized Series which are consolidated into the Trust financial statements. However, the consolidated Trust does not issue units.
The Trust, with respect to each Series:
maintains each Series of Units in three to six sub-classes—classes—Class 1, Class 1a, Class 2, Class 2a, Class 3, and Class 3a. Investors who have purchased Class 1 or Class 1a Units of any Series are charged a service fee of up to three percent (3.0%) annually of the NAV of each Unit purchased, for the benefit of selling agents selling such Class 1 or Class 1a Units. The initial service fee, which is amortized monthly at an annual rate of up to three percent (3.0%) of the average daily NAV of Class 1 or Class 1a of such Series, is prepaid to the Managing Owner by each Series, and paid to the selling agents by the Managing Owner in the month following sale; provided, however, that investors who redeem all or a portion of their Class 1 and Class 1a Units of any Series during the first twelve (12) months following the effective date of their purchase are subject to a redemption fee of up to three percent (3.0%) of the NAV at which such investor redeemed to reimburse the Managing Owner for the then-unamortized balance of the prepaid initial service fee. With respect to Class 2 and Class 2a Units of any Series, the Managing Owner pays an ongoing service fee to selling agents of up to one half percent (0.5%)
Managing Owner for the then-unamortized balance of the prepaid initial service fee. With respect to Class 2 and Class 2a Units of any Series, the Managing Owner pays an ongoing service fee to selling agents of up to one half percent (0.5%) annually of the NAV of each Class 2 or Class 2a Unit (of which 0.25% will be charged to Limited Owners holding Class 2 Units of the Equinox Frontier Diversified Fund, and Equinox Frontier Masters Fund or Class 2a Units of the Equinox Frontier Long/Short Commodity Fund sold) until such Class 2 or Class 2a Units which are subject to the fee limitation are reclassified as Class 3 or Class 3a Units of the applicable Series. Class 1AP was created as a sub-class of Class |
The assets of any particular Series include only those funds and other assets that are paid to, held by or distributed to the Trust on account of and for the benefit of that Series. Under the “Inter-Series Limitation on Liability” expressly provided for under Section 3804(a) of the Trust Act, separate and distinct records of the cash and equivalents, although pooled for maximizing returns, are maintained in the books and records of each Series.
As of March 31,June 30, 2015, the Trust, with respect to the Equinox Frontier Diversified Fund, Equinox Frontier Masters Fund, Equinox Frontier Select Fund, Equinox Frontier Winton Fund and Equinox Frontier Heritage Fund separates Units into three separate Classes—Class 1, Class 2, and Class 3. The Trust, with respect to the Equinox Frontier Balanced Fund and the Equinox Frontier Long/Short Commodity Fund separates Units into a maximum of six separate Classes—Class 1, Class 2, Class 3, Class 1a, Class 2a and Class 3a. It is expected that between 10% and 30% of each Series’ assets normally will be invested in one or more Trading Companies to be committed as margin for trading positions, but from time to time these percentages may be substantially more or less. The remainders of each Series’ assets are maintained at the Trust level for cash management. Each of the respective Series has invested monies into pooled cash management assets which have included purchases of U.S. Treasury Securities. Each Series’ ownership in these investments is based on its percentage ownership in the pooled cash management assets on the reporting date.
Each Series of the Trust may invest a portion of its assets in a single Trading Company or in several different Trading Companies and may have multiple Trading Advisors that manage the assets invested in such Trading Companies.
On November 26, 2014, the Trust’s portfolio management team approved an allocation change in an Emil Van Essen trading program that was not fully implemented as intended. As a result, certain series who invested in Emil Van Essen were not allocated sufficient gains and certain other series who invested in Emil Van Essen suffered greater losses. In January 2015, the Managing Owner determined to make a payment to the affected investors within the Equinox Frontier Balanced Fund, Equinox Frontier Diversified Fund and Equinox Frontier Long/Short Commodity Fund, in the aggregate amount of $1,247,752$1,211,610 to reimburse the effect of the missed gain or higher loss on such investors in the series, and such amount was recorded in the Statement of Changes in Owners’ Capital as Payment Made by the Managing Owner.
The Trust has entered into agreements, which provide for the indemnification of futures clearing brokers, currency trading companies, and commodity trading advisers, among others, against losses, costs, claims and liabilities arising from the performance of their individual obligations under such agreements, except for gross negligence or bad faith.
2. Significant Accounting Policies
The following are the significant accounting policies of the Trust.
Basis of Presentation—The Trust follows GAAP, as established by the Financial Accounting Standards Board (the “FASB”), to ensure consistent reporting of financial condition, condensed schedules of investments, results of operations, changes in capital and cash flows. The Trust is an investment company following accounting and reporting guidance in Accounting Standards Codification (“ASC”) 946.
Consolidation—Each Series of the Trust invests in Trading Companies who authorize certain Trading Advisors to place trades and manage assets at pre-determined investment levels. The Trading Companies were organized by the Managing Owner for the purpose of investing in commodities interests and derivative instruments, and have no operating income or expenses, except for trading income and expenses, all of which is allocated to the Series. The Trading Companies and Series of the Trust are consolidated by the Trust.
Use of Estimates—The preparation of financial statements in conformity with GAAP may require the Managing Owner to make estimates and assumptions that affect the reported amounts of assets and liabilities and disclosure of contingent assets and liabilities at the date of the financial statements and the reported amounts of revenue and expenses during the reporting period. The valuation of swap contracts requires significant estimates as well as the valuation of certain other investments. Please refer to Note 3 for discussion of valuation methodology. Actual results could differ from these estimates and such differences could be material.
Cash and Cash Equivalents—Cash and cash equivalents include cash and overnight investments in interest-bearing demand deposits held at banks with original maturities of three months or less. This cash is not restricted.
Interest Income—Aggregate interest income from all sources, including U.S. Treasury securities and assets held at FCMs, up to the first two percentage points or 20% of the aggregate percentage yield (annualized) is paid to the Managing Owner. All interest not paid to the Managing Owner is interest income to the Trust, and shown net on the consolidated statement of operations.
U.S. Treasury Securities—U.S. Treasury Securities are reported at fair value as Level 1 inputs under ASC 820,Fair Value Measurements and Disclosures (“ASC 820”). The Trust values U.S. Treasury Securities at fair value and records the daily change in value in the consolidated statements of operations as net unrealized gain/(loss) on U.S. Treasury securities. Accrued interest is reported on the consolidated statements of financial condition as interest receivable.
Receivable From Futures Commission Merchants—The Trust deposits assets with a FCM subject to CFTC regulations and various exchange and broker requirements. Margin requirements are satisfied by the deposit of cash with such FCM. The Trust earns interest income on its assets deposited with the FCM.
Investment Transactions—Futures, options on futures, forward and swap contracts are recorded on a trade date basis and realized gains or losses are recognized when contracts are settled. Unrealized gains or losses on open contracts (the difference between contract trade price and market price) are reported in the consolidated statements of financial condition as a net unrealized gain or loss, as there exists a right of offset of unrealized gains or losses in accordance with FASB ASC 210,Balance Sheet (“ASC 210”) and Accounting Standards Update (ASU) 2013-01,Balance Sheet (Topic 210).
Any change in net unrealized gain or loss from the preceding period is reported in the consolidated statements of operations. Fair value of exchange-traded contracts is based upon exchange settlement prices. Fair value of non-exchange-traded contracts is based on third party quoted dealer values on the interbank market. For U.S. Treasury securities, interest was recognized in the period earned and the instruments were marked-to-market daily based on third party information. Transaction costs are recognized as incurred and reflected separately in the consolidated statements of operations.
Foreign Currency Transactions—The Series of the Trust’s functional currency is the U.S. dollar; however, they transact business in currencies other than the U.S. dollar. The Series of the Trust do not isolate that portion of the results of operations resulting from changes in foreign exchange rates on investments from fluctuations arising from changes in market prices of securities held. Such fluctuations are included with the net realized or unrealized gain or loss from investments.
Allocation of Earnings—Each Series of the Trust may maintain three to six classes of Units—Class 1, Class 2, Class 3, Class 1a, Class 2a and Class 3a. All classes have identical voting, dividend, liquidation and other rights and the same terms and conditions, except that fees charged to a Class or Series differ as described below. Revenues, expenses (other than expenses attributable to a specific class), and realized and unrealized trading gains and losses of each Series are allocated daily to Class 1, Class 1a, Class 2, Class 2a, Class 3 and Class 3a Units based on each Class’ respective owners’ capital balances as applicable to the classes maintained by the Series.
Investments and Swaps—The Trust records investment transactions on a trade date basis and all investments are recorded at fair value, with changes in fair value reported as a component of realized and unrealized gains/(losses) on investments in the statements of operations. Certain Series of the Trust strategically invest a portion or all of their assets in total return Swaps, selected at the discretion of the Managing Owner. Swaps are privately negotiated contracts designed to provide investment returns linked to those produced by one or more underlying investment products or indices. In a typical Swap, two parties agree to exchange the returns (or differentials in rates of return) earned or realized on one or more particular predetermined investments or instruments. The gross returns to be exchanged or “swapped” between the parties are calculated with respect to a “notional amount” (i.e., the amount of value of the underlying asset used in computing the particular interest rate, return, or other amount to be exchanged) in a particular investment, or in a “basket” of securities. The valuation of swap contracts requires significant estimates. Swap contracts are reported at fair value
based upon daily reports from the counterparty. The Managing Ownercounterparty values the investments based on the CTA’s estimated position information on a same-trading day basis. The Managing Owner reviews and approves current day pricing of the CTA positions, as received from the counterparty which includes intra-day volatility and volume and daily index performance, that is used to determine a daily fair value NAV for the swap contracts. This fair value is corroborated by valuations provided by a third party pricing service on a daily basis. The pricing service, utilizing proprietary model-intensive methodologies, selects and implements the pricing model appropriate for each swap valuation. The pricing service does not provide detail of the pricing model to management. The Managing Owner engages, via inquiry and review of methodology documentation, with the service provider to gain an understanding of the valuation model selected, the components of the model, both observable and unobservable, and quality control testing procedures in place.
Income Taxes—The Trust applies the provisions of ASC 740Income Taxes(“ASC 740”), which provides guidance for how uncertain tax positions should be recognized, measured, presented and disclosed in the financial statements. This interpretation also provides guidance on derecognition, classification, interest and penalties, accounting in interim periods and disclosure. ASC 740 requires the evaluation of tax positions taken or expected to be taken in the course of preparing the Trust’s financial statements to determine whether the tax positions are “more-likely-than-not” of being sustained by the applicable tax authority. Tax positions with respect to tax at the Trust’s level not deemed to meet the “more-likely-than-not” threshold would be recorded as a tax benefit or expense in the current year. The Managing Owner has concluded there is no tax expense, interest or penalties to be recorded by the Trust for the threesix months ended March 31,June 30, 2015. The 2011 through 2014 tax years generally remain subject to examination by U.S. federal and most state tax authorities.
In the opinion of the Managing Owner, (i) the Trust is treated as a partnership for Federal income tax purposes and, assuming that at least 90% of the gross income of the Trust constitutes “qualifying income” within the meaning of Section 7704(d) of the Code, the Trust is not a publicly traded partnership treated as a corporation, and (ii) the discussion set forth in the Prospectus under the heading “Federal Income Tax Consequences” correctly summarizes the material Federal income tax consequences as of the date of the Prospectus to potential U.S. Limited Owners of the purchase, ownership and disposition of Units of the Trust.
Fees and Expenses—All management fees, incentive fees, service fees and trading fees of the Trust are paid to the Managing Owner. It is the responsibility of the Managing Owner to pay all Trading Advisor management and incentive fees, Selling Agent Service fees and all other operating expenses and continuing offering costs of the Trust.
Service Fees—The Trust may maintain each Series of Units in three to six sub-classes—classes—Class 1, Class 1a, Class 2, Class 2a, Class 3, and Class 3a. Investors who have purchased Class 1 or Class 1a Units of any Series are charged a service fee of up to three percent (3.0%) annually of the NAV of each Unit purchased, for the benefit of selling agents selling such Class 1 or Class 1a Units. The initial service fee, which is amortized monthly at an annual rate of up to three percent (3.0%) of the average daily NAV of Class 1 or Class 1a of such Series, is prepaid to the Managing Owner by each Series, and paid to the selling agents by the Managing Owner in the month following sale; provided, however, that investors who redeem all or a portion of their Class 1 or Class 1a Units of any Series during the first twelve (12) months following the effective date of their purchase are subject to a redemption fee of up to three percent (3.0%) of the NAV at which such investor redeemed to reimburse the Managing Owner for the then-unamortized balance of the prepaid initial service fee. With respect to Class 2 and Class 2a Units of any Series, the Managing Owner pays an ongoing service fee to Selling Agents of up to one half percent (0.5%) annually of the NAV of each Class 2 or Class 2a Unit (of which 0.25% will be charged to Limited Owners holding Class 2 Units of the Equinox Frontier Diversified Fund and Equinox Frontier Masters Fund or Class 2a Units of the Equinox Frontier Long/Short Commodity Fund sold) until such Class 2 or Class 2a Units which are subject to the fee limitation are reclassified as Class 3 or Class 3a Units of the applicable Series for administrative purposes. The Managing Owner may also pay selling agents certain additional fees and expenses for administrative and other services rendered and expenses incurred by such Selling Agents.
These service fees are part of the offering costs of the Trust, which include registration and filing fees, legal and blue sky expenses, accounting and audit, printing, marketing support and other offering costs which are borne by the Managing Owner. With respect to the service fees, the initial service fee (for the first 12 months) relating to a purchase of Class 1 and Class 1a Units by an investor is prepaid by the Managing Owner to the relevant selling agent in the month following such purchase and is reimbursed for such payment by the Series monthly in arrears in an amount based upon a corresponding percentage of NAV, calculated daily. Consequently, the Managing Owner bears the risk of the downside and enjoys the benefit of the upside potential of any difference between the amount of the initial service fee prepaid by it and the amount of the reimbursement thereof, which may result from variations in NAV over the following 12 months.
Pending Owner Additions—Funds received for new subscriptions and for additions to existing owner interests are recorded as capital additions at the NAV per unit of the second business day following receipt.
Recently Adopted Accounting Pronouncements—In September of 2013, FASB issued ASU 2013-08 to (i) modify Topic 946 for determining whether an entity is an investment company; (ii) update the measurement requirements for noncontrolling interests in
other investment companies; and (iii) require additional disclosures for investment companies under GAAP. This guidance is effective for annual and interim periods beginning on or after December 15, 2013. An entity should provide the disclosures required by those amendments retrospectively for all comparative periods presented. The adoption of this guidance did not have a material impact on the financial position or results of operations.
Recently Issued Accounting Pronouncements—Recently Issued Accounting Pronouncements—In May of 2015, the Financial Accounting Standards Board (FASB) issued Accounting Standards Update (ASU) 2015-07,Fair Value Measurement (Topic 820): Disclosures for Investments in Certain Entities That Calculate Net Asset Value per Share (or Its Equivalent) (a consensus of the FASB Emerging Issues Task Force). This ASU removes the requirement to categorize within the fair value hierarchy investments for which fair values are measured at NAV using the practical expedient. The ASU also removes the requirement to make certain disclosures for all investments that are eligible to be measured at fair value using the NAV per share practical expedient. Rather, those disclosures are limited to investments for which the entity has elected to measure the fair value using that practical expedient. The ASU is effective for public business entities for fiscal years beginning after December 15, 2015 and interim periods within those fiscal years. For all other entities, the ASU is effective for fiscal years beginning after December 15, 2016 and interim periods within those fiscal years. A reporting entity should apply the amendments retrospectively to all periods presented. Earlier application is permitted.
In February, 2015, the FASB issued Accounting Standards Update (ASU)No. 2015-02, Consolidation (Topic 810): Amendments to the Consolidation Analysis. ASU 2015-02 provides guidance on the consolidation evaluation for reporting organizations that are required to evaluate whether they should consolidate certain legal entities such as limited partnerships, limited liability corporations, and securitization structures (collateralized debt obligations, collateralized loan
obligations, and mortgage-backed security transactions). ASU 2015-02 is effective for periods beginning after December 15, 2015. The adoption of ASU 2015-02 is not expected to have a material effect on the Trust’s consolidated financial statements. Early adoption is permitted. In May 2014 the FASB issued a final standard on revenue from contracts with customers. The standard, issued as FASB ASU 2014-09, “Revenue from Contracts with Customers” (“ASU 2014-09”), outlines a single comprehensive model for entities to use in accounting for revenue arising from contracts with customers and supersedes most current revenue recognition guidance. The ASU is effective for interim and annual reporting periods beginning after December 15, 2016. Early adoption is not permitted. A full retrospective or modified retrospective approach may be taken to adopt the guidance in the ASU. The Trust is currently evaluating the impact of the provisions of ASU 2014-09 on its consolidated financial position, results of operations and related disclosures.
Subsequent Events—The Trust follows the provisions of ASC 855,Subsequent Events, which establishes general standards of accounting for and disclosure of events that occur after the balance sheet date and up through the date the financial statements are issued. No events or transactions requiring recognition or disclosure have been identified.
3. Fair Value Measurements
In connection with the valuation of investments the Trust applies ASC 820,Fair Value Measurement (“ASC 820”). ASC 820 provides clarification that when a quoted price in an active market for the identical asset or liability is not available, a reporting entity is required to measure fair value using certain techniques. ASC 820 also clarifies that when estimating the fair value of an asset or liability, a reporting entity is not required to include a separate input or adjustment to other inputs relating to the existence of a restriction that prevents the transfer of an asset or liability. ASC 820 also clarifies that both a quoted price in an active market for the identical asset or liability at the measurement date and the quoted price for the identical asset or liability when traded as an asset in an active market when no adjustments to the quoted price of the asset are required are Level 1 fair value measurements.
Level 1 Inputs
Unadjusted quoted prices in active markets for identical financial assets that the reporting entity has the ability to access at the measurement date.
Level 2 Inputs
Inputs other than quoted prices included in Level 1 that are observable for the financial assets or liabilities, either directly or indirectly. These might include quoted prices for similar financial assets in active markets, quoted prices for identical or similar financial assets in markets that are not active, inputs other than quoted prices that are observable for the financial assets or inputs that are derived principally from or corroborated by market data by correlation or other means.
Level 3 Inputs
Unobservable inputs for determining the fair value of financial assets that reflect an entity’s own assumptions about the assumptions that market participants would use in pricing the financial asset.
The Trust uses the following methodologies to value instruments within its financial asset portfolio at fair value:
Trading Securities. These instruments include U.S. Treasury securities and open trade equity positions (futures contracts) that are actively traded on public markets with quoted pricing for corroboration. U.S. Treasury securities and futures contracts are reported at fair value using Level 1 inputs. Trading securities instruments further include trading options and currency forwards that are quoted prices for identical or similar assets that are not traded on active markets. Trading options and currency forwards are reported at fair value using Level 2 inputs.
Swap Contracts. Certain Series of the Trust strategically invest a portion or all of their assets in total return Swaps, selected at the direction of the Managing Owner. Swaps are privately negotiated contracts designed to provide investment
returns linked to those produced by one or more investment products or indices. In a typical Swap, two parties agree to exchange the returns (or differentials in rates of return) earned or realized on one or more particular predetermined investments or instruments. The gross returns to be exchanged or “swapped” between the parties are calculated with respect to a “notional amount” (i.e., the amount of value of the underlying asset used in computing the particular interest rate, return, or other amount to be exchanged) in a particular investment, or in a “basket” of securities. Swap contracts are reported at fair value based upon daily reports from the counterparty. The Managing Ownercounterparty values the investments based on the CTA’s estimated position information on a same-trading day basis. The Managing Owner reviews and approves current day pricing of the CTA positions, as received from the counterparty which includes intra-day volatility and volume and daily index performance, that is used to determine a daily fair value NAV for the swap contracts. The fair value is corroborated through the use of a third party pricing service (“pricing service”). The valuation of swap contracts requires significant estimates utilizing Level 3 Inputs corroborated by management through the use of the pricing service. The pricing service, utilizing proprietary model-intensive methodologies, selects and implements the pricing model appropriate for each swap valuation. The pricing service does not provide detail of the pricing model to management. The Managing Owner through the valuation committee charted by the Executive Committee of the Trust,
engages, via inquiry and review of methodology documentation, with the service provider to gain an understanding of the valuation model selected; the components of the model, both observable and unobservable; and quality control testing procedures in place. The valuation committee meets on a monthly basis and as needed to discuss any updates or changes in the valuation process, reporting to the Executive Committee. The pricing service’s methodology includes performance of tolerance testing on its valuation models to ensure consistency and reasonableness of the values derived. The tolerance testing includes valuing the components of the product separately, i.e. underlying asset, volatility, financing rates, and so forth. The tolerance testing is part of the initial valuation setup and throughout the ongoing daily valuation process. The pricing service also has several layers of quality control including: engineering / reverse engineering process to understand each swap and it’sits subcomponent parts fully; comparative analysis against other valuations performed with similar composition and characteristics; review of output valuation against expectations based on observable price movements of underlying futures; and lastly, periodic review by a senior financial engineer to ensure design and function of model is stable and perform as expected.
The Managing Owner has chartered a valuation committee to provide oversight of the valuation process for the Series. The valuation committee meets at least monthly to discuss the valuation process and any valuation issues that may arise. The valuation committee is comprised of senior members of the Managing Owner’s management team with varying areas of expertise that add value to the committee. The valuation committee reports to both the Managing Owner’s Management Committee and the Trust’s Executive Committee. The committee further remains in communication with the Managing Owner’s Due Diligence Committee that provides ongoing counterparty risk monitoring of the swap counterparties. The committee’s designee monitors daily pricing valuation provided by the swap counterparty and daily valuation provided by the third party pricing service to ensure the change in fair value is reasonable and valuations are in accordance with current regulations and best practices. The committee may request a price challenge if the daily valuation provided by the counterparty valuations differs significantly from the valuation obtained by the pricing service. The Managing Owner’s valuation committee monitors some additional input factors such as liquidity, volatility, and counterparty risk in order to further review the valuations provide by the pricing service.
The following table summarizes the instruments that comprise the Trust’s financial asset portfolio, by Series, measured at fair value on a recurring basis as of March 31,June 30, 2015 and December 31, 2014, segregated by the level of valuation inputs within the fair value hierarchy utilized to measure fair value:
March 31, 2015 | Level 1 Inputs | Level 2 Inputs | Level 3 Inputs | Total Fair Value | ||||||||||||
Open Trade Equity (Deficit) | $ | 3,685,819 | $ | (285,046 | ) | $ | — | $ | 3,400,773 | |||||||
Swap Contracts | — | — | 47,935,058 | 47,935,058 | ||||||||||||
U.S. Treasury Securities | 163,190,625 | — | — | 163,190,625 | ||||||||||||
Purchased Options | — | 15,494,973 | — | 15,494,973 | ||||||||||||
Written Options | — | (15,201,527 | ) | — | (15,201,527 | ) | ||||||||||
December 31, 2014 | Level 1 Inputs | Level 2 Inputs | Level 3 Inputs | Total Fair Value | ||||||||||||
Open Trade Equity (Deficit) | $ | 15,756,796 | $ | (932,374 | ) | $ | — | $ | 14,824,422 | |||||||
Swap Contracts | — | — | 35,990,887 | 35,990,887 | ||||||||||||
U.S. Treasury Securities | 139,953,516 | — | — | 139,953,516 | ||||||||||||
Purchased Options | — | 9,075,883 | — | 9,075,883 | ||||||||||||
Written Options | — | (8,963,838 | ) | — | (8,963,838 | ) | ||||||||||
June 30, 2015 Open Trade Equity (Deficit) Swap Contracts U.S. Treasury Securities Purchased Options Written Options December 31, 2014 Open Trade Equity (Deficit) Swap Contracts U.S. Treasury Securities Purchased Options Written Options Level 1 Inputs Level 2 Inputs Level 3 Inputs Total
Fair Value $ 70,482 $ (87,763 ) $ — $ (17,281 ) — — 38,220,263 38,220,263 128,817,968 — — 128,817,968 — 3,819,429 — 3,819,429 — (2,581,870 ) — (2,581,870 ) Level 1 Inputs Level 2 Inputs Level 3 Inputs Total
Fair Value $ 15,756,796 $ (932,374 ) $ — $ 14,824,422 — — 35,990,887 35,990,887 139,953,516 — — 139,953,516 — 9,075,883 — 9,075,883 — (8,963,838 ) — (8,963,838 )
The changes in Level 3 assets measured at fair value on a recurring basis are summarized in the following tables. Swap contract asset gains and losses (realized/unrealized) included in earnings are classified in “realized and unrealized gain (loss) on investments – net realized and net unrealized gain/(loss) on swap contracts” on the statements of operations.
| For the Three Months Ended March 31, 2015 | For the Six Months Ended June 30, 2015 | |||||||
Balance of recurring Level 3 assets as of January 1, 2015 | $ | 35,990,887 | $ | 35,990,887 | ||||
Total gains or losses (realized/unrealized): | ||||||||
Included in earnings-realized | — | — | ||||||
Included in earnings-unrealized | 10,944,171 | 1,229,376 | ||||||
Purchases of investments | 1,000,000 | 1,000,000 | ||||||
Sales of investments | — | — | ||||||
Transfers in and/or out of Level 3 | — | — | ||||||
|
| |||||||
Balance of recurring Level 3 assets as of March 31, 2015 | $ | 47,935,058 | ||||||
Balance of recurring Level 3 assets as of June 30, 2015 | $ | 38,220,263 | ||||||
|
| |||||||
| For the Year Ended December 31, 2014 | ||||||||
Balance of recurring Level 3 assets as of January 1, 2014 | $ | 21,455,529 | ||||||
Total gains or losses (realized/unrealized): | ||||||||
Included in earnings-realized | — | |||||||
Included in earnings-unrealized | 14,535,358 | |||||||
Purchases of investments | — | |||||||
Sales of investments | — | |||||||
Transfers in and/or out of Level 3 | — | |||||||
| ||||||||
Balance of recurring Level 3 assets as of December 31, 2014 | $ | 35,990,887 | ||||||
| ||||||||
| For the Year Ended December 31, 2014 | ||||
Balance of recurring Level 3 assets as of January 1, 2014 | $ | 21,455,529 | ||
Total gains or losses (realized/unrealized): | ||||
Included in earnings-realized | — | |||
Included in earnings-unrealized | 14,535,358 | |||
Purchases of investments | — | |||
Sales of investments | — | |||
Transfers in and/or out of Level 3 | — | |||
|
| |||
Balance of recurring Level 3 assets as of December 31, 2014 | $ | 35,990,887 | ||
|
| |||
The Trust assesses the levels of the investments at each measurement date, and transfers between levels are recognized on the actual date of the event or change in circumstances that caused the transfer in accordance with the Trust’s accounting policy regarding the recognition of transfers between levels of the fair value hierarchy. During the threesix months ended March 31,June 30, 2015 and the year ended December 31, 2014, the Trust did not transfer any assets between Levels 1, 2 and 3.
The total change in unrealized appreciation (depreciation) included in the statements of operations attributable to level 3 investments still held at March 31,June 30, 2015.
Swaps | $ | 10,944,171 |
| Swaps | $ 1,229,375 | |||
The total change in unrealized appreciation (depreciation) included in the statements of operations attributable to level 3 investments still held at December 31, 2014.
Swaps | $ | 14,535,358 |
| Swaps | $ 14,535,358 | |||
4. Swaps
In addition to authorizing Trading Advisors to manage pre-determined investment levels of futures and forward contracts, certain Series of the Trust will strategically invest a portion or all of their assets in total return swaps, selected at the direction of the Managing Owner. Total returnReturn Swaps are privately negotiated contracts designed to provide investment returns linked to those produced by one or more investment products or indices. In a typical total returnTotal Return Swap, two parties agree to exchange the returns (or differentials in rates of return) earned or realized on one or more particular predetermined investments or instruments. The gross returns to be exchanged or “swapped” between the parties are calculated with respect to a “notional amount” (i.e., the amount or value of the underlying asset used in computing the particular interest rate, return, or other amount to be exchanged) in a particular investment, or in a “basket” of securities.
The Trust’s investment in Swaps will likely differ substantially over time due to cash flows, portfolio management decisions and market movements. The Swaps serve to diversify the investment holdings of the Trust and to provide access to programs and advisors that would not be otherwise available to the Trust, and are not used for hedging purposes.
The Managing Owner follows a procedure in selecting well-established financial institutions which the Managing Owner, in its sole discretion, considers to be reputable, reliable, financially responsible and well established to act as swap counterparties. The procedure includes due diligence review of documentation on all new and existing financial institution counterparties prior to initiation of the relationship, and quarterly ongoing review during the relationship, to ensure that counterparties meet the Managing Owner’s minimum credit requirements, the counterparty average rating being no less than an investment grade rating as defined by the rating agencies. As of March 31,June 30, 2015 and December 31, 2014, approximately 7.9%14.9% or $25,062,058$38,220,263 and 4.9%12.5% or $14,117,887,$35,990,887, respectively, of the Trust’s assets were invested with over-the-counter counterparties in order to initiate and maintain Swaps and is recorded as Swap Contracts, at fair value on the Statements of Financial Condition of the Trust. This cash held with the counterparty is not restricted.
The Trust strategically invests assets in one or more swapsSwaps linked to certain underlying investments or indices at the direction of the Managing Owner. The Trading Company in which the assets of the Trust will be invested will not own any of the investments or indices referenced by any swapSwap entered into by the Trust. In addition, neither the swapSwap counterparty nor any advisor referenced by any such swapSwap is a Trading Advisor to the Trust.
The Trust had invested in the following swaps as of and for the threesix months ended March 31,June 30, 2015:
| Brevan Howard | XXXIV Balanced Select Swap | XXXV Diversified Select Swap | XXXVII L/S Select Swap | |||||||||||||||||||||
| Total Return Swap | Total Return Swap | Total Return Swap | Total Return Swap | |||||||||||||||||||||
| Brevan Howard Total Return Swap | XXXIV Balanced Select Swap Total Return Swap | XXXV Diversified Select Swap Total Return Swap | XXXVII L/S Select Swap Total Return Swap | |||||||||||||||||||||
Counterparty | DeutscheBank AG | DeutscheBank AG | DeutscheBank AG | DeutscheBank AG | DeutscheBank AG | DeutscheBank AG | DeutscheBank AG | DeutscheBank AG | ||||||||||||||||
Notional Amount | $17,663,283 | $70,910,098 | $38,500,000 | $12,090,513 | $ | 15,663,283 | $ | 62,910,098 | $ | 30,500,000 | $ | 10,090,513 | ||||||||||||
Termination Date | 3/26/2018 | 8/2/2018 | 8/2/2018 | 8/7/2018 | 3/26/2018 | 8/2/2018 | 8/2/2018 | 8/7/2018 | ||||||||||||||||
Cash Collateral | $5,993,000 | $9,600,000 | $3,400,000 | $3,880,000 | $ | 5,993,000 | $ | 9,600,000 | $ | 3,400,000 | $ | 3,880,000 | ||||||||||||
Swap Value | $3,607,330 | $13,873,632 | $6,159,124 | $1,421,972 | $ | 1,816,251 | $ | 8,891,634 | $ | 4,215,169 | $ | 424,209 | ||||||||||||
Investee Returns | Total Returns | Total Returns | Total Returns | Total Returns | Total Returns | Total Returns | Total Returns | Total Returns | ||||||||||||||||
Realized Gain/(Loss) | $0 | $0 | $0 | $0 | $ | 0 | $ | 0 | $ | 0 | $ | 0 | ||||||||||||
|
|
|
|
|
|
|
| |||||||||||||||||
Change in Unrealized Gain/(Loss) | $2,059,865 | $5,226,678 | $2,988,715 | $668,912 | $ | 268,786 | $ | 244,680 | $ | 1,044,760 | ($ | 328,851 | ) | |||||||||||
|
|
|
|
|
|
|
| |||||||||||||||||
Fair Value as of 3/31/2015 | $9,660,330 | $23,473,632 | $9,559,124 | $5,301,972 | ||||||||||||||||||||
Fair Value as of 6/30/2015 | $ | 7,809,251 | $ | 18,491,634 | $ | 7,615,169 | $ | 4,304,209 | ||||||||||||||||
|
|
|
|
|
|
|
| |||||||||||||||||
The Trust had invested in the following swaps as of and for the year ended December 31, 2014:
| Brevan Howard | XXXIV Balanced Select Swap | XXXV Diversified Select Swap | XXXVII L/S Select Swap | |||||||||||||||||||||
| Total Return Swap | Total Return Swap | Total Return Swap | Total Return Swap | |||||||||||||||||||||
| Brevan Howard Total Return Swap | XXXIV Balanced Select Swap Total Return Swap | XXXV Diversified Select Swap Total Return Swap | XXXVII L/S Select Swap Total Return Swap | |||||||||||||||||||||
Counterparty | DeutscheBank AG | DeutscheBank AG | DeutscheBank AG | DeutscheBank AG | DeutscheBank AG | DeutscheBank AG | DeutscheBank AG | DeutscheBank AG | ||||||||||||||||
Notional Amount | $17,663,283 | $67,610,098 | $35,500,000 | $13,590,513 | $ | 17,663,283 | $ | 67,610,098 | $ | 35,500,000 | $ | 13,590,513 | ||||||||||||
Termination Date | 3/26/2018 | 8/2/2018 | 8/2/2018 | 8/7/2018 | 3/26/2018 | 8/2/2018 | 8/2/2018 | 8/7/2018 | ||||||||||||||||
Cash Collateral | $5,993,000 | $9,600,000 | $3,400,000 | $3,880,000 | $ | 5,993,000 | $ | 9,600,000 | $ | 3,400,000 | $ | 3,880,000 | ||||||||||||
Swap Value | $1,547,465 | $8,646,954 | $3,170,408 | ($246,940) | $ | 1,547,466 | $ | 8,646,955 | $ | 3,170,409 | ($ | 246,940 | ) | |||||||||||
Investee Returns | Total Returns | Total Returns | Total Returns | Total Returns | Total Returns | Total Returns | Total Returns | Total Returns | ||||||||||||||||
Realized Gain/(Loss) | $0 | $0 | $0 | $0 | $ | 0 | $ | 0 | $ | 0 | $ | 0 | ||||||||||||
|
|
|
|
|
|
|
| |||||||||||||||||
Unrealized Gain/(Loss) | $2,105,282 | $8,120,784 | $3,132,777 | $1,176,515 | $ | 2,105,281 | $ | 8,120,996 | $ | 3,132,777 | $ | 1,176,514 | ||||||||||||
|
|
|
|
|
|
|
| |||||||||||||||||
Fair Value as of 12/31/2014 | $7,540,465 | $18,246,954 | $6,570,408 | $3,633,060 | $ | 7,540,466 | $ | 18,246,955 | $ | 6,570,409 | $ | 3,633,060 | ||||||||||||
|
|
|
|
|
|
|
| |||||||||||||||||
5. Transactions with Affiliates
The Managing Owner contributes funds to the Trust in order to have a 1% interest in the aggregate capital, profits and losses and in return will receive units designated as general units in the Series of the Trust in which the Managing Owner invests such funds. The general units may only be purchased by the Managing Owner and may be subject to no advisory fees or management advisory fees at reduced rates. Otherwise, the general units hold the same rights as the limited units. The Managing Owner is required to maintain at least a 1% interest (“Minimum Purchase Commitment”) in the aggregate capital, profits and losses of the Trust so long as it is acting as the Managing Owner of the Trust. Such contribution was made by the Managing Owner before trading commenced for the Trust and will be maintained throughout the existence of the Trust, and the Managing Owner will make such purchases as are necessary to effect this requirement. Additionally, the Managing Owner agreed with certain regulatory bodies to maintain a 1% interest specifically in the Equinox Frontier Balanced Fund Class 1a Units and Equinox Frontier Balanced Fund Class 2a Units, aggregated, and each of the Equinox Frontier Long/Short Commodity Fund, Equinox Frontier Diversified Fund, and Equinox Frontier Masters Fund. The 1% interest in these specific Series of the Trust is included in computing the Minimum Purchase Commitment in aggregate capital. In addition to the general units the Managing Owner receives in respect of its Minimum Purchase Commitment, the Managing Owner may purchase limited units in any Series as a Limited Owner. Principals of the Managing Owner or affiliates are allowed to own beneficial interests in the Trust, as well. All units purchased by the Managing Owner are held for investment purposes only and not for resale. The Managing Owner may make purchases or redemptions at any time on the same terms as any Limited Owner. The Trust has and will continue to have certain relationships with the Managing Owner and its affiliates.
Expenses
Management Fees—Each Series of Units pays to the Managing Owner a monthly management fee equal to a percentage of the nominal assets of such Series, calculated on a daily basis. The total amount of assets of a series allocated to trading advisors and/or
reference programs, including (i) actual funds deposited in accounts directed by the trading advisors or deposited as margin in respect of swaps or other derivative instruments referencing a reference program plus (ii) any notional equity allocated to the trading advisors and any reference programs, is referred to herein as the “nominal assets” of the series. The annual rate of the management fee is: 0.5%
for the Equinox Frontier Balanced Fund Class 1, Class 2 and Class 3, 1.0% for the Equinox Frontier Balanced Fund Class 1a, Class 2a and Class 3a, 2.0% for the Equinox Frontier Winton Fund, Equinox Frontier Long/Short Commodity Fund Class 1a, Class 2a and Class 3a and Equinox Frontier Masters Fund, 0.75% for Equinox Frontier Diversified Fund, 2.5% for the Equinox Frontier Heritage Fund and Equinox Frontier Select Fund, and 3.5% for the Equinox Frontier Long/Short Commodity Fund Class 1, Class 2 and Class 3. The Managing Owner may pay all or a portion of such management fees to the Trading Advisor(s) and/or waive (up to the percentage specified) any such management fee to the extent any related management fee is paid by a trading company or estimated management fee is embedded in a swap or other derivative instrument. Any management fee embedded in a swap or other derivative instrument may be greater or less than the management fee that would otherwise be charged to the series by the Managing Owner. As of the date of this Form 10-K,10-Q, the trading advisor for a series that has invested in a swap has not received any management fees directly from the series for such swap, and instead the relevant trading advisor receives compensation via the fees embedded in the swap.
The management fee as a percentage of the applicable series’ net asset value will be greater than the percentage indicated above to the extent that the nominal assets of the series exceeds its net asset value. The managing owner expects that the nominal assets of each series will generally be maintained at a level in excess of the net asset value of such series and such excess may be substantial to the extent the managing owner deems necessary to achieve the desired level of volatility.
Trading Fees—In connection with each Series’ trading activities of the Trust, the Equinox Frontier Long/Short Commodity Fund (Classes 1, 2 and 3), Equinox Frontier Balanced Fund, Equinox Frontier Select Fund, Equinox Frontier Winton Fund and Equinox Frontier Heritage Fund pays to the Managing Owner a trading fee, or FCM Fee, of up to 0.75% of such Series’ NAV, calculated daily. The Equinox Frontier Diversified Fund, Equinox Frontier Long/Short Commodity Fund (Classes 1a and 2a) and Equinox Frontier Masters Fund pays to the Managing Owner a trading fee, or FCM Fee, of up to 2.25% and a custodial/due diligence fee of 0.12% of such Series’ NAV, calculated daily.
Incentive Fees—Some Series of the Trust pay to the Managing Owner an incentive fee of a certain percentage of new net trading profits generated by such Series, monthly or quarterly. Because the Equinox Frontier Balanced Fund, Equinox Frontier Heritage Fund, Equinox Frontier Select Fund, and Equinox Frontier Long/Short Commodity Fund may each employ multiple Trading Advisors, these Series will pay the Managing Owner a monthly incentive fee calculated on a Trading Advisor by Trading Advisor basis. It is therefore possible that in any given period the Series may pay incentive fees to the Managing Owner for one or more Trading Advisors while each of these Series as a whole experiences losses. The incentive fee is 25% for the Equinox Frontier Balanced Fund and the Equinox Frontier Diversified Fund and 20% for the Equinox Frontier Winton Fund, Equinox Frontier Heritage Fund, Equinox Frontier Select Fund, Equinox Frontier Long/Short Commodity Fund and Equinox Frontier Masters Fund. The Managing Owner may pay all or a portion of such incentive fees to the Trading Advisor(s) for such Series.
Service Fees—In addition, with respect to Class 1 and Class 1a Units of each Series of the Trust, as applicable, the Series pays monthly or quarterly to the Managing Owner a service fee of up to 3% annually, which the Managing Owner pays to selling agents of the Trust.
As of March 31,June 30, 2015, the Trust has a payable to the Managing Owner in the amounts of $4,902,774, $464,587, $227,324, $344,996$94,737, $433,161, $207,941, $304,512 and $355,058$313,101 for incentive fees, management fees, interest, trading fees, and service fees, respectively.
As of December 31, 2014, the Trust has a payable to the Managing Owner in the amounts of $6,665,328, $468,154, $203,086, $324,854, and $336,115 for incentive fees, management fees, interest, trading fees, and service fees, respectively.
For the three months ended March 31,June 30, 2015, the Trust paid the Managing Owner $4,902,774, $1,288,670, $1,171,052$94,738, $1,280,518, $1,129,839 and $921,267$886,592 for incentive fees, management fees, service fees, and trading fees, respectively.
For the three months ended March 31,June 30, 2014, the Trust paid the Managing Owner $997,327, $1,629,685, $1,202,157$2,554,722, $1,498,648, $1,065,882 and $905,120$798,997 for incentive fees, management fees, service fees, and trading fees, respectively.
For the six months ended June 30, 2015, the Trust paid the Managing Owner $4,997,512, $2,569,188, $2,300,891 and $1,807,859 for incentive fees, management fees, service fees, and trading fees, respectively.
For the six months ended June 30, 2014, the Trust paid the Managing Owner $3,552,049, $3,128,333, $2,268,039, and $1,704,117 for incentive fees, management fees, service fees, and trading fees, respectively.
With respect to the service fees, the initial service fee (for the first 12 months) relating to a purchase of Units by an investor is prepaid by the Managing Owner to the relevant selling agent in the month following such purchase and is reimbursed therefore by the Series monthly in arrears in an amount based upon a corresponding percentage of NAV, calculated daily. Consequently, the Managing Owner bears the risk and enjoys the benefit of the upside potential of any difference between the amount of the initial service fee prepaid by it and the amount of the reimbursement thereof, which may result from variations in NAV over the following 12 months. For the three months ended March 31,June 30, 2015 and 2014 amounts received or receivable from the Managing Owner for the difference in monthly service fees from the prepaid initial service fees were $7,262$14,977 and ($8,738)7,682), respectively.
Aggregate interest income from all sources, including assets held at clearing brokers, up to 2% (annualized) is paid to the Managing Owner by the Equinox Frontier Balanced Fund (Class 1 and Class 2 only), Equinox Frontier Winton Fund, Equinox Frontier Select Fund and Equinox Frontier Heritage Fund. For the Equinox Frontier Diversified Fund, Equinox Frontier Long/Short Commodity Fund, Equinox Frontier Masters Fund, and Equinox Frontier Balanced Fund (Class 1a and Class 2a only), 20% of the total interest allocated to each Series is paid to the Managing Owner. During the three months ended March 31,June 30, 2015 and 2014, the Trust paid $603,037$593,987 and $698,392,$579,315, respectively, and $1,197,024 and $1,277,706 for the six months ended June 30, 2015 and 2014, respectively of such interest income to the Managing Owner. Such amounts are not included in the consolidated statements of operations of the Trust. All other interest income is recorded by the Trust on the consolidated statements of operations.
The Managing Owner, under an amended contract, paid to The Bornhoft Group Corporation, an affiliate of the Trust, an annual payment of $1,100,000 for the first year of the contract and $600,000 for the second year of the contract, and $300,000 for the third and final year for investment and advisor services and 0.1% annually thereafter of the trading level with the Equinox Frontier Balanced Fund in lieu of a monthly service fee. The Managing Owner paid $139,848 and $221,095, respectively under this agreement for the three months ended March 31,June 30, 2015 and 2014.2014, respectively. These amounts do nothave no impact on the Trust’sSeries’ financial statements. This contract will endended April 30, 2015.
Equinox Financial Group, LLC, an affiliate of the Trust, provides management services for the Managing Owner who paid $305,000$730,000 and $230,000,$241,667, respectively, for the six months ended June 30, 2015 and 2014, and $425,000 and $91,667 for the three months ended March 31, 2015 andJune 30, 2014, respectively. These amounts do nothave no impact on the Trust’sSeries’ financial statements.
Solon Capital, LLC, an affiliate of the Trust, provides product development and marketing services. For these services, the Managing Owner paid Solon Capital, LLC, $316,272$623,715 and $208, 417,$581,681, respectively, for the six months ended June 30, 2015 and 2014 and $307,442 and $272,694 for the three months ended March 31,June 30, 2015 and 2014.2014, respectively. These amounts do nothave no impact on the Trust’sSeries’ financial statements.
Equinox Group Distributors LLC, an affiliate under common control of the Managing Owner, serves as wholesaler of the Trust by marketing to broker/dealer organizations.
6. Financial Highlights
The following information presents the financial highlights of the Trust for the three and six months ended March 31,June 30, 2015 and 2014. This data has been derived from the information presented in the consolidated financial statements.
| Three months ended | ||||||||||||||||
| 2015 | 2014 | |||||||||||||||
| 2015 | 2014 | |||||||||||||||
Ratios to average net assets (1) | ||||||||||||||||
Net investment gain/(loss) (1) | -6.18 | % | -5.31 | % | -4.48 | % | -6.06 | % | ||||||||
Expenses before incentive fees (3) | 4.87 | % | 5.45 | % | 4.85 | % | 5.45 | % | ||||||||
Expenses after incentive fees (3) | 6.61 | % | 5.81 | % | 4.89 | % | 6.49 | % | ||||||||
Total return before incentive fees (2) | 14.05 | % | -4.60 | % | -13.25 | % | 4.84 | % | ||||||||
Total return after incentive fees (2) | 12.31 | % | -4.96 | % | -13.28 | % | 3.81 | % | ||||||||
Six months ended
| ||||||||||||||||
| 2015 | 2014 | |||||||||||||||
Ratios to average net assets (1) | ||||||||||||||||
Net investment gain/(loss) (1) | -6.37 | % | -6.28 | % | ||||||||||||
Expenses before incentive fees (3) | 4.95 | % | 5.40 | % | ||||||||||||
Expenses after incentive fees (3) | 6.79 | % | 6.74 | % | ||||||||||||
Total return before incentive fees (2) | 1.27 | % | -0.31 | % | ||||||||||||
Total return after incentive fees (2) | -0.57 | % | -1.65 | % | ||||||||||||
| (1) | Annualized with the exception of incentive fees. |
| (2) | Total returns are not annualized. |
| (3) | Expense ratios do not reflect interest allocated to the Managing Owner as such expenses are not included in the Consolidated Statements of Operations of the Trust. See footnote 5. |
The Trust financial highlights are calculated based upon the Trust’s consolidated financial statements. The consolidated Trust does not issue units and therefore the financial highlights do not disclose any unitized data.
7. Derivative Instruments and Hedging Activities
The Trust’s primary business is to engage in speculative trading of a diversified portfolio of futures, forwards (including interbank foreign currencies), options contracts and other derivative instruments (including swap contracts). The Trust does not enter into or hold positions for hedging purposes as defined under ASC 815. The detail of the fair value of the Trust’s derivatives by instrument types as of March 31,June 30, 2015 and December 31, 2014 is included in the Consolidated Condensed Schedules of Investments. See Note 4 for further disclosure related to the Trust’s positions in swap contracts.
For the three and six months ended March 31,June 30, 2015 and 2014, the monthly average of futures contracts bought was approximately 10,92310,232 and 10,603,9,319, respectively and sold was approximately 10,97510,304 and 10,745,9,124, respectively.
The following tables summarize the trading revenues for the three and six months ended March 31,June 30, 2015 and 2014 by contract type:
Realized Trading Revenue from Futures, Forwards and Options
for the Three Months Ended March 31, 2015(1)
Type of contract | ||||
Metals | $ | (1,858,800 | ) | |
Currencies | 10,129,391 | |||
Energies | 11,552,937 | |||
Agriculturals | (148,685 | ) | ||
Interest rates | 9,920,908 | |||
Stock indices | 10,391,914 | |||
|
| |||
Realized trading income/(loss)(1) | $ | 39,987,665 | ||
|
| |||
Net Change in Open Trade Equity from Futures, Forwards and Options
for the Three Months Ended March 31,June 30, 2015(2)
Type of contract | ||||
Metals | $ | 787,054 | ||
Currencies | 322,356 | |||
Energies | 3,239,657 | |||
Agriculturals | 250,296 | |||
Interest rates | (4,205,211 | ) | ||
Stock indices | (3,588,047 | ) | ||
|
| |||
Change in unrealized trading income/(loss)(1) | $ | (3,193,895 | ) | |
|
| |||
Net Change in Open Trade Equity from Futures, Forwards and Options
for the Six Months Ended June 30, 2015
Type of contract | ||||||||
Metals | $ | 104,184 | $ | 891,238 | ||||
Currencies | (2,328,313 | ) | (2,005,957 | ) | ||||
Energies | (7,926,646 | ) | (4,686,989 | ) | ||||
Agriculturals | 187,764 | 438,060 | ||||||
Interest rates | (190,205 | ) | (4,395,416 | ) | ||||
Stock indices | (148,225 | ) | (3,736,272 | ) | ||||
|
| |||||||
Change in unrealized trading income/(loss)(2) | $ | (10,301,441 | ) | |||||
Change in unrealized trading income/(loss)(1) | $ | (13,495,336 | ) | |||||
|
| |||||||
| (1) |
Realized Trading Revenue from Futures, Forwards and Options
for the Three Months Ended June 30, 2015
Type of contract | ||||
Metals | $ | (1,671,013 | ) | |
Currencies | (5,995,199 | ) | ||
Energies | (6,800,965 | ) | ||
Agriculturals | 66,907 | |||
Interest rates | (1,770,084 | ) | ||
Stock indices | 1,991,665 | |||
|
| |||
Realized trading income/(loss)(1) | $ | (14,178,689 | ) | |
|
| |||
Realized Trading Revenue from Futures, Forwards and Options
for the Six Months Ended June 30, 2015
Type of contract | ||||
Metals | $ | (3,529,813 | ) | |
Currencies | 4,134,192 | |||
Energies | 4,751,972 | |||
Agriculturals | (81,778 | ) | ||
Interest rates | 8,150,824 | |||
Stock indices | 12,383,579 | |||
|
| |||
Realized trading income/(loss)(1) | $ | 25,808,976 | ||
|
| |||
| (1) | Amounts recorded in the Consolidated Statements of Operations under net realized gain/(loss) on futures, forwards and options |
Net Change in Open Trade Equity from Futures, Forwards and Options for the Three Months Ended June 30, 2014 Type of contract Metals Currencies Energies Agriculturals Interest rates Stock indices Change in unrealized trading income/(loss)(1) Net Change in Open Trade Equity from Futures, Forwards and Options for the Six Months Ended June 30, 2014 Type of contract Metals Currencies Energies Agriculturals Interest rates Stock indices Change in unrealized trading income/(loss)(1) $ 1,029,170 450,876 300,637 749,674 4,544,705 (1,089,139 ) $ 5,985,923 $ (947,051 ) (3,956,074 ) 1,967,434 (471,767 ) 4,765,842 (6,400,414 ) $ (5,042,030 )
| (1) | Amounts recorded in the Consolidate Statement of Operations under net change in open trade equity (deficit), at fair value. |
Realized Trading Revenue from Futures, Forwards and Options for the Three Months Ended June 30, 2014 |
| |||
Type of contract | ||||
Metals | $ | (2,663,349 | ) | |
Currencies | (786,959 | ) | ||
Energies | (234,908 | ) | ||
Agriculturals | (1,684,548 | ) | ||
Interest rates | 4,682,671 | |||
Stock indices | 6,048,688 | |||
|
| |||
Realized trading income/(loss)(1) | $ | 5,361,595 | ||
|
| |||
Realized Trading Revenue from Futures, Forwards and Options for the Six Months Ended June 30, 2014 | ||||
Type of contract | ||||
Metals | $ | (3,401,979 | ) | |
Currencies | (441,730 | ) | ||
Energies | (1,894,183 | ) | ||
Agriculturals | (1,738,025 | ) | ||
Interest rates | 7,301,379 | |||
Stock indices | 5,687,637 | |||
|
| |||
Realized trading income/(loss)(1) | $ | 5,513,099 | ||
|
| |||
| (1) | Amounts recorded in the Consolidated Statements of Operations under net realized gain/(loss) on futures, forwards and options |
Certain financial instruments and derivative instruments are eligible for offset in the statements of financial condition under GAAP. The Trust’s open trade equity/(deficit), options written, and receivables from FCMs are subject to master netting arrangements and collateral arrangements and meet the GAAP guidance to qualify for offset. A master netting arrangement with a counterparty creates a right of offset for amounts due to and from that same counterparty that is enforceable in the event of a default or bankruptcy. The Trust’s policy is to recognize amounts subject to master netting arrangements on a net basis on the consolidated statements of financial condition.
The following tables present gross and net information about the Trust’s assets and liabilities subject the master netting arrangements as disclosed on the consolidated statements of financial condition as of March 31,June 30, 2015 and December 31, 2014:
Offsetting of Derivative Assets and Liabilities
| As of March 31, 2015 | Gross Amounts of recognized Derivative Assets | Gross Amounts offset in the Statement of Financial Condition | Net Amounts Presented in the Statement of Financial Condition | |||||||||||||||||||||
| As of June 30, 2015 | Gross Amounts of recognized Derivative Assets | Gross Amounts offset in the Statement of Financial Condition | Net Amounts Presented in the Statement of Financial Condition | |||||||||||||||||||||
Open Trade Equity/(Deficit) | $ | 7,892,086 | $ | (4,491,313 | ) | $ | 3,400,773 | $ | — | $ | (17,281 | ) | $ | (17,281 | ) | |||||||||
Options Purchased | 15,494,973 | — | 15,494,973 | 3,819,429 | — | 3,819,429 | ||||||||||||||||||
Options Written | — | (15,201,527 | ) | (15,201,527 | ) | — | (2,581,870 | ) | (2,581,870 | ) | ||||||||||||||
Swap Contracts | 47,935,058 | — | 47,935,058 | 38,220,263 | — | 38,220,263 | ||||||||||||||||||
Offsetting of Derivative Assets and Liabilities
| As of December 31, 2014 | Gross Amounts of recognized Derivative Assets | Gross Amounts offset in the Statement of Financial Condition | Net Amounts Presented in the Statement of Financial Condition | Gross Amounts of recognized Derivative Assets | Gross Amounts offset in the Statement of Financial Condition | Net Amounts Presented in the Statement of Financial Condition | ||||||||||||||||||
Open Trade Equity/(Deficit) | $ | 17,120,111 | $ | (2,295,689 | ) | $ | 14,824,422 | $ | 17,120,111 | $ | (2,295,689 | ) | $ | 14,824,422 | ||||||||||
Options Purchased | 9,075,883 | — | 9,075,883 | 9,075,883 | — | 9,075,883 | ||||||||||||||||||
Options Written | — | (8,963,838 | ) | (8,963,838 | ) | — | (8,963,838 | ) | (8,963,838 | ) | ||||||||||||||
Swap Contracts | 35,990,887 | — | 35,990,887 | 35,990,887 | — | 35,990,887 | ||||||||||||||||||
8. Trading Activities and Related Risks
The purchase and sale of futures and options on futures contracts require margin deposits with FCMs. Additional deposits may be necessary for any loss on contract value. The Commodity Exchange Act requires an FCM to segregate all customer transactions and assets from the FCM’s proprietary activities. A customer’s cash and other property (for example, U.S. treasury bills) deposited with an FCM are considered commingled with all other customer funds subject to the FCM’s segregation requirements. In the event of an FCM’s insolvency, recovery may be limited to a pro rata share of segregated funds available. It is possible that the recovered amount could be less than the total of cash and other property deposited.
The term “off-balance sheet risk” refers to an unrecorded potential liability that, even though it does not appear on the statements of financial condition, may result in future obligation or loss in excess of the amount paid by the Series for a particular investment. Each Trading Company expects to trade in futures, options, forward and swap contracts and will therefore be a party to financial instruments with elements of off-balance sheet market and credit risk. In entering into these contracts, there exists a market risk that such contracts may be significantly influenced by market conditions, such as interest rate volatility, resulting in such contracts being less valuable. If the markets should move against all of the futures positions held by a Trading Company in respect of any Series at the same time, and if the Trading Advisor(s) of such Trading Company are unable to offset such futures interests positions, such Trading Company could lose all of its assets and the holders of Units of such Series would realize a 100% loss. The Managing Owner will seek to minimize market risk through real-time monitoring of open positions and the level of diversification of each Trading Advisor’s portfolio. It is anticipated that any Trading Advisor’s margin-to-equity ratio will typically not exceed approximately 35% although the actual ratio could be higher or lower from time to time.
In addition to market risk, trading futures, forward and swap contracts entails credit risk that a counterparty will not be able to meet its obligations to a Trading Company. The counterparty for futures contracts traded in the United States and on most foreign exchanges is
the clearinghouse associated with such exchange. In general, clearinghouses are backed by the corporate members of the clearinghouse who are required to share any financial burden resulting from the non-performance by one of their members and, as such, should significantly reduce this credit risk. In cases where the clearinghouse is not backed by the clearing members, like some foreign exchanges, it is normally backed by a consortium of banks or other financial institutions. Some non-U.S. exchanges, in contrast to U.S. exchanges, are principals’ markets in which performance is the responsibility only of the individual counterparty with whom the Trading Company has entered into the transaction, and not of the exchange or clearing corporation. In these kinds of markets, there is risk of bankruptcy or other failure or refusal to perform by the counterparty.
In the case of forward contracts traded on the interbank market and swaps, neither is traded on exchanges. The counterparty is generally a single bank or other financial institution, rather than a group of financial institutions; thus there may be a greater counterparty credit risk. The Managing Owner expects the Trading Advisors to trade only with those counterparties which it believes to be creditworthy. All positions of each Trading Company will be valued each day on a mark-to-market basis. There can be no assurance that any clearing member, clearinghouse or other counterparty will be able to meet its obligations to any Trading Company.
The Managing Owner has established procedures to actively monitor and minimize market and credit risks. The Limited Owners bear the risk of loss only to the extent of the market value of their respective investments and, in certain specific circumstances, distributions and redemptions received.
9. Indemnifications and Guarantees
The Trust has entered into agreements, which provide for the indemnification of futures clearing brokers, and commodity trading advisers, among others, against losses, costs, claims and liabilities arising from the performance of their individual obligations under such agreements, except for gross negligence or bad faith. The Trust has had no prior claims or payments pursuant to these agreements. The Trust’s individual maximum exposure under these arrangements is unknown, as this would involve future claims that may be made against the Trust that have not yet occurred. However, based on experience the Trust expects the risk of loss to be remote. Maximum exposure is unfulfilled obligations of the Trust up to the amount of equity at risk with UBS. The Trust has not recorded any liability for the guarantees in the accompanying financial statements as it expects any possibility of losses to be remote.
The Trust has guaranteed the obligations of the trading companies under the customer agreements with UBS Securities LLC as Clearing Broker. In the event that one Series of the Trust is unable to meet its obligations to UBS Securities LLC, the assets of the other Series will be available to UBS Securities LLC as part of the guarantee, but only to the extent of such Series’ pro rata allocation to the trading company. The Trust has not recorded any liability for the indemnifications in the accompanying financial statements as it expects any possibility of losses to be remote.
10. Subsequent Events
Effective as of May 1, 2015, Mr. Richard E. Bornhoft no longer serves on the Executive Committee of the Managing Owner. As of May 1, 2015, the members of the Executive Committee are David DeMuth and Robert J. Enck.None.
| Item 2. | MANAGEMENT’S DISCUSSION AND ANALYSIS OF FINANCIAL CONDITION AND RESULTS OF OPERATIONS |
Introduction
The following discussion and tables should be read in conjunction with our unaudited consolidated financial statements and notes thereto included in this quarterly report and our 2014 Annual Report on Form 10-K for the year ended December 31, 2014.
Overview
The Trust is a Delaware statutory trust formed on August 8, 2003. The Trust is a multi-advisor commodity pool, as described in CFTC Regulation § 4.10(d)(2). The Trust is authorized to issue multiple Series of Units, pursuant to the requirements of the Trust Act. The assets of each Series are held and accounted for in separate and distinct records separately from the assets of other Series. The Trust is managed by the Managing Owner, and its term will expire on December 31, 2053 (unless terminated earlier in certain circumstances).
The Trust, with respect to each Series of Units, engages in the speculative trading of a diversified portfolio of futures, forwards (including interbank foreign currencies), options contracts and other derivative instruments (including Swaps). The Trust allocates funds to affiliated Trading Companies, each of which has one-year renewable contracts with its own independent Trading Advisor(s) that will manage all or a portion of the applicable Trading Company’s assets, and make the trading decisions for the assets of each Series vested in such Trading Company. In November 2010, the Equinox Frontier Select Fund invested a portion of its assets in an unaffiliated Trading Company, Berkeley Quantitative Colorado Fund LLC which was liquidated on March 16, 2012. The assets of each Trading Company will be segregated from the assets of each other Trading Company. The Trust has an investment objective of increasing the value of the Units over the long term (capital appreciation), while controlling risk and volatility; further, to offer exposure to the investment programs of individual Trading Advisors and to specific instruments (currencies). For additional overview of the Trust’s structure and business activities, see Item 1. “BUSINESS.”
Critical Accounting Policies and Estimates
The preparation of financial statements in conformity with GAAP requires the Managing Owner to adopt accounting policies and make estimates and assumptions that affect amounts reported in the Trust’s financial statements. The Trust’s most significant accounting policy, described below, includes the valuation of its futures and forward contracts, options contracts, swap contracts, U.S. treasury securities and investments in unconsolidated Trading Companies.Companies upon exchange settlement prices or non-exchange traded contracts and obligations with valuation based on third-party quoted dealer values on the Interbank market.
The Trust’s other significant accounting policies are described in detail in Note 2 of the financial statements.
Investment Transactions and Valuation
The Managing Owner has evaluated the nature and type of transactions processed and estimates that it makes in preparing the Trust’s financial statements and related disclosures and has adoptedAccounting Standard Codification (“ASC”) 820,Fair Value Measurements and Disclosure, and implemented the framework for measuring fair value for assets and liabilities.
The Trust utilizes valuation techniques that are consistent with the market approach per the requirement of ASC 820 for the valuation of futures (exchange traded) contracts, forward (non-exchange traded) contracts, option contracts, swap contracts and other non-cash assets. The market approach uses prices and other relevant information generated by market transactions involving identical or comparable assets or liabilities. The Trust applies the valuation techniques in a consistent manner for each asset or liability. The Trust records all investments at fair value in its Statements of Financial Condition, with changes in fair value reported as a component of net gain/(loss) on investments in the Statements of Operations.
Inputs to valuation techniques refer to the assumptions that market participants would use in pricing the assets or liabilities. Inputs may be observable, meaning those that reflect the assumptions market participants would use in pricing the financial asset or liability based on market data obtained from independent sources, or unobservable, meaning those that reflect the reporting entity’s own assumptions about the assumptions market participants would use in pricing the financial asset or liability based on the best information available in the circumstances.
In addition, the Trust monitors counterparty credit risk and incorporates any identified risk factors when assigning input levels to underlying financial assets or liabilities. In that regard ASC 820 establishes a fair value hierarchy for valuation inputs that gives the highest priority to quoted prices in active markets for identical financial assets and the lowest priority to unobservable inputs. A full disclosure of the fair value hierarchy is presented in Note 3 of the financial statements—Fair Value Measurements.
Selection and Replacement of Trading Advisors
The managing owner is responsible for the selection, retention and termination of the trading advisors and reference programs on behalf of each series. The actual allocation among trading advisors for each series will vary based upon the relative trading performance of the trading advisors and/or reference programs, and the managing owner may otherwise vary such percentages from time to time in its sole discretion. The managing owner will adjust its allocations and rebalance the portfolio of any series among trading advisors to maintain weightings that it believes will most likely achieve capital growth within the investment guidelines of the relevant series.
The managing owner utilizes certain quantitative and qualitative analysis in connection with the identification, evaluation and selection of the trading advisors. The managing owner’s proprietary and commercial analytical software programs and comprehensive trading advisor database provide the quantitative basis for the trading advisor selection, portfolio implementation process, and ongoing risk management, monitoring, and review.
In 1983, Richard Bornhoft, the Chief Investment Officer of the managing owner, began compiling a proprietary database of the leading United States and internationally based alternative investment programs. Trading advisors are monitored and performance data is entered on a daily, monthly, quarterly or bi-annual basis according to internal ranking systems.
The managing owner’s research department is continually refining ways to assimilate vast amounts of trading advisor performance data and due-diligence information. The proprietary and commercial database of alternative investment programs is always increasing. Research team members regularly interact with trading advisors throughout the due diligence and monitoring process. Only those programs that have met strict quantitative and qualitative review are considered as potential managers of client assets.
Following is a summary of the quantitative and qualitative analysis:
Quantitative Analysis
The managing owner’s analytical software system applies a variety of statistical measures towards the evaluation of current and historical advisor performance data. Statistical measures include but are not limited to: (1) risk/reward analysis, (2) time window analysis, (3) risk analysis, (4) correlation analysis, (5) statistical overlays and (6) performance cycle analysis.
Qualitative Analysis
Although quantitative analysis statistically identifies the top performing trading advisors, qualitative analysis plays a major role in the trading advisor evaluation and final selection process. Each trading advisor in the managing owner’s top decile universe initially undergoes extensive qualitative review by the managing owner’s research department, as well as continual monitoring. This analysis generally includes, but is not limited to: (1) preliminary information and due diligence, (2) background review, (3) onsite due diligence, (4) extensive due diligence questionnaires and (5) written review and periodic updates. This information allows a thorough review of each trading advisor’s trading philosophy, trading systems and corporate structure.
Multi-Manager Approach
A multi-manager approach to portfolio management provides diversification of trading advisors and access to broader global markets. Multiple trading advisors can provide diversification across trading methodologies, trading time horizons, and markets traded. Additionally, multi-manager portfolios tend to provide a greater level of professional management with ongoing risk management and review. The result can be more consistent returns with lower volatility.
The trading system of each of the major commodity trading advisors used by the Trading Companies is as follows:
Major Commodity Trading Advisor | Trading System Style | |
Abraham Trading Company | Systematic | |
BH-DG Systematic Trading LLP | Systematic | |
Brandywine Asset Management | Discretionary | |
Campbell & Company, Inc. | Systematic | |
Cantab Capital Partners LLP | Systematic | |
Chesapeake Capital Corporation | Systematic | |
Commodity Strategies AG | Systematic | |
Crabel Capital Management, LLC | Systematic | |
Emil Van Essen, LLC | Discretionary | |
Fort, L.P. | Systematic | |
H2O Asset Management | Systematic | |
J E Moody & Company | Systematic | |
Quantica Capital AG | Systematic | |
Quantitative Investment Management, LLC | Systematic | |
QuantMetrics Capital Management LLP | Systematic | |
Quest Partners LLC | Systematic | |
Red Oak Commodity Advisors, Inc. | Discretionary | |
Rosetta Capital Management, LLC | Discretionary | |
Skyline Management, Inc. | Discretionary | |
Systematic Alpha | Systematic | |
Tarpon Trading | Systematic | |
Tiverton Trading | Discretionary | |
Transtrend B.V. | Systematic | |
Winton Capital Management Ltd. | Systematic | |
As of March 31,June 30, 2015, the allocation of the assets of each applicable Series of the Trust betweenamong the Trading Advisors was as follows:
Allocation as of March 31, 2015 (expressed as a percentage of aggregate notional exposure to commodity trading programs)
| Allocation as of June 30, 2015 (expressed as a percentage of aggregate notional exposure to commodity trading programs) | ||||||||||||||||||||||||||||||||||||||||||||||||||||||||
| Advisor | Equinox Frontier Diversified Fund | Equinox Frontier Long/Short Commodity Fund | Equinox Frontier Masters Fund | Equinox Frontier Balanced Fund | Equinox Frontier Select Fund | Equinox Frontier Winton Fund | Equinox Frontier Heritage Fund | Equinox Frontier Diversified Fund | Equinox Frontier Long/Short Commodity Fund | Equinox Frontier Masters Fund | Equinox Frontier Balanced Fund | Equinox Frontier Select Fund | Equinox Frontier Winton Fund | Equinox Frontier Heritage Fund | ||||||||||||||||||||||||||||||||||||||||||
Abraham Trading Company | — | 23 | % | — | — | — | — | — | — | 19 | % | — | — | — | — | — | ||||||||||||||||||||||||||||||||||||||||
Brandywine Asset Management | — | — | — | 5 | % | — | — | — | — | — | — | 5 | % | — | — | — | ||||||||||||||||||||||||||||||||||||||||
BH-DG Systematic Trading LLP | 11 | % | — | — | — | 44 | % | — | 50 | % | 7 | % | — | — | — | 43 | % | — | 48 | % | ||||||||||||||||||||||||||||||||||||
Campbell &Company Inc. | — | — | — | 9 | % | — | — | — | — | — | — | 7 | % | — | — | — | ||||||||||||||||||||||||||||||||||||||||
Cantab Capital Partners LLP | — | — | — | 8 | % | — | — | — | — | — | — | 8 | % | — | — | — | ||||||||||||||||||||||||||||||||||||||||
Chesapeake Capital Corporation | 10 | % | — | 28 | % | — | — | — | — | 10 | % | — | 27 | % | — | — | — | — | ||||||||||||||||||||||||||||||||||||||
Commodity Strategies AG | — | — | — | — | — | — | — | — | — | — | — | — | — | — | ||||||||||||||||||||||||||||||||||||||||||
Crabel Capital Management, LLC | 7 | % | — | — | 5 | % | — | — | — | 7 | % | — | — | 6 | % | — | — | — | ||||||||||||||||||||||||||||||||||||||
Emil Van Essen, LLC | 6 | % | 11 | % | 17 | % | 4 | % | — | — | — | 7 | % | 17 | % | 20 | % | 5 | % | — | — | — | ||||||||||||||||||||||||||||||||||
Fort, L.P. | 10 | % | — | — | 8 | % | — | — | — | 11 | % | — | — | 11 | % | — | — | — | ||||||||||||||||||||||||||||||||||||||
H2O Asset Management | 9 | % | — | — | 9 | % | — | — | — | 8 | % | — | — | 9 | % | — | — | — | ||||||||||||||||||||||||||||||||||||||
J E Moody & Company | — | 19 | % | — | — | — | — | — | — | 16 | % | — | — | — | — | — | ||||||||||||||||||||||||||||||||||||||||
Quantica Capital AG | — | — | — | — | — | — | — | — | — | — | 7 | % | — | — | — | |||||||||||||||||||||||||||||||||||||||||
Quantitative Investment Management, LLC | 8 | % | — | — | 8 | % | — | — | — | 10 | % | — | — | 9 | % | — | — | — | ||||||||||||||||||||||||||||||||||||||
QuantMetrics Capital Management LLP | 13 | % | — | — | 9 | % | — | — | — | 15 | % | — | — | 9 | % | — | — | — | ||||||||||||||||||||||||||||||||||||||
Quest Partners LLC | 11 | % | — | — | — | — | — | — | 11 | % | — | — | — | — | — | — | ||||||||||||||||||||||||||||||||||||||||
Red Oak Commodity Advisors, Inc. | — | 25 | % | — | — | — | — | — | — | 24 | % | — | — | — | — | — | ||||||||||||||||||||||||||||||||||||||||
Rosetta Capital Management, LLC | — | 18 | % | — | — | — | — | — | — | 20 | % | — | — | — | — | — | ||||||||||||||||||||||||||||||||||||||||
Skyline Management, Inc. | — | — | — | — | — | — | — | — | — | — | — | — | — | — | ||||||||||||||||||||||||||||||||||||||||||
Systematic Alpha | — | — | — | 6 | % | — | — | — | ||||||||||||||||||||||||||||||||||||||||||||||||
Tarpon Trading LLC | — | — | — | — | — | — | — | — | — | — | — | — | — | — | ||||||||||||||||||||||||||||||||||||||||||
Tiverton Trading | — | — | — | — | — | — | — | — | — | — | — | — | — | — | ||||||||||||||||||||||||||||||||||||||||||
Transtrend B.V. | — | — | 26 | % | — | 56 | % | — | — | — | — | 25 | % | — | 57 | % | — | — | ||||||||||||||||||||||||||||||||||||||
Winton Capital Management Ltd. | 11 | % | — | 30 | % | 9 | % | — | 100 | % | 50 | % | 10 | % | — | 28 | % | 8 | % | — | 100 | % | 52 | % | ||||||||||||||||||||||||||||||||
Liquidity and Capital Resources
The Trust will raise additional capital only through the sale of Units offered pursuant to the continuing offering, and does not intend to raise any capital through borrowing. Due to the nature of the Trust’s business, it makes no capital expenditures and has no capital assets that are not operating capital or assets.
The Managing Owner is responsible for the payment of all of the ordinary expenses associated with the organization of the Trust and the offering of each Series of Units, except for the initial and ongoing service fee, if any, and no Series will be required to reimburse these expenses. As a result, 100% of each Series’ offering proceeds are initially available for that Series’ trading activities.
A portion of each Trading Company’s assets is used as margin to maintain that Trading Company’s forward currency contract positions, and another portion is deposited in cash in segregated accounts in the name of each Trading Company maintained for each Trading Company at the clearing brokers in accordance with CFTC segregation requirements. At March 31,June 30, 2015, cash deposited at the clearing brokers was $74,616,685$61,682,864 for the Trust. The clearing brokers are expected to credit each Trading Company with approximately 80%-100% of the interest earned on its average net assets on deposit with the clearing brokers each month. Currently, with the Federal Funds target rate at 0.00% to 0.25%, this amount is estimated to be 0.00%. In an attempt to increase interest income earned, the Managing Owner also may invest the non-margin assets in U.S. government securities which include any security issued or guaranteed as to principal or interest by the U.S., or by a person controlled by or supervised by and acting as an instrumentality of the government of the U.S. pursuant to authority granted by Congress or any certificate of deposit for any of the foregoing, including U.S. treasury bonds, U.S. treasury bills and issues of agencies of the U.S. government, and certain cash items such as money market funds and time deposits. Aggregate interest income from all sources, including assets held at clearing brokers, of up to 2% (annualized) is paid to the Managing Owner by the Equinox Frontier Balanced Fund (Class 1 and Class 2 only), Equinox Frontier Winton Fund, Equinox Frontier Select Fund, and Equinox Frontier Heritage Fund. For the Equinox Frontier Balanced Fund (Class 1a and Class 2a only), and the Equinox Frontier Long/Short Commodity Fund, 20% of the total interest allocated to each Series is paid to the Managing Owner. The amounts reflected in the financial statements for the Trust and Series are disclosed on a net basis. Due to some classes not exceeding the 2% paid to the Managing Owner, amounts earned by those classes may be zero.
Approximately 10% to 30% of the Trust’s assets are expected to be committed as required margin for futures contracts and forwards and options trading and held by the respective broker, although the amount committed may vary significantly. Such assets are
maintained in the form of cash or U.S. treasury bills in segregated accounts with the futures broker pursuant to the Commodity Exchange Act and regulations there under. Approximately 2% to 6% of the Trust’s assets are expected to be deposited withover-the-counter counterparties in order to initiate and maintain forward and swap contracts. Such assets are not held in segregation or otherwise regulated under the Commodity Exchange Act, unless such over-the-counter counterparty is registered as a futures commission merchant. These assets are held either in U.S. government securities or short-term time deposits with U.S.-regulated bank affiliates of the over-the-counter counterparties. The remaining approximately 64% to 88% of the Trust’s assets will normally be invested in cash equivalents and short-term investments, such as money market funds and time deposits and held by the clearing broker, the over-the-counter counterparties and by U.S. federally chartered banks. As of March 31,June 30, 2015, total cash and cash equivalents held at banking institutions were $2,117,560$4,827,779 for the Equinox Frontier Diversified Fund, $600,918$1,119,846 for the Equinox Frontier Long/Short Commodity Fund, $896,661$1,978,484 for the Equinox Frontier Masters Fund, $3,273,398$7,863,320 for the Equinox Frontier Balanced Fund, $207,627$401,143 for the Equinox Frontier Select Fund, $1,892,129$4,254,223 for the Equinox Frontier Winton Fund, and $427,180$947,643 for the Equinox Frontier Heritage Fund.
As a commodity pool, the Registrant has large cash positions. Such cash positions are used to pay margin for the trading of futures, forwards and options, and also to pay redemptions. Generally, the Registrant has not been forced to liquidate positions to fund redemptions. During the threesix months ended March 31,June 30, 2015, the Registrant was able to pay all redemptions.
Off-Balance Sheet Risk
The term “off-balance sheet risk” refers to an unrecorded potential liability that, even though it does not appear on the balance sheet, may result in future obligation or loss. Each Trading Company trades in futures, forward and swap contracts and is therefore a party to financial instruments with elements of off-balance sheet market and credit risk. In entering into these contracts there exists a market risk that such contracts may be significantly influenced by market conditions, such as interest rate volatility, resulting in such contracts being less valuable. If the markets should move against all of the futures interests positions held by a Trading Company in respect of any Series at the same time, and if the Trading Advisor(s) of such Trading Company are unable to offset such futures interests positions, such Trading Company could lose all of its assets and the holders of Units of such Series would realize a 100% loss. The Managing Owner seeks to minimize market risk through real-time monitoring of open positions and the level of diversification of each Trading Advisor’s portfolio. It is anticipated that any Trading Advisor’s margin-to-equity ratio will typically not exceed approximately 35% although the actual ratio could be higher or lower from time to time.
In addition to market risk, trading futures, forward and swap contracts entails credit risk which is the risk that a counterparty will not be able to meet its obligations to a Trading Company. The counterparty for futures contracts traded in the U.S. and on most foreign exchanges is the clearinghouse associated with such exchange. In general, clearinghouses are backed by the corporate members of the clearinghouse who are required to share any financial burden resulting from the non-performance by one of their members and, as such, should significantly reduce this credit risk. In cases where the clearinghouse is not backed by the clearing members, like some foreign exchanges, it is normally backed by a consortium of banks or other financial institutions. Some non-U.S. exchanges, in contrast to U.S. exchanges are principals’ markets in which performance is the responsibility only of the individual counterparty with whom the Trading Company has entered into the transaction and not of the exchange or clearing corporation. In these kinds of markets, there is risk of bankruptcy or other failure or refusal to perform by the counterparty.
In the case of forward contracts and swaps traded on the interbank market, neither is traded on an exchange. The counterparty is generally a single bank or other financial institution, rather than a group of financial institutions; thus, there may be a greater counterparty credit risk. The Managing Owner expects the Trading Advisors to trade only with those counterparties which it believes to be creditworthy. All positions of each Trading Company are valued each day on a mark-to-market basis. There can be no assurance that any clearing member, clearinghouse or other counterparty will be able to meet its obligations to any Trading Company.
The Trust has entered into agreements, which provide for the indemnification of futures clearing brokers, currency trading companies, and commodity trading advisers, among others, against losses, costs, claims and liabilities arising from the performance of their individual obligations under such agreements, except for gross negligence or bad faith. The Trust has had no prior claims or payments pursuant to these agreements. The Trust’s individual maximum exposure under these arrangements is unknown, as this would involve future claims that may be made against the Trust that have not yet occurred. However, based on experience the Trust expects the risk of loss to be remote.
Disclosure of Contractual Obligations
The business of the Trust is the speculative trading of commodity interests. The majority of the Trust’s futures and forward positions, which may be categorized as “purchase obligations” under Item 303 of Regulation S-K, are short-term. That is, they are held for less
than one year. Because the Trust does not enter into other long-term debt obligations, capital lease obligations, operating lease obligations or other long-term liabilities that would otherwise be reflected on the Trust’s Statement of Financial Condition, a table of contractual obligations has not been presented.
Results of Operations
Series Returns and Other Information
The returns for each Series and Class of Units for the three and six months ended March 31,June 30, 2015 and 2014, and related information, are discussed below. The activities of the Trust on a consolidated basis are explained through the activity of the underlying Series. Please refer to the discussion of the Series activities in relation to the Trust on a consolidated basis.
Each Series had exposure to commodity interest positions within one or more sectors during the three and six months ended March 31,June 30, 2015 and 2014. The performance of each Series was impacted over the course of the periods by, among other things, the relative performance of the relevant sector or sectors and the commodities within those sectors, the changing allocations among, and the specific positions taken by the Series’ Trading Advisors in, the relevant sector(s) and commodities, and the timing of entries and exits. For certain of the Series, a sector attribution chart has been included at the end of the relevant discussion. Each chart depicts the performance of the relevant Series’ positions within each of the relevant sectors (determined by the Managing Owner using monthly gross return and NAV figures, with various adjustments to net out a proportional allocation of the fees and expenses chargeable to the Series) during the periods presented.
Three Months Ended March 31,June 30, 2015 Compared to Three Months Ended March 31,June 30, 2014.
Equinox Frontier Diversified Fund
The Equinox Frontier Diversified Fund— Class 1 NAV lost 12.24% and gained 4.83%, respectively, for the three months ended June 30, 2015 and 2014, net of fees and expenses; the Equinox Frontier Diversified Fund—Class 2 NAV lost 11.85% and gained 5.29%, respectively for the three months ended June 30, 2015 and 2014, net of fees and expenses; the Equinox Frontier Diversified Fund—Class 3 NAV lost 11.79% and gained 5.37%, respectively for the three months ended June 30, 2015 and 2014.
For the three months ended June 30, 2015, the Equinox Frontier Diversified Fund recorded net loss on investments of $7,276,498, net investment income of $155,143, and total expenses of $706,350 resulting in a net decrease in Owners’ capital from operations of $7,505,363, after non-controlling interests of $322,342. For the three months ended June 30, 2014, the Equinox Frontier Diversified Fund recorded net gain on investments of $4,070,103, net investment income of $135,499, and total expenses of $1,658,328 resulting in a net increase in Owner’s Capital from operations of $2,547,274.
Please see additional discussion under “Six Months Ended June 30, 2015 Compared to Six Months Ended June 30, 2014 – Equinox Frontier Diversified Fund.”
Equinox Frontier Masters Fund
The Equinox Frontier Masters Fund—Class 1 NAV lost 14.31% and gained 6.49% for the three months ended June 30, 2015 and 2014 net of fees and expenses; the Equinox Frontier Masters Fund —Class 2 NAV lost 13.93% and gained 6.96% for the three months ended June 30, 2015 and 2014, net of fees and expenses; the Equinox Frontier Masters Fund—Class 3 NAV lost 13.88% and gained 7.03% for the three months ended June 30, 2015 and 2014, net of fees and expenses.
For the three months ended June 30, 2015, the Equinox Frontier Masters Fund recorded net loss on investments of $3,430,447, net investment income of $68,655, and total expenses of $432,082, resulting in a net decrease in Owners’ capital from operations of $3,793,874. For the three months ended June 30, 2014, the Equinox Frontier Masters Fund recorded net gain on investments of $2,119,822, net investment income of $71,429, and total expenses of $621,832, resulting in a net increase in Owners’ capital from operations of $1,569,419.
Please see additional discussion under “Six Months Ended June 30, 2015 Compared to Six Months Ended June 30, 2014—Equinox Frontier Masters Fund.”
Equinox Frontier Long/Short Commodity Fund
The Equinox Frontier Long/Short Commodity Fund—Class 2 NAV lost 10.75% and gained 0.62%, respectively, for the three months ended June 30, 2015, net of fees and expenses; the Equinox Frontier Long/Short Commodity Fund —Class 3 NAV lost 10.76% and gained 0.62%, respectively for the three months ended June 30, 2015, net of fees and expenses; the Equinox Frontier Long/Short Commodity Fund —Class 1a NAV lost 11.22% and gained 0.41%, respectively, for the three months ended June 30, 2015, net of fees and expenses; the Equinox Frontier Long/Short Commodity Fund —Class 2a NAV lost 10.83% and gained 0.85%, respectively, for the three months ended June 30, 2015, net of fees and expenses; the Equinox Frontier Long/Short Commodity Fund Class 3a NAV lost 10.78% and gained 0.91%, respectively, for the three months ended June 30, 2015, net of fees and expenses.
For the three months ended June 30, 2015, the Equinox Frontier Long/Short Commodity Fund recorded net loss on investments of $1,822,067, net investment income of $43,133, and total expenses of $266,165, resulting in a net increase in Owners’ capital from operations of $2,045,099. For the three months ended June 30, 2014, the Equinox Frontier Long/Short Commodity Fund recorded net gain on investments of $1,521,079, net investment income of $47,605, and total expenses of $317,381, resulting in a net increase in Owners’ capital from operations of $111,679, after non-controlling interests of $1,139,624.
Please see additional discussion under “Six Months Ended June 30, 2015 Compared to Six Months Ended June 30, 2014 – Equinox Frontier Long/Short Commodity Fund.”
Equinox Frontier Balanced Fund
The Equinox Frontier Balanced Fund—Class 1 NAV lost 11.41% and gained 1.83%, respectively, for the three months ended June 30, 2015 and 2014, net of fees and expenses; the Equinox Frontier Balanced Fund —Class 2 NAV lost 10.74% and gained 2.61%, respectively, for the three months ended June 30, 2015 and 2014, net of fees and expenses; the Equinox Frontier Balanced Fund —Class 2a NAV lost 10.53% and gained 2.87%, respectively, for the three months ended June 30, 2015 and 2014, net of fees and expenses; the Equinox Frontier Balanced Fund —Class 3a NAV lost 10.53% and gained 2.87%, respectively, for the three months ended June 30, 2015 and 2014, net of fees and expenses; the Equinox Frontier Balanced Fund —Class 1AP NAV lost 10.74% for the three months ended June 30, 2015, net of fees and expenses.
For the three months ended June 30, 2015, the Equinox Frontier Balanced Fund recorded net loss on investments of $11,603,125, net investment income of $8,003, and total expenses of $1,027,119, resulting in a net decrease in Owners’ capital from operations of $12,148,245, after non-controlling interests of $473,996 For the three months ended June 30, 2014, the Equinox Frontier Balanced Fund recorded net gain on investments of $6,379,507, net investment income of $6,543, and total expenses of $1,826,219, resulting in a net increase in Owners’ capital from operations of $1,705,510, after non-controlling interests of $2,854,321.
Please see additional discussion under “Six Months Ended June 30, 2015 Compared to Six Months Ended June 30, 2014 – Equinox Frontier Balanced Fund.”
Equinox Frontier Select Fund
The Equinox Frontier Select Fund—Class 1 NAV lost 17.76% and gained 4.29%, respectively, for the three months ended June 30, 2015 and 2014, net of fees and expenses; the Equinox Frontier Select Fund —Class 2 NAV lost 17.14% and gained 5.08% respectively for the three months ended June 30, 2015 and 2014, net of fees and expenses; the Equinox Frontier Select Fund —Class 1AP NAV lost 17.15% for the three months ended June 30, 2015.
For the three months ended June 30, 2015, the Equinox Frontier Select Fund recorded net loss on investments of $4,071,121, net investment income of $0, and total expenses of $208,627, resulting in a net decrease in Owners’ capital from operations of $2,913,178, after non-controlling interests of $1,366,570. For the three months ended June 30, 2014, the Equinox Frontier Select Fund recorded net gain on investments of $902,903, net investment income of $0, and total expenses of $291,912, resulting in a net increase in Owners’ capital from operations of $610,991.
Please see additional discussion under “Six Months Ended June 30, 2015 Compared to Six Months Ended June 30, 2014 – Equinox Frontier Select Fund.”
Equinox Frontier Winton Fund
The Equinox Frontier Winton Fund—Class 1 NAV lost 13.57% and gained 5.94%, respectively, for the three months ended June 30, 2015 and 2014, net of fees and expenses; the Equinox Frontier Winton Fund —Class 2 NAV lost 12.93% and gained 6.74%, respectively, for the three months ended June 30, 2015 and 2014, net of fees and expenses; the Equinox Frontier Winton Fund —Class 1AP NAV lost 12.93% for the three months ended June 30, 2015.
For the three months ended June 30, 2015, the Equinox Frontier Winton Fund recorded net loss on investments of $5,119,775, net investment income of $27, and total expenses of $580,321, resulting in a net decrease in Owners’ capital from operations of $5,700,069. For the three months ended June 30, 2014, the Equinox Frontier Winton Fund recorded net gain on investments of $2,996,455, net investment income of $0, and total expenses of $945,307, resulting in a net increase in Owners’ capital from operations of $2,051,148.
Please see additional discussion under “Six Months Ended June 30, 2015 Compared to Six Months Ended June 30, 2014 – Equinox Frontier Winton Fund.”
Equinox Frontier Heritage Fund
The Equinox Frontier Heritage Fund—Class 1 NAV lost 14.72% and gained 7.51%, respectively, for the three months ended June 30, 2015 and 2014 net of fees and expenses; the Equinox Frontier Heritage Fund —Class 2 NAV lost 14.09% and gained 8.32%, respectively for the three months ended June 30, 2015 and 2014, net of fees and expenses; the Equinox Frontier Heritage Fund —Class 1AP NAV lost 14.09% for the three months ended June 30, 2015.
For the three months ended June 30, 2015, the Equinox Frontier Heritage Fund recorded net loss on investments of $2,770,445, net investment income of $0, and total expenses of $171,023, resulting in a net increase in Owners’ capital from operations of $2,941,468. For the three months ended June 30, 2014, the Equinox Frontier Heritage Fund recorded net gain on investments of $1,418,344, net investment income of $0, and total expenses of $256,119, resulting in a net increase in Owners’ capital from operations of $832,265, after non-controlling interests of $329,960.
Please see additional discussion under “Six Months Ended June 30, 2015 Compared to Six Months Ended June 30, 2014 – Equinox Frontier Heritage Fund.”
Six Months Ended June 30, 2015 Compared to Six Months Ended June 30, 2014.
Equinox Frontier Diversified Fund
2015
The Equinox Frontier Diversified Fund—Class 1 NAV gained 16.42% and lost 4.97%, respectively,2.18% for the threesix months ended March 31,June 30, 2015, and 2014, net of fees and expenses; the Equinox Frontier Diversified Fund—Class 2 NAV gained 16.92% and lost 4.56%, respectively3.06% for the threesix months ended March 31,June 30, 2015, and 2014, net of fees and expenses;expenses, the Equinox Frontier Diversified Fund—Class 3 NAV gained 16.99% and lost 1.53%, respectively3.19% for the threesix months ended March 31, 2015 and 2014. The inception date of the Equinox Frontier Diversified Fund Class 3 was February 24, 2014.June 30, 2015.
For the threesix months ended March 31,June 30, 2015, the Equinox Frontier Diversified Fund recorded net gain on investments of $15,234,471,$7,957,973, net investment income of $169,258,$324,401, and total expenses of $2,373,266$3,079,616 resulting in a net increase in Owners’ capital from operations of $9,717,066,$2,211,703, after non-controlling interests of $3,313,397.$2,991,055. The NAV per Unit, Class 1, increased from $113.09 at December 31, 2014 to $131.66$115.55 as of March 31,June 30, 2015. The NAV per Unit, Class 2, increased from $124.67 at December 31, 2014 to $145.76$128.49 as of March 31,June 30, 2015. The NAV per Unit, Class 3 increased from $115.03115.03 at December 31, 2014 to $134.57$118.70 as of March 31,June 30, 2015. Total Class 1 subscriptions and redemptions for the period were $487,852$1,270,579 and $2,417,127,$5,313,927, respectively. Total Class 2 subscriptions and redemptions for the period were $759,658$1,189,681 and $5,722,101,$6,218,435, respectively. Total Class 3 subscriptions and redemptions for the period were $1,813,483$3,413,795 and $597,357,$1,578,475, respectively. Ending capital at March 31,June 30, 2015 was $20,268,019$15,940,760 for Class 1, $36,055,993$31,718,687 for Class 2 and $7,869,420$7,467,609 for Class 3. Ending capitalCapital at December 31, 2014 was $19,195,036 for Class 1,$35,224,292 $35,224,292 for Class 2, and $5,588,281 for Class 3.
The Equinox Frontier Diversified Fund may have both long and short exposure to the Interest Rates, Currencies, Stock Indices, Energies, Metals, and Commodities sectors.
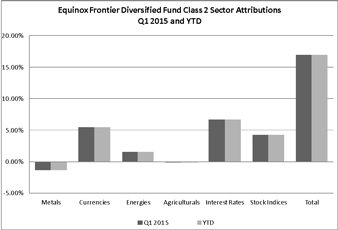
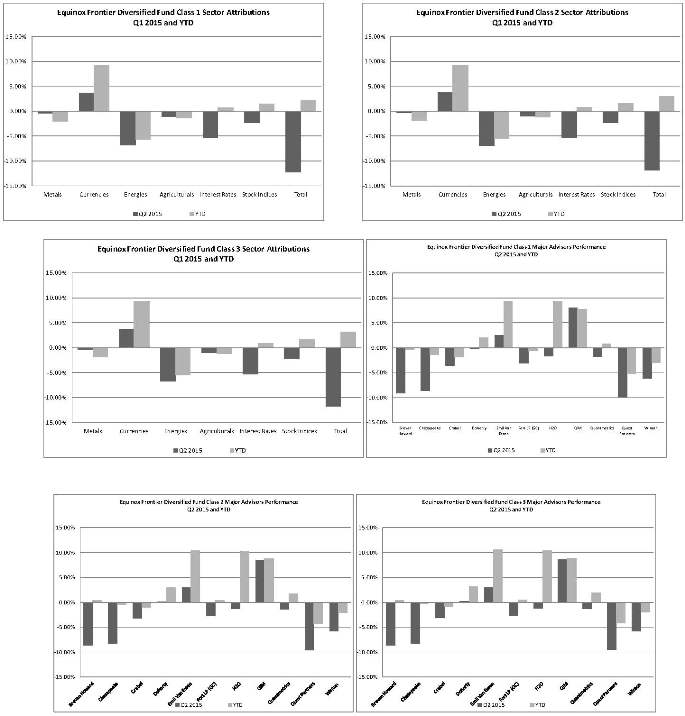

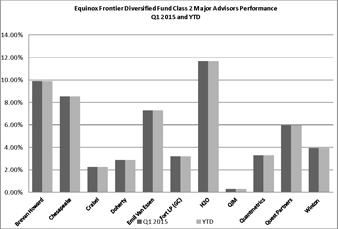
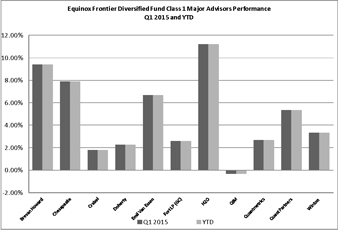

FourOne of the six sectors traded in the Equinox Frontier Diversified Fund was profitable in Q1 2015Q2 2015. Currencies was profitable while and YTD. Currencies,Metals, Energies, Agriculturals, Interest Rates and Stock Indices were profitable while and Metals and Agriculturals finished negative for the quarter.
The Interest Rate, Currencies and Stock Indices sectors were positive YTD while Metals, Agriculturals and Energies are negative YTD.
In terms of major CTA performance Doherty, Emil Van Essen, and QIM finished positive for the quarter. Brevan Howard, Chesapeake, Crabel, Fort LP (GC), H20, Quantmetrics, Quest and Winton were negative for the quarter.
Brevan Howard, Doherty, Emil Van Essen, Fort LP (GC), H20, QIM and Quantmetrics were positive YTD while Chesapeake, Crabel, Quest and Winton finished positive for the quarter andwere negative YTD.
2014
The Equinox Frontier Diversified Fund—Class 1 NAV lost 4.97%0.38% for the threesix months ended March 31,June 30, 2014, net of fees and expenses; the Equinox Frontier Diversified Fund—Class 2 NAV lost 4.56%gained 0.49% for the threesix months ended March 31,June 30, 2014, net of fees and expenses. Theexpenses the Equinox Frontier Diversified Fund—Class 3 NAV lost 1.53%gained 3.75% for the threesix months ended March 31,June 30, 2014. The inception date of the Equinox Frontier Diversified Fund Class 3 was February 24, 2014.
For the threesix months ended March 31,June 30, 2014, the Equinox Frontier Diversified Fund recorded net lossgain on investments of $1,584,528,$2,485,576, net investment income of $164,878,$300,377, and total expenses of $1,034,738$2,857,944 resulting in a net decrease in Owners’ capital from operations of $2,944,637,$397,362, after non-controlling interests of 325,371.$325,371. The NAV per Unit, Class 1, decreased from $87.10 at December 31, 2013 to $82.77$86.77 as of March 31,June 30, 2014. The NAV per Unit, Class 2, decreasedincreased from $94.35 at December 31, 2013 to $90.05$94.81 as of March 31,June 30, 2014. The NAV per Unit, Class 3 decreased from $84.21 at December 31, 2013 to $82.92was $87.37 as of March 31,June 30, 2014. Class 3 operations began February 25, 2014. Total Class 1 subscriptions and redemptions for the period were $275,409$558,427 and $4,803,463,$8,011,875, respectively. Total Class 2 subscriptions and redemptions for the period were $273,471$349,817 and $2,949,068,$5,909,484, respectively. Total Class 3 subscriptions and redemptions for the period were $754,623$1,809,523 and $10,755,$52,288, respectively. Ending capital at March 31,June 30, 2014 was $22,857,752$20,901,816 for Class 1, $30,465,282$29,073,838 for Class 2 and $731,584.$1,830,141 for Class 3. Ending capital at December 31, 2013 was $28,744,047 for Class 1 and $34,714,991 for Class 2.
The Equinox Frontier Diversified Fund may have both long and short exposure to the Interest Rates, Currencies, Stock Indices, Energies, Metals, and Commodities sectors.
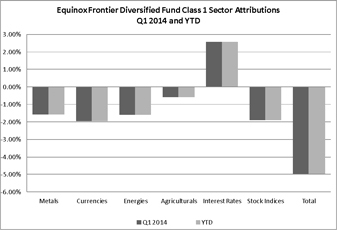
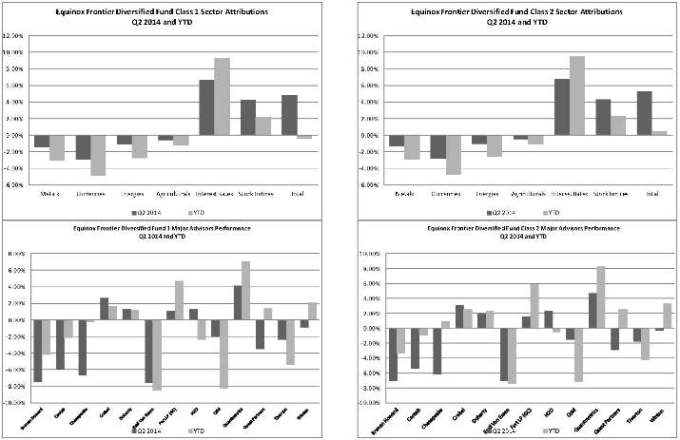
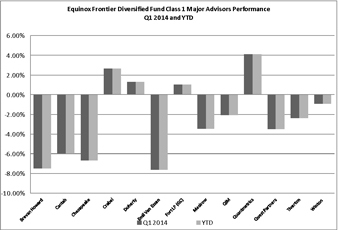
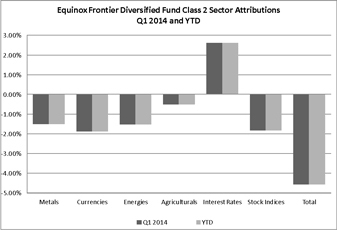
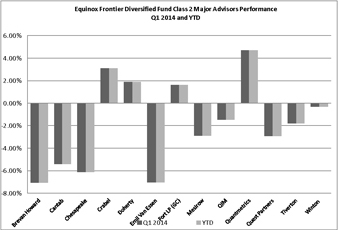
OneTwo of the six sectors traded in the Equinox Frontier Diversified Fund was profitable in Q12Q 2014. Interest Rates and Stock Indices were profitable while Stock Indices, Currencies, Metals, Agriculturals and Energies finished negative for the quarter.
The Interest Rate and Stock Indices sectors arewere positive YTD while Stock Indices, Currencies, Interest Rates, Metals, Agriculturals and Energies arewere negative YTD.
In terms of major CTA performance Crabel, Doherty, Fort (GC), H20 and Quantmetrics finished positive for the quarter. Brevan Howard, Cantab, Chesapeake, Mesirow, Tiverton, Winton, Emil Van Essen, QIM and Quest Partners finished negative for the quarter. In terms of YTD performance Crabel, Doherty, Fort (GC) and Quantmetrics arewere positive YTD while Brevan Howard, Cantab, Chesapeake, Mesirow,H20, Tiverton, Winton, Emil Van Essen, QIM and Quest Partners arewere negative YTD.
Equinox Frontier Masters Fund
2015
The Equinox Frontier Masters Fund—Class 1 NAV gained 10.09% and lost 4.93%5.66% for the threesix months ended March 31,June 30, 2015, and 2014 net of fees and expenses; the Equinox Frontier Masters Fund —Class 2 NAV gained 10.57% and lost 4.52%4.83% for the threesix months ended March 31,June 30, 2015, and 2014, net of fees and expenses; the Equinox Frontier Masters Fund—Class 3 NAV gained 10.64% and lost 4.47%4.71% for the threesix months ended March 31, 2015 and 2014, net of fees and expenses.June 30, 2015.
For the threesix months ended March 31,June 30, 2015, the Equinox Frontier Masters Fund recorded net gain on investments of $3,440,003,$9,556, net investment income of $71,164,$139,819, and total expenses of $932,773, resulting in a net increase in Owners’ capital from operations of $2,578,394. For the three months ended March 31, 2014, the Equinox Frontier Masters Fund recorded net loss on investments of $1,139,641, net investment income of $95,272, and total expenses of $570,990,$1,364,855, resulting in a net decrease in Owners’ capital from operations of $1,615,359.
$1,215,480. For the six months ended June 30, 2014, the Equinox Frontier Diversified Fund recorded net gain on investments of $2,485,576, net investment income of $300,377, and total expenses of $2,857,944 resulting in a net decrease in Owners’ capital from operations of $397,362, after non-controlling interests of $325,371. The NAV per Unit, Class 1, increased from $116.61 at December 31, 2014 to $128.38$110.01 as of March 31,June 30, 2015. The NAV per Unit, Class 2, increased from $128.53 at December 31, 2014 to $142.12$122.32 as of March 31,June 30, 2015. The NAV per Unit, Class 3, increased from $119.06 at December 31, 2014 to $131.73$113.45 as of March 31,June 30, 2015. Total Class 1 subscriptions and redemptions for the period were $197,260$989,895 and $950,034,$3,183,426, respectively. Total Class 2 subscriptions and redemptions for the period were $5,000$10,000 and $247,295,$483,171, respectively. Total Class 3 subscriptions and redemptions for the period were $663,443$2,498,048 and $1,228,567,$1,625,851, respectively. Ending capital at March 31,June 30, 2015 was $12,259,432$9,077,720 for Class 1, $9,548,554$8,004,780 for Class 2 and $4,918,069$5,615,369 for Class 3. Ending capital at December 31, 2014 was $11,850,911 for Class 1, $8,868,743 for Class 2 and $4,988,200 for Class 3.
The Equinox Frontier Masters Fund may have both long and short exposure to the Interest Rates, Currencies, Stock Indices, Energies, Metals, and Commodities sectors.
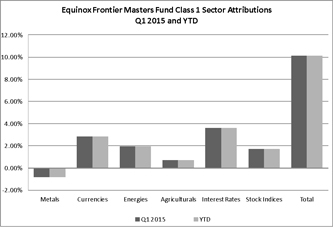
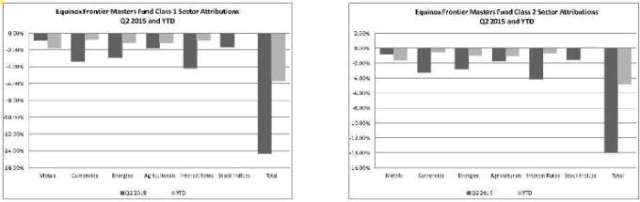
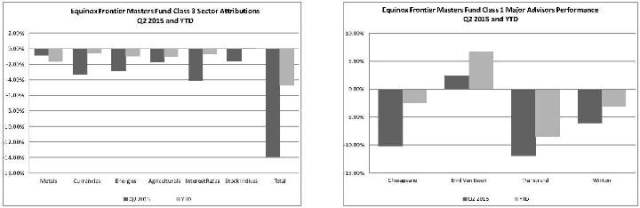
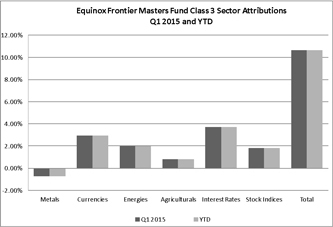

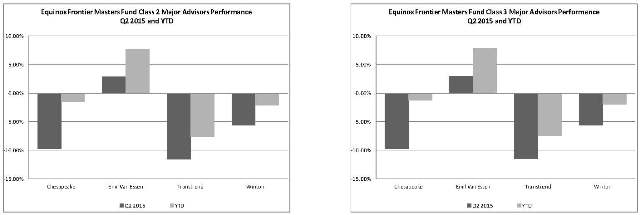
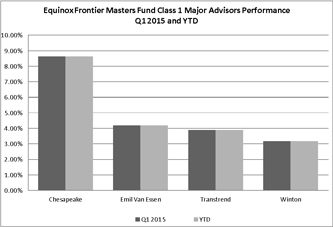
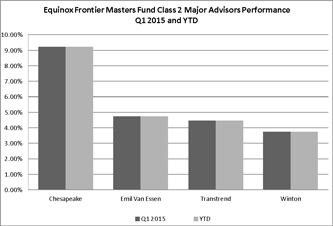

FiveAll of the six sectors traded in Equinox Frontier Masters Fund were profitablenegative in Q1 2015 and YTD. Currencies, Energies, Agriculturals, Interest Rates and Stock Indices were positive while Metals were negative for the quarter and YTD.
In terms of major CTA performance, allone of the four major CTAs in the Equinox Frontier Masters Fund werewas profitable for the quarter. All are alsoEmil Van Essen was positive for the quarter and YTD, while Chesapeake, Transtrend and Winton were negative for the quarter and YTD.
2014
The Equinox Frontier Masters Fund—Class 1 NAV lost 4.93%gained 1.24% for the threesix months ended March 31,June 30, 2014, net of fees and expenses; the Equinox Frontier Masters Fund —Class 2 NAV lost 4.52%gained 2.12% for the threesix months ended March 31,June 30, 2014, net of fees and expenses; the Equinox Frontier Masters Fund—Class 3 NAV lost 4.47%gained 2.24% for the threesix months ended March 31,June 30, 2014. The inception date of the Equinox Frontier Masters Fund Class 3 was December 17, 2013.
For the threesix months ended March 31,June 30, 2014, the Equinox Frontier Masters Fund recorded net lossgain on investments of $1,139,641,$980,182, net investment income of $95,272,$166,701, and total expenses of $475,718,$1,192,822, resulting in a net decrease in Owners’ capital from operations of $1,615,359.$45,939. For the threesix months ended March 31,June 30, 2013 the Equinox Frontier Masters Fund recorded a net gainloss on investments of $883,034,$1,692,118, net investment income of $231,188,$455,372, and total expenses of $561,505,$1,588,128, resulting in a net increasedecrease in Owners’ capital from operations of $321,529.$2,824,874. The NAV per Unit, Class 1, decreasedincreased from $91.83 at December 31, 2013 to $87.30$92.97 as of March 31,June 30, 2014. The NAV per Unit, Class 2, decreasedincreased from $99.46 at December 31, 2013 to $94.96$101.57 as of March 31,June 30, 2014. The NAV per Unit, Class 3, decreased
increased from $91.91 at December 31, 2013 to $87.80$93.97 as of March 31,June 30, 2014. Total Class 1 subscriptions and redemptions for the period were $36,836$140,294 and $5,237,423,$10,016,182, respectively. Total Class 2 subscriptions and redemptions for the period were $35,000 and $634,052,$1,825,965, respectively. Total Class 3 subscriptions and redemptions for the period were $680,760$2,764,331 and $89,144,$445,554, respectively. Ending capital at March 31,June 30, 2014 was $16,792,778$12,926,946 for Class 1, $9,329,134$8,724,607 for Class 2 and $825,490$2,725,219 for Class 3. Ending capital at December 31, 2013 was $23,115,495 for Class 1, $10,406,162 for Class 2 and $249,127 for Class 3.
The Equinox Frontier Masters Fund may have both long and short exposure to the Interest Rates, Currencies, Stock Indices, Energies, Metals, and Commodities sectors.
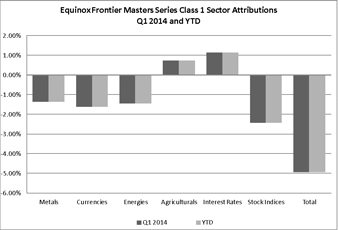
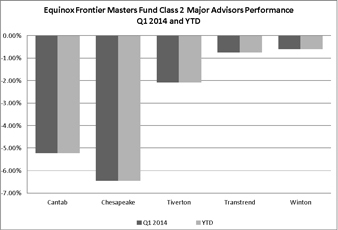
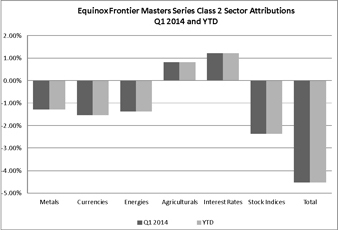

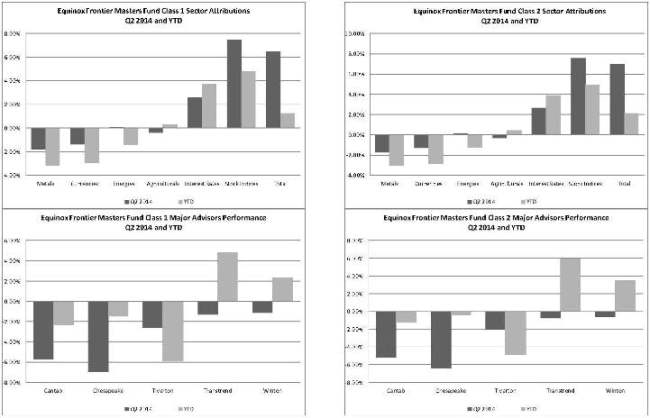
Two of the six sectors traded in Equinox Frontier Masters Fund were profitable in Q12Q 2014. AgriculturalsStock Indices and Interest Rates were positive while Metals, Currencies, Energies and Stock IndicesAgriculturals were negative for the quarter.
AgriculturalsStock Indices and Interest Rates were positive for the year while Metals, Currencies, Energies and Stock IndicesAgriculturals were negative for the year.
In terms of major CTA performance, none of the major CTAs in the Equinox Frontier Masters Fund were profitable for the quarter orquarter. Transtrend and Winton were positive YTD, while Cantab, Chesapeake, and Tiverton were negative YTD.
Equinox Frontier Long/Short Commodity Fund
2015
The Equinox Frontier Long/Short Commodity Fund—Class 2 NAV gained 20.17%7.13% for the threesix months ended March 31,June 30, 2015, net of fees and expenses; the Equinox Frontier Long/Short Commodity Fund —Class 3 NAV gained 20.04%7.13% for the threesix months ended March 31,June 30, 2015, net of fees and expenses; the Equinox Frontier Long/Short Commodity Fund —Class 1a NAV gained 19.36%5.98%, for the threesix months ended March 31,June 30, 2015, net of fees and expenses; the Equinox Frontier Long/Short Commodity Fund —Class 2a NAV gained 19.88%,6.90% 9, for the threesix months ended March 31,June 30, 2015, net of fees and expenses; the Equinox Frontier Long/Short Commodity Fund Class 3a NAV gained 19.97%7.04% for the threesix months ended March 31,June 30, 2015, net of fees and expenses.
For the threesix months ended March 31,June 30, 2015, the Equinox Frontier Long/Short Commodity Fund recorded net gain on investments of $2,732,204,$910,137, net investment income of $47,058,$90,191, and total expenses of $463,081,$729,246, resulting in a net increase in Owners’ capital from operations of $2,316,181.$271,082. For the threesix months ended March 31,June 30, 2014, the Equinox Frontier Long/Short Commodity Fund recorded net loss on investments of $4,086,877,$2,565,800, net investment income of $69,247,$116,852, and total expenses of $407,171,$724,549, resulting in a net decrease in
Owners’ capital from operations of $4,424,801,$2,406,675, after non-controlling interests of ($1,906,446)766,822). The NAV per Unit, Class 2, increased from $138.30 at December 31, 2014 to $166.20$148.16 as of March 31,June 30, 2015. The NAV per Unit, Class 3, increased from $138.34 at December 31, 2014 to $166.06$148.20 as of March 31,June 30, 2015. The NAV per Unit, Class 1a, increased from $101.12 at December 31, 2014 to $120.70$107.17 as of March 31,June 30, 2015. The NAV per Unit, Class 2a, increased from $111.35 at December 31, 2014 to $133.49$119.03 as of March 31,
June 30, 2015. The NAV per Unit, Class 3a, increased from $111.77 at December 31, 2014 to $134.09$119.64 as of March 31,June 30, 2015. Total Class 2 redemptions for the period were $46,260.$181,144. Total Class 3 redemptions for the period were $226,216.$454,734. Total Class 1a subscriptions and redemptions for the period were $ $414,752.$23,000 and $874,536, respectively. Class 2a subscriptions and redemptions for the period were $5,000 and $109,918,$281,680, respectively. Class 3a subscriptions and redemptions for the period were $41,303$120,785 and $42,766,$90,453, respectively. Ending capital at March 31,June 30, 2015 was $1,447,695$1,161,998 for Class 2, $8,438,115$7,309,331 for Class 3, $6,448,293$5,306,714 for Class 1a, $1,924,732$1,548,908 for Class 2a and $787,818$734,451 for Class 3a. Ending capital at December 31, 2014 was $1,246,481 for Class 2, $7,233,099 for Class 3, $5,776,906 for Class 1a, $1,702,551 for Class 2a and $657,882 for Class 3a.
The Equinox Frontier Long/Short Commodity Fund may have both long and short exposure to the Interest Rates, Currencies, Stock Indices, Energies, Metals, and Commodities sectors.
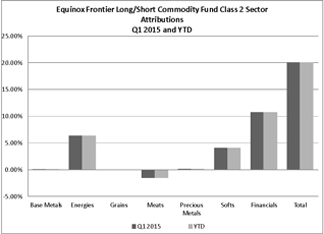 | 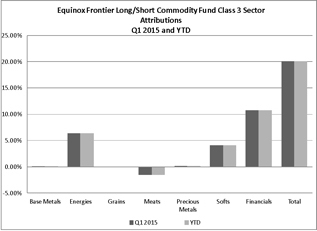 | |
|
|
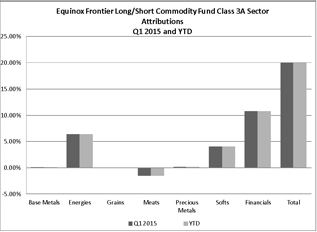 | 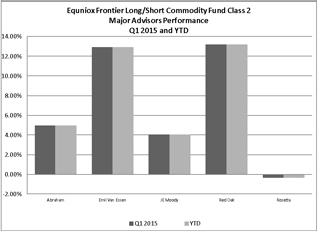 |
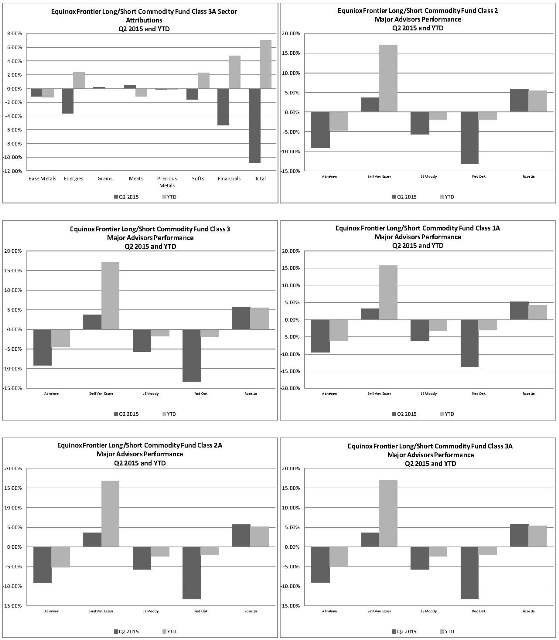
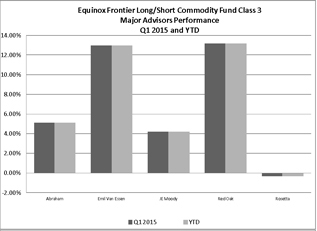
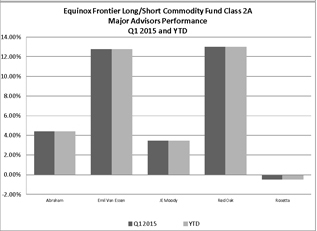
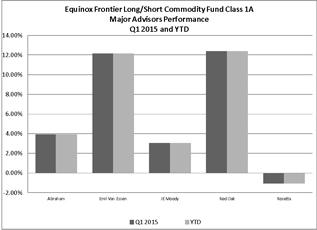
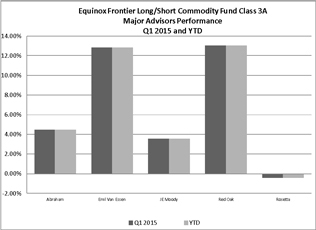
ThreeTwo of the seven sectors traded in the Equinox Frontier Long/Short Commodity Fund were profitable in Q1Q2 2015. Energies, Precious Metals, SoftsGrains and FinancialsMeats finished positive for the quarter while Base Metals, Grains,Energies, Precious Metals, Softs and MeatsFinancials finished negative for the quarterquarter. Energies, Softs and Financials were positive YTD while Base Metals, Grains, Meats, and Precious Metals were negative YTD.
In terms of major CTA performance, four outtwo of the five major CTAs in the Equinox Frontier Long/Short Commodity Fund were profitable in Q1Q2 2015. Abraham, Emil Van Essen and Red OakRosetta were positive for the quarter and arewere positive YTD while RosettaAbraham, JE Moody, and Red Oak finished negative for the quarter and were negative YTD.
2014
The Equinox Frontier Long/Short Commodity Fund—Class 2 NAV lost 11%10.45% for the threesix months ended March 31,June 30, 2014, net of fees and expenses; the Equinox Frontier Long/Short Commodity Fund —Class 3 NAV lost 11.01%10.45% for the three month periodsix months ended March 31,June 30, 2014, 2014, net of fees and expenses; the Equinox Frontier Long/Short Commodity Fund —Class 1a NAV lost 11.12%10.75%, for the three month periodsix months ended March 31,June 30, 2014, net of fees and expenses; the Equinox Frontier Long/Short Commodity Fund —Class 2a NAV lost 10.74%9.99%, for the three month periodsix months ended March 31,June 30, 2014, net of fees and expenses; the Equinox Frontier Long/Short Commodity Fund Class 3a NAV lost 10.68%9.86% for the three month periodsix months ended March 31,June 30, 2014, net of fees and expenses.
For the threesix months ended March 31,June 30, 2014, the Equinox Frontier Long/Short Commodity Fund recorded net loss on investments of $4,086,877,$2,565,800, net investment income of $69,247,$116,852, and total expenses of $337,924,$724,549, resulting in a net decrease in Owners’ capital from operations of $2,518,355,$2,406,675, after non-controlling interests of ($1,906,446)766,822). For the threesix months ended March 31,June 30, 2013, the Equinox Frontier Long/Short Commodity Fund recorded net loss on investments of $1,371,456,$4,975,201, net investment income of $297,099,$585,282, and total expenses of $648,989,$1,815,455, resulting in a net decrease in Owners’ capital from operations of $194,728,$3,523,930, after non-controlling interests of ($1,825,717)2,681,444). The NAV per Unit, Class 2, decreased from $125.26 at December 31, 2013 to $111.48$112.17 as of March 31,June 30, 2014. The NAV
per Unit, Class 3, decreased from $125.30 at December 31, 2013 to $111.51$112.20 as of March 31,June 30, 2014. The NAV per Unit, Class 1a, decreased from $92.73 at December 31, 2013 to $82.42$82.76 as of March 31,June 30, 2014. The NAV per Unit, Class 2a, decreased from $100.34 at December 31, 2013 to $89.56$90.32 as of March 31,June 30, 2014. The NAV per Unit, Class 3a, decreased from $100.47 at December 31, 2013 to $89.74$90.56 as of March 31,June 30, 2014. Total Class 2 redemptions for the period were $1,851,384.$1,932,014. Total Class 3 redemptions for the period were $996,055.$1,796,339. Total Class 1a subscriptions and redemptions were $39,949$107,716 and $1,700,961$2,484,658 respectively. Class 2a redemptions for the period were $576,515.$1,228,609. Class 3a subscriptions and redemptions for the period were $263,648$294,261 and $83,636,$125,931, respectively. Ending capital at March 31,June 30, 2014 was $1,246,556$1,173,977 for Class 2, $7,616,070$6,866,592 for Class 3, $6,200,830$5,516,168 for Class 1a, $2,222,795$1,588,411 for Class 2a and $395,536$387,699 for Class 3a. Ending capital at December 31, 2013 was $3,371,798 for Class 2, $9,619,596 for Class 3, $8,752,826 for Class 1a, $3,103,405 for Class 2a and $257,471 for Class 3a.
The Equinox Frontier Long/Short Commodity Fund may have both long and short exposure to the Interest Rates, Currencies, Stock Indices, Energies, Metals, and Commodities sectors, although the majority of the exposure will typically be in the Energies, Metals, and Commodities sectors.
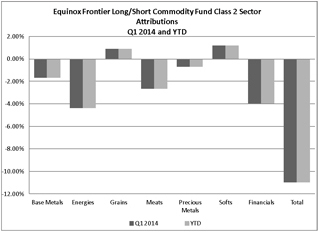 |  | |
|
|
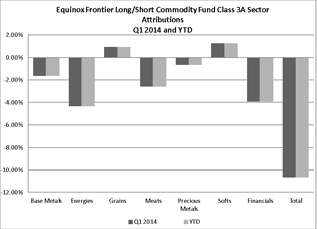 | 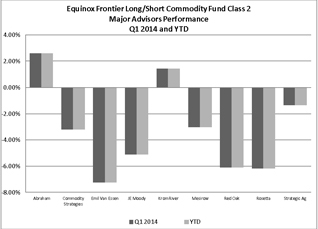 |
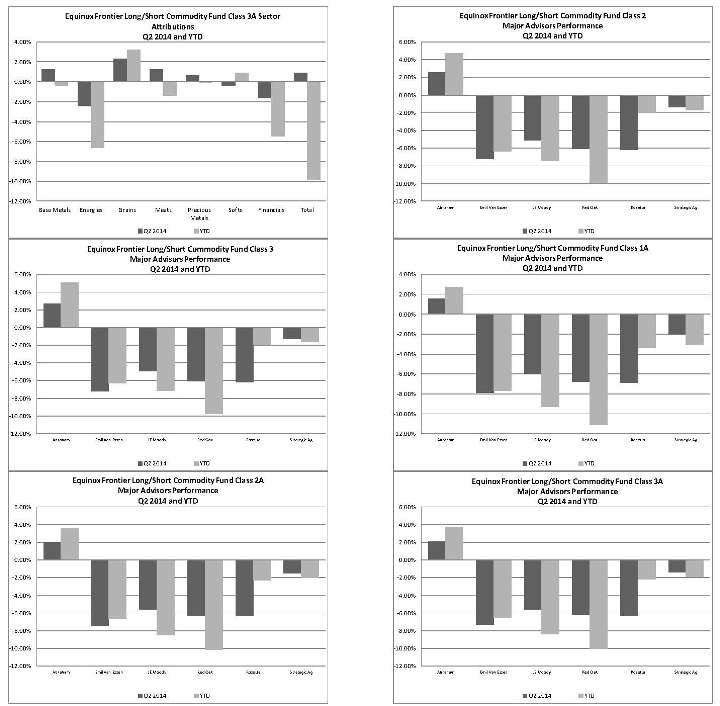
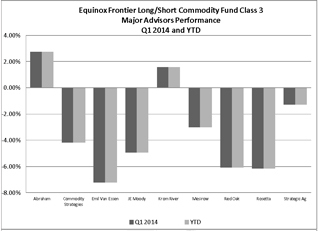
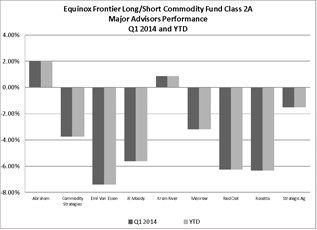
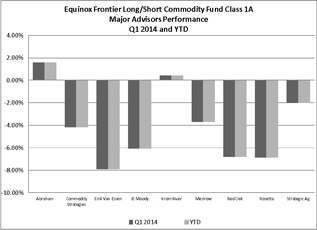
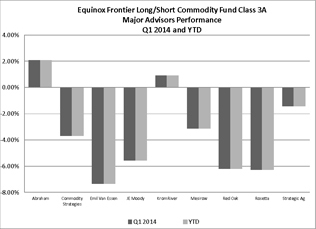
TwoFour of the seven sectors traded in the Equinox Frontier Long/Short Commodity Fund were profitable in Q1Q2 2014. Base Metals, Grains, Meat and SoftsPrecious Metals finished positive for the quarter while Base Metals, Energies, Grains, Meats, Precious MetalsSofts and Financials finished negative for the quarter. Grains and Softs arewere positive YTD while Base Metals, Energies, Grains, Meats, Precious Metals and Financials were negative YTD.
In terms of major CTA performance, twoone of the ninesix major CTAs in the Equinox Frontier Long/Short Commodity Fund werewas profitable in Q12Q 2014. Abraham and Krom River werewas positive for the quarter and arewere positive YTD while Commodity Strategies, Emil Van Essen, JE Moody, Mesirow, Red Oak, Rosetta and Strategic Ag finished negative for the quarter and iswere negative YTD.
Please see additional discussion under “Three months Ended March 31, 2015 Compared to Three months Ended March 31, 2014 – Equinox Frontier Long/Short Commodity Fund.”
Equinox Frontier Balanced Fund
2015
The Equinox Frontier Balanced Fund—Class 1 NAV gained 13.12% and lost 4.05%, respectively,0.21% for the threesix months ended March 31,June 30, 2015, net of fees and 2014,expenses; The Equinox Frontier Balanced Fund—Class 1AP NAV gained 1.72% for the six months ended June 30, 2015, net of fees and expenses; the Equinox Frontier Balanced Fund —Class 2 NAV gained 13.96% and lost 3.33%,
respectively,1.72% for the threesix months ended March 31,June 30, 2015, and 2014, net of fees and expenses; the Equinox Frontier Balanced Fund —Class 2a NAV gained 14.21% and lost 3.06%, respectively,2.18% for the threesix months ended March 31,June 30, 2015, and 2014, net of fees and expenses; the Equinox Frontier Balanced Fund —Class 3a NAV gained 14.21% and lost 3.05%, respectively,2.18% for the three months ended March 31,June 30, 2015, and 2014, net of fees and expenses;expenses.
For the Equinox Frontier Balanced Fund —Class 1AP NAV gained 13.96% for the threesix months ended March 31, 2015.
For the three months ended March 31,June 30, 2015, the Equinox Frontier Balanced Fund recorded net gain on investments of $16,254,937,$4,651,800, net investment income of $7,190,$15,193, and total expenses of $2,504,697,$3,531,816, resulting in a net increase in Owners’ capital from operations of $12,927,288,$779,031, after non-controlling interests of $830,142.$356,146. For the threesix months ended March 31,June 30, 2014, the Equinox Frontier Balanced Fund recorded net lossgain on investments of $2,141,831,$4,237,671, net investment income of $8,530,$15,073, and total expenses of $1,578,518,$3,404,737, resulting in a net decreaseincrease in Owners’ capital from operations of $4,165,357$1,705,510, after non-controlling interests of $453,538.$2,854,321. The NAV per Unit, Class 1, increased from $131.54 at December 31, 2014 to $148.80$131.82 as of March 31,June 30, 2015. The NAV per Unit, Class 1AP, increased from $133.20 at December 31, 2014 to $151.80$135.49 as of March 31,June 30, 2015. The NAV per Unit, Class 2, increased from $179.16 at December 31, 2014 to $204.17$182.24 as of March 31,June 30, 2015. The NAV per Unit, Class 2a, increased from $153.02 at December 31, 2014 to $174.76$156.36 as of March 31,June 30, 2015. The NAV per Unit, Class 3a, increased from $152.52 at December 31, 2014 to $174.19$155.85 as of March 31,June 30, 2015. Total Class 1 subscriptions and redemptions for the period were $56,154$117,365 and $3,119,131,$4,065,683, respectively. Total Class 1AP subscriptions and redemptions for the period were $1,457 and $11,615,$39,001, respectively. Total Class 2 subscriptions and redemptions for the period were $4,315$9,409 and $196,584,$524,931, respectively. Total Class 2a, redemptions for the period were $60,850. Total Class 3a redemptions for the period were $47,479.$52,948. Ending capital at March 31,June 30, 2015 was $78,309,904$68,562,471 for Class 1, $842,256$724,876 for Class 1AP, $26,631,212$23,474,966 for Class 2, $618,416$553,306 for Class 2a, and 2,837,703$2,534,161 for Class 3a. Ending capital at December 31, 2014 was $72,098,275 for Class 1, $748,275 for Class 1AP, $23,550,697 for Class 2, $600,287 for Class 2a and $2,528,303 for Class 3a.
The Equinox Frontier Balanced Fund may have both long and short exposure to the Interest Rates, Currencies, Stock Indices, Energies, Metals, and Commodities sectors.
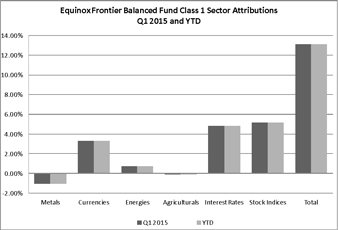
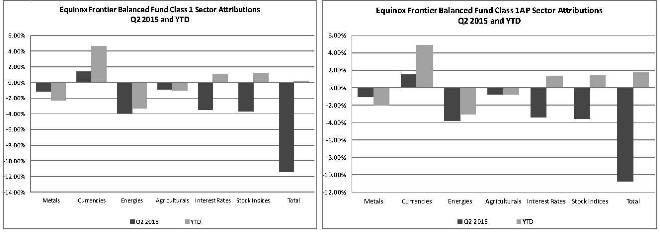
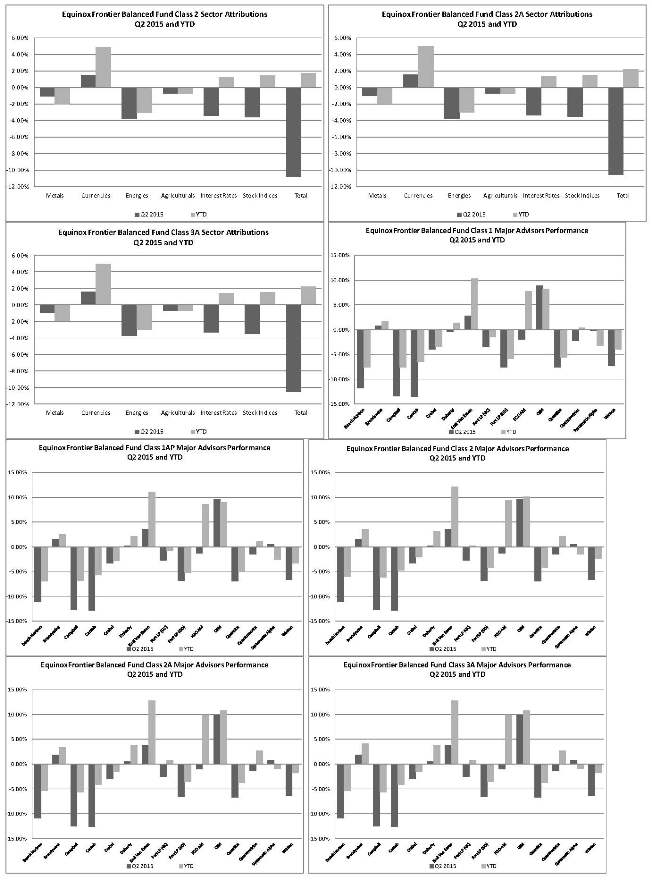

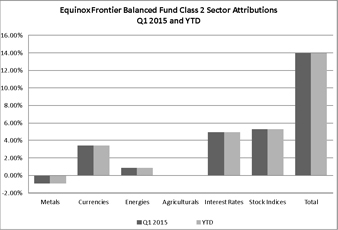

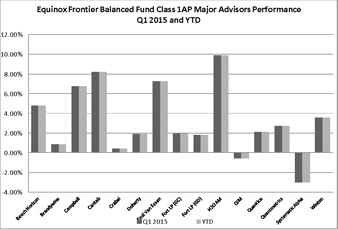

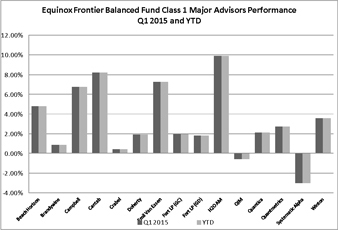
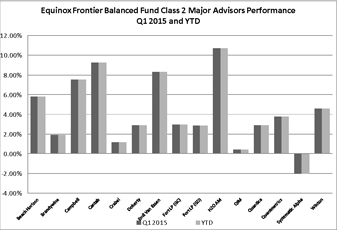
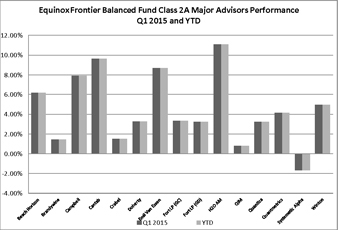
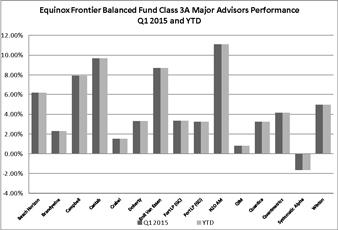
FiveOne of the six sectors traded in the Equinox Frontier Balanced Fund were profitable in Q1Q2 2015. Currencies was profitable while Metals, Energies, Agriculturals, Interest RateRates and Stock Indies sectors were profitable while MetalsIndices finished negative for the quarterquarter.
Currencies, Interest Rates, and Stock Indices were positive YTD while Metals, Energies, and Agriculturals were negative YTD.
In terms of major CTA performance, fourteenfive of the fifteen major CTAs in the Equinox Frontier Balanced Fund were profitable in Q1Q2 2015. Beach Horizon, Brandywine, Campbell, Cantab, Crabel,, Doherty, Emil Van Essen, Fort (GC), Fort (GD), H2O AM, QIM Quantica, Quantmetrics, and Winton were positive for the quarter while Beach Horizon, Campbell, Cantab, Crabel, Fort LP (GP), Fort LP (GD), H20 AM, Quantica, Quantmetrics and YTD. Systematic Alpha finishedWinton are negative for the quarterquarter.
Brandywine, Doherty, Emil Van Essen, Fort LP (GC), H20 AM, QIM and isQuantmetrics were positive YTD, while Beach Horizon, Campbell, Cantab, Crabel, Fort LP (GD), Quantica, Systematic Alpha and Winton were negative YTD.
2014
The Equinox Frontier Balanced Fund—Class 1 NAV lost 4.05%2.29% for the threesix months ended March 31,June 30, 2014, net of fees and expenses; the Equinox Frontier Balanced Fund —Class 2 NAV lost 3.33%0.81% for the threesix months ended March 31,June 30, 2014, net of fees and expenses; the Equinox Frontier Balanced Fund —Class 2a NAV lost 3.06%0.27%, for the threesix months ended March 31,June 30, 2014, net of fees and expenses; the Equinox Frontier Balanced Fund —Class 3a NAV lost 3.05%0.27% for the threesix months ended March 31,June 30, 2014, net of fees and expenses.
For the threesix months ended March 31,June 30, 2014, the Equinox Frontier Balanced Fund recorded net lossgain on investments of $2,141,831,$4,237,674, net investment income of $8,530,$15,073, and total expenses of $1,569,988,$3,404,734, resulting in a net decreaseincrease in Owners’ capital from operations of $4,165,357,$1,705,510, after non-controlling interests of $453,538.$2,854,321. For the threesix months ended March 31,June 30, 2013, the Equinox Frontier Balanced Fund recorded net loss on investments of $3,972,194,$12,914,896, net investment income of $47,281,$122,551, and total expenses of $2,044,258,$4,163,030, resulting in a net decrease in Owners’ capital from operations of $6,016,452.$16,342,353 after non- controlling interests of $613,022. The NAV per Unit, Class 1, decreased from $106.29 at December 31, 2013 to $101.99$103.86 as of March 31,June 30, 2014. The NAV per Unit, Class 2, decreased from $140.49 at December 31, 2013 to $135.81$139.35 as of March 31,June 30, 2014. The NAV per Unit, Class 2a, decreasedincreased from $118.80 at December 31, 2013 to $115.17$118.48 as of March 31,June 30, 2014. The NAV per Unit, Class 3a, decreased from $118.41 at December 31, 2013 to $114.80$118.09 as of March 31,June 30, 2014. Total Class 1 subscriptions and redemptions for the period were $39,640$75,943 and $8,033,927,$14,334,761, respectively. Total Class 2 subscriptions and redemptions for the period were $3,529$7,110 and $2,781,047,$5,534,845, respectively. Total Class 2a, redemptions for the period were $2,122.$4,070. Total Class 3a redemptions for the period were $102,488.$190,929. Ending capital at March 31,June 30, 2014 was $69,599,720$64,439,345 for Class 1, $22,961,181$20,739,600 for Class 2, $474,436$486,096 for Class 2a, and $2,149,750$2,120,414 for Class 3a. Ending capital at December 31, 2013 was $80,801,534 for Class 1, $26,611,117 for Class 2, $491,579 for Class 2a and $2,322,629 for Class 3a.
The Equinox Frontier Balanced Fund may have both long and short exposure to the Interest Rates, Currencies, Stock Indices, Energies, Metals, and Commodities sectors.
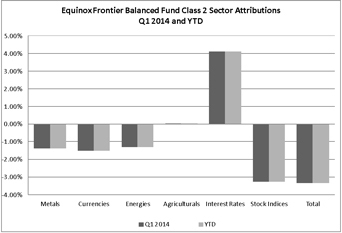
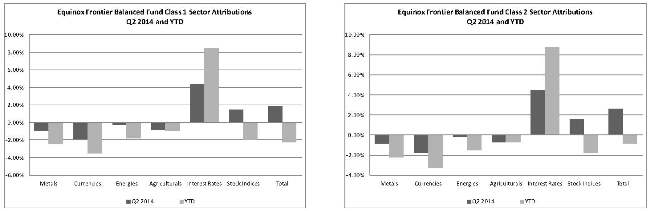

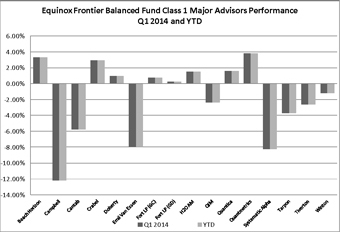
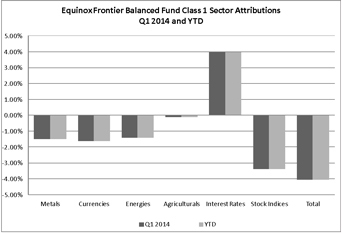
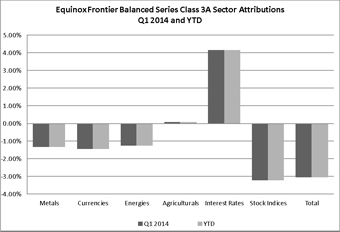
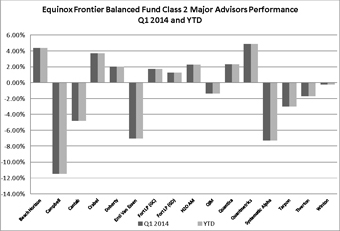
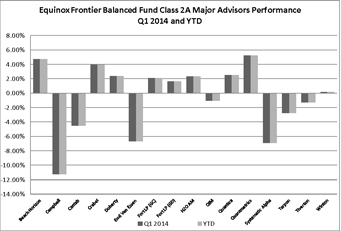
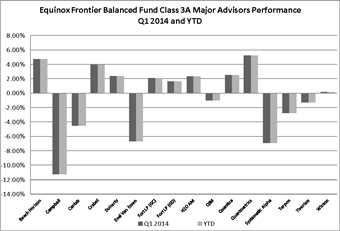
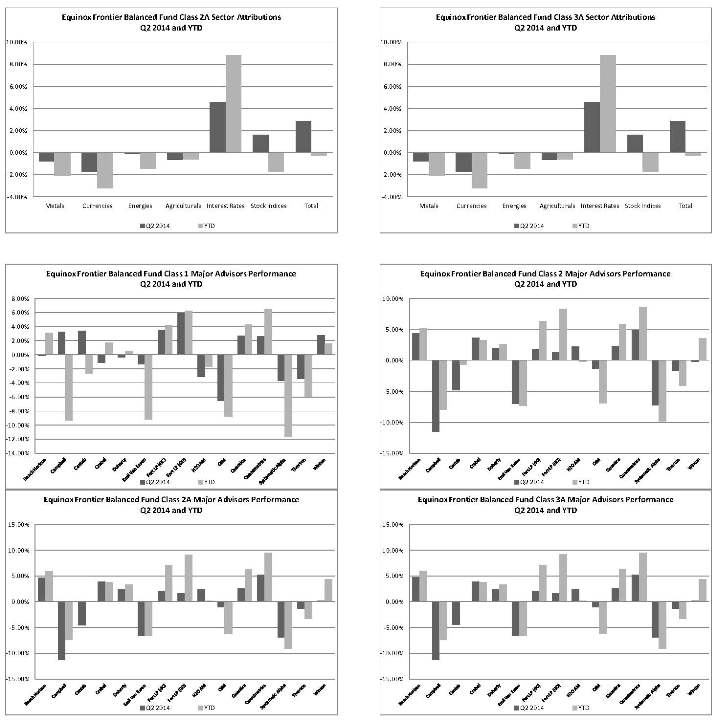
Two of the six sectors traded in the Equinox Frontier Balanced Fund were profitable in Q1Q2 2014. AgriculturalsStock Indices and Interest Rate sectors were profitable while Metals, Currencies, Energies, and Stock IndicesAgriculturals finished negative for the quarter.
Agriculturals and Interest Rate sectors arewas positive YTD while Stock Indices, Metals, Currencies, Energies, and Stock Indices areAgriculturals were negative YTD.
In terms of major CTA performance, eightnine of the sixteenfifteen major CTAs in the Equinox Frontier Balanced Fund were profitable in Q12Q 2014. Beach Horizon, Crabel, Doherty, Fort (GC), Fort (GD), H2O AM, Quantica, Quantmetrics and Winton were positive for the quarter and are positive YTD while Campbell, Cantab, Emil Van Essen, QIM, Systematic Alpha, Tarpon and Tiverton finished negative for the quarter and are negative YTD.
Please see additional discussion under “Three months Ended September 30, 2015 Compared to Three months Ended March 31, 2014 – Equinox Frontier Balanced Fund.”
Equinox Frontier Select Fund
2015
The Equinox Frontier Select Fund—Class 1 NAV gained 11.03% and lost 6.07%, respectively,8.68% for the threesix months ended March 31,June 30, 2015, net of fees and 2014,expenses; the Equinox Frontier Select Fund—Class 1AP NAV lost 7.31% for the six months ended June 30, 2015, net of fees and expenses; the Equinox Frontier Select Fund —Class 2 NAV gained 11.87% and lost 5.37%, respectively7.31% for the threesix months ended March 31,June 30, 2015, and 2014, net of fees and expenses;expenses.
For the six months ended June 30, 2015, the Equinox Frontier Select Fund —Class 1AP NAV gained 11.87% forrecorded net loss on investments of $1,329,887, net investment income of $0, and total expenses of $584,464, resulting in a net decrease in Owners’ capital from operations of $684,237, less non-controlling interests of ($684,237). For the threesix months ended March 31, 2015.
For the three months ended March 31, 2015,June 30, 2014, the Equinox Frontier Select Fund recorded net gain on investments of $2,741,233,$132,564, net investment income of $0, and total expenses of $375,837, resulting in a net increase in Owners’ capital from operations of $1,683,063, after non-controlling interests of $682,333. For the three months ended March 31, 2014, the Equinox Frontier Select Fund recorded net loss on investments of $770,338, net investment income of $0, and total expenses of $273,428,$565,340, resulting in a net decrease in Owners’ capital from operations of $1,043,766.$432,776. The NAV per Unit, Class 1, increaseddecreased from $95.61 at December 31, 2014 to $106.16$87.31 as of March 31,June 30, 2015. The NAV per Unit, Class 1AP, increaseddecreased from $96.82 at December 31, 2014 to $108.31$89.74 as of March 31,June 30, 2015. The NAV per Unit, Class 2, increaseddecreased from $128.48 at December 31, 2014 to $143.73$119.09 as of March 31, 2015. TotalJune 30, 2015.Total Class 1 subscriptions and redemptions for the period were $4,734$10,068 and $261,695,$545,555, respectively. Total Class 1AP subscriptions and redemptions for the period were $930.$930 and $0, respectively. Total Class 2 redemptions for the period were $79,199.$152,448. Ending capital at March 31,June 30, 2015 was $14,900,908$12,000,655 for Class 1, $54,412$45,084 for Class 1AP and $1,661,991$1,306,618 for Class 2. Ending capital at December 31, 2014 was $13,663,563 for Class 1, $47,785 for Class 1AP and $1,558,130 for Class 2.
The Equinox Frontier Select Fund may have both long and short exposure to the Interest Rates, Currencies, Stock Indices, Energies, Metals, and Commodities sectors.
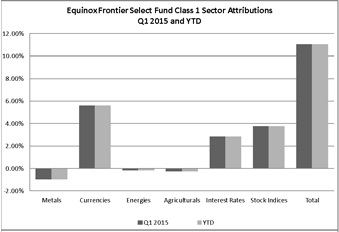
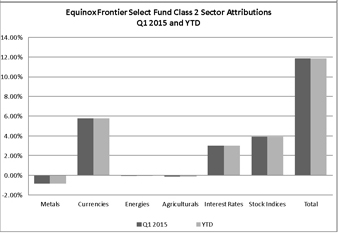
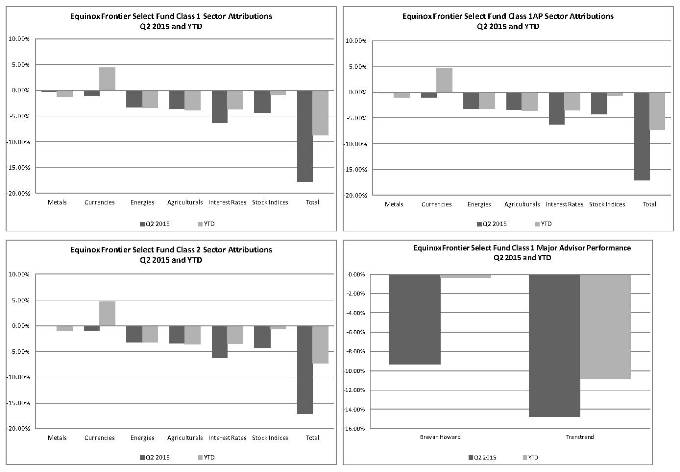
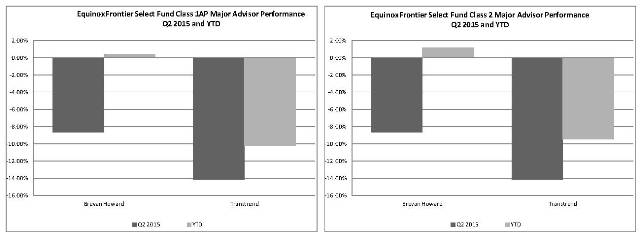
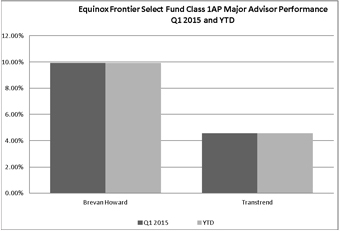
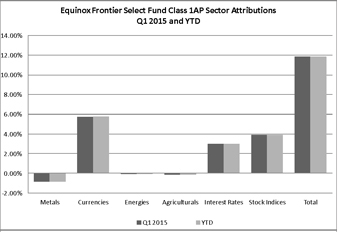
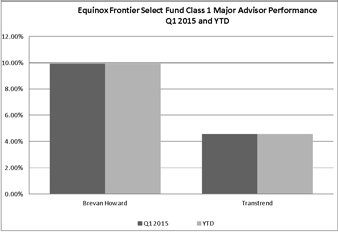
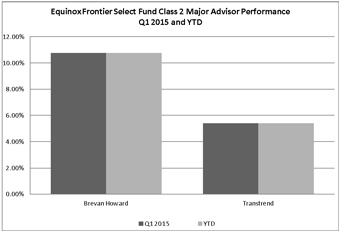
ThreeNone of the six sectors traded in the Equinox Frontier Select Fund were profitable in Q1 2015 and YTD. Q2 2015.
Currencies was positive YTD while Metals, Energies, Agriculturals, Interest Rates and Stock Indices were positive while Metals, Energies, and Agriculturals were negative for the quarter and YTD.
In terms of major CTA performance, Brevan Howard, and TivertonTranstrend finished positivenegative for the quarter, arewhile Brevan Howard was positive YTD and Transtrend was negative YTD.
2014
The Equinox Frontier Select Fund—Class 1 NAV lost 6.07%2.04% for the threesix months ended March 31,June 30, 2014, net of fees and expenses; the Equinox Frontier Select Fund —Class 2 NAV lost 5.37%0.56% for the threesix months ended March 31,June 30, 2014, net of fees and expenses.
For the threesix months ended March 31,June 30, 2014, the Equinox Frontier Select Fund recorded net lossgain on investments of $770,338,$132,564, net investment income of $0, and total expenses of $273,428,$565,340, resulting in a net decrease in Owners’ capital from operations of $1,043,766.$432,776. For the threesix months ended March 31,June 30, 2013, the Equinox Frontier Select Fund recorded net gain on investments of $1,322,891,$1,354,736, net investment income of $90,594,$178,057, and total expenses of $321,247,$746,269, resulting in a net increase in Owners’ capital from operations of $1,001,644.$786,524. The NAV per Unit, Class 1, decreased from $79.86 at December 31, 2013 to $75.01$78.23 as of March 31,June 30, 2014. The NAV per Unit, Class 2, decreased from $104.14 at December 31, 2013 to $98.55$103.56 as of March 31,June 30, 2014. Total Class 1 subscriptions and redemptions for the period were $2,594$4,943 and $1,391,660,$2,484,851, respectively. Total Class 2 redemptions for the period were $151,317.$361,783. Ending capital at March 31,June 30, 2014 was $13,514,210$12,963,579 for Class 1 and $1,513,489$1,373,802 for Class 2. Ending capital at December 31, 2013 was $15,852,947 for Class 1 and $1,758,901 for Class 2.
The Equinox Frontier Select Fund may have both long and short exposure to the Interest Rates, Currencies, Stock Indices, Energies, Metals, and Commodities sectors.
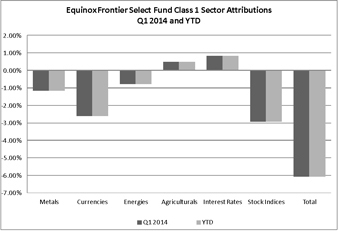
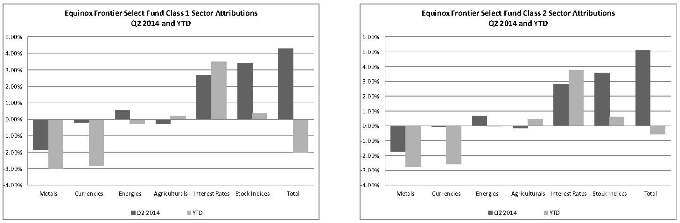
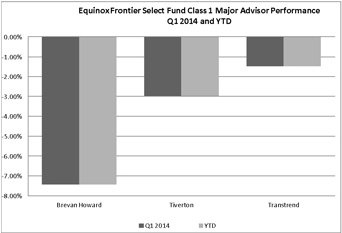
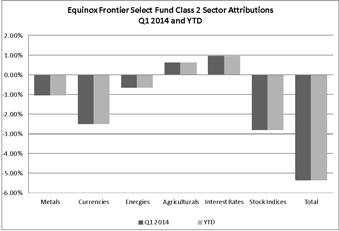

Two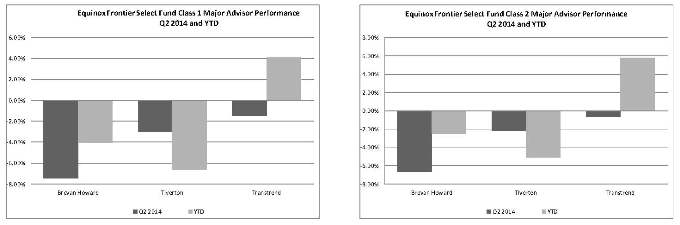
Three of the six sectors traded in the Equinox Frontier Select Fund were profitable in Q1Q2 2014. AgriculturalsEnergies, Stock Indices and Interest Rates were positive while Currencies, Stock Indices,Agriculturals, and Metals and Energies were negative for the quarter.
Agriculturals, and Interest Rates areand Stock Indices were positive YTD while Stock Indices, Currencies, Metals and Energies arewere negative YTD.
In terms of major CTA performance, Brevan Howard, Transtrend and Tiverton finished negative for the quarter and isBrevan Howard and Tiverton were negative YTD, while Transtrend was positive YTD.
Please see additional discussion under “Three months Ended March 31, 2015 Compared to Three months Ended March 31, 2014 – Equinox Frontier Select Fund.”
Equinox Frontier Winton Fund
2015
The Equinox Frontier Winton Fund—Class 1 NAV gained 9.07% and lost 1.91%, respectively,5.74% for the threesix months ended March 31,June 30, 2015, and 2014, net of fees and expenses; the Equinox Frontier Winton Fund —Class 2Fund—Class 1AP NAV gained 9.87% and lost 1.18%, respectively,4.33% for the threesix months ended March 31,June 30, 2015, and 2014, net of fees and expenses;expenses the Equinox Frontier Winton Fund —Class 1AP2 NAV gained 9.87%lost 4.33% for the threesix months ended March 31, 2015.June 30, 2015, net of fees and expenses.
For the threesix months ended March 31,June 30, 2015, the Equinox Frontier Winton Fund recorded net loss on investments of $122,657, net investment income of $27, and total expenses of $1,901,121, resulting in a net decrease in Owners’ capital from operations of $2,023,778. For the six months ended June 30, 2014, the Equinox Frontier Winton Fund recorded net gain on investments of $4,997,118,$2,893,259, net investment income of $0,$41, and total expenses of $1,320,827,$1,473,239, resulting in a net increase in Owners’ capital from operations of $3,676,291. For the three months ended March 31, 2014, the Equinox Frontier Winton Fund recorded net loss on investments of $103,198, net investment income of $41, and total expenses of $527,891, resulting in a net decrease in Owners’ capital from operations of $631,089.$1,420,061. The NAV per Unit, Class 1, increaseddecreased from $175.95 at December 31, 2014 to $191.90$165.85 as of March 31,June 30, 2015. The NAV per Unit, Class 1AP, increaseddecreased from $178.18 at December 31, 2014 to $195.77$170.46 as of March 31,June 30, 2015. The NAV per Unit, Class 2, increaseddecreased from $226.23 at December 31, 2014 to $248.56$216.43 as of March 31,June 30, 2015. Total Class 1 subscriptions and redemptions for the period were $45,490$93,346 and $940,759,$1,185,987, respectively. There were no subscriptions orTotal Class 2 redemptions for Class 1AP or Class 2 for the period.period were $148,360. Ending capital at March 31,June 30, 2015 was $28,350,789$24,319,904 for Class 1, $41,798$36,395 for Class 1AP and $14,439,668$12,430,155 for Class 2. Ending capital at December 31, 2014 was $26,870,878 for Class 1, $38,042 for Class 1AP and $13,142,313 for Class 2.
The Equinox Frontier Winton Fund may have both long and short exposure to the Interest Rates, Currencies, Stock Indices, Energies, Metals, and Commodities sectors.
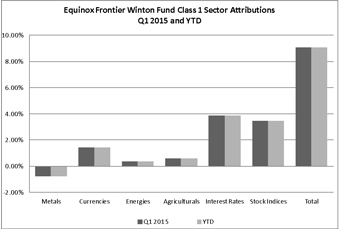
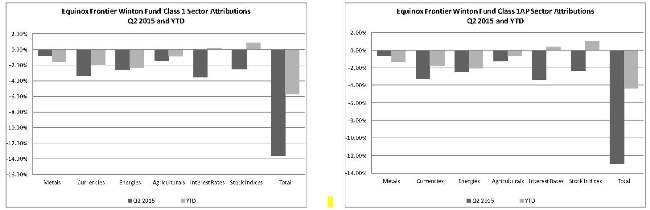

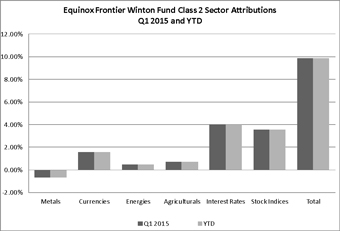
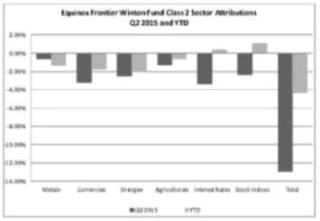
FiveNone of the six sectors traded in the Equinox Frontier Winton Fund were profitable in Q1Q2 2015.
Stock Indices and Interest Rates were positive YTD while Currencies, Energies, Agriculturals, Metals, Interest Rates and Stock IndicesEnergies were positive while Metals were negative for the quarter and YTD.
2014
The Equinox Frontier Winton Fund—Class 1 NAV lost 1.91%gained 3.93% for the threesix months ended March 31,June 30, 2014, net of fees and expenses; the Equinox Frontier Winton Fund —Class 2 NAV lost 1.18%gained 5.48% for the threesix months ended March 31,June 30, 2014, net of fees and expenses.
For the threesix months ended March 31,June 30, 2014, the Equinox Frontier Winton Fund recorded net lossgain on investments of $103,198,$2,893,259, net investment income of $41, and total expenses of $527,891,$1,473,239, resulting in a net decreaseincrease in Owners’ capital from operations of $631,089.$1,420,061. For the threesix months ended March 31,June 30, 2013, the Equinox Frontier Winton Fund recorded net gain on investments of $2,311,200,$1,781,248, net investment income of $110,026,$204,611, and total expenses of $439,776,$1,121,735, resulting in a net increase in Owners’ capital from operations of $1,871,424.$864,124. The NAV per Unit, Class 1, decreasedincreased from $139.59 at December 31, 2013 to $136.93$145.07 as of March 31,June 30, 2014. The NAV per Unit, Class 2, decreased from$174.17increased from $174.17 at December 31, 2013 to $172.12$183.72 as of March 31,June 30, 2014. Total Class 1 subscriptions and redemptions for the period were $33,929$67,734 and $1,432,112,$3,480,897, respectively. Total Class 2 redemptions for the period were $117,949.$307,865. Ending capital at March 31,June 30, 2014 was $24,258,572$23,611,933 for Class 1 and $10,219,044$10,711,937 for Class 2. Ending capital at December 31, 2013 was $26,164,147 for Class 1 and $10,460,690 for Class 2.
The Equinox Frontier Winton Fund may have both long and short exposure to the Interest Rates, Currencies, Stock Indices, Energies, Metals, and Commodities sectors.
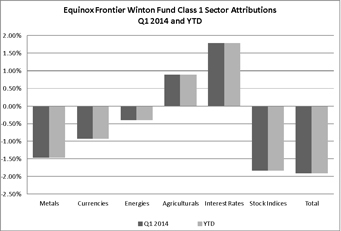
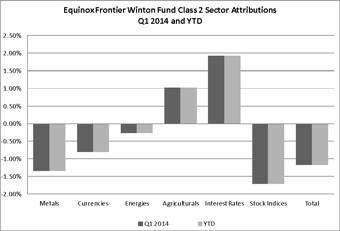
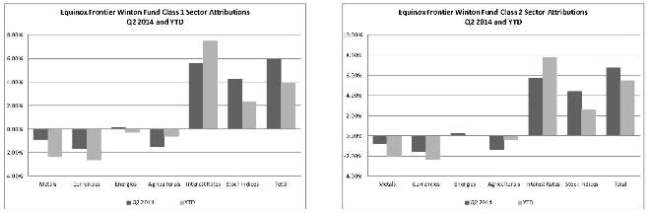
TwoThree of the six sectors traded in the Equinox Frontier Winton Fund were profitable in Q1Q2 2014. AgriculturalsStock Indices, Energies and Interest Rates were positive while Metals, Currencies Stock Indices and EnergiesAgriculturals were negative for the quarter.
AgriculturalsStock Indices and Interest Rates arewere positive YTD while Currencies, Stock Indices,Agriculturals, Metals, Interest Rates and Energies arewere negative YTD.
Please see additional discussion under “Three months Ended March 31, 2015 Compared to Three months Ended March 31, 2014 – Equinox Frontier Winton Fund.”
Equinox Frontier Heritage Fund
2015
The Equinox Frontier Heritage Fund—Class 1 NAV gained 13.50% and lost 6.51%, respectively,3.21% for the threesix months ended March 31,June 30, 2015, and 2014 net of fees and expenses; the Equinox Frontier Heritage Fund —Class 2Fund—Class 1AP NAV gained 14.35% and lost 5.81%, respectively1.76% for the threesix months ended March 31,June 30, 2015, and 2014, net of fees and expenses;expenses the Equinox Frontier Heritage Fund —Class 1AP2 NAV gained 14.35%lost 1.76% for the threesix months ended March 31, 2015.June 30, 2015, net of fees and expenses.
For the threesix months ended March 31,June 30, 2015, the Equinox Frontier Heritage Fund recorded net gain on investments of $3,048,084,$277,639, net investment income of $0, and total expenses of $313,282, resulting in a net increase in Owners’ capital from operations of $1,767,687, after non-controlling interests of $967,115. For the three months ended March 31, 2014, the Equinox Frontier Heritage Fund recorded net loss on investments of $1,236,579, net investment income of $0, and total expenses of $175,833,$484,305, resulting in a net decrease in Owners’ capital from operations of $874,418$334,182, after non-controlling interests of $537,994.$127,516. For the six months ended June 30, 2014, the Equinox Frontier Heritage Fund recorded net gain on investments of $181,764, net investment income of $0, and total expenses of $431,952, resulting in a net decrease in Owners’ capital from operations of $42,154, after non-controlling interests of ($208,034). The NAV per Unit, Class 1, increaseddecreased from $130.28 at December 31, 2014 to $147.87$126.10 as of March 31,June 30, 2015. The NAV per Unit, Class 1AP, increaseddecreased from $131.93 at December 31, 2014 to $150.86$129.61 as of March 31,June 30, 2015. The NAV per Unit, Class 2, increaseddecreased from $176.56 at December 31, 2014 to $201.89$173.45 as of March 31,June 30, 2015. Total Class 1 subscriptions and redemptions for the period were $10,456$21,905 and $238,356,$356,862, respectively. TotalThere were no subscriptions or redemptions for Class 1AP subscriptions were $1,288.for the period. Total Class 2 redemptions for the period were $93,986.$112,648. Ending capital at March 31,June 30, 2015 was $10,838,892$9,141,028 for Class 1, $68,083$58,494 for Class 1AP and $3,567,493$3,047,359 for Class 2. Ending capital at December 31, 2014 was $9,761,819 for Class 1, $58,378 for Class 1AP and $3,207,182 for Class 2.
The Equinox Frontier Heritage Fund may have both long and short exposure to the Interest Rates, Currencies, Stock Indices, Energies, Metals, and Commodities sectors.
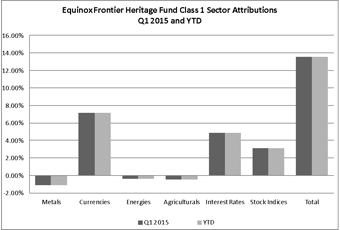
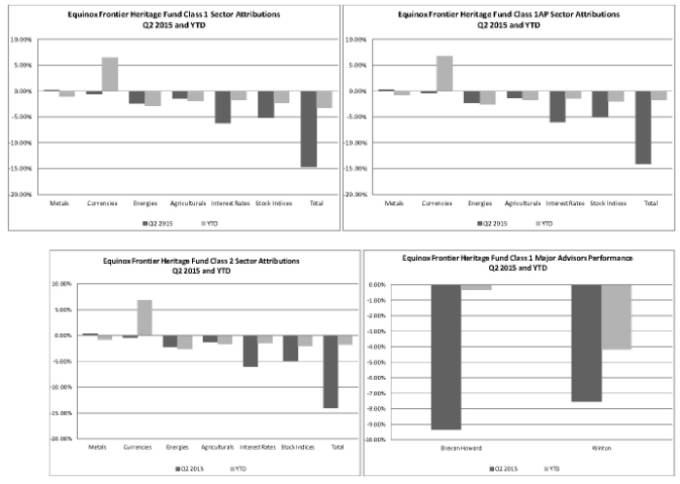
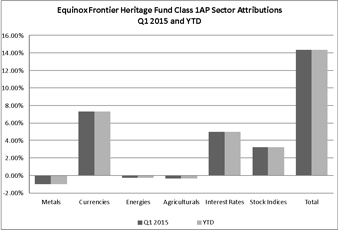
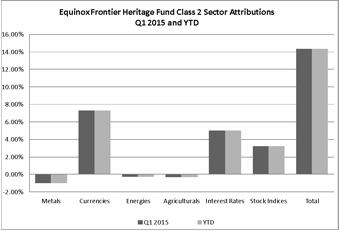
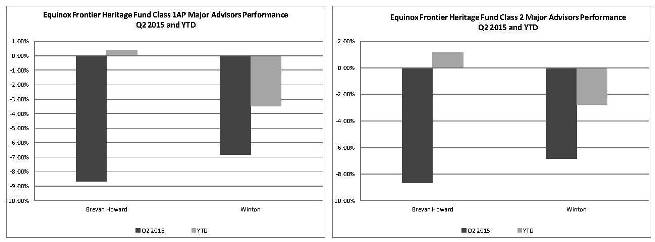

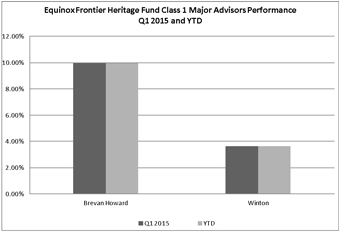
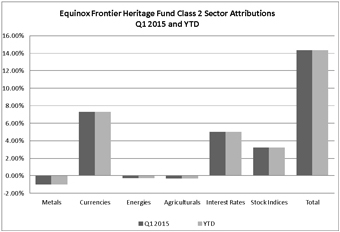
ThreeNone of the six sectors traded in the Equinox Frontier Heritage Fund were profitable in Q1Q2 2015.
Currencies were positive YTD while Stock Indices, Agriculturals, Metals, Interest Rates and Stock Indices were positive while Metals, Agriculturals and Energies were negative for the quarter and YTD.
In terms of major CTA performance, bothWinton finished negative for the quarter and YTD while Brevan Howard and Winton finished positivenegative for the quarter. Both arequarter and positive YTD.
2014
The Equinox Frontier Heritage Fund—Class 1 NAV lost 6.51%gained 0.52% for the threesix months ended March 31,June 30, 2014, net of fees and expenses; the Equinox Frontier Heritage Fund —Class 2 NAV lost 5.81%gained 2.03% for the threesix months ended March 31,June 30, 2014, net of fees and expenses.
For the threesix months ended March 31,June 30, 2014, the Equinox Frontier Heritage Fund recorded net lossgain on investments of $1,236,579,$181,764, net investment income of $0, and total expenses of $175,833,$431,952, resulting in a net decrease in Owners’ capital from operations of $874,418,$42,154, after non-controlling interests of ($537,994)208,034). For the threesix months ended March 31,June 30, 2013, the Equinox Frontier Heritage Fund recorded net gain on investments of $1,759,853,$1,345,719, net investment income of $37,238,$72,996, and total expenses of $258,845,$523,679, resulting in a net increase in Owners’ capital from operations of $1,501,008.$895,036. The NAV per Unit, Class 1, decreasedincreased from $102.05 at December 31, 2013 to $95.41$102.58 as of March 31,June 30, 2014. The NAV per Unit, Class 2, decreasedincreased from $134.21 at December 31, 2013 to $126.41$136.93 as of March 31,June 30, 2014. Total Class 1 subscriptions and redemptions for the period were $6,040$11,982 and $1,422,481,$2,465,305, respectively. Total Class 2 redemptions for the period were $112,923.$235,405. Ending capital at March 31,June 30, 2014 was $9,201,795$8,792,828 for Class 1 and $2,572,891$2,654,758 for Class 2. Ending capital at December 31, 2013 was $11,328,406 for Class 1 and $2,850,062 for Class 2.
The Equinox Frontier Heritage Fund may have both long and short exposure to the Interest Rates, Currencies, Stock Indices, Energies, Metals, and Commodities sectors.


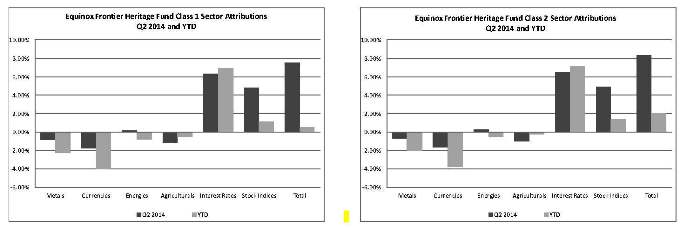
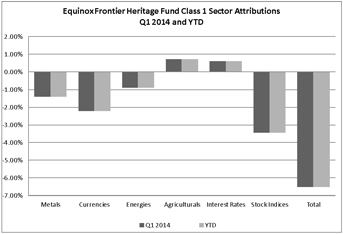
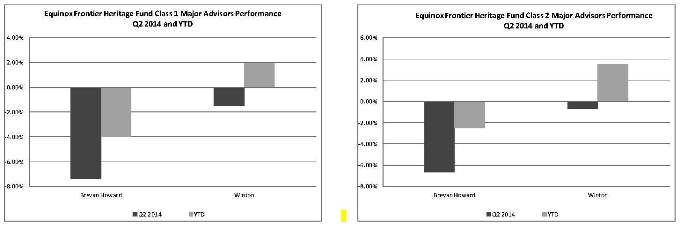
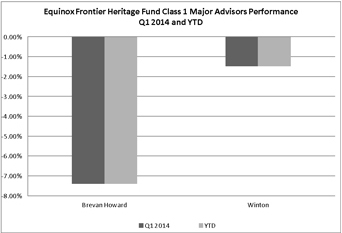
TwoThree of the six sectors traded in the Equinox Frontier Heritage Fund were profitable in Q1Q2 2014. AgriculturalsEnergies, Stock Indices and Interest Rates were positive while Metals, Currencies Stock Indices and EnergiesAgriculturals were negative for the quarter.
AgriculturalsStock Indices and Interest Rates arewere positive YTD while Currencies, Stock Indices,Agriculturals, Metals, Interest Rates and Energies arewere negative YTD.
In terms of major CTA performance, bothWinton finished positive for the quarter and YTD while Brevan Howard and Winton finished negative for the quarter and are negative YTD.
| ITEM 3. | QUANTITATIVE AND QUALITATIVE DISCLOSURES ABOUT MARKET RISK |
The Trust is a speculative commodity pool. The market sensitive instruments which are held by the Trading Companies in which the Series are invested are acquired for speculative trading purposes, and all or a substantial amount of the Series’ assets are subject to the risk of trading loss. Unlike an operating company, the risk of market sensitive instruments is integral, not incidental, to the Series’ main line of business.
Market movements result in frequent changes in the fair market value of each Trading Company’s open positions and, consequently, in each Series of the Trust’s earnings and cash flow. The Trading Companies’ and consequently the Series’ market risk is influenced by a wide variety of factors, including the level and volatility of exchange rates, interest rates, equity price levels, the market value of financial instruments and contracts, the diversification effects among the open positions and the liquidity of the markets in which trades are made.
Each Trading Company rapidly acquires and liquidates both long and short positions in a wide range of different markets. Consequently, it is not possible to predict how a particular future market scenario will affect performance, and the past performance for any Series is not necessarily indicative of the future results of such Series.
Additional risk of trading loss from investment in an unaffiliated Trading Company may result from the Managing Owner’s inability to directly control or stop trading in the event of exercise of certain withdrawal provisions in the investment agreement.
The Trading Companies’ and consequently the Series’ primary market risk exposures as well as the strategies used and to be used by the Trading Advisors for managing such exposures are subject to numerous uncertainties, contingencies and risks, any one of which could cause the actual results of the Trust’s and the Managing Owner’s risk controls to differ materially from the objectives of such strategies. Government interventions, defaults and expropriations, illiquid markets, the emergence of dominant fundamental factors, political upheavals, changes in historical price relationships, an influx of new market participants, increased regulation and many other factors could result in material losses as well as in material changes to the risk exposures and the risk management strategies of the Trading Companies and consequently the Trust. There can be no assurance that the Trading Companies’ current market exposure and/or risk management strategies will not change materially or that any such strategies will be effective in either the short- orlong-term. Investors must be prepared to lose all or substantially all of their investment in a Series.
Quantitative Market Risk
Trading Risk
The Series’ approximate risk exposure in the various market sectors traded by its trading advisors is quantified below in terms of value at risk. Due to the Series’ mark-to-market accounting, any loss in the fair value of the Series’ (through the Trading Companies) open positions is directly reflected in the Series’ earnings, realized or unrealized.
Exchange maintenance margin requirements have been used by the Trust as the measure of its value at risk. Maintenance margin requirements are set by exchanges to equal or exceed the maximum losses reasonably expected to be incurred in the fair value of any given contract in 95% to 99% of any one-day interval. The maintenance margin levels are established by brokers, dealers and exchanges using historical price studies as well as an assessment of current market volatility and economic fundamentals to provide a probabilistic estimate of the maximum expected near-term one-day price fluctuation. Maintenance margin has been used rather than the more generally available initial margin, because initial margin includes a credit risk component that is not relevant to value at risk.
In the case of market sensitive instruments that are not exchange-traded, including currencies and some energy products and metals, the margin requirements for the equivalent futures positions have been used as value at risk. In those cases in which afutures-equivalent margin is not available, dealers’ margins have been used.
In the case of contracts denominated in foreign currencies, the value at risk figures include foreign currency margin amounts converted into U.S. dollars with an incremental adjustment to reflect the exchange rate risk inherent to the Series, which is valued in U.S. dollars, in expressing value at risk in a functional currency other than U.S. dollars.
In quantifying each Series’ value at risk, 100% positive correlation in the different positions held in each market risk category has been assumed. Consequently, the margin requirements applicable to the open contracts have simply been aggregated to determine each trading category’s aggregate value at risk. The diversification effects resulting from the fact that the Series’ positions held through the Trading Companies are rarely, if ever, 100% positively correlated have not been reflected.
Value at Risk by Market Sectors
The following tables present the trading value at risk associated with each Series’ exposure to open positions (as held by the Trading Companies) by market sector as of March 31,June 30, 2015 and December 31, 2014. All open position trading risk exposures of the Series have been included in calculating the figures set forth below.
Equinox Frontier Diversified Fund:
| March 31, 2015 | December 31, 2014 | June 30, 2015 | December 31, 2014 | |||||||||||||||||||||||||||||
| VALUE AT RISK | % OF TOTAL CAPITALIZATION | VALUE AT RISK | % OF TOTAL CAPITALIZATION | VALUE AT RISK | % OF TOTAL CAPITALIZATION | VALUE AT RISK | % OF TOTAL CAPITALIZATION | |||||||||||||||||||||||||
MARKET SECTOR | ||||||||||||||||||||||||||||||||
Interest Rates | $ | 1,790,577 | 2.38 | % | $ | 1,276,055 | 2.13 | % | $ | 1,748,918 | 2.81 | % | $ | 1,276,055 | 2.13 | % | ||||||||||||||||
Currencies | 3,671,096 | 4.88 | % | 1,670,041 | 2.78 | % | 4,218,978 | 6.78 | % | 1,670,041 | 2.78 | % | ||||||||||||||||||||
Stock Indices | 4,582,486 | 6.09 | % | 3,152,926 | 5.25 | % | 4,565,527 | 7.34 | % | 3,152,926 | 5.25 | % | ||||||||||||||||||||
Metals | 237,513 | 0.32 | % | 124,812 | 0.21 | % | 237,513 | 0.38 | % | 124,812 | 0.21 | % | ||||||||||||||||||||
Agriculturals/Softs | 1,341,935 | 1.78 | % | 854,409 | 1.42 | % | 1,343,451 | 2.16 | % | 854,409 | 1.42 | % | ||||||||||||||||||||
Energy | 1,229,090 | 1.63 | % | 1,677,590 | 2.80 | % | 1,229,113 | 1.98 | % | 1,677,590 | 2.80 | % | ||||||||||||||||||||
|
|
|
|
|
|
|
| |||||||||||||||||||||||||
Total: | $ | 12,852,697 | 17.08 | % | $ | 8,755,833 | 14.59 | % | $ | 13,343,500 | 21.45 | % | $ | 8,755,833 | 14.59 | % | ||||||||||||||||
|
|
|
|
|
|
|
| |||||||||||||||||||||||||
Equinox Frontier Long/Short Commodity Fund:
| March 31, 2015 | December 31, 2014 | June 30, 2015 | December 31, 2014 | |||||||||||||||||||||||||||||
| VALUE AT RISK | % OF TOTAL CAPITALIZATION | VALUE AT RISK | % OF TOTAL CAPITALIZATION | VALUE AT RISK | % OF TOTAL CAPITALIZATION | VALUE AT RISK | % OF TOTAL CAPITALIZATION | |||||||||||||||||||||||||
MARKET SECTOR | ||||||||||||||||||||||||||||||||
Interest Rates | $ | 55,565 | 0.29 | % | $ | 86,055 | 0.52 | % | $ | 54,244 | 0.34 | % | $ | 86,055 | 0.52 | % | ||||||||||||||||
Currencies | 265,536 | 1.39 | % | 206,375 | 1.24 | % | 264,755 | 1.65 | % | 206,375 | 1.24 | % | ||||||||||||||||||||
Stock Indices | 211,133 | 1.11 | % | 185,321 | 1.12 | % | 208,503 | 1.30 | % | 185,321 | 1.12 | % | ||||||||||||||||||||
Metals | 46,572 | 0.24 | % | 32,767 | 0.20 | % | 46,572 | 0.29 | % | 32,767 | 0.20 | % | ||||||||||||||||||||
Agriculturals/Softs | 640,648 | 3.36 | % | 474,912 | 2.86 | % | 640,648 | 3.99 | % | 474,912 | 2.86 | % | ||||||||||||||||||||
Energy | 1,630,349 | 8.56 | % | 2,278,884 | 13.71 | % | 1,630,349 | 10.15 | % | 2,278,884 | 13.71 | % | ||||||||||||||||||||
|
|
|
|
|
|
|
| |||||||||||||||||||||||||
Total: | $ | 2,849,803 | 14.95 | % | $ | 3,264,314 | 30.56 | % | $ | 2,845,071 | 17.72 | % | $ | 3,264,314 | 19.65 | % | ||||||||||||||||
|
|
|
|
|
|
|
| |||||||||||||||||||||||||
Equinox Frontier Masters Fund:
| March 31, 2015 | December 31, 2014 | June 30, 2015 | December 31, 2014 | |||||||||||||||||||||||||||||
| VALUE AT RISK | % OF TOTAL CAPITALIZATION | VALUE AT RISK | % OF TOTAL CAPITALIZATION | VALUE AT RISK | % OF TOTAL CAPITALIZATION | VALUE AT RISK | % OF TOTAL CAPITALIZATION | |||||||||||||||||||||||||
MARKET SECTOR | ||||||||||||||||||||||||||||||||
Interest Rates | $ | 829,630 | 3.10 | % | $ | 596,543 | 2.32 | % | $ | 812,109 | 3.58 | % | $ | 596,543 | 2.32 | % | ||||||||||||||||
Currencies | 1,210,237 | 4.53 | % | 1,004,876 | 3.91 | % | 1,191,217 | 5.25 | % | 1,004,876 | 3.91 | % | ||||||||||||||||||||
Stock Indices | 1,699,358 | 6.36 | % | 659,851 | 2.57 | % | 1,687,409 | 7.43 | % | 659,851 | 2.57 | % | ||||||||||||||||||||
Metals | 113,367 | 0.42 | % | 48,364 | 0.19 | % | 113,367 | 0.50 | % | 48,364 | 0.19 | % | ||||||||||||||||||||
Agriculturals/Softs | 766,398 | 2.87 | % | 394,545 | 1.53 | % | 767,510 | 3.38 | % | 394,545 | 1.53 | % | ||||||||||||||||||||
Energy | 635,103 | 2.38 | % | 776,846 | 3.02 | % | 635,321 | 2.80 | % | 776,846 | 3.02 | % | ||||||||||||||||||||
|
|
|
|
|
|
|
| |||||||||||||||||||||||||
Total: | $ | 5,254,093 | 19.66 | % | $ | 3,481,025 | 9.62 | % | $ | 5,206,933 | 22.94 | % | $ | 3,481,025 | 13.45 | % | ||||||||||||||||
|
|
|
|
|
|
|
| |||||||||||||||||||||||||
Equinox Frontier Balanced Fund:
| March 31, 2015 | December 31, 2014 | June 30, 2015 | December 31, 2014 | |||||||||||||||||||||||||||||
| VALUE AT RISK | % OF TOTAL CAPITALIZATION | VALUE AT RISK | % OF TOTAL CAPITALIZATION | VALUE AT RISK | % OF TOTAL CAPITALIZATION | VALUE AT RISK | % OF TOTAL CAPITALIZATION | |||||||||||||||||||||||||
MARKET SECTOR | ||||||||||||||||||||||||||||||||
Interest Rates | $ | 3,180,214 | 2.87 | % | $ | 3,301,495 | 3.04 | % | $ | 3,110,405 | 3.21 | % | $ | 3,301,495 | 3.04 | % | ||||||||||||||||
Currencies | 6,170,333 | 5.57 | % | 4,131,348 | 3.81 | % | 7,162,906 | 7.38 | % | 4,131,348 | 3.81 | % | ||||||||||||||||||||
Stock Indices | 5,295,447 | 4.78 | % | 4,350,810 | 4.01 | % | 5,260,731 | 5.42 | % | 4,350,810 | 4.01 | % | ||||||||||||||||||||
Metals | 548,150 | 0.50 | % | 460,411 | 0.42 | % | 547,597 | 0.56 | % | 460,411 | 0.42 | % | ||||||||||||||||||||
Agriculturals/Softs | 3,097,906 | 2.80 | % | 2,507,574 | 2.31 | % | 3,097,033 | 3.19 | % | 2,507,574 | 2.31 | % | ||||||||||||||||||||
Energy | 1,960,977 | 1.77 | % | 2,862,415 | 2.64 | % | 1,960,579 | 2.02 | % | 2,862,415 | 2.64 | % | ||||||||||||||||||||
|
|
|
|
|
|
|
| |||||||||||||||||||||||||
Total: | $ | 20,253,027 | 18.29 | % | $ | 17,614,053 | 16.24 | % | $ | 21,139,251 | 21.78 | % | $ | 17,614,053 | 16.23 | % | ||||||||||||||||
|
|
|
|
|
|
|
| |||||||||||||||||||||||||
Equinox Frontier Select Fund:
| March 31, 2015 | December 31, 2014 | June 30, 2015 | December 31, 2014 | |||||||||||||||||||||||||||||
| VALUE AT RISK | % OF TOTAL CAPITALIZATION | VALUE AT RISK | % OF TOTAL CAPITALIZATION | VALUE AT RISK | % OF TOTAL CAPITALIZATION | VALUE AT RISK | % OF TOTAL CAPITALIZATION | |||||||||||||||||||||||||
MARKET SECTOR | ||||||||||||||||||||||||||||||||
Interest Rates | $ | 434,226 | 1.81 | % | $ | 338,847 | 2.22 | % | $ | 425,425 | 2.21 | % | $ | 338,847 | 2.22 | % | ||||||||||||||||
Currencies | 736,305 | 3.07 | % | 684,037 | 4.48 | % | 715,904 | 3.72 | % | 684,037 | 4.48 | % | ||||||||||||||||||||
Stock Indices | 1,095,001 | 4.57 | % | 124,866 | 0.82 | % | 1,087,395 | 5.65 | % | 124,866 | 0.82 | % | ||||||||||||||||||||
Metals | 48,199 | 0.20 | % | 12,156 | 0.08 | % | 48,199 | 0.25 | % | 12,156 | 0.08 | % | ||||||||||||||||||||
Agriculturals/Softs | 438,748 | 1.83 | % | 140,093 | 0.92 | % | 439,143 | 2.28 | % | 140,093 | 0.92 | % | ||||||||||||||||||||
Energy | 64,251 | 0.27 | % | 18,880 | 0.12 | % | 64,510 | 0.34 | % | 18,880 | 0.12 | % | ||||||||||||||||||||
|
|
|
|
|
|
|
| |||||||||||||||||||||||||
Total: | $ | 2,816,730 | 11.75 | % | $ | 1,318,879 | 8.64 | % | $ | 2,780,576 | 14.45 | % | $ | 1,318,879 | 8.64 | % | ||||||||||||||||
|
|
|
|
|
|
|
| |||||||||||||||||||||||||
Equinox Frontier Winton Fund:
| March 31, 2015 | December 31, 2014 | June 30, 2015 | December 31, 2014 | |||||||||||||||||||||||||||||
| VALUE AT RISK | % OF TOTAL CAPITALIZATION | VALUE AT RISK | % OF TOTAL CAPITALIZATION | VALUE AT RISK | % OF TOTAL CAPITALIZATION | VALUE AT RISK | % OF TOTAL CAPITALIZATION | |||||||||||||||||||||||||
MARKET SECTOR | ||||||||||||||||||||||||||||||||
Interest Rates | $ | 1,648,521 | 3.85 | % | $ | 1,081,081 | 2.70 | % | $ | 1,615,476 | 4.39 | % | $ | 1,081,081 | 2.70 | % | ||||||||||||||||
Currencies | 2,295,860 | 5.36 | % | 1,845,125 | 4.61 | % | 2,288,497 | 6.22 | % | 1,845,125 | 4.61 | % | ||||||||||||||||||||
Stock Indices | 1,233,376 | 2.88 | % | 847,093 | 2.12 | % | 1,211,219 | 3.29 | % | 847,093 | 2.12 | % | ||||||||||||||||||||
Metals | 233,173 | 0.54 | % | 112,363 | 0.28 | % | 233,173 | 0.63 | % | 112,363 | 0.28 | % | ||||||||||||||||||||
Agriculturals/Softs | 645,032 | 1.51 | % | 478,222 | 1.19 | % | 649,201 | 1.76 | % | 478,222 | 1.19 | % | ||||||||||||||||||||
Energy | 247,776 | 0.58 | % | 141,408 | 0.35 | % | 247,852 | 0.67 | % | 141,408 | 0.35 | % | ||||||||||||||||||||
|
|
|
|
|
|
|
| |||||||||||||||||||||||||
Total: | $ | 6,303,738 | 14.72 | % | $ | 4,505,292 | 11.25 | % | $ | 6,245,418 | 16.96 | % | $ | 4,505,292 | 11.25 | % | ||||||||||||||||
|
|
|
|
|
|
|
| |||||||||||||||||||||||||
Equinox Frontier Heritage Fund:
| March 31, 2015 | December 31, 2014 | June 30, 2015 | December 31, 2014 | |||||||||||||||||||||||||||||
| VALUE AT RISK | % OF TOTAL CAPITALIZATION | VALUE AT RISK | % OF TOTAL CAPITALIZATION | VALUE AT RISK | % OF TOTAL CAPITALIZATION | VALUE AT RISK | % OF TOTAL CAPITALIZATION | |||||||||||||||||||||||||
MARKET SECTOR | ||||||||||||||||||||||||||||||||
Interest Rates | $ | 312,466 | 1.65 | % | $ | 228,140 | 1.38 | % | $ | 306,144 | 1.93 | % | $ | 228,140 | 1.38 | % | ||||||||||||||||
Currencies | 442,516 | 2.33 | % | 381,353 | 2.30 | % | 441,225 | 2.78 | % | 381,353 | 2.30 | % | ||||||||||||||||||||
Stock Indices | 262,862 | 1.38 | % | 194,764 | 1.18 | % | 258,246 | 1.63 | % | 194,764 | 1.18 | % | ||||||||||||||||||||
Metals | 47,000 | 0.25 | % | 23,407 | 0.14 | % | 47,000 | 0.30 | % | 23,407 | 0.14 | % | ||||||||||||||||||||
Agriculturals/Softs | 133,548 | 0.70 | % | 101,074 | 0.61 | % | 134,298 | 0.85 | % | 101,074 | 0.61 | % | ||||||||||||||||||||
Energy | 46,336 | 0.24 | % | 28,157 | 0.17 | % | 46,349 | 0.29 | % | 28,157 | 0.17 | % | ||||||||||||||||||||
|
|
|
|
|
|
|
| |||||||||||||||||||||||||
Total: | $ | 1,244,728 | 6.55 | % | $ | 956,895 | 5.78 | % | $ | 1,233,262 | 7.78 | % | $ | 956,895 | 5.78 | % | ||||||||||||||||
|
|
|
|
|
|
|
| |||||||||||||||||||||||||
As of March 31, 2015, a portion of the assets of the Equinox Frontier Balanced Fund, Equinox Frontier Diversified Fund, Equinox Frontier Long/Short Commodity Fund and Equinox Frontier Heritage Fund are invested in Swap contracts (Please refer to Note 4 in the Series Financial Statements). Margin information is not available for these contracts therefore no value at risk calculations were included in the table for these investments.
Material Limitations on Value at Risk as an Assessment of Market Risk
The face value of the market sector instruments held on behalf of the Series is typically many times the applicable maintenance margin requirement, which generally ranges between approximately 1% and 10% of contract face value, as well as many times the capitalization of the Series. The magnitude of each Series’ open positions creates a risk of ruin not typically found in most other investment vehicles. Because of the size of their positions, certain market conditions, although unusual, but historically recurring from time to time, could cause a Series to incur severe losses over a short period of time. The value at risk table above, as well as the past performance of the Series, gives no indication of this risk of severe losses.
Non-Trading Risk
The Series have non-trading market risk on their foreign cash balances not needed for margin. However, these balances, as well as the market risk they represent, are immaterial. The Series also have non-trading market risk as a result of investing a portion of their available assets in U.S. government securities which include any security issued or guaranteed as to principal or interest by the U.S., or by a person controlled by or supervised by and acting as an instrumentality of the government of the U.S. pursuant to authority granted by Congress of the U.S. or any certificate of deposit for any of the foregoing, including U.S. treasury bonds, U.S. treasury bills and issues of agencies of the U.S. government, and certain cash items such as money market funds, certificates of deposit (under nine months) and time deposits. The market risk represented by these investments is also immaterial.
Qualitative Market Risk
The following are the primary trading risk exposures of the Series of the Trust as of March 31,June 30, 2015, by market sector.
Interest Rates
Interest rate risk is one of the principal market exposures of each Series. Interest rate movements directly affect the price of interest rate futures positions held and indirectly affect the value of a Trading Company’s stock index and currency positions. Interest rate movements in one country as well as relative interest rate movements between countries materially impact profitability. The primary interest rate exposure is to interest rate fluctuations in the U.S. and the other G-7 countries. However, the Trading Companies also may take futures positions on the government debt of smaller nations. The Managing Owner anticipates that G-7 interest rates will remain the primary market exposure of each Trading Company and accordingly of each Series for the foreseeable future. The changes in interest rates which are expected to have the most effect on the Series are changes in long-term, as opposed to short-term rates. Most of the speculative positions to be held by the Trading Companies will be in medium- to long-term instruments. Consequently, even a material change in short-term rates is expected to have little effect on the Series if the medium- to long-term rates remain steady. Aggregate interest income from all sources, including assets held at clearing brokers, of up to 2% (annualized) is paid to the Managing Owner by the Equinox Frontier Balanced Fund (Class 1 and Class 2 only), Equinox Frontier Winton Fund, Equinox Frontier Select Fund, and Equinox Frontier Heritage Fund. For the Equinox Frontier Diversified Fund, Equinox Frontier Long/Short Commodity Fund, Equinox Frontier Masters Fund and Equinox Frontier Balanced Fund (Class 1a and Class 2a only), 20% of the total interest allocated to each Series is paid to the Managing Owner. In addition, if interest rates fall below 0.75%, the Managing Owner is paid the difference between the Trust’s annualized interest income that is allocated to each of such Series and 0.75%. Interest income above what is paid to the Managing Owner is retained by the Series. The amounts reflected in the financial statements for the Trust and Series are disclosed on a net basis. Due to some classes not exceeding the 2% paid to the Managing Owner, amounts earned by those classes may be zero.
Currencies
Exchange rate risk is a significant market exposure of each Series of the Trust in general. For each Series of the Trust in general, currency exposure is to exchange rate fluctuations, primarily fluctuations that disrupt the historical pricing relationships between different currencies and currency pairs. These fluctuations are influenced by interest rate changes as well as political and general economic conditions. The Trading Advisors on behalf of a Series trade in a large number of currencies, including cross-rates, which are positions between two currencies other than the U.S. dollar. The Managing Owner does not anticipate that the risk profile of the Series’ currency sector will change significantly in the future.
Stock Indices
For each Series, its primary equity exposure is equity price risk in the G-7 countries as well as other smaller jurisdictions. Each Series of the Trust is primarily exposed to the risk of adverse price trends or static markets in the major U.S., European and Japanese indices.
Metals
For each Series, its metals market exposure is fluctuations in the price of both precious metals, including gold and silver, as well as base metals including aluminum, copper, nickel and zinc. Some metals, such as gold, are used as surrogate stores of value, in place of hard currency, and thus have currency or interest rate risk associated with them relative to their price in a specific currency. Other metals, such as silver, platinum, copper and steel, have substantial industrial applications, and may be subject to forces affecting industrial production and demand.
Agriculturals/Softs
Each Series may also invest in raw commodities and may thus have exposure to agricultural price movements, which are often directly affected by severe or unexpected weather conditions or by political events in countries that comprise significant sources of commodity supply.
Energy
For each Series its primary energy market exposure is in oil, gas and other energy product price movements, often resulting from political developments and ongoing conflicts in the Middle East. Oil and gas prices can be volatile and substantial profits and losses have been and are expected to continue to be experienced in this market.
Other Trading Risks
As a result of leverage, small changes in the price of a Trading Company’s positions may result in substantial losses for a Series. Futures, forwards and options are typically traded on margin. This means that a small amount of capital can be used to invest in contracts of much greater total value. The resulting leverage means that a relatively small change in the market price of a contract can produce a substantial loss. Like other leveraged investments, any purchase or sale of a contract may result in losses in excess of the amount invested in that contract. The Trading Companies may lose more than their initial margin deposits on a trade.
The Trading Companies’ trading is subject to execution risks. Market conditions may make it impossible for the Trading Advisors to execute a buy or sell order at the desired price, or to close out an open position. Daily price fluctuation limits are established by the exchanges and approved by the CFTC. When the market price of a contract reaches its daily price fluctuation limit, no trades can be executed at prices outside the limit. The holder of a contract may therefore be locked into an adverse price movement for several days or more and lose considerably more than the initial margin put up to establish the position. Thinly traded or illiquid markets also can make it difficult or impossible to execute trades. The Trading Advisor’s positions are subject to speculative limits. The CFTC and domestic exchanges have established speculative position limits on the maximum futures position which any person, or group of persons acting in concert, may hold or control in particular futures contracts or options on futures contracts traded on U.S. commodity exchanges. Under current regulations, other accounts of the Trading Advisors are combined with the positions held by them on behalf of the applicable Trading Company for position limit purposes. This trading could preclude additional trading in these commodities by the Trading Advisors for the accounts of the Series.
Systematic strategies do not consider fundamental types of data and do not have the benefit of discretionary decision making. The assets of the Series are allocated to Trading Advisors that rely on technical, systematic strategies that do not take into account factors external to the market itself (although certain of these strategies may have minor discretionary elements incorporated into their systematic strategy). The widespread use of technical trading systems frequently results in numerous trading advisors attempting to execute similar trades at or about the same time, altering trading patterns and affecting market liquidity. Furthermore, the profit potential of trend-following systems may be diminished by the changing character of the markets, which may make historical price data (on which technical programs are based) only marginally relevant to future market patterns. Systematic strategies are developed on the basis of a statistical analysis of market prices. Consequently, any factor external to the market itself that dominates prices that a discretionary decision maker may take into account may cause major losses for a systematic strategy. For example, a pending political or economic event may be very likely to cause a major price movement, but a systematic strategy may continue to maintain positions indicated by its trading method that might incur major losses if the event proved to be adverse.
However, because certain of the Trading Advisors’ strategies involve some discretionary aspects in addition to their technical factors, certain of the Trading Advisors may occasionally use discretion in investing the assets of a Trading Company. For example, the Trading Advisors often use discretion in selecting contracts and markets to be followed. In exercising such discretion, such Trading Advisor may take positions opposite to those recommended by the Trading Advisor’s trading system or signals. Discretionary decision making may also result in a Trading Advisor failing to capitalize on certain price trends or making unprofitable trades in a situation where another trader relying solely on a systematic approach might not have done so. Furthermore, such use of discretion may not enable the relevant Series of the Trust to avoid losses, and in fact, such use of discretion may cause such Series to forego profits which it may have otherwise earned had such discretion not been used.
Qualitative Disclosures Regarding Means of Managing Risk Exposure
The means by which the Managing Owner attempts to manage the risk of the Trust’s open positions is essentially the same in all market categories traded. The Managing Owner applies risk management policies to trading which generally are designed to limit the total exposure of assets under management. In addition, the Managing Owner follows diversification guidelines which are often formulated in terms of the balanced volatility between markets and correlated groups.
| ITEM 4. | CONTROLS AND PROCEDURES |
Evaluation of Disclosure Controls and Procedures
Under the supervision and with the participation of the management of the Managing Owner, including its Chief Executive Officer and Principal Financial Officer, the Trust evaluated the effectiveness of the design and operation of the disclosure controls and procedures (as defined in Rule 13a-15(e) under the Securities Exchange Act of 1934, as amended (the “Exchange Act”)), for the Trust and each Series as of March 31,June 30, 2015 (the “Evaluation Date”). Any control system, no matter how well designed and operated, can provide only reasonable (not absolute) assurance that its objectives will be met. Furthermore, no evaluation of controls can provide absolute assurance that all control issues and instances of fraud, if any, have been detected. Based upon our evaluation, the Chief Executive Officer and Principal Financial Officer of the Managing Owner concluded that, as of the Evaluation Date, the disclosure controls and procedures for the Trust and each Series were effective to provide reasonable assurance that they are timely alerted to the material information relating to the Trust and each Series required to be included in the Trust’s periodic SEC filings.
Changes in Internal Control Over Financial Reporting
There were no changes in the Trust’s internal control over financial reporting for the quarter ended March 31,June 30, 2015 that have materially affected, or are reasonably likely to materially affect, the Trust’s internal control over financial reporting.
Scope of Exhibit 31 Certifications
The certifications of the Chief Executive Officer and the Principal Financial Officer of the Managing Owner included as Exhibits 31.1 and 31.2, respectively, to this Form 10-Q apply not only to the Trust as a whole but also to each Series individually.
| ITEM 1. | LEGAL PROCEEDINGS. |
There are no material legal preceedingsCommencing in April and May 2013, the Managing Owner was required by the SEC and CFTC, respectively, to which the Trust or anyproduce certain documents and certain of its affiliates iscurrent and former employees were called to provide testimony related to, among other things, the valuation of certain, previously-held, financial instruments entered into between a party orbank/counterparty and certain of which anythe series operated by the Managing Owner at various points between October 2007 and June 2013. In February 2015, the SEC expanded the scope of theirits investigation to include the methodology behind how management fees for certain of the series operated by the Managing Owner were disclosed and calculated. In connection with its investigation, the SEC requested further information and took testimony from certain current and former employees regarding the management fees calculated on notional assets arethat were paid by each series to the subject.Managing Owner prior to March 2011. These matters remain pending with the SEC and CFTC.
| ITEM 1A. | RISK FACTORS. |
The section entitled “Risk Factors” beginning on page 18 of the Prospectus filed pursuant to Rule 424(b)(3) (File No. 333-185695) is incorporated by reference into this section.
| ITEM 2. | UNREGISTERED SALES OF EQUITY SECURITIES AND USE OF PROCEEDS. |
The following table provides information regarding the sale of unregistered Units by the Registrant for the three months ended March 31,June 30, 2015. The number of Units listed below for each transaction is the aggregate number of Units in the particular Series of the Trust purchased in such transaction. The consideration listed below for each transaction is, except as otherwise noted, the aggregate amount of cash paid for the Units purchased. For each transaction reported below, the price per Unit was NAV per Unit at the time of the transaction and the Managing Owner of the Trust was the purchaser of the Units. No underwriting discount or sales commission was paid or received with respect to any of the transactions reported below. The Registrant claims an exemption from registration of each of the transactions listed below under Section 4(a)(2) of the Securities Act, as a sale by an issuer not involving a public offering.
SERIES | DATE | UNITS | CONSIDERATION | |||
NONE |
One hundred percent of the offering proceeds from the sale of Units are initially available for the Series’ trading activities.
| ITEM 3. | DEFAULTS UPON SENIOR SECURITIES. |
None
| ITEM 4. | MINE SAFETY DISCLOSURES. |
Not applicable.
| ITEM 5. | OTHER INFORMATION. |
None
| ITEM 6. | EXHIBITS. |
Exhibits (numbered in accordance with Item 601 of Regulation S-K)
| 31.1 | Certification of Principal Executive Officer of the Managing Owner pursuant to Rules 13a-14(a) and 15(d)-14(a) of the Securities Exchange Act of 1934 (furnished herewith) | |
| 31.2 | Certification of Principal Financial Officer of the Managing Owner pursuant to Rules 13a-14(a) and 15(d)-14(a) of the Securities Exchange Act of 1934 (furnished herewith) | |
| 32.1 | Certification pursuant to 18 U.S.C. Section 1350, as enacted by Section 906 of The Sarbanes- Oxley Act of 2002. (furnished herewith) | |
| 32.2 | Certification pursuant to 18 U.S.C. Section 1350, as enacted by Section 906 of The Sarbanes- Oxley Act of 2002. (furnished herewith) | |
| 32.3 | Certification pursuant to 18 U.S.C. Section 1350, as enacted by Section 906 of The Sarbanes- Oxley Act of 2002. (furnished herewith) | |
| 32.4 | Certification pursuant to 18 U.S.C. Section 1350, as enacted by Section 906 of The Sarbanes- Oxley Act of 2002. (furnished herewith) | |
| 32.5 | Certification pursuant to 18 U.S.C. Section 1350, as enacted by Section 906 of The Sarbanes- Oxley Act of 2002. (furnished herewith) | |
| 32.6 | Certification pursuant to 18 U.S.C. Section 1350, as enacted by Section 906 of The Sarbanes- Oxley Act of 2002. (furnished herewith) | |
| 32.7 | Certification pursuant to 18 U.S.C. Section 1350, as enacted by Section 906 of The Sarbanes- Oxley Act of 2002. (furnished herewith) | |
| 32.8 | Certification pursuant to 18 U.S.C. Section 1350, as enacted by Section 906 of The Sarbanes- Oxley Act of 2002. (furnished herewith) | |
| 101 | Financials in XBRL format | |
Pursuant to the requirements of the Securities Exchange Act of 1934, the registrant has duly caused this report to be signed on its behalf by the undersigned thereunto duly authorized.
| Equinox Frontier Funds | ||||||
| (Registrant) | ||||||
| Date: August 14, 2015 | ||||||
| By: | /s/ ROBERT J. ENCK | |||||
| Robert J. Enck | ||||||
| President and Chief Executive Officer of Equinox Fund Management, LLC, the Managing Owner of Equinox Frontier Funds | ||||||
SIGNATURES
Pursuant to the requirements of the Securities Exchange Act of 1934, the registrant has duly caused this report to be signed on its behalf by the undersigned thereunto duly authorized.
| Equinox Frontier Balanced Fund, | ||||||||||
| a Series of Equinox Frontier Funds | ||||||||||
| (Registrant) | ||||||||||
| Date: August 14, 2015 | ||||||||||
| By: | /s/ ROBERT J. ENCK | |||||||||
| Robert J. Enck | ||||||||||
| President and Chief Executive Officer of Equinox Fund Management, LLC, the Managing Owner of Equinox Frontier Funds | ||||||||||
SIGNATURES
Pursuant to the requirements of the Securities Exchange Act of 1934, the registrant has duly caused this report to be signed on its behalf by the undersigned thereunto duly authorized.
| Equinox Frontier Heritage Fund, | ||||||||||
| a Series of Equinox Frontier Funds | ||||||||||
| (Registrant) | ||||||||||
| Date: | ||||||||||
| By: | /s/ ROBERT J. ENCK | |||||||||
| Robert J. Enck | ||||||||||
| President and Chief Executive Officer of Equinox Fund Management, LLC, the Managing Owner of Equinox Frontier Funds | ||||||||||
SIGNATURES
Pursuant to the requirements of the Securities Exchange Act of 1934, the registrant has duly caused this report to be signed on its behalf by the undersigned thereunto duly authorized.
| Equinox Frontier Winton Fund, | ||||||||||
| a Series of Equinox Frontier Funds | ||||||||||
| (Registrant) | ||||||||||
| Date: August 14, 2015 | ||||||||||
| By: | /s/ ROBERT J. ENCK | |||||||||
| Robert J. Enck | ||||||||||
| President and Chief Executive Officer of Equinox Fund Management, LLC, the Managing Owner of Equinox Frontier Funds | ||||||||||
SIGNATURES
Pursuant to the requirements of the Securities Exchange Act of 1934, the registrant has duly caused this report to be signed on its behalf by the undersigned thereunto duly authorized.
| Equinox Frontier Select Fund, | ||||||||||
a Series of Equinox Frontier Funds | ||||||||||
| (Registrant) | ||||||||||
| Date: | ||||||||||
| By: | /s/ ROBERT J. ENCK | |||||||||
| Robert J. Enck | ||||||||||
| President and Chief Executive Officer of Equinox Fund Management, LLC, the Managing Owner of Equinox Frontier Funds | ||||||||||
SIGNATURES
Pursuant to the requirements of the Securities Exchange Act of 1934, the registrant has duly caused this report to be signed on its behalf by the undersigned thereunto duly authorized.
| Equinox Frontier Long/Short Commodity Fund, | ||||||||||
a Series of Equinox Frontier Funds | ||||||||||
| (Registrant) | ||||||||||
| Date: | ||||||||||
| By: | /s/ ROBERT J. ENCK | |||||||||
| Robert J. Enck | ||||||||||
| President and Chief Executive Officer of Equinox Fund Management, LLC, the Managing Owner of Equinox Frontier Funds | ||||||||||
SIGNATURES
Pursuant to the requirements of the Securities Exchange Act of 1934, the registrant has duly caused this report to be signed on its behalf by the undersigned thereunto duly authorized.
| Equinox Frontier Diversified Fund, | ||||||||||
a Series of Equinox Frontier Funds | ||||||||||
| (Registrant) | ||||||||||
| Date: | ||||||||||
| By: | /s/ ROBERT J. ENCK | |||||||||
| Robert J. Enck | ||||||||||
| President and Chief Executive Officer of Equinox Fund Management, LLC, the Managing Owner of Equinox Frontier Funds | ||||||||||
SIGNATURES
Pursuant to the requirements of the Securities Exchange Act of 1934, the registrant has duly caused this report to be signed on its behalf by the undersigned thereunto duly authorized.
| Equinox Frontier Masters Fund, | ||||||||||
| a Series of Equinox Frontier Funds | ||||||||||
| (Registrant) | ||||||||||
| Date: August 14, 2015 | ||||||||||
| By: | /s/ ROBERT J. ENCK | |||||||||
| Robert J. Enck | ||||||||||
| President and Chief Executive Officer of Equinox Fund Management, LLC, the Managing Owner of Equinox Frontier Funds | ||||||||||
114117