UNITED STATES
SECURITIES AND EXCHANGE COMMISSION
Washington, D.C. 20549
FORM 10-Q
(Mark One)
| x | QUARTERLY REPORT PURSUANT TO SECTION 13 OR 15(d) OF THE SECURITIES EXCHANGE ACT OF 1934 |
FOR THE QUARTERLY PERIOD ENDED February 29,August 31, 2016
OR
| ¨ | TRANSITION REPORT PURSUANT TO SECTION 13 OR 15(d) OF THE SECURITIES EXCHANGE ACT OF 1934 |
FOR THE TRANSITION PERIOD FROM TO
Commission File Number: 1-15829
FEDEX CORPORATION
(Exact name of registrant as specified in its charter)
| Delaware | 62-1721435 | |
(State or other jurisdiction of incorporation or organization) | (I.R.S. Employer Identification No.) | |
| 942 South Shady Grove Road Memphis, Tennessee | 38120 | |
| (Address of principal executive offices) | (ZIP Code) | |
(901) 818-7500
(Registrant’s telephone number, including area code)
Indicate by check mark whether the registrant (1) has filed all reports required to be filed by Section 13 or 15(d) of the Securities Exchange Act of 1934 during the preceding 12 months (or for such shorter period that the registrant was required to file such reports), and (2) has been subject to such filing requirements for the past 90 days. Yes x No ¨
Indicate by check mark whether the registrant has submitted electronically and posted on its corporate website, if any, every Interactive Data File required to be submitted and posted pursuant to Rule 405 of Regulation S-T (§ 232.405 of this chapter) during the preceding 12 months (or for such shorter period that the registrant was required to submit and post such files). Yesx No¨
Indicate by check mark whether the registrant is a large accelerated filer, an accelerated filer, a non-accelerated filer or a smaller reporting company. See the definitions of “large accelerated filer,” “accelerated filer” and “smaller reporting company” in Rule 12b-2 of the Exchange Act.
Large accelerated filerx | Accelerated filer¨ | Non-accelerated filer¨ | Smaller reporting company ¨ | |||
| (Do not check if a smaller reporting company) | ||||||
Indicate by check mark whether the registrant is a shell company (as defined in Rule 12b-2 of the Exchange Act). Yes¨ Nox
Indicate the number of shares outstanding of each of the issuer’s classes of common stock, as of the latest practicable date.
| Common Stock | Outstanding Shares at | |
| Common Stock, par value $0.10 per share |
|
FEDEX CORPORATION
- 2 -
FEDEX CORPORATION
CONDENSED CONSOLIDATED BALANCE SHEETS
(IN MILLIONS)
| February 29, | August 31, | |||||||||||||||
| 2016 | May 31, | 2016 | May 31, | |||||||||||||
| (Unaudited) | 2015 | (Unaudited) | 2016 | |||||||||||||
ASSETS | ||||||||||||||||
CURRENT ASSETS | ||||||||||||||||
Cash and cash equivalents | $ | 2,841 | $ | 3,763 | $ | 2,989 | $ | 3,534 | ||||||||
Receivables, less allowances of $187 and $185 | 5,634 | 5,719 | ||||||||||||||
Spare parts, supplies and fuel, less allowances of $212 and $207 | 476 | 498 | ||||||||||||||
Deferred income taxes | 608 | 606 | ||||||||||||||
Receivables, less allowances of $169 and $178 | 7,233 | 7,252 | ||||||||||||||
Spare parts, supplies and fuel, less allowances of $222 and $218 | 512 | 496 | ||||||||||||||
Prepaid expenses and other | 678 | 355 | 667 | 707 | ||||||||||||
|
|
|
| |||||||||||||
Total current assets | 10,237 | 10,941 | 11,401 | 11,989 | ||||||||||||
PROPERTY AND EQUIPMENT, AT COST | 46,032 | 42,864 | 48,121 | 47,018 | ||||||||||||
Less accumulated depreciation and amortization | 23,480 | 21,989 | 23,317 | 22,734 | ||||||||||||
|
|
|
| |||||||||||||
Net property and equipment | 22,552 | 20,875 | 24,804 | 24,284 | ||||||||||||
OTHER LONG-TERM ASSETS | ||||||||||||||||
Goodwill | 3,764 | 3,810 | 6,783 | 6,747 | ||||||||||||
Other assets | 1,266 | 1,443 | 2,587 | 2,939 | ||||||||||||
|
|
|
| |||||||||||||
Total other long-term assets | 5,030 | 5,253 | 9,370 | 9,686 | ||||||||||||
|
|
|
| |||||||||||||
| $ | 37,819 | $ | 37,069 | $ | 45,575 | $ | 45,959 | |||||||||
|
|
|
| |||||||||||||
The accompanying notes are an integral part of these condensed consolidated financial statements.
- 3 -
FEDEX CORPORATION
CONDENSED CONSOLIDATED BALANCE SHEETS
(IN MILLIONS, EXCEPT SHARE DATA)
| February 29, | August 31, | |||||||||||||||
| 2016 | May 31, | 2016 | May 31, | |||||||||||||
| (Unaudited) | 2015 | (Unaudited) | 2016 | |||||||||||||
LIABILITIES AND STOCKHOLDERS’ INVESTMENT | ||||||||||||||||
CURRENT LIABILITIES | ||||||||||||||||
Current portion of long-term debt | $ | 11 | $ | 19 | $ | 47 | $ | 29 | ||||||||
Accrued salaries and employee benefits | 1,451 | 1,436 | 1,603 | 1,972 | ||||||||||||
Accounts payable | 2,024 | 2,066 | 2,851 | 2,944 | ||||||||||||
Accrued expenses | 2,453 | 2,436 | 2,973 | 3,063 | ||||||||||||
|
|
|
| |||||||||||||
Total current liabilities | 5,939 | 5,957 | 7,474 | 8,008 | ||||||||||||
LONG-TERM DEBT, LESS CURRENT PORTION | 8,477 | 7,249 | 13,735 | 13,733 | ||||||||||||
OTHER LONG-TERM LIABILITIES | ||||||||||||||||
Deferred income taxes | 2,046 | 1,747 | 1,762 | 1,567 | ||||||||||||
Pension, postretirement healthcare and other benefit obligations | 4,628 | 4,893 | 6,063 | 6,227 | ||||||||||||
Self-insurance accruals | 1,282 | 1,120 | 1,338 | 1,314 | ||||||||||||
Deferred lease obligations | 723 | 711 | 457 | 400 | ||||||||||||
Deferred gains, principally related to aircraft transactions | 161 | 181 | 150 | 155 | ||||||||||||
Other liabilities | 236 | 218 | 454 | 771 | ||||||||||||
|
|
|
| |||||||||||||
Total other long-term liabilities | 9,076 | 8,870 | 10,224 | 10,434 | ||||||||||||
COMMITMENTS AND CONTINGENCIES | ||||||||||||||||
COMMON STOCKHOLDERS’ INVESTMENT | ||||||||||||||||
Common stock, $0.10 par value; 800 million shares authorized; 318 million shares issued as of February 29, 2016 and May 31, 2015 | 32 | 32 | ||||||||||||||
Common stock, $0.10 par value; 800 million shares authorized; 318 million shares issued as of August 31, 2016 and May 31, 2016 | 32 | 32 | ||||||||||||||
Additional paid-in capital | 2,869 | 2,786 | 2,918 | 2,892 | ||||||||||||
Retained earnings | 18,481 | 16,900 | 18,862 | 18,371 | ||||||||||||
Accumulated other comprehensive (loss) income | (159 | ) | 172 | |||||||||||||
Accumulated other comprehensive loss | (176 | ) | (169 | ) | ||||||||||||
Treasury stock, at cost | (6,896 | ) | (4,897 | ) | (7,494 | ) | (7,342 | ) | ||||||||
|
|
|
| |||||||||||||
Total common stockholders’ investment | 14,327 | 14,993 | 14,142 | 13,784 | ||||||||||||
|
|
|
| |||||||||||||
| $ | 37,819 | $ | 37,069 | $ | 45,575 | $ | 45,959 | |||||||||
|
|
|
| |||||||||||||
The accompanying notes are an integral part of these condensed consolidated financial statements.
- 4 -
FEDEX CORPORATION
CONDENSED CONSOLIDATED STATEMENTS OF INCOME
(UNAUDITED)
(IN MILLIONS, EXCEPT PER SHARE AMOUNTS)
| Three Months Ended | Nine Months Ended | |||||||||||||||||||||||
| February 29, | February 28, | February 29, | February 28, | Three Months Ended August 31, | ||||||||||||||||||||
| 2016 | 2015 | 2016 | 2015 | 2016 | 2015 | |||||||||||||||||||
REVENUES | $ | 12,654 | $ | 11,716 | $ | 37,386 | $ | 35,339 | $ | 14,663 | $ | 12,279 | ||||||||||||
OPERATING EXPENSES: | ||||||||||||||||||||||||
Salaries and employee benefits | 4,712 | 4,335 | 13,807 | 12,678 | 5,311 | 4,525 | ||||||||||||||||||
Purchased transportation | 2,623 | 2,165 | 7,505 | 6,404 | 3,240 | 2,344 | ||||||||||||||||||
Rentals and landing fees | 744 | 686 | 2,121 | 2,009 | 790 | 695 | ||||||||||||||||||
Depreciation and amortization | 663 | 652 | 1,964 | 1,954 | 739 | 648 | ||||||||||||||||||
Fuel | 537 | 810 | 1,864 | 2,982 | 650 | 712 | ||||||||||||||||||
Maintenance and repairs | 504 | 505 | 1,581 | 1,604 | 598 | 548 | ||||||||||||||||||
Other | 2,007 | 1,525 | 5,399 | 4,520 | 2,071 | 1,663 | ||||||||||||||||||
|
|
|
|
|
| |||||||||||||||||||
| 11,790 | 10,678 | 34,241 | 32,151 | 13,399 | 11,135 | |||||||||||||||||||
|
|
|
|
|
| |||||||||||||||||||
OPERATING INCOME | 864 | 1,038 | 3,145 | 3,188 | 1,264 | 1,144 | ||||||||||||||||||
OTHER INCOME (EXPENSE): | ||||||||||||||||||||||||
Interest, net | (81 | ) | (58 | ) | (218 | ) | (153 | ) | (113 | ) | (63 | ) | ||||||||||||
Other, net | (1 | ) | 5 | (6 | ) | 8 | (9 | ) | 3 | |||||||||||||||
|
|
|
|
|
| |||||||||||||||||||
| (82 | ) | (53 | ) | (224 | ) | (145 | ) | (122 | ) | (60 | ) | |||||||||||||
|
|
|
|
|
| |||||||||||||||||||
INCOME BEFORE INCOME TAXES | 782 | 985 | 2,921 | 3,043 | 1,142 | 1,084 | ||||||||||||||||||
PROVISION FOR INCOME TAXES | 275 | 357 | 1,031 | 1,099 | 427 | 392 | ||||||||||||||||||
|
|
|
|
|
| |||||||||||||||||||
NET INCOME | $ | 507 | $ | 628 | $ | 1,890 | $ | 1,944 | $ | 715 | $ | 692 | ||||||||||||
|
|
|
|
|
| |||||||||||||||||||
EARNINGS PER COMMON SHARE: | ||||||||||||||||||||||||
Basic | $ | 1.86 | $ | 2.21 | $ | 6.79 | $ | 6.85 | $ | 2.69 | $ | 2.45 | ||||||||||||
|
|
|
|
|
| |||||||||||||||||||
Diluted | $ | 1.84 | $ | 2.18 | $ | 6.71 | $ | 6.75 | $ | 2.65 | $ | 2.42 | ||||||||||||
|
|
|
|
|
| |||||||||||||||||||
DIVIDENDS DECLARED PER COMMON SHARE | $ | 0.25 | $ | 0.20 | $ | 1.00 | $ | 0.80 | $ | 0.80 | $ | 0.50 | ||||||||||||
|
|
|
|
|
| |||||||||||||||||||
The accompanying notes are an integral part of these condensed consolidated financial statements.
- 5-5 -
FEDEX CORPORATION
CONDENSED CONSOLIDATED STATEMENTS OF COMPREHENSIVE INCOME
(UNAUDITED)
(IN MILLIONS)
| Three Months Ended | Nine Months Ended | |||||||||||||||
| February 29, | February 28, | February 29, | February 28, | |||||||||||||
| 2016 | 2015 | 2016 | 2015 | |||||||||||||
NET INCOME | $ | 507 | $ | 628 | $ | 1,890 | $ | 1,944 | ||||||||
OTHER COMPREHENSIVE INCOME (LOSS): | ||||||||||||||||
Foreign currency translation adjustments, net of tax of $11, $18, $28 and $41 | (99 | ) | (152 | ) | (270 | ) | (305 | ) | ||||||||
Amortization of prior service credit, net of tax of $12, $10, $30 and $31 | (19 | ) | (18 | ) | (61 | ) | (52 | ) | ||||||||
|
|
|
|
|
|
|
| |||||||||
| (118 | ) | (170 | ) | (331 | ) | (357 | ) | |||||||||
|
|
|
|
|
|
|
| |||||||||
COMPREHENSIVE INCOME | $ | 389 | $ | 458 | $ | 1,559 | $ | 1,587 | ||||||||
|
|
|
|
|
|
|
| |||||||||
| Three Months Ended August 31, | ||||||||
| 2016 | 2015 | |||||||
NET INCOME | $ | 715 | $ | 692 | ||||
OTHER COMPREHENSIVE LOSS: | ||||||||
Foreign currency translation adjustments, net of tax expense of $4 in 2016 and tax benefit of $13 in 2015 | 12 | (138 | ) | |||||
Amortization of prior service credit, net of tax benefit of $11 in 2016 and $7 in 2015 | (19 | ) | (24 | ) | ||||
|
|
|
| |||||
| (7 | ) | (162 | ) | |||||
|
|
|
| |||||
COMPREHENSIVE INCOME | $ | 708 | $ | 530 | ||||
|
|
|
| |||||
The accompanying notes are an integral part of these condensed consolidated financial statements.
- 6-6 -
FEDEX CORPORATION
CONDENSED CONSOLIDATED STATEMENTS OF CASH FLOWS
(UNAUDITED)
(IN MILLIONS)
| Nine Months Ended | ||||||||||||||||
| February 29, | February 28, | Three Months Ended August 31, | ||||||||||||||
| 2016 | 2015 | 2016 | 2015 | |||||||||||||
Operating Activities: | ||||||||||||||||
Net income | $ | 1,890 | $ | 1,944 | $ | 715 | $ | 692 | ||||||||
Adjustments to reconcile net income to cash provided by operating activities: | ||||||||||||||||
Depreciation and amortization | 1,964 | 1,954 | 739 | 648 | ||||||||||||
Provision for uncollectible accounts | 90 | 112 | 39 | 28 | ||||||||||||
Stock-based compensation | 115 | 106 | 57 | 53 | ||||||||||||
Deferred income taxes and other noncash items | 288 | 220 | 173 | 20 | ||||||||||||
Changes in assets and liabilities: | ||||||||||||||||
Receivables | (78 | ) | (200 | ) | 20 | 50 | ||||||||||
Other assets | (322 | ) | (38 | ) | (4 | ) | (89 | ) | ||||||||
Accounts payable and other liabilities | (146 | ) | (599 | ) | (753 | ) | (151 | ) | ||||||||
Other, net | (5 | ) | (26 | ) | (15 | ) | (10 | ) | ||||||||
|
|
|
| |||||||||||||
Cash provided by operating activities | 3,796 | 3,473 | 971 | 1,241 | ||||||||||||
Investing Activities: | ||||||||||||||||
Capital expenditures | (3,562 | ) | (2,969 | ) | (1,215 | ) | (1,209 | ) | ||||||||
Business acquisitions, net of cash acquired | — | (1,429 | ) | |||||||||||||
Asset dispositions and other, net | (17 | ) | 16 | |||||||||||||
Proceeds from asset dispositions and other | 9 | 10 | ||||||||||||||
|
|
|
| |||||||||||||
Cash used in investing activities | (3,579 | ) | (4,382 | ) | (1,206 | ) | (1,199 | ) | ||||||||
Financing Activities: | ||||||||||||||||
Principal payments on debt | (28 | ) | (1 | ) | (12 | ) | (15 | ) | ||||||||
Proceeds from debt issuances | 1,238 | 2,491 | ||||||||||||||
Proceeds from stock issuances | 79 | 272 | 40 | 46 | ||||||||||||
Excess tax benefit on the exercise of stock options | 9 | 31 | 2 | 6 | ||||||||||||
Dividends paid | (210 | ) | (171 | ) | (106 | ) | (71 | ) | ||||||||
Purchases of treasury stock | (2,133 | ) | (1,016 | ) | ||||||||||||
Purchase of treasury stock | (222 | ) | (190 | ) | ||||||||||||
Other, net | (16 | ) | (23 | ) | (15 | ) | — | |||||||||
|
|
|
| |||||||||||||
Cash (used in) provided by financing activities | (1,061 | ) | 1,583 | |||||||||||||
Cash used in financing activities | (313 | ) | (224 | ) | ||||||||||||
|
|
|
| |||||||||||||
Effect of exchange rate changes on cash | (78 | ) | (104 | ) | 3 | (38 | ) | |||||||||
|
|
|
| |||||||||||||
Net (decrease) increase in cash and cash equivalents | (922 | ) | 570 | |||||||||||||
Net decrease in cash and cash equivalents | (545 | ) | (220 | ) | ||||||||||||
Cash and cash equivalents at beginning of period | 3,763 | 2,908 | 3,534 | 3,763 | ||||||||||||
|
|
|
| |||||||||||||
Cash and cash equivalents at end of period | $ | 2,841 | $ | 3,478 | $ | 2,989 | $ | 3,543 | ||||||||
|
|
|
| |||||||||||||
The accompanying notes are an integral part of these condensed consolidated financial statements.
- 7 -
FEDEX CORPORATION
NOTES TO CONDENSED CONSOLIDATED FINANCIAL STATEMENTS
(UNAUDITED)
(1)General
SUMMARY OF SIGNIFICANT ACCOUNTING POLICIES.These interim financial statements of FedEx Corporation (“FedEx”) have been prepared in accordance with accounting principles generally accepted in the United States and Securities and Exchange Commission (“SEC”) instructions for interim financial information, and should be read in conjunction with our Annual Report on Form 10-K for the year ended May 31, 20152016 (“Annual Report”). Accordingly, significant accounting policies and other disclosures normally provided have been omitted since such items are disclosed in our Annual Report.
In the opinion of management, the accompanying unaudited condensed consolidated financial statements reflect all adjustments (including normal recurring adjustments) necessary to present fairly our financial position as of February 29,August 31, 2016, and the results of our operations for the three- and nine-month periods ended February 29, 2016 and February 28, 2015 and cash flows for the nine-monththree-month periods ended February 29,August 31, 2016 and February 28, 2015. Operating results for the three- and nine-month periodsthree-month period ended February 29,August 31, 2016 are not necessarily indicative of the results that may be expected for the year ending May 31, 2016.2017.
Except as otherwise specified, references to years indicate our fiscal year ending May 31, 20162017 or ended May 31 of the year referenced and comparisons are to the corresponding period of the prior year.
REVENUE RECOGNITION.RECLASSIFICATIONS.On June 1, 2015, we began recording revenues associated withReclassifications have been made to the FedEx SmartPost service on a gross basis including postal fees in revenues and expenses, versus our previous net treatment, dueMay 31, 2016 condensed consolidated balance sheets to operational changes occurring in 2016 that result in us beingconform to the principal in all casescurrent year’s presentation of debt issuance costs. See recent accounting guidance below for the FedEx SmartPost service. This change has been recognized prospectively.additional information.
BUSINESS ACQUISITIONS.ACQUISITION.As discussed in our Annual Report, on April 6, 2015,On May 25, 2016, we entered into a conditional agreement to acquireacquired TNT Express N.V.B.V. (“TNT Express”) for €4.4 billion (currently, approximately(approximately $4.9 billion). This combination is expected to expand our global portfolio, particularly in Europe, lower our costs to serve our European markets by increasing density in our pickup-and-delivery operations and accelerate our global growth. This acquisition is expected to be completedCash acquired in the first halfacquisition was approximately €250 million ($280 million). As of calendar yearAugust 31, 2016, $36 million of shares associated with the transaction remained untendered, a decrease of $251 million since May 31, 2016. The closingremaining untendered shares are included in the “Other liabilities” caption of our consolidated balance sheets. We funded the acquisition is subject to customary conditions, including obtaining all necessary approvalswith proceeds from our April 2016 debt issuance and competition clearances. We expect to secure all relevant competition approvals.
We completed our acquisitions of GENCO Distribution System, Inc. (“GENCO”) and Bongo International, LLC (“Bongo”) in the third quarter of 2015 and have included theexisting cash balances. The financial results and estimated fair values of the assets and liabilities related to these acquisitionsthis business are included in the FedEx GroundExpress group and FedExTNT Express segments, respectively. These acquisitions aresegment from the date of acquisition.
TNT Express collects, transports and delivers documents, parcels and freight to over 200 countries. This strategic acquisition broadens our portfolio of international transportation solutions with the combined strength of TNT Express’s strong European road platform and our strength in other regions globally, including North America and Asia.
- 8 -
This acquisition is included in the accompanying balance sheets based on an allocation of the purchase price (summarized in the table below, in millions). Given the timing and complexity of the acquisition, the presentation of TNT Express in our financial statements, including the allocation of the purchase price, is preliminary and will likely change in future periods, perhaps significantly, as fair value estimates of the assets acquired and liabilities assumed are refined during the measurement period. We will complete our purchase price allocation no later than the fourth quarter of 2017.
Current assets | $ | 344 | ||
Property and equipment | 113 | |||
Goodwill | 1,194 | |||
Intangible assets | 69 | |||
Other non-current assets | 25 | |||
Current liabilities | (244 | ) | ||
Long-term liabilities | (56 | ) | ||
|
| |||
Total purchase price | $ | 1,445 | ||
|
|
Current assets(1) | $ | 1,905 | ||
Property and equipment | 1,104 | |||
Goodwill | 2,964 | |||
Identifiable intangible assets | 920 | |||
Other non-current assets | 289 | |||
Current liabilities(2) | (1,644 | ) | ||
Long-term liabilities | (644 | ) | ||
|
| |||
Total purchase price | $ | 4,894 | ||
|
|
| (1) | Primarily accounts receivable and cash. |
| (2) | Primarily accounts payable and other accrued expenses. |
- 8-
TheAs a result of this acquisition, we recognized a preliminary value of $3.0 billion of goodwill, recordedwhich is primarily attributable to the TNT Express workforce and the expected benefits from synergies of the combinationscombination with existing businesses and other acquired entities and the work force in place at GENCO.growth opportunities. The majority of the purchase price allocated to goodwill is not deductible for U.S. income tax purposes.
The purchase price was preliminarily allocated to the identifiable intangible assets acquired consist primarily of customer-related intangible assets, which are amortized on an accelerated basis over an estimated life of 15 years.as follows (in millions):
Intangible assets with finite lives | ||||
Customer relationships (15-year useful life) | $ | 685 | ||
Technology (4-year useful life) | 90 | |||
Trademarks (4-year useful life) | 145 | |||
|
| |||
Total intangible assets | $ | 920 | ||
|
|
EMPLOYEES UNDER COLLECTIVE BARGAINING ARRANGEMENTS.ARRANGEMENTS. The pilots of Federal Express Corporation (“FedEx Express”), which represent a small number of FedEx Express’s total employees, are employed under a collective bargaining agreement (“CBA”) that took effect on November 2, 2015. The CBAThis collective bargaining agreement is scheduled to become amendable in November 2021, after a six-year term. In addition to our pilots at FedEx Express, GENCO Distribution System, Inc. (“GENCO”) has a small number of employees who are members of unions, and certain non-U.S. employees are unionized.
STOCK-BASED COMPENSATION.We have two types of equity-based compensation: stock options and restricted stock. The key terms of the stock option and restricted stock awards granted under our incentive stock plans and all financial disclosures about these programs are set forth in our Annual Report.
Our stock-based compensation expense was $29$57 million for the three-month period ended February 29,August 31, 2016 and $115 million for the nine-month period ended February 29, 2016. Our stock-based compensation expense was $26$53 million for the three-month period ended February 28, 2015 and $106 million for the nine-month period ended February 28,August 31, 2015. Due to its immateriality, additional disclosures related to stock-based compensation have been excluded from this quarterly report.
- 9 -
RECENT ACCOUNTING GUIDANCE.New accounting rules and disclosure requirements can significantly impact our reported results and the comparability of our financial statements. These matters are described in our Annual Report.
InDuring the second quarter, of 2016, we chose to early adoptretrospectively adopted the authoritative guidance issued by the Financial Accounting Standards Board (“FASB”) requiring acquirers into simplify the presentation of debt issuance costs. This new guidance requires entities to present debt issuance costs related to a business combination to recognize adjustments to provisional amountsrecognized debt liability as a direct deduction from the carrying amount of that are identified during the measurement period in the reporting period that the adjustment amounts are determined and eliminates the requirement to retrospectively account for these adjustments. It also requires additional disclosure about the effects of the adjustments on prior periods. Adoption of thisdebt liability, rather than as an asset. This new guidance had noa minimal impact on our accounting and financial reporting. See
On May 28, 2014, the “Business Acquisitions” section aboveFASB and International Accounting Standards Board issued a new accounting standard that will supersede virtually all existing revenue recognition guidance under generally accepted accounting principles in the United States (and International Financial Reporting Standards) which has been subsequently updated to defer the effective date of the new revenue recognition standard by one year. This standard will be effective for further discussion regardingus beginning in fiscal 2019. The fundamental principles of the new guidance are that companies should recognize revenue in a manner that reflects the timing of the transfer of services to customers and the amount of revenue recognized reflects the consideration that a company expects to receive for the goods and services provided. The new guidance establishes a five-step approach for the recognition of revenue. Based on our recent business acquisitions.preliminary assessment, we do not anticipate that the new guidance will have a material impact on our revenue recognition policies, practices or systems.
On February 25, 2016, the FASB issued the new lease accounting standard which requires lessees to put most leases on their balance sheets but recognize the expenses on their income statements in a manner similar to current practice. The new standard states that a lessee will recognize a lease liability for the obligation to make lease payments and a right-of-use asset for the right to use the underlying asset for the lease term. Expense related to leases determined to be operating leases will be recognized on a straight-line basis, while those determined to be financing leases will be recognized following a front-loaded expense profile in which interest and amortization are presented separately in the income statement. We are currently evaluating the impact of this new standard on our financial reporting, but recognizing the lease liability and related right-of-use asset will significantly impact our balance sheet. These changes will be effective for our fiscal year beginning June 1, 2019 (fiscal 2020), with a modified retrospective adoption method to the beginning of 2018.
On November 20, 2015,In March 2016, the FASB issued an Accounting Standards Update that will requireto simplify the accounting for share-based payment transactions. The new guidance requires companies to classify all deferredrecognize the income tax assets and liabilitieseffects of awards that vest or are settled as noncurrent onincome tax expense or benefit in the balance sheet insteadincome statement as opposed to additional paid-in capital as is current practice. The guidance also provides clarification of separating deferred taxes into current and noncurrent amounts.the presentation of certain components of share-based awards in the statement of cash flows. Additionally, the guidance allows companies to make a policy election to account for forfeitures either upon occurrence or by estimating forfeitures. This new guidancestandard will have minimal impact on our accounting and financial reporting, and we plan to early adopt on a retrospective basis in the fourth quarter of 2016.reporting. These changes will be effective for our fiscal year beginning June 1, 2017 (fiscal 2018).
We believe that no other new accounting guidance was adopted or issued during the ninefirst three months of 20162017 that is relevant to the readers of our financial statements.
- 9 -
TREASURY SHARES.In January 2016, the stock repurchase authorization announced in September 2014 for 15 million shares was completed. On January 26, 2016, our Board of Directors approvedauthorized a new share repurchase program of up to 25 million shares. Shares under the newcurrent repurchase program may be repurchased from time to time in the open market or in privately negotiated transactions. The timing and volume of repurchases are at the discretion of management, based on the capital needs of the business, the market price of FedEx common stock and general market conditions. No time limit was set for the completion of the program, and the program may be suspended or discontinued at any time.
During the thirdfirst quarter of 2016,2017, we repurchased 7.31.4 million shares of FedEx common stock at an average price of $140.42$160.18 per share for a total of $1.0 billion.$222 million. As of February 29,August 31, 2016, 22.817.6 million shares remained under the share repurchase authorization.
- 10 -
DIVIDENDS DECLARED PER COMMON SHARE.On FebruaryAugust 19, 2016, our Board of Directors declared a quarterly dividend of $0.25$0.40 per share of common stock. The dividend will be paid on April 1,October 3, 2016 to stockholders of record as of the close of business on March 14,September 12, 2016. Each quarterly dividend payment is subject to review and approval by our Board of Directors, and we evaluate our dividend payment amount on an annual basis at the end of each fiscal year.
(2)Accumulated Other Comprehensive Income (Loss)
The following table provides changes in accumulated other comprehensive income (loss) (“AOCI”), net of tax, reported in our unaudited condensed consolidated financial statements for the three-month periods ended February 29, 2016 and February 28, 2015August 31 (in millions; amounts in parentheses indicate debits to AOCI):
| Three Months Ended | Nine Months Ended | |||||||||||||||
| 2016 | 2015 | 2016 | 2015 | |||||||||||||
Foreign currency translation gain (loss): | ||||||||||||||||
Balance at beginning of period | $ | (424 | ) | $ | (72 | ) | $ | (253 | ) | $ | 81 | |||||
Translation adjustments | (99 | ) | (152 | ) | (270 | ) | (305 | ) | ||||||||
|
|
|
|
|
|
|
| |||||||||
Balance at end of period | (523 | ) | (224 | ) | (523 | ) | (224 | ) | ||||||||
|
|
|
|
|
|
|
| |||||||||
Retirement plans adjustments: | ||||||||||||||||
Balance at beginning of period | 383 | 391 | 425 | 425 | ||||||||||||
Reclassifications from AOCI | (19 | ) | (18 | ) | (61 | ) | (52 | ) | ||||||||
|
|
|
|
|
|
|
| |||||||||
Balance at end of period | 364 | 373 | 364 | 373 | ||||||||||||
|
|
|
|
|
|
|
| |||||||||
Accumulated other comprehensive (loss) income at end of period | $ | (159 | ) | $ | 149 | $ | (159 | ) | $ | 149 | ||||||
|
|
|
|
|
|
|
| |||||||||
- 10 -
| 2016 | 2015 | |||||||
Foreign currency translation loss: | ||||||||
Balance at beginning of period | $ | (514 | ) | $ | (253 | ) | ||
Translation adjustments | 12 | (138 | ) | |||||
|
|
|
| |||||
Balance at end of period | (502 | ) | (391 | ) | ||||
|
|
|
| |||||
Retirement plans adjustments: | ||||||||
Balance at beginning of period | 345 | 425 | ||||||
Reclassifications from AOCI | (19 | ) | (24 | ) | ||||
|
|
|
| |||||
Balance at end of period | 326 | 401 | ||||||
|
|
|
| |||||
Accumulated other comprehensive (loss) income at end of period | $ | (176 | ) | $ | 10 | |||
|
|
|
| |||||
The following table presents details of the reclassifications from AOCI for the three-month periods ended February 29, 2016 and February 28, 2015August 31 (in millions; amounts in parentheses indicate debits to earnings):
| Amount Reclassified from AOCI | Affected Line Item in the Income Statement | |||||||||||||||||||||||||||
| Three Months Ended | Nine Months Ended | Amount Reclassified from AOCI | Affected Line Item in the Income Statement | |||||||||||||||||||||||||
| 2016 | 2015 | 2016 | 2015 | 2016 | 2015 | |||||||||||||||||||||||
Amortization of retirement plans prior service credits, before tax | $ | 31 | $ | 28 | $ | 91 | $ | 83 | Salaries and employee benefits | $ | 30 | $ | 31 | Salaries and employee benefits | ||||||||||||||
Income tax benefit | (12 | ) | (10 | ) | (30 | ) | (31 | ) | Provision for income taxes | (11 | ) | (7 | ) | Provision for income taxes | ||||||||||||||
|
|
|
|
|
| |||||||||||||||||||||||
AOCI reclassifications, net of tax | $ | 19 | $ | 18 | $ | 61 | $ | 52 | Net income | $ | 19 | $ | 24 | Net income | ||||||||||||||
|
|
|
|
|
| |||||||||||||||||||||||
(3)Financing Arrangements
We have a shelf registration statement filed with the SEC that allows us to sell, in one or more future offerings, any combination of our unsecured debt securities and common stock.
On October 23, 2015, we issued $1.25 billion of senior unsecured 4.75% fixed-rate notes due in November 2045 under our current shelf registration statement. Interest on the notes is paid semiannually. We utilized the net proceeds for working capital and general corporate purposes, including share repurchases.
On November 13, 2015, we replaced our revolving and letter of credit facilities withhave a new, single five-year $1.75 billion revolving credit facility that expires in November 2020. The facility, which includes a $500 million letter of credit sublimit, is available to finance our operations and other cash flow needs. The agreement contains a financial covenant, which requires us to maintain a ratio of debt to consolidated earnings (excluding non-cash pension mark-to-market adjustments and non-cash asset impairment charges) before interest, taxes, depreciation and amortization (“adjusted EBITDA”) of not more than 3.5 to 1.0, calculated as of the end of the applicable quarter on a rolling four quarters basis. The ratio of our debt to adjusted EBITDA
- 11 -
was 1.21.9 to 1.0 at February 29,August 31, 2016. We believe this covenant is the only significant restrictive covenant in our revolving credit agreement. Our revolving credit agreement contains other customary covenants that do not, individually or in the aggregate, materially restrict the conduct of our business. We are in compliance with the financial covenant and all other covenants of our revolving credit agreement and do not expect the covenants to affect our operations, including our liquidity or expected funding needs. As of February 29,August 31, 2016, no commercial paper was outstanding. However, we had a total of $318$311 million in letters of credit outstanding at February 29,August 31, 2016, with $182$189 million of the letter of credit sublimit unused under our revolving credit facility.
Long-term debt, exclusive of capital leases, had a carrying valuesvalue of $8.5$13.7 billion at February 29,August 31, 2016 and $7.2 billion at May 31, 2015,2016, compared with estimated fair values of $8.5$15.0 billion at February 29,August 31, 2016 and $7.4$14.3 billion at May 31, 2015.2016. The annualized weighted average interest rate on long-term debt was 3.6% for the three months ended August 31, 2016. The estimated fair values were determined based on quoted market prices and the current rates offered for debt with similar terms and maturities. The fair value of our long-term debt is classified as Level 2 within the fair value hierarchy. This classification is defined as a fair value determined using market-based inputs other than quoted prices that are observable for the liability, either directly or indirectly.
- 11 -
(4)Computation of Earnings Per Share
The calculation of basic and diluted earnings per common share for the three-month periods ended February 29, 2016 and February 28, 2015August 31 was as follows (in millions, except per share amounts):
| Three Months Ended | Nine Months Ended | |||||||||||||||||||||||
| 2016 | 2015 | 2016 | 2015 | 2016 | 2015 | |||||||||||||||||||
Basic earnings per common share: | ||||||||||||||||||||||||
Net earnings allocable to common shares(1) | $ | 506 | $ | 626 | $ | 1,888 | $ | 1,941 | $ | 714 | $ | 691 | ||||||||||||
Weighted-average common shares | 272 | 283 | 278 | 284 | 265 | 282 | ||||||||||||||||||
|
|
|
|
|
| |||||||||||||||||||
Basic earnings per common share | $ | 1.86 | $ | 2.21 | $ | 6.79 | $ | 6.85 | $ | 2.69 | $ | 2.45 | ||||||||||||
|
|
|
|
|
| |||||||||||||||||||
Diluted earnings per common share: | ||||||||||||||||||||||||
Net earnings allocable to common shares(1) | $ | 506 | $ | 626 | $ | 1,888 | $ | 1,941 | $ | 714 | $ | 691 | ||||||||||||
|
|
|
|
|
| |||||||||||||||||||
Weighted-average common shares | 272 | 283 | 278 | 284 | 265 | 282 | ||||||||||||||||||
Dilutive effect of share-based awards | 3 | 4 | 3 | 4 | 4 | 4 | ||||||||||||||||||
|
|
|
|
|
| |||||||||||||||||||
Weighted-average diluted shares | 275 | 287 | 281 | 288 | 269 | 286 | ||||||||||||||||||
Diluted earnings per common share | $ | 1.84 | $ | 2.18 | $ | 6.71 | $ | 6.75 | $ | 2.65 | $ | 2.42 | ||||||||||||
|
|
|
|
|
| |||||||||||||||||||
Anti-dilutive options excluded from diluted earnings per common share | 4.8 | 2.0 | 4.0 | 2.1 | 5.1 | 3.5 | ||||||||||||||||||
|
|
|
|
|
| |||||||||||||||||||
| (1) | Net earnings available to participating securities were immaterial in all periods presented. |
- 12 -
(5)Retirement Plans
We sponsor programs that provide retirement benefits to most of our employees. These programs include defined benefit pension plans, defined contribution plans and postretirement healthcare plans. Key terms of our retirement plans are provided in our Annual Report. Our retirement plansplans’ costs for the three-month periods ended February 29, 2016 and February 28, 2015August 31 were as follows (in millions):
| Three Months Ended | Nine Months Ended | |||||||||||||||
| 2016 | 2015 | 2016 | 2015 | |||||||||||||
Defined benefit pension plans | $ | 53 | $ | (10 | ) | $ | 160 | $ | (27 | ) | ||||||
Defined contribution plans | 104 | 96 | 304 | 284 | ||||||||||||
Postretirement healthcare plans | 20 | 21 | 61 | 61 | ||||||||||||
|
|
|
|
|
|
|
| |||||||||
| $ | 177 | $ | 107 | $ | 525 | $ | 318 | |||||||||
|
|
|
|
|
|
|
| |||||||||
- 12 -
| 2016 | 2015 | |||||||
Defined benefit pension plans | $ | 58 | $ | 53 | ||||
Defined contribution plans | 119 | 102 | ||||||
Postretirement healthcare plans | 19 | 21 | ||||||
|
|
|
| |||||
| $ | 196 | $ | 176 | |||||
|
|
|
| |||||
Net periodic benefit cost of the pension and postretirement healthcare plans for the three-month periods ended February 29, 2016 and February 28, 2015August 31 included the following components (in millions):
| Three Months Ended | Nine Months Ended | Pension Plans | Postretirement Healthcare Plans | |||||||||||||||||||||||||||||
| 2016 | 2015 | 2016 | 2015 | 2016 | 2015 | 2016 | 2015 | |||||||||||||||||||||||||
Pension Plans | ||||||||||||||||||||||||||||||||
Service cost | $ | 166 | $ | 165 | $ | 497 | $ | 493 | $ | 180 | $ | 166 | $ | 9 | $ | 10 | ||||||||||||||||
Interest cost | 295 | 274 | 885 | 824 | 293 | 295 | 10 | 11 | ||||||||||||||||||||||||
Expected return on plan assets | (377 | ) | (420 | ) | (1,131 | ) | (1,260 | ) | (386 | ) | (377 | ) | — | — | ||||||||||||||||||
Amortization of prior service credit and other | (31 | ) | (29 | ) | (91 | ) | (84 | ) | (29 | ) | (31 | ) | — | — | ||||||||||||||||||
|
|
|
|
|
|
|
| |||||||||||||||||||||||||
| $ | 53 | $ | (10 | ) | $ | 160 | $ | (27 | ) | $ | 58 | $ | 53 | $ | 19 | $ | 21 | |||||||||||||||
|
|
|
|
|
|
|
| |||||||||||||||||||||||||
| Three Months Ended | Nine Months Ended | |||||||||||||||||||||||||||||||
| 2016 | 2015 | 2016 | 2015 | |||||||||||||||||||||||||||||
Postretirement Healthcare Plans | ||||||||||||||||||||||||||||||||
Service cost | $ | 10 | $ | 10 | $ | 30 | $ | 30 | ||||||||||||||||||||||||
Interest cost | 10 | 11 | 31 | 31 | ||||||||||||||||||||||||||||
|
|
|
| |||||||||||||||||||||||||||||
| $ | 20 | $ | 21 | $ | 61 | $ | 61 | |||||||||||||||||||||||||
|
|
|
| |||||||||||||||||||||||||||||
Contributions to our tax qualifiedtax-qualified U.S. domestic pension plans (“U.S. Pension Plans”) for the nine-monththree-month periods ended February 29, 2016 and February 28, 2015August 31 were as follows (in millions):
| 2016 | 2015 | 2016 | 2015 | |||||||||||||
Required | $ | 8 | $ | 380 | $ | — | $ | 6 | ||||||||
Voluntary | 487 | 115 | 250 | 159 | ||||||||||||
|
|
|
| |||||||||||||
| $ | 495 | $ | 495 | $ | 250 | $ | 165 | |||||||||
|
|
|
| |||||||||||||
In MarchSeptember 2016, we made an additional voluntarya required contribution of $165$250 million to our U.S. Pension Plans. Our U.S. Pension Plans have ample funds to meet expected benefit payments.
- 13 -
(6)Business Segment Information
We provide a broad portfolio of transportation, e-commerce and business services through companies competing collectively, operating independently and managed collaboratively under the respected FedEx brand. Our primary operating companies include FedEx Express, the world’s largest express transportation company; TNT Express, an international express, small-package ground delivery and freight transportation company that was acquired near the end of our 2016 fourth quarter; FedEx Ground Package System, Inc. (“FedEx Ground”), a leading North American provider of small-package ground delivery services; and FedEx Freight, Inc. (“FedEx Freight”), a leading U.S. provider of less-than-truckload (“LTL”) freight services. These companies represent our major service lines and, along with FedEx Corporate Services, Inc. (“FedEx Services”), form the core of our reportable segments.
- 13 -
Our reportable segments include the following businesses:
| FedEx Express | ||
FedEx Express Segment | FedEx Express (express transportation) | |
FedEx Trade Networks (air and ocean freight forwarding, customs brokerage and | ||
| FedEx SupplyChain Systems (logistics services) | ||
TNT Express Segment | TNT Express (international express transportation, small-package ground delivery and | |
| FedEx Ground Segment | FedEx Ground (small-package ground delivery) | |
| GENCO (third-party logistics) | ||
| FedEx Freight Segment | FedEx Freight (LTL freight transportation) | |
| FedEx Custom Critical (time-critical transportation) | ||
| FedEx Services Segment | FedEx Services (sales, marketing, information technology, communications, customer service, technical support, billing and collection services and back-office functions) | |
FedEx Office (document and business services and package acceptance) | ||
FedEx Services Segment
The FedEx Services segment operates combined sales, marketing, administrative and information technology functions in shared services operations that support our transportation businesses and allow us to obtain synergies from the combination of these functions. For the international regions of FedEx Express, some of these functions are performed on a regional basis by FedEx Express and reported in the FedEx Express segment in their natural expense line items. The FedEx Services segment includes: FedEx Services, which provides sales, marketing, information technology, communications, customer service, technical support, billing and collection services for U.S. customers of our major business units and certain back-office support to our other companies; and FedEx Office, which provides an array of document and business services and retail access to our customers for our package transportation businesses.
The FedEx Services segment provides direct and indirect support to our transportation businesses, and we allocate all of the net operating costs of the FedEx Services segment (including the net operating results of FedEx Office) to reflect the full cost of operating our transportation businesses in the results of those segments. Within the FedEx Services segment allocation, the net operating results of FedEx Office, which are an immaterial component of our allocations, are allocated to FedEx Express and FedEx Ground. We review and evaluate the performance of our transportation segments based on operating income (inclusive of FedEx Services segment allocations). For the FedEx Services segment, performance is evaluated based on the impact of its total allocated net operating costs on our transportation segments.
Operating expenses for each of our transportation segments include the allocations from the FedEx Services segment to the respective transportation segments. These allocations also include charges and credits for administrative services provided between operating companies. The allocations of net operating costs are based on metrics such as relative revenues or estimated services provided. We believe these allocations approximate the net cost of providing these functions. Our allocation methodologies are refined periodically, as necessary, to reflect changes in our businesses.
- 14 -
Eliminations, Corporate and Other
Certain FedEx operating companies provide transportation and related services for other FedEx companies outside their reportable segment. Billings for such services are based on negotiated rates, which we believe approximate fair value, and are reflected as revenues of the billing segment. These rates are adjusted from time to time based on market conditions. Such intersegment revenues and expenses are eliminated in our consolidated results and are not separately identified in the following segment information, because the amounts are not material.
Corporate and other includes corporate headquarters costs for executive officers and certain other legal and financial functions, as well as certain other costs and credits not attributed to our core business. These costs are not allocated to the business segments.
The following table provides a reconciliation of reportable segment revenues and operating income to our unaudited condensed consolidated financial statement totals for the three-month periods ended February 29, 2016 and February 28, 2015August 31 (in millions):
| Three Months Ended | Nine Months Ended | |||||||||||||||||||||||
| 2016 | 2015 | 2016 | 2015 | 2016 | 2015 | |||||||||||||||||||
Revenues | ||||||||||||||||||||||||
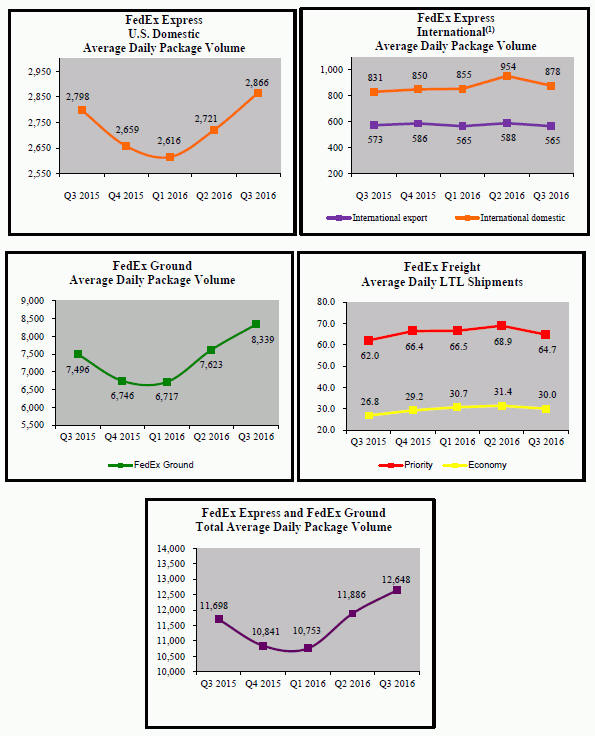
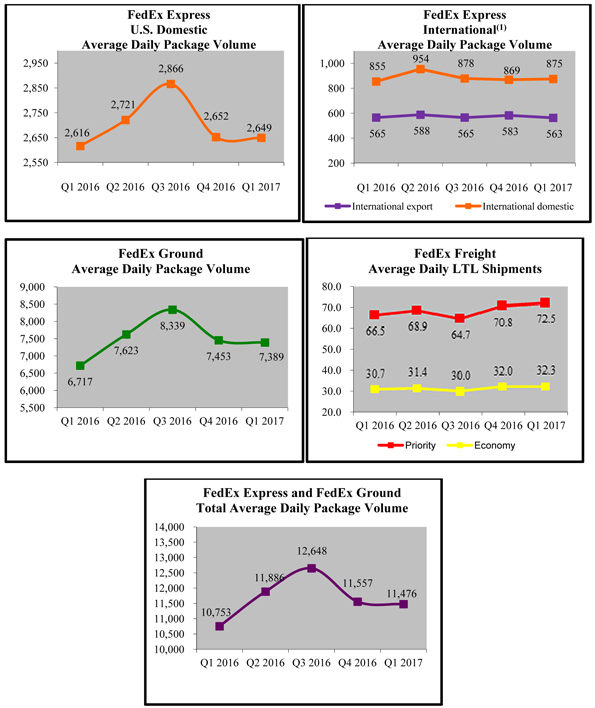
FedEx Express segment | $ | 6,557 | $ | 6,656 | $ | 19,736 | $ | 20,542 | $ | 6,656 | $ | 6,591 | ||||||||||||
TNT Express segment | 1,804 | N/A | ||||||||||||||||||||||
FedEx Ground segment | 4,408 | 3,393 | 12,288 | 9,416 | 4,290 | 3,830 | ||||||||||||||||||
FedEx Freight segment | 1,447 | 1,428 | 4,595 | 4,622 | 1,658 | 1,601 | ||||||||||||||||||
FedEx Services segment | 384 | 370 | 1,177 | 1,138 | 395 | 390 | ||||||||||||||||||
Eliminations and other | (142 | ) | (131 | ) | (410 | ) | (379 | ) | (140 | ) | (133 | ) | ||||||||||||
|
|
|
|
|
| |||||||||||||||||||
| $ | 12,654 | $ | 11,716 | $ | 37,386 | $ | 35,339 | $ | 14,663 | $ | 12,279 | |||||||||||||
|
|
|
|
|
| |||||||||||||||||||
Operating Income | ||||||||||||||||||||||||
FedEx Express segment | $ | 595 | $ | 393 | $ | 1,762 | $ | 1,262 | $ | 624 | $ | 545 | ||||||||||||
TNT Express segment | (14 | ) | N/A | |||||||||||||||||||||
FedEx Ground segment | 557 | 559 | 1,620 | 1,569 | 610 | 537 | ||||||||||||||||||
FedEx Freight segment | 56 | 67 | 289 | 347 | 135 | 132 | ||||||||||||||||||
Eliminations, corporate and other | (344 | ) | 19 | (526 | ) | 10 | (91 | ) | (70 | ) | ||||||||||||||
|
|
|
|
|
| |||||||||||||||||||
| $ | 864 | $ | 1,038 | $ | 3,145 | $ | 3,188 | $ | 1,264 | $ | 1,144 | |||||||||||||
|
|
|
|
|
| |||||||||||||||||||
- 15 -
(7)Commitments
As of February 29,August 31, 2016, our purchase commitments under various contracts for the remainder of 20162017 and annually thereafter were as follows (in millions):
| Aircraft and Aircraft-Related | Other(1) | Total | Aircraft and Aircraft-Related | Other(1) | Total | |||||||||||||||||||
2016 (remainder) | $ | 94 | $ | 151 | $ | 245 | ||||||||||||||||||
2017 | 1,283 | 291 | 1,574 | |||||||||||||||||||||
2017 (remainder) | $ | 719 | $ | 1,112 | $ | 1,831 | ||||||||||||||||||
2018 | 1,748 | 173 | 1,921 | 1,767 | 463 | 2,230 | ||||||||||||||||||
2019 | 1,569 | 78 | 1,647 | 1,717 | 316 | 2,033 | ||||||||||||||||||
2020 | 1,633 | 26 | 1,659 | 1,925 | 222 | 2,147 | ||||||||||||||||||
2021 | 1,480 | 135 | 1,615 | |||||||||||||||||||||
Thereafter | 5,779 | 102 | 5,881 | 4,191 | 112 | 4,303 | ||||||||||||||||||
|
|
|
|
|
| |||||||||||||||||||
Total | $ | 12,106 | $ | 821 | $ | 12,927 | $ | 11,799 | $ | 2,360 | $ | 14,159 | ||||||||||||
|
|
|
|
|
| |||||||||||||||||||
| (1) | Primarily equipment, advertising contracts and, |
- 15 -
The amounts reflected in the table above for purchase commitments represent noncancelable agreements to purchase goods or services. As of February 29,August 31, 2016, our obligation to purchase fivefour Boeing 767-300 Freighter (“B767F”) aircraft and nineseven Boeing 777 Freighter (“B777F”) aircraft is conditioned upon there being no event that causes FedEx Express or its employees not to be covered by the Railway Labor Act of 1926, as amended. Open purchase orders that are cancelable are not considered unconditional purchase obligations for financial reporting purposes and are not included in the table above.
On June 10, 2016, FedEx Express exercised options to acquire six additional B767F aircraft for delivery in 2019 and 2020.
We had $363$392 million in deposits and progress payments as of February 29,August 31, 2016 on aircraft purchases and other planned aircraft-related transactions. These deposits are classified in the “Other assets” caption of our consolidated balance sheets. Aircraft and aircraft-related contracts are subject to price escalations. The following table is a summary of the key aircraft we are committed to purchase as of February 29,August 31, 2016 with the year of expected delivery:
| B767F | B777F | Total | B767F | B777F | Total | |||||||||||||||||||
2016 (remainder) | 1 | — | 1 | |||||||||||||||||||||
2017 | 12 | — | 12 | |||||||||||||||||||||
2017 (remainder) | 6 | — | 6 | |||||||||||||||||||||
2018 | 16 | 2 | 18 | 16 | 2 | 18 | ||||||||||||||||||
2019 | 13 | 2 | 15 | 15 | 2 | 17 | ||||||||||||||||||
2020 | 12 | 3 | 15 | 16 | 3 | 19 | ||||||||||||||||||
2021 | 10 | 3 | 13 | |||||||||||||||||||||
Thereafter | 26 | 9 | 35 | 16 | 6 | 22 | ||||||||||||||||||
|
|
|
|
|
| |||||||||||||||||||
Total | 80 | 16 | 96 | 79 | 16 | 95 | ||||||||||||||||||
|
|
|
|
|
| |||||||||||||||||||
- 16 -
A summary of future minimum lease payments under noncancelable operating leases with an initial or remaining term in excess of one year at February 29,August 31, 2016 is as follows (in millions):
| Operating Leases | Operating Leases | |||||||||||||||||||||||
| Aircraft and Related Equipment | Facilities and Other | Total Operating Leases | Aircraft and Related Equipment | Facilities and Other | Total Operating Leases | |||||||||||||||||||
2016 (remainder) | $ | 84 | $ | 691 | $ | 775 | ||||||||||||||||||
2017 | 403 | 1,980 | 2,383 | |||||||||||||||||||||
2017 (remainder) | $ | 398 | $ | 1,529 | $ | 1,927 | ||||||||||||||||||
2018 | 332 | 1,583 | 1,915 | 403 | 1,899 | 2,302 | ||||||||||||||||||
2019 | 274 | 1,396 | 1,670 | 345 | 1,673 | 2,018 | ||||||||||||||||||
2020 | 190 | 1,231 | 1,421 | 262 | 1,474 | 1,736 | ||||||||||||||||||
2021 | 204 | 1,329 | 1,533 | |||||||||||||||||||||
Thereafter | 360 | 7,711 | 8,071 | 364 | 8,123 | 8,487 | ||||||||||||||||||
|
|
|
|
|
| |||||||||||||||||||
Total | $ | 1,643 | $ | 14,592 | $ | 16,235 | $ | 1,976 | $ | 16,027 | $ | 18,003 | ||||||||||||
|
|
|
|
|
| |||||||||||||||||||
Future minimum lease payments under capital leases were immaterial at February 29,August 31, 2016. While certain of our lease agreements contain covenants governing the use of the leased assets or require us to maintain certain levels of insurance, none of our lease agreements include material financial covenants or limitations.
(8)Contingencies
Wage-and-Hour. We are a defendant in a number of lawsuits containing various class-action allegations of wage-and-hour violations. The plaintiffs in these lawsuits allege, among other things, that they were forced to work “off the clock,” were not paid overtime or were not provided work breaks or other benefits. The complaints generally seek unspecified monetary damages, injunctive relief, or both. We do not believe that a material loss is reasonably possible with respect to any of these matters.
- 16 -
Independent Contractor — Lawsuits and State Administrative Proceedings. FedEx Ground is involved in numerous class-action lawsuits (including 2524 that have been certified as class actions), individual lawsuits and state tax and other administrative proceedings that claim that the company’s owner-operators under a contractor model no longer in use should behave been treated as employees, rather than independent contractors.
Most of the class-action lawsuits were consolidated for administration of the pre-trial proceedings by a single federal court, the U.S. District Court for the Northern District of Indiana. The multidistrict litigation court granted class certification in 28 cases and denied it in 14 cases. On December 13, 2010, the court entered an opinion and order addressing all outstanding motions for summary judgment on the status of the owner-operators (i.e., independent contractor vs. employee). In sum, the court ruled on our summary judgment motions and entered judgment in favor of FedEx Ground on all claims in 20 of the 28 multidistrict litigation cases that had been certified as class actions, finding that the owner-operators in those cases were contractors as a matter of the law of 20 states. The plaintiffs filed notices of appeal in all of these 20 cases. The Seventh Circuit heard the appeal in the Kansas case in January 2012 and, in July 2012, issued an opinion that did not make a determination with respect to the correctness of the district court’s decision and, instead, certified two questions to the Kansas Supreme Court related to the classification of the plaintiffs as independent contractors under the Kansas Wage Payment Act. The other 19 cases that are before the Seventh Circuit were stayed.
On October 3, 2014, the Kansas Supreme Court determined that a 20 factor right to control test applies to claims under the Kansas Wage Payment Act and concluded that under that test, the class members were employees, not independent contractors. The case was subsequently transferred back to the Seventh Circuit, where both parties made filings requesting the action necessary to complete the resolution of the appeals. The parties also made recommendations to the court regarding next steps for the other 19 cases that are before the Seventh Circuit. FedEx Ground requested that each of those cases be separately briefed given the potential differences in the applicable state law from that in Kansas. On July 8, 2015, the Seventh Circuit issued an order and opinion confirming the decision of the Kansas Supreme Court, concluding that the class members are employees, not independent contractors. Additionally, the Seventh Circuit referred the other 19 cases to a representative of the court for purposes of setting a case management conference to address briefing and argument for those cases.
During the second quarter of 2015, we established an accrual for the estimated probable loss in the Kansas case. In the second quarter of 2016 the Kansas case settled, and we increased the accrual to the amount of the settlement. The settlement will requirerequires court approval.
- 17 -
During the third quarter of 2016, we reached agreements in principle to settle all of the 19 cases on appeal in the multidistrict independent contractor litigation. All of these settlements require court approval. We recognized a liability for the expected loss (net of recognized insurance recovery) related to these cases and certain other pending independent-contractor-related proceedings of $204 million.
The Kansas case was remanded to the multidistrict litigation court, and the other 19 cases remain at the Seventh Circuit; however, approval proceedings will be conducted primarily by the multidistrict litigation court. Plaintiffs filed motions for preliminary approval between June 15 and June 30, 2016, and on August 3 and 4, 2016, the multidistrict litigation court issued orders indicating that it would grant preliminary approval if the Seventh Circuit would remand the cases on appeal for the purpose of entering approval orders. Upon the parties’ joint motion, the Seventh Circuit remanded the cases for this purpose on August 10, 2016, and the multidistrict litigation court entered orders preliminarily approving the settlements on August 17, 2016. Fairness hearings are scheduled for January 23 and 24, 2017.
The multidistrict litigation court remanded the other eight certified class actions back to the district courts where they were originally filed because its summary judgment ruling did not completely dispose of all of the claims in those lawsuits. ThreeFour of these matters settled for immaterial amounts and have received court approval. The casescase in Arkansas and Florida settled in the second quarter of 2016, and we established an accrual in each of these cases for the amount of the settlement. The settlements are subject to court approval. On January 13,granted preliminary approval on September 15, 2016, the court preliminarily approved the settlement of the Florida case and setscheduled a fairnessfinal approval hearing for July 15, 2016. On January 29, 2016, the parties filed their motion for preliminary approval of the settlement in the Arkansas case.March 1, 2017.
Two cases in Oregon and one in California were appealed to the Ninth Circuit Court of Appeals, where the court reversed the district court decisions and held that the plaintiffs in California and Oregon were employees as a matter of law and remanded the cases to their respective district courts for further proceedings. In the first quarter of 2015, we recognized an accrual for the then-estimated probable loss in those cases.
In June 2015, the parties in the California case reached an agreement to settle the matter for $228 million, and in the fourth quarter of 2015 we increased the accrual to that amount. The court has scheduled aentered final approval hearing regardingjudgment on June 20, 2016, and two objectors to the settlement for April 7, 2016.filed appeals with the Ninth Circuit. We expect the appeals to be briefed by the end of the third quarter of 2017 and arguments to be scheduled thereafter. The settlement is not effective until all appeals have been resolved without affecting the court’s approval of the settlement.
- 17 -
The two cases in Oregon were consolidated with a non-multidistrict litigation independent contractor case in Oregon. The three cases collectively settled in the second quarter of 2016, and we increased the accrual in these cases to the amount of the settlement. The settlement is subject towas preliminarily approved on April 20, 2016 and the court approval.set a fairness hearing for October 20, 2016.
In addition, we are defending contractor-model cases that are not or are no longer part of the multidistrict litigation. These cases are in varying stages of litigation. For these cases, weWe do not expect to incur a material loss in these matters; however, it is reasonably possible that potential loss in some of these lawsuits or changes to the independent contractor status of FedEx Ground’s owner-operators could be material. In these cases, we continue to evaluate what facts may arise in the course of discovery and what legal rulings the courts may render and how these facts and rulings might impact FedEx Ground’s loss. For a number of reasons, we are not currently able to estimate a range of reasonably possible loss in these cases. The number and identities of plaintiffs in these lawsuits are uncertain, as they are dependent on how the class of full-time drivers is defined and how many individuals will qualify based on whatever criteria may be established. In addition, the parties have conducted only very limited discovery into damages in certain of these cases, which could vary considerably from plaintiff to plaintiff and be dependent on evidence pertaining to individual plaintiffs, which has yet to be produced in the cases. Further, the range of potential loss could be impacted substantially by future rulings by the court, including on the merits of the claims, on FedEx Ground’s defenses, and on evidentiary issues. As a consequence of these factors, as well as others that are specific to these cases, we are not currently able to estimate a range of reasonably possible loss. We do not believe that a material loss is probable in these matters.
- 18 -
Adverse determinations in matters related to FedEx Ground’s independent contractors, could, among other things, entitle certain of our owner-operators and their drivers to the reimbursement of certain expenses and to the benefit of wage-and-hour laws and result in employment and withholding tax and benefit liability for FedEx Ground. We believe that FedEx Ground’s owner-operators are properly classified as independent contractors and that FedEx Ground is not an employer of the drivers of the company’s independent contractors.
City and State of New York Cigarette Suit.The City of New York (“City”) and the State of New York (“State”) filed two related lawsuits against FedEx Ground in December 2013 and November 2014 arising from FedEx Ground’s alleged shipments of cigarettes to New York residents in contravention of several statutes, including the Racketeer Influenced and Corrupt Organizations Act (“RICO”) and New York’s Public Health Law, as well as common law nuisance claims. In April 2016, the two lawsuits were consolidated and will now proceed as one lawsuit. The firstfirst-filed lawsuit alleges that FedEx Ground provided delivery services on behalf of four shippers, none of which continues to ship in our network. The secondand the second-filed lawsuit alleges that FedEx Ground provided delivery services on behalf of six additional shippers. In March 2015, the court ruled onshippers; none of these shippers continue to ship in our motionnetwork. Pursuant to motions to dismiss filed in the first case, granting our motions to limit the applicable statute of limitations to four years and to dismiss a portion of the claims. The court, however, denied our motion to dismissboth lawsuits, some of the claims includinghave been dismissed entirely or limited. In the RICO claims.first-filed lawsuit, the New York Public Health Law and common law nuisance claims were dismissed and the plaintiffs voluntarily dismissed another claim. In July 2015,the second-filed lawsuit, the court dismissed, without prejudice to plaintiffs’ right to refile the claim at a later date, the New York Public Health Law claim. The plaintiffs have refiled the New York Public Health Law claim, and FedEx Ground has filed a motion to dismiss that claim that is pending with the court. Other claims, including the RICO claims, remain in the second case and the court has not issued its ruling on this motion.both lawsuits. The likelihood of loss is reasonably possible, but the amount of loss cannot be estimated at this stage of the litigation and we expect the amount of any loss to be immaterial.
Environmental Matters. SEC regulations require disclosure of certain environmental matters when a governmental authority is a party to the proceedings and the proceedings involve potential monetary sanctions that management reasonably believes could exceed $100,000.
In February 2014, FedEx GroundOn September 9, 2016, GENCO received oral communicationsa written offer from several District Attorneys’ Offices (representing California’s county environmental authorities) andin California to settle a civil action that the California Attorney General’s Office (representing the California Division of Toxic Substances Control (“DTSC”)) that they were seeking civil penaltiesDistrict Attorneys intend to file against GENCO for alleged violations of the state’s hazardous waste regulations. Specifically, the District Attorneys’ Offices allege GENCO unlawfully disposed of hazardous waste at one of its California environmental authorities alleged that FedEx Ground improperly generates and/or handles, storesfacilities and transportscaused the illegal transportation and disposal of hazardous waste from its stations to its hubsthe retail stores of a GENCO customer at this same facility. The District Attorneys allege these violations began in California. In April 2014, FedEx Ground filed a declaratory judgment action2006 and continued until the facility closed in the United States District Court for the Eastern Districtspring of California against the Director of the California DTSC and the County District Attorneys with whom we have been negotiating. In June 2014, the California Attorney General filed a complaint against FedEx Ground in Sacramento County Superior Court alleging violations by FedEx Ground as described above. The County District Attorneys filed a similar complaint in Sacramento County Superior Court in July 2014. The county and state authorities filed a motion to dismiss FedEx Ground’s declaratory judgment action, and their motion was granted on January 22, 2015. FedEx Ground filed a notice of appeal with the Ninth Circuit Court of Appeals on February 23, 2015.
- 18 -
FedEx Ground and the County District Attorneys reachedWe believe an agreement to resolve all claims between them, and on August 10, 2015, they filed a negotiated final judgment in Sacramento County Superior Court that the court subsequently approved. In the fourth quarter of 2015, we established an accrual for the final judgment amount, which was immaterial. On November 19, 2015, FedEx Ground and the DTSC agreed to settle their dispute, subject to memorializing a consent judgment consistent with the terms FedEx Ground agreed upon with the District Attorneys. We established an accrual for the settlement amount in the second quarter of 2016. This amount was immaterial.
On January 14, 2014, the U.S. Department of Justice (“DOJ”) issued a Grand Jury Subpoena to FedEx Express relating to an asbestos matter previously investigated by the U.S. Environmental Protection Agency. On May 1, 2014, the DOJ informed us that it had determined to continue to pursue the matter as a criminal case, citing seven asbestos-related regulatory violations associated with removal of roof materials from a hangar in Puerto Rico during cleaning and repair activity, as well as violation of waste disposal requirements. Loss is reasonably possible; however, the amount of anyimmaterial loss is expected to be immaterial.
Department of Justice Indictment – Internet Pharmacy Shipments. In the past, we received requests for information from the DOJ in the Northern District of California in connection with a criminal investigation relating to the transportation of packages for online pharmacies that may have shipped pharmaceuticals in violation of federal law. In July 2014, the DOJ filed a criminal indictment in the United States District Court for the Northern District of California in connection with the matter. A superseding indictment was filed in August 2014. The indictment alleges that FedEx Corporation, FedEx Express and FedEx Services, together with certain pharmacies, conspired to unlawfully distribute controlled substances, unlawfully distributed controlled substances and conspired to unlawfully distribute misbranded drugs. The superseding indictment adds conspiracy to launder money counts related to services provided to and payments from online pharmacies. We continue to believe that our employees have acted in good faith at all times and that we have not engaged in any illegal activities.
Accordingly, we will vigorously defend ourselves in this matter. If we are convicted, remedies could include fines, penalties, forfeiture and compliance conditions. Given the stage of this proceeding, we cannot estimate the amount or range of loss, if any; however, it is reasonably possible that it could be material if we are convicted.
Other Matters. On June 30, 2014, we received a Statement of Objections from the French Competition Authority (“FCA”) addressed to FedEx Express France, formerly known as TATEX, regarding an investigation by the FCA into anticompetitive behavior that is alleged to have occurred primarily in the framework of trade association meetings that included the former general managers of TATEX prior to our acquisition of that company in July 2012. In September 2014, FedEx Express France submitted its observations in response to the Statement of Objections to the FCA. In April 2015, the FCA issued a report responding to the observations submitted by all companies involved in the investigation. We submitted an answer to the FCA’s report in early July. In the fourth quarter of 2015, we established an accrual for the estimated probable loss. This amount was immaterial.
A hearing in this matter before the Board of the FCA occurred on September 30, 2015. On December 15, 2015, the FCA announced its decision and related fines against all companies involved in the investigation. FedEx Express France was fined €17 million.is probable. The District Attorneys are also investigating GENCO’s hazardous waste activities at eight additional facilities within California. We did not appeal the FCA decision. In the third quarter of 2016, we increased the accrual to that amount ($19 million). We plan towill pursue all available remedies against the sellers of TATEXGENCO to recover ourany losses in this matter.these matters.
The U.S. Customs and Border Protection (the “CBP”) previously notified FedEx Trade Networks that it would be reviewing certain customs entries made at U.S. ports from 2008 to December 2013. In November 2015, the CBP notified FedEx Trade Networks that it may be liable for $76 million to $210 million in estimated uncollected duties and merchandising processing fees. On January 4, 2016, FedEx Trade Networks submitted an offer of compromise to the CBP to resolve the company’s potential liability from December 24, 2008 through January 4, 2016. On February 19, 2016, CBP informed FedEx Trade Networks that it accepted the offer of compromise, and we recognized a liability (net of recognized insurance recovery) in the amount of $69 million.
- 19 -
FedEx and its subsidiaries are subject to other legal proceedings that arise in the ordinary course of their business.business, including certain lawsuits containing various class-action allegations of wage-and-hour violations in which plaintiffs claim, among other things, that they were forced to work “off the clock,” were not paid overtime or were not provided work breaks or other benefits. In the opinion of management, the aggregate liability, if any, with respect to these other actions will not have a material adverse effect on our financial position, results of operations or cash flows.
- 19 -
(9)Supplemental Cash Flow Information
Cash paid for interest expense and income taxes for the nine-monththree-month periods ended February 29, 2016 and February 28, 2015August 31 was as follows (in millions):
| 2016 | 2015 | 2016 | 2015 | |||||||||||||
Cash payments for: | ||||||||||||||||
Interest (net of capitalized interest) | $ | 284 | $ | 196 | $ | 143 | $ | 139 | ||||||||
|
|
|
| |||||||||||||
Income taxes | $ | 919 | $ | 859 | $ | 80 | $ | 115 | ||||||||
Income tax refunds received | (3 | ) | (7 | ) | (8 | ) | (2 | ) | ||||||||
|
|
|
| |||||||||||||
Cash tax payments, net | $ | 916 | $ | 852 | $ | 72 | $ | 113 | ||||||||
|
|
|
| |||||||||||||
(10)Condensed Consolidating Financial Statements
We are required to present condensed consolidating financial information in order for the subsidiary guarantors of our public debt to continue to be exempt from reporting under the Securities Exchange Act of 1934, as amended. FedEx Express, however, currently files reports under such act with respect to certain indebtedness previously issued under registration statements filed by FedEx Express with the SEC.
The guarantor subsidiaries, which are 100%wholly owned by FedEx, guarantee $8.25$13.6 billion of our debt. The guarantees are full and unconditional and joint and several. Our guarantor subsidiaries were not determined using geographic, service line or other similar criteria, and as a result, the “Guarantor Subsidiaries” and “Non-guarantor Subsidiaries” columns each include portions of our domestic and international operations. Accordingly, this basis of presentation is not intended to present our financial condition, results of operations or cash flows for any purpose other than to comply with the specific requirements for subsidiary guarantor reporting. Prior year amounts have been recast to conform to the pension accounting changes as discussed in our Annual Report.
- 20 -
Condensed consolidating financial statements for our guarantor subsidiaries and non-guarantor subsidiaries are presented in the following tables (in millions):
CONDENSED CONSOLIDATING BALANCE SHEETS
(UNAUDITED)
February 29,August 31, 2016
| Parent | Guarantor Subsidiaries | Non-guarantor Subsidiaries | Eliminations | Consolidated | Parent | Guarantor Subsidiaries | Non-guarantor Subsidiaries | Eliminations | Consolidated | |||||||||||||||||||||||||||||||
ASSETS | ||||||||||||||||||||||||||||||||||||||||
CURRENT ASSETS | ||||||||||||||||||||||||||||||||||||||||
Cash and cash equivalents | $ | 1,498 | $ | 331 | $ | 1,044 | $ | (32 | ) | $ | 2,841 | $ | 1,308 | $ | 327 | $ | 1,391 | $ | (37 | ) | $ | 2,989 | ||||||||||||||||||
Receivables, less allowances | 20 | 4,415 | 1,246 | (47 | ) | 5,634 | 1 | 4,517 | 2,760 | (45 | ) | 7,233 | ||||||||||||||||||||||||||||
Spare parts, supplies, fuel, prepaid expenses and other, less allowances | 298 | 730 | 126 | — | 1,154 | 74 | 839 | 266 | — | 1,179 | ||||||||||||||||||||||||||||||
Deferred income taxes | — | 571 | 37 | — | 608 | |||||||||||||||||||||||||||||||||||
|
|
|
|
|
|
|
|
|
| |||||||||||||||||||||||||||||||
Total current assets | 1,816 | 6,047 | 2,453 | (79 | ) | 10,237 | 1,383 | 5,683 | 4,417 | (82 | ) | 11,401 | ||||||||||||||||||||||||||||
PROPERTY AND EQUIPMENT, AT COST | 29 | 43,938 | 2,065 | — | 46,032 | 22 | 44,777 | 3,322 | — | 48,121 | ||||||||||||||||||||||||||||||
Less accumulated depreciation and amortization | 24 | 22,334 | 1,122 | — | 23,480 | 17 | 22,061 | 1,239 | — | 23,317 | ||||||||||||||||||||||||||||||
|
|
|
|
|
|
|
|
|
| |||||||||||||||||||||||||||||||
Net property and equipment | 5 | 21,604 | 943 | — | 22,552 | 5 | 22,716 | 2,083 | — | 24,804 | ||||||||||||||||||||||||||||||
INTERCOMPANY RECEIVABLE | — | 1,646 | 1,130 | (2,776 | ) | — | 2,747 | 1,177 | — | (3,924 | ) | — | ||||||||||||||||||||||||||||
GOODWILL | — | 1,571 | 2,193 | — | 3,764 | — | 1,571 | 5,212 | — | 6,783 | ||||||||||||||||||||||||||||||
INVESTMENT IN SUBSIDIARIES | 24,828 | 3,052 | — | (27,880 | ) | — | 25,493 | 3,758 | — | (29,251 | ) | — | ||||||||||||||||||||||||||||
OTHER ASSETS | 2,797 | 802 | 384 | (2,717 | ) | 1,266 | 3,398 | 858 | 1,580 | (3,249 | ) | 2,587 | ||||||||||||||||||||||||||||
|
|
|
|
|
|
|
|
|
| |||||||||||||||||||||||||||||||
| $ | 29,446 | $ | 34,722 | $ | 7,103 | $ | (33,452 | ) | $ | 37,819 | $ | 33,026 | $ | 35,763 | $ | 13,292 | $ | (36,506 | ) | $ | 45,575 | |||||||||||||||||||
|
|
|
|
|
|
|
|
|
| |||||||||||||||||||||||||||||||
LIABILITIES AND STOCKHOLDERS’ INVESTMENT | ||||||||||||||||||||||||||||||||||||||||
CURRENT LIABILITIES | ||||||||||||||||||||||||||||||||||||||||
Current portion of long-term debt | $ | — | $ | 4 | $ | 7 | $ | — | $ | 11 | $ | — | $ | 29 | $ | 18 | $ | — | $ | 47 | ||||||||||||||||||||
Accrued salaries and employee benefits | 58 | 1,201 | 192 | — | 1,451 | 38 | 1,115 | 450 | — | 1,603 | ||||||||||||||||||||||||||||||
Accounts payable | 70 | 1,369 | 664 | (79 | ) | 2,024 | 111 | 1,334 | 1,488 | (82 | ) | 2,851 | ||||||||||||||||||||||||||||
Accrued expenses | 805 | 1,378 | 270 | — | 2,453 | 877 | 1,368 | 728 | — | 2,973 | ||||||||||||||||||||||||||||||
|
|
|
|
|
|
|
|
|
| |||||||||||||||||||||||||||||||
Total current liabilities | 933 | 3,952 | 1,133 | (79 | ) | 5,939 | 1,026 | 3,846 | 2,684 | (82 | ) | 7,474 | ||||||||||||||||||||||||||||
LONG-TERM DEBT, LESS CURRENT PORTION | 8,217 | 248 | 12 | — | 8,477 | 13,458 | 245 | 32 | — | 13,735 | ||||||||||||||||||||||||||||||
INTERCOMPANY PAYABLE | 2,776 | — | — | (2,776 | ) | — | — | — | 3,924 | (3,924 | ) | — | ||||||||||||||||||||||||||||
OTHER LONG-TERM LIABILITIES | ||||||||||||||||||||||||||||||||||||||||
Deferred income taxes | — | 4,583 | 180 | (2,717 | ) | 2,046 | — | 4,645 | 366 | (3,249 | ) | 1,762 | ||||||||||||||||||||||||||||
Other liabilities | 3,193 | 3,577 | 260 | — | 7,030 | 4,400 | 3,420 | 642 | — | 8,462 | ||||||||||||||||||||||||||||||
|
|
|
|
|
|
|
|
|
| |||||||||||||||||||||||||||||||
Total other long-term liabilities | 3,193 | 8,160 | 440 | (2,717 | ) | 9,076 | 4,400 | 8,065 | 1,008 | (3,249 | ) | 10,224 | ||||||||||||||||||||||||||||
STOCKHOLDERS’ INVESTMENT | 14,327 | 22,362 | 5,518 | (27,880 | ) | 14,327 | 14,142 | 23,607 | 5,644 | (29,251 | ) | 14,142 | ||||||||||||||||||||||||||||
|
|
|
|
|
|
|
|
|
| |||||||||||||||||||||||||||||||
| $ | 29,446 | $ | 34,722 | $ | 7,103 | $ | (33,452 | ) | $ | 37,819 | $ | 33,026 | $ | 35,763 | $ | 13,292 | $ | (36,506 | ) | $ | 45,575 | |||||||||||||||||||
|
|
|
|
|
|
|
|
|
| |||||||||||||||||||||||||||||||
- 21 -
CONDENSED CONSOLIDATING BALANCE SHEETS
May 31, 20152016
| Parent | Guarantor Subsidiaries | Non-guarantor Subsidiaries | Eliminations | Consolidated | Parent | Guarantor Subsidiaries | Non- guarantor Subsidiaries | Eliminations | Consolidated | |||||||||||||||||||||||||||||||
ASSETS | ||||||||||||||||||||||||||||||||||||||||
CURRENT ASSETS | ||||||||||||||||||||||||||||||||||||||||
Cash and cash equivalents | $ | 2,383 | $ | 487 | $ | 971 | $ | (78 | ) | $ | 3,763 | $ | 1,974 | $ | 326 | $ | 1,277 | $ | (43 | ) | $ | 3,534 | ||||||||||||||||||
Receivables, less allowances | 3 | 4,383 | 1,385 | (52 | ) | 5,719 | 1 | 4,461 | 2,831 | (41 | ) | 7,252 | ||||||||||||||||||||||||||||
Spare parts, supplies, fuel, prepaid expenses and other, less allowances | 41 | 689 | 123 | — | 853 | 233 | 724 | 246 | — | 1,203 | ||||||||||||||||||||||||||||||
Deferred income taxes | — | 571 | 35 | — | 606 | |||||||||||||||||||||||||||||||||||
|
|
|
|
|
|
|
|
|
| |||||||||||||||||||||||||||||||
Total current assets | 2,427 | 6,130 | 2,514 | (130 | ) | 10,941 | 2,208 | 5,511 | 4,354 | (84 | ) | 11,989 | ||||||||||||||||||||||||||||
PROPERTY AND EQUIPMENT, AT COST | 29 | 40,364 | 2,471 | — | 42,864 | 22 | 43,760 | 3,236 | — | 47,018 | ||||||||||||||||||||||||||||||
Less accumulated depreciation and amortization | 23 | 20,685 | 1,281 | — | 21,989 | 17 | 21,566 | 1,151 | — | 22,734 | ||||||||||||||||||||||||||||||
|
|
|
|
|
|
|
|
|
| |||||||||||||||||||||||||||||||
Net property and equipment | 6 | 19,679 | 1,190 | — | 20,875 | 5 | 22,194 | 2,085 | — | 24,284 | ||||||||||||||||||||||||||||||
INTERCOMPANY RECEIVABLE | — | 686 | 1,563 | (2,249 | ) | — | 2,437 | 1,284 | — | (3,721 | ) | — | ||||||||||||||||||||||||||||
GOODWILL | — | 1,552 | 2,258 | — | 3,810 | — | 1,571 | 5,176 | — | 6,747 | ||||||||||||||||||||||||||||||
INVESTMENT IN SUBSIDIARIES | 23,173 | 3,800 | — | (26,973 | ) | — | 24,766 | 3,697 | — | (28,463 | ) | — | ||||||||||||||||||||||||||||
OTHER ASSETS | 2,752 | 898 | 477 | (2,684 | ) | 1,443 | 3,359 | 967 | 1,851 | (3,238 | ) | 2,939 | ||||||||||||||||||||||||||||
|
|
|
|
|
|
|
|
|
| |||||||||||||||||||||||||||||||
| $ | 28,358 | $ | 32,745 | $ | 8,002 | $ | (32,036 | ) | $ | 37,069 | $ | 32,775 | $ | 35,224 | $ | 13,466 | $ | (35,506 | ) | $ | 45,959 | |||||||||||||||||||
|
|
|
|
|
|
|
|
|
| |||||||||||||||||||||||||||||||
LIABILITIES AND STOCKHOLDERS’ INVESTMENT | ||||||||||||||||||||||||||||||||||||||||
CURRENT LIABILITIES | ||||||||||||||||||||||||||||||||||||||||
Current portion of long-term debt | $ | — | $ | 7 | $ | 12 | $ | — | $ | 19 | $ | — | $ | 13 | $ | 16 | $ | — | $ | 29 | ||||||||||||||||||||
Accrued salaries and employee benefits | 34 | 1,208 | 194 | — | 1,436 | 54 | 1,377 | 541 | — | 1,972 | ||||||||||||||||||||||||||||||
Accounts payable | 5 | 1,433 | 758 | (130 | ) | 2,066 | 8 | 1,501 | 1,519 | (84 | ) | 2,944 | ||||||||||||||||||||||||||||
Accrued expenses | 604 | 1,557 | 275 | — | 2,436 | 883 | 1,411 | 769 | — | 3,063 | ||||||||||||||||||||||||||||||
|
|
|
|
|
|
|
|
|
| |||||||||||||||||||||||||||||||
Total current liabilities | 643 | 4,205 | 1,239 | (130 | ) | 5,957 | 945 | 4,302 | 2,845 | (84 | ) | 8,008 | ||||||||||||||||||||||||||||
LONG-TERM DEBT, LESS CURRENT PORTION | 6,978 | 248 | 23 | — | 7,249 | 13,451 | 245 | 37 | — | 13,733 | ||||||||||||||||||||||||||||||
INTERCOMPANY PAYABLE | 2,249 | — | — | (2,249 | ) | — | — | — | 3,721 | (3,721 | ) | — | ||||||||||||||||||||||||||||
OTHER LONG-TERM LIABILITIES | ||||||||||||||||||||||||||||||||||||||||
Deferred income taxes | — | 4,206 | 225 | (2,684 | ) | 1,747 | — | 4,436 | 369 | (3,238 | ) | 1,567 | ||||||||||||||||||||||||||||
Other liabilities | 3,495 | 3,367 | 261 | — | 7,123 | 4,595 | 3,375 | 897 | — | 8,867 | ||||||||||||||||||||||||||||||
|
|
|
|
|
|
|
|
|
| |||||||||||||||||||||||||||||||
Total other long-term liabilities | 3,495 | 7,573 | 486 | (2,684 | ) | 8,870 | 4,595 | 7,811 | 1,266 | (3,238 | ) | 10,434 | ||||||||||||||||||||||||||||
STOCKHOLDERS’ INVESTMENT | 14,993 | 20,719 | 6,254 | (26,973 | ) | 14,993 | 13,784 | 22,866 | 5,597 | (28,463 | ) | 13,784 | ||||||||||||||||||||||||||||
|
|
|
|
|
|
|
|
|
| |||||||||||||||||||||||||||||||
| $ | 28,358 | $ | 32,745 | $ | 8,002 | $ | (32,036 | ) | $ | 37,069 | $ | 32,775 | $ | 35,224 | $ | 13,466 | $ | (35,506 | ) | $ | 45,959 | |||||||||||||||||||
|
|
|
|
|
|
|
|
|
| |||||||||||||||||||||||||||||||
- 22 -
CONDENSED CONSOLIDATING STATEMENTS OF COMPREHENSIVE INCOME
(UNAUDITED)
Three Months Ended February 29,August 31, 2016
| Parent | Guarantor Subsidiaries | Non-guarantor Subsidiaries | Eliminations | Consolidated | ||||||||||||||||
REVENUES | $ | — | $ | 10,838 | $ | 1,892 | $ | (76 | ) | $ | 12,654 | |||||||||
OPERATING EXPENSES: | ||||||||||||||||||||
Salaries and employee benefits | 32 | 4,072 | 608 | — | 4,712 | |||||||||||||||
Purchased transportation | — | 2,106 | 545 | (28 | ) | 2,623 | ||||||||||||||
Rentals and landing fees | 1 | 660 | 84 | (1 | ) | 744 | ||||||||||||||
Depreciation and amortization | — | 608 | 55 | — | 663 | |||||||||||||||
Fuel | — | 520 | 17 | — | 537 | |||||||||||||||
Maintenance and repairs | — | 471 | 33 | — | 504 | |||||||||||||||
Intercompany charges, net | (344 | ) | 294 | 50 | — | — | ||||||||||||||
Other | 311 | 1,344 | 399 | (47 | ) | 2,007 | ||||||||||||||
|
|
|
|
|
|
|
|
|
| |||||||||||
| — | 10,075 | 1,791 | (76 | ) | 11,790 | |||||||||||||||
|
|
|
|
|
|
|
|
|
| |||||||||||
OPERATING INCOME | — | 763 | 101 | — | 864 | |||||||||||||||
OTHER INCOME (EXPENSE): | ||||||||||||||||||||
Equity in earnings of subsidiaries | 507 | 86 | — | (593 | ) | — | ||||||||||||||
Interest, net | (90 | ) | 6 | 3 | — | (81 | ) | |||||||||||||
Intercompany charges, net | 95 | (105 | ) | 10 | — | — | ||||||||||||||
Other, net | (5 | ) | (1 | ) | 5 | — | (1 | ) | ||||||||||||
|
|
|
|
|
|
|
|
|
| |||||||||||
INCOME BEFORE INCOME TAXES | 507 | 749 | 119 | (593 | ) | 782 | ||||||||||||||
Provision for income taxes | — | 249 | 26 | — | 275 | |||||||||||||||
|
|
|
|
|
|
|
|
|
| |||||||||||
NET INCOME | $ | 507 | $ | 500 | $ | 93 | $ | (593 | ) | $ | 507 | |||||||||
|
|
|
|
|
|
|
|
|
| |||||||||||
COMPREHENSIVE INCOME | $ | 488 | $ | 487 | $ | 7 | $ | (593 | ) | $ | 389 | |||||||||
|
|
|
|
|
|
|
|
|
| |||||||||||
CONDENSED CONSOLIDATING STATEMENTS OF COMPREHENSIVE INCOME
(UNAUDITED)
Three Months Ended February 28, 2015
(As Adjusted)
| Parent | Guarantor Subsidiaries | Non-guarantor Subsidiaries | Eliminations | Consolidated | Parent | Guarantor Subsidiaries | Non-guarantor Subsidiaries | Eliminations | Consolidated | |||||||||||||||||||||||||||||||
REVENUES | $ | — | $ | 9,793 | $ | 2,024 | $ | (101 | ) | $ | 11,716 | $ | — | $ | 10,903 | $ | 3,830 | $ | (70 | ) | $ | 14,663 | ||||||||||||||||||
OPERATING EXPENSES: | ||||||||||||||||||||||||||||||||||||||||
Salaries and employee benefits | 25 | 3,712 | 598 | — | 4,335 | 36 | 4,106 | 1,169 | — | 5,311 | ||||||||||||||||||||||||||||||
Purchased transportation | — | 1,527 | 695 | (57 | ) | 2,165 | — | 1,917 | 1,351 | (28 | ) | 3,240 | ||||||||||||||||||||||||||||
Rentals and landing fees | 1 | 597 | 89 | (1 | ) | 686 | 1 | 620 | 170 | (1 | ) | 790 | ||||||||||||||||||||||||||||
Depreciation and amortization | — | 593 | 59 | — | 652 | — | 611 | 128 | — | 739 | ||||||||||||||||||||||||||||||
Fuel | — | 790 | 20 | — | 810 | — | 578 | 72 | — | 650 | ||||||||||||||||||||||||||||||
Maintenance and repairs | — | 468 | 37 | — | 505 | — | 526 | 72 | — | 598 | ||||||||||||||||||||||||||||||
Intercompany charges, net | (48) | (34 | ) | 82 | — | — | (90 | ) | 62 | 28 | — | — | ||||||||||||||||||||||||||||
Other | 22 | 1,231 | 315 | (43 | ) | 1,525 | 53 | 1,373 | 686 | (41 | ) | 2,071 | ||||||||||||||||||||||||||||
|
|
|
|
|
|
|
|
|
| |||||||||||||||||||||||||||||||
| — | 8,884 | 1,895 | (101 | ) | 10,678 | — | 9,793 | 3,676 | (70 | ) | 13,399 | |||||||||||||||||||||||||||||
|
|
|
|
|
|
|
|
|
| |||||||||||||||||||||||||||||||
OPERATING INCOME | — | 909 | 129 | — | 1,038 | — | 1,110 | 154 | — | 1,264 | ||||||||||||||||||||||||||||||
OTHER INCOME (EXPENSE): | ||||||||||||||||||||||||||||||||||||||||
Equity in earnings of subsidiaries | 628 | 91 | — | (719 | ) | — | 715 | 56 | — | (771 | ) | — | ||||||||||||||||||||||||||||
Interest, net | (66 | ) | 6 | 2 | — | (58 | ) | (122 | ) | 9 | — | — | (113 | ) | ||||||||||||||||||||||||||
Intercompany charges, net | 68 | (74 | ) | 6 | — | — | 122 | (81 | ) | (41 | ) | — | — | |||||||||||||||||||||||||||
Other, net | (2 | ) | (4 | ) | 11 | — | 5 | — | (5 | ) | (4 | ) | — | (9 | ) | |||||||||||||||||||||||||
|
|
|
|
|
|
|
|
|
| |||||||||||||||||||||||||||||||
INCOME BEFORE INCOME TAXES | 628 | 928 | 148 | (719 | ) | 985 | 715 | 1,089 | 109 | (771 | ) | 1,142 | ||||||||||||||||||||||||||||
Provision for income taxes | — | 274 | 83 | — | 357 | — | 380 | 47 | — | 427 | ||||||||||||||||||||||||||||||
|
|
|
|
|
|
|
|
|
| |||||||||||||||||||||||||||||||
NET INCOME | $ | 628 | $ | 654 | $ | 65 | $ | (719 | ) | $ | 628 | $ | 715 | $ | 709 | $ | 62 | $ | (771 | ) | $ | 715 | ||||||||||||||||||
|
|
|
|
|
|
|
|
|
| |||||||||||||||||||||||||||||||
COMPREHENSIVE INCOME | $ | 611 | $ | 640 | $ | (74 | ) | $ | (719 | ) | $ | 458 | $ | 696 | $ | 702 | $ | 81 | $ | (771 | ) | $ | 708 | |||||||||||||||||
|
|
|
|
|
|
|
|
|
| |||||||||||||||||||||||||||||||
CONDENSED CONSOLIDATING STATEMENTS OF COMPREHENSIVE INCOME (UNAUDITED) Three Months Ended August 31, 2015
|
CONDENSED CONSOLIDATING STATEMENTS OF COMPREHENSIVE INCOME (UNAUDITED) Three Months Ended August 31, 2015
|
| ||||||||||||||||||||||||||||||||||||||
| Parent | Guarantor Subsidiaries | Non-guarantor Subsidiaries | Eliminations | Consolidated | ||||||||||||||||||||||||||||||||||||
REVENUES | $ | — | $ | 9,873 | $ | 2,509 | $ | (103 | ) | $ | 12,279 | |||||||||||||||||||||||||||||
OPERATING EXPENSES: | ||||||||||||||||||||||||||||||||||||||||
Salaries and employee benefits | 34 | 3,813 | 678 | — | 4,525 | |||||||||||||||||||||||||||||||||||
Purchased transportation | — | 1,434 | 965 | (55 | ) | 2,344 | ||||||||||||||||||||||||||||||||||
Rentals and landing fees | 1 | 587 | 108 | (1 | ) | 695 | ||||||||||||||||||||||||||||||||||
Depreciation and amortization | — | 583 | 65 | — | 648 | |||||||||||||||||||||||||||||||||||
Fuel | — | 691 | 21 | — | 712 | |||||||||||||||||||||||||||||||||||
Maintenance and repairs | — | 508 | 40 | — | 548 | |||||||||||||||||||||||||||||||||||
Intercompany charges, net | (69 | ) | (40 | ) | 109 | — | — | |||||||||||||||||||||||||||||||||
Other | 34 | 1,264 | 412 | (47 | ) | 1,663 | ||||||||||||||||||||||||||||||||||
|
|
|
|
| ||||||||||||||||||||||||||||||||||||
| — | 8,840 | 2,398 | (103 | ) | 11,135 | |||||||||||||||||||||||||||||||||||
|
|
|
|
| ||||||||||||||||||||||||||||||||||||
OPERATING INCOME | — | 1,033 | 111 | — | 1,144 | |||||||||||||||||||||||||||||||||||
OTHER INCOME (EXPENSE): | ||||||||||||||||||||||||||||||||||||||||
Equity in earnings of subsidiaries | 692 | 61 | — | (753 | ) | — | ||||||||||||||||||||||||||||||||||
Interest, net | (75 | ) | 8 | 4 | — | (63 | ) | |||||||||||||||||||||||||||||||||
Intercompany charges, net | 78 | (76 | ) | (2 | ) | — | — | |||||||||||||||||||||||||||||||||
Other, net | (3 | ) | (3 | ) | 9 | — | 3 | |||||||||||||||||||||||||||||||||
|
|
|
|
| ||||||||||||||||||||||||||||||||||||
INCOME BEFORE INCOME TAXES | 692 | 1,023 | 122 | (753 | ) | 1,084 | ||||||||||||||||||||||||||||||||||
Provision for income taxes | — | 357 | 35 | — | 392 | |||||||||||||||||||||||||||||||||||
|
|
|
|
| ||||||||||||||||||||||||||||||||||||
NET INCOME | $ | 692 | $ | 666 | $ | 87 | $ | (753 | ) | $ | 692 | |||||||||||||||||||||||||||||
|
|
|
|
| ||||||||||||||||||||||||||||||||||||
COMPREHENSIVE INCOME | $ | 674 | $ | 651 | $ | (42 | ) | $ | (753 | ) | $ | 530 | ||||||||||||||||||||||||||||
|
|
|
|
| ||||||||||||||||||||||||||||||||||||
- 23 -
CONDENSED CONSOLIDATING STATEMENTS OF COMPREHENSIVE INCOMECASH FLOWS
(UNAUDITED)
NineThree Months Ended February 29,August 31, 2016
| Parent | Guarantor Subsidiaries | Non-guarantor Subsidiaries | Eliminations | Consolidated | ||||||||||||||||
REVENUES | $ | — | $ | 31,190 | $ | 6,449 | $ | (253 | ) | $ | 37,386 | |||||||||
OPERATING EXPENSES: | ||||||||||||||||||||
Salaries and employee benefits | 92 | 11,811 | 1,904 | — | 13,807 | |||||||||||||||
Purchased transportation | — | 5,481 | 2,132 | (108 | ) | 7,505 | ||||||||||||||
Rentals and landing fees | 4 | 1,843 | 278 | (4 | ) | 2,121 | ||||||||||||||
Depreciation and amortization | 1 | 1,792 | 171 | — | 1,964 | |||||||||||||||
Fuel | — | 1,808 | 56 | — | 1,864 | |||||||||||||||
Maintenance and repairs | — | 1,476 | 105 | — | 1,581 | |||||||||||||||
Intercompany charges, net | (525 | ) | 338 | 187 | — | — | ||||||||||||||
Other | 428 | 3,901 | 1,211 | (141 | ) | 5,399 | ||||||||||||||
|
|
|
|
|
|
|
|
|
| |||||||||||
| — | 28,450 | 6,044 | (253 | ) | 34,241 | |||||||||||||||
|
|
|
|
|
|
|
|
|
| |||||||||||
OPERATING INCOME | — | 2,740 | 405 | — | 3,145 | |||||||||||||||
OTHER INCOME (EXPENSE): | ||||||||||||||||||||
Equity in earnings of subsidiaries | 1,890 | 220 | — | (2,110 | ) | — | ||||||||||||||
Interest, net | (246 | ) | 20 | 8 | — | (218 | ) | |||||||||||||
Intercompany charges, net | 257 | (264 | ) | 7 | — | — | ||||||||||||||
Other, net | (11 | ) | (10 | ) | 15 | — | (6 | ) | ||||||||||||
|
|
|
|
|
|
|
|
|
| |||||||||||
INCOME BEFORE INCOME TAXES | 1,890 | 2,706 | 435 | (2,110 | ) | 2,921 | ||||||||||||||
Provision for income taxes | — | 915 | 116 | — | 1,031 | |||||||||||||||
|
|
|
|
|
|
|
|
|
| |||||||||||
NET INCOME | $ | 1,890 | $ | 1,791 | $ | 319 | $ | (2,110 | ) | $ | 1,890 | |||||||||
|
|
|
|
|
|
|
|
|
| |||||||||||
COMPREHENSIVE INCOME | $ | 1,834 | $ | 1,758 | $ | 77 | $ | (2,110 | ) | $ | 1,559 | |||||||||
|
|
|
|
|
|
|
|
|
| |||||||||||
CONDENSED CONSOLIDATING STATEMENTS OF COMPREHENSIVE INCOME
(UNAUDITED)
Nine Months Ended February 28, 2015
(As Adjusted)
| Parent | Guarantor Subsidiaries | Non-guarantor Subsidiaries | Eliminations | Consolidated | ||||||||||||||||
REVENUES | $ | — | $ | 29,488 | $ | 6,136 | $ | (285 | ) | $ | 35,339 | |||||||||
OPERATING EXPENSES: | ||||||||||||||||||||
Salaries and employee benefits | 78 | 10,902 | 1,698 | — | 12,678 | |||||||||||||||
Purchased transportation | — | 4,381 | 2,170 | (147 | ) | 6,404 | ||||||||||||||
Rentals and landing fees | 4 | 1,746 | 263 | (4 | ) | 2,009 | ||||||||||||||
Depreciation and amortization | 1 | 1,783 | 170 | — | 1,954 | |||||||||||||||
Fuel | — | 2,913 | 69 | — | 2,982 | |||||||||||||||
Maintenance and repairs | — | 1,497 | 107 | — | 1,604 | |||||||||||||||
Intercompany charges, net | (191 | ) | (82 | ) | 273 | — | — | |||||||||||||
Other | 108 | 3,635 | 911 | (134 | ) | 4,520 | ||||||||||||||
|
|
|
|
|
|
|
|
|
| |||||||||||
| — | 26,775 | 5,661 | (285 | ) | 32,151 | |||||||||||||||
|
|
|
|
|
|
|
|
|
| |||||||||||
OPERATING INCOME | — | 2,713 | 475 | — | 3,188 | |||||||||||||||
OTHER INCOME (EXPENSE): | ||||||||||||||||||||
Equity in earnings of subsidiaries | 1,944 | 292 | — | (2,236 | ) | — | ||||||||||||||
Interest, net | (172 | ) | 15 | 4 | — | (153 | ) | |||||||||||||
Intercompany charges, net | 176 | (192 | ) | 16 | — | — | ||||||||||||||
Other, net | (4 | ) | (5 | ) | 17 | — | 8 | |||||||||||||
|
|
|
|
|
|
|
|
|
| |||||||||||
INCOME BEFORE INCOME TAXES | 1,944 | 2,823 | 512 | (2,236 | ) | 3,043 | ||||||||||||||
Provision for income taxes | — | 916 | 183 | — | 1,099 | |||||||||||||||
|
|
|
|
|
|
|
|
|
| |||||||||||
NET INCOME | $ | 1,944 | $ | 1,907 | $ | 329 | $ | (2,236 | ) | $ | 1,944 | |||||||||
|
|
|
|
|
|
|
|
|
| |||||||||||
COMPREHENSIVE INCOME | $ | 1,891 | $ | 1,864 | $ | 68 | $ | (2,236 | ) | $ | 1,587 | |||||||||
|
|
|
|
|
|
|
|
|
| |||||||||||
| Parent | Guarantor Subsidiaries | Non- guarantor Subsidiaries | Eliminations | Consolidated | ||||||||||||||||
CASH PROVIDED BY (USED IN) OPERATING ACTIVITIES | $ | (342 | ) | $ | 1,119 | $ | 188 | $ | 6 | $ | 971 | |||||||||
INVESTING ACTIVITIES | ||||||||||||||||||||
Capital expenditures | — | (1,111 | ) | (104 | ) | — | (1,215 | ) | ||||||||||||
Proceeds from asset dispositions and other | — | 9 | — | — | 9 | |||||||||||||||
|
|
|
|
|
|
|
|
|
| |||||||||||
CASH USED IN INVESTING ACTIVITIES | — | (1,102 | ) | (104 | ) | — | (1,206 | ) | ||||||||||||
FINANCING ACTIVITIES | ||||||||||||||||||||
Net transfers from (to) Parent | (35 | ) | (2 | ) | 37 | — | — | |||||||||||||
Payment on loan between subsidiaries | (2 | ) | (14 | ) | 16 | — | — | |||||||||||||
Principal payments on debt | — | (7 | ) | (5 | ) | — | (12 | ) | ||||||||||||
Proceeds from stock issuances | 40 | — | — | — | 40 | |||||||||||||||
Excess tax benefit on the exercise of stock options | 2 | — | — | — | 2 | |||||||||||||||
Dividends paid | (106 | ) | — | — | — | (106 | ) | |||||||||||||
Purchase of treasury stock | (222 | ) | — | — | — | (222 | ) | |||||||||||||
Other, net | (1 | ) | (1 | ) | (13 | ) | — | (15 | ) | |||||||||||
|
|
|
|
|
|
|
|
|
| |||||||||||
CASH (USED IN) PROVIDED BY FINANCING ACTIVITIES | (324 | ) | (24 | ) | 35 | — | (313 | ) | ||||||||||||
|
|
|
|
|
|
|
|
|
| |||||||||||
Effect of exchange rate changes on cash | — | 8 | (5 | ) | — | 3 | ||||||||||||||
|
|
|
|
|
|
|
|
|
| |||||||||||
Net (decrease) increase in cash and cash equivalents | (666 | ) | 1 | 114 | 6 | (545 | ) | |||||||||||||
Cash and cash equivalents at beginning of period | 1,974 | 326 | 1,277 | (43 | ) | 3,534 | ||||||||||||||
|
|
|
|
|
|
|
|
|
| |||||||||||
Cash and cash equivalents at end of period | $ | 1,308 | $ | 327 | $ | 1,391 | $ | (37 | ) | $ | 2,989 | |||||||||
|
|
|
|
|
|
|
|
|
| |||||||||||
- 24 -
CONDENSED CONSOLIDATING STATEMENTS OF CASH FLOWS
(UNAUDITED)
Nine Months Ended February 29, 2016
CONDENSED CONSOLIDATING STATEMENTS OF CASH FLOWS (UNAUDITED) Three Months Ended August 31, 2015
| CONDENSED CONSOLIDATING STATEMENTS OF CASH FLOWS (UNAUDITED) Three Months Ended August 31, 2015
|
| ||||||||||||||||||||||||||||||||||||||
| Parent | Guarantor Subsidiaries | Non- guarantor Subsidiaries | Eliminations | Consolidated | Parent | Guarantor Subsidiaries | Non- guarantor Subsidiaries | Eliminations | Consolidated | |||||||||||||||||||||||||||||||
CASH PROVIDED BY (USED IN) OPERATING ACTIVITIES | $ | (833 | ) | $ | 4,213 | $ | 370 | $ | 46 | $ | 3,796 | $ | (397 | ) | $ | 1,533 | $ | 71 | $ | 34 | $ | 1,241 | ||||||||||||||||||
INVESTING ACTIVITIES | ||||||||||||||||||||||||||||||||||||||||
Capital expenditures | — | (3,434 | ) | (128 | ) | — | (3,562 | ) | — | (1,170 | ) | (39 | ) | — | (1,209 | ) | ||||||||||||||||||||||||
Asset dispositions and other | (55 | ) | 26 | 12 | — | (17 | ) | |||||||||||||||||||||||||||||||||
Proceeds from asset dispositions and other | (5 | ) | 15 | — | — | 10 | ||||||||||||||||||||||||||||||||||
|
|
|
|
|
|
|
|
|
| |||||||||||||||||||||||||||||||
CASH USED IN INVESTING ACTIVITIES | (55 | ) | (3,408 | ) | (116 | ) | — | (3,579 | ) | (5 | ) | (1,155 | ) | (39 | ) | — | (1,199 | ) | ||||||||||||||||||||||
FINANCING ACTIVITIES | ||||||||||||||||||||||||||||||||||||||||
Net transfers from (to) Parent | 1,036 | (1,039 | ) | 3 | — | — | 452 | (479 | ) | 27 | — | — | ||||||||||||||||||||||||||||
Payment on loan between subsidiaries | — | 109 | (109 | ) | — | — | — | 98 | (98 | ) | — | — | ||||||||||||||||||||||||||||
Intercompany dividends | — | 20 | (20 | ) | — | — | — | 4 | (4 | ) | — | — | ||||||||||||||||||||||||||||
Principal payments on debt | — | (7 | ) | (21 | ) | — | (28 | ) | — | (2 | ) | (13 | ) | — | (15 | ) | ||||||||||||||||||||||||
Proceeds from debt issuance | 1,238 | — | — | — | 1,238 | |||||||||||||||||||||||||||||||||||
Proceeds from stock issuances | 79 | — | — | — | 79 | 46 | — | — | — | 46 | ||||||||||||||||||||||||||||||
Excess tax benefit on the exercise of stock options | 9 | — | — | — | 9 | 6 | — | — | — | 6 | ||||||||||||||||||||||||||||||
Dividends paid | (210 | ) | — | — | — | (210 | ) | (71 | ) | — | — | — | (71 | ) | ||||||||||||||||||||||||||
Purchase of treasury stock | (2,133 | ) | — | — | — | (2,133 | ) | (190 | ) | — | — | — | (190 | ) | ||||||||||||||||||||||||||
Other, net | (16 | ) | (27 | ) | 27 | — | (16 | ) | — | (25 | ) | 25 | — | — | ||||||||||||||||||||||||||
|
|
|
|
|
|
|
|
|
| |||||||||||||||||||||||||||||||
CASH (USED IN) PROVIDED BY FINANCING ACTIVITIES | 3 | (944 | ) | (120 | ) | — | (1,061 | ) | 243 | (404 | ) | (63 | ) | — | (224 | ) | ||||||||||||||||||||||||
|
|
|
|
|
|
|
|
|
| |||||||||||||||||||||||||||||||
Effect of exchange rate changes on cash | — | (17 | ) | (61 | ) | — | (78 | ) | — | (15 | ) | (23 | ) | — | (38 | ) | ||||||||||||||||||||||||
|
|
|
|
|
|
|
|
|
| |||||||||||||||||||||||||||||||
Net (decrease) increase in cash and cash equivalents | (885 | ) | (156 | ) | 73 | 46 | (922 | ) | (159 | ) | (41 | ) | (54 | ) | 34 | (220 | ) | |||||||||||||||||||||||
Cash and cash equivalents at beginning of period | 2,383 | 487 | 971 | (78 | ) | 3,763 | 2,383 | 487 | 971 | (78 | ) | 3,763 | ||||||||||||||||||||||||||||
|
|
|
|
|
|
|
|
|
| |||||||||||||||||||||||||||||||
Cash and cash equivalents at end of period | $ | 1,498 | $ | 331 | $ | 1,044 | $ | (32 | ) | $ | 2,841 | $ | 2,224 | $ | 446 | $ | 917 | $ | (44 | ) | $ | 3,543 | ||||||||||||||||||
|
|
|
|
|
|
|
|
|
| |||||||||||||||||||||||||||||||
- 25 -
CONDENSED CONSOLIDATING STATEMENTS OF CASH FLOWS
(UNAUDITED)
Nine Months Ended February 28, 2015
| Parent | Guarantor Subsidiaries | Non- guarantor Subsidiaries | Eliminations | Consolidated | ||||||||||||||||
CASH PROVIDED BY (USED IN) OPERATING ACTIVITIES | $ | (460 | ) | $ | 3,443 | $ | 382 | $ | 108 | $ | 3,473 | |||||||||
INVESTING ACTIVITIES | ||||||||||||||||||||
Capital expenditures | (1 | ) | (2,849 | ) | (119 | ) | — | (2,969 | ) | |||||||||||
Business acquisitions, net of cash acquired | (1,429 | ) | — | — | — | (1,429 | ) | |||||||||||||
Asset dispositions and other | — | 35 | (19 | ) | — | 16 | ||||||||||||||
|
|
|
|
|
|
|
|
|
| |||||||||||
CASH USED IN INVESTING ACTIVITIES | (1,430 | ) | (2,814 | ) | (138 | ) | — | (4,382 | ) | |||||||||||
FINANCING ACTIVITIES | ||||||||||||||||||||
Net transfers from (to) Parent | 692 | (681 | ) | (11 | ) | — | — | |||||||||||||
Payment on loan between subsidiaries | — | 202 | (202 | ) | — | — | ||||||||||||||
Intercompany dividends | — | 38 | (38 | ) | — | — | ||||||||||||||
Principal payments on debt | — | (1 | ) | — | — | (1 | ) | |||||||||||||
Proceeds from debt issuance | 2,491 | — | — | — | 2,491 | |||||||||||||||
Proceeds from stock issuances | 272 | — | — | — | 272 | |||||||||||||||
Excess tax benefit on the exercise of stock options | 31 | — | — | — | 31 | |||||||||||||||
Dividends paid | (171 | ) | — | — | — | (171 | ) | |||||||||||||
Purchase of treasury stock | (1,016 | ) | — | — | — | (1,016 | ) | |||||||||||||
Other, net | (23 | ) | (105 | ) | 105 | (23 | ) | |||||||||||||
|
|
|
|
|
|
|
|
|
| |||||||||||
CASH PROVIDED BY (USED IN) FINANCING ACTIVITIES | 2,276 | (547 | ) | (146 | ) | — | 1,583 | |||||||||||||
|
|
|
|
|
|
|
|
|
| |||||||||||
Effect of exchange rate changes on cash | — | (31 | ) | (73 | ) | — | (104 | ) | ||||||||||||
|
|
|
|
|
|
|
|
|
| |||||||||||
Net increase in cash and cash equivalents | 386 | 51 | 25 | 108 | 570 | |||||||||||||||
Cash and cash equivalents at beginning of period | 1,756 | 441 | 861 | (150 | ) | 2,908 | ||||||||||||||
|
|
|
|
|
|
|
|
|
| |||||||||||
Cash and cash equivalents at end of period | $ | 2,142 | $ | 492 | $ | 886 | $ | (42 | ) | $ | 3,478 | |||||||||
|
|
|
|
|
|
|
|
|
| |||||||||||
- 26 -
REPORT OF INDEPENDENT REGISTERED
PUBLIC ACCOUNTING FIRM
The Board of Directors and Stockholders
FedEx Corporation
We have reviewed the condensed consolidated balance sheet of FedEx Corporation as of February 29,August 31, 2016, and the related condensed consolidated statements of income, and comprehensive income for the three-month and nine-month periods ended February 29, 2016 and February 28, 2015 and the condensed consolidated statements of cash flows for the nine-monththree-month periods ended February 29,August 31, 2016 and February 28, 2015. These financial statements are the responsibility of the Company’s management.
We conducted our review in accordance with the standards of the Public Company Accounting Oversight Board (United States). A review of interim financial information consists principally of applying analytical procedures and making inquiries of persons responsible for financial and accounting matters. It is substantially less in scope than an audit conducted in accordance with the standards of the Public Company Accounting Oversight Board (United States), the objective of which is the expression of an opinion regarding the financial statements taken as a whole. Accordingly, we do not express such an opinion.
Based on our review, we are not aware of any material modifications that should be made to the condensed consolidated financial statements referred to above for them to be in conformity with U.S. generally accepted accounting principles.
We have previously audited, in accordance with the standards of the Public Company Accounting Oversight Board (United States), the consolidated balance sheet of FedEx Corporation as of May 31, 2015,2016, and the related consolidated statements of income, comprehensive income, changes in stockholders’ investment, and cash flows for the year then ended not(not presented herein,herein) and we expressed an unqualified audit opinion on those consolidated financial statements in our report dated July 14, 2015.18, 2016. In our opinion, the accompanying condensed consolidated balance sheet of FedEx Corporation as of May 31, 2015,2016, is fairly stated, in all material respects, in relation to the consolidated balance sheet from which it has been derived.
/s/ Ernst & Young LLP |
Memphis, Tennessee
March 17,September 21, 2016
- 2726 -
Item 2. Management’s Discussion and Analysis of Results of Operations and Financial Condition
GENERAL
The following Management’s Discussion and Analysis of Results of Operations and Financial Condition (“MD&A”) describes the principal factors affecting the results of operations, liquidity, capital resources, contractual cash obligations and critical accounting estimates of FedEx Corporation (“FedEx”). This discussion should be read in conjunction with the accompanying quarterly unaudited condensed consolidated financial statements and our Annual Report on Form 10-K for the year ended May 31, 20152016 (“Annual Report”). Our Annual Report includes additional information about our significant accounting policies, practices and the transactions that underlie our financial results, as well as a detailed discussion of the most significant risks and uncertainties associated with our financial condition and operating results.
We provide a broad portfolio of transportation, e-commerce and business services through companies competing collectively, operating independently and managed collaboratively, under the respected FedEx brand. Our primary operating companies are Federal Express Corporation (“FedEx Express”), the world’s largest express transportation company; TNT Express B.V. (“TNT Express”), an international express, small-package ground delivery and freight transportation company, FedEx Ground Package System, Inc. (“FedEx Ground”), a leading North American provider of small-package ground delivery services; and FedEx Freight, Inc. (“FedEx Freight”), a leading U.S. provider of less-than-truckload (“LTL”) freight services. These companies represent our major service lines and, along with FedEx Corporate Services, Inc. (“FedEx Services”), form the core of our reportable segments.
Our FedEx Services segment provides sales, marketing, information technology, communications, customer service, technical support, billing and collection services, and certain back-office functions that support to our transportation segments. In addition, the FedEx Services segment provides customers with retail access to FedEx Express and FedEx Ground shipping services through FedEx Office and Print Services, Inc. (“FedEx Office”) and provides customer service, technical support and billing and collection services through FedEx TechConnect, Inc. (“FedEx TechConnect”). See “Reportable Segments” for further discussion. Additional information on our businesses can also be found in our Annual Report.
The key indicators necessary to understand our operating results include:
the overall customer demand for our various services based on macro-economic factors and the global economy;
the volumes of transportation services provided through our networks, primarily measured by our average daily volume and shipment weight and size;
the mix of services purchased by our customers;
the prices we obtain for our services, primarily measured by yield (revenue per package or pound or revenue per hundredweight and shipment for LTL freight shipments);
our ability to manage our cost structure (capital expenditures and operating expenses) to match shifting volume levels; and
the timing and amount of fluctuations in fuel prices and our ability to recover incremental fuel costs through our fuel surcharges.
The majorityMany of our operating expenses are directly impacted by revenue and volume levels. Accordingly, we expect these operating expenses to fluctuate on a year-over-year basis consistent with the changechanges in revenues and volumes. Therefore, the discussion of operating expense captions focuses on the key drivers and trends impacting expenses other than changes in revenues and volume.volumes. The line item “Other operating expenses” predominantly includes costs associated with outside service contracts (such as security, facility services and cargo handling), insurance, professional fees, uniforms and advertising.uniforms.
- 2827 -
Except as otherwise specified, references to years indicate our fiscal year ending May 31, 20162017 or ended May 31 of the year referenced and comparisons are to the corresponding period of the prior year. References to our transportation segments include, collectively, our FedEx Express group, which includes the FedEx Express and TNT Express segments, the FedEx Ground segment and the FedEx Freight segments.segment.
RESULTS OF OPERATIONS
CONSOLIDATED RESULTS
The following table comparestables compare summary operating results and changes in revenues and operating income (dollars in millions, except per share amounts) for the three-month periods ended February 29, 2016 and February 28, 2015:August 31:
| Three Months Ended | Percent Change | Nine Months Ended | Percent Change | |||||||||||||||||||||
| 2016 | 2015 | 2016 | 2015 | |||||||||||||||||||||
Revenues | $ | 12,654 | $ | 11,716 | 8 | $ | 37,386 | $ | 35,339 | 6 | ||||||||||||||
FedEx Express Segment operating income | 595 | 393 | 51 | 1,762 | 1,262 | 40 | ||||||||||||||||||
FedEx Ground Segment operating income | 557 | 559 | — | 1,620 | 1,569 | 3 | ||||||||||||||||||
FedEx Freight Segment operating income | 56 | 67 | (16 | ) | 289 | 347 | (17 | ) | ||||||||||||||||
Eliminations, corporate and other | (344 | ) | 19 | NM | (526 | ) | 10 | NM | ||||||||||||||||
|
|
|
|
|
|
|
|
|
|
|
| |||||||||||||
Consolidated operating income | 864 | 1,038 | (17 | ) | 3,145 | 3,188 | (1 | ) | ||||||||||||||||
|
|
|
|
|
|
|
|
|
|
|
| |||||||||||||
FedEx Express Segment operating margin | 9.1 | % | 5.9 | % | 320 | bp | 8.9 | % | 6.1 | % | 280 | bp | ||||||||||||
FedEx Ground Segment operating margin | 12.6 | % | 16.5 | % | (390 | )bp | 13.2 | % | 16.7 | % | (350 | )bp | ||||||||||||
FedEx Freight Segment operating margin | 3.9 | % | 4.7 | % | (80 | )bp | 6.3 | % | 7.5 | % | (120 | )bp | ||||||||||||
Consolidated operating margin | 6.8 | % | 8.9 | % | (210 | )bp | 8.4 | % | 9.0 | % | (60 | )bp | ||||||||||||
Consolidated Net income | $ | 507 | $ | 628 | (19 | ) | $ | 1,890 | $ | 1,944 | (3 | ) | ||||||||||||
|
|
|
|
|
|
|
|
|
|
|
| |||||||||||||
Diluted earnings per share | $ | 1.84 | $ | 2.18 | (16 | ) | $ | 6.71 | $ | 6.75 | (1 | ) | ||||||||||||
|
|
|
|
|
|
|
|
|
|
|
| |||||||||||||
| 2016 | 2015 | Percent Change | ||||||||||
Consolidated revenues | $ | 14,663 | $ | 12,279 | 19 | |||||||
Operating income: | ||||||||||||
FedEx Express Segment | 624 | 545 | 14 | |||||||||
TNT Express Segment | (14 | ) | — | — | ||||||||
FedEx Ground Segment | 610 | 537 | 14 | |||||||||
FedEx Freight Segment | 135 | 132 | 2 | |||||||||
Eliminations, corporate and other | (91 | ) | (70 | ) | (30 | ) | ||||||
|
|
|
|
|
| |||||||
Consolidated operating income | 1,264 | 1,144 | 10 | |||||||||
|
|
|
|
|
| |||||||
Operating margin: | ||||||||||||
FedEx Express Segment | 9.4 | % | 8.3 | % | 110 | bp | ||||||
TNT Express Segment | (0.8 | %) | — | — | bp | |||||||
FedEx Ground Segment | 14.2 | % | 14.0 | % | 20 | bp | ||||||
FedEx Freight Segment | 8.1 | % | 8.2 | % | (10 | )bp | ||||||
Consolidated operating margin | 8.6 | % | 9.3 | % | (70 | )bp | ||||||
Consolidated net income | $ | 715 | $ | 692 | 3 | |||||||
|
|
|
|
|
| |||||||
Diluted earnings per share | $ | 2.65 | $ | 2.42 | 10 | |||||||
|
|
|
|
|
| |||||||
The following table shows changes in revenues and operating income by reportable segment for the periods ended February 29, 2016 compared to February 28, 2015 (dollars in millions):
| Year-over-Year Changes | ||||||||
| Revenues | Operating Income | |||||||
FedEx Express segment | $ | 65 | $ | 79 | ||||
TNT Express segment | 1,804 | (14 | ) | |||||
FedEx Ground segment | 460 | 73 | ||||||
FedEx Freight segment | 57 | 3 | ||||||
FedEx Services segment | 5 | — | ||||||
Eliminations, corporate and other | (7 | ) | (21 | ) | ||||
|
|
|
| |||||
| $ | 2,384 | $ | 120 | |||||
|
|
|
| |||||
| Change in Revenue | Change in Operating Income | |||||||||||||||
| Three Months Ended | Nine Months Ended | Three Months Ended | Nine Months Ended | |||||||||||||
FedEx Express segment | $ | (99 | ) | $ | (806 | ) | $ | 202 | $ | 500 | ||||||
FedEx Ground segment | 1,015 | 2,872 | (2 | ) | 51 | |||||||||||
FedEx Freight segment | 19 | (27 | ) | (11 | ) | (58 | ) | |||||||||
FedEx Services segment | 14 | 39 | — | — | ||||||||||||
Eliminations, corporate and other | (11 | ) | (31 | ) | (363 | ) | (536 | ) | ||||||||
|
|
|
|
|
|
|
| |||||||||
| $ | 938 | $ | 2,047 | $ | (174 | ) | $ | (43 | ) | |||||||
|
|
|
|
|
|
|
| |||||||||
- 28 -
Overview
Our consolidated results above include certain amounts in “Eliminations, corporate and other” that significantly impacted our income and margin. We recorded provisions for the settlement of (and certain expected losses related to) independent contractor litigation matters involving FedEx Ground for $204 million ($126 million, net of tax, or $0.46 per diluted share) in the third quarter and $245 million ($152 million, net of tax, or $0.54 per diluted share) in the nine months of 2016.
- 29 -
The thirdfirst quarter of 2016 also included expenses related to the settlement of a U.S. Customs and Border Protection (“CBP”) notice of action regarding uncollected duties and merchandising processing fees in the amount of $69 million ($43 million, net of tax, or $0.15 per diluted share for the third quarter and nine months of 2016). Both of these third quarter provisions are net of recognized insurance recoveries. The nine months of 2015 included a legal contingency reserve associated with an independent contractor litigation matter involving FedEx Ground.
In addition, we incurred expenses related to our pending acquisition of TNT Express N.V. (“TNT Express”) of $25 million ($15 million, net of tax, or $0.06 per diluted share) in the third quarter and $53 million ($33 million, net of tax, or $0.12 per diluted share) in the nine months of 2016.
Our segment results2017 improved during the third quarter and the nine months of 2016 due to higher operating income at FedEx Express, and as our profit improvement program commenced in 2013 continueswe continue to improve revenue qualitybase yields while constraining expense growth, and constrain expenses. In addition, one additional operating day benefited all our transportation segments in the nine months of 2016.at FedEx Ground, driven by volume and yield growth. These factors were partially offset in the third quarter and the nine months of 2016 by lower than anticipated volume at FedEx Freight, andhigher network expansion costs higher self-insurance expenses and increased purchased transportation rates at FedEx Ground.Ground and lower LTL revenue per shipment at FedEx Freight.
In the first quarter of 2017 we incurred an aggregate $68 million ($45 million, net of tax, or $0.17 per diluted share) of integration expenses for TNT Express and charges associated with TNT Express’s restructuring program called Outlook. The integration expenses are predominantly incremental costs directly associated with the integration of TNT Express, including professional fees, advertising expenses, legal expenses and travel. Internal salaries, wages, and benefits costs are included only to the extent the individuals are assigned full time to integration activities. These costs were incurred primarily at FedEx Corporation and FedEx Express. The identification of these costs as integration-related expenditures is subject to our disclosure controls and procedures. In addition, in the third quarterwe incurred $28 million ($21 million, net of 2016, higher operational costs at FedEx Ground during our peak season negatively impacted results. Higher healthcare costs and incentive compensation accruals also negatively impacted results in the nine monthstax, or $0.08 per diluted share) of 2016.increased intangible asset amortization as a result of this acquisition.
- 3029 -
The following graphs for FedEx Express, FedEx Ground and FedEx Freight show selected volume trends (in thousands) over the five most recent quarters:quarters (TNT Express volume trends are not presented, as it was acquired on May 25, 2016):
| (1) | International domestic average daily package volume represents our international intra-country |
- 3130 -
The following graphs for FedEx Express, FedEx Ground and FedEx Freight show selected yield trends over the five most recent quarters:quarters (TNT yield trends are not presented, as it was acquired on May 25, 2016):
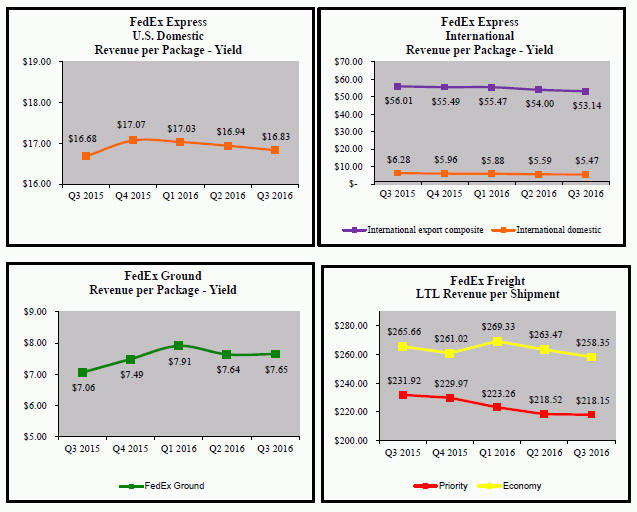
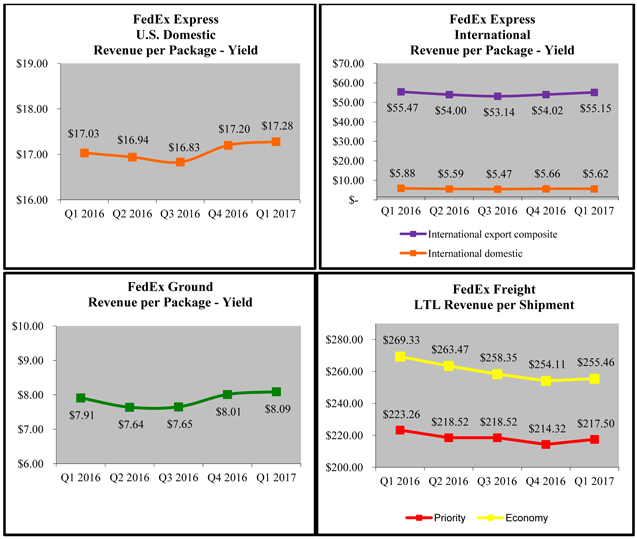
Revenue
Revenues increased 8% in19% during the thirdfirst quarter of 2017 due to the inclusion of TNT Express and 6% in the nine months of 2016 driven by theimproved performance at our other transportation segments. At FedEx Ground, segmentrevenues increased 12% due to volume growth in our residential services coupled with rate increases, and the inclusion of GENCO Distribution System, Inc. (“GENCO”) revenue. In addition,commercial business. Revenues at FedEx Express increased 1% due to base yields, package volume and freight pounds growth. FedEx Freight increased revenues increased approximately $350 million in the third quarter and $890 million in the nine months of 2016 as a result of recording FedEx SmartPost service revenues on a gross basis, versus our previous net treatment, as further discussed in our Annual Report and in Note 1 of our unaudited condensed consolidated financial statements.4% due to higher average daily LTL shipments, which was partially offset by lower revenue per LTL shipment. Lower fuel surcharges had a significant negative impact on revenues at all of our transportation segments but had a modest benefit on our earnings in the third quarter and nine months of 2016. Unfavorableunfavorable exchange rates also negatively impacted revenues at FedEx Express in the thirdfirst quarter and nine months of 2016. One additional operating day benefited revenues at all our transportation segments in the nine months of 2016.2017.
- 3231 -
Operating Expenses
The following tables comparetable compares operating expenses expressed as dollar amounts (in millions) and as a percent of revenue for the three-month periods ended February 29, 2016 and February 28, 2015:August 31:
| Three Months Ended | Nine Months Ended | Percent of Revenue | ||||||||||||||||||||||||||||||
| 2016 | 2015 | 2016 | 2015 | 2016 | 2015 | 2016 | 2015 | |||||||||||||||||||||||||
Operating expenses: | ||||||||||||||||||||||||||||||||
Salaries and employee benefits | $ | 4,712 | $ | 4,335 | $ | 13,807 | $ | 12,678 | $ | 5,311 | $ | 4,525 | 36.2 | % | 36.9 | % | ||||||||||||||||
Purchased transportation | 2,623 | 2,165 | 7,505 | 6,404 | 3,240 | 2,344 | 22.1 | 19.1 | ||||||||||||||||||||||||
Rentals and landing fees | 744 | 686 | 2,121 | 2,009 | 790 | 695 | 5.4 | 5.6 | ||||||||||||||||||||||||
Depreciation and amortization | 663 | 652 | 1,964 | 1,954 | 739 | 648 | 5.1 | 5.3 | ||||||||||||||||||||||||
Fuel | 537 | 810 | 1,864 | 2,982 | 650 | 712 | 4.4 | 5.8 | ||||||||||||||||||||||||
Maintenance and repairs | 504 | 505 | 1,581 | 1,604 | 598 | 548 | 4.1 | 4.5 | ||||||||||||||||||||||||
Other | 2,007 | 1,525 | 5,399 | 4,520 | 2,071 | 1,663 | 14.1 | 13.5 | ||||||||||||||||||||||||
|
|
|
|
|
|
|
| |||||||||||||||||||||||||
Total operating expenses | $ | 11,790 | $ | 10,678 | $ | 34,241 | $ | 32,151 | $ | 13,399 | $ | 11,135 | 91.4 | 90.7 | ||||||||||||||||||
|
|
|
|
|
|
|
| |||||||||||||||||||||||||
Total operating income | $ | 864 | $ | 1,038 | $ | 3,145 | $ | 3,188 | ||||||||||||||||||||||||
Operating income | $ | 1,264 | $ | 1,144 | 8.6 | % | 9.3 | % | ||||||||||||||||||||||||
|
|
|
|
|
|
|
| |||||||||||||||||||||||||
Percent of Revenue | ||||||||||||||||||||||||||||||||
| Three Months Ended | Nine Months Ended | |||||||||||||||||||||||||||||||
| 2016 | 2015 | 2016 | 2015 | |||||||||||||||||||||||||||||
Operating expenses: | ||||||||||||||||||||||||||||||||
Salaries and employee benefits | 37.2 | % | 36.9 | % | 36.9 | % | 35.9 | % | ||||||||||||||||||||||||
Purchased transportation | 20.7 | 18.5 | 20.1 | 18.1 | ||||||||||||||||||||||||||||
Rentals and landing fees | 5.9 | 5.9 | 5.7 | 5.7 | ||||||||||||||||||||||||||||
Depreciation and amortization | 5.2 | 5.6 | 5.3 | 5.5 | ||||||||||||||||||||||||||||
Fuel | 4.3 | 6.9 | 5.0 | 8.4 | ||||||||||||||||||||||||||||
Maintenance and repairs | 4.0 | 4.3 | 4.2 | 4.6 | ||||||||||||||||||||||||||||
Other | 15.9 | 13.0 | 14.4 | 12.8 | ||||||||||||||||||||||||||||
|
|
|
| |||||||||||||||||||||||||||||
Total operating expenses | 93.2 | 91.1 | 91.6 | 91.0 | ||||||||||||||||||||||||||||
|
|
|
| |||||||||||||||||||||||||||||
Operating margin | 6.8 | % | 8.9 | % | 8.4 | % | 9.0 | % | ||||||||||||||||||||||||
|
|
|
| |||||||||||||||||||||||||||||
Our operatingOperating margin fordeclined during the thirdfirst quarter of 2016 was negatively impacted by corporate level provisions for the settlement of (and certain expected losses relating to) independent contractor litigation matters involving FedEx Ground and the settlement of the CBP matter as described above, higher salaries and employee benefits at FedEx Freight, the recording of FedEx SmartPost revenues on a gross basis and higher operational costs during our peak season at FedEx Ground. During the nine months of 2016, operating margin was negatively impacted by the same factors, as well as higher self-insurance expenses. The independent contractor litigation and CBP items affected operating margin by a combined 220 basis points in the third quarter and 80 basis points in the nine months of 2016.
Our operating expenses included an increase in salaries and employee benefits expense of 9% in the third quarter and nine months of 20162017 due to the inclusion of GENCO results and payTNT Express, which was partially offset by the continued benefits from cost management initiatives coupled with increased staffing at FedEx Freight. Higher healthcare costs and incentive compensation accruals alsoExpress.
The inclusion of the TNT Express segment in our results has impacted salaries and employee benefits in the nine monthsyear-over-year comparability of 2016.all our operating expenses. Purchased transportation costs increased 21%38% in the thirdfirst quarter and 17% in the nine months of 20162017 due to the recordinginclusion of FedEx SmartPost service revenues on a gross basisTNT Express and higher volumes and increased rates at FedEx Ground. Other expenses were driven 32% higherSalaries and employee benefits expense increased 17% in the thirdfirst quarter due to the independent contractor litigation and CBP matters further discussed in Note 8 of the accompanying unaudited condensed consolidated financial statements and the inclusion of GENCO results and 19% in the nine months of 20162017 due to the inclusion of GENCO results, the independent contractor litigationTNT Express, volume growth and CBP matters and higher self-insurance insurance costsstaffing to support network expansion at FedEx Ground. RentalsGround and landing fees increased 8%staffing at FedEx Freight. Other expenses were 25% higher in the thirdfirst quarter and 6% in the nine months of 20162017 primarily due to network expansion and the inclusion of GENCOTNT Express results at FedEx Ground.driven by outside service contracts.
- 3332 -
Fuel
The following graph for our transportation segments shows our average cost of jet and vehicle fuel per gallon for the five most recent quarters:
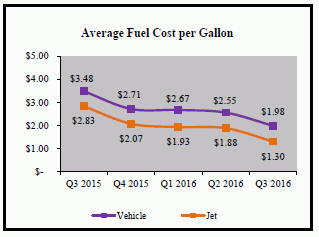
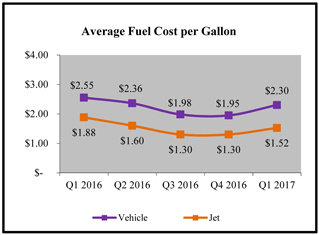
Fuel expense decreased 34%9% in the thirdfirst quarter and 37% in the nine months of 20162017 due to lower fuel prices. However, fuel prices represent only one component of the two factors we consider meaningful in understanding the impact of fuel on our business. Consideration must also be given to the fuel surcharge revenue we collect. Accordingly, we believe discussion of the net impact of fuel on our results, which is a comparison of the year-over-year change in these two factors, is important to understand the impact of fuel on our business. In order to provide information about the impact of fuel surcharges on the trend in revenue and yield growth, we have included the comparative weighted-average fuel surcharge percentages in effect for the thirdfirst quarter of 2017 and nine months of 2016 and 2015 in the accompanying discussions of each of our transportation segments.
The index used to determine the fuel surcharge percentage for our FedEx Freight business adjusts weekly, while our fuel surcharges for the FedEx Express, TNT Express and FedEx Ground businesses incorporate a timing lag of approximately six to eight weeks before they are adjusted for changes in fuel prices. For example, the fuel surcharge index in effect at FedEx Express in FebruaryAugust 2016 was set based on December 2015June 2016 fuel prices. In addition, the structure of the table that is used to determine our fuel surcharge at FedEx Express, TNT Express and FedEx Ground does not adjust immediately for changes in fuel price, but allows for the fuel surcharge revenue charged to our customers to remain unchanged as long as fuel prices remain within certain ranges.
Beyond these factors, the manner in which we purchase fuel also influences the net impact of fuel on our results. For example, our contracts for jet fuel purchases at FedEx Express are tied to various indices, including the U.S. Gulf Coast index. While many of these indices are aligned, each index may fluctuate at a different pace, driving variability in the prices paid for jet fuel. Furthermore, under these contractual arrangements, approximately 75% of our jet fuel is purchased based on the index price for the preceding week, with the remainder of our purchases tied to the index price for the preceding month, rather than based on daily spot rates. These contractual provisions mitigate the impact of rapidly changing daily spot rates on our jet fuel purchases.
- 34 -
Because of the factors described above, our operating results may be affected should the market price of fuel suddenly change by a significant amount or change by amounts that do not result in an adjustment in our fuel surcharges, which can significantly affect our earnings either positively or negatively in the short-term.
We routinely review our fuel surcharges and our fuel surcharge methodology. On November 2, 2015,As announced on September 19, 2016, FedEx Express and FedEx Ground fuel surcharges will be adjusted on a weekly basis compared to the current monthly adjustment, effective February 6, 2017. On November 2, 2015, we updated certainthe tables used to determine our fuel surcharges.surcharges at FedEx Express, FedEx Ground and FedEx Freight.
- 33 -
The net impact of fuel had a modest benefitminimal impact to consolidated operating income in the thirdfirst quarter and nine months of 2016 to operating income. This was driven by2017, as the year-over-year decrease in fuel prices during the third quarter and nine months of 2016, which was partiallywere offset by decreased fuel surcharge revenue during these periods.the first quarter of 2017 versus the prior year.
The net impact of fuel on our operating results does not consider the effects that fuel surcharge levels may have on our business, including changes in demand and shifts in the mix of services purchased by our customers. While fluctuations in fuel surcharge percentages can be significant from period to period, fuel surcharges represent one of the many individual components of our pricing structure that impact our overall revenue and yield. Additional components include the mix of services sold, the base price and extra service charges we obtain for these services and the level of pricing discounts offered.
Other Income and Expense
Interest expense increased $50 million in the first quarter of 2017 primarily due to our U.S. and European debt issuances in fiscal 2016. The annualized weighted average interest rate on long-term debt was 3.6% for the three months ended August 31, 2016, reflecting the favorable interest rates obtained in recent debt offerings.
Income Taxes
Our effective tax rate was 35.2%37.4% for the thirdfirst quarter of 20162017 and 35.3%36.2% for the nine monthsfirst quarter of 2016, compared with 36.2%2016. The tax rate in the thirdfirst quarter and 36.1% in the nine months of 2015. The tax rates in 2016 have decreased primarily2017 increased due to a lower statethe impact of local country losses in some entities within TNT Express, for which no tax rate includingbenefit could be recognized due to the resolutionuncertainty as to the utilization of a state income tax matter duringthese losses. Longer term, as the second quarter. For 2016,synergies from the TNT Express acquisition result in greater international profits, we expect anour effective tax rate of 35.0% to 36.0% prior to any year-end mark-to-market accounting adjustment for defined benefit pension and postretirement healthcare plans (“MTM Adjustment”). The actualbe lower than the rate however, will depend on a number of factors, including the amount and source of operating income, the impact of the MTM Adjustment and when the proposed TNT Express acquisition is completed.in recent years.
We are subject to taxation in the United States and various U.S. state, local and foreign jurisdictions. During the third quarter, we closedWe are currently under examination by the Internal Revenue Service examination for the 20122014 and 20132015 tax years. The conclusion ofIt is reasonably possible that certain income tax return proceedings will be completed during the audit had an immaterial impact tonext 12 months and could result in a change in our balance of unrecognized tax benefits. The expected impact of any changes would not be material to our consolidated financial statements. As of February 29,August 31, 2016, there were no material changes to our liabilities for unrecognized tax benefits from May 31, 2015.2016.
Business AcquisitionsAcquisition
As discussed in our Annual Report, on April 6, 2015,On May 25, 2016, we entered into a conditional agreement to acquireacquired TNT Express for €4.4 billion (currently, approximately(approximately $4.9 billion). This combination is expected to expand our global portfolio, particularly in Europe, lower our costs to serve our European markets by increasing density in our pickup-and-delivery operations and accelerate our global growth. This acquisition is expected to be completedCash acquired in the first halfacquisition was approximately €250 million ($280 million). As of calendar yearAugust 31, 2016, $36 million of shares associated with the transaction remained untendered, a decrease of $251 million since May 31, 2016. The closing of the acquisition is subject to customary conditions, including obtaining all necessary approvals and competition clearances. We expect to secure all relevant competition approvals.
During 2015, we acquired two businesses, expanding our portfolio in e-commerce and supply chain solutions. On January 30, 2015, we acquired GENCO, a leading North American third-party logistics provider, for $1.4 billion, which was funded using a portion of the proceeds from our January 2015 debt issuance. The financial results of this businessremaining untendered shares are included in the FedEx Ground segment“Other liabilities” caption of our consolidated balance sheets. We funded the acquisition with proceeds from the date of acquisition.
In addition, on December 16, 2014, we acquired Bongo International, LLC (“Bongo”), a leader in cross-border enablement technologiesour April 2016 debt issuance and solutions, for $42 million inexisting cash from operations.balances. The financial results of this business are included in the FedEx Express group and TNT Express segment from the date of acquisition.
TNT Express collects, transports and delivers documents, parcels and freight to over 200 countries. This strategic acquisition broadens our portfolio of international transportation solutions with the combined strength of TNT Express’s strong European road platform and our strength in other regions globally, including North America and Asia.
Given the timing and complexity of the acquisition, the presentation of TNT Express in our financial statements, including the allocation of the purchase price, is preliminary and will likely change in future periods, perhaps significantly, as fair value estimates of the assets acquired and liabilities assumed are refined during the measurement period. We will complete our purchase price allocation no later than the fourth quarter of 2017.
- 35 -
These acquisitions will allow us to enter new markets, as well as strengthen our current service offerings to existing customers. See Note 1 of the accompanying unaudited condensed consolidated financial statements for further discussion of these acquisitions.this acquisition.
- 34 -
Outlook
We expect revenue and earnings growth in the fourth quarter and full year of 2016 (prior2017 prior to any MTM Adjustment and exclusive of certain litigation matters) driven by improvements in the results of our FedEx Express and FedEx Ground segments due to volume growth and yield management initiatives, despite weaker than anticipated industrial production. We expect this weakness to drive lower than anticipated revenue growth and have a negative impact on the earnings of our FedEx Freight segment in the fourth quarter and full year of 2016.mark-to-market (MTM) benefit plans adjustment. Our results in 20162017 will continue to benefit from execution of the profit improvement programs announced in 2013, which are further described inbe negatively impacted by our Annual Report.TNT Express integration and restructuring activities. Our expectations for earnings growth in the fourthsecond quarter and the remainder of 20162017 are dependent on key external factors, including fuel prices and moderate growththe pace of improvement in the global economy. Our outlook for 2016 also does not include any impact from
Due to our announced intent to acquire TNT Express such asacquisition, 2017 will be a year of intensive integration planning or transaction costs, the operating activities ofand investments. We have owned TNT Express orfor approximately 120 days, and our integration activities are well underway. The integration process is complex as it spans over 200 countries and involves combining our pickup and delivery operations at a local level, our global and regional air and ground networks, and our extensive operations, clearance, sales and back-office IT systems, and is expected to take four years to complete. In addition, as discussed in our Annual Report, TNT Express is undergoing a large restructuring program called Outlook, which includes incurring certain restructuring costs. We estimate incurring costs of approximately $275 million in 2017 as a result of the relatedTNT Express integration and Outlook restructuring programs. We currently expect the aggregate integration program expense over the four years to be in the range of $700 million to $800 million. The timing and amount of integration-related expenses in any future period is subject to change as we implement our plans. Therefore, we cannot currently predict if TNT Express will be accretive under accounting principles generally accepted in the United States in 2018.
We believe that this acquisition presents significant opportunities for material synergies in pickup and delivery costs, air and ground network optimization, selling, general and administrative expenses, as well as revenue growth, and the benefit of a lower tax consequences ifrate. We are currently anticipating annual pre-tax synergies following the transactioncompletion of the integration program in fiscal 2020 of $750 million. Given that the integration is consummated.complex and spans several years, how we achieve our target may evolve over time as market conditions and other factors change.
Other Outlook Matters. For details on key 20162017 capital projects, refer to the “Liquidity Outlook” section of this MD&A.
We plan to merge FedEx TechConnect into FedEx Services, effective May 31, 2016. This internal structure change will enhance FedEx Services’ ability to serve our operating companies and our customers. There will be no personnel reduction associated with the merger and the estimated cost of the merger will be immaterial to our results.
We are involved in a number of lawsuits and other proceedings that challenge the status of FedEx Ground’s owner-operators as independent contractors. For a description of these proceedings, see Note 8 of the accompanying unaudited condensed consolidated financial statements and the “Independent Contractor Model” section of our FedEx Ground segment MD&A.
In the third quarter of 2016, FedEx Ground announced plans to implement the Independent Service Provider (“ISP”) model throughout its entire U.S. pickup and delivery network. To date, service providers in 2432 states are operating under, or transitioning to, the ISP model. The transition to the ISP model in the remaining 2618 states is expected to be completed by May 31,the end of 2020. The costs associated with these transitions will be recognized in the periods incurred and are not expected to be material to any future quarter.
See “Forward-Looking Statements” for a discussion of these and other potential risks and uncertainties that could materially affect our future performance.
RECENT ACCOUNTING GUIDANCE
New accounting rules and disclosure requirements can significantly impact our reported results and the comparability of our financial statements. These matters are described in our Annual Report.
InDuring the second quarter, of 2016, we chose to early adoptretrospectively adopted the authoritative guidance issued by the Financial Accounting Standards Board (“FASB”) requiring acquirers into simplify the presentation of debt issuance costs. This new guidance requires entities to present debt issuance costs related to a business combination to recognize adjustments to provisional amountsrecognized debt liability as a direct deduction from the carrying amount of that are identified during the measurement period in the reporting period that the adjustment amounts are determined and eliminates the requirement to retrospectively account for these adjustments. It also requires additional disclosure about the effects of the adjustments on prior periods. Adoption of thisdebt liability, rather than as an asset. This new guidance had noa minimal impact on our accounting and financial reporting. See
On May 28, 2014, the “Business Acquisitions” section aboveFASB and International Accounting Standards Board issued a new accounting standard that will supersede virtually all existing revenue recognition guidance under generally accepted accounting principles in the United States (and International Financial Reporting Standards) which has been subsequently updated to defer the effective date of the new revenue recognition standard by one year. This standard will be effective for further discussion regarding our recent business acquisitions.us beginning in fiscal 2019. The fundamental principles of the new guidance are that companies should recognize revenue in a manner that reflects the timing of the transfer of services to
- 3635 -
customers and the amount of revenue recognized reflects the consideration that a company expects to receive for the goods and services provided. The new guidance establishes a five-step approach for the recognition of revenue. Based on our preliminary assessment, we do not anticipate that the new guidance will have a material impact on our revenue recognition policies, practices or systems.
On February 25, 2016, the FASB issued the new lease accounting standard which requires lessees to put most leases on their balance sheets but recognize the expenses on their income statements in a manner similar to current practice. The new standard states that a lessee will recognize a lease liability for the obligation to make lease payments and a right-of-use asset for the right to use the underlying asset for the lease term. Expense related to leases determined to be operating leases will be recognized on a straight-line basis, while those determined to be financing leases will be recognized following a front-loaded expense profile in which interest and amortization are presented separately in the income statement. We are currently evaluating the impact of this new standard on our financial reporting, but recognizing the lease liability and related right-of-use asset will significantly impact our balance sheet. These changes will be effective for our fiscal year beginning June 1, 2019 (fiscal 2020), with a modified retrospective adoption method to the beginning of 2018.
On November 20, 2015,In March 2016, the FASB issued an Accounting Standards Update that will requireto simplify the accounting for share-based payment transactions. The new guidance requires companies to classify all deferredrecognize the income tax assets and liabilitieseffects of awards that vest or are settled as noncurrent onincome tax expense or benefit in the balance sheet insteadincome statement as opposed to additional paid-in capital as is current practice. The guidance also provides clarification of separating deferred taxes into current and noncurrent amounts.the presentation of certain components of share-based awards in the statement of cash flows. Additionally, the guidance allows companies to make a policy election to account for forfeitures either upon occurrence or by estimating forfeitures. This new guidancestandard will have minimal impact on our accounting and financial reporting, and we plan to early adopt on a retrospective basis in the fourth quarter of 2016.reporting. These changes will be effective for our fiscal year beginning June 1, 2017 (fiscal 2018).
We believe that no other new accounting guidance was adopted or issued during the ninefirst three months of 20162017 that is relevant to the readers of our financial statements.
- 36 -
REPORTABLE SEGMENTS
FedEx Express, TNT Express, FedEx Ground and FedEx Freight represent our major service lines and, along with FedEx Services, form the core of our reportable segments. Our reportable segments include the following businesses:
FedEx Express Group: | ||
FedEx Express Segment | FedEx Express (express transportation) | |
FedEx Trade Networks (air and ocean freight forwarding, customs brokerage and | ||
FedEx SupplyChain Systems (logistics services) | ||
TNT Express Segment | TNT Express (international express transportation, small-package ground delivery and | |
FedEx Ground Segment | FedEx Ground (small-package ground delivery) | |
GENCO Distribution System, Inc. (“GENCO”) (third-party logistics) | ||
FedEx Freight Segment | FedEx Freight (LTL freight transportation) | |
FedEx Custom Critical (time-critical transportation) | ||
FedEx Services Segment | FedEx Services (sales, marketing, information technology, communications, | |
| ||
FedEx Office (document and business services and package acceptance) | ||
FEDEX SERVICES SEGMENT
The operating expenses line item “Intercompany charges” on the accompanying unaudited condensed consolidated financial statements of our transportation segments reflects the allocations from the FedEx Services segment to the respective transportation segments. The allocations of net operating costs are based on metrics such as relative revenues or estimated services provided.
The FedEx Services segment provides direct and indirect support to our transportation businesses, and we allocate all of the net operating costs of the FedEx Services segment (including the net operating results of FedEx Office) to reflect the full cost of operating our transportation businesses in the results of those segments. Within the FedEx Services segment allocation, the net operating results of FedEx Office, which are an immaterial component of our allocations, are allocated to FedEx Express and FedEx Ground. We review and evaluate the performance of our transportation segments based on operating income (inclusive of FedEx Services segment allocations).
- 37 -
For the FedEx Services segment, performance is evaluated based on the impact of its total allocated net operating costs on our transportation segments. We believe these allocations approximate the net cost of providing these functions. Our allocation methodologies are refined periodically, as necessary, to reflect changes in our businesses.
ELIMINATIONS, CORPORATE AND OTHER
Certain FedEx operating companies provide transportation and related services for other FedEx companies outside their reportable segment. Billings for such services are based on negotiated rates, which we believe approximate fair value, and are reflected as revenues of the billing segment. These rates are adjusted from time to time based on market conditions. Such intersegment revenues and expenses are eliminated in our consolidated results and are not separately identified in the following segment information, because the amounts are not material.
- 37 -
Corporate and other includes corporate headquarters costs for executive officers and certain other legal and financial functions, as well as certain other costs and credits not attributed to our core business. These costs are not allocated to the business segments. The year-over-year increase in these costs was driven by the 2016 legal reserves described above and prior year benefits of approximately $67 million in the third quarter and $200 million in the nine months as a result of our change in recognizing expected return on plan assets for our defined benefit pension and postretirement healthcare plans at the segment level, which had no impact at the consolidated level.TNT Express integration expenses discussed above.
- 38 -
FEDEX EXPRESS GROUP
The FedEx Express Group consists of the combined results of the FedEx Express and TNT Express segments. As discussed in our Annual Report, we have combined these segments for financial reporting discussion purposes into a collective business as a result of their management reporting structure. Furthermore, over time their operations will be integrated, therefore presenting a group view provides a basis for future year-over-year comparison purposes. We acquired TNT Express in the fourth quarter of 2016, which has impacted the year-over-year comparability of revenue and operating income. The following table compares selected performance measures (dollars in millions) for the three-month periods ended August 31:
| 2016 | 2015 | Percent Change | ||||||||||
Revenues: | ||||||||||||
FedEx Express Segment | $ | 6,656 | $ | 6,591 | 1 | |||||||
TNT Express Segment | 1,804 | — | NM | |||||||||
|
|
|
| |||||||||
FedEx Express Group | 8,460 | 6,591 | 28 | |||||||||
|
|
|
| |||||||||
Operating income (loss): | ||||||||||||
FedEx Express Segment | 624 | 545 | 14 | |||||||||
TNT Express Segment | (14 | ) | — | NM | ||||||||
|
|
|
| |||||||||
FedEx Express Group | $ | 610 | $ | 545 | 12 | |||||||
|
|
|
| |||||||||
Operating margin: | ||||||||||||
FedEx Express Segment | 9.4 | % | 8.3 | % | 110 | bp | ||||||
TNT Express Segment | (0.8 | %) | — | NM | bp | |||||||
|
|
|
| |||||||||
FedEx Express Group | 7.2 | % | 8.3 | % | (110 | )bp | ||||||
|
|
|
| |||||||||
FedEx Express Group Results
In the first quarter of 2017, the FedEx Express Group delivered combined revenue of $8.5 billion, which represents an increase of 28% over the first quarter of 2016. This increase was due to the inclusion of our recently acquired TNT Express segment, as well as improved base yields and package volume and freight pounds growth at our FedEx Express segment, which were partially offset by the negative impact of lower fuel surcharges and slightly unfavorable exchange rates.
Operating income increased in the first quarter of 2017 within the FedEx Express group reflecting the continued success of our FedEx Express segment, which was slightly offset by the TNT Express segment. The TNT Express segment reported an operating loss due to the continued execution of the Outlook restructuring program and amortization of intangible assets. Operating margin of the group declined due to the inclusion of the TNT Express segment which was partially offset by the increase in the FedEx Express segment operating margin.
- 39 -
FEDEX EXPRESS SEGMENT
FedEx Express offers a wide range of U.S. domestic and international shipping services for delivery of packages and freight including priority services, which provide time-definite delivery within one, two or three business days worldwide, and deferred or economy services, which provide time-definite delivery within five business days worldwide. The following tables comparetable compares revenues, operating expenses, operating expenses as a percent of revenue, operating income and operating margin (dollars in millions) and operating margin for the three-month periods ended February 29, 2016 and February 28, 2015:August 31:
| Three Months Ended | Percent | Nine Months Ended | Percent | |||||||||||||||||||||||||||||||||||||||||
| 2016 | 2015 | Change | 2016 | 2015 | Change | 2016 | 2015 | Percent Change | ||||||||||||||||||||||||||||||||||||
Revenues: | ||||||||||||||||||||||||||||||||||||||||||||
Package: | ||||||||||||||||||||||||||||||||||||||||||||
U.S. overnight box | $ | 1,704 | $ | 1,653 | 3 | $ | 5,044 | $ | 5,040 | — | $ | 1,722 | $ | 1,658 | 4 | |||||||||||||||||||||||||||||
U.S. overnight envelope | 408 | 392 | 4 | 1,227 | 1,207 | 2 | 443 | 422 | 5 | |||||||||||||||||||||||||||||||||||
U.S. deferred | 926 | 895 | 3 | 2,568 | 2,524 | 2 | 810 | 816 | (1 | ) | ||||||||||||||||||||||||||||||||||
|
|
|
|
|
| |||||||||||||||||||||||||||||||||||||||
Total U.S. domestic package revenue | 3,038 | 2,940 | 3 | 8,839 | 8,771 | 1 | 2,975 | 2,896 | 3 | |||||||||||||||||||||||||||||||||||
|
|
|
|
|
| |||||||||||||||||||||||||||||||||||||||
International priority | 1,346 | 1,463 | (8 | ) | 4,243 | 4,742 | (11 | ) | 1,434 | 1,464 | (2 | ) | ||||||||||||||||||||||||||||||||
International economy | 546 | 560 | (3 | ) | 1,688 | 1,729 | (2 | ) | 584 | 574 | 2 | |||||||||||||||||||||||||||||||||
|
|
|
|
|
| |||||||||||||||||||||||||||||||||||||||
Total international export package revenue | 1,892 | 2,023 | (6 | ) | 5,931 | 6,471 | (8 | ) | 2,018 | 2,038 | (1 | ) | ||||||||||||||||||||||||||||||||
|
|
|
|
|
| |||||||||||||||||||||||||||||||||||||||
International domestic(1) | 303 | 328 | (8 | ) | 966 | 1,082 | (11 | ) | 320 | 327 | (2 | ) | ||||||||||||||||||||||||||||||||
|
|
|
|
|
| |||||||||||||||||||||||||||||||||||||||
Total package revenue | 5,233 | 5,291 | (1 | ) | 15,736 | 16,324 | (4 | ) | 5,313 | 5,261 | 1 | |||||||||||||||||||||||||||||||||
Freight: | ||||||||||||||||||||||||||||||||||||||||||||
U.S. | 647 | 580 | 12 | 1,798 | 1,745 | 3 | 616 | 573 | 8 | |||||||||||||||||||||||||||||||||||
International priority | 325 | 375 | (13 | ) | 1,029 | 1,182 | (13 | ) | 360 | 350 | 3 | |||||||||||||||||||||||||||||||||
International airfreight | 30 | 45 | (33 | ) | 98 | 133 | (26 | ) | 27 | 36 | (25 | ) | ||||||||||||||||||||||||||||||||
|
|
|
|
|
| |||||||||||||||||||||||||||||||||||||||
Total freight revenue | 1,002 | 1,000 | — | 2,925 | 3,060 | (4 | ) | 1,003 | 959 | 5 | Percent of Revenue | |||||||||||||||||||||||||||||||||
|
| |||||||||||||||||||||||||||||||||||||||||||
Other(2) | 322 | 365 | (12 | ) | 1,075 | 1,158 | (7 | ) | 340 | 371 | (8 | ) | 2016 | 2015 | ||||||||||||||||||||||||||||||
|
|
|
|
|
|
|
| |||||||||||||||||||||||||||||||||||||
Total revenues | 6,557 | 6,656 | (1 | ) | 19,736 | 20,542 | (4 | ) | 6,656 | 6,591 | 1 | 100.0 | % | 100.0 | % | |||||||||||||||||||||||||||||
Operating expenses: | ||||||||||||||||||||||||||||||||||||||||||||
Salaries and employee benefits | 2,602 | 2,572 | 1 | 7,638 | 7,574 | 1 | 2,588 | 2,523 | 3 | 38.9 | 38.3 | |||||||||||||||||||||||||||||||||
Purchased transportation | 545 | 614 | (11 | ) | 1,762 | 1,942 | (9 | ) | 557 | 601 | (7 | ) | 8.4 | 9.1 | ||||||||||||||||||||||||||||||
Rentals and landing fees | 452 | 436 | 4 | 1,261 | 1,284 | (2 | ) | 401 | 410 | (2 | ) | 6.0 | 6.2 | |||||||||||||||||||||||||||||||
Depreciation and amortization | 342 | 364 | (6 | ) | 1,038 | 1,106 | (6 | ) | 348 | 347 | — | 5.2 | 5.3 | |||||||||||||||||||||||||||||||
Fuel | 455 | 697 | (35 | ) | 1,579 | 2,573 | (39 | ) | 501 | 607 | (17 | ) | 7.5 | 9.2 | ||||||||||||||||||||||||||||||
Maintenance and repairs | 306 | 324 | (6 | ) | 981 | 1,060 | (7 | ) | 357 | 345 | 3 | 5.4 | 5.2 | |||||||||||||||||||||||||||||||
Intercompany charges | 464 | 460 | 1 | 1,371 | 1,360 | 1 | 462 | 445 | 4 | 6.9 | 6.7 | |||||||||||||||||||||||||||||||||
Other | 796 | 796 | — | 2,344 | 2,381 | (2 | ) | 818 | 768 | 7 | 12.3 | 11.7 | ||||||||||||||||||||||||||||||||
|
|
|
|
|
|
|
| |||||||||||||||||||||||||||||||||||||
Total operating expenses | 5,962 | 6,263 | (5 | ) | 17,974 | 19,280 | (7 | ) | 6,032 | 6,046 | — | 90.6 | % | 91.7 | % | |||||||||||||||||||||||||||||
|
|
|
|
|
|
|
| |||||||||||||||||||||||||||||||||||||
Operating income | $ | 595 | $ | 393 | 51 | $ | 1,762 | $ | 1,262 | 40 | $ | 624 | $ | 545 | 14 | |||||||||||||||||||||||||||||
|
|
|
|
|
| |||||||||||||||||||||||||||||||||||||||
Operating margin | 9.1 | % | 5.9 | % | 320 | bp | 8.9 | % | 6.1 | % | 280 | bp | 9.4 | % | 8.3 | % | 110 | bp | ||||||||||||||||||||||||||
| (1) | International domestic revenues represent our international intra-country |
| (2) | Includes FedEx Trade Networks and FedEx SupplyChain |
- 3940 -
| Percent of Revenue | ||||||||||||||||
| Three Months Ended | Nine Months Ended | |||||||||||||||
| 2016 | 2015 | 2016 | 2015 | |||||||||||||
Operating expenses: | ||||||||||||||||
Salaries and employee benefits | 39.7 | % | 38.7 | % | 38.7 | % | 36.9 | % | ||||||||
Purchased transportation | 8.3 | 9.2 | 8.9 | 9.5 | ||||||||||||
Rentals and landing fees | 6.9 | 6.5 | 6.4 | 6.2 | ||||||||||||
Depreciation and amortization | 5.2 | 5.5 | 5.3 | 5.4 | ||||||||||||
Fuel | 6.9 | 10.5 | 8.0 | 12.5 | ||||||||||||
Maintenance and repairs | 4.7 | 4.9 | 5.0 | 5.2 | ||||||||||||
Intercompany charges | 7.1 | 6.9 | 6.9 | 6.6 | ||||||||||||
Other | 12.1 | 11.9 | 11.9 | 11.6 | ||||||||||||
|
|
|
|
|
|
|
| |||||||||
Total operating expenses | 90.9 | 94.1 | 91.1 | 93.9 | ||||||||||||
|
|
|
|
|
|
|
| |||||||||
Operating margin | 9.1 | % | 5.9 | % | 8.9 | % | 6.1 | % | ||||||||
|
|
|
|
|
|
|
| |||||||||
The following table compares selected statistics (in thousands, except yield amounts) for the three-month periods ended February 29, 2016 and February 28, 2015:August 31:
| Three Months Ended | Percent | Nine Months Ended | Percent | |||||||||||||||||||||||||||||||||
| 2016 | 2015 | Change | 2016 | 2015 | Change | 2016 | 2015 | Percent Change | ||||||||||||||||||||||||||||
Package Statistics(1) | ||||||||||||||||||||||||||||||||||||
Average daily package volume (ADV): | ||||||||||||||||||||||||||||||||||||
U.S. overnight box | 1,316 | 1,258 | 5 | 1,271 | 1,243 | 2 | 1,255 | 1,210 | 4 | |||||||||||||||||||||||||||
U.S. overnight envelope | 535 | 516 | 4 | 536 | 521 | 3 | 570 | 541 | 5 | |||||||||||||||||||||||||||
U.S. deferred | 1,015 | 1,024 | (1 | ) | 926 | 928 | — | 824 | 865 | (5 | ) | |||||||||||||||||||||||||
|
|
|
|
|
| |||||||||||||||||||||||||||||||
Total U.S. domestic ADV | 2,866 | 2,798 | 2 | 2,733 | 2,692 | 2 | 2,649 | 2,616 | 1 | |||||||||||||||||||||||||||
|
|
|
|
|
| |||||||||||||||||||||||||||||||
International priority | 386 | 398 | (3 | ) | 393 | 410 | (4 | ) | 385 | 389 | (1 | ) | ||||||||||||||||||||||||
International economy | 179 | 175 | 2 | 180 | 175 | 3 | 178 | 176 | 1 | |||||||||||||||||||||||||||
|
|
|
|
|
| |||||||||||||||||||||||||||||||
Total international export ADV | 565 | 573 | (1 | ) | 573 | 585 | (2 | ) | 563 | 565 | — | |||||||||||||||||||||||||
|
|
|
|
|
| |||||||||||||||||||||||||||||||
International domestic(2) | 878 | 831 | 6 | 895 | 854 | 5 | 875 | 855 | 2 | |||||||||||||||||||||||||||
|
|
|
|
|
| |||||||||||||||||||||||||||||||
Total ADV | 4,309 | 4,202 | 3 | 4,201 | 4,131 | 2 | 4,087 | 4,036 | 1 | |||||||||||||||||||||||||||
|
|
|
|
|
| |||||||||||||||||||||||||||||||
Revenue per package (yield): | ||||||||||||||||||||||||||||||||||||
U.S. overnight box | $ | 20.56 | $ | 20.85 | (1 | ) | $ | 20.77 | $ | 21.34 | (3 | ) | $ | 21.11 | $ | 21.08 | — | |||||||||||||||||||
U.S. overnight envelope | 12.11 | 12.07 | — | 11.99 | 12.18 | (2 | ) | 11.96 | 11.99 | — | ||||||||||||||||||||||||||
U.S. deferred | 14.48 | 13.88 | 4 | 14.52 | 14.32 | 1 | 15.12 | 14.52 | 4 | |||||||||||||||||||||||||||
U.S. domestic composite | 16.83 | 16.68 | 1 | 16.93 | 17.15 | (1 | ) | 17.28 | 17.03 | 1 | ||||||||||||||||||||||||||
International priority | 55.35 | 58.40 | (5 | ) | 56.59 | 60.79 | (7 | ) | 57.30 | 57.86 | (1 | ) | ||||||||||||||||||||||||
International economy | 48.36 | 50.60 | (4 | ) | 49.02 | 52.03 | (6 | ) | 50.48 | 50.18 | 1 | |||||||||||||||||||||||||
International export composite | 53.14 | 56.01 | (5 | ) | 54.21 | 58.17 | (7 | ) | 55.15 | 55.47 | (1 | ) | ||||||||||||||||||||||||
International domestic(2) | 5.47 | 6.28 | (13 | ) | 5.65 | 6.67 | (15 | ) | 5.62 | 5.88 | (4 | ) | ||||||||||||||||||||||||
Composite package yield | 19.27 | 19.99 | (4 | ) | 19.61 | 20.80 | (6 | ) | 20.00 | 20.05 | — | |||||||||||||||||||||||||
Freight Statistics(1) | ||||||||||||||||||||||||||||||||||||
Average daily freight pounds: | ||||||||||||||||||||||||||||||||||||
U.S. | 8,340 | 8,145 | 2 | 7,937 | 7,831 | 1 | 8,067 | 7,278 | 11 | |||||||||||||||||||||||||||
International priority | 2,414 | 2,823 | (14 | ) | 2,503 | 2,866 | (13 | ) | 2,534 | 2,491 | 2 | |||||||||||||||||||||||||
International airfreight | 622 | 718 | (13 | ) | 636 | 673 | (5 | ) | 585 | 609 | (4 | ) | ||||||||||||||||||||||||
|
|
|
|
|
| |||||||||||||||||||||||||||||||
Total average daily freight pounds | 11,376 | 11,686 | (3 | ) | 11,076 | 11,370 | (3 | ) | 11,186 | 10,378 | 8 | |||||||||||||||||||||||||
|
|
|
|
|
| |||||||||||||||||||||||||||||||
Revenue per pound (yield): | ||||||||||||||||||||||||||||||||||||
U.S. | $ | 1.23 | $ | 1.13 | 9 | $ | 1.19 | $ | 1.17 | 2 | $ | 1.18 | $ | 1.21 | (2 | ) | ||||||||||||||||||||
International priority | 2.14 | 2.11 | 1 | 2.15 | 2.17 | (1 | ) | 2.19 | 2.16 | 1 | ||||||||||||||||||||||||||
International airfreight | 0.76 | 1.00 | (24 | ) | 0.81 | 1.04 | (22 | ) | 0.70 | 0.92 | (24 | ) | ||||||||||||||||||||||||
Composite freight yield | 1.40 | 1.36 | 3 | 1.38 | 1.42 | (3 | ) | 1.38 | 1.42 | (3 | ) | |||||||||||||||||||||||||
| (1) | Package and freight statistics include only the operations of FedEx Express. |
| (2) | International domestic statistics represent our international intra-country |
- 40 -
FedEx Express Segment Revenues
FedEx Express segment revenues decreasedincreased 1% in the thirdfirst quarter and 4% in the nine months of 2016 primarily2017 due to improved base yields and package volume and freight pounds growth, which was largely offset by lower fuel surcharges and slightly unfavorable exchange rates. These factors were partially offset by improved U.S. domestic and international export yield management and U.S. domestic volume growth. Revenuesaverage daily volumes increased 1% in the nine monthsfirst quarter of 2016 also benefited from one additional operating day.
2017 driven by our overnight service offerings. U.S. domestic yields increased 1% in the thirdfirst quarter of 2017 due to higher base rates and were partially offset by the negative impact of lower fuel surcharges andsurcharges. Freight average daily pounds increased 8% in the first quarter of 2017 due to higher U.S. Postal Service volume. International export yields decreased 1% in the nine monthsfirst quarter of 2016 due to the negative impact of lower fuel surcharges, which were partially offset by higher base rates. U.S. domestic volumes increased 2% in the third quarter and nine months of 2016 driven by our overnight service offerings. International export yields decreased 5% in the third quarter and 7% in the nine months of 20162017 due to the negative impact of lower fuel surcharges and unfavorable exchange rates whichand were partially offset by higher base rates. Freight yields decreased 3% in the nine months of 2016 as the negative impact of lower
- 41 -
Our fuel surcharges and unfavorable exchange rates offset higher base rates. International domestic revenues declined 8% in the third quarter and 11% in the nine months of 2016 dueare indexed to the negative impact of unfavorable exchange rates, which were partially offset by increased volumes.
Ourspot price for jet fuel. Using this index, the U.S. domestic and outbound fuel surcharge percentages and the international fuel surchargessurcharge percentages ranged as follows for the three-month periods ended February 29, 2016 and February 28, 2015:August 31:
| Three Months Ended | Nine Months Ended | |||||||||||||||||||||||
| 2016 | 2015 | 2016 | 2015 | 2016 | 2015 | |||||||||||||||||||
U.S. Domestic and Outbound Fuel Surcharge: | ||||||||||||||||||||||||
Low | 0.75 | % | 3.50 | % | 0.75 | % | 3.50 | % | 1.00 | % | 3.00 | % | ||||||||||||
High | 2.75 | 6.00 | 4.00 | 9.50 | 2.50 | 4.00 | ||||||||||||||||||
Weighted-average | 2.00 | 4.80 | 2.40 | 7.62 | 1.83 | 3.34 | ||||||||||||||||||
International Fuel Surcharges: | ||||||||||||||||||||||||
Low | 0.75 | 0.50 | 0.75 | 0.50 | 1.00 | 3.00 | ||||||||||||||||||
High | 9.50 | 15.00 | 12.00 | 18.00 | 9.50 | 12.00 | ||||||||||||||||||
Weighted-average | 5.83 | 11.57 | 7.08 | 14.49 | 5.69 | 8.82 | ||||||||||||||||||
On September 19, 2016, FedEx Express announced a 3.9% average list price increase for U.S. domestic, U.S. export and U.S. import services and a change to the U.S. domestic dimensional weight divisor effective January 2, 2017. In addition, FedEx Express fuel surcharges will be adjusted on a weekly basis compared to the current monthly adjustment, effective February 6, 2017. On January 4, 2016, FedEx Express implemented a 4.9% average list price increase for FedEx Express U.S. domestic, U.S. export and U.S. import services. In addition, effective November 2, 2015, FedEx Express updated certain tables used to determine fuel surcharges. On February 2, 2015, FedEx Express updated the tables used to determine fuel surcharges. On January 5, 2015, FedEx Express implemented a 4.9% average list price increase for FedEx Express U.S. domestic, U.S. export and U.S. import services.
FedEx Express Segment Operating Income
FedEx Express continued to increase operating income, which was up 14%, and grew operating margin increased despite lower revenues110 basis points in the thirdfirst quarter of 2017 due to base yield improvement, volume growth and the continued benefits of cost management initiatives. In addition, results in the nine monthsfirst quarter of 2016. This increase was primarily driven by improved U.S. domestic2017 include approximately $22 million of TNT Express integration expenses. FedEx Express continues to manage network capacity to match customer demand, reduce structural costs, modernize our fleet and international export yield management and U.S. domestic volume growth, profit improvement program initiatives that continued to improve revenue quality and constrain expenses, lower international expenses due to currency exchange rates and the positive net impact of fuel. Also, operating income and operating margin benefited from one additional operating day in the nine months of 2016.drive productivity increases throughout its operations.
Salaries and employee benefits increased 1%3% in the thirdfirst quarter and nine months of 20162017 due to merit increases which were partially offset by a favorable exchange rate impact. Higher incentive compensation accruals also impacted salaries and employee benefits in the nine months of 2016. Purchased transportation decreased 11% in the third quarter and 9% in the nine months of 2016 driven by a favorable exchange rate impact. Aircraft retirements during 2015 caused depreciation and amortization expensestaffing to decrease 6% in the third quarter and nine months of 2016. Maintenance and repairs expense decreased 6% in the third quarter andsupport volume growth. Other expenses increased 7% in the nine monthsfirst quarter of 20162017 primarily due to TNT Express integration expenses of approximately $15 million. Purchased transportation expenses decreased 7% in the timingfirst quarter of prior year aircraft maintenance events.2017 driven by lower exchange rates.
- 41 -
Fuel expense decreased 35% in17% during the thirdfirst quarter and 39% in the nine months of 20162017 due to lower aircraft fuel prices. The net impact of fuel had a modest benefit in the third quarter and nine months of 2016 to operating income. See the “Fuel” section of this MD&A for a description and additional discussion of the net impact of fuel on our operating results.
- 42 -
TNT EXPRESS SEGMENT
TNT Express collects, transports and delivers documents, parcels and freight on a day-definite or time-definite basis. Services are primarily classified by the speed, distance, weight and size of shipments. Whereas the majority of shipments are between businesses, TNT Express also offers business-to-consumer services to select key customers. We acquired TNT Express in the fourth quarter of 2016. The following table presents revenues, operating expenses, operating expenses as a percent of revenue, operating income, operating margin (dollars in millions) and selected package statistics (in thousands, except yield amounts) for the three month period ended August 31:
| Percent of Revenue | ||||||||
| 2016 | 2016 | |||||||
Revenues | $ | 1,804 | 100.0 | % | ||||
Operating expenses: | ||||||||
Salaries and employee benefits | 521 | 28.9 | ||||||
Purchased transportation | 768 | 42.5 | ||||||
Rentals and landing fees | 86 | 4.8 | ||||||
Depreciation and amortization | 72 | 4.0 | ||||||
Fuel | 54 | 3.0 | ||||||
Maintenance and repairs | 36 | 2.0 | ||||||
Other | 281 | 15.6 | ||||||
|
|
|
| |||||
Total operating expenses | 1,818 | 100.8 | % | |||||
|
|
|
| |||||
Operating loss | $ | (14 | ) | |||||
|
| |||||||
Operating margin | (0.8 | )% | ||||||
Package: | ||||||||
Average daily packages | 919 | |||||||
Revenue per package (yield) | $ | 25.97 | ||||||
Freight: | ||||||||
Average daily pounds | 3,702 | |||||||
Revenue per pound (yield) | $ | 0.62 | ||||||
TNT Express fuel surcharges are indexed to the spot price for jet fuel. Using this index, the international fuel surcharge percentages ranged as follows for the three-month periods ended August 31:
| 2016 | ||||
International Fuel Surcharges: | ||||
Low | 6.50 | % | ||
High | 18.00 | |||
Weighted-average | 12.70 | |||
- 43 -
TNT Express Segment Results
The TNT Express segment was formed in the fourth quarter of 2016, following the acquisition of TNT Express on May 25, 2016. Since the date of acquisition, TNT Express has focused on maintaining its customer base while beginning integration activities with FedEx Express, as well as continuing to execute the Outlook program.
TNT Express revenues were $1.8 billion for the first quarter of 2017. However, TNT Express reported an operating loss in the first quarter of 2017 due to intangible asset amortization of $28 million and $20 million of Outlook restructuring and integration costs. Costs associated with the Outlook restructuring program are expected to continue through calendar year 2018 and integration costs are expected to continue through fiscal year 2020.
- 44 -
FEDEX GROUND SEGMENT
FedEx Ground service offerings include day-certain delivery to businesses in the U.S. and Canada and to nearly 100% of U.S. residences. On August 31, 2015, our FedEx SmartPost business was merged into FedEx Ground. The FedEx SmartPost service remains an important component of our FedEx Ground service offerings; however, for presentation purposes, FedEx SmartPost service revenues and operating statistics have been combined with our FedEx Ground service offerings. Also, on June 1, 2015, we prospectively began recording revenues associated with the FedEx SmartPost service on a gross basis and including postal fees in revenues and expenses, versus our previous net treatment, as discussed in our Annual Report. On January 30, 2015, we acquired GENCO, a leading North American third-party logistics provider. GENCO’s financial results are included in the following table from the date of acquisition, which has impacted the year-over-year comparability of revenue and operating expenses. The following tables compare revenues, operating expenses, operating expenses as a percent of revenue, operating income, operating margin (dollars in millions), operating margin and selected package statistics (in thousands, except yield amounts) for the three-month periods ended February 29, 2016 and February 28, 2015:August 31:
| Three Months Ended | Percent | Nine Months Ended | Percent | |||||||||||||||||||||
| 2016 | 2015 | Change | 2016 | 2015 | Change | |||||||||||||||||||
Revenues: | ||||||||||||||||||||||||
FedEx Ground | $ | 4,025 | $ | 3,306 | 22 | $ | 11,161 | $ | 9,329 | 20 | ||||||||||||||
GENCO | 383 | 87 | NM | 1,127 | 87 | NM | ||||||||||||||||||
|
|
|
|
|
|
|
|
|
|
|
| |||||||||||||
Total revenues | 4,408 | 3,393 | 30 | 12,288 | 9,416 | 31 | ||||||||||||||||||
|
|
|
|
|
|
|
|
|
|
|
| |||||||||||||
Operating expenses: | ||||||||||||||||||||||||
Salaries and employee benefits | 756 | 564 | 34 | 2,105 | 1,497 | 41 | ||||||||||||||||||
Purchased transportation | 1,891 | 1,348 | 40 | 5,130 | 3,765 | 36 | ||||||||||||||||||
Rentals | 166 | 126 | 32 | 466 | 349 | 34 | ||||||||||||||||||
Depreciation and amortization | 159 | 136 | 17 | 451 | 381 | 18 | ||||||||||||||||||
Fuel | 3 | 3 | — | 8 | 9 | (11 | ) | |||||||||||||||||
Maintenance and repairs | 71 | 61 | 16 | 209 | 174 | 20 | ||||||||||||||||||
Intercompany charges | 312 | 281 | 11 | 910 | 834 | 9 | ||||||||||||||||||
Other | 493 | 315 | 57 | 1,389 | 838 | 66 | ||||||||||||||||||
|
|
|
|
|
|
|
| |||||||||||||||||
Total operating expenses | 3,851 | 2,834 | 36 | 10,668 | 7,847 | 36 | ||||||||||||||||||
|
|
|
|
|
|
|
| |||||||||||||||||
Operating income | $ | 557 | $ | 559 | — | $ | 1,620 | $ | 1,569 | 3 | ||||||||||||||
|
|
|
|
|
|
|
| |||||||||||||||||
Operating margin | 12.6 | % | 16.5 | % | (390 | )bp | 13.2 | % | 16.7 | % | (350 | )bp | ||||||||||||
Average daily package volume | ||||||||||||||||||||||||
FedEx Ground | 8,339 | 7,496 | 11 | 7,551 | 6,970 | 8 | ||||||||||||||||||
Revenue per package (yield) | ||||||||||||||||||||||||
FedEx Ground | $ | 7.65 | $ | 7.06 | 8 | $ | 7.72 | $ | 7.06 | 9 | ||||||||||||||
- 43 -
| Percent of Revenue | 2016 | 2015 | Percent Change | |||||||||||||||||||||||||||||||||
Revenues: | ||||||||||||||||||||||||||||||||||||
FedEx Ground | $ | 3,891 | $ | 3,460 | 12 | Percent of Revenue | ||||||||||||||||||||||||||||||
| Three Months Ended | Nine Months Ended |
|
| |||||||||||||||||||||||||||||||||
GENCO | 399 | 370 | 8 | 2016 | 2015 | |||||||||||||||||||||||||||||||
|
|
|
| |||||||||||||||||||||||||||||||||
Total revenues | 4,290 | 3,830 | 12 | 100.0 | % | 100.0 | % | |||||||||||||||||||||||||||||
| 2016 | 2015 | 2016 | 2015 |
|
| |||||||||||||||||||||||||||||||
Operating expenses: | ||||||||||||||||||||||||||||||||||||
Salaries and employee benefits | 17.1 | % | 16.6 | % | 17.1 | % | 15.9 | % | 766 | 653 | 17 | 17.9 | 17.0 | |||||||||||||||||||||||
Purchased transportation | 42.9 | 39.7 | 41.7 | 40.0 | 1,692 | 1,527 | 11 | 39.4 | 39.9 | |||||||||||||||||||||||||||
Rentals | 3.8 | 3.7 | 3.8 | 3.7 | 181 | 145 | 25 | 4.2 | 3.8 | |||||||||||||||||||||||||||
Depreciation and amortization | 3.6 | 4.0 | 3.7 | 4.0 | 163 | 146 | 12 | 3.8 | 3.8 | |||||||||||||||||||||||||||
Fuel | 0.1 | 0.1 | 0.1 | 0.1 | 2 | 3 | (33 | ) | — | 0.1 | ||||||||||||||||||||||||||
Maintenance and repairs | 1.6 | 1.8 | 1.7 | 1.8 | 76 | 69 | 10 | 1.8 | 1.8 | |||||||||||||||||||||||||||
Intercompany charges | 7.1 | 8.3 | 7.4 | 8.9 | 325 | 297 | 9 | 7.6 | 7.8 | |||||||||||||||||||||||||||
Other | 11.2 | 9.3 | 11.3 | 8.9 | 475 | 453 | 5 | 11.1 | 11.8 | |||||||||||||||||||||||||||
|
|
|
|
|
|
|
| |||||||||||||||||||||||||||||
Total operating expenses | 87.4 | 83.5 | 86.8 | 83.3 | 3,680 | 3,293 | 12 | 85.8 | % | 86.0 | % | |||||||||||||||||||||||||
|
|
|
|
|
|
|
| |||||||||||||||||||||||||||||
Operating income | $ | 610 | $ | 537 | 14 | |||||||||||||||||||||||||||||||
|
| |||||||||||||||||||||||||||||||||||
Operating margin | 12.6 | % | 16.5 | % | 13.2 | % | 16.7 | % | 14.2 | % | 14.0 | % | 20 | bp | ||||||||||||||||||||||
|
|
|
| |||||||||||||||||||||||||||||||||
Average daily package volume | ||||||||||||||||||||||||||||||||||||
FedEx Ground | 7,389 | 6,717 | 10 | |||||||||||||||||||||||||||||||||
Revenue per package (yield) | ||||||||||||||||||||||||||||||||||||
FedEx Ground | $ | 8.09 | $ | 7.91 | 2 | |||||||||||||||||||||||||||||||
FedEx Ground Segment Revenues
FedEx Ground segment revenues increased 30% in12% during the thirdfirst quarter and 31% in the nine months of 20162017 due to volume and yield growth at FedEx Ground and the inclusion of GENCO revenue, which were partially offset by lower fuel surcharges. Revenues increased approximately $350 million in the third quarter and $890 million in the nine months of 2016 as a result of recording FedEx SmartPost revenues on a gross basis, versus our previous net treatment, as further discussed in our Annual Report.
Average daily volume at FedEx Ground increased 11% in10% during the thirdfirst quarter and 8% in the nine months of 20162017 primarily due to continued growth in our residential services driven by e-commerce.e-commerce, as well as our commercial business. FedEx Ground yield increased 8%2% during the thirdfirst quarter and 9% in the nine months of 20162017 primarily due to the recording of FedEx SmartPost revenues on a gross basis, versus our previous net treatment and increasedhigher base rates,yields, which include additional dimensional weight charges. These factors were partially offset by lower fuel surcharges.
The FedEx Ground fuel surcharge is based on a rounded average of the national U.S. on-highway average price for a gallon of diesel fuel, as published by the Department of Energy. Our fuel surcharge percentages ranged as follows for the three-month periods ended February 29, 2016 and February 28, 2015:August 31:
| Three Months Ended | Nine Months Ended | |||||||||||||||||||||||
| 2016 | 2015 | 2016 | 2015 | 2016 | 2015 | |||||||||||||||||||
Low | 3.80 | % | 5.50 | % | 3.50 | % | 5.50 | % | 3.30 | % | 4.00 | % | ||||||||||||
High | 4.30 | 6.00 | 4.50 | 7.00 | 4.00 | 4.50 | ||||||||||||||||||
Weighted-average | 4.00 | 5.85 | 4.10 | 6.38 | 3.70 | 4.30 | ||||||||||||||||||
On September 19, 2016, FedEx Ground announced a 4.9% average list price increase and a change to the U.S. domestic dimensional weight divisor effective January 2, 2017. In addition, FedEx Ground fuel surcharges will be adjusted on a weekly basis compared to the current monthly adjustment, effective February 6, 2017. On January 4, 2016, FedEx Ground implemented a 4.9% increase in average list price. In addition, on November 2, 2015, FedEx Ground increased surcharges for shipments that exceed the published maximum weight or dimensional limits and updated certain tables used to determine fuel surcharges. On February 2, 2015, FedEx Ground updated the tables used to determine fuel surcharges. On January 5, 2015, FedEx Ground implemented a 4.9% increase in average list price. In addition, on January 5, 2015, FedEx Ground began applying dimensional weight pricing to all shipments.
- 45 -
FedEx Ground Segment Operating Income
FedEx Ground segment operating income was flat inand margin increased during the thirdfirst quarter as higher volumes were offset by higher costs driven significantly by network expansion and by our peak season demand that exceeded bothof 2017 due to volume and package size expectations. Additionally, higheryield growth and lower self-insurance expenses and increased purchased transportation rates negatively impacted operating income in the third quarter of 2016. Operating income in the nine months of 2016 increased 3% due to higher volumes and increased yield, as well as the benefit from one additional operating day.costs. These factors were partially offset by network expansion costs, higher self-insurance expenses, increased purchased transportation rates and higher operational costs during our peak season.
- 44 -
Operating margin decreased in the third quarter of 2016 due to the recording of FedEx SmartPost revenues on a gross basis, increased operational costs during our peak seasoncontinued network expansion and higher self-insurance expenses. In the nine months of 2016, operating margin decreased due to the recording of FedEx SmartPost revenues on a gross basis, the inclusion of GENCO results, and higher self-insurance expenses. The change in FedEx SmartPost revenue recognition and the inclusion of GENCO collectively decreased operating margin by 190 basis points in the third quarter and 210 basis points in the nine months of 2016.purchased transportation rates.
The inclusion of GENCO in the FedEx Ground segment results has impacted the year-over-year comparability of all operating expenses. Along with incremental costs from GENCO, purchasedPurchased transportation expense increased 40%11% in the thirdfirst quarter and 36% in the nine months of 20162017 due to the recording of FedEx SmartPost revenues on a gross basis, as further discussed in this MD&A, and higher volumes and increased rates. Salaries and employee benefits expense increased 34% in17% during the thirdfirst quarter and 41% in the nine months of 20162017 due to the inclusion of GENCO resultsvolume growth and additional staffing to support volume growth. Higher healthcare costs also impacted salaries and employee benefits in the nine months of 2016. Other expenses increased 57% in the third quarter and 66% in the nine months of 2016 primarily due to the addition of GENCO results and higher self-insurance costs.network expansion. Rentals expense increased 32% in the third quarter25% and 34% in the nine months of 2016 due to network expansion and the inclusion of GENCO results. Depreciationdepreciation and amortization expense increased 17%12% in the thirdfirst quarter and 18% in the nine months of 20162017 due to the inclusion of GENCO results and network expansion.
Independent Contractor Model
FedEx Ground is involved in numerous lawsuits and other proceedings (such as state tax or other administrative challenges) where the classification of its independent contractors is at issue. During the third quarter of 2016, we reached agreements in principle to settle all of the 19 cases on appeal in the multidistrict litigation. These cases involve a contractor model which FedEx Ground has not operated since 2011. In addition, we are defending contractor-model cases that are not or are no longer part of the multidistrict litigation. These cases are in varying stages of litigation. We will continue to vigorously defend ourselves in these proceedings and continue to believe that FedEx Ground’s owner-operators are properly classified as independent contractors and that FedEx Ground is not employeesan employer of FedEx Ground.the drivers of the company’s independent contractors. For a description of these proceedings, see Note 8 of the accompanying unaudited condensed consolidated financial statements.
For additional information on the FedEx Ground Independent Service Provider model, see Part 1, Item 1 of our Annual Report under the caption “Independent Contractor Model” and “Other Outlook Matters” under Consolidated Results.Results of this MD&A.
- 4546 -
FEDEX FREIGHT SEGMENT
FedEx Freight service offerings include priority services when speed is critical and economy services when time can be traded for savings. The following tables comparetable compares revenues, operating expenses, operating expenses as a percent of revenue, operating income, operating margin (dollars in millions), operating margin and selected statistics for the three-month periods ended February 29, 2016 and February 28, 2015:August 31:
| Three Months Ended | Percent | Nine Months Ended | Percent | |||||||||||||||||||||
| 2016 | 2015 | Change | 2016 | 2015 | Change | |||||||||||||||||||
Revenues | $ | 1,447 | $ | 1,428 | 1 | $ | 4,595 | $ | 4,622 | (1 | ) | |||||||||||||
Operating expenses: | ||||||||||||||||||||||||
Salaries and employee benefits | 716 | 664 | 8 | 2,168 | 2,006 | 8 | ||||||||||||||||||
Purchased transportation | 223 | 235 | (5 | ) | 720 | 792 | (9 | ) | ||||||||||||||||
Rentals | 33 | 33 | — | 109 | 96 | 14 | ||||||||||||||||||
Depreciation and amortization | 65 | 54 | 20 | 185 | 170 | 9 | ||||||||||||||||||
Fuel | 80 | 109 | (27 | ) | 277 | 399 | (31 | ) | ||||||||||||||||
Maintenance and repairs | 48 | 49 | (2 | ) | 154 | 148 | 4 | |||||||||||||||||
Intercompany charges | 112 | 108 | 4 | 337 | 329 | 2 | ||||||||||||||||||
Other | 114 | 109 | 5 | 356 | 335 | 6 | ||||||||||||||||||
|
|
|
|
|
|
|
| |||||||||||||||||
Total operating expenses | 1,391 | 1,361 | 2 | 4,306 | 4,275 | 1 | ||||||||||||||||||
|
|
|
|
|
|
|
| |||||||||||||||||
Operating income | $ | 56 | $ | 67 | (16 | ) | $ | 289 | $ | 347 | (17 | ) | ||||||||||||
|
|
|
|
|
|
|
| |||||||||||||||||
Operating margin | 3.9 | % | 4.7 | % | (80 | )bp | 6.3 | % | 7.5 | % | (120 | )bp | ||||||||||||
Average daily LTL shipments (in thousands) | ||||||||||||||||||||||||
Priority | 64.7 | 62.0 | 4 | 66.7 | 67.1 | (1 | ) | |||||||||||||||||
Economy | 30.0 | 26.8 | 12 | 30.7 | 28.4 | 8 | ||||||||||||||||||
|
|
|
|
|
|
|
| |||||||||||||||||
Total average daily LTL shipments | 94.7 | 88.8 | 7 | 97.4 | 95.5 | 2 | ||||||||||||||||||
|
|
|
|
|
|
|
| |||||||||||||||||
Weight per LTL shipment (lbs) | ||||||||||||||||||||||||
Priority | 1,189 | 1,287 | (8 | ) | 1,189 | 1,262 | (6 | ) | ||||||||||||||||
Economy | 1,152 | 1,007 | 14 | 1,154 | 1,010 | 14 | ||||||||||||||||||
Composite weight per LTL shipment | 1,177 | 1,203 | (2 | ) | 1,178 | 1,187 | (1 | ) | ||||||||||||||||
LTL revenue per shipment | ||||||||||||||||||||||||
Priority | $ | 218.15 | $ | 231.92 | (6 | ) | $ | 220.03 | $ | 229.43 | (4 | ) | ||||||||||||
Economy | 258.35 | 265.66 | (3 | ) | 263.84 | 265.51 | (1 | ) | ||||||||||||||||
Composite LTL revenue per shipment | $ | 231.61 | $ | 242.52 | (4 | ) | $ | 234.07 | $ | 240.30 | (3 | ) | ||||||||||||
LTL yield (revenue per hundredweight) | ||||||||||||||||||||||||
Priority | $ | 18.35 | $ | 18.02 | 2 | $ | 18.51 | $ | 18.18 | 2 | ||||||||||||||
Economy | 22.42 | 26.38 | (15 | ) | 22.86 | 26.29 | (13 | ) | ||||||||||||||||
Composite LTL yield | $ | 19.67 | $ | 20.17 | (2 | ) | $ | 19.87 | $ | 20.24 | (2 | ) | ||||||||||||
- 46 -
| Percent of Revenue | Percent | Percent of Revenue | ||||||||||||||||||||||||||||||||||
| Three Months Ended | Nine Months Ended | 2016 | 2015 | Change | 2016 | 2015 | ||||||||||||||||||||||||||||||
| 2016 | 2015 | 2016 | 2015 | |||||||||||||||||||||||||||||||||
Revenues | $ | 1,658 | $ | 1,601 | 4 | 100.0 | % | 100.0 | % | |||||||||||||||||||||||||||
Operating expenses: | ||||||||||||||||||||||||||||||||||||
Salaries and employee benefits | 49.5 | % | 46.5 | % | 47.2 | % | 43.4 | % | 772 | 721 | 7 | 46.6 | 45.0 | |||||||||||||||||||||||
Purchased transportation | 15.4 | 16.5 | 15.7 | 17.1 | 259 | 251 | 3 | 15.6 | 15.7 | |||||||||||||||||||||||||||
Rentals | 2.3 | 2.3 | 2.4 | 2.1 | 30 | 43 | (30 | ) | 1.8 | 2.7 | ||||||||||||||||||||||||||
Depreciation and amortization | 4.5 | 3.8 | 4.0 | 3.7 | 64 | 59 | 8 | 3.9 | 3.7 | |||||||||||||||||||||||||||
Fuel | 5.5 | 7.6 | 6.0 | 8.6 | 91 | 102 | (11 | ) | 5.5 | 6.4 | ||||||||||||||||||||||||||
Maintenance and repairs | 3.3 | 3.4 | 3.4 | 3.2 | 54 | 53 | 2 | 3.2 | 3.3 | |||||||||||||||||||||||||||
Intercompany charges | 7.7 | 7.6 | 7.3 | 7.1 | 126 | 113 | 12 | 7.6 | 7.1 | |||||||||||||||||||||||||||
Other | 7.9 | 7.6 | 7.7 | 7.3 | 127 | 127 | — | 7.7 | 7.9 | |||||||||||||||||||||||||||
|
|
|
|
|
|
|
| |||||||||||||||||||||||||||||
Total operating expenses | 96.1 | 95.3 | 93.7 | 92.5 | 1,523 | 1,469 | 4 | 91.9 | % | 91.8 | % | |||||||||||||||||||||||||
|
|
|
|
|
|
|
| |||||||||||||||||||||||||||||
Operating income | $ | 135 | $ | 132 | 2 | |||||||||||||||||||||||||||||||
|
| |||||||||||||||||||||||||||||||||||
Operating margin | 3.9 | % | 4.7 | % | 6.3 | % | 7.5 | % | 8.1 | % | 8.2 | % | (10 | )bp | ||||||||||||||||||||||
|
|
|
| |||||||||||||||||||||||||||||||||
Average daily LTL shipments (in thousands) | ||||||||||||||||||||||||||||||||||||
Priority | 72.5 | 66.5 | 9 | |||||||||||||||||||||||||||||||||
Economy | 32.3 | 30.7 | 5 | |||||||||||||||||||||||||||||||||
|
| |||||||||||||||||||||||||||||||||||
Total average daily LTL shipments | 104.8 | 97.2 | 8 | |||||||||||||||||||||||||||||||||
|
| |||||||||||||||||||||||||||||||||||
Weight per LTL shipment (lbs) | ||||||||||||||||||||||||||||||||||||
Priority | 1,176 | 1,198 | (2 | ) | ||||||||||||||||||||||||||||||||
Economy | 1,098 | 1,168 | (6 | ) | ||||||||||||||||||||||||||||||||
Composite weight per LTL shipment | 1,152 | 1,189 | (3 | ) | ||||||||||||||||||||||||||||||||
LTL revenue per shipment | ||||||||||||||||||||||||||||||||||||
Priority | $ | 217.50 | $ | 223.26 | (3 | ) | ||||||||||||||||||||||||||||||
Economy | 255.46 | 269.33 | (5 | ) | ||||||||||||||||||||||||||||||||
Composite LTL revenue per shipment | $ | 229.20 | $ | 237.81 | (4 | ) | ||||||||||||||||||||||||||||||
LTL revenue per hundredweight | ||||||||||||||||||||||||||||||||||||
Priority | $ | 18.49 | $ | 18.63 | (1 | ) | ||||||||||||||||||||||||||||||
Economy | 23.26 | 23.06 | 1 | |||||||||||||||||||||||||||||||||
Composite LTL revenue per hundredweight | $ | 19.89 | $ | 20.01 | (1 | ) | ||||||||||||||||||||||||||||||
FedEx Freight Segment Revenues
FedEx Freight segment revenues increased 1% in4% during the thirdfirst quarter of 2017 due to higher average daily LTL shipments, which werewas partially offset by lower fuel surcharges. Revenues decreased 1% in the nine months of 2016 as lower fuel surcharges more than offset higher average daily shipments and the benefit of one additional operating day.revenue per shipment. Average daily LTL shipments increased 7%8% in the thirdfirst quarter and 2% in the nine months of 20162017 primarily due to continued increased volume related tovolumes from small and mid-sized customers. LTL revenue per shipment decreased 4% in the thirdfirst quarter and 3% in the nine months of 20162017 due to lower fuel surcharges and lower weight per shipment.
- 47 -
The weekly indexed LTL fuel surcharge is based on the average of the national U.S. on-highway average pricesprice for a gallon of diesel fuel, as published by the Department of Energy. The indexed LTL fuel surcharge percentages ranged as follows for the three-month periods ended February 29, 2016 and February 28, 2015:August 31:
| Three Months Ended | Nine Months Ended | |||||||||||||||||||||||
| 2016 | 2015 | 2016 | 2015 | 2016 | 2015 | |||||||||||||||||||
Low | 18.50 | % | 20.90 | % | 18.50 | % | 20.90 | % | 20.20 | % | 21.40 | % | ||||||||||||
High | 20.70 | 24.60 | 23.10 | 26.20 | 20.80 | 23.10 | ||||||||||||||||||
Weighted-average | 19.50 | 22.70 | 21.00 | 24.70 | 20.50 | 22.40 | ||||||||||||||||||
On September 19, 2016, FedEx Freight announced a 4.9% average increase in certain U.S. and other shipping rates effective January 2, 2017. On January 4, 2016, FedEx Freight implemented zone-based pricing on U.S. and other LTL shipping rates. Also, on January 4, 2016, FedEx Freight implemented a 4.9% average increase in certain U.S. and other shipping rates. On February 2, 2015, FedEx Freight updated the tables used to determine fuel surcharges. On January 5, 2015, FedEx Freight implemented a 4.9% average increase in certain U.S. and other shipping rates.
FedEx Freight Segment Operating Income
FedEx Freight segment operating income and operating margin decreased in the third quarter and nine months of 2016increased 2% primarily due to salaries and employee benefits expense outpacing volume growth, as well ashigher volumes. This increase was partially offset by lower LTL revenue per shipment, which also drove a facility closure chargedecline in the nine months of 2016. Within operating expenses, salariesmargin. Salaries and employee benefits increased 8%7% in the thirdfirst quarter and nine months of 2016 driven by pay initiatives and increased staffing levels for higher shipment volumes. Other expenses increased 6% in the nine months of 2016 primarily2017 due to higher insurance claims, a legal reserve, and higher supplies expense. Depreciation and amortizationstaffing levels to support volume growth. Purchased transportation expense increased 20%3% in the thirdfirst quarter and 9%of 2017 due to higher volumes. Rentals decreased 30% in the nine monthsfirst quarter of 2016 due to investments in transportation equipment. Rentals increased 14% in the nine months of 20162017 driven primarily by a charge related to a facility closure. Purchased transportation expense decreased 5%closure in the third quarterprior year and 9%a credit related to the favorable sublease of the facility in the nine months of 2016 due to lower rates and lower utilization of third-party transportation providers.
- 47 -
Fuel expense decreased 27% in the third quarter and 31% in the nine months of 2016 due to lower average price per gallon of diesel fuel. See the “Fuel” section of this MD&A for a description and additional discussion of the net impact of fuel on our operating results.current year.
- 48 -
FINANCIAL CONDITION
LIQUIDITY
Cash and cash equivalents totaled $2.8$3.0 billion at February 29,August 31, 2016, compared to $3.8$3.5 billion at May 31, 2015.2016. The following table provides a summary of our cash flows for the nine month-periodsthree-month periods ended February 29, 2016 and February 28, 2015August 31 (in millions):
| 2016 | 2015 | 2016 | 2015 | |||||||||||||
Operating activities: | ||||||||||||||||
Net income | $ | 1,890 | $ | 1,944 | $ | 715 | $ | 692 | ||||||||
Noncash charges and credits | 2,457 | 2,392 | 1,008 | 749 | ||||||||||||
Changes in assets and liabilities | (551 | ) | (863 | ) | (752 | ) | (200 | ) | ||||||||
|
|
|
| |||||||||||||
Cash provided by operating activities | 3,796 | 3,473 | 971 | 1,241 | ||||||||||||
|
|
|
| |||||||||||||
Investing activities: | ||||||||||||||||
Capital expenditures | (3,562 | ) | (2,969 | ) | (1,215 | ) | (1,209 | ) | ||||||||
Business acquisitions, net of cash acquired | — | (1,429 | ) | |||||||||||||
Asset dispositions and other, net | (17 | ) | 16 | |||||||||||||
Proceeds from asset dispositions and other | 9 | 10 | ||||||||||||||
|
|
|
| |||||||||||||
Cash used in investing activities | (3,579 | ) | (4,382 | ) | (1,206 | ) | (1,199 | ) | ||||||||
|
|
|
| |||||||||||||
Financing activities: | ||||||||||||||||
Principal payments on debt | (28 | ) | (1 | ) | (12 | ) | (15 | ) | ||||||||
Proceeds from debt issuances | 1,238 | 2,491 | ||||||||||||||
Proceeds from stock issuances | 79 | 272 | 40 | 46 | ||||||||||||
Excess tax benefit on the exercise of stock options | 2 | 6 | ||||||||||||||
Dividends paid | (210 | ) | (171 | ) | (106 | ) | (71 | ) | ||||||||
Purchases of treasury stock | (2,133 | ) | (1,016 | ) | ||||||||||||
Other | (7 | ) | 8 | |||||||||||||
Purchase of treasury stock | (222 | ) | (190 | ) | ||||||||||||
Other, net | (15 | ) | — | |||||||||||||
|
|
|
| |||||||||||||
Cash (used in) provided by financing activities | (1,061 | ) | 1,583 | |||||||||||||
Cash used in financing activities | (313 | ) | (224 | ) | ||||||||||||
|
|
|
| |||||||||||||
Effect of exchange rate changes on cash | (78 | ) | (104 | ) | 3 | (38 | ) | |||||||||
|
|
|
| |||||||||||||
Net (decrease) increase in cash and cash equivalents | $ | (922 | ) | $ | 570 | |||||||||||
Net decrease in cash and cash equivalents | (545 | ) | (220 | ) | ||||||||||||
|
|
|
| |||||||||||||
Cash and cash equivalents at the end of period | $ | 2,841 | $ | 3,478 | $ | 2,989 | $ | 3,543 | ||||||||
|
|
|
| |||||||||||||
Cash flows from operating activities increased $323decreased $270 million in the nine monthsfirst quarter of 2016 primarily2017 predominantly due to higher segment operating income, which was partially offset by the timing of cash payments.variable compensation payouts and higher pension contributions. Capital expenditures during the ninefirst three months of 20162017 were higher than capital expenditures in the first three months of 2016, primarily due to increased spending for sort facility expansion at FedEx Ground and aircraft at FedEx Express.Ground. See “Capital Resources” for a discussion of capital expenditures during 20162017 and 2015.2016.
During the second quarter of 2016, we issued $1.25 billion of senior unsecured debt under our current shelf registration statement. We utilized the net proceeds for working capital and general corporate purposes, including share repurchases. See Note 3 of the accompanying unaudited condensed consolidated financial statements for further discussion of this debt.
In January 2016, the stock repurchase authorization announced in September 2014 for 15 million shares was completed. On January 26, 2016, our Board of Directors approved a new share repurchase program of up to 25 million shares. During the first quarter of 2017, we repurchased 1.4 million shares of FedEx common stock at an average price of $160.18 per share for a total of $222 million. As of August 31, 2016, 17.6 million shares remained under the share repurchase authorization. Shares under the newcurrent repurchase program may be repurchased from time to time in the open market or in privately negotiated transactions. The timing and volume of repurchases are at the discretion of management, based on the capital needs of the business, the market price of FedEx common stock and general market conditions. No time limit was set for the completion of the program, and the program may be suspended or discontinued at any time.
- 49 -
During the third quarter of 2016, we repurchased 7.3 million shares of FedEx common stock at an average price of $140.42 per share for a total of $1.0 billion. As of February 29, 2016, 22.8 million shares remained under the share repurchase authorization. Stock repurchases had a $0.07 year-over-year positive impact on the third quarter earnings per diluted share and a $0.12 positive impact on the nine months of 2016 earnings per diluted share (net of interest expense on debt used to fund a portion of the repurchases).
CAPITAL RESOURCES
Our operations are capital intensive, characterized by significant investments in aircraft, vehicles, technology, facilities, and package-handling and sort equipment. The amount and timing of capital additions depend on various factors, including pre-existing contractual commitments, anticipated volume growth, domestic and international economic conditions, new or enhanced services, geographical expansion of services, availability of satisfactory financing and actions of regulatory authorities.
- 49 -
The following table compares capital expenditures by asset category and reportable segment for the three-month periods ended February 29, 2016 and February 28, 2015August 31 (in millions):
| Percent Change | ||||||||||||||||||||||||||||||||||||||||
| 2016/2015 | ||||||||||||||||||||||||||||||||||||||||
| Three Months Ended | Nine Months Ended | Three Months Ended | Nine Months Ended | Dollar | Percent | |||||||||||||||||||||||||||||||||||
| 2016 | 2015 | 2016 | 2015 | 2016 | 2015 | Change | Change | |||||||||||||||||||||||||||||||||
Aircraft and related equipment | $ | 230 | 472 | 1,388 | 1,270 | (51 | ) | 9 | $ | 592 | $ | 623 | $ | (31 | ) | (5 | ) | |||||||||||||||||||||||
Facilities and sort equipment | 408 | 294 | 1,067 | 746 | 39 | 43 | ||||||||||||||||||||||||||||||||||
Package handling and ground support equipment | 197 | 185 | 12 | 6 | ||||||||||||||||||||||||||||||||||||
Vehicles | 175 | 184 | 652 | 523 | (5 | ) | 25 | 149 | 218 | (69 | ) | (32 | ) | |||||||||||||||||||||||||||
Information and technology investments | 95 | 59 | 256 | 209 | 61 | 22 | ||||||||||||||||||||||||||||||||||
Other equipment | 92 | 71 | 199 | 221 | 30 | (10 | ) | |||||||||||||||||||||||||||||||||
Information technology investments | 159 | 74 | 85 | 115 | ||||||||||||||||||||||||||||||||||||
Facilities and other | 118 | 109 | 9 | 8 | ||||||||||||||||||||||||||||||||||||
|
|
|
|
|
|
| ||||||||||||||||||||||||||||||||||
Total capital expenditures | $ | 1,000 | $ | 1,080 | $ | 3,562 | $ | 2,969 | (7 | ) | 20 | $ | 1,215 | $ | 1,209 | $ | 6 | — | ||||||||||||||||||||||
|
|
|
|
|
|
| ||||||||||||||||||||||||||||||||||
FedEx Express segment | $ | 345 | 569 | 1,865 | 1,649 | (39 | ) | 13 | 775 | 834 | (59 | ) | (7 | ) | ||||||||||||||||||||||||||
TNT Express segment | 56 | — | 56 | NM | ||||||||||||||||||||||||||||||||||||
FedEx Ground segment | 387 | 291 | 1,033 | 794 | 33 | 30 | 237 | 221 | 16 | 7 | ||||||||||||||||||||||||||||||
FedEx Freight segment | 161 | 147 | 367 | 285 | 10 | 29 | 45 | 63 | (18 | ) | (29 | ) | ||||||||||||||||||||||||||||
FedEx Services segment | 107 | 73 | 297 | 240 | 47 | 24 | 102 | 91 | 11 | 12 | ||||||||||||||||||||||||||||||
Other | — | — | — | 1 | — | NM | ||||||||||||||||||||||||||||||||||
|
|
|
|
|
|
| ||||||||||||||||||||||||||||||||||
Total capital expenditures | $ | 1,000 | $ | 1,080 | $ | 3,562 | $ | 2,969 | (7 | ) | 20 | $ | 1,215 | $ | 1,209 | $ | 6 | — | ||||||||||||||||||||||
|
|
|
|
|
|
| ||||||||||||||||||||||||||||||||||
Capital expenditures during the nine monthsfirst quarter of 20162017 were higher than the prior-year period primarily due to increased spending forat FedEx Ground driven by sort facility expansion, at FedEx Ground and aircraft at FedEx Express.which includes information technology investments. Aircraft and related equipment purchases at FedEx Express during the nine monthsfirst quarter of 20162017 included the delivery of tensix Boeing 767-300 Freighter aircraft and two Boeing 777 Freighter(“B767F”) aircraft, as well as the modification of certain aircraft before being placed into service.
LIQUIDITY OUTLOOK
We believe that our existing cash and cash equivalents, cash flow from operations and available financing sources are adequate to meet our liquidity needs, including working capital, capital expenditure and business acquisition requirements and debt payment obligations. Our cash and cash equivalents balance at February 29,August 31, 2016 includes $598$728 million of cash in offshore jurisdictions associated with our permanent reinvestment strategy. We do not believe that the indefinite reinvestment of these funds offshore impairs our ability to meet our domestic debt or working capital obligations. Although we expect higher capital expenditures in 2016,2017, we anticipate that our cash flow from operations will be sufficient to fund these expenditures. Historically, we have been successful in obtaining unsecured financing, from both domestic and international sources, although the marketplace for such investment capital can become restricted depending on a variety of economic factors.
- 50 -
Our capital expenditures are expected to be approximately $4.8$5.6 billion in 20162017 and include spending for sort facility expansion, primarily at FedEx Ground, aircraft and aircraft-related equipment at FedEx Express, sort facility expansion, primarily at FedEx Ground, and vehicle replacement at all our transportation segments. This capital expenditure forecast includes TNT Express. We invested $1.4 billion$592 million in aircraft and aircraft-related equipment in the nine monthsfirst quarter of 20162017 and expect to invest an additional $245 million$1 billion for aircraft and aircraft-related equipment during the remainder of 2016. In March 2016, we made $165 million in voluntary contributions to our tax-qualified U.S. domestic pension plans (“U.S. Pension Plans”). Our U.S. Pension Plans have ample funds to meet expected benefit payments. See Note 5 of the accompanying unaudited condensed consolidated financial statements for expected future benefit payments for the remainder of 2016.2017.
We have a shelf registration statement filed with the Securities and Exchange Commission (“SEC”) that allows us to sell, in one or more future offerings, any combination of our unsecured debt securities and common stock.
On November 13, 2015, we replaced our existing revolving and letter of credit facilities withWe have a new, single five-year $1.75 billion revolving credit facility that expires in November 2020. See Note 3 of the accompanying unaudited condensed consolidated financial statements for a description of the term and significant covenants of our revolving credit facility.
During the fourth quarter, we plan to defease the underlying debt of certain leveraged operating leases which will be accounted for as a prepayment of the lease obligations. On April 1,
- 50 -
In September 2016, we expectmade $250 million in required contributions to redeem allour tax-qualified U.S. domestic pension plans (“U.S. Pension Plans”). Our U.S. Pension Plans have ample funds to meet expected benefit payments. For the remainder of the outstanding $2452017, we have $616 million of tax-exempt Alliance Airport bonds. During the fourth quarter of 2016, we also expectin required contributions to prepay and defease the $238 million of outstanding tax-exempt Indianapolis Airport bonds, which are scheduled to mature on January 15, 2017. We expect to finance these prepayments with the proceeds of a debt offering. Proceeds from this offering also are expected to be used for working capital and general corporate purposes, including share repurchases under our current share repurchase authorization.
We expect to fund the acquisition of TNT Express with cash from operations and proceeds from a second debt offering, which we expect to launch shortly after the planned debt offering described above.
In December 2015, The Protecting Americans from Tax Hikes Act of 2015 (PATH Act) was passed into law. As a result, our current federal income taxes will be reduced due to the accelerated depreciation provisions on qualifying capital investments through December 31, 2019.U.S. Pension Plans.
Standard & Poor’s has assigned us a senior unsecured debt credit rating of BBB and commercial paper rating of A-2 and a ratings outlook of “stable.” On March 15, 2016, Moody’s Investors Service loweredhas assigned our senior unsecured debt a credit rating from Baa1 toat Baa2 and affirmed our commercial paper rating of P-2 and a ratings outlook of “stable.” If our credit ratings drop, our interest expense may increase. If our commercial paper ratings drop below current levels, we may have difficulty utilizing the commercial paper market. If our senior unsecured debt credit ratings drop below investment grade, our access to financing may become limited.
- 51 -
CONTRACTUAL CASH OBLIGATIONS AND OFF-BALANCE SHEET ARRANGEMENTS
The following table sets forth a summary of our contractual cash obligations as of February 29,August 31, 2016. Certain of these contractual obligations are reflected in our balance sheet, while others are disclosed as future obligations under accounting principles generally accepted in the United States. Except for the current portion of interest on long-term debt, this table does not include amounts already recorded in our balance sheet as current liabilities at February 29,August 31, 2016. We have certain contingent liabilities that are not accrued in our balance sheet in accordance with accounting principles generally accepted in the United States. These contingent liabilities are not included in the table below. We have other long-term liabilities reflected in our balance sheet, including deferred income taxes, qualified and nonqualified pension and postretirement healthcare plan liabilities and other self-insurance accruals. The payment obligations associated with these liabilities are not reflected in the table below due to the absence of scheduled maturities. Accordingly, this table is not meant to represent a forecast of our total cash expenditures for any of the periods presented.
| Payments Due by Fiscal Year (Undiscounted) (in millions) | Payments Due by Fiscal Year (Undiscounted) (in millions) | |||||||||||||||||||||||||||||||||||||||||||||||||||||||
| 2016 (1) | 2017 | 2018 | 2019 | 2020 | Thereafter | Total | 2017 (1) | 2018 | 2019 | 2020 | 2021 | Thereafter | Total | |||||||||||||||||||||||||||||||||||||||||||
Operating activities: | ||||||||||||||||||||||||||||||||||||||||||||||||||||||||
Operating leases | $ | 775 | $ | 2,383 | $ | 1,915 | $ | 1,670 | $ | 1,421 | $ | 8,071 | $ | 16,235 | $ | 1,927 | $ | 2,302 | $ | 2,018 | $ | 1,736 | $ | 1,533 | $ | 8,487 | $ | 18,003 | ||||||||||||||||||||||||||||
Non-capital purchase obligations and other | 134 | 286 | 172 | 77 | 25 | 93 | 787 | 448 | 459 | 312 | 221 | 134 | 104 | 1,678 | ||||||||||||||||||||||||||||||||||||||||||
Interest on long-term debt | 47 | 379 | 379 | 379 | 319 | 6,847 | 8,350 | 343 | 497 | 496 | 434 | 422 | 8,234 | 10,426 | ||||||||||||||||||||||||||||||||||||||||||
Quarterly contributions to our U.S. Pension Plans | 616 | — | — | — | — | — | 616 | |||||||||||||||||||||||||||||||||||||||||||||||||
Investing activities: | ||||||||||||||||||||||||||||||||||||||||||||||||||||||||
Aircraft and aircraft-related capital commitments | 94 | 1,283 | 1,748 | 1,569 | 1,633 | 5,779 | 12,106 | 719 | 1,767 | 1,717 | 1,925 | 1,480 | 4,191 | 11,799 | ||||||||||||||||||||||||||||||||||||||||||
Other capital purchase obligations | 18 | 5 | 1 | 1 | 1 | 9 | 35 | 49 | 4 | 4 | 1 | 1 | 8 | 67 | ||||||||||||||||||||||||||||||||||||||||||
Financing activities: | ||||||||||||||||||||||||||||||||||||||||||||||||||||||||
Debt | — | — | — | 750 | 400 | 7,340 | 8,490 | 8 | 3 | 1,313 | 961 | — | 11,580 | 13,865 | ||||||||||||||||||||||||||||||||||||||||||
|
|
|
|
|
|
|
|
|
|
|
|
|
| |||||||||||||||||||||||||||||||||||||||||||
Total | $ | 1,068 | $ | 4,336 | $ | 4,215 | $ | 4,446 | $ | 3,799 | $ | 28,139 | $ | 46,003 | $ | 4,110 | $ | 5,032 | $ | 5,860 | $ | 5,278 | $ | 3,570 | $ | 32,604 | $ | 56,454 | ||||||||||||||||||||||||||||
|
|
|
|
|
|
|
|
|
|
|
|
|
| |||||||||||||||||||||||||||||||||||||||||||
| (1) | Cash obligations for the remainder of |
Open purchase orders that are cancelable are not considered unconditional purchase obligations for financial reporting purposes and are not included in the table above. Such purchase orders often represent authorizations to purchase rather than binding agreements. See Note 7 of the accompanying unaudited condensed consolidated financial statements for more information.
Operating Activities
The amounts reflected in the table above for operating leases represent future minimum lease payments under noncancelable operating leases (principally aircraft and facilities) with an initial or remaining term in excess of one year at February 29,August 31, 2016.
- 51 -
Included in the table above within the caption entitled “Non-capital purchase obligations and other” is our estimate of the current portion of the liability ($1 million) for uncertain tax positions and amounts for purchase obligations that represent noncancelable agreements to purchase goods or services that are not capital related. Such contracts include those for printing and advertising and promotions contracts. We cannot reasonably estimate the timing of the long-term payments or the amount by which the liability for uncertain tax positions will increase or decrease over time; therefore, the long-term portion of the liability for uncertain tax positions ($2448 million) is excluded from the table.
The amounts reflected in the table above for interest on long-term debt represent future interest payments due on our long-term debt, all of which are fixed rate.debt.
- 52 -
We had $363$392 million in deposits and progress payments as of February 29,August 31, 2016 on aircraft purchases and other planned aircraft-related transactions.
Investing Activities
The amounts reflected in the table above for capital purchase obligations represent noncancelable agreements to purchase capital-related equipment. Such contracts include those for certain purchases of aircraft, aircraft modifications, vehicles, facilities, computers and other equipment.
On June 10, 2016, FedEx Express exercised options to acquire six additional B767F aircraft for delivery in 2019 and 2020.
Financing Activities
The amounts reflected in the table above for long-term debt represent future scheduled payments on our long-term debt. For the remainder of 2016,2017, we have no scheduled principal debt payments.
Additional information on amounts included within the operating, investing and financing activities captions in the table above can be found in our Annual Report.
CRITICAL ACCOUNTING ESTIMATES
The preparation of financial statements in accordance with accounting principles generally accepted in the United States requires management to make significant judgments and estimates to develop amounts reflected and disclosed in the financial statements. In many cases, there are alternative policies or estimation techniques that could be used. We maintain a thorough process to review the application of our accounting policies and to evaluate the appropriateness of the many estimates that are required to prepare the financial statements of a complex, global corporation. However, even under optimal circumstances, estimates routinely require adjustment based on changing circumstances and new or better information.
GOODWILL.Goodwill is tested for impairment between annual tests whenever events or circumstances make it more likely than not that the fair value of a reporting unit has fallen below its carrying value. We do not believe there has been any change of events or circumstances that would indicate that a reevaluation of the goodwill of our reporting units is required as of February 29,August 31, 2016, nor do we believe the goodwill of our reporting units is at risk of failing impairment testing. For additional details on goodwill impairment testing, refer to Note 1 of our Annual Report.
Information regarding our critical accounting estimates can be found in our Annual Report, including Note 1 to the financial statements therein. Management has discussed the development and selection of these critical accounting estimates with the Audit Committee of our Board of Directors and with our independent registered public accounting firm.
- 52 -
FORWARD-LOOKING STATEMENTS
Certain statements in this report, including (but not limited to) those contained in “Outlook,” “Liquidity,” “Capital Resources,” “Liquidity Outlook,” “Contractual Cash Obligations” and “Critical Accounting Estimates,” and the “Financing Arrangements,” “General,” “Retirement Plans,” and “Contingencies” notes to the consolidated financial statements, are “forward-looking” statements within the meaning of the Private Securities Litigation Reform Act of 1995 with respect to our financial condition, results of operations, cash flows, plans, objectives, future performance and business. Forward-looking statements include those preceded by, followed by or that include the words “may,” “could,” “would,” “should,” “will,” “believes,” “expects,” “anticipates,” “plans,” “estimates,” “targets,” “projects,” “intends” or similar expressions. These forward-looking statements involve risks and uncertainties. Actual results may differ materially from those contemplated (expressed or implied) by such forward-looking statements, because of, among other things, potential risks and uncertainties, such as:
economic conditions in the global markets in which we operate;
- 53 -
significant changes in the volumes of shipments transported through our networks, customer demand for our various services or the prices we obtain for our services;
damage to our reputation or loss of brand equity;
cybersecurity incidentsour ability to successfully integrate the businesses and operations of FedEx Express and TNT Express in the expected time frame;
a significant data breach or disruptionsother disruption to the Internet or our technology infrastructure, including those impacting our computer systems and website, which can adversely affect our operations and reputation, among customers;business or results of operations;
the price and availability of jet and vehicle fuel;
our ability to manage our cost structure for capital expenditures and operating expenses, and match it to shifting and future customer volume levels;
the impact of intense competition on our ability to maintain or increase our prices (including our fuel surcharges in response to fluctuating fuel prices) or to maintain or grow our market share;
our ability to successfully execute the TNT Express acquisition on favorable terms, a timely basis or at all;
our ability to effectively operate, integrate, leverage and grow acquired businesses, and to continue to support the value we allocate to these acquired businesses, including their goodwill;
our ability to maintain good relationships with our employees and prevent attempts by labor organizations to organize groups of our employees, which could significantly increase our operating costs and reduce our operational flexibility;
the impact of costs related to (i) challenges to the status of FedEx Ground’s owner-operators as independent contractors rather than employees,and direct employers of drivers providing services on their behalf, and (ii) any related changes to our relationship with these owner-operators;owner-operators and their drivers;
- 53 -
the impact of the United Kingdom’s vote to leave the European Union;
our ability to executeany impact on our profit improvement programs;business from disruptions or modifications in service by, or changes in the business of, the U.S. Postal Service, which is a significant customer and vendor of FedEx;
the impact of any international conflicts or terrorist activities on the United States and global economies in general, the transportation industry or us in particular, and what effects these events will have on our costs or the demand for our services;
any impacts on our businesses resulting from new domestic or international government laws and regulation, including regulatory actions affecting global aviation or other transportation rights, increased air cargo and other security or safety requirements, and tax, accounting, trade (such as protectionist measures enacted in response to weak economic conditions), labor (such as card-check legislation, joint employment standards or changes to the Railway Labor Act of 1926, as amended, affecting FedEx Express employees), environmental (such as global climate change legislation) or postal rules;
adverse weather conditions or localized natural disasters in key geographic areas, such as earthquakes, volcanoes, and hurricanes, which can disrupt our electrical service, damage our property, disrupt our operations, increase our fuel costs and adversely affect our shipment levels;
any impact on our business from disruptions or modifications in service by the U.S. Postal Service, which is a significant customer and vendor of FedEx;
increasing costs, the volatility of costs and funding requirements and other legal mandates for employee benefits, especially pension and healthcare benefits;
- 54 -
the increasing costs of compliance with federal, state and foreign governmental agency mandates (including the Foreign Corrupt Practices Act and the U.K. Bribery Act) and defending against inappropriate or unjustified enforcement or other actions by such agencies;
changes in foreign currency exchange rates, especially in the euro, Chinese yuan, euro, British pound, Brazilian real, Canadian dollar and Mexican peso, and the Canadian dollar, which can affect our sales levels and foreign currency sales prices;
market acceptance of our new service and growth initiatives;
any liability resulting from and the costs of defending against class-action litigation, such as wage-and-hour, joint employment, and discrimination and retaliation claims, and any other legal or governmental proceedings;
our ability to achieve the benefits of any ongoing or future profit improvement initiatives;
the outcome of future negotiations to reach new collective bargaining agreements — including with the union that represents the pilots of FedEx Express;Express (the current pilot agreement is scheduled to become amendable in November 2021) and with the union that was elected in 2015 to represent drivers at four FedEx Freight facilities;
the impact of technology developments on our operations and on demand for our services, and our ability to continue to identify and eliminate unnecessary information technology redundancy and complexity throughout the organization;
governmental underinvestment in transportation infrastructure, which could increase our costs and adversely impact our service levels due to traffic congestion or sub-optimal routing of our vehicles and aircraft;
widespread outbreak of an illness or any other communicable disease, or any other public health crisis;
- 54 -
availability of financing on terms acceptable to us and our ability to maintain our current credit ratings, especially given the capital intensity of our operations; and
other risks and uncertainties you can find in our press releases and SEC filings, including the risk factors identified under the heading “Risk Factors” in “Management’s Discussion and Analysis of Results of Operations and Financial Condition” in our Annual Report, as updated by our quarterly reports on Form 10-Q.
As a result of these and other factors, no assurance can be given as to our future results and achievements. Accordingly, a forward-looking statement is neither a prediction nor a guarantee of future events or circumstances and those future events or circumstances may not occur. You should not place undue reliance on the forward-looking statements, which speak only as of the date of this report. We are under no obligation, and we expressly disclaim any obligation, to update or alter any forward-looking statements, whether as a result of new information, future events or otherwise.
- 55 -
Item 3. Quantitative and Qualitative Disclosures About Market Risk
As of February 29,August 31, 2016, there had been no material changes in our market risk sensitive instruments and positions since our disclosures in our Annual Report.
The principal foreign currency exchange rate risks to which we are exposed are in the euro, Chinese yuan, euro, British pound, Brazilian real, Canadian dollar and Mexican peso and the Canadian dollar.peso. Historically, our exposure to foreign currency fluctuations is more significant with respect to our revenues than our expenses, as a significant portion of our expenses are denominated in U.S. dollars, such as aircraft and fuel expenses. During the ninefirst three months of 2016,2017, the U.S. dollar strengthened relative to the currencies of the foreign countries in which we operate as compared to May 31, 2015,2016, and this strengthening had a slightly positivenegative impact on our results.
While we have market risk for changes in the price of jet and vehicle fuel, this risk is largely mitigated by our indexed fuel surcharges. For additional discussion of our indexed fuel surcharges see the “Fuel” section of “Management’s Discussion and Analysis of Results of Operations and Financial Condition.”
Item 4. Controls and Procedures
The management of FedEx, with the participation of our principal executive and financial officers, has evaluated the effectiveness of our disclosure controls and procedures in ensuring that the information required to be disclosed in our filings under the Securities Exchange Act of 1934, as amended, is recorded, processed, summarized and reported within the time periods specified in the SEC’s rules and forms, including ensuring that such information is accumulated and communicated to FedEx management as appropriate to allow timely decisions regarding required disclosure. Based on such evaluation, our principal executive and financial officers have concluded that such disclosure controls and procedures were effective as of February 29,August 31, 2016 (the end of the period covered by this Quarterly Report on Form 10-Q).
During our fiscal quarter ended February 29,On May 25, 2016, nowe acquired TNT Express. We have begun the TNT Express integration process including the integration of policies, processes, people, technology and operations, and we will continue to evaluate the impact of any related changes to internal control over financial reporting. No change occurred in our internal control over financial reporting during our fiscal quarter ended August 31, 2016, that has materially affected, or is reasonably likely to materially affect, our internal control over financial reporting.
- 56 -
For a description of all material pending legal proceedings, see Note 8 of the accompanying unaudited condensed consolidated financial statements.
There have been no material changes from the risk factors disclosed in our Annual Report (under the heading “Risk Factors” in “Management’s Discussion and Analysis of Results of Operations and Financial Condition”) in response to Part I, Item 1A of Form 10-K.
Item 2. Unregistered Sales of Equity Securities and Use of Proceeds
The following table provides information on FedEx’s repurchases of our common stock during the thirdfirst quarter of 2016:2017:
ISSUER PURCHASES OF EQUITY SECURITIES
Period | Total Number of Shares Purchased | Average Price Paid per Share | Total Number of Shares Purchased as Part of Publicly Announced Program | Maximum Number of Shares That May Yet Be Purchased Under the Program | ||||||||||||
Dec. 1-31, 2015 | 2,660,000 | $ | 149.48 | 2,660,000 | 2,435,000 | |||||||||||
Jan. 1-31, 2016 | 2,435,000 | 139.60 | 2,435,000 | 25,000,000 | ||||||||||||
Feb. 1-29, 2016 | 2,250,000 | 130.59 | 2,250,000 | 22,750,000 | ||||||||||||
|
|
|
| |||||||||||||
Total | 7,345,000 | $ | 140.42 | 7,345,000 | ||||||||||||
Period | Total Number of Shares Purchased | Average Price Paid per Share | Total Number of Shares Purchased as Part of Publicly Announced Programs | Maximum Number of Shares That May Yet Be Purchased Under the Programs | ||||||||||||
June 1-30, 2016 | 975,000 | $ | 162.71 | 975,000 | 18,000,000 | |||||||||||
July 1-31, 2016 | 410,000 | 154.17 | 410,000 | 17,590,000 | ||||||||||||
Aug. 1-31, 2016 | — | — | — | 17,590,000 | ||||||||||||
|
|
|
| |||||||||||||
Total | 1,385,000 | $ | 160.18 | 1,385,000 | ||||||||||||
The December and January repurchases above were made under the stocka share repurchase program approved by our Board of Directors and announced on September 29, 2014 and through which we were authorized to purchase, in the open market or in privately negotiated transactions, up to an aggregate of 15 million shares of our common stock. The September 2014 stock repurchase programthat was completed in January 2016.
The February repurchases were made under the new stock repurchase program approved by our Board of Directors and announced on January 26, 2016, and through which we are authorized to purchase, in the open market or in the privately negotiated transactions, up to an aggregate of 25 million shares of our common stock. As of March 16,September 20, 2016, 21.517.6 million shares remained authorized for purchase under the January 2016 stock repurchase program, which is the only such program that currently exists. The program does not have an expiration date.
As previously disclosed, on March 7, 2016, the Board of Directors of FedEx approved amendments to the Amended and Restated Bylaws of FedEx (the “Bylaws”). As amended, Article III, Section 14 of the Bylaws implements proxy access. The proxy access bylaw permits up to 20 stockholders owning 3% or more of FedEx’s outstanding voting stock continuously for at least three years to nominate and include in FedEx’s proxy materials directors constituting up to two individuals or 20% of the Board, whichever is greater, provided that the stockholder(s) and the nominee(s) satisfy the requirements specified in the Bylaws.
- 57 -
Exhibit Number | Description of Exhibit | |
| 10.1 | Amendment dated | |
| 10.2 | Amendment dated | |
| 10.3 | Amendment dated June 20, 2016 (but effective as of May 30, 2016) amending the USPS Transportation Agreement. Confidential treatment has been requested for confidential commercial and financial information, pursuant to Rule 24b-2 under the Exchange Act. | |
- 57 -
| 10.4 | Amendment dated June 20, 2016 amending the USPS Transportation Agreement. Confidential treatment has been requested for confidential commercial and financial information, pursuant to Rule 24b-2 under the Exchange Act. | |
| 10.5 | Amendment dated June 20, 2016 amending the USPS Transportation Agreement. Confidential treatment has been requested for confidential commercial and financial information, pursuant to Rule 24b-2 under the Exchange Act. | |
| 10.6 | Amendment dated June 20, 2016 (but effective as of May 2, 2016) amending the USPS Transportation Agreement. Confidential treatment has been requested for confidential commercial and financial information, pursuant to Rule 24b-2 under the Exchange Act. | |
| 10.7 | Amendment dated July 18, 2016 (but effective as of June 27, 2016) amending the USPS Transportation Agreement. Confidential treatment has been requested for confidential commercial and financial information, pursuant to Rule 24b-2 under the Exchange Act. | |
| 10.8 | Amendment dated July 7, 2016 (but effective as of July 6, 2016) amending the USPS Transportation Agreement. | |
| 10.9 | Amendment dated July 26, 2016 (but effective as of May 30, 2016) amending the USPS Transportation Agreement. Confidential treatment has been requested for confidential commercial and financial information, pursuant to Rule 24b-2 under the Exchange Act. | |
| 10.10 | Amendment dated August 4, 2016 (but effective as of August 1, 2016) amending the USPS Transportation Agreement. Confidential treatment has been requested for confidential commercial and financial information, pursuant to Rule 24b-2 under the Exchange Act. | |
| 10.11 | Amendment dated August 9, 2016 (but effective as of June 27, 2016) amending the USPS Transportation Agreement. Confidential treatment has been requested for confidential commercial and financial information, pursuant to Rule 24b-2 under the Exchange Act. | |
| 10.12 | Supplemental Agreement No. 8 (and related side letters) dated as of June 10, 2016, amending the Boeing 767-3S2 Freighter Purchase Agreement dated | |
| Eighth Amendment dated | ||
| 12.1 | Computation of Ratio of Earnings to Fixed Charges. | |
| 15.1 | Letter re: Unaudited Interim Financial Statements. | |
| 31.1 | Certification of Principal Executive Officer Pursuant to Rules 13a-14(a) and 15d-14(a) under the Securities Exchange Act of 1934, as Adopted Pursuant to Section 302 of the Sarbanes-Oxley Act of 2002. | |
- 58 -
| 31.2 | Certification of Principal Financial Officer Pursuant to Rules 13a-14(a) and 15d-14(a) under the Securities Exchange Act of 1934, as Adopted Pursuant to Section 302 of the Sarbanes-Oxley Act of 2002. | |
| 32.1 | Certification of Principal Executive Officer Pursuant to 18 U.S.C. Section 1350, as Adopted Pursuant to Section 906 of the Sarbanes-Oxley Act of 2002. | |
| 32.2 | Certification of Principal Financial Officer Pursuant to 18 U.S.C. Section 1350, as Adopted Pursuant to Section 906 of the Sarbanes-Oxley Act of 2002. | |
| 101.1 | Interactive Data Files. | |
- 59 -
Pursuant to the requirements of the Securities Exchange Act of 1934, as amended, the Registrant has duly caused this report to be signed on its behalf by the undersigned thereunto duly authorized.
| FEDEX CORPORATION | ||||||
| Date: | /s/ JOHN L. MERINO | |||||
| JOHN L. MERINO | ||||||
| CORPORATE VICE PRESIDENT AND | ||||||
| PRINCIPAL ACCOUNTING OFFICER | ||||||
- 60 -
Exhibit | Description of Exhibit | |
| 10.1 | Amendment dated | |
| 10.2 | Amendment dated | |
| 10.3 | Amendment dated June 20, 2016 (but effective as of May 30, 2016) amending the USPS Transportation Agreement. Confidential treatment has been requested for confidential commercial and financial information, pursuant to Rule 24b-2 under the Exchange Act. | |
| 10.4 | Amendment dated June 20, 2016 amending the USPS Transportation Agreement. Confidential treatment has been requested for confidential commercial and financial information, pursuant to Rule 24b-2 under the Exchange Act. | |
| 10.5 | Amendment dated June 20, 2016 amending the USPS Transportation Agreement. Confidential treatment has been requested for confidential commercial and financial information, pursuant to Rule 24b-2 under the Exchange Act. | |
| 10.6 | Amendment dated June 20, 2016 (but effective as of May 2, 2016) amending the USPS Transportation Agreement. Confidential treatment has been requested for confidential commercial and financial information, pursuant to Rule 24b-2 under the Exchange Act. | |
| 10.7 | Amendment dated July 18, 2016 (but effective as of June 27, 2016) amending the USPS Transportation Agreement. Confidential treatment has been requested for confidential commercial and financial information, pursuant to Rule 24b-2 under the Exchange Act. | |
| 10.8 | Amendment dated July 7, 2016 (but effective as of July 6, 2016) amending the USPS Transportation Agreement. | |
| 10.9 | Amendment dated July 26, 2016 (but effective as of May 30, 2016) amending the USPS Transportation Agreement. Confidential treatment has been requested for confidential commercial and financial information, pursuant to Rule 24b-2 under the Exchange Act. | |
| 10.10 | Amendment dated August 4, 2016 (but effective as of August 1, 2016) amending the USPS Transportation Agreement. Confidential treatment has been requested for confidential commercial and financial information, pursuant to Rule 24b-2 under the Exchange Act. | |
| 10.11 | Amendment dated August 9, 2016 (but effective as of June 27, 2016) amending the USPS Transportation Agreement. Confidential treatment has been requested for confidential commercial and financial information, pursuant to Rule 24b-2 under the Exchange Act. | |
| 10.12 | Supplemental Agreement No. 8 (and related side letters) dated as of June 10, 2016, amending the Boeing 767-3S2 Freighter Purchase Agreement dated | |
| Eighth Amendment dated | ||
| 12.1 | Computation of Ratio of Earnings to Fixed Charges. | |
| 15.1 | Letter re: Unaudited Interim Financial Statements. | |
| 31.1 | Certification of Principal Executive Officer Pursuant to Rules 13a-14(a) and 15d-14(a) under the Securities Exchange Act of 1934, as Adopted Pursuant to Section 302 of the Sarbanes-Oxley Act of 2002. | |
| 31.2 | Certification of Principal Financial Officer Pursuant to Rules 13a-14(a) and 15d-14(a) under the Securities Exchange Act of 1934, as Adopted Pursuant to Section 302 of the Sarbanes-Oxley Act of 2002. | |
| 32.1 | Certification of Principal Executive Officer Pursuant to 18 U.S.C. Section 1350, as Adopted Pursuant to Section 906 of the Sarbanes-Oxley Act of 2002. | |
| 32.2 | Certification of Principal Financial Officer Pursuant to 18 U.S.C. Section 1350, as Adopted Pursuant to Section 906 of the Sarbanes-Oxley Act of 2002. | |
| 101.1 | Interactive Data Files. | |
E-2